Embed Size (px)
Citation preview
Exploring the Role of Centre of Mass Variability in
Reactive Balance Control
by
Roshanth Rajachandrakumar
A thesis submitted in conformity with the requirements for
the degree of Rehabilitation Science, Rehabilitation
Sciences Institute, in the University of Toronto
© Copyright by Roshanth Rajachandrakumar (2017)
ii
Exploring the Role of Centre of Mass Variability in Reactive Balance Control
Roshanth Rajachandrakumar
Master of Science
Rehabilitation Sciences Institute
2017
Abstract
Increased variability of movement is related to increased risk for falls. The objective of the
current work was to better understand the role of variability in balance control. It was
hypothesized that high centre of mass (COM) variability (position and velocity) while standing
would induce a stepping response after a balance perturbation compared to low COM
variability. It was also hypothesized that a low margin of stability (MOS) at perturbation onset
would induce stepping response after a platform perturbation. Fourteen young adults (20-35
years old) were recruited. Participants experienced postural perturbations when standing using
surface translations. COM variability and MOS did not differ between stepping and feet in place
responses. The current results suggest that transient changes in movement variability may not
influence reactive balance control. Instead, increased movement variability may be a sign of
aging or motor impairment.

iii
Acknowledgements
First and foremost, I would like to give a huge thank you to my supervisor Dr. Avril Mansfield.
I’ve had an amazing experience under your supervision as both a co-op and graduate student.
Thank you for your guidance and your patience during these last 3 years. It’s truly been a great
learning experience that I’ve wholeheartedly enjoyed!
I would also like to thank my Program Advisory Committee members Dr. Kara Patterson and
Dr. Timothy Welsh for their helpful advice, and making time for me during their busy schedules.
Furthermore, I would like to give a special thank you to both past and present members of my
research team at Toronto Rehab. My team has always been there for me whenever I needed
help, and the amazing experience I’ve had as a graduate student would not be the same
without them!
Last but not least, I would like to thank my family and friends who have always supported me
during my time as a graduate student. They have always been there to give me insightful
advice when I’ve felt lost, and have been there when the stress was becoming too much for me
to handle alone. Thank you so much!
iv
Table of Contents Abstract...................................................................................................................................... ii
Acknowledgements ................................................................................................................... iii
Table of Contents ...................................................................................................................... iv
List of Tables ............................................................................................................................. v
List of Figures ........................................................................................................................... vi
1. Introduction ........................................................................................................................... 1
2. Literature Review .................................................................................................................. 4
2.1 Standing balance control ................................................................................................. 4
2.1.1 Basic mechanics of standing balance control ........................................................ 4
2.1.2. Inducing reactive stepping .................................................................................... 6
2.1.3. Sensory contributions to balance control .............................................................. 7
2.1.4. Effects of fatigue on balance control ..................................................................... 8
2.1.5. Psychological factors affecting balance control .................................................... 9
2.2. Aging and balance control ............................................................................................ 12
2.3. Theoretical perspectives of variability ........................................................................... 14
2.4. Summary ...................................................................................................................... 16
3. Methodology ....................................................................................................................... 17
3.1. Participants ................................................................................................................... 17
3.2. Apparatus ..................................................................................................................... 17
3.3. Protocol ........................................................................................................................ 18
3.4. Data Processing ........................................................................................................... 23
3.5. Data Analysis ............................................................................................................... 25
3.6. Sample Size ................................................................................................................. 27
4. Results ................................................................................................................................ 28
5. Discussion .......................................................................................................................... 35
5.1. Limitations .................................................................................................................... 43
5.2. Future Directions .......................................................................................................... 44
5.3. Conclusions .................................................................................................................. 45
References ............................................................................................................................. 46
Appendix A ............................................................................................................................. 54
Appendix B ............................................................................................................................. 55
Appendix C ............................................................................................................................. 56
Appendix D ............................................................................................................................. 59
v
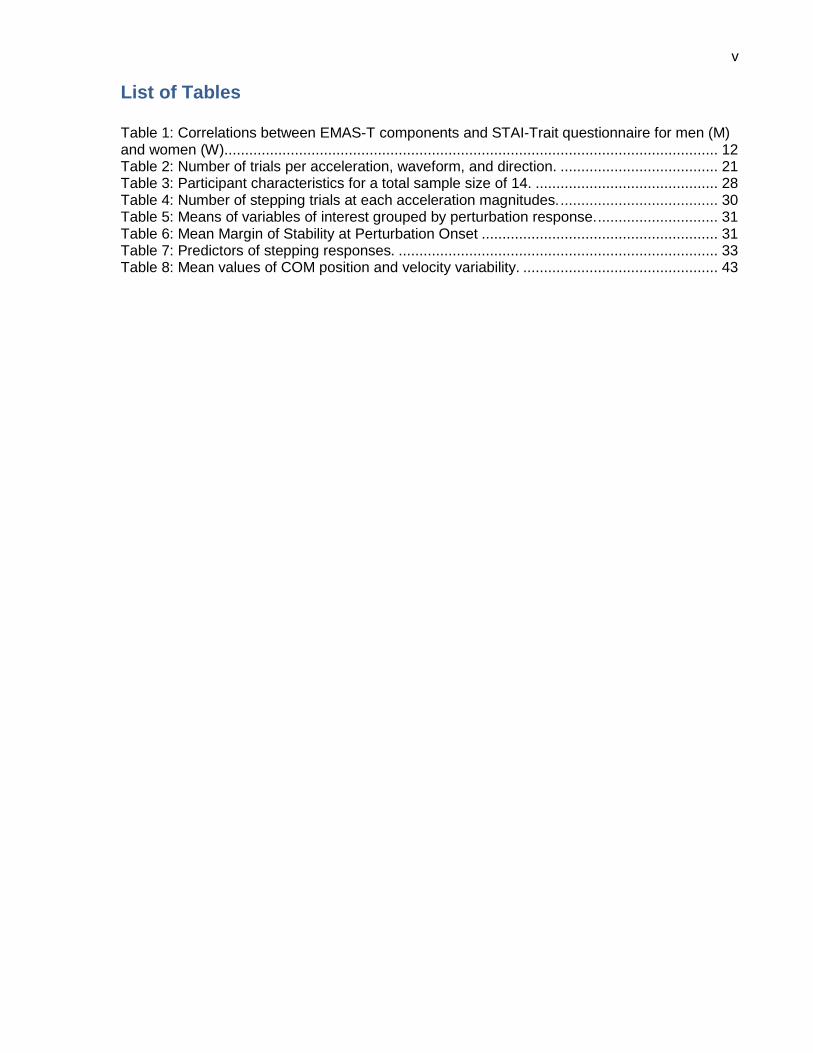
List of Tables
Table 1: Correlations between EMAS-T components and STAI-Trait questionnaire for men (M) and women (W). ...................................................................................................................... 12 Table 2: Number of trials per acceleration, waveform, and direction. ...................................... 21 Table 3: Participant characteristics for a total sample size of 14. ............................................ 28 Table 4: Number of stepping trials at each acceleration magnitudes. ...................................... 30 Table 5: Means of variables of interest grouped by perturbation response. ............................. 31 Table 6: Mean Margin of Stability at Perturbation Onset ......................................................... 31 Table 7: Predictors of stepping responses. ............................................................................. 33 Table 8: Mean values of COM position and velocity variability. ............................................... 43
vi
List of Figures
Figure 1: Example of differing COM variability......................................................................... 14 Figure 2: Laboratory set up. .................................................................................................... 18 Figure 3: Layout of the 73 marker locations used. ................................................................... 19 Figure 4: The 3 acceleration waveforms used in this study: (A) standard, (B) triphasic and (C) extended. ................................................................................................................................ 22 Figure 5: Timing of questionnaire administration relative to trial blocks. .................................. 23 Figure 6: Allocation of fatigue score to perturbation trials ........................................................ 27 Figure 7: Mean score for the fatigue and balance confidence questionnaires at each time point collected. ................................................................................................................................. 32 Figure 8: Trait (Graph A) and state (Graph B) anxiety scores vs mean number of stepping trials. ............................................................................................................................................... 33
1
1. Introduction
A number of studies have found a relationship between movement variability and falls in older
adults [1-4]. Specifically, increased variability of the position of the centre of pressure (COP)
when standing [4] and increased variability of spatiotemporal characteristics of gait [1-3], have
been linked to an increased risk of falls in daily life. Currently, the nature of this relationship is
uncertain. Specifically, it is unknown if increased variability causes falls, or if both variability and
falls are the result of another underlying mechanism.
It can be postulated that the variability of these balance measures (e.g., COP movement, stride
speed, stride length, etc.) actually reflects variability of the centre of mass (COM) movement.
Since balance control fundamentally involves the central nervous system (CNS) maintaining
control of the relationship between the COM and base of support (BOS) [5], increased
variability of the COM movement could be seen as a form of error in balance control that puts
humans at an increased risk of falls. Accordingly, a large error (i.e., increased variability) would
reflect poor balance control and, consequently, increased risk of falling. Increased variability
could increase the likelihood the COM will be placed in a less stable position; that is, a low
margin of stability. Margin of stability (MOS) [6] is a stability measure based on the distance
between the BOS and the extrapolated centre of mass, i.e. position of the COM’s vertical
projection that also incorporates the COM velocity. A low margin of stability value would mean
a short distance between the BOS and extrapolated centre of mass, and therefore, reflects less
stability than a larger MOS value. If an individual were to experience an external postural
perturbation when at a low MOS, there would be an increased chance they would experience a
loss of balance than if they were at a high MOS at the onset of perturbation.
Moving platforms can be used to challenge the postural control system to better understand the
different facets of balance control like determinants of stepping, stepping thresholds, patterns
2
of muscle activation, and motor learning [7-10]. Thus, a moving platform can be a suitable tool
to study the relationship between variability and falls risk. The number of steps taken in
response to the perturbation is often used to gauge the quality of the response. For example, a
multistep response would be considered a poorer response than a single step response and a
single step response would be considered worse than a no-step (i.e., ‘feet-in-place’) response
[11]. During the swing phase of the stepping response, the BOS is defined solely by the stance
limb (i.e. the leg in contact with the surface), which is much smaller, and therefore less stable,
than when standing with two limbs contacting the surface. Therefore, if a reactive step is taken
when it is not needed, this potentially contributes to further instability. Previous studies have
also found that participants reduce the number of steps used in response to platform
perturbations as they adapt to the movements of the platform [8, 12], suggesting that
individuals can learn to reduce the frequency of excessive or unnecessary responses (i.e.,
stepping when a step is not needed). Of course, the magnitude of the response (i.e., no step,
single step, or multiple steps) will be dependent on the magnitude of the postural perturbation.
High platform accelerations will evoke stepping responses compared to lower accelerations [8,
12], as high perturbation magnitudes are more likely to displace the COM outside of the BOS
and/or increase the COM velocity to a point that a step is required to counteract the COM
movement [10]. Despite the obvious relationship between perturbation magnitude and the type
of response, different responses (e.g., no step versus single step) can be observed even at the
same perturbation magnitude [7, 10, 12], which provides an interesting opportunity to study the
determinants of reactions.
The overall objective of the current study is to better understand the role of variability in
balance control. Specifically, the aim was to understand the effect of variability of COM
movement while standing still prior to a postural perturbation on reactive stepping after a
platform perturbation. It was hypothesized that high variability of COM movement (position and
speed) when standing would lead to poor balance responses to moving platform perturbations.
3
In this study, the trials where participants did not take a step (best response) were compared to
trials where a step (poor response) was taken, at the same perturbation magnitude, to better
understand if variability of the COM determines when a stepping response is made.
Furthermore, it was hypothesized that stepping responses would be determined by a low MOS
at perturbation onset than no step responses. The influence of other factors such as fatigue,
balance confidence, or anxiety was also examined.
4
2. Literature Review
2.1 Standing balance control
2.1.1 Basic mechanics of standing balance control
Balance control involves regulation of the relationship between the centre of mass (COM) and
the base of support (BOS) by the central nervous system (CNS) [5]. The COM is a location in
the body where a person’s mass is equally distributed around [13]. No matter what postural
orientation the human body is in, the fundamental goal of balance is to maintain control of the
relationship between the COM and the BOS. Previously it was believed that balance was solely
maintained by keeping the COM within the BOS, and when the COM is outside of the BOS, the
individual is falling. However, more recently it has been noted that both the position and
velocity of the COM are important for determining if an individual is stable or unstable [10, 14]
and whether or not a reactive step is required to regain stability following a postural
perturbation. The authors compared the ability of two models, a static threshold model vs
dynamic threshold model, to predict if a step was needed after experiencing a platform
perturbation. The static model was based solely on the position of the COM, while the dynamic
model incorporated both the position and velocity of the COM. The dynamic threshold model
was found to be a more accurate predictor of stepping than the static threshold model, while
the static threshold model also appeared to overestimate when stepping would occur [10]. It is
thought that as the velocity of the COM increases, the effect of momentum of the body
becomes more significant [15], and if the velocity is high enough a step could be forced even
when COM is still within the BOS.
This change in perspective from static to dynamic models of stability eventually lead to the
creation of margin of stability (MOS). MOS was created by Hof, Gazendam & Sinke [6] and
accounts for both the position and velocity of the COM relative to the BOS. The MOS is the
distance between the BOS and the extrapolated COM (xCOM), where the xCOM is the position
5
of the COM that also incorporates the effect of COM velocity. A large MOS reflects a large
distance between the BOS and xCOM and can interpreted to mean the individual is more
stable than a small MOS. When MOS is negative, a change in the size of the BOS (e.g., step)
is required to regain stability [16]. MOS has been used in measure stability in both standing and
walking balance [6, 17, 18].
The CNS can use various postural control strategies in order to maintain a stable relationship
between the COM and the BOS. When standing upright, the CNS has the option of two
different postural control strategies [19]: the change-in-support strategy or fixed support
strategy. The change-in-support strategy involves expanding the BOS to re-capture the COM
by either grasping another stable object or stepping [19].The fixed support strategy involves
activating the muscles around the ankles or hips to manipulate the COM without changing the
BOS [13]. The fixed support strategy can be observed by measuring changes in the centre of
pressure (COP). COP is the weighted average of a person’s vertical ground reaction forces on
the surface [13], and the COP under each foot is considered to be the direct reflection of neural
control of the ankle muscles [13]. While both COP and COM move in phase, the magnitude
and direction of the COP is used to manipulate the COM when standing [13]. Therefore, the
COP can be considered to be the controlling variable in standing postural control and COM as
the controlled variable [20]. The difference between the position of the COP and the vertical
projection of the COM (centre of gravity), i.e. COP minus COM (COP-COM), has been found to
be equivalent to the horizontal acceleration of the COM [20, 21]. COP-COM has also been
thought to be sensitive to changes in the postural control where increasing COP-COM reflects
increasing neurological impairment [20] or error in the postural control system [21]. This idea
was supported when older adults were found to have higher COP-COM values and higher
COM acceleration than young adults [20] showing that COP-COM may be a measure of
balance control that is sensitive to detect changes in balance control due to aging.
6
2.1.2. Inducing reactive stepping
A number of studies have used methods, such as cable waist pulls or moving platforms, to
provide external postural perturbations to study reactive stepping, particularly in the antero-
posterior direction [8, 10, 15, 22]. Moving platforms are particularly useful in providing a large
range of perturbation magnitudes. Unlike controlled waist cable pulls that disturb balance by
displacing the COM, platform translations perturb balance by shifting the BOS. A forward
acceleration of 0.7 m/s2 and backward acceleration of 1.0m/s2 consistently evokes feet-in-place
responses [10], while a forward acceleration of 1.25m/s2 has been found to initially induce a
backward stepping response but resulted in feet-in-place responses after participants
experienced more platform perturbations [12]. A backward acceleration of 2.0 m/s2 and a
forward acceleration of 1.3-1.5m/s2 have been found to produce both feet-in-place and stepping
responses [10, 23], while a backward acceleration of 3.0m/s2 and a forward acceleration of
2.2m/s2 have consistently resulted in a stepping responses [8, 10]. Therefore, previous
literature shows that backward platform accelerations from 1.0m/s2 to 2.0m/s2, and forward
platform accelerations between 0.7m/s2 and 1.5m/s2 provide a range of accelerations that may
induce both feet-in-place and stepping responses at the same acceleration among healthy
individuals. Peak platform acceleration plays the biggest role in determining the magnitude of
the perturbation; according to Newton’s First Law, the individual will be still until an external
force is applied (by the accelerating platform). The higher the acceleration, the greater the force
produced, and therefore, the larger the loss of balance experienced by the individual.
Aside from using varying platform accelerations to provide a diverse range of platform
perturbations, different platform waveforms (i.e., timing of acceleration and deceleration
phases) have also been developed. A waveform consisting of 300ms acceleration followed by
300ms deceleration has been used frequently [10, 12]; however, when participants were
repeatedly exposed to this waveform they learned to use the deceleration phase to stabilize
themselves [24]. To prevent participants from learning to use the deceleration phase,

7
researchers have added waveforms with a constant velocity phase (lasting 400ms to 500ms)
between the acceleration and deceleration phases [10, 23] to the protocol to provide
unpredictability of waveform characteristics when using multiple platform perturbations. These
studies provide a large amount of data regarding platform perturbations that can help create
perturbations that induce both feet-in-place and stepping responses.
2.1.3. Sensory contributions to balance control
Balance control is a complex motor skill originating from the combination of multiple
sensorimotor processes [25]. The visual, vestibular, and somatosensory systems are the
important sensory systems involved in balance control [25]. Vision provides knowledge of
upcoming obstacles, which is critical information needed to anticipate and prepare for potential
threats to balance while walking [26]. Vision, and specifically optic flow, also provides
information about how one is moving relative to the environment [27]. The vestibular system
provides further cues about postural orientation and motion by providing information about the
head movement and orientation in space [28]. The somatosensory system provides postural
information regarding the body’s orientation relative to the support surface through muscle and
joint proprioceptors that provide information on joint position and movement, and
mechanoreceptors that provide information on the change in pressure and shear forces caused
by body movement [29]. While individual sensory systems provide large amounts of information
for balance control on their own, the integration of multiple sensory systems is needed in order
to provide accurate feedback [30]. Sensory integration becomes even more important when
one or more sensory systems are compromised either due to disease or the environment. For
example, when standing on an unstable support surface, the CNS increases the sensitivity of
the vestibular system in order to compensate for the compromised information coming from the
somatosensory system [28].
8
2.1.4. Effects of fatigue on balance control
Fatigue has been shown to affect balance control [31-36]. Fatigue can be induced by both
general muscular exercise and local muscular exercise [37]. General muscular exercise refers
to activities where the whole body is exercised and fatigued (such as running, swimming, or
cycling). High intensity general muscular exercise has been shown to increase standing
postural sway in young adults [34]. Furthermore, general fatigue has also shown to affect
sensory integration for balance control [32]. Authors found that young adults had trouble
maintaining standing balance during situations where sensory conflicts were induced (i.e.,
platform and visual surroundings were manipulated) after performing a 25 km run [32]. Local
muscular exercise refers to the use of simple repetitive movements affecting a few muscles
(e.g., plantarflexion of the feet) where these specific muscles are fatigued [37]. Plantarflexor
muscle fatigue was found to significantly increase antero-posterior sway when standing in
young adults [31], while significantly increasing mediolateral mean COP position and amplitude
during single leg stance in older adults [33]. Another study also found hip and quadriceps
muscle fatigue to increase the angular displacement of the hip, knee, and ankle when
performing a stepping response to a forward fall [35]. Overall, it can be seen that both general
and local fatigue can negatively affect balance control.
Both performance measures and questionnaires have been used in research to identify if the
experimental protocols have induced fatigue. Many studies have frequently used the reduction
in performance to identify if the participant is fatigued. For example, Simoneau, Bégin &
Tesdale [36] used 3 sessions of fast walking to induce fatigue. Participants walked at their
maximal pace, and the session ended when they were unable to maintain that pace. Fatigue
was assumed to be present when a progressive decrease across session times was seen (i.e.,
first session length > second session length > third session length). Other studies that used
repetitive localized movements to induce local muscle fatigue often identified fatigue to be
present when participants were unable to maintain a certain percentage of their maximal
9
voluntary contraction [33, 35, 38]. Another fatigue study [31] used the Borg Rating of Perceived
Exertion (RPE) scale [39] to measure fatigue. While perceived exertion may incorporate
aspects of fatigue (i.e., muscle fatigue), it is primarily a measure of exercise intensity. As it can
be seen, the primary indicator of fatigue seems to be the reduction in performance, while there
seems to a be lack of questionnaires to measure fatigue
2.1.5. Psychological factors affecting balance control
Psychological factors, such as balance confidence, fear of falling, and anxiety, have also been
shown to affect balance control. Balance confidence is defined as an individual’s confidence in
their ability to maintain their balance and remain steady [40]. Transient changes in balance
confidence can influence postural stability. For example, in a previous study, young adults
stood quietly on an elevated platform [41], where the elevated height of the platform increased
perceived threat to participant’s safety (i.e., affected balance confidence). The authors found
that when young adults stood on an elevated platform, participants had a reduced root-mean-
square (RMS) of COP amplitude and increased the frequency of COP fluctuations in the
antero-posterior direction than when standing on the ground. Participants mean COP location
was also located further back when elevated and standing on the edge of the platform than
when standing on the ground. The authors believe that these postural changes were induced
by increasing ankle stiffness [41]. ‘Trait’ balance confidence, i.e., balance confidence
connected to one’s personality and not temporarily induced by a specific scenario (e.g.,
standing on an elevated platform), also potentially influences postural stability. Low balance
confidence has been found to predict high rate of falls in older adults [42]. Balance confidence
is typically measured using questionnaires, such as Falls Efficacy Scale (FES) and Activities-
specific Balance Confidence (ABC) scale in the older adult population [40]. The ABC scale was
found to have better concurrent validity with the Physical Self-Efficacy score (r=0.49) than the
FES (r=-0.33) when measuring balance confidence in older adults. The ABC scale was also
10
shown to be better at detecting a loss of balance confidence in higher functioning older adults
than the FES [40].
Fear of falling is a lasting concern about falling [43]. While often thought to be the
interchangeable with balance confidence, fear of falling and balance confidence are two
different constructs that are related [44, 45]. Balance confidence has been found to be a
mediator between fear of falling and falls, where fear of falling seems to reduce balance
confidence in order to increase the risk of falls in older adults [46]. Originally fear of falling was
thought to increase risk of falls by reducing the activities a person was capable of doing which
would in turn reduce their physical activity level [43]. However, more recent research has
provided evidence that fear of falling can directly affect balance control [44] as well as daily
physical activity level. When young adults who were not fearful stood on an elevated platform
at a height of 3.2m they had decreased RMS COP displacement compared to standing at
ground level [47]. Conversely, young adults who were fearful had increased RMS when
standing on the platform compared to standing at ground level [47]. Similar results have been
seen in studies of the effect of anxiety on postural control [48]. Fear of falling and falls in an
older adult population have also been found to be a risk factor for each other [49], where the
presence of one of these risk factors in an individual can lead to developing the other. Frail
older adults have greater fear of falling than non-frail older adults [50]; declining muscle mass,
strength, power, and physical performance contribute independently to increasing fear of falling
[51]. Questionnaires have been developed to assess fear of falling, but a very simple question
such as “Are you afraid of falling?” with a binary response of “Yes/No” has been used detect
fear of falling in older adults [3, 44]. “Are you afraid of falling?” has also been found to have a
good test-retest reliability (κ = 0.66).
Anxiety can be categorized into two different types: state anxiety and trait anxiety. State anxiety
has been described as a transitory emotional state made up of unpleasant feelings and
11
perceived feelings of tension accompanied by a physiological response from the autonomic
nervous system [52, 53]. Trait anxiety refers to an individual’s anxiety proneness [52, 54].
Increased anxiety has been associated with an increased risk of falls in older adults, but it is
not clear if this is due to side effects of medication to treat anxiety, or due to the anxiety itself
[55]. The authors believed that a vicious cycle where physical disability creates anxiety and
results in prescription drugs that cause more falls and further increase physical disability [55].
More recent research has found that a history of anxiety disorders was independently
associated with an increased likelihood of reported falls and high risk of falls in older men, while
an independent association was not found in older women [56]. Research has also found
generalized anxiety (i.e., trait anxiety) to directly affect balance control [48]. Non-anxious older
adults standing on an elevated force platform were found to have reduced COP sway than
when on the ground [48], which mimicked results found a previous study observing young
healthy adults [41], but anxious older adults were not found to have a decrease in COP sway
when elevated [48]. Reduction in COP sway has been believed to be an ankle stiffening
strategy in response to the threat of the elevated platform [41], but anxiety seems to modify this
postural control strategy [48]. Additionally, state anxiety has shown to be positively correlated
with anterior-posterior postural sway where increased state anxiety increases the postural sway
in the anterior-posterior direction [57]. Furthermore, state anxiety seems to affect postural
control by influencing visual information processing as the lack of vision has found to remove
the effects of state anxiety [57, 58]. While there are multiple questionnaires available to assess
anxiety, the Endler Multidimensional Anxiety Scales (EMAS) [52] has been found to
differentiate between state and trait anxiety using separate questionnaires (EMAS-S and
EMAS-T, respectively). The EMAS further divides state and trait anxiety into different
dimensions or components. EMAS-S splits state anxiety into cognitive worry and autonomic
emotion components, while the EMAS-T splits trait anxiety into: social evaluation, physical
danger, ambiguous situations, and daily routines. The EMAS-S was found to have good
concurrent validity with the State-Trait Anxiety Inventory (STAI) state questionnaire (Males –
12
r=0.48, females – r=0.61; both p=0.001) of state anxiety in American undergraduate students.
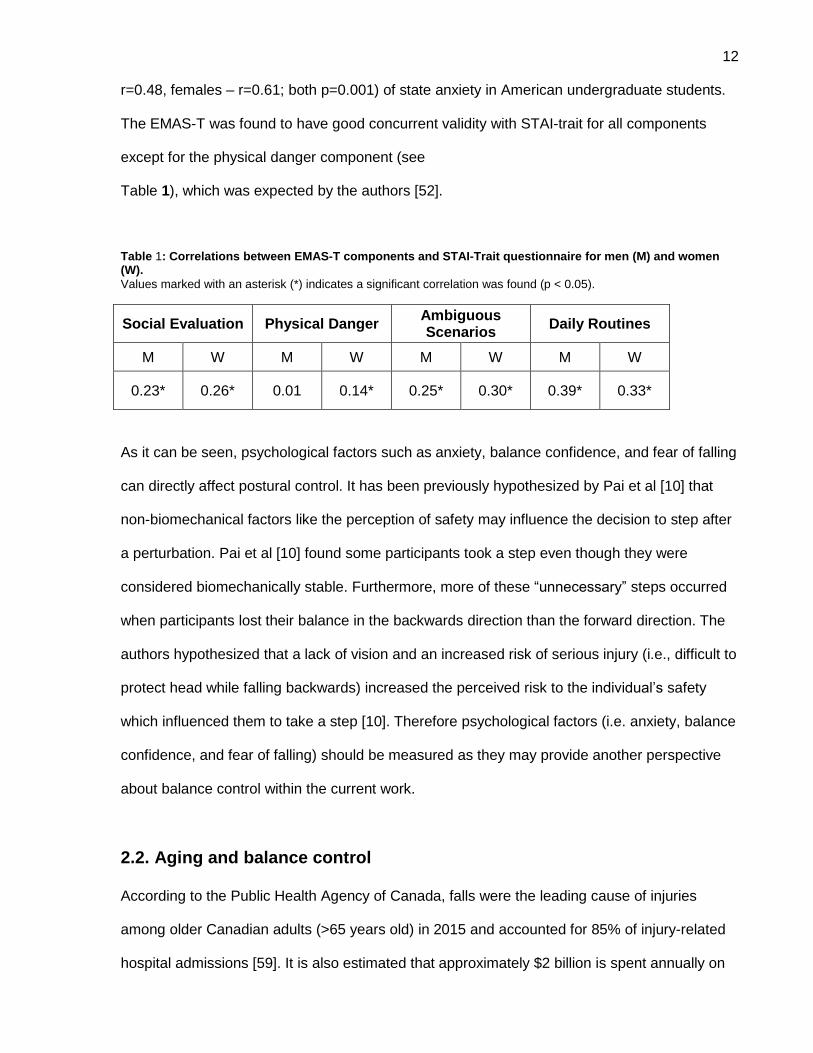
The EMAS-T was found to have good concurrent validity with STAI-trait for all components
except for the physical danger component (see
Table 1), which was expected by the authors [52].
Table 1: Correlations between EMAS-T components and STAI-Trait questionnaire for men (M) and women (W).
Values marked with an asterisk (*) indicates a significant correlation was found (p < 0.05).
Social Evaluation Physical Danger Ambiguous Scenarios
Daily Routines
M W M W M W M W
0.23* 0.26* 0.01 0.14* 0.25* 0.30* 0.39* 0.33*
As it can be seen, psychological factors such as anxiety, balance confidence, and fear of falling
can directly affect postural control. It has been previously hypothesized by Pai et al [10] that
non-biomechanical factors like the perception of safety may influence the decision to step after
a perturbation. Pai et al [10] found some participants took a step even though they were
considered biomechanically stable. Furthermore, more of these “unnecessary” steps occurred
when participants lost their balance in the backwards direction than the forward direction. The
authors hypothesized that a lack of vision and an increased risk of serious injury (i.e., difficult to
protect head while falling backwards) increased the perceived risk to the individual’s safety
which influenced them to take a step [10]. Therefore psychological factors (i.e. anxiety, balance
confidence, and fear of falling) should be measured as they may provide another perspective
about balance control within the current work.
2.2. Aging and balance control
According to the Public Health Agency of Canada, falls were the leading cause of injuries
among older Canadian adults (>65 years old) in 2015 and accounted for 85% of injury-related
hospital admissions [59]. It is also estimated that approximately $2 billion is spent annually on
13
direct health care costs due to falls [59]. Falls are an important issue especially within older
adults. Balance control is affected by the aging process due to the decline in musculoskeletal
and sensory systems [60]. For example, many studies reviewed by Shaffer and Harrison [61]
have found that general decline in the somatosensory system (e.g., impaired proprioception,
vibration and discriminative touch) worsens balance control and puts older adults an increased
risk of falls. There are significant differences in postural control strategies between younger and
older adults. For example, young adults make small continuous adjustments to their COP while
older adults make larger corrective COP movements during upright stance [62]. This change in
postural control strategy may be the reason why older adults have an increased postural sway
while standing than young adults [63]. Additionally, people become more dependent on
anticipatory balance control than reactive balance control as they age [64].
Numerous studies have found a link a between variability of balance measures and an
increased risk of falls in older adults when standing or walking. Increased variability of COP in
healthy older adults [65] and those with type 2 diabetes [4] have been linked to an increased
risk of falls when standing, while increased variability in spatiotemporal measures of walking in
healthy older adults [1-3] and people with stroke [66] has also been linked to an increased risk
of falls. Currently the nature of this relationship is not fully understood. Specifically, it is
unknown if variability causes falls. It can be hypothesized that an increased variability of
balance measures when standing (i.e., COP) reflects an increased variability in the movement
of the COM, and it is the variability of the COM that puts the human body at risk of falling. One
potential explanation is that high COM variability may increase the chance that the COM will
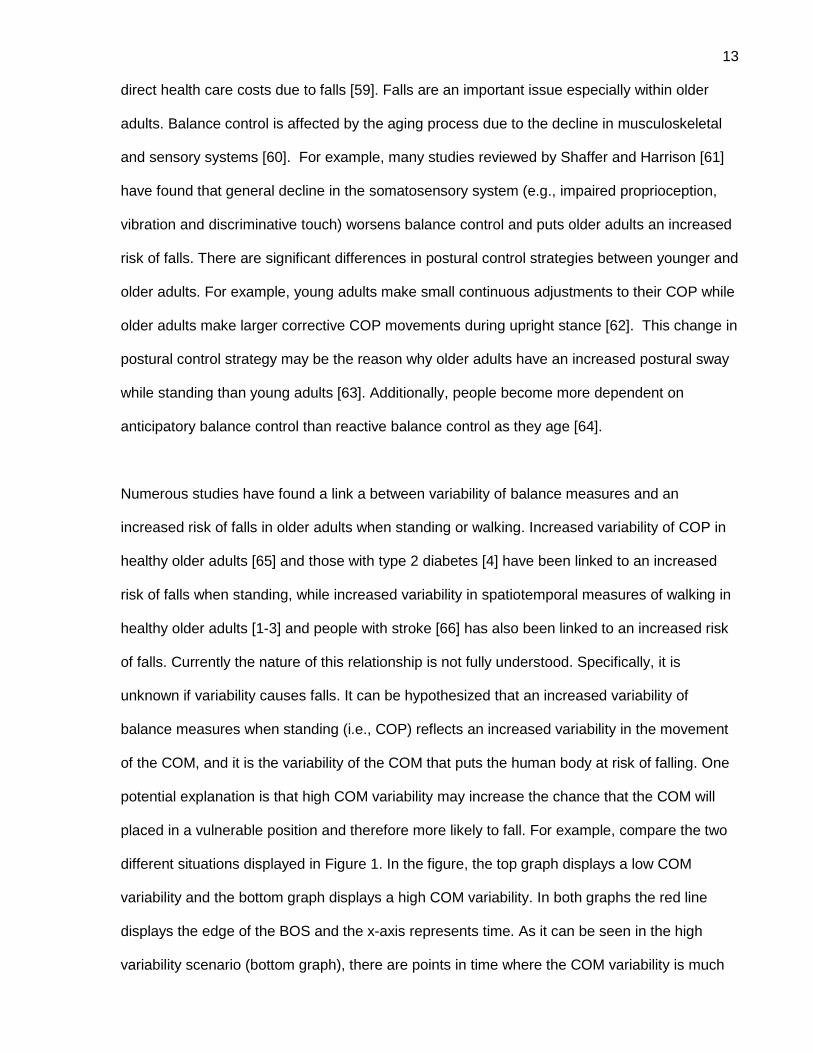
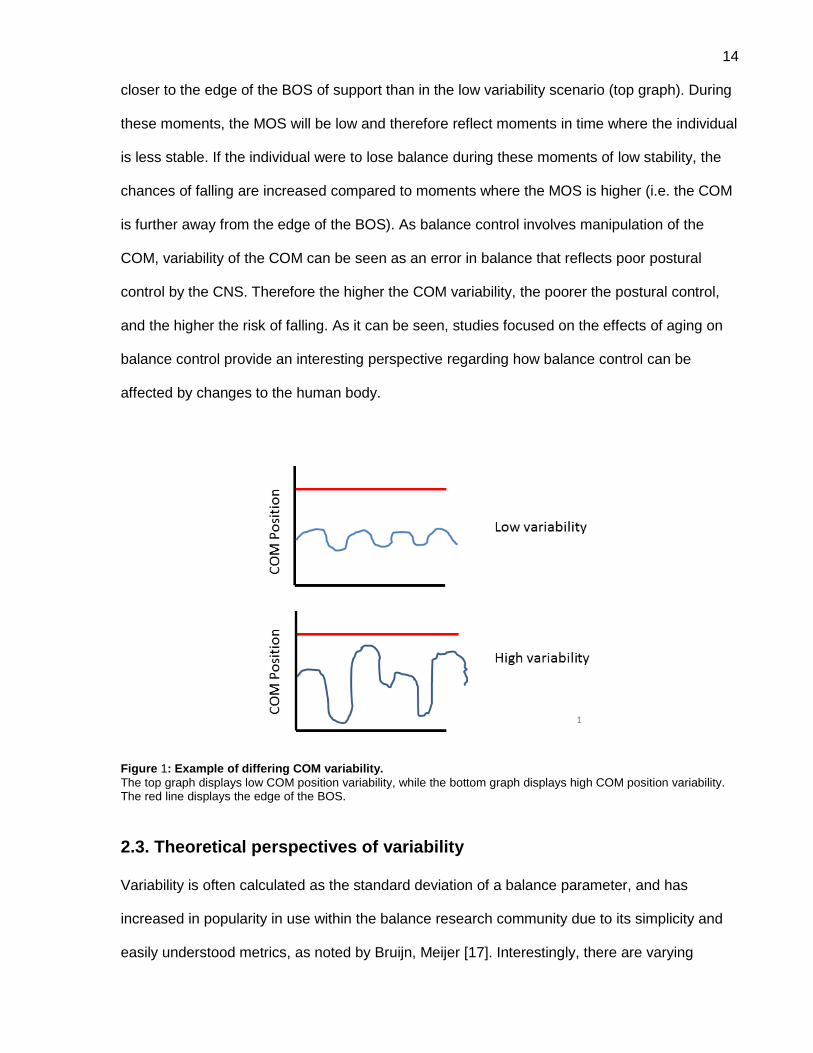
placed in a vulnerable position and therefore more likely to fall. For example, compare the two
different situations displayed in Figure 1. In the figure, the top graph displays a low COM
variability and the bottom graph displays a high COM variability. In both graphs the red line
displays the edge of the BOS and the x-axis represents time. As it can be seen in the high
variability scenario (bottom graph), there are points in time where the COM variability is much
14
closer to the edge of the BOS of support than in the low variability scenario (top graph). During
these moments, the MOS will be low and therefore reflect moments in time where the individual
is less stable. If the individual were to lose balance during these moments of low stability, the
chances of falling are increased compared to moments where the MOS is higher (i.e. the COM
is further away from the edge of the BOS). As balance control involves manipulation of the
COM, variability of the COM can be seen as an error in balance that reflects poor postural
control by the CNS. Therefore the higher the COM variability, the poorer the postural control,
and the higher the risk of falling. As it can be seen, studies focused on the effects of aging on
balance control provide an interesting perspective regarding how balance control can be
affected by changes to the human body.
Figure 1: Example of differing COM variability.
The top graph displays low COM position variability, while the bottom graph displays high COM position variability. The red line displays the edge of the BOS.
2.3. Theoretical perspectives of variability
Variability is often calculated as the standard deviation of a balance parameter, and has
increased in popularity in use within the balance research community due to its simplicity and
easily understood metrics, as noted by Bruijn, Meijer [17]. Interestingly, there are varying
15
perspectives regarding whether or not variability is a negative aspect of human movement.
Traditionally, variability in human movement has been thought of as disadvantageous where a
reduction in variability has been seen as an improvement in performance [67]. In contrast, there
is also the perspective that variability is a consequence of human movement [17, 68] as
humans have multiple degrees of freedom in their movements [17].This latter perspective is
exemplified with the uncontrolled manifold (UCM) hypothesis [68]. The UCM hypothesis
assumes that the CNS allows the different elements of the movement (i.e., muscle activations,
joint angles, etc.) to self-adjust to each other as long as the performance variable (i.e., goal of
the movement) is achieved. Toney and Chang [69] provide an effective analogy to explain the
UCM hypothesis. Imagine a choir conductor signalling the group to increase their volume. The
conductor would not direct each singer individually in order to increase the choir volume as it
may lead to an overall uneven sound. Instead the conductor would direct the whole choir to
increase their volume, allowing each singer to self-adjust to their neighbour, and thus producing
an overall even sound. Like the conductor, the UCM hypothesis considers the different aspects
of movement (singers) to self-adjust to errors (singers adjusting their respective volume to their
neighbours) in order to achieve a performance variable (choir volume) [69]. Thus showing how
variability can be a natural consequence of human movement due to the many elements within
the motor control system.
Furthermore, there is also the perspective that variability may play a positive role in balance
control. Carpenter et al [70] state that COP may play a role in providing sensory information to
the CNS as there was an increase in COP variability when the COM was stabilized by an
apparatus. Theoretically, when the COM is stabilized externally by an apparatus, there should
be reduced movement of COP as COP does not need to move in order to control the COM.
Instead, the authors found that COP variability increased and hypothesized that this occurred in
order to continue to provide the CNS with sensory feedback [70]. This could mean that
variability of movement may represent a method of receiving sensory feedback, and a lack of
16
variability, may lead to a reduction of sensory input to the CNS. Therefore, variability may also
play a positive role in human movement.
In addition to the contrasting perspectives on the role of variability, there are also different
ideas relating to the origin of movement variability. van Beers, Haggard [71] have found that
movement variability stems from noise associated with movement execution while Churchland,
Afshar [72] have found movement variability originates from variable neural activity of motor
neurons involved in the preparation of movement.
.
2.4. Summary
Previous research has found a link between variability and falls, but it is unknown if variability
causes falls. Furthermore, while there is much knowledge about how balance control is
accomplished mechanically and how sensory systems and psychological factors can affect
balance control, it is unknown how variability is influenced by these processes and how
variability affects balance control. The purpose of the current work is to better understand the
role of variability in balance control, specifically in standing postural control. The objective of
the study is to understand how variability affects the response to balance perturbations induced
by a moving platform. It is hypothesized that a high variability of the COM position and velocity
when standing will lead to a stepping response after a platform perturbation while low COM
variability will result in a feet in place response. It is also hypothesized that stepping responses
will be preceded by a lower MOS compared to feet-in-place places. Other factors such as
fatigue, balance confidence, and anxiety will be measured in order to control for possible
factors other than COM variability that may influence the decision to step.
17
3. Methodology
3.1. Participants
Fourteen healthy young adults voluntarily participated in this study. Participants were excluded
if they had history of neurological disorder, lower body injury, or any other impairment that may
affect postural control. Written informed consent was obtained from all participants and the
protocol was approved by Toronto Rehabilitation Institute’s Research Ethics Board.
Participants received a $30 gift card as remuneration for their time spent in the study sessions.
3.2. Apparatus
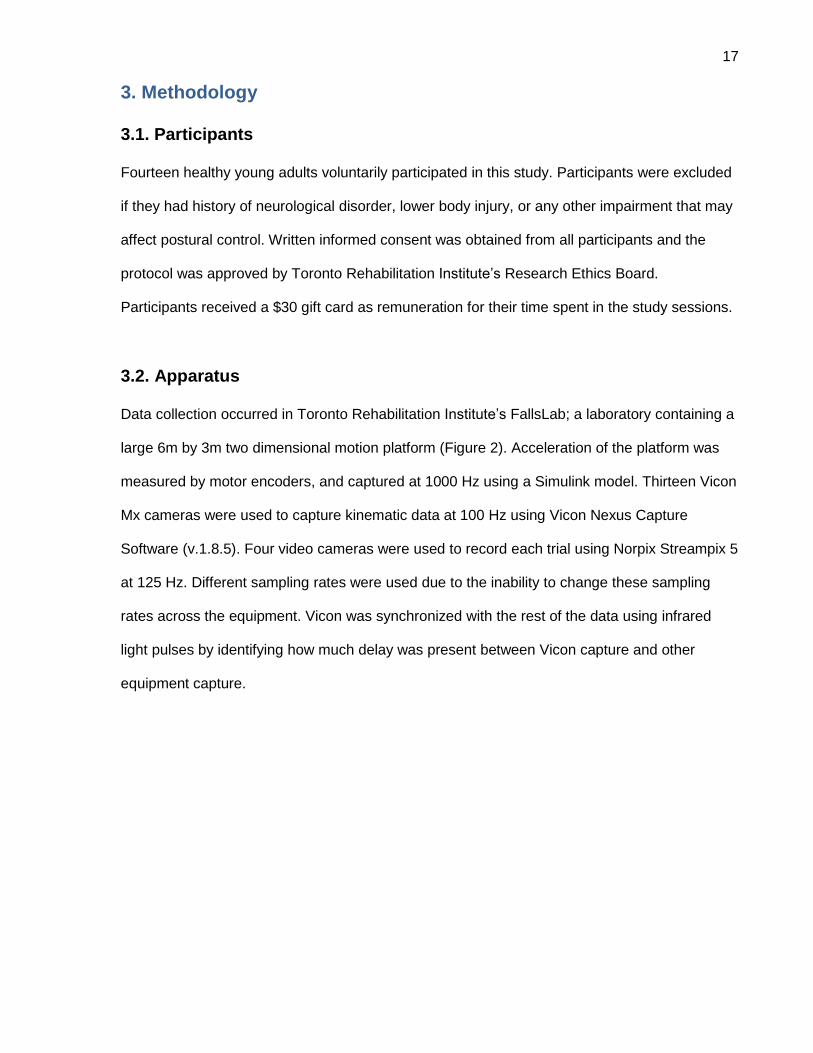
Data collection occurred in Toronto Rehabilitation Institute’s FallsLab; a laboratory containing a
large 6m by 3m two dimensional motion platform (Figure 2). Acceleration of the platform was
measured by motor encoders, and captured at 1000 Hz using a Simulink model. Thirteen Vicon
Mx cameras were used to capture kinematic data at 100 Hz using Vicon Nexus Capture
Software (v.1.8.5). Four video cameras were used to record each trial using Norpix Streampix 5
at 125 Hz. Different sampling rates were used due to the inability to change these sampling
rates across the equipment. Vicon was synchronized with the rest of the data using infrared
light pulses by identifying how much delay was present between Vicon capture and other
equipment capture.
18
Figure 2: Laboratory set up.
3.3. Protocol
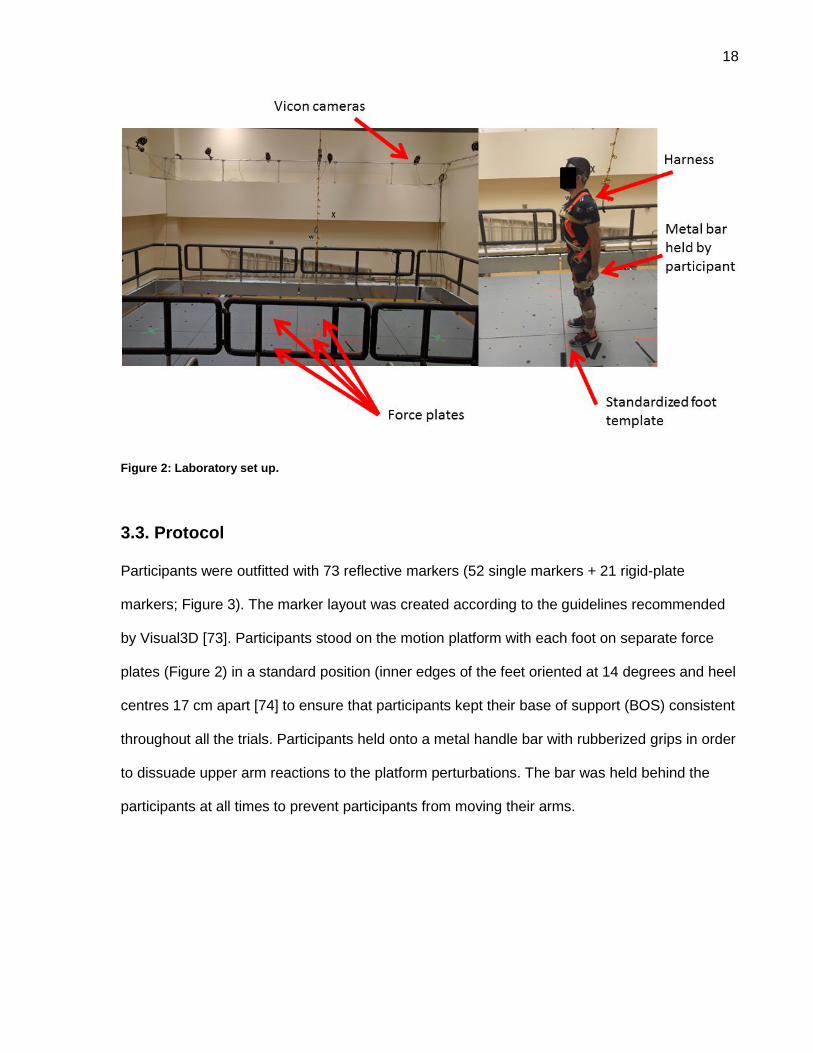
Participants were outfitted with 73 reflective markers (52 single markers + 21 rigid-plate
markers; Figure 3). The marker layout was created according to the guidelines recommended
by Visual3D [73]. Participants stood on the motion platform with each foot on separate force
plates (Figure 2) in a standard position (inner edges of the feet oriented at 14 degrees and heel
centres 17 cm apart [74] to ensure that participants kept their base of support (BOS) consistent
throughout all the trials. Participants held onto a metal handle bar with rubberized grips in order
to dissuade upper arm reactions to the platform perturbations. The bar was held behind the
participants at all times to prevent participants from moving their arms.
19
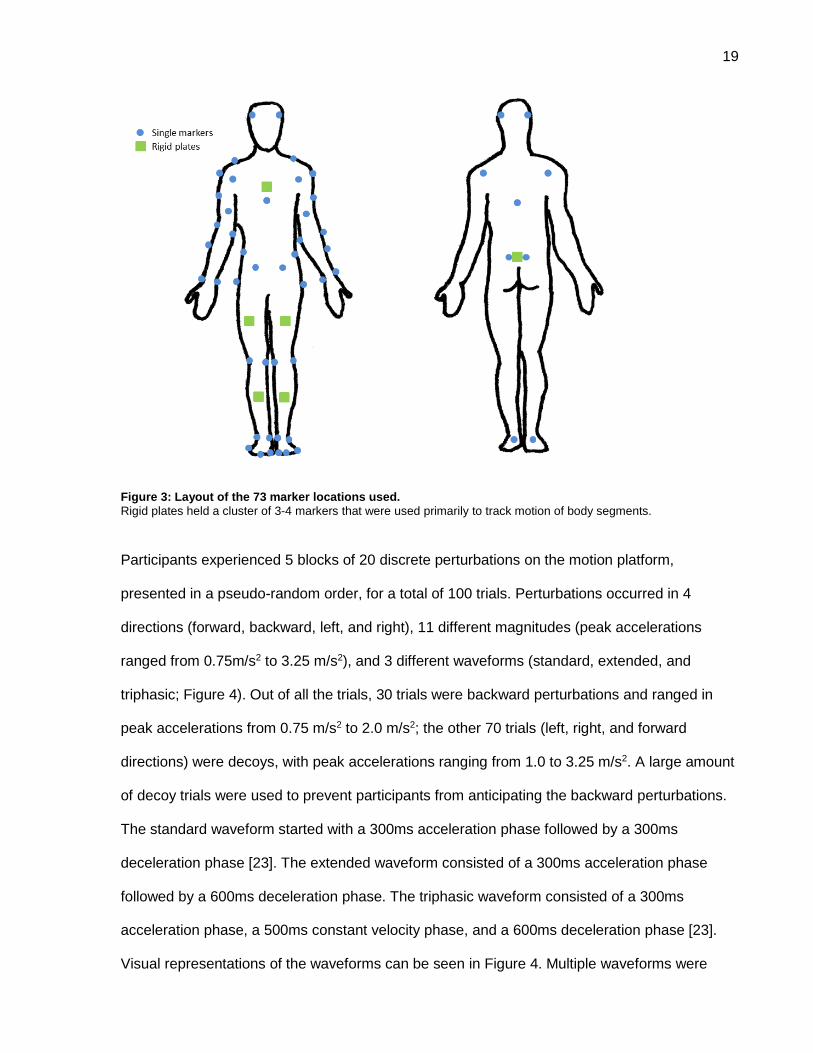
Figure 3: Layout of the 73 marker locations used.
Rigid plates held a cluster of 3-4 markers that were used primarily to track motion of body segments.
Participants experienced 5 blocks of 20 discrete perturbations on the motion platform,
presented in a pseudo-random order, for a total of 100 trials. Perturbations occurred in 4
directions (forward, backward, left, and right), 11 different magnitudes (peak accelerations
ranged from 0.75m/s2 to 3.25 m/s2), and 3 different waveforms (standard, extended, and
triphasic; Figure 4). Out of all the trials, 30 trials were backward perturbations and ranged in
peak accelerations from 0.75 m/s2 to 2.0 m/s2; the other 70 trials (left, right, and forward
directions) were decoys, with peak accelerations ranging from 1.0 to 3.25 m/s2. A large amount
of decoy trials were used to prevent participants from anticipating the backward perturbations.
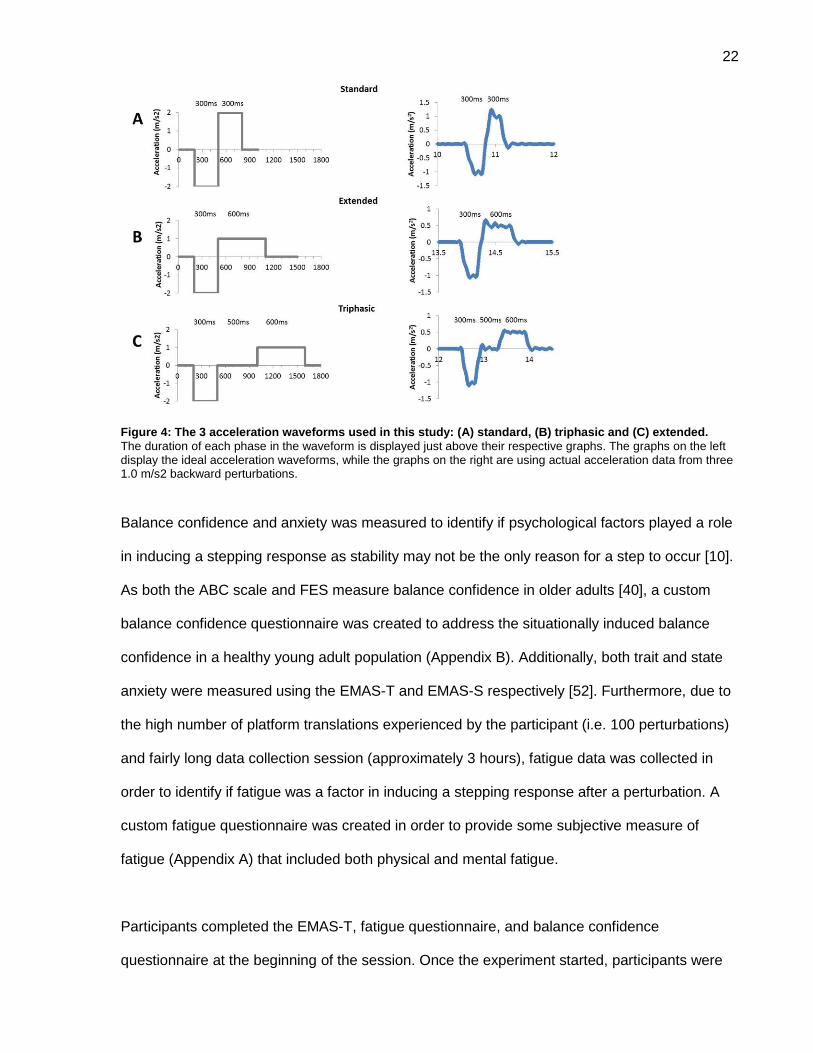
The standard waveform started with a 300ms acceleration phase followed by a 300ms
deceleration phase [23]. The extended waveform consisted of a 300ms acceleration phase
followed by a 600ms deceleration phase. The triphasic waveform consisted of a 300ms
acceleration phase, a 500ms constant velocity phase, and a 600ms deceleration phase [23].
Visual representations of the waveforms can be seen in Figure 4. Multiple waveforms were
20
used to prevent participants from predicting the timing and magnitude of the deceleration
phase, where they may have used the platform deceleration to regain their stability [24]. The 30
backward perturbations were divided between the 6 accelerations of interest (i.e. 0.75, 1.00,
1.25, 1.50, 1.75, and 2.00 m/s2) resulting in 5 perturbations at each acceleration. The 5
perturbations consisted of: 2 standard waveforms, 2 extended waveforms, and 1 triphasic
waveform. Only one triphasic waveform was chosen for each acceleration as it was the most
“experimental” waveform. During pilot testing, the triphasic waveform went through
modifications in order to prevent the waveform from inducing a step. While our pilot testing
showed that the current triphasic waveform did not seem to induce stepping, the appearance of
this waveform was kept to a minimum to be safe. The acceleration phase in all waveforms was
kept the same in order to keep the perturbation magnitude consistent between waveforms. A
random amount of time (ranged from 10-15 seconds) of quiet standing data were collected
before each perturbation to prevent the participant from predicting the timing of perturbation
onset. Two seconds of data were collected after the perturbation. Rest breaks were provided
between each trial block and when requested by the participant.
21
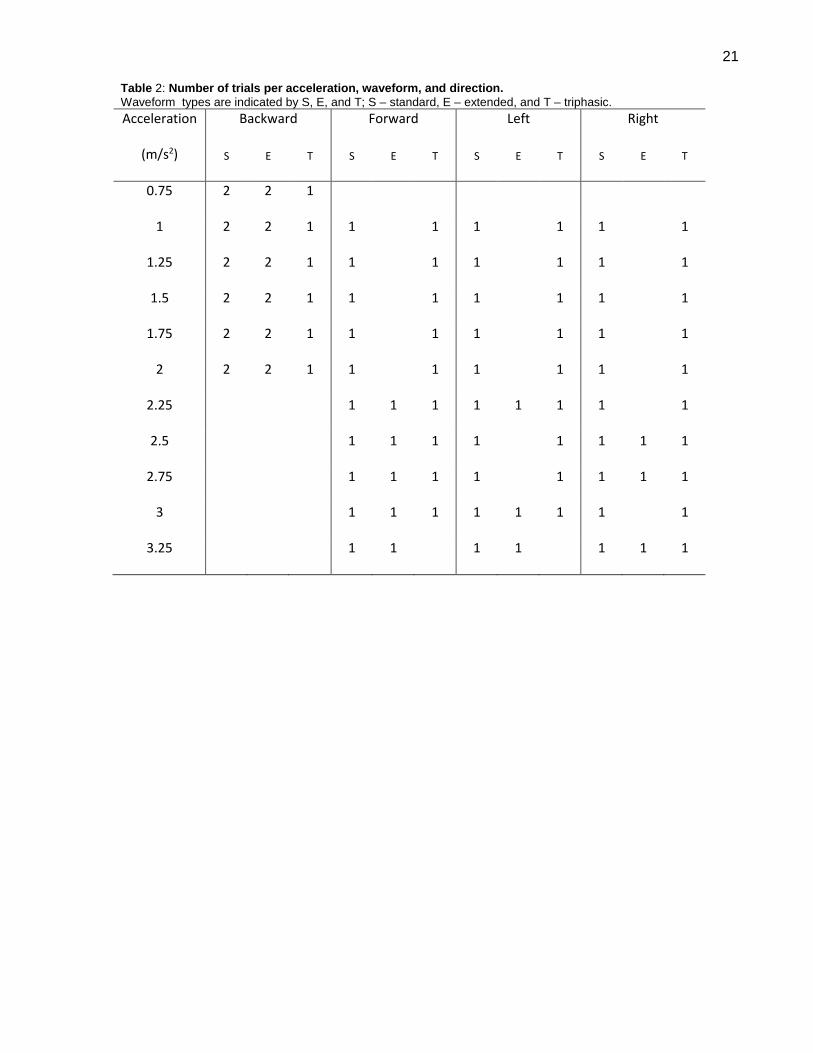
Table 2: Number of trials per acceleration, waveform, and direction.
Waveform types are indicated by S, E, and T; S – standard, E – extended, and T – triphasic.
Acceleration
(m/s2)
Backward Forward Left Right
S E T S E T S E T S E T
0.75 2 2 1
1 2 2 1 1
1 1
1 1
1
1.25 2 2 1 1
1 1
1 1
1
1.5 2 2 1 1
1 1
1 1
1
1.75 2 2 1 1
1 1
1 1
1
2 2 2 1 1
1 1
1 1
1
2.25
1 1 1 1 1 1 1
1
2.5
1 1 1 1
1 1 1 1
2.75
1 1 1 1
1 1 1 1
3
1 1 1 1 1 1 1
1
3.25
1 1
1 1
1 1 1
22
Figure 4: The 3 acceleration waveforms used in this study: (A) standard, (B) triphasic and (C) extended.
The duration of each phase in the waveform is displayed just above their respective graphs. The graphs on the left display the ideal acceleration waveforms, while the graphs on the right are using actual acceleration data from three 1.0 m/s2 backward perturbations.
Balance confidence and anxiety was measured to identify if psychological factors played a role
in inducing a stepping response as stability may not be the only reason for a step to occur [10].
As both the ABC scale and FES measure balance confidence in older adults [40], a custom
balance confidence questionnaire was created to address the situationally induced balance
confidence in a healthy young adult population (Appendix B). Additionally, both trait and state
anxiety were measured using the EMAS-T and EMAS-S respectively [52]. Furthermore, due to
the high number of platform translations experienced by the participant (i.e. 100 perturbations)
and fairly long data collection session (approximately 3 hours), fatigue data was collected in
order to identify if fatigue was a factor in inducing a stepping response after a perturbation. A
custom fatigue questionnaire was created in order to provide some subjective measure of
fatigue (Appendix A) that included both physical and mental fatigue.
Participants completed the EMAS-T, fatigue questionnaire, and balance confidence
questionnaire at the beginning of the session. Once the experiment started, participants were
23
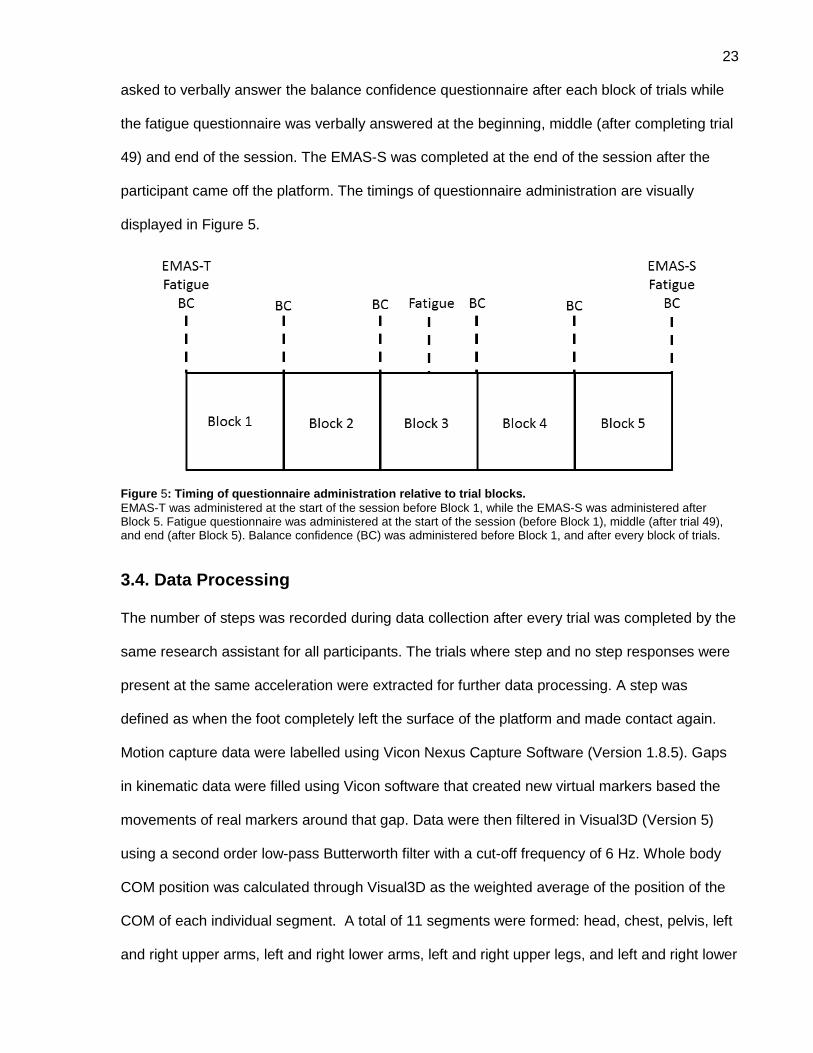
asked to verbally answer the balance confidence questionnaire after each block of trials while
the fatigue questionnaire was verbally answered at the beginning, middle (after completing trial
49) and end of the session. The EMAS-S was completed at the end of the session after the
participant came off the platform. The timings of questionnaire administration are visually
displayed in Figure 5.
Figure 5: Timing of questionnaire administration relative to trial blocks.
EMAS-T was administered at the start of the session before Block 1, while the EMAS-S was administered after Block 5. Fatigue questionnaire was administered at the start of the session (before Block 1), middle (after trial 49), and end (after Block 5). Balance confidence (BC) was administered before Block 1, and after every block of trials.
3.4. Data Processing
The number of steps was recorded during data collection after every trial was completed by the
same research assistant for all participants. The trials where step and no step responses were
present at the same acceleration were extracted for further data processing. A step was
defined as when the foot completely left the surface of the platform and made contact again.
Motion capture data were labelled using Vicon Nexus Capture Software (Version 1.8.5). Gaps
in kinematic data were filled using Vicon software that created new virtual markers based the
movements of real markers around that gap. Data were then filtered in Visual3D (Version 5)
using a second order low-pass Butterworth filter with a cut-off frequency of 6 Hz. Whole body
COM position was calculated through Visual3D as the weighted average of the position of the
COM of each individual segment. A total of 11 segments were formed: head, chest, pelvis, left
and right upper arms, left and right lower arms, left and right upper legs, and left and right lower
24
legs (Appendix C). The feet and hands were excluded from whole body COM calculation.
According the inverted pendulum model of quiet standing, balance control during quiet standing
is manipulated by the muscles around the ankles [13]. As the feet do not move during quiet
standing (as participants are stationary), the feet were not included in the whole body COM
calculation. The hands were excluded as they were placed along the body during the entire
time of data collection and did not move. COM velocity and variability of COM position and
velocity were calculated using a custom Matlab routine from COM position outputted by
Visual3D. COM variability was calculated as the standard deviation of COM position and
velocity in the antero-posterior (AP) and medio-lateral (ML) directions during the 10-second
period prior to perturbation onset. Both position and velocity were used in the current study as
both have been found to be important factors in the manipulation of the COM during balance
control [6, 10, 14]. Thus, there were four measures of COM variability: standard deviation of ML
position, standard deviation of AP position, standard deviation of ML velocity, and standard
deviation of AP velocity.
Perturbation onset was the point in time where the platform reached an acceleration of 0.1m/s2
[8, 75]. Acceleration data were filtered using a custom Matlab program with a zero-phase lag 4th
order Butterworth filter with a low-pass cut-off frequency of 20 Hz. Cut-off frequencies was
determined during pilot testing using residual analysis [76]. Acceleration data were detrended
after the filtering process by subtracting the mean of the first 10 seconds from the entire signal.
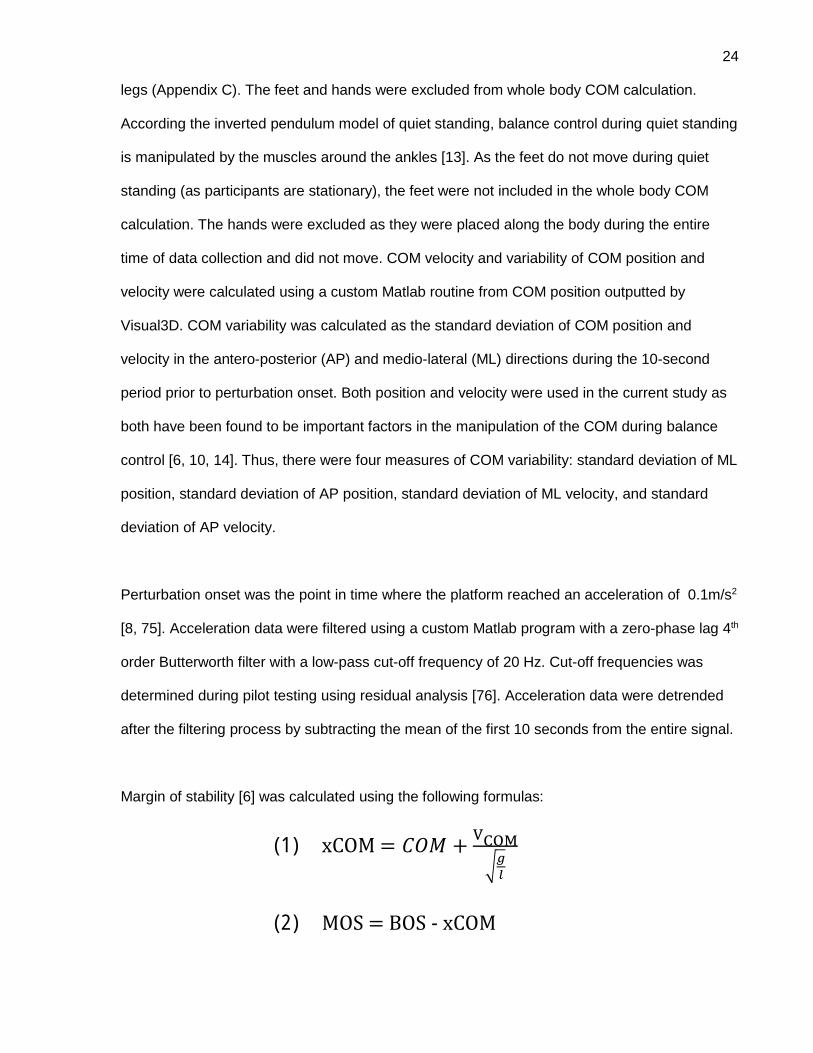
Margin of stability [6] was calculated using the following formulas:
(1) xCOM = 𝐶𝑂𝑀 +VCOM
√𝑔
𝑙
(2) MOS = BOS - xCOM
25
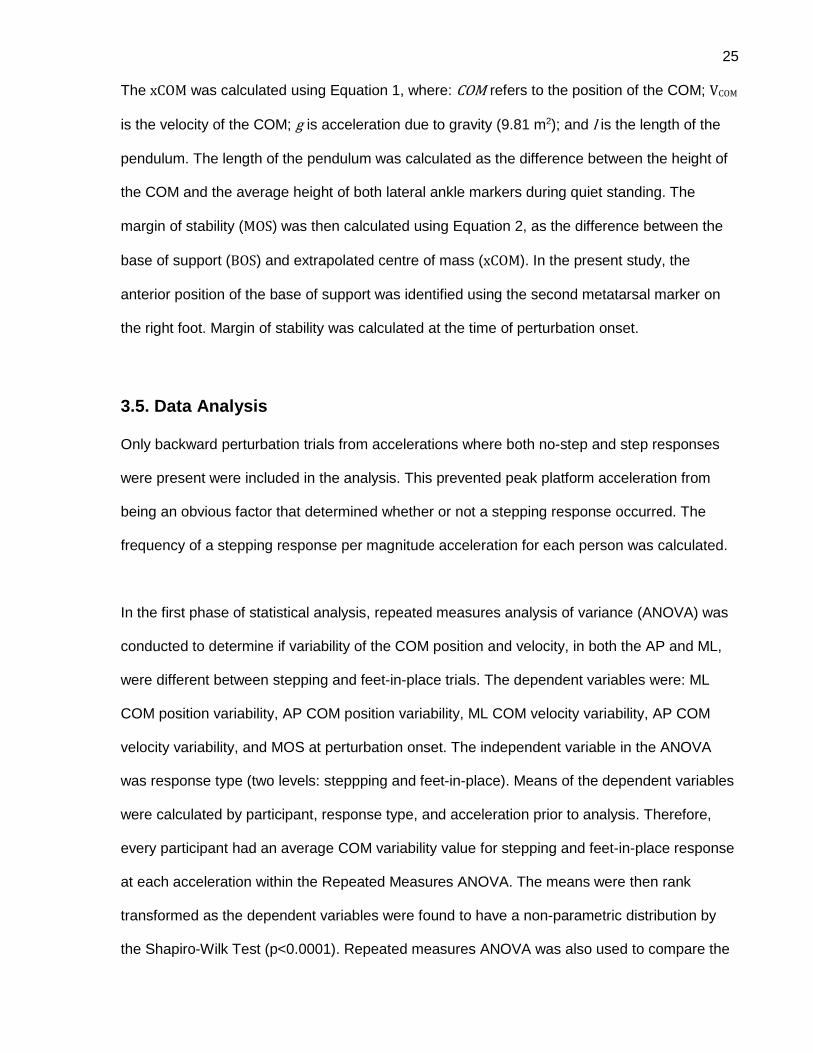
The xCOM was calculated using Equation 1, where: COM refers to the position of the COM; VCOM
is the velocity of the COM; g is acceleration due to gravity (9.81 m2); and l is the length of the
pendulum. The length of the pendulum was calculated as the difference between the height of
the COM and the average height of both lateral ankle markers during quiet standing. The
margin of stability (MOS) was then calculated using Equation 2, as the difference between the
base of support (BOS) and extrapolated centre of mass (xCOM). In the present study, the
anterior position of the base of support was identified using the second metatarsal marker on
the right foot. Margin of stability was calculated at the time of perturbation onset.
3.5. Data Analysis
Only backward perturbation trials from accelerations where both no-step and step responses
were present were included in the analysis. This prevented peak platform acceleration from
being an obvious factor that determined whether or not a stepping response occurred. The
frequency of a stepping response per magnitude acceleration for each person was calculated.
In the first phase of statistical analysis, repeated measures analysis of variance (ANOVA) was
conducted to determine if variability of the COM position and velocity, in both the AP and ML,
were different between stepping and feet-in-place trials. The dependent variables were: ML
COM position variability, AP COM position variability, ML COM velocity variability, AP COM
velocity variability, and MOS at perturbation onset. The independent variable in the ANOVA
was response type (two levels: steppping and feet-in-place). Means of the dependent variables
were calculated by participant, response type, and acceleration prior to analysis. Therefore,
every participant had an average COM variability value for stepping and feet-in-place response
at each acceleration within the Repeated Measures ANOVA. The means were then rank
transformed as the dependent variables were found to have a non-parametric distribution by
the Shapiro-Wilk Test (p<0.0001). Repeated measures ANOVA was also used to compare the
26
fatigue questionnaire scores between three different time points (i.e., start, middle, end) and
the balance confidence questionnaire between 6 different time points (at the start, before the
session, and after every block). Questionnaire scores for both the fatigue and balance
confidence questionnaire were rank transformed as these scores are ordinal, and therefore,
have a non-parametric distribution. Factors in the ANOVA were questionnaire score and time
point (fatigue questionnaire – 3 time points; balance confidence questionnaire – 6 time points).
Spearman’s correlation was conducted to determine the relationship between anxiety scores
(EMAS-S and EMAS-T) and the mean number of stepping trials. Only 13 participants (out of
14) were included in the trait anxiety analysis as one participant did not complete the EMAS-T.
The lack of significant findings in the first phase of statistical analysis prompted a second phase
to be conducted using a more robust statistical model with the addition of possible covariates.
Logistic regressions with repeated measures were used to determine if COM variability and
margin of stability were related to prevalence of stepping responses when controlling for other
potentially confounding variables. The dependent variable was step response (i.e., step versus
no step). Independent variables were variability/margin of stability, platform acceleration, and
fatigue score. As fatigue score was only conducted 3 times during a session, the 5 trial blocks
had to split into 3 sections where each section had a fatigue score assigned to all trials within
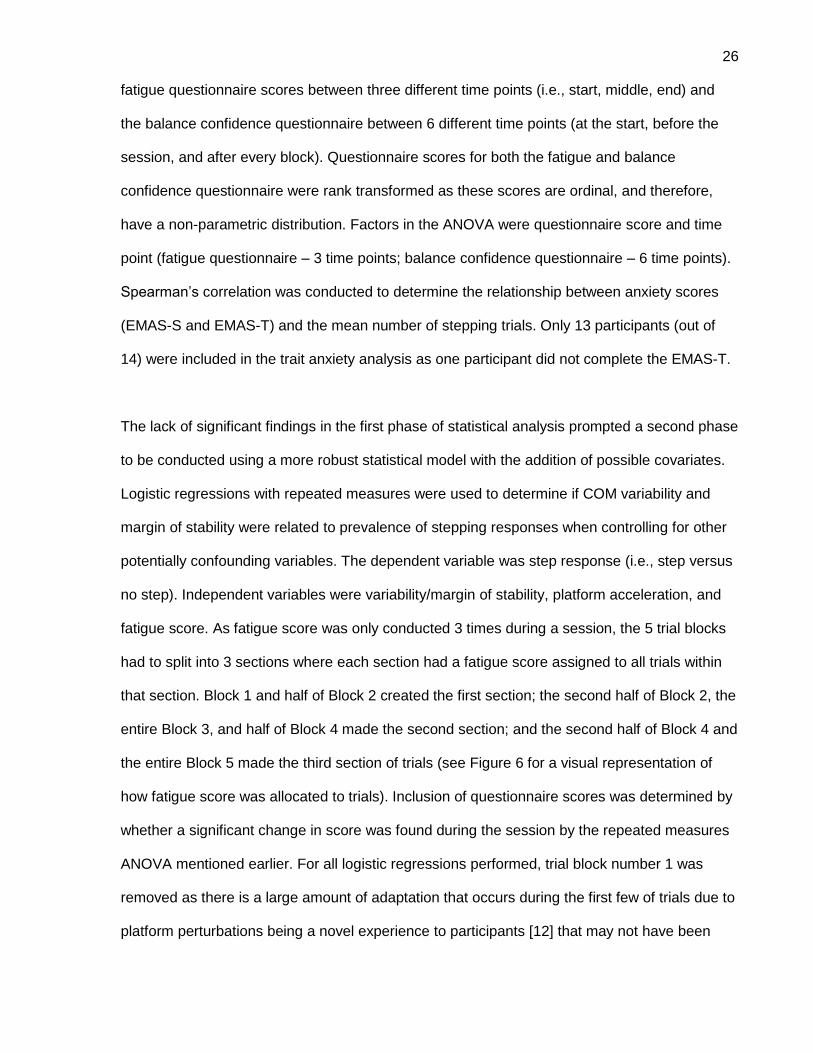
that section. Block 1 and half of Block 2 created the first section; the second half of Block 2, the
entire Block 3, and half of Block 4 made the second section; and the second half of Block 4 and
the entire Block 5 made the third section of trials (see Figure 6 for a visual representation of
how fatigue score was allocated to trials). Inclusion of questionnaire scores was determined by
whether a significant change in score was found during the session by the repeated measures
ANOVA mentioned earlier. For all logistic regressions performed, trial block number 1 was
removed as there is a large amount of adaptation that occurs during the first few of trials due to
platform perturbations being a novel experience to participants [12] that may not have been
27
consistent with the reactions seen in the following trials blocks. For all statistics analyses α was
0.05.
Figure 6: Allocation of fatigue score to perturbation trials
Fatigue score was collected at 3 different time points indicated by the dash lines. The 5 trial blocks were split up into 3 sections in order to apply a fatigue score to all trials within each section.. This was done so that fatigue score could be included in the logistic regression.
3.6. Sample Size
A sample size of 14 participants was used in this study. Similar number of participants have
been used in previous work observing COP and COM measures in a healthy young adult
population [20, 77]. These works have also used an ANOVA within their data analyses.
28
4. Results
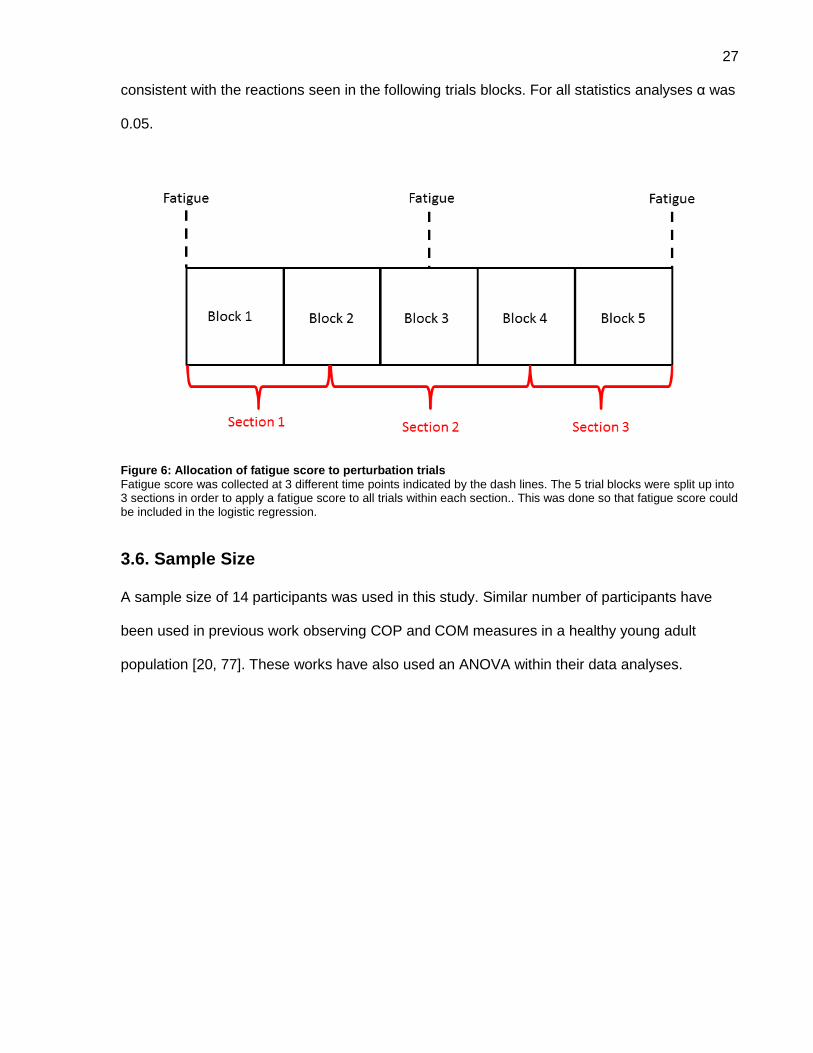
Fourteen participants were recruited for this study. Participant characteristics can be seen in
Table 3. A total of 235 trials were used in the analysis, where 48% of trials (113/235) had a
stepping response. Nineteen of these stepping trials (17% of stepping trials) were multistep
responses where the participants took 2 or more steps.
Table 3: Participant characteristics for a total sample size of 14.
Values are presented as mean (standard deviation) for continuous variables OR counts (% of sample) for categorical variables. Values for Sex refer to the number of women (percentage) in sample.
Age (years) 28 (4.2)
Height (m) 1.32 (0.1)
Weight (kg) 70.6 (15.2)
Sex (women) 8 (57.1)
Most participants had 15-20 trials included in the analysis, but one participant had as low as 5
trials. Number of stepping trials per acceleration for each participant is shown in

29
Table 4. There was a trend towards increased frequency of stepping as the magnitude of
acceleration increased. All participants stepped on all trials at 2.0m/s2.
30
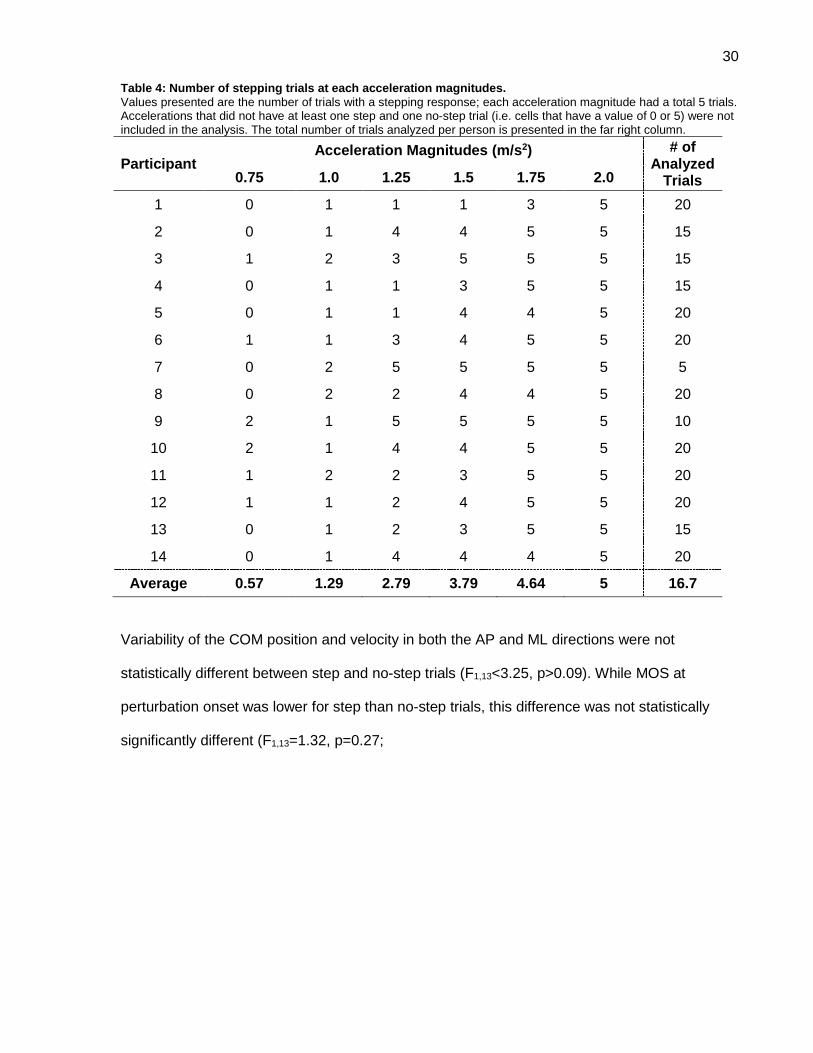
Table 4: Number of stepping trials at each acceleration magnitudes.
Values presented are the number of trials with a stepping response; each acceleration magnitude had a total 5 trials. Accelerations that did not have at least one step and one no-step trial (i.e. cells that have a value of 0 or 5) were not included in the analysis. The total number of trials analyzed per person is presented in the far right column.
Participant Acceleration Magnitudes (m/s2) # of
Analyzed Trials 0.75 1.0 1.25 1.5 1.75 2.0
1 0 1 1 1 3 5 20
2 0 1 4 4 5 5 15
3 1 2 3 5 5 5 15
4 0 1 1 3 5 5 15
5 0 1 1 4 4 5 20
6 1 1 3 4 5 5 20
7 0 2 5 5 5 5 5
8 0 2 2 4 4 5 20
9 2 1 5 5 5 5 10
10 2 1 4 4 5 5 20
11 1 2 2 3 5 5 20
12 1 1 2 4 5 5 20
13 0 1 2 3 5 5 15
14 0 1 4 4 4 5 20
Average 0.57 1.29 2.79 3.79 4.64 5 16.7
Variability of the COM position and velocity in both the AP and ML directions were not
statistically different between step and no-step trials (F1,13<3.25, p>0.09). While MOS at
perturbation onset was lower for step than no-step trials, this difference was not statistically
significantly different (F1,13=1.32, p=0.27;
31
Table 7). A more detailed summary of the mentioned results can be found in
Table 5.
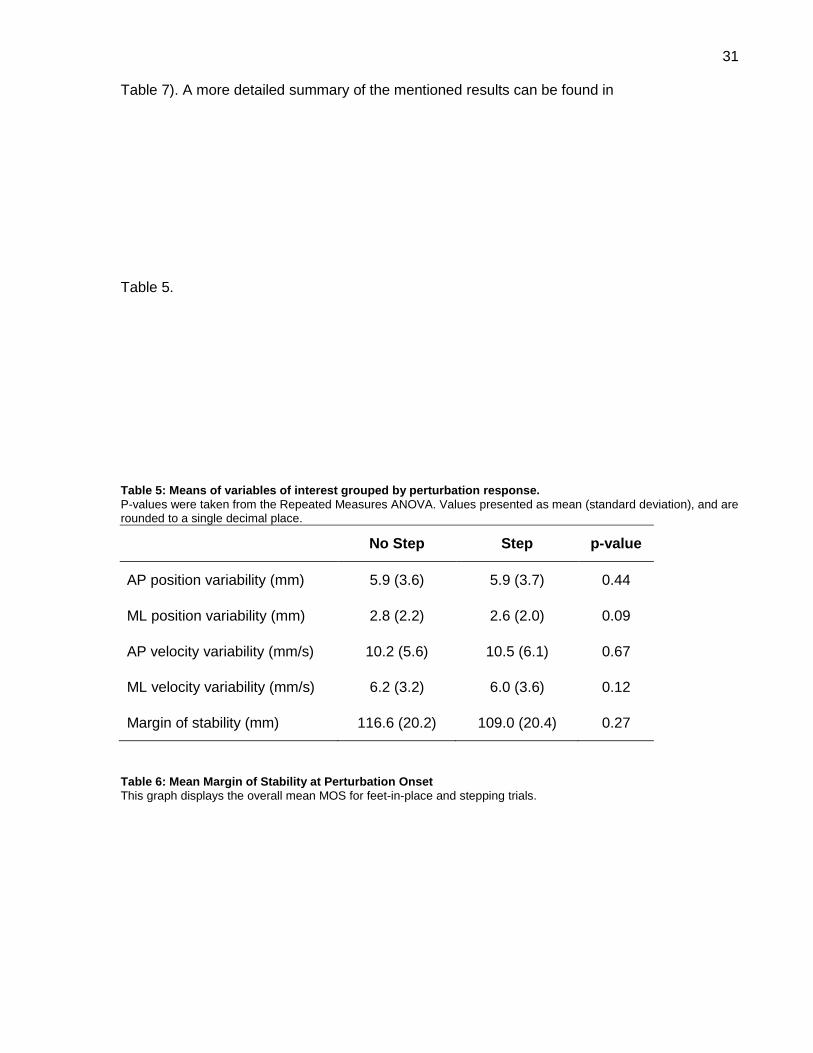
Table 5: Means of variables of interest grouped by perturbation response.
P-values were taken from the Repeated Measures ANOVA. Values presented as mean (standard deviation), and are rounded to a single decimal place.
No Step Step p-value
AP position variability (mm) 5.9 (3.6) 5.9 (3.7) 0.44
ML position variability (mm) 2.8 (2.2) 2.6 (2.0) 0.09
AP velocity variability (mm/s) 10.2 (5.6) 10.5 (6.1) 0.67
ML velocity variability (mm/s) 6.2 (3.2) 6.0 (3.6) 0.12
Margin of stability (mm) 116.6 (20.2) 109.0 (20.4) 0.27
Table 6: Mean Margin of Stability at Perturbation Onset
This graph displays the overall mean MOS for feet-in-place and stepping trials.
32
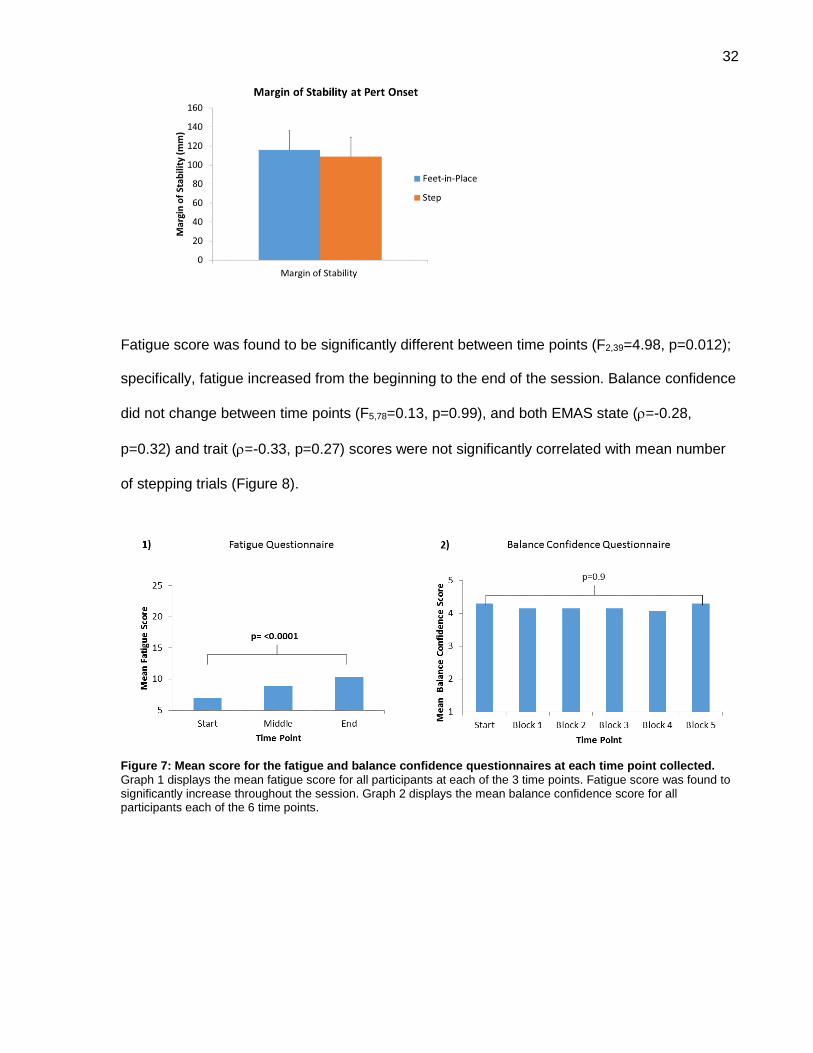
Fatigue score was found to be significantly different between time points (F2,39=4.98, p=0.012);
specifically, fatigue increased from the beginning to the end of the session. Balance confidence
did not change between time points (F5,78=0.13, p=0.99), and both EMAS state (=-0.28,
p=0.32) and trait (=-0.33, p=0.27) scores were not significantly correlated with mean number
of stepping trials (Figure 8).
Figure 7: Mean score for the fatigue and balance confidence questionnaires at each time point collected.
Graph 1 displays the mean fatigue score for all participants at each of the 3 time points. Fatigue score was found to significantly increase throughout the session. Graph 2 displays the mean balance confidence score for all participants each of the 6 time points.
33
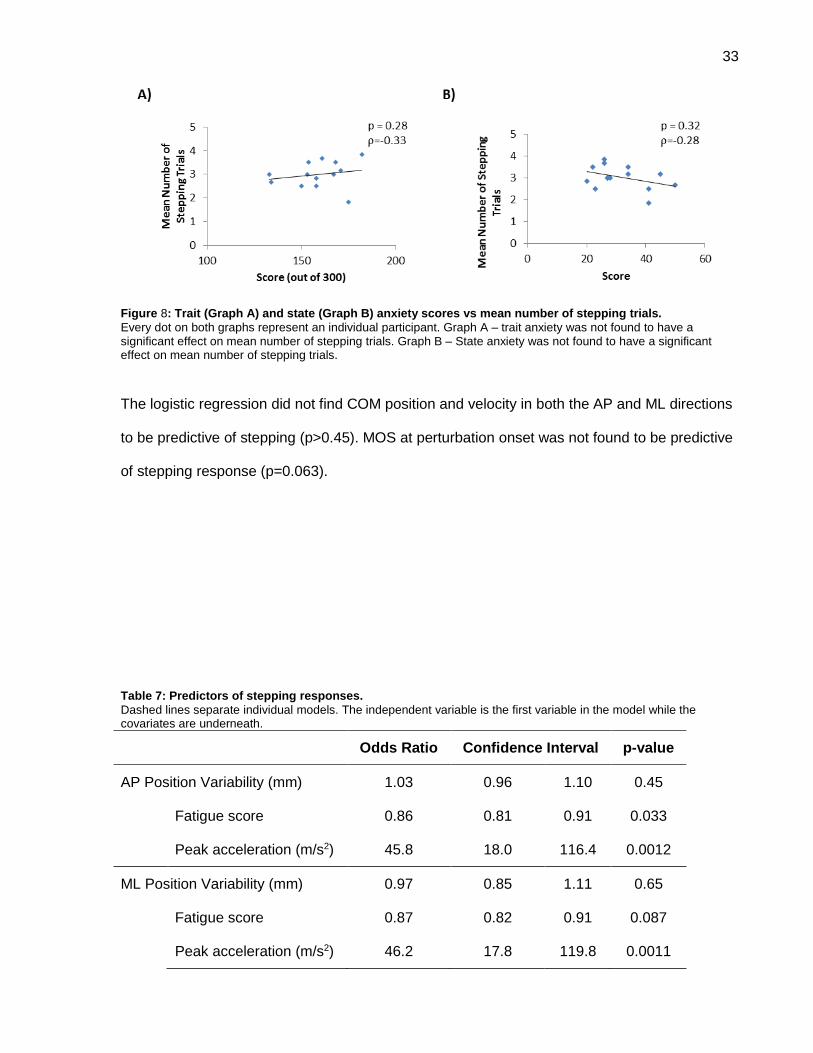
Figure 8: Trait (Graph A) and state (Graph B) anxiety scores vs mean number of stepping trials.
Every dot on both graphs represent an individual participant. Graph A – trait anxiety was not found to have a significant effect on mean number of stepping trials. Graph B – State anxiety was not found to have a significant effect on mean number of stepping trials.
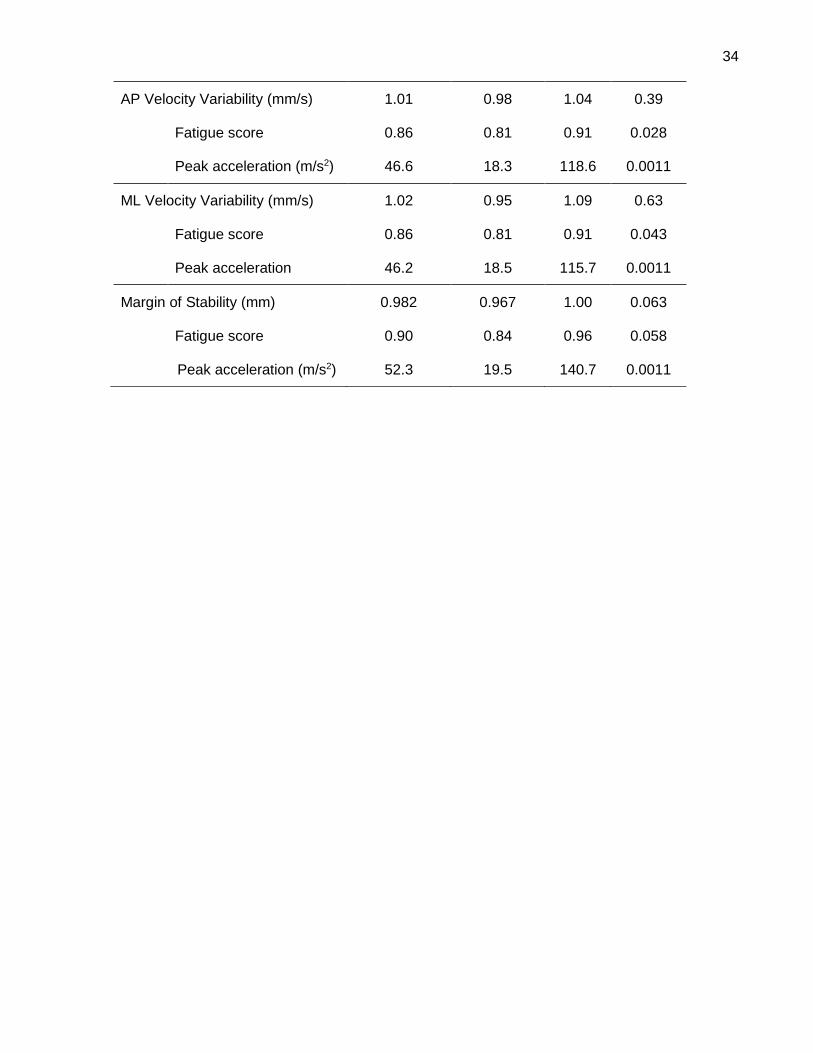
The logistic regression did not find COM position and velocity in both the AP and ML directions
to be predictive of stepping (p>0.45). MOS at perturbation onset was not found to be predictive
of stepping response (p=0.063).
Table 7: Predictors of stepping responses.
Dashed lines separate individual models. The independent variable is the first variable in the model while the covariates are underneath.
Odds Ratio Confidence Interval p-value
AP Position Variability (mm) 1.03 0.96 1.10 0.45
Fatigue score 0.86 0.81 0.91 0.033
Peak acceleration (m/s2) 45.8 18.0 116.4 0.0012
ML Position Variability (mm) 0.97 0.85 1.11 0.65
Fatigue score 0.87 0.82 0.91 0.087
Peak acceleration (m/s2) 46.2 17.8 119.8 0.0011
34
AP Velocity Variability (mm/s) 1.01 0.98 1.04 0.39
Fatigue score 0.86 0.81 0.91 0.028
Peak acceleration (m/s2) 46.6 18.3 118.6 0.0011
ML Velocity Variability (mm/s) 1.02 0.95 1.09 0.63
Fatigue score 0.86 0.81 0.91 0.043
Peak acceleration 46.2 18.5 115.7 0.0011
Margin of Stability (mm) 0.982 0.967 1.00 0.063
Fatigue score 0.90 0.84 0.96 0.058
Peak acceleration (m/s2) 52.3 19.5 140.7 0.0011
35
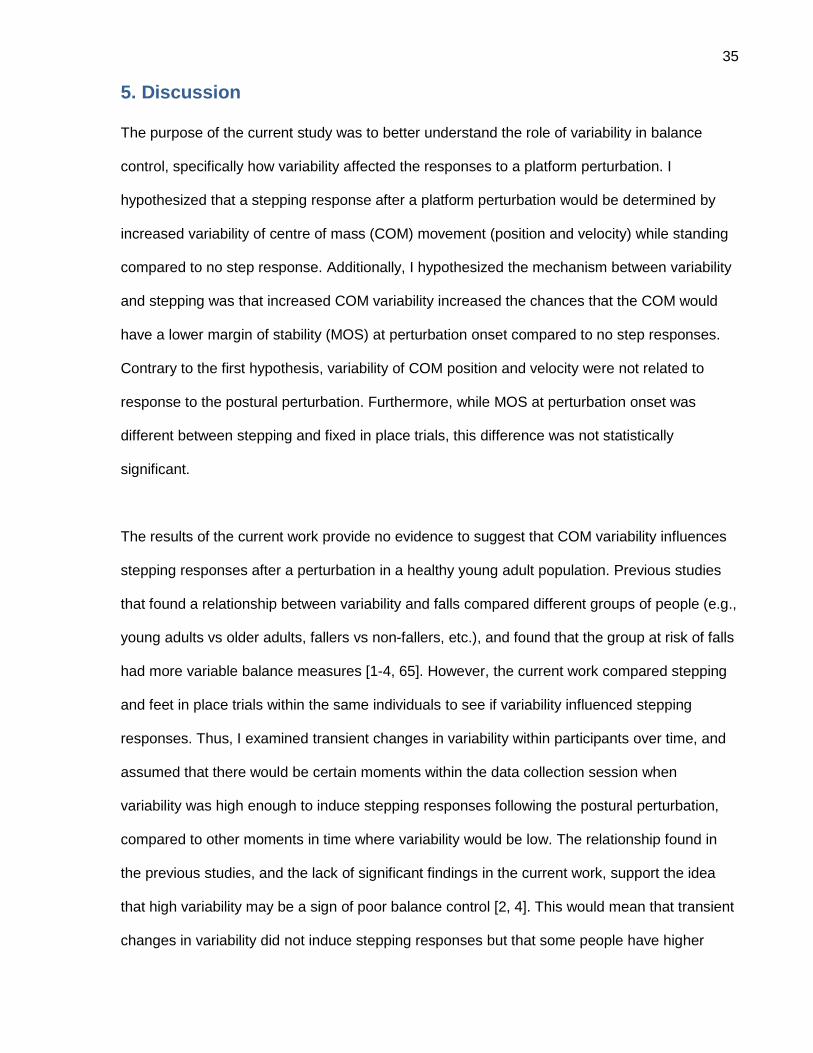
5. Discussion
The purpose of the current study was to better understand the role of variability in balance
control, specifically how variability affected the responses to a platform perturbation. I
hypothesized that a stepping response after a platform perturbation would be determined by
increased variability of centre of mass (COM) movement (position and velocity) while standing
compared to no step response. Additionally, I hypothesized the mechanism between variability
and stepping was that increased COM variability increased the chances that the COM would
have a lower margin of stability (MOS) at perturbation onset compared to no step responses.
Contrary to the first hypothesis, variability of COM position and velocity were not related to
response to the postural perturbation. Furthermore, while MOS at perturbation onset was
different between stepping and fixed in place trials, this difference was not statistically
significant.
The results of the current work provide no evidence to suggest that COM variability influences
stepping responses after a perturbation in a healthy young adult population. Previous studies
that found a relationship between variability and falls compared different groups of people (e.g.,
young adults vs older adults, fallers vs non-fallers, etc.), and found that the group at risk of falls
had more variable balance measures [1-4, 65]. However, the current work compared stepping
and feet in place trials within the same individuals to see if variability influenced stepping
responses. Thus, I examined transient changes in variability within participants over time, and
assumed that there would be certain moments within the data collection session when
variability was high enough to induce stepping responses following the postural perturbation,
compared to other moments in time where variability would be low. The relationship found in
the previous studies, and the lack of significant findings in the current work, support the idea
that high variability may be a sign of poor balance control [2, 4]. This would mean that transient
changes in variability did not induce stepping responses but that some people have higher
36
variability compared to others; those with high variability may be more likely to step in situations
where people with low variability would not. Furthermore, the current work recruited healthy
young adults while previous studies that found a relationship between variability and falls to be
existent in older adults [1-3]. Therefore, it is possible that variability was overall low in our
sample, which led to negative findings. Furthermore, the current work supports previous
studies that found no relationship between balance control in quiet standing and capacity to
respond to external postural perturbations [78, 79]. The previous studies calculated COP-based
measures of standing postural steadiness, and measured reactive balance control using a
lean-and-release test. Either no correlations or weak correlations were found between standing
postural steadiness and reactive balance control, leading both groups of investigators to
conclude that there was no relationship between standing balance control and reactive balance
control.
Fatigue score was found to significantly increase over time. As fatigue scores were measured
using subjective questionnaires, this indicates that the subjects felt increasing fatigue as they
continued with the protocol. Unlike previous studies that identified fatigue by the reduction in
performance [33, 35, 38], a reduction in the number of stepping responses in the current
protocol would indicate adaptation to the platform perturbations [12]. In the current work,
balance confidence did not change over time. It was expected that balance confidence would
increase during the session, and would therefore indicate balance confidence was gained as
participants adapted to the platform perturbations. The lack of change indicates that young
healthy adults may not have perceived the platform perturbations to be a significant threat to
their personal safety, unlike standing on an elevated platform [41]. Both state and trait anxiety
was also not found to be correlated with the mean number of stepping trials. This was expected
for trait anxiety as all participants were healthy adults who did not have anxiety disorders. The
lack of correlation found between state anxiety and the mean number of stepping trials indicate
that the current protocol may not induce anxiety in healthy young individuals. Previous studies
37
using rotational platform perturbations at an elevated height were found to induce anxiety and a
loss of balance confidence in healthy young adults [80]. The lack of correlation with state
anxiety may also have been due to the EMAS-S only being administered at the end of the
session. State anxiety may have been observed to change if it was collected before the start of
the session and after every block of trials. As participants adapted to the perturbations and got
more familiar with the laboratory set up, state anxiety may have been seen to decrease as the
session continued. However, this was not done in the current study due to the amount of time it
would have taken for the participants to get off the platform, fill the form, and get back on the
platform, and therefore extending the session past 3 hours.
The current work also found that MOS was lower for stepping trials than feet-in-place trials, but
this difference was not statistically significant. MOS was calculated at perturbation onset, i.e.
when the platform reached an acceleration of 0.1m/s2. It was hypothesized that if participants
had both stepping and feet-in-place reactions for the same platform accelerations, then the
reason for stepping would be a difference in stability while standing. This difference in stability
would be caused by increased COM variability that would increase the likelihood that the COM
would be close to the BOS edge and therefore result in a small MOS. While variability may not
have been found to be different between stepping and feet-in-place trials in the current work,
the difference of MOS between stepping and feet-in-place trials can be expected. As only feet-
in-place trials and stepping trials that occurred at the same acceleration were compared would
suggest that the external forces applied to the participant were the same across these trials.
The difference between the stepping and feet-in-place trials may then be due to the internal
forces where stepping trials may have had a COM closer to the BOS edge than feet-in-place
trials. This may suggest that stepping was needed to counteract a greater instability caused by
the perturbations due to the MOS being smaller at perturbation onset for stepping trials than
feet-in-place trials. On the other hand, while there was a difference in mean MOS values
between stepping and feet-in-place trials, the difference was approximately 7mm. This small
38
difference, that was not found to be statistically significant, may be due to the instructions
provided to the participants where they were instructed to react naturally to the perturbations.
Initially researchers thought that reactive strategies were in response to certain perturbation
magnitudes where: small perturbations required the ankle strategy, medium perturbations
required hip strategy, and large perturbations required stepping. Later research showed this to
be incorrect, and that humans tend to naturally take a step even when they didn’t need to [19].
Being instructed to react naturally may have allowed participants to step when a step was not
necessary. This may be a reason why the difference in MOS between stepping and feet-in-
place trials was not found to be significant. Furthermore, small or negative values of MOS have
been shown to indicate that that postural correction is needed to avoid a fall [16]. Even during a
multistep reaction, the initial step often has negative MOS values indicating that more steps are
needed in order for stability to be regained [75]. Alternatively, the lack of negative MOS values
in the current work as well as the lack of significant difference in MOS between stepping and
feet-in-place trials may indicate that the participants were equally stable in both scenarios.
Therefore, the decision to step may have been influenced by factors other than stability. Pai et
al [10] hypothesized that the decision to step was due to psychological factors, but the current
work did not find this to be the case with anxiety or balance confidence. This may mean other
psychological factors not measured in the current study may play a role in the decision to step.
An example of this may be attention. It is well known that attention can affect a human reaction.
Posner [81] showed how attending to a misleading cue can increase one’s reaction, while valid
cues can decrease reaction time. Research has also started looking into how to measure the
attentional investment one places into their postural control [82]. Currently, it is still unknown
how attention may affect the decision to take a step after a perturbation.
This work used a randomized set of 30 backward perturbations ranging from 0.75m/s2 – 2.0
m/s2, distributed among 70 decoy perturbations (left, right, and forward directions) ranging from
1m/s2 - 3.25m/s2. Researchers using similar platform perturbations have used different
39
methods to determine thresholds of platform acceleration that evoke stepping responses [7].
De Kam et al [7] used a protocol with left, right, and backward perturbations starting at an
acceleration of 0.875m/s2 and 0.375m/s for forward perturbations. Participants experienced a
maximum of 3 perturbations until they had one feet-in-place response, at which point the
acceleration was increased by 0.125m/s2. Accelerations kept increasing until participants were
unable to use feet-in-place response to maintain balance during the 3 perturbations. Stepping
threshold was defined as the highest acceleration experienced by the participant where they
were able to maintain balance using a feet-in-place response. The biggest difference between
the current study’s protocol and de Kam et al. [7], is de Kam et al.’s [7] use of predictable
increments in perturbation magnitude, and the fact that the perturbations in their study started
low and continued to increase in magnitude consistently. These predictable increments of
increasing magnitude may have allowed participants to better adapt to platform movements
than in the current work. Better adaptation may have been due to lower contextual interference
in de Kam et al.’s [7] protocol than in the current work’s protocol. Contextual interference is
mainly referred to in the context of learning where high contextual interference would lead to
poor short term adaptation of the task but better long term learning; low contextual interference
would result in better short term adaptation but poor long term learning of the task [83]. For the
current comparison between de Kam et al.’s [7] protocol and the current work, contextual
inference is only used to describe the differences in short term adaptation between protocols.
The current work could be thought to have a higher contextual interference compared to de
Kam et al. [7] as the trial order of the current work is pseudo randomized in terms of difficulty
while de Kam et al. [7] performed trials in an ascending order with consistent gradual
increments in platform acceleration. Therefore, the stepping thresholds found by de Kam et al.
[7] may be higher than the participants’ actual stepping threshold. The current study’s protocol
could be argued to have found a stepping threshold more reflective of the participant’s ability as
the protocol (with unpredictable order of perturbation direction, magnitude, and waveform type)
made it more difficult to adapt to the platform perturbations.
40
The current thesis only analyzed backward perturbations that induced forward falls. In order to
have enough trials in each direction to conduct a proper statistical analysis the protocol would
have required a very large number of trials, which did not seem practical. Therefore, the
decision was made to focus on one direction to reduce burden on participants and to keep the
entire session < 3 hours. Antero-posterior perturbations seemed to be more frequently used in
the literature. Backward perturbations were selected as pilot testing showed backwards
perturbations to have a broader range of platform accelerations that would induce both
stepping and feet-in-place reactions than forward perturbations. While the current results did
not find COM variability to affect stepping response after backward perturbations, it may be
possible that COM variability may play a role in other perturbation directions.
Three platform waveforms were used in the current study. These waveforms were used in
order to provide more variations of perturbations in order to prevent participants from learning
to use the deceleration phase of the perturbation to regain stability [24]. The standard
waveform and the triphasic waveform have been used in previous studies [23]. The extended
waveform was developed during the pilot testing of the current work where the deceleration
phase was extended from 300ms to 600ms. During pilot testing, there was some concern
regarding the triphasic waveform. It was believed that the triphasic used by Maki et al[23] may
involuntarily induce a stepping response as the platform deceleration may act as a second
perturbation while the participant was still regaining their stability. Therefore, the current work
used a longer constant velocity phase (500ms vs 400 ms) than Maki et al [23], assuming that
by the end of this phase the participant would have regained their stability, and also reduced
the magnitude of the deceleration phase to minimize its impact on the participant. Pilot testing
these new waveforms showed that neither one (extended or triphasic) was more likely to
induce a stepping a response. Though a post-hoc analysis of the frequency of stepping by
waveform (Appendix D) does show a trend where the triphasic waveforms may induce
41
stepping. Future studies may want to take a closer look at the effects of these newer
perturbation waveforms on reactive balance control to better understand if they inadvertently
induce stepping responses.
COM variability was analyzed during a 10 second time period prior to a perturbation. The
choice of 10 seconds was made based on previous literature and pilot testing. Ruhe et al [84]
conducted a systematic review on how COP should be collected in order to obtain reliable data.
The authors recommended that 90 second quiet standing trials would be the best duration to
provide reliable data for most COP parameters. This number was suggested based off previous
quiet standing trials that were not followed up by a perturbation. Using a 90 second quiet
standing period before every perturbation seemed very impractical, especially when the
protocol contained 100 trials. During pilot testing for the current work, a 30 second period of
quiet standing was collected. From this data, varying time periods from 5 seconds to 30
seconds were compared and showed that COP variability did not differ. Therefore, a 10 second
time period was selected in order to provide enough data to be analyzed while remaining
feasible for the participant to experience for a 100 trials. Future studies may be interested in
observing the COM variability during a much shorter time period before perturbation onset (e.g.
500 ms to 1 sec) as it is unknown if the COM variability just before perturbation onset plays a
more important role than the average COM variability collected 10 seconds before the
perturbation onset.
This thesis used a moving platform to induce perturbations where the moving platform
disturbed balance while the area outside of the platform remained stationary. This scenario is
not commonly encountered outside of the laboratory which may lead some to question the
ecological validity of the current study. A moving platform was needed in order to observe the
COM variability prior to a balance disturbance while minimizing extraneous variables. While this
may reduce the ecological validity of the current study, the results still possess high external
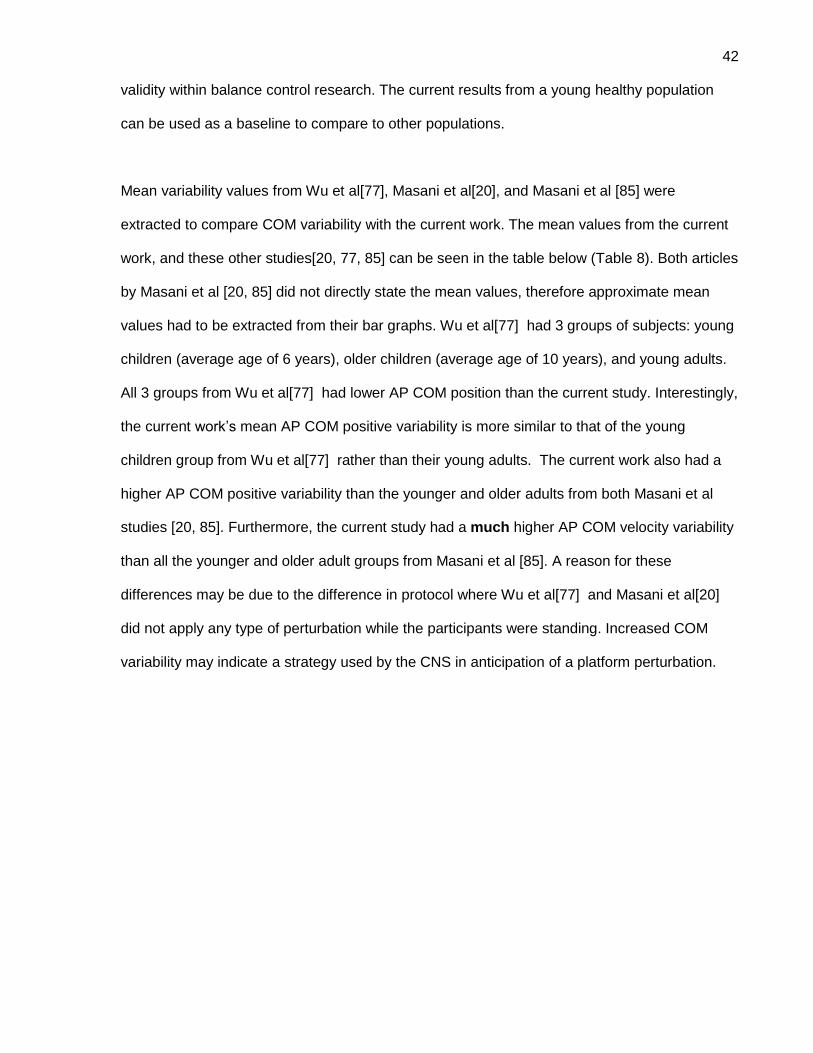
42
validity within balance control research. The current results from a young healthy population
can be used as a baseline to compare to other populations.
Mean variability values from Wu et al[77], Masani et al[20], and Masani et al [85] were
extracted to compare COM variability with the current work. The mean values from the current
work, and these other studies[20, 77, 85] can be seen in the table below (Table 8). Both articles
by Masani et al [20, 85] did not directly state the mean values, therefore approximate mean
values had to be extracted from their bar graphs. Wu et al[77] had 3 groups of subjects: young
children (average age of 6 years), older children (average age of 10 years), and young adults.
All 3 groups from Wu et al[77] had lower AP COM position than the current study. Interestingly,
the current work’s mean AP COM positive variability is more similar to that of the young
children group from Wu et al[77] rather than their young adults. The current work also had a
higher AP COM positive variability than the younger and older adults from both Masani et al
studies [20, 85]. Furthermore, the current study had a much higher AP COM velocity variability
than all the younger and older adult groups from Masani et al [85]. A reason for these
differences may be due to the difference in protocol where Wu et al[77] and Masani et al[20]
did not apply any type of perturbation while the participants were standing. Increased COM
variability may indicate a strategy used by the CNS in anticipation of a platform perturbation.
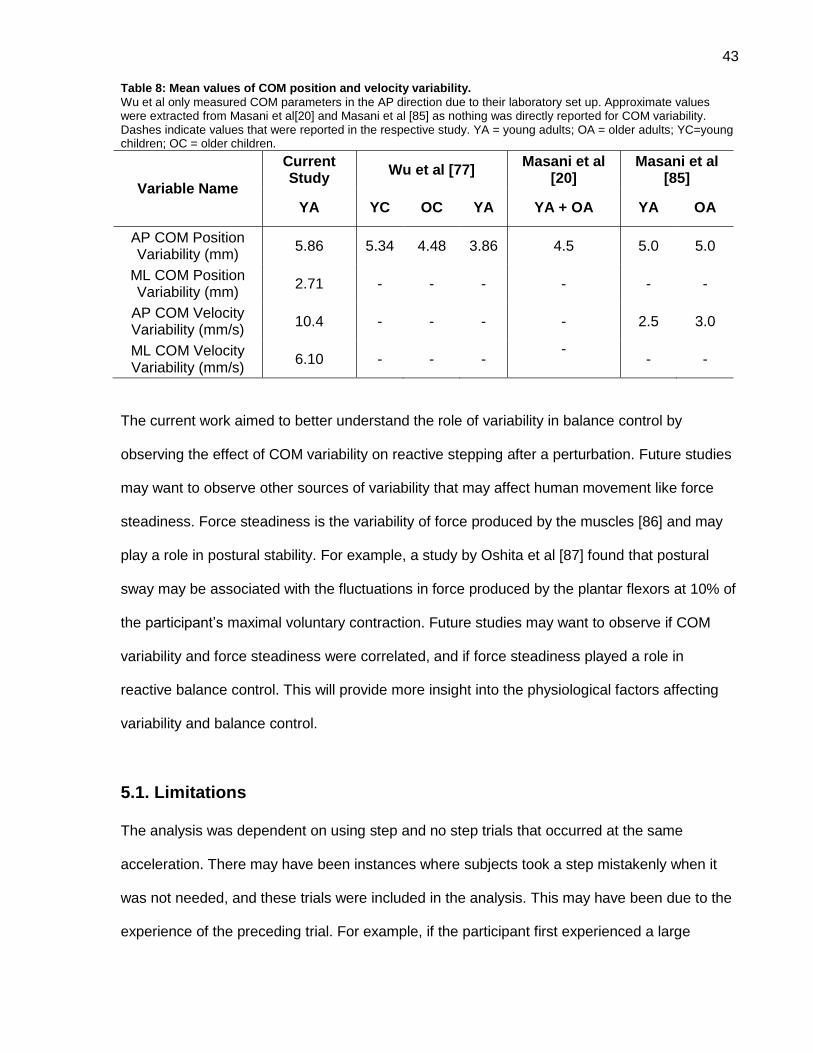
43
Table 8: Mean values of COM position and velocity variability.
Wu et al only measured COM parameters in the AP direction due to their laboratory set up. Approximate values were extracted from Masani et al[20] and Masani et al [85] as nothing was directly reported for COM variability. Dashes indicate values that were reported in the respective study. YA = young adults; OA = older adults; YC=young children; OC = older children.
Variable Name
Current Study
Wu et al [77] Masani et al
[20] Masani et al
[85]
YA YC OC YA YA + OA YA OA
AP COM Position Variability (mm)
5.86 5.34 4.48 3.86 4.5 5.0 5.0
ML COM Position Variability (mm)
2.71 - - - - - -
AP COM Velocity Variability (mm/s)
10.4 - - - - 2.5 3.0
ML COM Velocity Variability (mm/s)
6.10 - - - -
- -
The current work aimed to better understand the role of variability in balance control by
observing the effect of COM variability on reactive stepping after a perturbation. Future studies
may want to observe other sources of variability that may affect human movement like force
steadiness. Force steadiness is the variability of force produced by the muscles [86] and may
play a role in postural stability. For example, a study by Oshita et al [87] found that postural
sway may be associated with the fluctuations in force produced by the plantar flexors at 10% of
the participant’s maximal voluntary contraction. Future studies may want to observe if COM
variability and force steadiness were correlated, and if force steadiness played a role in
reactive balance control. This will provide more insight into the physiological factors affecting
variability and balance control.
5.1. Limitations
The analysis was dependent on using step and no step trials that occurred at the same
acceleration. There may have been instances where subjects took a step mistakenly when it
was not needed, and these trials were included in the analysis. This may have been due to the
experience of the preceding trial. For example, if the participant first experienced a large
44
magnitude perturbation and then experienced a much smaller perturbation magnitude,
regardless of the direction, they may have been more inclined to take a take a step even if it
was not needed. Additionally, some participants only had step and feet-in-place trials at one
acceleration magnitude, leaving only five trials for analysis for these participants. Due to the
length of the existing protocol (3 hours) we were reluctant to add further trials in order to
increase the likelihood of observing both step and no-step trials at the same perturbation
magnitude.
5.2. Future Directions
Recruiting older adults, both healthy and at risk of falls, would expand the scope of this study
and assist in understanding if variability only plays a role in balance control in old age.
Expanding the methodology to include more scenarios outside of step and no step responses
in the forward directions, such as multistep responses or reactive responses in other directions,
may also provide a better understanding of the situations and levels of instability where
variability starts to play a role. The current study used questionnaires to assess fatigue,
anxiety, and balance confidence; there may be other factors that play a role in balance control
that could also be considered, such as attention.
Force plate data was collected during the study but not used within the current analysis. Future
studies could use this data to calculate COP variability. COP data can then be compared to the
current study’s COM data to see if there is a difference in variability, and to see if COP
variability differed between stepping and feet-in-place trials. Furthermore, more
experimentation of the length of variability data analyzed can be looked into. The current study
calculated the COM variability during a period of 10 seconds before each perturbation. It is
unknown if 10 seconds is the necessary or optimal amount of time needed to understand the
effects of variability on reactive responses after a platform perturbation. Therefore future
studies could look into using shorter time periods such as 1 to 5 seconds
45
5.3. Conclusions
The results of the current study suggest that variability may not induce a stepping response
after a loss of balance in healthy young adults. Links between variability and falls have only
been found in studies among older adults. The discrepancy between the current study and
previous studies supports the idea that variability may be a sign of aging. Variability may be a
result deterioration of the sensory and musculoskeletal systems caused by aging affecting
balance control. Further research using older adult subjects are needed to understand if
variability does play a role in the balance control of older adults.
46
References
1. Hausdorff, J.M., et al., Increased gait unsteadiness in community-dwelling elderly
fallers. Arch Phys Med Rehabil, 1997. 78(3): p. 278-83.
2. Hausdorff, J.M., D.A. Rios, and H.K. Edelberg, Gait variability and fall risk in community-
living older adults: a 1-year prospective study. Arch Phys Med Rehabil, 2001. 82(8): p.
1050-6.
3. Maki, B.E., Gait changes in older adults: predictors of falls or indicators of fear. J Am
Geriatr Soc, 1997. 45(3): p. 313-20.
4. Morrison, S., et al., Relation between risk of falling and postural sway complexity in
diabetes. Gait & Posture, 2012. 35(4): p. 662-668.
5. Maki, B.E. and W.E. McIlroy, Effects of aging on control of stability, in Textbook of
Audiological Medicine: Clinical Aspects of Hearing and Balance. 2003, Martin Dunitz:
United Kingdom. p. 671-690.
6. Hof, A.L., M.G. Gazendam, and W.E. Sinke, The condition for dynamic stability. J
Biomech, 2005. 38(1): p. 1-8.
7. de Kam, D., et al., The effect of weight-bearing asymmetry on dynamic postural stability
in healthy young individuals. Gait Posture, 2016. 45: p. 56-61.
8. Mansfield, A., et al., Effect of a perturbation-based balance training program on
compensatory stepping and grasping reactions in older adults: a randomized controlled
trial. Phys Ther, 2010. 90(4): p. 476-91.
9. Moore, S.P., et al., Human automatic postural responses: responses to horizontal
perturbations of stance in multiple directions. Exp Brain Res, 1988. 73(3): p. 648-58.
10. Pai, Y.C., et al., Thresholds for step initiation induced by support-surface translation: a
dynamic center-of-mass model provides much better prediction than a static model. J
Biomech, 2000. 33(3): p. 387-92.
47
11. Wolfson, L.I., et al., Stressing the Postural Response. Journal of the American
Geriatrics Society, 1986. 34(12): p. 845-850.
12. Mcllroy, W.E. and B.E. Maki, Adaptive changes to compensatory stepping responses.
Gait & Posture, 1995. 3(1): p. 43-50.
13. Winter, D.A., Human balance and posture control during standing and walking. Gait &
Posture, 1995. 3(4): p. 193-214.
14. Pai, Y.C. and J. Patton, Center of mass velocity-position predictions for balance control.
J Biomech, 1997. 30(4): p. 347-54.
15. Mille, M.L., et al., Thresholds for inducing protective stepping responses to external
perturbations of human standing. J Neurophysiol, 2003. 90(2): p. 666-74.
16. McAndrew Young, P.M., J.M. Wilken, and J.B. Dingwell, Dynamic margins of stability
during human walking in destabilizing environments. J Biomech, 2012. 45(6): p. 1053-9.
17. Bruijn, S.M., et al., Assessing the stability of human locomotion: a review of current
measures. J R Soc Interface, 2013. 10(83): p. 20120999.
18. Martin Lorenzo, T. and J. Vanrenterghem, Effects of increased anterior-posterior
voluntary sway frequency on mechanical and perceived postural stability. Hum Mov Sci,
2015. 39: p. 189-99.
19. Maki, B.E. and W.E. McIlroy, The role of limb movements in maintaining upright stance:
the "change-in-support" strategy. Phys Ther, 1997. 77(5): p. 488-507.
20. Masani, K., et al., Larger center of pressure minus center of gravity in the elderly
induces larger body acceleration during quiet standing. Neurosci Lett, 2007. 422(3): p.
202-6.
21. Winter, D.A., et al., Stiffness control of balance in quiet standing. J Neurophysiol, 1998.
80(3): p. 1211-21.
22. Sturnieks, D.L., et al., Sensorimotor and neuropsychological correlates of force
perturbations that induce stepping in older adults. Gait Posture, 2012. 36(3): p. 356-60.

48
23. Maki, B.E., M.A. Edmondstone, and W.E. McIlroy, Age-related differences in laterally
directed compensatory stepping behavior. J Gerontol A Biol Sci Med Sci, 2000. 55(5):
p. M270-7.
24. McIlroy, W.E. and B.E. Maki, The 'deceleration response' to transient perturbation of
upright stance. Neurosci Lett, 1994. 175(1-2): p. 13-6.
25. Horak, F.B., Postural orientation and equilibrium: what do we need to know about
neural control of balance to prevent falls? Age Ageing, 2006. 35 Suppl 2: p. ii7-ii11.
26. Krell, J. and A.E. Patla, The influence of multiple obstacles in the travel path on
avoidance strategy. Gait Posture, 2002. 16(1): p. 15-9.
27. Raffi, M., et al., Importance of optic flow for postural stability of male and female young
adults. Eur J Appl Physiol, 2014. 114(1): p. 71-83.
28. Horak, F.B. and F. Hlavacka, Somatosensory loss increases vestibulospinal sensitivity.
J Neurophysiol, 2001. 86(2): p. 575-85.
29. Inglis, J.T., et al., The importance of somatosensory information in triggering and
scaling automatic postural responses in humans. Exp Brain Res, 1994. 101(1): p. 159-
64.
30. Peterka, R.J., Sensorimotor integration in human postural control. J Neurophysiol,
2002. 88(3): p. 1097-118.
31. Gimmon, Y., et al., The effect of plantar flexor muscle fatigue on postural control. J
Electromyogr Kinesiol, 2011. 21(6): p. 922-8.
32. Lepers, R., et al., Posture control after prolonged exercise. Eur J Appl Physiol Occup
Physiol, 1997. 76(1): p. 55-61.
33. Nam, H.S., et al., The relationship between muscle fatigue and balance in the elderly.
Ann Rehabil Med, 2013. 37(3): p. 389-95.
34. Nardone, A., et al., Fatigue effects on body balance. Electroencephalogr Clin
Neurophysiol, 1997. 105(4): p. 309-20.
49
35. Papa, E.V., K.B. Foreman, and L.E. Dibble, Effects of age and acute muscle fatigue on
reactive postural control in healthy adults. Clin Biomech (Bristol, Avon), 2015. 30(10): p.
1108-13.
36. Simoneau, M., F. Begin, and N. Teasdale, The effects of moderate fatigue on dynamic
balance control and attentional demands. J Neuroeng Rehabil, 2006. 3: p. 22.
37. Paillard, T., Effects of general and local fatigue on postural control: a review. Neurosci
Biobehav Rev, 2012. 36(1): p. 162-76.
38. Remaud, A., C. Thuong-Cong, and M. Bilodeau, Age-Related Changes in Dynamic
Postural Control and Attentional Demands are Minimally Affected by Local Muscle
Fatigue. Front Aging Neurosci, 2015. 7: p. 257.
39. Borg, G.A., Perceived exertion: a note on "history" and methods. Med Sci Sports, 1973.
5(2): p. 90-3.
40. Powell, L.E. and A.M. Myers, The Activities-specific Balance Confidence (ABC) Scale. J
Gerontol A Biol Sci Med Sci, 1995. 50A(1): p. M28-34.
41. Carpenter, M.G., J.S. Frank, and C.P. Silcher, Surface height effects on postural
control: a hypothesis for a stiffness strategy for stance. J Vestib Res, 1999. 9(4): p. 277-
86.
42. Lajoie, Y. and S.P. Gallagher, Predicting falls within the elderly community: comparison
of postural sway, reaction time, the Berg balance scale and the Activities-specific
Balance Confidence (ABC) scale for comparing fallers and non-fallers. Arch Gerontol
Geriatr, 2004. 38(1): p. 11-26.
43. Tinetti, M.E. and L. Powell, Fear of falling and low self-efficacy: a case of dependence
in elderly persons. J Gerontol, 1993. 48 Spec No: p. 35-8.
44. Hadjistavropoulos, T., K. Delbaere, and T.D. Fitzgerald, Reconceptualizing the role of
fear of falling and balance confidence in fall risk. J Aging Health, 2011. 23(1): p. 3-23.
50
45. Moore, D.S. and R. Ellis, Measurement of fall-related psychological constructs among
independent-living older adults: a review of the research literature. Aging Ment Health,
2008. 12(6): p. 684-99.
46. Li, F., et al., Self-Efficacy as a Mediator Between Fear of Falling and Functional Ability
in the Elderly. Journal of Aging and Health, 2002. 14(4): p. 452-466.
47. Davis, J.R., et al., The relationship between fear of falling and human postural control.
Gait & Posture, 2009. 29(2): p. 275-279.
48. Sturnieks, D.L., et al., The influence of age, anxiety and concern about falling on
postural sway when standing at an elevated level. Hum Mov Sci, 2016. 49: p. 206-215.
49. Friedman, S.M., et al., Falls and Fear of Falling: Which Comes First? A Longitudinal
Prediction Model Suggests Strategies for Primary and Secondary Prevention. Journal of
the American Geriatrics Society, 2002. 50(8): p. 1329-1335.
50. Ní Mhaoláin, A.M., et al., Depression: a modifiable factor in fearful older fallers
transitioning to frailty? Int J Geriatr Psychiatry, 2012. 27(7): p. 727-33.
51. Trombetti, A., et al., Age-associated declines in muscle mass, strength, power, and
physical performance: impact on fear of falling and quality of life. Osteoporos Int, 2016.
27(2): p. 463-71.
52. Endler, N.S., et al., Assessment of state and trait anxiety: Endler multidimensional
anxiety scales. Anxiety Research, 1989. 2(1): p. 1-14.
53. Spielberger, C.D., Chapter 2 - ANXIETY AS AN EMOTIONAL STATE1, in Anxiety.
1972, Academic Press. p. 23-49.
54. Spielberger, C.D., Manual for the State-Trait Anxiety Inventory (Form Y). 1983, Palo
Alto, CA: Consulting Psychologists Press, Inc.
55. Vetter, N.J. and D. Ford, Anxiety and depression scores in elderly fallers. International
Journal of Geriatric Psychiatry, 1989. 4(3): p. 159-163.
56. Holloway, K.L., et al., Anxiety disorders and falls among older adults. J Affect Disord,
2016. 205: p. 20-27.
51
57. Ohno, H., et al., The effect of anxiety on postural control in humans depends on visual
information processing. Neurosci Lett, 2004. 364(1): p. 37-9.
58. Wada, M., N. Sunaga, and M. Nagai, Anxiety affects the postural sway of the antero-
posterior axis in college students. Neurosci Lett, 2001. 302(2-3): p. 157-9.
59. Canada, P.H.A.o., The Safe living Guide-A guide to home safety for seniors. Vol. 2016.
2015, Ottawa, ON: Public Health Agency of Canada.
60. Horak, F.B., C.L. Shupert, and A. Mirka, Components of postural dyscontrol in the
elderly: a review. Neurobiol Aging, 1989. 10(6): p. 727-38.
61. Shaffer, S.W. and A.L. Harrison, Aging of the somatosensory system: a translational
perspective. Phys Ther, 2007. 87(2): p. 193-207.
62. Panzer, V.P., S. Bandinelli, and M. Hallett, Biomechanical assessment of quiet standing
and changes associated with aging. Arch Phys Med Rehabil, 1995. 76(2): p. 151-7.
63. Abrahamova, D. and F. Hlavacka, Age-related changes of human balance during quiet
stance. Physiol Res, 2008. 57(6): p. 957-64.
64. Kanekar, N. and A.S. Aruin, Aging and balance control in response to external
perturbations: role of anticipatory and compensatory postural mechanisms. Age (Dordr),
2014. 36(3): p. 9621.
65. Laughton, C.A., et al., Aging, muscle activity, and balance control: physiologic changes
associated with balance impairment. Gait Posture, 2003. 18(2): p. 101-8.
66. Mansfield, A., et al., Do measures of reactive balance control predict falls in people with
stroke returning to the community? Physiotherapy, 2015. 101(4): p. 373-80.
67. Slifkin, A. and K. Newell, Is Variability in Human Performance a Reflection of System
Noise? Current Directions in Psychological Science, 1998. 7(6): p. 170-177.
68. Latash, M.L., J.P. Scholz, and G. Schoner, Motor control strategies revealed in the
structure of motor variability. Exerc Sport Sci Rev, 2002. 30(1): p. 26-31.
69. Toney, M.E. and Y.H. Chang, Humans robustly adhere to dynamic walking principles by
harnessing motor abundance to control forces. Exp Brain Res, 2013. 231(4): p. 433-43.
52
70. Carpenter, M.G., C.D. Murnaghan, and J.T. Inglis, Shifting the balance: evidence of an
exploratory role for postural sway. Neuroscience, 2010. 171(1): p. 196-204.
71. van Beers, R.J., P. Haggard, and D.M. Wolpert, The role of execution noise in
movement variability. J Neurophysiol, 2004. 91(2): p. 1050-63.
72. Churchland, M.M., A. Afshar, and K.V. Shenoy, A central source of movement
variability. Neuron, 2006. 52(6): p. 1085-96.
73. C-Motion. Marker Set Guidelines. Jaunary 16, 2015 [cited 2016; Available from:
https://www.c-motion.com/v3dwiki/index.php?title=Marker_Set_Guidelines.
74. McIlroy, W.E. and B.E. Maki, Preferred placement of the feet during quiet stance:
development of a standardized foot placement for balance testing. Clin Biomech
(Bristol, Avon), 1997. 12(1): p. 66-70.
75. Maki, B.E. and W.E. McIlroy, The control of foot placement during compensatory
stepping reactions: does speed of response take precedence over stability? IEEE Trans
Rehabil Eng, 1999. 7(1): p. 80-90.
76. Winter, D.A., Kinematics, in Biomechanics and Motor Control of Human Movement.
2009, John Wiley & Sons, Inc. p. 45-81.
77. Wu, J., S. McKay, and R. Angulo-Barroso, Center of mass control and multi-segment
coordination in children during quiet stance. Exp Brain Res, 2009. 196(3): p. 329-39.
78. Mackey, D.C. and S.N. Robinovitch, Postural steadiness during quiet stance does not
associate with ability to recover balance in older women. Clin Biomech (Bristol, Avon),
2005. 20(8): p. 776-83.
79. Owings, T.M., et al., Measures of postural stability are not predictors of recovery from
large postural disturbances in healthy older adults. J Am Geriatr Soc, 2000. 48(1): p.
42-50.
80. Carpenter, M.G., et al., Influence of postural anxiety on postural reactions to multi-
directional surface rotations. J Neurophysiol, 2004. 92(6): p. 3255-65.
81. Posner, M.I., Orienting of attention. Q J Exp Psychol, 1980. 32(1): p. 3-25.
53
82. Roerdink, M., P. Hlavackova, and N. Vuillerme, Center-of-pressure regularity as a
marker for attentional investment in postural control: a comparison between sitting and
standing postures. Hum Mov Sci, 2011. 30(2): p. 203-12.
83. Shea, J.B. and R.L. Morgan, Contextual interference effects on the acquisition,
retention, and transfer of a motor skill. Journal of Experimental Psychology: Human
Learning and Memory, 1979. 5(2): p. 179-187.
84. Ruhe, A., R. Fejer, and B. Walker, The test-retest reliability of centre of pressure
measures in bipedal static task conditions--a systematic review of the literature. Gait
Posture, 2010. 32(4): p. 436-45.
85. Masani, K., et al., Center of pressure velocity reflects body acceleration rather than
body velocity during quiet standing. Gait Posture, 2014. 39(3): p. 946-52.
86. Oomen, N.M. and J.H. van Dieen, Effects of age on force steadiness: A literature review
and meta-analysis. Ageing Res Rev, 2016.
87. Oshita, K. and S. Yano, Association of force steadiness of plantar flexor muscles and
postural sway during quiet standing by young adults. Percept Mot Skills, 2012. 115(1):
p. 143-52.
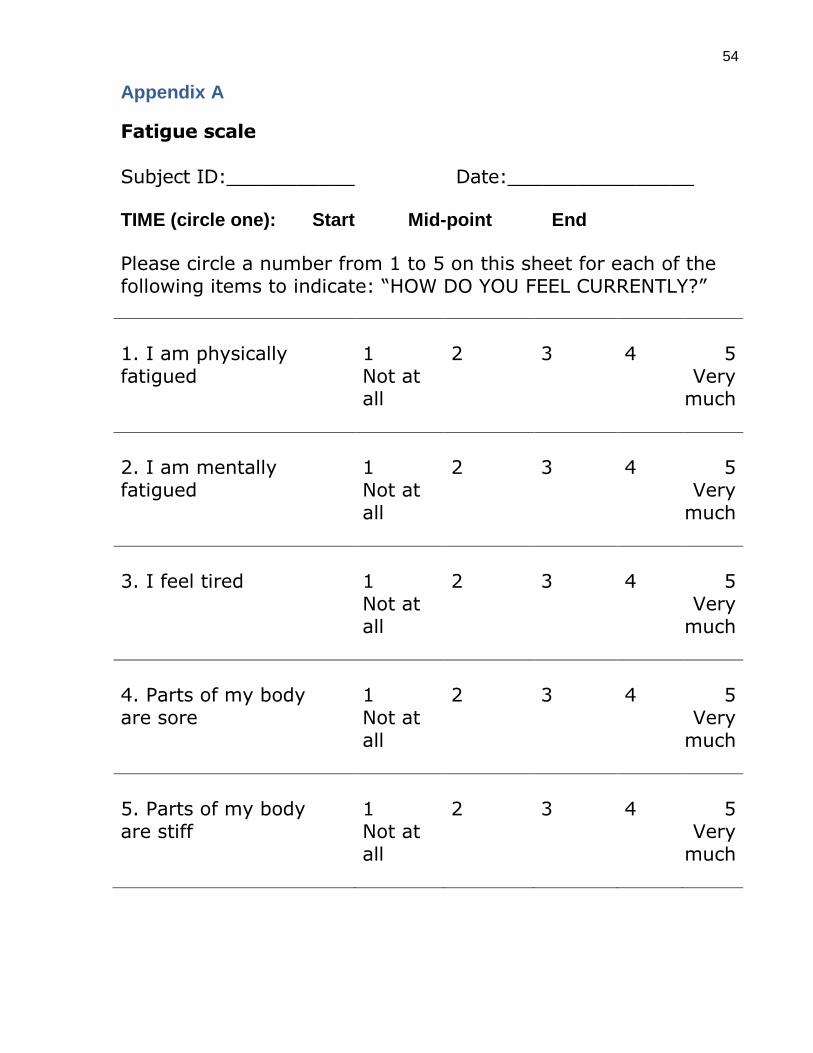
54
Appendix A
Fatigue scale Subject ID:___________ Date:________________ TIME (circle one): Start Mid-point End
Please circle a number from 1 to 5 on this sheet for each of the following items to indicate: “HOW DO YOU FEEL CURRENTLY?”
1. I am physically fatigued
1 2 3 4 5 Not at all
Very much
2. I am mentally fatigued
1 2 3 4 5 Not at all
Very much
3. I feel tired 1 2 3 4 5 Not at
all Very
much
4. Parts of my body are sore
1 2 3 4 5 Not at all
Very much
5. Parts of my body are stiff
1 2 3 4 5 Not at all
Very much
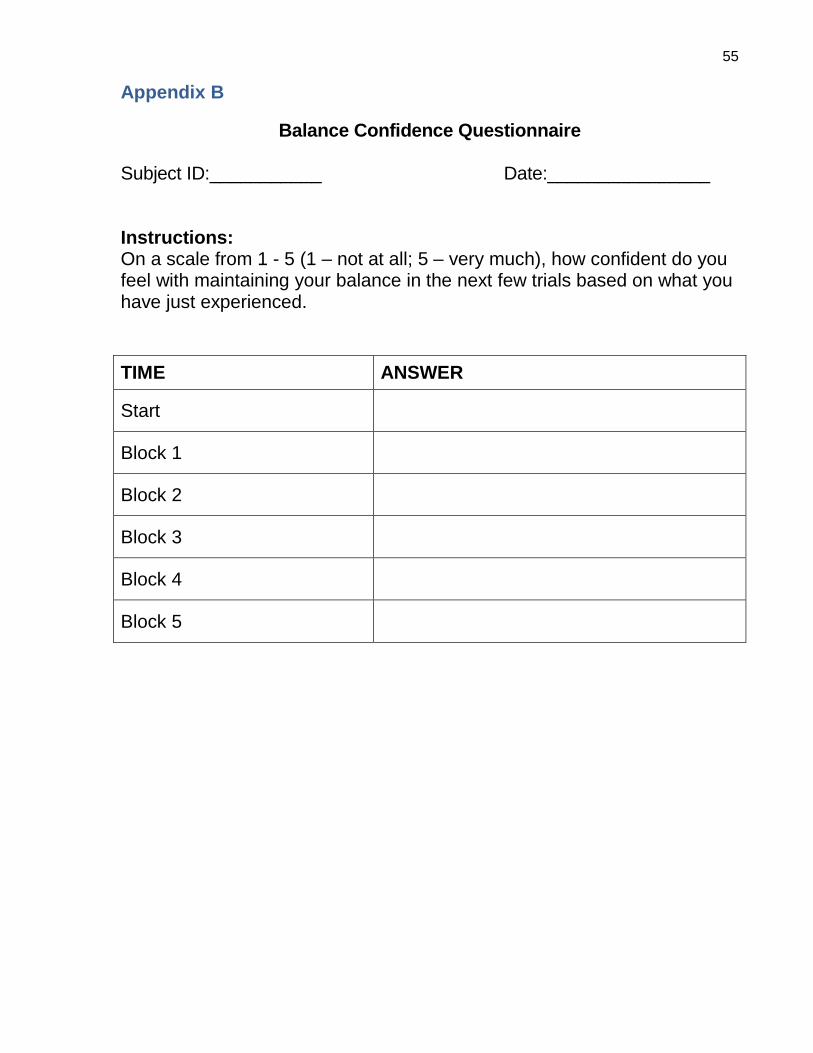
55
Appendix B
Balance Confidence Questionnaire Subject ID:___________ Date:________________ Instructions: On a scale from 1 - 5 (1 – not at all; 5 – very much), how confident do you feel with maintaining your balance in the next few trials based on what you have just experienced.
TIME ANSWER
Start
Block 1
Block 2
Block 3
Block 4
Block 5
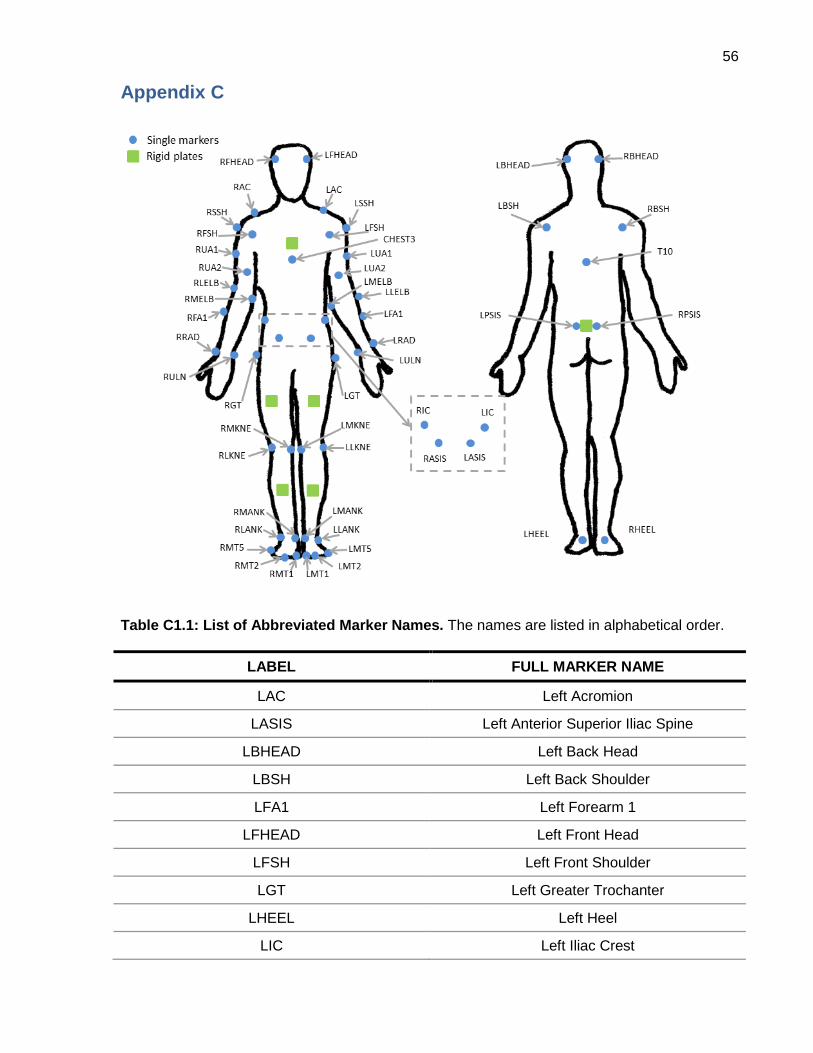
56
Appendix C
Table C1.1: List of Abbreviated Marker Names. The names are listed in alphabetical order.
LABEL FULL MARKER NAME
LAC Left Acromion
LASIS Left Anterior Superior Iliac Spine
LBHEAD Left Back Head
LBSH Left Back Shoulder
LFA1 Left Forearm 1
LFHEAD Left Front Head
LFSH Left Front Shoulder
LGT Left Greater Trochanter
LHEEL Left Heel
LIC Left Iliac Crest
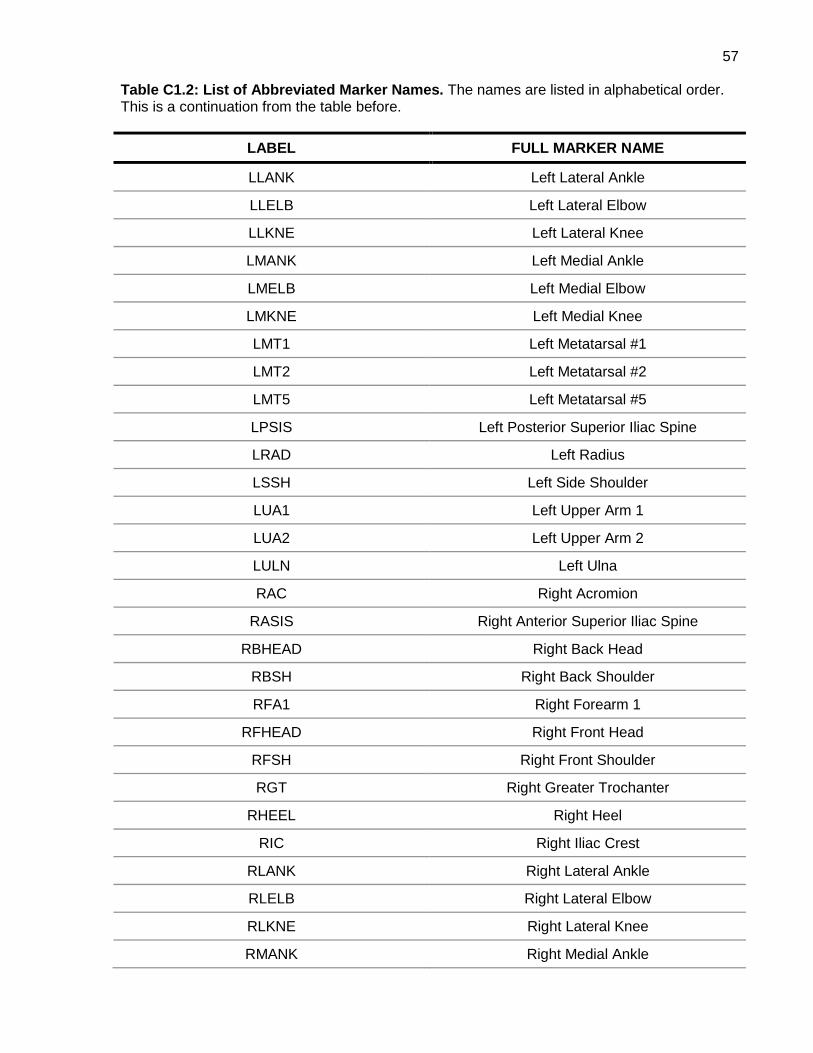
57
Table C1.2: List of Abbreviated Marker Names. The names are listed in alphabetical order. This is a continuation from the table before.
LABEL FULL MARKER NAME
LLANK Left Lateral Ankle
LLELB Left Lateral Elbow
LLKNE Left Lateral Knee
LMANK Left Medial Ankle
LMELB Left Medial Elbow
LMKNE Left Medial Knee
LMT1 Left Metatarsal #1
LMT2 Left Metatarsal #2
LMT5 Left Metatarsal #5
LPSIS Left Posterior Superior Iliac Spine
LRAD Left Radius
LSSH Left Side Shoulder
LUA1 Left Upper Arm 1
LUA2 Left Upper Arm 2
LULN Left Ulna
RAC Right Acromion
RASIS Right Anterior Superior Iliac Spine
RBHEAD Right Back Head
RBSH Right Back Shoulder
RFA1 Right Forearm 1
RFHEAD Right Front Head
RFSH Right Front Shoulder
RGT Right Greater Trochanter
RHEEL Right Heel
RIC Right Iliac Crest
RLANK Right Lateral Ankle
RLELB Right Lateral Elbow
RLKNE Right Lateral Knee
RMANK Right Medial Ankle
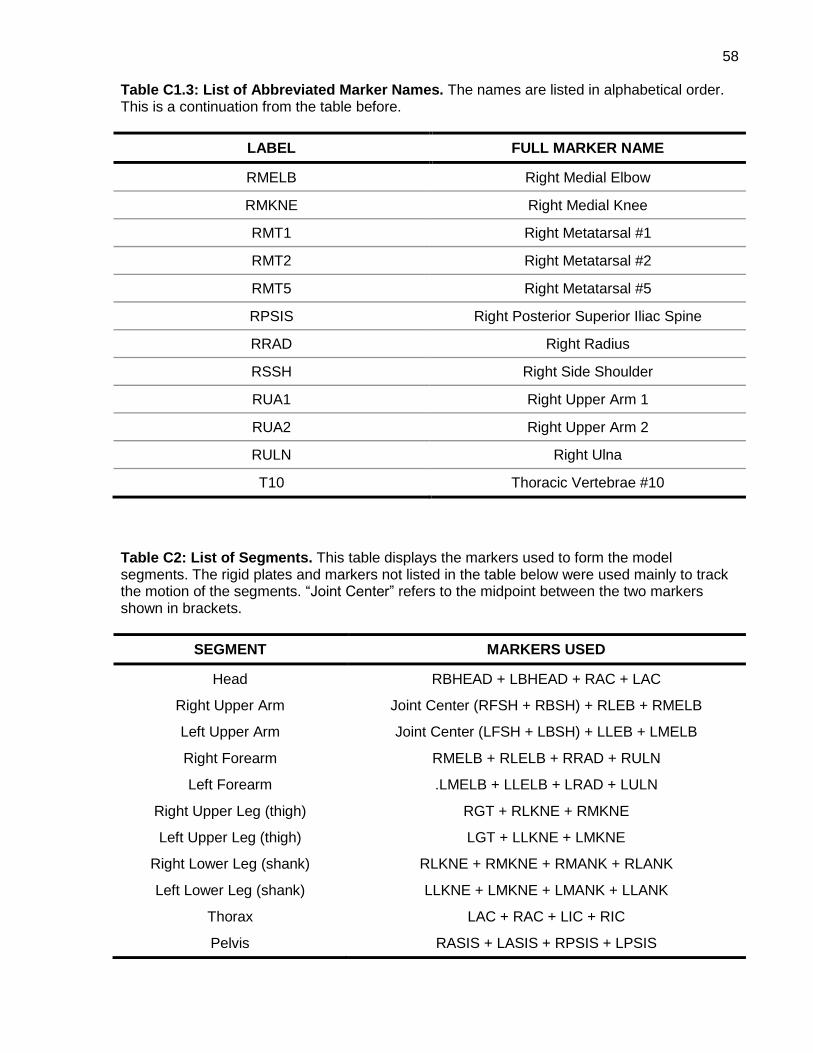
58
Table C1.3: List of Abbreviated Marker Names. The names are listed in alphabetical order. This is a continuation from the table before.
LABEL FULL MARKER NAME
RMELB Right Medial Elbow
RMKNE Right Medial Knee
RMT1 Right Metatarsal #1
RMT2 Right Metatarsal #2
RMT5 Right Metatarsal #5
RPSIS Right Posterior Superior Iliac Spine
RRAD Right Radius
RSSH Right Side Shoulder
RUA1 Right Upper Arm 1
RUA2 Right Upper Arm 2
RULN Right Ulna
T10 Thoracic Vertebrae #10
Table C2: List of Segments. This table displays the markers used to form the model segments. The rigid plates and markers not listed in the table below were used mainly to track the motion of the segments. “Joint Center” refers to the midpoint between the two markers shown in brackets.
SEGMENT MARKERS USED
Head RBHEAD + LBHEAD + RAC + LAC
Right Upper Arm Joint Center (RFSH + RBSH) + RLEB + RMELB
Left Upper Arm Joint Center (LFSH + LBSH) + LLEB + LMELB
Right Forearm RMELB + RLELB + RRAD + RULN
Left Forearm .LMELB + LLELB + LRAD + LULN
Right Upper Leg (thigh) RGT + RLKNE + RMKNE
Left Upper Leg (thigh) LGT + LLKNE + LMKNE
Right Lower Leg (shank) RLKNE + RMKNE + RMANK + RLANK
Left Lower Leg (shank) LLKNE + LMKNE + LMANK + LLANK
Thorax LAC + RAC + LIC + RIC
Pelvis RASIS + LASIS + RPSIS + LPSIS
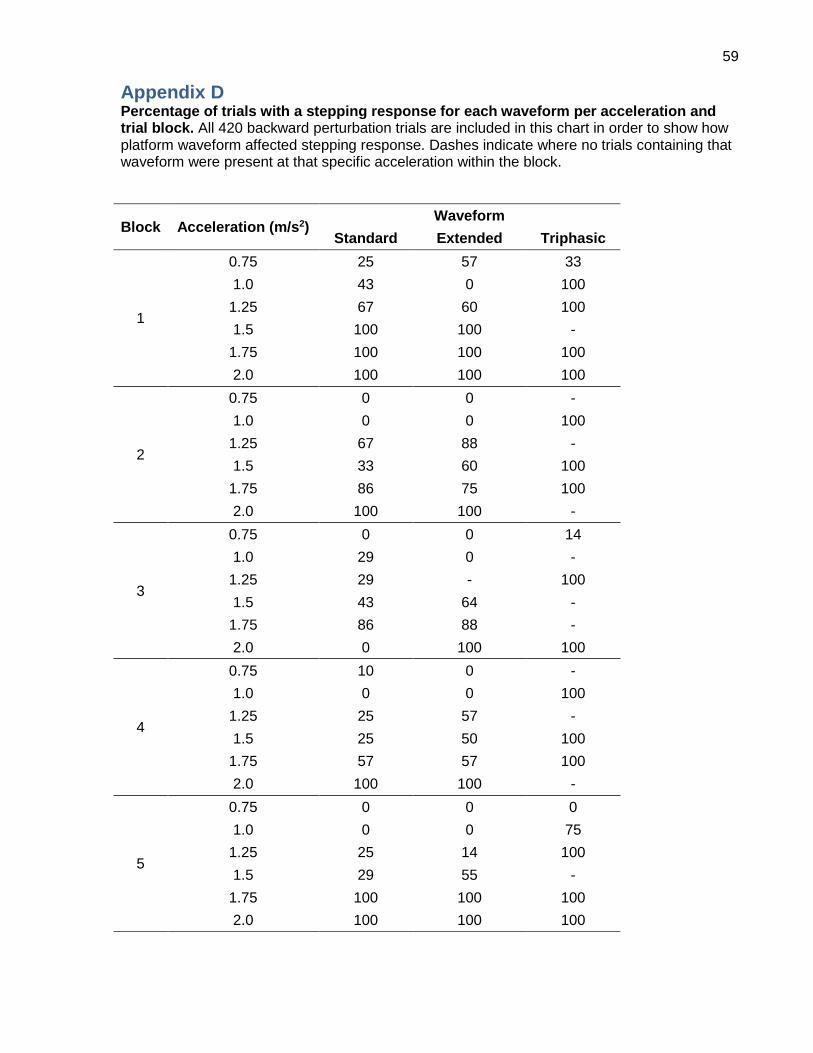
59
Appendix D Percentage of trials with a stepping response for each waveform per acceleration and trial block. All 420 backward perturbation trials are included in this chart in order to show how platform waveform affected stepping response. Dashes indicate where no trials containing that waveform were present at that specific acceleration within the block.
Block Acceleration (m/s2) Waveform
Standard Extended Triphasic
1
0.75 25 57 33
1.0 43 0 100
1.25 67 60 100
1.5 100 100 -
1.75 100 100 100
2.0 100 100 100
2
0.75 0 0 -
1.0 0 0 100
1.25 67 88 -
1.5 33 60 100
1.75 86 75 100
2.0 100 100 -
3
0.75 0 0 14
1.0 29 0 -
1.25 29 - 100
1.5 43 64 -
1.75 86 88 -
2.0 0 100 100
4
0.75 10 0 -
1.0 0 0 100
1.25 25 57 -
1.5 25 50 100
1.75 57 57 100
2.0 100 100 -
5
0.75 0 0 0
1.0 0 0 75
1.25 25 14 100
1.5 29 55 -
1.75 100 100 100
2.0 100 100 100