Embed Size (px)
Citation preview

PAGE TITLE HERE
Exploring the success and barriers to
SME access to finance and its potential
role in achieving growth
ERC Research Paper 53
November 2016

2
Exploring the success and barriers to
SME access to finance and its potential
role in achieving growth
Dr Robyn OwenMiddlesex [email protected]
Tiago BotelhoUniversity of East Anglia
Osman AnwarSQW
The Enterprise Research Centre is an independent research centre whichfocusses on SME growth and productivity. ERC is a partnership betweenWarwick Business School, Aston Business School, Imperial College BusinessSchool, Strathclyde Business School, Birmingham Business School and Queen’sUniversity School of Management. The Centre is funded by the Economic andSocial Research Council (ESRC); the Department for Business, Energy &Industrial Strategy (BEIS); Innovate UK and the British Business Bank. Thesupport of the funders is acknowledged. The views expressed in this report arethose of the authors and do not necessarily represent those of the funders.

3
ACKNOWLEDGEMENT
The research team would like to thank Jonathan Cook at SQW and Oxford
Innovation for their co-operation and assistance.
EXECUTIVE SUMMARY
Research Questions
The primary objectives of the research were to examine: (i) the UK SME demand
for external finance in terms of reasons for seeking, amount and types of finance
sought; (ii) the level and reasons for borrower discouragement; (iii) the
association between use of external finance and SME growth, and the
characteristics of SMEs that are successful, growth oriented and discouraged.
Methodology
Our approach included initial quantitative exploration of the Longitudinal Small
Business Survey (LSBS) 2015, a survey of 15,502 SMEs representing all types
of SMEs in the UK. This initially included descriptive data, focusing on the
external financing requirements of surveyed SMEs during the year prior to
survey, examining key characteristics associated with finance access success,
discouragement and growth orientation. Regression analysis was then used to
sift out the key factors in relation to seeking external finance, success in
accessing external finance (both overall and for different broad types of finance)
and discouragement.
We then explored our key findings for greater explanatory insights through six
qualitative semi-structured telephone interviews with frontline staff from Oxford
Innovation responsible for assisting potential high growth and innovation focused
SMEs with external financing.
Key Findings
There was widespread consensus between the descriptive analytical evidence
from the LSBS 2015 and the qualitative business finance support provider
interviews that obtaining external finance is significantly associated with SME

4
growth.
Almost one in ten (9%) surveyed SMEs were discouraged (i.e. had external
financing needs but did not apply), a third of which had applied for finance in the
year prior to survey but then gave up and revised down their growth aims. This
indicated that some growth oriented SMEs may grow faster if they could gain
timely access to sufficient external funding.
Almost one fifth (19%) of LSBS 2015 surveyed SMEs had sought external
finance in the year prior to survey: mostly relating to bank finance (43% loans
and 42% overdrafts), credit card finance (51%) and leasing (36%). There were
signs that demand for equity (6.5%) and P2P finance (4%) is rising in substitution
for bank finance for younger, smaller SMEs.
The main reasons for seeking external finance were for working capital (51%)
and equipment (42%). Only 7% mentioned growth finance and just 3% R&D.
Surveyed finance advisors questioned whether R&D finance was under reported,
insufficiently accounting for R&D tax credits.
The median level of funding received was £75,000: over a quarter (27%)
obtained under £25,000, whilst one eighth (13%) received over £1m.
The majority of those seeking external finance (62%) only applied once, with one
fifth applying three or more times. Persistence pays; the vast majority of
applicants (83%) obtain at least some external financing, 11% were still in
transaction and only 6% received nothing.
Regression analysis revealed the significant (<.05 level) characteristics of the
surveyed SMEs:
Who applies for external funding?
• Larger SMEs employers with 3 plus partner/directors and greater
perceived capability to access external financing.
• Younger SMEs established for up to 5 years were more likely to apply for
finance.
• Capital intensive sectors e.g. primary agricultural and manufacturing

5
SMEs.
• Ethnic minority owned businesses and those in less deprived areas.
Who gets external funding (where received at least some external finance
applied for)?
• Larger SMEs, obtaining larger amounts of finance, with better
management resources and perceived financial access skills, and 3 or
more partner/directors.
• Self employed were least successful and younger SMEs established for
up to 5 years.
• Accommodation and catering sectors were least successful.
Who is discouraged?
• Smaller SMEs (notably zero employee and micro employer) and younger
SMEs established under 5 years.
• SMEs with perceived poorer capabilities to raise finance and with less
than three directors/managers.
• Women-led and ethnic minority led businesses.
Key Recommendations
From a policy perspective the main findings suggest that government ought to
complement its efforts on the external financing supply side by stimulating the
demand-side for finance to ensure that quality propositions are put in front of
investors. This will require improved eco-system support through capacity
development amongst business advisors, a better join-up in the business support
landscape, and enhanced provision and take-up of investor readiness support
(SQW, 2016; Baldock et al. 2015).

6
Policy
1. Better education for entrepreneurs on understanding their risk profile, the
variety of finance available and identifying finance that suits their risk profile
2. Provision of investment readiness support which targets those that need it
most – younger, smaller high growth businesses with particular attention to
ethnic-minority, women-led and rural businesses.
3. Guidance and tools for smaller/younger businesses to improve their financial
management and business development
4. Improve the all round financing ecosystem integrating entrepreneurial support
with a full range of suitable financing along the finance escalator.
5. Enhancing existing datasets to provide more granular analysis of key factors
in the future (see LSBS data recommendations).
LSBS data
1. The relationship between financial planning and discouragement could be
explored further in future LSBS surveys, exploring firms’ adaptation to a lack
of external financing and the extent to which this stunts potential growth or
strengthens business models.
2. Current LSBS data collection makes it difficult to calculate (i) whether
businesses receive all of the external funding that they required and (ii) the
extent of any shortfall in required external funding.
3. Collection of R&D tax incentive (tax credits) data might provide a greater
indication of the extent of R&D financing required.
4. Despite the expanded LSBS size, the data is insufficient to conduct any
robust examination of the financing requirements of young potential high
growth SMEs and aspects of equity and new alternative financing (e.g. P2P,
reward/donation and equity crowd funding). This can only be achieved by
additional bolt-on sampling.
5. It is important that the LSBS is able to ascertain what type and source of

7
external financing advice and assistance was received. This would help to
examine demand-side and support network failures.
NEXT STEPS?
Future LSBS research should track the relationship between access to external
finance and actual growth performance over time, including assessing how those
that seek external finance but are discouraged actually perform.

8
CONTENTS
EXECUTIVE SUMMARY .................................................................. 3
1. INTRODUCTION ....................................................................... 9
Key aims of research ................................................................. 9
Methodology .............................................................................. 9
Quantitative Research................................................................ 9
Qualitative Research................................................................ 10
2. QUANTITATIVE ANALYSIS ................................................... 11
2.1 SME Access to finance ...................................................... 11
2.2 Discouragement................................................................. 20
2.3 Relationship between External Funding and Growth ......... 24
2.4 Descriptive Analysis Summary Conclusions ...................... 27
2.5 Regression Analysis........................................................... 28
3. QUALITATIVE ANALYSIS ...................................................... 32
4. CONCLUSIONS AND RECOMMENDATIONS ....................... 41
4.1 Key findings ....................................................................... 41
4.2 Policy Recommendations................................................... 46
REFERENCES................................................................................ 50
9
1. INTRODUCTION
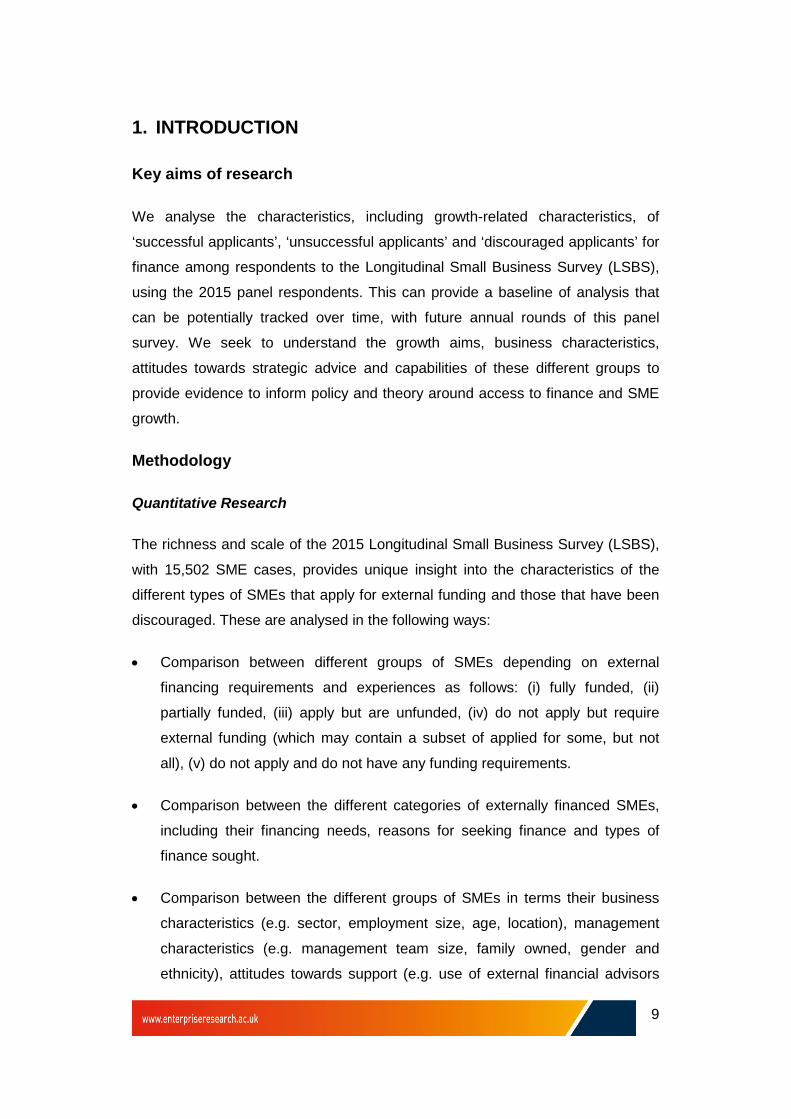
Key aims of research
We analyse the characteristics, including growth-related characteristics, of
‘successful applicants’, ‘unsuccessful applicants’ and ‘discouraged applicants’ for
finance among respondents to the Longitudinal Small Business Survey (LSBS),
using the 2015 panel respondents. This can provide a baseline of analysis that
can be potentially tracked over time, with future annual rounds of this panel
survey. We seek to understand the growth aims, business characteristics,
attitudes towards strategic advice and capabilities of these different groups to
provide evidence to inform policy and theory around access to finance and SME
growth.
Methodology
Quantitative Research
The richness and scale of the 2015 Longitudinal Small Business Survey (LSBS),
with 15,502 SME cases, provides unique insight into the characteristics of the
different types of SMEs that apply for external funding and those that have been
discouraged. These are analysed in the following ways:
• Comparison between different groups of SMEs depending on external
financing requirements and experiences as follows: (i) fully funded, (ii)
partially funded, (iii) apply but are unfunded, (iv) do not apply but require
external funding (which may contain a subset of applied for some, but not
all), (v) do not apply and do not have any funding requirements.
• Comparison between the different categories of externally financed SMEs,
including their financing needs, reasons for seeking finance and types of
finance sought.
• Comparison between the different groups of SMEs in terms their business
characteristics (e.g. sector, employment size, age, location), management
characteristics (e.g. management team size, family owned, gender and
ethnicity), attitudes towards support (e.g. use of external financial advisors

10
and use of strategic advice), recent growth (in the last 12 months), growth
aims (e.g. future growth plans, exporting behaviour), and business
capabilities (e.g. perceived abilities for accessing finance and developing a
business plan).
The data analysis presented is unweighted.
Our quantitative analysis is presented in four broad sections:
1. Descriptive analysis of the characteristics of applicant businesses, why they
sought external finance, types of finance applied for, the level of finance sought
and success rates in obtaining at least some finance;
2. Descriptive analysis of the characteristics of discouraged borrowers and
reasons why they were discouraged;
3. Descriptive analysis of the relationship between external finance and past and
future growth orientation;
4. Regression analysis to sift out the most important characteristics of businesses
(i) applying for external finance (ii) accessing at least some external finance (iii)
discouraged from seeking external finance. The external finance access models
are run for overall access and then for broad categories of finance (e.g. overdraft,
loans, equity, grants/charitable, leasing/HP, and P2P).
Qualitative Research
A further element of the research, aimed at achieving greater understanding of
the policy consequences of the quantitative findings, is extended telephone
survey work undertaken with practitioners from Oxford Innovation who provide
business and finance support to high growth and innovation focused firms . Six
interviews were undertaken with key business finance support staff. These
involved the use of a topic guide exploring the main findings from the quantitative
research to find out how they impact upon business support and might require
further policy development.
After a presentation of the main findings from the qualitative survey work, the
report concludes with a series of key conclusions and policy recommendations.

11
2. QUANTITATIVE ANALYSIS
2.1 SME Access to finance
Access to finance during the previous 5 years
The survey indicates that over one-third (36%) of surveyed businesses had
sought external finance during the last five years. All are currently using at least
one type of external finance; one third are using just one type, 27% two types,
21% three types and 19% four or more types.
In terms of external finance that is currently being used, the main types are
(n=5506): credit cards (51%), overdrafts (45%), leasing/HP (43%) and loans
(38%). The tier below includes commercial mortgages (17%) and factoring
(10%). Other external finance currently used includes equity (7%), private trusts
and grants (4%), personal loans (3%), government schemes (2%), P2P (2%),
mezzanine (1%), public equity (1%) and other assorted finance (3%).
Examining the numbers of applications for external finance made over the last
five years by business characteristics there are some significant (at beyond .001
level) correlations:
• Older businesses trading 20 years and longer along with those with three
or more partners/directors, perceived better management capabilities and
users of external advisors are all more likely to have applied.
• Older businesses (20+ years) and those with 3 or more partner/directors
are more likely to have applied six or more times.
• Family owned businesses were less likely to have applied for finance and
where they did they made fewer applications than their non family
business counterparts.
• Businesses in the most 15% most deprived UK areas were less likely to
apply 6 or more times.
• The amount of funding secured increases by the number of applications
made (22% of those applying once received £250,000 or more funding,

12
rising to 45% of those making 10 or more applications).
This report will focus on a detailed analysis of access to external finance
during the year prior to survey.
2.1.1 Access to finance during the last year
Types of finance accessed during the year prior to survey
2,865 (19%) of the SMEs surveyed had sought external finance in the last year.
Of these, 51% sought credit card finance, 43% bank loans, 42% overdrafts, 36%
leasing, 9% factoring, 6.5% equity, 7% grants and 4% P2P (peer-to-peer debt
finance).
62% applied only once for finance during the last year, 18% twice, 14% 3-5 times
and 6% more than 5 times.
Overall (Table 2.1), 83% of applicants received at least some funding, 6%
received nothing and 11% were unable to give a definitive answer because
applications were still in progress.
Amongst finance seekers, the most frequently sought types of finance were bank
overdrafts and loans (both 43%), followed by leasing/HP (35%) and credit cards
(22%). Just 6% sought private equity finance whilst rust and private grants
represented 7% and government schemes represented just 3%.
Reasons for seeking finance
The main reasons for seeking finance mentioned by the finance seekers
(n=2883) were:
• 51% were seeking working capital to assist cash-flow
• 42% were seeking finance for equipment and vehicles
• 15% were buying land and premises
• 9% were seeking funding for business property refurbishment
• 7% were seeking to expand in the UK

13
• 3% required finance for R&D
Other specific requirements which registered 2% or less included: start-up
finance, training, recruitment, marketing, buy-in and buy-out, overseas
expansion, recovery and debt consolidation.
Amounts of finance sought
The amounts of funding secured during the year prior to survey were recorded in
grouped categories. These demonstrate that amongst the successful applicants
(n=2402, see Figure 2.1):
• More than a quarter (27%) obtained under £25k
• One fifth obtained between £25k and £100k
• Almost one third (32%) received between £100k and £1m
• One in eight (13%) obtained over £1m, with 4% obtaining £4m plus
• The median level of funding received was £75k
Figure 2.1: Share of funding received by funding range categories
Share % of funding received ranges (£)
14, 14%
13, 13%
10, 10%
10, 10%15, 15%
17, 18%
8, 8%
4, 4%
2, 2%6, 6%
<10k
10k to 24,999
25k to 49,999
50k to 99,999
100k to 2499,999
250k to 999,999
£1m to £3.99
£4m plus
D/K
Refused
N=2402
Profile characteristics by amount of external finance raised

14
Securing larger amounts of finance during the last year is significantly related to
the larger employment size of businesses. It is also significantly associated with
perceived better capabilities for raising finance and strongly correlated with
having 3 or more partner/directors. Older businesses, established 20 years of
more were also more likely to raise larger amounts of finance. This demonstrates
the importance of internal management resources that are typically found in
larger older SMEs. The following profile characteristics of surveyed businesses
were significantly related (at beyond .001 level) with the amount of finance
obtained in the year prior to interview:
• Increased employment size is strongly related to increased amounts of
finance raised. For example, this rises proportionally for finance raised of
at least £250,000 within each category (rising from 1% of zero employee
to 19% of 50-249 employee businesses)
• Having perceived greater management capabilities for raising finance is
strongly related with raising greater amounts of finance.
• Businesses with three or more partners/directors were more likely to raise
greater amounts of finance as were older businesses established over 20
years.
• Both family and women owned businesses raised smaller amounts of
finance than their non-family and male owned business counterparts.
• More capital intensive sectors such as primary, manufacturing and
construction were more likely to raise larger amounts of finance than
services sectors such as finance, professional administrative and other
personal type services (which typically have lower overheads).

15
Table 2.1: Types of finance accessed and success rates in the last 12months
Type of Finance(n=2883) Row %
Obtained(a)
Progress(b)
Unsuccessful(c )
Success ratea/(a+c)
% ofseekers
Bank O/D 35 2 6 85 43
Loans 31 4 8 79 43
Commercial mortgage 7 2 2 78 11
Credit cards 20 1 1 95 22
Factoring 7 1 1 87 9
Leasing/HP 33 1 1 97 35
P2P 2 1 1 67 4
Equity 4 1 1 80 6
Public equity 0.4 0 0.1 80 1
Mezzanine 1 0 0.2 83 1
Trust/private grant 5 1 1 87 7
Government scheme 3 0 0.3 90 3
Personal finance 1 0 0.1 90 1
Other 4 1 1 80 6
Total 83 11 6 93 100
Table 2.1 indicates that the success rates of applicants for personal finance,
government schemes, credit cards and leasing were highest, whilst for bank
overdrafts, equity and loans and P2P the success rates in obtaining any external
finance were lower.
Profile by overall success rates
Table 2.1 presents the proportions of businesses applying for finance during the
previous 12 months that received at least some external finance, none, or were
still awaiting a decision.
Key findings include:
• Self employed businesses were significantly (<.001 level) less likely to
obtain any finance, with success rates increasing with employment size.
This finding is supported by the significance (.01 level) of SMEs with no
partner directors being less successful in accessing external finance,
whilst businesses with 3 or more partners are far more likely to be
successful.
• The accommodation and catering sector was significantly (<.01 level) less
likely to obtain external finance amongst the broad sectors tested.

16
Infocomms were also less likely to obtain finance.
• Young businesses established for less than 5 years were significantly
(<.001 level) less likely to obtain external finance, with success rates
increasing as businesses become more mature.
• SMEs in the North East region was significantly (.05 level) less likely to
obtain external finance and business in London were also less likely to
have success in obtaining external finance.
• Interestingly, businesses that used external finance finders and advisors
were significantly (.05 level) less successful at accessing external finance
and significantly (<.001 level) more likely to make more numbers of
applications. This may be because they are young and high risk
distressed businesses seeking unusual types of finance.
• Businesses with perceived strong capabilities to find external finance
were significantly (<.001 level) more likely to access at least some
finance.
Further examination of those that use financial advisors for seeking finance
reveals that they are generally more likely to be larger businesses, but that in the
micro size group a higher (but not significant proportion) are using financing
advisors (30% compared with 24%). Furthermore, younger businesses
established under 5 years are significantly (<.01 level) more likely to use
financing advisors. Those seeking equity finance are significantly (<.01 level)
more likely to use financing advisors and twice as likely to have experienced loan
application failure (14% compared with 7%).
Interestingly, businesses experiencing both sales turnover growth and decline
during the previous 12 months were higher proportional users of finance finders –
again highlighting the patchy impact of such advisors, or the problematic
distressed nature of the businesses that struggle to find funding.

17
Table 2.2: Access to finance Success rates by business and managementcharacteristics
Characteristic (n=2883) Row % Obtained Not OtherSuccessrate
N=
Employment size
Self employed/zero employee 72*** 14 15 84 446
1-9 employees 79 9 12 90 699
10-49 employees 86 4 10 96 909
50-249 employees 91 1 8 99 829
Broad sector (SIC2007)
Primary 90 1 9 99 165
Manufacturing 87 3 9 97 350
Construction 82 9 9 90 248
Wholesale/Retail 88 3 9 97 411
Transport 83 7 10 93 137
Accommodation/Food 73** 10 17 88 184
Infocomms 81 10 8 89 144
Finance/Real estate 81 7 13 92 88
Professional 84 7 9 92 327
Administration 84 7 9 92 205
Education 78 6 16 93 109
Health 79 7 14 92 316
Arts 86 1 13 99 94
Other services 76 7 17 92 105
Establishment age of business
0-5 years 77*** 10 13 89 379
6-10 years 78 9 13 90 357
11-20 years 84 6 11 93 457
20+ years 86 4 10 96 1685
Government Office Regions
East Midlands 87 4 9 96 220
East of England 89 3 8 97 305
London 79 9 12 90 343
North East 70* 8 11 90 89
North West 85 5 10 94 253
South East 81 8 11 90 463
South West 85 5 11 94 359
West Midlands 85 6 9 93 208
Yorkshire and Humber 84 4 12 95 206
Scotland 84 4 12 95 229
Wales 77 5 18 94 99
Northern Ireland 79 7 14 92 109
Urban/Rural/Deprived location
Urban 83 6 11 93 2027
Rural 85 5 11 94 849
15% most deprived areas 83 7 11 92 372
Management characteristics/capabilities

18
Family led 84 7 10 92 1747
Women led 80 7 12 92 547
Minority Ethnic led 81 8 11 90 150
No partners/directors 79** 5 16 94 325
1-2 partners/directors 82 7 11 92 1505
3+ partners/directors 88 3 9 97 1018
Capabilities access finance good+ 90*** 2 8 98 1515
Capabilities access finance average 83 4 13 95 656
Capabilities access finance poor- 67 15 18 82 542
Used external financeadvice/support
78* 8 14 91 167
Significance: *<.05; **<.01; ***<.001
Access relationship between key types of finance and business and management
characteristics
Examining the main types of finance sourced (overdrafts, loans, equity,
leasing/HP and grants/trust/charitable) revealed that larger employment size is
significantly related to application success across all forms of finance. The
situation for smaller firms with smaller internal resources was further exacerbated
where businesses declared that they had poor capabilities to raise finance; these
performed significantly less well (<.001 level) across all forms of finance.
Businesses that used external advisors exhibited mixed results, being
significantly (<.05 level) more likely to receive leasing/HP, but less likely to
receive overdrafts and loans. It is possible that these businesses are
unsuccessful or unsuitable for loan finance, causing them to take on advisors to
seek alternative types of finance; there is a marginally significant (<.1 level)
relationship suggesting that younger businesses (established under 5 years) are
more likely to use external advisors.
In further detail the following relationships are evident:
• By employment size, larger businesses are significantly more likely to be
successful in accessing all types of finance; at beyond .001 level, except
for grants (<.05 level)
• By age of establishment; older businesses are significantly (<.001 level)
more likely to experience success in applying for overdrafts, leasing and
loans.
19
• Businesses in urban locations were significantly (<.001 level) more likely
to experience success in applying for lease/HP finance than their rural
counterparts.
• Businesses located outside of the 15% most deprived neighbourhoods
were slightly significantly (<.1 level) more likely to experience success in
applying for grants/trust/charitable finance.
• Ethnic minority owned businesses were slightly significantly (<.1 level)
less likely to experience success in applying for leasing/HP finance.
• Businesses with more directors were significantly (<.001 level) more likely
to be successful in applying for overdrafts, leasing and loans.
• Businesses with declared poor capabilities for raising finance were
significantly (<.001 level) less likely to access finance of all types.
• Businesses that used financial advice and support were significantly (<.05
level) less likely to get overdrafts or loans and significantly (<.05 level)
more likely to obtain lease/HP finance.
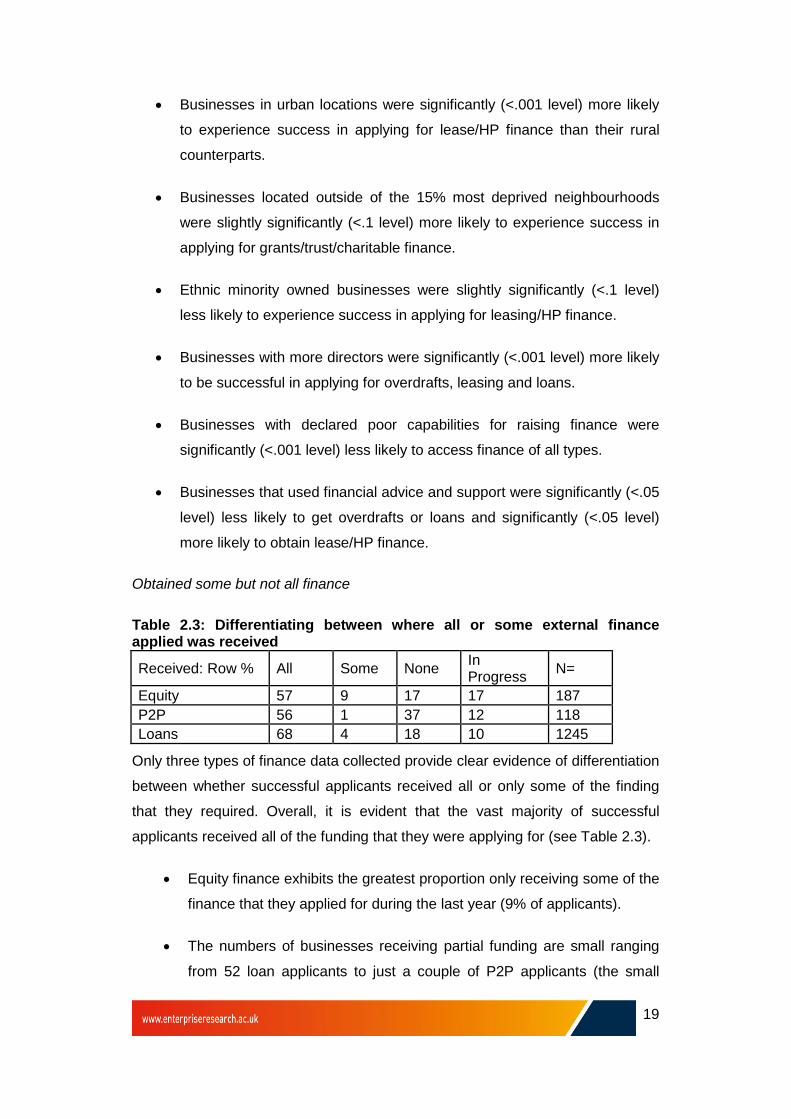
Obtained some but not all finance
Table 2.3: Differentiating between where all or some external financeapplied was received
Received: Row % All Some NoneInProgress
N=
Equity 57 9 17 17 187
P2P 56 1 37 12 118
Loans 68 4 18 10 1245
Only three types of finance data collected provide clear evidence of differentiation
between whether successful applicants received all or only some of the finding
that they required. Overall, it is evident that the vast majority of successful
applicants received all of the funding that they were applying for (see Table 2.3).
• Equity finance exhibits the greatest proportion only receiving some of the
finance that they applied for during the last year (9% of applicants).
• The numbers of businesses receiving partial funding are small ranging
from 52 loan applicants to just a couple of P2P applicants (the small

20
proportion here may relate to these type of funding platforms either
funding all or nothing).
2.2 Discouragement
‘Discouraged borrowers’ may be defined as those with a declared external
financing need who for some reason do not apply for funding (Fraser, 2009). In
this section we explore borrower discouragement exhibited by the 15002
surveyed SMEs for the 12 months prior to interview.
Overall 9% of SMEs exhibit some form of borrower discouragement and this
includes 3% of SMEs (417) that had applied for some funding (316 obtaining at
least some, 47 obtaining nothing and 54 experiencing delays or not yet having
resolved their applications during the last 12 months).
Characteristics of discouraged borrowers
An exploration of the characteristics of the discouraged borrowers reveals the
following significant findings:
• Micro businesses (1-9 employees) are more likely (significant at <.001
level) to exhibit discouragement.
• Young businesses aged five years or younger are more likely to exhibit
discouragement (significant at <.001 level).
• SMEs with no partners or directors (self employed) are more likely to
exhibit discouragement (significant at <.001 level).
• Minority ethnic led businesses are significantly (at <.001 level) more likely
to exhibit discouragement.
• SMEs with declared poor capabilities to access finance are significantly
(<.001 level) to exhibit discouragement.
• Those that use external finance finders and advisors are more likely to
exhibit discouragement (significant at <.001 level).
• Those SMEs that have a formal business plan, but do not keep it updated

21
are significantly (at <.01 level) more likely to exhibit discouragement.
Our findings are very much in-line with the expectations from previous studies
that smaller, younger SMEs, with smaller management resources and
capabilities are more likely to be discouraged (Table 2.4).
Our finding that SMEs that use external finance advisors and finance finders are
more discouraged also underlines the result that these businesses are
significantly less likely to access external funding. They exhibit twice the
proportion of use to those that are successful. The indication is that these
businesses struggle to find funding because they are smaller and younger,
initially failing or unable to obtain bank funding and seeking, but inexperienced in
raising, alternative sources of finance, notably equity. This raises important
questions for policy, as it confirms the findings of Baldock et al (2015) and SQW’s
DETI (2015) report, which both indicate that finance advice and finding services
can be inconsistent, poorly informed (notably about government schemes
availability and eligibility) and could be considerably improved.
Table 2.4: Discouraged Borrower characteristics, where financing need notpursued in the previous 12 months
Characteristic (n=15502) Row % Finance need not pursued N=
Employment size:
Self employed/zero employee 8 4355
1-9 employees 11*** 4102
10-49 employees 10 4066
50-249 employees 7 2979
Broad sector (SIC2007)
Primary 10 577
Manufacturing 10 1456
Construction 10 1497
Wholesale/Retail 9 2240
Transport 7 560
Accommodation/Food 11 1058
Infocomms 11 872
Finance/Real estate 6 613
Professional 7 2244
Administration 8 1129
Education 8 668
Health 12 1401
Arts 11 478
Other services 11 709
Establishment age of business

22
0-5 years 14*** 1887
6-10 years 10 2005
11-20 years 9 2733
20+ years 8 8819
Government Office Regions
East Midlands 9 1135
East of England 9 1694
London 11 1959
North East 8 433
North West 10 1400
South East 9 2590
South West 8 1849
West Midlands 8 1232
Yorkshire and Humber 8 1111
Scotland 10 1095
Wales 10 504
Northern Ireland 12 500
Urban/Rural/Deprived location
Urban 9 11188
Rural 9 4273
15% most deprived areas 10 1723
Management characteristics/capabilities
Family led 9 10360
Women led 10 3188
Minority Ethnic led 16*** 768
No partners/directors 11*** 1546
1-2 partners/directors 9 9616
3+ partners/directors 9 4062
Capabilities access finance good+ 7 5544
Capabilities access financeaverage
12 2794
Capabilities access finance poor- 17*** 2865
Used external financeadvice/support
20*** 349
Formal business plan to date 10 5986
Business plan not up to date 14** 1266
No formal business plan 8 7868
Total 9 15002
Significance: *<.05; **<.01; ***<.001
Reasons for discouragement
An examination of the main reasons for discouragement indicates that overall,
amongst the 9% (n=1435) of surveyed SMEs exhibiting discouragement, this
more frequently related to avoiding additional risk (20%), fear of rejection (17%),

23
perceived high cost of finance (13%) and length of time and amount of hassle to
obtain finance (11%). Furthermore, more than one in five (23%) suggested either
other reasons or ‘don’t know’ (Table 2.5).
When the sub-group of 3% (n=417) that had previously sought finance during the
last 12 months and still had finance external requirements which they had not
decided to apply for are analysed, thoughts of rejection increase to 29% and
lengthy timetable and hassle in obtaining finance increase to 14%. Amongst
those that had previously received no external finance from applications during
the last 12 months, nearly half (45%) were most concerned about application
rejection.
Table 2.5: Main reasons for discouragement by all SMEs and thosepreviously seeking finance in the last year
Main reason fordiscouragement
AllSMEs
Col%(n=1435)
Col%(n=15002)
Previouslysort (n=417)Col%
Some(n=316)
None(47)
Other(54)
You thought you wouldbe rejected
250 17.4 1.6 29 28 45 20
You thought it would betoo expensive
189 13.2 1.2 9 10 4 9
You don't want to takeon additional risk
293 20.4 1.9 15 17 9 9
Now is not the righttime because ofeconomic conditions
97 6.8 0.6 6 6 0 7
You didn't know whereto find the appropriatefinance you needed
55 3.8 0.4 5 4 9 7
Poor credit history 64 4.5 0.4 4 3 15 2
The decision wouldhave taken too long/toomuch hassle
151 10.5 1 14 15 6 17
Other 255 17.8 1.6 14 14 11 19
Don't know 71 4.9 0.5 3 3 0 9
Refused 10 0.7 0.1 1 1 2 0
Total 1435 100 9.3 100 100 100 100

24
2.3 Relationship between External Funding and Growth
Table 2.6: Predicted and Actual Sales Turnover Change by Access toExternal Finance
Outcome/financeIncreaseRow%
Same(Row%
DecreaseRow%
N=
Future sales growth (12 months)
Obtained some 56* 36 8 2357
None 45 43 12 160
Other (in process) 51 38 11 301
Applied once 55 36 9 1738
Applied twice 57 36 7 492
Applied 3-5 times 56 35 9 388
Applied 6+ times 43*** 41 16 200
Not Applied 43*** 46 11 11669
Sales growth last 12months
Obtained some 47*** 34 17 2347
None 38 39 22 157
Other (in process) 38 39 19 308
Applied once 46 35 17 1731
Applied twice 47 33 17 495
Applied 3-5 times 44 34 20 386
Applied 6+ times 44 36 20 200
Not Applied 36*** 43 18 11980
Significance: *<.05; **<.01; ***<.001
Examining sales turnover performance, Table 2.6 presents actual sales turnover
growth during the past 12 months prior to survey and predicted sales turnover
growth for the next 12 months.
Examining future sales turnover performance predictions for the next 12 months,
successful application for external finance, along with applying up to five times for
external finance appear to be correlated with improved growth predictions, when
compared to those firms applying 6 or more times and non applicants in this
period.
• Future sales growth over the next 12 months is significantly (at beyond
.05 level) related to obtaining at least some external finance during the 12
months prior to survey.
• Unsuccessful applicant firms during the past 12 months exhibit a
considerably lower proportion expecting sales growth (in-line with those

25
firms not applying for finance).
• Those firms applying 6 or more times for finance during the past 12
months, along with firms not seeking external finance in this period are
significantly (at beyond .001 level) less likely to indicate future sales
growth.
Turning to actual sales turnover performance during the previous 12 months, our
overall findings demonstrate that obtaining at least some external finance during
the last 12 months is significantly associated with sales turnover growth when
compared with unsuccessful applicants and those firms not seeking external
finance in this period.
When we examine higher growth outcomes (grew significantly 10-20% or
substantially 20%+) there is no difference between receiving some or no external
finance, or in relation to the number of applications for external finance made
during the last year. The only clear finding is that those seeking external finance
are significantly more likely to have experienced higher sales growth in this
period (30%) when compared to non applicants (24%).
Furthermore, amongst applicant firms the number of applications for finance is
not strongly correlated with past sales growth. This might suggest that application
success is more strongly related to the strength of future growth predictions than
firms’ past growth record, but more likely indicates that future growth predictions
have been revised down as a result of not receiving external finance.
• Those firms obtaining at least some external finance during the past 12
months were significantly (at beyond .001 level) more likely to indicate
sales turnover growth over the past 12 months.
• Those firms not applying for external finance in the period were
significantly (at beyond .001 level) less likely to exhibit sales turnover
growth in the past 12 months.
Examining employment change (Table 2.7) recorded during the 12 months prior
to survey and predicted for the 12 months after survey, we find similar patterns to
sales performance in relation to access to external finance during the previous 12

26
months.
• Employment growth during the past 12 months is significantly associated
(at beyond .001 level) obtaining at least some external finance.
• Those not applying for finance are significantly (at beyond .001 level)
less likely to forecast employment growth over the next 12 months.
• Those not obtaining external finance that they have applied for are also
significantly (at beyond .05 level) less likely to have experienced
employment growth in the 12 months prior to survey.
• Those not applying for finance in the past 12 months are significantly (at
beyond .001 level) less likely to have experienced employment growth in
this period.
Table 2.7: Predicted and Actual Sales Employment Change by Access toExternal Finance
Outcome/financeIncreaseRow%
SameRow%
DecreaseRow%
N=
Employment growth last 12 months
Obtained some 36*** 50 14 2374
None 20 66 14 163
Other (in process) 26 56 17 310
Applied once 32 54 14 1751
Applied twice 37 47 16 502
Applied 3-5 times 36 47 17 392
Applied 6+ times 36 48 16 202
Not Applied 20*** 68 11 12112
Future Employment growth next 12 months
Obtained some 40 53 7 2402
None 27* 63 9 168
Other (in process) 40 53 2 313
Applied once 37 56 6 1779
Applied twice 43 47 10 504
Applied 3-5 times 40 51 9 397
Applied 6+ times 38 52 9 203
Not Applied 25*** 68 6 12170
Significance: *<.05; **<.01; ***<.001

27
2.4 Descriptive Analysis Summary Conclusions
The picture emerging from the LSBS data is largely supportive of other studies of
SME access to external finance, with larger businesses (in terms of employment
size) being more likely to access finance and secure larger amounts. Conversely,
the success rates amongst younger smaller businesses, particularly self
employed/zero employee and those established under 5 years were poorest.
A key emerging theme is that larger businesses with stronger management
resource bases are significantly more likely to access external finance. This was
the case for those with perceived better capabilities for raising finance and having
3 or more partner/directors.
An important finding is that businesses that used external finance finders and
advisors were significantly less successful at accessing external finance and
more likely to make more numbers of applications. There is an indication that
these are younger, smaller businesses that lack management resources and also
some older established distressed businesses that struggle to get conventional
bank finance, or alternative sources of finance.
Borrower discouragement is exhibited by just under one in ten SMEs and is more
prevalent amongst younger, smaller SMEs. One third of this group are
businesses that have applied for external finance during the previous year but
have not obtained all of the finance that they required. Intriguingly this group
contains a significantly high proportion of businesses that used external advisors
to seek finance. These appear to be a mix of distressed under-performing
established businesses and small, young businesses that lack internal resources
and knowledge of accessing finance and are seeking alternative finance
solutions (e.g. forms of equity).
Business growth, both in terms of employment and sales turnover during the year
prior to interview and predicted for the next year, is highly significantly correlated
with access to (at least some) external finance. A possible area for future
research will be to track predicted growth with actual performance. An interesting
point is that businesses with multiple applications of 6 or more are as significantly
unlikely to indicate future growth as non applicants, suggesting that they are

28
impacted by lack of finance (potentially revising down their growth predictions).
2.5 Regression Analysis
In this sub-section we explore a series of regression models to establish which
are the main factors contributing to access to finance when potentially key
influences such as business size, establishment age and management resources
and capabilities are controlled for. The approach taken was to run a series of
binary logit models to test the dependent variable of whether the applicant
business received external finance or not. The models begin with an aggregate
overall model for all applicants and then separately investigate five different types
of finance (loans, overdrafts, leasing/HP, equity and charity/grants) to see if there
are specific nuances within these. Initially, as a point of context we explore the
dependent variable of whether sought external finance during the past year, we
then also explore the dependent variable where borrower discouragement was
mentioned.
The independent variables included in the model are those which appeared most
influential from the initial descriptive analysis undertaken and include: number of
business partner/directors; business capabilities to raise finance; broad regions
(London, South, Midlands, North, Scotland, Wales); urban location; sector,
number of employees; establishment age; family owned business; women-led;
Minority Ethnic Group (MEG) led.
Whether sought External Finance
Here we are examine the broad question of whether firms that seek external
finance are different from those that do not, by using the dependent variable
applied for external finance during the 12 months prior to survey. This produced a
robust regression model with 69% accuracy, significant difference from the
baseline model at <.001 level, R-square 7.20% explanation of outcomes and
Hosmer & Lemeshow (H&L) goodness of fit at .354 (<.05). This revealed:
• Unsurprisingly, SMEs that did not use external financing services are less
likely (0.397 times) to apply for finance than those that did use such
services (<0.001)
• Increasing the capabilities of access to finance is associated with

29
increased chances of applying for external finance: firms with poor
capabilities to access finance are less likely (0.741 times) to apply for
finance than those with good capabilities (<0.001), whilst those with
average capabilities are less likely (0.864 times) to apply for finance than
the ones with good capabilities to access finance (<0.1).
• Increasing the firm size by numbers of employees number is associated
with increased chances of odds of applying for external finance: firms with
no employees are less likely (0.452 times) to apply for finance (<0.001),
firms with 1 to 9 employees are less likely (0.759 times) to apply (<0.01)
and firms with 10 to 49 employees are less likely (0.813 times) to apply
(<0.05), than those with 50-249 employees.
• A confirmatory finding of the importance of size is that firms with up to 2
partners are less likely (0.788 times) to apply for finance than the ones
with 3 or more partners (<0.01).
• Firms in primary activities are more likely (2.527 times) to apply for
external finance (<0.001), along with manufacturing (1.536 times; <.05)
and transport (1.784 times; <0.05), when compared to other services.
• Firms established up to 5 years are more likely (1.278 times) to apply for
finance than those established 20+ years (<0.05).
• Firms in the 15% most deprived areas are less likely (1.257 times) to
apply for finance than those in less deprived areas (<0.05)
• Ethnic minority led firms are more likely (1.699 times) to apply for external
finance than their counterparts (<0.001)
Access to External Finance
Here we explore whether the applicants for external finance during the past 12
months received at least some finance. The aggregate model for whether
received at least some funding provided robust findings, with 85.6% accuracy,
significant difference from the baseline model at <.001 level, R-square 13.8%
explanation of outcomes and Hosmer & Lemeshow ‘HL’ model goodness of fit at
.72 (<.05). This revealed:
• Increasing the capabilities of firms to access finance is significantly
associated with increased chances of accessing finance: firms with poor
capabilities to access finance are less likely (0.323 times) to obtained

30
finance than the ones with good capabilities to access finance. (p<0.001)
and firms with average capabilities to access finance are less likely (0.496
times) to obtained finance than the ones with good capabilities to access
finance (<0.01). This indicates that increasing the capabilities of access to
finance is associated with increased odds of obtaining finance.
• Increasing the number of employees is associated with increased
chances of obtaining finance; notably, firms with zero employees are less
likely (0.297 times) to obtained finance than the ones with 50 to 249
employees (<0.001)
• Firms in accommodation and food catering are less likely (0.337 times) to
have obtained finance than the ones in other sectors (<0.05).
Examination of the specific types of finance indicated robust models for all except
equity where the numbers were small and the HL is .025 and the baseline model
only has .1 difference and charitable/trust/grants where similarly to equity some
observations fall below 50 cases. All of the models have at least 75%
classification accuracy. The main findings are as follows:
• Increasing the capabilities of access to finance is significantly (<.01)
associated with increased odds of obtaining loan finance; notably firms
with poor capabilities to access finance are less likely (0.124 times) to
obtained finance than the ones with good capabilities to access finance
(<0.001).
• Firms with poor and average capabilities to access external finance are
significantly less likely to access equity finance than the ones with good
capabilities (<.01).
• Firms with poor capabilities to access finance are less likely (0.107 times)
to obtained bank overdraft than the ones with good capabilities to access
finance (p<0.001). Similarly they are less likely to have obtained
Leasing/HP finance (0.24 times: <.01), Charity/Trust/Grant than (0.12
times: <.01)
• Firms located in the Midlands (0.144 times) and North (0.16 times) of
England are significantly less likely to have obtained a bank overdraft
than firms located in NI (<0.05).
• Women-led firms are significantly less likely (0.464 times) to have

31
obtained bank overdraft finance than men-led (<0.05)
• Firms located in urban areas are more likely (1.899 times) to obtained
loan finance than the ones in rural areas (<0.01).
Borrower Discouragement
Turning to borrower discouragement, we explore whether the surveyed SMEs
had external financing requirements but did not apply for this finance in the 12
months prior to survey. This regression model was robust, containing 67%
accuracy, significant difference from the baseline model at <.001 level, R-square
19% explanation of outcomes and Hosmer & Lemershow ‘HL’ model goodness of
fit at 0.474 (<.05). This revealed:
• Firms with poor capabilities to access finance are significantly more likely
(2.642 times) to be discouraged than the ones with good capabilities to
access finance (<.001).
• Younger firms established up to five years are significantly more less
likely (0.517 times) to be discouraged than those established for over 20
years (<.05).
• Women-led firms are significantly more likely (1.698 times) to be
discouraged than their male-led counterparts (<.05).
• Minority ethnic-led firms are significantly more likely (2.217 times) to be
discouraged than their counterparts (<.05).
• Increasing firm size by number of employees is significantly associated
with increased odds of not being discouraged: Firms with on employees
are more likely (0.434 times) to be discouraged (<0.05), as are firms with
10 to 49 employees (0.553 times; <.05) than those with 50-249
employees.
Summary Regression Findings
Seeking financing in the last 12 months:
• Firms seeking external financing are more likely to be larger in size, but
younger in age (established up to 5 years), to have at least three
directors/managers and better capabilities for accessing finance, including
using external finance finders. They also include the primary,

32
manufacturing and transport sectors (all traditionally capital intensive
sectors), ethnic minority owned businesses and those in less deprived
areas.
Accessing External Finance in the last 12 months:
• Increasing the capabilities of firms to access finance is significantly
associated with increased chances of accessing finance alongside
increasing firm size by the number of employees. This is also the case for
obtaining bank loan and equity finance. The accommodation and catering
sector is significantly less likely to access external finance.
• Firms with poor capabilities to raise external finance are significantly less
likely to obtain bank overdrafts, HP/leasing and grants/charitable funding.
• Firms located in the Midlands and North of England and women led firms
are significantly less likely to obtain bank overdraft finance.
• Firms located in rural areas are significantly less likely to obtain bank loan
finance.
Discouraged Borrowers in the last 12 months:
• Increasing the size of the firm by employment numbers significantly
decreases the likelihood of discouragement.
• Firms with poor capabilities to raise finance are significantly more likely
to be discouraged and this is linked to younger firms established up to 5
years and those with less than three directors/managers.
• Women and ethnic minority led businesses are significantly more likely
to be discouraged than their counterparts.
3. QUALITATIVE ANALYSIS
This section presents the findings from the qualitative interviews with
practitioners from Oxford Innovation (part of SQW Group). It complements the
quantitative analysis set out in section 2. The overall purpose of the interviews
was to: (i) explore whether the key findings from the quantitative analysis of the
33
LSBS data 2015 aligned with Oxford Innovation’s ‘on-the-ground’ experience
and/or wider knowledge; (ii) probe for possible explanations for the quantitative
findings; and (iii) consider any wider policy implications. The feedback helped to
test the main quantitative findings and connect the data with practice.
Oxford Innovation manages a UK network of business and innovation centres1,
and provides business advice and support through Oxford Innovation Services2
(OIS). It also manages three investment networks: Oxford Investment
Opportunity Network (OION)3; Thames Valley Investment Network (TVIN)4; and
Oxford Early Investments (OEI)5. These networks offer investment opportunities
in early stage ventures by connecting companies with angel investors. The
investor membership includes private individuals, Venture Capital Funds, Venture
Capital Trusts and Corporate Investors. Over £50 million has been directly raised
through the three investment networks. Oxford Innovation as whole has
supported over 500 high-growth companies to commercialise their innovations6.
The approach to engaging with Oxford Innovation involved conducting six
telephone interviews lasting 40-60 minutes each. A semi-structured topic guide
with the main results from the quantitative analysis of the LSBS data was used
(sent to interviewees in advance of the discussions). This covered the following
areas:
• Access to finance during the previous 12 months
• Reasons for seeking finance during the previous 12 months
• Amount of finance sought during the previous 12 months
• Access to finance during the previous 5 years
• SMEs receiving some external finance, none or awaiting decision
• Relationship between key types of finance and business and
management characteristics
• Discouragement issues
1 http://www.oxin-centres.co.uk/2 http://oxfordinnovationservices.co.uk/3 http://www.oion.co.uk/4 http://www.tvin.co.uk/5 http://www.oxei.co.uk/6 The types of firms supported by Oxford Innovation are high-growth and innovationfocused technology firms from a range of sectors.

34
• Relationship between external funding and growth.
The six Oxford Innovation practitioners interviewed were client facing and have
been delivering specialist finance and business support to high growth firms for a
number of years including through: Oxford Innovation’s investment networks; and
through the Growth Accelerator programme and its successor the Business
Growth Service (now closed). The roles of interviewees included: Business
Growth Manager; Access to Finance Growth Manager; Investment Director;
Incubation Director; and Business Performance and Finance. The responsibilities
of interviewees covered a range of investment readiness and other support (e.g.
financial, growth strategy development, business planning, networking).
Types of finance accessed and reasons for seeking finance during the
previous 12 months
Interviewees agreed with the survey analysis on the proportion of SMEs
accessing external finance in the year prior to the survey (19% of SMEs
surveyed) and that from the proportion of SMEs applying for external finance, the
vast majority received at least some funding (83% of applicants). The prevalence
of different sources (in order of most survey responses): bank loans, overdrafts,
leasing/HP, credit cards, factoring, equity, grants and P2P debt finance (see
section 2.1 for results) was generally thought to be in line with the experiences of
interviewees.
There was also general consensus on the reasons for seeking finance during the
previous 12 months. Working capital to assist cash-flow, equipment and vehicles,
buying land and premises (land being less relevant for Oxford Innovation
supported firms), business property refurbishment, expansion in the UK, and
R&D were all considered the main factors for seeking finance. It was highlighted
that ‘cash-flow’ difficulties constituted the main driver for accessing external
finance as many were starting out, and working on the idea/products. With
regards to established firms, the time between receiving payment for
products/services and money going-out to pay e.g. suppliers (difference between
income coming in and expenditure) was argued to not always be in sync, in turn
affecting cash-flow, and resulting in a key reason for seeking finance.
Across all SMEs, the proportion seeking finance for R&D was low but according

35
to interviewees this proportion is much higher amongst high growth and
innovative SMEs. It was suggested that many high growth SMEs do not take
advantage of R&D tax credits and even if they do they are unlikely to perceive
this tax credit as a form of external finance7.
Although the survey analysis seems generally “right” it was pointed out that the
financing picture is changing: SMEs tend to go to banks as first lender (as they
may have existing relationships) but are increasingly finding that this is not
appropriate for various reasons (e.g. strict terms and conditions, long time taken
to process and obtain funds, lack of collateral and trade history, aversion to
supporting innovative/risky projects). There were now far more “flexible”
alternatives to financing cash-flow and other financing needs especially through
crowdfunding/P2P. For example, the volume of lending in the South West of
England is reported to have increased through P2P with decisions being made
more quickly (e.g. within 7 days) compared to the banks. So, although the survey
analysis suggested that bank loans, overdrafts, leasing/HP, credit cards were
more accessed products with P2P being at the other end of the spectrum, there
is growing activity from SMEs and lenders/investors in alternative financing such
as P2P.
It was stressed by interviewees that a lot more work needs to be done to educate
entrepreneurs/SMEs on what are the appropriate sources of finance for their
business especially on particular products like mezzanine finance to improve
demand. A potential area that was identified by interviewees related to the
personal circumstances of the entrepreneur which were thought to play an
important role in accessing external finance (e.g. can they provide personal
guarantee/collateral?).
Amount of finance sought during the previous 12 months
All interviewees confirmed that the results for the amounts of funding secured by
successful applicants during the year prior to the survey appeared to be as
expected (see results in section 2.1). From the perspective of understanding
growth, it was suggested that the “interesting” category is the one relating to
7 A point here is that although the LSBS is not capable of capturing R&D tax credit data itis possible to link respondents to HMRC data.

36
‘13% obtained over £1m, with 4% obtaining £4m plus’. The firms in this group
potentially represent those which were growing (rather than those which are just
surviving/lifestyle firms) and can properly evidence their future plans, in turn
securing confidence of lenders/investors to achieve their targets. It was
suggested that if “normal” SMEs are excluded from the analysis (i.e. not growing
firms) then a more accurate picture may emerge of the amounts secured for
growth-orientated businesses8.
Practitioners involved in Oxford Innovation’s investment networks indicated that
typically £100k-£500k was sought by firms (with some outliers) supported by the
networks, and that some entrepreneurs wanted “visibility” and go through e.g.
series A, B and C funding rounds knowing they will not realistically secure equity
from VCs but go through this process just to raise their profile and build
experience.
SMEs receiving some external finance, none or awaiting decision
Perhaps a surprising finding from the LSBS data analysis was that firms that
used external finance finders and advisors were significantly less successful at
accessing external finance and more likely to make more applications. These
were younger, smaller businesses that lacked management resources and
struggled to get conventional bank finance, or alternative sources of finance.
Interviewees explained the above findings that firms seeking external support
were already in a “distressed” state when they come to engaging with finance
finders and advisors. These firms were likely to have already struggled to raise
finance (or may have borrower discouragement) partly because their approach to
raising funds is not necessarily “tactical” or “strategic” but “reactionary” (requiring
immediate “cash-injection”).
An example is where entrepreneurs leave it too late to access external finance,
something which is reflected in the “turnaround” market for when firms are about
to go “bust”. This has given rise, in some cases, to the practice of “Pre Pack
8 A problem here is that the higher order funding requirements of £1m plus represent just412 SMEs (<3% of surveyed SMEs) which is insufficient to run robust regressionanalysis.

37
Administration” (when an insolvent business is sold to a “phoenix” company i.e. a
business that has been set up by the existing directors before going into
administration)9.
It is important to make clear the differentiation between “distressed” early stage
companies that engage advisors and those that do so as part of a calculated plan
for growth. In the former case, success is highly unlikely and there may be other
motivations driving the advisory engagement (administration fees, pre-pack deals
etc.)
Taking into account the “troubled” state firms are already in, the advisors are not
able to fundamentally change the business plans of the firms and will often have
to look at several different finance sources before getting any traction (thus
requiring greater numbers of applications). Those firms which go to external
support are also often younger and smaller business which may not have the
management resource (e.g. a Financial Director) to focus on searching and
accessing external funds. They may have relationships with banks who in turn
have their own designated advisors. These advisors may not always be flexible
and invest the time needed to fully understand the business.
The feedback from interviewees also highlighted the “trust and links” between
finance finders and advisors, and the influential role this can play in successfully
obtaining finance. There is a difference between long-term relationship advisors
and those that provide short-term services. The former is considered “better” as
they can work with the client firm over a longer period of time, understand their
needs, and provide a wider network which firms can tap into. A related issue is
the incentive/remuneration method for advisors which may also influence the
outcome for firms (advisors tend to “work at risk” and have different approaches
to secure their income: “retainer”, success fee, charging upfront fees10). These
issues need to be further explored to see how they affect firms’ access to
external funds.
9 A pre-pack is an “arrangement under which the sale of all or part of a company’sbusiness or assets is negotiated with a purchaser prior to the appointment of theadministrator, and the sale contract executed on the appointment of the administrator orvery shortly afterwards”. See: House of Commons Library Briefing Paper, NumberCBP5035, Pre Pack Administration. 20 January 2016.10 Reduces number of less quality businesses.

38
Interviewees were not surprised with the findings from the LSBS data that larger
businesses (in terms of employment size) were more likely to access finance and
secure larger amounts. Conversely, the success rates amongst younger smaller
businesses, particularly self-employed/zero employee and those established
under five years were poorest. Interviewees attributed this to risk profiling by debt
or equity providers and the work required to administer a small loan or undertake
due diligence. The larger banks for instance would far rather work with a large
firm because the fees are relatively higher and they are likely to be able to repay
the loan.
The finding that younger firms established under five years were more likely to
use finance advisors might partly be due to them being equity focused (therefore
requiring specific external expertise). For example, a young spin-out firm, which
may have received public grants (e.g. Smart award from Innovate UK) - typically
requiring matching funding - and then accessed other support (e.g. Knowledge
Transfer Network) may then be ready for/seeking equity investment.
A key emerging theme from the LSBS data was that larger businesses with
stronger management resource bases are significantly more likely to access
external finance. This was the case for those with perceived better capabilities for
raising finance and having three or more partner/directors. Again this can partly
be explained by risk. If something should happen to one director, then the others
were more likely to keep the business going and be able to pay back the finance.
A larger business with greater management resource can also spend more time
preparing quality presentations/pitches to finance providers.
The data analysis also found that businesses in London were less likely to have
success in obtaining external finance. This might partly be explained by the trend
for London businesses owners assigning unrealistic high valuations on their
business which investors were not willing to consider. It was suggested that
many owners of technology/innovation firms in London were influenced by high
valuations seen in other international markets (e.g. USA) when valuing their own
companies. However, investors in these UK firms were “put-off” by these high
valuations.

39
Relationship between key types of finance and business and management
characteristics
The LSBS analysis indicated that larger businesses (by employment size)11 were
more likely to be successful in accessing all types of finance and that older
businesses (by age of establishment)12 were more likely to experience success in
applying for overdrafts, leasing and loans. The feedback suggested that larger
and older businesses have built-up a track record and relatively lower risk-level
for banks and other finance providers of these products. The fact that businesses
with more partners/directors13 were more likely to be successful in applying for
overdrafts, leasing and loans, again points to the risk being spread between a
larger number of directors who have collateral (compared to just two directors
with no collateral).
Discouragement issues
The feedback confirmed that younger and micro firms, firms with no partners or
directors, minority ethnic led businesses, and SMEs with declared poor
capabilities to access finance exhibited more borrower discouragement. Many
within this group were considered to be ill prepared for raising finance and so
presented themselves badly to finance providers. The finding that a high
proportion of businesses that used external advisors to seek finance were in the
discouraged borrower group is explained by the reasons already given above
(under sub-section ‘SMEs receiving some external finance, none or awaiting
decision’). To re-iterate, firms are considered already to be in a “distressed” state
when they come to advisors.
Interviewees agree that these businesses struggle to find funding because they
are smaller and younger, initially failing or unable to obtain bank funding. They
are also inexperienced in raising, alternative sources of finance, notably equity. It
was also mentioned that business plans were important for accessing external
funds but firms did not always keep these updated because it required time and
11 Graduated, so at each category step it is greater (self-employed/zero employee; 1-9emp; 10-49 emp; 50-249 emp).12 Graduated, so at each category step it is greater (0-5 yrs; 6-10 yrs; 11-20 yrs; 20+ yrs).13 Graduated, so at each category step it is greater (no partners/directors; 1-2partners/directors; 3+ partners/directors).

40
effort and many of the smaller firms were too busy “fighting fires” in their day-to-
day operations to devote the resource required. It was also noted that business
plans will change over time especially for start-ups (e.g. due to ‘pivoting’ of their
business model). This should be expected and can be a positive development. A
further observation made was that SMEs and the lender can pull out of a deal at
the “last minute” thus being discouraged next time round.
The LSBS analysis found the reasons for discouragement to be as follows (in
order of most survey responses): avoiding additional risk; fear of rejection;
perceived high cost of finance; and length of time and amount of hassle to obtain
finance. All interviewees agreed with these reasons. However, there was surprise
that the length of time and amount of hassle to obtain finance was not higher up
the list. It was also noted that fear of rejection was a “composite” of the other
reasons. Another reason given for being discouraged related to the inability to
access co-finance in order to secure the full finance amount required.
It was also pointed out by interviewees that the attitude of the retail banks to early
stage businesses was important to take into account. In most cases they have a
corporate policy of not lending without well covered collateral. This is more acute
in some sectors (e.g. hospitality) with banks not lending regardless of the
maturity of the business.
Relationship between external funding and growth
When examining business growth, both in terms of employment and sales
turnover during the year prior to the survey and predicted for the next year, it was
highly correlated with access to external finance. Interviewees considered this to
be normal practice as those firms which have experienced actual growth or
expected to grow (and can demonstrate this with evidence e.g. future contracts,
confirmed sales pipeline) were more likely to access external finance.
The LSBS analysis found that that amongst applicant firms the number of
applications for finance was not strongly correlated with past sales growth.
Interviewees indicated that this might suggest that application success was more
related to the strength of future growth predictions than past growth record, but
more likely indicates that future growth predictions have been revised down as a
result of not receiving external finance. In addition, it was stressed that the

41
companies will not be able to grow without the “correct” funds. Therefore,
ensuring the most appropriate finance at the right stage of development was
considered important to achieving a sustainable business.
Policy implications
Potential policy implications relating to accessing external finance were explored
with the interviewees. The suggestions tended to converge around further
improvements in education/knowledge and awareness amongst SMEs and their
advisors (public and private) for finance products and providers, including:
• Better education for entrepreneurs on understanding their risk profile, the
variety of finance available and identifying finance that suits their risk
profile
• Provision of investment readiness support which targets those that need it
most – younger, smaller high growth businesses with particular attention
to ethnic-minority and women led businesses
• Guidance and tools to smaller/younger businesses to improve their
financial management.
4. CONCLUSIONS AND RECOMMENDATIONS
This final section presents a synthesis of the key findings for each element of the
research into access to external finance by UK SMEs surveyed in the LSBS
2015.
The research addresses key findings from the LSBS and provides
recommendation for future data collection and further research as well as
providing important recommendation for policymakers. From a policy perspective
the main findings suggest that government ought to complement its efforts on the
external financing supply side by stimulating the demand-side for finance to
ensure that quality propositions are put in front of investors. This will require
improved eco-system support through capacity development amongst business
advisors, a better join-up in the business support landscape, and enhanced
provision and take-up of investor readiness support (SQW, 2016; Baldock et al.
42
2015).
4.1 Key findings
4.1.1 Association between external financing and growth
There is widespread consensus between the descriptive analytical evidence from
the LSBS 2015 and the qualitative business finance support provider interviews
that obtaining external finance is highly significantly associated with SME growth.
This finding supports many studies which indicate that SME growth is associated
with access to external finance and particularly in relation to innovative potential
high growth SMEs (e.g. Lerner, 2010; North et al. 2013).
4.1.2 UK SME demand for external finance
Over one third (36%) of surveyed SMEs had sought external finance during the
past 5 years and all were using external finance of some sort.
Almost one fifth (19%) of surveyed SMEs had sought external finance in the last
year: mostly relating to bank finance in the form of bank loans (43%) and
overdrafts (42%) and credit card finance (51%), but also including leasing (36%),
factoring (9%), grants (7%), equity (6.5%), P2P (4%).
A high proportion of external finance was sought for working capital cash-flow
(51%) and equipment (42%), whereas only small proportions were designated
specifically as growth (7%) and R&D (3%) finance.
The median level of funding received was £75,000: over a quarter (27%)
obtained under £25,000, almost one third (32%) received between £100,000 and
£1m and one eighth (13%) received over £1m.
The majority (62%) only applied once, with one fifth applying three or more times.
There is an indication that persistence pays and that the vast majority of
applicants do obtain at least some external financing: 83% received at least
some funding, 11% were still in transaction and only 6% received nothing.
The amounts and types of finance sought were in-line with previous SBS findings
(SBS, 2014), but with an increasing trend towards alternative P2P and equity
finance. However, as the qualitative research suggested from a potential high
43
growth SME perspective the amount of external funding and level of R&D
investment required was low. This reflected both the more generic SME
representative nature of the LSBS and also the lack of data collection on R&D tax
incentives. It was also felt that the survey is not reflecting the extent of alternative
financing (e.g. P2P) being used.
4.1.3 Key factors relating to access to external finance
Who applies for external funding?
Larger SMEs (by employment size) are more likely to apply for external finance.
Firms that have greater perceived capability to access external financing are also
more likely to make applications for external finance. Additionally, SMEs with
three or more partners/directors are more likely to apply for external finance.
However, younger SMEs established for 5 years or less are also more likely to
apply for finance. These conclusions reflect segments of SMEs that have the
greatest capacity and/or the greatest need.
Capital intensive sectors such as primary (agriculture and land based activities)
and manufacturing, ethnic minority owned businesses and those in less deprived
areas are all more likely to have applied during the past 12 months (appendix
table 2).
Who gets external funding?
Larger businesses (increasingly progressively from through each broad category;
1-9 employees, 10-49 employees and 50-249 employees) are more likely to
access external finance and secure larger amounts. Conversely, the success
rates amongst younger, smaller businesses, particularly self-employed/zero
employee and those established under 5 years are poorest.
Larger businesses with stronger management resource bases are significantly
more likely to access external finance. This was the case for those with perceived
better capabilities for raising finance and having 3 or more partner/directors
(including the greater likelihood of these companies having a dedicated finance
director).
44
• SMEs in accommodation and food catering are less likely to have
obtained finance than the ones in other sectors. This finding is supported
by various studies which have indicated that this broad sector is
considered high risk by the banks (e.g. North et al. 2010).
In terms of accessing specific types of finance:
• Increased perceived capabilities of accessing external finance is
significantly associated with increased chances of obtaining loan finance,
overdrafts, equity, leasing and grant type funds.
• Firms located in the Midlands and North of England were significantly
less likely to have obtained a bank overdraft, as were women-led firms
(when compared to their male-led counterparts).
• Firms located in urban areas were significantly more likely to have
obtained loan finance than their rural counterparts.
These findings underline those of other studies which clearly indicate that
younger, less well resourced and experienced SMEs which lack financial track
records, assets and forward order books (which would enhance opportunities for
obtaining mainstream bank debt finance), longer term trust ties and bonding with
financiers (Uzzi, 1997, 1999) and experience in approaching alternative financing
(see e.g. Baldock et al. 2015) are less likely to successfully apply for external
finance and that women entrepreneurs and those in more rural and remote parts
of the UK may struggle to obtain traditional forms of finance.
LSBS descriptive analysis revealed that SMEs that used external finance finders
and advisors were significantly less successful accessing external finance and
more likely to make more applications. However, this finding was not supported
by the regression analysis or the qualitative interviews around supporting
innovative potential high growth SMEs to access external finance. This appears
consistent with the view that many younger, smaller SMEs will only resort to
external advisers once they are in distress and as a last resort.
The strength of the management team is vital in identifying and securing
appropriate types of SME finance. Younger, less experienced SME management
teams are likely to require support to identify appropriate finance from the range
of available options and also to become investment ready for their chosen source
45
of finance. Furthermore, it was felt that many of those using external advisors
were likely to be younger, inexperienced, lack management resources and
capabilities, be poorly planned and reactive. These ‘distressed’ businesses would
not be attractive to finance providers and at this late stage there are limited viable
finance options.
4.1.4 Borrower Discouragement
Just under one in ten (9%) of SMEs exhibit some form of borrower
discouragement during the 12 months prior to survey, and this includes one third
(representing 3% of all surveyed SMEs) that had applied for some funding during
this period.
The main reasons for discouragement were avoiding additional risk (20%), fear of
rejection (17%), perceived high cost of finance (13%) and length of time and
amount of hassle to obtain finance (11%). Time and bureaucratic hassle were
factors that increased for those that had applied but been unsuccessful and then
become discouraged.
There is also evidence from the LSBS 2015 that discouraged SMEs are less
growth oriented and that their growth aims may well be revised down as a result
of their discouragement – notably from experiencing initial difficulties in trying to
access external financing. Those businesses applying six or more times for
external finance in the last year reported growth aims that were similar to those
not seeking finance in this period (significantly lower than for at least partially
successful applicants). The suggestion here is that some growth oriented SMEs
would be more likely to grow faster if they could gain timely access to sufficient
external funding.
Qualitative interview evidence suggests that hassle and time in obtaining
traditional external finance from banks could be more important than the LSBS
suggests (and this increased for those who sought external finance in the last
year and then became discouraged). The hassle factor could cause some SMEs
to adjust their business model to one that could be bootstrapped and does not
require external financing. In some cases this can be a positive change but in
other cases it may result in slower and/or lower growth.

46
Regression analysis highlights the following trends amongst discouraged
borrowers:
• Firms with larger numbers of employees are less likely to be
discouraged.
• Firms with poor capabilities to raise finance – typically younger firms
established 5 years or less and those with less than three
directors/managers - are significantly more likely to be discouraged.
• Women and ethnic minority led businesses are significantly more likely
to be discouraged than their counterparts.
Qualitative evidence underlines the findings that it is younger, less experienced,
less planned and less well-resourced SME management teams that are likely to
be discouraged.
Our findings appear to be broadly in-line with Fraser's (2014) in-depth study of
discouraged bank borrowers using the UK SME Finance Monitor and 25 case
studies. A major difference appears to be the scale of discouraged SME
borrowers at 9% as opposed to Fraser's annual figure of around 4% (of the UK
SME population of 4.8m). In part, this may be explained by our broad-based
definition (discussed above) which includes businesses that had previously
applied for finance during the annual period of study (2015) and inclusion of all
types of external finance, rather than just bank finance (which Fraser calls for). In
terms of the types of SMEs that are most likely to be discouraged we find similar
characteristics involving smaller, younger SMEs with less experienced
managers. Whilst our research finds a link between struggling businesses and
discouragement, building on Fraser's work the UK LSBS may be improved with
regard to establishing the credit worthiness (ratings) of discouraged SMEs.
4.2 Policy Recommendations
In summary we make 5 policy recommendations which are further detailed
below:
1. Better education for entrepreneurs on understanding their risk profile, the

47
variety of finance available and identifying finance that suits their risk
profile
2. Provision of investment readiness support which targets those that need it
most – younger, smaller high growth businesses with particular attention
to ethnic-minority, women-led and rural businesses.
3. Guidance and tools to smaller/younger businesses to improve their
financial management and business development
4. Improve the all around financing ecosystem integrating entrepreneurial
support with a full range of suitable financing along the finance escalator.
5. Enhancing existing datasets to provide more granular analysis of key
factors in the future (see LSBS data recommendations).
1. Entrepreneurial Education: More needs to be done to educate
entrepreneurs, particularly those that are inexperienced in accessing finance,
about the range and suitability of all forms of financing particularly new emerging
forms of P2P, equity (e.g. government VC, angel and crowd funding) and
mezzanine.
2. Investment Readiness: Ensure that investment readiness support is targeted
at younger, less experienced SME entrepreneurs and that such services are
attractive and available to women-led, and rural enterprises. Furthermore, a great
deal more could be done to raise awareness of the value of financial planning
and the suitability of alternative sources of finance to young, first time and
inexperienced entrepreneurs in terms of accessing external finance.
3. Financial Management and business development: Improve financial
management skills to facilitate better knowledge and ability to consider different
business financing models and approaches which could enable quicker decision
making and deliver better growth prospects for these businesses. Furthermore,
ensure that financing is linked to ongoing financial management and business
development (e.g. through assisting sales and marketing and addressing ongoing
external financing requirements).
external financing requirements).

48
4. Improve business financing networks and finance escalator: It is
imperative that a suitable external financing escalator (with available funding
types at appropriate stages of SME growth and development – e.g. see Nesta,
2009; Baldock and Mason, 2015) and financing ecosystem is developed which
includes appropriate education and support for entrepreneurs (see Mason and
Kwok, 2010) and sufficiently well informed networked between entrepreneurs,
intermediary advisors and financiers (Lerner, 2010; Hwang and Horrowitt, 2012)
to overcome potential demand-side failures in entrepreneurs knowledge and
decision making and facilitates greater realisation of SME growth potential.
4.3 LSBS data recommendations
The LSBS 2015 has provided considerably enhanced scale and explanatory
powers when compared to previous SBS surveys. However, in order to facilitate
further research and achieve more out of the longitudinal study over its duration
over the next four years, the following recommendations are presented to
enhance existing datasets to provide more granular analysis of key factors in the
future:
1. The relationship between financial planning and discouragement could be
explored further in more depth in future LSBS surveys, including how businesses
pivot and adapt to lack of external financing and the extent to which this stunts
potential growth, as opposed to strengthens the eventual business model.
2. The current data collection by the LSBS makes it very difficult to calculate (i)
whether businesses receive all of the external funding that they required and
potentially more importantly (ii) the extent of shortfall in required external funding.
More precise sets of questions would enable more accurate analysis.
Furthermore, the collection of R&D tax incentive (tax credits) data might provide
a greater indication of the extent of R&D financing required.
3. Even with the expanded size of the current survey, there is insufficient data to
conduct a robust examination of the financing requirements of young potential
high growth SMEs and aspects of equity and new alternative financing such as
P2P, reward/donation and equity crowd funding. This can only be achieved by
additional bolt-on sampling.

49
4. It is important that the LSBS is able to ascertain what type and source of
external financing advice and assistance was received. This could refer simply to
bank managers, to more specifically tasked specialist finance finders. Also the
length of time of using the external financing service could prove instructive, in
terms of whether there is a trusted relationship.

50
REFERENCES
Baldock R, Deakins D and Savic M (2015) Finance pathways for innovative
SMEs: the new UK
finance escalator. In: Paper to the Institute of Small business and
Entrepreneurship conference,
Glasgow: Strathclyde University, 11–12 November.
Baldock R and Mason C (2015) UK government equity schemes, post GFC: the
roles of the Enterprise
Capital Funds and angel co-investment fund in the new UK finance escalator.
Venture Capital 17(1–2): 59–86.
Barney, J. (1991) Firm Resources and Sustained Competitive Advantage.
Journal of Management
17 (1): 99–120
BIS (2015) Small Business Survey 2014: SME Employers. Department for
Business Innovation and Skills Research Paper 214, March
Fraser S (2014) Back to Borrowing? Perspectives on the 'Arc of
Discouragement'. ESRC White Paper No. 8, March
Hwang, V. W., and G. Horowitt. (2012) The Rainforest: The Secret to Building the
Next Silicon
Valley. California, CA: Regenwald.
Lerner, J. (2010) The Future of Public Efforts to Boost Entrepreneurship and
Venture Capital.
Small Business Economics 35 (3): 255–264. doi:10.1007/s11187-010-9298-z.
Mason CM and Kwok K (2010) Investment readiness programmes and access to
finance: a critical review of design issues. Local Economy 25(4): 269–292
NESTA (2009a) From funding gaps to thin markets: UK Government support for
early-stage venture
capital. BVCA report for NESTA, London, TM/28, September.
North D. Baldock R and Ekanem I (2010) Is there a debt finance gap relating to
Scottish SMEs? A demand-side perspective. Venture Capital 12 (3) 173-192
SQW (2016) Viewpoint: The Role of Policy in SME Finance: Demand-side
Perspectives. Report by Anwar O and Cook J, September
http://www.sqw.co.uk/insights-and-publications/the-role-of-policy-in-sme-finance-

51
demand-side-perspectives/
Uzzi, B (1997) Social Structure and Competition in Interfirm Networks: The
Paradox of Embeddedness, Administrative Science Quarterly, 42(1): 35-67
Uzzi, B. (1999) Embeddedness in the making of financial capital: How social
relations and networks benefit firms seeking financing, American Sociological
Review: 481-505

52
Annex 1: Regression Tables
1.1 Obtained at least some external finance Aggregate Model
B S.E. Exp(B)
Use of information/advice -0.380 0.232 0.684
Number of partners
Number of partners(0) 0.210 0.312 1.234
Number of partners(1-2) -0.114 0.205 0.892
Capabilities
Capabilities poor- -1.131**** 0.212 0.323
Capabilities average -0.700*** 0.203 0.496
New regions
Midlands -0.261 0.556 0.770
South -0.425 0.522 0.654
London -0.696 0.555 0.499
North -0.607 0.528 0.545
Scotland -0.227 0.586 0.797
Wales -0.902 0.636 0.406
Family Business -0.189 0.207 0.828
A2. Number of employees
A2. Number of employees (0) -1.247**** 0.296 0.287
A2. Number of employees (1-9) -0.4756* 0.258 0.622
A2. Number of employees (10-49) -0.406* 0.227 0.666
A3/A4. Sector
A3/A4. Sector (Primary) 0.277 0.589 1.319
A3/A4. Sector (Manufacturing) 0.035 0.529 1.036
A3/A4. Sector (Construction) -0.124 0.549 0.884
A3/A4. Sector (Wholesale/Retail) 0.238 0.530 1.269
A3/A4. Sector (Transport) -0.566 0.645 0.568
A3/A4. Sector (Accommodation/Food) -1.089** 0.531 0.337
A3/A4. Sector (Infocomms) -0.057 0.558 0.944
A3/A4. Sector (Finance/Real State) -0.463 0.583 0.630
A3/A4. Sector (Professional) 0.157 0.507 1.170
A3/A4. Sector (Administration) -0.319 0.539 0.727
A3/A4. Sector (Education) -0.784 0.565 0.457
A3/A4. Sector (Health) -0.633 0.491 0.531
A3/A4. Sector (Arts) 0.761 0.771 2.141
A6. Age of business - summary
A6. Age of business (0-5 years) 0.349 0.265 1.417
A6. Age of business (6-10 years) -0.120 0.256 0.887
A6. Age of business (11-20 years) -0.139 0.237 0.871
Broad urban/rural categorisation from postcode -0.256 0.208 0.774
Businesses located in the most deprived 15% of the country 0.032 0.267 1.033
Whether business is women-led 0.153 0.211 1.166
Whether business is MEG-led 0.380 0.316 1.463
Constant 2.946**** 1.110 19.031
-2LL 993.12
χ2=107, df=35, p<0.001 Nagelkerke R2 13.80%Hosmer & Lemeshow test p=0.720Classification accuracy 85.60%
**** p<0.001
*** p<0.01
** p<0.05
* p<0.1

53
1.2 Obtained at least some external finance Bank Overdraft
B S.E. Exp(B)
Use of information/advice 0.176 0.360 1.192Number of partnersNumber of partners(0) 0.356 0.705 1.427Number of partners(1-2) -0.261 0.329 0.770CapabilitiesCapabilities poor- -2.236**** 0.324 0.107Capabilities average -0.467 0.350 0.627New regionsMidlands -1.936** 0.886 0.144South -1.628* 0.853 0.196London -1.767* 0.928 0.171North -1.832** 0.872 0.160Scotland -1.163 0.962 0.313Wales -1.819 1.134 0.162Family Business -0.563* 0.327 0.570A2. Number of employeesA2. Number of employees (0) -0.765 0.502 0.465A2. Number of employees (1-9) -0.341 0.409 0.711A2. Number of employees (10-49) 0.398 0.367 1.488A3/A4. SectorA3/A4. Sector (Primary) -0.011 1.129 0.989A3/A4. Sector (Manufacturing) -1.710* 0.961 0.181A3/A4. Sector (Construction) -1.759* 0.998 0.172A3/A4. Sector (Wholesale/Retail) -0.882 0.979 0.414A3/A4. Sector (Transport) -1.254 1.255 0.285A3/A4. Sector (Accommodation/Food) -2.241** 0.988 0.106A3/A4. Sector (Infocomms) -0.895 1.025 0.408A3/A4. Sector (Finance/Real State) -0.322 1.462 0.724A3/A4. Sector (Professional) -0.161 0.981 0.851A3/A4. Sector (Administration) -1.362 0.988 0.256A3/A4. Sector (Education) -0.445 1.266 0.641A3/A4. Sector (Health) -0.835 1.034 0.434A3/A4. Sector (Arts) -0.877 1.259 0.416A6. Age of business - summaryA6. Age of business (0-5 years) -0.467 0.363 0.627A6. Age of business (6-10 years) 0.200 0.438 1.221A6. Age of business (11-20 years) 0.460 0.429 1.585Broad urban/rural categorisation from postcode 0.279 0.331 1.322Businesses located in the most deprived 15% of the country -0.546 0.409 0.579Whether business is women-led -0.767** 0.339 0.464Whether business is MEG-led -0.183 0.519 0.833Constant 2.484 1.315 201.439
-2LL 403.548
χ2=129, df=35, p<0.001 Nagelkerke R2 33.60%Hosmer & Lemeshow test p=0.911Classification accuracy 85.00%
**** p<0.001*** p<0.01** p<0.05* p<0.1

54
1.3 Obtained at least some external financeEquity Finance
B S.E. Exp(B)Use of information/advice 0.867 0.721 2.379
Number of partners
Number of partners(0) 18.666 21444.172 127865480
Number of partners(1-2) 0.234 0.697 1.264
Capabilities
Capabilities poor- -2.188*** 0.903 0.112
Capabilities average -2.645*** 0.912 0.071
New regions
Midlands -21.130 40192.953 0.000
South -20.433 40192.953 0.000
London -20.985 40192.953 0.000
North -22.334 40192.953 0.000
Scotland -21.520 40192.953 0.000
Wales -19.765 40192.953 0.000
Family Business 0.221 0.727 1.247
A2. Number of employees
A2. Number of employees (0) -1.626 1.058 0.197
A2. Number of employees (1-9) 0.137 1.057 1.146
A2. Number of employees (10-49) 0.781 1.022 2.184
A3/A4. Sector
A3/A4. Sector (Primary) -1.978 2.465 0.138
A3/A4. Sector (Manufacturing) 0.577 2.302 1.781
A3/A4. Sector (Construction) -1.116 2.367 0.328
A3/A4. Sector (Wholesale/Retail) 1.616 2.279 5.030
A3/A4. Sector (Transport) 19.686 21610.850 354519175
A3/A4. Sector (Accommodation/Food) -0.027 2.422 0.974
A3/A4. Sector (Infocomms) 0.170 2.201 1.186
A3/A4. Sector (Finance/Real State) -0.001 2.348 0.999
A3/A4. Sector (Professional) 0.771 2.324 2.162
A3/A4. Sector (Administration) 1.108 2.665 3.030
A3/A4. Sector (Education) 19.276 40192.970 235162062
A3/A4. Sector (Health) 0.714 2.612 2.042
A3/A4. Sector (Arts) - - -
A6. Age of business - summary
A6. Age of business (0-5 years) -1.101 0.838 0.332
A6. Age of business (6-10 years) 0.535 1.397 1.708
A6. Age of business (11-20 years) -0.814 0.938 0.443
Broad urban/rural categorisation from postcode 0.997 0.808 2.711
Businesses located in the most deprived 15% of the country -0.028 1.198 0.972
Whether business is women-led 0.577 0.988 1.781
Whether business is MEG-led -0.985 1.098 0.374
Constant 21.928 40192.953 30434847171
-2LL 90χ2=17, df=8, p<0.1
Nagelkerke R2 47.80%Hosmer & Lemeshow test p=0.025Classification accuracy 82.30%
**** p<0.001
*** p<0.01
** p<0.05
* p<0.1

55
1.4 Obtained at least some external finance Leasing/HP
B S.E. Exp(B)Use of information/advice 0.521 0.630 1.68Number of partnersNumber of partners(0) -1.657* 0.944 0.19Number of partners(1-2) -0.058 0.522 0.94CapabilitiesCapabilities poor- -1.443*** 0.548 0.24Capabilities average -0.142 0.588 0.87New regionsMidlands -18.427 8615.840 0.00South -19.169 8615.840 0.00London -17.357 8615.840 0.00North -18.641 8615.840 0.00Scotland -18.039 8615.840 0.00Wales -18.286 8615.840 0.00Family Business 0.264 0.606 1.302A2. Number of employeesA2. Number of employees (0) -0.834 0.921 0.43A2. Number of employees (1-9) -0.462 0.663 0.63A2. Number of employees (10-49) 0.423 0.618 1.53A3/A4. SectorA3/A4. Sector (Primary) 0.544 1.137 1.72A3/A4. Sector (Manufacturing) 0.951 1.084 2.59A3/A4. Sector (Construction) 1.147 1.183 3.15A3/A4. Sector (Wholesale/Retail) 1.324 1.162 3.76A3/A4. Sector (Transport) 18.943 7740.043 168583321A3/A4. Sector (Accommodation/Food) -0.837 1.086 0.43A3/A4. Sector (Infocomms) 0.575 1.535 1.78A3/A4. Sector (Finance/Real State) 19.293 10751.521 239164728A3/A4. Sector (Professional) 1.306 1.053 3.69A3/A4. Sector (Administration) 0.411 1.110 1.51A3/A4. Sector (Education) 20.110 9985.350 541358822A3/A4. Sector (Health) 1.605 1.382 4.98A3/A4. Sector (Arts) 19.326 9271.369 247187417A6. Age of business - summaryA6. Age of business (0-5 years) -0.212 0.655 0.81A6. Age of business (6-10 years) -0.171 0.864 0.84A6. Age of business (11-20 years) 0.068 0.663 1.07Broad urban/rural categorisation from postcode 0.035 0.534 1.036Businesses located in the most deprived 15% of the country 0.716 0.952 2.045Whether business is women-led -0.611 0.622 0.543Whether business is MEG-led -0.473 1.016 0.623Constant 20.696 8615.841 973102521
-2LL 164.586χ2=54, df=35, p<0.05
Nagelkerke R2 29.20%Hosmer & Lemeshow test p=0.404Classification accuracy 94.60%
**** p<0.001*** p<0.01** p<0.05* p<0.1

56
1.5 Obtained at least some external finance Loans
B S.E. Exp(B)Use of information/advice 0.463 0.310 1.589
Number of partners
Number of partners(0) 0.172 0.548 1.188
Number of partners(1-2) -0.021 0.256 0.979
Capabilities
Capabilities poor- -2.092**** 0.287 0.124
Capabilities average -0.797*** 0.278 0.451
New regions
Midlands 0.121 0.618 1.129
South -0.063 0.558 0.939
London -0.489 0.625 0.613
North 0.110 0.581 1.116
Scotland -0.213 0.634 0.808
Wales -0.583 0.789 0.558
Family Business 0.235 0.277 1.265
A2. Number of employees
A2. Number of employees (0) -0.255 0.433 0.775
A2. Number of employees (1-9) -0.566* 0.326 0.568
A2. Number of employees (10-49) -0.489* 0.292 0.613
A3/A4. Sector
A3/A4. Sector (Primary) 1.263 0.867 3.535
A3/A4. Sector (Manufacturing) 0.145 0.796 1.156
A3/A4. Sector (Construction) 0.068 0.815 1.070
A3/A4. Sector (Wholesale/Retail) 0.747 0.801 2.111
A3/A4. Sector (Transport) 0.059 1.061 1.061
A3/A4. Sector (Accommodation/Food) -0.817 0.819 0.442
A3/A4. Sector (Infocomms) -0.434 0.853 0.648
A3/A4. Sector (Finance/Real State) 0.119 0.900 1.127
A3/A4. Sector (Professional) 0.778 0.793 2.177
A3/A4. Sector (Administration) -0.025 0.844 0.975
A3/A4. Sector (Education) -0.204 0.915 0.816
A3/A4. Sector (Health) -0.090 0.829 0.914
A3/A4. Sector (Arts) -0.944 0.994 0.389
A6. Age of business - summary
A6. Age of business (0-5 years) 0.025 0.345 1.025
A6. Age of business (6-10 years) 0.041 0.364 1.042
A6. Age of business (11-20 years) 0.067 0.306 1.069
Broad urban/rural categorisation from postcode 0.636*** 0.265 1.889
Businesses located in the most deprived 15% of the country 0.594 0.406 1.811
Whether business is women-led -0.152 0.329 0.859
Whether business is MEG-led -0.118 0.413 0.888
Constant 0.881 1.534 2.413
-2LL 556.798χ2=130, df=35, p<0.001
Nagelkerke R2 29.20%Hosmer & Lemeshow test p=0.220Classification accuracy 76.90%
**** p<0.001
*** p<0.01
** p<0.05
* p<0.1
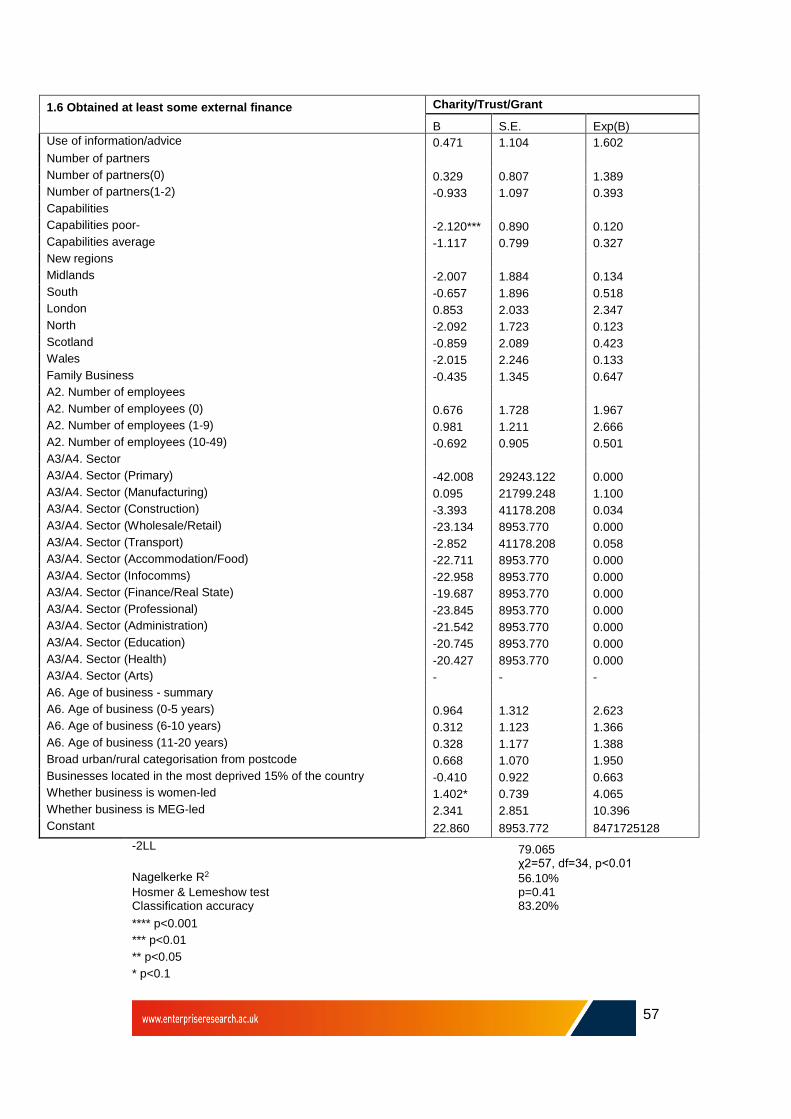
57
1.6 Obtained at least some external finance Charity/Trust/Grant
B S.E. Exp(B)Use of information/advice 0.471 1.104 1.602
Number of partners
Number of partners(0) 0.329 0.807 1.389
Number of partners(1-2) -0.933 1.097 0.393
Capabilities
Capabilities poor- -2.120*** 0.890 0.120
Capabilities average -1.117 0.799 0.327
New regions
Midlands -2.007 1.884 0.134
South -0.657 1.896 0.518
London 0.853 2.033 2.347
North -2.092 1.723 0.123
Scotland -0.859 2.089 0.423
Wales -2.015 2.246 0.133
Family Business -0.435 1.345 0.647
A2. Number of employees
A2. Number of employees (0) 0.676 1.728 1.967
A2. Number of employees (1-9) 0.981 1.211 2.666
A2. Number of employees (10-49) -0.692 0.905 0.501
A3/A4. Sector
A3/A4. Sector (Primary) -42.008 29243.122 0.000
A3/A4. Sector (Manufacturing) 0.095 21799.248 1.100
A3/A4. Sector (Construction) -3.393 41178.208 0.034
A3/A4. Sector (Wholesale/Retail) -23.134 8953.770 0.000
A3/A4. Sector (Transport) -2.852 41178.208 0.058
A3/A4. Sector (Accommodation/Food) -22.711 8953.770 0.000
A3/A4. Sector (Infocomms) -22.958 8953.770 0.000
A3/A4. Sector (Finance/Real State) -19.687 8953.770 0.000
A3/A4. Sector (Professional) -23.845 8953.770 0.000
A3/A4. Sector (Administration) -21.542 8953.770 0.000
A3/A4. Sector (Education) -20.745 8953.770 0.000
A3/A4. Sector (Health) -20.427 8953.770 0.000
A3/A4. Sector (Arts) - - -
A6. Age of business - summary
A6. Age of business (0-5 years) 0.964 1.312 2.623
A6. Age of business (6-10 years) 0.312 1.123 1.366
A6. Age of business (11-20 years) 0.328 1.177 1.388
Broad urban/rural categorisation from postcode 0.668 1.070 1.950
Businesses located in the most deprived 15% of the country -0.410 0.922 0.663
Whether business is women-led 1.402* 0.739 4.065
Whether business is MEG-led 2.341 2.851 10.396
Constant 22.860 8953.772 8471725128
-2LL 79.065χ2=57, df=34, p<0.01
Nagelkerke R2 56.10%Hosmer & Lemeshow test p=0.41Classification accuracy 83.20%
**** p<0.001
*** p<0.01
** p<0.05
* p<0.1
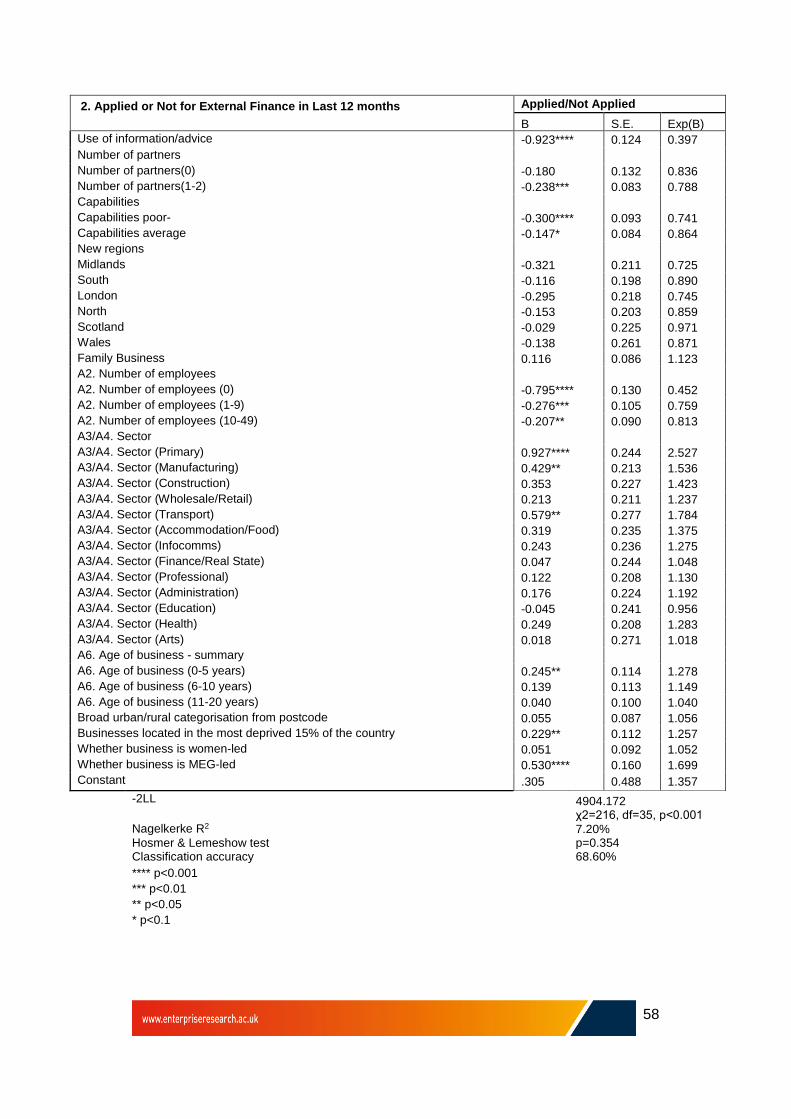
58
2. Applied or Not for External Finance in Last 12 months Applied/Not Applied
B S.E. Exp(B)Use of information/advice -0.923**** 0.124 0.397
Number of partners
Number of partners(0) -0.180 0.132 0.836Number of partners(1-2) -0.238*** 0.083 0.788Capabilities
Capabilities poor- -0.300**** 0.093 0.741Capabilities average -0.147* 0.084 0.864New regions
Midlands -0.321 0.211 0.725South -0.116 0.198 0.890London -0.295 0.218 0.745North -0.153 0.203 0.859Scotland -0.029 0.225 0.971Wales -0.138 0.261 0.871Family Business 0.116 0.086 1.123A2. Number of employees
A2. Number of employees (0) -0.795**** 0.130 0.452A2. Number of employees (1-9) -0.276*** 0.105 0.759A2. Number of employees (10-49) -0.207** 0.090 0.813A3/A4. Sector
A3/A4. Sector (Primary) 0.927**** 0.244 2.527A3/A4. Sector (Manufacturing) 0.429** 0.213 1.536A3/A4. Sector (Construction) 0.353 0.227 1.423A3/A4. Sector (Wholesale/Retail) 0.213 0.211 1.237A3/A4. Sector (Transport) 0.579** 0.277 1.784A3/A4. Sector (Accommodation/Food) 0.319 0.235 1.375A3/A4. Sector (Infocomms) 0.243 0.236 1.275A3/A4. Sector (Finance/Real State) 0.047 0.244 1.048A3/A4. Sector (Professional) 0.122 0.208 1.130A3/A4. Sector (Administration) 0.176 0.224 1.192A3/A4. Sector (Education) -0.045 0.241 0.956A3/A4. Sector (Health) 0.249 0.208 1.283A3/A4. Sector (Arts) 0.018 0.271 1.018A6. Age of business - summary
A6. Age of business (0-5 years) 0.245** 0.114 1.278A6. Age of business (6-10 years) 0.139 0.113 1.149A6. Age of business (11-20 years) 0.040 0.100 1.040Broad urban/rural categorisation from postcode 0.055 0.087 1.056Businesses located in the most deprived 15% of the country 0.229** 0.112 1.257Whether business is women-led 0.051 0.092 1.052Whether business is MEG-led 0.530**** 0.160 1.699Constant .305 0.488 1.357
-2LL 4904.172χ2=216, df=35, p<0.001
Nagelkerke R2 7.20%Hosmer & Lemeshow test p=0.354Classification accuracy 68.60%
**** p<0.001
*** p<0.01
** p<0.05
* p<0.1

59
3. Discouraged from Applying for External Finance inLast 12 Months
Discouraged/not discouraged
B S.E. Exp(B)Use of information/advice 0.365 0.316 1.440
Number of partners
Number of partners(0) -0.436 0.350 0.646
Number of partners(1-2) -0.017 0.233 0.983
Capabilities
Capabilities poor- -0.901**** 0.243 0.406
Capabilities average -0.337 0.237 0.714
New regions
Midlands 0.552 0.595 1.736
South 0.350 0.545 1.419
London 0.513 0.591 1.670
North 0.511 0.560 1.667
Scotland 0.505 0.620 1.657
Wales -0.368 0.759 0.692
Family Business 0.294 0.241 1.342
A2. Number of employees
A2. Number of employees (0) -0.835** 0.365 0.434
A2. Number of employees (1-9) -0.420 0.310 0.657
A2. Number of employees (10-49) -0.593** 0.279 0.553
A3/A4. Sector
A3/A4. Sector (Primary) 1.119* 0.670 3.062
A3/A4. Sector (Manufacturing) -0.294 0.563 0.746
A3/A4. Sector (Construction) 0.045 0.556 1.046
A3/A4. Sector (Wholesale/Retail) 0.230 0.513 1.259
A3/A4. Sector (Transport) -0.065 0.875 0.937
A3/A4. Sector (Accommodation/Food) 0.193 0.593 1.213
A3/A4. Sector (Infocomms) -0.067 0.571 0.935
A3/A4. Sector (Finance/Real State) 0.041 0.650 1.042
A3/A4. Sector (Professional) -0.159 0.520 0.853
A3/A4. Sector (Administration) 0.538 0.576 1.712
A3/A4. Sector (Education) -0.293 0.638 0.746
A3/A4. Sector (Health) -0.078 0.504 0.925
A3/A4. Sector (Arts) 0.516 0.670 1.676
A6. Age of business - summary
A6. Age of business (0-5 years) -0.660** 0.294 0.517
A6. Age of business (6-10 years) -0.582* 0.313 0.559
A6. Age of business (11-20 years) -0.205 0.271 0.815
Broad urban/rural categorisation from postcode -0.197 0.243 0.821
Businesses located in the most deprived 15% of the country 0.355 0.321 1.426
Whether business is women-led -0.506** 0.247 0.603
Whether business is MEG-led -0.796** 0.400 0.451
Constant 0.152 1.262 1.164
-2LL 652.972χ2=81, df=35, p<0.001
Nagelkerke R2 18.80%Hosmer & Lemeshow test p=0.474Classification accuracy 66.80%
**** p<0.001 *** p<0.01
** p<0.05 * p<0.1

60
Centre ManagerEnterprise Research Centre
Aston Business SchoolBirmingham, B1 7ET
Centre ManagerEnterprise Research Centre
Warwick Business SchoolCoventry, CV4 7AL