Embed Size (px)
Citation preview

BROOKINGS | July 2010 1
Export Nation: How U.S. Metros Lead National Export Growth and Boost CompetitivenessEmilia Istrate, Jonathan Rothwell, and Bruce Katz
“ To reset its eco-
nomic trajectory,
the United States
needs to connect
the macroeco-
nomic goal of
increasing ex-
ports with the
metropolitan
reality of export
production.”
FindingsAn analysis of the location of production of U.S. exports, particularly in the nation’s 100 largest metro areas in 2008, and between 2003 and 2008 reveals that:n Increasing the nation’s exports holds out the potential of generating a significant number
of good-paying jobs in the United States. All told, U.S. exports supported 11.8 million jobs nationally and 7.7 million jobs in the top 100 metro areas in 2008. These jobs amounted to 8.3 percent of the nation’s employment and 8.1 percent of all employment in the largest 100 metros in 2008. These are direct jobs in companies that sell abroad and, to some extent, indirect jobs in firms that are part of the supply chain of exporting companies.
n The largest 100 metropolitan areas produce most of the nation’s exports. Home to 65 percent of the nation’s population, the 100 largest metropolitan areas produced an esti-mated 64 percent of U.S. exports in 2008, including 62 percent of U.S. manufactured goods and 75 percent of services. Export activity is highly concentrated. The 10 metropolitan areas with the highest value of exports produced about 43 percent of all the top 100 metro areas’ exports in 2008, even though they contain just 38 percent of the population.
n Strong manufacturing and patent producing metropolitan areas generate the highest shares of exports from their output. Manufacturing industries are the most export oriented, so metropolitan areas that specialize in manufacturing tend to export the largest shares of their GMP. Export-oriented metropolitan areas are also significantly more innovative, as defined by their rate of patent production. This may be explained by existing evidence that more innovative firms are more likely to export internationally and that activity reinforces innovation through competition.
n Four metropolitan areas doubled the real value of their exports between 2003 and 2008. Houston doubled exports largely through sales of chemicals, while Wichita, KS doubled exports based on its powerful aviation cluster. Computer and electronics led the doubling of Portland’s exports. New Orleans also doubled the value of its exports over the period, driven largely by oil refining.
n Export intensive industries pay higher wages than domestic oriented industries in large metropolitan areas. In an analysis of the 94 of the largest 100 metropolitan areas, for every $1 billion in exports of a metro area industry, workers in that industry earn roughly 1 to 2 per-cent higher wages. Even those exporting industry workers without high school diplomas earn a higher wage. This wage effect can be seen even adjusting for worker characteristics, occupa-tion, or the characteristics of the metropolitan area.
n Future export growth will come increasingly from large emerging markets. Though Canada and Mexico are the nation’s two largest trading partners, U.S. exports to Brazil, India, and China (the so-called BIC countries) have been increasing rapidly during the last decade, doubling in size between 2003 and 2008. The BIC countries are expected to account for about a fifth of the global gross domestic product in 2010, surpassing the United States for the first time. The metropolitan areas that produce the largest U.S. exports to the BICs are well-positioned to take advantage of the growth of these countries.
To reset its economic trajectory, the United States needs to connect the macroeconomic goal of increasing exports with the metropolitan reality of export production. Public and private sector leaders at the metro level need to collaborate and engage actively to leverage already extant export concentrations to create good paying jobs at home.

BROOKINGS | July 20102
Introduction
In the beginning of 2010, with the U.S. economy struggling to produce output or jobs, President Obama devoted a portion of his State of the Union Address to “fixing the problems that are ham-pering our growth.” One of these problems, he said, was a lack of exports.1 The president linked an increase in exports to an increase in jobs, stating:
So tonight, we set a new goal: We will double our exports over the next five years, an increase that will support two million jobs in America. To help meet this goal, we’re launching a National Export Initiative that will help farmers and small businesses increase their exports, and reform export controls consistent with national security.2
The following March, the Obama administration released a more formal list of goals including: greater access to financing for exporters through the Export-Import Bank; more aggressive pursuit of U.S. interests in treaties and trade agreements; and an increased effort by the Foreign Commercial Service to assist U.S. firms in identifying export opportunities.
As it turns out, the doubling of exports in a five year period is extremely rare in the United States.3 In real terms, such a doubling has occurred just three times in American history and not since 1949, when exports were twice as high as they were in 1944, a very atypical period. Focusing on the ambitious nature of the goal, however, misses the larger point: Any increase in U.S. exports would benefit the nation, so the federal government is right to think about maximizing exports. More importantly, it is up to local leaders, in businesses and government, to assess their own strengths and weaknesses and address them to sell to foreign markets.
Increasing exports is one key strategy for addressing current and past structural eco-nomic deficiencies. Even before the protracted recession that soured the U.S. economy, a number of longer term problems have plagued the country: declining median wages; increasing inequality; and ample fluctuations in the business cycles. The bursting of the most recent bubble, in housing and its finance, has resulted in the most stubborn period of high unemployment since the early 1980s and perhaps, by the time it ends, the Great Depression.
If the United States is to achieve a significant surge in exports—whether a doubling or not—metropolitan areas will play a huge role. Reflecting their high concentration of the nation’s human and physical capital, metropolitan areas produce 84 percent of the nation’s exports, making them the points of leverage for scaling up trade with the wider world. The 100 largest metropolitan areas alone account for over 64 percent of the nation’s exports, including 75 percent of its service exports. Moreover, almost every large metro produces a disproportionately large share of U.S. exporting value in at least two export industries. The average large metro has roughly seven export clusters.4
Some of these metro export clusters are truly large. Exports from textile manufactur-ing as a percentage of Chattanooga, TN’s economy are almost 18 times the national average; exports from leather manufacturing in Portland, ME are 16 times larger in rela-tion to its economy than to the U.S. economy. Computer and electronics manufacturing is hugely concentrated in Portland, OR’s “Silicon Forest,” which has sales 12 times larger than the size of its economy would predict.
And yet, this distinctive role of metropolitan areas is often ignored because the nation’s political map does not correspond to its economic geography. Regional econo-mies do not stop at congressional districts or state boundaries; metropolitan statisti-cal areas, which comprise counties with residents that commute to central cities, were designed to approximate regional labor markets. Further, current measures of exports from metropolitan areas are based on origin of movement data and not production data, and services exports are neglected altogether. So to considerable extent, metropolitan leaders interested in nurturing their export clusters lack a full and accurate database of industrial export activity. One ambition of this report is to provide new data at the
What is a U.S. Export?A U.S. export is the sale of a good or service made in the United States to a person or business residing in a foreign country. To provide a common example, in 2008, 376,780 automo-biles made in the United States left the Port of New York-New Jersey des-tined for places like Germany, France, the United Kingdom, and China.
Service exports are not always as obvious. If a Canadian residing in Canada takes a trip to Rochester, NY, she generates U.S. exports to Canada for each dollar she spends in Rochester—on things like taxis, restaurants, entertainment, clothing, and lodging.
The expenditures of foreign stu-dents studying in the United States are education exports for the United States. The payments made by people and companies from outside of the United States to U.S. companies or individuals for the right to use their patents, trademarks, or copyrights are U.S. exports of royalties.
What makes something a U.S. export is not where the transaction takes place, but whether or not the buyer is outside the United States. For example, if a U.S. company sells goods or services to its subsidiary in India or to an Indian business in India, it sends U.S. exports to India in both cases.
This notion of a U.S. export focuses on international trade, which is a subset to the broader definition of an export sector or traded sector in a metro area. In regional economic development, export sectors are those that bring income into a metro area from outside of the metro area, whether domestically or internation-ally. This paper focuses on just that segment of a metro area’s export sector that sells a good or service to a foreign resident or business. n
BROOKINGS | July 2010 3
metropolitan scale in terms of where exports are produced and in what industries.Beyond that, the study describes the nation’s export landscape in detail: The first section dis-
cusses why exports matter nationally and provides some national context for the metropolitan-cen-tered discussion. Next, the study presents a summary of the methods used to generate the export estimates. The findings showcase the level and importance of exports to each of the 100 largest metros, including recent growth rates, most significant trading partners, jobs supported, and wages earned. Finally, a policy discussion is presented about what’s required to support increasing exports.
I. Background: Why Are Exports Important to the United States and Why Are Metropolitan Areas Important to Exports?
U.S. exports are goods and services that are sold in international markets (See Sidebar).5 This means two things: Competition is usually more intense, forcing greater efficiency or innovation; and the scale of the market is larger, meaning that there are more potential customers for any given product, and products can be more specialized than they would otherwise be. These two factors—competition and scale—translate into more jobs and higher wages for workers in exporting industries compared to what would be the case if the same industry did not export.6
Increasing exports relative to imports is even more advantageous when a country, like the United States, imports more than it exports. In theory, a trade deficit situation should lead to a depreciation of the currency of the country with a trade deficit, but since the United States dollar is a “reserve currency” (used as a safe investment vehicle by investors around the world) the demand for U.S. dol-lars prevents the dollar from depreciating enough to aid the reduction of the trade deficit.7
At any rate, multiple benefits can be achieved through an increase in export activity.
Exports Deliver Economic Growth and Jobs Economists have argued at least since the 18th century that trade is linked to economic growth, and there is abundant evidence in favor of the theory.8 Trade enhances growth by taking advantage of di-verse productive capacities, and by encouraging specialization and economies of scale.9 In addition, trade creates wealth even when trading partners are identical because of specialization through scale economies.10 Many products with large upfront costs (like Hollywood movies, pharmaceuticals, solar technologies, computer processing microchips) simply could never be profitable if not for vast international markets, which allow producers to amortize the costs of producing a single product via sales at scale.11
There is also evidence that exporting makes companies more competitive.12 Exporting forces com-panies to stay on the cutting edge of competition and exposes them to international best practices. Even if companies initially struggle in foreign markets, there is evidence that this intense competi-tion forces them to improve over time. For example, Taiwanese exporting firms are more likely to invest in R&D and to witness faster productivity growth regardless of R&D.13
Exporting activity generates jobs. A recent economic report from the U.S. Department of Commerce estimates that, in 2008, 10.3 million jobs were supported by the entire chain of export production, including inputs and transportation.14 The Commerce figure was produced using input-output tables, which relate an industry’s supply and demand of products to and from other indus-tries. This study estimated 11.8 million export related jobs in 2008, using a different method that multiplies the total number of jobs in an industry by the ratio of its export sales to its gross value added. Unlike the Commerce estimate, this study ignored the fact that imports are used in the pro-duction of some exports, which may explain the discrepancy.
Export-Related Jobs Offer Good Pay to Workers at All Levels of EducationWages are higher for exporting companies. Firms that produce for export markets pay more even after adjusting for the effects of firm size and capital intensity, even within the same industry.15 Other research finds that in the 1990s wages were roughly 11 percent higher for exporting companies, adjusting for industry and state location, for both production and non-production workers.16

BROOKINGS | July 20104
This export effect does not exclude the distributional consequences of import competition, when considering trade overall. Trade between countries with different skill distributions (i.e. the United States and China) can harm unskilled workers in the more developed country, even as overall living standards are enhanced.17 This distributional problem can be partially resolved by spending a share of the gains from trade on those who lose out (such as unemployment insurance and retraining programs for displaced workers).
Exports Could Contribute to the Rebalancing of the U.S. Economy and a Lower Trade DeficitFor the most of the last 20 years, the United States has witnessed strong economic growth and low unemployment in comparison with other developed countries.18 Yet, the U.S. economy was affected by the wide fluctuations at the end of two business cycles, the so called IT bubble of the late 1990s and the housing bubble that ended between sometime during 2006 and 2007. Meanwhile, in 2006 house-hold income inequality reached its post-World War II peak.19 Real median income in 2008 fell below 1999 levels.20 These three conditions—a tepid rise in living standards, increasing inequality, and bubble economies—are embedded in the consumption driven American economy.
In 1982, U.S. residents spent 86 cents of every dollar of after-tax income, but the intensity of con-sumption grew steadily such that by 2005, that share had reached 95 cents of every dollar.21 All this spending depleted savings, which dropped precipitously over the time period from over 10 percent in the early 1980s to just 1.7 percent in 2005.22 At the same time, an increasing share of consumption involved the purchase of imports. While the value of U.S. total imports was eight percent higher than the value of U.S. total exports in 1982, by 2005, the difference was 36 percent, the highest gap since 1960.23
With minimal household savings, domestic investment declined over the last two decades relative to the size of the economy. The United States invested about 7.3 percent of GDP in the 2000s, much less than the 9.4 percent rate of the 1970s.24 Moreover, from 2000 to 2007, private manufacturing invest-ment as a share of GDP was just 0.26 percent per year compared to 0.37 percent during the 1990s. At the same time, foreign investment compensated to some extent, though more in the real estate sector. For example, Chinese holdings represented 6 percent of all federal agency debt and 29 percent of foreign-held agency debt in 2007, making China the largest foreign holder of Fannie Mae and Freddie Mac debt.25
The externalization of risk is another major problem with trade deficits. A large portion of the dol-lars spent on imports end up being re-invested back into the United States and that process increases the risk of bubbles. No sector can sustain limitless growth, and as the safest and most valuable invest-ments become saturated with funding, the excess liquidity begins to seep into riskier and riskier propo-sitions like no-income-no-asset subprime mortgage derivatives. The economists Joshua Aizenman and Yothin Jinjarak have shown that current account deficits have coincided with and contributed to rapid housing price appreciation across OECD countries between 1990 and 2005.26
While the United States based its growth on private consumption over the last three decades, the other developed countries exploited foreign demand. Over the last 30 years, private consumption, as a share of GDP, increased by seven percentage points in the United States, while total exports grew by only two percentage points. The other large developed countries, Canada, France, Germany, Italy, Japan, and the United Kingdom, maintained an almost constant share of private spending, but increased their share of total exports in GDP by seven percentage points.28 In 2008, the U.S. total exports were only 12.7 of domestic production, in comparison with 29.7 percent in the other large developed countries. Moreover, as a recent Brookings report shows, this underperformance is not entirely explained by the size of the U.S. economy and its distance from trading partners.
There are a number of potential explanations for why the United States under-exports. First, the dol-lar is over-valued relative to the currencies of a number of important U.S. trading partners.29 In addi-tion, U.S. companies have been focused on catering to the large and growing U.S market. About one percent of U.S. companies exported in 2008.30 It seems that many small and medium companies lack information regarding exports and perceive exporting as a risky endeavor.31 Finally, many countries still put up significant trade barriers against U.S. companies. In the absence of free trade agreements with emerging countries, U.S. companies had additional incentives to locate production abroad in order to
BROOKINGS | July 2010 5
take advantage of these foreign markets. For example, while nominal total exports grew by 10 percent annually between 1994 and 2007, nominal sales of U.S. affiliates located in foreign countries increased by almost 18 percent a year during the same period.32
Whatever the reasons why the United States is less export-oriented than other countries, increasing exports relative to imports can be part of the solution to many long-standing difficulties.
A Profile of Exports in the United StatesThe United States exported 1.8 trillion dollars in 2008 in total, out of which 1.6 trillion were domestic goods and private services. 69.9 percent of the 1.6 trillion exports were goods produced in the United States and 28.8 percent came from private services. Total exports from the United States grew 46 percent over the previous five years, double the import growth rate, in real terms.33 Overall, in 2008, the United States ranked third in the world in terms of goods exports and first in terms of service exports.34 American companies, such as General Electric, are the generators of these exports (See Sidebar).35
Though still a major exporter in terms of sheer value, the United States has been losing ground in terms of its share of goods exports, as one would expect based on the rapid economic growth of many developing countries. In 1948, the United States pro-duced roughly 21.7 percent of the world’s goods exports, but 60 years later that share dropped to 8.2 percent. Over the last five years, products made in China, India, Brazil, and the Middle East have made up an increasing share of world goods exports.36
Accompanying the decline in U.S. dominance in goods exporting is the steady rise of service exports from the United States. As U.S. jobs in services shifted from 65 per-cent of all jobs in 1960 to 84 percent in 2009, commercial service exports increased from only 15.8 percent of total exports to 31 percent.37 This increase in service exports has surpassed the increase in service imports. By 2007, the value of United States ser-vice exports was 40 percent higher than the value of service imports.38 Moreover, the United States has been a global leader in commercial service exports, selling $525.8 billion worth to foreign residents in 2008.39 This represented 13.8 percent of global commercial service exports, making the United States by far the world’s dominant service exporter.40
Business, professional and technical services, such as advertising, architecture, and industrial engineering were the fifth largest U.S. export category in 2008 (See Table 1). In fact, half of the top 10 major export categories in 2008 were services.
Still, despite the rise in services, manufacturing still accounts for the lion’s share of U.S. exports—accounting for 62 percent in 2008. Transportation equipment exports, mostly manufactured aircraft and aircraft parts, followed by automobiles and to a lesser extent ships, have been the largest exports category since 2002, when it replaced computers and electronics. Chemicals manufacturing, including exports of plastics, medicine, pharmaceuticals, and various compounds, were also a major source of exports in 2008.
From 2003 to 2008, U.S. exports grew by 9.2 percent annually, adjusting for indus-try specific inflation, compared to 2.5 percent real GDP annual growth.41 As Table 1 shows, of the ten largest industries, all grew faster than GDP over the period. The fastest growing industries were in petroleum refining and the mining of coal, which grew by 26.2 and 24.8 percent, respectively. Outside of raw materials, the fastest export growth was from the publishing industry—which includes books, newspapers, and software— which increased by 24.4 percent annually, from a base of just 360 million in 2003 to 799 million in 2008. Rapid growth—19.2 percent annually— was also found in the sub-category of other business, professional, and technical services, which includes things like highly specialized equipment repair services, legal services, internet trade services, architectural and engineering services, and adver-tising. Exports from telecommunication services and miscellaneous manufacturing, which includes medical equipment manufacturing, also grew faster than 14 percent annually. Meanwhile, exports from apparel manufacturing declined by 7.9 percent.
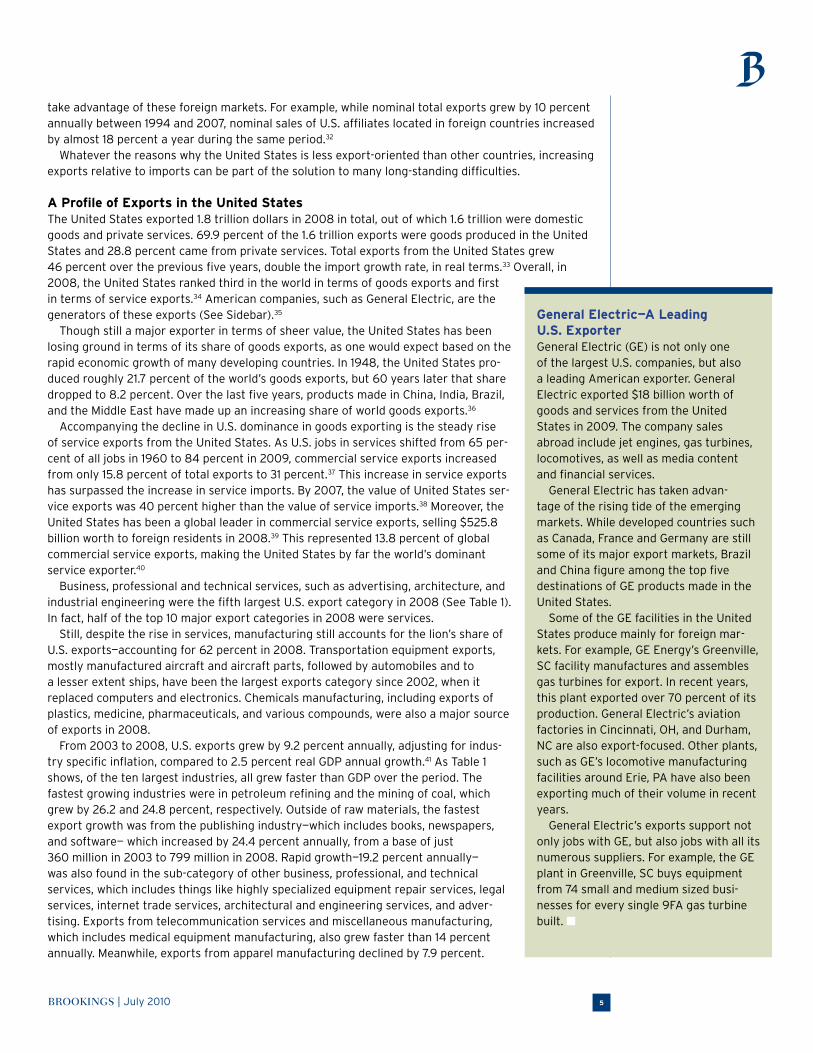
General Electric—A Leading U.S. ExporterGeneral Electric (GE) is not only one of the largest U.S. companies, but also a leading American exporter. General Electric exported $18 billion worth of goods and services from the United States in 2009. The company sales abroad include jet engines, gas turbines, locomotives, as well as media content and financial services.
General Electric has taken advan-tage of the rising tide of the emerging markets. While developed countries such as Canada, France and Germany are still some of its major export markets, Brazil and China figure among the top five destinations of GE products made in the United States.
Some of the GE facilities in the United States produce mainly for foreign mar-kets. For example, GE Energy’s Greenville, SC facility manufactures and assembles gas turbines for export. In recent years, this plant exported over 70 percent of its production. General Electric’s aviation factories in Cincinnati, OH, and Durham, NC are also export-focused. Other plants, such as GE’s locomotive manufacturing facilities around Erie, PA have also been exporting much of their volume in recent years.
General Electric’s exports support not only jobs with GE, but also jobs with all its numerous suppliers. For example, the GE plant in Greenville, SC buys equipment from 74 small and medium sized busi-nesses for every single 9FA gas turbine built. n
BROOKINGS | July 20106
The multi-decade changes discussed above are in large part driven by changes outside of the United States, especially the rise of China, India, and other nations.
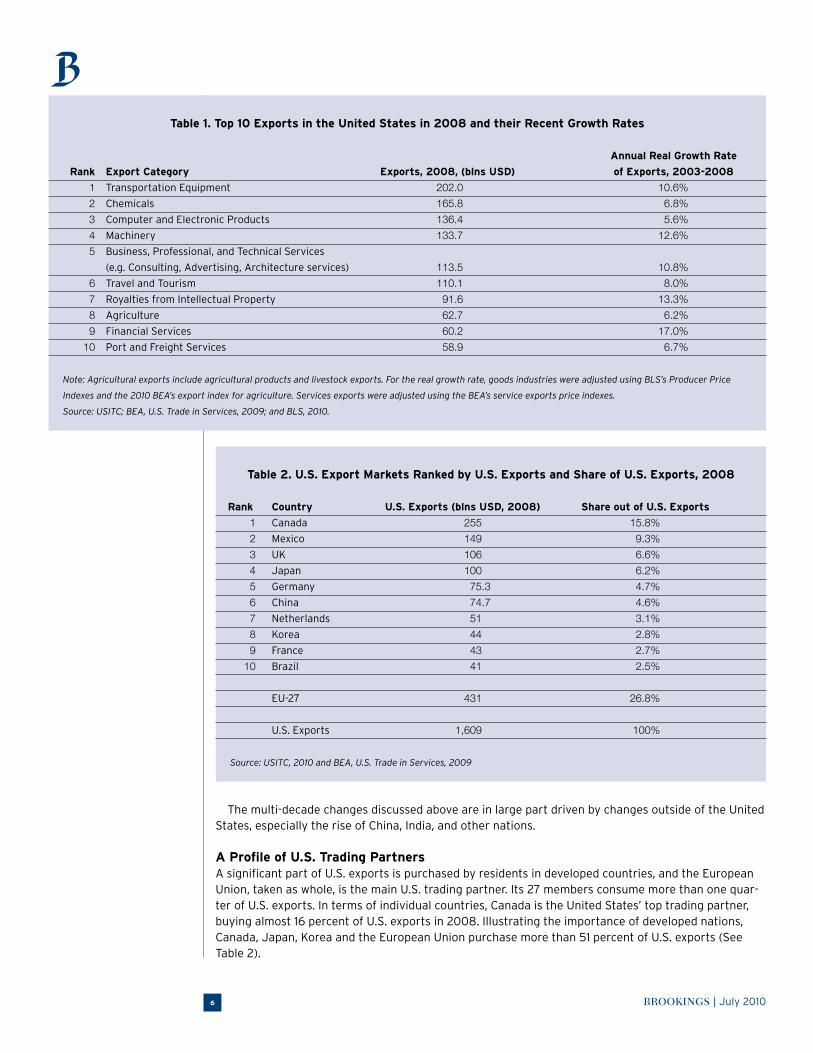
A Profile of U.S. Trading PartnersA significant part of U.S. exports is purchased by residents in developed countries, and the European Union, taken as whole, is the main U.S. trading partner. Its 27 members consume more than one quar-ter of U.S. exports. In terms of individual countries, Canada is the United States’ top trading partner, buying almost 16 percent of U.S. exports in 2008. Illustrating the importance of developed nations, Canada, Japan, Korea and the European Union purchase more than 51 percent of U.S. exports (See Table 2).
Table 2. U.S. Export Markets Ranked by U.S. Exports and Share of U.S. Exports, 2008
Rank Country U.S. Exports (blns USD, 2008) Share out of U.S. Exports
1 Canada 255 15.8%
2 Mexico 149 9.3%
3 UK 106 6.6%
4 Japan 100 6.2%
5 Germany 75.3 4.7%
6 China 74.7 4.6%
7 Netherlands 51 3.1%
8 Korea 44 2.8%
9 France 43 2.7%
10 Brazil 41 2.5%
EU-27 431 26.8%
U.S. Exports 1,609 100%
Source: USITC, 2010 and BEA, U.S. Trade in Services, 2009
Table 1. Top 10 Exports in the United States in 2008 and their Recent Growth Rates
Annual Real Growth Rate
Rank Export Category Exports, 2008, (blns USD) of Exports, 2003-2008
1 Transportation Equipment 202.0 10.6%
2 Chemicals 165.8 6.8%
3 Computer and Electronic Products 136.4 5.6%
4 Machinery 133.7 12.6%
5 Business, Professional, and Technical Services
(e.g. Consulting, Advertising, Architecture services) 113.5 10.8%
6 Travel and Tourism 110.1 8.0%
7 Royalties from Intellectual Property 91.6 13.3%
8 Agriculture 62.7 6.2%
9 Financial Services 60.2 17.0%
10 Port and Freight Services 58.9 6.7%
Note: Agricultural exports include agricultural products and livestock exports. For the real growth rate, goods industries were adjusted using BLS’s Producer Price
Indexes and the 2010 BEA’s export index for agriculture. Services exports were adjusted using the BEA’s service exports price indexes.
Source: USITC; BEA, U.S. Trade in Services, 2009; and BLS, 2010.

BROOKINGS | July 2010 7
Despite the importance of these long-established markets, U.S. exports to the BIC countries—Brazil, India, and China—have increased rapidly between 2003 and 2008, more than doubling in size, in real terms. These export markets are also gaining share, from 5.9 percent of U.S. exports in 2003 to 8.8 percent in 2008. This group of countries will be increasingly the main source of additional demand in the world. For example, if their GDPs are combined, based on the IMF forecast, they are expected to account for about a fifth of global GDP in 2010, which would surpass U.S. GDP for the first time.42
The Role of Metropolitan Areas in the National Economy and its ExportsLike all industrialized countries, the United States is largely composed of metropolitan areas, which are cities surrounded by lower density areas. It is the aggregation of these diverse metropolitan areas, including their distinct geographies, industrial specializations, administrative and regulatory systems, and physical and human capital that shape the economic vitality of the nation.43 Accordingly, develop-ing an understanding of which places succeed in exporting and in what export industries is essential to inform a national strategy to boost exports. As economist Paul Krugman put it:
One of the best ways to understand how the international economy works is to start by looking what happens inside the nations. If we want to understand differences in national growth rates, a good place to start is by examining differences in regional growth; if we want to understand international specialization, a good place to start is with local specialization.44
In short, metropolitan strengths and weaknesses determine the strengths and weaknesses of the national economy.
Metropolitan areas are the nation’s hubs of commerce and innovation and the ultimate source of much of its prosperity. Metropolitan areas work in this way by concentrating productive assets.45 As the English economist Alfred Marshall argued back in 1890, concentrated industries exhibit benefits that no one company can expect to capture by facilitating access to shared ideas, skills, and transac-tions. As it turns out, there is considerable empirical evidence to support Marshall’s theoretical conten-tions, as urban economists have documented for years.46
These advantages of metropolitan location are relevant to exporting in a number of ways. At the most basic level, metropolitan areas offer a large pool of workers to draw from, matching specific worker skills and training to industry needs.
Most exports require the cross-border movement of goods and people, and in this, metropolitan areas are crucial. The 100 largest metropolitan areas also move 79 percent of the nation’s air cargo.47 Over the course of 2009, just 26 metropolitan areas accommodated roughly 75 percent of domestic air travelers, and 94 percent of international passengers landed in 20 metro areas.48
Research on U.S. exports has found that the introduction of innovative products often precedes exports, and it is well documented that metropolitan areas are the home to most inventors of patents and a disproportionate share of research and development, science, and even venture capital invest-ments.49 Finally, there is evidence that export-oriented industries produce more patents if they are located near other firms in the same industry.50 Clusters seem to operate just as Marshall described, by leveraging access to labor, suppliers, and ideas.51 While clusters are not limited to urban or even metropolitan areas, export industry clusters are much more likely to be found in the counties of metro-politan areas.52
Despite these export strengths, no metropolitan area has been immune to the economic downturn that has gripped the nation, despite its varying severity.53 With a sluggish domestic economy, metro-politan businesses should look overseas to fill the gap in demand.
From a longer-term perspective, however, increasing a metropolitan area’s export orientation is likely to create higher paying jobs—and not just for the most highly educated. Local metropolitan lead-ers should be concerned with increasing the export intensity of existing companies rather than simply recruiting new ones, and in recruiting should target industries that overlap with existing firms in the area. There is evidence that exporting firms located in the same county as other firms in their industry experience higher productivity growth.54 These features of clusters provide an incentive for local eco-nomic development experts to attract or grow companies in the export industries where they already have strengths.

BROOKINGS | July 20108
II. Methods Used in Report
This study examines U.S. exports produced in the top 100 metropolitan areas.55 While the Census Bureau (Census) and the International Trade Administration (ITA) have been compil-ing metropolitan goods exports since 1995, these data do not accurately reflect the origin of production.56 They are allocated based on origin of movement declared by the exporter,
which is not always the place where the good was produced. In addition, if the exported goods are consolidated, the metro export series assigns them to the metro area where the consolidation point is located.57 Last but not least, the Census--ITA metro exports data are limited only to merchandise trade,
and do not include service exports, which constitute roughly a third of total U.S. exports. For these reasons, this study generates new estimates of exports from metropolitan areas, which are more accurate and comprehensive than any measure publicly available.
To generate estimates of metropolitan exports, the general technique was to allo-cate U.S. domestic exports for individual industries to metropolitan areas based on the metropolitan areas’ share of national value added for each of those industries. This approach assumes that if Wichita, KS produces 20 percent of the national value added of transportation manufacturing, then this metro area also exports 20 percent of U.S. transportation equipment.58 In the case of trading partners, this method apportions U.S. exports associated with an industry sold to a particular country to each of the 100 largest metro areas in proportion with the metro share of output produced by that same industry to the national total. So, in the hypothetical Wichita example, if the U.S. exported $100 million to Turkey in transportation equipment in 2008, Wichita would be credited with exporting $20 million (i.e. 20 percent) to Turkey in transportation equip-ment in 2008. Thus, a metro’s rank for share of exports in a particular industry to a particular U.S. trading partner is the same as that metro’s overall ranking in exports in that industry.
One challenge with this method is that service exports, which are measured by cross-border trade surveys from the Bureau of Economic Analysis, do not report industries but rather service categories like architectural services, computer services, financial services, freight servies, and rights to show films. These categories were matched up with the relevant North American Industrial Classification System (NAICS) codes, using information provided in BEA documents. For three difficult cases, supplemen-tary resources were used. Internal Revenue Service (IRS) data on corporate income by industry from royalties was used to first link royalties to NAICS.59 Likewise, data from a BEA satellite account was obtained for travel and tourism to insure that national exports were allocated accurately to industries. For education services, this study calculated the metropolitan area’s share of foreign university students based on data from the Institute of International Education (IIE).
Accuracy of DataThough caution should be used in interpreting these estimates, there is reason to believe that they accurately reflect export activity within a reasonable margin of error and represent a considerable improvement in accuracy over the ITA origin of movement data.
First, these estimates capture the reality that metros that export a larger share of their goods outside of their region are likely to export a larger share of their goods to other countries. The Commodity Flows Survey from the U.S. Department of Transportation allows one to calculate the share of goods that are sent externally for 59 of the 100 largest metropolitan areas for the year 2007. This export orientation measure is positively and significantly correlated with the Brookings export orientation measure, but it is negatively correlated with the ITA measure. In other words, the ITA data has no statistical association with an alternative measure of exports, while this study’s data does.60
Second, according to the ITA metropolitan exports series, there are 15 metropolitan
Key Terms Used in the StudyOur terms focus on the interna-tional trade side of regional exports. Therefore, they exclude the sales of a U.S. metropolitan area to other U.S. regional economies.
Metropolitan exports are goods and services sold by U.S. resident firms located in one of the largest 100 metro areas to foreign entities (people or companies). The foreign entities include foreign firms located abroad, subsidiaries of American firms located abroad, foreign tourists and students in the United States or foreign passen-gers on U.S. air carriers. This defini-tion follows the Bureau of Economic Analysis (BEA) classification of cross- border exports of goods and ser-vices at the national level. This term excludes internal regional exports, expressed as the sales of a top 100 metro area outside of its metropolitan boundary to a U.S. resident.
Metropolitan export intensity is the share of metropolitan exports out of Gross Metropolitan Product (GMP). This measure shows the importance of exports to the metropolitan economy.
The growth rate of metropolitan exports is the real growth rate of metro exports between 2003 and 2008, where real means adjusted for inflation. This period was chosen because it reflects the start and end of the previous business cycle.
A metro export cluster is defined as the case in which as an industry in which the metro’s export share of Gross Metropolitan Product is at least 1.5 times higher than that industry’s export share of Gross Domestic Product nationally. n

BROOKINGS | July 2010 9
areas out of the 100 largest that export a larger value of goods than they produce, at least in 2008. The highest percentage of goods produced as a share of exports using the Brookings data is a more plausible 84 percent, and the average was 54 percent as opposed to 67 percent using the ITA data.
An analysis of the sources of the discrepancies between the ITA and Brookings estimates leads to the conclusion that the respondents to the Census origin of movement surveys, which form the basis of the ITA data, attribute the origin of exports to metropolitan areas that have ports and that are near Canadian and Mexican borders, regardless of whether or not the good was produced there. The metropolitan areas with the highest export to GMP ratios in the ITA were in states that bordered Mexico or Canada; metros in these bordering states were allocated an average of 54 extra percentage points to their exports to GMP ratio; this represented an extra $7 billion in exports, most of which is probably erroneous if interpreted as the origin of production. Many border metros serve as warehouse or con-solidation points, and so the origin of movement method used by the ITA attributes origin to where the goods were temporarily housed. Furthermore, the Brookings goods exports data are strongly correlated with manufacturing employment, but the ITA data have no significant correlation with manufacturing. Given the outsized importance of manufacturing to exports, this result also favors using the Brookings data over the ITA data.61
Generating Employment EstimatesThe level of export related jobs was estimated based on the contribution of industry exports to indus-try GMP for each metropolitan area. This ratio, which one could call the metropolitan export intensity of the industry, was multiplied by the number of jobs in each metropolitan-industry to get the num-ber of export related jobs in that metropolitan areas’ industry. The export related jobs number is an estimate of the number of workers in each industry within a metropolitan area that are required to produce that industry’s exports. To some extent, this figure captures jobs that supply export indus-tries, since the export values are final sales numbers, which include the supply chain.62
Generating the Relationship between Metropolitan Exports and Metropolitan Industry WagesTo estimate how individual wages are affected by working in a metropolitan industry that exports, individual data was obtained from IPUMS, which organizes data from the 2008 American Community Survey. The approach was to estimate the average effect of metropolitan industry exports on indi-vidual wages, adjusting for other relevant factors that affect wages, such as the characteristics of the individual, his or her industry, his or her metropolitan area and occupational characteristics, and the level of education of his or her colleagues in the same industry within the metropolitan area.
The Brookings exports data for each of the 100 largest metropolitan areas is available at www.brookings.edu/metro/exports
III. Findings
1. Increasing the nation’s exports holds out the potential of generating a significant numberof good-paying jobs in the United States. U.S. exports supported 11.8 million jobs nationally and 7.7 million jobs in the top 100 metro areas in 2008. These jobs amounted to 8.3 percent of total employment in the nation and 8.1 percent of all jobs in the largest 100 metropolitan areas.
Export related employment is not only jobs in companies that sell abroad, but also in firms that are part of the supply chain of the exporting companies. For example, the export related jobs in trans-portation equipment are jobs in companies that sell cars, aircraft, and parts abroad and jobs in the domestic firms that supply parts to these companies. Because this study estimates the export related jobs based on export sales, the export related jobs only partially reflect the jobs in the companies from the supply chains of exporting companies. Further, these job figures do not include jobs in the local services (retail, restaurants) that are generated by the spending of those employed by exporting companies.
Southern and Western large metropolitan areas hold 56 percent of export related jobs from the top 100 metropolitan areas. Midwestern large metro areas have 24 percent of the export related jobs

BROOKINGS | July 201010
from the largest 100 metro areas, larger than the 20.9 percent share of the export volume of the same group. The concentration of their exports in manufacturing partly explains this result. For every per-centage point increase in the manufacturing share of total employment, the export share of employ-ment increases by 0.8 percentage points.
The large metropolitan exporters have the most export jobs. For example, the counties in greater metropolitan areas of Los Angeles and New York had almost one million export related jobs total in 2008 (See Table 3). Computer and electronics sales abroad supported the largest number of jobs in Los Angeles (121,000), where the percentage of export jobs in computer and electronics manufactur-ing is roughly twice as high as the national share. Its famous film and television industry, which has ten times the number of export jobs as a percentage of all employment than the nation, generates an estimated 41,000 jobs from exports.
In the New York metropolitan area, jobs in business and professional services generated the largest number of jobs (70,000), in large part because of a disproportionate share of jobs in management and consulting, R&D, computer services, and telecommunications. New York, of course, also has a major financial sector cluster, and roughly 36,000 of its jobs in finance are supported by exports.
Export related jobs are a large part of the job base in several metropolitan areas in the United States. For example, in San Jose, almost 23 out of 100 metro jobs are supported by exports. Seventy percent of the export related jobs reside in the computer and electronics industry that fuels the San Jose economy and represents its largest industry cluster. Likewise, Wichita’s workforce is heavily dependent on export markets. Exports support 22 out of every 100 jobs in the metropolitan area of
Table 3. Export Related Jobs and the Share of Export Related Jobs out of Metropolitan Employment, 2008
Total Jobs Rank Export Share of Export Related Rank
from Exports Related Jobs of Metro Percentage of
Metropolitan Area in 2008 Jobs Employment, 2008 Jobs from Exports
Los Angeles-Long Beach-Santa Ana, CA 560,475 1 9.8% 23
New York-Northern New Jersey-Long Island, NY-NJ-PA 481,946 2 5.6% 87
Chicago-Naperville-Joliet, IL-IN-WI 397,924 3 8.7% 43
Dallas-Fort Worth-Arlington, TX 303,514 4 10.0% 21
Detroit-Warren-Livonia, MI 239,910 5 12.5% 7
Houston-Sugar Land-Baytown, TX 235,193 6 8.9% 38
Boston-Cambridge-Quincy, MA-NH 223,070 7 8.9% 37
San Jose-Sunnyvale-Santa Clara, CA 212,157 8 22.7% 1
Philadelphia-Camden-Wilmington, PA-NJ-DE-MD 201,634 9 7.1% 65
Seattle-Tacoma-Bellevue, WA 196,000 10 10.7% 16
Honolulu, HI 18,218 91 3.6% 98
Augusta-Richmond County, GA-SC 17,602 92 7.6% 60
Provo-Orem, UT 17,477 93 8.9% 39
Colorado Springs, CO 17,232 94 5.9% 82
Modesto, CA 17,177 95 9.7% 25
El Paso, TX 17,114 96 5.8% 85
Bradenton-Sarasota-Venice, FL 15,241 97 5.5% 88
Lakeland-Winter Haven, FL 13,236 98 6.1% 80
McAllen-Edinburg-Mission, TX 8,695 99 3.8% 97
Cape Coral-Fort Myers, FL 6,006 100 2.8% 100
Largest 100 Metro Areas 7,688,744 8.1%
United States 11,854,390 8.3%
Source: Brookings Analysis of data from BEA, Moody’s Economy.com, USITC, IIE, and IRS.

BROOKINGS | July 2010 11
Wichita. Of those 22 jobs, 15 come from Wichita’s massive aviation cluster, which specializes in non-commercial, non-military planes.
In some cases, export related employment is not nearly as impressive as export sales. For example, metros such as New Orleans and Baton Rouge that rely heavily on petroleum refining exports do not have nearly as many export related jobs as their export sales would predict. Only 6.8 percent of jobs in New Orleans and 5.8 percent of jobs in Baton Rouge are export related, despite overall export sales accounting for 18.1 and 18.8 percent, respectively, of Gross Metropolitan Product in 2008. Exports per job (or export productivity) can be extremely high in industries dealing with raw materials and com-modities because of capital intensity.
2. The largest 100 metropolitan areas produce most of the nation’s exports. Home to 65 percent of the nation’s population, the 100 largest metropolitan areas produced an estimated 64 percent of U.S. exports in 2008, including 62.3 percent of U.S. manufactured goods and 75 percent of services. Export activity is highly concentrated among the top 100 metropolitan areas. The 10 metropolitan areas with the highest value of exports produced about 43 percent of all the top 100 metro areas’ exports in 2008 even though they contain just 38 percent of the top 100 metros’ population.
More broadly, 83.6 percent of the U.S. population in 2008 resided in metros of all sizes, and these areas produced 83.7 percent of all exports, including 90.2 percent of services and 80.5 percent of goods.
The reason that the large metros’ export share is slightly lower than their population share is that many export-oriented industries have characteristics that favor less dense areas; these industries include agriculture, mining, oil and gas extraction, and resource-dependant manufacturing like paper and primary metals. These producers require large spaces, which can be very expensive in the cities and suburbs of large metros, and they often emit noise, odors, or pollutants which are understandably kept away from residential areas through zoning and mining exports laws. Despite that, 25 percent of the nation’s agricultural exports and more than a third of oil and gas exports are produced in large metropolitan areas, a reminder that metros function as fully regional economies made up of cities, suburbs, towns, and rural areas.
Still, most export indus-tries, 31 out of 52 categories, are concentrated dispropor-tionately in the largest 100 metros, higher than the 65 percent share of the larg-est 100 metros population (Figure 1). For example, three quarters of computer and electronics manufacturing is produced in the largest 100 metros. Other goods activi-ties concentrated in large metros include publishing, print manufacturing, petro-leum manufacturing, and apparel manufacturing. The smaller service exports, such as management and consult-ing, R&D, film and television, computer services, and insurance concentrate more than 80 percent of their production in the large metro areas.
Figure 1. Exports from the Largest Metros100 Metro Share of U.S. Total for 25 Largest Export Industries
Reference line at 0.65; circle sizes correspond to industry export values
Source: Brookings Analysis of Various Data Sources for 2008
Au
tos
& T
ran
s E
qu
ip
Ch
emic
al M
an
uf
Com
p &
Ele
ctro
nic
Man
f
Tou
rism
Mach
ine
Roy
alt
ies Fin
an
ce
Pet
ro M
an
u
Fre
igh
t &
Port
Srv
Mis
c M
an
uf
Pri
me
Met
al
Pass
enger
Tra
ns
Food M
an
uf
Man
agem
ent
Fab M
etals
Ele
ctr
Agri
cult
ure
R&
D
Edu
Pla
stic
s
Film
Com
pu
ter
Srv
Paper
M
an
uf
Insu
ran
ce
Tel
ecom
.2
.4
.6
.8
1
100
Met
ro S
hare
0 5 10 15 20 25
Industry Export Rank
BROOKINGS | July 201012
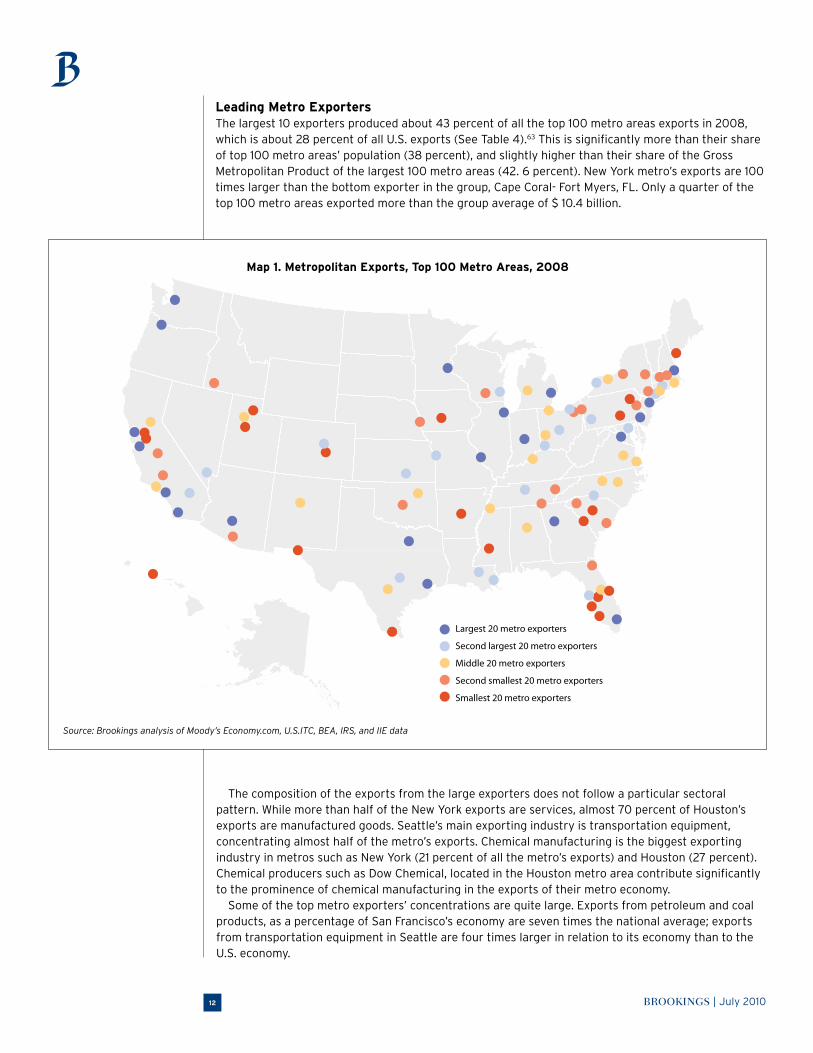
Leading Metro ExportersThe largest 10 exporters produced about 43 percent of all the top 100 metro areas exports in 2008, which is about 28 percent of all U.S. exports (See Table 4).63 This is significantly more than their share of top 100 metro areas’ population (38 percent), and slightly higher than their share of the Gross Metropolitan Product of the largest 100 metro areas (42. 6 percent). New York metro’s exports are 100 times larger than the bottom exporter in the group, Cape Coral- Fort Myers, FL. Only a quarter of the top 100 metro areas exported more than the group average of $ 10.4 billion.
Map 1. Metropolitan Exports, Top 100 Metro Areas, 2008
Source: Brookings analysis of Moody’s Economy.com, U.S.ITC, BEA, IRS, and IIE data
The composition of the exports from the large exporters does not follow a particular sectoral pattern. While more than half of the New York exports are services, almost 70 percent of Houston’s exports are manufactured goods. Seattle’s main exporting industry is transportation equipment, concentrating almost half of the metro’s exports. Chemical manufacturing is the biggest exporting industry in metros such as New York (21 percent of all the metro’s exports) and Houston (27 percent). Chemical producers such as Dow Chemical, located in the Houston metro area contribute significantly to the prominence of chemical manufacturing in the exports of their metro economy.
Some of the top metro exporters’ concentrations are quite large. Exports from petroleum and coal products, as a percentage of San Francisco’s economy are seven times the national average; exports from transportation equipment in Seattle are four times larger in relation to its economy than to the U.S. economy.
Largest 20 metro exporters
Second largest 20 metro exporters
Middle 20 metro exporters
Second smallest 20 metro exporters
Smallest 20 metro exporters

BROOKINGS | July 2010 13
Table 4. U.S. Metro Areas Ranked by their Exports, 2008
Exports,
as Share of Share of
Exports Top 100 Top Exporting Industry Metro
Rank Metro Area (bln 2008) Metro Total in the Metro Area Exports
1 New York-Northern New Jersey-Long Island, NY-NJ-PA 85.16 8.2% Chemicals 21.1%
2 Los Angeles-Long Beach-Santa Ana, CA 78.54 7.6% Computer and Electronics 12.1%
3 Chicago-Naperville-Joliet, IL-IN-WI 52.88 5.1% Machinery 13.3%
4 Houston-Sugar Land-Baytown, TX 51.55 5.0% Chemicals 27.4%
5 Dallas-Fort Worth-Arlington, TX 44.55 4.3% Computer and Electronics 16.4%
6 San Francisco-Oakland-Fremont, CA 30.90 3% Petroleum and Coal Products 25.7%
7 Boston-Cambridge-Quincy, MA-NH 28.80 2.8% Computer and Electronics 21.6%
8 Philadelphia-Camden-Wilmington, PA-NJ-DE-MD 27.44 2.6% Chemicals 18.1%
9 Detroit-Warren-Livonia, MI 26.91 2.6% Transportation Equipment 47.6%
10 Seattle-Tacoma-Bellevue, WA 24.16 2.3% Transportation Equipment 48.7%
Top 10 Metro Exporters 450.90 43.5%
Top 100 Metros 1,036.88 Transportation Equipment 11.8%
United States 1,609.41 Transportation Equipment 12.6%
Source: Brookings analysis of Moody’s Economy.com, U.S.ITC, BEA, IRS, and IIE data
3. Strong manufacturing and patent producing metropolitan areas are the most export oriented. Manufacturing industries are the most export oriented, and so metropolitan areas that specialize in manufacturing tend to export the largest shares of their GMP. Export oriented metropolitan areas are also significantly more innovative, defined by their rate of patent production. This finding may be explained through existing evidence that firms that are more innovative are more likely to export internationally and exporting activity reinforces innovation through competition.
Overall, the top 100 metro areas export about 10.3 percent of their production, which is less than the national average of 11.4 percent.64 Metro exports, as a share of the metro output, range from 4.1 percent in Cape Coral, FL to 27.8 percent in Wichita, KS, with an average of 10.9 percent across the top 100 metros (Table 5).
This reflects a wide spatial distribution among metro areas in terms of export intensity, with the Midwestern metros standing out as particularly export oriented (See Map 2). The Southern and Western metros follow in terms of the share of their output exported. The Northeastern metro areas rank lower in the group, with no metropolitan area from this region being among the 20 most export oriented metro areas.
The more export oriented metro areas are manufactured based economies.65 For example, 65 percent of Wichita’s exports are transportation equipment, mainly airplanes and airplane parts (See Sidebar).66 Portland, OR, San Jose, and Palm Bay, FL rely on computer exports in a similar fashion. In Oxnard, CA chemicals and computers are about 42 percent of all the metro’s exports.
Most of the metropolitan areas that are less export oriented specialize in services. The least export intensive metro areas rely on travel and tourism or business services as the main exporting industries. All of these metros are either in the West or South. Their low export intensities reflect the fact that manufactured goods are more tradable than services in general. In addition, it may show that they sell their services to other places in the United States or that a large base of non-tradable services (i.e. retail trade, health care and social assistance, government and administrative services) is necessary to support tradable services.
Export orientation is linked to innovation In order to test whether or not metropolitan export orientation is related to innovation, this report obtained new patent data from the Strumsky Patent Applications Database, which, through the work of Deborah Strumsky, aggregates and classifies

Strongest 20 metro exporters
Second strongest 20 metro exporters
Middle 20 metro exporters
Second weakest 20 metro exporters
Weakest 20 metro exporters
BROOKINGS | July 201014
historic and current patent information from the U.S. Trademark and Patent Office by geography. It is well established that patent data is a proxy for product innovation. Using these data, the average large metropolitan area generated approximately 3,527 patents per year between 2001 and 2008; metropolitan performance ranged widely: McAllen TX produced 0.2 patents per thousand workers from 2001 to 2008, while San Jose CA produced 33.9.
It turns out that manufacturing-oriented metros create patents at much higher rates, despite having a lower rate of workers with college degrees (which is otherwise helpful for patenting). The average large metropolitan area had a patent rate of 3.6 granted patents per thousand workers from 2001 to 2008, while the 37 large metros with a manufacturing share of employment greater than or equal to 10 percent had a patent rate of 5.2. Those 63 metropolitan areas with less than 10 percent manufacturing share have patent rates of 2.7.
Yet, the link between innovation and exporting is not limited to manufacturing, and metropolitan areas that are more export-oriented have higher patent rates than less export oriented metropolitan areas with the same manufacturing share of employ-ment. In Figure 7, metropolitan export shares of GMP were adjusted for state charac-teristics and the manufacturing share of employment. Comparing the adjusted export orientation of low, medium, and high innovators, defined in terms of patent generation per thousand workers, shows that export intensity is higher for more innovative metros (Figure 7).68
In the low patenting category, metro such as Cape Coral FL, Honolulu HI, McAllen TX, Miami FL, Oklahoma City OK, Little Rock AR, and Las Vegas NV export less than eight percent of what they produce. Of the metros that are in the middle in terms of patent-ing rates, Charlotte NC, Buffalo NY, Houston TX, Grand Rapids MI, and Indianapolis IN all export at least 11 percent of what they produce. In the highly innovative category, Cleveland OH, Dallas TX, Palm Bay FL, Oxnard CA, San Jose, and Portland OR all export
Map 2. Metropolitan Exports, as a Share of Gross Metropolitan Product,Top 100 Metro Areas, 2008
Source: Brookings analysis of Moody’s Economy.com, U.S.ITC, BEA, IRS, and IIE data
Wichita’s Aviation Cluster—Its Main Source of Metro Exports Wichita’s top position in terms of exports share from output is the result of a shift towards foreign customers by its aviation companies. Overall, the U.S. general aviation industry has been growing its sales abroad, with 2009 being the first year when exports accounted for more than half of the industry sales. Large aviation manufacturers, such as Cessna and Hawker Beechcraft, are driving this trend in Wichita. They are helped by a myriad of suppliers that strengthen the export capability of the Wichita’s aviation cluster.
Cessna’s exports grew by 165.5 percent between 2005 and 2008 driven by strong sales into developing regions such as Latin America, Asia as well as the Middle East. The com-pany’s exports reached 44.1 percent of sales in 2008. Financing from the federal government will help Cessna to continue this trend. In 2009, the Ex-Im Bank authorized a $500 million direct-loan facility to Textron, Cessna’s parent company to provide funds to assist in financing of exports.
Hawker Beechcraft’s exports increased by more than 390 percent between 2004 and 2009, driven by sales to Europe, Latin America and Africa/Middle East. Exports were about half of the company’s sales both in 2008 and 2009.
Cessna and Hawker Beechcraft’s suppliers in Wichita, such as Cox Machine, Inc. and Perfekta ben-efited from the surging exports of the large companies. Cox Machine more than tripled its number of employees between 2003 and 2008, while Perfekta’s employee head-count increased by 76 percent. While affected by the recession in 2009, Cox Machine’s layoffs would have been much worse without Cessna and Hawker Beechcraft’s sales abroad, according to Jason Cox, the Chief Technical Officer of Cox Machine. n
BROOKINGS | July 2010 15
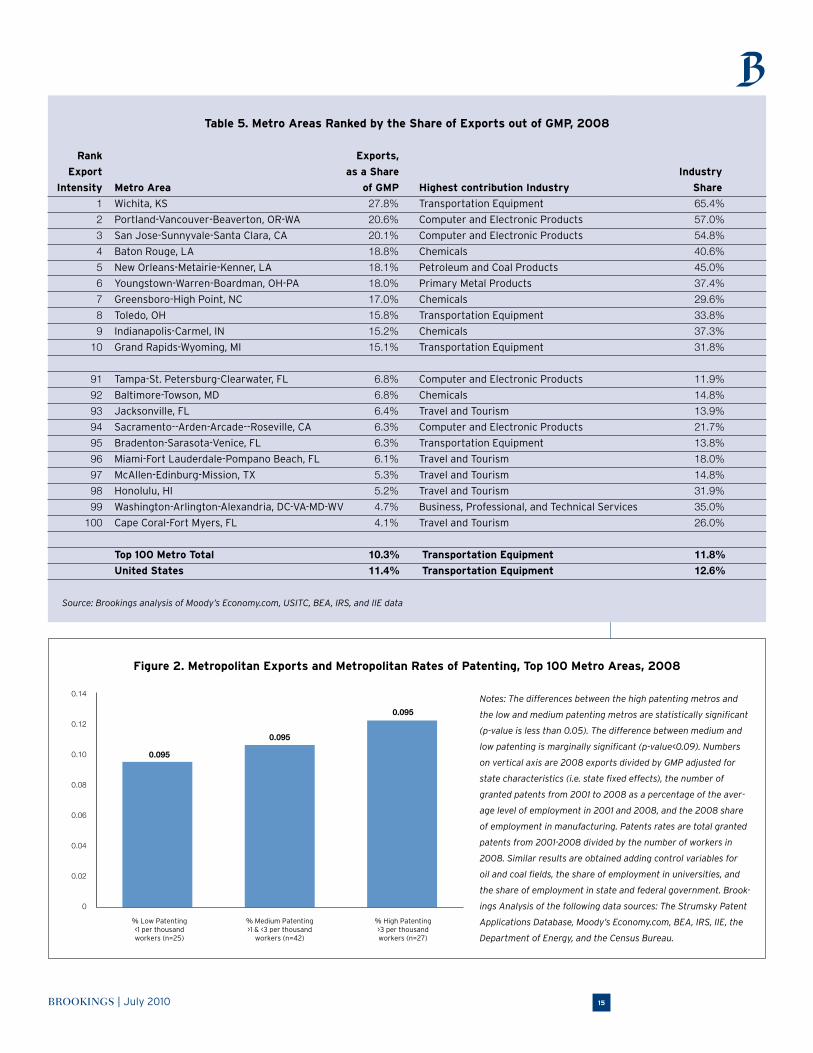
Table 5. Metro Areas Ranked by the Share of Exports out of GMP, 2008
Rank Exports,
Export as a Share Industry
Intensity Metro Area of GMP Highest contribution Industry Share
1 Wichita, KS 27.8% Transportation Equipment 65.4%
2 Portland-Vancouver-Beaverton, OR-WA 20.6% Computer and Electronic Products 57.0%
3 San Jose-Sunnyvale-Santa Clara, CA 20.1% Computer and Electronic Products 54.8%
4 Baton Rouge, LA 18.8% Chemicals 40.6%
5 New Orleans-Metairie-Kenner, LA 18.1% Petroleum and Coal Products 45.0%
6 Youngstown-Warren-Boardman, OH-PA 18.0% Primary Metal Products 37.4%
7 Greensboro-High Point, NC 17.0% Chemicals 29.6%
8 Toledo, OH 15.8% Transportation Equipment 33.8%
9 Indianapolis-Carmel, IN 15.2% Chemicals 37.3%
10 Grand Rapids-Wyoming, MI 15.1% Transportation Equipment 31.8%
91 Tampa-St. Petersburg-Clearwater, FL 6.8% Computer and Electronic Products 11.9%
92 Baltimore-Towson, MD 6.8% Chemicals 14.8%
93 Jacksonville, FL 6.4% Travel and Tourism 13.9%
94 Sacramento--Arden-Arcade--Roseville, CA 6.3% Computer and Electronic Products 21.7%
95 Bradenton-Sarasota-Venice, FL 6.3% Transportation Equipment 13.8%
96 Miami-Fort Lauderdale-Pompano Beach, FL 6.1% Travel and Tourism 18.0%
97 McAllen-Edinburg-Mission, TX 5.3% Travel and Tourism 14.8%
98 Honolulu, HI 5.2% Travel and Tourism 31.9%
99 Washington-Arlington-Alexandria, DC-VA-MD-WV 4.7% Business, Professional, and Technical Services 35.0%
100 Cape Coral-Fort Myers, FL 4.1% Travel and Tourism 26.0%
Top 100 Metro Total 10.3% Transportation Equipment 11.8%
United States 11.4% Transportation Equipment 12.6%
Source: Brookings analysis of Moody’s Economy.com, USITC, BEA, IRS, and IIE data
Figure 2. Metropolitan Exports and Metropolitan Rates of Patenting, Top 100 Metro Areas, 2008
Notes: The differences between the high patenting metros and
the low and medium patenting metros are statistically significant
(p-value is less than 0.05). The difference between medium and
low patenting is marginally significant (p-value<0.09). Numbers
on vertical axis are 2008 exports divided by GMP adjusted for
state characteristics (i.e. state fixed effects), the number of
granted patents from 2001 to 2008 as a percentage of the aver-
age level of employment in 2001 and 2008, and the 2008 share
of employment in manufacturing. Patents rates are total granted
patents from 2001-2008 divided by the number of workers in
2008. Similar results are obtained adding control variables for
oil and coal fields, the share of employment in universities, and
the share of employment in state and federal government. Brook-
ings Analysis of the following data sources: The Strumsky Patent
Applications Database, Moody’s Economy.com, BEA, IRS, IIE, the
Department of Energy, and the Census Bureau.
0.095
0.14
0.12
0.10
0.08
0.06
0.04
0.02
0
% Low Patenting<1 per thousandworkers (n=25)
0.095
% Medium Patenting>1 & <3 per thousand
workers (n=42)
0.095
% High Patenting>3 per thousandworkers (n=27)
BROOKINGS | July 201016
at least 13 percent of what they produce. States like Texas, California, and Florida have metros on both ends of the extreme, implying that metropolitan specific characteristics are driving the differences.
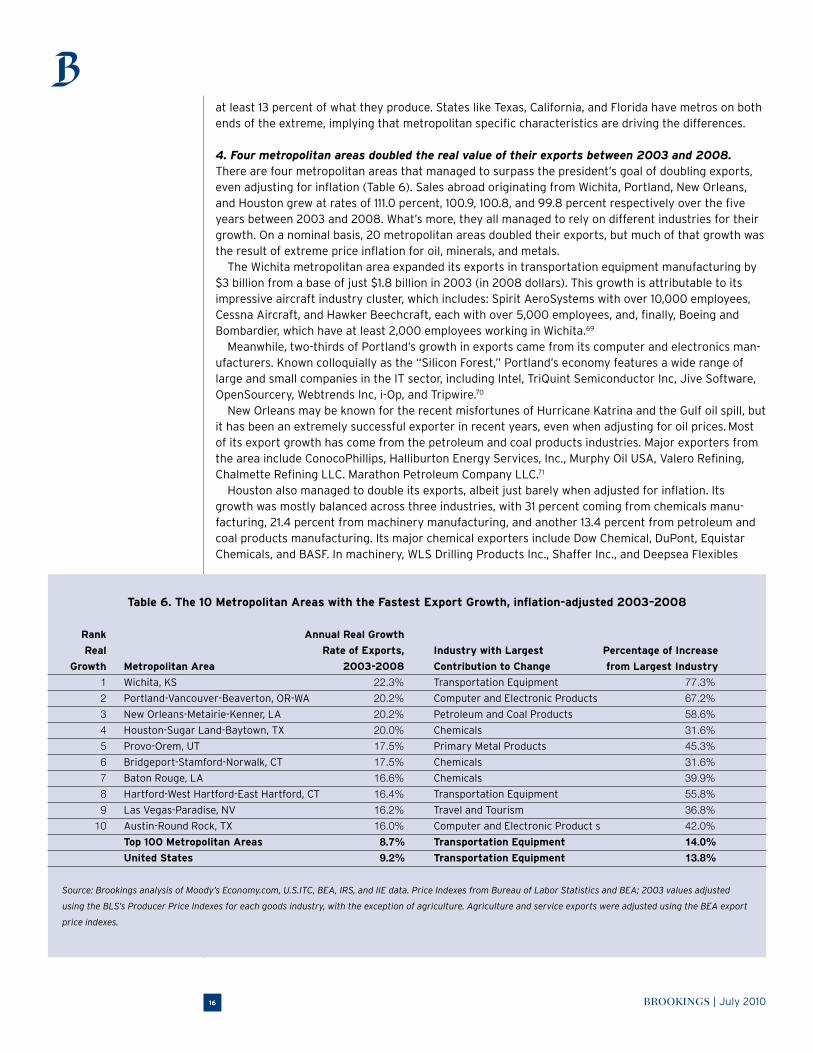
4. Four metropolitan areas doubled the real value of their exports between 2003 and 2008. There are four metropolitan areas that managed to surpass the president’s goal of doubling exports, even adjusting for inflation (Table 6). Sales abroad originating from Wichita, Portland, New Orleans, and Houston grew at rates of 111.0 percent, 100.9, 100.8, and 99.8 percent respectively over the five years between 2003 and 2008. What’s more, they all managed to rely on different industries for their growth. On a nominal basis, 20 metropolitan areas doubled their exports, but much of that growth was the result of extreme price inflation for oil, minerals, and metals.
The Wichita metropolitan area expanded its exports in transportation equipment manufacturing by $3 billion from a base of just $1.8 billion in 2003 (in 2008 dollars). This growth is attributable to its impressive aircraft industry cluster, which includes: Spirit AeroSystems with over 10,000 employees, Cessna Aircraft, and Hawker Beechcraft, each with over 5,000 employees, and, finally, Boeing and Bombardier, which have at least 2,000 employees working in Wichita.69
Meanwhile, two-thirds of Portland’s growth in exports came from its computer and electronics man-ufacturers. Known colloquially as the “Silicon Forest,” Portland’s economy features a wide range of large and small companies in the IT sector, including Intel, TriQuint Semiconductor Inc, Jive Software, OpenSourcery, Webtrends Inc, i-Op, and Tripwire.70
New Orleans may be known for the recent misfortunes of Hurricane Katrina and the Gulf oil spill, but it has been an extremely successful exporter in recent years, even when adjusting for oil prices. Most of its export growth has come from the petroleum and coal products industries. Major exporters from the area include ConocoPhillips, Halliburton Energy Services, Inc., Murphy Oil USA, Valero Refining, Chalmette Refining LLC. Marathon Petroleum Company LLC.71
Houston also managed to double its exports, albeit just barely when adjusted for inflation. Its growth was mostly balanced across three industries, with 31 percent coming from chemicals manu-facturing, 21.4 percent from machinery manufacturing, and another 13.4 percent from petroleum and coal products manufacturing. Its major chemical exporters include Dow Chemical, DuPont, Equistar Chemicals, and BASF. In machinery, WLS Drilling Products Inc., Shaffer Inc., and Deepsea Flexibles
Table 6. The 10 Metropolitan Areas with the Fastest Export Growth, inflation-adjusted 2003–2008 Rank Annual Real Growth
Real Rate of Exports, Industry with Largest Percentage of Increase
Growth Metropolitan Area 2003-2008 Contribution to Change from Largest Industry
1 Wichita, KS 22.3% Transportation Equipment 77.3%
2 Portland-Vancouver-Beaverton, OR-WA 20.2% Computer and Electronic Products 67.2%
3 New Orleans-Metairie-Kenner, LA 20.2% Petroleum and Coal Products 58.6%
4 Houston-Sugar Land-Baytown, TX 20.0% Chemicals 31.6%
5 Provo-Orem, UT 17.5% Primary Metal Products 45.3%
6 Bridgeport-Stamford-Norwalk, CT 17.5% Chemicals 31.6%
7 Baton Rouge, LA 16.6% Chemicals 39.9%
8 Hartford-West Hartford-East Hartford, CT 16.4% Transportation Equipment 55.8%
9 Las Vegas-Paradise, NV 16.2% Travel and Tourism 36.8%
10 Austin-Round Rock, TX 16.0% Computer and Electronic Product s 42.0%
Top 100 Metropolitan Areas 8.7% Transportation Equipment 14.0%
United States 9.2% Transportation Equipment 13.8%
Source: Brookings analysis of Moody’s Economy.com, U.S.ITC, BEA, IRS, and IIE data. Price Indexes from Bureau of Labor Statistics and BEA; 2003 values adjusted
using the BLS’s Producer Price Indexes for each goods industry, with the exception of agriculture. Agriculture and service exports were adjusted using the BEA export
price indexes.

BROOKINGS | July 2010 17
have production in Houston; in the refining industry, it has Shell, Pasadena Refining Systems, Houston Refining, and others.72
At the other end of the spectrum, Detroit lost $2.26 billion in exports from its transportation equip-ment industries, leading to zero net growth in exports. Large gains in petroleum and coal manufactur-ing, and business services like architecture, royalties, and tourism were barely enough to offset these massive losses.
High growth in exports does not simply fulfill abstract macroeconomic goals. These growth figures translate into jobs. As Figure 3 shows there is a very strong correlation between export increases and job increases, even adjusting for GMP without exports or total GMP. In fact, the relationship between export growth and job growth is much tighter than the relationship between GMP growth and job growth. This analysis does not prove that changes in exports are the primary sources of job gains, since increases in employment could also increase exports, but from the perspective of metropolitan areas, it really doesn’t matter. Jobs and exports clearly go together. The bottom line is that 5,800 jobs are required for every $1 billion in 2008 exports for the average metropolitan area.
5. Export intensive industries pay higher wages than domestic oriented industries in large met-ropolitan areas. In an analysis of the 94 of the largest 100 metropolitan areas, for every $1 billion in exports of a metro area industry, workers in that industry earn roughly 1 to 2 percent higher wages.73 Even those exporting industry workers without high school diplomas earn a higher wage. This wage effect can be seen even adjusting for worker characteristics, occupation, or the characteristics of the metropolitan area.
It is important for metropolitan areas to be aware of their exports structure and the role of their exports in the metropolitan economy. However, these descriptive characteristics do not necessarily indicate a better economic performance of a metropolitan area or more prosperity for its inhabitants. To better understand that connection, this study examines the relationship between metropolitan exports and wages (See Figure 4).
In an analysis of the 94 of the largest 100 metropolitan areas, for every $1 billion in exports of a metro area industry, workers in that industry earn roughly 1 to 2 percent higher wages.74 For an industry with $10 billion in metropolitan exports, its workers earn 10-20 percent higher wages than
Figure 3. Change in Jobs and Change in Exports2003 to 2008 for 100 MSAs
Brookings Institution Analysis of IPUMS, BEA,
Moody’s Economy.com, IIE, IRS, USITC.
Coef=5.8, T−statistic=5.7, R−sq=.80;
Adjusts for change in domestic GMP, errors clustered by state
New Y
Washi
PhoenPitts
MiamiOrlan
Las V
RaleiHonol
Green
McAllOklahCapeLakelBradeSan ALittlColumColorTucsoBoiseEl Pa
Balti
HarriBakerPoughAugusJacksStockRichmDes M
Tampa
ModesAllenJacksProvoFresnChattRiverAlbuqOgdenAlbanScranCharlSacraSyracAkronSprinPortlMadisWorceGrandSaltKnoxvPalm
Atlan
OxnarOmaha
Kansa
Phila
DenveLouisDaytoVirgiMemphNashvYoungCharlTulsaBirmiBuffaToledProviRocheNew HAustiGreen
St. L
San D
Baton
India
Milwa
Bosto
Colum
Minne
Bridg
CleveCinci
San J
Hartf
Wichi
Detro
New O
SeattLos A
San F
Dalla
Portl
Chica
Houst
−50,000
0
50,000
100,000
Ch
an
ge
in J
obs
−10,000 −5,000 0 5,000 10,000
Change in Exports in Mils

BROOKINGS | July 201018
workers in a non-exporting industry located in the same metropolitan area. This relationship is highly significant, even adjusting for individual characteristics like age, education, immigrant status, race, and gender, as well as effects associated with specific metropolitan areas, occupations and industries.
One possible explanation for this result is that more educated workers are employed by exporting industries. Yet, the analysis conducted here finds that the export premium holds even adjusting wages for average education attainment in the metro exporting industry. Moreover, even workers without high school diplomas earn the export premium. Workers who lack high school diplomas earn wages that are roughly one percent higher, on average, for every billion dollars of exports produced by their metro-industry. Hence, the explanation for the premium seems to be that working in a metro exporting industry makes workers more productive. Other studies have suggested that exporting firms are more innovative, which may explain why they can afford higher wages.75
Exporting industries paid considerably more than the 2008 national average wage of $45,563.76 High paying metro industries such as pharmaceuticals in the New York metropolitan area are responsi-ble for an estimated $20 billion in foreign sales and pay $105,213 in average wages (Table 7). Computer manufacturing in San Jose (paying $114,053), airplane manufacturing in Seattle (paying $81,004), autos in Detroit (paying $76,706), and film production in Los Angeles (paying $94,952) are among top exporting industries in the top 100 metro areas.77 Many of these industries generate not only direct export sales, but additional proceeds from royalties on patents and trademarks, which are included in the measure of export sales.
6. Future export growth will come increasingly from large emerging markets. With the rapid urbanization and growth in emerging economies, developing countries will drive the growth of the world’s consumption in the future. While only 30 percent of the world’s population lived in urban areas in 1950, today it’s over half, and the United Nations forecasts that 70 percent of the world’s population will be urbanized by 2050.79 This urbanized population will increasingly have more purchasing power and demand more specialized goods and services.
Figure 4. Wages and Exports2008 Analysis of Metropolitan Industries
Brookings Institution Analysis of IPUMS, BEA, Moody’s Economy.com,
IIE, IRS, USITC for 5400 Individuals in 94 MSAs & Industries
T−statistic=8.2, errors clustered on MSA;
MSA−Industries dropped if less than 10 observations, see appendix
0
50,000
100,000
150,000
Indu
stry
Wages
0 5,000 10,000 15,000 20,000
Industry Exports in Mils
Annual Wages in MSA Industry Fitted values

BROOKINGS | July 2010 19
Brazil, India, and China (the BIC countries) will play a major role in this trend.80 Based on the International Monetary Fund estimates, the BIC countries combined will be more than a quarter of the world economy by 2015, a rapid increase from the 19 percent share in 2008.81 Further, according to a recent Brookings study, the BIC countries, which accounted for 8.4 percent of the global middle class consumption in 2009, could reach 26 percent by 2020, conditional on continuous policy adjustment and structural transformation.82 The United States has not fully taken advantage of this emerging wave. The U.S. exports to the BICs were only 8.8 percent of U.S. sales abroad in 2008. However, they have been growing rapidly over the last five years and proved resilient during the recent crisis.
The United States sold $142 billion worth of goods and services to the BIC countries in 2008. U.S. exports to the BICs more than doubled in real terms over the 2003–2008 period, with exports to China
Table 7. The 30 Largest Metro-Industry Exports and Their Wages, 2008
2008 2008
Metro Industry Average Annual Wages
Metro Area Exporting Industry Exports in Mils in Metro Industry
New York-Northern New Jersey-Long Island, NY-NJ-PA Chemicals 20,409 105,213
Portland-Vancouver, -Beaverton, OR-WA Computer and Electronic Products 19,456 91,535
San Jose -Sunnyvale-Santa Clara, CA Computer and Electronic Products 19,394 114,053
Houston-Sugar Land-Baytown, TX Chemicals 16,082 87,300
Los Angeles-Long Beach-Santa Ana, CA Computer and Electronic Products 14,797 70,653
Detroit-Warren-Livonia, MI Transportation Equipment 14,020 76,706
Seattle-Tacoma-Bellevue, WA Transportation Equipment 12,872 81,004
Dallas-Fort Worth -Arlington, TX Computer and Electronic Products 11,397 93,290
Los Angeles-Long Beach-Santa Ana, CA Transportation Equipment 9,917 81,445
Boston-Cambridge-Quincy, MA-NH Computer and Electronic Products 9,689 101,085
New York-Northern New Jersey-Long Island,
NY-NJ-PA Professional, Scientific, and Technical Services 9,346 104,005
Los Angeles-Long Beach-Santa Ana, CA Motion Picture and Sound Recording Industries 8,603 94,952
Houston-Sugar Land-Baytown, TX Machinery 8,479 73,163
San Francisco-Oakland-Fremont, CA Petroleum and Coal Products 8,101 148,481*
Chicago-Naperville-Joliet, IL-IN-WI Machinery 7,668 66,513
Phoenix-Mesa-Scottsdale, AZ Computer and Electronic Products 7,082 85,395
Chicago-Naperville-Joliet, IL-IN-WI Chemicals 6,999 79,350
Austin-Round Rock, TX Computer and Electronic Products 6,990 92,223
Dallas-Fort Worth-Arlington, TX Transportation Equipment 6,618 80,622
Dallas-Fort Worth-Arlington, TX Chemicals 6,559 56,299
Los Angeles-Long Beach-Santa Ana, CA Chemicals 6,502 52,670
Houston -Sugar Land-Baytown, TX Petroleum and Coal Products 6,178 98,121
Philadelphia-Camden-Wilmington, PA-NJ-DE-MD Chemicals 5,679 94,073
Washington-Arlington-Alexandria, DC-VA-MD-WV Professional, Scientific, and Technical Services 5,533 108,101
Indianapolis-Carmel, IN Chemicals 5,437 85,415
Los Angeles-Long Beach-Santa Ana, CA Professional, Scientific, and Technical Services 5,345 86,683
Wichita, KS Transportation Equipment 5,322 61,563
New Orleans-Metairie-Kenner, LA Petroleum and Coal Products 5,157 86,389
San Francisco-Oakland-Fremont, CA Computer and Electronic Products 4,824 128,540
Note: Royalties exports were added to the exports of the industry that created the intellectual property right. Wages were calculated from the Census Bureau’s 2008
American Community Survey, provided by IPUMS.78
* The source for the average wages in the San Francisco-Oakland- Fremont, CA, petroleum and coal products industry is BLS, Quarterly Census of Employment and
Wages (QCEW).
Source: Brookings analysis of Moody’s Economy.com, U.S.ITC, BEA, IRS, and IIE data

BROOKINGS | July 201020
almost half that growth. Given that they have been growing at a much faster rate than U.S. exports elsewhere, the BIC countries have been gaining share as U.S. export markets—from 5.9 percent to 9.6 percent of U.S. exports between 2003 and 2009. U.S. exports dropped almost 11 percent in 2009, but the exports to the BICs declined by only 2.8 percent. Growing U.S. exports to China in 2009 coun-terbalanced the 9.7 percent drop in sales to Brazil and 6.7 percent decline in sales to India.
The composition of the U.S. exports to the BICs changed between 2003 and 2008. About three quarters of U.S. exports to these countries are merchandise, mainly manufactured goods, and a quarter is services. In 2003 the largest U.S. exports to the BICs were in the computer and electronics category, but by 2008 chemicals and transportation equipment were dominant. As a result, 12.4 percent of U.S. exports of chemical products are going to the BIC markets. U.S. services sales have also expanded. For example, U.S. sales of business and professional services to BIC customers, such as consulting, architecture, and legal services, more than doubled during the same time period.
Computers and electronics hold the top spot for U.S. exports to China. Eight percent of U.S. com-puter and electronics sales in 2008 went to the Chinese market. Chemicals were the largest U.S. export to both Brazil and India, with transportation equipment being in second place. All three exports increased significantly between 2003 and 2008. U.S. exports of chemicals almost doubled, computer and electronics more than doubled and transportation equipment sales to the BICs almost tripled in the five year period. The metropolitan areas that produce these goods are well-positioned to take advantage of the growth of the BIC countries.
The nation’s large Western metropolitan areas are the largest computer producers and exporters of computer and electronics equipment to China. Six out of the top 10 metropolitan areas that are major exporters of computers to China are located in California, Oregon, Washington and Arizona (Table 9). Texas’ large metro areas, Dallas, Austin, and Houston also figure prominently among the major U.S. computer and electronics sellers to China. Boston is the only Northeastern large metro that is a large exporter of the No 1 U.S. sale category to China.
Table 8. Top 10 U.S. Exports to the BIC countries, 2008
Rank Export Category 2008 (blns USD) Share out of U.S. Exports to BICs
1 Chemicals 20.5 14.4%
2 Transportation Equipment 17.2 12.1%
3 Computer and Electronic Products 16.1 11.3%
4 Machinery 13.4 9.4%
5 Agriculture 10.2 7.2%
6 Travel and Tourism 8.7 6.2%
7 Business Services 6.6 4.7%
8 Education 5.2 3.7%
9 Royalties from Intellectual Property 5.1 3.6%
10 Freight and Port Services 4.9 3.5%
Top 10 U.S. Exports to BICs 107.8 75.9%
U.S. Exports 142 100.0%
Source: Based on BEA 2010, USITC 2010

BROOKINGS | July 2010 21
The large metropolitan areas that are producers and exporters of chemicals are scattered across the country. The Northeastern metros of New York, Philadelphia, and Boston produced 15 percent of U.S. exports of chemicals to India in 2008 (Table 10). Houston and Dallas followed suit with 12 percent. Some smaller metro areas, such as Baton Rouge, are also among the metropolitan areas that are major producers of chemicals and exporters to India.
Table 9. Top Metros Exporting of Computer and Electronics Equipment to China
Computer and Electronics exports to China, Share out of U.S.
Metro Area 2008 (mil $) computer exports to China
Portland-Vancouver-Beaverton, OR-WA 1,015 9.2%
San Jose-Sunnyvale-Santa Clara, CA 1,014 9.2%
Los Angeles-Long Beach-Santa Ana, CA 769 6.9%
Dallas-Fort Worth-Arlington, TX 594 5.4%
Boston-Cambridge-Quincy, MA-NH 505 4.6%
Phoenix-Mesa-Scottsdale, AZ 371 3.3%
Austin-Round Rock, TX 364 3.3%
San Francisco-Oakland-Fremont, CA 251 2.3%
Houston-Sugar Land-Baytown, TX 237 2.1%
San Diego-Carlsbad-San Marcos, CA 222 2.0%
Top 10 total 5,343 48.2%
Largest 100 metro areas 8,386 75.7%
United States 11,074
Source: Brookings analysis of Moody’s Economy.com, U.S.ITC, BEA, IRS, and IIE data
Table 10. Top 10 Metropolitan Exporters of Chemicals to India, 2008
Chemicals exports to India, Share out of U.S.
Metro Area 2008 (mil $) chemical exports to India
New York-Northern New Jersey-Long Island, NY-NJ-PA 522.1 10.8%
Houston-Sugar Land-Baytown, TX 410.1 8.5%
Chicago-Naperville-Joliet, IL-IN-WI 178.5 3.7%
Dallas-Fort Worth-Arlington, TX 167.3 3.5%
Los Angeles-Long Beach-Santa Ana, CA 166.1 3.4%
Philadelphia-Camden-Wilmington, PA-NJ-DE-MD 144.5 3.0%
Indianapolis-Carmel, IN 138.6 2.9%
San Francisco-Oakland-Fremont, CA 92.1 1.9%
Baton Rouge, LA 87.0 1.8%
Boston-Cambridge-Quincy, MA-NH 62.8 1.3%
Top 10 total 1,969.1 40.9%
Largest 100 metro areas 3,284.5 68.2%
United States 4,815.0
Source: Brookings analysis of Moody’s Economy.com, U.S.ITC, BEA, IRS, and IIE data

BROOKINGS | July 201022
The Midwestern large metropolitan areas were still the largest U.S. producers of transportation equipment in 2008 and they delivered almost a fifth of the U.S. exports of transportation equipment to Brazil. Detroit, Wichita, Hartford, and Cincinnati produced 12.2 percent of U.S. exports of transporta-tion equipment to Brazil (Table 11). Western metro areas, such as Seattle, Los Angeles, and Phoenix are also major producers and exporters of transportation equipment.
IV. Policy Implications
In the aftermath of the recession, a U.S. economy searching for demand growth should look to become more export oriented and less dependent on domestic consumption. Exports could deliver good paying jobs, especially at a premium now, due to the so far jobless recovery and continuing wage disparities. An increase in exports relative to imports also could help reduce
U.S. dependence on foreign borrowing and the chance of massive investment bubbles.The focus of U.S. export policy to date has been on trade and export promotion. Trade barriers,
either tariffs, quotas, or more subtle technical barriers distort the incentives to trade. In this regard, the negotiation and enforcement of trade agreements are an essential factor in increasing exports. Further, government provision of foreign markets research and export financing helps U.S. firms, espe-cially small and medium sized businesses, overcome the risks inherent in doing business in foreign countries.
Though key components of U.S. export strategy, trade and export promotion will not by themselves deliver the goal of doubling exports. Increasing exports requires a broader export strategy that moves beyond the conventional discourse about trade and export promotion. Firms that are willing to take risks in the production and export of new goods and services could be helped with a consistent innovation and clusters policy, and deliberate and focused freight strategies, all implemented in an evidence-driven manner. The advantage of including these policy areas in the export strategy is two-fold: it reduces the cost of production of U.S. exporting firms while at the same time it promotes the creation of jobs and value added in the United States.
To realize the U.S. export potential, America must connect the macro vision of a more export oriented economy to its metropolitan reality. This requires the export strategy to follow a new type of federalism, focused on metropolitan areas and economic competitiveness.83 Each responsibility should
Table 11. Top 10 Metropolitan Exporters of Transportation Equipment to Brazil, 2008
Metro Area Transportation equipment exports Share out of U.S. transportation
to Brazil, 2008 (mil) exports to Brazil
Detroit-Warren-Livonia, MI 437.0 6.3%
Seattle-Tacoma-Bellevue, WA 401.2 5.8%
Los Angeles-Long Beach-Santa Ana, CA 308.9 4.5%
Dallas-Fort Worth-Arlington, TX 206.4 3.0%
Wichita, KS 165.7 2.4%
Hartford-West Hartford-East Hartford, CT 139.8 2.0%
Phoenix-Mesa-Scottsdale, AZ 109.1 1.6%
Boston-Cambridge-Quincy, MA-NH 102.6 1.5%
Cincinnati-Middletown, OH-KY-IN 94.7 1.4%
St. Louis, MO-IL 94.3 1.4%
Top 10 total 2,059.7 29.9%
Largest 100 metro areas 4,168.9 60.5%
United States 6,886.0
Source: Brookings analysis of Moody’s Economy.com, U.S.ITC, BEA, IRS, and IIE data

BROOKINGS | July 2010 23
be handled at the lowest possible effective level.84
“Dividing the job” is not a new idea.85 Given the findings of this report, three main policy goals and areas of improvement emerge: leveling the playing field on trade and currency, improving U.S.-made products for export, and connecting those products to global markets.
A. Leveling the Playing Field on Trade and CurrencyThe federal government is the only entity able to carry out currency and trade policies. In its efforts to double exports, the U.S. government should more actively pursue negotiations around exchange rates and trade liberalization.
The previous surge periods of U.S. exports show that the exchange rate of the dollar is an important variable in this process, but not the only one. Setting policy effects aside, the rapid increase of U.S. exports during 1987-1992 was caused mainly by the dollar’s depreciation and the relatively stronger growth in America’s export markets.86 With the dollar estimated to be overvalued currently, there is plenty of room for the dollar to depreciate.87 A fair market exchange rate of the dollar with the main U.S. trading partners’ currencies could contribute to the expansion of U.S. exports.88 Given the benefits to all the parties involved in trade, bilateral and multilateral discussions should move forward, and the United States should advocate appropriate changes to international trade law to address exchange rates.89
The U.S. government should push for better access to more sectors especially in export markets that are growing rapidly. For example, while the United States economy is projected to grow by 2.9 percent in 2011, the emerging economies in Asia are estimated to grow at 8.5 percent next year.90 The focus should be on industries in which the United States is competitive internationally and could cap-ture a niche market. However, mere access is not sufficient; U.S. companies have to be assured that their intellectual property rights are protected in these countries.
Over the medium term, the federal government should push to open new markets to U.S. com-panies. While the existing export markets will be the source of any export growth over a five year horizon, new markets are essential for export growth over a longer time frame. For example, between 1993 and 2003, U.S. firms that accessed new markets or sold new products comprised 42 percent of the export growth.91
More bilateral trade agreements and especially multilateral trade agreements will deliver new foreign demand for U.S. goods and services. Besides moving the Doha agenda forward, more attention should be paid to the other free trade agreements (FTAs). There is evidence that FTAs boost overall trade, which despite harming some U.S. businesses and their workers (who should be compensated for their loss) tends to enrich the country.92 As to exports in particular, FTAs do not guarantee that exports will increase relative to imports, but most American FTAs did result in an improvement in the trade balance in goods.93
The United States has been slow in reaching free trade deals with the rapidly growing Asian coun-tries. For example, while the United States is at the beginning of negotiations to join the Trans-Pacific Partnership, the European Union is on its last leg of negotiations with India on a free trade agree-ment and China has a new free trade area with the Association of South-East Asian Nations (ASEAN) starting this year.94 This new China- ASEAN free trade area is the largest free trade in the world, with a market of 1.9 billion people.
B. Improving U.S. Made Products for ExportIn an increasingly competitive world, where developing countries are moving up the value chain, it is essential for the United States to maintain the pace of innovation to improve and perfect products and processes. However, new technologies, products, and business models present larger benefits than innovators and entrepreneurs can capture, resulting in private under-investment in R&D.95 While the federal government funds basic research, this R&D activity is spread across the country, often failing to reach the critical size for fueling economic clusters.96 Moreover, private innovation efforts, as expressed by R&D services, are increasingly divorced from manufacturing locations.97
First and foremost, the federal government should follow through on the promise of increasing funding for R&D up to 3 percent of GDP.98 Given that manufactured goods are still a major part of U.S. exports, support for technology modernization efforts in manufacturing would help in growing

BROOKINGS | July 201024
U.S. exports.99 Modeled on successful efforts in Korea and Finland, the United States should create a National Innovation Foundation, for better coordination of the government’s fragmented efforts to boost commercialization of innovations in fields such as precision manufacturing, information tech-nology, and clean energy.100 Both the firms exporting high value added goods and services and their metro locations would benefit from increased federal and state support for cluster development that clearly connects R&D and human capital policies to process-innovation and co-location.101
The federal government should enhance the nascent regional innovation cluster initiatives. These competitive programs allow states and metro areas to strengthen their critical regional innovation networks and clusters. The Economic Development Administration (EDA) created a regional innova-tion cluster program in 2009 and the administration announced in February this year a multi-agency energy regional innovation cluster (E-RIC).102 The E-RIC program emphasizes collaboration between agencies and the private sector focused on filling the gap between scientific discovery and com-mercialized knowledge in a localized manner.103 These regional innovation hubs would provide a clear impetus for more co-location of high technology services and manufacturing.104
Metro areas can also help their companies move up the value chain by strengthening their existing centers of innovation, in public and private research institutions, and fostering emergent, high-poten-tial clusters. Moreover, they could partner with or otherwise support private sector and non-profit sector organizations that provide cluster support services, such as industry-specific training, market intelligence, and loans.105 They could also encourage existing clusters to create an export strategy as part of their development plan.
After identifying their exporting industries, metro areas could better cater to their workforce needs. Becoming more competitive does not mean necessarily a college education, but it does require more than a high school diploma. Local community colleges and post-secondary technical schools will deliver the bulk of the next American workforce.106 Providing this ecosystem, metro areas incentivize companies to co-locate their research and development services with manufacturing, basically anchor-ing the firms in the region.107
As a fundamental foundation, leaders at every level should undergird the efforts on clusters and innovation with renewed commitment to science, technology, engineering, and mathematics (STEM) education.
C. Connecting U.S. Products to Global Markets
National Export Promotion The National Export Initiative (NEI), launched in March 2010, is the latest federal policy to promote U.S. exports.108 This export promotion policy is focused on increased trade financing, advocacy, and as-sistance for American businesses, especially small and medium sized businesses interested in expand-ing their markets abroad.
It is difficult to evaluate the effectiveness of export promotion activities, due to numerous factors that impact the export volumes of firms.109 However, a World Bank review of 103 countries shows that export promotion agencies have a significant impact on the volume of exports, on average.110 The study also found out that a single export promotion agency, small but with well-defined responsibili-ties works better than a number of agencies involved in the export promotion effort. The private sector should be heavily involved in the strategy of this agency, but the government would provide the bulk of funding. The agency should focus on broad sectors, such as manufacturing, agriculture, and high- tech. Beyond the regular targeting of small and medium sized businesses, the agency should pay attention to large firms that are not exporting yet.
The NEI proposes a decentralized network of initiatives across federal agencies and not a sin-gle export promotion agency. This follows the model already in place with the Trade Promotion Coordinating Committee (TPCC) as the main facilitator, as described above. According to GAO, while TPCC has improved in its performance, it lacks a review of how the agencies involved in export promo-tion allocate budgets relative to government-wide export promotion priorities.111
To better connect U.S. products to global markets, the following changes should be considered: • Federalexportfinancingshouldbemoretargeted,togetmoreefficiencyoutoffederalfunding,
reducing their costs upstream.112

BROOKINGS | July 2010 25
• ThefederalagenciesinvolvedinNEIshouldhaveaclearcoordinationprocess,withtrans-parent distribution of funding and responsibilities for export promotion.113
• Thefederalgovernmentneedstobecomemorefederalistinthinkingandactionandengage more aggressively the private sector in the export strategy.
• StatesandmetropolitanleadersshouldbepartofthePresident’sExportCouncil.114
• NEIshouldbeaninteractiveandeducationalforumforalltheactorsinvolved,beitgovern-ment or private sector.
Finally, the federal government should integrate the different pieces of the broader export strategy. Extending the NEI beyond the traditional trade, currency, and export promotion requires a mechanism connecting these policies and the domestic areas of innovation, freight, and data collection. The fact is that U.S. exporting companies benefit when federal agencies leverage each other’s sources to help U.S. exports. Suniva, a photovoltaic cells manufacturing company located in Atlanta, is an example of a successful U.S. exporter benefiting from targeted government aid (See Sidebar).115
Metropolitan Export InitiativesAdditionally, metropolitan areas should develop their own initiative to boost metro exports, which must be evidence driven, cluster led, and metropolitan in scope and scale.116 Ideally, these initiatives should be organized and even implemented by business groups with support from other sectors—civic, government, labor, and university—that are critical to success. Metro leaders need to understand that the well- being of their constituencies will depend increasingly on how much their businesses sell abroad, where the demand resides. While some metropolitan areas are aware of their exports (the metros in the Bay Area and Seattle), most metro areas, large or small, do not pay particular attention to foreign demand (See Sidebar).117 A metropolitan export initiative should complement efforts to identify and strengthen metropolitan industry clusters. Most of the metro exports are generated by metro export clusters and metro leaders should build on their export clusters through a broad array of policies: collective marketing efforts to nurture distinctive regional brands, tailored assistance to their exporters, capital vehicles that are tailored to different stages of development, workforce training, and freight prioritization. Examples from abroad could help metro leaders in their plans (See sidebar).
Metropolitan areas should collaborate with the state and federal export promotion offices for more or tailored assistance for their exporters. Ex-Im Bank has already a city/state partners program that helps businesses learn about the credit enhancement products available to jump-start export activities. Metropolitan areas, such as Los Angeles and New York have been part of the network since 2007 through the Los Angeles Area Chamber of Commerce and the Brooklyn International Trade Development Center.
Metro areas should learn how to use most effectively federal and state services and not dupli-cate them (Map 3). While some metro areas such as those in the Bay Area can afford an office abroad, most metro areas could take advantage of the federal Export Assistance Centers (within Commerce’s International Trade Administration (ITA)) at home and abroad to organize trade missions under a metro brand.
For example, the newly created Economic Development Administration/International Trade Administration Job Creation Mission helps U.S. communities generate jobs by connecting the metropolitan areas with opportunities offered by the global marketplace. In April 2010, the first mission to Hannover, Germany had 16 U.S. economic development organizations, half of which represented auto communities.
A metropolitan export initiative should be sector agnostic and concentrate on the strengths of a metropolitan area. Moreover, in a similar fashion with the national export strategy, an export strategy at the metro level should go beyond export assistance services. Metro areas should leverage the innovation, human capital, freight, and data collection policies to fuel their exports. These policies allow the development of the export capability of a metro area: large companies, small and medium enterprises, research institutions, infrastructure, specialized services, skills providers and business associations.
The Trade Development Alliance of Greater Seattle
The Trade Development Alliance (TDA) of Greater Seattle has been promoting and enhancing the identity of the region in targeted world markets through marketing publications, trade missions, and benchmarking against other global cities. Each year, TDA organizes a Seattle trade mission to a city abroad. TDA takes a large group of Seattle business and civic leaders abroad every year to try to “steal” what policy makers have done in places like Stockholm, Helsinki, Singapore, Melbourne, Sydney, Abu Dhabi, Dubai, and Barcelona. The TDA trade missions created export opportunities for Seattle based firms and provided a learning exercise for Seattle policy makers. TDA works with the Export-‐ Import Bank and the federal Export Assistance Center in Seattle to provide technical assistance to Seattle-‐ based companies that have international business interests. TDA sits on the board of their Seattle offices and staff from these offices is part of the TDA board. By working across agencies and promoting inclusivity within the region, together with the Greater Seattle Chamber of Commerce, TDA is able to quickly and effectively respond to changing domestic and international business trends.
The Trade Development Alliance of Greater SeattleThe Trade Development
Alliance (TDA) of Greater Seattle has been promoting and enhancing the identity of the region in targeted world markets through marketing publications, trade missions, and benchmarking against other global cities.
Each year, TDA organizes a Seattle trade mission to a city abroad. TDA takes a large group of Seattle business and civic leaders abroad every year to try to “steal” what policy makers have done in places like Stockholm, Helsinki, Singapore, Melbourne, Sydney, Abu Dhabi, Dubai, and Barcelona.
The TDA trade missions created export opportunities for Seattle based firms and provided a learning exercise for Seattle policy makers.
TDA works with the Export- Import Bank and the federal Export Assistance Center in Seattle to provide technical assistance to Seattle- based companies that have inter-national business interests. TDA sits on the board of their Seattle offices and staff from these offices is part of the TDA board.
By working across agen-cies and promoting inclusivity within the region, together with the Greater Seattle Chamber of Commerce, TDA is able to quickly and effec-tively respond to changing domestic and international business trends. n

BROOKINGS | July 201026
Freight Policy Seaports and airports located in metro areas are important for the U.S. exports. Two thirds of the U.S. exports are merchandise and three quarters of the goods export tonnage is shipped abroad through ports. In addition, goods exports carried by commercial airplanes make up more than a third of the U.S. goods exports value.118 Large metropolitan areas are essential to the export flows. Seventy percent of U.S. goods exports were shipped from freight gateways located in 40 large metropolitan areas in 2008.119 A bottle-neck in these ports would have ripple effects across the country.
In collaboration with the states and metropolitan areas, the federal gov-ernment should develop a comprehensive National Freight Transportation Plan as a framework for goods movement policy and investment that spans all modes.120 This process should build off of the FHWA’s Freight Performance Measures Initiative and prioritize corridors on a cost-benefit analysis that would include all modal options.121 Learning from Germany, the United States should create a finance and evaluation mechanism to support its major seaports and airports to remain globally competitive.122 Funding mechanisms such as the Transportation Investment Generating Economic Recovery (TIGER) grants and the Transportation Infrastructure Finance and Innovation Act (TIFIA) program could help, but they would be insufficient. A National Infrastructure Bank, focused on projects of national significance, would be a more appropriate federal financing vehicle for major freight improvements.123 Last but not least, more public–private partnerships in financing the modernization of the nation’s ports and airports would leverage the federal funding.
Improve Market Information and Maximize PerformanceOverarching these efforts should be evidence driven and performance measured policies that would allow for better management and course cor-rection of export strategy. This would require all levels of government to im-prove their data collection on export trends, export capabilities, and export promotion activities. These metrics are necessary for any measurement of success of the policies implemented, an issue inherently difficult due to the convoluted relationship between export promotion and export volumes.124
Federal export statistics suffer from a number of problems that limit export analyses. In order to identify the location of production of U.S. exports, it would be helpful for the current systems of data collection to require identification of the county of the producer of the good or service exported. It would be helpful for Census to create a master concordance between services exports categories and NAICS codes, as it has done for goods. This would allow a link between service export figures and their producers’ characteristics. The federal government needs also to collect better data on the export promotion activities. As the GAO found out, the Commercial Service within the ITA, the main federal body in charge of export promotion of nonagricultural products, does not have reliable and sufficient data on its customer base.125
Support for the U.S. Census and Bureau of Economic Analysis to collect more geographically detailed data would help. Ultimately, most metro-politan areas, in partnership with the local Chambers of Commerce, could
collect the export data on their own with the help of a survey. The focus should be on exports that companies produce in a certain metro area and on the destination markets of these exports. Service exporters should be also included in the survey, given the rising importance of service exports in met-ropolitan areas and the United States, as a whole.
Suniva—An American Success StorySuniva, Inc. manufactures high-efficiency silicon solar cells and high power solar modules. The com-pany was created in 2007 by Dr. Ajeet Rohatgi, an Indian born scientist educated in the United States. The firm is based on his work at the Georgia Institute of Technology’s University Center of Excellence in Photovoltaics (UCEP), a Department of Energy Center of Excellence.
The company located in the Atlanta metro area has been growing rapidly, with nearly $1 billion in orders from Indian and European solar module makers between 2007 and 2009. Ninety percent of Suniva’s sales in 2009 were exports and it is expected to export well over 100 million dollars in 2010. More than 85 percent of the content of its products is U.S.-made.
In 2009 Suniva was already considering a sec-ond plant. The company was selected for consider-ation of a $141 million loan guarantee from the U.S. Department of Energy Loan Guarantee Program in April 2010. If successful, Suniva will use this loan guarantee towards the construction of a new plant in the Saginaw metro area in Michigan.
Suniva has 160 employees and is planning to hire 500 additional staff at the future plant in Michigan. The Michigan Economic Development Corporation estimates this investment would generate 2,000 indirect jobs for the Michigan economy. In addition, the loan guarantee would enable Suniva to quadruple exports over the next five years, according to Bryan Ashley, the Chief Marketing Officer at Suniva.
Suniva used also the services of Ex-Im Bank to expand in India. It got the Ex-Im Bank’s short-term multibuyer insurance policy to offer a $500,000 credit line to a customer in India. This credit line has led to several customers applying for Ex-Im Bank loans.
The company won the 2010 Renewable Energy Exporter of the Year from Ex-Im Bank and ranked second in The Wall Street Journal’s Top 10 Venture-Backed Clean Technology Companies in 2010. n

Large metros — 5 EACs
Large metros — 3 EACs
Large metros — 2 EACs
Large metros — 1 EAC
Small metros — 1 EAC
Micros — 1 EAC
Export Assistance Centers
BROOKINGS | July 2010 27
V. Conclusion
In the aftermath of the recession, increasing U.S. exports could contribute significantly to the reduction of the current job deficit, and the largest 100 metropolitan areas are central to this potential
Exports deliver good paying jobs. U.S. exports supported 11.8 million jobs nationally and 7.7 million jobs in the top 100 metro areas in 2008. The export related jobs pay better than met-ropolitan jobs in other industries. For every $1 billion dollar increase in the exports of the industry in which they work, workers in the exporting industries located in 94 of the top 100 metro areas earn roughly one to two percent higher wages. Even workers without high school diplomas earn an export premium, if they work in an export industry.
To build its next economy, the United States needs to connect the macroeconomic goal of increasing exports with the metropolitan reality. Any export promotion strategy should follow a metro-centric federalist perspective and be a true public-private partnership to be effective. While the federal government should lead in trade and currency policies, together with the states, it should empower metropolitan areas on export promotion, innovation, freight, and data collection policies. Metropolitan leaders should innovate to increase their export capabilities and modernize their economic development strategy from 20th century thinking to 21st century action on export-oriented economic growth. Ultimately, all U.S. metropolitan areas, large or small, must export more. Public and private sector leaders have to overcome their export paralysis and get engaged actively in the export game to create good paying jobs at home.
Map 3. Federal Export Assistance Centers, United States, 2010
Data source: U.S. Commercial Service, ITA, 2010.
Veneto, Italy’s Export Led Cluster InitiativeThe Veneto (Venice) regional economy is fueled by clusters of small and medium-sized businesses in industries such as clothing, furniture, and kitchen appliances. Although specialized in highly com-petitive global sectors and in the eurozone, this metro region prospered over the last decade based on its sales abroad. The Veneto region accounts for around one-quarter of all Italy’s exports.
Veneto pursued actively an export led cluster strategy over the last two decades, in order to maintain its competi-tive advantage. The Veneto firms went up the supply chain in their industries, concentrating on the higher value added activities. Given that 93 percent of the firms in the Veneto region have below ten employees, the region passed the Veneto Cluster Law in 2003, a policy that supports financially clusters which employ no less than 1000 workers.
Further, the region is financing innovative firms and working to develop a green energy and infrastruc-ture sector. With financial help from the European Regional Development Fund and the Italian government, the Veneto region aims to invest more than 452 million euros between 2007 and 2013. n

BROOKINGS | July 201028
APPENDIX A
HOW THE EXPORT DATA WAS PRODUCEDThe purpose of this study is to examine the U.S. exports produced in the top 100 metropolitan areas. While the Census Bureau (Census) and the International Trade Administration (ITA) have been compil-ing metropolitan goods exports since 1995, these data do not accurately reflect the origin of produc-tion. They are allocated based on origin of movement declared by the exporter, which is not always the place where the good was produced. In addition, if the exported goods are consolidated, the metro export series assigns them to the metro area where the consolidation point is located.129 Last but not least, the Census- ITA metro exports data are limited only to merchandise trade, not including services flows.
This study allocates U.S. domestic exports associated with an individual industry in proportion to each metropolitan area’s Gross Metropolitan Product (GMP) share generated by the same industry in the United States. This assumes if Wichita, KS produces 20 percent of the national value added of transportation manufacturing, then this metro area also exports 20 percent of the U.S. transportation equipment. In the case of trading partners, this report apportions the U.S. exports associated with an industry sold to a particular country to each of the 100 largest metro areas in proportion with the metro share of output produced by that same industry to the national total.
Our methodology uses output instead of employment to allocate the national exports to the metro level, because the GMP reflects better the value added by the exported goods and services.130 The difference is more at the conceptual level- there is a very high level of overlap between the export estimates based on employment and on output.131
In an effort to better approximate metropolitan services exports, this study employs a different allo-cation method for three service categories. Those three are royalties from intellectual property, travel and tourism, and education.
First, for royalties, this study introduces an additional step in the allocation method. This study first calculates an industry’s specific royalties acrrued from the use of U.S. patents and trademarks by foreigners by multiplying the U.S. royalties export revenue with the share of the industry’s royalties out of the total U.S. royalties. We allocate this industry’s royalties exports to the metropolitan level in proportion to each metropolitan area’s Gross Metropolitan Product (GMP) share generated by the same industry in the United States.132
A similar allocation method was used for the travel and tourism exports, by estimating first the export revenues that accrue to an industry that sells goods and services consumed by foreign tourists. U.S. travel exports were multiplied by the share of a tourism-related industry’s sales out of the total U.S. tourism and travel sales. Then this industry’s travel and tourism exports were allocated to metro-politan areas in proportion to each metropolitan area’s share of value added in the same industry.
Finally, in the case of education, this study uses the metropolitan share of the number of foreign students out of the total number of foreign students in the United States to allocate national education exports to metropolitan areas. This data was obtained from the Institute for International Education.
The method uses here is similar to previous efforts to estimate sub-national export data based on location of production. Testa, Klier and Zelenev from the Federal Reserve Bank of Chicago employed a similar method, using metropolitan industry employment shares.133 Brooks, with the U.S. Department of Agriculture, used the state level agricultural production data to allocate U.S. exports of agricultural goods to the States of production.134 In addition, the Bureau of Economic Analysis (BEA) uses an allo-cation method to estimate the Gross Metropolitan Product from the state output.135
Accuracy of the Estimates and a Comparison to the ITA’s Metropolitan Exports SeriesComparing the Brookings exports estimates to the ITA data confirms that the Brookings estimates are much more accurate. In general, they are highly correlated, but there are some significant differences. According to the ITA metropolitan exports series, there are 15 metropolitan areas out of the 100 larg-est that exported a larger value of goods than they produced in goods. Export sales for an individual company could theoretically be higher than the gross value added by that company because value added does not include the value of intermediate inputs produced elsewhere but embodied in the product. For an entire metropolitan area, however, it is not credible that export sales could be worth
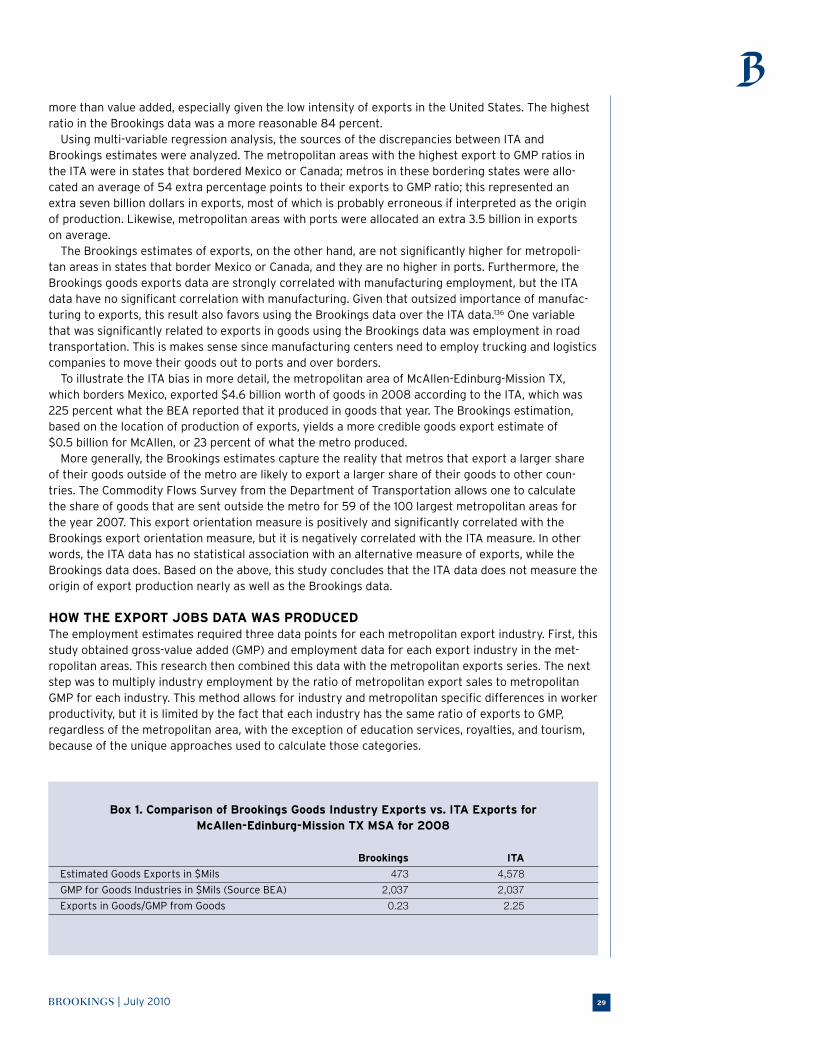
BROOKINGS | July 2010 29
more than value added, especially given the low intensity of exports in the United States. The highest ratio in the Brookings data was a more reasonable 84 percent.
Using multi-variable regression analysis, the sources of the discrepancies between ITA and Brookings estimates were analyzed. The metropolitan areas with the highest export to GMP ratios in the ITA were in states that bordered Mexico or Canada; metros in these bordering states were allo-cated an average of 54 extra percentage points to their exports to GMP ratio; this represented an extra seven billion dollars in exports, most of which is probably erroneous if interpreted as the origin of production. Likewise, metropolitan areas with ports were allocated an extra 3.5 billion in exports on average.
The Brookings estimates of exports, on the other hand, are not significantly higher for metropoli-tan areas in states that border Mexico or Canada, and they are no higher in ports. Furthermore, the Brookings goods exports data are strongly correlated with manufacturing employment, but the ITA data have no significant correlation with manufacturing. Given that outsized importance of manufac-turing to exports, this result also favors using the Brookings data over the ITA data.136 One variable that was significantly related to exports in goods using the Brookings data was employment in road transportation. This is makes sense since manufacturing centers need to employ trucking and logistics companies to move their goods out to ports and over borders.
To illustrate the ITA bias in more detail, the metropolitan area of McAllen-Edinburg-Mission TX, which borders Mexico, exported $4.6 billion worth of goods in 2008 according to the ITA, which was 225 percent what the BEA reported that it produced in goods that year. The Brookings estimation, based on the location of production of exports, yields a more credible goods export estimate of $0.5 billion for McAllen, or 23 percent of what the metro produced.
More generally, the Brookings estimates capture the reality that metros that export a larger share of their goods outside of the metro are likely to export a larger share of their goods to other coun-tries. The Commodity Flows Survey from the Department of Transportation allows one to calculate the share of goods that are sent outside the metro for 59 of the 100 largest metropolitan areas for the year 2007. This export orientation measure is positively and significantly correlated with the Brookings export orientation measure, but it is negatively correlated with the ITA measure. In other words, the ITA data has no statistical association with an alternative measure of exports, while the Brookings data does. Based on the above, this study concludes that the ITA data does not measure the origin of export production nearly as well as the Brookings data.
HOW THE EXPORT JOBS DATA WAS PRODUCEDThe employment estimates required three data points for each metropolitan export industry. First, this study obtained gross-value added (GMP) and employment data for each export industry in the met-ropolitan areas. This research then combined this data with the metropolitan exports series. The next step was to multiply industry employment by the ratio of metropolitan export sales to metropolitan GMP for each industry. This method allows for industry and metropolitan specific differences in worker productivity, but it is limited by the fact that each industry has the same ratio of exports to GMP, regardless of the metropolitan area, with the exception of education services, royalties, and tourism, because of the unique approaches used to calculate those categories.
Box 1. Comparison of Brookings Goods Industry Exports vs. ITA Exports for McAllen-Edinburg-Mission TX MSA for 2008
Brookings ITA
Estimated Goods Exports in $Mils 473 4,578
GMP for Goods Industries in $Mils (Source BEA) 2,037 2,037
Exports in Goods/GMP from Goods 0.23 2.25

BROOKINGS | July 201030
For 2008, export productivity, defined as the amount of exports required to support one job, was found to be $134,857. This figure is within the range—$125,000 to $166,000 exports per job—reported by Fred Bergsten of the Peterson Institute during Congressional testimony.137
DATA SOURCESThis study uses data from Moody’s Economy.com, the United States International Trade Commission (USITC), the Bureau of Economic Analysis (BEA), the Bureau of Labor Statistics (BLS), the Internal Revenue Service (IRS), and the Institute of International Education (IIE) to examine the export trends in the nation’s 100 largest metropolitan areas.
This study employs Gross Metropolitan Product (GMP) estimates from Moody’s Economy.com to compile the metropolitan share of the output produced by a certain industry out of the national total. While the BEA GMP data are of high quality and publicly available, the Moody’s Economy.com fills in the suppressed industry data from BEA.138
The USITC provides domestic goods exports by U.S. industries, as expressed by the North American Industry Classification System (NAICS).139 BEA provides services exports by specific categories, com-piled from a number of surveys targeted at certain service industries.140 In order to allocate services exports by production, this study constructs a match–up table between the BEA services export categories to the NAICS codes.141 The U.S. exports in this report are a sum of USITC goods domestic exports and BEA private services exports.142
This study uses the Institute for International Education data to measure the number of foreign students in each metropolitan area and then used it to allocate national education exports to metro-politan areas.143
For the travel and tourism related industries, this study used the travel and tourism satellite account from BEA to allocate travel exports first to industries (NAICS) and then to metropolitan areas based on their production of GMP in the given NAICS.
To measure royalties exports, this study used IRS industry receipts from royalties for 2007 to allo-cate U.S. royalties exports to industries and then to MSAs.144
To adjust for inflation from 2003 to 2008, the analysis uses the Bureau of Labor Statistics Producer Price Indexes for each of the 3-digit NAICS industries that export goods. This index was available for all goods except agricultural production. These indexes were not available in sufficient detail for services, so this study used the Bureau of Economic Analysis service export price indexes to adjust service export prices by service export category. The BEA exports index for agricultural goods was also used to adjust agricultural export prices. In both cases, 2003 export values were re-valued in 2008 prices before calculating the growth rate.
This paper analyzes exports of domestic goods by 26 major industries (at 3 digit NAICS level) and commercial services exports by 26 export categories (using BEA survey categories).145 Given this study’s focus on production, this study excluded goods exports such as re-exports, waste and scrap, second–hand merchandise, goods returned to Canada, special provisions, and services exports such as government services exports, military transfers, and expenditures in the United States of foreign governments and international organizations for maintenance of their embassies, consulates, head-quarters (other than employee compensation). The excluded exports amounted to 12.5 percent of the total U.S. exports in 2008,as reported by the Bureau of Economic Analysis.
The analysis of exports and wages uses individual data from the 2008 American Community Survey, which is organized and published by IPUMs.146 This study uses iPUMs data for export industry wages instead of BLS Quarterly Census of Employment and Wages (QCEW), due to the non-disclosure of a substantial number of observations in the BLS dataset. In addition, we use the iPUMs data for the wage model analysis. The iPUMs data were available for 94 metro areas, out of the largest 100 metro-politan areas in the country.
To obtain wage data for the following metropolitan areas, the QCEW was used because IPUMS data was not available or had too few observations: Honolulu, San Francisco, Miami, Portland, Columbia, El Paso, Provo, Omaha, Stockton, Poughkeepsie, Greenville, Ogden, and Tucson. The QCEW did not report data for Ogden and Tucson so the national average wage for their leading export industries was used instead of metropolitan level data. In all other cases the American Community Survey was used via IPUMS.

BROOKINGS | July 2010 31
We have chosen 2008 to serve as a basis of reference for the U.S. metropolitan exports. 2009 was an outlier year for U.S. exports. American exports declined by almost 11 percent in 2009, in real terms, the highest decrease since 1958.147
In order to test whether or not metropolitan export orientation is related to innovation, this report used new patent data from the Strumsky Patent Applications Database, which, through the work of Deborah Strumsky, aggregates and classifies historic and current patent information from the U.S. Trademark and Patent Office by geography. The data has been used in a variety of academic publications.148
Geographic DefinitionsThis study assesses export trends across the top 100 metropolitan areas in 2008, using metropolitan statistical areas (MSAs) as defined by the Office of Management and Budget (OMB) in 2008.149 There were 366 metropolitan areas in 2008 and this report focuses on the largest 100 metro areas by popu-lation, with at least 500,000 residents in 2008.150 We concentrate on this group, because they collec-tively contain two-thirds of the nation’s jobs and generate three-quarters of GDP.151
Wage ModelThis report investigates the relationship between individual wages and metropolitan exports. Since metropolitan area wages are likely to affect export competitiveness as well as be affected by it, regres-sions of metropolitan aggregates on metropolitan aggregates may be biased. One way around this problem is to relate individual wage data (since individual characteristics are unlikely to affect metro-politan area characteristics) to metropolitan averages. There are a number of empirical papers that use this method—selection through aggregation—while making the case that any resulting bias is likely to be trivial.152
To test the hypothesis that metropolitan exports in a given industry increase wages, the following equation will be estimated:
where M = Metro, I = Industry, i = individual, O = occupation,
1) Wi,I,M = X M,I + S M,I + Z i,I ,M + M m + O o + I I + r
This equation predicts individual annual income and wages based on metro-industry export values (X), metro-industry skill levels and specialization (embedded in the vector S), a large number of individual characteristics (Z), metropolitan effects (M), occupation effects (O), and industry effects (I). Z corresponds to a list of variables that are known to affect wages and may be correlated with industry exports. These include: attaining a high school diploma, attaining a college degree, attaining a post-graduate degree, age, race, gender, number of weeks worked, whether the resident has recently moved within the last year, foreign status, years spent in the United States, and labor force status. All regres-sion results adjust for these individual characteristics.
This model was estimated using a variety of specifications. To summarize the most noteworthy results, metro-industry exports predicted significantly higher wages controlling for any combination of the above controls, including occupational effects, industry effects, metro-industry-education, and metropolitan effects. We also find a significant export premium for workers without a high school diploma. These results are available at www.brookings.edu/metro/exports. In both cases, every billion dollars in metro-industry exports is associated with roughly 1 to 2 percent higher wages for individual workers in that metro-industry. One explanation for this result is that international competition demands higher worker productivity relative to domestic-oriented competition.

BROOKINGS | July 201032
APPENDIX B. Exports Produced in the 100 Largest Metropolitan Areas for 2008
Total Exports 2008
Rank Metro Area (in Billion dollars) Largest Export Industry
1 New York-Northern New Jersey-Long Island, NY-NJ-PA 85.16 Chemicals
2 Los Angeles-Long Beach-Santa Ana, CA 78.54 Computer and Electronic Products
3 Chicago-Naperville-Joliet, IL-IN-WI 52.88 Machinery
4 Houston-Sugar Land-Baytown, TX 51.55 Chemicals
5 Dallas-Fort Worth-Arlington, TX 44.55 Computer and Electronic Products
6 San Francisco-Oakland-Fremont, CA 30.90 Petroleum and Coal Products
7 Boston-Cambridge-Quincy, MA-NH 28.80 Computer and Electronic Products
8 Philadelphia-Camden-Wilmington, PA-NJ-DE-MD 27.44 Chemicals
9 Detroit-Warren-Livonia, MI 26.91 Transportation Equipment
10 Seattle-Tacoma-Bellevue, WA 24.16 Transportation Equipment
11 San Jose-Sunnyvale-Santa Clara, CA 22.79 Computer and Electronic Products
12 Portland-Vancouver-Beaverton, OR-WA 21.95 Computer and Electronic Products
13 Atlanta-Sandy Springs-Marietta, GA 20.32 Travel and Tourism
14 Minneapolis-St. Paul-Bloomington, MN-WI 18.99 Machinery
15 Phoenix-Mesa-Scottsdale, AZ 18.63 Computer and Electronic Products
16 Washington-Arlington-Alexandria, DC-VA-MD-WV 16.94 Business, Professional, and Technical Services
17 San Diego-Carlsbad-San Marcos, CA 15.49 Computer and Electronic Products
18 St. Louis, MO-IL 14.64 Transportation Equipment
19 Miami-Fort Lauderdale-Pompano Beach, FL 14.59 Travel and Tourism
20 Indianapolis-Carmel, IN 12.79 Chemicals
21 Cleveland-Elyria-Mentor, OH 12.70 Transportation Equipment
22 Cincinnati-Middletown, OH-KY-IN 11.82 Transportation Equipment
23 Riverside-San Bernardino-Ontario, CA 11.54 Transportation Equipment
24 New Orleans-Metairie-Kenner, LA 11.22 Petroleum and Coal Products
25 Milwaukee-Waukesha-West Allis, WI 10.25 Machinery
26 Austin-Round Rock, TX 10.22 Computer and Electronic Products
27 Pittsburgh, PA 10.13 Machinery
28 Denver-Aurora-Broomfield, CO 10.10 Business, Professional, and Technical Services
29 Charlotte-Gastonia-Concord, NC-SC 9.96 Chemicals
30 Hartford-West Hartford-East Hartford, CT 9.93 Transportation Equipment
31 Baltimore-Towson, MD 8.95 Chemicals
32 Columbus, OH 8.72 Transportation Equipment
33 Kansas City, MO-KS 8.40 Transportation Equipment
34 Tampa-St. Petersburg-Clearwater, FL 7.86 Computer and Electronic Products
35 Bridgeport-Stamford-Norwalk, CT 7.77 Chemicals
36 Nashville-Davidson--Murfreesboro--Franklin, TN 7.77 Transportation Equipment
37 Wichita, KS 7.43 Transportation Equipment
38 Baton Rouge, LA 7.39 Chemicals
39 Las Vegas-Paradise, NV 7.27 Travel and Tourism
40 Buffalo-Niagara Falls, NY 7.18 Chemicals
41 Orlando-Kissimmee, FL 7.07 Travel and Tourism
42 Virginia Beach-Norfolk-Newport News, VA-NC 6.72 Transportation Equipment
43 Rochester, NY 6.72 Machinery
44 Louisville-Jefferson County, KY-IN 6.65 Transportation Equipment
45 Providence-New Bedford-Fall River, RI-MA 6.62 Miscellaneous
46 San Antonio, TX 6.52 Transportation Equipment

BROOKINGS | July 2010 33
APPENDIX B. Exports Produced in the 100 Largest Metropolitan Areas for 2008 (continued)
Total Exports 2008
Rank Metro Area (in Billion dollars) Largest Export Industry
47 Sacramento--Arden-Arcade--Roseville, CA 6.31 Computer and Electronic Products
48 Salt Lake City, UT 6.12 Primary Metal
49 Greensboro-High Point, NC 5.96 Chemicals
50 Memphis, TN-MS-AR 5.56 Freight and Port Services
51 Oxnard-Thousand Oaks-Ventura, CA 5.54 Chemicals
52 Tulsa, OK 5.46 Machinery
53 Grand Rapids-Wyoming, MI 5.27 Transportation Equipment
54 Raleigh-Cary, NC 4.96 Chemicals
55 Richmond, VA 4.95 Chemicals
56 Dayton, OH 4.71 Transportation Equipment
57 New Haven-Milford, CT 4.66 Chemicals
58 Albuquerque, NM 4.50 Computer and Electronic Products
59 Birmingham-Hoover, AL 4.29 Primary Metal
60 Toledo, OH 4.28 Transportation Equipment
61 Omaha-Council Bluffs, NE-IA 4.02 Freight and Port Services
62 Tucson, AZ 3.98 Transportation Equipment
63 Oklahoma City, OK 3.94 Machinery
64 Albany-Schenectady-Troy, NY 3.84 Chemicals
65 Allentown-Bethlehem-Easton, PA-NJ 3.83 Chemicals
66 Fresno, CA 3.74 Agriculture
67 Worcester, MA 3.73 Computer and Electronic Products
68 Jacksonville, FL 3.68 Travel and Tourism
69 Akron, OH 3.64 Transportation Equipment
70 Youngstown-Warren-Boardman, OH-PA 3.64 Primary Metal
71 Syracuse, NY 3.59 Machinery
72 Knoxville, TN 3.49 Transportation Equipment
73 Greenville-Mauldin-Easley, SC 3.48 Machinery
74 Bakersfield, CA 3.46 Petroleum and Coal Products
75 Madison, WI 3.00 Chemicals
76 Chattanooga, TN-GA 2.82 Machinery
77 Boise City-Nampa, ID 2.81 Computer and Electronic Products
78 Springfield, MA 2.76 Machinery
79 Charleston-North Charleston-Summerville, SC 2.75 Transportation Equipment
80 Poughkeepsie-Newburgh-Middletown, NY 2.64 Chemicals
81 Des Moines-West Des Moines, IA 2.58 Machinery
82 Columbia, SC 2.57 Transportation Equipment
83 Harrisburg-Carlisle, PA 2.49 Primary Metal
84 Honolulu, HI 2.44 Travel and Tourism
85 Palm Bay-Melbourne-Titusville, FL 2.43 Computer and Electronic Products
86 Scranton--Wilkes-Barre, PA 2.33 Primary Metal
87 El Paso, TX 2.30 Primary Metal
88 Portland-South Portland-Biddeford, ME 2.30 Transportation Equipment
89 Little Rock-North Little Rock-Conway, AR 2.26 Transportation Equipment
90 Ogden-Clearfield, UT 2.24 Transportation Equipment
91 Modesto, CA 2.06 Agriculture
92 Stockton, CA 2.03 Agriculture

BROOKINGS | July 201034
APPENDIX B. Exports Produced in the 100 Largest Metropolitan Areas for 2008 (continued)
Total Exports 2008
Rank Metro Area (in Billion dollars) Largest Export Industry
93 Augusta-Richmond County, GA-SC 1.99 Transportation Equipment
94 Colorado Springs, CO 1.94 Computer and Electronic Products
95 Jackson, MS 1.94 Transportation Equipment
96 Provo-Orem, UT 1.82 Primary Metal
97 Bradenton-Sarasota-Venice, FL 1.63 Transportation Equipment
98 Lakeland-Winter Haven, FL 1.35 Food
99 McAllen-Edinburg-Mission, TX 1.02 Travel and Tourism
100 Cape Coral-Fort Myers, FL 0.85 Travel and Tourism
Largest 100 Metro Areas 1036.88 Transportation Equipment
United States 1609.41 Transportation Equipment

BROOKINGS | July 2010 35
Endnotes
1. This study is concerned with exports of goods produced
in the United States and commercial services sold
by U.S. residents to foreign residents. Therefore, this
study excludes from the U.S. total exports the following
categories: re-exports, scrap materials, used merchan-
dise, special provisions, government services, military
transfers, and expenditures of foreign governments
and international organizations in the United States for
services such as maintaining their embassies, consulates
or headquarters (excluding compensation of employees).
This research refers to this narrower export measure as
“U.S. exports”, unless noted otherwise. This measure of
U.S. exports is 12.5 percent less than U.S. total exports in
2008, as reported by BEA.
2. United States President Barack Obama, address before a
joint session of the Congress on the State of the Union,
January 27, 2010
3. Since 1929, when the Bureau of Economic Analysis (BEA)
begins its time series of exports data, there have been 11
years out of a possible 76 where exports have doubled in
nominal terms, with the latest occurring in 1981, and on
average, doubling exports takes just over 10 years. What
matters, though, are real exports, since a period of high
inflation could easily lead to an increase in the nominal
value of exports without a significant increase in actual
production.
4. For example, the metro area of Greensboro, NC has 14—
more than any other large metro—Provo-Orem, UT has
12, and Toledo has 10. This does not guarantee success
in exporting, but research suggests that, all else being
equal, industries are more productive, better paying, and
innovative if they are clustered. For the definition of an
export cluster, see Section II and http://www.brookings.
edu/metro/exports.
5. Sources for the sidebar: For the car exports figure see
The Port Authority of New York and New Jersey, “2009
Trade Statistics,” available at http://www.panynj.gov/
port/trade-stats.html
6. Andrew B. Bernard and Bradford J. Jensen, “Exceptional
Exporter Performance: Cause, Effect, or Both?” Journal
of International Economics, 47 (1) (1999): 1-25.
7. Barry Eichengreen, “The Dollar Dilemma: The World’s
Top Currency Faces Competition,” Foreign Affairs 88 (5)
(2009).
8. Jeffrey Frankel and David Romer, “Does trade cause
growth?” American Economic Review (89) (1999):
379–399; Romain Wacziarg and Karen Horn Welch,
“Trade Liberalization and Growth: New Evidence,” The
World Bank Economic Review 22 (2) (2008):187-231;
Simon Kuznets, Modern Economic Growth (New Haven:
Yale University, 1966).
9. David Ricardo, On the Principles of Political Economy and
Taxation 3rd Edition (London: John Murray, 1821/1817).
10. James Buchanan and Yong Yoon, “A Smithean
Perspective on Increasing Returns,” Journal of the
History of Economic Thought 22 (2000): 43-48; Russell
Roberts, “Treasure Island: The Power of Trade. Part
II. How Trade Transforms Our Standard of Living.”
(Library of Economics and Liberty, 2006), avail-
able at www.econlib.org/library/Columns/y2006/
Robertsstandardofliving.html (April 2010).
11. To elaborate on the point, Adam Smith argues that a nail
maker in a village in Scotland would have the capacity
to make 300,000 nails in a year, if this was his primary
activity. But there is no market for that many nails in
his village, so he can only sell 1,000 nails in a year and
must split his time in other fields of smithery. He has no
incentive to increase the productivity of his nail making
business because he can’t trade with enough people.
Adam Smith, An Inquiry into the Nature and Causes
of the Wealth of Nations (London: Methuen & Co., Ltd,
1904/1776).
12. Bee-Yan Aw, “Accumulating Technology and Location
Spillovers Among Firms in Taiwan’s Electronics Industry,”
The Journal of Development Studies 39 (1) (2002): 94-117.
13. Bee-Yan Aw, Mark J. Roberts and Tor Winston, “Export
Market Participation, Investments in R&D and Worker
Training, and the Evolution of Firm Productivity,” World
Economy, 30 (1) (2007): 83-104.
14. John Tschetter, “Exports Support American Jobs”
(U.S. Department of Commerce, International Trade
Administration, 2010).
15. Alexander Mas, testimony before the U.S. Senate
Committee on Finance, December 2, 2009, avail-
able at http://finance.senate.gov/imo/media/
doc/120909amtest1.pdf
16. Andrew B. Bernard and Bradford J. Jensen, “Exceptional
Exporter Performance: Cause, Effect, or Both?” Journal
of International Economics, 47 (1) (1999): 1-25.

BROOKINGS | July 201036
17. Niven Winchester, “Searching for the Smoking Gun: Did
Trade Hurt Unskilled Workers,” The Economic Reader
84 (265). (2008): 141-156; Mary Amiti and Donald R.
Davis, Trade, Firms, and Wages: Theory and Evidence,”
National Bureau of Economic Research Working Paper
14106 (2008); Paul Krugman, “Trade and Wages,
Reconsidered,” Brookings Papers on Economic Activity
Spring (2008):103-137.
18. Between 1992-2008, the U.S. average growth rate of
real GDP was 3.03 percent, higher than the European
Union (EU-27), 2.15 percent or the United Kingdom,
2.66 percent. The U.S. average unemployment rate
during the same period was 5.37 percent, while in the
EU was 9.24 percent and in the UK was 6.51 percent.
Source: The Economist Intelligence Unit, Country
Data- Annual Time Series (The Economist Intelligence
Unit, 2010).
19. U.S. Census Bureau, Historical Income Tables, (U.S.
Census, 2010) available at http://www.census.gov/
hhes/www/income/data/historical/index.html.
20. Ibid.
21. Calculated based on U.S. Bureau of Economic Analysis
(BEA), “Section 2: Personal Income and Outlays,”
National Income and Product Accounts Tables (U.S.
Department of Commerce, May 2010).
22. Calculations based on BEA, “Table 2.1. Personal Income
and Its Disposition 1980-2009,” National Income and
Product Accounts Table (U.S. Bureau of Economic
Analysis, May 010)
23. Calculations based on BEA, “Table 1. U.S. International
Transactions, 1960-2009,” U.S. International
Transactions (U.S. Bureau of Economic Analysis,
June 2010).
24. Calculations based on BEA, “Table 2.1. Personal Income
and Its Disposition 1980-2009,” National Income and
Product Accounts Table (U.S. Bureau of Economic
Analysis, May 2010)
25. U.S. Treasury Department, International Capital System:
Report on Foreign Portfolio Holdings of U.S. Securities,
(U.S. Treasury), available at http://www.treas.gov/tic/
fpis.shtml.
26. Joshua Aizenman and Yothin Jinjarak, “Current Account
Patterns and National Real Estate Markets,” Journal of
Urban Economics 66 (2) (2009): 75-89.
27. The Economist Intelligence Unit, Country Data- Annual
Time Series (The Economist Intelligence Unit, 2010).
28. Bosworth and Collins found that the United States
exports less than the original 15 members of the
European Union and Japan, based on an analysis of the
relationship between their exports and economic size,
distance and a number of other trade-related variables.
The dataset consisted of the import and export flows
of each of the mentioned countries with 162 other
countries during 1980 - 2005. For more information see
Barry Bosworth and Susan Collins, “Determinants of U.S.
Exports to China,” Asian Economic Papers, 2008, Vol. 7,
No. 3: 1-26.
29. William R. Cline and John Williamson, “2009 Estimates
of Fundamental Equilibrium Exchange Rates,”
(Washington: The Peterson Institute, 2009); Martin
Neil Baily and Robert Z. Lawrence, “Competitiveness
and the Assessment of Trade Performance,” in Michael
Mussa, ed., C. Fred Bergsten and the World Economy
(Washington: Peterson Institute for International
Economics, 2006).
30. U.S. Department of Commerce, “Secretary Locke,
Postmaster General Potter Launch New Initiative to
Boost U.S. Exports” ( U.S. Department of Commerce,
July 12, 2010).
31. The Trade Promotion Coordinating Committee (TPCC),
2008 National Export Strategy, 2008.
32. BEA, “Table 1. Ownership-Based Framework of the U.S.
Current Account, 1982-2008,” International Economic
Accounts, (U.S. Bureau of Economic Analysis, 2010).
33. All the growth rates are in real terms, from 2005
chained dollars values, unless noted otherwise.
Calculated based on BEA 2010.
34. The World Trade Organization (WTO), International
Trade Statistics 2009 (The World Trade Organization,
2009).
35. Personal communication from Andrew Eilts,
International Trade Specialist, General Electric,
July 02, 2010.
36. The World Trade Organization (WTO), International
Trade Statistics 2009.
37. This excludes military transfers and government ser-
vices from services exports. U.S. Bureau of Economic

BROOKINGS | July 2010 37
Analysis (BEA), International Economic Accounts,
Table 1: U.S. International Transactions (U.S. Department
of Commerce, June 2010).
38. Ibid.
39. U.S. Bureau of Economic Analysis (BEA), International
Economic Accounts, Trade in Services (U.S. Department
of Commerce, 2009) and WTO, International Trade
Statistics 2009.
40. WTO, International Trade Statistics 2009, Table I.10:
Leading exporters and importers in world trade in
commercial services, 2008. This ranking reports private
service exports by country.
41. GDP annual real growth average calculated based on
U.S. Bureau of Economic Analysis (BEA), Table 1.1.6. Real
Gross Domestic Product, Chained Dollars 1929-2009,
National Income and Product Accounts Tables (U.S.
Department of Commerce, May 2010). The U.S. exports
growth by industry calculated based on U.S. Bureau of
Economic Analysis, Table 1. Trade in Services, 1992-
2008 (Department of Commerce, March 2010), U.S.
International Trade Commission, U.S. Domestic Exports,
NAICS codes 1997-2009 (Department of Commerce,
May 2010), inflation adjusted with the Production Price
Indexes for goods exporting industries from the U.S.
Bureau of Labor Statistics, Producer Price Indexes
(Department of Labor, June 2010), and for agricultural
exports and service exports with the specific price
indexes for exports from U.S. Bureau of Economic
Analysis, Table 4.2.4 Price Indexes for Exports and
Imports for Goods and Services by Type of Product,
National Income and Product Accounts Tables (U.S.
Department of Commerce, May 2010).
42. The International Monetary Fund (IMF), World Economic
Outlook Database, (The International Monetary Fund,
April 2010).
43. Stuart Rosenthal and William Strange, “Evidence on
the Nature and Sources of Agglomeration Economies,”
in J.V. Henderson and J. F. Thisse, ed., Handbook of
Regional and Urban Economics, vol. 4 (Amsterdam:
North-Holland, 2004); David B. Audretsch and
Maryann Feldman, “R&D Spillovers and the Geography
of Innovation and Production,” American Economic
Review 86 (3) (1996):630-640; Antonio Ciccone
and Robert E. Hall, “Productivity and the Density of
Economic Activity,” American Economic Review 86 (1)
(1996): 54-70; Timothy Besley, Torsten Persson, and
Daniel Sturm, Political Competition and Economic
Performance: Theory and Evidence From The United
States,” Working Paper 11484 (Cambridge: National
Bureau of Economic Research, 2005); Jordan Rappaport
and Jeffrey D. Sachs, “The United States as a Coastal
Nation,” Journal of Economic Growth 8 (1), 2003: 5-46;
Stephen Knack, “Social capital and government perfor-
mance: Evidence from the states,” American Journal of
Political Science 46 (2002): 772–785.
44. Paul Krugman, Geography and Trade (Cambridge, MA:
The MIT Press, 1991).
45. Alfred Marshall, Principles of Economics (London:
Macmillan and Co, 1890).
46. Enrico Moretti, “Estimating the social return to Higher
Education: Evidence from Longitudinal and Repeated
Cross-Sectional Data,” Journal of Econometrics 121
(2004): 175-212; Adam B. Jaffe, Manuel Trajtenberg
and Rebecca Henderson, “Geographic localization of
knowledge spillovers as evidenced by patent citations,”
Quarterly Journal of Economics 577 (1993); Jung Won
Sonn and Michael Storper, “The Increasing Importance
of Geographical Proximity in Technological Innovation:
An Analysis of U.S. Patent Citations, 1975-1997,” UCLA
Working Paper, (UCLA, 2003); Luis M.A. Bettencourt,
Jose’ Lobo, and Deborah Stumsky, “Invention in the City:
Increasing Returns to Patenting as a Scaling Function of
Metropolitan Size,” Research Policy 36 (2007): 107-120;
Alan Berube, “MetroNation: How U.S. Metropolitan Areas
Fuel American Prosperity” (Washington: Brookings
Institution, 2007).
47. Mark Muro and others, “MetroPolicy: Shaping a
New Federal Partnership for a Metropolitan Nation”
(Washington: Brookings Institution, 2008).
48. Adie Tomer and Robert Puentes, “Expect Delays: An
Analysis of Air Travel Trends in the United States,”
(Washington: Brookings Institution, 2009).
49. Bernard and Jensen, “Exceptional Exporter
Performance: Cause, Effect, or Both?” 1999; Mark
Muro and others, “MetroPolicy: Shaping a New Federal
Partnership for a Metropolitan Nation,” 2008. Science
and engineering job figures were calculated from
the National Science Board, Science and Engineering
Indicators 2008 (Arlington: National Science
Foundation, 2009).
50. Rui Baptista and Peter Swann, “Do firms in clusters inno-
vate more?” Research Policy 27 (5) (1998): 525-540.

BROOKINGS | July 201038
51. Rosenthal and Strange, “Evidence on the Nature and
Sources of Agglomeration Economies,” 2004.
52. Purdue University’s Center for Regional Development
and Indiana University’s Indiana Business Research
Center, Unlocking Rural Competitiveness: The Role of
Regional Clusters, (January 2007) available at http://
www.ibrc.indiana.edu/innovation/reports/sections/3_
project1.pdf.
53. For more on the top 100 metro areas economic perfor-
mance during recession, see MetroMonitor (Washington:
The Brookings Institution, 2010) available at http://
www.brookings.edu/metro/MetroMonitor.aspx.
54. Bee-Yan Aw, “Accumulating Technology and Location
Spillovers Among Firms in Taiwan’s Electronics
Industry,” The Journal of Development Studies 39 (1)
(2002): 94-117.
55. This study uses the U.S. Bureau of Economic Analysis
definition of “exports” as goods or services sold by U.S.
residents to foreign residents. Therefore, this study’s
export estimates for the largest 100 U.S. metropolitan
areas do not include sales from a U.S. metropolitan
area to the U.S. market. In addition, the exports include
sales from the U.S. companies’ headquarters to their
subsidiaries abroad and the sales of foreign companies
located in the United States to entities located abroad.
For more information see U.S. Bureau of Economic
Analysis, International Economic Accounts, (Department
of Commerce, 2009).
56. Census Bureau collects the export data based on an
Origin of Movement (OM) ZIP-code-based methodology.
This means that the export data is allocated based on
the ZIP code of the company in the U.S. that is compen-
sated for the export (the United States Principal Party
in Interest (USPPI)). This methodology has been intro-
duced in 2005, due to the use of the Automated Export
System by the U.S. Customs Bureau and the Census
Bureau instead of the shipper’s export declaration.
International Trade Administration (ITA), Exports from
U.S. Metropolitan Areas Methodology (Department of
Commerce, 2009), available at http://www.ita.doc.gov/
td/industry/otea/metro/methodology_2008.html.
57. This is similar to the state Origin of Movement Zip
code based export series. U.S. Census Bureau, Guide
to Foreign Trade Statistics (Department of Commerce,
2009), available at http://www.census.gov/foreign-
trade/guide/sec2.html.
58. This assumption does not take into account differ-
ent export propensities of metropolitan areas that
produce similar shares of the industry’s national output.
Therefore, the most accurate way to interpret the rank-
ings of metropolitan export indicators is that they mea-
sure the metropolitan contribution to export industries,
rather than the direct contribution to exports per se.
59. While this method allows for the inclusion of wider
range of royalties earning industries, it does not take
into consideration the different locations of the pro-
duction and research and development facilities of a
company, due to lack of data.
60. This result was based on the bi-decennial 2007
Commodity Flows Survey (CFS). To estimate create
an alternative measure of export orientation, the
CFS was used to calculate the percentage of goods
shipped outside the metropolitan area as a percent-
age of all goods shipped (some goods were shipped
internally) for 59 MSAs. This value should be positively
correlated with the value of goods exported interna-
tionally divided by the value of all goods produced.
This value was constructed using Brookings exports
data and ITA data. The Brookings estimates of 2008
export orientation show a strong positive relationship
with the CFS measure of export orientation (correla-
tion coefficient=.36 and statistically significant), while
the 2008 ITA data has a negative (-0.16) correlation
and is statistically insignificant. The CFS includes 44
Combined Statistical Areas (CMAs) and 15 MSAs. The
CMA estimates are comparable with the MSA estimates,
given that MSAs concentrate about 86 percent of the
employment in CMAs across the largest 100 metropoli-
tan areas, on average. In fact, a concordance measure
(i.e. employment in the MSA divided by employment in
the CMA) between the CMAs and the MSAs was used
as an analytic weight to confirm this. The results were
similar: when weighting by concordance, the Brookings
export orientation measure had a correlation coef-
ficient of 0.37 with the CFS export orientation measure
and ITA’s had a coefficient of -0.04. For data and
more information, see The Bureau of Transportation
Statistics, Commodity Flow Survey (U.S. Department of
Transportation, 2009), available at http://factfinder.
census.gov/servlet/IBQTable?_bm=y&-geo_id=D&-
ds_name=CF0700A20&-_lang=en.
61. 1) Using the Brookings data, 2008 exports of goods
as a share of GMP is very strongly correlated with the
2008 share of employment in manufacturing 0.80,
while the ITA 2008 exports as a share of GMP has just
a correlation of 0.12 with the manufacturing share of

BROOKINGS | July 2010 39
employment. In the end, however, the Brookings data
are estimates, and a preferable solution would be for the
Census Bureau or BEA to create origins of production
data that directly measures exports from companies at
the county level.
62. In other words, export sales are divided by a pure
measure of metropolitan production, gross-value-added.
From the perspective of a metropolitan area, the final
sales price for an export product equals gross value
added plus intermediate value added, where intermedi-
ate value added may come from the same company,
another company in the same metropolitan area, a U.S.
company located elsewhere, or a foreign supplier.
63. The correlation coefficient between metropolitan
exports and Gross Metropolitan Product in 2008 is 0.94,
showing the high positive association between the two
series.
64. This U.S. export intensity is adjusted to conform to the
export numbers calculated for the top 100 metros. As
discussed in the methodology, it excludes domestic
exports of goods which are not production (the NAICS
900s category), and government services exports. The
U.S. export intensity calculated with the BEA total U.S.
exports was 12.7 percent in 2008.
65. The correlation coefficient between metropolitan export
intensity and the share of manufacturing in metropoli-
tan exports is 0.77.
66. Sources for the Sidebar: Source of U.S. aviation industry
numbers- General Aviation Manufacturers Association,
2009 General Aviation- Statistical Databook and
Industry Outlook (General Aviation Manufacturers
Association, 2010). For Cessna’s export figures- Personal
communication from Robert Stangarone, Vice President
of Corporate Communications, Cessna Aircraft Company,
June 30, 2010. For Ex-Im Bank loan, see Export- Import
Bank of the United States, Ex-Im Bank Authorizes
$500 Million Facility To Textron To Support Exports
Of Cessna Aircraft And Bell Helicopters, available at
http://www.exim.gov/pressrelease.cfm/68B8E446-
E156-4C05-7741251C06465832/] (May 2009). For
Hawker Beechcraft’s export figures- Personal com-
munication from Nicole D. Alexander, Public Relations
Representative, Hawker Beechcraft Corporation, July
09, 2010; For Cox Machine, Inc- Personal communication
from Jason Cox, Chief Technical Officer, Cox Machine,
Inc, July 2, 2010; For Perfekta, Inc’s exports- Personal
communication from Julian Guerra, President, Perfekta,
Inc, July 6, 2010.
67. Zoltan J. Acs and David B. Audretsch, “Innovation in
Large and Small Firms: An Empirical Analysis Source,”
The American Economic Review, 78 (4) (1988): 678-690.
68. To test this formally, the metropolitan export share
of GMP was regressed on the 2008 manufacturing
share of employment and the patent rate from 2001 to
2008, adjusting for state fixed effects. The relationship
between patent rate and export share of GMP was highly
significant, with a t-statistic of 3.8. This relationship was
robust to including the share of employees working for
universities, the share of employment in marine cargo
handling, and the number of oil and coal fields in the
metropolitan area.
69. Wichita Metro Chamber of Commerce, Wichita Metro
Business & Industry Profile, available at http://www.
wichitakansas.org/economic_development-wichita_
metro_profile-business_industry.php.
70. Portland Development Commission, Portland Economic
Development Strategy, (Portland Development
Commission, 2009), available at http://pdxeconomicde-
velopment.com/index.html
71. International Trade Administration, U.S. Foreign Trade
Zones, (U.S. Department of Commerce, 2009) available
at http://ia.ita.doc.gov/ftzpage/letters/ftzlist.html
72. Ibid.
73. The iPUMs dataset does not provide sufficient data
points for six metro areas out of the largest 100 metro
areas: Bradenton, FL, Greenville, SC, Ogden, UT, Oxnard,
CA, Poughkeepsie, NY and Tucson, AZ
74. This export effect is robust to the inclusion of not
only individual characteristics but also metropolitan,
industrial, and occupational characteristics. That is to
say: even in the same industry and occupation, workers
earn more in metros where export production is higher.
Likewise, workers in high export industries earn more
than workers in low export industries even if they work
the same metro.
75. Bee-Yan Aw, “Accumulating Technology and Location
Spillovers Among Firms in Taiwan’s Electronics
Industry,” The Journal of Development Studies 39 (1)
(2002): 94-117.
76. BLS, Quarterly Census of Employment and Wages (U.S.
Bureau of Labor Statistics, 2010).

BROOKINGS | July 201040
77. On the lower end of export industries, workers in
Administration and Support services earned just
$31,000 on average in San Jose. Those in Nursing and
Residential Care earned just $27,000. Those in New York
government earned $38,000. Those in Administration
and Human Resource Programs, which is not attributed
with any exports, earned $27,000 in Portland.
78. Steven Ruggles, Matthew Sobek, Trent Alexander,
Catherine A. Fitch, Ronald Goeken, Patricia Kelly Hall,
Miriam King, and Chad Ronnander. Integrated Public
Use Microdata Series: Version 4.0. (Minneapolis, MN:
Minnesota Population Center, 2009) available at http://
usa.ipums.org/usa.
79. UN Department of Economic and Social Affairs,
“Global Urbanization Rate from 1950 to 2050,” World
Urbanization Prospects (United Nations, 2007).
80. While the usual large emerging markets group is Brazil,
Russia, India, China, we excluded Russia from the analy-
sis, because Russia is a very small export market for the
United States. In 2008, U.S. exports of domestic goods
to Russia were only 8.7 billion dollars, only 0.5 percent
of U.S. exports of domestic goods and private services.
U.S. exports to Russia are not even reported separately
by the Bureau of Economic Analysis. For U.S. goods
services exports to Russia, see USITC, Interactive Trade
and Tariff DataWeb (Department of Commerce, 2010).
81. Calculation based on IMF, International Monetary Fund,
World Economic Outlook Database, (April 2010).
82. Calculation based on Homi Kharas and Geoffrey Gertz,
“The New Global Middle Class: A Cross Over from West
to East.”In Cheng Li, ed., China’s Emerging Middle
Class: Beyond Economic Transformation (Washington:
Brookings, 2010).
83. For more on the evolution of the federalist model and
implementation in the United States see Robert P. Inman
and Daniel L. Rubinfeld, “Rethinking Federalism,” The
Journal of Economic Perspectives 11 (4) (1997: 43-64;
and Wallace E. Oates, “Toward A Second-Generation
Theory of Fiscal Federalism,” International Tax and
Public Finance, 12, (2005): 349–373.
84. Wallace Oates, Fiscal Federalism (New York: Harcourt,
Brace, Jovanovich, 1972).
85. Alice Rivlin, Reviving the American Dream (Washington:
The Brookings Institution, 1992).
86. Andrew B. Bernard and J. Bradford Jensen, “Entry,
Expansion, and Intensity in the U.S. Export Boom,
1987–1992,” Review of International Economics, 12(4)
(2004): 662–675.
87. Most of the attention has been on the Chinese yuan.
For example, Cline and Williamson from the Peterson
Institute estimated a 40 percent overvalue of the
dollar against the Chinese currency in 2009. Paul
Krugman has been very vocal on the Chinese exchange
rate policy. In addition, as recent as last March, the
International Monetary Fund (IMF) Managing Director,
Dominique Strauss- Kahn has declared that the Chinese
yuan remains undervalued. See William R. Cline and
John Williamson, “2009 Estimates of Fundamental
Equilibrium Exchange Rates,” Policy Brief No. PB09-10,
(Washington D.C.: Peterson Institute of International
Economics, June 2009); Paul Krugman, “Taking on
China,” New York Times, March 14, 2010; Nicholas
Winning, “IMF Head Says Yuan Remains Undervalued,”
Wall Street Journal, March 17, 2010.
88. Sherle Schwenniger and Samuel Sherraden, Getting
Serious About Doubling U.S. Exports (Washington, D.C.:
New America Foundation, March, 2010).
89. Aaditya Mattoo and Arvind Subramanian, “Currency
Undervaluation and Sovereign Wealth Funds: A New
Role for the World Trade Organization,” Working
Paper 08-2 (The Peterson Institute for International
Economics, 2008).
90. Emerging markets in Asia refer to China, India,
Indonesia, Malaysia, Philippines, Thailand and Vietnam.
International Monetary Fund, World Economic Outlook
Update, (IMF, July 7, 2010), available at http://www.imf.
org/external/pubs/ft/weo/2010/update/02/index.
htm#tbl1
91. Andrew B. Bernard, J. Bradford Jensen, Stephen J.
Redding, and Peter K. Schott, “The Margins of Trade,”
NBER Working Paper Series 14662, (Cambridge, MA:
National Bureau of Economic Research, January 2009).
92. Scott L. Baier and Jeffrey H. Bergstrand, “Do Free Trade
Agreements Actually Increase Members’ International
Trade?” Working Paper 2005-3 (Federal Reserve Bank of
Atlanta, 2005).
BROOKINGS | July 2010 41
93. To study the effect of FTAs on the ratio of exports to
imports, an analysis was conducted on all 17 countries
with FTAs with the USA according to the International
Trade Administration using goods data from the USITC.
The average ratio of exports to imports was calculated
three years prior to the year the FTA was enacted and
three years after. The difference between these two
ratios was taken to approximate the effect of the FTA on
the trade balance. Two countries—Israel and Costa Rica—
were excluded because data before the FTA for Israel
could not be obtained, and the Costa Rican FTA was
enacted in 2009, which did not allow an observation for
its effect. Of the 15 countries that remained, the United
States saw an increase in the ratio of exports to imports
for 11 of them, including important trading partners such
as Australia, Chile, and Singapore. The overall trade bal-
ance, however, decreased from -11.0 Bil to -34.2 Bil, but
this negative effect was driven by Mexico and Canada.
Excluding those two, FTA increased the trade balance
from 1.3 blns USD to 14.9 BLNS USD. In summary, while
this exercise does not isolate the causal effect of FTAs, it
suggests that most FTA agreements have improved the
balance of trade in goods for the United States.
94. The Trans-Pacific Partnership, signed in 2005, is a mul-
tilateral free trade agreement focused on Asia- Pacific
between Australia, Brunei, Chile, New Zealand, Peru,
Singapore, and Vietnam. The European Union started
negotiations with India in 2007 and the plan is to finalize
the agreement by the end of 2010. The China- ASEAN
free trade area came into effect on January 1, 2010. For
more on the Trans-Pacific Partnership, see Office of the
United States Trade Representative, “USTR Fact Sheet:
Trans-Pacific Partnership,” December 08, 2009, avail-
able at http://www.ustr.gov/about-us/press-office/
fact-sheets/2009/november/ustr-fact-sheet-trans-
pacific-partnership. On the EU- India free trade agree-
ment negotiations, see Pallavi Aiyar, “Hope Floats for
EU- India Free Trade Pact Talks,” The Business Standard,
April 13, 2010. On the China- ASEAN free trade area, see
“China- ASEAN Free Trade Agreement,” The Economist,
January 7, 2010.
95. Robert Atkinson and Howard Wial, Boosting Productivity,
Innovation, and Growth through a National Innovation
Foundation (Washington D.C.: The Brookings Institution,
2008).
96. James Duderstadt and others, Energy Discovery-
Innovation Institutes: A Step toward America’s Energy
Sustainability (Washington D.C.: The Brookings
Institution, 2009).
97. Gregory Tassey, Rationales and Mechanisms for
Revitalizing U.S. Manufacturing R&D Strategies
(Gaithersburg, MD : National Institute of Standards and
Technology, 2009).
98. President Obama, remarks at the National Academy of
Sciences Annual Meeting, Washington, D.C.: National
Academy of Sciences, April 27, 2009.
99. For more on U.S. manufacturing competitiveness, see
Robert Atkinson, “Innovation and U.S. Manufacturing
Competitiveness,” remarks at the Manufacturing
Extension Partnership, May 3, 2010.
100. Atkinson and Wial, Boosting Productivity, 2008.
101. Karen G. Mills, Elisabeth B. Reynolds, Andrew Reamer,
Clusters and Competitiveness: A New Federal Role for
Stimulating Regional Economies (Washington D.C.: The
Brookings Institution, 2008).
102. For more information on the EDA RIC program see
U.S. Economic Development Administration, Regional
innovation Clusters, available at http://www.eda.gov/
AboutEDA/RIC/ . For more information on the energy
regional innovation cluster (E-RIC) see U.S. Department
of Energy, Energy Regional Innovations Cluster Q&As,
available at http://www.energy.gov/hubs/eric_qanda.
htm
103. This follows the concept of the energy discovery innova-
tion institutes (e-DII) proposed by Duderstadt and others.
Energy Discovery-Innovation Institutes, 2008.
104. Tassey, Rationales and Mechanisms, 2009.
105. Karen Mills, Elisabeth B. Reynolds, and Andrew Reamer,
Clusters and Competitiveness: A New Federal Role for
Stimulating Regional Economies (Washington: Brookings
Institution, 2008).
106. Bruce Katz, “Restoring Prosperity: Repositioning
Southern Nevada for the Next Economy,” remarks given
at University of Nevada, Las Vegas, April 5, 2010.
107. Gregory Tassey, The Technology Imperative, Edward
Elgar Publishing, 2007; Tassey, Rationales and
Mechanisms.
108. U.S. Executive Order 13534 of March 11, 2010, National
Export Initiative.
109. Yager, “Observations on U.S. Trade,” 2009.

BROOKINGS | July 201042
110. Daniel Lederman, Marcelo Olarreaga, and Lucy
Payton, “Export promotion agencies revisited,” Policy
Research Working Paper Series 5125 (Washington DC:
The World Bank, 2009). Andrew K. Rose, 2007. “The
Foreign Service and Foreign Trade: Embassies as Export
Promotion,” The World Economy, 30(1) (2007): 22-38.
111. GAO, “International Trade: Effective Export Programs
Can Help in Achieving U.S. Economic Goals”, GAO-09-
480T (U.S. Government Accountability Office, March,
2009).
112. John McAdams. Senior Vice President of Export- Import
Bank of the United States, remarks at the Metropolitan
Leadership Council, Metropolitan Policy Program, June
11, 2010.
113. At this point, it is clear only that the FY 2011 budget
is requesting a 20 percent increase for ITA, of about
$78 million. As the Secretary of the Department of
Commerce stated “The ITA plans to bring on as many as
328 trade experts—mostly in foreign countries—
to advocate and find customers for U.S. compa-
nies.” For more information, see Gary Locke, U.S.
Secretary of Commerce, “National Exports Initiative
Remarks,” February 4, 2010, available at http://www.
commerce.gov/NewsRoom/SecretarySpeeches/
PROD01_008893
114. Ibid.
115. Sources for the Sidebar: Export- Import Bank of the
United States, Powering Jobs, Sales, and Profits Through
Exports (Export-Import Bank of the United States, 2010)
available online at http://www.exim.gov/pubs_center/
brochures/bro-aov-01.pdf; Urvaksh Karkaria, Suniva
CEO, “Next Year Big for U.S. Solar,” Atlanta Business
Chronicle, August 5 2009; Personal communication
from Bryan Ashley, Chief Marketing Officer, Suniva, June
29, 2010; Suniva, Inc, About the company, available at
http://www.suniva.com/aboutthecompany.php (June
2010).
116. Howard Rosen, remarks at the Metropolitan Leadership
Council, 2010.
117. The Bay Area Council Economic Institute, International
Trade and the Bay Area Economy: Regional Interests and
Global Outlook 2008 (The Bay Area Council Economic
Institute, September 2008); Trade Development Alliance
of Greater Seattle, The Target Market Report (Trade
Development Alliance of Greater Seattle, 2009). Sources
for the Sidebar: Personal communication from Bill
Stafford, President, of the Trade Development Alliance
of Greater Seattle, June 18, 2010; Trade Development
Alliance of Greater Seattle, A Regional Partnership,
available at http://www.seattletradealliance.com/
about/about-us.php( June 2010).
118. Brookings analysis of the Commodity Flow Survey 2007.
119. Brookings analysis of U.S. DOT data. Data source:
U.S. Department of Transportation. America’s
Freight Transportation Gateways (U.S. Department of
Transportation, 2009), available at http://www.bts.gov/
publications/americas_freight_transportation_gate-
ways/2009/appendix/html/table_appendix.html
120. Robert Puentes, Develop a Competitive National
Transportation Agenda, the Auto Summit, May 18, 2010.
121. Robert Puentes, A Bridge to Somewhere: Rethinking
American Transportation for the 21st Century
(Washington D.C.: Brookings Institution, 2008).
122. Germany created a national freight policy to support
its major ports and airports in the summer of 2008.
See German Federal Ministry of Transport, Building, and
Urban Development, Freight Transport and Logistics
Masterplan (BMVBS, 2008).
123. For more on the National Infrastructure Bank, see
Emilia Istrate and Robert Puentes, Investing for Success:
Examining a Federal Capital Budget and a National
Infrastructure Bank (Brookings Institution, December
2009).
124. For more on measuring the effectiveness of export
promotion strategies see Yager, “Observations on U.S.
Trade,” 2009.
125. GAO, Export Promotion, 2009.
126. Source for the Venice sidebar: Organization for
Economic Cooperation and Development (OECD),
Examples of Best Regional Policy Practices in the OECD
(OECD, 2010).
127. Trade Promotion Coordinating Committee (TPCC), 2008
National Export Strategy, 2008.
128. Personal communication from Bryan Borlik, EDA
Director of Trade Adjustment Assistance, May 05, 2010.
129. This is similar with the state Origin of Movement Zip
code based export series. U.S. Census Bureau, Guide

BROOKINGS | July 2010 43
to Foreign Trade Statistics (Department of Commerce,
2009), available at http://www.census.gov/foreign-
trade/guide/sec2.html.
130. The Gross Metropolitan Product (GMP) is the Gross
Domestic Product counterpart at the metropolitan level.
In the same vein as the national indicator, the GMP by
industry shows the value added produced by that indus-
try in a certain metropolitan area.
131. We constructed two alternative export estimates based
on employment for 2007, using Moody’s Economy.
com series and U.S. Census County Business Patterns
database. These series exhibited correlation coefficients
of 0.98 and 0.97 respectively, with this study’s output-
based export estimates.
132. While this method allows for the inclusion of wider range
of royalties earning industries, it does not take into con-
sideration the different locations of the production and
research and development facilities of a company, due to
lack of data.
133. William Testa, Thomas Klier, and Alexei Zelenev,
“Estimating U.S. Metropolitan Area Export and Import
Competition,” Economic Perspective (Federal Reserve
Bank of Chicago, 2003).
134. Nora Brooks, “U.S. Agricultural Trade Update—State
Exports,” Economic Research Service Outlook Report,
FAU-102-01 (U.S. Department of Agriculture, 2005).
135. The BEA estimates a provisional county output, by
allocating the state output based on the county share
of the earnings in a certain industry from the state
earnings in the same industry. These provisional county
outputs are added to the level of a metropolitan area
to produce the Gross Domestic Product by metro area
(or Gross Metropolitan Product). See BEA,” Introducing
New Measures of the Metropolitan Economy,” Survey
of Current Business (U.S. Department of Commerce,
November 2007).
136. In the end, however, the Brookings data are estiamates,
and the Census Bureau or BEA should collaborate to
create origins of production data that directly measures
exports from companies at the county level.
137. C. Fred. Bergsten, “Correcting the Chinese Exchange
Rate: An Action Plan,” Testimony before the Committee
on Ways and Means, U.S. House of Representatives
March 24, 2010.
138. This study uses Moody’s GMP estimates from November
2009. These estimates might have been revised in the
meantime by Moody’s Economy.com.
139. The U.S. goods export codes are based on the
Harmonized System (HS) established by the World
Customs Organization (WCO). They are administered by
the Census in the Schedule B, an approximately 8,000
commodity classifications. Census also classifies U.S.
output by industry according to the North American
Industry Classification System (NAICS) since 1997. While
the U.S. export codes are based on product character-
istics, the NAICS codes may also take into account the
method of production. They do not overlap entirely, but
Census developed a matching system between the HS
and NAICS. See U.S. Census Bureau, Commodity Master
Record Layout (U.S. Department of Commerce, 2009),
available at http://www.census.gov/foreign-trade/refer-
ence/products/catalog/cmdtymst.html. For a discussion
of the relationship between the HS and NAICS codes
see Justin R. Pierce and Peter K. Schott, A Concordance
Between Ten-Digit U.S. Harmonized System Codes and
SIC/NAICS Product Classes and Industries, U.S. Census
Bureau Center for Economic Studies, Working Paper
09-41, (U.S. Department of Commerce, 2009).
140. This study is concerned only with the cross- border
services sales. For cross-border trade, data on the
majority of types of private services are collected on the
Quarterly Survey of Transactions in Selected Services
and Intangible Assets with Foreign Persons and the
Quarterly Survey of Transactions between U.S. Financial
Services Providers and Foreign Persons. For more
information see Jennifer Koncz and Anne Flatness, U.S.
International Services - Cross-Border Trade in 2007 and
Services Supplied through Affiliates in 2006, Survey
of Current Business, (U.S. Department of Commerce,
October 2008).
141. The Census Bureau reports in its Service Annual Survey
the estimated export revenue of establishments in select
industries by NAICS. However, this survey does not pro-
vide export estimates for a number of important service
industries such as travel or passenger transportation.
Unlike the HS- NAICS goods match-up by Census, there
is no concordance table for the service exports by NAICS
and the BEA service exports category. This is under-
standable, given that services are not provided only by
service industry. For example, manufacturing firms can
accrue royalties from their patents and trademarks. We
constructed initially a match-up between the BEA ser-
vices export categories and 6 digit level NAICS. However,
due to the lack of detail beyond 4 digit NAICS for GMP

BROOKINGS | July 201044
by industry in the utilized dataset, Moody’s Economy.
com, we restricted our match up for services exports
to 4 digit NAICS level. While more NAICS digit numbers
allow for more detailed industry identification, we use
this match up only to calculate the metro industry share
out of the national total. For the concordance file, see
Appendix.
142. The USITC goods exports are on a Census basis, while
the BEA services exports are on a Balance of Payments
(BOP) basis. The BEA adjusts the goods exports to bring
them to a BOP basis, in order to have a more accurate
U.S. total goods and services exports value. However,
the differences between the Census basis and the BOP
basis are very small at the national level- the sum of U.S.
goods exports on a Census basis and services exports
on a BOP basis was 99.96 percent of the BEA U.S. total
exports in 2008. For more information on the definitions
and differences between Census basis and BOP basis
see U.S. International Trade Administration, Trade Data
Basics, (U.S. Department of Commerce, 2009), available
at http://ita.doc.gov/td/industry/otea/trade_data_
basics.html#exports.
143. Institute of International Education, “Table: International
Student Enrollment by Institution, Listed Alphabetically,
2008/09,” Open Doors 2009 Report on International
Educational Exchange (Institute of International
Education, November 2009).
144. While our study is concerned with the 2008 figures,
the 2007 IRS industry receipts from royalties were the
latest series available. See IRS, “Table 7: Corporation
Returns With Net Income --Balance Sheet, Income
Statement, Tax, and Selected Other Items, by Major
Industry, Tax Year 2007,” SOI Tax Stats, (The Internal
Revenue Service, March 2010).
145. The goods export categories are all the 3 digit NAICS
level reported by USITC, excluding the 900s. The ser-
vices categories are the most detailed level reported by
the BEA for the cross-border services.
146. The American Community Survey samples Public Use
Micro Areas, rather than counties or other geographical
units. PUMAs do not directly overlap with Metropolitan
Statistics Areas (MSAs), and IPUMS organizes the data
according to MSAs as defined in 2000. Since the export
data uses the more up-to-date 2008 definitions of
MSAs, a cross-walk was used to match PUMAs to the
new MSA. The results are robust to using the old MSA
categories, but this procedure is not as accurate. IPUMS
data is from Steven Ruggles, Matthew Sobek, Trent
Alexander, Catherine A. Fitch, Ronald Goeken, Patricia
Kelly Hall, Miriam King, and Chad Ronnander, Integrated
Public Use Microdata Series: Version 4.0. (Minneapolis,
MN: Minnesota Population Center, 2009) available at
http://usa.ipums.org/usa.
147. See U.S. BEA,” Table 1.1.1. Percent Change From
Preceding Period in Real Gross Domestic Product,”
National Economic Accounts (U.S. Department of
Commerce, 2009).
148. Luis M.A. Bettencourt, Jose Lobo, and Deborah
Strumsky, “Invention in the City: Increasing Returns to
patenting as a scaling function of metropolitan size,”
Research Policy (36) (2007): 107-120; Jose Lobo and
Deborah Strumsky, “Metropolitan patenting, inven-
tor agglomeration and social networks: A tale of two
effects,” Journal of Urban Economics (63) (2008):
871-884.
149. OMB defines Metropolitan Statistical Areas as regions
with “at least one urbanized area of 50,000 or more
population, plus adjacent territory that has a high
degree of social and economic integration with the core
as measured by commuting ties”. U.S. OMB, “Update
of Statistical Area Definitions and Guidance on Their
Uses,” OMB Bulletin No. 09-01 (United States Office of
Management and Budget, 2008).
150. U.S. Census Bureau, “2008 Subject Definitions,”
American Community Survey 2008 (Department of
Commerce, 2009).
151. Mark Muro and others, MetroPolicy, 2008.
152. William Wheaton and Mark Lewis, “Urban Wages
and Labor Market Agglomeration,” Journal of Urban
Economics, 51 (2002): 541-562; David Card and Jesse
Rothstein, “Racial Segregation and the Black-White Test
Score Gap” Journal of Public Economics 91(11-12) (2007):
2158-2184.

BROOKINGS | July 2010 45
AcknowledgmentsFor their substantive and thoughtful comments on earlier drafts and other elements of this paper, we wish to thank all the participants in our spring 2010 expert roundtables, especially Sean Randolph, Howard Rosen, and Bill Stafford for their help and advice while writing this report. We would also like to thank the following individuals who provided information on the export efforts of their companies: Nicole Alexander of Hawker Beechcraft, Bryan Ashley of Suniva, Jason Cox of Cox Machine, Inc., Andrew Eilts of General Electric, Julian Guerra, of Perfekta Inc., and Robert Stangarone of Cessna Aircraft.
Within the Metropolitan Policy Program, the authors would like to thank Emily Broas, Alison Diciurcio, Clare Foran, Peter Hamp, and Daniel Weaver for their help on the metropolitan pro-files; Kenan Fikri for mapping assistance; Richard Shearer profile and research assistance. Other Brookings staff members, including Alan Berube, Jennifer Bradley, John Fairbanks, Lael Harris, David Jackson, Amy Liu, Mark Muro, Ellen Ochs, Rob Puentes, Barbara Semedo, Julie Wagner, and Howard Wial made thoughtful and insightful contributions along the way.
The Metropolitan Policy Program at Brookings would like to thank the John D. and Catherine T. MacArthur Foundation, the Heinz Endowments, and the George Gund Foundation who provide general support for the program’s research and policy efforts. We would also like to issue special thanks the Surdna Foundation and the Rockefeller Foundation for their support of the program’s Metropolitan Infrastructure Initiative, which greatly contributed to this effort.
Finally, we would like to thank its Metropolitan Leadership Council, a bipartisan network of individual, corporate, and philanthropic investors that provide us financial support but, more importantly, are true intellectual and strategic partners. While many of these leaders act glob-ally, they retain a commitment to the vitality of their local and regional communities, a rare blend that makes their engagement even more valuable. To learn more about the members of our Metropolitan Leadership Council, please go here.
For More InformationEmilia Istrate Senior Research AnalystMetropolitan Policy Program 202.741.6561 [email protected]
Jonathan RothwellSenior Research Analyst Metropolitan Policy Program [email protected]
For General InformationMetropolitan Policy Program at Brookings202.797.6139www.brookings.edu/metro

1775 Massachusetts Avenue, NW Washington D.C. 20036-2188telephone 202.797.6000fax 202.797.6004web site www.brookings.edu
telephone 202.797.6139 fax 202.797.2965web site www.brookings.edu/metro
BrookIngs
About the Metropolitan PolicyProgram at the Brookings InstitutionCreated in 1996, the Brookings Institution’s Metro-politan Policy Program provides decision makerswith cutting-edge research and policy ideas forimproving the health and prosperity of cities andmetropolitan areas including their component cities,suburbs, and rural areas. To learn more visit:www.brookings.edu/metro