Embed Size (px)
Citation preview
REACHING THE WORLD THROUGH PRIVATE
SECTOR INITIATIVE: SERVICE EXPORTS FROM THE PHILIPPINES
June, 2011
Soonhwa Yi
The World Bank
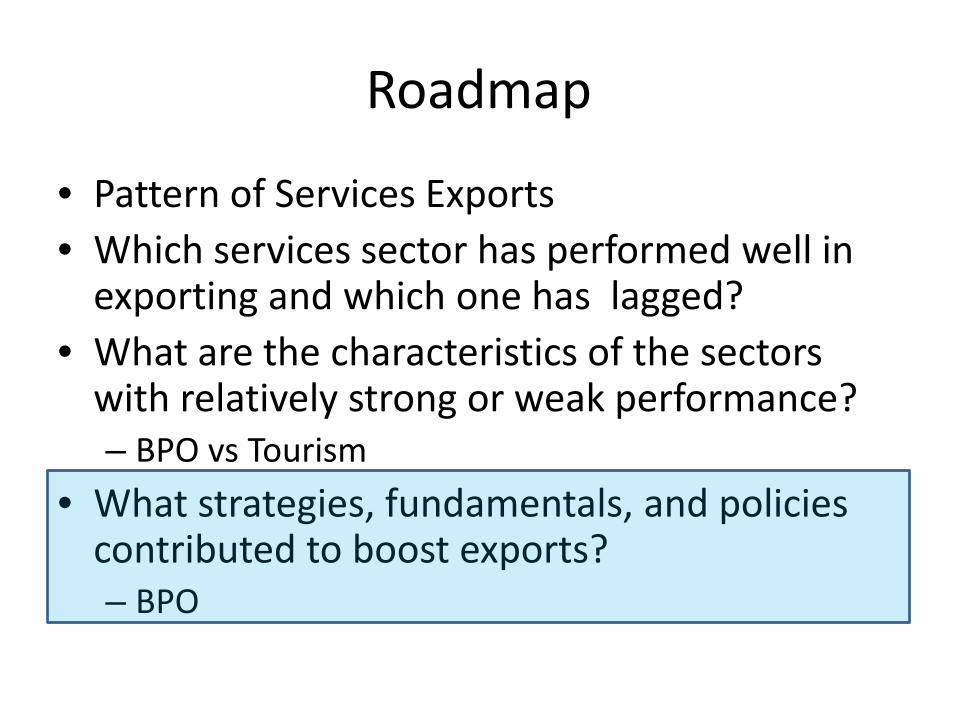
Roadmap
• Pattern of Services Exports• Which services sector has performed well in
exporting and which one has lagged?• What are the characteristics of the sectors
with relatively strong or weak performance?– BPO vs Tourism
• What strategies, fundamentals, and policies contributed to, or failed to, boost exports? – BPO vs Tourism
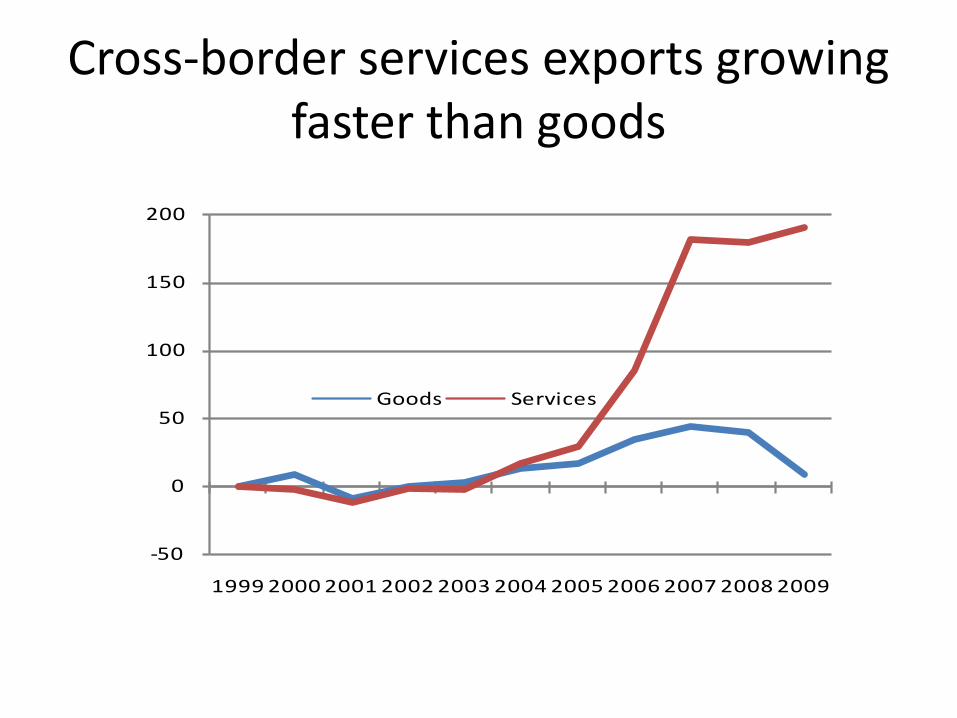
Cross-border services exports growing faster than goods
-50
0
50
100
150
200
1999 2000 2001 2002 2003 2004 2005 2006 2007 2008 2009
Goods Services
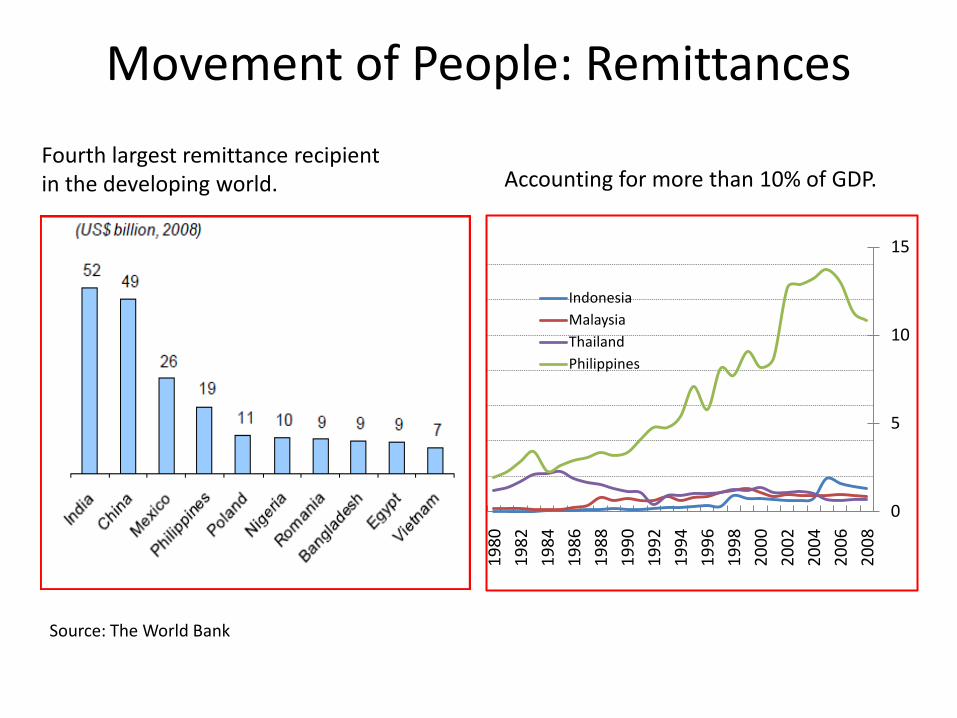
Movement of People: Remittances
0
5
10
15
1980
1982
1984
1986
1988
1990
1992
1994
1996
1998
2000
2002
2004
2006
2008
IndonesiaMalaysiaThailandPhilippines
Source: The World Bank
Accounting for more than 10% of GDP.Fourth largest remittance recipient in the developing world.
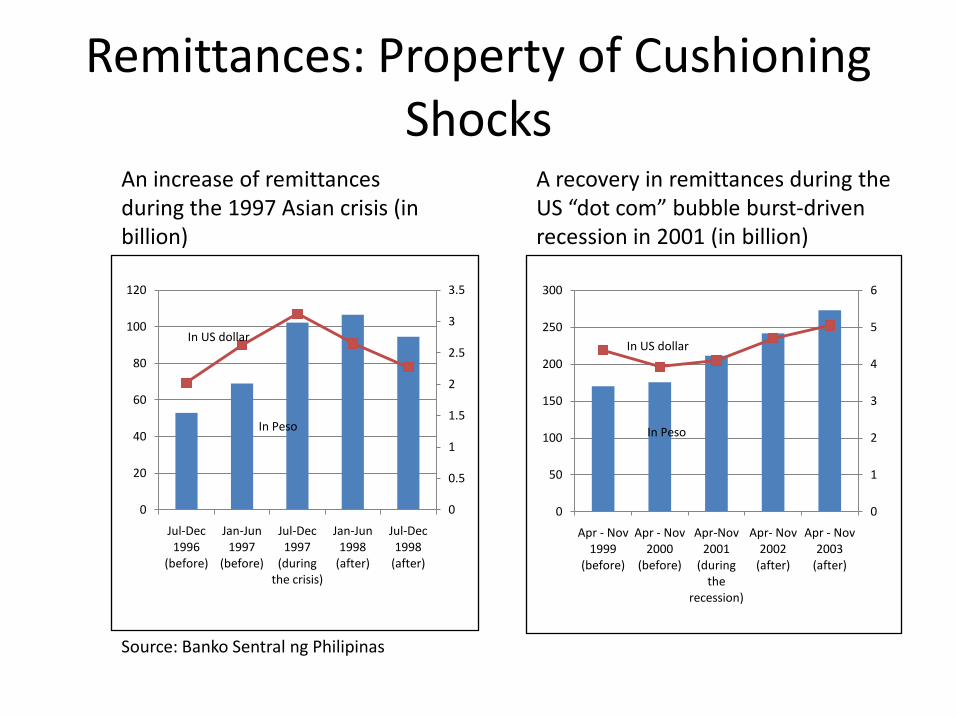
Remittances: Property of Cushioning Shocks
In Peso
In US dollar
0
0.5
1
1.5
2
2.5
3
3.5
0
20
40
60
80
100
120
Jul-Dec 1996
(before)
Jan-Jun 1997
(before)
Jul-Dec 1997
(during the crisis)
Jan-Jun 1998
(after)
Jul-Dec 1998
(after)
In Peso
In US dollar
0
1
2
3
4
5
6
0
50
100
150
200
250
300
Apr - Nov 1999
(before)
Apr - Nov 2000
(before)
Apr-Nov 2001
(during the
recession)
Apr- Nov 2002
(after)
Apr - Nov 2003
(after)
Source: Banko Sentral ng Philipinas
An increase of remittances during the 1997 Asian crisis (in billion)
A recovery in remittances during the US “dot com” bubble burst-driven recession in 2001 (in billion)
Roadmap
• Pattern of Services Exports• Which services sector has performed well in
exporting and which one has lagged?• What are the characteristics of the sectors
with relatively strong or weak performance?– BPO vs Tourism
• What strategies, fundamentals, and policies contributed to, or failed to, boost exports? – BPO vs Tourism
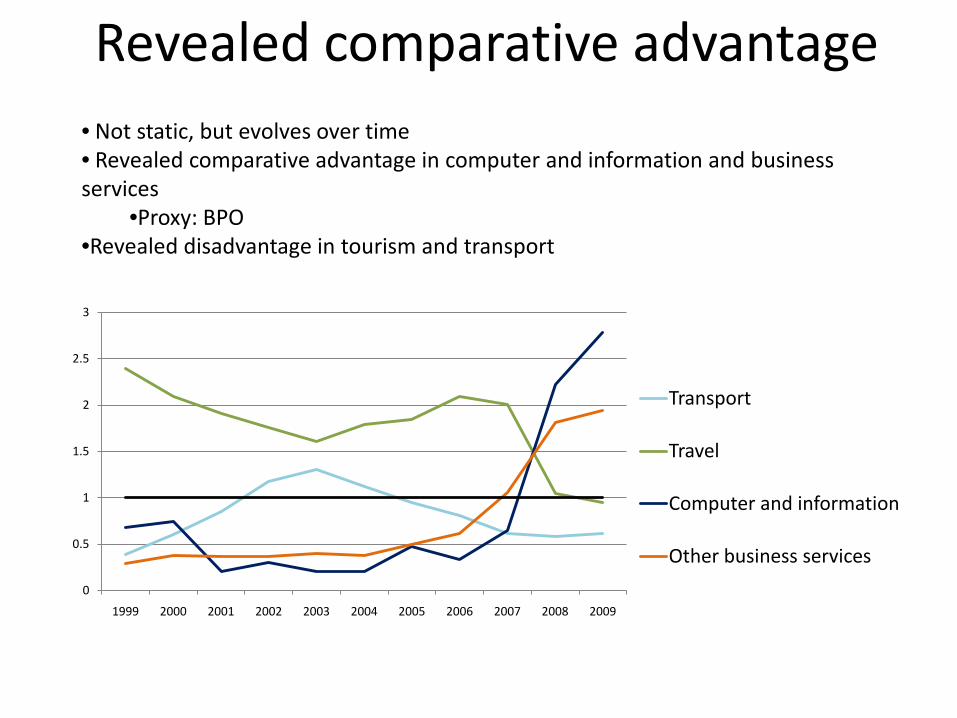
Revealed comparative advantage• Not static, but evolves over time• Revealed comparative advantage in computer and information and business services
•Proxy: BPO•Revealed disadvantage in tourism and transport
0
0.5
1
1.5
2
2.5
3
1999 2000 2001 2002 2003 2004 2005 2006 2007 2008 2009
Transport
Travel
Computer and information
Other business services
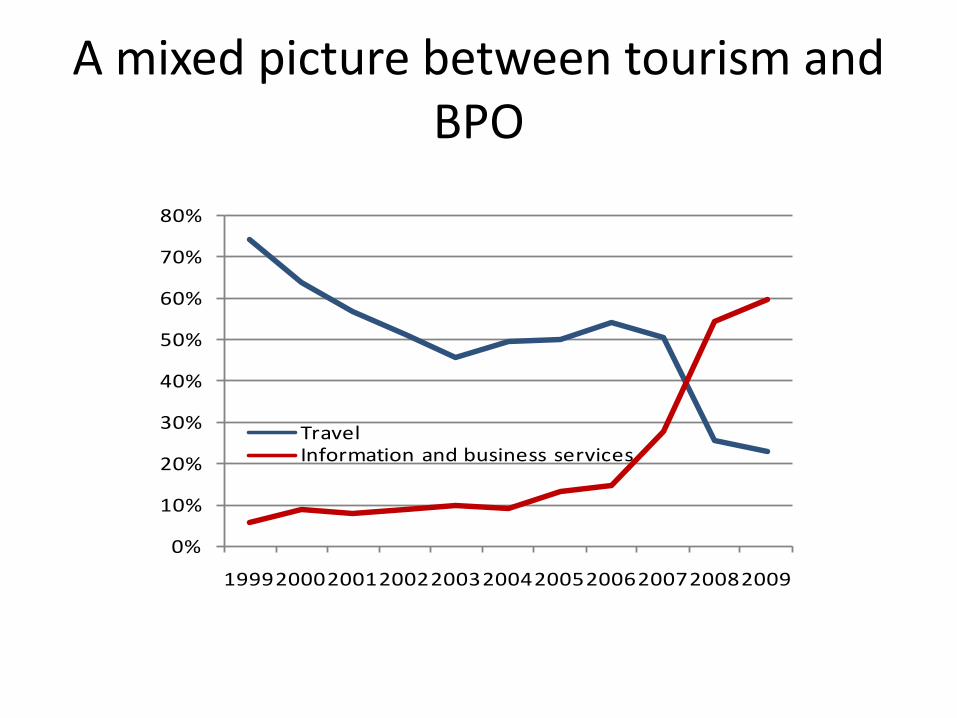
A mixed picture between tourism and BPO
0%
10%
20%
30%
40%
50%
60%
70%
80%
19992000200120022003200420052006200720082009
TravelInformation and business services
Roadmap
• Pattern of Services Exports• Which services sector has performed well in
exporting and which one has lagged?• What are the characteristics of the sector with
relatively strong performance?– BPO
• What strategies, fundamentals, and policies contributed to, or failed to, boost exports? – BPO vs Tourism
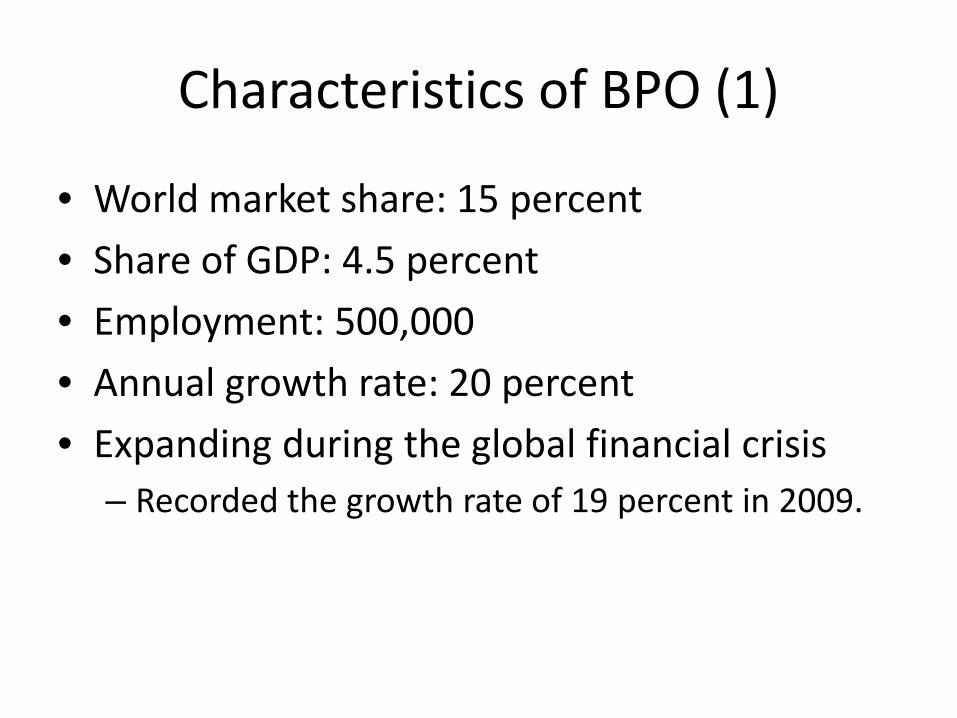
Characteristics of BPO (1)
• World market share: 15 percent
• Share of GDP: 4.5 percent
• Employment: 500,000
• Annual growth rate: 20 percent
• Expanding during the global financial crisis– Recorded the growth rate of 19 percent in 2009.
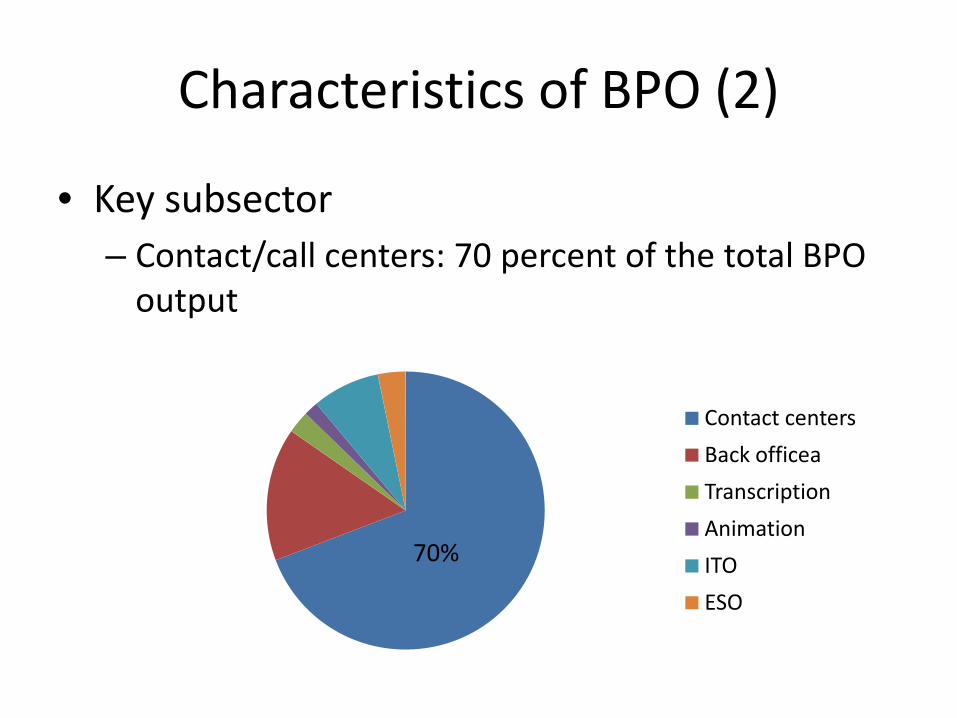
• Key subsector – Contact/call centers: 70 percent of the total BPO
output
Characteristics of BPO (2)
70%
Contact centers
Back officea
Transcription
Animation
ITO
ESO
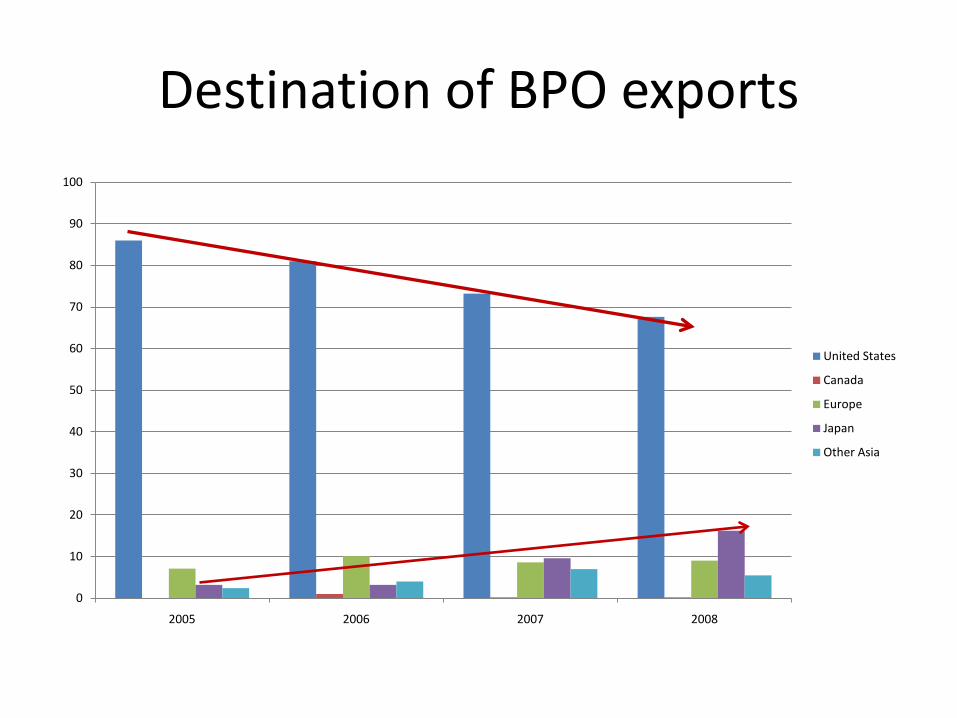
Destination of BPO exports
0
10
20
30
40
50
60
70
80
90
100
2005 2006 2007 2008
United States
Canada
Europe
Japan
Other Asia
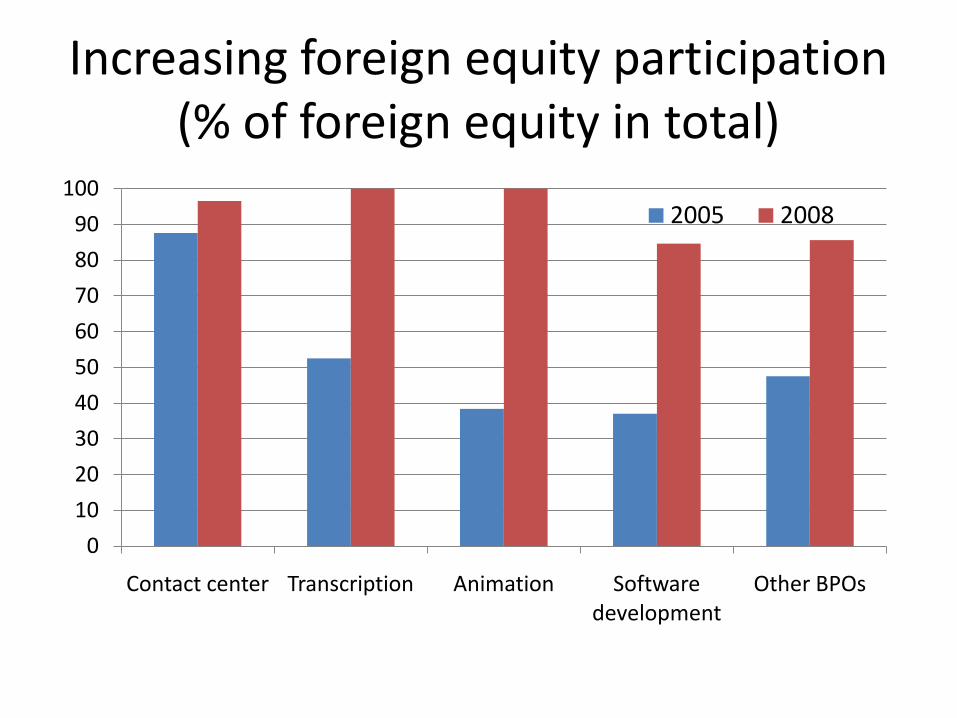
Increasing foreign equity participation(% of foreign equity in total)
0
10
20
30
40
50
60
70
80
90
100
Contact center Transcription Animation Software development
Other BPOs
2005 2008
Roadmap
• Pattern of Services Exports• Which services sector has performed well in
exporting and which one has lagged?• What are the characteristics of the sectors
with relatively strong or weak performance?– BPO vs Tourism
• What strategies, fundamentals, and policies contributed to boost exports? – BPO
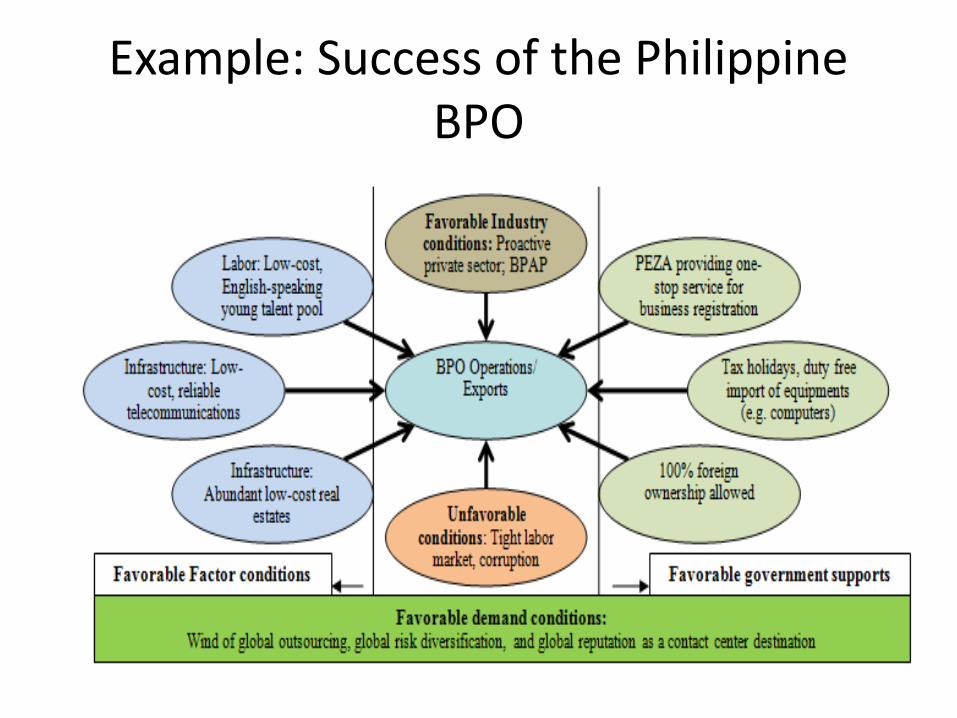
Example: Success of the Philippine BPO
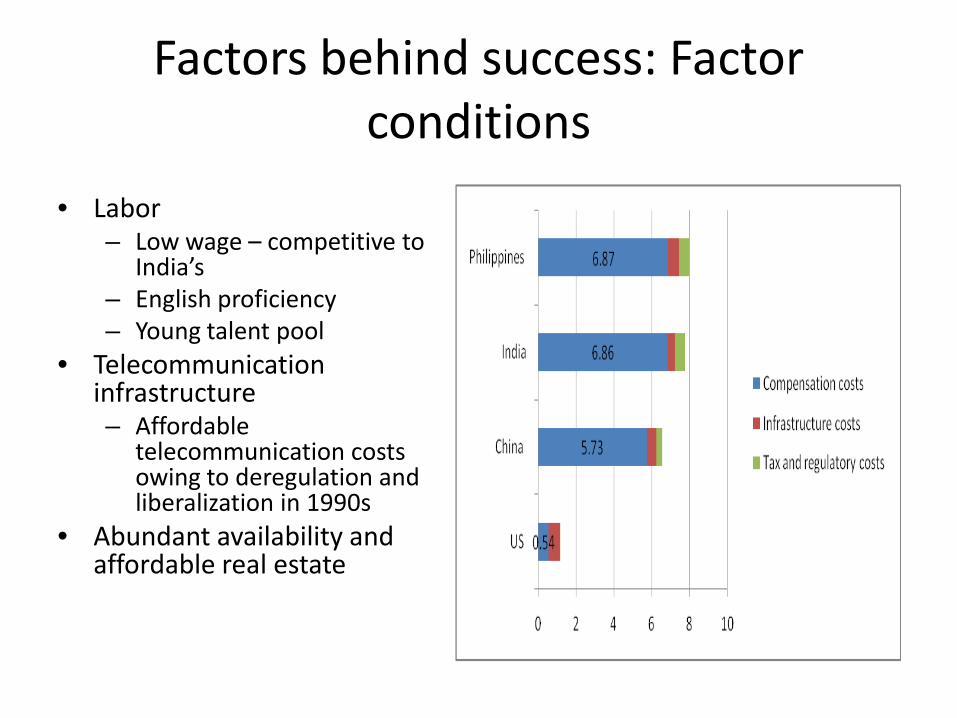
Factors behind success: Factor conditions
• Labor – Low wage – competitive to
India’s– English proficiency– Young talent pool
• Telecommunication infrastructure– Affordable
telecommunication costs owing to deregulation and liberalization in 1990s
• Abundant availability and affordable real estate
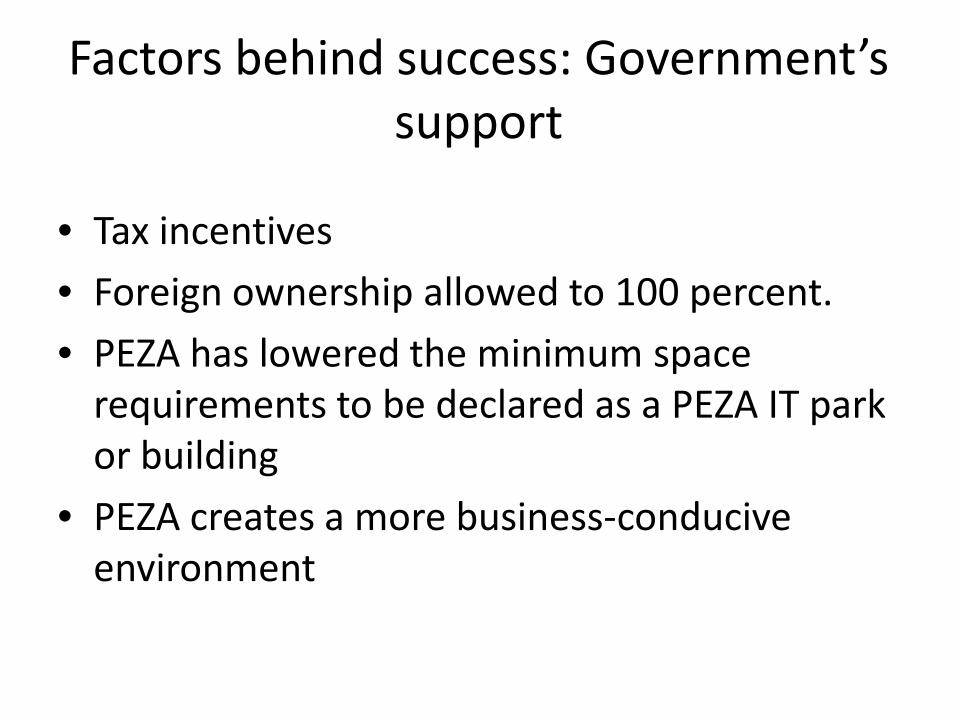
Factors behind success: Government’s support
• Tax incentives
• Foreign ownership allowed to 100 percent.
• PEZA has lowered the minimum space requirements to be declared as a PEZA IT park or building
• PEZA creates a more business-conducive environment
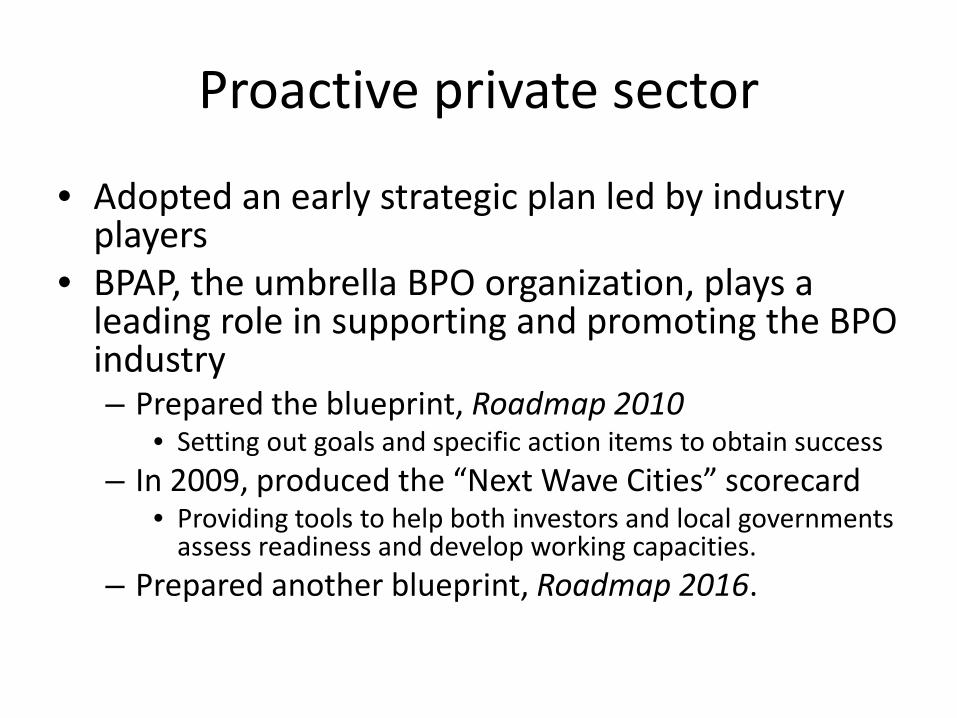
Proactive private sector
• Adopted an early strategic plan led by industry players
• BPAP, the umbrella BPO organization, plays a leading role in supporting and promoting the BPO industry– Prepared the blueprint, Roadmap 2010
• Setting out goals and specific action items to obtain success– In 2009, produced the “Next Wave Cities” scorecard
• Providing tools to help both investors and local governments assess readiness and develop working capacities.
– Prepared another blueprint, Roadmap 2016.
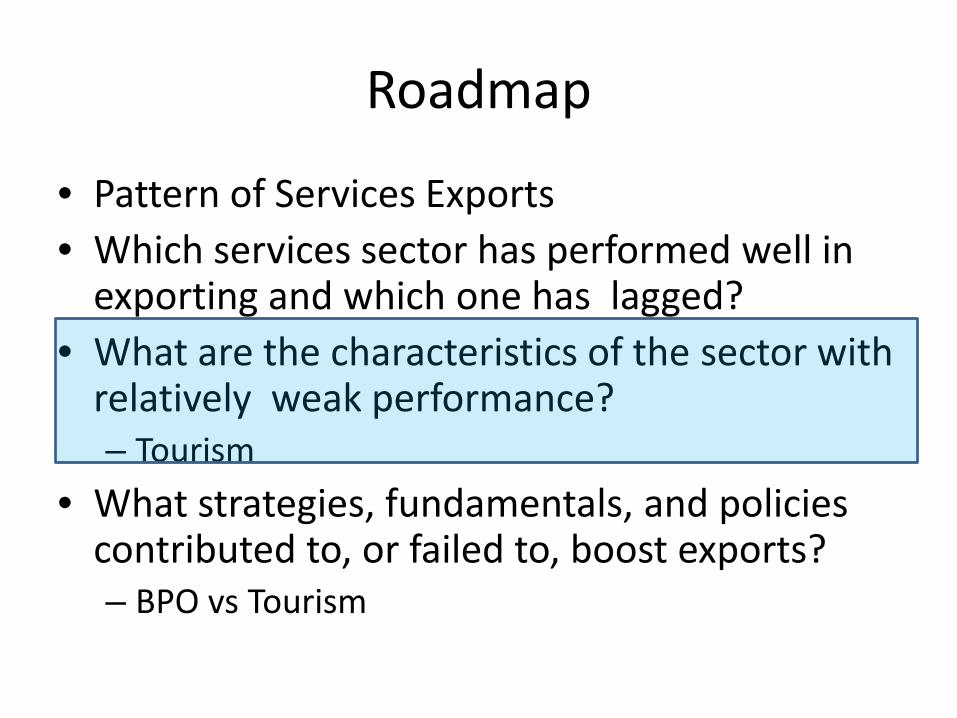
Roadmap
• Pattern of Services Exports• Which services sector has performed well in
exporting and which one has lagged?• What are the characteristics of the sector with
relatively weak performance?– Tourism
• What strategies, fundamentals, and policies contributed to, or failed to, boost exports? – BPO vs Tourism
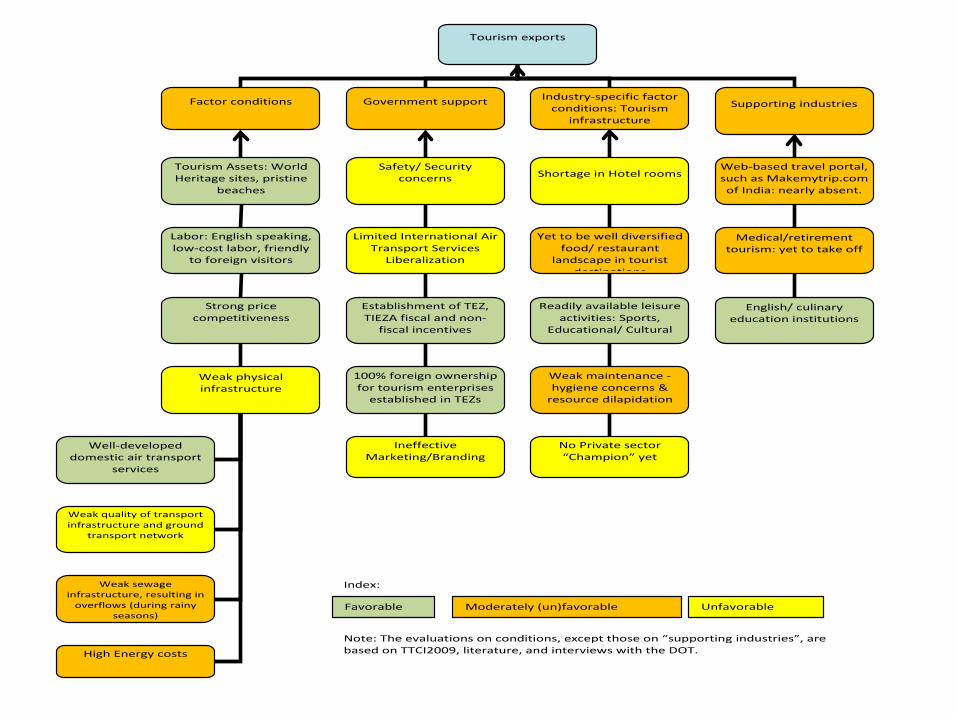
Tourism exports
Factor conditions Government support
Tourism Assets: World Heritage sites, pristine
beaches
Labor: English speaking, low-cost labor, friendly
to foreign visitors
Strong price competitiveness
Industry-specific factor conditions: Tourism
infrastructure
Weak physical infrastructure
Well-developed domestic air transport
services
Weak quality of transport infrastructure and ground
transport network
Weak sewage infrastructure, resulting in
overflows (during rainy seasons)
High Energy costs
Safety/ Security concerns
Limited International Air Transport Services
Liberalization
Establishment of TEZ, TIEZA fiscal and non-
fiscal incentives
Ineffective Marketing/Branding
Shortage in Hotel rooms
Yet to be well diversified food/ restaurant
landscape in tourist destinations
Readily available leisure
activities: Sports, Educational/ Cultural
Weak maintenance -hygiene concerns &
resource dilapidation
No Private sector “Champion” yet
Supporting industries
Web-based travel portal, such as Makemytrip.com of India: nearly absent.
Medical/retirement tourism: yet to take off
English/ culinary education institutions
100% foreign ownership for tourism enterprises
established in TEZs
Favorable Moderately (un)favorable Unfavorable
Index:
Note: The evaluations on conditions, except those on “supporting industries”, are based on TTCI2009, literature, and interviews with the DOT.
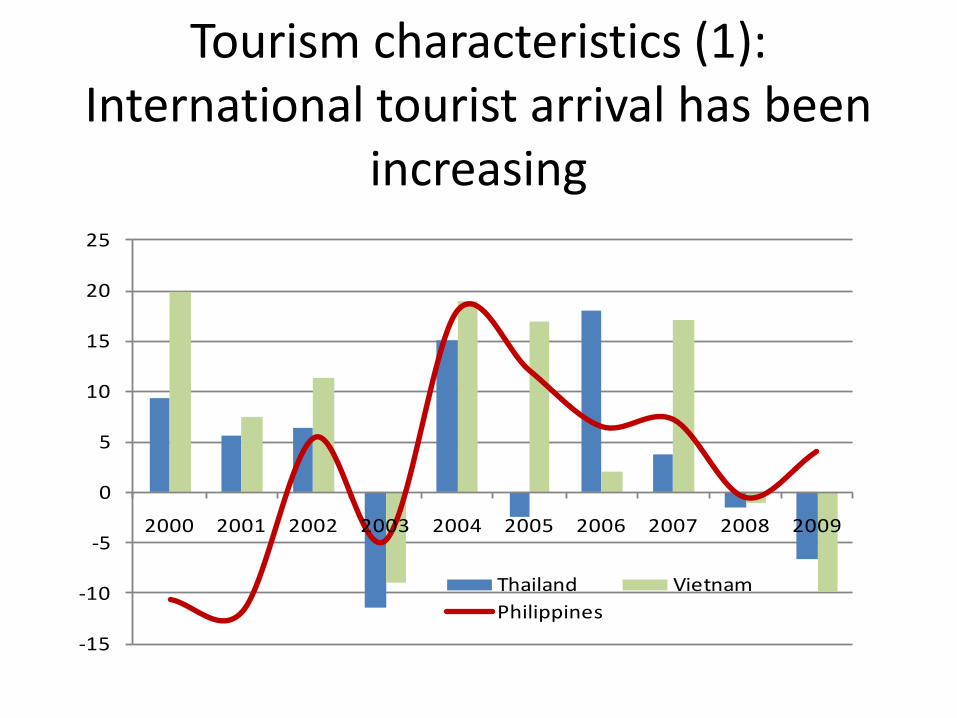
Tourism characteristics (1): International tourist arrival has been
increasing
-15
-10
-5
0
5
10
15
20
25
2000 2001 2002 2003 2004 2005 2006 2007 2008 2009
Thailand VietnamPhilippines
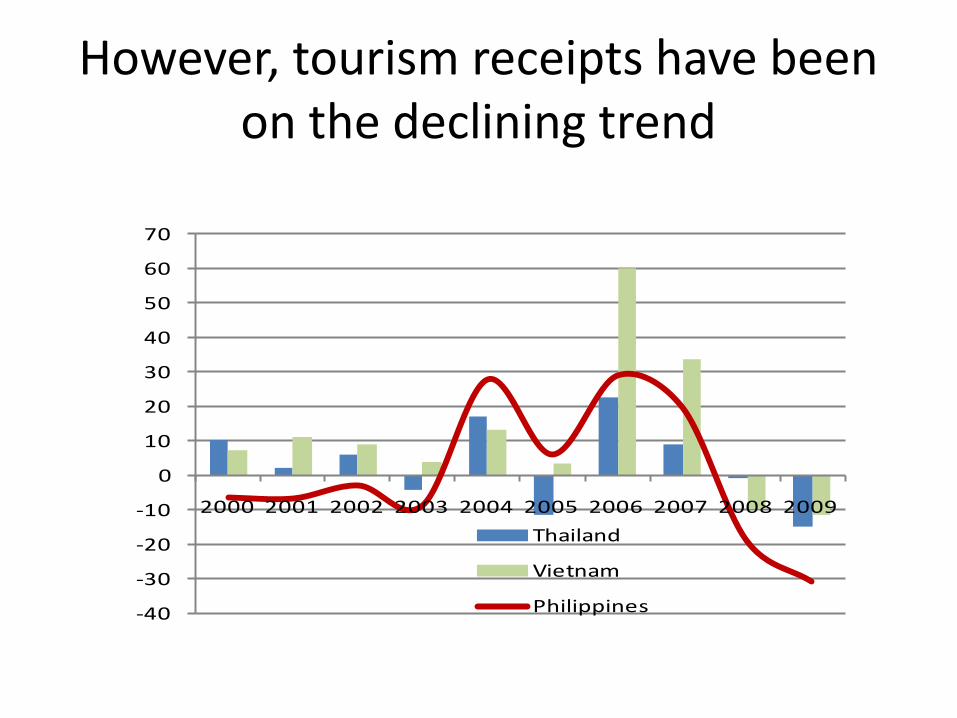
However, tourism receipts have been on the declining trend
-40
-30
-20
-10
0
10
20
30
40
50
60
70
2000 2001 2002 2003 2004 2005 2006 2007 2008 2009
Thailand
Vietnam
Philippines
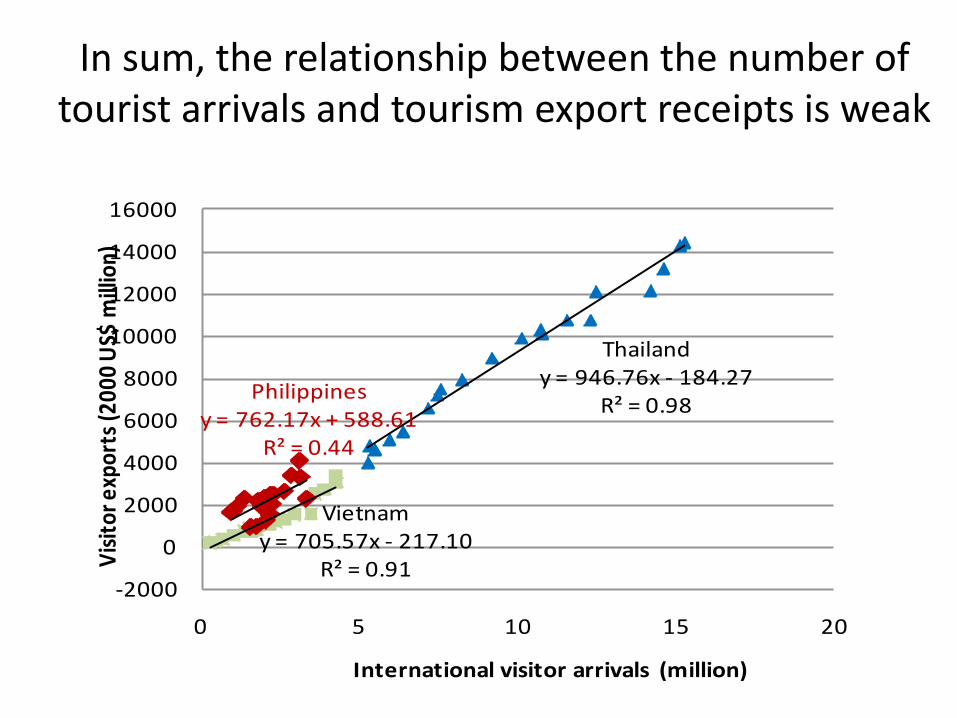
In sum, the relationship between the number of tourist arrivals and tourism export receipts is weak
Thailandy = 946.76x - 184.27
R² = 0.98
Vietnamy = 705.57x - 217.10
R² = 0.91
Philippines y = 762.17x + 588.61
R² = 0.44
-2000
0
2000
4000
6000
8000
10000
12000
14000
16000
0 5 10 15 20
Visit
or e
xpor
ts (2
000
US$
mill
ion)
International visitor arrivals (million)
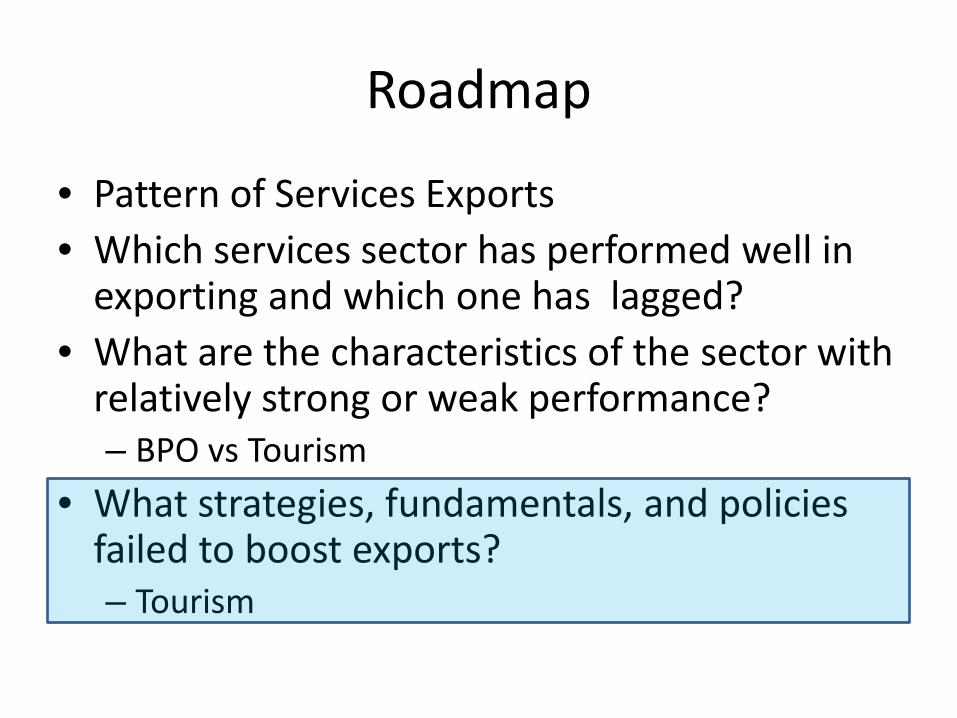
Roadmap
• Pattern of Services Exports• Which services sector has performed well in
exporting and which one has lagged?• What are the characteristics of the sector with
relatively strong or weak performance?– BPO vs Tourism
• What strategies, fundamentals, and policies failed to boost exports? – Tourism
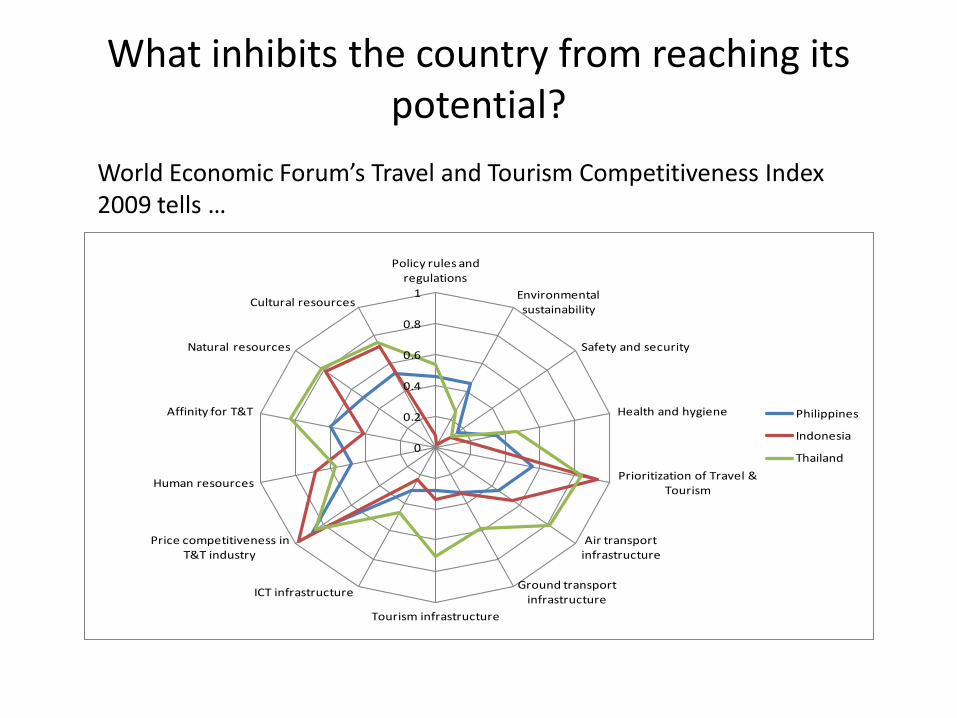
What inhibits the country from reaching its potential?
0
0.2
0.4
0.6
0.8
1
Policy rules and regulations
Environmental sustainability
Safety and security
Health and hygiene
Prioritization of Travel & Tourism
Air transport infrastructure
Ground transport infrastructure
Tourism infrastructure
ICT infrastructure
Price competitiveness in T&T industry
Human resources
Affinity for T&T
Natural resources
Cultural resources
Philippines
Indonesia
Thailand
World Economic Forum’s Travel and Tourism Competitiveness Index 2009 tells …
Ground transport infrastructure
• Domestic Logistics Performance Index 2010 ranks the quality of trade and transport related to road infrastructure as “low” or “very low.”
• the majority of the 201,940-kilometer road network (as of 2008) continues to be in poor condition with one-fifth of it paved (CIA 2010)
Implications …
• Limits mobility of tourists• Restricts choices for transportation means• Translates into higher vehicle operating costs per
kilometer (World Bank 2009) – Example: Distance between Manila and Banaue rice
terrace, 350 km. Choice of transportation limited to Bus and car. Takes 8-10 hours
– Distance between Bangkok and ChiangMai, 696km. Can be reached by car, bus, plane and train. an hour by air (at least six airlines operate some 23 flights daily), 8 hours by car, 10–11 hours by bus, or 11–12 hours by train
Airports require major upgrades
• Literature: a positive correlation between the quality of airports and the number of international arrivals
• Business perceived that the Philippine passenger air transport infrastructure is underdeveloped– TTCI 2009: the Philippines 89th in terms of the quality
of air transport infrastructure, far behind Thailand (28th) and Indonesia (75th)
– NAIA: Design capacity was already met in 1991
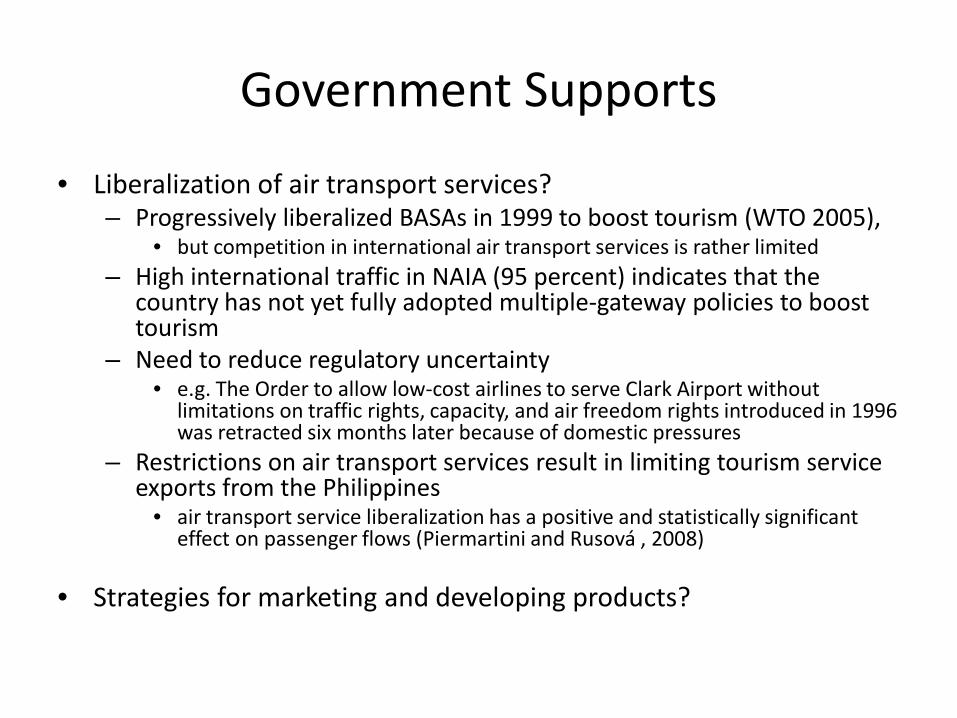
Government Supports
• Liberalization of air transport services? – Progressively liberalized BASAs in 1999 to boost tourism (WTO 2005),
• but competition in international air transport services is rather limited– High international traffic in NAIA (95 percent) indicates that the
country has not yet fully adopted multiple-gateway policies to boost tourism
– Need to reduce regulatory uncertainty• e.g. The Order to allow low-cost airlines to serve Clark Airport without
limitations on traffic rights, capacity, and air freedom rights introduced in 1996 was retracted six months later because of domestic pressures
– Restrictions on air transport services result in limiting tourism service exports from the Philippines
• air transport service liberalization has a positive and statistically significant effect on passenger flows (Piermartini and Rusová , 2008)
• Strategies for marketing and developing products?
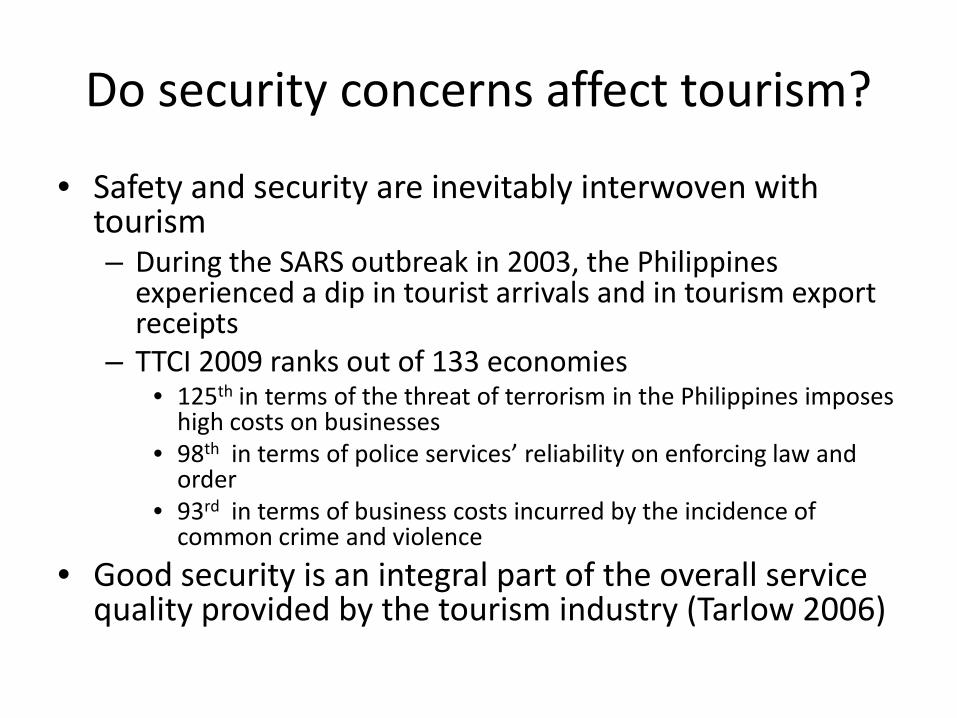
Do security concerns affect tourism?
• Safety and security are inevitably interwoven with tourism– During the SARS outbreak in 2003, the Philippines
experienced a dip in tourist arrivals and in tourism export receipts
– TTCI 2009 ranks out of 133 economies• 125th in terms of the threat of terrorism in the Philippines imposes
high costs on businesses • 98th in terms of police services’ reliability on enforcing law and
order • 93rd in terms of business costs incurred by the incidence of
common crime and violence
• Good security is an integral part of the overall service quality provided by the tourism industry (Tarlow 2006)
Conclusions and Challenges Ahead (1)
• The Philippines:– A net service exporter, – Services exports, growing faster than exports of
goods– Net export credits from sectors that are natural
resource–based (tourism), labor-intensive (construction), or more intensive users of human capital and telecommunications (communications, computer and information services, and other business services).
• BPO – How to shift the gear to high value-added sub-sector?– Comprehensive data protection law in place?– Quality control, especially in the area of medical
transcription?
• Tourism– PPP in infrastructure– More conducive business environment– Proactive private sector’s role in developing tourism
products
Conclusions and Challenges Ahead (2)