Embed Size (px)
Citation preview
Centre for Radiation, Chemical and Environmental Hazards
Exposure Assessment for Epidemiological Studies
International Scientific ConferenceElectromagnetic Fields & Public Health
Simon MannSession 1 11:20-11:5016 November 2011
Scope
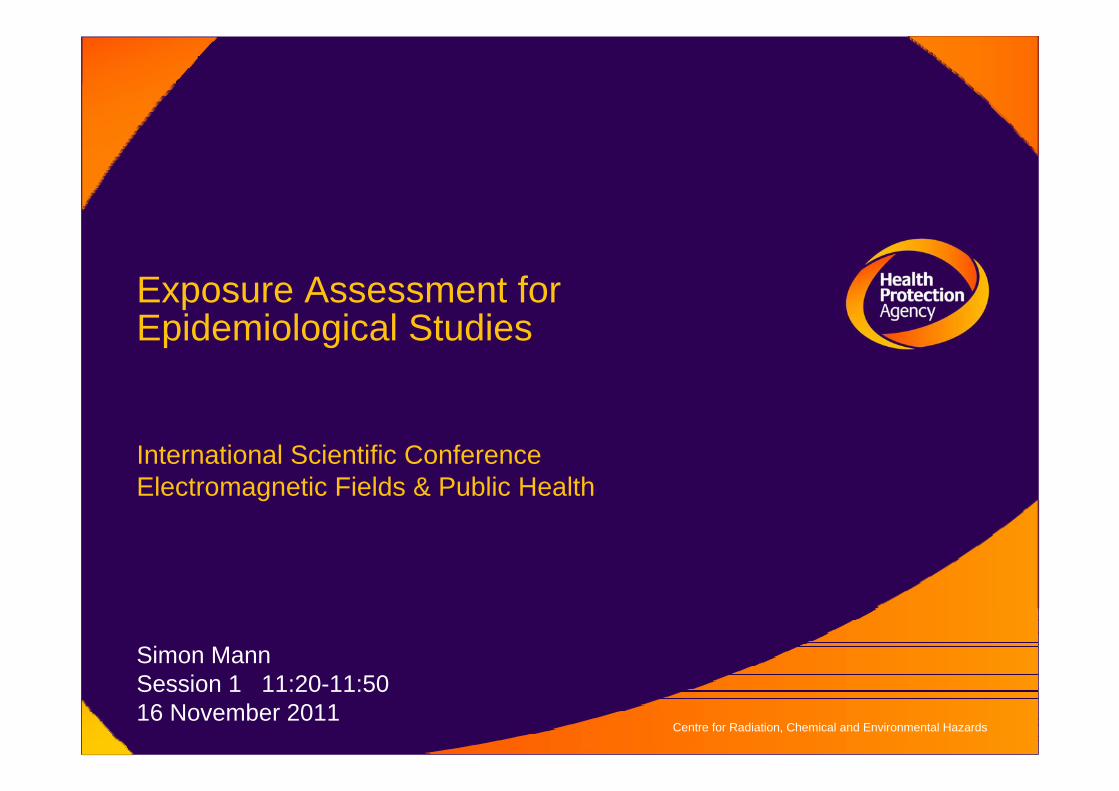
How to assess exposure of individuals within an observationalstudy over a time-period of interest (hours, days, years)
• Measures of Exposure• Factors Affecting Exposure• Occupational Studies• Environmental Studies• Mobile Phones
Study Types•Retrospective•Prospective
Sources of Information for an Epidemiological Study
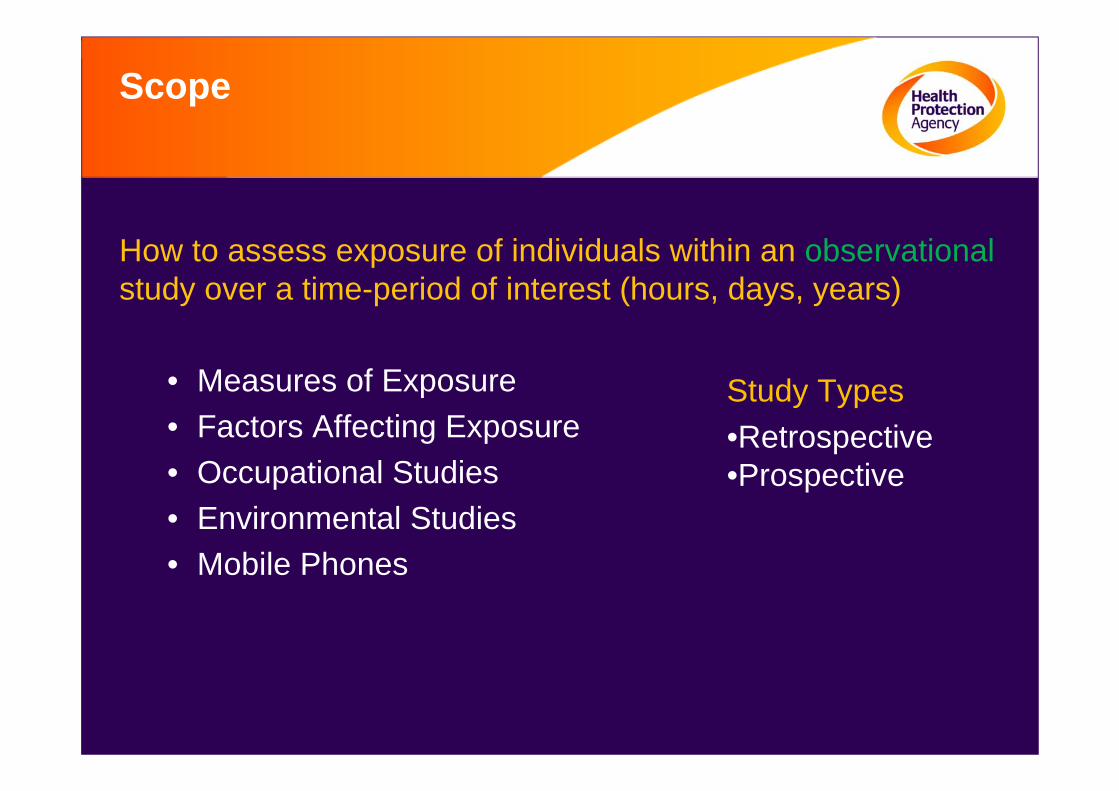
Questionnaire responses from participants • What, where, when, how?
Data gathered (prospectively) through electronic systems• Source emissions• Location of a person• Personal measurements
Databases for representative scenarios – lookup tables• Calculations• Measurements – spot or personal• Working/usage practices
Medical information (imaging etc) – tissues of interest
Centre for Radiation, Chemical and Environmental Hazards
Exposure Metrics
What is Exposure?Time & Space Aspects
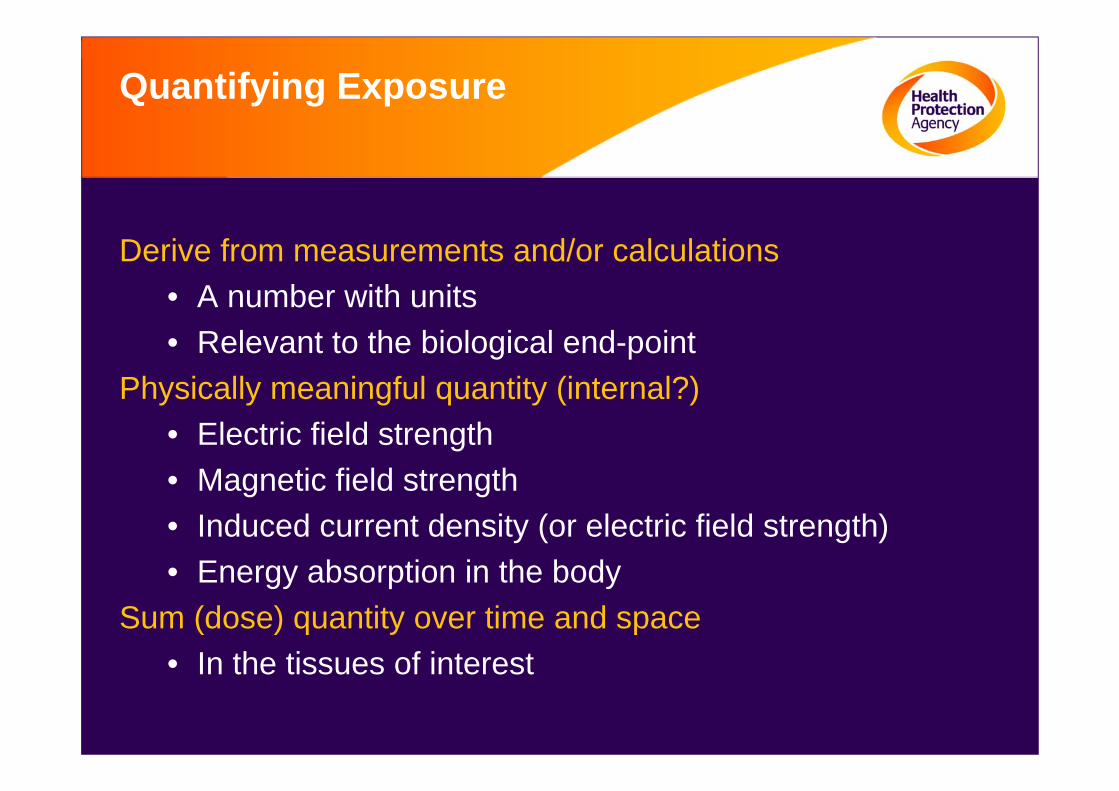
Quantifying Exposure
Derive from measurements and/or calculations• A number with units• Relevant to the biological end-point
Physically meaningful quantity (internal?)• Electric field strength• Magnetic field strength• Induced current density (or electric field strength)• Energy absorption in the body
Sum (dose) quantity over time and space• In the tissues of interest
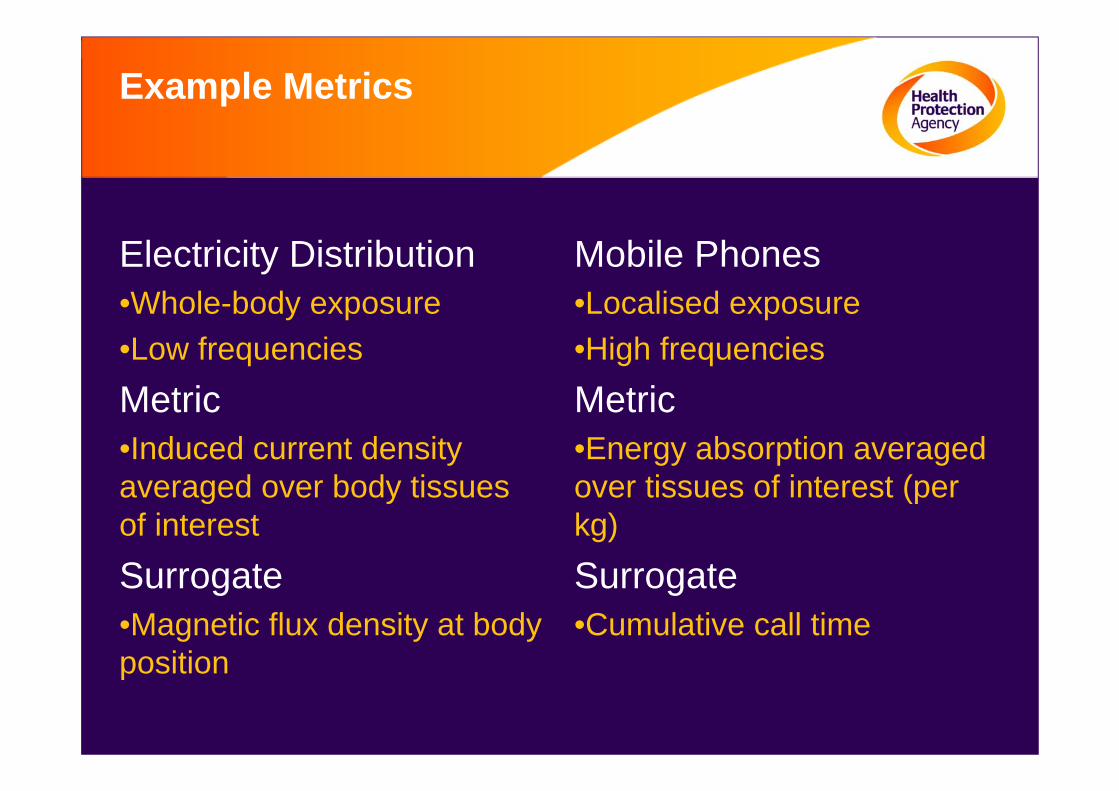
Example Metrics
Electricity Distribution•Whole-body exposure•Low frequenciesMetric•Induced current density averaged over body tissues of interestSurrogate•Magnetic flux density at body position
Mobile Phones•Localised exposure•High frequenciesMetric•Energy absorption averaged over tissues of interest (per kg)Surrogate•Cumulative call time
Centre for Radiation, Chemical and Environmental Hazards
Factors Affecting Exposure
General Considerations
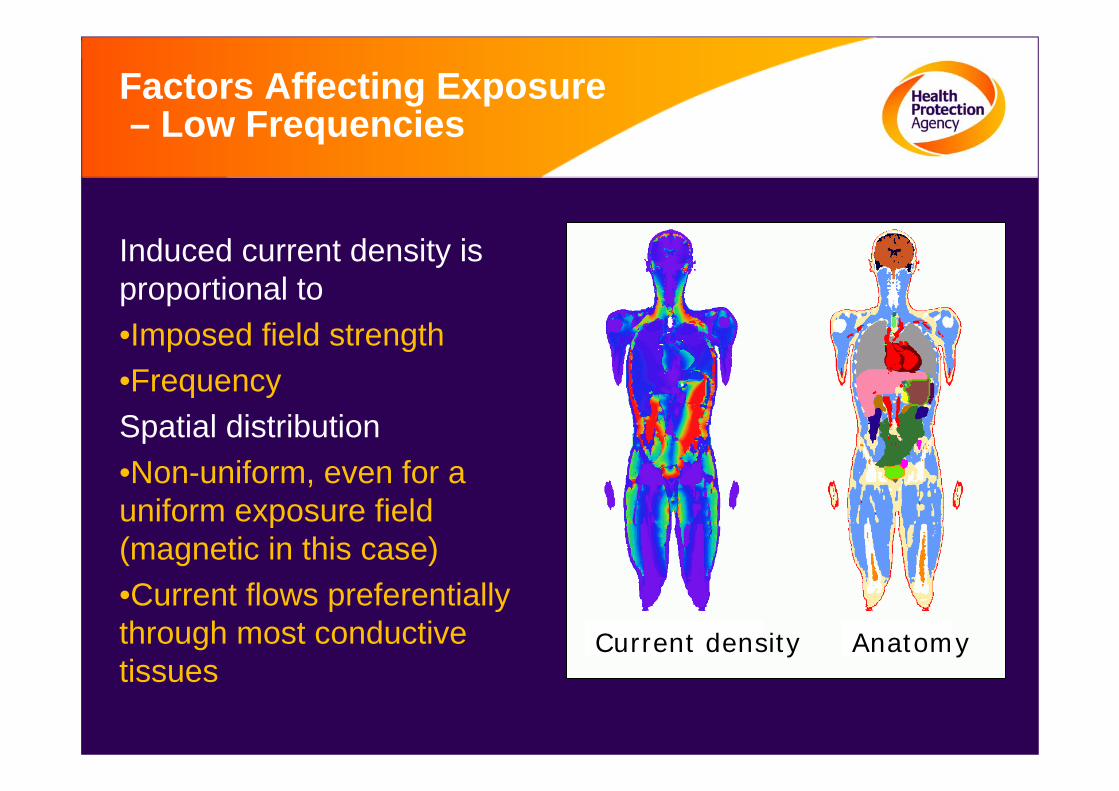
Factors Affecting Exposure– Low Frequencies
Induced current density is proportional to•Imposed field strength•FrequencySpatial distribution•Non-uniform, even for a uniform exposure field (magnetic in this case)•Current flows preferentially through most conductive tissues
Current density Anatomy
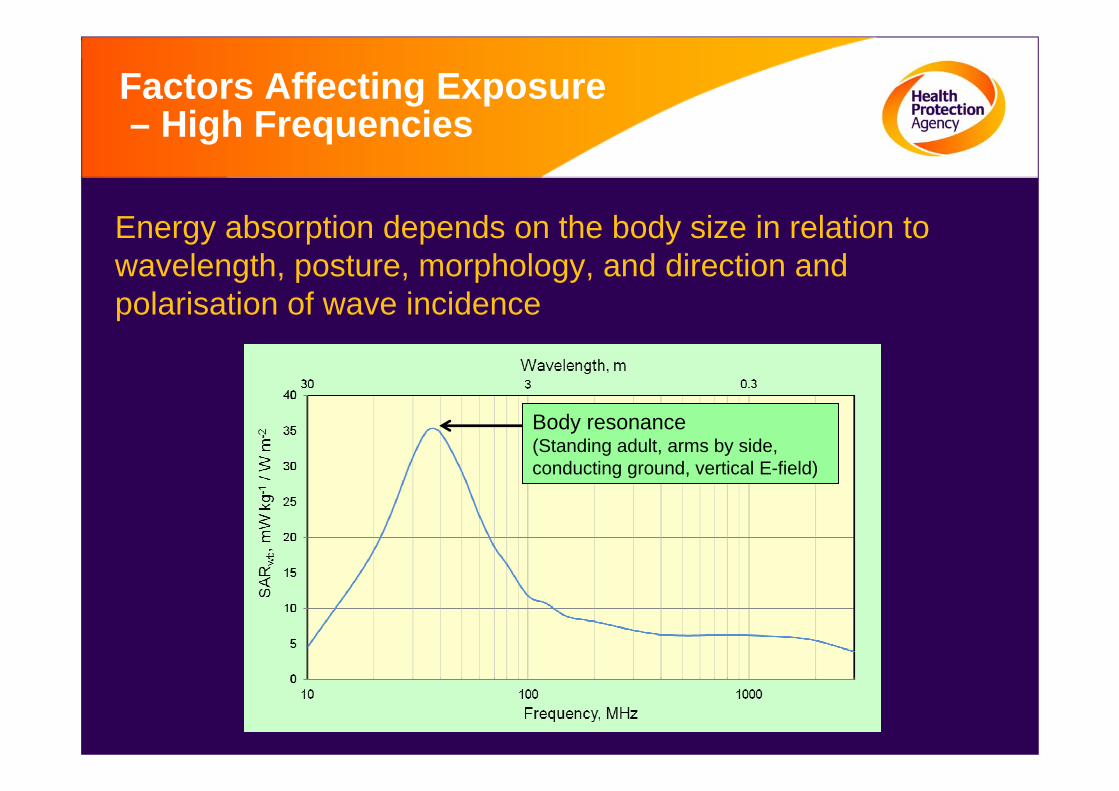
Factors Affecting Exposure– High Frequencies
Energy absorption depends on the body size in relation to wavelength, posture, morphology, and direction and polarisation of wave incidence
Body resonance(Standing adult, arms by side, conducting ground, vertical E-field)
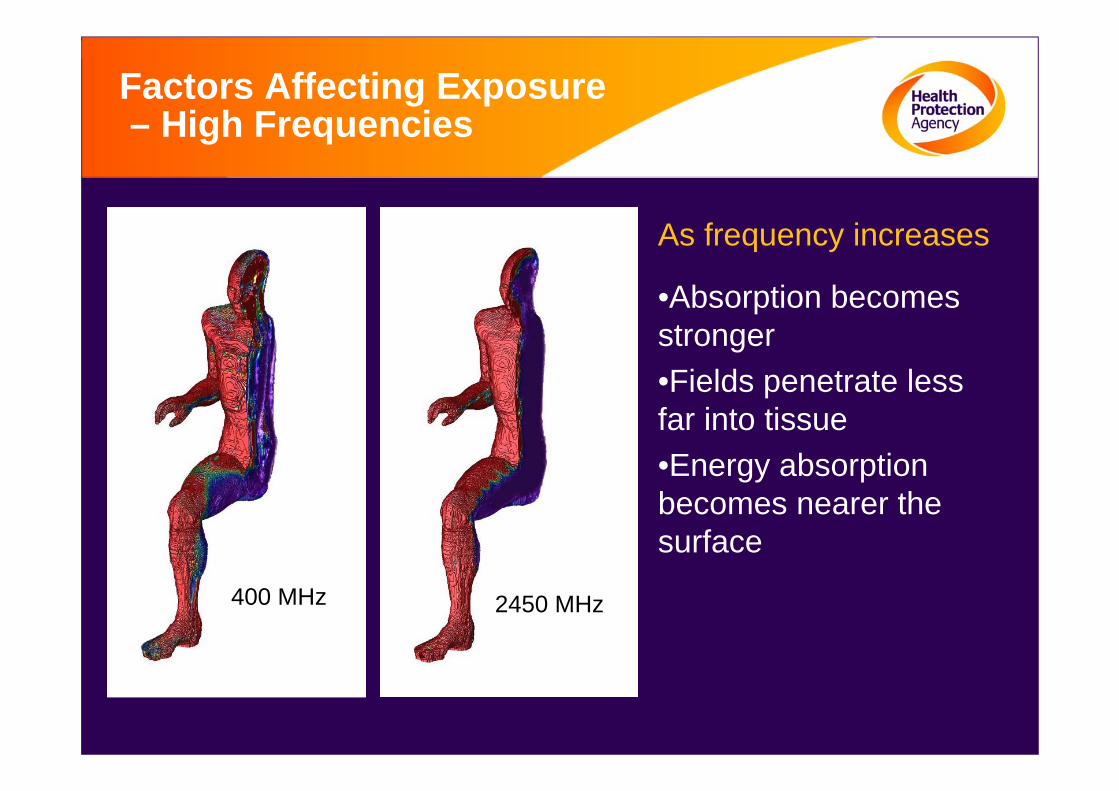
Factors Affecting Exposure– High Frequencies
As frequency increases
•Absorption becomes stronger•Fields penetrate less far into tissue•Energy absorption becomes nearer the surface
400 MHz 2450 MHz
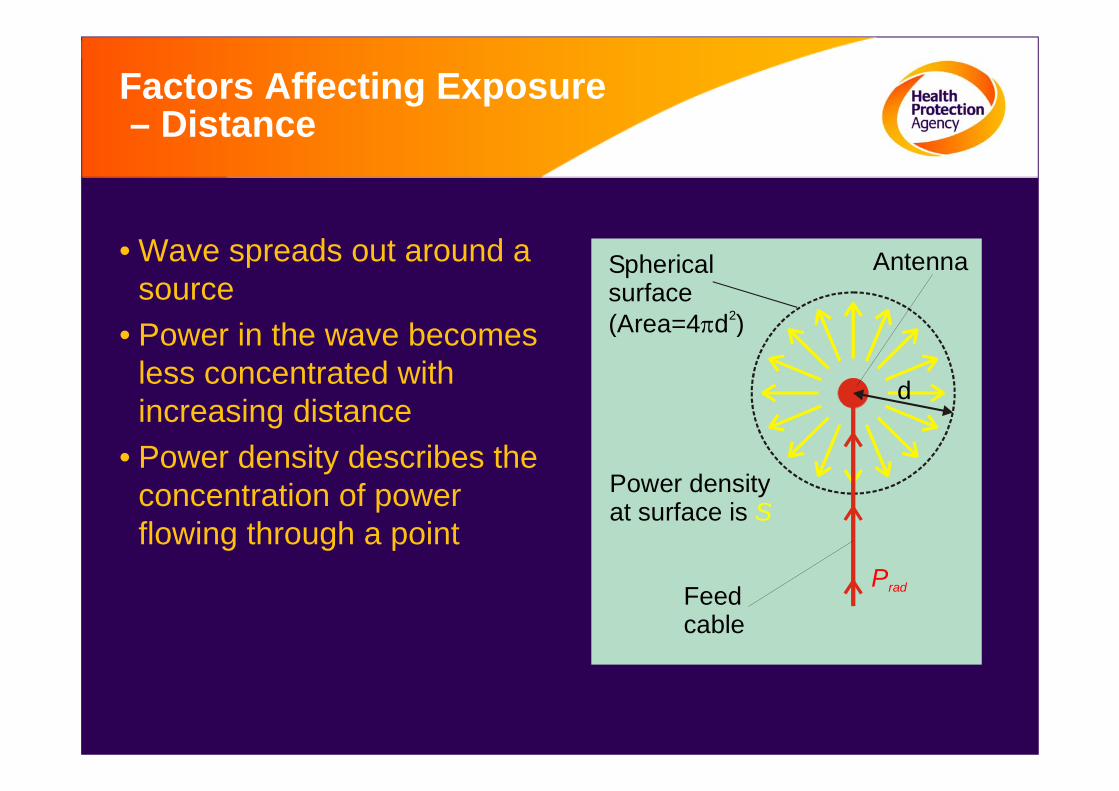
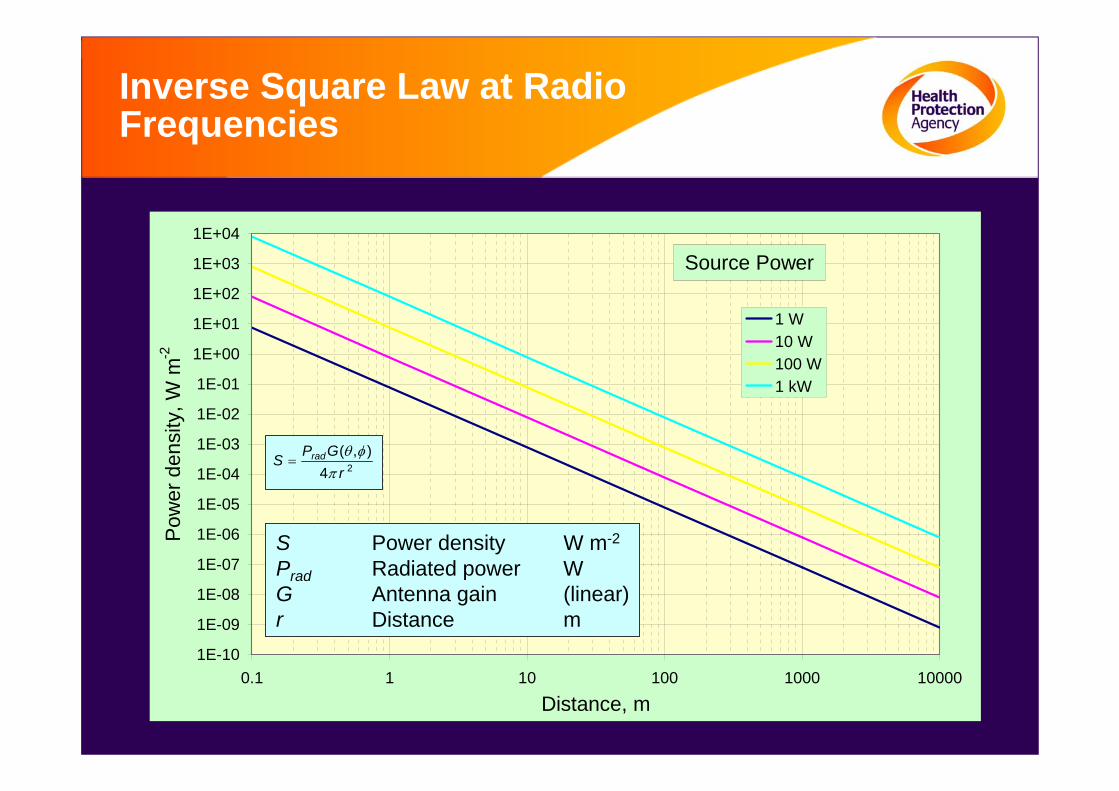
Factors Affecting Exposure– Distance
• Wave spreads out around a source
• Power in the wave becomes less concentrated with increasing distance
• Power density describes theconcentration of power flowing through a point
Prad
d
Sphericalsurface(Area=4 d )π 2
Antenna
Feedcable
Power density at surface is S
1E-10
1E-09
1E-08
1E-07
1E-06
1E-05
1E-04
1E-03
1E-02
1E-01
1E+00
1E+01
1E+02
1E+03
1E+04
0.1 1 10 100 1000 10000
Distance, m
Pow
er d
ensi
ty, W
m-2
1 W10 W100 W1 kW
Source Power
Inverse Square Law at Radio Frequencies
24),(
rGPS rad
πφθ
=
S Power density W m-2
Prad Radiated power WG Antenna gain (linear)r Distance m
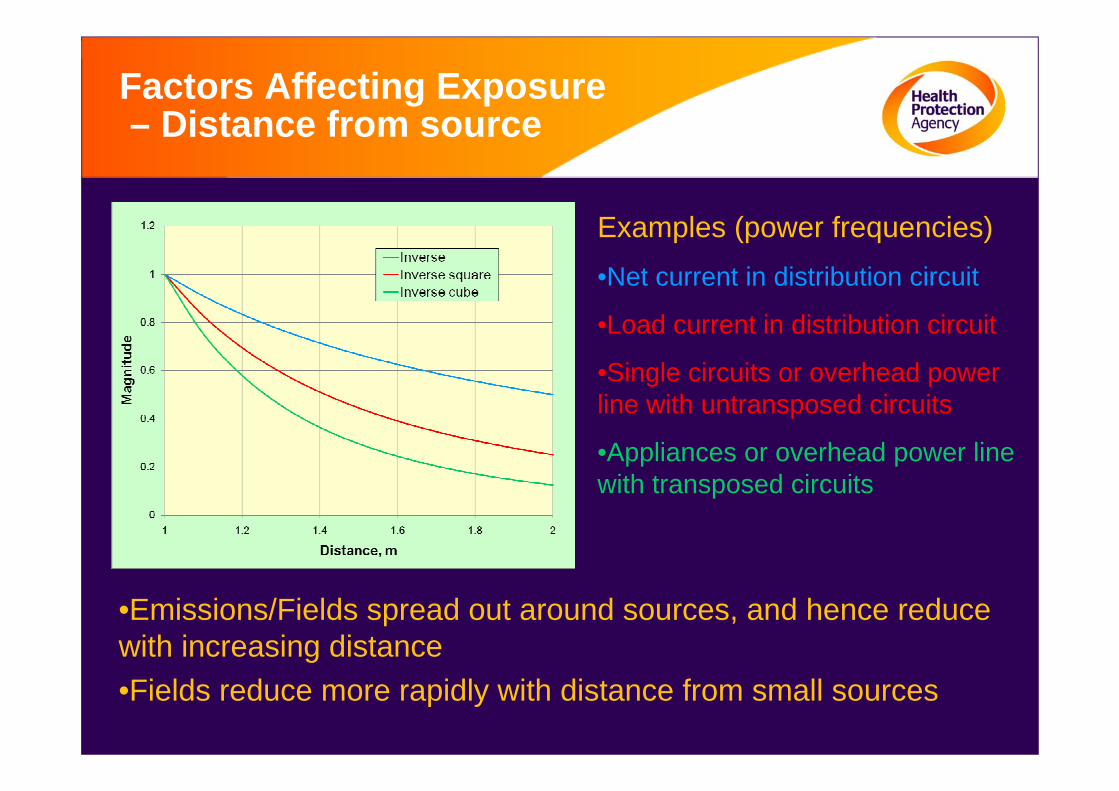
Factors Affecting Exposure– Distance from source
Examples (power frequencies)•Net current in distribution circuit
•Load current in distribution circuit
•Single circuits or overhead power line with untransposed circuits
•Appliances or overhead power line with transposed circuits
•Emissions/Fields spread out around sources, and hence reduce with increasing distance•Fields reduce more rapidly with distance from small sources
Summary of Factors Affecting Exposure from a Source
• Source emissions (frequency, power, current, voltage)• Source configuration (size, shape)• Distribution of emissions from the source (angular)• Distance, location, orientation of source from the body• Body size, shape, morphology• Influence of the environment (obstacles, reflection)

Centre for Radiation, Chemical and Environmental Hazards
Occupational Studies
Working with EMF Sources

Occupational Sources
Spot Measurements– Limitations
• Published measurements are available for most sources, but what do they mean?• Most measurements are made as maximum exposures
reasonably foreseeable – regulatory requirements• Epidemiology usually needs typical average exposures,
which may be very different• Need to consider duty factors
• On/off cycle of equipment when working• Shift duration• Number of shifts per day, week etc
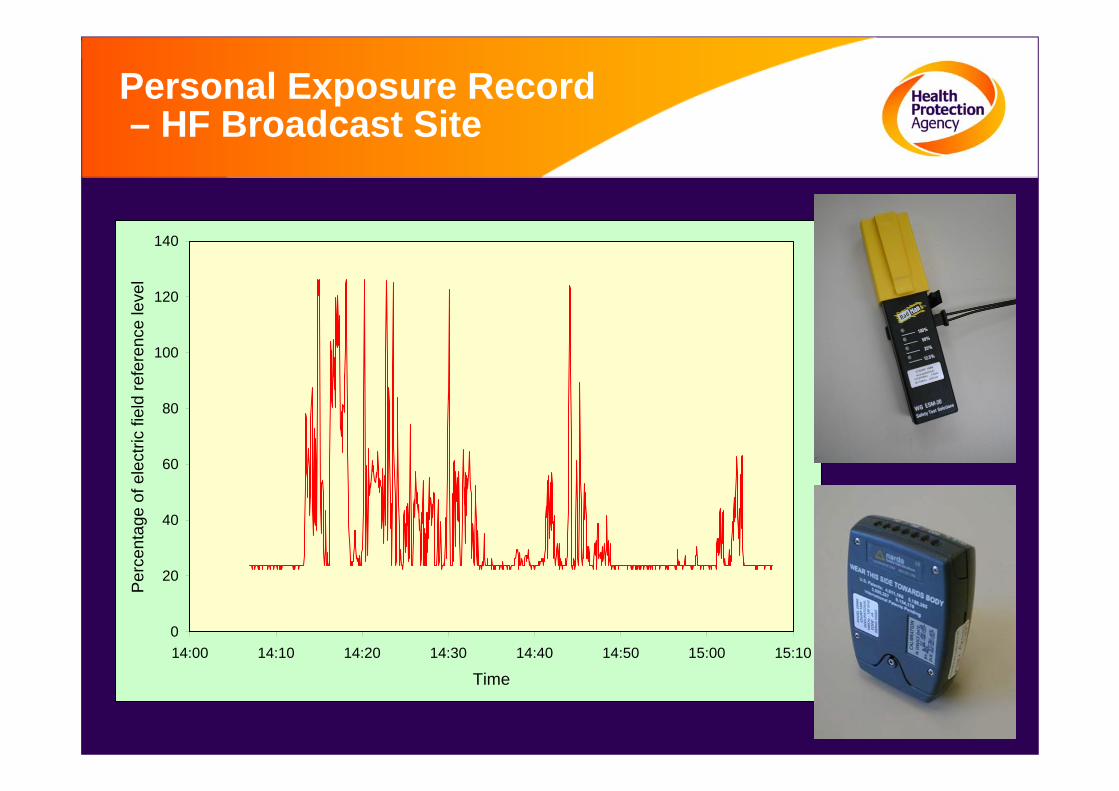
Personal Exposure Record– HF Broadcast Site
0
20
40
60
80
100
120
140
14:00 14:10 14:20 14:30 14:40 14:50 15:00 15:10
Time
Per
cent
age
of e
lect
ric fi
eld
refe
renc
e le
vel
Issues with Job Titles
• Can be too broad – misclassification• Working with radar?
• May have different meanings in different contexts• Assessments need to be specific and linked to actual
measurements• Experts making judgements should watch and talk to
people doing the work• Beware of other sources
• People climbing broadcast towers use walkie-talkies and mobile phones
Historical Exposures
Options• Make a measurement today• Use historical published measurements• Calculations based on expert judgement
Problems• Source decommissioned – power/frequency unknown• Exposure may depend critically on juxtaposition to source• Working practices unknown/undefined
Summary of Occupational Assessments
Solution•Develop job-exposure matrices based on representative measurements and dosimetry
Pitfalls•Misuse of compliance measurements•Omitting secondary sources of exposure•Not accounting for duty factors properly•Job titles not specific enough
Centre for Radiation, Chemical and Environmental Hazards
Environmental Studies
Communities Near Radio Transmitters or Power Lines
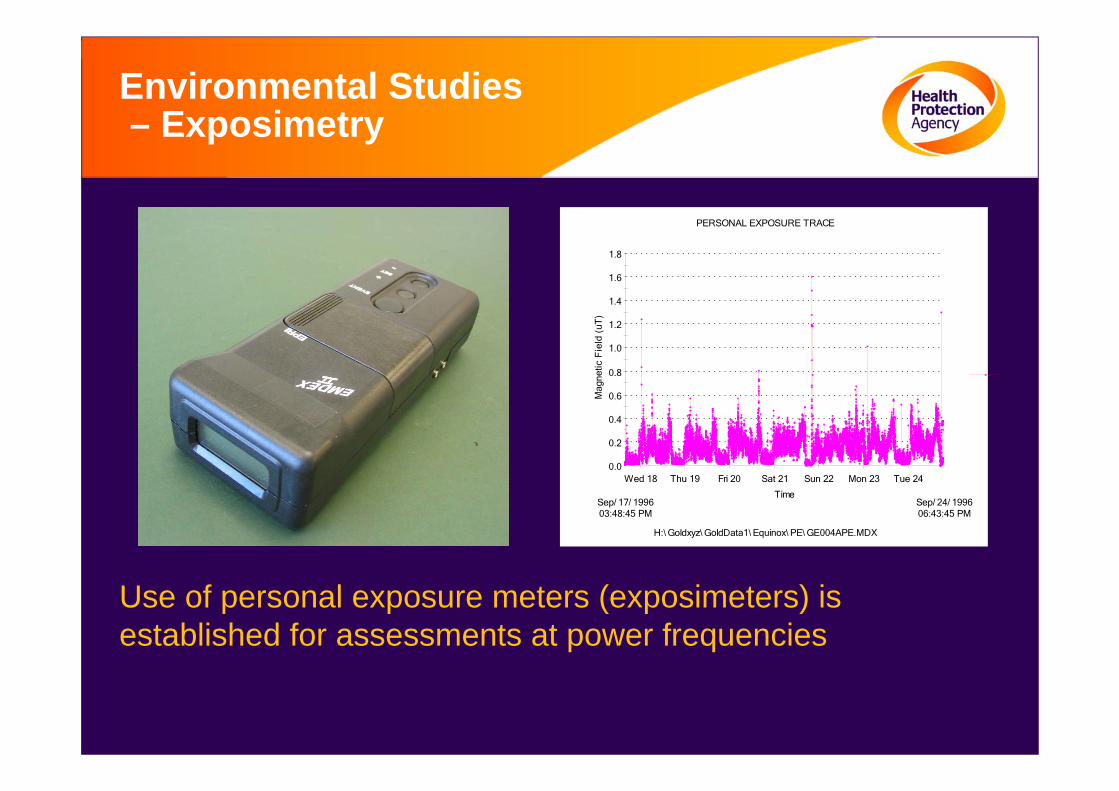
Environmental Studies– Exposimetry
0.0
0.2
0.4
0.6
0.8
1.0
1.2
1.4
1.6
1.8
Wed 18 Thu 19 Fri 20 Sat 21 Sun 22 Mon 23 Tue 24
Mag
netic
Fie
ld (
uT)
Time
PERSONAL EXPOSURE TRACE
H:\ Goldxyz\ GoldData1\ Equinox\ PE\ GE004APE.MDX
Sep/ 17/ 199603:48:45 PM
Sep/ 24/ 199606:43:45 PM
Use of personal exposure meters (exposimeters) is established for assessments at power frequencies
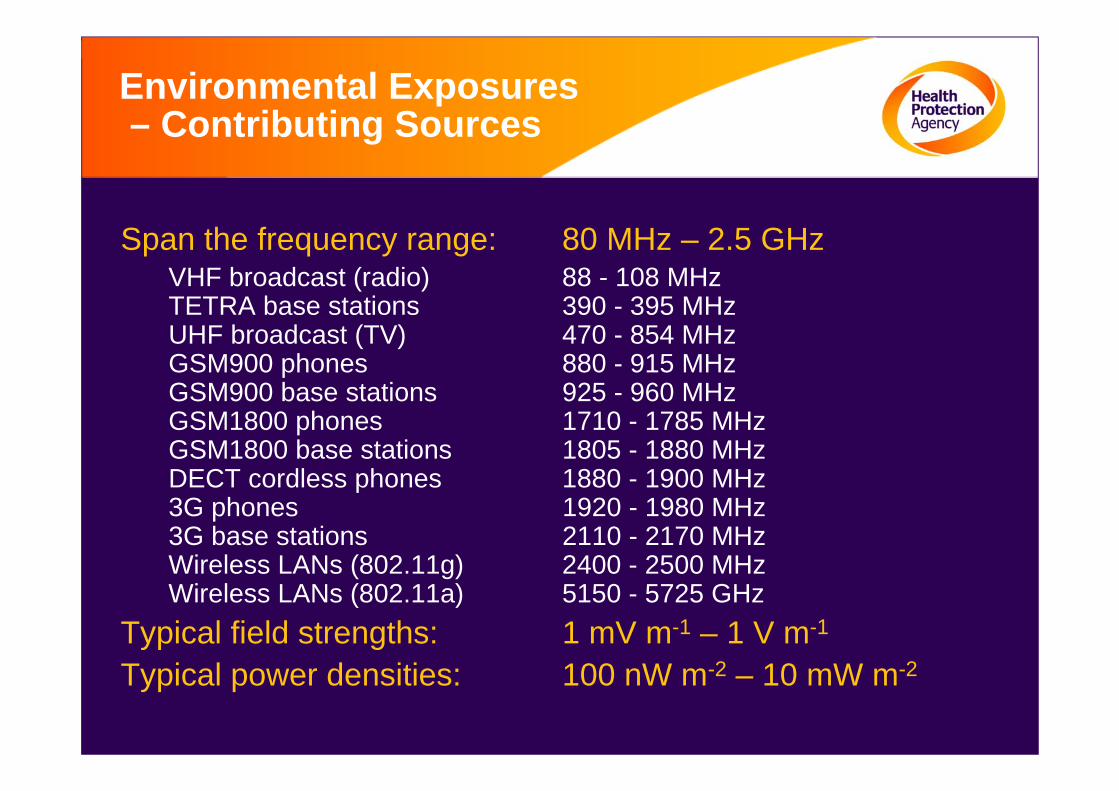
Environmental Exposures– Contributing Sources
Span the frequency range: 80 MHz – 2.5 GHzVHF broadcast (radio) 88 - 108 MHzTETRA base stations 390 - 395 MHzUHF broadcast (TV) 470 - 854 MHzGSM900 phones 880 - 915 MHzGSM900 base stations 925 - 960 MHzGSM1800 phones 1710 - 1785 MHzGSM1800 base stations 1805 - 1880 MHzDECT cordless phones 1880 - 1900 MHz3G phones 1920 - 1980 MHz3G base stations 2110 - 2170 MHzWireless LANs (802.11g) 2400 - 2500 MHzWireless LANs (802.11a) 5150 - 5725 GHz
Typical field strengths: 1 mV m-1 – 1 V m-1
Typical power densities: 100 nW m-2 – 10 mW m-2
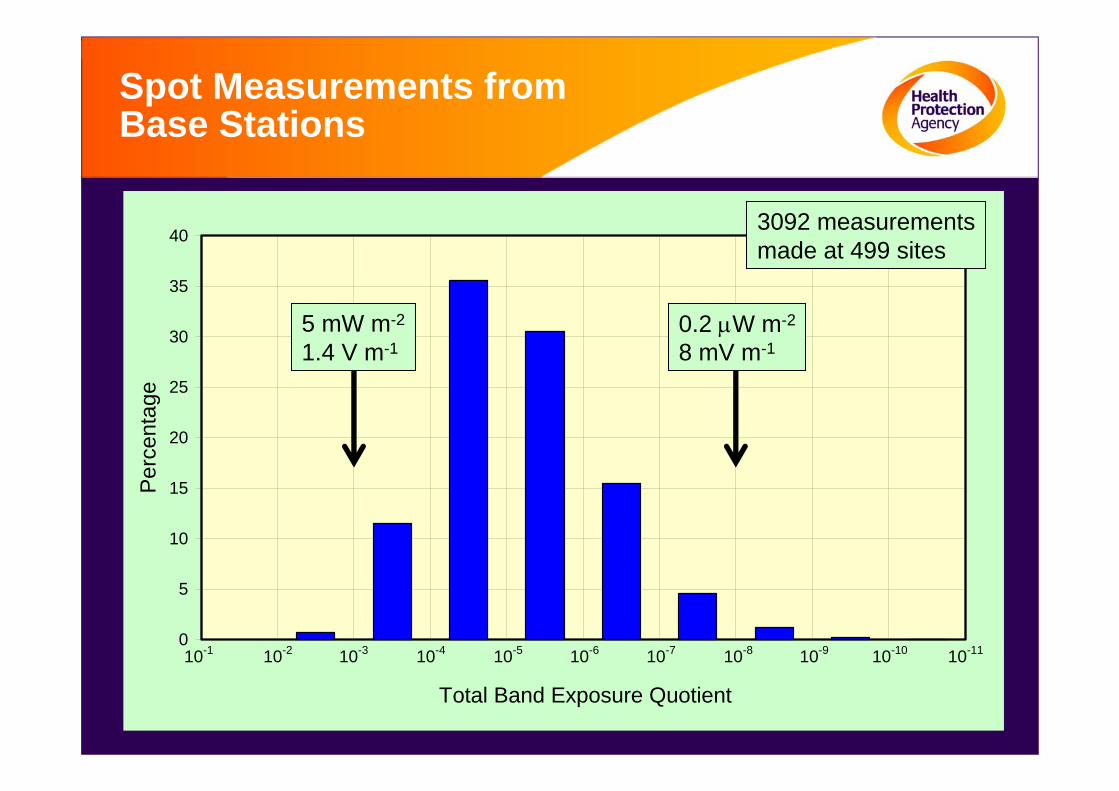
Spot Measurements from Base Stations
0
5
10
15
20
25
30
35
40
Total Band Exposure Quotient
Per
cent
age
10-1 10-1110-1010-910-810-710-610-510-410-310-2
0.2 μW m-2
8 mV m-1
3092 measurements made at 499 sites
5 mW m-2
1.4 V m-1
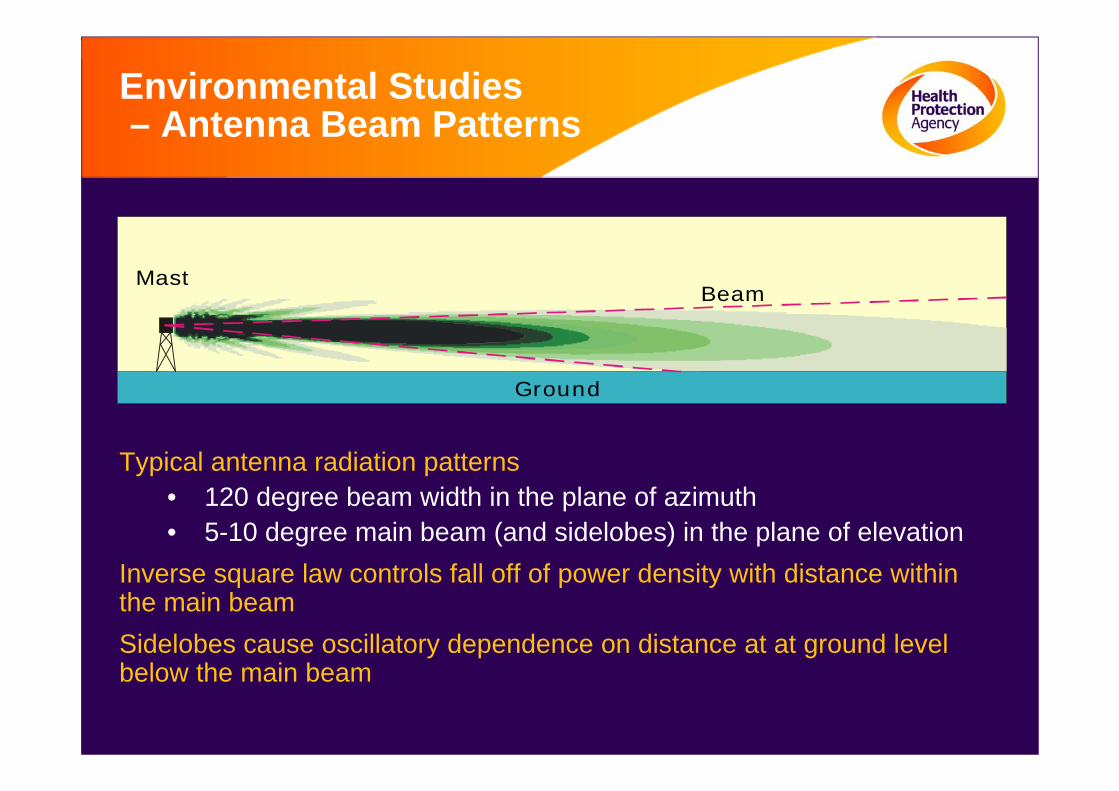
Environmental Studies– Antenna Beam Patterns
Typical antenna radiation patterns• 120 degree beam width in the plane of azimuth• 5-10 degree main beam (and sidelobes) in the plane of elevation
Inverse square law controls fall off of power density with distance within the main beamSidelobes cause oscillatory dependence on distance at at ground level below the main beam
MastBeam
Ground
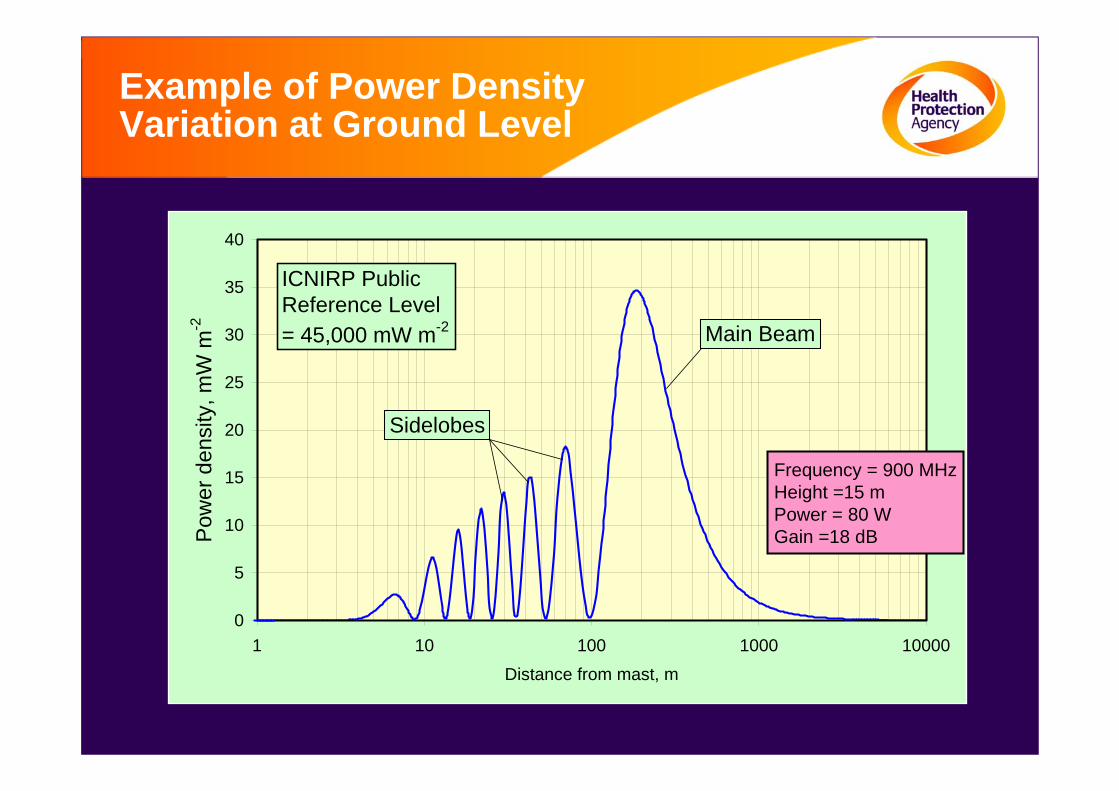
Example of Power Density Variation at Ground Level
0
5
10
15
20
25
30
35
40
1 10 100 1000 10000Distance from mast, m
Pow
er d
ensi
ty, m
W m
-2
ICNIRP Public Reference Level= 45,000 mW m-2 Main Beam
Sidelobes
Frequency = 900 MHzHeight =15 mPower = 80 WGain =18 dB
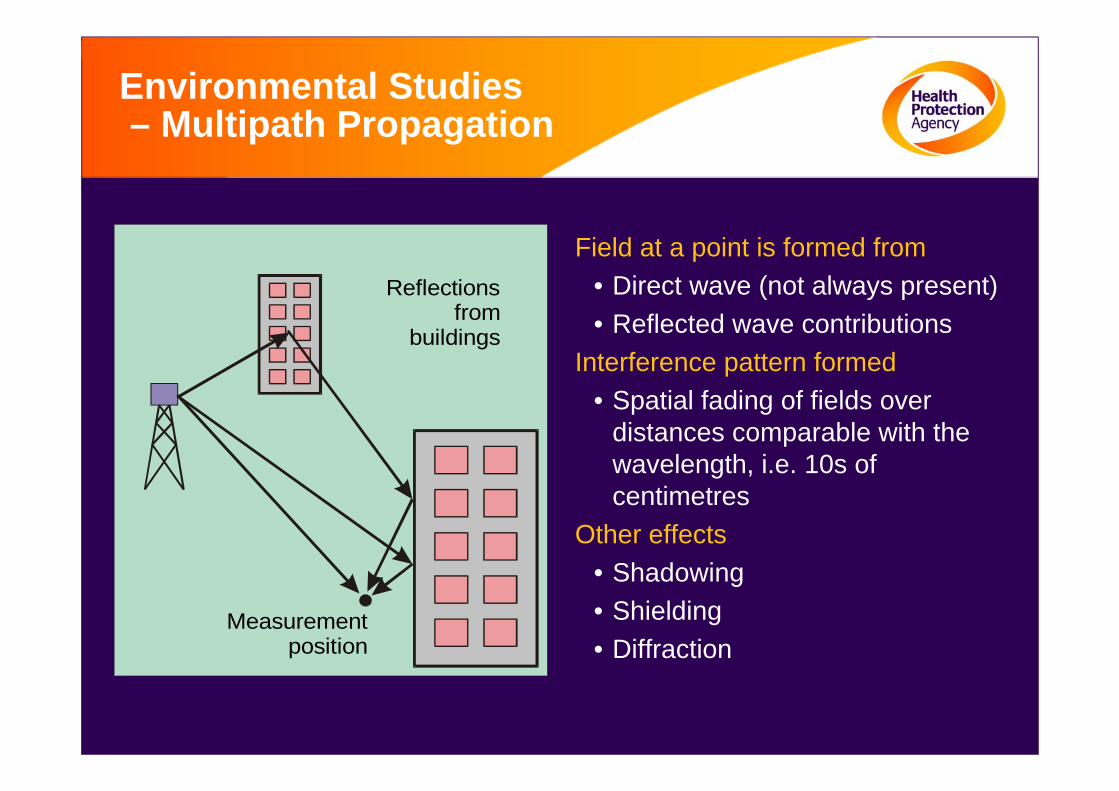
Environmental Studies– Multipath Propagation
Field at a point is formed from• Direct wave (not always present)• Reflected wave contributions
Interference pattern formed• Spatial fading of fields over
distances comparable with the wavelength, i.e. 10s of centimetres
Other effects• Shadowing• Shielding• Diffraction
Measurementposition
Reflectionsfrom
buildings
Summary of Environmental Assessments
Solutions•Ask participants to wear personal exposure meters•Develop activity/location exposure matrices•Develop (and validate) calculation models
Pitfalls•Use of distance as a surrogate for exposure•Not calibrating/correcting personal dosimeters•Neglecting sources other than the one of concern
Centre for Radiation, Chemical and Environmental Hazards
Mobile Phone Studies
Transmitters Near the Body
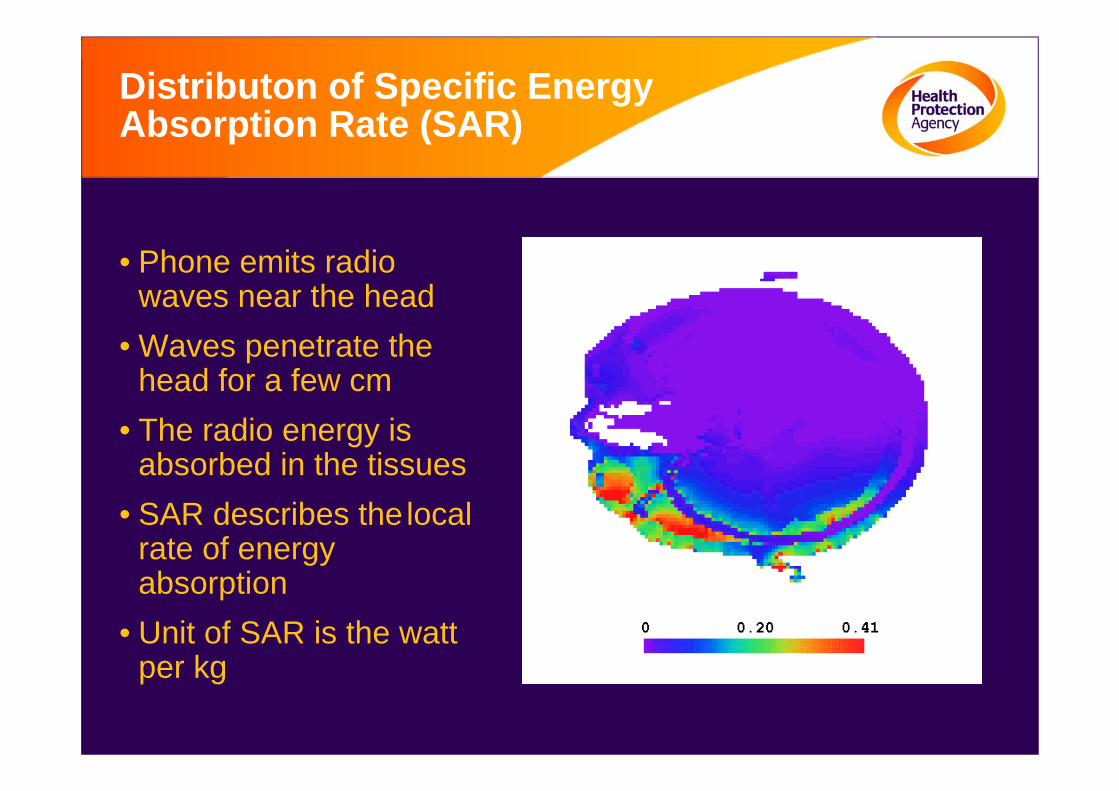
Distributon of Specific Energy Absorption Rate (SAR)
• Phone emits radio waves near the head
• Waves penetrate the head for a few cm
• The radio energy is absorbed in the tissues
• SAR describes the local rate of energy absorption
• Unit of SAR is the watt per kg
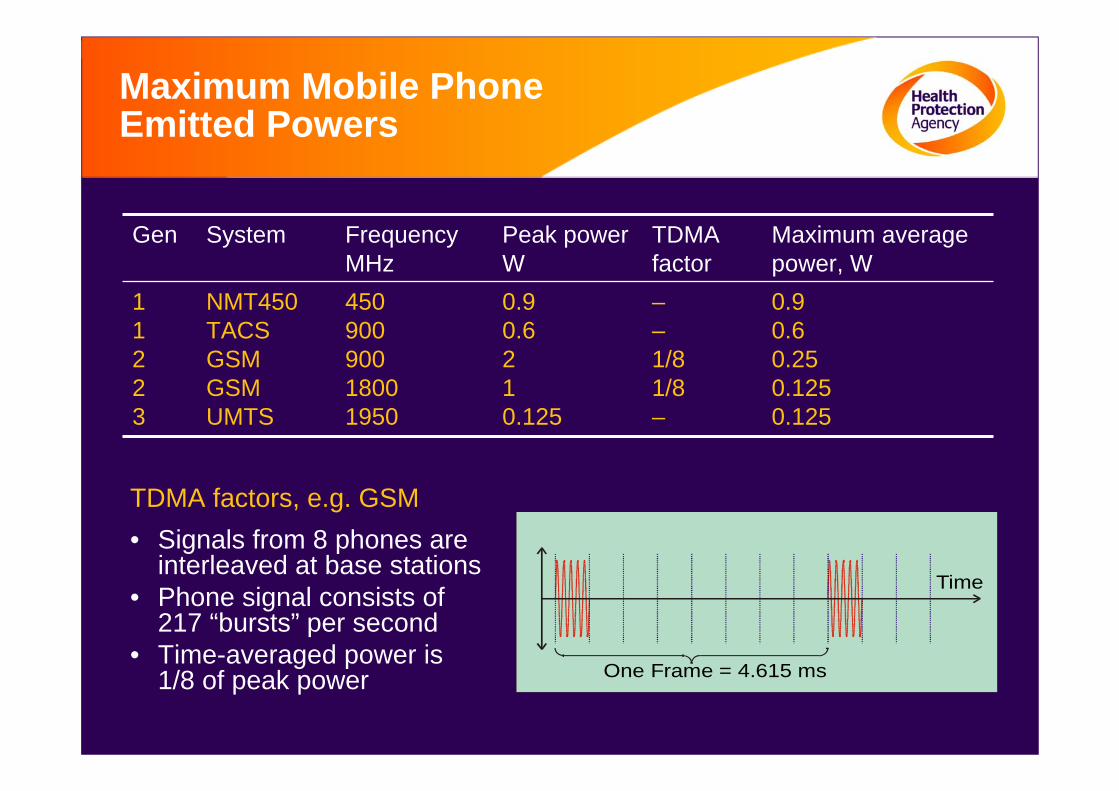
Maximum Mobile Phone Emitted Powers
TDMA factors, e.g. GSM• Signals from 8 phones are
interleaved at base stations• Phone signal consists of
217 “bursts” per second• Time-averaged power is
1/8 of peak power One Frame = 4.615 ms
Time
Gen System FrequencyMHz
Peak powerW
TDMA factor
Maximum average power, W
11223
NMT450TACSGSMGSMUMTS
45090090018001950
0.90.6210.125
––1/81/8–
0.90.60.250.1250.125
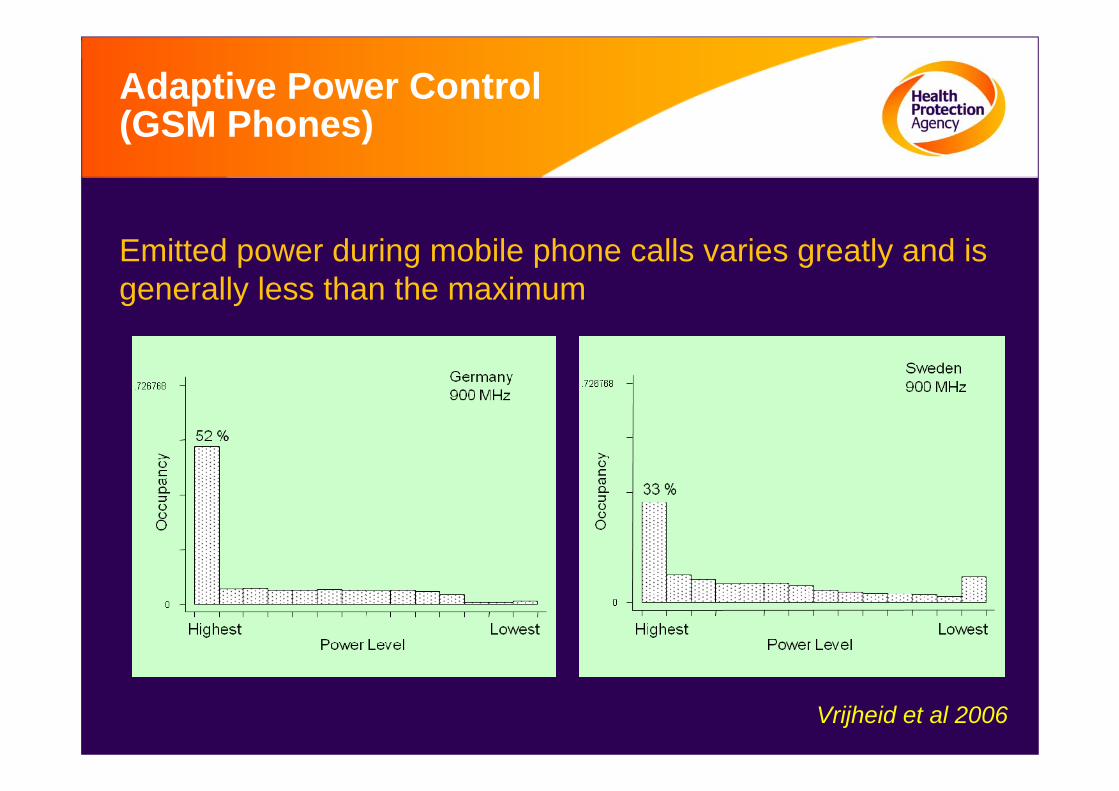
Adaptive Power Control(GSM Phones)
Emitted power during mobile phone calls varies greatly and is generally less than the maximum
Vrijheid et al 2006
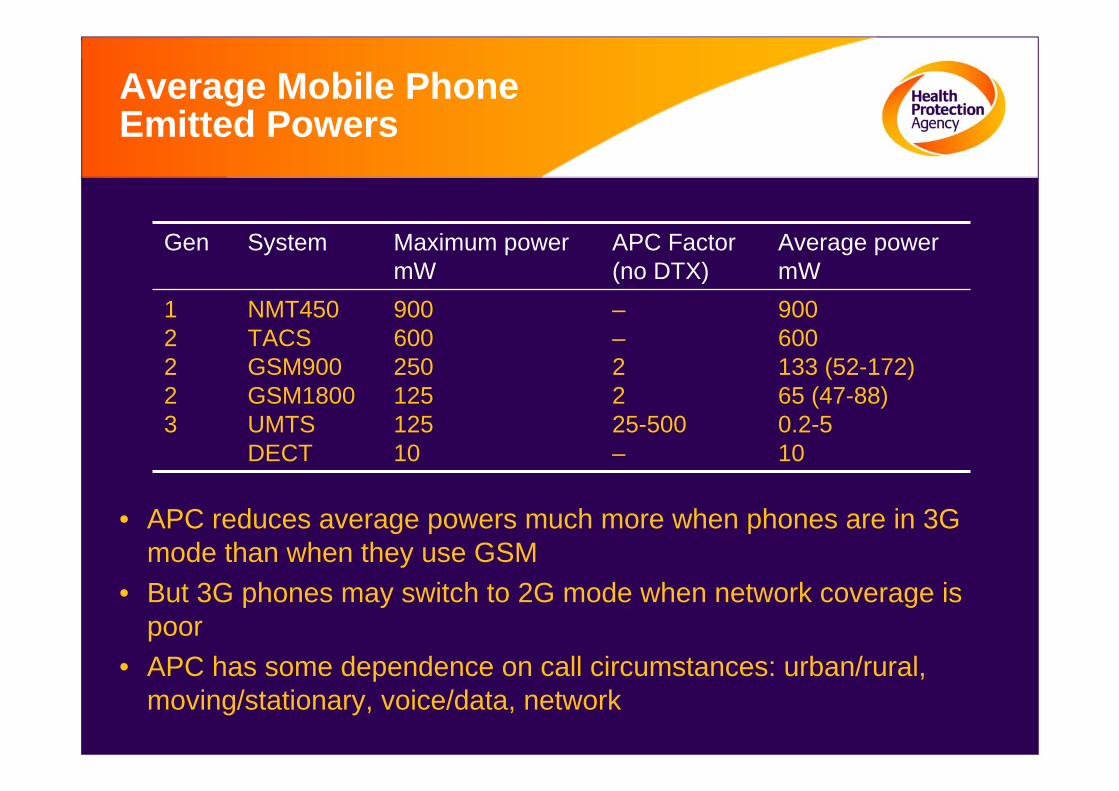
Average Mobile Phone Emitted Powers
Gen System Maximum powermW
APC Factor(no DTX)
Average powermW
12223
NMT450TACSGSM900GSM1800UMTSDECT
90060025012512510
––2225-500–
900600133 (52-172)65 (47-88)0.2-510
• APC reduces average powers much more when phones are in 3G mode than when they use GSM
• But 3G phones may switch to 2G mode when network coverage is poor
• APC has some dependence on call circumstances: urban/rural, moving/stationary, voice/data, network
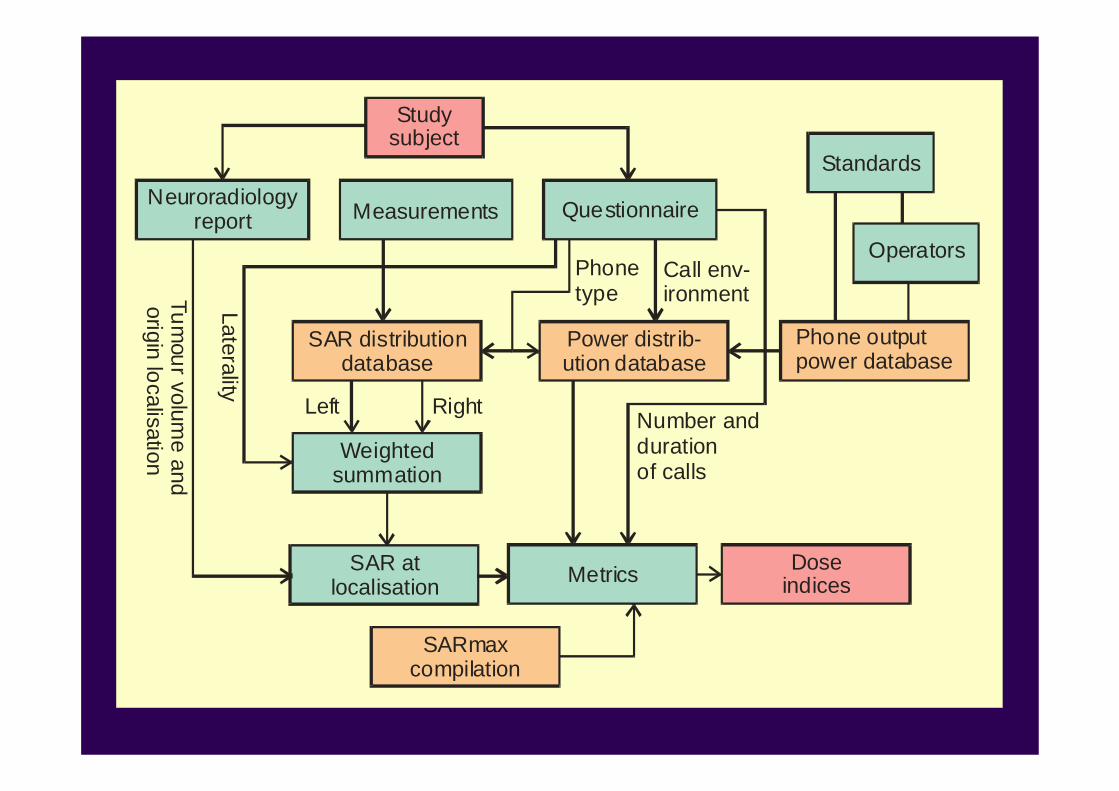
Phone typeLaterality
Call env-ironment
Studysubject
Questionnaire
Weightedsummation
SAR distributiondatabase
Power distrib-ution database
MetricsSAR atlocalisation
Doseindices
Neuroradiologyreport
Tumour volum
e and origin localisation
Left Right
Measurements
SARmaxcompilation
Number and duration of calls
Phone outputpower database
Operators
Standards
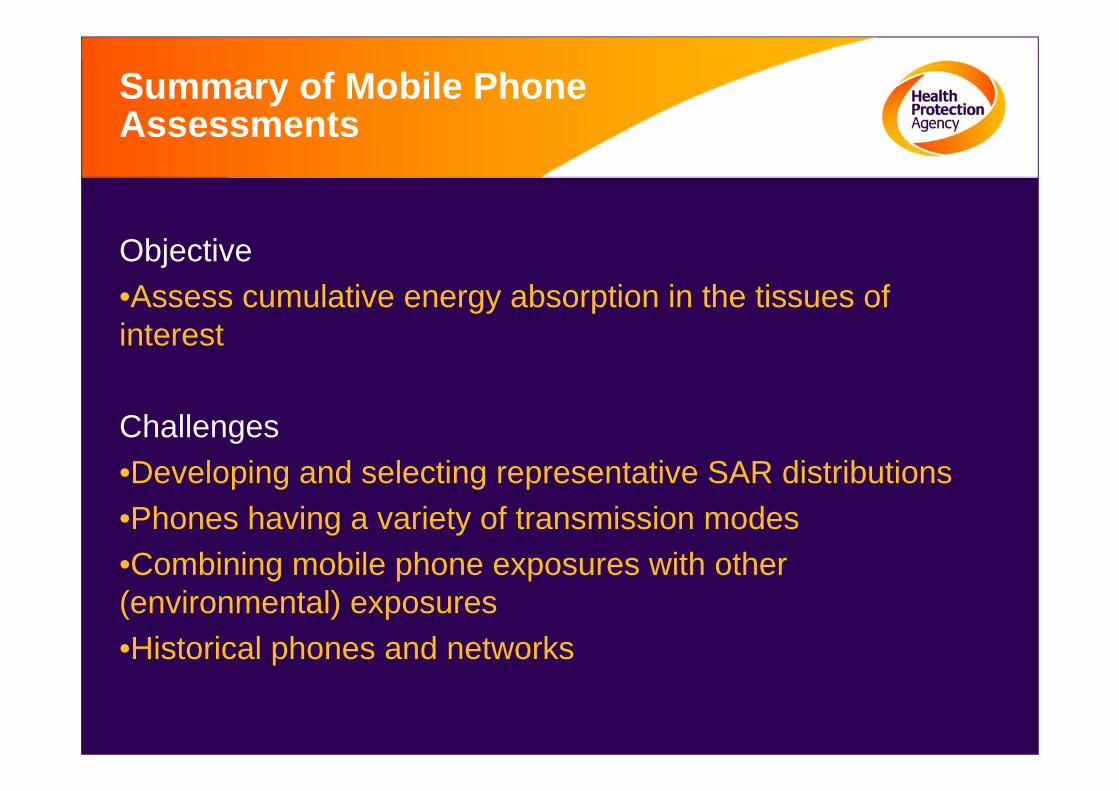
Summary of Mobile Phone Assessments
Objective•Assess cumulative energy absorption in the tissues of interest
Challenges•Developing and selecting representative SAR distributions•Phones having a variety of transmission modes•Combining mobile phone exposures with other (environmental) exposures•Historical phones and networks
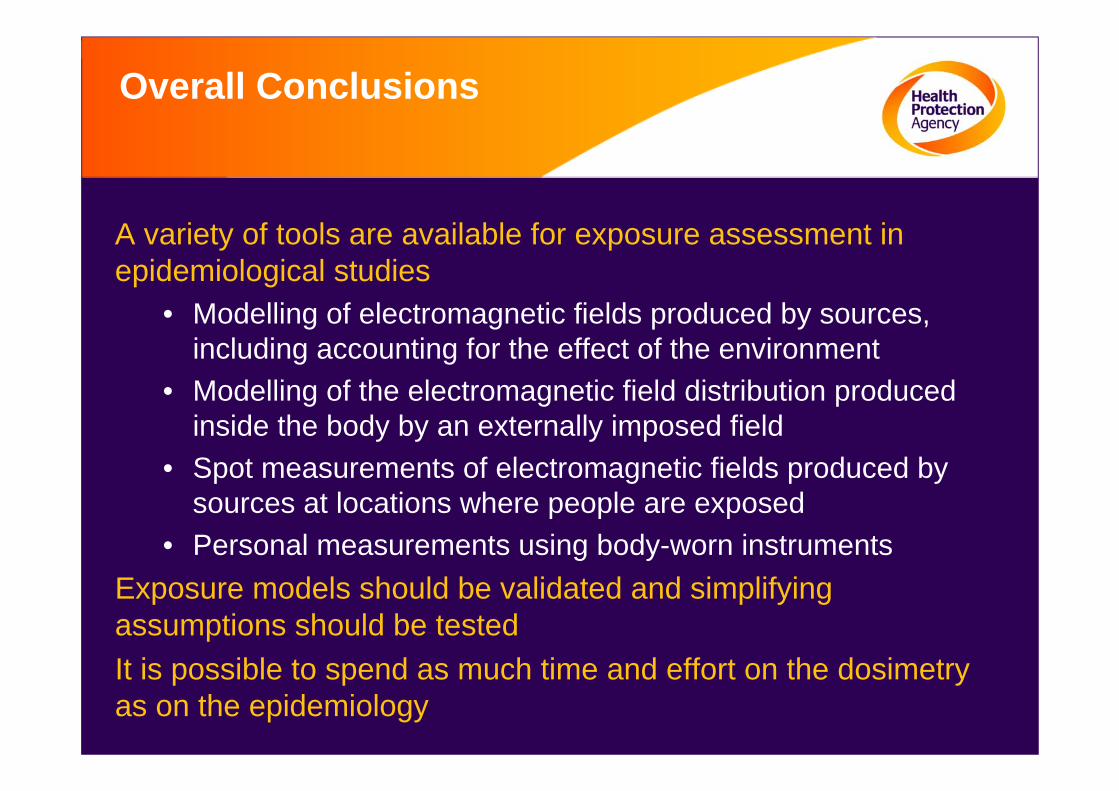
Overall Conclusions
A variety of tools are available for exposure assessment in epidemiological studies
• Modelling of electromagnetic fields produced by sources, including accounting for the effect of the environment
• Modelling of the electromagnetic field distribution produced inside the body by an externally imposed field
• Spot measurements of electromagnetic fields produced by sources at locations where people are exposed
• Personal measurements using body-worn instrumentsExposure models should be validated and simplifying assumptions should be testedIt is possible to spend as much time and effort on the dosimetryas on the epidemiology
This paper was produced for a meeting organized by Health & Consumers DG and represents the views of its author on thesubject. These views have not been adopted or in any way approved by the Commission and should not be relied upon as a statement of the Commission's or Health & Consumers DG's views. The European Commission does not guarantee the accuracy of the dataincluded in this paper, nor does it accept responsibility for any use made thereof.