Embed Size (px)
Citation preview
Exposure assessment of nanomaterials in consumer products Environmental project No. 1636, 2015
2
Title:
Exposure assessment of nanomaterials in
consumer products
Editing:
Poul Bo Larsen, DHI
Frans Christensen, COWI
Keld Alstrup Jensen, NFA
Anna Brinch, COWI
Sonja Hagen Mikkelsen, COWI
Published by:
The Danish Environmental Protection Agency
Strandgade 29
1401 Copenhagen K
Denmark
www.mst.dk/english
Year:
2015
ISBN no.
978-87-93283-57-2
Disclaimer:
When the occasion arises, the Danish Environmental Protection Agency will publish reports and papers concerning
research and development projects within the environmental sector, financed by study grants provided by the Danish
Environmental Protection Agency. It should be noted that such publications do not necessarily reflect the position or
opinion of the Danish Environmental Protection Agency.
However, publication does indicate that, in the opinion of the Danish Environmental Protection Agency, the content
represents an important contribution to the debate surrounding Danish environmental policy.
Sources must be acknowledged.
Exposure assessment of nanomaterials in consumer products 3
Contents
Preface ...................................................................................................................... 8
Summary and conclusions ......................................................................................... 9
1. Introduction ..................................................................................................... 27 1.1 Background .......................................................................................................................... 27 1.2 Objectives ............................................................................................................................. 28 1.3 Reader's guide to approach and methodology .................................................................... 28
1.3.1 Chapter 1. Introduction ......................................................................................... 28 1.3.2 Chapter 2. Nanoproducts and consumer exposure scenarios to look for ........... 28 1.3.3 Chapter 3 Review of available risk assessment tools ........................................... 29 1.3.4 Chapter 4. Exposure assessment and key factors affecting exposure ................. 29 1.3.5 Chapter 5. Specific nanomaterial exposure assessment ...................................... 29 1.3.6 Chapter 6. Selection of exposure scenarios for further exposure and risk
assessment ............................................................................................................. 29 1.3.7 Chapter 7. Consumer exposure to nanomaterials - exposure assessment
of selected scenarios – .......................................................................................... 29 1.4 Working process .................................................................................................................. 30 1.5 Terminology ......................................................................................................................... 30
2. Nano-products and consumer exposure scenarios to look for ........................... 31 2.1 Searching for relevant product categories ........................................................................... 31 2.2 Data sources for finding information on specific nano-products on the market .............. 32 2.3 Strategy for extraction of product information .................................................................. 33 2.4 Findings from the search on each of the product categories ............................................. 34
2.4.1 Food and beverages ............................................................................................... 35 2.4.2 Cosmetics............................................................................................................... 35 2.4.3 Cleaning agents ......................................................................................................37 2.4.4 Coatings/ impregnation .........................................................................................37 2.4.5 Maintenance products (car, boats) ........................................................................37 2.4.6 Textiles .................................................................................................................. 38 2.4.7 Construction materials ......................................................................................... 38 2.4.8 Medical devices ..................................................................................................... 39 2.4.9 Air-cleaners ........................................................................................................... 39 2.4.10 Fuel and lubrication oil additives ......................................................................... 40 2.4.11 Electronic devices/products ................................................................................. 40 2.4.12 Appliances .............................................................................................................. 41
2.5 Overall findings regarding nanomaterials in the various product categories .................... 41
3. Review of available risk assessment tools ......................................................... 44 3.1 Scope/objective/boundaries................................................................................................ 44 3.2 Summary and comparison of the scope and approach of the assessed tools .................... 45
3.2.1 Nano-specific tools ................................................................................................ 50 3.2.2 General (non-nano) tools...................................................................................... 50
3.3 Initial assessment and comparison of the ability of the tools to assess relevant
consumer exposure scenarios............................................................................................... 51
4
3.4 Conclusions and considerations for the way forward ........................................................ 59
4. Exposure assessment and key factors affecting exposure .................................. 61 4.1 Objective ................................................................................................................................ 61 4.2 Overall findings from the search on relevant exposure parameters .................................. 62
4.2.1 Identification of exposure parameters ................................................................. 62 4.2.2 Conclusions ........................................................................................................... 64
5. Specific nanomaterial exposure assessments .................................................... 68 5.1 Objective and approach ....................................................................................................... 68 5.2 Examples of nanomaterial exposure from food and beverages ......................................... 68
5.2.1 Main findings ........................................................................................................ 68 5.2.2 Specific data .......................................................................................................... 69
5.3 Examples of nanomaterial exposure from cosmetics ......................................................... 72 5.3.1 Main findings ........................................................................................................ 72 5.3.2 Specific data ...........................................................................................................73
5.4 Examples of Nanomaterial exposure from cleaning products ........................................... 79 5.4.1 Main findings ........................................................................................................ 79 5.4.2 Specific data .......................................................................................................... 79
5.5 Examples of nanomaterial exposure from coating/impregnation and maintenance
products ................................................................................................................................. 81 5.5.1 Main findings ......................................................................................................... 81 5.5.2 Specific data .......................................................................................................... 82
5.6 Examples of nanomaterial exposure from textiles ............................................................. 84 5.6.1 Main findings ........................................................................................................ 84 5.6.2 Specific data .......................................................................................................... 85
5.7 Examples of Nanomaterial exposure from construction materials ................................... 88 5.7.1 Main findings ........................................................................................................ 88 5.7.2 Specific data .......................................................................................................... 88
5.8 Examples of nanomaterial exposure from medical devices ................................................ 91 5.8.1 Main findings ......................................................................................................... 91 5.8.2 Specific data .......................................................................................................... 92
5.9 Examples of nanomaterial exposure from air cleaners ...................................................... 94 5.9.1 Main findings ........................................................................................................ 94 5.9.2 Specific data .......................................................................................................... 95
5.10 Examples of nanomaterial exposure from electronic devices, sports equipment
and appliances (general use) ............................................................................................... 96 5.10.1 Main findings ........................................................................................................ 96 5.10.2 Specific data .......................................................................................................... 96
5.11 Examples of release from wear, tear and mechanical reworking ...................................... 96 5.12 Overall findings from the examples .................................................................................. 102
6. Selection of exposure scenarios for further exposure and risk assessment ...... 106 6.1 Selection of consumer products as examples of representative consumer exposure
scenarios ............................................................................................................................. 106 6.2 Criteria for selection ........................................................................................................... 113
7. Consumer exposure to nanomaterials - exposure assessment of selected
scenarios ......................................................................................................... 115 7.1 Estimation of nanomaterial exposure ................................................................................ 115 7.2 Discussion of outcome ........................................................................................................ 123
7.2.1 Scenarios covering oral exposure ........................................................................ 123 7.2.2 Scenarios covering dermal exposure ................................................................... 123 7.2.3 Scenarios covering inhalation exposure .............................................................. 123 7.2.4 Scenarios covering eye exposure ......................................................................... 124
Exposure assessment of nanomaterials in consumer products 5
7.2.5 Overall dose levels from use of the various product categories and
formulations ......................................................................................................... 124 7.2.6 Exposure to specific nanomaterials..................................................................... 125 7.2.7 Target groups ....................................................................................................... 126
7.3 Uncertainty and knowledge gaps ....................................................................................... 126 7.4 Implications for use of data ................................................................................................ 127
8. References ..................................................................................................... 128
6
Contents of Appendix report Download appendix report
1. Appendix 1 - Databases/inventories and reports relevant for consumer
exposure to nanomaterials ................................................................................. 5
2. Appendix 2 - Selection of consumer exposure scenarios and important
parameters for assessing exposure ..................................................................... 8
3. Appendix 3 - Identification of relevant existing
databases/surveys/inventories on marketed nanomaterials ............................. 15
4. Appendix 4 - Tables with examples of nanoproducts ......................................... 27 4.1 Food and beverages ............................................................................................................. 28 4.2 Cosmetics ............................................................................................................................. 33 4.3 Cleaning agents .................................................................................................................... 44 4.4 Coating, impregnation ......................................................................................................... 49 4.5 Maintenance products .......................................................................................................... 57 4.6 Textiles ................................................................................................................................. 66 4.7 Construction materials ......................................................................................................... 71 4.8 Medical devices ..................................................................................................................... 77 4.9 Air-cleaner sprays ................................................................................................................. 81 4.10 Fuel and lubrication oil additive ......................................................................................... 85 4.11 Electronic devices ................................................................................................................ 89 4.12 Appliances ............................................................................................................................ 94
5. Appendix 5 - Model reviews – Templates with assessment for each model
against the model assessment criteria .............................................................. 99 5.1 NanoRiskCat ........................................................................................................................ 100 5.2 NanoSafer ............................................................................................................................. 116 5.3 Stoffenmanager Nano version 1.0 ........................................................................................ 134 5.4 Stoffenmanager 5.1 .............................................................................................................. 149 5.5 The ANSES tool .................................................................................................................... 169 5.6 Swiss Precautionary Matrix ................................................................................................. 183 5.7 ECETOC TRA ........................................................................................................................ 193 5.8 ConsExpo ............................................................................................................................ 210 5.9 DREAM ................................................................................................................................ 232 5.10 Margin of Exposure ............................................................................................................. 247
6. Appendix 6 - Review of methodologies for assessment of chemical
exposure from consumer products .................................................................. 271 6.1 RIVM (2009) and key parameters for evaluating consumer exposure to
nanomaterials ..................................................................................................................... 271 6.2 REACH guidances on exposure assessment from chemical products and articles ......... 272
6.2.1 REACH guidance Chapter R.15: Consumer exposure estimation ..................... 273 6.2.2 REACH guidance Chapter R.14: Occupational exposure estimation ................ 278 6.2.3 REACH guidance Appendix R14-4: Recommendations for nanomaterials ..... 278 6.2.4 REACH Guidance on information requirements and chemical safety
assessment, Chapter D ........................................................................................ 279 6.2.5 REACH Guidance on requirements for substances in articles .......................... 280
6.3 SCCS guidance on nanomaterials in cosmetics .................................................................281 6.4 EFSA guidance on nanomaterials in food ......................................................................... 282
Exposure assessment of nanomaterials in consumer products 7
6.5 Environmental Defense – DuPont approach .................................................................... 283 6.6 ECETOC TRA ..................................................................................................................... 284 6.7 ConsExpo ........................................................................................................................... 286 6.8 NanoSafer ........................................................................................................................... 289 6.9 NanoRiskCat ....................................................................................................................... 291 6.10 Stoffenmanager .................................................................................................................. 292 6.11 Stoffenmanager Nano ........................................................................................................ 295 6.12 ANSES ................................................................................................................................ 296 6.13 Swiss Precautionary matrix ............................................................................................... 297 6.14 Dream ................................................................................................................................. 299 6.15 Margin of exposure concept .............................................................................................. 300
7. Appendix 7 - Working table for overview of the various exposure scenarios
to consider and from which to prioritise sceanrios for further in-depth
evaluation ...................................................................................................... 302
8. Appendix 8 - Exposure estimations of 20 selected examples of
representative ................................................................................................ 328 8.1 Scenario 1 - Product: Chewing gum with TiO2 food additive (E171) ................................ 329 8.2 Scenario 2 - Product: Nano-Silica in food items .............................................................. 335 8.3 Scenario 3 - Product: Nano-Ag food supplement ............................................................. 340 8.4 Scenario 4 - Product: Food contact material containing Silica ........................................ 344 8.5 Scenario 5 - Product: Sun screen lotion ............................................................................ 348 8.6 Scenario 6 - Product: Sun screen containing nano-ZnO (pump spray) .......................... 356 8.7 Scenario 7 - Product: Mascara with Carbon Black ........................................................... 364 8.8 Scenario 8 - Product: Lipstick sun screen containing nano-TiO2 .................................... 369 8.9 Scenario 9 - Product: Face powder containing nano-silica ...............................................375 8.10 Scenario 10a - Product: Paint containing nano-TiO2 ....................................................... 383 8.11 Scenario 10b - Product: Primer Paint containing nano-TiO2 .......................................... 389 8.12 Scenario 11 - Product: Paint with Nano-Ag....................................................................... 399 8.13 Scenario 12 - Product: Surface impregnation product with silica (silane/siloxane
technology?) ........................................................................................................................ 411 8.14 Scenario 13 - Product: Air conditioner and air purifier device containing nano-
silver ................................................................................................................................... 422 8.15 Scenario 14 - Product: Disinfectant pump spray containing nano-Ag ............................ 426 8.16 Scenario 15 - Product: Disinfectant multipurpose sanitizer with Nano-Ag
(Propellant spray) .............................................................................................................. 437 8.17 Scenario 16 – Product: T-shirt containing nano-Ag ......................................................... 445 8.18 Scenario 17 - Product: Cement containing nano-TiO2 ..................................................... 452 8.19 Scenario 18 - Product: Wound dressing containing nano-Ag .......................................... 460 8.20 Scenario 19 - Product: Nanocomposite product for dental replacement and
restoration containing nano-Zirconia and nano-silica ..................................................... 465
8.21 Scenario 20 - Product: Golf club with CNT re-enforced shaft ………………………………….. 473
8
Preface
Nanomaterials (NM) are applied in a wide range of consumer products and the commercial use of
NM in both amounts and diversity is anticipated to increase rapidly in the near future. It is
increasingly recognised that NMs can have unique properties as compared to their bulk substances
favouring the use of NM in products, articles and technologies. At the same time, concerns in
relation to the possible health and environmental properties and impacts of NMs have surfaced.
On this background, the Danish government and the Red-Green Alliance (a.k.a. Enhedslisten) have
signed an agreement for four years (2012-2015) that focuses on the use of nanomaterials in
products on the Danish market and their consequences on consumers and the environment. The
Danish Environmental Protection Agency (EPA) has initiated a series of projects with the aim of
further clarifying possible risks to consumers and the environment.
The current project addresses consumer exposure and risk assessment of nanomaterials in products
on the Danish market. It runs from third quarter 2013 through second quarter 2015.
The project is foreseen to result in four reports:
Occurrence and exposure assessment of nanomaterials in consumer products and review of
available risk assessment tools (the current report)
Hazard assessment of nanomaterials in consumer products
Human exposure to nanomaterials in the environment – as a reference to nanomaterials
exposure from consumer products
Consumer risk assessment and overall conclusions (final report)
The first three reports will be finalised during 2014, whereas the final report with the consumer risk
assessment and overall conclusions will be finalised during the second quarter of 2015.
This report covers the first work package concerning occurrence and exposure assessment of
nanomaterials in consumer products and review of available risk assessment tools.
The project has been implemented with support from a reference group:
Susan Dekker, National Institute for Public Health and the Environment (RIVM), The
Netherlands
Andrea Haase, Bundesinstitut für Risikobewertung (BfR), Germany
Gregory Moore, Swedish Chemicals Agency (KEMI), Sweden
Derk Brouwer, Netherlands Organisation for Applied Scientific Research (TNO), The
Netherlands
The reference group has assisted with comments and ideas, but are not responsible for the content
of the project reports.
Exposure assessment of nanomaterials in consumer products 9
Summary and conclusions
Under the Agreement "Better Control of Nanomaterials" (“Bedre styr på nanomaterialer”), the
Danish EPA has commissioned a number of projects aiming to investigate and generate new
knowledge on the presence of nanomaterials in products on the Danish market and assess the
possible associated risks to consumers and the environment.
This report is part of a series of four from a project, which addresses consumer exposure and risk
assessment of nanomaterials in products on the Danish market.
The following summarises the findings in the seven chapters of this report focusing on the findings
and conclusions made.
Chapter 1: Introduction
Nanomaterials are found in a wide range of consumer products and the commercial use of
nanomaterials is anticipated to increase rapidly in the future both in quantity and diversity. It is
increasingly recognised that materials in the nanoform can have unique properties as compared to
the microforms and macroforms of the same material. This favours the use of nanomaterials in
products, articles and technologies. At the same time concerns in relation to the possible health and
environmental properties and impacts of nanomaterials have surfaced.
The current report addresses presence and exposure of nanomaterials in consumer products, as
well as an analysis of available methodologies and tools, which could be used to assess exposure and
risk from use of nanomaterials in consumer products.
The overall objectives with the current report have been to:
Evaluate existing methods/approaches/tools for assessing consumer exposure and risks
associated with consumer nanoproducts.
Identify representative consumer nanoproducts from which to select and describe a total
of 20 exposure scenarios for further risk assessment.
Chapter 2: Nanoproducts and consumer scenarios to look for
To kick-off the product activities, relevant data sources describing nanomaterial exposure to
consumers were identified. A very relevant starting point for our project was found to be the RIVM
(2009) report “Exposure to nanomaterials in consumer products” which identified important
factors/ parameters for assessing the consumer exposure to nanomaterials and made rough overall
evaluation of the exposure potential for several consumer product categories. Further important
sources for our projects, when looking on specific products and product categories on the market,
were databases/inventories containing information of products containing (- or claimed to contain)
nanomaterials. These were:
-the Nanodatabase from DTU Environment, The Danish Ecological Council and Danish
Consumer Council;
-the BUND database;
-the ANEC/BEUC database; and
-the US Nanotechproject database.
10
Data from these databases were supplemented with data from a recent Danish EPA 2014 report
“Supplementary survey of products on the Danish market containing nanomaterials” (REF).
Together with the Danish EPA, it was decided to collect data from products within the following
product categories:
Food and beverages; Cosmetics; Cleaning agents; Coatings/ impregnation; Maintenance
products (car, boats); Textiles; Construction materials; Medical devices; Air-cleaners; Fuel and
lubrication oil additives; Electronic devices; Appliances (e.g. refrigerators).
Data on more than 120 nanoproducts was extracted from these data sources and the data was
entered into a template inspired by RIVM (2009) in order to give information on the parameters
that were considered especially relevant for the assessment of the exposure potential.
The following strategy was as far as possible used when identifying the products for which to extract
data to enter into our template:
the nanomaterial had been identified (i.e. chemistry known);
the product should be of relevance for the Danish and European market (this was
often based on assumptions. It was generally assumed that products on the
European market could also be on the Danish marked);
for each product category the products should cover as many different i)
formulations, ii) types of uses and iii') and ways of handling as possible.
As an overall observation it became clear that for many products the specific nanomaterials were
often vaguely or not reported and also it was difficult to assess in which state or concentration the
nanomaterial was present in the product. Furthermore, it was difficult to assess to which extent the
nanomaterial was fully matrix bound, occurred in layers and/or could be released during use. Thus,
often the content of a nanomaterial was claimed without any further specification or documentation
of the nano-content.
It was noticed that dead links to manufacturers and vendors as well as wrong data base information
was sometimes encountered. Thus, care has to be taken when using information from the
databases/inventories. Also it was noted that there are several overlaps between the databases as
they often feed into each other.
Sometimes it was difficult to categorise a product into one of our chosen product categories. A
cleaning agent may as an example also be grouped as a coating/impregnation agent, and a paint
product can be considered relevant both for the coating/impregnation category as well as for the
construction materials category.
Especially with respect to data on food and beverages, it is important to note that the databases only
present nanomaterials in food supplements and do not cover the content of nanomaterial in food
products as such, which might e.g. originate from the use of additives in nanoform.
Overall, available information on nanomaterials in consumer products in available
databases/inventories is largely biased towards products for which the manufacturer/provider
claims the presence of nanomaterials. Throughout the project activities, the knowledge on
nanomaterials in consumer products was supplemented with information in the open literature; as
described in Chapter 5 of the report. Also, input from the work-package addressing hazards of
nanomaterials in consumer products was received.
Exposure assessment of nanomaterials in consumer products 11
(The Appendices 1, 2, 3 and 4 in the appendix report contain additional information regarding the
activities conducted in relation to Chapter 2).
Chapter 3: Review of available risk assessment tools
This chapter reviewed a selected suite of relevant exposure and risk assessment tools and addressed
whether the tools include exposure assessment, hazard characterisation and/or risks
characterisation modules.
The overall aim of the activity was to identify a tool, which in itself or adapted could be used for
making risk assessment of the 20 exposure scenarios to be identified in the project.
The reviewed exposure and risk assessment tools were identified in cooperation with the Danish
EPA. The tools were selected based on their specificity for assessing nanomaterials or for their
general applicability for assessing conventional chemicals and possible relevance for assessment of
nanomaterials. The tools reviewed included:
NanoRiskCat (DTU and NRCWE)
NanoSafer (NRCWE, DTI)
Stoffenmanager Nano (TNO)
Stoffenmanager (TNO)
The ANSES tool
Swiss Precautionary Matrix (Swiss consortium)
ECETOC TRA
ConsExpo (RIVM)
DREAM (TNO and IOM)
Margin of Exposure (MOE) concept (The US Soap and Detergent Industries)
It should be noted that we have not only addressed tools intended for assessment of consumer
exposure.
Occupational exposure/risk assessment tools were also included, as their approaches or the tools
themselves might be applicable for some consumer exposure scenarios.
The reviews of the tools were conducted following an assessment template with relevant questions
in relation to the approach/performance of the models/tools. A completed assessment template can
be found for each tool in Appendix 5 in the appendix report.
The overall learning from this activity was that the assessed tools vary considerably in terms of
coverage, scope/approach, level of quantification, target groups in the population and exposure
routes addressed, etc. The nano-specific tools were generally rather qualitative and not specifically
designed to assess whether there necessarily was a concrete risk. The tools rather indicated where
there could be a risk potential and how strong indications there was for implementing
(precautionary) risk management/mitigation. Furthermore, none of the nanomaterial exposure
assessment tools specifically addressed exposure routes in relation to oral, dermal and eye
exposure.
In contrast to this, the general (non nano-specific tools) were generally rather quantitative with a
wider coverage, e.g. in terms of exposure routes addressed. Noteworthy, the exposure assessment
algorithms in most of the non nano-specific tools were simpler and more conservative than the
algorithms in the most advanced nano-specific tools.
12
The tools generally applied the mass metric (e.g. mg/m³) which may not always be the most
relevant, as a metric related to particle number or total particle surface area might be more relevant
for assessing nanomaterials exposure and risks, in particular for inhalation.
Overall, no single tool (or combinations of tools) was identified that might enable an adequate and
harmonised exposure/risk assessment for all types of consumer nanoproducts. Thus, significant
work would be required to further develop the tools with modifications for incorporating
nanospecific properties, harmonizing the output and validation of the tool.
For the exposure assessments to be completed in this project, the following was considered:
1) To assess some of the selected scenarios with all the tools (to the extent possible, e.g.
considering data availability and tool coverage) and based on this make an expert based
qualitative assessment;
2) To apply (components of) several tools as appropriate;
3) Not to apply the assessed tools, but rather perform a case-by-case expert assessment of
each of the selected scenarios.
Based on discussions with the external expert panel, it was suggested to follow a combination of the
second and third option depending on the data availability and the scenarios identified. The exact
procedures for assessment of the consumer exposure and risk in the next phases of the project
would then depend on the specific scenarios to be addressed, as well as the specific exposure and
hazard data that might be available (hazard data are identified in another part of this project).
(Appendix 5 in the appendix report contain additional details regarding the activities conducted in
relation to Chapter3).
Chapter 4: Exposure assessment and key factors affecting exposure
The objective of this chapter was to provide an overview of the knowledge needed to conduct a
reliable conservative exposure assessment for a nanomaterial used in a consumer product. The
most important factors/parameters determining the consumer exposure were identified and
described in more detail in relation to the different exposure routes and use scenarios for the
various product categories and formulations.
To achieve this goal, the first part of this chapter describes the learnings that could be obtained
from relevant guidance documents and tools for exposure assessment to chemicals, in consumer
products and articles, as well as from guidance documents and tools specifically addressing
exposure to nanomaterials.
The following guidance documents and tools were evaluated for identifying the most important
factors/ parameters determining consumer exposure:
- RIVM (2009) Exposure to nanomaterials in consumer products
- REACH guidance documents on exposure assessment from chemical products and
articles
- SCCS guidance on nanomaterials in cosmetics
- EFSA guidance on nanomaterials in food
- Environmental Defense – DuPont approach
- ECETOC TRA
- ConsExpo
- NanoSafer
- NanoRiskCat
- Stoffenmanager
Exposure assessment of nanomaterials in consumer products 13
- Stoffenmanager Nano
- ANSES
- Swiss Precautionary matrix
- Dream
- Margin of exposure concept
As mentioned, RIVM (2009) had already performed an analysis of consumer exposure to
nanomaterials. Key parameters were identified in the RIVM (2009) study and these key parameters
formed a benchmark in the current analysis of the other guidance documents and tools. On this
basis, descriptions and evaluations of the other guidance documents and tools were made (details in
appendix 6) and it was evaluated whether additional important exposure parameters could be
identified.
Having performed this stepwise analysis of the various tools and guidance documents, the following
parameters, as indicated below, could be identified as relevant for exposure assessment of
consumer products:
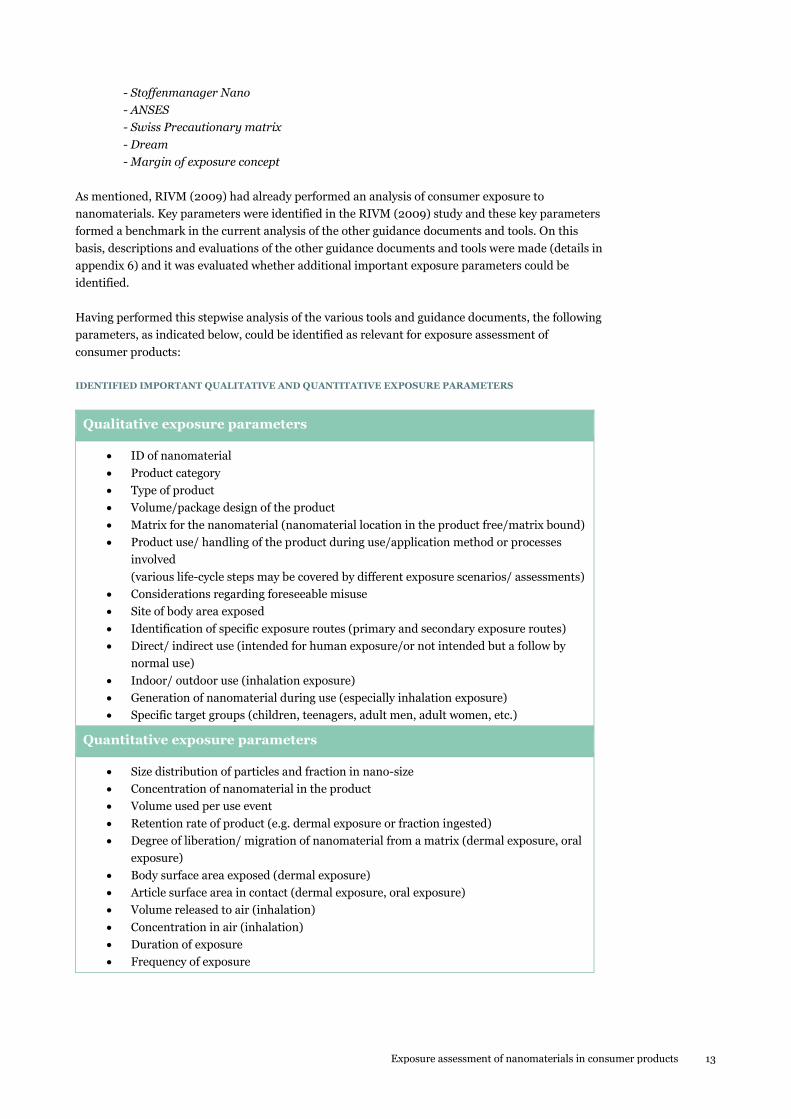
IDENTIFIED IMPORTANT QUALITATIVE AND QUANTITATIVE EXPOSURE PARAMETERS
Qualitative exposure parameters
ID of nanomaterial
Product category
Type of product
Volume/package design of the product
Matrix for the nanomaterial (nanomaterial location in the product free/matrix bound)
Product use/ handling of the product during use/application method or processes
involved
(various life-cycle steps may be covered by different exposure scenarios/ assessments)
Considerations regarding foreseeable misuse
Site of body area exposed
Identification of specific exposure routes (primary and secondary exposure routes)
Direct/ indirect use (intended for human exposure/or not intended but a follow by
normal use)
Indoor/ outdoor use (inhalation exposure)
Generation of nanomaterial during use (especially inhalation exposure)
Specific target groups (children, teenagers, adult men, adult women, etc.)
Quantitative exposure parameters
Size distribution of particles and fraction in nano-size
Concentration of nanomaterial in the product
Volume used per use event
Retention rate of product (e.g. dermal exposure or fraction ingested)
Degree of liberation/ migration of nanomaterial from a matrix (dermal exposure, oral
exposure)
Body surface area exposed (dermal exposure)
Article surface area in contact (dermal exposure, oral exposure)
Volume released to air (inhalation)
Concentration in air (inhalation)
Duration of exposure
Frequency of exposure
14
The qualitative parameters are mainly for characterising the exposure scenario for a product,
but they may contain some quantitative elements e.g. the packaging volume in which the product is
sold. The quantitative parameters are parameters, which can be used in an algorithm to obtain
a quantitative estimate of the exposure.
Some of the above parameters are primarily important in connection with specific exposure routes,
which are indicated in brackets.
It should be stressed that some parameters and type of information are considered especially
relevant for nanoproducts and nanomaterials. These are nanomaterial identification, surface
coating of the nanomaterial, particle size distribution, details on the matrix, attachment to matrix
(e.g. embedded or surface attached), and product formulation (e.g. pump spray vs propellant spray
etc.).
Whereas semi-quantitative oral and dermal exposure assessment may be addressed in a rather
simplistic and transparent way using rather few assumptions concerning e.g. the amount ingested
or the amount applied on skin, it may be more difficult or complex to obtain semi-quantitative
estimates on inhalational exposure. This is because multiple factors in addition to the volume used
may affect the exposure. A key parameter is the concentration of the air in a person’s breathing
zone, which depends on various factors such as: emission rate of droplets/solid particles into air
from the product, the air exchange rate in the room, particle size distribution, sedimentation rate of
the different particle sizes, the persons distance to the emission source (e.g. spray or air cleaner),
and the breathing rate and breathing volume of the person.
(Appendix 6 in the appendix report gives further details regarding the activities conducted in
relation to the Chapter 4 activities).
Chapter 5: Specific nanomaterial exposure assessment
In addition to the collection of data on specific nanoproducts (Chapter 2) and descriptions of the
relevant assessment tools (Chapter 3 and 4), a literature search was conducted in order to gain
knowledge from the scientific literature and reports on concrete examples of exposure assessment
to nanomaterials from consumer products within the product categories defined in Chapter 2.
These exposure assessments may either have been carried out by use of some of the tools described
above or have been based on measurements of the amount of liberated nanomaterial during
product use. Thus, these examples for several of the products in the product categories defined in
Chapter 2 provided additional information regarding the exposure potential. In addition, some new
products and nanomaterials in certain products were identified during this exercise. Thus, the
specific information gained from this chapter further fed into the next phase of the project, where
representative and specific consumer exposure scenarios were selected (Chapter 6) and the
exposure assessed (Chapter 7).
(The reader is referred to Section 5.12 for summaries on the various findings for the various
product categories).
Chapter 6: Selection of exposure scenarios for further exposure and risk assessment
Based on the knowledge gained in Chapter 2 and from Appendix 4 (data on specific nanoproducts
on the market); Chapters 3 and 4 (knowledge from tools, models and guidance) and Chapter 5
(specific exposure assessment from literature on products from the selected product categories)
and a working table overview (Appendix 7 in appendix report), the project team made a draft table
with 20 representative consumer exposure scenarios representing various nanoproducts.
The selection of the scenarios/products was made using the following criteria agreed with the
Danish EPA:
Exposure assessment of nanomaterials in consumer products 15
-Coverage of the various product categories and type of use
-Coverage of various formulations and matrices of the products/articles
-Coverage of various type of use/application methods
-Coverage of low as well as high quantitative use of the product
-Coverage of high/ low/ uncertain exposure potential
-Coverage of specific user or target group populations
-Coverage of all relevant exposure routes (dermal, oral, inhalation and eye)
-Coverage of uses of nanomaterials that may be of toxicological concern
-Coverage of most used nanomaterials
The draft table was discussed during a workshop with the external expert panel in order to include
comments and ideas from the panel members. The resulting choice of the 20 exposure scenarios
(see Table 6-1) was the outcome of this process. It was during the workshop emphasized by the
external experts that although each of the 20 scenarios may be representative for similar
products/scenarios, the total of the 20 scenarios was far from being representative for the overall
consumer exposure to nanomaterials. On the other hand, the scenarios chosen could be seen as
representing possible high exposure/risk scenarios (and some possible low exposure/risk scenarios)
given the current knowledge about nanomaterials in consumer products.
Chapter 7: Consumer exposure to nanomaterials - exposure assessment of selected
scenarios
Based on the findings from evaluating existing methods and tools (Chapter 3) and discussions with
the Danish EPA and the external expert group, it was decided to perform a case-by-case assessment
for each scenario based on existing information and expert knowledge, including a careful
description of uncertainties.
Based on the conclusions in Chapter 4, an overall template for collection and presentation of
relevant exposure parameters, and for performing the exposure assessment for the various
scenarios, was made. Based on this template exposure assessment and exposure, estimates were
made for the 20 scenarios (see Appendix 8 in the appendix report) and the results from this were
compiled into Table 7-1. In this table the exposure estimations were given for the target groups
considered most relevant (or for which most specific data have been found) and for each exposure
route. The results were given in mg NM/cm2 (dermal load); mg NM/m3 (inhalation); mg
NM/person/ day (dermal, oral, inhalation exposure) and mg NM/ kg bw/day (dermal, oral,
inhalation exposure). In specific cases where data was available, also exposure estimates in particle
number concentrations were given.
The reader is referred to Section 7.2 discussing the outcome of the exposure estimates regarding:
- the potential for nanomaterial exposure for the various exposure routes (oral, dermal,
inhalational and eye exposure);
- the potential for exposure of the 7 specific nanomaterials covered by the scenarios;
- the potential of nanomaterial exposure for the different target groups (children,
teenagers and adults).
Moreover, Chapter 7 identified main uncertainties to be considered.
Main uncertainties to consider in the further project activities
Based on the findings in this report, the following key uncertainties related to assessment of
consumer exposure to nanoproducts were identified to be considered in the further activities in this
project:
16
-Generally, the chemical identify and/or properties of nanomaterials applied in consumer
products is not very well described. Several entries in available inventories/databases give
no (indicated as "Unknown") or very generic information about the contained
nanomaterial and seldom any details about their characteristics. Also in some cases, the
claim of a nanoproduct is not due to actual nano-content but due to reactive chemistry and
formation of nano-scale particles or surface structures during/after application of the
products as in the case of some "nanosprays".
-Related to this, the nanomaterial concentration in a consumer product is often not
(precisely) indicated and therefore the exposure estimate becomes associated with high
uncertainty.
- In many cases the exposure to nanoparticles will be in association with a matrix or
liberated from a matrix where the transfer out of a droplet or a surface layer (e.g. the
matrix of a sanding fragment) is less understood as compared to exposure from soluble
chemicals. Thus, it may be very uncertain to which extent the nanomaterial can be
liberated (or can migrate) from the product matrix, and this very much influences the
actual oral or dermal exposure to the nanomaterial.
-With a few exceptions, available data and models, only allow exposure estimation in the
mass metric. In particular for inhalation, the particle number concentration or the total
surface area might for some specific cases be more relevant for further risk assessment.
-In general, current exposure estimation models are not designed for estimating
nanomaterial exposure.
-Currently, it appears more reliable to estimate (conservatively) oral and dermal exposures
to nanomaterials (mass based exposure) compared to inhalational exposure.
- Inhalation exposure is more difficult to assess and from the literature review, it appears
particularly difficult to assess exposures following pump and propellant spray applications.
Although the amount of scientific publications presenting spray measurement data are
growing, a closer look at these publications reveal that exposure concentration are highly
dependent on a significant number of experimental parameters (pressure, nozzle size,
ventilation, size of experimental chamber, viscosity of sample, analytical measurement
techniques, etc.). Thus, in general, representative data for inhalation exposure following
spray applications are lacking.
-To some extent, the same applies for data on releases following mechanical reworking
(sanding, grinding) as well as wear and tear of nanomaterials containing consumer
products.
Thus, when making risk assessment of the 20 scenarios in the next phase of the project especially
the following should be noted and taken into account:
- The 20 scenarios identified might be good examples of high (and low) exposures
associated with consumer products, but given the current knowledge about nanomaterials
in consumer products, they cannot be used to generalise to consumer products in general.
-When assessing risks, it should be noted that the characterization of the nanomaterial(s)
in the investigated consumer products is generally not very well described, making it
challenging to match exposure findings with hazard findings.
Exposure assessment of nanomaterials in consumer products 17
-Care should be taken when assessing in particular inhalation risks in the next phases of
the project as the mass metric applied is probably not the most appropriate metric for
assessing risk. Also, in general, the low tier exposure estimations may be very conservative
which of course should be kept in mind and considered when evaluating the outcome of
the risk assessment.
18
Sammenfatning og konklusion
Under overskriften "Bedre styr på nanomaterialer" har den danske Miljøstyrelse iværksat en række
projekter, der sigter på at undersøge og generere ny viden om forekomsten af nanomaterialer i
produkter på det danske marked og vurdere potentielle risici for forbrugerne og miljøet.
Denne rapport er en del af en serie på fire i et projekt, som omhandler forbrugereksponering og
risikovurdering af nanomaterialer i produkter på det danske marked.
Nedenfor opsummeres indholdet fra de syv kapitler i denne rapport med fokus på resultater og
konklusioner.
Kapitel 1: Introduktion
Nanomaterialer findes i en lang række forbrugerprodukter, og den kommercielle anvendelse af
nanomaterialer forventes at stige hurtigt i fremtiden, både i mængde og i udbredelse. Det erkendes i
stigende omfang, at materialer i nanoform kan besidde unikke egenskaber sammenlignet med
mikro- og makroformer af det samme materiale. Mens dette på den ene side begunstiger
anvendelsen af nanomaterialer i produkter, artikler og teknologier, er der på den anden side opstået
betænkeligheder i forhold til de mulige effekter, nanomaterialerne kan have på sundhed og miljø.
Denne rapport har til formål at belyse tilstedeværelsen af og den mulige eksponering for
nanomaterialer i forbrugerprodukter samt analysere tilgængelige metoder og værktøjer, som kunne
anvendes til at vurdere eksponering og risiko ved anvendelse af nanomaterialer i
forbrugerprodukter.
De overordnede mål med denne rapport er at:
evaluere eksisterende metoder og værktøjer til vurdering af forbrugereksponering og risici forbundet med forbruger-nanoprodukter
identificere forbruger-nanoprodukter på markedet, hvorfra der derpå udvælges ca. 20
repræsentative produkter til nærmere beskrivelse af eksponeringsscenarier og
risikovurdering
Mens eksponeringsscenarier for de 20 produkter beskrives i denne rapport, beskrives resultaterne
af risikovurderingen i en efterfølgende rapport i projektet.
Kapitel 2: Nanoprodukter og forbrugerscenarier, udvælgelse
Som den første aktivitet blev relevante datakilder, som beskriver forbrugereksponering for
nanomaterialer, identificeret. RIVM (2009) rapporten "Exposure to nanomaterials in consumer
products" viste sig i den forbindelse at være et velegnet udgangspunkt. Rapporten udpeger og
beskriver således vigtige faktorer/parametre til vurdering af forbrugereksponering for
nanomaterialer samt angiver en skønsmæssig vurdering af eksponeringspotentialet for flere
kategorier/ typer af forbrugerprodukter. Yderligere blev der udpeget følgende databaser/opgørelser
mht. nano-produkter:
- Nanodatabasen fra DTU Miljø, Det Økologiske Råd og Forbrugerrådet;
- BUND databasen;
-ANEC/BEUC databasen;
-US Nanotechproject databasen.
Exposure assessment of nanomaterials in consumer products 19
Data fra disse databaser blev suppleret med data fra en netop færdiggjort rapport fra Miljøstyrelsen
fra 2014: "Supplementary survey of products on the Danish market containing nanomaterials".
Med viden fra disse kilder og i samråd med Miljøstyrelsen blev det besluttet at koncentrere
indsamlingen af produktdata inden for følgende kategorier af nanoprodukter:
Mad og drikkevarer; kosmetik; Rengøringsmidler; overfladehandlings-/imprægneringsmidler;
plejeprodukter (biler, både); tekstiler; byggematerialer; medicinsk udstyr; luftrensere;
brændstof- og smøreolie-additiver; elektronisk udstyr; andet udstyr (fx sportsudstyr, hvidevarer
etc.).
Data for mere end 120 nanoprodukter inden for disse kategorier blev indsamlet fra datakilderne, og
oplistet i en tabel inspireret af RIVM (2009) for at give oplysninger om de parametre, der må anses
for særligt relevante i forbindelse med en eksponeringsvurdering.
Ved indsamling af produktdata blev der fokuseret på:
at der er så konkret viden som muligt om den kemiske identitet af nanomaterialet i produktet
at produktet er relevant for det danske og det europæiske marked (det antages generelt at produkter på det europæiske marked også kunne være på det danske
marked)
at der for hver produktkategori udvælges produkter, der dækker bredest muligt mht.
forskellige i) formuleringer, ii) typer af anvendelse og iii) håndteringsmåder
Det viste sig ved søgningen i datakilderne, at for mange produkter bliver indholdet af et
nanomateriale ofte kun angivet meget uklart mht. identitet, fysisk form og koncentration. Desuden
var det vanskeligt at vurdere, i hvilket omfang nanomaterialet var matrix-bundet, forekom på
overflader og/eller kunne frigives under brug. Ofte blev det blot anført, at produktet indeholder et
nanomateriale uden yderligere specifikation eller dokumentation for dette indhold.
Endelig blev der i databaserne for flere produkter fundet fejlagtig information, og flere steder var
henvisninger via links til producenter og forhandlere ikke længere aktive. Det viste sig også, at der
er et vist overlap databaserne imellem, da der blev fundet flere gengangere i databaserne. Man skal
således anvende data fra databaserne med en vis forsigtighed, såfremt yderligere (og evt. opdateret)
dokumentation ikke kan fremskaffes for et produkt.
Lejlighedsvis viste det sig endvidere vanskeligt helt entydigt at placere produkter fra databaserne i
én af de udvalgte produktkategorier. Der kan fx være vanskeligt at afgøre, hvorvidt et produkt skal
kategoriseres som et rengøringsmiddel eller som et overfladebehandlings-/imprægneringsmiddel,
eller om et malingsprodukt skal kategoriseres som et overfladebehandlings-/imprægneringsmiddel
eller som et byggemateriale.
Især med hensyn til data for fødevarer og drikkevarer er det vigtigt at bemærke, at databaserne i
praksis kun har anført nanomaterialer i forbindelse med kosttilskud, og således ikke omfatter
indhold af nanomaterialer i fødevarer som sådan (dvs. fødevarer, hvor visse tilsætningsstoffer er i
nanoform, indgår ikke af databaserne).
Generelt er oplysningerne om nanomaterialer i forbrugerprodukter i de tilgængelige
databaser/opgørelser primært baseret på, at fabrikanten/udbyderen har påstået/ anført indhold af
nanomateriale frem for konkret viden.
20
Ud over viden fra databaser og opgørelser blev viden om nanomaterialer i forbrugerprodukter
igennem projektets forløb løbende suppleret med oplysninger fra den åbne litteratur (beskrevet i
kapitel 5 i rapporten). Yderligere indgår der i dette projekt også informationer fra det parallelle
delprojekt vedrørende farevurdering af nanomaterialer.
(Bilag 1, 2, 3 og 4 i bilagsrapporten indeholder yderligere oplysninger om de aktiviteter, der
gennemførtes i relation til kapitel 2)
Kapitel 3: Gennemgang af tilgængelige risikovurderingsværktøjer
Denne del af projektet gennemgik udvalgte eksponerings- og risikovurderingsværktøjer og
undersøgte, hvorvidt værktøjerne omfattede eksponeringsvurderings-, farekarakteriserings-
og/eller risikokarakteriseringsmoduler.
Det overordnede sigte med dette er at identificere relevante modeller / værktøjer, som umiddelbart
eller i tilpasset form kunne anvendes til risikovurderingen af de 20 eksponeringsscenarier, der
skulle udpeges i projektet.
De relevante eksponerings- og risikovurderingsværktøjer blev identificeret i samarbejde med
Miljøstyrelsen. Værktøjerne blev udvalgt på grundlag af deres specificitet m.h.t. vurdering af
nanomaterialer eller deres generelle anvendelighed til vurdering af traditionelle kemikalier og
dermed mulige relevans for vurdering af nanomaterialer. De udvalgte værktøjer omfattede:
- NanoRiskCat (DTU and NRCWE)
- NanoSafer (NRCWE, DTI)
- Stoffenmanager Nano (TNO)
- Stoffenmanager (TNO)
- The ANSES tool
- Swiss Precautionary Matrix (Swiss consortium)
- ECETOC TRA
- ConsExpo (RIVM)
- DREAM (TNO and IOM)
- Margin of Exposure (MOE) concept (The US Soap and Detergent Industries)
Det skal bemærkes, at der ikke kun blev bedømt værktøjer beregnet til vurdering af
forbrugereksponering, idet eksponerings-/risikovurderingsværktøjer beregnet for arbejdsmiljø i
visse tilfælde også blev medtaget, da elementer herfra kunne tænkes anvendt, da der ofte kan være
overlap mellem arbejdsmiljø- og forbruger-eksponeringsscenarier.
Vurdering af modellerne/værktøjerne blev foretaget med udgangspunkt i en udarbejdet skabelon
med relevante spørgsmål i relation til modellerne/værktøjernes indhold og anvendelsesområder.
Udfyldte vurderingsskabeloner kan ses for de enkelte modeller/værktøjer i bilag 5 i bilagsrapporten.
Det samlede konklusion af denne gennemgang var, at de angivne modeller/ værktøjer varierer
betydeligt bl.a. med hensyn til hvilke scenarier de omfatter, hvilket grad af kvantificering der
anvendes, samt hvilke eksponeringsveje og hvilke målgrupper (og evt. undergrupper) i
befolkningen de omfatter. De nano-specifikke værktøjer er generelt beregnet til kvalitative
vurderinger og ikke specifikt designet til at vurdere, hvorvidt der foreligger en konkret risiko.
Værktøjerne indikerer snarere, hvor der kan være en potentiel risiko, og hvor stærke indikationer
der er for at iværksætte konkrete tiltag for en præventiv risikohåndtering. Ingen af værktøjerne til
vurdering af nanomaterialer omfatter specifik vurdering af eksponeringsveje i forhold til
eksponering gennem indtagelse, hudkontakt eller via øjnene.
Exposure assessment of nanomaterials in consumer products 21
I modsætning hertil er de generelle (ikke nano-specifikke værktøjer) generelt mere kvantitative med
en bredere dækningsflade, fx i form af flere eksponeringsveje. Der er værd at bemærke, at
antagelser vedrørende eksponering og de anvendte algoritmer til eksponeringsvurderingen i de
fleste af de ikke nano-specifikke værktøjer er mere enkle og mere konservative (dvs. har en tendens
til at overestimere) end algoritmerne i de mest avancerede nanospecifikke værktøjer til vurdering af
eksponering via inhalation.
Værktøjerne anvender generelt vægtbaserede måleenheder (f.eks. mg/m³), som måske ikke altid er
de mest relevante enheder, da partikelantal eller totalt partikeloverfladeareal især for
nanomaterialer (og især ifm. med indånding) kan være mere relevant ved vurdering af eksponering
og risiko.
Alt i alt blev der ikke identificeret noget enkelt værktøj (eller kombination af værktøjer), som kunne
muliggøre en passende, ensartet og harmoniseret eksponerings-/risikovurdering for alle relevante
typer af nanoforbrugerprodukter. Således ville der være behov for yderligere tilpasninger for at
udvikle og modificere værktøjerne for at tage højde for nanospecifikke egenskaber og opnå mere
ensartede og sammenlignelige resultater, som så efterfølgende kan valideres.
For den fremtidige eksponerings- og risikovurdering i dette projekt blev det derfor overvejet:
1) - at vurdere nogle af de udvalgte scenarier med alle værktøjer (i det omfang dette er
muligt, fx i forhold til hvilke typer data der er tilgængelige, og hvilke typer scenarier de
enkelte værktøjer omfatter), og herudfra at foretage en ekspertbaseret vurdering;
2) - at anvende og sammensætte dele af flere relevante værktøjer;
3) - som udgangspunkt ikke at anvende konkrete redskaber, men derimod at gennemføre
en case-by-case ekspertvurdering for hvert af de udvalgte scenarier.
Efter drøftelser med det eksterne ekspertpanel blev det foreslået at anvende en kombination af den
anden og tredje mulighed, afhængigt af tilgængeligheden af data og de identificerede scenarier. Den
nøjagtige tilgang for vurdering af forbrugereksponering og risiko i de næste faser af projektet vil så
afhænge af de konkrete scenarier, der skal vurderes, samt de konkrete eksponerings- og
farlighedsdata, der vil være til rådighed.
(Bilag 5 i bilagsrapporten indeholder yderligere detaljer om de aktiviteter, der blev gennemført i
kapitel 3).
Kapitel 4: Eksponeringsvurdering og angivelse af vigtige faktorer, der bestemmer
eksponeringen
Formålet med dette kapitel er at give et overblik over den nødvendige viden til at foretage en
pålidelig, konservativ (forsigtig) eksponeringsvurdering af forbrugerprodukter indeholdende
nanomaterialer. De vigtigste faktorer/parametre, der er bestemmende for forbrugereksponering,
blev udpeget og beskrevet mere detaljeret i forhold til de forskellige eksponeringsveje og
anvendelsesscenarier for de forskellige produktkategorier og produktformuleringer.
For at nå dette mål beskriver første del af dette kapitel relevante vejledninger og værktøjer i
forbindelse med eksponeringsvurdering af kemikalier i forbrugerprodukter/-artikler samt
vejledninger og værktøjer, der specifikt vedrører eksponering for nanomaterialer.
Følgende vejledninger og værktøjer blev gennemgået for at udpege de vigtigste faktorer/parametre,
der har betydning for den mulige forbrugereksponering:
- RIVM (2009) exposure to nanomaterials in consumer products
- REACH guidance documents on exposure assessment from chemical products and
articles
22
- SCCS guidance on nanomaterials in cosmetics
- EFSA guidance on nanomaterials in food
- Environmental Defense – DuPont approach
- ECETOC TRA
- ConsExpo
- NanoSafer
- NanoRiskCat
- Stoffenmanager
- Stoffenmanager Nano
- ANSES
- Swiss Precautionary matrix
- Dream
- Margin of exposure concept
Som nævnt har RIVM (2009) allerede foretaget en analyse af forbrugereksponering for
nanomaterialer. Nøgleparametre blev af eksperter identificeret i rapporten, og disse
nøgleparametre dannede fundamentet for den videre analyse af de andre vejledninger og værktøjer.
Med dette som udgangspunkt blev de andre vejledninger og værktøjer derpå beskrevet (nærmere
detaljer i bilag 6), og det blev vurderet, om der kunne identificeres yderligere vigtige
eksponeringsparametre.
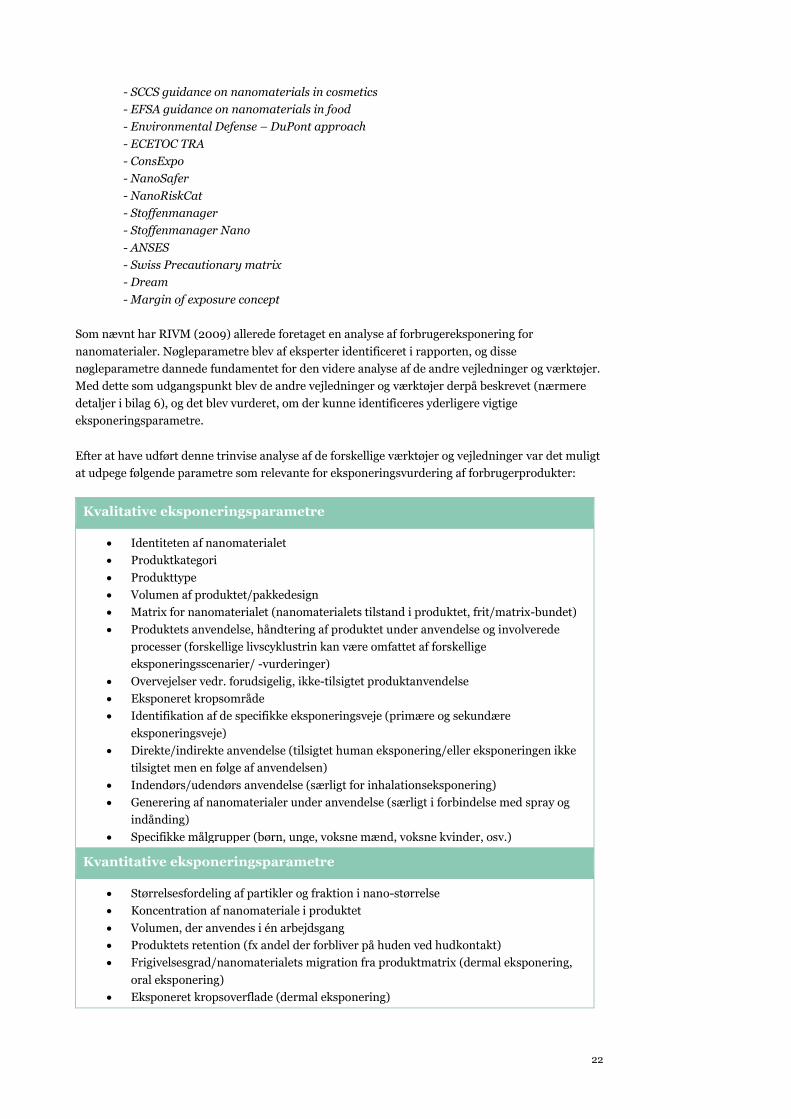
Efter at have udført denne trinvise analyse af de forskellige værktøjer og vejledninger var det muligt
at udpege følgende parametre som relevante for eksponeringsvurdering af forbrugerprodukter:
Kvalitative eksponeringsparametre
Identiteten af nanomaterialet
Produktkategori
Produkttype
Volumen af produktet/pakkedesign
Matrix for nanomaterialet (nanomaterialets tilstand i produktet, frit/matrix-bundet)
Produktets anvendelse, håndtering af produktet under anvendelse og involverede
processer (forskellige livscyklustrin kan være omfattet af forskellige
eksponeringsscenarier/ -vurderinger)
Overvejelser vedr. forudsigelig, ikke-tilsigtet produktanvendelse
Eksponeret kropsområde
Identifikation af de specifikke eksponeringsveje (primære og sekundære
eksponeringsveje)
Direkte/indirekte anvendelse (tilsigtet human eksponering/eller eksponeringen ikke
tilsigtet men en følge af anvendelsen)
Indendørs/udendørs anvendelse (særligt for inhalationseksponering)
Generering af nanomaterialer under anvendelse (særligt i forbindelse med spray og
indånding)
Specifikke målgrupper (børn, unge, voksne mænd, voksne kvinder, osv.)
Kvantitative eksponeringsparametre
Størrelsesfordeling af partikler og fraktion i nano-størrelse
Koncentration af nanomateriale i produktet
Volumen, der anvendes i én arbejdsgang
Produktets retention (fx andel der forbliver på huden ved hudkontakt)
Frigivelsesgrad/nanomaterialets migration fra produktmatrix (dermal eksponering,
oral eksponering)
Eksponeret kropsoverflade (dermal eksponering)
Exposure assessment of nanomaterials in consumer products 23
En artikels berøringsareal (dermal eksponering, oral eksponering)
Volumen/ mængde af produkt frigivet til luften (indånding)
Koncentration i luften (indånding)
Eksponeringsvarighed
Eksponeringshyppighed
De kvalitative parametre er primært til karakterisering af et produkts eksponeringsscenarie,
men de kan indeholde nogle kvantitative elementer, f.eks. produktets pakkevolumen. De
kvantitative parametre er parametre, der kan indgå i en algoritme til at opnå en kvantitativ
vurdering af eksponeringen.
Nogle af ovennævnte parametre er primært vigtige i forbindelse med konkrete eksponeringsveje -
dette er angivet i parentes.
Det skal understreges, at nogle parametre og typer af information må anses for at være særligt
relevante for nanoprodukter og nanomaterialer. Disse er: Identiteten af nanomaterialet (inkl.
overflademodificering og partikelstørrelsesfordeling), oplysninger i forhold til produktmatrix
(vedhæftning til/ indlejring i matrix), og produktdesign/-formulering (fx pumpespray eller
drivgasspray).
Mens semikvantitativ oral og dermal eksponeringsvurdering kan adresseres på en temmelig
forenklet og gennemskuelig måde ved hjælp af ganske få antagelser om eksempelvis indtaget
mængde eller mængde anvendt på huden, kan det være mere vanskeligt eller komplekst at opnå
semikvantitative skøn for eksponering gennem indånding/ inhalation. Dette skyldes, at flere
faktorer ud over den anvendte produktmængde kan påvirke eksponeringen. En vigtig parameter er
koncentrationen af luft i en persons indåndingszone, som vil afhænge af flere forskellige faktorer,
såsom emissionshastighed af dråber/faste partikler til luften fra produktet, luftskifte i rummet,
partikelstørrelsesfordeling, sedimentationshastighed af de forskellige partikelstørrelser, personens
afstand til emissionskilden (fx spray eller luftrenser) og personens indåndingshastighed og
vejrtrækningsvolumen.
(Bilag 6 i bilagsrapporten indeholder yderligere detaljer om de aktiviteter, der er gennemført i
kapitel 4).
Kapitel 5: Specifikke eksempler på eksponeringsvurderinger af nanomaterialer i
forbruger-produkter
Ud over indsamling af data om konkrete nanoprodukter (kapitel 2) og beskrivelse af de relevante
vurderingsværktøjer (kapitel 3 og 4) blev der foretaget en litteratursøgning for at indsamle viden fra
den åbne litteratur om konkrete eksempler på eksponeringsvurdering af nanomaterialer fra
forbrugerprodukter inden for de produktkategorier, der er udpeget i kapitel 2. Disse
eksponeringsvurderinger viste sig enten at være udført ved hjælp af nogle af de værktøjer, der er
beskrevet ovenfor, eller at være baseret på målinger. Eksemplerne bidrog således med yderligere
relevante oplysninger om flere produkter i produktkategorierne. Derudover blev der under denne
aktivitet også identificeret nogle nye produkter og nanomaterialer. Samlet set gav dette således et
bedre grundlag for næste fase af projektet, hvor repræsentative og specifikke
forbrugereksponeringsscenarier skulle udvælges (se kapitel 6), og hvor den endelige
eksponeringsvurdering skulle foretages (se kapitel 7).
(Der henvises til afsnit 5.12 for sammendrag af de forskellige resultater for de forskellige
produktkategorier).
24
Kapitel 6: Valg af eksponeringsscenarier til yderligere vurdering af eksponering og
risiko
Baseret på viden fra kapitel 2 og bilag 4 (data om specifikke nanoprodukter på markedet), kapitel 3
og 4 (viden fra værktøjer, modeller og vejledninger) og kapitel 5 (specifik eksponeringsvurdering fra
litteratur vedrørende produkter fra de udvalgte produktkategorier), samt en arbejdsoversigt (bilag 7
i bilagsrapporten), udarbejdede projektgruppen et udkast til en tabel med 20 repræsentative
forbrugereksponeringsscenarier for forskellige nanoprodukter.
Udvælgelse af disse scenarier/produkter blev foretaget efter følgende kriterier aftalt med
Miljøstyrelsen for at opnå dækning af:
- forskellige produktkategorier og anvendelsestyper
- diverse formuleringer og matricer for produkter/artikler
- diverse typer af anvendelser/anvendelsesmetoder
- både lav og høj mængde produkt anvendt
- højt/lavt eller meget usikkert eksponeringspotentiale
- specifikke brugergrupper eller målgrupper i befolkningen
- alle relevante eksponeringsveje (dermal, oral, inhalation og øjne)
- anvendelse af nanomaterialer på en måde, der kan være toksikologisk betænkelig
- de mest anvendte nanomaterialer
Udkastet til de repræsentative eksponeringsscenarier blev drøftet på en workshop med det eksterne
ekspertpanel for at modtage kommentarer og ideer fra paneldeltagerne. Resultatet af denne proces
blev valget af 20 eksponeringsscenarier (se tabel 6-1) til videre vurdering. På workshoppen blev det
understreget af de eksterne eksperter, at selv om hvert af de 20 scenarier kan være repræsentativt
for lignende produkter eller scenarier, så er de 20 scenarier langt fra repræsentative for den
samlede forbrugereksponering for nanomaterialer. På den anden side kunne de valgte scenarier
anses som udtryk for scenarier med varierende (fra højt til lavt) eksponeringspotentiale vurderet ud
fra den nuværende viden om nanomaterialer i forbrugerprodukter.
Kapitel 7: Forbrugereksponering for nanomaterialer – eksponeringsvurdering af
udvalgte scenarier
Baseret på resultaterne fra evalueringen af de eksisterende metoder og værktøjer (kapitel 3) og
drøftelser med Miljøstyrelsen og den eksterne ekspertgruppe blev det besluttet at udføre en case-by-
case vurdering for hvert scenarie baseret på eksisterende oplysninger og ekspertviden, og med en
omhyggelig beskrivelse af usikkerheder.
På grundlag af konklusionerne i kapitel 4 blev der lavet en arbejdsskabelon til præsentation af de
relevante eksponeringsparametre og den indsamlede viden samt til selve eksponeringsvurderingen
for de forskellige scenarier. Med udgangspunkt i denne skabelon blev der lavet
eksponeringsberegninger for hvert af de 20 scenarier (fremgår af bilag 8 i bilagsrapporten), og
resultaterne fra vurderingerne blev derpå samlet i en oversigttabel (tabel 7-1). I tabellen er der
angivet eksponeringsestimater for relevante eksponeringsveje for de målgrupper, der anses for mest
relevante. Resultaterne er angivet i mg nanomateriale (NM)/cm2 (hudkontakt), mg NM/m3
(indånding), mg NM/person/dag (hudkontakt, oral indtagelse, indånding) og mg NM/kg
legemsvægt/dag (hudkontakt, oral indtagelse, indånding). I særlige tilfælde, hvor data var til
rådighed, blev eksponeringsestimater i partikelantal koncentrationer også angivet.
Der henvises til sektion 7.2, som endvidere diskuterer resultaterne af eksponeringsberegningerne
m.h.t.:
-potentiale for eksponering via de forskellige eksponeringsveje (hud kontakt, oral
indtagelse, indånding og øjeneksponering)
Exposure assessment of nanomaterials in consumer products 25
-potentiale for eksponering for de 7 specifikke nanomaterialer, der var omfattet af
scenarierne
-potentiale for eksponering af de forskellige målgrupper (børn, unge og voksne) for
nanomateriale
Desuden diskuteres i kapitel 7 en række væsentlige usikkerheder, som man bør have for øje.
Væsentlige usikkerheder, som man bør have for øje i de fremadrettede
projektaktiviteter
På baggrund af den opnåede viden blev følgende væsentlige usikkerheder, tilknyttet vurdering af
forbrugereksponering for nanoprodukter, identificeret. Det er vigtigt at have disse for øje i de
fremadrettede projektaktiviteter:
- Generelt er kemisk identifikation og/eller egenskaber af nanomaterialer, der anvendes i
forbrugerprodukter, ikke særligt velbeskrevne. Tilgængelige databaser/ opgørelser angiver
ofte ingen eller meget generiske oplysninger om det indeholdte nanomateriale og sjældent
nogen detaljer om dets karakteristika. I nogle tilfælde skyldes angivelse som et
nanoprodukt ikke et egentligt nanoindhold, men derimod reaktiv kemi og dannelse af
nanopartikler eller -overfladestrukturer i forbindelse med påføring af produkterne, hvilket
fx er tilfældet med nogle "nanosprays".
-Koncentrationen af nanomateriale i et forbrugerprodukt er ofte ikke (præcist) angivet, og
derfor bliver eksponeringsberegningen forbundet med stor usikkerhed.
-I mange tilfælde vil eksponering for nanopartikler være enten i forbindelse med
vedhæftning til en matrix eller ved frigivelse fra en matrix. Frigivelsen og
eksponeringspotentialet af et nanomateriale afgivet fra en matrix (fx fra en dråbe eller fra
slibestøv) er således væsentligt dårligere belyst end fx frigivelse af et opløseligt kemikalie.
Det kan således være meget usikkert, i hvilket omfang et nanomateriale kan frigives (eller
kan migrere) fra produktmatrix.
-Med nogle få undtagelser tillader tilgængelige data og modeller kun en vægtbaseret
eksponeringsberegning, Særligt ved indånding er det muligt at fx partikelkoncentration
eller det samlede overfladeareal af partiklerne er mere relevant for en risikovurdering.
-Generelt er de aktuelle modeller til eksponeringsberegning ikke målrettet estimering af
eksponering for nanomaterialer.
-For nærværende synes det mere pålideligt at foretage konservative eksponeringsestimater
(eksempelvis ved vægtbaserede estimater) for oral og dermal eksponering end at estimere
eksponering ved inhalation/indånding.
-Eksponering ved indånding er vanskeligere at vurdere, og fra litteraturen fremgår det
særligt vanskeligt at vurdere eksponering i forbindelse med anvendelser i pumpesprays og
drivgasspray-produkter. Selv om mængden af videnskabelige publikationer omhandlende
disse scenarier vokser, viser et nærmere eftersyn af disse publikationer, at
eksponeringskoncentrationen er meget afhængig af et betydeligt antal eksperimentelle
parametre (tryk, dyse-størrelse, ventilation, forsøgsrummets størrelse, prøvens viskositet,
analytiske måleteknikker, osv.). Således mangler der generelt repræsentative data for
eksponering ved indånding efter spraying/sprøjtning.
26
-Til en vis grad gælder det samme for data mht. eksponering i forbindelse med mekanisk
efterbearbejdning (slibning, formaling, m.v.) samt i forbindelse med slitage af
forbrugerprodukter med indhold af nanomaterialer.
Således bør især det følgende bemærkes og holdes for øje, når der foretages risikovurdering af de 20
scenarier i næste fase af projektet:
-De 20 identificerede scenarier kan være gode eksempler på høj- (og lav-) eksponering
forbundet med forbrugerprodukter, men i betragtning af den nuværende viden om
nanomaterialer i forbrugerprodukter kan de ikke bruges mere generelt til at vurdere
eksponeringen fra forbrugerprodukter i almindelighed.
-Ved vurdering af risici skal det bemærkes, at karakterisering af nanomaterialet i de
undersøgte forbrugerprodukter generelt ikke er særligt velbeskrevet, hvilket gør det
vanskeligt at sammenligne eksponeringsestimater med data, der beskriver farligheden af
et tilsvarende stof, men som måske ikke er helt sammenligneligt.
-Der bør udvises forsigtighed ved vurdering af risiko ved indånding i de næste faser af
projektet, da et vægtbaseret eksponeringsestimat måske ikke er den mest hensigtsmæssige
parameter til vurdering af risici ved indånding.
-Generelt vil konservative metoder til beregning af eksponeringen overvurdere, hvilket
naturligvis bør tages i betragtning ved den endelige bedømmelse af resultatet af
risikovurderingen.
Exposure assessment of nanomaterials in consumer products 27
1. Introduction
1.1 Background
Nanomaterials are found in a wide range of consumer products and the commercial use of
nanomaterials is anticipated to increase rapidly in the future both in quantity and diversity. It is
increasingly recognised that materials in the nanoform can have unique properties as compared to
the microforms and macroforms of the same material. This favours the use of nanomaterials in
products, articles and technologies. At the same time, concerns in relation to the possible health
and environmental properties and impacts of nanomaterials have surfaced.
The current report addresses presence and exposure of nanomaterials in consumer products, as
well as an analysis of available tools, which could be used to assess exposure and risk from use of
nanomaterials in consumer products. In this report, the term "nano-product" designates mixtures
and articles containing nanomaterials (or claimed as a nano-product). This may cover products
even with small amounts/ contents of nanomaterials. Some products groups/categories are outside
the scope of this project, such as pharmaceuticals and tattoo colours, whereas medical devices
(those most similar to a consumer use), food and food contact materials are within the scope. Also,
the product life cycle after the initial use of the product is included (e.g. wear of a product or
sanding of a painted surface) is included.
As set out in the preface, two other reports from the projects will specifically address: i) the
hazardous properties of the nanomaterials used in consumer products, and ii) exposure/risks in
relation to background exposure to nanoparticles/ nanomaterials from environmental sources.
A final report will aim at assessing the risks for Danish consumers in relation to selected consumer
products containing nanomaterials
Figure 1 provides an overview of how the different work packages (WPs) of the project should
support the overall aim of the project. The current report includes the outputs of WP1 and WP2 of
the project.
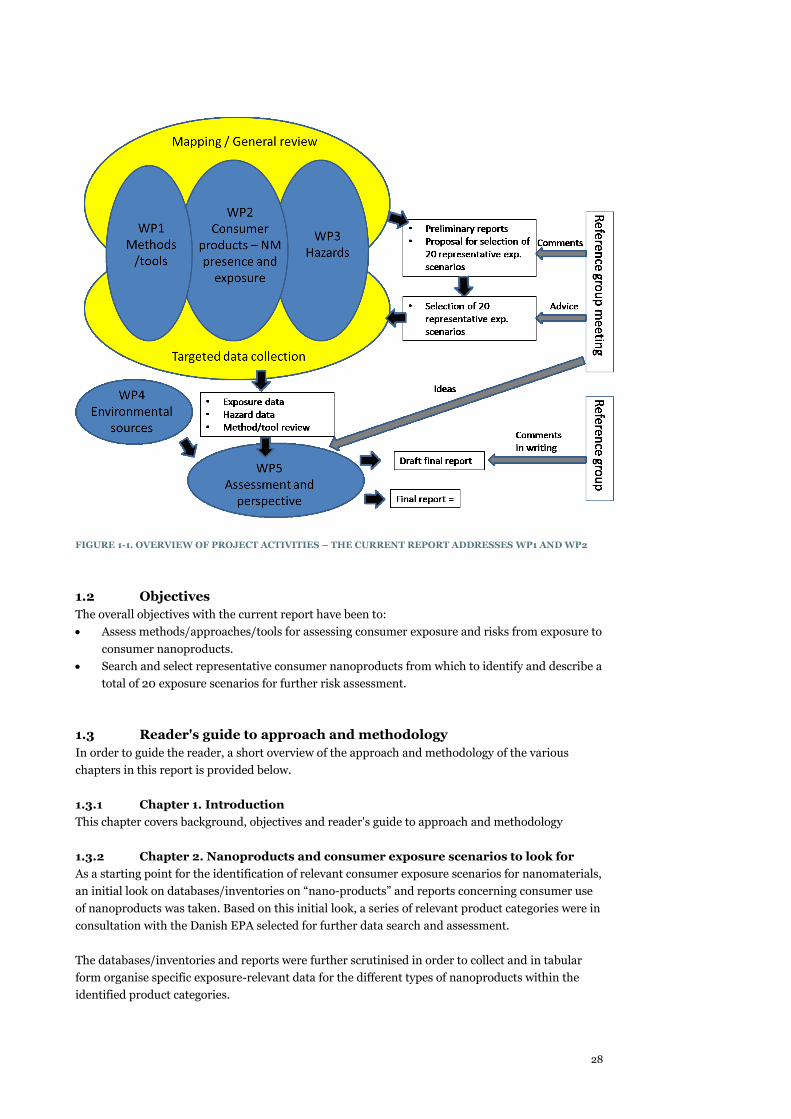
28
FIGURE 1-1. OVERVIEW OF PROJECT ACTIVITIES – THE CURRENT REPORT ADDRESSES WP1 AND WP2
1.2 Objectives
The overall objectives with the current report have been to:
Assess methods/approaches/tools for assessing consumer exposure and risks from exposure to
consumer nanoproducts.
Search and select representative consumer nanoproducts from which to identify and describe a
total of 20 exposure scenarios for further risk assessment.
1.3 Reader's guide to approach and methodology
In order to guide the reader, a short overview of the approach and methodology of the various
chapters in this report is provided below.
1.3.1 Chapter 1. Introduction
This chapter covers background, objectives and reader's guide to approach and methodology
1.3.2 Chapter 2. Nanoproducts and consumer exposure scenarios to look for
As a starting point for the identification of relevant consumer exposure scenarios for nanomaterials,
an initial look on databases/inventories on “nano-products” and reports concerning consumer use
of nanoproducts was taken. Based on this initial look, a series of relevant product categories were in
consultation with the Danish EPA selected for further data search and assessment.
The databases/inventories and reports were further scrutinised in order to collect and in tabular
form organise specific exposure-relevant data for the different types of nanoproducts within the
identified product categories.
Exposure assessment of nanomaterials in consumer products 29
At this stage, it has to be mentioned that a general challenge during collecting of data on specific
products was the documentation of the nano-content of the claimed nanoproducts that often was
very inadequate or absent.
1.3.3 Chapter 3 Review of available risk assessment tools
For the further assessment of the product categories, models/tools for exposure and risk
assessment were in cooperation with the Danish EPA identified for review as to their relevance for
the exposure scenarios to be undertaken in this project.
A total of 10 tools were reviewed. It should be noted that not only nanospecific tools were addressed
but also tools for risk assessment of chemicals in general. Also, not only consumer specific risk
assessment tools were selected, but also tools intended for the occupational environments were
included, as these might be applicable for some consumer exposure scenarios as well.
The aim of the review at this stage of the project was to establish an overview of the addressed
models/tools in terms of scope, requirements and coverage and to provide an initial indication of
how the models/tools would be able to address the preliminary gross list of product categories and
the associated exposure scenarios.
1.3.4 Chapter 4. Exposure assessment and key factors affecting exposure
The identified risk assessment tools where described in more detail with respect to their exposure
part, and exposure algorithms and key exposure parameters from the tools were identified. In
addition to this, also various EU guidance documents and opinions on exposure assessment and
risk assessment of nanomaterials were consulted in order to identify key parameters for making
exposure assessment.
1.3.5 Chapter 5. Specific nanomaterial exposure assessment
In addition to the collection of data on specific nano-products and description for the relevant
assessment tools, a literature search was conducted in order to gain knowledge from the scientific
literature and reports on concrete examples of exposure assessment to nanomaterials from
consumer products within product categories defined in Chapter 2. These examples may either have
been derived from use of some of the tools described above or been obtained by using
measurements of the amount of liberated nanomaterial during product use. Thus, the examples
may for some of the products in the product categories defined in Chapter 2 give additional
indications in relation to the exposure potential.
1.3.6 Chapter 6. Selection of exposure scenarios for further exposure and risk
assessment
Based on all nano-products identified and based on a range of selection criteria, 20 exposure
scenarios (representing 20 uses/applications of 20 nano-products), considered representative for
the exposure and risk of consumer use of nano-products on the Danish market, were selected.
1.3.7 Chapter 7. Consumer exposure to nanomaterials - exposure assessment of
selected scenarios
For each of the selected scenarios in Chapter 6 a case-by-case exposure assessment was made based
on learnings from mainly Chapter 4 and using relevant literature data from Chapter 5.
Results from the exposure assessment of the scenarios were compiled in a table (Table 7.1) to be
further used in the following risk assessment phase of the project presented in a separate report for
WP5.
During the elaboration of the above-mentioned chapters, several tables and working documents
were elaborated. These are attached separately in an appendix report to this report.
30
1.4 Working process
Writing of the various chapters in this report has largely been done in a sequential manner.
However, as the chapters throughout the report to some extent address the same products, the
learning process has been iterative. Thus, when further/new data were obtained, e.g. concerning the
content of nanomaterials in specific consumer products or new data regarding uses or exposure
scenarios, this knowledge has been included as identified. This may cause some minor
inconsistencies when reading the report as some data introduced late in the report not necessarily is
fully coherent with the information given earlier in the report.
1.5 Terminology
When the report uses the term nanomaterial this in relation to the physical characteristics and
follows the EC recommendation for definition of nanomaterial. The nanomaterial is defined in
ISO/TS 80004-4 having internal structure or surface structures in the nanoscale. Nanomaterials
include nano-objects and nanostructured materials. However, the report is limited to the
industrially produced/engineered nanomaterials.
Nano-scale or nano-size generally refers to sizes below 100 nm.
The term nano-product is used for a product containing (or claimed to contain) manufactured
nanomaterials or a product that result in nano-properties to an object after treatment (e.g.,
nanosprays used to generate easy-to-clean nano-films on a surface).
Product categories are defined by the purpose for a product e.g.: food, cosmetics, cleaning agents
etc. However there may be some overlap in the categories, e.g. paint could be placed in the coating
and impregnation category as well as in the category for construction materials. In addition, some
cleaning agents could be placed in the category for coating/impregnation as well.
Product types reflect a subdivision of the product category etc. cosmetics contain product types
such as shampoo, body lotion, mascara etc.
The Formulation of a product describes whether the product is in a spray can, whether it is a liquid
or solid. Thus, a formulation may be determined by the chemical content and matrix of a product in
combination with the design, volume and packaging/container of the products.
Matrix is the physical entity in which the nanomaterial is contained. The nature of the matrix may
be very important by determining to which extent there is a potential for liberation of the
nanomaterial, e.g. whether the nanomaterial is tightly bound in a solid matrix or more freely
available in a liquid matrix.
In this report the term nanomaterial exposure is used as the external exposure of the human body
to nanomaterial, thus the external exposure takes into account to which extent the nanomaterial is
liberated from the matrix, however skin penetration and further systemic absorption from the
dermal, oral or inhalation exposure is not considered.
An exposure scenario for a nano-product is understood as a qualitative and quantitative description
regarding a given use of a product, which may lead to exposure to the nanomaterial with respect to
dermal, oral, eye or inhalational exposure during product use by the consumer.
Exposure assessment of nanomaterials in consumer products 31
2. Nano-products and consumer exposure scenarios to look for
2.1 Searching for relevant product categories
As a starting point for the identification of relevant consumer exposure scenarios for nanomaterials,
relevant databases/inventories on “nano-products” and relevant reports concerning consumer use
of nano-products were consulted. The databases/inventories and the reports were pre-selected in
consultation with the Danish EPA, see Appendix 1.
Overall it was found that the RIVM (2009) project “Exposure to nanomaterials in consumer
products” and the Danish “Nano database” from DTU Environment, The Danish Ecological
Council and Danish Consumer Council provided a first basis for rough evaluations on the exposure
potential for various product categories and product types/formulations within the product
categories.
In the RIVM (2009) study, exposure estimations for various product categories have been
performed on the basis of expert judgements and graded high -/ medium-/ low-/ or unknown
exposure potential.
The following information was considered important for making exposure assessment: Shape of nanomaterial in product
Product form (i.e. spray, powder, liquid, solid)
Free or fixed nanomaterial
Concentration in product
Direct/indirect exposure
Indoor/outdoor use
Duration time per use
Frequency of use
Exposure route.
The Danish Nano database is further considered relevant for the Danish market as it includes rather
detailed descriptions of more than 1200 products claimed as nano-products. Also, it includes
exposure and hazard assessment of the nanomaterials and it is a living database that is continuously
updated.
In the Nano database, the specific products are ranked according to their potential ability to result
in exposure (high -/ medium-/low-/ or unknown exposure potential using the colour codes red/
yellow/ green/ or grey). The ranking is mainly done based on the use pattern of the nano-product
and the state of the nano-material in the matrix of the product (i.e. to which extent the
nanomaterial was free or bound i.e. whether the nanomaterials was airborne, in a liquid, or e.g.
bound in or onto a matrix).
32
Another important information source has been the recent Danish EPA (2014a) supplementary
survey of products on the Danish market containing nanomaterials. This survey covers the use of
nano-materials in Denmark in food and feed, food packaging, cosmetics, pesticides, medical devices
and water treatment. Through contact to Danish producers, importers and trade organisations,
information has been gathered on the use of specific nano-materials in the various product
categories. Each nano-material was mapped out on a generic level for each product category and the
report therefore does not refer to specific commercial products on the market.
Based on these data sources, the following product categories were found to have relatively high
potential for consumer exposure to nanomaterials (see also Appendix 2):
Food and beverages:
Nano-material ingredients
Food supplements
Nano-material in packaging
Cosmetics:
Spray, liquids, crème, lipstick, mascara, etc.
Cleaning agents:
Liquids, spray, paste
Coatings/ impregnation:
Liquids, spray, cloth/textile, paints, shoe polish
Maintenance products (car, boats):
Liquids, spray, cloth/textile, paste
Textiles
Construction materials:
Self-cleaning surfaces; cement concrete a.o
Medical devices:
E.g. wound dressings containing nano-silver, dental fillings
Air-cleaners:
Sprays
Fuel and lubrication oil additives
It was further decided to include products from the following product categories as well in order to
also cover some expected low-exposure scenarios:
Electronic devices E.g. computers Appliances E.g. refrigerators
2.2 Data sources for finding information on specific nano-products on
the market
In addition to the above-mentioned sources that formed the basis of the project, additional nano
databases/inventories and reports were identified (see Appendix 1) and further scrutinised in order
to find the most relevant data sources of information on specific nano-products to cover all the
product categories selected in Section 2.1.
Each of the databases/inventories were examined with respect to the scope (what does it cover,
content (which type of information), content and outcome (content and findings from the data
source), exposure (which type of exposure relevant information) and the relevance in connection
with this project. The outcome of this exercise is indicated in Appendix 3.
Exposure assessment of nanomaterials in consumer products 33
The Danish “Nanodatabasen” was as already mentioned considered to be a very relevant database
as it is a living database with detailed information and evaluations regarding potential exposure
(and potential hazard) of each product. Thus, this was used as a first-choice database when
extracting data on products from various product categories. Other important and valuable
databases for extracting product-specific information was considered to be the BUND database
(also a living database) and the ANEC/BEUC database (last update 2012 with nano-silver products)
covering to a great extent the same product categories as the Nano-database. The US Nanotech
project database was also considered as a key relevant database as it has recently been updated
(November 2013) and contain products from Europe. Further, this database has been upgraded
with very good search options.
Applications and reference to these databases is often found in reports and scientific literature
addressing nanomaterials in products, as these databases are considered the best information
sources. However, when applying information from these databases, it should be stressed that the
content of these databases are based on "claims" on the products. Thus, the databases may be
biased or limited as they:
Only address products for which the supplier can see a benefit in claiming "nano".
Do not include products were the supplier is not interested in claiming "nano" or not knowing
whether the product contains nanomaterials.
Do not prove the content of "nano", i.e. it has not been verified that the products actually
contain the claimed nanomaterials.
A further important information source was a mentioned in Section 2.1 a recent Danish EPA
(2014a) supplementary survey of products on the Danish market containing nanomaterials. This
survey covers the use of nanomaterials in Denmark in food and feed, food packing, cosmetics,
pesticides, medical devices and water treatment. Through contact to Danish producers, importers
and trade organisations, information has been gathered on the use of specific nanomaterials in the
various product categories. Each nanomaterial was mapped out on a generic level for each product
category and the report therefore does not refer to specific product examples on the market.
In Chapter 5, a review of scientific literature addressing exposure to nanomaterials from nano-
products will be presented. The findings from that review will supplement the findings in this
chapter and be considered in the selection of representative exposure scenarios in Chapter 6.
2.3 Strategy for extraction of product information
To cover the various product categories, formulations and exposure scenarios, it was decided to
collect data of about hundred specific products and to extract data from the databases and from the
website of the product suppliers to gain as much information as possible for each product.
Furthermore, it was decided to collect the data in a structured approach for various parameters
important for exposure assessment. Inspired by the findings of RIVM (2009), the following
information should be gathered if possible:
Product name, volume and product type
Formulation and application method
Nanomaterial identification
Nanomaterial concentration in the product
Volume of product used per event
Duration of use (per event)
Frequency of use
Indoor/ outdoor use
Target consumer group for the product
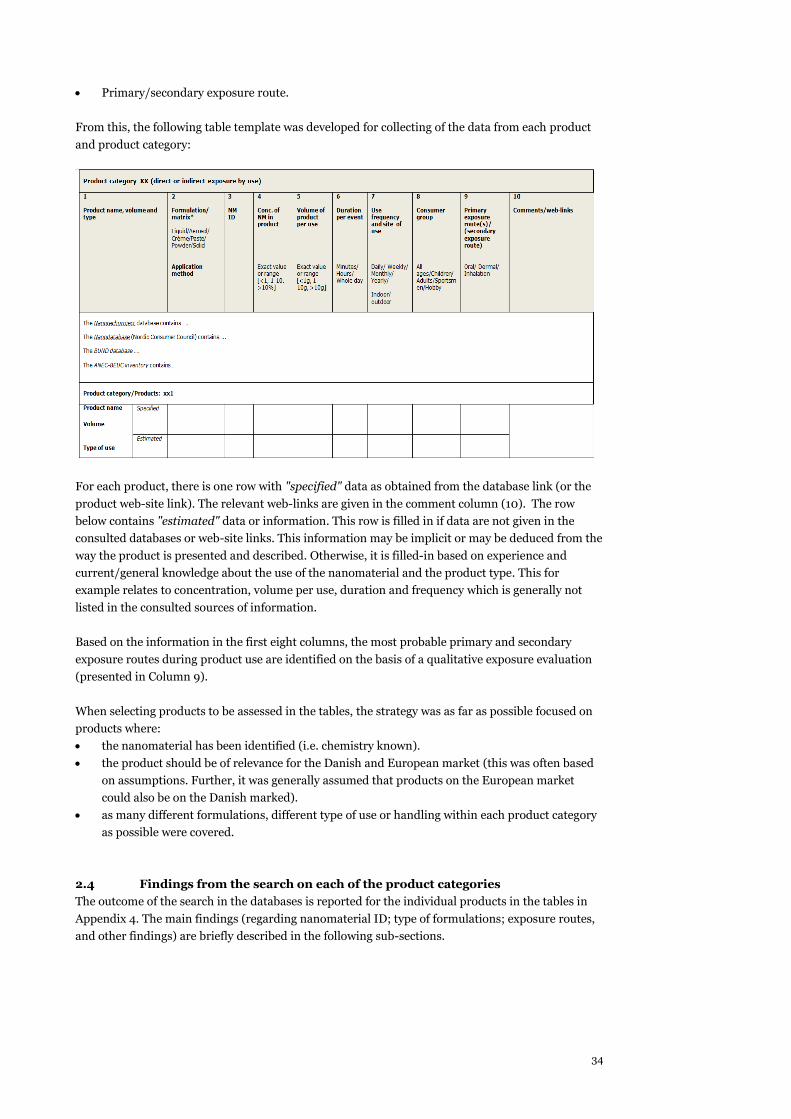
34
Primary/secondary exposure route.
From this, the following table template was developed for collecting of the data from each product
and product category:
For each product, there is one row with "specified" data as obtained from the database link (or the
product web-site link). The relevant web-links are given in the comment column (10). The row
below contains "estimated" data or information. This row is filled in if data are not given in the
consulted databases or web-site links. This information may be implicit or may be deduced from the
way the product is presented and described. Otherwise, it is filled-in based on experience and
current/general knowledge about the use of the nanomaterial and the product type. This for
example relates to concentration, volume per use, duration and frequency which is generally not
listed in the consulted sources of information.
Based on the information in the first eight columns, the most probable primary and secondary
exposure routes during product use are identified on the basis of a qualitative exposure evaluation
(presented in Column 9).
When selecting products to be assessed in the tables, the strategy was as far as possible focused on
products where:
the nanomaterial has been identified (i.e. chemistry known).
the product should be of relevance for the Danish and European market (this was often based
on assumptions. Further, it was generally assumed that products on the European market
could also be on the Danish marked).
as many different formulations, different type of use or handling within each product category
as possible were covered.
2.4 Findings from the search on each of the product categories
The outcome of the search in the databases is reported for the individual products in the tables in
Appendix 4. The main findings (regarding nanomaterial ID; type of formulations; exposure routes,
and other findings) are briefly described in the following sub-sections.
Exposure assessment of nanomaterials in consumer products 35
2.4.1 Food and beverages
All the identified products referred to in Appendix 4 are food supplements. The food supplement
products contained the following metallic elements claimed to be in nano form:
silver
platinum
palladium
gold
but also different organic substances apparently in the nano-size were used. The concentrations of
the identified nanomaterials range from 10 ppm to <500 ppm (for nano-Ag).
Uses of nanomaterials in food products have not been presented in the databases, and thus specific
food items are not included in Table 2-1.
A supplementary survey of products on the Danish market containing nanomaterials (Danish EPA,
2014a) identified in the Danish food industry the following food additives (for colouring, anticaking,
etc.), which may contain particles in nanosize: silicon dioxide (E551), titanium dioxide (E171),
calcium carbonate (E170), and vegetable carbon (E153). Iron, calcium and silver, and oxides thereof
are not approved as food additives but are being marketed as food supplements. For use in food
contact materials, nanomaterials such as silicon dioxide, titanium dioxide and titanium nitride have
been approved for use.
Specific food products containing these (or other) food additives in nano-form were not identified in
the databases. This may first of all be because the food items are not marketed as products containing
nanomaterials and further because it may usually not be known to which extent the particulate food
additives in fact contain fractions in the nm-size-range and at which levels.
The primary exposure route is of course oral as the products are intended to be ingested.
2.4.2 Cosmetics
In the examples of cosmetic products addressed in appendix 4, the following materials have been
indicated to be in nanoform:
silver
in soap/ creams/ gels/ lotions for dermal application. Also in mouth wash solution
and in toothpaste
gold
in cream for facial use
platinium
in cream
fullerenes
in cream at dermal application in eye region
nano-peptides
in mascara for eye lashes
silicium dioxide
in sunscreen cream and in liquid preparations for application in face and eye region
36
zinc oxide
in sunscreen
titanium dioxide
in sunscreen, face powder
calcium peroxide
in toothpaste
copper & copper peptides
in shampoo and facial liquid preparations
carbon black
in mascara
For the far majority of the products, the primary exposure route is the dermal route, whereas
secondary routes are in relation to oral, inhalational and eye exposure. For mouthwash solution
(nano-Ag) and toothpaste (nano-calcium peroxide), the primary route is the oral route.
The whole volume of a cosmetic is normally intended for direct exposure onto the body e.g. in
relation to dermal or oral cavity exposure. For products that are "leave-on", the products remain on
the body for hours, whereas most of the use volume from "rinse-off" products is washed off (e.g.
soaps and shampoos) and exposure is limited to a much shorter duration.
It may be surprising that although pigments are used in a variety of cosmetics (e.g. mascara, lip
stick, eye shadow, face powder, etc.), this content seems not to have led to inclusion of any
cosmetics into the nano databases/inventories, although pigments, e.g. carbon black, titanium
oxide, iron oxides and aluminium hydroxide, may fulfil the EU definition of “nanomaterial”
(Danish EPA 2014a). However, this definition was established in October 2011 and it might be that
pigments prior to that were not generally considered nanomaterials. However, with the new
Cosmetics Regulation (Regulation No 1223/20091) which entered into force in 2013, it is mandatory
to label for content of ingredients in the nano form and a mandatory pre-notification scheme for
products containing nanomaterials entered into force. This is expected to influence upcoming
revisions of the databases/inventories. Only few toothpastes occur in the databases even though it
has often been stated that they in general contain nanoparticles e.g. nano-silica and nano-TiO2.
According to the Danish EPA (2014a), nanomaterials have been used in nail polish for several years
whereas the use of nanomaterials in mascara, eyeliner, face powder and foundation has been
introduced within the last year.
As noted above, further knowledge concerning the use of nanomaterials in cosmetics will be
available in near future. In the new Cosmetics Regulation there is a requirement for the companies
to notify the use of nanomaterials in cosmetics indicating ID, particle size, physical and chemical
properties, the amount used in the cosmetics, a toxicological profile, foreseeable exposure and
safety data. By 11 January 2014, the Commission should have made a catalogue of all nanomaterials
used in cosmetic products available, indicating the categories of cosmetic products and the
reasonably foreseeable exposure conditions. This catalogue shall be regularly updated thereafter
and be made publicly available. However, the work on creating this catalogue has not met this
deadline as considerable inconsistencies in the notifications have been noted.
1 Regulation (EC) No 1223/2009 of The European Parliament and of the Council of 30 November 2009
on cosmetic products.
Exposure assessment of nanomaterials in consumer products 37
2.4.3 Cleaning agents
Three different product types are addressed in Appendix 4: liquids, sprays, and cloth/wipe-based
products. The indicated active nanomaterial ingredients were either:
silver
titanium dioxide
silica
micelles
Concentration levels around 1% or less than 1% (for nano-Ag) was considered as realistic estimates
for these products.
The primary exposure routes were assessed to be inhalation and/or dermal exposure depending on
the product type. There is subsequent risk of accidental oral exposure. The volume of the products
to be used by each application of the product is typically greater than 10 g. The typical exposure
duration will last for minutes, but in some cases the post application stage can result in exposure for
days, e.g. this may especially be the case with textiles cleaned/ treated with a nano-product.
2.4.4 Coatings/ impregnation
For many of the products addressed in Appendix 4, no specification of the actual nanomaterial was
indicated. However, products with the following nanomaterials were indicated:
titanium dioxide
silicium dioxide
silver
teflon, polytetrafluoroethylene
Only one product specifies the actual concentration of the nanomaterial. For the remaining
products, the estimated nanomaterial concentrations are less than 10%, with the most products
estimated to have concentrations of less than 1%. Duration of use of the products is estimated to be
minutes to hours, and the frequency was estimated to vary from monthly to yearly. The primary
exposure route for the nanomaterial exposure is the dermal route and for products that are sprayed,
also the inhalation route.
2.4.5 Maintenance products (car, boats)
In the examples addressed in Appendix 4, the following nanomaterials have been found in the
maintenance products:
silver
in anti-reflecting cleaning agents, textile impregnation, antimicrobial protection for
plastic parts of car interior, odour remover inside car
silicium dioxide
in window coating for cars, car shampoo, car tires, sealant/coating and protection
for cars
aluminium oxide
in polish/coating for cars
nano boron
coating for the motor protection unit
nano ceramics
in maintenance for cars
38
titanium dioxide
in odour remover inside car
carbon nanotubes
in polymer skeleton that are used for moulding into automotive parts for repair.
For the majority of the products, the primary exposure route is the dermal route, whereas
secondary routes are in relation to oral or inhalational exposure. However, for spray/pump
products such as textile impregnation and products where they require mixing before use, such as
cockpit cleaner, the primary exposure route is inhalation. The latter is also assumed to cause the
highest consumer exposures.
For maintenance products, the exposure is unintended, but may typically occur during use of the
products. The consumers exposed will mainly be adults and car owners, who use the maintenance
products. The frequency of use will mainly be monthly or yearly for the maintenance products and
the duration of the event will be minutes or hours depending on the application.
2.4.6 Textiles
The nanomaterials addressed in Appendix 4 are:
silver
bamboo charcoal
titanium dioxide
teflon, polytetrafluoroethylene
The most frequently used nanomaterial in textiles seems to be Ag with antimicrobial effect. A few
products contain other nanomaterials such as bamboo charcoal, Teflon and nano-TiO2, the latter as
ultra violet (UV) protection. For some of the more exotic materials e.g. bamboo charcoal it may be
difficult to evaluate what type of substance that is actually covered by this terminology and how the
word nano should be understood in this context. For exposure to surface-bound nanomaterials, it is
difficult to express "volume of product per use" in a meaningful manner, and thus a value of <1 g is
used in Table 2-1.
The principal exposure route is the dermal route as clothes are in close contact with skin. Even
though the nanomaterials are considered surface-bound, a low exposure potential may still be
assumed, as e.g. textiles treated with nano-Ag may release silver particles or ions. Oral exposure
may be relevant for small children sucking the textile e.g. snips from pillows.
2.4.7 Construction materials
In the examples addressed in Appendix 4, the following nanomaterials have been indicated in the
construction materials:
silver
in façade protection
silicium dioxide
in plaster and cement
silicon dioxide
in coating for stone and tile protection
titanium dioxide
Exposure assessment of nanomaterials in consumer products 39
in tiles, surface layer for roofs and pavements, "self-cleaning" glass
unknown nanomaterials
in surface protection, mortar, sealant and soil stabilization products
It was anticipated that carbon nanotubes could be found in this product category, however, no
specific construction materials with content of carbon nanotubes were identified.
For all of the products, the primary exposure route is the dermal route (for cement also the
inhalational route), whereas secondary routes are for the majority of the products in relation to
inhalational and oral exposure. Most of the nanomaterial content is unknown.
For construction materials, the exposure is unintended and the consumer will only be exposed to
part of the volume of the product. The duration of the exposure depends on whether the product is
quickly applied on the surface or whether it is a construction material requiring handling such as
tile and cement. Consumer exposure must be assumed to be much higher for nanomaterials in
powders and liquids than for nanomaterials in solid matrices.
2.4.8 Medical devices
In the examples addressed in Appendix 4, the following nanomaterials have been indicated in the
medical devices:
silver
in wound dressing, coating for implants
copper
in ostomy bags
silicate
in dental filling
zirconia
in dental filling
For the ostomy bags and wound dressing, the primary exposure route is the dermal route. For
dental filling (silicate or zirconia), the primary route is the oral route. For coating implants, the
consumer exposure is “systemic”. Generally, consumers of all ages may be exposed. However,
ostomy bags and implants will be used more often by elderly people.
Except for dental fillings, the nanomaterials are added to enhance the antibacterial effect and thus
the exposure is in that respect intended for the medical devices. For coating of implants and dental
filling the duration of the event is divided into ‘application’ and ‘after application’ since the dental
filling and implants will be embedded into the body, permanently or for a long period of time.
2.4.9 Air-cleaners
In the area of air-cleaners and sprays, two types of nano-enabled products are indicated in
Appendix 4; namely solid-state and spray-based air-cleaners. The active nanomaterial ingredients
were:
silver
titanium oxide
activated carbon
plant oil fatty acids, plant oils vegetable extracts (not further declared)
40
Solid-state air-cleaning may be assisted by UV-light or ozone treatment. In two cases, other air-
cleaning agents were reported.
The most important exposure routes were inhalation and dermal for sprays and dermal exposure
for handling solid-state air-cleaning systems (filters, filter changes). The typical volume of product
used during each application of the products is in the order of 1-10 g. In a few cases, the actual
exposure and exposure duration could be hours or longer.
2.4.10 Fuel and lubrication oil additives
In the examples addressed in Appendix 4, the following nanomaterials are indicated in fuel and
lubrication oil additive products:
gold - in engine oil and as fuel catalyst
cerium oxide - as diesel catalyst
tungsten disulphide -as lubricant for engine oil
For all of the products, the primary exposure route is the dermal route during fuelling/addition of
oil. The product can be added either indoor in a garage or outside on a service station.
The primary route related to combustion of the diesel would be the inhalation route. The latter is
relevant for the general population (all ages) and not just the consumers fuelling the vehicles.
The exposure to the products/combustion products is any case unintended.
Fuel is added regularly and the frequency of the exposure will be daily or weekly depending on the
driving habits. Engine oil is added less frequently and the frequency of the exposure is therefore
monthly or yearly. Exposure to traffic exhaust is very frequent/almost continuous and this is
covered in another section of this project.
2.4.11 Electronic devices/products
In the examples addressed in Appendix 4, the following nanomaterials have been indicated in the
electronic devices:
silver
in computer keyboard and protection coating for metal
gold
in protection coating for metal
silicon dioxide
in processor
zinc oxide
in cooling liquid
It is also known that carbon nanotubes (CNTs) are used in electronics (e.g. in semi-conductors and
other solid matrices) as will be further addressed in Chapter 5. However, such uses are not generally
claimed, and therefore not identified in this chapter.
For all of the products, the primary exposure route is the dermal route, whereas secondary routes
may be in relation to oral and inhalational exposure.
Exposure assessment of nanomaterials in consumer products 41
For the cooling liquid to be applied from the bottle, actual dermal consumer exposure is expected.
For the keyboard where the nanomaterials are added for antibacterial purposes, dermal exposure
may also take place. The frequency of the exposure is expected to be monthly or yearly and thus
limited, except for the keyboard, which will be used daily. The consumer exposure to nanomaterials
in solid matrices (e.g. the processor) would require consumer intervention into the computer.
2.4.12 Appliances
In the examples addressed in Appendix 4, the following nanomaterials have been found in the
electrical appliances:
silver
in refrigerator, air humidifier and in washing machine
iron
in refrigerators
carbon
in refrigerators
For the far majority of the products, the primary exposure route is the dermal route, whereas
secondary routes are in relation to oral or inhalational exposure. This applies for the refrigerators
and the air humidifier.
For appliances, the use of nano-Ag as biocide will lead to some release of silver (as silver ions and
perhaps as nano-silver) and thereby some exposure. The exposure is difficult to estimate but
intuitively assessed to be low.
2.5 Overall findings regarding nanomaterials in the various product categories
Nanomaterials and products in the product categories
Overall, when searching for consumer products in the databases/inventories and the literature, a
very broad and diverse picture of nanoproducts on the market appears. Especially for the broad
categories of cosmetics, cleaning agents, coating/impregnation and maintenance products many
different products can be found with respect to various products types/formulation and application
methods.
With respect to data on food and beverages, it is important to note that the databases only present
nanomaterials in food supplements and do not cover the content of nanomaterial in food products
as such, which might e.g. originate from the use of additives in nanoform.
It was further noted that there are several overlaps between the databases as they often feed into
each other. In addition, it was noted that it sometimes may be difficult to categorise a product into
one of our chosen product categories. A cleaning agent may as an example also be a
coating/impregnation agent, and a paint product can be considered relevant both for the
coating/impregnation category as well as for the construction materials category.
When working with and searching in the databases, it was noted that dead links to manufacturers
and vendors as well as wrong information was sometimes encountered. Thus, care has to be taken
when using information from the data bases/inventories.
As an overall observation, it became clear that for many products, the nanomaterials are not
properly identified, and it is difficult to assess in which state the nanomaterial is present or to which
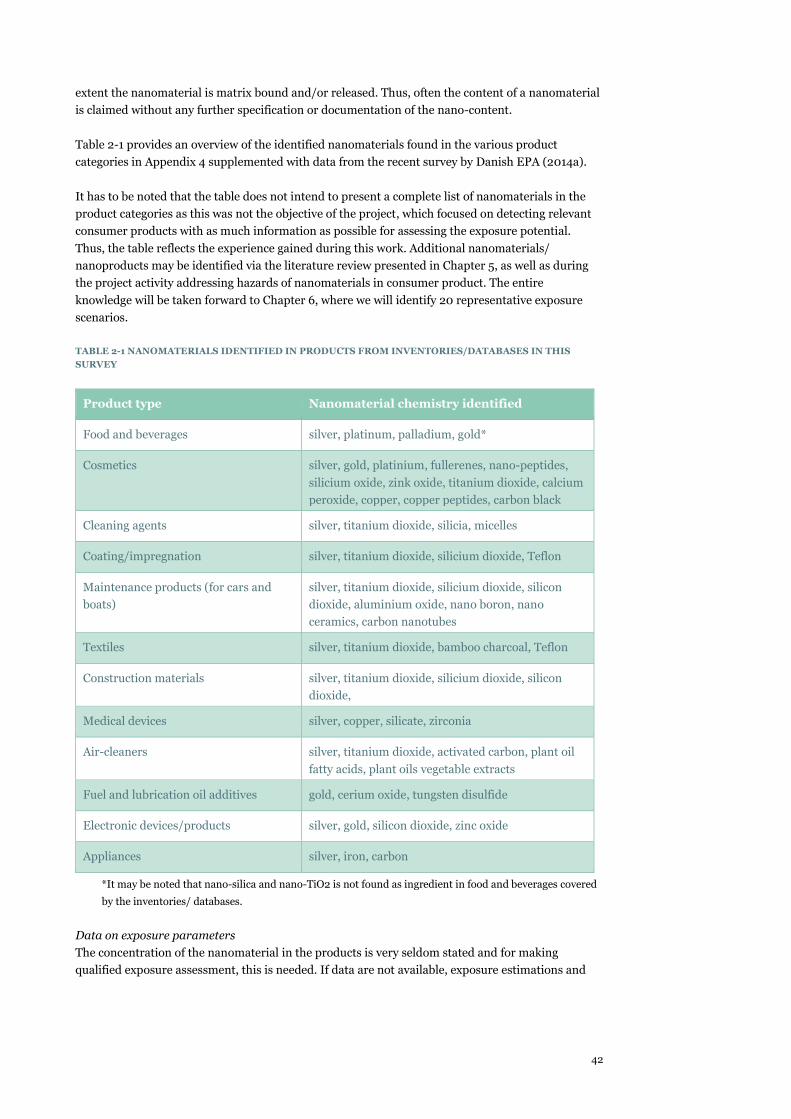
42
extent the nanomaterial is matrix bound and/or released. Thus, often the content of a nanomaterial
is claimed without any further specification or documentation of the nano-content.
Table 2-1 provides an overview of the identified nanomaterials found in the various product
categories in Appendix 4 supplemented with data from the recent survey by Danish EPA (2014a).
It has to be noted that the table does not intend to present a complete list of nanomaterials in the
product categories as this was not the objective of the project, which focused on detecting relevant
consumer products with as much information as possible for assessing the exposure potential.
Thus, the table reflects the experience gained during this work. Additional nanomaterials/
nanoproducts may be identified via the literature review presented in Chapter 5, as well as during
the project activity addressing hazards of nanomaterials in consumer product. The entire
knowledge will be taken forward to Chapter 6, where we will identify 20 representative exposure
scenarios.
TABLE 2-1 NANOMATERIALS IDENTIFIED IN PRODUCTS FROM INVENTORIES/DATABASES IN THIS
SURVEY
Product type Nanomaterial chemistry identified
Food and beverages silver, platinum, palladium, gold*
Cosmetics silver, gold, platinium, fullerenes, nano-peptides,
silicium oxide, zink oxide, titanium dioxide, calcium
peroxide, copper, copper peptides, carbon black
Cleaning agents silver, titanium dioxide, silicia, micelles
Coating/impregnation silver, titanium dioxide, silicium dioxide, Teflon
Maintenance products (for cars and
boats)
silver, titanium dioxide, silicium dioxide, silicon
dioxide, aluminium oxide, nano boron, nano
ceramics, carbon nanotubes
Textiles silver, titanium dioxide, bamboo charcoal, Teflon
Construction materials silver, titanium dioxide, silicium dioxide, silicon
dioxide,
Medical devices silver, copper, silicate, zirconia
Air-cleaners silver, titanium dioxide, activated carbon, plant oil
fatty acids, plant oils vegetable extracts
Fuel and lubrication oil additives gold, cerium oxide, tungsten disulfide
Electronic devices/products silver, gold, silicon dioxide, zinc oxide
Appliances silver, iron, carbon
*It may be noted that nano-silica and nano-TiO2 is not found as ingredient in food and beverages covered
by the inventories/ databases.
Data on exposure parameters
The concentration of the nanomaterial in the products is very seldom stated and for making
qualified exposure assessment, this is needed. If data are not available, exposure estimations and
Exposure assessment of nanomaterials in consumer products 43
worst-case scenarios could be made based on current knowledge and experience in relation to the
various product categories.
Rather good estimations may however be done on "volume of product per use" as this can often be
estimated due to the product volume or general knowledge concerning use of the various consumer
products. However for articles where nanomaterials are embedded into a solid or semi-solid matrix,
or surface bound it may be rather difficult to make a meaningful estimation on "volume of product
per use". Instead, contact surface area and potential migration/release may be considered to assess
the emission potential. Such a procedure has recently been applied to assess the potential consumer
and environmental exposure to CNT in consumer products (Danish EPA 2014b).
With respect to duration and frequency of use, some general everyday considerations have been
made, however, for some subset of the population that have specific interests in leisure activities,
hobbies or specific preferences, the frequency of use may be higher and the duration per day longer.
The primary exposure route for most products is via dermal exposure. For product in the food
category, the oral route is the primary route. For nearly all product categories where spray
application is used, the inhalation route is generally considered the primary route and calls for
attention, as the matrix here is aerosolised into tiny droplets, and the nanomaterials may be easily
accessible for lung tissue exposure when inhaled. However, dermal and eye exposure associated
with spraying might be highly relevant.
Further use of the information in the product category tables (Appendix 4)
At this stage, data on relevant parameters for exposure have been extracted from the most relevant
databases and qualitative estimations regarding the potential for oral, dermal and inhalational
exposure have been made. Further investigations and considerations are necessary in order to
establish more detailed and relevant information needed for further qualitative and semi-
quantitative exposure assessment of the various consumer products and exposure scenarios.
From information given in the product category tables in Appendix 4 and from the qualitative
exposure estimation given in column 9 of the tables, it already seems clear that a very important
factor for the further semi-quantitative approach would be the implication of the product matrix
with regard to accessibility of the nanomaterial, i.e. to which extent is the nanomaterial liberated or
accessible for exposure to humans. This may have a great impact on the quantitative exposure
assessment that may overrule much of the quantitative information presented in the columns 1, 4,
5, 6, and 7 of the tables. E.g., there may be order-of-magnitude differences in the accessibility to
nanomaterials embedded in a solid matrix compared to nanomaterials in a liquid or an aerosol.
Therefore, in the next chapters of this report, available risk assessment and exposure models will be
presented and the most important parameters in relations to quantitative exposure assessment and
the interplay of these when making exposure estimations will be identified and described. In
addition to this, specific examples or cases with detailed exposure estimates for nanomaterials in
consumer products will be described in order to obtain case-specific experience e.g. with measured
exposure levels.
With further information on these aspects, it may be possible to further build on the knowledge
from the tables in Appendix 4, and to select some of the products in order to define relevant and
representative consumer exposure scenarios for further evaluation. This selection of scenarios will,
as noted, also take into account findings from the parallel-running hazard assessment activities in
the project.
44
3. Review of available risk assessment tools
This chapter reviews a select suite of relevant exposure and risk assessment tools. The aim of the
review was to establish an overview of the addressed models/tools in terms of scope, requirements
and coverage and to provide an initial indication of how the models/tools would be able to address
the preliminary gross list of exposure scenarios related to the product categories identified in
Chapter 2.
As the aim is to identify and examine tools for risk assessment and the potential use for
nanomaterials the tools to some extent have to include several elements (or modules) in relation to
exposure assessment, hazard characterisation and risks characterisation.
The current reporting will not at this stage identify which model(s) would be most suitable for the
risk assessments to be performed by the end of project, but merely form a basis for the choice of risk
assessment model(s) to be used or adapted to a selected set of exposure scenarios for
nanomaterials. Thus, some of the information in the current reporting might be revised or further
detailed in the risk assessments in the final project report, when the prioritised exposure scenarios
for nanomaterials have been selected.
Although exposure to some extend will be addressed in this chapter the following Chapter 4 will go
further into detail with respect to defining exposure algorithms and identifying the most important
factors/parameters determining consumer exposure to nanomaterials.
3.1 Scope/objective/boundaries
The reviewed exposure and risk assessment tools were identified in cooperation with the Danish
EPA. The tools were selected based on their specificity for assessing nanomaterials or for their
general applicability for assessing conventional chemicals and possible relevance for assessment of
nanomaterials. The tools reviewed include:
NanoRiskCat (DTU and NRCWE)
NanoSafer (NRCWE, DTI)
Stoffenmanager Nano (TNO)
Stoffenmanager (TNO)
The ANSES tool
Swiss Precautionary Matrix (Swiss consortium)
ECETOC TRA
ConsExpo (RIVM)
DREAM (TNO and IOM)
Margin of Exposure (MOE) concept (The US Soap and Detergent Industries).
It should be noted that we have not only addressed tools intended for risk assessment of consumer
exposure. Occupational exposure/risk assessment and control-banding-type tools were also
Exposure assessment of nanomaterials in consumer products 45
included, as their approaches or the tools themselves might be applicable for some consumer
exposure scenarios.
The reviews of the tools were conducted following an assessment template with relevant questions
in relation to the approach/performance of the models/tools. A completed assessment template can
be found for each tool in Appendix 5 in the appendix report.
Below a summary is given regarding the findings after filling out the assessment templates
3.2 Summary and comparison of the scope and approach of the
assessed tools
Table 3-1 summarises the general scope and approach of the 10 assessed tools based on the
evaluation listed in Appendix 5.
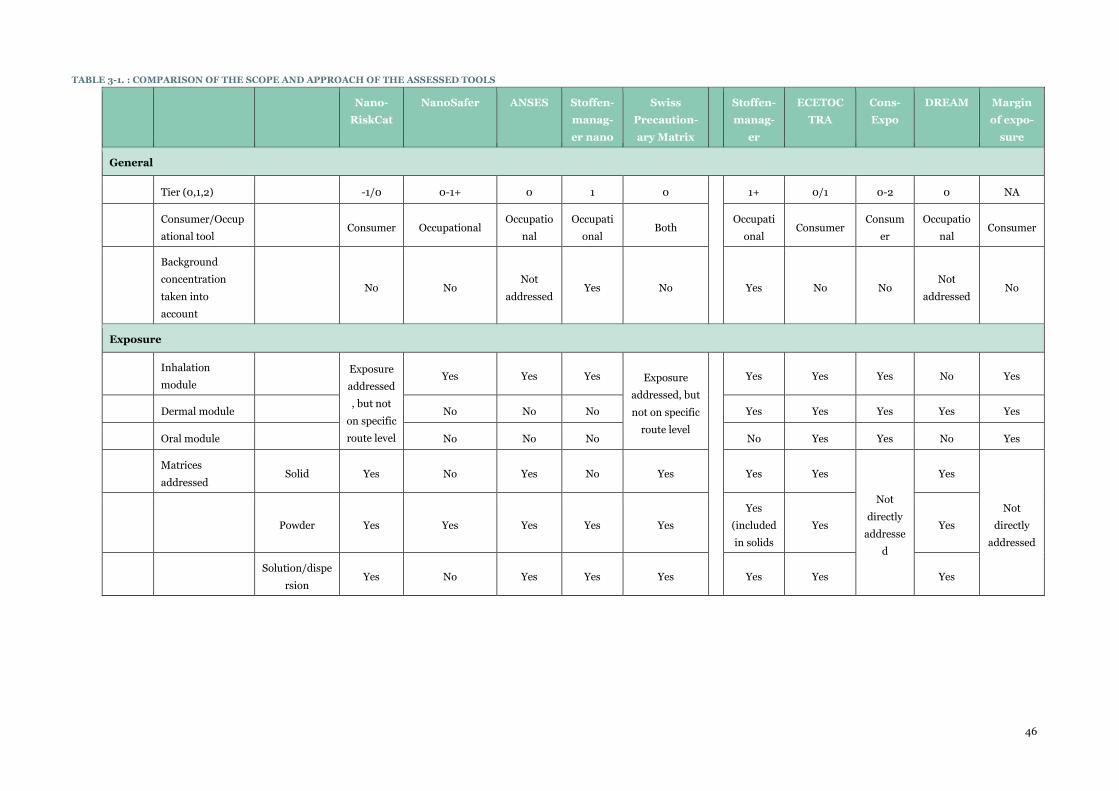
46
TABLE 3-1. : COMPARISON OF THE SCOPE AND APPROACH OF THE ASSESSED TOOLS
Nano-
RiskCat
NanoSafer ANSES Stoffen-
manag-
er nano
Swiss
Precaution-
ary Matrix
Stoffen-
manag-
er
ECETOC
TRA
Cons-
Expo
DREAM Margin
of expo-
sure
General
Tier (0,1,2)
-1/0 0-1+ 0 1 0
1+ 0/1 0-2 0 NA
Consumer/Occup
ational tool Consumer Occupational
Occupatio
nal
Occupati
onal Both
Occupati
onal Consumer
Consum
er
Occupatio
nal Consumer
Background
concentration
taken into
account
No No
Not
addressed Yes No Yes No No
Not
addressed No
Exposure
Inhalation
module
Exposure
addressed
, but not
on specific
route level
Yes Yes Yes Exposure
addressed, but
not on specific
route level
Yes Yes Yes No Yes
Dermal module
No No No Yes Yes Yes Yes Yes
Oral module
No No No No Yes Yes No Yes
Matrices
addressed Solid Yes No Yes No Yes Yes Yes
Not
directly
addresse
d
Yes
Not
directly
addressed
Powder Yes Yes Yes Yes Yes
Yes
(included
in solids
Yes Yes
Solution/dispe
rsion Yes No Yes Yes Yes Yes Yes Yes
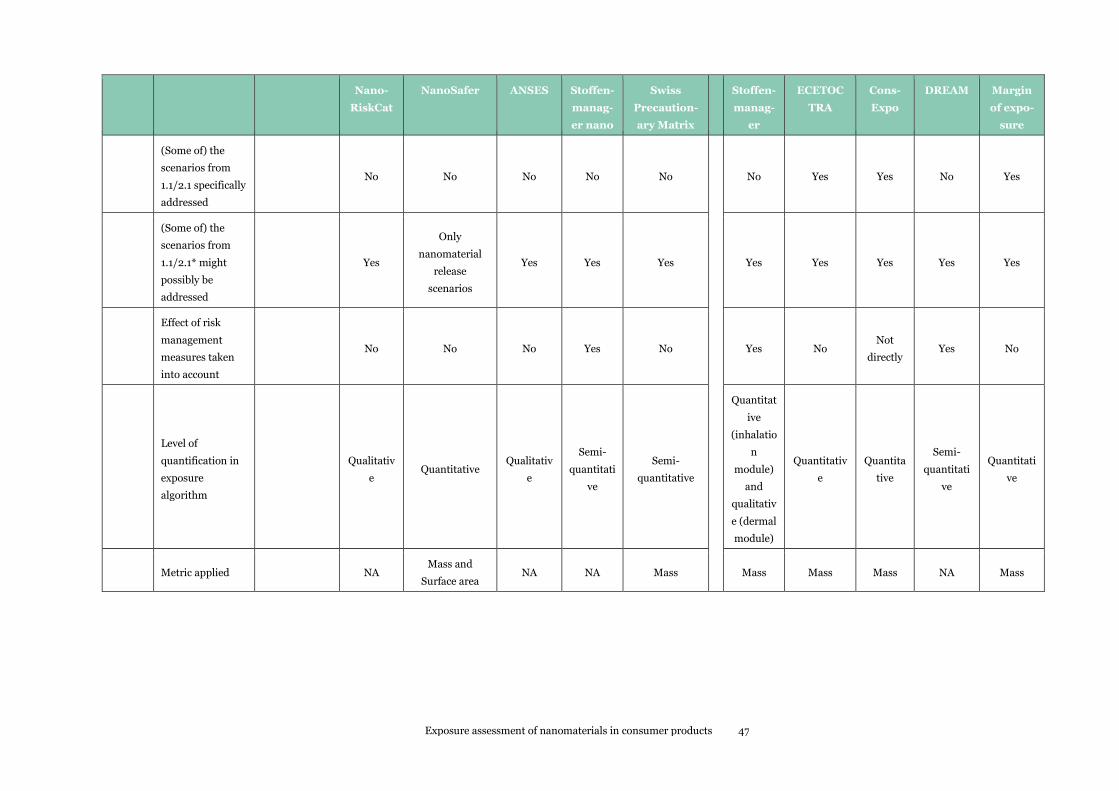
Exposure assessment of nanomaterials in consumer products 47
Nano-
RiskCat
NanoSafer ANSES Stoffen-
manag-
er nano
Swiss
Precaution-
ary Matrix
Stoffen-
manag-
er
ECETOC
TRA
Cons-
Expo
DREAM Margin
of expo-
sure
(Some of) the
scenarios from
1.1/2.1 specifically
addressed
No No No No No
No Yes Yes No Yes
(Some of) the
scenarios from
1.1/2.1* might
possibly be
addressed
Yes
Only
nanomaterial
release
scenarios
Yes Yes Yes Yes Yes Yes Yes Yes
Effect of risk
management
measures taken
into account
No No No Yes No Yes No
Not
directly Yes No
Level of
quantification in
exposure
algorithm
Qualitativ
e Quantitative
Qualitativ
e
Semi-
quantitati
ve
Semi-
quantitative
Quantitat
ive
(inhalatio
n
module)
and
qualitativ
e (dermal
module)
Quantitativ
e
Quantita
tive
Semi-
quantitati
ve
Quantitati
ve
Metric applied
NA
Mass and
Surface area NA NA Mass Mass Mass Mass NA Mass
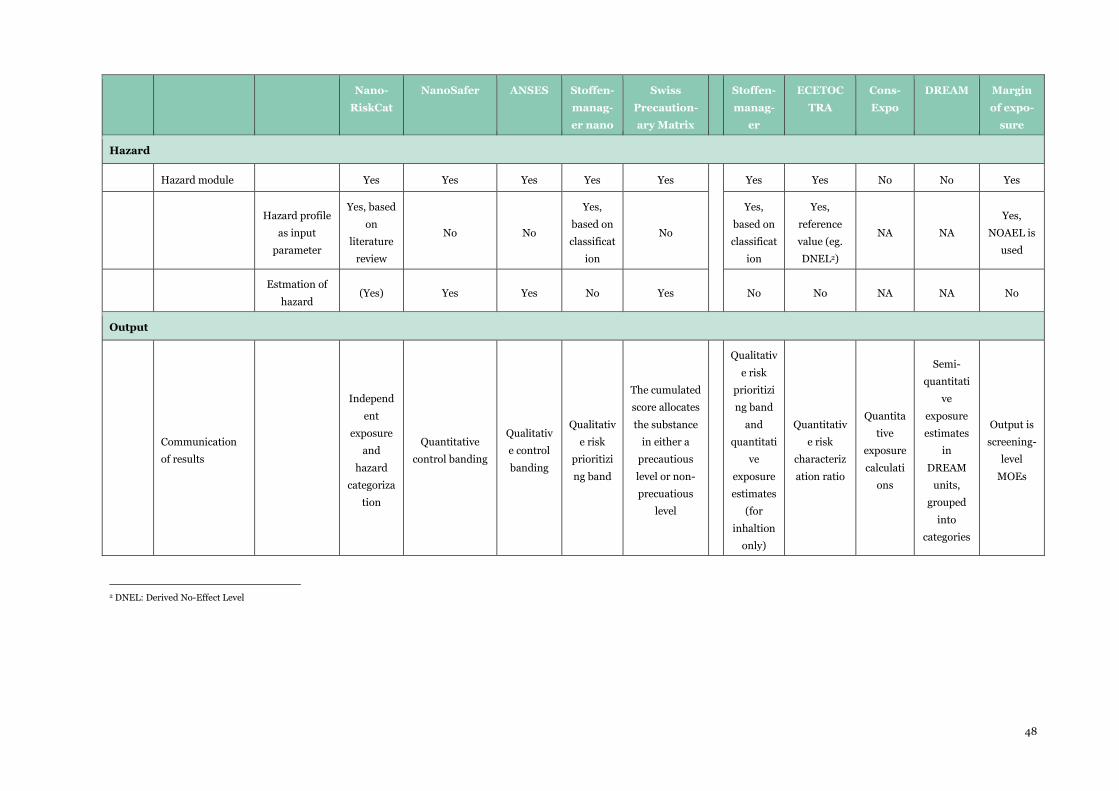
48
Nano-
RiskCat
NanoSafer ANSES Stoffen-
manag-
er nano
Swiss
Precaution-
ary Matrix
Stoffen-
manag-
er
ECETOC
TRA
Cons-
Expo
DREAM Margin
of expo-
sure
Hazard
Hazard module
Yes Yes Yes Yes Yes
Yes Yes No No Yes
Hazard profile
as input
parameter
Yes, based
on
literature
review
No No
Yes,
based on
classificat
ion
No
Yes,
based on
classificat
ion
Yes,
reference
value (eg.
DNEL2)
NA NA
Yes,
NOAEL is
used
Estmation of
hazard (Yes) Yes Yes No Yes No No NA NA No
Output
Communication
of results
Independ
ent
exposure
and
hazard
categoriza
tion
Quantitative
control banding
Qualitativ
e control
banding
Qualitativ
e risk
prioritizi
ng band
The cumulated
score allocates
the substance
in either a
precautious
level or non-
precuatious
level
Qualitativ
e risk
prioritizi
ng band
and
quantitati
ve
exposure
estimates
(for
inhaltion
only)
Quantitativ
e risk
characteriz
ation ratio
Quantita
tive
exposure
calculati
ons
Semi-
quantitati
ve
exposure
estimates
in
DREAM
units,
grouped
into
categories
Output is
screening-
level
MOEs
2 DNEL: Derived No-Effect Level
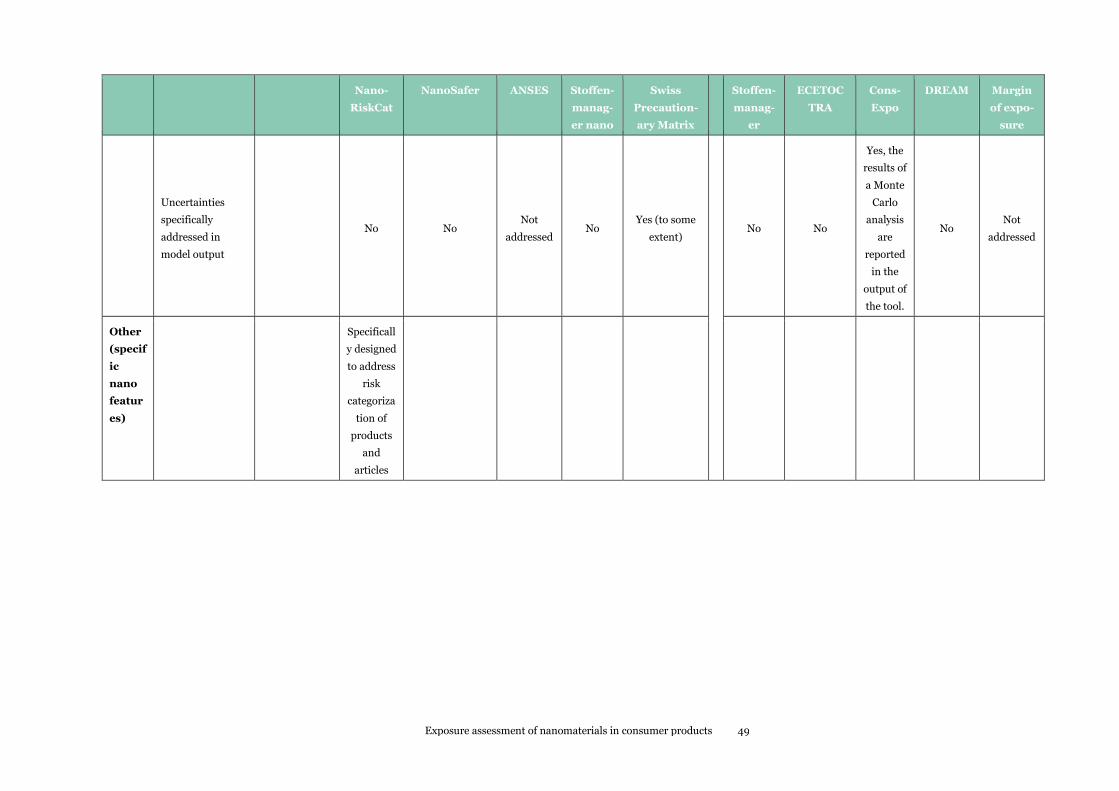
Exposure assessment of nanomaterials in consumer products 49
Nano-
RiskCat
NanoSafer ANSES Stoffen-
manag-
er nano
Swiss
Precaution-
ary Matrix
Stoffen-
manag-
er
ECETOC
TRA
Cons-
Expo
DREAM Margin
of expo-
sure
Uncertainties
specifically
addressed in
model output
No No
Not
addressed No
Yes (to some
extent)
No No
Yes, the
results of
a Monte
Carlo
analysis
are
reported
in the
output of
the tool.
No Not
addressed
Other
(specif
ic
nano
featur
es)
Specificall
y designed
to address
risk
categoriza
tion of
products
and
articles
50
Table 3-1 is divided in two parts, with the first five tools specifically developed for assessment of
nanomaterials. The five more general tools in the right side of the table are included in the
assessment as they with appropriate caution might be used to assess exposure to nanomaterials.
3.2.1 Nano-specific tools
It was found that all the nano-specific tools are “Low Tier” tools, i.e. generally rather conservative
with low level of complexity. Except for NanoSafer, the nano-specific tools use qualitative/semi-
quantitative algorithms to reach conclusions. All tools lead to an output that either prioritise/rank
or places a nanomaterial/nanoproduct in a control banding category. Control banding refers to
categorising exposure scenarios in relation to recommended risk management.
It should be noted that all nano-specific tools have exposure as well as hazard modules thus leading
to “risk-based” approaches, where some of the non-nano-specific tools discussed below only
address exposure.
In relation to possible further application of these tools in this project, it should be stressed that the
tools are generally not designed to explicitly confirm “no risk”, but rather to prioritise areas for
exposure/risk reduction. On the other hand, one might implicitly assume that “non-
prioritisation”/”low banding” could indicate low/no risk, also considering that the tools generally
apply conservative approaches. To this end, it should be stressed that the ANSES, NanoSafer,
NanoRiskCat, and Stoffenmanager Nano tools - due to the absence of nano-specific data - also apply
hazard data for the nearest analogue macro/bulk compound. Although such macro/bulk data are
applied in a way that the final hazard score of the nanomaterials is higher than for the macro/bulk
form, it should be noted that nanoforms might possess hazards, which are not identified based on
the hazard profile for the macro/bulk form and the physicochemical hazard indicators. Depending
on the level of precautionary approach taken, these potential unknown hazards, e.g. carcinogenicity
or mutagenicity, could have graver implications than estimated.
The issue of exposure and dose metric is less relevant for the qualitative/semi-quantitative tools as
these are inherently not operating with exposure estimates or dose descriptors, whereas it should be
noted that the more quantitative NanoSafer tool includes the nano-relevant surface area metric in
the final estimation of risk level.
None of the nano-specific tools has fully “built-in” default exposure scenarios for the selected
product categories and exposure scenarios identified in Chapter 2. Stoffenmanager Nano is
currently the only nano-specific tools pursuing this approach by requesting selection of source
domains in the start of the assessment. The other nano-specific tools assess specific exposure and
use scenarios using a combination of various input criteria, which often include various formats of
emission potential/release potential, amount, duration, and frequency. It is upfront considered that
all nano-specific tools possibly might be used to assess (some of) the exposure scenarios associated
to the product categories identified in Chapter 2. In this context, it should be stressed that three of
the tools are explicitly developed to be used in an occupational context and thus quite some
modifications of default parameters/approaches may have to be made in order to properly address
nanomaterials in consumer products. It should also be noted that three of the tools only address
inhalation, whereas the two risk categorization tools, NanoRiskCat and the Swiss Precautionary
Matrix, address the overall exposure potential, however without differentiating into the various
exposure routes. Thus, none of the nano-specific tools explicitly address eye, oral and dermal
exposure.
3.2.2 General (non-nano) tools
A number of tools for regulatory risk assessment of chemicals in general (Stoffenmanager, ECETOC
TRA and ConsExpo) have also been assessed in this project as e.g. the NANEX project and the
nano-specific REACH guidance indicate that these tools might be applicable (with caution) in the
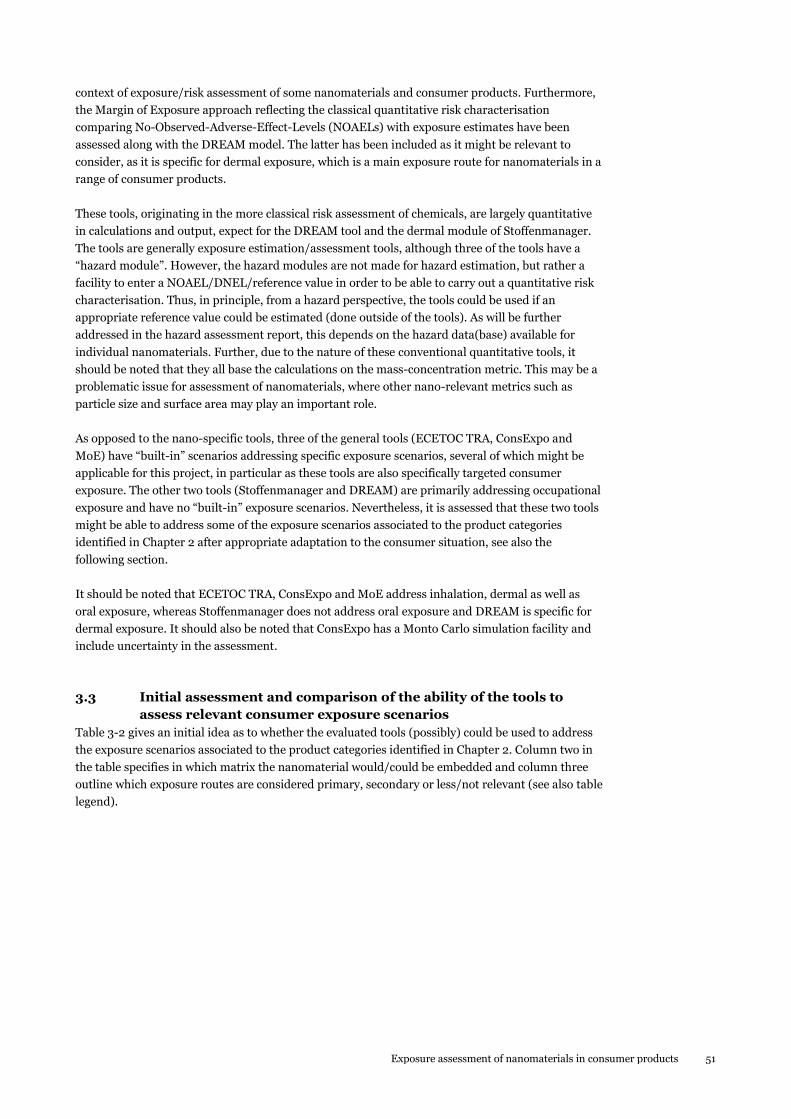
Exposure assessment of nanomaterials in consumer products 51
context of exposure/risk assessment of some nanomaterials and consumer products. Furthermore,
the Margin of Exposure approach reflecting the classical quantitative risk characterisation
comparing No-Observed-Adverse-Effect-Levels (NOAELs) with exposure estimates have been
assessed along with the DREAM model. The latter has been included as it might be relevant to
consider, as it is specific for dermal exposure, which is a main exposure route for nanomaterials in a
range of consumer products.
These tools, originating in the more classical risk assessment of chemicals, are largely quantitative
in calculations and output, expect for the DREAM tool and the dermal module of Stoffenmanager.
The tools are generally exposure estimation/assessment tools, although three of the tools have a
“hazard module”. However, the hazard modules are not made for hazard estimation, but rather a
facility to enter a NOAEL/DNEL/reference value in order to be able to carry out a quantitative risk
characterisation. Thus, in principle, from a hazard perspective, the tools could be used if an
appropriate reference value could be estimated (done outside of the tools). As will be further
addressed in the hazard assessment report, this depends on the hazard data(base) available for
individual nanomaterials. Further, due to the nature of these conventional quantitative tools, it
should be noted that they all base the calculations on the mass-concentration metric. This may be a
problematic issue for assessment of nanomaterials, where other nano-relevant metrics such as
particle size and surface area may play an important role.
As opposed to the nano-specific tools, three of the general tools (ECETOC TRA, ConsExpo and
MoE) have “built-in” scenarios addressing specific exposure scenarios, several of which might be
applicable for this project, in particular as these tools are also specifically targeted consumer
exposure. The other two tools (Stoffenmanager and DREAM) are primarily addressing occupational
exposure and have no “built-in” exposure scenarios. Nevertheless, it is assessed that these two tools
might be able to address some of the exposure scenarios associated to the product categories
identified in Chapter 2 after appropriate adaptation to the consumer situation, see also the
following section.
It should be noted that ECETOC TRA, ConsExpo and MoE address inhalation, dermal as well as
oral exposure, whereas Stoffenmanager does not address oral exposure and DREAM is specific for
dermal exposure. It should also be noted that ConsExpo has a Monto Carlo simulation facility and
include uncertainty in the assessment.
3.3 Initial assessment and comparison of the ability of the tools to
assess relevant consumer exposure scenarios
Table 3-2 gives an initial idea as to whether the evaluated tools (possibly) could be used to address
the exposure scenarios associated to the product categories identified in Chapter 2. Column two in
the table specifies in which matrix the nanomaterial would/could be embedded and column three
outline which exposure routes are considered primary, secondary or less/not relevant (see also table
legend).
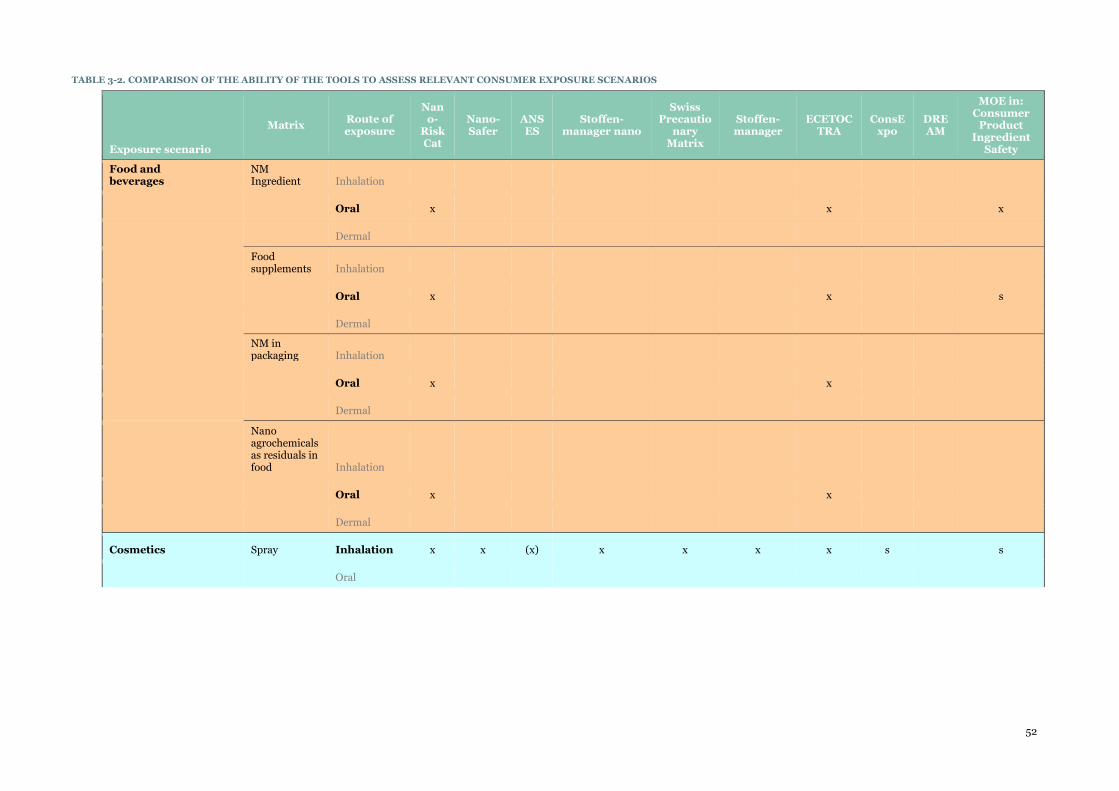
52
TABLE 3-2. COMPARISON OF THE ABILITY OF THE TOOLS TO ASSESS RELEVANT CONSUMER EXPOSURE SCENARIOS
Exposure scenario
Matrix Route of exposure
Nano-
RiskCat
Nano-Safer
ANSES
Stoffen-manager nano
Swiss Precautio
nary Matrix
Stoffen-manager
ECETOC TRA
ConsExpo
DREAM
MOE in: Consumer
Product Ingredient
Safety
Food and beverages
NM Ingredient Inhalation
Oral x x x
Dermal
Food supplements Inhalation
Oral x x s
Dermal
NM in packaging Inhalation
Oral x x
Dermal
Nano agrochemicals as residuals in food Inhalation
Oral x x
Dermal
Cosmetics Spray Inhalation x x (x) x x x x s s
Oral
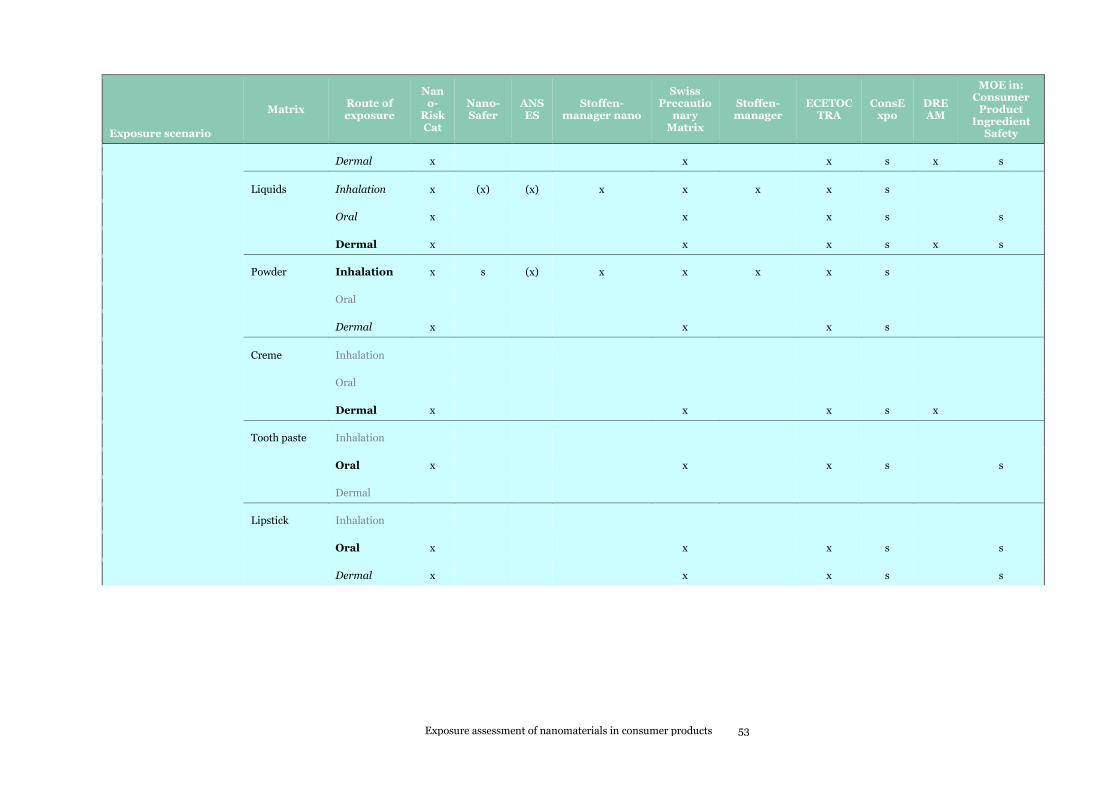
Exposure assessment of nanomaterials in consumer products 53
Exposure scenario
Matrix Route of exposure
Nano-
RiskCat
Nano-Safer
ANSES
Stoffen-manager nano
Swiss Precautio
nary Matrix
Stoffen-manager
ECETOC TRA
ConsExpo
DREAM
MOE in: Consumer
Product Ingredient
Safety
Dermal x x x s x s
Liquids Inhalation x (x) (x) x x x x s
Oral x x x s s
Dermal x x x s x s
Powder Inhalation x s (x) x x x x s
Oral
Dermal x x x s
Creme Inhalation
Oral
Dermal x x x s x
Tooth paste Inhalation
Oral x x x s s
Dermal
Lipstick Inhalation
Oral x x x s s
Dermal x x x s s
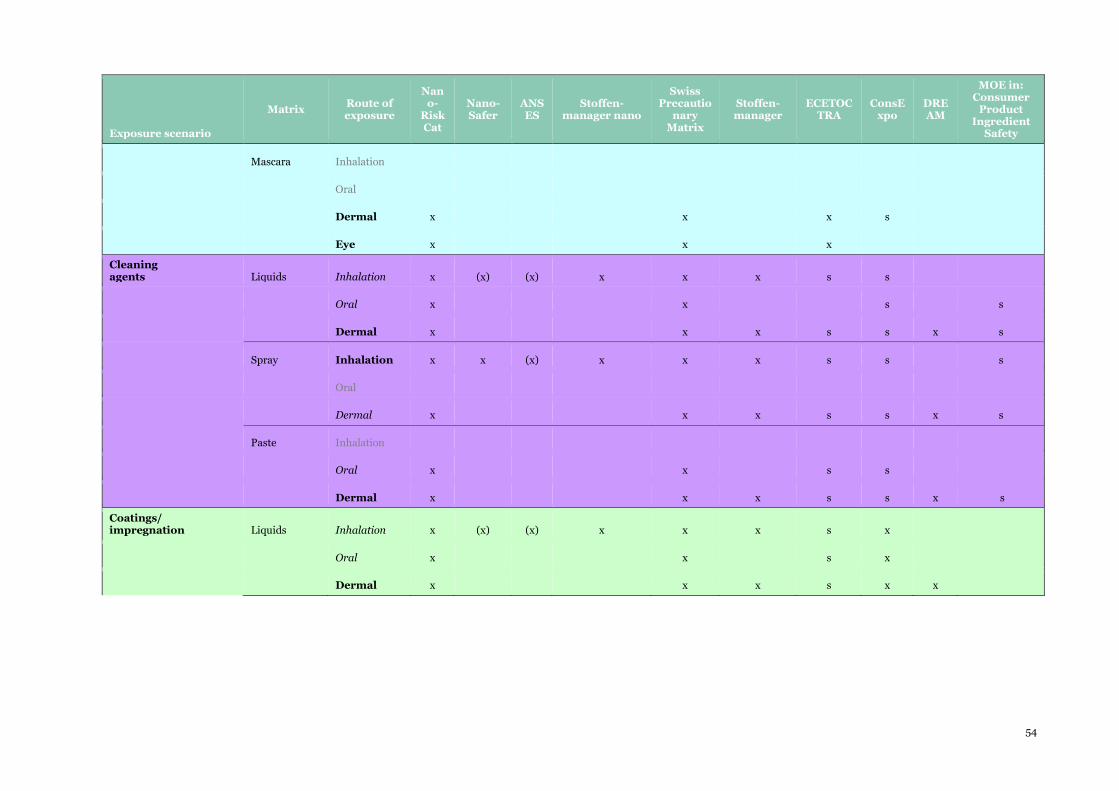
54
Exposure scenario
Matrix Route of exposure
Nano-
RiskCat
Nano-Safer
ANSES
Stoffen-manager nano
Swiss Precautio
nary Matrix
Stoffen-manager
ECETOC TRA
ConsExpo
DREAM
MOE in: Consumer
Product Ingredient
Safety
Mascara Inhalation
Oral
Dermal x x x s
Eye x x x
Cleaning agents Liquids Inhalation x (x) (x) x x x s s
Oral x x s s
Dermal x x x s s x s
Spray Inhalation x x (x) x x x s s s
Oral
Dermal x x x s s x s
Paste Inhalation
Oral x x s s
Dermal x x x s s x s
Coatings/ impregnation Liquids Inhalation x (x) (x) x x x s x
Oral x x s x
Dermal x x x s x x
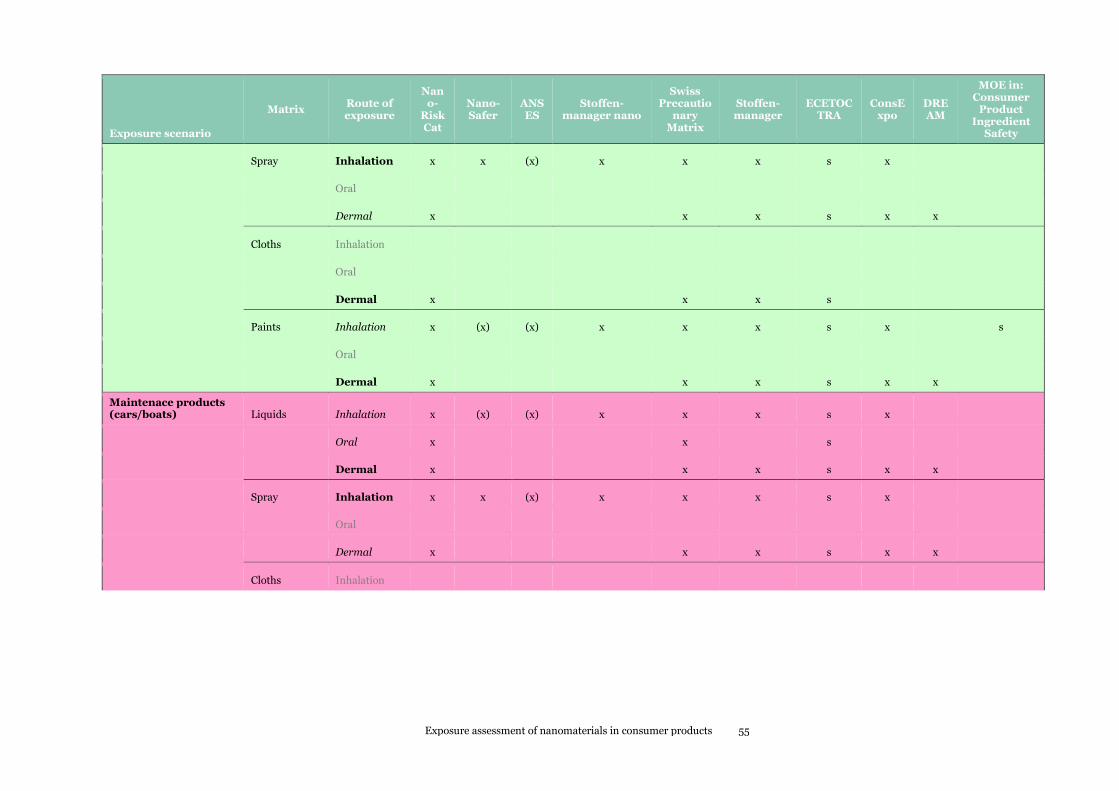
Exposure assessment of nanomaterials in consumer products 55
Exposure scenario
Matrix Route of exposure
Nano-
RiskCat
Nano-Safer
ANSES
Stoffen-manager nano
Swiss Precautio
nary Matrix
Stoffen-manager
ECETOC TRA
ConsExpo
DREAM
MOE in: Consumer
Product Ingredient
Safety
Spray Inhalation x x (x) x x x s x
Oral
Dermal x x x s x x
Cloths Inhalation
Oral
Dermal x x x s
Paints Inhalation x (x) (x) x x x s x s
Oral
Dermal x x x s x x
Maintenace products (cars/boats) Liquids Inhalation x (x) (x) x x x s x
Oral x x s
Dermal x x x s x x
Spray Inhalation x x (x) x x x s x
Oral
Dermal x x x s x x
Cloths Inhalation
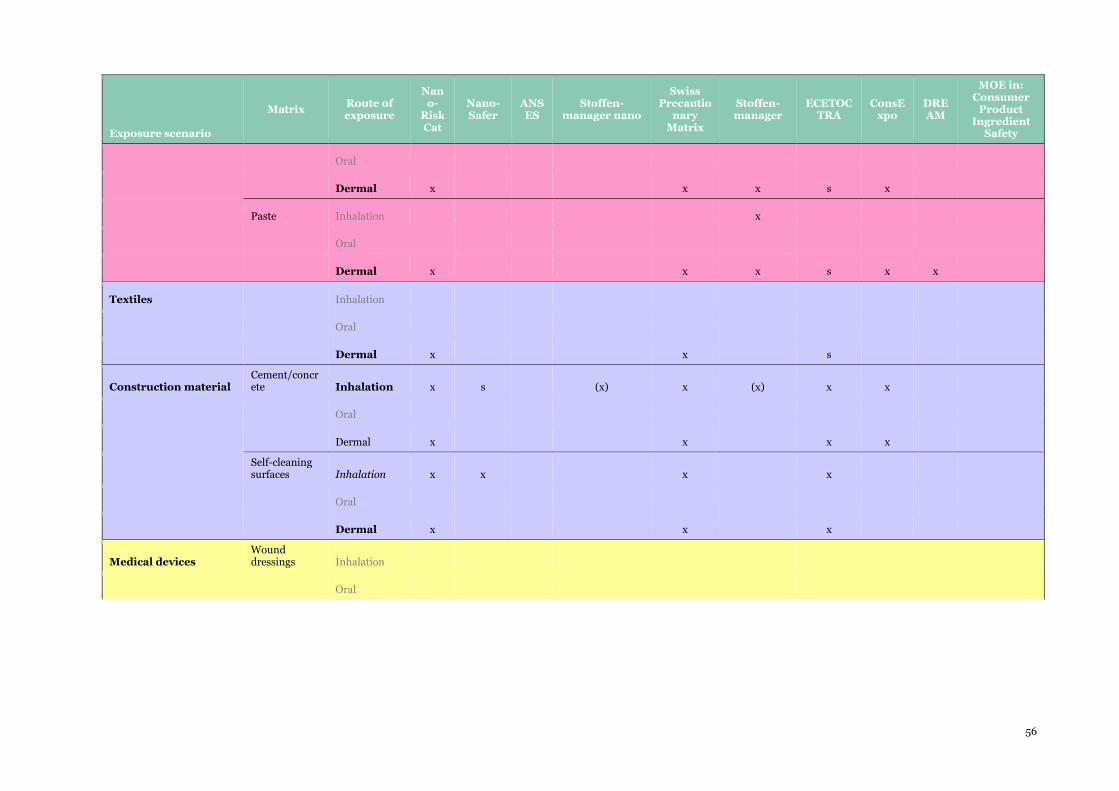
56
Exposure scenario
Matrix Route of exposure
Nano-
RiskCat
Nano-Safer
ANSES
Stoffen-manager nano
Swiss Precautio
nary Matrix
Stoffen-manager
ECETOC TRA
ConsExpo
DREAM
MOE in: Consumer
Product Ingredient
Safety
Oral
Dermal x x x s x
Paste Inhalation x
Oral
Dermal x x x s x x
Textiles Inhalation
Oral
Dermal x x s
Construction material Cement/concrete Inhalation x s (x) x (x) x x
Oral
Dermal x x x x
Self-cleaning surfaces Inhalation x x x x
Oral
Dermal x x x
Medical devices Wound dressings Inhalation
Oral
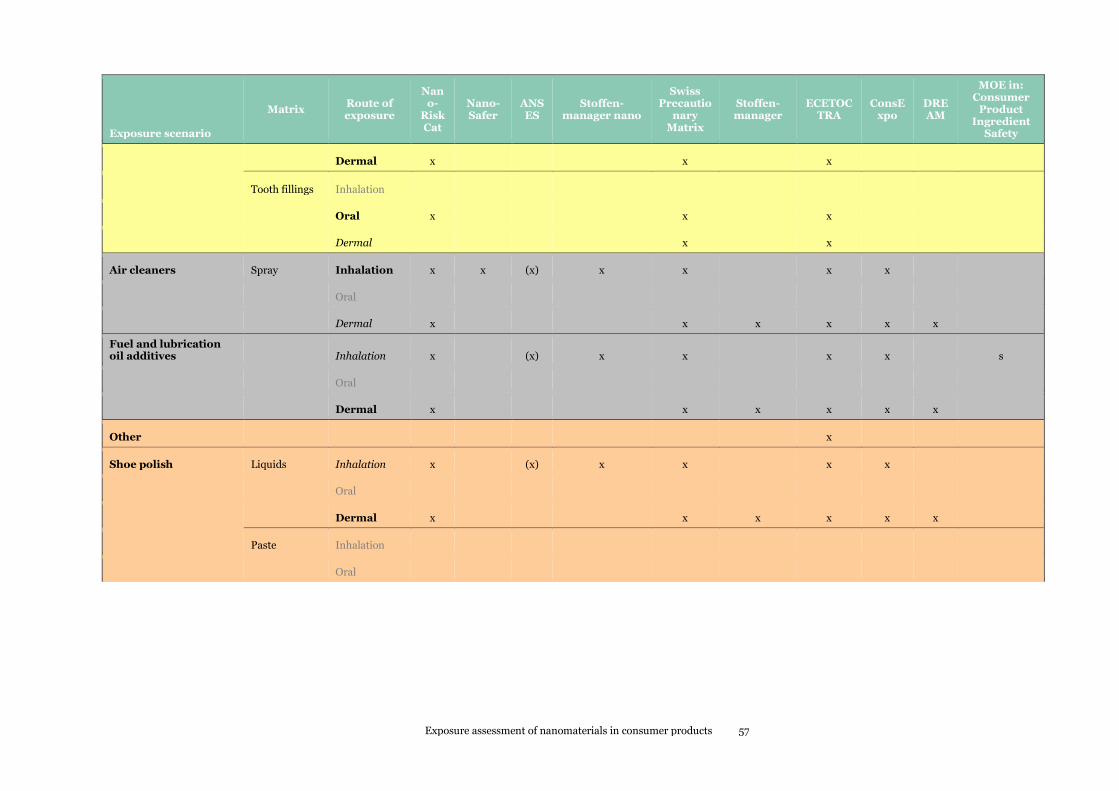
Exposure assessment of nanomaterials in consumer products 57
Exposure scenario
Matrix Route of exposure
Nano-
RiskCat
Nano-Safer
ANSES
Stoffen-manager nano
Swiss Precautio
nary Matrix
Stoffen-manager
ECETOC TRA
ConsExpo
DREAM
MOE in: Consumer
Product Ingredient
Safety
Dermal x x x
Tooth fillings Inhalation
Oral x x x
Dermal x x
Air cleaners Spray Inhalation x x (x) x x x x
Oral
Dermal x x x x x x
Fuel and lubrication oil additives Inhalation x (x) x x x x s
Oral
Dermal x x x x x x
Other x
Shoe polish Liquids Inhalation x (x) x x x x
Oral
Dermal x x x x x x
Paste Inhalation
Oral
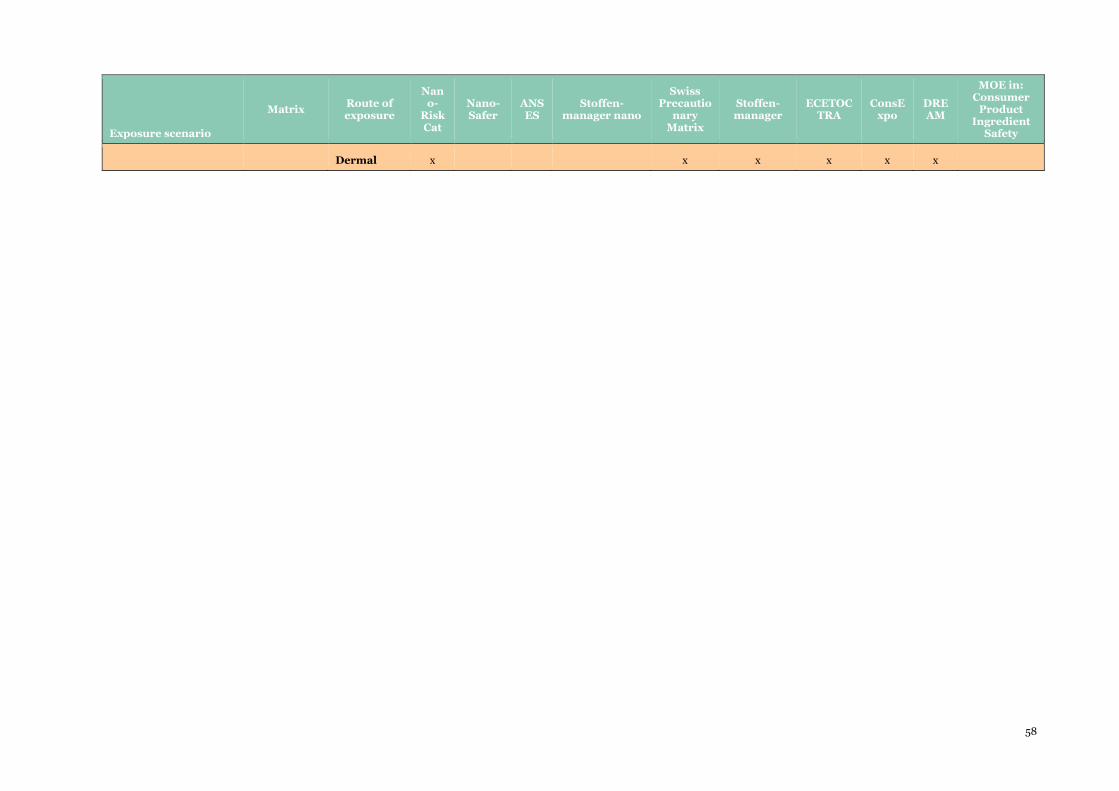
58
Exposure scenario
Matrix Route of exposure
Nano-
RiskCat
Nano-Safer
ANSES
Stoffen-manager nano
Swiss Precautio
nary Matrix
Stoffen-manager
ECETOC TRA
ConsExpo
DREAM
MOE in: Consumer
Product Ingredient
Safety
Dermal x x x x x x
Exposure assessment of nanomaterials in consumer products 59
Legend: The table has been populated to indicate the initial results from our assessment and define whether a
given tool:
specifically “s” address the exposure scenario (with default description and assumptions for that specific
scenario),
might with caution “x” address the exposure scenario, or
might with doubt (even further caution) “(x)” address the exposure scenario.
From this initial assessment, the results illustrate e.g.:
That most tools have limited coverage in terms of exposure routes (as already indicated above).
Inhalation exposure is the focus in most of the tools intended for exposure (control-banding-
like) assessment of nanomaterials;
That only some of the general tools (ECETOC TRA, ConsExpo and MoE) have relevant “built-
in” consumer exposure scenarios “s” indications. However, none of these scenarios and
exposure profiles appear to consider exposure to nanomaterials and use of nano-products;
except for ConsExpo, which has the possibility to include size-distribution information. None
of the tools appear to be readily applicable to assess the exposure due to use of select
construction materials, medical devices, shoe polish and release from abrasion (matrix)
nanocomposites;
That common products such as cleaning agents, coatings/impregnation and maintenance
products could potentially be addressed by several of the tools. Still, however, the tools make
mass-based assessments and nanomaterial aspects are in principle not covered;
That less detailed/generic tools such as the NanoRiskCat and the Swiss Precautionary Matrix
could potentially be used for many/most types of exposure scenarios. One drawback with these
risk categorization tools is that they might be too broad/ conservative in their scaling to be
applied for risk assessment and that they do not e.g. specifically address the relevant exposure
routes and levels of exposure.
That combination of different modified and further developed tools may enable a framework
for semi-quantitative risk assessment of several types of consumer products and exposure
scenarios.
Overall, the results in this section are preliminary and cannot be seen in isolation from the details in
the templates in Appendix 5. Sometimes the devil is in the detail and only actual application of the
tools on the exposure scenarios to be selected might reveal whether it actually makes sense to use a
given tool. Among the critical aspects is whether the hazard of a specific compound is assessed and
defined using mass as the exposure metric and that sufficient comparability exists between the
exposure characteristics in the use-phase agree with the exposure characteristics used in the
toxicological tests.
3.4 Conclusions and considerations for the way forward
The overall learning from this activity is that the assessed tools vary considerably in terms of
coverage, scope/approach, level of quantification, populations and exposure routes addressed etc.
The nano-specific tools are generally rather qualitative, but also not specifically designed to assess
whether there necessarily is a true risk, but rather to indicate where there could be a risk and how
strong indications it has, which could be subject to risk mitigation. Further, none of the
nanomaterial exposure assessment tools addresses eye, dermal and oral exposure specifically. The
need for change in risk assessment paradigm from mass to particle-size-distribution, number
concentration and specific surface area for these exposure routes needs to be documented and await
conclusions from the hazard assessment activities of this project. In contrast, the general (non
nano-specific tools) are generally rather quantitative with a wider coverage, e.g. in terms of
exposure routes addressed. Noteworthy, the exposure assessment algorithms in most of the non
nano-specific tools are simpler and more conservative than the algorithms in the most advanced
nano-specific tools.
60
No single tool will enable a harmonised proper exposure assessment for all nano-products.
Significant work effort will be required to further develop the tools with modification for
incorporating nano-specific properties and harmonizing the output, not mentioning its validation.
The results show that selection/adaptation of one tool (as speculated in the project specifications)
will be a major effort, which is out of the scope of the current project. One could speculate whether
alternative approaches could/should be taken, such as:
Assess some of the selected scenarios with all the tools (to the extent possible, e.g. considering
data availability and tool coverage) and based on this make an expert based qualitative
assessment
Whether to apply (components of) several tools as appropriate
Whether the project at all should apply the assessed tools, but rather perform a case-by-case
expert assessment of each of the selected scenarios.
Based on discussions with the external expert panel, it was suggested to follow a combination of the
second and third option depending on the data-availability and the scenarios. The exact procedures
for assessment of the consumer risk in the final phases of the project will depend on the specific
scenarios to be addressed, as well as the specific exposure and hazard data that might be available
(identified in other part of this project). Chapter 4 will built further on the results from this activity
in terms of specifying the most important exposure parameters needed for exposure assessment
and subsequent chapters will address how such data could be applied.
Exposure assessment of nanomaterials in consumer products 61
4. Exposure assessment and key factors affecting exposure
4.1 Objective
The objective of this chapter is to provide an overview of the knowledge needed to conduct a reliable
conservative exposure assessment for a nanomaterial used in a consumer product/article. The most
important factors/ parameters determining the consumer exposure will be identified and described
in more detail taking the relevant product and article use scenarios into consideration for the
various exposure routes.
To achieve this goal the first part of this chapter describes the learnings that can be obtained from
relevant guidance and, tools for exposure assessment to chemicals, in consumer products and
articles, as well as from guidance and tools specifically addressing exposure to nanomaterials.
The following guidance and tools were assessed for identifying the most important factors/
parameters determining consumer exposure:
- RIVM (2009) Exposure to nanomaterials in consumer products
- REACH guidance on exposure assessment from chemical products and articles
- SCCS guidance on nanomaterials in cosmetics
- EFSA guidance on nanomaterials in food
- Environmental Defense – DuPont approach
- ECETOC TRA
- ConsExpo
- NanoSafer
- NanoRiskCat
- Stoffenmanager
- Stoffenmanager Nano
- ANSES
- Swiss Precautionary matrix
- Dream
- Margin of exposure concept
This chapter governs greatly from the learnings from the descriptions of the risk assessment tools in
Chapter 3. However, in this chapter the focus will be on the exposure part of the tools that will be
described in more detail to identify methods and algorithms of the tools and to identify parameters
most relevant for assessing exposure to nanomaterials from consumer products.
Together with the findings in Chapter 3, it will then be possible to select the most relevant tools for
exposure and risk assessment of 20 specific scenarios that will be selected in Chapter 6.
As mentioned in Chapter 2, RIVM (2009) has already performed an analysis of consumer exposure
to nanomaterials. Key parameters were identified in the RIVM (2009) study and these key
62
parameters will form a benchmark reference in the current analysis of the other guidance and tools.
Thus, descriptions and evaluations of the other guidance and tools will be made and it will be
evaluated whether additional important exposure parameters can be identified.
Learning from this exercise is important to identify the most critical exposure parameters for either
a qualitative or a semi-quantitative approach for assessing consumer exposure to nanomaterials
from nano-products within this project.
Note to the reader: If the reader wishes to study the detailed descriptions of single guidelines and
tools, please see Appendix 6 in the appendix report. Below the overall findings from the review of the tools and guidelines are given.
4.2 Overall findings from the search on relevant exposure parameters
4.2.1 Identification of exposure parameters
From the overview of guidance documents and tools used for exposure assessment, several key
characteristics and parameters can be identified as important for a qualitative, semi-quantitative
and/or quantitative assessment of exposure to nanomaterials. Below parameters are listed starting
with parameters identified by RIVM (2009) and supplemented by further (sub-) parameters that
have been used by others. The parameters in italics indicate parameters primarily for qualitative
exposure assessment, whereas parameters in bold indicate quantifiable parameters to be
important for (semi-)quantitative assessment of nanomaterials. If a parameter specifically
addresses an exposure route this exposure route is indicated in a bracket ( ).
RIVM (2009) (consumer exposure, nanomaterials):
The following parameters as starting point for estimating consumer nanomaterial exposure are
given:
- Chemical ID - Shape of nanomaterial
- Physical location/type of product (Free/ fixed nanomaterial)
- Product matrix/form/application (e.g. spray/ liquid/ solid)
- Direct/ indirect or indoor/outdoor exposure
- Exposure route (dermal, oral, inhalation)
- Concentration
- Exposure (event) duration
- Frequency of use
REACH guidance (consumer exposure, chemicals in general):
This guidance addresses further the following parameters in order to quantify consumer exposure:
- Type of activity or processes
- Level of containment of the process
- Fugacity, dustiness, volatility
- Package design (e.g. design for decreasing exposure potential)
- Amount/ volume per use
- Dilution of the product during use
- Thickness of (diluted) product layer (dermal exp)
- Surface area exposed (dermal exp)
- Fraction remaining on skin / retention factor (dermal exp)
- Migration factor (dermal exp)
- Fraction of used amount that is ingested (oral exp)
- Concentration in air (inhalation)
Exposure assessment of nanomaterials in consumer products 63
- Ventilation rate of exposed person (inhalation)
SCCS (2012a) guidance (nanomaterials, cosmetics):
Further addresses:
- Method of application (rather similar to type of activity or processes)
- Foreseeable misuse
- Target groups (e.g. children or people with skin disease/ sensitive skin),
- Mass generation rate into air (spray, inhalation)
- Airborne fraction (inhalation)
- Aerosol size distribution (inhalation)
-
EFSA (2011a) guidance (nanomaterials, food):
- Consumption data on food items (median and high oral exposures)
ECETOC TRA (consumer exposure, chemicals):
- Transfer factor (may be comparable to migration factor) from matrix to
dermal or gastro-intestinal tissue (oral and dermal exposure)
- Dilution factor in air in relation to fraction released to air (inhalation)
ConsExpo (consumer exposure, chemicals):
In principle no further parameters are added but sub-parameters for more advanced and exact
consumer exposure calculations are considered, e.g. for calculation of concentration in air where
room size, room ventilation rate, particle size distributions are taken into account.
Nanosafer (occupational inhalation exposure, nanomaterials):
Nanosafer specifies some further parameters in relation to occupational inhalational exposure to
nanomaterials during manufacture/ processing and industrial use:
- Coated/ surface modified nanomaterial
- Specific density
- Specific surface area
- Water solubility of nanomaterial
- Dimension of nanomaterial
- Handling energy
- Constant release rate
- Respirable dustiness
NanoRiskCat (consumer exposure, nanomaterials):
No further parameters are addressed in relation to consumer exposure to nanomaterials but the
semi-quantitative exposure evaluations are made based on type of product/product use and to
which extent the nanomaterial is considered free or matrix bound.
Swiss Precautionary Matrix (general exposure potential, nanomaterials):
For the semi-quantitative exposure estimation, the matrix further addresses:
- Release factors with respect to nanomaterial release from various matrices
Stoffenmanager + Stoffenmanager Nano (occupational inhalation exposure, chemicals +
nanomaterials):
In order to grade the occupational inhalational exposure levels, additional parameters are
mentioned:
64
- Exposure reduction factor associated to control measures
- Exposure reduction factor associated to use of personal protective equipment
- Distance from task (inhalation) (e.g. within or out-site the near-field breathing zone.;
may be comparable to a dilution factor)
ANSES (occupational inhalation exposure, nanomaterials):
For occupational inhalational exposure assessment in relation to control banding, further factors in
relation to liberation of nanomaterials from solids are considered:
- Friable solids (release of nanomaterial under low stress)
- Dust generated by external forces (e.g. mechanical, electrical, laser forces)(inhalation)
- Melting?
- Dispersion in liquid
Dream (occupational dermal exposure, chemicals):
Addresses issues in relation of emission to clothing and deposition on skin and clothing for ranking
dermal exposure potential:
- Probability and intensity of dermal exposure routes (emission, transfer and deposition)
(per body part)
- Use of clothing (per body part) (covered vs. uncovered body parts, clothing material,
repeated use of clothing)
- Emission to clothing and uncovered skin; and immersion of skin into agent (unlikely,
occasionally, repeatedly, almost constantly)
- Intensity (= amount of agent) of emission
- Exposure route factors (= either emission, deposition, transfer)
- Probability of deposition on clothing and uncovered skin
- Intensity of deposition on clothing and uncovered skin
- Transfer to clothing and uncovered skin : Contact with surfaces, or tools, occurs:
- Intensity of transfer: Contamination level of contact surface
Margin of exposure concept (consumer exposure, chemicals):
Does not address further parameters for external exposure assessment as already covered above.
4.2.2 Conclusions
4.2.2.1 Exposure parameters
When having an overall look of these parameters it is clear that some parameters are sub-
parameters to other parameters: E.g., an air measured air concentration can be used directly for a
rather precise exposure assessment. If the concentration in air has to be estimated this can be done
either by using simple assumptions and few parameters or by using a more advanced approach
using several sub-parameters that are equally important for determining concentration in air. The
estimation can be done at a tier 0 level using only used amount of a spray for instance divided by
the volume of a room. However for higher tier assessment further parameters my advance this
estimate using parameters such as the distance between the spray nozzle and the breathing zone,
rate of emission from the spray, rate of deposition of the various particle sizes generated, room
ventilation rate and so on.
So when looking for parameters for qualitative/semi-quantitative exposure estimation for more
general consumer exposure scenarios the focus would be on the more overall parameters, whereas
the additional sub-parameters are important when making a more quantitative exposure
assessment of a specific exposure scenario.
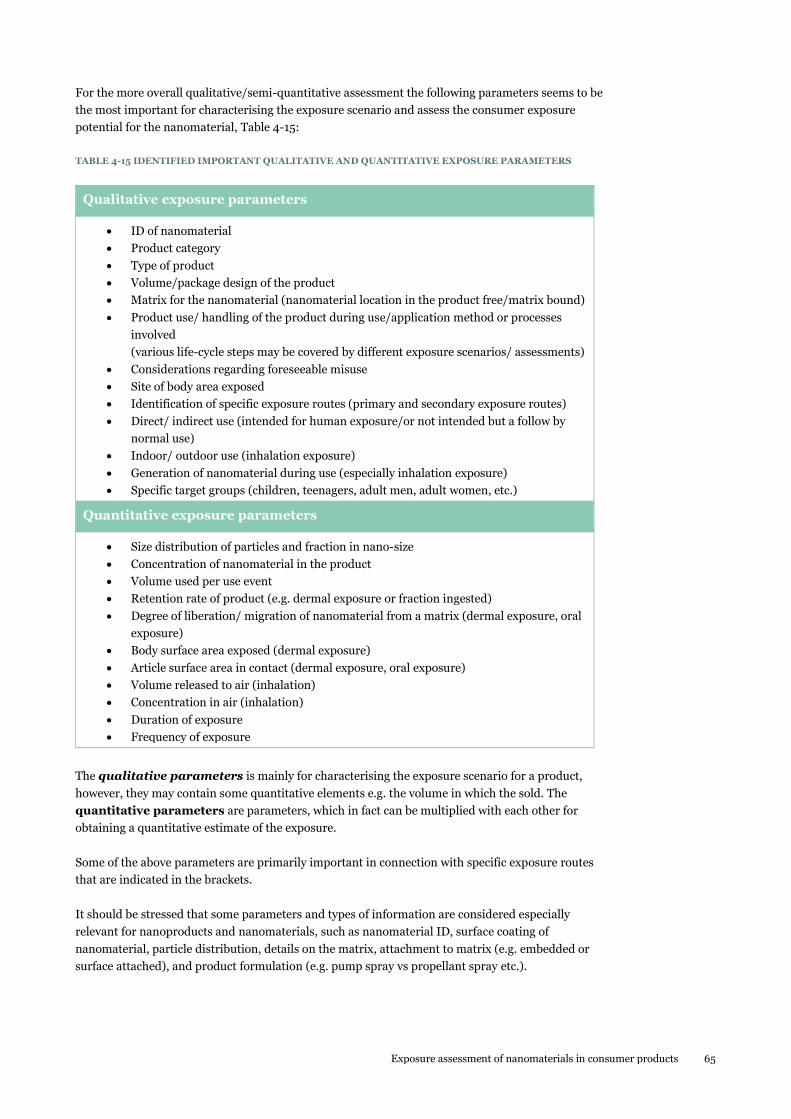
Exposure assessment of nanomaterials in consumer products 65
For the more overall qualitative/semi-quantitative assessment the following parameters seems to be
the most important for characterising the exposure scenario and assess the consumer exposure
potential for the nanomaterial, Table 4-15:
TABLE 4-15 IDENTIFIED IMPORTANT QUALITATIVE AND QUANTITATIVE EXPOSURE PARAMETERS
Qualitative exposure parameters
ID of nanomaterial
Product category
Type of product
Volume/package design of the product
Matrix for the nanomaterial (nanomaterial location in the product free/matrix bound)
Product use/ handling of the product during use/application method or processes
involved
(various life-cycle steps may be covered by different exposure scenarios/ assessments)
Considerations regarding foreseeable misuse
Site of body area exposed
Identification of specific exposure routes (primary and secondary exposure routes)
Direct/ indirect use (intended for human exposure/or not intended but a follow by
normal use)
Indoor/ outdoor use (inhalation exposure)
Generation of nanomaterial during use (especially inhalation exposure)
Specific target groups (children, teenagers, adult men, adult women, etc.)
Quantitative exposure parameters
Size distribution of particles and fraction in nano-size
Concentration of nanomaterial in the product
Volume used per use event
Retention rate of product (e.g. dermal exposure or fraction ingested)
Degree of liberation/ migration of nanomaterial from a matrix (dermal exposure, oral
exposure)
Body surface area exposed (dermal exposure)
Article surface area in contact (dermal exposure, oral exposure)
Volume released to air (inhalation)
Concentration in air (inhalation)
Duration of exposure
Frequency of exposure
The qualitative parameters is mainly for characterising the exposure scenario for a product,
however, they may contain some quantitative elements e.g. the volume in which the sold. The
quantitative parameters are parameters, which in fact can be multiplied with each other for
obtaining a quantitative estimate of the exposure.
Some of the above parameters are primarily important in connection with specific exposure routes
that are indicated in the brackets.
It should be stressed that some parameters and types of information are considered especially
relevant for nanoproducts and nanomaterials, such as nanomaterial ID, surface coating of
nanomaterial, particle distribution, details on the matrix, attachment to matrix (e.g. embedded or
surface attached), and product formulation (e.g. pump spray vs propellant spray etc.).
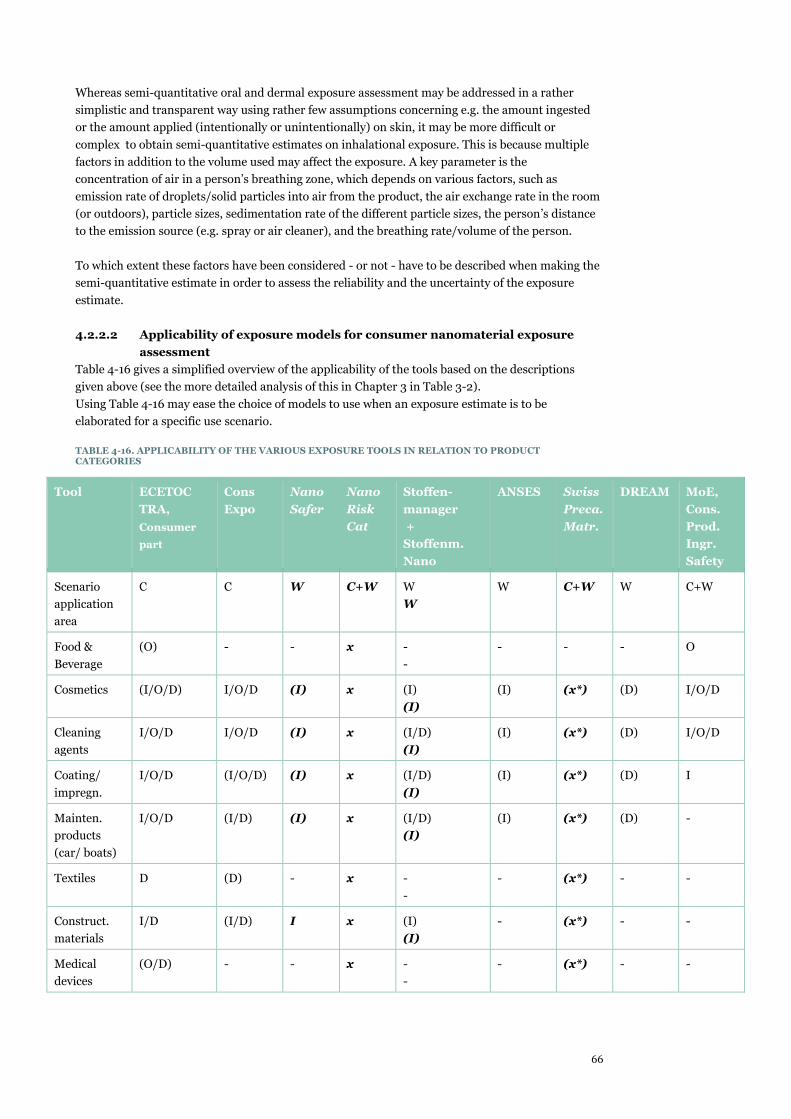
66
Whereas semi-quantitative oral and dermal exposure assessment may be addressed in a rather
simplistic and transparent way using rather few assumptions concerning e.g. the amount ingested
or the amount applied (intentionally or unintentionally) on skin, it may be more difficult or
complex to obtain semi-quantitative estimates on inhalational exposure. This is because multiple
factors in addition to the volume used may affect the exposure. A key parameter is the
concentration of air in a person’s breathing zone, which depends on various factors, such as
emission rate of droplets/solid particles into air from the product, the air exchange rate in the room
(or outdoors), particle sizes, sedimentation rate of the different particle sizes, the person’s distance
to the emission source (e.g. spray or air cleaner), and the breathing rate/volume of the person.
To which extent these factors have been considered - or not - have to be described when making the
semi-quantitative estimate in order to assess the reliability and the uncertainty of the exposure
estimate.
4.2.2.2 Applicability of exposure models for consumer nanomaterial exposure
assessment
Table 4-16 gives a simplified overview of the applicability of the tools based on the descriptions
given above (see the more detailed analysis of this in Chapter 3 in Table 3-2).
Using Table 4-16 may ease the choice of models to use when an exposure estimate is to be
elaborated for a specific use scenario.
TABLE 4-16. APPLICABILITY OF THE VARIOUS EXPOSURE TOOLS IN RELATION TO PRODUCT CATEGORIES
Tool ECETOC
TRA,
Consumer
part
Cons
Expo
Nano
Safer
Nano
Risk
Cat
Stoffen-
manager
+
Stoffenm.
Nano
ANSES Swiss
Preca.
Matr.
DREAM MoE,
Cons.
Prod.
Ingr.
Safety
Scenario
application
area
C C W C+W W
W
W C+W W C+W
Food &
Beverage
(O) - - x -
-
- - - O
Cosmetics (I/O/D) I/O/D (I) x (I)
(I)
(I) (x*) (D) I/O/D
Cleaning
agents
I/O/D I/O/D (I) x (I/D)
(I)
(I) (x*) (D) I/O/D
Coating/
impregn.
I/O/D (I/O/D) (I) x (I/D)
(I)
(I) (x*) (D) I
Mainten.
products
(car/ boats)
I/O/D (I/D) (I) x (I/D)
(I)
(I) (x*) (D) -
Textiles D (D) - x -
-
- (x*) - -
Construct.
materials
I/D (I/D) I x (I)
(I)
- (x*) - -
Medical
devices
(O/D) - - x -
-
- (x*) - -
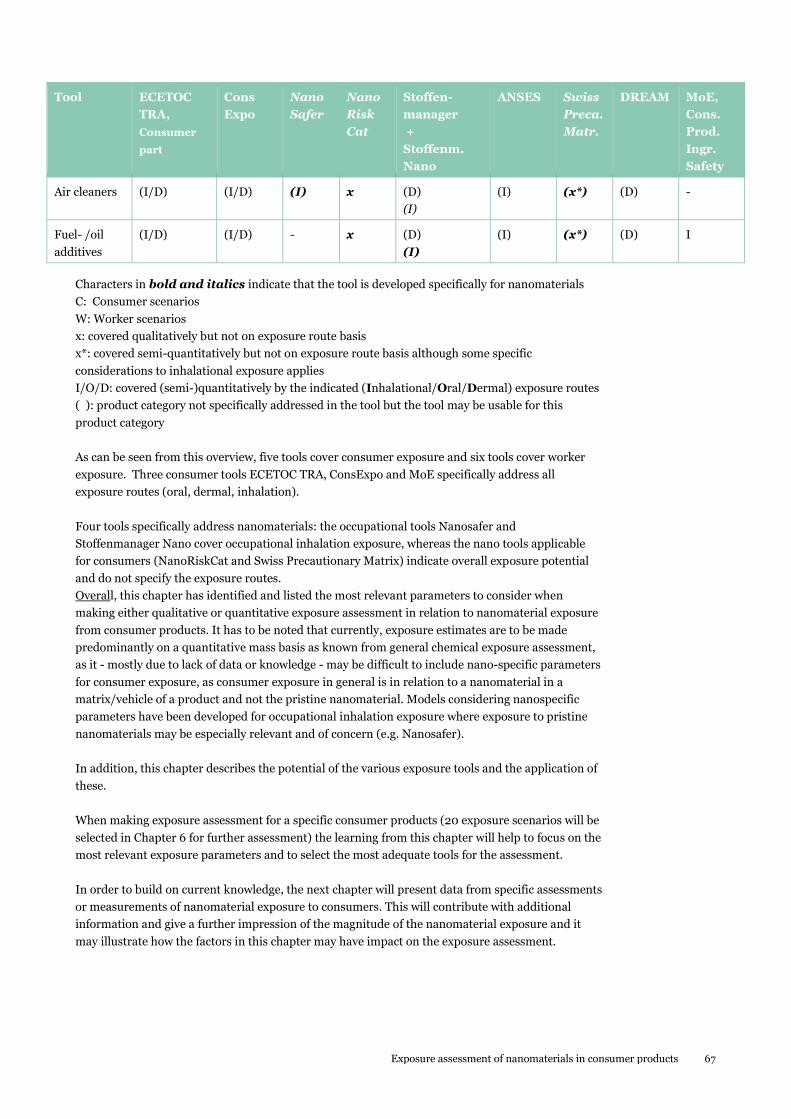
Exposure assessment of nanomaterials in consumer products 67
Tool ECETOC
TRA,
Consumer
part
Cons
Expo
Nano
Safer
Nano
Risk
Cat
Stoffen-
manager
+
Stoffenm.
Nano
ANSES Swiss
Preca.
Matr.
DREAM MoE,
Cons.
Prod.
Ingr.
Safety
Air cleaners (I/D) (I/D) (I) x (D)
(I)
(I) (x*) (D) -
Fuel- /oil
additives
(I/D) (I/D) - x (D)
(I)
(I) (x*) (D) I
Characters in bold and italics indicate that the tool is developed specifically for nanomaterials
C: Consumer scenarios
W: Worker scenarios
x: covered qualitatively but not on exposure route basis
x*: covered semi-quantitatively but not on exposure route basis although some specific
considerations to inhalational exposure applies
I/O/D: covered (semi-)quantitatively by the indicated (Inhalational/Oral/Dermal) exposure routes
( ): product category not specifically addressed in the tool but the tool may be usable for this
product category
As can be seen from this overview, five tools cover consumer exposure and six tools cover worker
exposure. Three consumer tools ECETOC TRA, ConsExpo and MoE specifically address all
exposure routes (oral, dermal, inhalation).
Four tools specifically address nanomaterials: the occupational tools Nanosafer and
Stoffenmanager Nano cover occupational inhalation exposure, whereas the nano tools applicable
for consumers (NanoRiskCat and Swiss Precautionary Matrix) indicate overall exposure potential
and do not specify the exposure routes.
Overall, this chapter has identified and listed the most relevant parameters to consider when
making either qualitative or quantitative exposure assessment in relation to nanomaterial exposure
from consumer products. It has to be noted that currently, exposure estimates are to be made
predominantly on a quantitative mass basis as known from general chemical exposure assessment,
as it - mostly due to lack of data or knowledge - may be difficult to include nano-specific parameters
for consumer exposure, as consumer exposure in general is in relation to a nanomaterial in a
matrix/vehicle of a product and not the pristine nanomaterial. Models considering nanospecific
parameters have been developed for occupational inhalation exposure where exposure to pristine
nanomaterials may be especially relevant and of concern (e.g. Nanosafer).
In addition, this chapter describes the potential of the various exposure tools and the application of
these.
When making exposure assessment for a specific consumer products (20 exposure scenarios will be
selected in Chapter 6 for further assessment) the learning from this chapter will help to focus on the
most relevant exposure parameters and to select the most adequate tools for the assessment.
In order to build on current knowledge, the next chapter will present data from specific assessments
or measurements of nanomaterial exposure to consumers. This will contribute with additional
information and give a further impression of the magnitude of the nanomaterial exposure and it
may illustrate how the factors in this chapter may have impact on the exposure assessment.
68
5. Specific nanomaterial exposure assessments
5.1 Objective and approach
This section will gain learnings from examples of more detailed exposure assessments of
nanomaterials that have been performed in published literature. The starting point for selection of
these examples and descriptions is reports/surveys on consumer nano-products and exposure, in
which specific exposure assessments have been done for some products. In addition to this, also
data from recent original literature published within the latest years have been used. The literature
has been identified through a structured web-search on ISI Web of Science (Thomson Index) and
covers at about 70 references that may contain relevant information for this project. For each
product group (e.g. [textiles]) the search keys were “consumer* AND product* AND expo* AND
[product group] OR consumer* AND product* AND release* AND [product group]”.
The exposure assessments of the specific products will be briefly described regarding methodology
(e.g. to with extent measurements and/or exposure tools have been used) and the key findings and
results will be presented. In addition information from these data sources will be extracted and
described for the various product categories, e.g.: - has further nanomaterials been identified
compared to the ones identified in the tables presented in previous chapters; - which type of
nanomaterial, exposure route/ product formulations has especially been in focus: -are exposure
discussed in relation to specific processes or life-cycle stages?
A general issue that is relevant across the various product categories is exposure to specific
downstream life-cycle stages (e.g. in relation to tear, wear, repair, and abrasion). This will be
covered separately in the end of this chapter.
5.2 Examples of nanomaterial exposure from food and beverages
5.2.1 Main findings
Most literature data regarding nanomaterials in food have been obtained for use of silica, titanium
dioxide (TiO2) and calcium carbonate (CaCO3) that may contain nano-sized particles to variable
degrees. Using assumptions regarding content of food additive in the food items, the relative
content of nano-sized particles in the food additive, and consumption rates of the food items, the
following exposure estimates have been derived in relation to the nanomaterial exposure:
nano-silica: 1.8 mg/kg bw day (adult)
nano-TiO2: 0.36 mg/kg bw day (adult)
0.7 -1.1 mg/kg bw day (child below 10 years)
nano-CaCO3: 0.5- 1 mg/kg bw day (adult)
2-3 mg/kg bw day (toddler)
From food contact materials exposure to e.g. Ag (Ag, as either ions or nanoparticles) and carbon
black (as nanoparticles) may occur. However, these exposures may be quantitatively lower due to
the bound state of the nanomaterial compared to nanomaterial exposure from food additives used
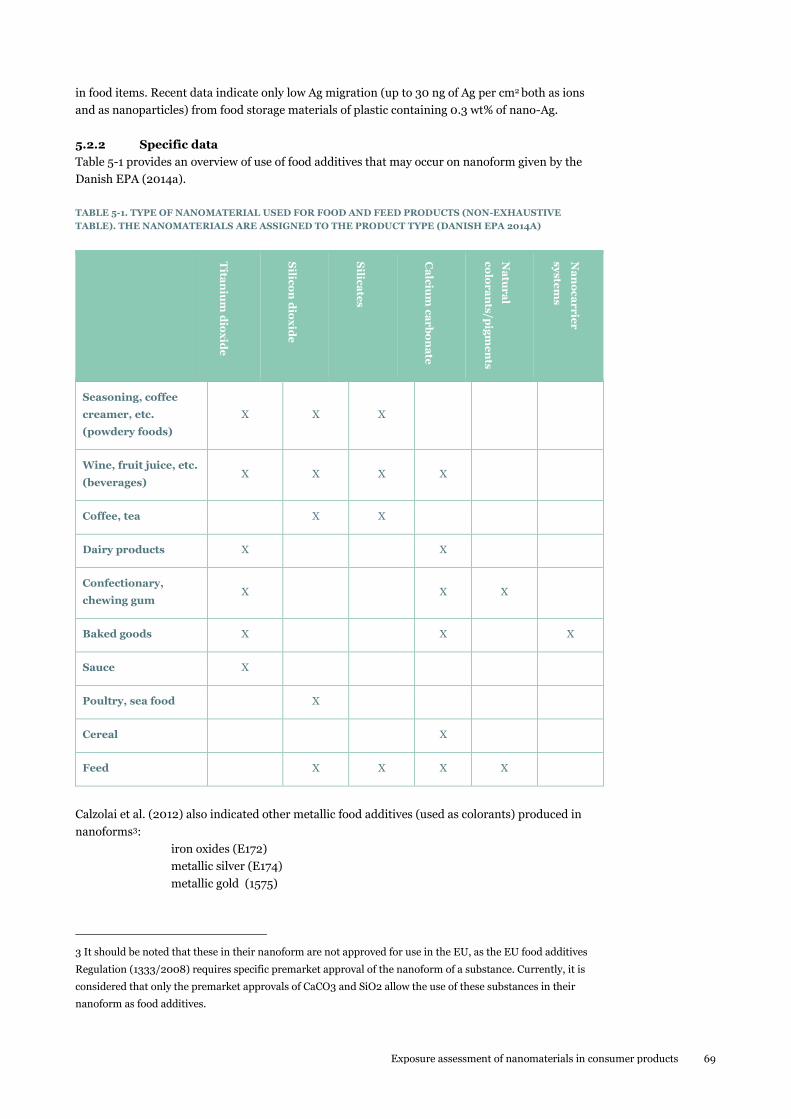
Exposure assessment of nanomaterials in consumer products 69
in food items. Recent data indicate only low Ag migration (up to 30 ng of Ag per cm2 both as ions
and as nanoparticles) from food storage materials of plastic containing 0.3 wt% of nano-Ag.
5.2.2 Specific data
Table 5-1 provides an overview of use of food additives that may occur on nanoform given by the
Danish EPA (2014a).
TABLE 5-1. TYPE OF NANOMATERIAL USED FOR FOOD AND FEED PRODUCTS (NON-EXHAUSTIVE
TABLE). THE NANOMATERIALS ARE ASSIGNED TO THE PRODUCT TYPE (DANISH EPA 2014A)
Tita
niu
m d
iox
ide
Silic
on
dio
xid
e
Silic
ate
s
Ca
lciu
m c
ar
bo
na
te
Na
tur
al
co
lor
an
ts/p
igm
en
ts
Na
no
ca
rrie
r
sy
ste
ms
Seasoning, coffee
creamer, etc.
(powdery foods)
X X X
Wine, fruit juice, etc.
(beverages) X X X X
Coffee, tea X X
Dairy products X X
Confectionary,
chewing gum X X X
Baked goods X X X
Sauce X
Poultry, sea food X
Cereal X
Feed X X X X
Calzolai et al. (2012) also indicated other metallic food additives (used as colorants) produced in
nanoforms3:
iron oxides (E172)
metallic silver (E174)
metallic gold (1575)
3 It should be noted that these in their nanoform are not approved for use in the EU, as the EU food additives
Regulation (1333/2008) requires specific premarket approval of the nanoform of a substance. Currently, it is
considered that only the premarket approvals of CaCO3 and SiO2 allow the use of these substances in their
nanoform as food additives.
70
Below, examples of exposure estimates on some of these food additives are given from recent
studies presented in the scientific literature.
Amorphous silica
Dekkers et al. (2011) made a detailed assessment of nano-silica (silicon dioxide, SiO2) in food. The
conventional form of amorphous silica is known as the food additive (E551). Specifications of
commercial available qualities on the market indicate that the food additive contain nanoparticles.
From analysis of two qualities (Aerosil 200F and Aerosil 380F) specific surface areas of 199 m2/g
and 388 m2/g were determined (BET nitrogen adsorption method). Primary particle size diameters
of 12 nm and 7 nm were determined using transmission electron microscopy; however, most of the
primary particles formed larger aggregates and agglomerates.
The total concentrations of silica in 26 products containing E551 were found to be in the range of 0-
13.7 wt%. The contents of nano-silica determined in seven products (sauce, soup, coffee cream,
pancake mix, seasoning products and spicy rubs) were in the range of 0- 1 mg/g with the highest
content found in coffee creamer (1 mg/g). The highest relative content of nano-silica (33% of the
total silica-concentration) was found in instant asparagus soup; however, this product had an
overall low total silica content of 0.6 mg/g.
When 2 g of the coffee cream was added to 200 mL coffee, the ready to drink content of nano-silica
was measured at 22 mg/L.
Estimates of the daily intake of nanosilica from 14 food products containing E551 were made based
on food intake rates from the Dutch Food Consumption Survey. From these estimates, daily
exposures to nanosilica of 33 mg, 20 mg and 15 mg were found from intake of coffee creamer,
seasoning mix and cheese sauce, respectively. A total daily consumption of 124 mg nanosilica
(corresponding to 1.8 mg/kg bw day) was estimated from intake from the total of the 14 different
food products (for 6 of the products that has not been analysed for the nanofraction as indicated
above, a worst case assumption of a relative amount of nano-silica of 50% in E551 was used).
Titanium dioxide (TiO2)
Weir et al. (2012) analysed food grade TiO2 (E171) by electron microscopy and found a very broad
particle size distribution in the range of 30-400 nm with 36% of the particles (by number) below the
particle size of 100 nm. Also, E171 includes TiO2 as both the rutile and anatase crystalline form.
The titanium content was measured in a variety of food items on the US market, where the highest
content of titanium was found in coconut curd and in candy and sweets including products with
sugar toppings. Titanium contents above 1 mg/g food were found in chewing gum, candy, additive
products, and beverages; however, the highest content of 2.5 mg/g was found in the coconut curd.
Food intake estimates of E171 was made based on data from the UK National Diet and Nutrition
Survey using Monte Carlo simulations for the intake rates and point estimates for the titanium
content in the food items.
Realistic average exposure for the UK population was found to 2-3 mg TiO2/kg bw day for children
under the age of 10 years, whereas exposure for higher age groups were estimated to about 1 mg
TiO2/kg bw day. It was noted that 36% of this exposure may be as nano-TiO2.
Calcium carbonate (CaCO3)
EFSA (2011b) in its opinion on CaCO3 as food additive (E 170) noted that CaCO3 can have an
amorphous or microcrystalline structure, and that particle size varies according to the form and
manufacturing conditions. Particles of amorphous calcium carbonate are reported to be
characteristically 40 to 120 nm diameter spherules, in contrast to the 1 to 10 μm diameters in the
crystalline forms.
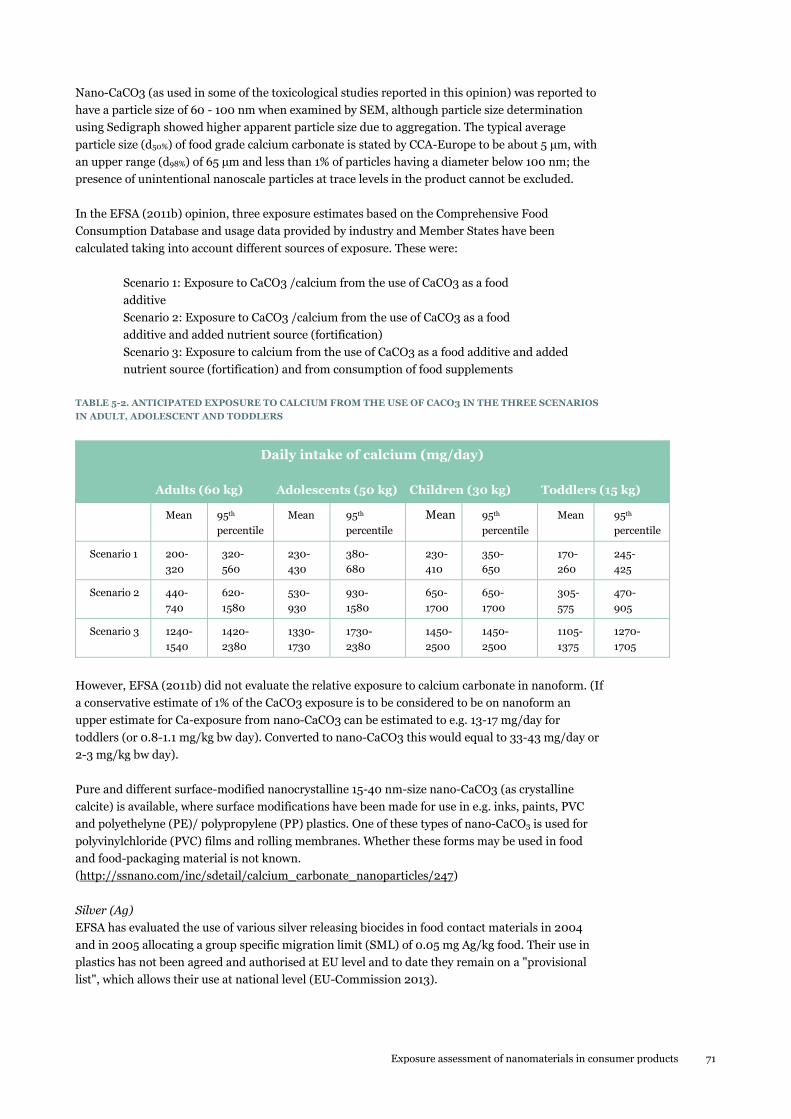
Exposure assessment of nanomaterials in consumer products 71
Nano-CaCO3 (as used in some of the toxicological studies reported in this opinion) was reported to
have a particle size of 60 - 100 nm when examined by SEM, although particle size determination
using Sedigraph showed higher apparent particle size due to aggregation. The typical average
particle size (d50%) of food grade calcium carbonate is stated by CCA-Europe to be about 5 μm, with
an upper range (d98%) of 65 μm and less than 1% of particles having a diameter below 100 nm; the
presence of unintentional nanoscale particles at trace levels in the product cannot be excluded.
In the EFSA (2011b) opinion, three exposure estimates based on the Comprehensive Food
Consumption Database and usage data provided by industry and Member States have been
calculated taking into account different sources of exposure. These were:
Scenario 1: Exposure to CaCO3 /calcium from the use of CaCO3 as a food
additive
Scenario 2: Exposure to CaCO3 /calcium from the use of CaCO3 as a food
additive and added nutrient source (fortification)
Scenario 3: Exposure to calcium from the use of CaCO3 as a food additive and added
nutrient source (fortification) and from consumption of food supplements
TABLE 5-2. ANTICIPATED EXPOSURE TO CALCIUM FROM THE USE OF CACO3 IN THE THREE SCENARIOS
IN ADULT, ADOLESCENT AND TODDLERS
Daily intake of calcium (mg/day)
Adults (60 kg) Adolescents (50 kg) Children (30 kg) Toddlers (15 kg)
Mean 95th
percentile
Mean 95th
percentile
Mean 95th
percentile
Mean 95th
percentile
Scenario 1 200-
320
320-
560
230-
430
380-
680
230-
410
350-
650
170-
260
245-
425
Scenario 2 440-
740
620-
1580
530-
930
930-
1580
650-
1700
650-
1700
305-
575
470-
905
Scenario 3 1240-
1540
1420-
2380
1330-
1730
1730-
2380
1450-
2500
1450-
2500
1105-
1375
1270-
1705
However, EFSA (2011b) did not evaluate the relative exposure to calcium carbonate in nanoform. (If
a conservative estimate of 1% of the CaCO3 exposure is to be considered to be on nanoform an
upper estimate for Ca-exposure from nano-CaCO3 can be estimated to e.g. 13-17 mg/day for
toddlers (or 0.8-1.1 mg/kg bw day). Converted to nano-CaCO3 this would equal to 33-43 mg/day or
2-3 mg/kg bw day).
Pure and different surface-modified nanocrystalline 15-40 nm-size nano-CaCO3 (as crystalline
calcite) is available, where surface modifications have been made for use in e.g. inks, paints, PVC
and polyethelyne (PE)/ polypropylene (PP) plastics. One of these types of nano-CaCO3 is used for
polyvinylchloride (PVC) films and rolling membranes. Whether these forms may be used in food
and food-packaging material is not known.
(http://ssnano.com/inc/sdetail/calcium_carbonate_nanoparticles/247)
Silver (Ag)
EFSA has evaluated the use of various silver releasing biocides in food contact materials in 2004
and in 2005 allocating a group specific migration limit (SML) of 0.05 mg Ag/kg food. Their use in
plastics has not been agreed and authorised at EU level and to date they remain on a "provisional
list", which allows their use at national level (EU-Commission 2013).
72
Quadros et al. (2013) measured the release of silver (as Ag-ions) from various consumer products
assumed to contain silver in nanoform. From sippy cups and a breast milk storage bag with a
content of 0.9-24.3 mg Ag/kg product, a release of 0.93 mg Ag/kg product was measured to juice
from a sippy cup, whereas no silver release was found into milk in the breast milk storage bag.
Anticipating release from a cup weighing 100 g, this would result in a release of 0.09 mg of silver.
For a child weighing 10 kg this would using the cup three times daily correspond to an exposure of
0.027 mg Ag/kg bw day.
Echegoyen and Nerín (2013) studied the release of silver from two different food storage containers
made of polyolefins and from food storage plastic bags made of low density polyethylene or
polypropylene. The Ag content in the containers and bags were in the range of 0.32-0.33 wt%. It
was noted that other products on the market may contain up to 0.72 wt% Ag. The migration of
silver was measured according to EU regulation 10/2011/EU using acetic acid 3% or ethanol 50%
with a migration duration of 2 hours at 70 oC and 10 days at 40 oC. The highest migration ranging
from 3.7 – 31.5 ng Ag/cm2 was measured using acetic acid at 40 oC for 10 days. This migration was
calculated to be far below the migration limit value for silver of 0.05 mg Ag/kg food*.
For some samples, up to 20% of the migration of Ag was due to Ag nano-particles (identified by
SEM-EDX) with a diameter of 10 to 60 nm. Further, it was found that heating in a microwave oven
for 2 minutes resulted in higher migration than 2 hours heating in a conventional oven.
Furthermore, plastic nanoparticles were observed to be released from the food storage materials as
well.
Carbon black and vegetable carbon
Carbon black that is derived from petrochemical sources should not be confused with the food
additive E153, vegetable carbon, which is derived from carbonised material of plant origin.
According to EFSA (2012) the particle size specifications on the marketed qualities of vegetable
carbon, E153 indicates that currently nano-sized particles in E153 can be excluded.
Carbon black used in plastic materials and articles intended to come into contact with foodstuffs is
regulated in European Directive 2007/19/EC. The maximum use level of carbon black in the
polymer is set to 2.5% w/w. Requirements are set to toluene extractables with a maximum of 0.1 wt
% and to a maximum benzo(a)pyrene content of 0.25 mg/kg (SCCS 2013a).
5.3 Examples of nanomaterial exposure from cosmetics
5.3.1 Main findings
Based on estimated content of nanomaterials in cosmetics and the consumption pattern of different
consumer age groups the following overall estimate of nanomaterials exposure from various types
of cosmetics have been made:
Body lotion (2.5%)*: 33.8 mg/kg bw day
Hand cream (2.5%): 5.57 mg/kg bw day
Skin cream (2.5%): 5.57 mg/kg bw day
Sunscreen (5%): 1.61 mg/kg bw day
Antiperspirant (0.002%): 4.50 µg/kg bw day
Shampoo (0.002%): 0.14 µg/kg bw day
Showergel (0.002%): 0.005 µg/kg bw day
Toothpaste (0.002%): 0.010 µg/kg bw day
Eye makeup (0.1%): 0.25 µg/kg bw day
Lipstick (0.3%): 2.76 µg/kg bw day
Makeup (0.1%): 42.5 µg/kg bw day
Exposure assessment of nanomaterials in consumer products 73
Mascara (5%): 12.5 µg/kg bw day
*( ) estimated concentration of nanomaterial in the product
These exposure estimates pertain to teenage girls, as this group was found to have the most
intensive use of cosmetics. Exposure is predominantly dermal. Oral exposure is considered the
dominant exposure route for toothpaste and lipstick. Eye exposure may occur for use of e.g. eye
makeup and mascara.
The highest single exposure estimate was, however, found for small children and the use of
sunscreen - and especially if the official recommendations for sunscreen use was followed4.
Following these advices, a dermal exposure of 284 mg TiO2/ kg bw day has been estimated for a
sunscreen with a content of 10% nano-TiO2.
For cosmetic propellant spray formulations, measurements of the aerosols indicate no consistent
differences between spray products marketed as nano-products compared to conventional spray
product with respect to generation of nano-sized aerosols during use. For an antiperspirant spray
containing silver nanoaerosols were generated (with a content of 6 µg Ag/g aerosol and measured as
Ag-ions) leading to an average aerosol number concentration of 2 x 10⁶/cm3 in the breathing zone
when using 4 g of the spray (i.e. a total of 24 µg silver). More than 10 x 1010 nanoparticles (aerosols)
were estimated to be deposited in the respiratory tract during use.
For another mouth propellant spray containing colloidal silver a daily oral dose of 70 ng silver was
estimated.
From data on cosmetic pump spray products containing titanium dioxide, a weight-based amount
of aerosols below 10 µm was reported to be less than 1 wt% indicating a very low potential for
exposure to nanosized aerosols from these types of (sun-screen) pump-spray products.
Data from cosmetic propellant sprays containing zinc oxide indicated that less than 0.1 wt% of the
aerosols had a size below 10 µm. The large aerosol diameters of these type of sprays may pertain to
the formulation with zinc and titanium dioxide as these products for skin care/ skin protection may
be formulations with a high content of solid matter and/or emulsified droplets and with a rather
viscous and non-volatile matrix, altogether aspects that would hamper the generation of nano-sized
aerosols.
5.3.2 Specific data
The Danish EPA (2007) report on nanomaterials in consumer products established exposure
scenarios for the use of nanomaterials in facial cream and sunscreen. The Technical Guidance
Document on Risk Assessment for Existing Substances from 2003 was used as a basis for making
the scenarios.
For facial cream (a leave-on product) a dermal exposure of 2 x 0.8 mg nanomaterial was estimated
based on the use of 800 mg cream twice daily containing 0.1% nanomaterial (corresponding to
0.013 mg/kg bw day for a woman weighing 60 kg).
4 ’The SCCS based their risk assessment of sun screens on exposure to 18 grams of sun screen product/person/day, even though the amount
recommended by the EU Commission is 36 grams/person/application which is the amount necessary to obtain the claimed sun protection factor.
Others, e.g. the Danish EPA finds that risk assessment on UV filters and other sun screen ingredients should be based on exposure to the amount
which the EU Commission, national authorities and cancer organisations worldwide recommend consumers to use and which is necessary in order
to achieve the claimed sun protection factor.’
74
For sunscreen (a leave-on product) a dermal exposure of 3 x 52 mg nanomaterial was estimated
for a 2-year-old child using 2.6 g sunscreen containing 2% nanomaterials three times daily
(corresponding to 12.6 mg /kg bw day for a child weighing 12 kg).
However, it was noted that according to a recommendation from the EU-Commission regarding
effective use of sunscreen a much higher volume of sunscreen should be used (12 g) which would
then correspond to a nanomaterial exposure of 56.7 mg/kg bw day for a 2-year-old child. (Danish
EPA 2007)
Lorenz et al (2011) gave an overall assessment of nanomaterial exposure from cosmetic in general.
Exposure levels were modelled for 12 cosmetic products (body-lotion, hand cream, skin cream,
sunscreen, antiperspirant, shampoo, shower gel, toothpaste, eye make-up, lipstick, make-up and
mascara).
The exposure was evaluated based on the following algorithm:
Exposure nano = use frequency per day x retentionproduct x use amountproduct x nanoconc. product/ bodyweight
The retention factor for leave-on products was set to 1 whereas a retention factor of 0.01 was used
for shampoo and toothpaste and a factor of 0.001 was used for shower gel. The amount of cosmetics
used were taken from the literature e.g. US-EPA's exposure handbook and other assessments in
literature, and data on the nanomaterial content in cosmetic was judged based on data from
available literature.
Data with regard to use pattern of cosmetics were obtained from a German database on behaviour
of youth (age above 12 years) and adults, giving data on frequency of use of the various cosmetic
product.
The highest daily exposure to nanomaterials from the various products was in all cases among
teenage females due to most frequent use by this group. Below figures are given for a subgroup of
teenage females using the products at most:
Body lotion (2.5%)*: 33.8 mg/kg bw day
Hand cream (2.5%): 5.57 mg/kg bw day
Skin cream (2.5%): 5.57 mg/kg bw day
Sunscreen (5%): 1.61 mg/kg bw day
Antiperspirant (0.002%): 4.50 µg/kg bw day
Shampoo (0.002%): 0.14 µg/kg bw day
Shower gel (0.002%): 0.005 µg/kg bw day
Toothpaste (0.002%): 0.010 µg/kg bw day
Eye makeup (0.1%): 0.25 µg/kg bw day
Lipstick (0.3%): 2.76 µg/kg bw day
Makeup (0.1%): 42.5 µg/kg bw day
Mascara (5%): 12.5 µg/kg bw day
*The number in brackets indicates the estimated concentration of nanomaterial in the product
In general, the dominant exposure route was considered the dermal route. For toothpaste however,
oral exposure was considered most important and for lipstick, the oral route was considered as
important as the dermal route. The oral route was considered the secondary exposure route for
creams, shampoo/shower gel, and makeup, whereas the inhalation was considered an important
secondary route for powdered makeup and eye-makeup.
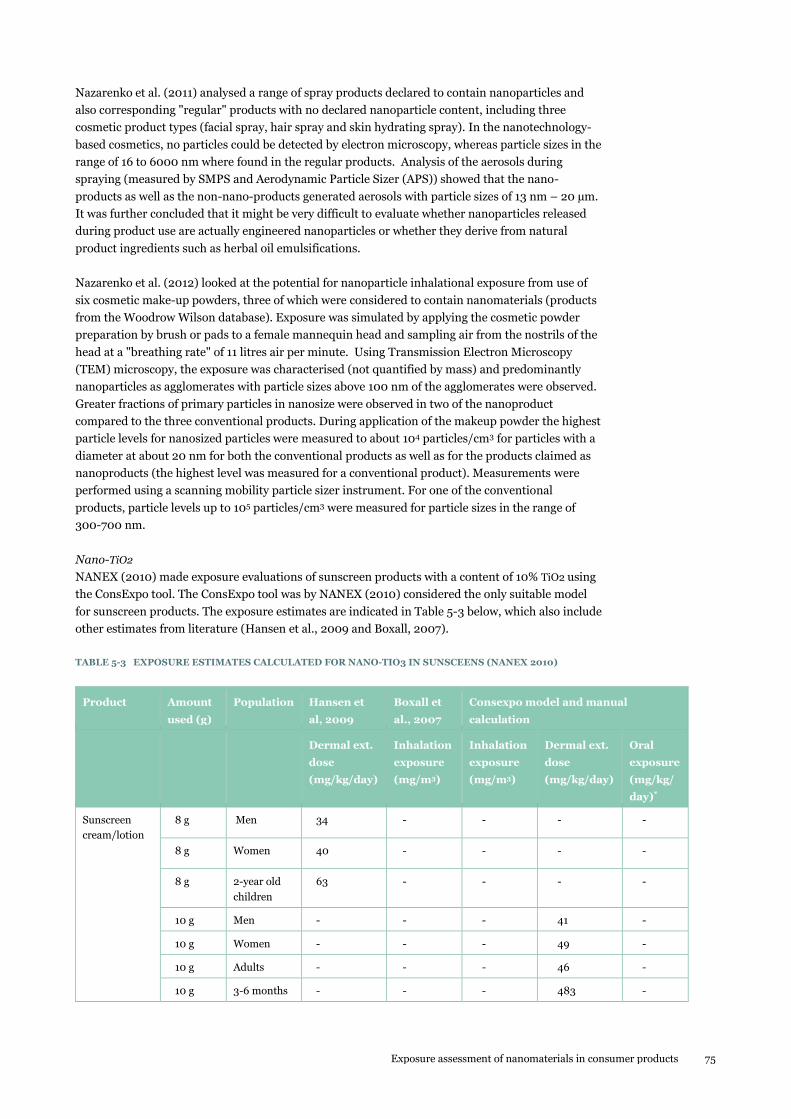
Exposure assessment of nanomaterials in consumer products 75
Nazarenko et al. (2011) analysed a range of spray products declared to contain nanoparticles and
also corresponding "regular" products with no declared nanoparticle content, including three
cosmetic product types (facial spray, hair spray and skin hydrating spray). In the nanotechnology-
based cosmetics, no particles could be detected by electron microscopy, whereas particle sizes in the
range of 16 to 6000 nm where found in the regular products. Analysis of the aerosols during
spraying (measured by SMPS and Aerodynamic Particle Sizer (APS)) showed that the nano-
products as well as the non-nano-products generated aerosols with particle sizes of 13 nm – 20 µm.
It was further concluded that it might be very difficult to evaluate whether nanoparticles released
during product use are actually engineered nanoparticles or whether they derive from natural
product ingredients such as herbal oil emulsifications.
Nazarenko et al. (2012) looked at the potential for nanoparticle inhalational exposure from use of
six cosmetic make-up powders, three of which were considered to contain nanomaterials (products
from the Woodrow Wilson database). Exposure was simulated by applying the cosmetic powder
preparation by brush or pads to a female mannequin head and sampling air from the nostrils of the
head at a "breathing rate" of 11 litres air per minute. Using Transmission Electron Microscopy
(TEM) microscopy, the exposure was characterised (not quantified by mass) and predominantly
nanoparticles as agglomerates with particle sizes above 100 nm of the agglomerates were observed.
Greater fractions of primary particles in nanosize were observed in two of the nanoproduct
compared to the three conventional products. During application of the makeup powder the highest
particle levels for nanosized particles were measured to about 104 particles/cm3 for particles with a
diameter at about 20 nm for both the conventional products as well as for the products claimed as
nanoproducts (the highest level was measured for a conventional product). Measurements were
performed using a scanning mobility particle sizer instrument. For one of the conventional
products, particle levels up to 105 particles/cm3 were measured for particle sizes in the range of
300-700 nm.
Nano-TiO2
NANEX (2010) made exposure evaluations of sunscreen products with a content of 10% TiO2 using
the ConsExpo tool. The ConsExpo tool was by NANEX (2010) considered the only suitable model
for sunscreen products. The exposure estimates are indicated in Table 5-3 below, which also include
other estimates from literature (Hansen et al., 2009 and Boxall, 2007).
TABLE 5-3 EXPOSURE ESTIMATES CALCULATED FOR NANO-TIO3 IN SUNSCEENS (NANEX 2010)
Product Amount
used (g)
Population Hansen et
al, 2009
Boxall et
al., 2007
Consexpo model and manual
calculation
Dermal ext.
dose
(mg/kg/day)
Inhalation
exposure
(mg/m3)
Inhalation
exposure
(mg/m3)
Dermal ext.
dose
(mg/kg/day)
Oral
exposure
(mg/kg/
day)*
Sunscreen
cream/lotion
8 g Men 34 - - - -
8 g Women 40 - - - -
8 g 2-year old
children
63 - - - -
10 g Men - - - 41 -
10 g Women - - - 49 -
10 g Adults - - - 46 -
10 g 3-6 months - - - 483 -
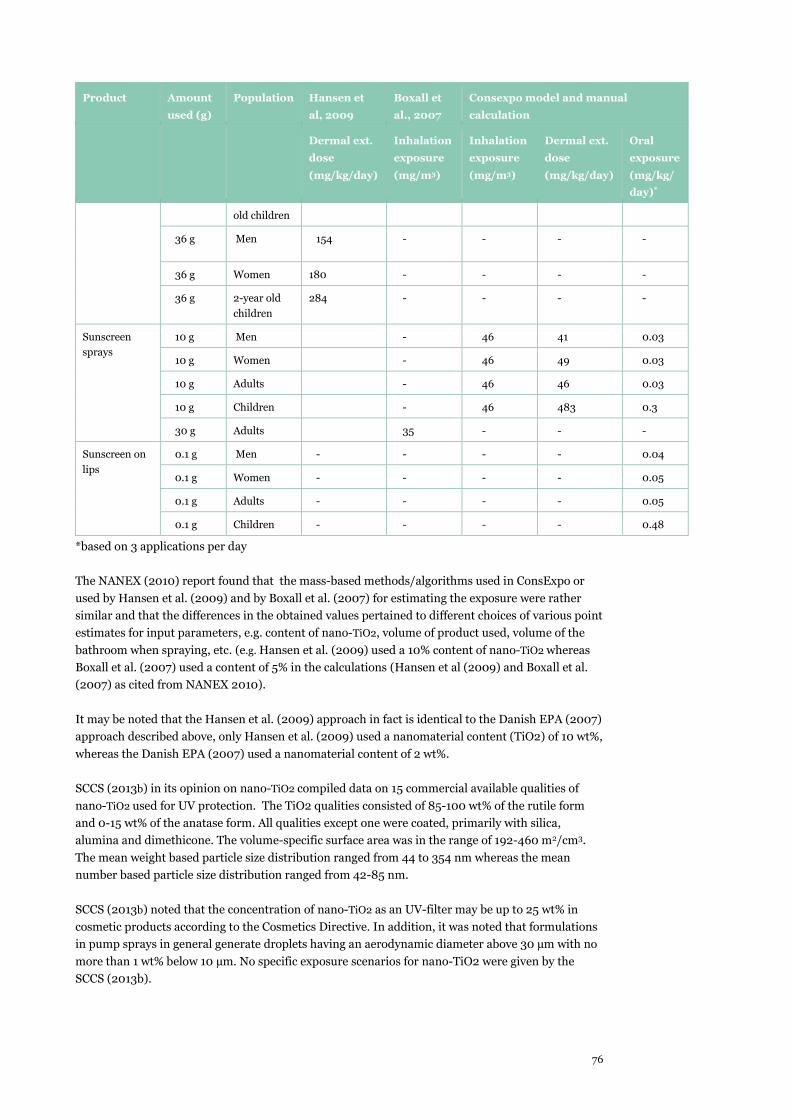
76
Product Amount
used (g)
Population Hansen et
al, 2009
Boxall et
al., 2007
Consexpo model and manual
calculation
Dermal ext.
dose
(mg/kg/day)
Inhalation
exposure
(mg/m3)
Inhalation
exposure
(mg/m3)
Dermal ext.
dose
(mg/kg/day)
Oral
exposure
(mg/kg/
day)*
old children
36 g Men 154 - - - -
36 g Women 180 - - - -
36 g 2-year old
children
284 - - - -
Sunscreen
sprays
10 g Men - 46 41 0.03
10 g Women - 46 49 0.03
10 g Adults - 46 46 0.03
10 g Children - 46 483 0.3
30 g Adults 35 - - -
Sunscreen on
lips
0.1 g Men - - - - 0.04
0.1 g Women - - - - 0.05
0.1 g Adults - - - - 0.05
0.1 g Children - - - - 0.48
*based on 3 applications per day
The NANEX (2010) report found that the mass-based methods/algorithms used in ConsExpo or
used by Hansen et al. (2009) and by Boxall et al. (2007) for estimating the exposure were rather
similar and that the differences in the obtained values pertained to different choices of various point
estimates for input parameters, e.g. content of nano-TiO2, volume of product used, volume of the
bathroom when spraying, etc. (e.g. Hansen et al. (2009) used a 10% content of nano-TiO2 whereas
Boxall et al. (2007) used a content of 5% in the calculations (Hansen et al (2009) and Boxall et al.
(2007) as cited from NANEX 2010).
It may be noted that the Hansen et al. (2009) approach in fact is identical to the Danish EPA (2007)
approach described above, only Hansen et al. (2009) used a nanomaterial content (TiO2) of 10 wt%,
whereas the Danish EPA (2007) used a nanomaterial content of 2 wt%.
SCCS (2013b) in its opinion on nano-TiO2 compiled data on 15 commercial available qualities of
nano-TiO2 used for UV protection. The TiO2 qualities consisted of 85-100 wt% of the rutile form
and 0-15 wt% of the anatase form. All qualities except one were coated, primarily with silica,
alumina and dimethicone. The volume-specific surface area was in the range of 192-460 m2/cm3.
The mean weight based particle size distribution ranged from 44 to 354 nm whereas the mean
number based particle size distribution ranged from 42-85 nm.
SCCS (2013b) noted that the concentration of nano-TiO2 as an UV-filter may be up to 25 wt% in
cosmetic products according to the Cosmetics Directive. In addition, it was noted that formulations
in pump sprays in general generate droplets having an aerodynamic diameter above 30 µm with no
more than 1 wt% below 10 µm. No specific exposure scenarios for nano-TiO2 were given by the
SCCS (2013b).
Exposure assessment of nanomaterials in consumer products 77
Weir et al. (2012) analysed various cosmetics for the content of TiO2. In sunscreens, the
concentrations measured as titanium were in the range of 10-100 mg/ g (i.e. 1-10%). Toothpaste
labelled with content of TiO2 (E171) generally contained titanium in the 1-10 mg/g range (i.e. 0.1-
1%).
Silver (Ag)
Quadros & Marr (2011) measured particle sizes and amount of Ag emitted from a mouth spray
product containing 30 ppm of colloidal nano-Ag (using ultrafine condensation particle counter and
a six-channel optical particle counter, and filter sampling for weight-based metrics). Per ml
sprayed, 6.6 x 10⁷ aerosol droplets were formed with a median diameter of 219 nm. Per spray event
(0.18 ml), 55.6 ng of Ag-aerosols were generated of which only 4 ng of the aerosols had an aerosol
droplet size below 250 nm.
According to the use instructions, 1-2 sprays are to be used on a daily basis, which was considered to
lead to a daily load onto the mucous membrane of the oral cavity of 70 ng Ag.
Lorenz et al. (2011) measured the aerosols generated from a liquid antiperspirant propellant spray
with an analysed Ag content of 6.8 mg Ag/kg (measured as total Ag). Aerosols were generated in a
box with a volume of 300 L under conditions reflecting the near-field breathing zone exposure of a
consumer and measured using a scanning mobility particle sizer. In addition, aerosols were
collected using an electrostatic sampler for analysis by electron microscopy. No Ag particles could
be detected in the aerosols. When spraying, aerosol sizes from 20 nm to 80 nm were the most
dominant size fraction. An average concentration of 1.98 x 10⁶ /cm3 aerosols was measured in
connection with use of 4 g spray over a period of 5 minutes. With an inhalation rate of 10,650 cm3 of
an adult man, the deposition of aerosols in the various respiratory tracts regions was modelled to
4.6 x 10¹⁰ aerosols for the alveolar regions; 1.3 x 10¹⁰ for the tracheobronchial region and 4.4 x 10⁹
for the nasal region.
As no Ag particles were detected, it can be assumed that the exposure consisted of dissolved silver
in the droplets.
Lem et al. (2012) reviewed nano-Ag contents in various consumer products, but the authors did not
make any exposure estimations. The levels referred to in various types of cosmetics were:
Hair mousse: 20-30 wt%
Liquid, emulsions, creams, gel and sprays: 0.05-20 wt%
Wound care: 0.0005-0.04 wt%
Gel: 0.001 wt%
Cream: 0.0005-0.003 wt%
Facial mask: 0.0005-0.0015 wt%
These data has to be considered with caution as the data primarily (or maybe only) are related to
products and articles on the US and Korean markets.
Fullerenes
Benn et al. (2011) analysed C60 and C70 fullerenes in cosmetic products using TEM electron
microscopy and mass spectrometer. The cosmetic products were claimed to contain fullerenes (two
watery serums, one lotion and two dense creams). The TEM images showed 50-100 nm
agglomerated fullerenes, some of which were covered by a 20 nm layer of polyvinylpyrrolidone. C60
was detected in four of the products within a concentration range of 0.04-1.1 µg/g product. C70 was
detected in two products, however, not quantified.
78
Nano-(ZnO
SCCS (2012c) compiled data on four qualities of nano-ZnO with UV absorbing properties for
sunscreen products. The primary particle size of the four qualities were all above 21 nm with a mean
weight based particle size in the range of 41-105 nm and a mean particle number based particle size
of 30 to 55 nm (determined using a CPS disc centrifuge). Spray nano-ZnO formulations with gas
propellant resulted in less than 5% of droplets (by weight) below 30 µm and less than 0.1% of the
droplets (by weight) below 10 µm. No specific dermal or inhalational exposure scenarios for nano-
ZnO were given by the SCCS (2013).
Carbon black, CI 77266
The ingredient carbon black has a long history of use as a cosmetic colorant. Typical uses of carbon
black are in different types of cosmetic products, specifically makeup products, and include but are
not limited to eyeliners, eye pencils, eye shadows, mascaras, blushers, brush-on-brow, foundations
and nail enamels, leave-on and rinse-off skin products. Typical use concentrations range from
0.001% to 10%, with 0.001% for skin products, 5% for nail enamels and mascaras and up to 10% for
other eye decorative products such as eyeliners, eye pencils and eye shadows (SCCS 2013a).
SCCS (2013a) in its opinion on carbon black (in nano-form) characterised carbon black for cosmetic
use as elemental carbon obtained by partial combustion or thermal decomposition of hydrocarbons.
Typically, the average primary particle diameter of commercial carbon black materials range from
10 to 100 nm, while the average aggregate/agglomerate size is in the range 100-800 nm or above.
Carbon black is initially formed as roughly spherical primary particles, which, in most cases, rapidly
form aggregates. An aggregate is a chain of primary carbon particles that are permanently fused
together in a random branching structure. The aggregate may consist of a few or hundreds of
spherical particles (or, as in the case of thermal black, primarily single spheres rather than chains).
Accordingly, on the basis of their primary particle size, all carbon black materials used in cosmetics
are considered as nano-structured materials.
Further, SCCS (2013a) stated that the purity of carbon black for cosmetic use should be in
compliance with FDA specifications, i.e. a purity of more than 97% and with an ash content <
0.15%, total sulphur < 0.65%, total PAH < 500 ppb and benzo(a)pyrene <5 ppb,
dibenz(a,h)anthracene < 5ppb, As < 3 ppm, Pb < 10 ppm, and Hg < 1 ppm.
It may be noted that SCCS (2013a) concluded the cosmetic dermal use of carbon black as safe, not
at least due to the lack of systemic absorption of the substance. A potential for eye irritation of
carbon black could not be completely excluded, as relevant data were lacking.
Exposure assessment of nanomaterials in consumer products 79
5.4 Examples of Nanomaterial exposure from cleaning products
5.4.1 Main findings
The identified literature indicates that nano-Ag is used in cleaning sprays, detergents, surface wipes
and a cleaning scrubber. One paper addresses the use of nano-silica in a glass cleaner product.
Some studies have identified the presence of non-declared nanomaterials in a number of cleaning
sprays. The chemical identify of these nanomaterials have not been identified by the studies.
One study addressing dermal nano-Ag exposure (e.g. from wipes) finds a maximum release of 18.5
mg Ag/kg product. This release is assumed to be Ag in ionic form and considered by the authors to
be very low. No actual exposure assessment is performed.
Most papers address sprays containing nano-Ag, where focus in on characterisation of the aerosol
and nanomaterial content rather than actual estimation of exposure.
The study addressing nano-silica in a glass cleaner spray, estimated (using ConsExpo) that the
mean concentration is 0.002 mg silica/m3 in the surrounding of the consumer and the peak
concentration 0.035 mg/m³ shortly after spraying. An accidental scenario (spraying towards
exposed person) resulted in 0.044 mg/m³.
In general, the papers addressing sprays indicate that pump sprays result in no/low exposure due to
larger aerosols generated, which deposit without causing consumer exposure to (free)
nanoparticles. Propellant sprays generate much lower diameters from which liquid might readily
evaporate and cause direct exposure to free nanomaterials. Smaller aerosols also stay airborne for a
longer period. Thus, the spray mechanism highly influences exposure.
Further, it should be noted that propellant sprays seems to generate nano-aerosols even if they do
not contain nano. These aerosols disappear when the liquid aerosol evaporates.
Overall, the literature reflects measurements in experimental chambers and shows that there are
many variables (spray mechanism, room size, temperature, equipment, etc.). This may explain that
many authors abstain from estimating exposure levels.
5.4.2 Specific data
Lem et al. (2012) reports a market-based Intellectual Property (IP) study on nanosilver applications
and finds that "detergents" typically have a nano-Ag concentration in the range from 0.00001 up to
3% (w/w).
Dermal
Quadros et al. (2013) investigated children exposure from a number of nano-Ag-containing
products, including three cleaning products; a disinfecting spray, surface wipes and a kitchen
scrubber. Ag deposition onto skin was estimated by use of dermal wipes. To allow using this method
for the nano-Ag-containing spray and surface wipes, these products were applied onto surface tiles,
which were allowed to surface dry before wiped with the dermal wipe. For the three cleaning
products, silver transfer rates of 0.3 (kitchen scrubber) to 9 µg Ag/m² (disinfectant spray) were
identified. These values were lower than for textiles products also addressed. Overall, the authors
note that exposure is expected to be to the ionic form of Ag (although further speciation research is
recommended) and that the observed levels seem to be low.
80
Inhalation/spray
Hagendorfer et al. (2010) report from a chamber experiment conducted with a commercially
available water-based nano-Ag spray. The product is supplied as a pump spray as well as a gas
propellant spray. The declared Ag concentration of 1000 mg Ag/L was confirmed analytically.
Particle size analysis (disregarding agglomerates possibly formed during analysis) showed a peak of
6nm and a range in the 15-60nm area as compared to a declared size of 26 nm (Dynamic light
scattering). Airborne nano-aerosols/particles were measured by SMPS (Scanning Mobility Particle
Sizer) and sampled on TEM-grids using an electrostatic particle sampler. The latter allowed
subsequent SEM (Scanning Electron Microscopy) image analysis and elemental identification with
an EDX (Energy-dispersive X-ray Spectroscopy) unit.
In control experiments, it was shown that nano-aerosols can be formed during propellant spraying
even if the product does not contain nanomaterials. These purely liquid aerosols could be removed
by applying a thermo-desorber before measurement. The authors conclude that that the pump
sprays release relatively large droplets/aerosols, which deposit on walls and floors and do therefore
not lead to exposure to free/dry nanoparticles. The propellant spray forms smaller (nm to µm
range) aerosols from which the water evaporates and leads to exposure to free/dry nanoparticles.
For the propellant spray, the authors showed that rapid particle loss takes place (possibly due to
agglomeration and deposition of these), but that a rather stable concentration is reached within
three minutes. Thereafter, particle concentration decreases very slowly indicating the potential for
long-term exposure to these non-agglomerated individual particles. Generally, the paper shows a
huge amount of variables in such experiments and that evaporation, deposition and agglomeration
phenomena are very complex. Possibly associated with this, the paper does not propose any
indicative exposure levels.
Michel et al. (2013) assessed the risks of the use of a glass cleaner supplied for consumers in "spray
trigger bottles". The product is water based and contains 0.09% (w/w) spherical synthetic
amorphous silica (SAS) nanoparticles as well as non-disclosed surfactants, solvents and other
cleaning agents. The reported size of the primary SAS nanoparticles was 9 nm, which was
confirmed with Dynamic Light Scattering (DLS) (range 4-40 nm) and TEM (range 10-20 nm). This
analysis showed that the nanoparticles had a large tendency to agglomerate/aggregate, which is
expected given the function of the SAS nanoparticles, in which the hydroxyl groups react with the
glass surface or with each other to form siloxane bonds. This self-organisation leads to enhanced
hydrophilic properties and thereby enhanced drainage, drying speed and reduced de-soiling. One
spray shot corresponds to approximately 2 mL (approx. 2 g of product). The authors representing
Hempel refer own data that have shown that the consumers that most frequently clean their
windows do so 3-4 times per year by applying the product on dirty surfaces with a few strokes and
thereafter wipe of the window using cleaning cloths. It is therefore likely that use will lead to
inhalation and dermal exposure, and even inadvertent oral exposure might occur from hand to
mouth or if the cleaning product is used on surfaces, which are subsequently used to handle
unpackaged food. However, inhalation is assumed the main (most important) exposure route. Laser
diffraction experiments were conducted to measure the aerosol droplets with open sieve (spray) and
closed sieve (foam). In both cases, no aerosols below 4 µm were detected. Thus. it was concluded
that aerosols were in a size range not expected to reach the alveoli. Consumer inhalation exposure
was modelled with ConsExpo. It is not entirely clear which parameters are used for the modelling,
but during "one cleaning event", it is estimated that the mean concentration is 0.002 mg SAS/m3 in
the surrounding of the consumer and the peak concentration 0.035 mg/m³ shortly after spraying.
An accidental scenario (spraying towards exposed person) resulted in 0.044 mg/m³. The paper goes
on with assessing risk (authors found no risk).
Nazarenko et al. (2011) analysed a range of spray products declared to contain nanoparticles and
corresponding "regular" products on which nanoparticle content is not declared, including a general
disinfectant. Sample analysis (TEM and Photo Correlation Spectroscopy), as well as particles in the
Exposure assessment of nanomaterials in consumer products 81
airborne state during simulated use (measured by SMPS and Aerodynamic Particle Sizer (APS))
show that the nano-products as well as the non-nanoproducts contain nanoparticles and result in a
range of particle sizes when used (14 nm – 20 µm). This indicates that consumers can be exposed to
particles, which deposit in all regions of the airway systems from nano as well as from regular
sprays. Overall, the authors are, however, hesitant to draw firm conclusions due to poor ingredient
lists and therefore challenges with optimising the analytical techniques towards the contained
chemistry. Experiments were conducted with the supplied spray mechanism as well as with two
standard nebulizers. These experiments show that particle generation and thus consumer exposure
is heavily influenced by the spraying mechanism, including that smaller aerosols more likely lead to
exposure to primary nanoparticles (higher likeliness of evaporation of the carrier liquid). The data
also showed that generally alcohol-based products generate lower particle size distributions as
compared to water-based (presumably due to quicker evaporation of alcohol compared to water).
Quadros and Marr (2011), addresses three spray products associated with nano-Ag technology of
which one is a surface disinfectant. No/very few nanoparticles were found in the surface
disinfectant and the authors therefore do not assess the human exposure to this product. Results for
the two other products are addressed in Section 5.3. However, it should be noted that the authors in
line with other authors note that spray mechanism/dynamics influence the aerosol
generation/exposure, but also note that concentration of nanomaterial in the sample might
influence release and exposure.
5.5 Examples of nanomaterial exposure from coating/impregnation
and maintenance products
5.5.1 Main findings
Data were found on products for impregnation of surfaces using an impregnated cloth for car
windows and for propellant spray products for either surface treatment of a bathroom or surface
treatment of shoes and for paints.
A dermal nanomaterial exposure of 8 x 10⁻³ mg/kg bw (or a total of 560 µg) per event was estimated
using a cloth for treatment of car windows impregnated with 1% nanomaterial.
Dermal nanomaterial exposure in relation to spraying bathroom surfaces was estimated to be 2 x
10-2 mg/kg (or a total of 1.2 mg) per event anticipating a nanomaterial content of 0.1% in the spray
and assuming 1% of the sprayed amount came into contact with skin.
Inhalational exposure for the nanomaterial during 40 minutes of stay in the bathroom and use of
118 ml of the spray was calculated to be 1.9 x 10⁻³ mg/kg bw or at a total of 114 µg nanomaterial.
For shoe impregnation products (as propellant sprays), the nanoparticle concentrations in the
breathing zone were measured to be about 1 x 10⁵ particles/cm3 (as liquid aerosols). During
spraying, the inhalational exposure for TiO2 (1.6wt% content in the aerosols) was calculated to be
3.4 µg TiO2 per minute.
Although based on few data, this indicates that in absolute figures the dermal exposure may be
more than an order of magnitude higher than the inhalational exposure for impregnation spray
products. The inhalational exposure to nanomaterials from spray product may be in the microgram
range per use event and within the nanogram range when expressed per kg bw. Inhalational
exposure expressed in nano-particle numbers may be within the range of 1-10 x 109 particles per
event (for a person inhaling a particle concentration level of 1 x 10⁵ particles/cm3 during several
minutes).
82
Dermal exposure for roller painting using ConsExpo was estimated to be 13.6 mg nano-TiO2/kg bw
per event.
Inhalation exposure for spray application of the paint was using ConsExpo estimated to be 0.016
mg nano-TiO2/kg bw per event.
5.5.2 Specific data
The Danish EPA (2007) study on nanomaterials in consumer products established an exposure
estimate for an impregnation product for car windows. The Technical Guidance Document on Risk
Assessment for Existing Substances (TGD 2003) was used as a basis for making the scenario.
The liquid product with an unspecified nanomaterial content of 1% was applied using a cloth on an
overall surface area of 5.4 m2 and using 10 ml/m2. It was assumed that 1% of the product used came
into contact with the skin per event (assumed as twice yearly). Based on this, a nanomaterial
exposure per event of 8 x 10⁻³ mg/kg bw was calculated for an adult man (70 kg bw).
For a spray product used for impregnation of surfaces in bathrooms, the Danish EPA (2007) study
estimated a dermal nanomaterial exposure of 2 x 10⁻² mg/kg bw and an inhalational exposure of 1.9
x 10-3 mg/kg bw per event for a woman (60 kg bw) using the product . This was based on a
nanomaterial content in the product of 0.1% and a use of 10 ml/m2 on a total surface area of 11.75
m2.
For the dermal exposure, 1% of the product volume used was assumed to come into contact with
skin. For the inhalational exposure, the concentration of the nanomaterial in the bathroom of 7.5
m3 was calculated based on the amount sprayed divided by the room size. The inhalational exposure
was then calculated based on a 40 minutes stay in the bathroom during application with a
respiratory rate of 26 m3/24 h during light work.
Nano-TiO2
NANEX (2010) used the ConsExpo model to calculate the dermal exposure in relation to painting
(brush or roller application) with water based paint containing 25% nano-TiO2. A dermal load of
nano-TiO2 was calculated to 1.05 mg/cm2 on a skin area (both hands) of 860 cm2 leading to a
dermal exposure of 13.6 mg/ kg bw.
Using the ConsExpo model for spray application of the paint, the inhalational exposure was
calculated to be 0.0157 mg nano-TiO2/kg bw during 25 minutes of exposure at an average
concentration in air of 1.7 mg nano-TiO2/m3. The dermal load and the dermal exposure was
estimated to be 0.425 mg/cm2 and 5.63 mg/kg bw, respectively. The oral (non-respirable) exposure
was estimated to be 0.112 mg nano-TiO2/kg bw per event (NANEX 2010).
Chen et al. (2010) analysed the aerosols generated from a bathroom cleaner/sanitizer containing
TiO2 dispensed as a propellant spray. The spraying was performed in a chamber set-up using
realistic spraying conditions during 2.5 minutes. Results indicated that, while aerosol droplets were
large with a count median diameter of 22 µm during spraying, the final aerosol contained primarily
solid titanium dioxide particles with a diameter of 75 nm. This size reduction was due to the surface
deposition of the droplets and the rapid evaporation of the aerosol propellant. In the breathing
zone, the aerosol, containing primarily individual particles (>90%), had a mass concentration of 3.4
mg/m3 or 1.6 x 10⁵ particles/cm3, with a nanoparticle fraction limited to 170 µg/m3 or 1 .2 x 105
particles/cm3 (i.e. 1 µg corresponds to 7 x 10⁸ particles).
Assuming a peak TiO2 aerosol concentration of 3.4 mg/m3 with a MMAD of 836 nm (or MMAD of
395 nm), a minute ventilation rate of 20 L/min and a deposition fraction of 11.3%, and a alveolar
surface of 102 m², 1 minute of spraying would result in 0.0075 µg titanium dioxide per m2 alveolar
epithelium per minute or a total alveolar dose of 7.65 µg titanium dioxide. No data on the TiO2
Exposure assessment of nanomaterials in consumer products 83
content in the product was given; however, the sprayed aerosols contained 1.6 wt% dry weight. The
nano-aerosol exposure can be calculated to 3.4 µg per minute and 2.4 x 10⁹ particles per minute.
These data may be compared to the Danish data above where the exposure for a 40 minutes spray
with a product concentration of 0.1% resulted in an inhalational exposure of 1.9 x 10⁻³ mg/kg bw.
This exposure would have been 16 times higher i.e. 3.0 x 10⁻² mg/kg bw (or 30 µg/kg bw) if a
content of 1.6% in the product was used.
When using the Chen et al. (2010) exposure rate of 3.4 µg per minute, then 40 minutes of
inhalational exposure would lead to 136 µg of inhalational exposure assuming all nano-aerosol mass
is consisting of titanium dioxide (or to 96 x 109 titanium dioxide nanoparticles). This would for a 60
kg person correspond to a nanomaterial exposure of 2.3 µg/kg bw, which is a factor 13 lower than
the calculated Danish exposure scenario. Thus, the calculated scenario may be considered as a
conservative but maybe still realistic scenario as great variations may be anticipated for consumer
inhalation scenarios.
Silane, siloxane and TiO2 mixed with silane and siloxane
Nørgaard et al. (2009) studied the aerosol size-distributions and chemistry during simulated
application of four different easy-to-clean surface-treatment spray products and concluded with a
preliminary worst-case assessment of the exposure in a 17.4 m2 standard model room. Three of the
products were pump-sprays of which one of them (NFP3) contained nano-TiO2 anatase particles.
According to the data sheets, the pump sprays, NFP1 (intended for making self-cleaning non-
adsorbing floor materials) contained non-specified fluorosilane in a 2-propanol solvent and NFP2
(intended for making self-cleaning ceramic tiles) contained siloxane in an ethanol-methanol
mixture. NFP3 (intended for making self-cleaning windows) contained nano-TiO2 in ethanol
solvent. The fourth product (NFP4) was a pressurized spray can product for general cleaning
application containing propane/butane (propellant) and kerosene. The spray tests were conducted
in a 0.66 m3 fully mixed air closed aerosol chamber in stainless steel. Product corresponding to the
recommended use for 1 m2 was sprayed onto a stainless steel plate at the recommended surface-to-
nozzle-distance of 35 cm. Air-borne particles and SVOCs was sampled 20 cm behind the spray
bottle to represent the position of the user inhalation zone. Nano-size particles (6-523 nm) were
measured using a Fast Mobility Particle Sizer (FMPS) whereas µm-size particles (0.5 – 18.4 µm)
were measured using an APS. Volatile Organic Compounds were measured using MIMs and GC-MS
and GC/FID. All experiments were conducted at 25ºC and 23% RH.
The results showed several sizes-modes of airborne nm- to µm-size particles after use of all the
spray products. The observed particle size-distributions and concentration trends revealed complex
particle formation, growth and evaporation in the air after use of these products. The gas-phase
chemical analysis also showed a more complex chemistry in the products than reported by the
distributer. Overall, in the tests the pump sprays generated 3.1 x 10⁸ to 3.6 x 10⁸ airborne
particles/m3/g product used, whereas the pressurized spray-can (NFP4) generated 2.1 x 10¹⁰
particles/m3/g product used. The fluoro-silane and siloxane pump-spray products are thought to
produce particles as a result of solvent evaporation and condensation of the active surface-coating
ingredients. For the TiO2 anatase surface coating product (NFP3), cyclohexasiloxane and
cycloheptasiloxane were found in the emissions in addition to the expected TiO2 anatase. Use of
NFP4 was associated with emission of numerous volatiles, including especially alkanes, various
siloxanes, and relatively high contents of limonene, an often used fragrance, but not reported in this
product. Exposure assessment for NFP1 and NFP2 pump spray products showed that
concentrations exceeding 1.5 x 10⁶ particles/cm3 could be reached treating a 7 m2 surface in a 17.4
m2 standard model room without ventilation. The particle exposure levels applying the gas
propellant NFP4 spray would be approx. 100 times higher than for NFP1 and 2. NFP3 is intended
84
for outdoor treatment of windows, why dilution is anticipated to be very rapid reducing the level of
exposure considerably.
Due to observed acute hazardous risk to the airways caused by hydroxylated per-fluorinated silanes
and siloxanes (Nørgaard et al., 2010) NFP1 was taken of the Danish market on request by the
Danish EPA. The specific anatase-based NFP3 is also no longer available on the Danish market, but
other comparable products exist.
Zinc oxide (ZnO)
Lorenz et al. (2011) measured aerosols generated from a shoe impregnation product from a
propellant gas vessel with a zinc content of 470 mg Zn/kg (analysed as Zn-ions). Aerosols were
generated in a box with dimensions reflecting the near-field breathing zone exposure of a consumer
and analysed using a scanning mobility particle sizer and electron microscopy. ZnO particles were
further verified by the chemical analysis and electron microscopy. In addition, chlorine and fluorine
were detected in the chemical analysis suggesting that acrylate polymers were present in the
product. When spraying the highest particle number concentrations were obtained for particle sizes
below 15 nm. The aerosol number concentration for 1 g of spraying was 7.6 x 10⁴/cm3. Zinc particles
were only observed in the micrometer range of particles and particles below 100 nm was therefore
considered to consist of acrylate polymers.
Consumer exposure was calculated based on use of 18.5 g of the product during 8 minutes and a
measured average particle number concentration during the period of 1.14 x 10⁶. When inhaling
10650 cm3 air/ minute, the exposure of the various respiratory regions could be modelled to 4.5 x
1010 particles for the alveolar regions; 1.4 x 10¹⁰ for the tracheobronchial region and 4.8 x 10⁹ for the
nasal region.
Similar exposure levels could be calculated for another shoe impregnation product that only
contained fluorine and chlorine and which therefore was suggested to only contain acrylate
polymers.
5.6 Examples of nanomaterial exposure from textiles
5.6.1 Main findings
The number of different textiles with nanomaterials is rather wide and includes all from inner to
outer clothing, shoes, blankets and textile cuddle toys for children. Ag and TiO2 are by far the most
common nanomaterial used in textiles while CNT are potentially soon emerging on the European
market for wearable electronic textiles. Textiles as a component in other products or articles are not
covered by this analysis. The exposure route is primarily dermal, but for babies and smaller children
the oral pathway, is also a likely route of exposure.
Data were found on textiles treated with Ag and TiO2. No data on use of carbon nanotubes (CNT) in
textiles from the market have been found.
From the Danish market, Ag-content in textiles has been measured in the range of 0.037 µg Ag/g
in a sandal to 10 300 µg Ag/g in the cuddly toy.
From migration data on a tank-top containing 12 µg Ag/g a dermal exposure to a girl (up to 9 years
old) of 12.7 µg Ag/kg bw day was estimated. For a similar scenario, the ConsExpo model estimated a
dermal exposure three times higher when using a content of 10 µg Ag/g in a T-shirt and a migration
rate of 45%.
Such estimations may be very sensitive to different degrees of migration rates of the Ag from the
textile as experimental data found here indicate a very high degree of variability (from 2% and up to
Exposure assessment of nanomaterials in consumer products 85
38%). Overall, these similar results from measured data and the use of the ConsExpo model
indicate that ConsExpo may be an appropriate tool for estimating dermal exposure from textiles.
Based on migration data on the cuddly toy (as indicated above) an oral exposure of 0.042 µg Ag/kg
bw day was estimated in relation to sucking of the toy by a child.
Migration of Ag has most often in literature been measured as Ag ions, but in one case it was
indicated that silver particles < 450 nm was found in the migration fluid as well.
Wash data from textiles treated with TiO2 in the range of 2,153 to 7,149 mg Ti/g indicate generally
very low migration of 0.01-0.06% of TiO2 with worst case wash out levels of 3-4%. The migration is
mainly due to particulates. Based on migration data, dermal exposure from a shirt with a titanium
content at 7,149 µg Ti/g textile has been estimated to be 11.6 µg Ti/kg bw for an adult person.
5.6.2 Specific data
Silver (Ag)
The Danish EPA (2012) report on nano-Ag in textiles made three consumer exposure scenarios for
textiles that contained Ag based on chemical analysis. (Using EDX the content of nano-Ag particles
could however, not be verified).
For a shoe insole with an Ag content of 19 µg Ag/g, a dermal exposure of 0.42 µg Ag/kg bw day was
estimated based of a measured migration rate of silver from the shoe insole of 0.12 µg Ag/cm2/8
hours, a skin contact area of the feet of 300 cm2, a contact duration of 8 hours and a body weight of
70 kg.
For a tank top with a silver content of 12 µg Ag/g for 3-9 year-old girls, a dermal exposure of 12.7 µg
Ag/kg bw day was estimated based on a measured migration rate of Ag from the tank top of 0.09
µg Ag/cm2/16 hours, a skin contact area of 2,340 cm2, a contact duration of 16 hours and a body
weight of 16.3 kg.
For a cuddly toy with an Ag content of 10 300 µg Ag/g, an oral exposure due to mouthing of the toy
by a 2 year-old child was estimated to be 0.042 µg Ag/kg bw/day. This was based on a measured
migration of 58 ng Ag/cm2/2 hours in artificial saliva, a mouthing area of 10 cm2, a mouthing
duration of 2 hours and a body weight of 13.7 kg.
A total of 18 types of textiles were examined and the Ag contents were found in the range of 0.037
µg Ag/g in a sandal to 10 300 µg Ag/g in the cuddly toy.
The NANEX (2010) project made exposure assessments using the ECHA guidance for Consumer
Exposure Estimation (version 2008) and the ECETOC TRA and ConsExpo tool for consumer
exposure to nano-Ag in socks (Ag content of 2.4 mg/g) and a T-shirt (Ag content 10 µg/g) .
The following results were obtained in relations to worst-case assumptions (leaching of 45% of the
Ag from the textile) using the various approaches:
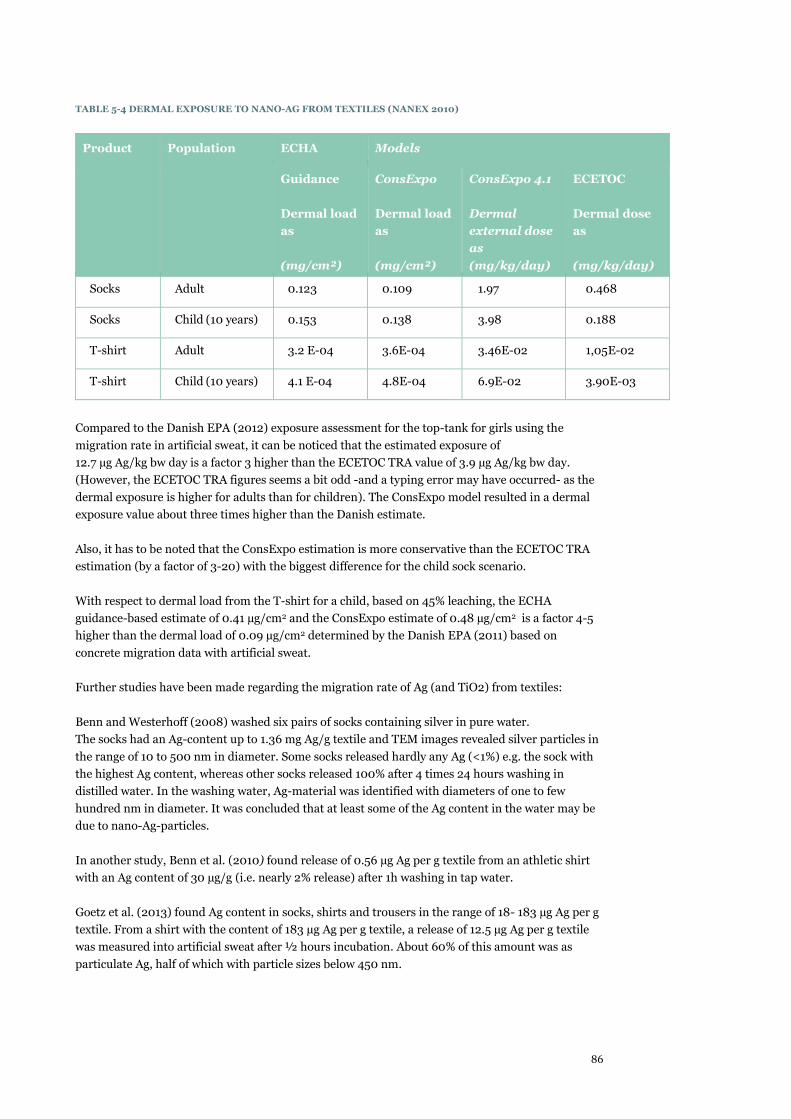
86
TABLE 5-4 DERMAL EXPOSURE TO NANO-AG FROM TEXTILES (NANEX 2010)
Product Population ECHA Models
Guidance
Dermal load
as
(mg/cm²)
ConsExpo
Dermal load
as
(mg/cm²)
ConsExpo 4.1
Dermal
external dose
as
(mg/kg/day)
ECETOC
Dermal dose
as
(mg/kg/day)
Socks Adult 0.123 0.109 1.97 0.468
Socks Child (10 years) 0.153 0.138 3.98 0.188
T-shirt Adult 3.2 E-04 3.6E-04 3.46E-02 1,05E-02
T-shirt Child (10 years) 4.1 E-04 4.8E-04 6.9E-02 3.90E-03
Compared to the Danish EPA (2012) exposure assessment for the top-tank for girls using the
migration rate in artificial sweat, it can be noticed that the estimated exposure of
12.7 µg Ag/kg bw day is a factor 3 higher than the ECETOC TRA value of 3.9 µg Ag/kg bw day.
(However, the ECETOC TRA figures seems a bit odd -and a typing error may have occurred- as the
dermal exposure is higher for adults than for children). The ConsExpo model resulted in a dermal
exposure value about three times higher than the Danish estimate.
Also, it has to be noted that the ConsExpo estimation is more conservative than the ECETOC TRA
estimation (by a factor of 3-20) with the biggest difference for the child sock scenario.
With respect to dermal load from the T-shirt for a child, based on 45% leaching, the ECHA
guidance-based estimate of 0.41 µg/cm2 and the ConsExpo estimate of 0.48 µg/cm2 is a factor 4-5
higher than the dermal load of 0.09 µg/cm2 determined by the Danish EPA (2011) based on
concrete migration data with artificial sweat.
Further studies have been made regarding the migration rate of Ag (and TiO2) from textiles:
Benn and Westerhoff (2008) washed six pairs of socks containing silver in pure water.
The socks had an Ag-content up to 1.36 mg Ag/g textile and TEM images revealed silver particles in
the range of 10 to 500 nm in diameter. Some socks released hardly any Ag (<1%) e.g. the sock with
the highest Ag content, whereas other socks released 100% after 4 times 24 hours washing in
distilled water. In the washing water, Ag-material was identified with diameters of one to few
hundred nm in diameter. It was concluded that at least some of the Ag content in the water may be
due to nano-Ag-particles.
In another study, Benn et al. (2010) found release of 0.56 µg Ag per g textile from an athletic shirt
with an Ag content of 30 µg/g (i.e. nearly 2% release) after 1h washing in tap water.
Goetz et al. (2013) found Ag content in socks, shirts and trousers in the range of 18- 183 µg Ag per g
textile. From a shirt with the content of 183 µg Ag per g textile, a release of 12.5 µg Ag per g textile
was measured into artificial sweat after ½ hours incubation. About 60% of this amount was as
particulate Ag, half of which with particle sizes below 450 nm.
Exposure assessment of nanomaterials in consumer products 87
Based on these measurements, a dermal exposure of 17.1 µg Ag/kg bw as total Ag and a exposure of
8.2 µg Ag/kg bw as Ag particles below 420 nm was estimated for an adult man wearing Ag-
functionalized trousers and T-shirt.
For the exposure estimate, the following algorithm was used:
E (µg/kg) = mtextile x asubst x rsweat x texpo x Aexpo x fcontact / mbw
Where
mtextile = weight of the textile (g)
asubst = released amount of substance from fabric into sweat (µg/g/mL)
rsweat = released volume of sweat per time and body weight (mL/min/m2; 1.8 and 1.25
mL/min/m2 used for males and females)
texpo = duration of exposure (min)
Aexpo = body surface area covered by the fabric (m2)
fcontact = fraction of fabric in close contact with sweat and skin
mbw = body weight (kg; 77 kg and 62 kg used for men and women)
In another study from the group, eight pieces of textiles containing Ag (three of which containing
nano-Ag) were examined. The initial Ag content of the textiles was between 1.5 and 2 925 mg
Ag/kg. Only four of the investigated textiles leached detectable amounts of Ag during washing (in
wash machines with detergent at 40 oC for 45 minutes). 34–80% of the Ag was in the form of
particles larger than 450 nm. Microscopic analysis of the particles released in the washing solutions
identified Ti/Si–AgCl nanocomposites, AgCl nanoparticles, large AgCl particles, nano-Ag sulfide
and metallic nano-Ag, respectively. The nanoparticles were mainly found in highly agglomerated
form. The fraction of Ag released in one washing/rinsing cycle compared to the initial amount was
20%, 14.8%, 23.5% and 17.6% for the four textiles releasing silver (Lorenz et al. 2012).
Quadros et al. (2013) measured the migration of Ag into tap water, saliva, sweat and urine from a
children plush toy and a baby blanket containing 48.2 and 109.8 µ Ag per g textile. Highest degrees
of migrations were measured into sweat and urine. Thus, 38% and 36% of the Ag in the plush toy
were liberated into sweat and urine after 2 hours at 37 oC from the plush toy, whereas 4.4% and
3.4% was liberated from the baby blanket. When wiping the textiles with dermal wipes there was an
Ag transfer rate of 23 µg Ag/m2 and 13.8 µg Ag/m2 onto the wipes from the baby blanket and the
plush toy, respectively.
From these data, it can be concluded that the migration of Ag from textiles can vary quite a lot.
Therefore, a default assumption of 45% as used by NANEX (2010) may not seem quite unrealistic as
worst case assumptions for dermal exposure.
Titanium dioxide (TiO2)
Windler et al. (2012) found generally low migration of 0.01-0.06% of TiO2 during washing from
textiles that were sun protected with TiO2 in a concentration of 2 153 to 7 149 mg Ti/g. One textile,
however, liberated 3.4% during a wash. Particle sizes in the textiles were in the range of 60 to 700
nm and particle sizes in the wash water in the range of 60-350 nm. Goetz et al. (2013) estimated a
dermal exposure level of 11.6 µg Ti/kg bw based on similar migration rates measured from a TiO2-
functionalized shirt with titanium content at 7 149 µg Ti/g textile. The TiO2 migration occurred
mainly in form of particulates.
For TiO2 in textiles, a realistic worst-case assumption for dermal exposure may be a migration of 3-
4% of the content.
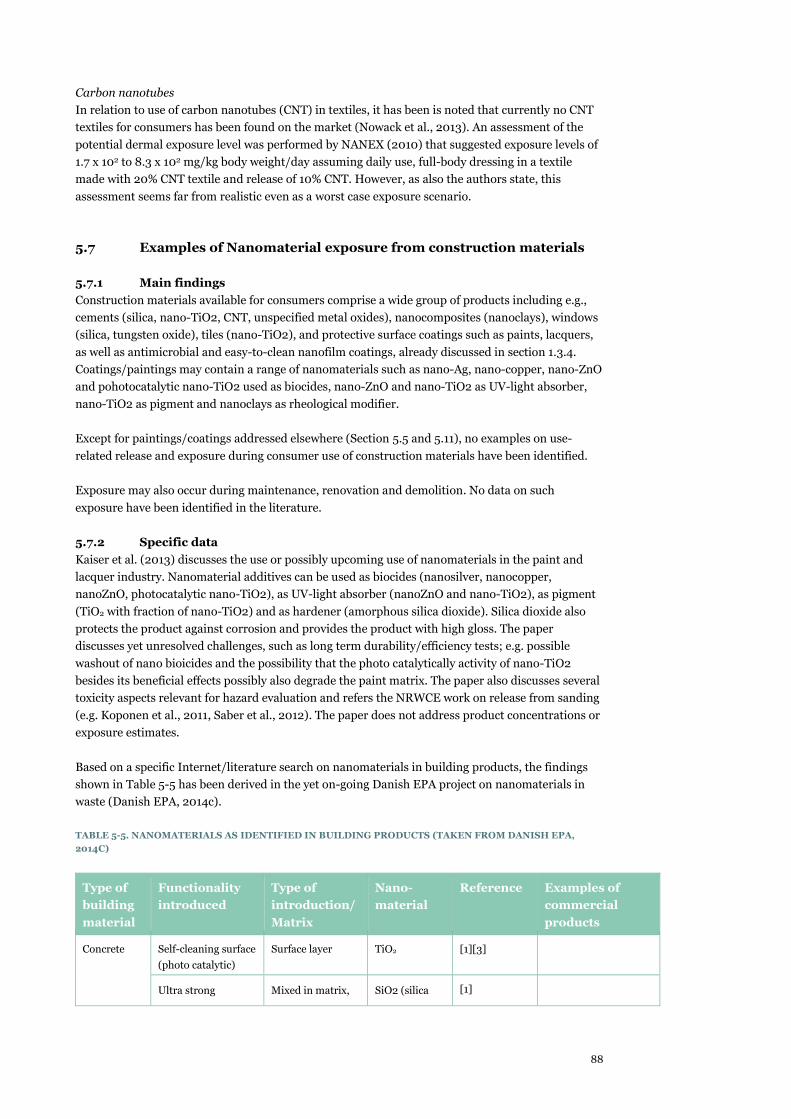
88
Carbon nanotubes
In relation to use of carbon nanotubes (CNT) in textiles, it has been is noted that currently no CNT
textiles for consumers has been found on the market (Nowack et al., 2013). An assessment of the
potential dermal exposure level was performed by NANEX (2010) that suggested exposure levels of
1.7 x 10² to 8.3 x 10² mg/kg body weight/day assuming daily use, full-body dressing in a textile
made with 20% CNT textile and release of 10% CNT. However, as also the authors state, this
assessment seems far from realistic even as a worst case exposure scenario.
5.7 Examples of Nanomaterial exposure from construction materials
5.7.1 Main findings
Construction materials available for consumers comprise a wide group of products including e.g.,
cements (silica, nano-TiO2, CNT, unspecified metal oxides), nanocomposites (nanoclays), windows
(silica, tungsten oxide), tiles (nano-TiO2), and protective surface coatings such as paints, lacquers,
as well as antimicrobial and easy-to-clean nanofilm coatings, already discussed in section 1.3.4.
Coatings/paintings may contain a range of nanomaterials such as nano-Ag, nano-copper, nano-ZnO
and pohotocatalytic nano-TiO2 used as biocides, nano-ZnO and nano-TiO2 as UV-light absorber,
nano-TiO2 as pigment and nanoclays as rheological modifier.
Except for paintings/coatings addressed elsewhere (Section 5.5 and 5.11), no examples on use-
related release and exposure during consumer use of construction materials have been identified.
Exposure may also occur during maintenance, renovation and demolition. No data on such
exposure have been identified in the literature.
5.7.2 Specific data
Kaiser et al. (2013) discusses the use or possibly upcoming use of nanomaterials in the paint and
lacquer industry. Nanomaterial additives can be used as biocides (nanosilver, nanocopper,
nanoZnO, photocatalytic nano-TiO2), as UV-light absorber (nanoZnO and nano-TiO2), as pigment
(TiO2 with fraction of nano-TiO2) and as hardener (amorphous silica dioxide). Silica dioxide also
protects the product against corrosion and provides the product with high gloss. The paper
discusses yet unresolved challenges, such as long term durability/efficiency tests; e.g. possible
washout of nano bioicides and the possibility that the photo catalytically activity of nano-TiO2
besides its beneficial effects possibly also degrade the paint matrix. The paper also discusses several
toxicity aspects relevant for hazard evaluation and refers the NRWCE work on release from sanding
(e.g. Koponen et al., 2011, Saber et al., 2012). The paper does not address product concentrations or
exposure estimates.
Based on a specific Internet/literature search on nanomaterials in building products, the findings
shown in Table 5-5 has been derived in the yet on-going Danish EPA project on nanomaterials in
waste (Danish EPA, 2014c).
TABLE 5-5. NANOMATERIALS AS IDENTIFIED IN BUILDING PRODUCTS (TAKEN FROM DANISH EPA,
2014C)
Type of
building
material
Functionality
introduced
Type of
introduction/
Matrix
Nano-
material
Reference Examples of
commercial
products
Concrete Self-cleaning surface
(photo catalytic)
Surface layer TiO2 [1][3]
Ultra strong Mixed in matrix, SiO2 (silica [1]
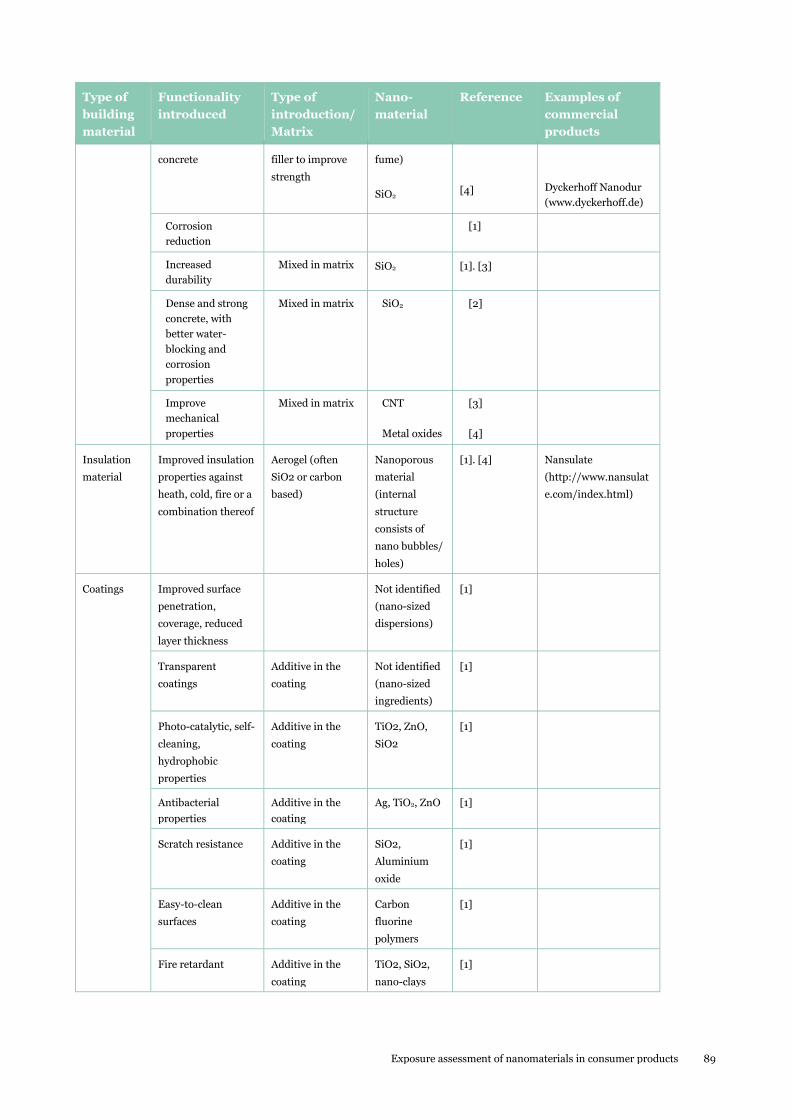
Exposure assessment of nanomaterials in consumer products 89
Type of
building
material
Functionality
introduced
Type of
introduction/
Matrix
Nano-
material
Reference Examples of
commercial
products
concrete filler to improve
strength
fume)
SiO2
[4]
Dyckerhoff Nanodur
(www.dyckerhoff.de)
Corrosion
reduction
[1]
Increased
durability
Mixed in matrix SiO2 [1]. [3]
Dense and strong
concrete, with
better water-
blocking and
corrosion
properties
Mixed in matrix SiO2 [2]
Improve
mechanical
properties
Mixed in matrix CNT
Metal oxides
[3]
[4]
Insulation
material
Improved insulation
properties against
heath, cold, fire or a
combination thereof
Aerogel (often
SiO2 or carbon
based)
Nanoporous
material
(internal
structure
consists of
nano bubbles/
holes)
[1]. [4] Nansulate
(http://www.nansulat
e.com/index.html)
Coatings Improved surface
penetration,
coverage, reduced
layer thickness
Not identified
(nano-sized
dispersions)
[1]
Transparent
coatings
Additive in the
coating
Not identified
(nano-sized
ingredients)
[1]
Photo-catalytic, self-
cleaning,
hydrophobic
properties
Additive in the
coating
TiO2, ZnO,
SiO2
[1]
Antibacterial
properties
Additive in the
coating
Ag, TiO2, ZnO [1]
Scratch resistance Additive in the
coating
SiO2,
Aluminium
oxide
[1]
Easy-to-clean
surfaces
Additive in the
coating
Carbon
fluorine
polymers
[1]
Fire retardant Additive in the
coating
TiO2, SiO2,
nano-clays
[1]
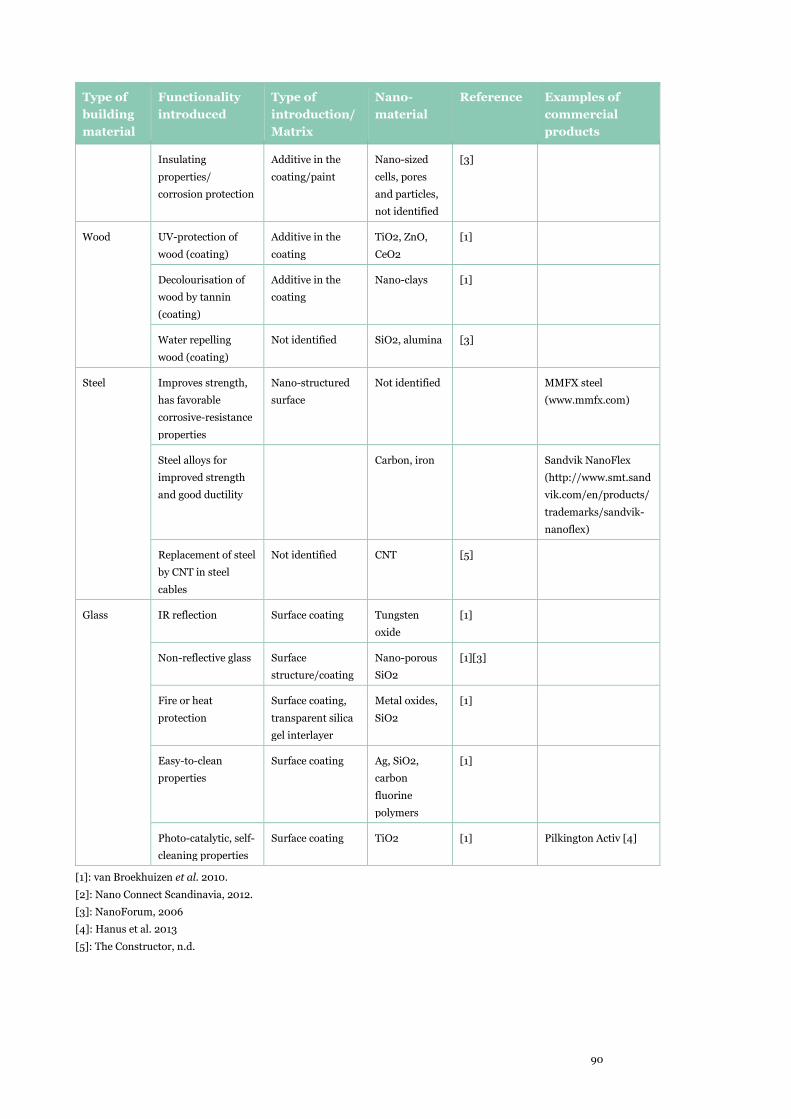
90
Type of
building
material
Functionality
introduced
Type of
introduction/
Matrix
Nano-
material
Reference Examples of
commercial
products
Insulating
properties/
corrosion protection
Additive in the
coating/paint
Nano-sized
cells, pores
and particles,
not identified
[3]
Wood UV-protection of
wood (coating)
Additive in the
coating
TiO2, ZnO,
CeO2
[1]
Decolourisation of
wood by tannin
(coating)
Additive in the
coating
Nano-clays [1]
Water repelling
wood (coating)
Not identified SiO2, alumina [3]
Steel Improves strength,
has favorable
corrosive-resistance
properties
Nano-structured
surface
Not identified MMFX steel
(www.mmfx.com)
Steel alloys for
improved strength
and good ductility
Carbon, iron Sandvik NanoFlex
(http://www.smt.sand
vik.com/en/products/
trademarks/sandvik-
nanoflex)
Replacement of steel
by CNT in steel
cables
Not identified CNT [5]
Glass IR reflection Surface coating Tungsten
oxide
[1]
Non-reflective glass Surface
structure/coating
Nano-porous
SiO2
[1][3]
Fire or heat
protection
Surface coating,
transparent silica
gel interlayer
Metal oxides,
SiO2
[1]
Easy-to-clean
properties
Surface coating Ag, SiO2,
carbon
fluorine
polymers
[1]
Photo-catalytic, self-
cleaning properties
Surface coating TiO2 [1] Pilkington Activ [4]
[1]: van Broekhuizen et al. 2010.
[2]: Nano Connect Scandinavia, 2012.
[3]: NanoForum, 2006
[4]: Hanus et al. 2013
[5]: The Constructor, n.d.
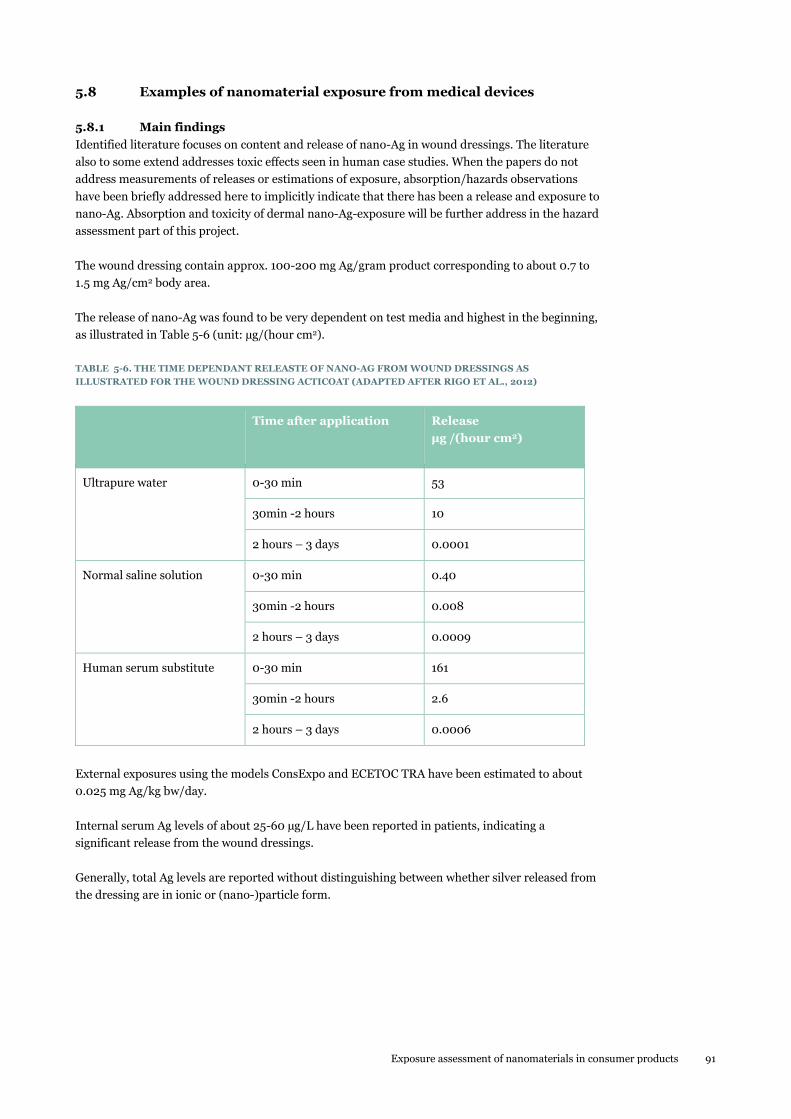
Exposure assessment of nanomaterials in consumer products 91
5.8 Examples of nanomaterial exposure from medical devices
5.8.1 Main findings
Identified literature focuses on content and release of nano-Ag in wound dressings. The literature
also to some extend addresses toxic effects seen in human case studies. When the papers do not
address measurements of releases or estimations of exposure, absorption/hazards observations
have been briefly addressed here to implicitly indicate that there has been a release and exposure to
nano-Ag. Absorption and toxicity of dermal nano-Ag-exposure will be further address in the hazard
assessment part of this project.
The wound dressing contain approx. 100-200 mg Ag/gram product corresponding to about 0.7 to
1.5 mg Ag/cm2 body area.
The release of nano-Ag was found to be very dependent on test media and highest in the beginning,
as illustrated in Table 5-6 (unit: µg/(hour cm2).
TABLE 5-6. THE TIME DEPENDANT RELEASTE OF NANO-AG FROM WOUND DRESSINGS AS
ILLUSTRATED FOR THE WOUND DRESSING ACTICOAT (ADAPTED AFTER RIGO ET AL., 2012)
Time after application Release
µg /(hour cm2)
Ultrapure water 0-30 min 53
30min -2 hours 10
2 hours – 3 days 0.0001
Normal saline solution 0-30 min 0.40
30min -2 hours 0.008
2 hours – 3 days 0.0009
Human serum substitute 0-30 min 161
30min -2 hours 2.6
2 hours – 3 days 0.0006
External exposures using the models ConsExpo and ECETOC TRA have been estimated to about
0.025 mg Ag/kg bw/day.
Internal serum Ag levels of about 25-60 µg/L have been reported in patients, indicating a
significant release from the wound dressings.
Generally, total Ag levels are reported without distinguishing between whether silver released from
the dressing are in ionic or (nano-)particle form.
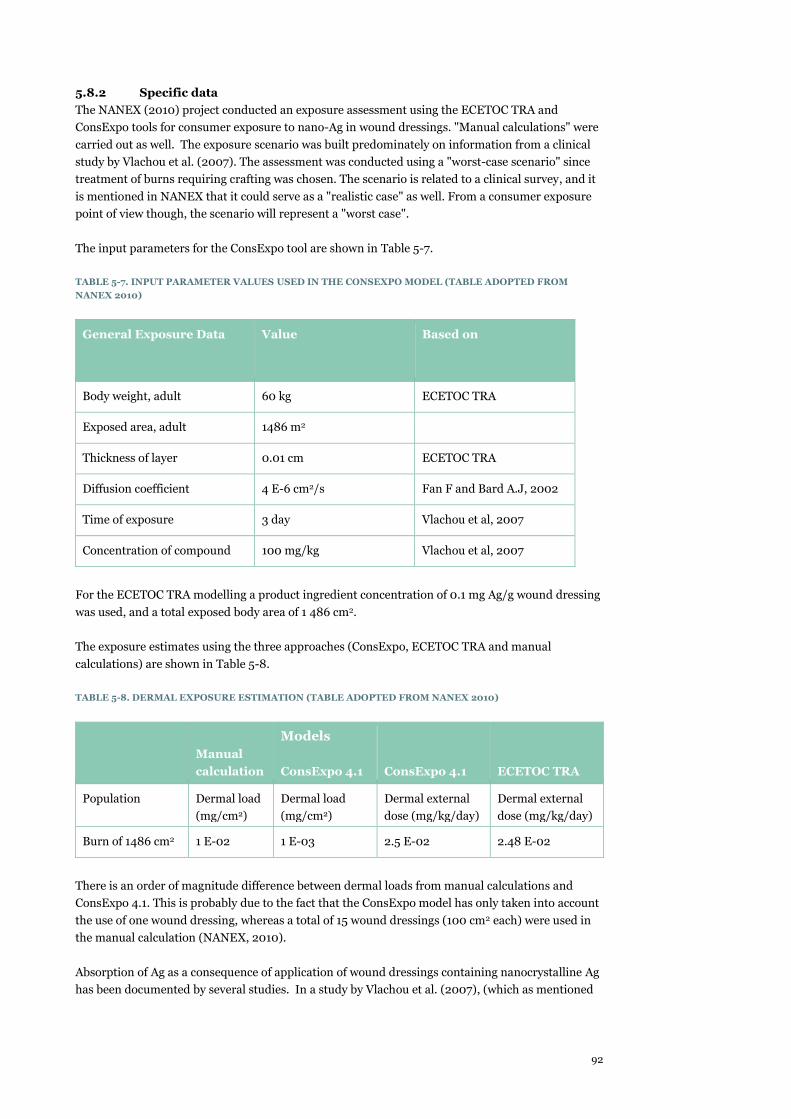
92
5.8.2 Specific data
The NANEX (2010) project conducted an exposure assessment using the ECETOC TRA and
ConsExpo tools for consumer exposure to nano-Ag in wound dressings. "Manual calculations" were
carried out as well. The exposure scenario was built predominately on information from a clinical
study by Vlachou et al. (2007). The assessment was conducted using a "worst-case scenario" since
treatment of burns requiring crafting was chosen. The scenario is related to a clinical survey, and it
is mentioned in NANEX that it could serve as a "realistic case" as well. From a consumer exposure
point of view though, the scenario will represent a "worst case".
The input parameters for the ConsExpo tool are shown in Table 5-7.
TABLE 5-7. INPUT PARAMETER VALUES USED IN THE CONSEXPO MODEL (TABLE ADOPTED FROM
NANEX 2010)
General Exposure Data Value Based on
Body weight, adult 60 kg ECETOC TRA
Exposed area, adult 1486 m2
Thickness of layer 0.01 cm ECETOC TRA
Diffusion coefficient 4 E-6 cm2/s Fan F and Bard A.J, 2002
Time of exposure 3 day Vlachou et al, 2007
Concentration of compound 100 mg/kg Vlachou et al, 2007
For the ECETOC TRA modelling a product ingredient concentration of 0.1 mg Ag/g wound dressing
was used, and a total exposed body area of 1 486 cm2.
The exposure estimates using the three approaches (ConsExpo, ECETOC TRA and manual
calculations) are shown in Table 5-8.
TABLE 5-8. DERMAL EXPOSURE ESTIMATION (TABLE ADOPTED FROM NANEX 2010)
Manual
calculation
Models
ConsExpo 4.1
ConsExpo 4.1
ECETOC TRA
Population Dermal load
(mg/cm2)
Dermal load
(mg/cm2)
Dermal external
dose (mg/kg/day)
Dermal external
dose (mg/kg/day)
Burn of 1486 cm2 1 E-02 1 E-03 2.5 E-02 2.48 E-02
There is an order of magnitude difference between dermal loads from manual calculations and
ConsExpo 4.1. This is probably due to the fact that the ConsExpo model has only taken into account
the use of one wound dressing, whereas a total of 15 wound dressings (100 cm2 each) were used in
the manual calculation (NANEX, 2010).
Absorption of Ag as a consequence of application of wound dressings containing nanocrystalline Ag
has been documented by several studies. In a study by Vlachou et al. (2007), (which as mentioned
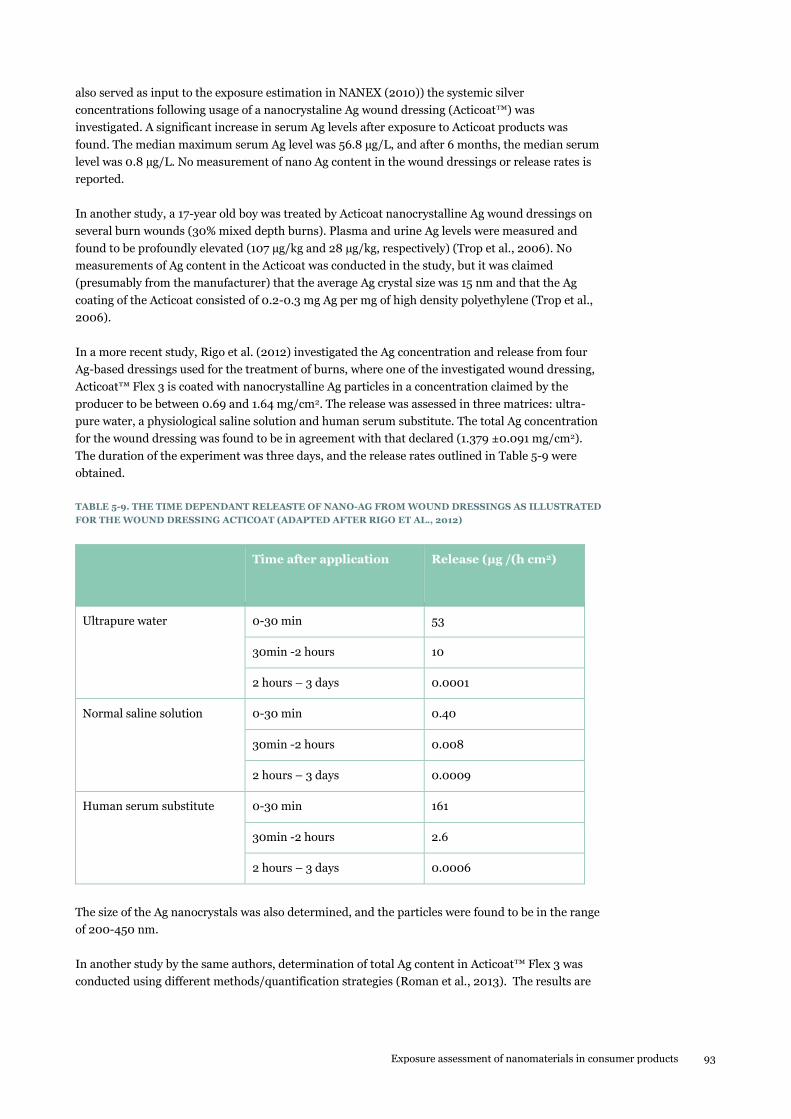
Exposure assessment of nanomaterials in consumer products 93
also served as input to the exposure estimation in NANEX (2010)) the systemic silver
concentrations following usage of a nanocrystaline Ag wound dressing (Acticoat™) was
investigated. A significant increase in serum Ag levels after exposure to Acticoat products was
found. The median maximum serum Ag level was 56.8 µg/L, and after 6 months, the median serum
level was 0.8 µg/L. No measurement of nano Ag content in the wound dressings or release rates is
reported.
In another study, a 17-year old boy was treated by Acticoat nanocrystalline Ag wound dressings on
several burn wounds (30% mixed depth burns). Plasma and urine Ag levels were measured and
found to be profoundly elevated (107 µg/kg and 28 µg/kg, respectively) (Trop et al., 2006). No
measurements of Ag content in the Acticoat was conducted in the study, but it was claimed
(presumably from the manufacturer) that the average Ag crystal size was 15 nm and that the Ag
coating of the Acticoat consisted of 0.2-0.3 mg Ag per mg of high density polyethylene (Trop et al.,
2006).
In a more recent study, Rigo et al. (2012) investigated the Ag concentration and release from four
Ag-based dressings used for the treatment of burns, where one of the investigated wound dressing,
Acticoat™ Flex 3 is coated with nanocrystalline Ag particles in a concentration claimed by the
producer to be between 0.69 and 1.64 mg/cm2. The release was assessed in three matrices: ultra-
pure water, a physiological saline solution and human serum substitute. The total Ag concentration
for the wound dressing was found to be in agreement with that declared (1.379 ±0.091 mg/cm2).
The duration of the experiment was three days, and the release rates outlined in Table 5-9 were
obtained.
TABLE 5-9. THE TIME DEPENDANT RELEASTE OF NANO-AG FROM WOUND DRESSINGS AS ILLUSTRATED
FOR THE WOUND DRESSING ACTICOAT (ADAPTED AFTER RIGO ET AL., 2012)
Time after application Release (µg /(h cm2)
Ultrapure water 0-30 min 53
30min -2 hours 10
2 hours – 3 days 0.0001
Normal saline solution 0-30 min 0.40
30min -2 hours 0.008
2 hours – 3 days 0.0009
Human serum substitute 0-30 min 161
30min -2 hours 2.6
2 hours – 3 days 0.0006
The size of the Ag nanocrystals was also determined, and the particles were found to be in the range
of 200-450 nm.
In another study by the same authors, determination of total Ag content in Acticoat™ Flex 3 was
conducted using different methods/quantification strategies (Roman et al., 2013). The results are
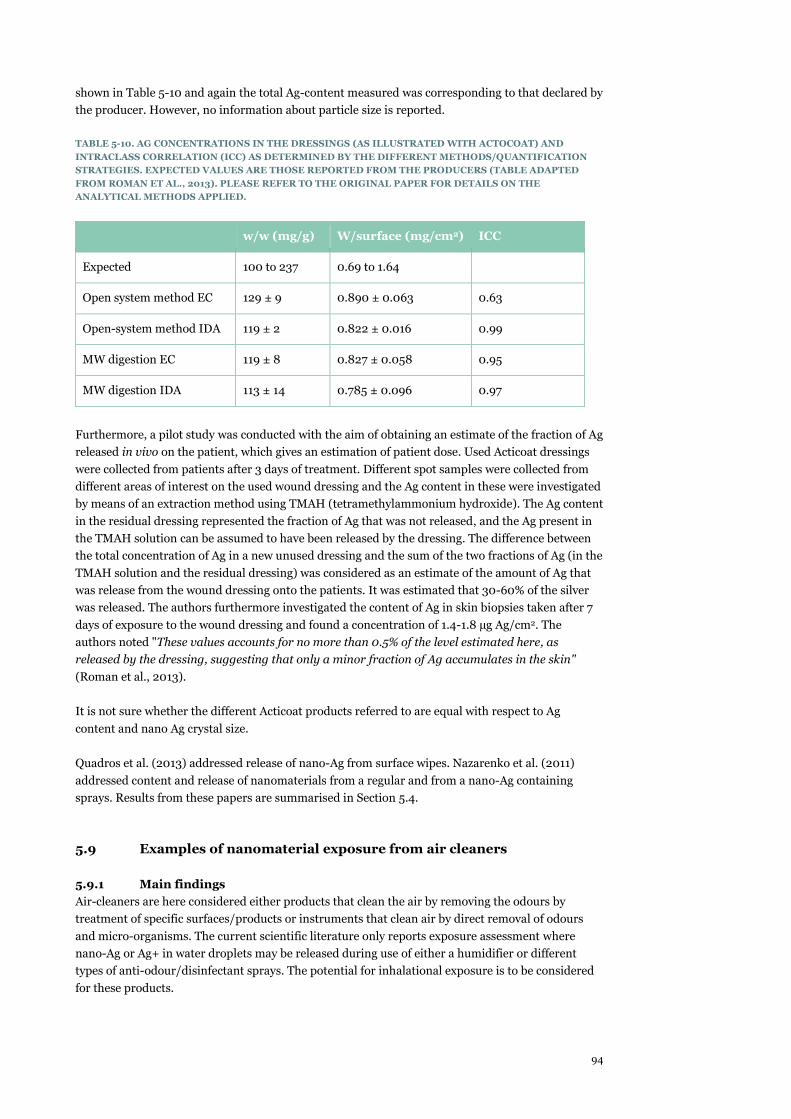
94
shown in Table 5-10 and again the total Ag-content measured was corresponding to that declared by
the producer. However, no information about particle size is reported.
TABLE 5-10. AG CONCENTRATIONS IN THE DRESSINGS (AS ILLUSTRATED WITH ACTOCOAT) AND
INTRACLASS CORRELATION (ICC) AS DETERMINED BY THE DIFFERENT METHODS/QUANTIFICATION
STRATEGIES. EXPECTED VALUES ARE THOSE REPORTED FROM THE PRODUCERS (TABLE ADAPTED
FROM ROMAN ET AL., 2013). PLEASE REFER TO THE ORIGINAL PAPER FOR DETAILS ON THE
ANALYTICAL METHODS APPLIED.
w/w (mg/g) W/surface (mg/cm2) ICC
Expected 100 to 237 0.69 to 1.64
Open system method EC 129 ± 9 0.890 ± 0.063 0.63
Open-system method IDA 119 ± 2 0.822 ± 0.016 0.99
MW digestion EC 119 ± 8 0.827 ± 0.058 0.95
MW digestion IDA 113 ± 14 0.785 ± 0.096 0.97
Furthermore, a pilot study was conducted with the aim of obtaining an estimate of the fraction of Ag
released in vivo on the patient, which gives an estimation of patient dose. Used Acticoat dressings
were collected from patients after 3 days of treatment. Different spot samples were collected from
different areas of interest on the used wound dressing and the Ag content in these were investigated
by means of an extraction method using TMAH (tetramethylammonium hydroxide). The Ag content
in the residual dressing represented the fraction of Ag that was not released, and the Ag present in
the TMAH solution can be assumed to have been released by the dressing. The difference between
the total concentration of Ag in a new unused dressing and the sum of the two fractions of Ag (in the
TMAH solution and the residual dressing) was considered as an estimate of the amount of Ag that
was release from the wound dressing onto the patients. It was estimated that 30-60% of the silver
was released. The authors furthermore investigated the content of Ag in skin biopsies taken after 7
days of exposure to the wound dressing and found a concentration of 1.4-1.8 µg Ag/cm2. The
authors noted "These values accounts for no more than 0.5% of the level estimated here, as
released by the dressing, suggesting that only a minor fraction of Ag accumulates in the skin"
(Roman et al., 2013).
It is not sure whether the different Acticoat products referred to are equal with respect to Ag
content and nano Ag crystal size.
Quadros et al. (2013) addressed release of nano-Ag from surface wipes. Nazarenko et al. (2011)
addressed content and release of nanomaterials from a regular and from a nano-Ag containing
sprays. Results from these papers are summarised in Section 5.4.
5.9 Examples of nanomaterial exposure from air cleaners
5.9.1 Main findings
Air-cleaners are here considered either products that clean the air by removing the odours by
treatment of specific surfaces/products or instruments that clean air by direct removal of odours
and micro-organisms. The current scientific literature only reports exposure assessment where
nano-Ag or Ag+ in water droplets may be released during use of either a humidifier or different
types of anti-odour/disinfectant sprays. The potential for inhalational exposure is to be considered
for these products.
Exposure assessment of nanomaterials in consumer products 95
5.9.2 Specific data
Benn et al. (2010) investigated the Ag concentrations in a number of consumer products and
assessed the release and exposure levels from these. Two of the products were two different sizes of
humidifiers. The water in the small tanks contained 60 µg Ag/g plastic. The aerosolized water in the
small tank contained 1.1±0.4 µg Ag/L resulting in an aerosol emission rate of 0.11±0.04 µg/hour.
The large tank had an Ag-concentration of 0.19 µg Ag/L and a release rate of 0.19 µg Ag/hour into
the indoor environment. The nature of the aerosolised silver was not characterised.
Quadros and Marr (2011) studied the particle emission rate from two Ag-based air-cleaner products
and assessed the potential exposure during use by modelling. The two products were an anti-odour
spray for hunters and a surface disinfectant. The anti-odour hunters spray was based on Ag
nanoparticles and water and was intended to be sprayed directly onto the body. The surface
disinfectant was based on 0.003% electrolytically generated Ag+; citric acid (4.48%); and others
(95.16%). The experiments were conducted in a fully mixed 0.52 m3 polyethylene chamber and the
released aerosols were measured using a CPC, a SMPS and an OPC (Optical Particle Counter). The
amounts sprayed were chosen specifically to reach a constant concentration for each product, and
to further maintain the concentrations for 30 min by periodic spraying.
Analysis showed that the hunters spray contained 12.5±1.8 ppm of Ag and the surface disinfectant
contained 27.5±0.4 ppm of Ag. Spray tests with two different bottles of Hunter’s anti-odour spray
showed very different results: The first bottle produced a bimodal size-distribution with a 20 nm
and a 500 nm-mode. The second bottle produced particles mainly coarser than 500 nm. The
disinfectant spray produced particle sizes comparable to the particles generated by the first
Hunter’s odour-spray. By mass, most of the Ag particles were found in the µm-size in the tests of the
Hunter’s anti-odour spray. The silver particles in the disinfectant spray had a very wide and very
low-concentration distribution.
A conservative assessment of the exposure levels showed that a person using the anti-odour hunters
spray by spraying 20 times (1/sec.) in a 30 m3 room with an air-exchange rate of 0.5 per hour would
inhale 0.62 ng Ag the first 10 minutes. However, the anti-odour Hunter’s spray is to be sprayed onto
the body, and the actual exposure levels may be significantly higher.
Quadros et al. (2013) investigated the emission from two air humidifiers; a nano-technology based
manual humidifier and one with a conventional silver accessory for the water tank, respectively. The
use-situations were investigated in a 36 m3 room, with carpets and furniture to simulate a bedroom,
and test conditions at less than 25C and 40%RH. ICP-MS analysis of 5 and 17 days old tank water
resulted in 0.8 ppb Ag at 5 days, but not detectable concentrations in 17 days old tank water.
Condensates (300 mL water of atomized over 90 minutes) generated by the tabletop humidifier
with the conventional Ag accessory, contained 2.30.4 ppb of Ag (measured as total Ag and most
probably related to dissolved Ag-ions), suggesting a very low exposure level during regular use.
(This corresponds to total liberation into air of 0.69 µg Ag over 90 minutes). No silver was detected
from in the reservoir from the nanotechnology based humidifier. Also the simulated use did not
result in any detectable amounts of particles emitted.
Based on these, it was concluded that there seem to be a very low – if any - release potential for
silver particles from the air humidifiers.
96
5.10 Examples of nanomaterial exposure from electronic devices, sports
equipment and appliances (general use)
5.10.1 Main findings
Exposure to nanomaterials from this type of products are not generally addressed quantitatively in
the literatures, except when such products are subject to sanding, grinding, etc., which will be
addressed in Section 1.3.10.
A paper qualitatively discussing exposure to CNTs from composites materials generally conclude
that the expected consumer exposure is low.
Section 5.7 discussed a paper on nanoclays used in polymer nanocomposites and a number of
papers addressing paints and coatings, which might also be relevant for this product category.
Literature quantifying potentially relevant exposure to nanosilver from e.g. keyboards, refrigerators,
touchscreens etc. has not been identified in the current study.
5.10.2 Specific data
Nowack et al. (2013) discusses release of CNTs from various life cycle steps of CNTs used in
composites (from manufacturing of the products to final disposal). Of relevance for consumer
exposure are CNT-composites in: i) sports equipment, ii) electronics, and iii) textiles addressed. The
latter is addressed in Section 5.6. In relation to sports equipment the authors note that release of
CNTs might occur due to chemical (sweat, saliva) or mechanically (breakage or
maintenance/repair) or by weathering /UV light/water). However, the authors judge overall that
such release during the consumer phase has a very low likelihood. Regarding electronics, it is noted
that consumers might have extensive dermal contact with these devices (laptops, mobile phones
etc.) which might contain CNTs as flame retardants (although marked penetration is currently low).
This may lead to dermal exposure if CNT are chemically released (sweat). As it has been shown that
polymer fragments are found in household dust, it is also speculated that there could be an
inhalation exposure. No quantitative data are presented, but further research in this area is
proposed.
5.11 Examples of release from wear, tear and mechanical reworking
The release of nanomaterials due to wear, tear and mechanical reworking occurs or may occur for a
wide range of consumer products, and therefore this crosscutting issue is covered in this separate
section. The release mechanisms range from passive release by nanomaterial diffusion,
nanomaterial dissolution and matrix degradation during regular use, over accidental events such as
damaging a material, to influencing the materials mechanically (e.g., polishing, sanding, drilling,
cutting, sawing) and during demolition. The number of publications in this topic area is growing
rapidly with highest focus on nanomaterial-based composites. Some examples have already been
touched upon above, but this section addresses this general issue in more detail. First search words
were: nano* AND sanding OR nano* AND cutting OR nano* AND polishing OR nano* AND drilling
OR nano* AND sawing OR nano* AND demolition” using ISI web of knowledge. This search
resulted in 10 947 hits and was refined by the terms occupational OR consumer giving 40 hits. Title
and abstract screening reduced the number to 17 hits, which were reviewed considering their
potential relevance for consumer use and exposure situations.
As general conclusion, tear, wear, and sanding can result in exposure to released nanomaterials or
nanomaterials present at the surface or protruding the surface of debris particles. The area is also
complex due to the many different types of nanomaterials used in the different types of
nanocomposite materials. The likelihood of release strongly depends on the type of product as well
as the type of nanomaterial and loading. Products consisting entirely of nanomaterials, such as
Exposure assessment of nanomaterials in consumer products 97
ceramic nanocomposites, have a high propensity to release nanomaterial during reworking such as
grinding ceramic dental replacements. High-energy processes and long-term alteration by chemical
or UV-exposure (with or without rain) are prone to facilitate release and exposure to nanomaterial.
Freshly dried paint and lacquer generally show good retention of doped nanomaterial during
sanding, but cases do exist where their release have been documented. Loosely bound coatings such
as powder treatments of wooden surfaces release nanomaterials during even gentle mechanical
stress. Nanocomposite polymers were found to be associated with low risk of release in normal
consumer scenarios, but many matrix degradation processes may occur that can facilitate release.
Despite the knowledge in this field has grown considerably regarding release characteristics and
factors enabling release during the last 5-7 years, there is still an almost complete lack of data useful
for quantitative exposure assessment.
Loosely bound particulate coatings
Hsu and Chein (2007) measured the release of nanoparticles from surfaces coated with nano-TiO2
powder coating. When three different treated surfaces (wood, polymer and tile) was exposed to UV-
light (sun), a fan (wind) and scraping motions (human contact), particles with diameters in the
range of 8 to 127 nm were emitted at a rate from 5.5 and up to 280 particles per minute from a 10
cm2 surface. The particle emissions were measured with SMPS and the largest emissions of nano-
TiO2 was found for coated tiles (22 particles/cm3). UV light seems to increase emission and
emissions were affected by the rubber knife scraping motion.
Paint, lacquers and nanofilm coatings
Kaiser et al. (2013) discusses the use or possibly upcoming use of nanomaterials in the paint and
lacquer industry. Nanomaterial additives can be used as biocides (nano-Ag, nano-copper, nano-
ZnO, photocatalytic nano-TiO2), as UV-light absorber (nano-ZnO and nano-TiO2), as pigment
(nano-TiO2) and as hardener (amorphous silica dioxide). Silica dioxide also protects the product
against corrosion and provides the product with high gloss. The paper discusses yet unresolved
challenges, such as long-term durability/efficiency tests; e.g. possible washout of nano biocides and
the possibility that the photocatalytically activity of nano-TiO2 besides its beneficial effects, possibly
also degrade the paint matrix. The paper also discusses several toxicity aspects relevant for hazard
evaluation and refers the NRWCE work on release from sanding (e.g. Koponen et al., 2011; Saber et
al., 2012). The paper does not address product concentrations or exposure estimates.
Dashtizadeh et al. (2011) examines scratch resistance of ceramics, steel and glass coated with a
range of silica-filled water-based acrylic nanocomposite emulsions/paints specifically prepared for
the study. Emulsions with 0 – 12.4% (w/w) nanosilica were used in the experiments. Highest
scratch resistance was found for emulsions with 6.2% (w/w). The paper does not address particle
release nor assessment of exposure.
Koponen et al. (2011) studied the size-distributions and emission characteristics of sanding dust
generated by manual sanding a series of different model paint and lacquer products. The
experiments were conducted on hard-coat lacquer as well as PVA (polyvinyl acetate) and Acryl
paints matrices that were agreed upon by the Danish paint and adhesives association. The test
materials were nano- to pigment size according to the recommended EU-definition of a
nanomaterial. The actual nanomaterial in the paints were a 95 nm-size carbon black (Flammrüss
101), 7 nm nanosilica sol, 17 nm rutile UV-Titan L181, <100 nm anatase W2730X, and kaolinite
flakes (ASP90) reported as 200 nm size particles. In the lacquer the nanomaterial was a <50 nm
nanosilica. The nano-paints/lacquers contained between 2.5 (Flammrüss 101) and 14.7 wt%
(Asp90) nanomaterial. The study was conducted inside a human exposure chamber, where the dust
collection chamber of a handheld orbital sander was mounted with a tube to extract all dust
generated into a mixing chamber for subsequent collection on electrostatic filters. In all emission
studies, the total released aerosol passing to the dust collection chamber in the sander was by
number (usually strongly) dominated by sub-µm-size particles. Online monitoring data with a
98
FMPS and an APS, in most cases showed that the dust size-distributions were only affected to a
minor degree. This suggests that the matrix and other paint fillers dominate the general emission
during sanding. However, the concentrations of the dusts were affected in different ways: In the
PVA group, addition of W2730X and RD3 caused significant increase in particle number (3-5 times)
and also a coarser size of µm-size dust in paint with W2730X. For the acrylic group addition of UV-
Titan L181 resulted in reduced particle concentrations of FMPS-size sanding dust particles, whereas
addition of nanosilica sol increased the particle concentration in the FMPS size-range by 45 times.
For lacquer, a reduction to 0.13 of the reference dust concentration was observed in the FMPS-
range after addition of nanosilica.
Scanning electron microscopy analysis (follow-up publication by Saber et al., 2012) showed that
most of the µm-size emission particles consisted of paint aggregates and large aggregates of paint
filler material. For paints, the sub-µm-size fraction of the dust generally included paint composite,
free pigment particles and minor amounts of released nanomaterial. Released nanomaterial was
particularly evident in the PVA-paint added nano-kaolinite, whereas released nanomaterial was not
immediately identified in the experiments with UV-lacquer, where the dust appeared to consist
entirely of lacquer debris particles. However, for all emissions, a more detailed nano-scale
characterization work by electron microscopy might improve our understanding of nanoscale
particle release. This, however, is partially hampered by the dramatic loss of sampler collection
efficiency of the electrostatic precipitator used for sample collection.
Göhler et al. (2010) investigated the emission potential of two different coatings in a semi-
automated standardized test design, where a sanding was made at a fixed pressure load of 1104 –
5104 Pa using a rotating abrasion wheel mounted with grain size 600 sanding paper. Sanding dust
was removed by an exhaust tube and measured using an FMPS, LAP (Laser Aerosol Size
Spectrometer), and a CPC. The coatings were so-called two-pack polyurethane with and without
ZnO nanoparticles and white-pigmented architectural coating with and without nanoparticles of
ZnO (75% smaller than 100 nm) and Fe2O3 (25% smaller than 100 nm). FMPS analysis of the
airborne particles showed modal sizes between 90 and 100 nm for the polyurethane coating
irrespective of ZnO loading or not. The airborne particles from the architectural coating, however,
varied with nanoparticle doping. Sanding of the Fe2O3-doped architectural coating produced a
bimodal size-distribution with peaks at 30 and ca. 100 nm, whereas sanding of the ZnO-doped
architectural coating released 10-30 nm- and 100-200 nm-size particles. Sanding of the
nanoparticle free architectural coating produced 10-20 nm- and 100-200 nm-size particles.
Modelled air concentrations during sanding an area of 13 cm2 in a 30 m3 room with no ventilation
reached from about 6.2102 (architectural coatings) to about 6.4104 (polyurethanes) particles/cm3.
Compared to reference materials, addition of nanoparticles increased emission levels slightly.
However, no free nanoparticles were observed in the dust as observed by TEM.
Epoxy and polymer nanocomposites
Methner et al. (2012) studied the release characteristics during wet-cutting, grinding and sanding of
plastic composite materials containing carbon nanofibers (CNFs) in an occupational setting. The
diameters of the CNFs range from 70 to 200 nm and lengths ranging from 50 to 200 μm. The
plastic nanocomposites are usually used in the aerospace industry and as carbon nanomembrane
composite materials. The consumers at risk of these exposures are therefore rare, but the principle
findings may still be of relevance.
Filter samples were collected to determine the mass-concentrations of dust and elemental carbon,
and for qualitative TEM (Transmission Electron Microscopy) analysis. Online measurements of
airborne particle concentrations were made using a CPC and for size-distributions using a laser
scattering equipment and a dust track used for estimation of dust mass-concentration. Most
processes lasted no longer than 5 minutes. Consequently, the measurements were done using
multiple repetitions of specific tasks.
Exposure assessment of nanomaterials in consumer products 99
Relevant for assessment of consumer exposure risk, the paper presents two cases 1) Wet-saw
cutting with no local ventilation resulted in personal exposure levels of 1 934 particles/cm3 and
detection of free CNF by TEM; 2) Sanding of the CNF-doped composite which resulted in two cases
with a relatively high concentration (160 to 3 090 µg/m3) of dust in the 300 nm to 10 µm size
particles in the ambient environment around the operator, but much lower concentrations in the
breathing zone. Clear detection of CNF was made using TEM in both the breathing zone and
ambient air samples.
Schlagenhauf et al. (2012) assessed the release of particles from epoxy-based nanocomposites
during an abrasion process. Abrasion from three samples with 0, 0.1 and 1% (w/w) CNT were
analysed. Particle size distributions for abrasion from the three samples were measured to release
between 8 000 to 20 000 particles/cm3 (MSPS) and 1 000 to 3 000 particles/cm3 (APS). Sizes were
estimated to be 600 nm to 2 500 nm measured by APS. Images by TEM revealed that freestanding
CNTs and agglomerates were emitted during abrasion.
Wohlleben et al. (2013) investigated the surface characteristics and release of CNT from
thermoplastic polyurethane with and without 3 wt% CNT under normal use (Taber abrasion),
machining (sanding) and outdoor weathering (UV-light). The Taber abraser test is an established
method of the coatings industry to quantify wear resistance and is described in e.g. ISO 5470–
1:1999. In this case, Taber abrasion was done using S-42 sandpaper at 1 kg load and a relative
velocity of 0.294 m/s. Sanding was performed using P320 sanding paper on a fixed machine and
rotating the sample below. The sanding pressure load was 0.25 kg and the relative velocity of the
sanding was 6.5 m/sec. Both Taber and sanding experiments were conducted in a chamber
(unspecified size?) with HEPA-filtered air. Weathering was conducted with and without simulating
rain according to ISO standards using a commercial weathering apparatus. The accelerated
weathering simulation corresponded to 9 and 18 months of outdoor exposure in sunlight (111
W/m2) or mixed sun (60 W/m2; n x 102 min) and rain (n x 18 min) at 50 Northern latitude.
Airborne particle size-distributions were measured online by SMPS (or CPC alone) and of-line using
analytical ultracentrifuge and SEM. The results showed that particles were released from both the
CNT-doped and pure polyurethane during Taber abrasion and sanding. During Taber abrasion
testing, the increase in particle concentration in the chamber was very low (100 particles/cm3), but
a significant amount of coarser debris particles were generated. The airborne particles had a size-
peak between 20 and 100 nm. During sanding the particle concentration in the chamber increased
to 6 000 to 8 000 particles/cm3 and bursts with up to 25 000 (CNT-doped polyurethane) and 40
000 particles/cm3 (pure polyurethane) were observed. The bursts made it impossible to size the
dusts with SMPS, but analytical ultracentrifugation analysis showed that some sanding dust
particles were present in the size-range below 150 nm. A high amount of coarse debris particles was
also generated. Analytical ultracentrifugation analysis showed that the dusts are dominated by 10-
100 µm particles. Free CNT was not observed by SEM and not detected by XPS (X-ray photon
spectroscopy). It was concluded, based on uncertainties and minimum detection limits, that at least
97 wt% of the CNT remains in the polyureathane.
Weathering causes matrix degradation, protruding CNT at the sample surface and finally a highly
CNT-rich crust after 9 and 18 months weathering. The CNT concentration in the most weathered
samples reached 723 wt% at the upper 10 nm surface.
Kingston et al. (2014) reviewed the literature on release characteristics of CNT polymer matrix
nanocomposites based on 134 cited references. This rather extensive work lists some of the many
commercial applications and potential future applications and the typical loadings (concentrations)
of CNT in polymer technologies. They also review the release properties considering the mechanical
and chemical nature of the different polymer matrices. They report based on market reports that
the current commercial applications of CNT polymer nanocomposites are mainly within the
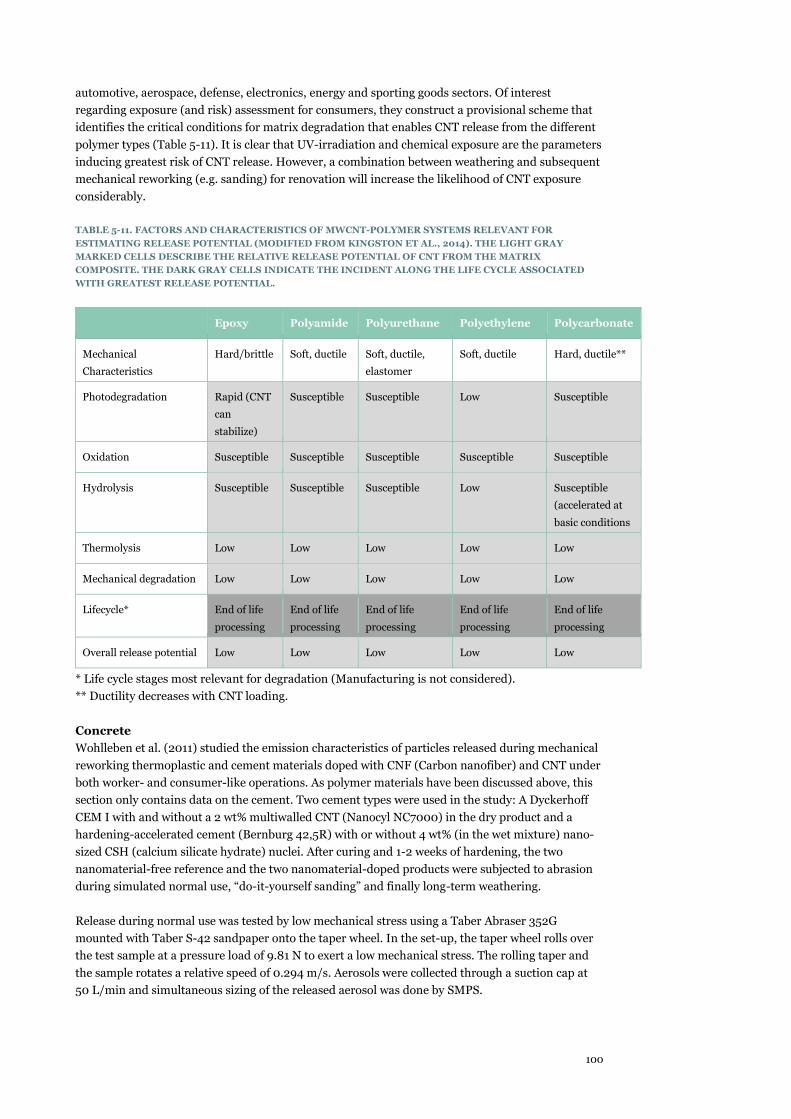
100
automotive, aerospace, defense, electronics, energy and sporting goods sectors. Of interest
regarding exposure (and risk) assessment for consumers, they construct a provisional scheme that
identifies the critical conditions for matrix degradation that enables CNT release from the different
polymer types (Table 5-11). It is clear that UV-irradiation and chemical exposure are the parameters
inducing greatest risk of CNT release. However, a combination between weathering and subsequent
mechanical reworking (e.g. sanding) for renovation will increase the likelihood of CNT exposure
considerably.
TABLE 5-11. FACTORS AND CHARACTERISTICS OF MWCNT-POLYMER SYSTEMS RELEVANT FOR
ESTIMATING RELEASE POTENTIAL (MODIFIED FROM KINGSTON ET AL., 2014). THE LIGHT GRAY
MARKED CELLS DESCRIBE THE RELATIVE RELEASE POTENTIAL OF CNT FROM THE MATRIX
COMPOSITE. THE DARK GRAY CELLS INDICATE THE INCIDENT ALONG THE LIFE CYCLE ASSOCIATED
WITH GREATEST RELEASE POTENTIAL.
Epoxy Polyamide Polyurethane Polyethylene Polycarbonate
Mechanical
Characteristics
Hard/brittle Soft, ductile Soft, ductile,
elastomer
Soft, ductile Hard, ductile**
Photodegradation Rapid (CNT
can
stabilize)
Susceptible Susceptible Low Susceptible
Oxidation Susceptible Susceptible Susceptible Susceptible Susceptible
Hydrolysis Susceptible Susceptible Susceptible Low Susceptible
(accelerated at
basic conditions
Thermolysis Low Low Low Low Low
Mechanical degradation Low Low Low Low Low
Lifecycle* End of life
processing
End of life
processing
End of life
processing
End of life
processing
End of life
processing
Overall release potential Low Low Low Low Low
* Life cycle stages most relevant for degradation (Manufacturing is not considered).
** Ductility decreases with CNT loading.
Concrete
Wohlleben et al. (2011) studied the emission characteristics of particles released during mechanical
reworking thermoplastic and cement materials doped with CNF (Carbon nanofiber) and CNT under
both worker- and consumer-like operations. As polymer materials have been discussed above, this
section only contains data on the cement. Two cement types were used in the study: A Dyckerhoff
CEM I with and without a 2 wt% multiwalled CNT (Nanocyl NC7000) in the dry product and a
hardening-accelerated cement (Bernburg 42,5R) with or without 4 wt% (in the wet mixture) nano-
sized CSH (calcium silicate hydrate) nuclei. After curing and 1-2 weeks of hardening, the two
nanomaterial-free reference and the two nanomaterial-doped products were subjected to abrasion
during simulated normal use, “do-it-yourself sanding” and finally long-term weathering.
Release during normal use was tested by low mechanical stress using a Taber Abraser 352G
mounted with Taber S-42 sandpaper onto the taper wheel. In the set-up, the taper wheel rolls over
the test sample at a pressure load of 9.81 N to exert a low mechanical stress. The rolling taper and
the sample rotates a relative speed of 0.294 m/s. Aerosols were collected through a suction cap at
50 L/min and simultaneous sizing of the released aerosol was done by SMPS.
Exposure assessment of nanomaterials in consumer products 101
Release during sanding was analyzed using sanding paper with P320 grain size mounted on a stamp
(32 mm in diameter). The sanding was performed at a pressure load of 1 N and a relative velocity of
6.49 m/s between the stamp and the disk. The released particles where sampled at 50 L/min
through a suction cap located only 1 cm above the stamp and collected on a membrane filter for
further investigations. The concentration and size distribution of the aerosol were measured using a
SMPS.
Dry weathering tests by UV-light were performed using a Suntest™ XLS+ standard apparatus.
Samples were covered by a >90% UV-transparent borosilicate glass to prevent loss of any
degradation products. The nanocomposites and reference testing plates were run equivalent to 9
months in Europe at approximately 50° northern latitude. The temperature did not exceed 45°C.
All dusts and surface crusts were analysed using a range of techniques, including SEM, analytical
centrifuge, XPS, and SIMS.
The normal use and sanding release studies showed no liberation of the CNT and CSH nanomaterial
during the mechanical stress tests. However, for the CNT-doped cement, dust particles did contain
protruding CNT. The size-distribution of the released dust was heavily dominated by particles
smaller than 100 nm electrical mobility size. Noteworthy, the authors revealed that these nanosized
particles were dominated by Ti-, Fe- and Ca-rich particles also found in the sandpaper, which was
concluded to be the source.
Metal- and Ceramic composites
Van Landyot et al. (2012) investigated the release and exposure characteristics during reshaping
and finishing ceramic composite dental replacements. Based on the listed characteristics, 5 of the 6
tested ceramic composites contained nanomaterial according to the EC nanomaterial definition: 1)
Filtek Supreme XT (20 nm nano-silica and zirconia-silica clusters with primary particle sizes of 5-
20 nm), 2) Premise Enamel (20 nm nano-silica), 3) Ceram X duo+ (10 nm methacrylate
functionalized nano-silica and 2-3 nm methacrylate-functionalized siloxane particles), 4) Herculite
XRV Ultra (20-50 nm nano-silica, 5) Gradia Direct (16 nm pyrogenic silica, 10 nm to 3.5 µm
zirconia silica). The last material (Tetric EvoCeram) contained 160 nm-size mixed oxides. Common
for all the nano-based ceramics was a presence of NM in high percent range 12-85 wt% and in some
cases the ceramics appeared fully based on nanomaterials in the form of hybrid composites.
However, the material table in the paper is not always fully clear due to formatting issues and the
concentration data in some cases needs to be confirmed.
The dust emission tests were conducted inside a 27 cm x 27 cm x 42 cm (readers revision of given
data) Plexiglass box. Ca. 1 g (15 mm x 13 mm x 3 mm) composite blocks were fully grinded during
the test using a rough diamond bur (100 µm grain size) mounted in a dental drilling tool operated at
200,000 rpm. Dusts were collected on PUF (5-10 µm dust) and glass-fibre (< 5 µm dust) filters
using IOM personal inhalable samplers and subsequently characterized by TEM. Size-class resolved
dust mass-concentrations PM1, PM2.5, PM5, PM10 (0.5 to 10 µm) were assessed by online
measurements using a laser scattering instrument (Aerocet-531 Mass Particle Counter) in a dentist
work situation using a grinder comparable to the one used in the laboratory experiment on a Filtek
Supreme XTE nano-composite.
The results showed that grinding of all composites resulted in significant amounts of respirable
dust. TEM-analysis showed that the dust consisted of both composite fragments and free
nanoparticles, which were part of the composites. The nanocomposite Filtek Supreme XT released
the highest amount of sub-µm size dust and the hybrid composite Z100 MP released the lowest
amounts. The percentage of nano-size dust was highest during reworking the micro-hybrid
composite Gradia Direct (65% by number).
102
Results from personal exposure measurements in the dental clinique also showed exposure to (dry)
grinding dust during mechanical reworking the dental ceramics in patients. The air concentration
levels at the dentist were highly elevated in episodic bursts and far above indoor reference
concentrations measured in a nearby office location. From light-scattering measurements, the
maximum concentrations in PM1 (mass of particulate matter smaller than 1 µm) exceeded 60
µg/m3, whereas the total suspended dust at the same event reached ca. 10 mg/m3. It is concluded
that this type of exposure is significant and the dentist should use respiratory protection.
In the context of consumer exposure, the results also clearly suggest that consumer exposure occurs
during placement and reworking/repairing ceramic teeth. Inhalation of even fine respirable
nanoparticles or composite dusts is highly likely during finishing process. Additionally, oral debris
particles may not be fully rinsed out by washing the mouth and enter the gastric system.
Other contributions to the area
Patal et al. (2006) discusses applications of nanoclays in various products. Clays used for
production of nanoclays belong to the smectite (2:1 phyllosilicates) group of which montmorillonite
and hectorite are the most commonly used. Clay is highly hydrophilic, so the organophilic/
hydrophobic nanoclays can be obtained simply by ion exchange. 3-6% nanoclay content improves
the properties (e.g. tensile strengths) of polymer nanocomposites as compared with the
corresponding polymer. Nanoclay can also be used as a rheological modifier in paints, inks,
emulsions or pigment suspensions. 15% content is mentioned, but it is not entirely clear whether
this is the content in additive to be used when formulating products or the product concentration.
Enormous nanoclay market volumes of billions of pounds are mentioned in the paper. Exposure
estimations are not addressed.
5.12 Overall findings from the examples
Below main findings from the product category examples are given:
Food and beverages
This category accounts for the highest oral nanomaterial exposure.
Nanomaterial exposure assessments have been made for food additives such as
- Silica (E551)
- TiO2 (E171)
- CaCO3 (E170)
Nanomaterial exposure up to 3 mg /kg bw day has been estimated, due to the content of nanosized
particles in these additives. Up to 50 wt% of the additive has in some cases be considered to be in
the nano-size range.
Oral exposure from food contact materials containing nano-Ag seems to be low, due to low degree
of migration.
(Also some exposure to nanomaterials from food supplement may occur, as indicated in the tables
in appendix 4 where supplements containing 10-500 ppm of .g. nano-Ag, nano-palladium, nano-
platinium, and nano-zinc have been found).
Cosmetics
This category accounts for the highest dermal nanomaterial exposure. Highest exposure pertains to
leave-on products such a body lotion and sunscreen where dermal exposure to nanomaterials for
small children may exceed 100 mg/kg bw day of nano-TiO2.
Inhalation may be a further exposure route, especially for cosmetics formulated as gas propellant
sprays, as they may generate respirable nano-aerosols which also in some cases may contain solid
Exposure assessment of nanomaterials in consumer products 103
nano-particles. Formulations in pump spray with e.g. nano-TiO2 and nano-ZnO hardly generate
any aerosols in the nano-size range (or even in the respirable size range below 5 µm).
Oral exposure may occur in connection with swallowing of toothpaste (e.g. nano-TiO2) and in
connection to oral exposure of lipsticks (e.g. nano-TiO2 from sun-protection sticks).
Eye exposure may be relevant in connection with use of eye-cosmetic e.g. mascara, eye shadow, and
eyeliners (e.g. carbon black up to 10% in some products).
Teenage girls and small children seems based on the exposure estimates that have been undertaken
to may be the most heavily exposed groups to nanomaterials in cosmetic products.
Cleaning products
The identified literature indicates that nano-Ag is used in cleaning sprays, detergents, surface wipes
and a cleaning scrubber. One paper addresses the use of nano-silica in a glass cleaner product.
Some papers have identified the presence of non-declared nanomaterials in a number of cleaning
sprays.
In most literature addressing sprays containing nano-Ag, the focus is set on characterisation of the
aerosol and nanomaterial content rather than actual estimation of exposure.
One paper using ConsExpo for a glass cleaner spray product containing silica estimated a mean
concentration of 0.002 mg silica/m3 in the surrounding air of the consumer and a peak
concentration of 0.035 mg/m³ shortly after spraying.
See general findings regarding spraying further down.
One study finds low dermal nano-Ag exposure (e.g. from wipes).
Coating/ impregnation
Data on exposure was found for products containing nano-TiO2, silane/siloxane, nano-ZnO. The
examples ranged from applying impregnation on car windows using an impregnated cloth, over use
of liquid sprays products for shoes or bathrooms, to the application of paints with roller and by
spraying.
Dermal exposure to a liquid spray product (containing 0.1% of a nanomaterial) for bathroom
surface treatment was estimated to be 2 x 10⁻² mg/kg per use event. The inhalation exposure was
estimated to be 1.9 x 10³ mg/kg bw per use event.
Dermal exposure of 13.6 mg nano-TiO2/kg bw was estimated for roller application of paint
containing 25% nano-TiO2 using the ConsExpo exposure model. Inhalation exposure was estimated
to be 0.016 mg TiO2/kg bw per event in case of spray application of the paint. The oral exposure to
non-respirable aerosols from spray painting was estimated to be 0.112 mg nano-TiO2/kg bw per
event.
When measuring particle number and particle sizes from use of impregnation sprays about 100
times higher concentrations of nano-sized aerosols were obtained from gas propellant sprays
compared to pump sprays. Highest number concentration of nano-aerosols at about 108 particles/
cm3 was reported for fluoro-silane/siloxane sprays.
Use of impregnation propellant sprays containing TiO2 or ZnO resulted in particle number
concentrations of 105 - 106 particles /cm3 and a mass concentration of about 3.4 mg/m3 ( ZnO
104
particles were however only observed in sizes in the micrometer range). From the ZnO spray an
inhalation exposure of a total of 6.4 x 10¹⁰ particles was estimated from use of 18.5 g of the spray.
Textiles
Data has been found for textiles containing either nano-Ag or nano-TiO2.
The primary exposure route is dermal exposure with highest exposure to nano-Ag due to highest
migration/dissolution rate from the textile. Migration rates up to 45% have been used for nano-Ag
in textiles, whereas a worst case migration rate for nano-TiO2 of 2-3% seems more realistic.
Highest dermal exposure of 4 mg Ag/kg bw day was calculated (using ConsExpo) for a child
exposure from socks with a high Ag content (2.4 mg Ag/g), whereas an exposure of 12.7 µg Ag/kg
bw day was calculated from a T-shirt based on specific migration data on Ag from the shirt.
Oral exposure of 0.042 µg Ag/kg bw day has been estimated based on Ag migration data from a
cuddly toy animal. Oral exposure pertains to a small child sucking the toy.
Construction materials
Construction materials available for consumers comprise a wide group of products including e.g.
cements (silica, nano-TiO2, CNT, unspecified metal oxides), nanocomposites (nanoclays and CNT),
windows (silica, tungsten oxide), tiles (nano-TiO2), and protective surface coatings such as paints,
lacquers, as well as antimicrobial and easy-to-clean nanofilm coatings (see also "coatings/
impregnation"). Coatings/paints may contain a range of nanomaterials such as nano-Ag, nano-
copper, nano-ZnO and pohotocatalytic nano-TiO2 used as biocides, nano-ZnO and nano-TiO2 as
UV-light absorber, nano-TiO2 as pigment and nanoclays as rheological modifier.
Except for coatings/paintings addressed elsewhere, no examples on use-related release and
exposure during consumer use of construction materials have been identified.
Medical Devices
Identified literature focuses on content and release of nano-Ag in wound dressings. The literature
also addresses toxic effects seen in human case studies indicating release, exposure, uptake and
toxicity of silver contained in the wound dressing. Absorption and toxicity of dermal nano-Ag
exposure will be further addressed in the hazard assessment part of this project.
The wound dressing contain approx. 100-200 mg Ag/g product corresponding to about 0.7 to 1.5
mg Ag/cm2 body area. External exposures using the models ConsExpo and ECETOC TRA have been
estimated to about 0.025 mg Ag/kg bw/day. Internal serum Ag levels of about 25-60 µg/L have
been reported in patients, indicating a significant release from the wound dressing.
Generally, total Ag levels are reported without distinguishing between whether silver released from
the dressing are in ionic or (nano-)particle form.
Air Cleaners
In this analysis, air-cleaners are considered products that either clean the air by removing the
odours by treatment of specific surfaces/products or instruments that clean air by direct removal of
odours and microorganisms. Air-cleaners using the aerosol route is associated with potential risk of
inhalation exposure. However, the experimental studies showed that Ag (either nano-Ag or Ag+) is
released at very low concentrations during use of either a humidifier or different types of anti-
odour/disinfectant sprays. However, the potential for inhalational exposure is to be considered for
these products. The highest direct inhalation exposure estimate published for nano-Ag, is 0.62 ng
Ag the first 10 minutes using an anti-odour spray.
Electronic devices, sports equipment and appliances for general use
Exposure to nanomaterials from this type of products are not generally addressed quantitatively in
the literatures, except when such products are subject to sanding, grinding etc. summarised in the
following section.
Exposure assessment of nanomaterials in consumer products 105
The composite materials in products maycontain e.g. carbon nanotubes (CNT), nanoclays or
nanosilver (the latter as antibacterial agent in e.g. keyboards and refrigerators).
Wear/tear/mechanical reworking
Wear, tear and mechanical reworking can all result in inhalation exposure to released free
nanomaterials or nanomaterials present at the surface or protruding the surface of debris particles.
Less important exposure routes are dermal, oral and the eye. The likelihood of nanomaterial release
strongly depends on the type of product as well as the type of nanomaterial and concentration in the
products. Products consisting entirely of nanomaterials, such as ceramic nano-composites, have a
high propensity to release nanomaterials during reworking such as grinding ceramic dental
replacements. High-energy processes and long-term alteration by chemical or UV-exposure (with or
without rain) are prone to facilitate release and exposure to nanomaterials. Freshly dried paint and
lacquer generally show good retention of added nanomaterials during sanding, but cases do exist
where their release have been documented. Loosely bound coatings, such as powder-treated
wooden surfaces, release nanomaterials during even gentle mechanical stress. Polymer matrix
nanocomposites were found to be associated with low risk of release in normal consumer scenarios,
but different matrix degradation processes may occur that can facilitate release. For the above-
mentioned type of release there is still an almost complete lack of data useful for quantitative
exposure assessment.
Spraying
Spraying and inhalational exposure to micro- and nanosized aerosols is a general and cross-cutting
issue relevant for nearly all type of products categories: cosmetics (nano-TiO2, nano-Ag, Ag’+), air-
cleaning (Ag+, nano-Ag), cleaning (nano-silica, nano-Ag, Ag+, unknown), coating/impregnation
and maintenance products (nano-silica, silane, siloxane, nano-TiO2, nano-ZnO, nano-Ag, Ag+,
mixtures, and unspecified), construction materials (paints with nanosize pigments and various
nanomaterials, easy to clean products, surface protection products), and air-cleaners (nano-Ag,
Ag+).
Spraying is per default associated with risk of inhalation exposure being a process where the
content of a container is dispersed in the air directed towards a target area. Dermal and oral
exposure may also occur. It is observed that nanoproducts as well as the non-nanoproducts may
generate aerosols with sizes in the nanometer range. As a rule of thumb, spraying using a
pressurized (propellant) spray or highly volatile matrices such, as alcohol-based pump-sprays,
result in very small droplets increasing the potential for direct release/ generation of nano-objects/
nanosize particles. Solutions with water-based and high-viscosity matrices (e.g. emulsions and oil)
are less likely to result in generation of nano-aerosols or release of free nano-objects. However, it
must be concluded that spraying results in dispersion of freely accessible nanomaterial in a liquid
matrix, which is within the inhalable and often to a great extent within the respirable fraction.
Assessments of mass-based exposure or dose levels indicate 1.9 x 10⁻³ and up to more than 1o0 x 10-
3 mg/kg bw, with the highest value reported for a coating/impregnation and maintenance products.
The actual exposure levels are very dependent on the exposure scenario and in particular the
context of the scenario.
106
6. Selection of exposure scenarios for further exposure and risk assessment
6.1 Selection of consumer products as examples of representative
consumer exposure scenarios
For getting a compiled overview of the product information collected in Chapters 2 and 4, a working
table (see Appendix 7 in appendix report) was made. The table contains the relevant nanomaterials
and matrices for the various product types in the various product categories (Column 1-4) as
identified in previous chapters and with some input from the hazard assessment activities of the
project (WP3). From this overview, specific products with specific nanomaterials was selected
(marked in yellow) based on a series of selection criteria. Columns 5-9 in the table in Appendix 7
were used for specific information regarding documentation and specific information to consider
further in the risk assessment.
Based on that table, the project team made a draft for Table 6-1 where 20 exposure scenarios
representing various nano-products were selected as examples of representative consumer exposure
scenarios.
The selection of the scenarios/products in Table 6-1 was made using the criteria below which have
been agreed with the Danish EPA:
-Coverage of the various product categories and type of use
-Coverage of various formulations and matrices of the products/ articles
-Coverage of various type of use/ application methods
-Coverage of low as well as high quantitative use of the product
-Coverage of high/ low/ uncertain exposure potential
-Coverage of specific user or target group populations
-Coverage of all relevant exposure routes (dermal, oral, inhalation and eye)
-Coverage of uses of nanomaterials that may be of toxicological concern
-Coverage of most used nanomaterials
The draft table was during a workshop meeting discussed together with the reference group in order
to include comments and ideas from the reference group members. Table 6-1 can be seen as the
outcome of this process. It was during the workshop emphasised by the external expert that
although each of the 20 scenarios may be representative for similar products/scenarios, the total of
20 scenarios could far from be said to be representative for the overall consumer exposure to
nanomaterials. On the other hand, the scenarios chosen could be seen as representing possible high
exposure/risk scenarios (and some low exposure/risk scenarios) given the current knowledge about
nanomaterials in consumer products.
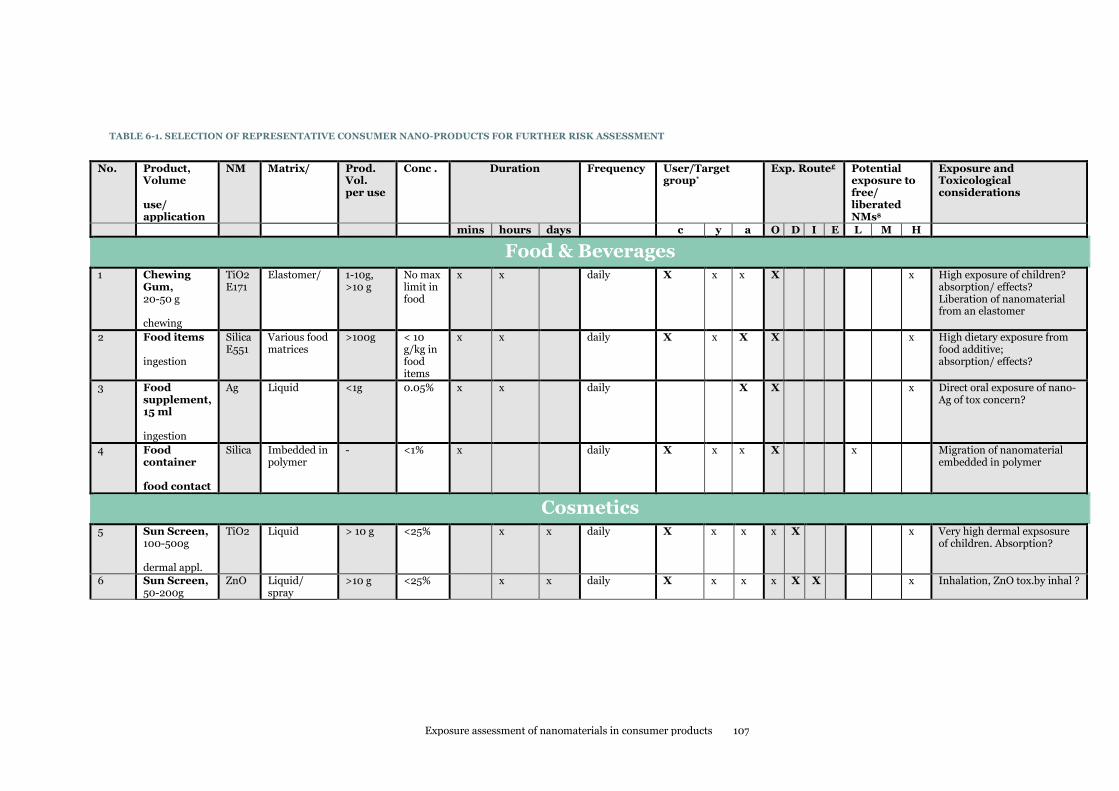
Exposure assessment of nanomaterials in consumer products 107
TABLE 6-1. SELECTION OF REPRESENTATIVE CONSUMER NANO-PRODUCTS FOR FURTHER RISK ASSESSMENT
No. Product, Volume use/ application
NM Matrix/
Prod. Vol. per use
Conc . Duration
Frequency User/Target group*
Exp. Route£ Potential exposure to free/ liberated NMs$
Exposure and Toxicological considerations
mins hours days c y a O D I E L M H
Food & Beverages
1 Chewing Gum, 20-50 g chewing
TiO2 E171
Elastomer/
1-10g, >10 g
No max limit in food
x x daily X x x X x High exposure of children? absorption/ effects? Liberation of nanomaterial from an elastomer
2 Food items ingestion
Silica E551
Various food matrices
>100g < 10 g/kg in food items
x x daily X x X X x High dietary exposure from food additive; absorption/ effects?
3 Food supplement, 15 ml ingestion
Ag Liquid <1g 0.05% x x daily X X x Direct oral exposure of nano-Ag of tox concern?
4 Food container food contact
Silica Imbedded in polymer
- <1% x daily X x x X x Migration of nanomaterial embedded in polymer
Cosmetics
5 Sun Screen, 100-500g dermal appl.
TiO2 Liquid > 10 g <25% x x daily X x x x X x Very high dermal expsosure of children. Absorption?
6 Sun Screen, 50-200g
ZnO Liquid/ spray
>10 g <25% x x daily X x x x X X x Inhalation, ZnO tox.by inhal ?
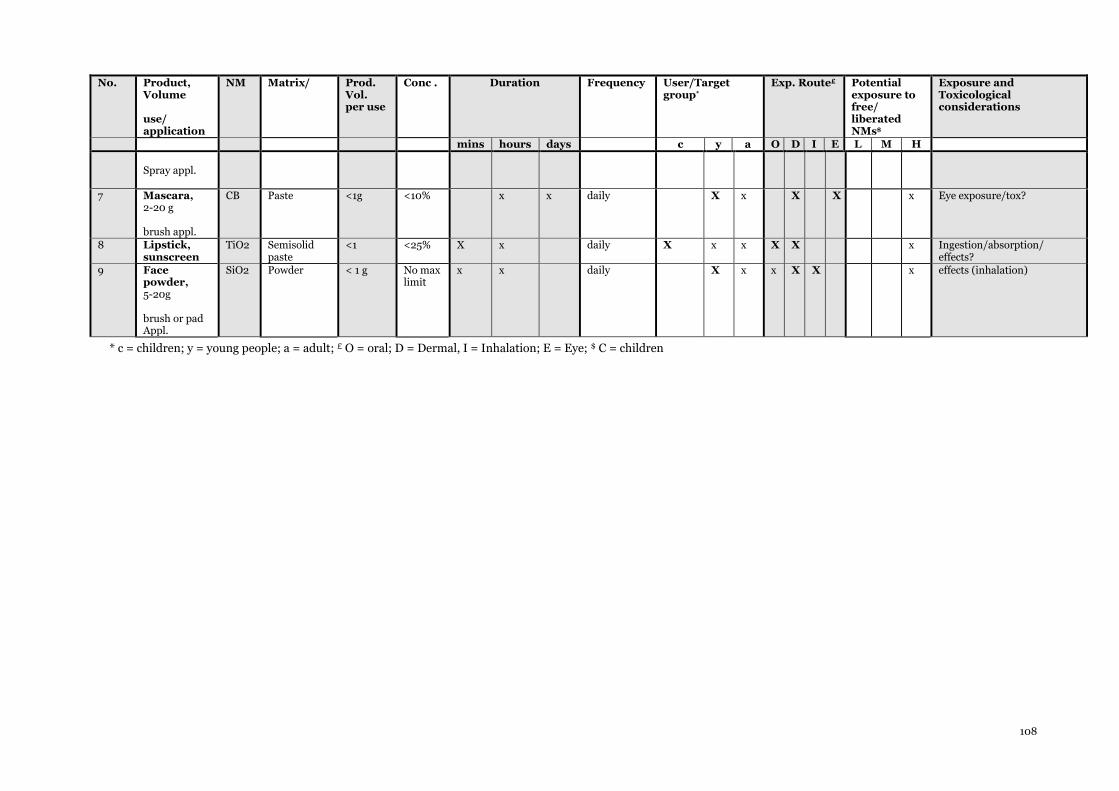
108
No. Product, Volume use/ application
NM Matrix/
Prod. Vol. per use
Conc . Duration
Frequency User/Target group*
Exp. Route£ Potential exposure to free/ liberated NMs$
Exposure and Toxicological considerations
mins hours days c y a O D I E L M H
Spray appl.
7 Mascara, 2-20 g brush appl.
CB Paste <1g <10% x x daily X x X X x Eye exposure/tox?
8 Lipstick, sunscreen
TiO2 Semisolid paste
<1
<25% X x daily X x x X X x Ingestion/absorption/ effects?
9 Face powder, 5-20g brush or pad Appl.
SiO2 Powder < 1 g No max limit
x x daily X x x X X x effects (inhalation)
* c = children; y = young people; a = adult; £ O = oral; D = Dermal, I = Inhalation; E = Eye; $ C = children
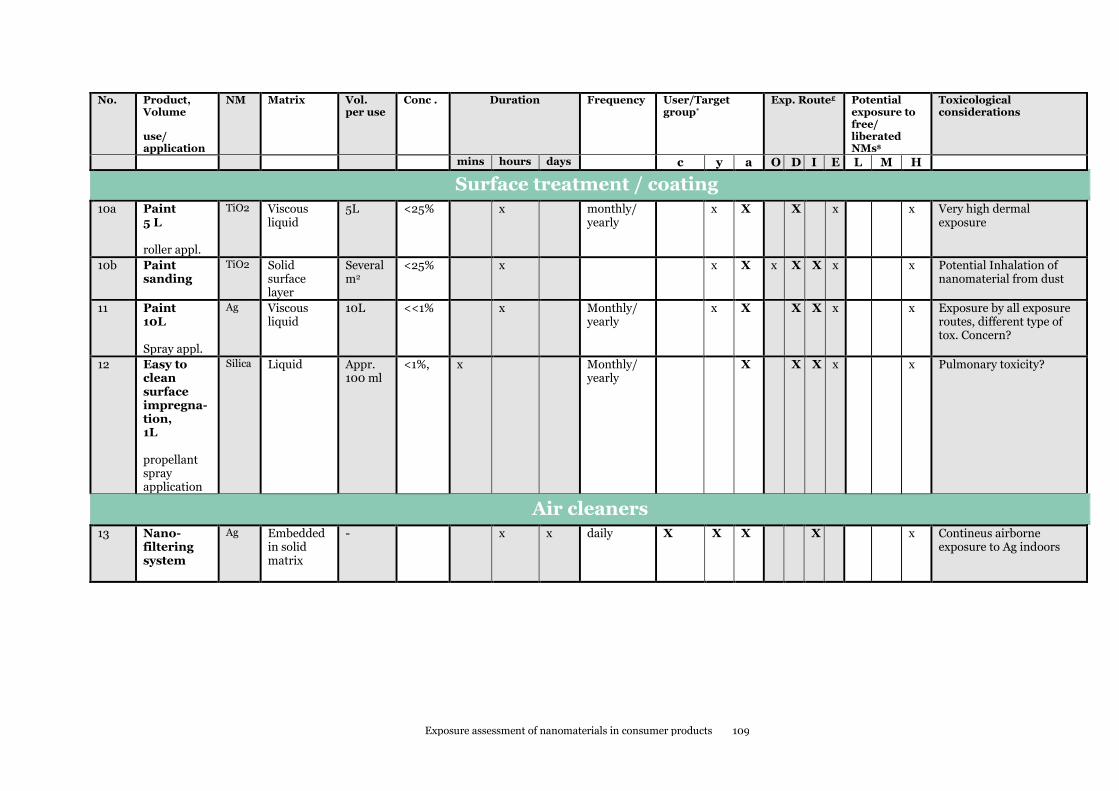
Exposure assessment of nanomaterials in consumer products 109
No. Product,
Volume use/ application
NM Matrix Vol. per use
Conc . Duration
Frequency User/Target group*
Exp. Route£ Potential exposure to free/ liberated NMs$
Toxicological considerations
mins hours days c y a O D I E L M H
Surface treatment / coating
10a Paint 5 L roller appl.
TiO2 Viscous liquid
5L <25% x monthly/ yearly
x X X x x Very high dermal exposure
10b Paint sanding
TiO2 Solid surface layer
Several m2
<25% x x X x X X x x Potential Inhalation of nanomaterial from dust
11 Paint 10L Spray appl.
Ag Viscous liquid
10L <<1% x Monthly/ yearly
x X X X x x Exposure by all exposure routes, different type of tox. Concern?
12 Easy to clean surface impregna-tion, 1L propellant spray application
Silica Liquid Appr. 100 ml
<1%, x Monthly/ yearly
X X X x x Pulmonary toxicity?
Air cleaners
13 Nano-filtering system
Ag Embedded in solid matrix
- x x daily X X X X x Contineus airborne exposure to Ag indoors
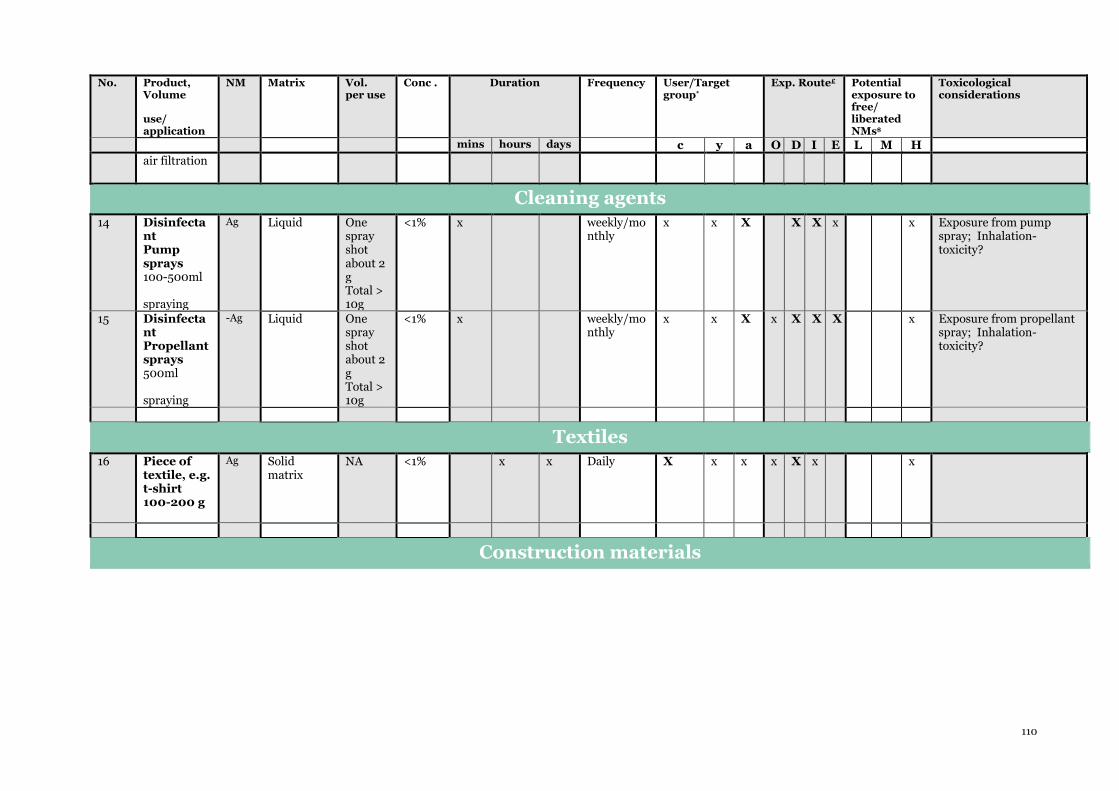
110
No. Product, Volume use/ application
NM Matrix Vol. per use
Conc . Duration
Frequency User/Target group*
Exp. Route£ Potential exposure to free/ liberated NMs$
Toxicological considerations
mins hours days c y a O D I E L M H
air filtration
Cleaning agents
14 Disinfectant Pump sprays 100-500ml spraying
Ag Liquid One spray shot about 2 g Total > 10g
<1% x weekly/monthly
x x X X X x x Exposure from pump spray; Inhalation-toxicity?
15 Disinfectant Propellant sprays 500ml spraying
-Ag Liquid One spray shot about 2 g Total > 10g
<1% x weekly/monthly
x x X x X X X x Exposure from propellant spray; Inhalation-toxicity?
Textiles
16 Piece of textile, e.g. t-shirt 100-200 g
Ag Solid matrix
NA <1% x x Daily X x x x X x x
Construction materials
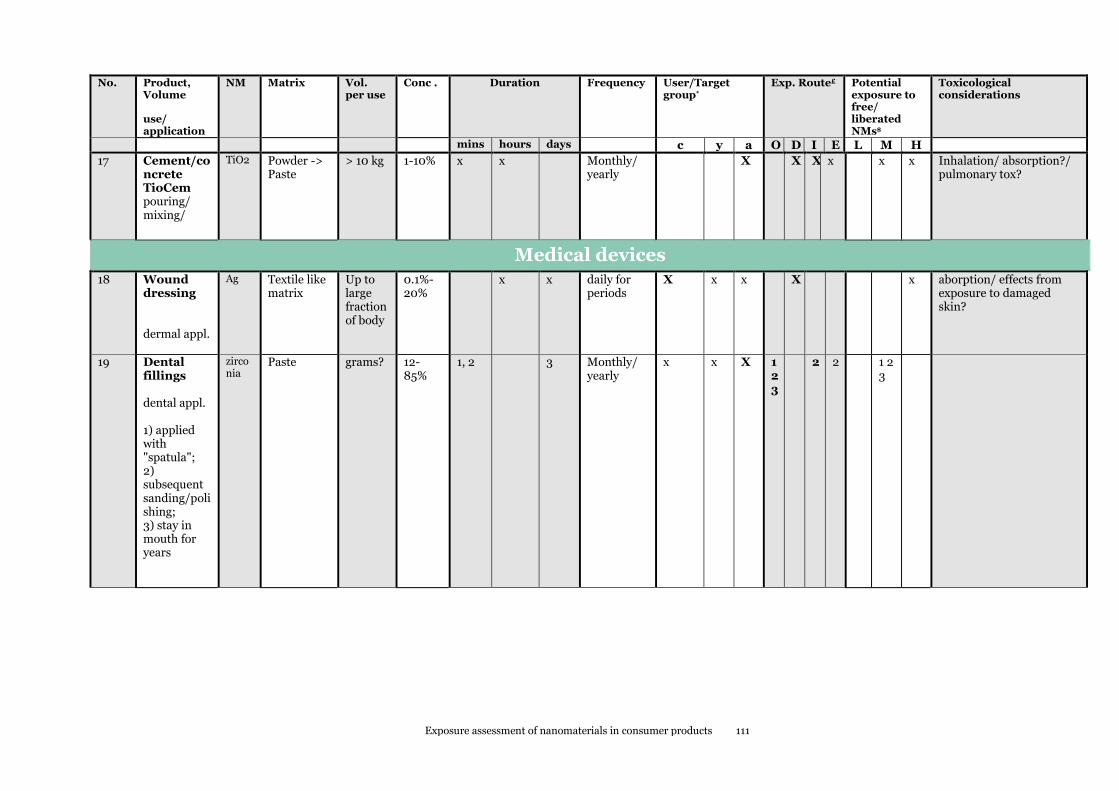
Exposure assessment of nanomaterials in consumer products 111
No. Product, Volume use/ application
NM Matrix Vol. per use
Conc . Duration
Frequency User/Target group*
Exp. Route£ Potential exposure to free/ liberated NMs$
Toxicological considerations
mins hours days c y a O D I E L M H
17 Cement/concrete TioCem pouring/ mixing/
TiO2 Powder -> Paste
> 10 kg 1-10% x x Monthly/ yearly
X X X x x x Inhalation/ absorption?/ pulmonary tox?
Medical devices
18 Wound dressing dermal appl.
Ag Textile like matrix
Up to large fraction of body
0.1%-20%
x x daily for periods
X x x X x aborption/ effects from exposure to damaged skin?
19 Dental fillings dental appl. 1) applied with "spatula"; 2) subsequent sanding/polishing; 3) stay in mouth for years
zirconia
Paste grams? 12-85%
1, 2 3 Monthly/ yearly
x x X 123
2 2 1 2 3
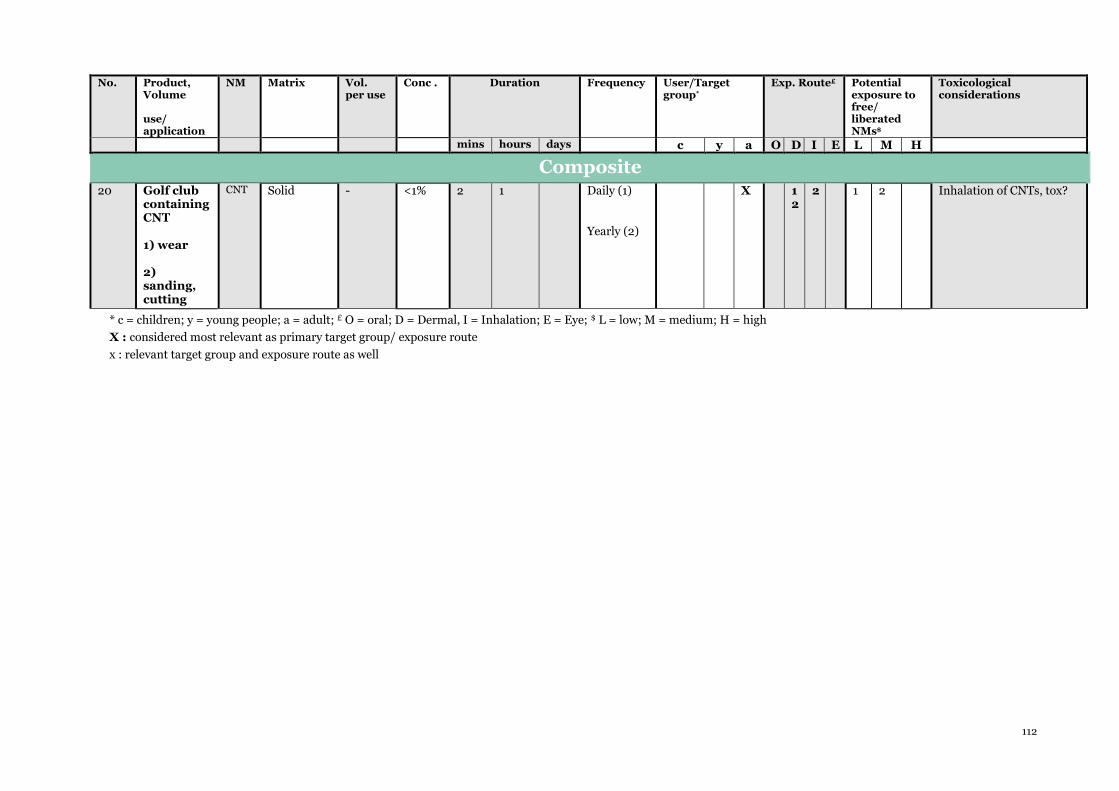
112
No. Product, Volume use/ application
NM Matrix Vol. per use
Conc . Duration
Frequency User/Target group*
Exp. Route£ Potential exposure to free/ liberated NMs$
Toxicological considerations
mins hours days c y a O D I E L M H
Composite
20 Golf club containing CNT 1) wear 2) sanding, cutting
CNT Solid - <1% 2 1 Daily (1) Yearly (2)
X 1 2
2 1 2 Inhalation of CNTs, tox?
* c = children; y = young people; a = adult; £ O = oral; D = Dermal, I = Inhalation; E = Eye; $ L = low; M = medium; H = high X : considered most relevant as primary target group/ exposure route
x : relevant target group and exposure route as well
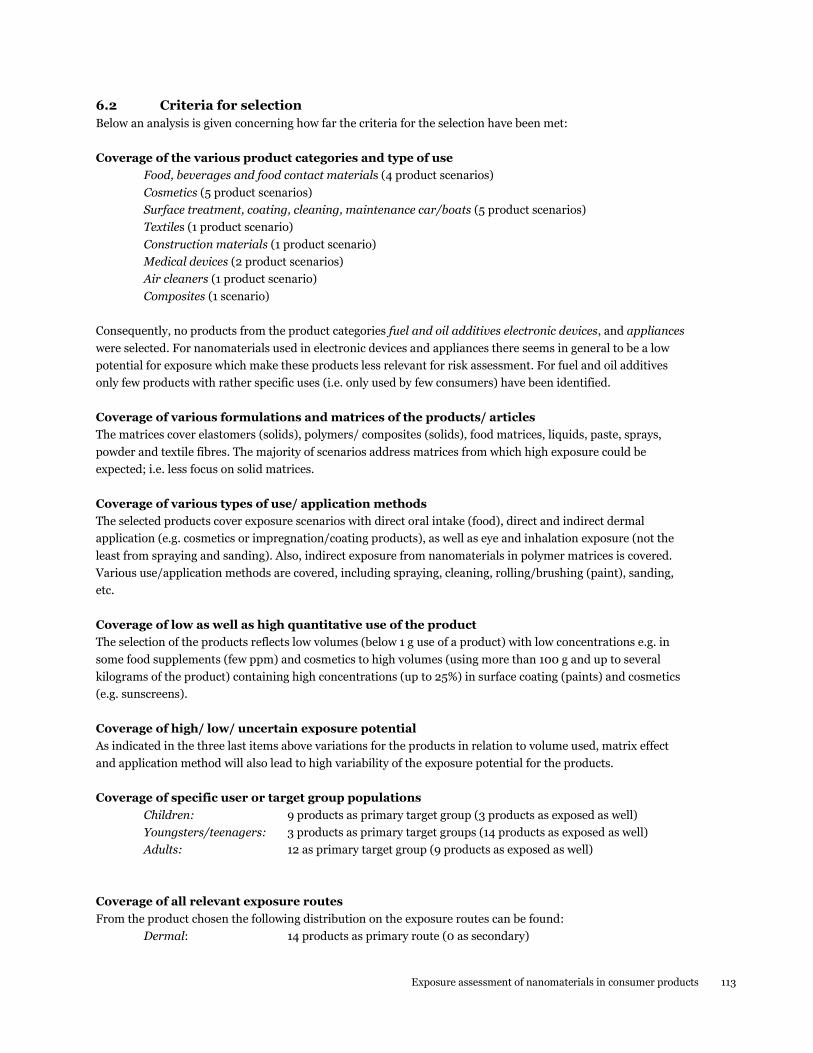
Exposure assessment of nanomaterials in consumer products 113
6.2 Criteria for selection
Below an analysis is given concerning how far the criteria for the selection have been met:
Coverage of the various product categories and type of use
Food, beverages and food contact materials (4 product scenarios)
Cosmetics (5 product scenarios)
Surface treatment, coating, cleaning, maintenance car/boats (5 product scenarios)
Textiles (1 product scenario)
Construction materials (1 product scenario)
Medical devices (2 product scenarios)
Air cleaners (1 product scenario)
Composites (1 scenario)
Consequently, no products from the product categories fuel and oil additives electronic devices, and appliances
were selected. For nanomaterials used in electronic devices and appliances there seems in general to be a low
potential for exposure which make these products less relevant for risk assessment. For fuel and oil additives
only few products with rather specific uses (i.e. only used by few consumers) have been identified.
Coverage of various formulations and matrices of the products/ articles
The matrices cover elastomers (solids), polymers/ composites (solids), food matrices, liquids, paste, sprays,
powder and textile fibres. The majority of scenarios address matrices from which high exposure could be
expected; i.e. less focus on solid matrices.
Coverage of various types of use/ application methods
The selected products cover exposure scenarios with direct oral intake (food), direct and indirect dermal
application (e.g. cosmetics or impregnation/coating products), as well as eye and inhalation exposure (not the
least from spraying and sanding). Also, indirect exposure from nanomaterials in polymer matrices is covered.
Various use/application methods are covered, including spraying, cleaning, rolling/brushing (paint), sanding,
etc.
Coverage of low as well as high quantitative use of the product
The selection of the products reflects low volumes (below 1 g use of a product) with low concentrations e.g. in
some food supplements (few ppm) and cosmetics to high volumes (using more than 100 g and up to several
kilograms of the product) containing high concentrations (up to 25%) in surface coating (paints) and cosmetics
(e.g. sunscreens).
Coverage of high/ low/ uncertain exposure potential
As indicated in the three last items above variations for the products in relation to volume used, matrix effect
and application method will also lead to high variability of the exposure potential for the products.
Coverage of specific user or target group populations
Children: 9 products as primary target group (3 products as exposed as well)
Youngsters/teenagers: 3 products as primary target groups (14 products as exposed as well)
Adults: 12 as primary target group (9 products as exposed as well)
Coverage of all relevant exposure routes
From the product chosen the following distribution on the exposure routes can be found:
Dermal: 14 products as primary route (0 as secondary)
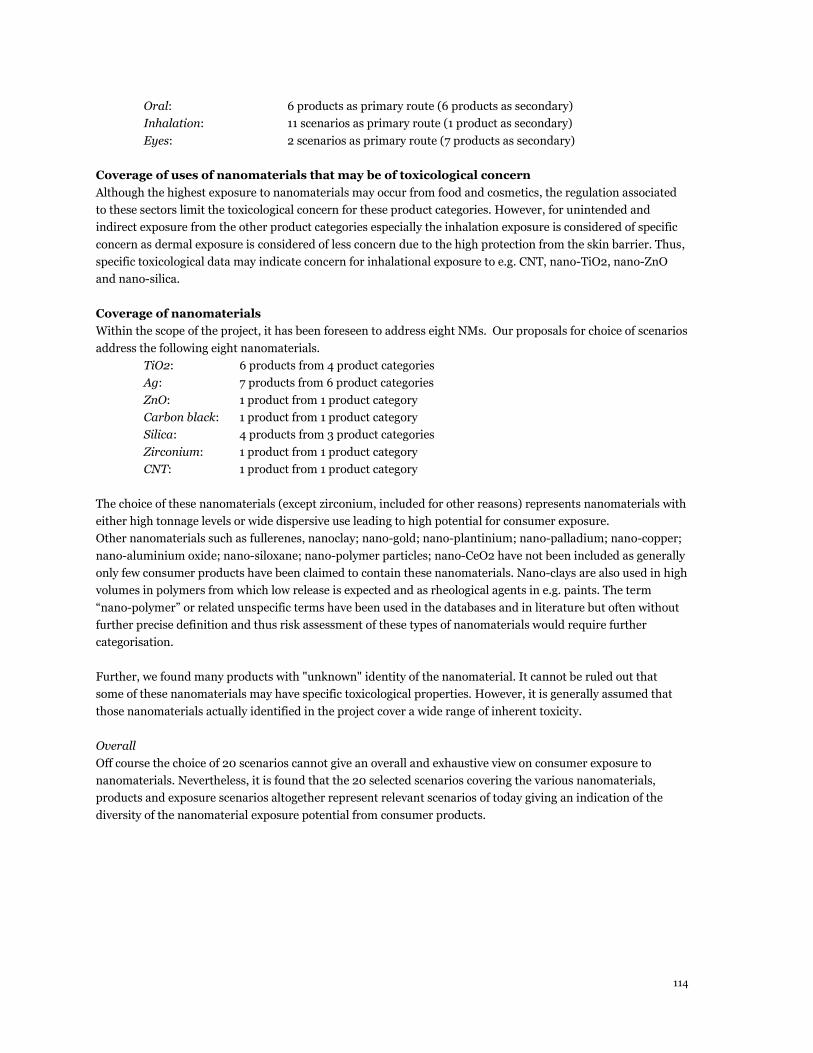
114
Oral: 6 products as primary route (6 products as secondary)
Inhalation: 11 scenarios as primary route (1 product as secondary)
Eyes: 2 scenarios as primary route (7 products as secondary)
Coverage of uses of nanomaterials that may be of toxicological concern
Although the highest exposure to nanomaterials may occur from food and cosmetics, the regulation associated
to these sectors limit the toxicological concern for these product categories. However, for unintended and
indirect exposure from the other product categories especially the inhalation exposure is considered of specific
concern as dermal exposure is considered of less concern due to the high protection from the skin barrier. Thus,
specific toxicological data may indicate concern for inhalational exposure to e.g. CNT, nano-TiO2, nano-ZnO
and nano-silica.
Coverage of nanomaterials
Within the scope of the project, it has been foreseen to address eight NMs. Our proposals for choice of scenarios
address the following eight nanomaterials.
TiO2: 6 products from 4 product categories
Ag: 7 products from 6 product categories
ZnO: 1 product from 1 product category
Carbon black: 1 product from 1 product category
Silica: 4 products from 3 product categories
Zirconium: 1 product from 1 product category
CNT: 1 product from 1 product category
The choice of these nanomaterials (except zirconium, included for other reasons) represents nanomaterials with
either high tonnage levels or wide dispersive use leading to high potential for consumer exposure.
Other nanomaterials such as fullerenes, nanoclay; nano-gold; nano-plantinium; nano-palladium; nano-copper;
nano-aluminium oxide; nano-siloxane; nano-polymer particles; nano-CeO2 have not been included as generally
only few consumer products have been claimed to contain these nanomaterials. Nano-clays are also used in high
volumes in polymers from which low release is expected and as rheological agents in e.g. paints. The term
“nano-polymer” or related unspecific terms have been used in the databases and in literature but often without
further precise definition and thus risk assessment of these types of nanomaterials would require further
categorisation.
Further, we found many products with "unknown" identity of the nanomaterial. It cannot be ruled out that
some of these nanomaterials may have specific toxicological properties. However, it is generally assumed that
those nanomaterials actually identified in the project cover a wide range of inherent toxicity.
Overall
Off course the choice of 20 scenarios cannot give an overall and exhaustive view on consumer exposure to
nanomaterials. Nevertheless, it is found that the 20 selected scenarios covering the various nanomaterials,
products and exposure scenarios altogether represent relevant scenarios of today giving an indication of the
diversity of the nanomaterial exposure potential from consumer products.
Exposure assessment of nanomaterials in consumer products 115
7. Consumer exposure to nanomaterials - exposure assessment of selected scenarios
This chapter further describes and attempts to assess consumer exposures associated with the exposure
scenarios identified in Chapter 6.
7.1 Estimation of nanomaterial exposure
Given the findings in Chapter 3 and 4 in relation to applicability of existing models and given discussion with
the reference group, it was concluded that no existing model could accommodate the variation in types of
nanoproducts, exposure scenarios, matrices and exposure routes. Further, it was not the aim to develop new
models in this project, but rather to assess the exposure potential with existing methodologies.
Thus, it was decided to perform a case-by-case assessment for each scenario based on existing information and
expert knowledge, including a careful description of uncertainties.
Based on the conclusions in Chapter 4 with regards to the most relevant exposure parameters (see Table 4-15),
an overall template for collection and presentation of relevant exposure parameters and data, and for
performing the exposure assessment for the various scenarios was made (see Appendix 8). The evaluation of the
applicability of the various exposure tools indicated in Table 4-16 was used in order to quickly identify potential
tools as relevant for the specific cases.
Table 7-1 below presents the overall results from the exposure assessments made for the 20 scenarios. The
exposure estimations are given for the target groups considered most relevant (or for which most specific data
have been found) and for each exposure route. The results are given in the following units:
mg NM/cm2 (dermal load),
mg NM/m3 (inhalation),
mg NM/person/ day (dermal, oral, inhalation exposure) (indicated as mg/day),
mg NM/ kg bw/day (dermal, oral, inhalation exposure) as appropriate (indicated as mg/kg/day).
In specific cases where data was available also exposure estimates in particle number concentrations are given.
The specific data, algorithms and methods for deriving to the exposure estimates can be found in the filled-out
templates in Appendix 8, along with a discussion of the derived values.
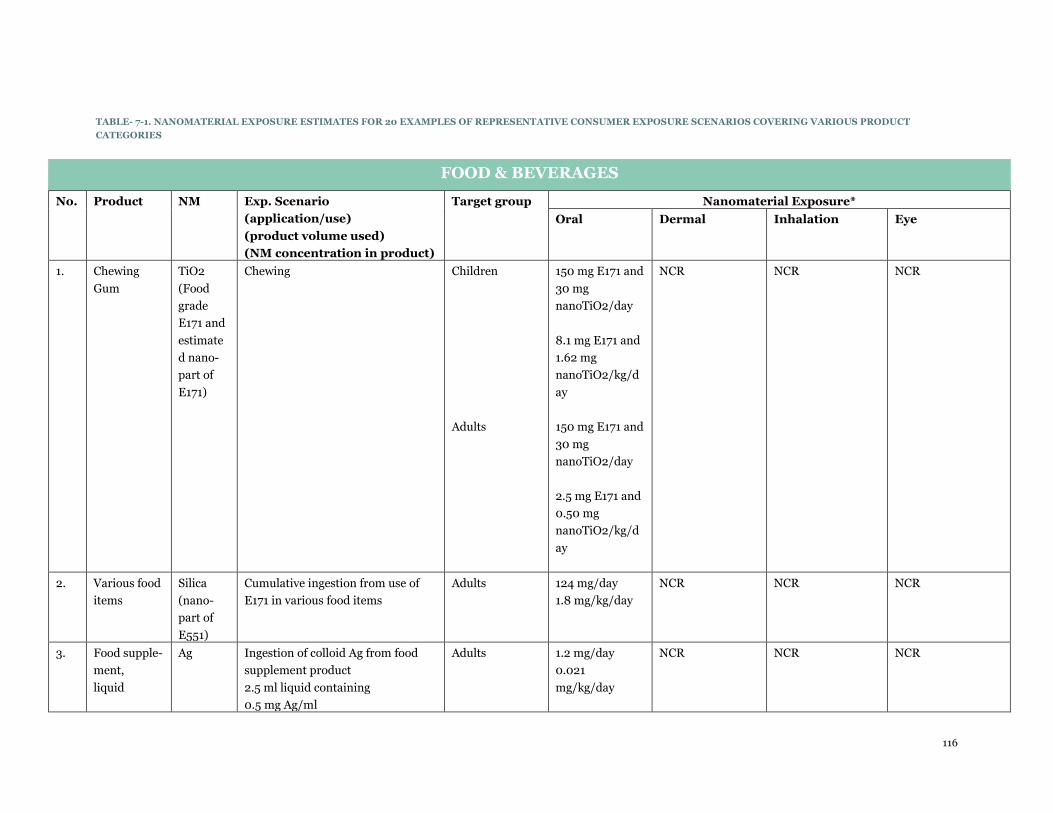
116
TABLE- 7-1. NANOMATERIAL EXPOSURE ESTIMATES FOR 20 EXAMPLES OF REPRESENTATIVE CONSUMER EXPOSURE SCENARIOS COVERING VARIOUS PRODUCT
CATEGORIES
FOOD & BEVERAGES
No. Product NM Exp. Scenario
(application/use)
(product volume used)
(NM concentration in product)
Target group Nanomaterial Exposure*
Oral
Dermal Inhalation
Eye
1.
Chewing
Gum
TiO2
(Food
grade
E171 and
estimate
d nano-
part of
E171)
Chewing Children
Adults
150 mg E171 and
30 mg
nanoTiO2/day
8.1 mg E171 and
1.62 mg
nanoTiO2/kg/d
ay
150 mg E171 and
30 mg
nanoTiO2/day
2.5 mg E171 and
0.50 mg
nanoTiO2/kg/d
ay
NCR NCR NCR
2. Various food
items
Silica
(nano-
part of
E551)
Cumulative ingestion from use of
E171 in various food items
Adults 124 mg/day
1.8 mg/kg/day
NCR NCR NCR
3. Food supple-
ment,
liquid
Ag Ingestion of colloid Ag from food
supplement product
2.5 ml liquid containing
0.5 mg Ag/ml
Adults 1.2 mg/day
0.021
mg/kg/day
NCR NCR NCR
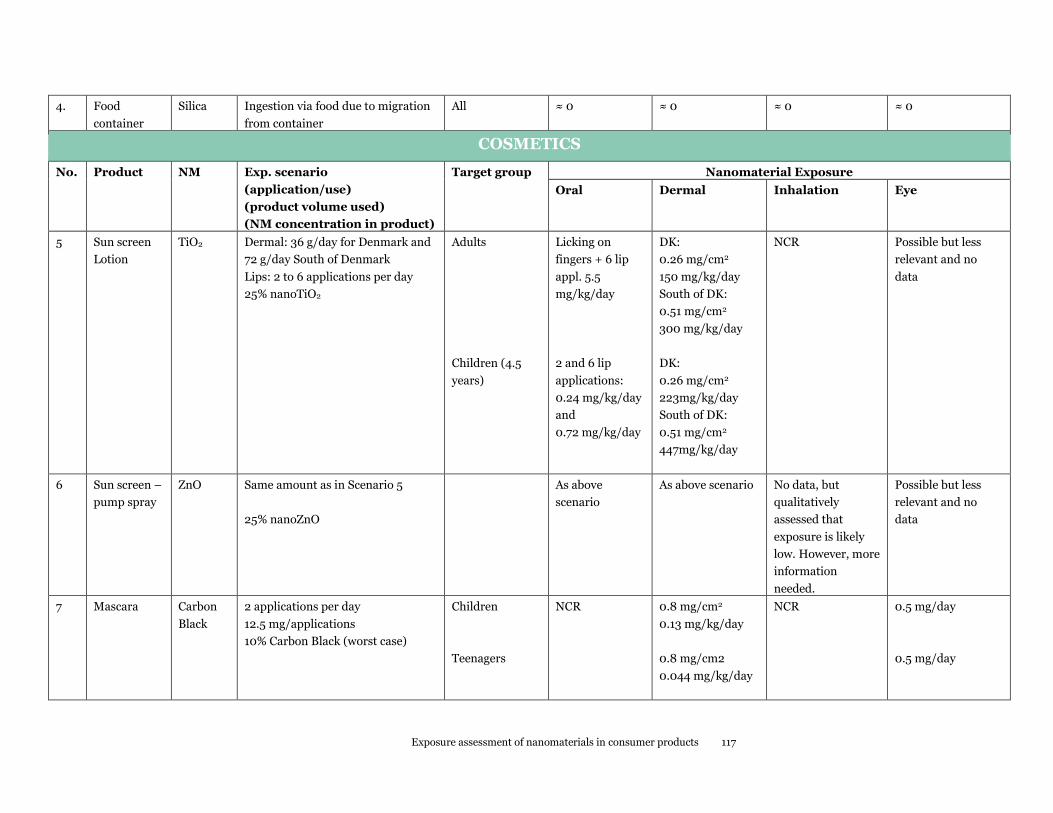
Exposure assessment of nanomaterials in consumer products 117
4. Food
container
Silica Ingestion via food due to migration
from container
All ≈ 0 ≈ 0 ≈ 0 ≈ 0
COSMETICS
No. Product NM Exp. scenario
(application/use)
(product volume used)
(NM concentration in product)
Target group Nanomaterial Exposure
Oral
Dermal
Inhalation
Eye
5 Sun screen
Lotion
TiO2 Dermal: 36 g/day for Denmark and
72 g/day South of Denmark
Lips: 2 to 6 applications per day
25% nanoTiO2
Adults
Children (4.5
years)
Licking on
fingers + 6 lip
appl. 5.5
mg/kg/day
2 and 6 lip
applications:
0.24 mg/kg/day
and
0.72 mg/kg/day
DK:
0.26 mg/cm2
150 mg/kg/day
South of DK:
0.51 mg/cm2
300 mg/kg/day
DK:
0.26 mg/cm2
223mg/kg/day
South of DK:
0.51 mg/cm2
447mg/kg/day
NCR Possible but less
relevant and no
data
6 Sun screen –
pump spray
ZnO Same amount as in Scenario 5
25% nanoZnO
As above
scenario
As above scenario No data, but
qualitatively
assessed that
exposure is likely
low. However, more
information
needed.
Possible but less
relevant and no
data
7 Mascara Carbon
Black
2 applications per day
12.5 mg/applications
10% Carbon Black (worst case)
Children
Teenagers
NCR 0.8 mg/cm2
0.13 mg/kg/day
0.8 mg/cm2
0.044 mg/kg/day
NCR 0.5 mg/day
0.5 mg/day
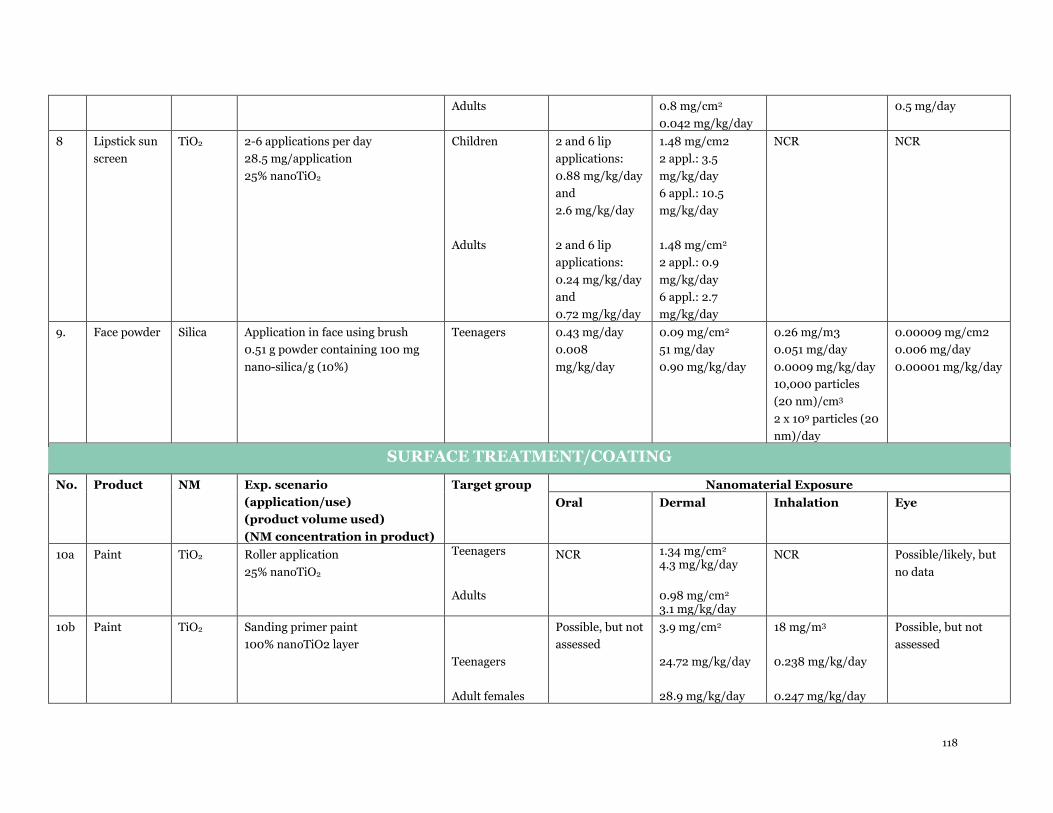
118
Adults 0.8 mg/cm2
0.042 mg/kg/day
0.5 mg/day
8 Lipstick sun
screen
TiO2 2-6 applications per day
28.5 mg/application
25% nanoTiO2
Children
Adults
2 and 6 lip
applications:
0.88 mg/kg/day
and
2.6 mg/kg/day
2 and 6 lip
applications:
0.24 mg/kg/day
and
0.72 mg/kg/day
1.48 mg/cm2
2 appl.: 3.5
mg/kg/day
6 appl.: 10.5
mg/kg/day
1.48 mg/cm2
2 appl.: 0.9
mg/kg/day
6 appl.: 2.7
mg/kg/day
NCR NCR
9. Face powder Silica Application in face using brush
0.51 g powder containing 100 mg
nano-silica/g (10%)
Teenagers 0.43 mg/day
0.008
mg/kg/day
0.09 mg/cm2
51 mg/day
0.90 mg/kg/day
0.26 mg/m3
0.051 mg/day
0.0009 mg/kg/day
10,000 particles
(20 nm)/cm3
2 x 10⁹ particles (20
nm)/day
0.00009 mg/cm2
0.006 mg/day
0.00001 mg/kg/day
SURFACE TREATMENT/COATING
No. Product NM Exp. scenario
(application/use)
(product volume used)
(NM concentration in product)
Target group Nanomaterial Exposure
Oral Dermal Inhalation Eye
10a Paint TiO2 Roller application
25% nanoTiO2
Teenagers
Adults
NCR 1.34 mg/cm2 4.3 mg/kg/day
0.98 mg/cm2 3.1 mg/kg/day
NCR Possible/likely, but
no data
10b Paint TiO2 Sanding primer paint
100% nanoTiO2 layer
Teenagers
Adult females
Possible, but not
assessed
3.9 mg/cm2
24.72 mg/kg/day
28.9 mg/kg/day
18 mg/m3
0.238 mg/kg/day
0.247 mg/kg/day
Possible, but not
assessed
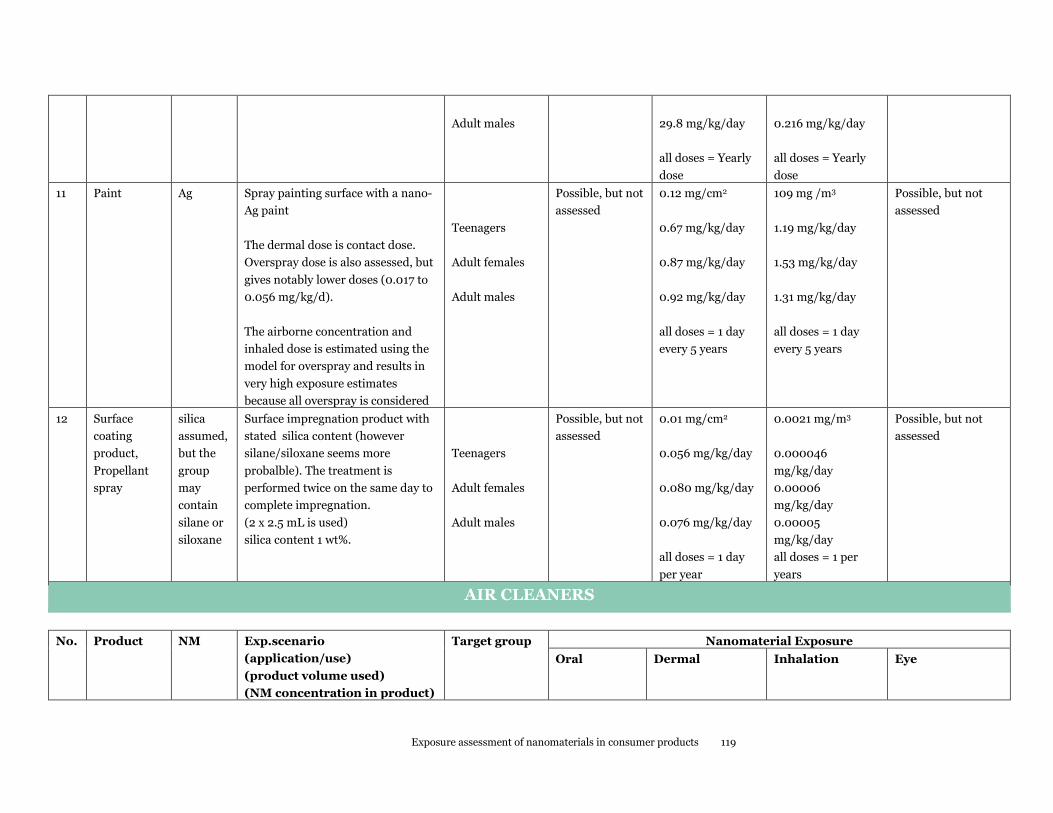
Exposure assessment of nanomaterials in consumer products 119
Adult males
29.8 mg/kg/day
all doses = Yearly
dose
0.216 mg/kg/day
all doses = Yearly
dose
11 Paint Ag Spray painting surface with a nano-
Ag paint
The dermal dose is contact dose.
Overspray dose is also assessed, but
gives notably lower doses (0.017 to
0.056 mg/kg/d).
The airborne concentration and
inhaled dose is estimated using the
model for overspray and results in
very high exposure estimates
because all overspray is considered
Teenagers
Adult females
Adult males
Possible, but not
assessed
0.12 mg/cm2
0.67 mg/kg/day
0.87 mg/kg/day
0.92 mg/kg/day
all doses = 1 day
every 5 years
109 mg /m3
1.19 mg/kg/day
1.53 mg/kg/day
1.31 mg/kg/day
all doses = 1 day
every 5 years
Possible, but not
assessed
12 Surface
coating
product,
Propellant
spray
silica
assumed,
but the
group
may
contain
silane or
siloxane
Surface impregnation product with
stated silica content (however
silane/siloxane seems more
probalble). The treatment is
performed twice on the same day to
complete impregnation.
(2 x 2.5 mL is used)
silica content 1 wt%.
Teenagers
Adult females
Adult males
Possible, but not
assessed
0.01 mg/cm2
0.056 mg/kg/day
0.080 mg/kg/day
0.076 mg/kg/day
all doses = 1 day
per year
0.0021 mg/m3
0.000046
mg/kg/day
0.00006
mg/kg/day
0.00005
mg/kg/day
all doses = 1 per
years
Possible, but not
assessed
AIR CLEANERS
No. Product NM Exp.scenario
(application/use)
(product volume used)
(NM concentration in product)
Target group Nanomaterial Exposure
Oral Dermal Inhalation Eye
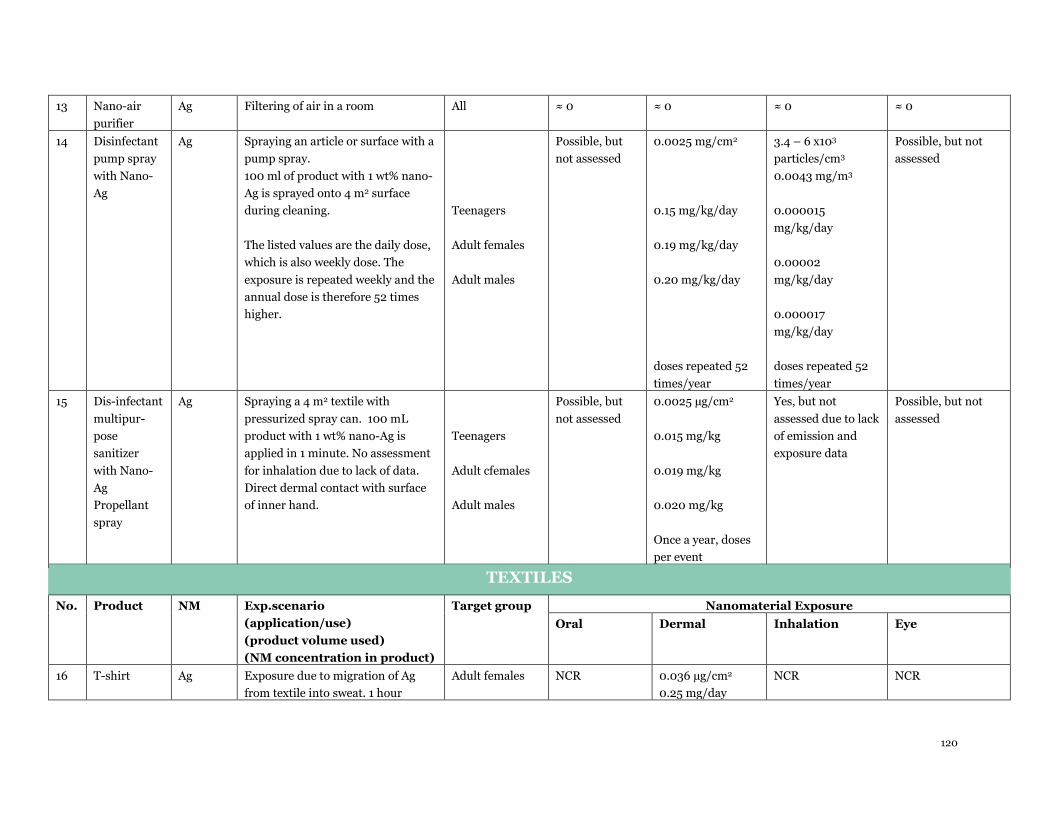
120
13 Nano-air
purifier
Ag Filtering of air in a room All ≈ 0 ≈ 0 ≈ 0 ≈ 0
14 Disinfectant
pump spray
with Nano-
Ag
Ag Spraying an article or surface with a
pump spray.
100 ml of product with 1 wt% nano-
Ag is sprayed onto 4 m2 surface
during cleaning.
The listed values are the daily dose,
which is also weekly dose. The
exposure is repeated weekly and the
annual dose is therefore 52 times
higher.
Teenagers
Adult females
Adult males
Possible, but
not assessed
0.0025 mg/cm2
0.15 mg/kg/day
0.19 mg/kg/day
0.20 mg/kg/day
doses repeated 52
times/year
3.4 – 6 x10³
particles/cm3
0.0043 mg/m3
0.000015
mg/kg/day
0.00002
mg/kg/day
0.000017
mg/kg/day
doses repeated 52
times/year
Possible, but not
assessed
15 Dis-infectant
multipur-
pose
sanitizer
with Nano-
Ag
Propellant
spray
Ag Spraying a 4 m2 textile with
pressurized spray can. 100 mL
product with 1 wt% nano-Ag is
applied in 1 minute. No assessment
for inhalation due to lack of data.
Direct dermal contact with surface
of inner hand.
Teenagers
Adult cfemales
Adult males
Possible, but
not assessed
0.0025 µg/cm2
0.015 mg/kg
0.019 mg/kg
0.020 mg/kg
Once a year, doses
per event
Yes, but not
assessed due to lack
of emission and
exposure data
Possible, but not
assessed
TEXTILES
No. Product NM Exp.scenario
(application/use)
(product volume used)
(NM concentration in product)
Target group Nanomaterial Exposure
Oral
Dermal
Inhalation
Eye
16 T-shirt Ag Exposure due to migration of Ag
from textile into sweat. 1 hour
Adult females
NCR
0.036 µg/cm2
0.25 mg/day
NCR
NCR
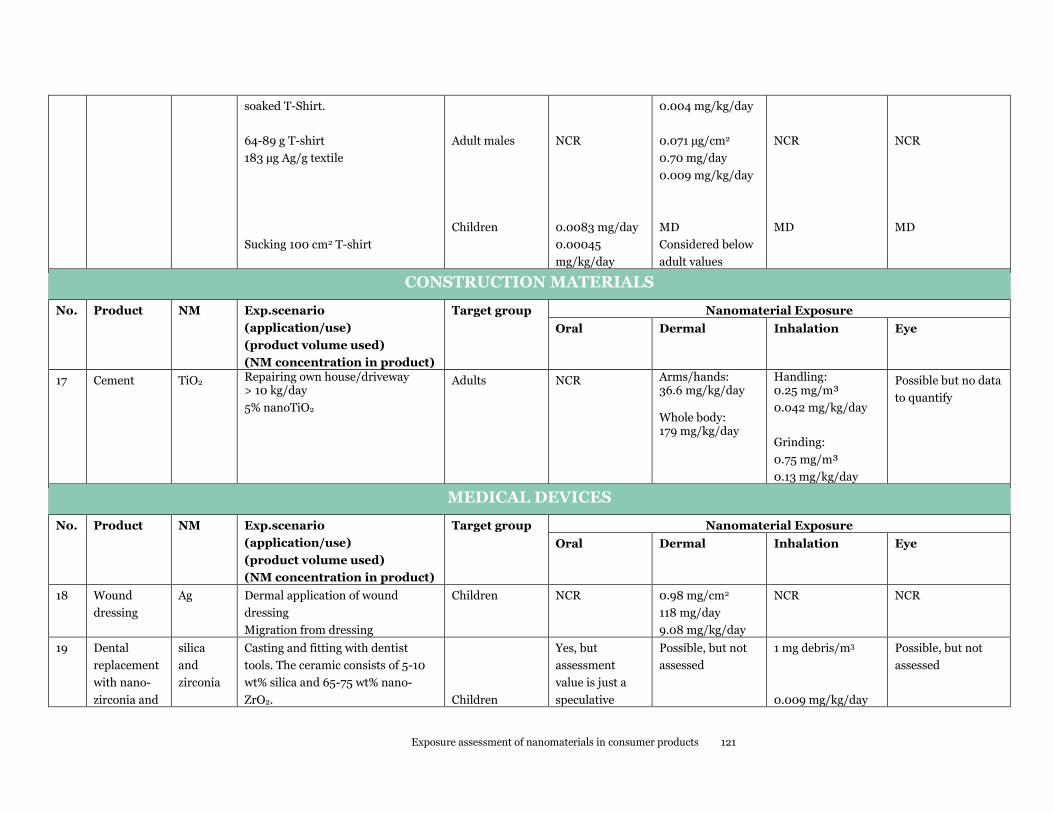
Exposure assessment of nanomaterials in consumer products 121
soaked T-Shirt.
64-89 g T-shirt
183 µg Ag/g textile
Sucking 100 cm2 T-shirt
Adult males
Children
NCR
0.0083 mg/day
0.00045
mg/kg/day
0.004 mg/kg/day
0.071 µg/cm2
0.70 mg/day
0.009 mg/kg/day
MD
Considered below
adult values
NCR
MD
NCR
MD
CONSTRUCTION MATERIALS
No. Product NM Exp.scenario
(application/use)
(product volume used)
(NM concentration in product)
Target group Nanomaterial Exposure
Oral
Dermal
Inhalation
Eye
17 Cement TiO2 Repairing own house/driveway > 10 kg/day
5% nanoTiO2
Adults NCR Arms/hands: 36.6 mg/kg/day Whole body: 179 mg/kg/day
Handling: 0.25 mg/m³
0.042 mg/kg/day
Grinding:
0.75 mg/m³
0.13 mg/kg/day
Possible but no data
to quantify
MEDICAL DEVICES
No.
Product
NM
Exp.scenario
(application/use)
(product volume used)
(NM concentration in product)
Target group Nanomaterial Exposure
Oral Dermal
Inhalation
Eye
18 Wound
dressing
Ag Dermal application of wound
dressing
Migration from dressing
Children NCR 0.98 mg/cm2
118 mg/day
9.08 mg/kg/day
NCR NCR
19 Dental
replacement
with nano-
zirconia and
silica
and
zirconia
Casting and fitting with dentist
tools. The ceramic consists of 5-10
wt% silica and 65-75 wt% nano-
ZrO2.
Children
Yes, but
assessment
value is just a
speculative
Possible, but not
assessed
1 mg debris/m3
0.009 mg/kg/day
Possible, but not
assessed
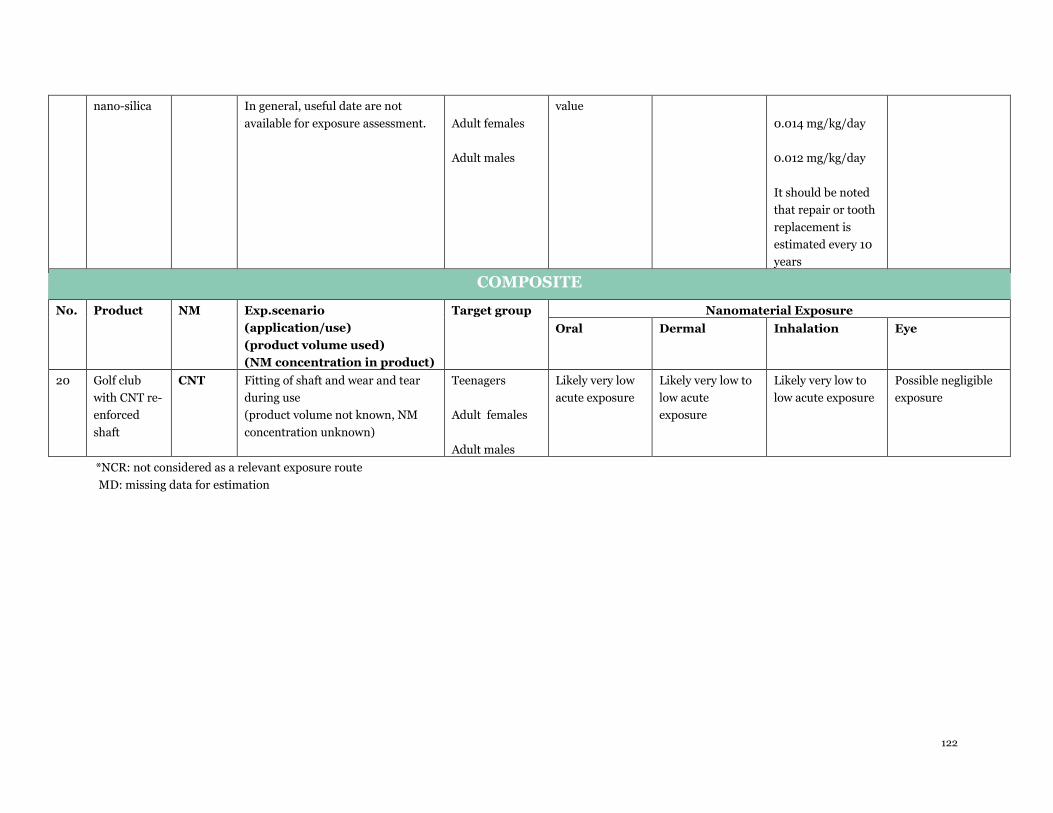
122
nano-silica In general, useful date are not
available for exposure assessment.
Adult females
Adult males
value
0.014 mg/kg/day
0.012 mg/kg/day
It should be noted
that repair or tooth
replacement is
estimated every 10
years
COMPOSITE
No.
Product
NM
Exp.scenario
(application/use)
(product volume used)
(NM concentration in product)
Target group Nanomaterial Exposure
Oral Dermal
Inhalation
Eye
20 Golf club
with CNT re-
enforced
shaft
CNT Fitting of shaft and wear and tear
during use
(product volume not known, NM
concentration unknown)
Teenagers
Adult females
Adult males
Likely very low
acute exposure
Likely very low to
low acute
exposure
Likely very low to
low acute exposure
Possible negligible
exposure
*NCR: not considered as a relevant exposure route
MD: missing data for estimation
Exposure assessment of nanomaterials in consumer products 123
7.2 Discussion of outcome
The following discussion is based on the findings presented in Table 7-1 supplemented by the data
given in the filled out templates in Appendix 7. It has to be noted that when the discussion indicates
high, medium and low exposure in relation to the various exposure routes and various
nanomaterials, this concerns solely the relative exposure and as compared to other exposures and
not whether the exposure may constitute a risk or not. Thus, when evaluating the exposure in this
chapter, this shall not be confused with evaluation of the risk, as evaluation of risk in connection
with a specific scenario require further input from a hazard evaluation for each specific
nanomaterial and for each specific exposure route. The exposure data from this chapter will be used
later in the forthcoming risk assessment stage of this project in which data on the hazards of the
nanomaterials are included in order to compare the exposure assessments given in Table 7-1 with
the hazard evaluation and characterization presented in the separate project report “Hazard
assessment of nanomaterials in consumer products”.
7.2.1 Scenarios covering oral exposure
For 12 scenarios, estimations have been made regarding oral exposure (food and beverages
scenarios 1, 2, 3, 4; cosmetic scenario 5, 6, 8, 9; air-ventilation purifier scenario 13; textile scenario
16, dental filling scenario 19; composite scenario 20).
Food items and cosmetics represent the sources with the highest oral exposure (up to 5.5 mg NM/
kg bw/day, scenarios 5 and 6), whereas oral exposure from textiles, air-purifiers, dental fillings, or
composite may seem rather low or in some cases even considered as absent.
However, it should be noticed that if inhalation occurs, then the inhalational dose expressed in mg
NM /kg bw/day may also contribute to the oral dose as particles that do not deposit in the alveolar
region may be swallowed.
7.2.2 Scenarios covering dermal exposure
For 14 scenarios, estimations have been made regarding dermal exposure (1 (food contact material);
5, 6, 7, 8, 9 (cosmetics); 10, 11, 12 (surface coating); 13 (air-ventilation cleaner); 16 (textile); 17
(construction material); 18 (medical devise); 20 (composite).
Cosmetics represent by far the highest exposure potential as these products often are intended for
dermal application on a daily basis (up to 450 mg NM/kg bw/day in scenario 5).
Construction materials (scenario 17, cement) also represent a high potential for dermal exposure
primarily due to the large dermal surface areas exposed. Also the paint and sanding scenarios
(10,11) represent scenarios with potential for dermal exposure especially from sanding up to 30
mg/kg bw/day. However, the exposure to nanomaterials in sanding dust may vary considerably
depending on the type of paint. In this case, scenario 11, represent sanding of a primer paint, which
is reported to only contain nanomaterial suspended in a water-based medium. The paint scenario
(number 10) on the other hand represents a regular paint coating where the sanding debris may
predominantly be incorporated in the larger solid particles of the paint matrix.
Wound dressings (scenario 18) further represent a high dermal exposure potential.
Low dermal exposure potential relates to food-contact material (4), air-ventilation cleaner (13),
composite (20) and textile (16) (the latter due to very low concentrations in the textile).
7.2.3 Scenarios covering inhalation exposure
For 11 scenarios, estimations have been made regarding inhalation exposure (6, 9 (cosmetics); 10,
11, 12 (surface coating); 13, 14, 15 (air-cleaners); 17 (cement); 19 (dental filling); 20 (composite).
124
Sanding and Spray-painting (10, 11) represented by far the highest potential for exposure (18-109
mg NM/m3 and an overall exposure of 0.2-1.5 mg NM/kg bw/day). In the case of spray painting,
the assessment is thought, however, to result in great overestimation because no model is able to
truly estimate the inhalation exposure to overspray.
Scenario 17, cement represented an in-between scenario with an exposure level of 0.75 mg NM/m3
and 0.13 mg NM/kg bw/day.
Also, use of face powder (9) may result in a relatively high exposure level of 0.26 mg NM/m3 and a
number-based exposure level of more than 10,000 particles per cm3, however with a low overall
exposure of 0.001 mg NM/kg bw/day and more than 2 x 10⁹ particles/person/day.
In the selected cases for use of pump and propellant spray for surface impregnation and air –
cleaning representing rather low exposure levels (up to 0.004 mg NM/m3, scenario 14) and overall
exposure (up to 0.02 mg Nm/kg bw/day, scenario 15). The relatively low estimated exposure levels
are due to low contents of NM in the products and short exposure durations.
Inhalation exposure from sanding and fitting a CNT-reinforced shaft for a golf-club as a
representative for sports gear (scenario 20) may only lead to very low or low acute exposure. The
assessment is uncertain as both the exact location, type of the matrix and concentration in the
product are unknown.
Inhalation exposure is determined by many parameters/factors that have to be considered in each
scenario. Therefore, the combination of uncertainties and worst-case assumptions for each of these
determining parameters are added (or multiplied) upon each other leading to scenarios that
generally reflect greater variability and uncertainties than what pertains to the oral and dermal
exposure estimates.
7.2.4 Scenarios covering eye exposure
For only two scenarios, quantitative estimations have been made regarding eye exposure (7 and 9)
(cosmetics for mascara and face powder). Highest exposure was estimated for mascara leading to an
exposure of 0.5 mg NM into the eye on a daily basis.
In general, eye exposure with respect to airborne exposure is difficult to assess and therefore great
uncertainties exist in the assessments, but the mass based exposure levels are to be considered as
minor compared to other exposure routes (scenario 9). However, it should be kept in mind that eye
exposure –even if low- may be of concern in terms of the local exposure of the mucous membranes
of the eye and possible local effects.
7.2.5 Overall dose levels from use of the various product categories and
formulations
Overall highest NM dose can be found from food items and food supplements (oral exposure);
cosmetics, especially sunscreens (dermal and oral exposure); surface coating, paints (dermal and
inhalation), construction material, cement (dermal and inhalation); wound dressing (dermal).
Lower dose levels pertain to air cleaners, ventilation system and pump/propellant sprays
(inhalation scenario 13, 14, 15); surface coating, propellant spray (inhalation) and textiles
(dermal).
Very low if any exposure was found in relation to the chosen scenarios for food contact material,
air cleaner (ventilation purifier), and from composites.
Exposure assessment of nanomaterials in consumer products 125
7.2.6 Exposure to specific nanomaterials
7.2.6.1 Nano-Ti02 (scenario 1, 5, 8, 10, 17)
High oral exposure pertain to food (1) and cosmetics (5, 8) where exposures in the range of 1.6 - 5.5
mg nano-TiO2/kg bw/day were estimated.
High dermal exposures were especially related to:
cosmetics: up to 446 mg nano-TiO2 for a sunscreen product (5),
construction material: up to 179 mg nano-TiO2/kg bw/day for cement (17), and
sanding of paint: up to 30 mg TiO2/kg bw/day (10b).
Still high (but lower) dermal exposure of up to 4.3 mg nano-TiO2/kg bw/d was estimated for roller
application of paint (10a).
Inhalation exposure levels (scenario 10b, sanding of paint surface and 17 cement) was found to be
in the range of 0.25-18 mg/m3 resulting in inhaled doses in the range of 0.042- 0.25 mg/kg bw/day.
7.2.6.2 Nano-silica (scenarios 2, 4, 9, 12, 19)
High oral exposure pertain to food (2) with an accumulated exposure up to 1.8 mg nano-silica/kg
bw/day. No/low oral exposure is considered to take place from the use in food contact materials (4).
The use of nano-silica in surface-coating (12) is considered very uncertain, however it is considered
to be relatively low both in relation to dermal and inhalation exposure.
The use in e.g. face powder (9) result in relatively high dermal exposure of 51 mg/d or 0.9 mg/kg
bw/d, whereas the dermal exposure, inhalation exposure and eye exposure are considered orders of
magnitudes lower on a mg/kg bw/day basis.
7.2.6.3 Nano-Ag (scenario 3, 11, 13, 14, 15, 16, 18)
Highest dermal exposures pertain to the use of wound dressing (18) with an exposure estimation of
9 mg/kg bw/day.
High dermal and inhalation exposure pertain to spray painting (11) with estimated exposures of
0.9 mg/kg bw/d and 1.2 mg/kg bw/day, respectively.
Exposure from disinfection sprays (14, 15) was estimated to reach up to 0.2 mg/kg bw/day for
dermal exposure and up to 0.o2 mg/kg bw/day for inhalation exposure (in connection with an air
concentration of 0.0025 mg Ag/m3).
Dermal exposure from textile (16) was estimated at 0.009 mg/kg bw/day, which is to be considered
as very low.
The highest oral exposure is from a food supplement (3) with an estimated exposure of 0.021
mg/kg bw/day.
Exposure from an air-ventilation purifier was considered to be very low or even absent (13).
7.2.6.4 Nano-ZnO (scenario 6)
High oral and dermal exposure pertain to the use in a sunscreen product (6) where exposures up to
5.5 mg nano-ZnO/kg bw/day (oral) and 446 mg ZnO/kg bw/day (dermal) were estimated.
7.2.6.5 Carbon black (scenario 7)
Relatively high dermal load of 0.8 mg/cm2 was found for the use in mascara. Also, an eye exposure
of 0.5 mg/day was estimated.
126
An upper exposure of 0.13 mg/kg bw/day was estimated for children.
7.2.6.6 Nano-zirconia (scenario 19)
The use in dental fillings for tooth replacement may result in exposure less frequent than once a
year. The exposure assessment is considered very uncertain. An inhalational dose of up to 0.014
mg/kg bw/day was estimated.
7.2.6.7 CNT (scenario 20)
The use of CNT in a golf club was estimated to result in very low acute exposure by dermal and
inhalational exposure.
7.2.7 Target groups
Children were considered in 8 scenarios and found to be the most exposed target group in 7 of the
20 exposure scenarios (1 (TiO2); 5(TiO2); 6(ZnO); 7(Carbon black);8(TiO2), 18 (Ag), 19(Zirconia)).
In scenario 16 (textile, Ag) only oral exposure was considered as dermal exposure was considered
lower than for adults.
The far highest dermal and oral exposure to TiO2 and ZnO pertain to the use of sunscreen (5, 6).
High dermal exposure to nano-Ag pertains to the use in wound dressing.
Teenagers were considered in nine scenarios and found to be the most exposed target group in two
scenarios: scenario 9 (nanosilica, face powder) and scenario 10 (TiO2, roller application of paint).
Adults were considered in 16 scenarios and were the most exposed target group in nine scenarios:
scenario 2 (nano-silica, food-items); scenario 3 (nano-Ag, food supplement); scenarui 10(TiO2,
sanding painted surfaces); scenarui 11 (nano-Ag, spray painting), scenario 12 (silica, surface
coating), scenarios 14+15 (nano-Ag, disinfectant sprays), scenario 16 (nano-Ag, textile), scenario 17
(TiO2, cement).
7.3 Uncertainty and knowledge gaps
It should be noted that the 20 products addressed in Chapter 6 and 7 are only a small selection of
consumer products, which contain or could contain nanomaterials. Further, given availability of
data, the selection is biased towards products where the manufacturer/producer has had an interest
in "claiming" a content of nanomaterials. Anyway, given current knowledge, the selected products
are expected to illustrate representative cases for the current situation.
Generally, the chemical identity and/or characterisation of nanomaterials applied in consumer
products are not very well described. Several entries in available inventories/databases give no
("Unknown") or very generic information about the contained nanomaterial, and seldom any details
about their characteristics. Also in some cases, the “nanoeffect” is due to reactive chemistry and
formation of nanoscale structures after application of the products. In these cases, nanomaterials or
nanoscale particles may be produced during application as in the case of some nanosprays.
Related to this, the nanomaterials concentration in a consumer product is often not indicated, and
therefore the exposure estimate becomes associated with high uncertainty. In many cases, the
exposure will be in association or liberated from a matrix where the transfer out of a droplet, a
surface layer or the matrix a sanding fragment for example is less understood as for pure soluble
chemicals.
With a few exceptions, available data and models only allow exposure estimation in the mass
metric. In particular for inhalation, the number or surface area metrics might for specific cases be
more relevant, e.g. in relation to further risk assessment.
Exposure assessment of nanomaterials in consumer products 127
In general, current exposure estimation models are not designed for estimating nanomaterial
exposure.
As already noted, it appears more reliable to estimate (conservatively) oral and dermal exposures to
nanomaterials (as mass based exposure estimates). In many cases it is, however, uncertain to which
extent the nanomaterial can be liberated (or migrate) from the product matrix, as this may very
much influence the real oral or dermal exposure to the nanomaterial. Inhalation exposure is more
difficult and from reviewing the available literature, it appears particularly difficult to assess
exposures following pump and propellant spray applications. Although the amount of scientific
publications presenting data from studies of spray applications is growing, a closer look at these
publications reveal that exposure concentration are highly dependent on a significant number of
experimental parameters (pressure, nozzle size, ventilation, size of experimental chamber, viscosity
of sample, analytical measurement techniques, etc.). Thus, in general, representative data for
inhalation exposure following spray applications are lacking.
To some extent, the same applies for data on exposure following mechanical reworking (sanding,
grinding, etc.) as well as wear and tear of nanomaterials containing consumer products.
7.4 Implications for use of data
The uncertainties described above have, between others, the following implications for further use
of information collected and generated in this report:
As also pointed out by the reference group of the project, the 20 scenarios addressed can be
seen as representing very relevant consumer products with expected high as well as low
exposure potentials. However, there are too many knowledge gaps in relation to where
nanomaterials could potentially be found in and released from consumer products to say that
(only) 20 scenarios are representative for consumer products as such.
Given the diversity of products and matrices in which nanomaterials are found, as well as the
level of available exposure estimation models, exposure (and risk assessment) of
nanomaterials in consumer products must currently be made on a case-by-case basis.
When assessing risks, it should be noted that the characterization of the nanomaterials in the
investigated consumer products is generally not very well described, making it challenging to
match exposure findings with hazard findings.
Care should be taken when assessing in particular inhalation risks in the next phases of the
project as the mass metric applied is probably not the most appropriate metric for assessing
risk. Also, in general, the low tier exposure estimations may be very conservative which of
course should be kept in mind and considered when evaluating the outcome of the risk
assessment
128
8. References
ANEC (European Association for the Co-ordination of Consumer Representation in
Standardisation) and BEUC (Bureau européen des unions de consommateurs). ANEC/BEUC
inventory of products claiming to contain nanoparticles available on the EU market. (Excel file. e.g.
can be downloaded from here: http://www.beuc.org/Content/Default.asp?PageID=2142)
Benn T, Cavanagh B, Hristovski K, Posner JD, and Westerhoff P. 2010. The Release of Nanosilver
from Consumer Products Used in the Home J Environ Qual 39, 1875-1882.
Benn TM, and Westerhoff P. 2008. Nanoparticle silver released into water from commercially
available sock fabrics. Environmental Science & Technology 42 (11): 4133-4139
Benn TM, Westerhoff P, and Herckes P. 2011. Detection of fullerenes (C60 and C70) in commercial
cosmetics. Environmental Pollution 159, 1334-1342.
Brouwer DH. 2012. Control Banding Approaches for Nanomaterials, Ann. Occup. Hyg., Vol. 56, no.
5 pp. 506-514, Oxford University Press
Bund 2013. German environmental NGO “Bund” nanoproduct database:
http://www.bund.net/nc/themen_und_projekte/nanotechnologie/nanoproduktdatenbank/produk
tsuche/
Calzolai L, Gilliland D, and Rossi F. 2012. Measuring nanoparticles size distribution in food and
consumer products: a review. Food Additives and Contaminants 29(8), 1183-1193
Chen BT, Afshari A, Stone S, Jackson M, Schwegler-Berry D, Frazer DG, Castranova V, and Thomas
TA. 2010. Nanoparticles-containing spray can aerosol: characterization, exposure assessment, and
generator design. Inhalation Toxicology 22 (13): 1072-1082.
Danish EPA 2007. Kortlægning af produkter der indeholder nanopartikler eller er baseret på
nanoteknologi. Consumer Survey No 81. Danish Environmental Protection Agency (in Danish)
Danish EPA 2011a. Survey on basic knowledge about exposure and potential environmental and
health risk for selected nanomaterials. Environmental Project No. 1370, Danish Environmental
Protection Agency.
Danish EPA 2011b. NanoRiskCat – A conceptual decision support tool for nanomaterials.
Environmental Project 1372.
Danish EPA 2012. Assessment of nanosilver on textiles on the Danish market. Environmental
Project No 1432. 77 pp + appendices.
Danish EPA 2014a. Supplementary survey of products on the Danish Market containing
nanomaterials. Environmental Project No 1581.
http://www2.mst.dk/Udgiv/publications/2014/06/978-87-93178-66-3.pdf
Exposure assessment of nanomaterials in consumer products 129
Danish EPA 2014b. CNT-report (in preparation).
Danish EPA 2014c. Nanomaterials in waste - Issues and new knowledge (in preparation).
Dashtizadeh A, Abdouss M, Khorassani M, and Mahdavi H. 2011. Preparation of silica-filled water-
based acrylic nanocomposite paints with improved scratch resistance. Journal of Plastic Film &
Sheeting 28 (2): 120-135.
Dekkers S, Krystek P, Peters RJB, Lankveld DPK, Bokkers BGH, Hoeven-Arentzen PHv,
Bouwmeester H, and Oomen AG 2011. Presence and risks of nanosilica in food products.
Nanotoxicology 5(3), 393-405.
Echegoyen Y and Nerín C 2013. Nanoparticle release from nano-silver antimicrobial food
containers. Food Chem Toxicol 62, 16-22.
ECHA 2011. Guidance on Requirements for substances in articles. Available via:
http://echa.europa.eu/documents/10162/13632/articles_en.pdf
ECHA 2012. Guidance on Information Requirements and Chemical Safety Assessment.
Avaialble via: http://echa.europa.eu/web/guest/guidance-documents/guidance-on-information-
requirements-and-chemical-safety-assessment
EFSA 2011a.Guidance on the risk assessment of the application of nanoscience and
nanotehcnologies in the food and feed chain. European Food Safety Authority, EFSA Journal
2011;9(5):2140
EFSA 2011b. Scientific Opinion on re-evaluation of calcium carbonate (E 170) as a food
additive1EFSA Journal 2011;9(7):2318.
EFSA 2012. Scientific Opinion on the re-evaluation of vegetable carbon (E 153) as a food additive.
EFSA Journal 2012;10(4):2592
Environmental Defense – DuPont 2007. Nano Risk Framework. Environmental Defense – DuPont Nano Partnership. http://www.nanoriskframework.com/files/2011/11/6496_Nano-Risk-Framework.pdf
EU-Commission 2013. Discussion document on the regulation of the use of biocides in food contact
materials. Draft February 2013, 13 pp.
Friends of the Earth 2008. Out of the laboratory and on to our plates - Nanotechnology in Food &
Agriculture; (http://nano.foe.org.au/sites/default/files/Nanotechnology%20in%20food%20a
nd%20agriculture%20-%20text%20only%20version_0.pdf)
Goetz NV, Lorenz C, Windler L, Nowack B, Heuberger M, and Hungerbühler K. 2013. Migration of
Ag- and TiO2-(Nano)particles from Textiles into Artificial Sweat under Physical Stress:
Experiments and Exposure Modeling. Environ. Sci. Technol. 47, 9979-9987
Göhler D, Stintz M, Hillemann L and Vorbau M. 2010. Characterization of nanoparticle release
from surface coatings by the simulation of a sanding process. Annals of Occupational Hygiene
54(6), 615-624
Hagendorfer H, Lorenz C, Kaegi R, Sinnet B, Gehrig R, Goetz NV, Scheringer M, Ludwig C, and
Ulrich A. 2010. Size-fractionated characterization and quantification of nanoparticle release rates
from a consumer spray product containing engineered nanoparticles. J Nanopart Res 12, 2481-2494
130
Hanus, M.J., and Harris, A.T. 2013. Nanotechnology innovations for the construction industry.
Progress in Materials Sciencem. 58: 1056-1102
Hsu LY, and Chein HM. 2007. Evaluation of nanoparticle emission for TiO2 nanopowder coating
materials. Journal of Nanoparticle Research 9 (1): 157-163
Kaiser JP, Zuin S, and Wick P. 2013. Is nanotechnology revolutionizing the paint and lacquer
industry? A critical opinion. Science of The Total Environment 442: 282-289
Kingston C, Zepp R, Andrady A, Boverhof D, Fehir R, Hawkins D, Roberts J, Sayre P, Shelton B,
Sultan Y, Vejins V, and Wohlleben W. 2014. Release characteristics of selected carbon nanotube
polymer composites. Carbon 68, 33-57
Koponen IK, Jensen KA, and Schneider T. 2011. Comparison of dust released from sanding
conventional and nanoparticle-doped wall and wood coatings. Journal of Exposure Science and
Environmental Epidemiology 21 (4): 408-418
Lem KW, Choudhury A, Lakhani AA, Kuyate P, Haw JR, Lee DS, Iqbal Z, and Brumlik CJ. 2012. Use
of Nanosilver in Consumer Products, 60-72. Recent Patents on Nanotechnology
Lorenz C, Goetz NV, Scheringer M, Wormuth M, and Hungerbühler K. 2011. Potential exposure of
German consumers to engineered nanoparticles in cosmetics and personal care products.
Nanotoxicology 5(1), 12-29.
Lorenz C, Windler L, Goetz NV, Lehmann RP, Schuppler M, Hungerbühler K, Heuberger M, and
Nowack B. 2012. Characterization of silver release from commercially available functional
(nano)textiles. Chemosphere 89, 817-824.
Methner M, Crawford C and Geraci C. 2012. Evaluation of the potential airborne release of carbon
nanofibers during the preperation, grinding, and cutting of epoxy-based nanocomposite material.
Journal of Occupational and Environmental Hygiene 9, 308-318.
Michel K, Scheel J, Karsten S, Stelter N, and Wind T. 2013. Risk assessment of amorphous silicon
dioxide nanoparticles in a glass cleaner formulation. 974-988. Nanotoxicology.
Milieu / RPA 2009. Information from Industry on Applied Nanomaterials and their Safety.
http://www.nanomaterialsconf.eu/documents/Nanos-Task1.pdf
Milieu / RPA 2010. Proposal for an EU Reporting System for Nanomaterials.
http://www.nanomaterialsconf.eu/documents/NanoReportingSystemFinalReport-20Jun10.doc
Nanex 2010. Development of Exposure Scenarios for Manufactured Nanomaterials). Work package
4 report on consumer exposure. http://www.nanex-project.eu/mainpages/public-
documents/doc_download/101-nanex-project-final-report-.pdf
+ FP7 Nanex project (http://nanex-project.eu/) surveying literature and existing exposure models
to identify knowledge about consumer exposure scenarios and assessment of nanomaterials
Nano Connect Scandinavia 2012. Nanotechnology for New Materials. Available as download from:
http://www.nano-connect.org/downloads [accessed 14.02.2014]
Nanodatabase (2013)."Nanodatabasen", DTU Environment, The Danish Ecological Council and
Danish Consumer Council.
Exposure assessment of nanomaterials in consumer products 131
http://nanodb.dk/en/
Nanoforum 2006. Nanotechnology in Consumer Products.
http://www.innovationsgesellschaft.ch/images/fremde_publikationen/Nanotechnology_in_consu
mer_products.pdf
Nanotechproject 2013. Inventory of the Project on emerging Nanotechnologies (formerly known as
the Woodrow Wilson database)
(http://www.nanotechproject.org/inventories/consumer/)
NANOWERK 2012; http://www.nanowerk.com/nanotechnology_databases.php
Nazarenko Y, Han TW, Lioy PJ, and Mainelis G. 2011. Potential for exposure to engineered
nanoparticles from nanotechnology-based consumer spray products. 515-528. J Expo Sci Environ
Epidemiol.
Nazarenko Y, Zhen H, Han T, Lioy PJ, and Mainelis G. 2012. Potential for Inhalation Exposure to
Engineered Nanoparticles from Nanotechnology-Based Cosmetic Powders. Environmental Health
Perspectives 120(6), 885-892.
Nowack B, David RM, Fissan H, Morris H, Shatkin JA, Stintz M, Zepp R, and Brouwer D. 2013.
Potential release scenarios for carbon nanotubes used in composites. Environment International 59
(0): 1-11.
Nørgaard AW, Jensen KA, Janfelt C, Lauritsen FR, Clausen PA, and Wolkoff P. 2009. Release of
VOCs and Particles During Use of Nanofilm Spray Products. Environmental Science & Technology
43 (20): 7824-7830
Nørgaard, AW, Larsen, ST, Hammer, M, Poulsen, SS , Jensen, KA , Nielsen, GD and Wolkoff, P
2010. Lung damage in mice after inhalation of nanofilm spray products: the role of perfluorination
and free hydroxyl groups. Toxicological Sciences, vol 116, no. 1, pp. 216-24.,
http://dx.doi.org/10.1093/toxsci/kfq094
Patel HA, Somani RS, Bajaj HC, and Jasra RV. 2006. Nanoclays for polymer nanocomposites,
paints, inks, greases and cosmetics formulations, drug delivery vehicle and waste water treatment.
Bulletin of Materials Science 29 (2): 133-145.
OECD 2012. Important issues on Risk Assessment of manufactured nanomaterials. Series on the
Safety of Manufactured Nanomaterials No. 33. ENV/JM/MONO(2012)8. OECD.
Quadros ME, and Marr LC. 2011. Silver Nanoparticles and Total Aerosols Emitted by
Nanotechnology-Related Consumer Spray Products. Environ. Sci. Technol 45,10713-10719.
Quadros ME, Pierson R, Tulve NS, Willis R, Rogers K, Thomas TA, and Marr LC. 2013. Release of
Silver from Nanotechnology-Based Consumer Products for Children. Environ. Sci. Technol 47,
8894-8901.
Rigo, C., Roman M., Munivrana, I., Vindigni, V., Azzena, B., Barbante, C., Cairns, W.R.L.
2012.Characterization and evaluation of silver release from four different dressings used in burns
care. 38, 1131–1142. Burns.
RIVM 2006. Nanomaterials in consumer products - Availability on the European market and
adequacy of the regulatory framework. RIVM/SIR Advisory report 11014 (IP/A/ENVI/IC/2006-
132
193). Prepared for the European Parliament.
http://www.europarl.europa.eu/comparl/envi/pdf/externalexpertise/nanomaterials_in_consumer
_products.pdf
RIVM 2007. Inventory of consumer products containing nanomaterials.
RIVM/SIR Advisory report 11124;
http://www.rivm.nl/bibliotheek/digitaaldepot/inventoryconsumerproducts.pdf
RIVM 2009. Exposure to nanomaterials in consumer products. Letter report 340370001/2009.
http://www.rivm.nl/bibliotheek/rapporten/340370001.pdf
RIVM 2010a. Nanomaterials in consumer products. Update of products on the European market in
2010. RIVM Report 340370003/2010.
http://www.nanogenotox.eu/files/PDF/rivm%20rapport%20nanomaterials%2
0in%20consumer%20products%2023-02-2011.pdf
RIVM 2010b. Development of an inventory for consumer products containing nanomaterials. Final
Report. 070307/2010/580587/SER/D3;
http://ec.europa.eu/environment/chemicals/nanotech/pdf/study_inventory.pdf
RIVM 2011. Nanomaterial in consumer products. Detection, characterisation and interpretation.
Report 320029001/2011.
Roman M., Rigo, C., Munivrana, I., Vindigni, V., Azzena, B., Barbante, C., Fenzi, F., Guerriero, P.,
Cairns, W.R.L. 2013. Development and application of methods for the determination of silver in
polymeric dressings used for the care of burns. 115, 94-103.. Talanta.
Saber AT, Koponen IK, Jensen KA, Jacobsen NR, Mikkelsen L, Moller P, Loft S, Vogel U, and
Wallin H. 2012. Inflammatory and genotoxic effects of sanding dust generated from nanoparticle-
containing paints and lacquers. Nanotoxicology 6 (7): 776-788.
SCCS 2012a. Guidance on the Safety Assessment of Nanomaterials in Cosmetics. Scientific
Committee on consumer safety, SCCS/1484/12.
SCCS 2012b. The SCCS´S notes to Guidance for the testing of Cosmetic substances and their safety
evaluation. Scientific Committee on consumer safety, SCCS/1501/12.
SCCS 2012c. Scientific Committee on Consumer Safety. Opinion on Zinc oxide (nano form).
SCCS/1489/12. 112 pp.
SCCS 2013a. Scientific Committee on Consumer Safety. Opinion on Carbon Black (nano form).
SCCS/1515/13. 104 pp
SCCS 2013b. Scientific Committee on Consumer Safety. Opinion on Titanium dioxide (nano form).
SCCS/1516/13. 111 pp.
Schlagenhauf L, Chu BTT, Buha J, Nüesch F, and Wang J. 2012. Release of Carbon Nanotubes from
an Epoxy-Based Nanocomposite during an Abrasion Process., 7366-7372. Environ. Sci. Technol.
The Constructor. No date. Smart nanomaterials in construction industry. Available online:
http://theconstructor.org/building/smart-materials/smart-nanomaterials-in-construction-
industry/5638/ [accessed 07.02.2014]
Exposure assessment of nanomaterials in consumer products 133
Trop, M., Novak, M., Rodl, S., Hellbom, B., Kroell, W., Goessler, W. Silver-coated dressing Acticoat
caused raised liver enzymes and argyria-like symptoms in burn patient. 60(3), 648-652. 2006. J
Trauma.
Van Broekhuizen, P., van Broekhuizen, F., Cornelissen, R., Reijnders, L. 2010. Use of nanomaterials
in the European construction industry and some occupational health aspects thereof. J Nanopart
Res.
Van Landuyt KL, Yoshihara K, Geebelen B, Peumans M, Godderis L, Hoet P, van Meerbeek B. 2012.
Should web e concerned about composute (nano-)dust?. Dental Materials 28, 1162-1170.
Vlachou, E., Chipp, E., Shale, E., Wilson, Y.T., Papini, E., Moiemen, N.S. 2007.The safety of
nanocrystalline silver dressings on burns: A study of systemic silver absorption. 33, 979-985. Burns.
Weir A, Westerhoff P, Fabricius L, Hristovski K, and Goetz NV. 2012. Titanium Dioxide
Nanoparticles in Food and Personal Care Products., 2242-2250. Environ. Sci. Technol.
Windler L, Lorenz C, Hungerbühler K, Amberg M, Heuberger M, and Nowack B. 2012. Release of
Titanium Dioxide from Textiles during Washing. Environ. Sci. Technol 46, 8181-8188.
Wohlleben W, Brill S, Maier MW, Mertler M, Cox G, Hirth S, von Vacano B, Straus V, Treumann S,
Wiench K, Ma-Hock L, and Landsiedel R. 2011. On the lifecycle of nanocomposites: comparing
released fragments and their in-vivo hazards from three release mechanisms and four
nanocomposites Small 7(16), 2384-2395.
Wohlleben W, Meier MW, Vogel S, Landsiedel R, Cox G, Hirth S, and Tomovic Z. 2013. Elastic
CNT-polyurethane nanocomposite: synthesis, performance and assessment of fragment release
during use. Nanoscale 5, 369-380.
Strandgade 29
1401 Copenhagen K, Denmark
Tel.: (+45) 72 54 40 00
www.mst.dk
Exposure assessment of nanomaterials in consumer products
Under the Agreement "Better Control of Nanomaterials" (“Bedre styr på nanomaterialer”), the Danish
EPA has commissioned a number of projects aiming to investigate and generate new knowledge on the
presence of nanomaterials in products on the Danish market and assess the possible associated risks to
consumers and the environment.
This report is the first in a series of four from a project which addresses consumer exposure and risk
assessment of nanomaterials in products on the Danish market. The report:
• Evaluates existing methods/approaches/tools for assessing consumer exposure and risks
associated with consumer nanoproducts.
• Identifies representative consumer nanoproducts from which to select and describe a total of 20
exposure scenarios for further risk assessment.