Embed Size (px)
Citation preview

ARTICLE IN PRESS
1352-2310/$ - se
doi:10.1016/j.at
�CorrespondE-mail addr
Atmospheric Environment 39 (2005) 7342–7350
www.elsevier.com/locate/atmosenv
Exposure to airborne fungi and bacteria while commuting inpassenger cars and public buses
Ji-Hyun Lee, Wan-Kuen Jo�
Department of Environmental Engineering, Kyungpook National University, Daegu, Korea
Received 21 March 2005; received in revised form 8 August 2005; accepted 1 September 2005
Abstract
The present study examined airborne microbe levels inside and outside passenger cars and public buses during two
seasons (winter and summer). The prevalence level of individual fungal genera depended on the fungi and agar type,
whereas a constant higher prevalence (490%) was found for the total bacteria and total fungi. The four most prevalentfungal genera were Cladosporium, Penicillium, Aspergillus, and Alternaria in a descending order. The major parameters
associated with the airborne microbe measurements included agar type, vehicle type, and seasonal variation. When
compared to the malt extract agar (MEA), the dichloran glycerol 18 agar (DG-18) was found to produce better counts for
the target fungi. The summer in-vehicle bacterial concentrations were significantly higher for public buses than for the
passenger cars, whereas the reverse was true for summer in-vehicle total fungal concentrations. This pattern was also
consistent with summer outdoor results. In contrast, the winter in-vehicle and outdoor airborne microbe levels were similar
for cars and buses. Meanwhile, summer was generally found to have higher in-vehicle fungal concentrations than winter.
The current in-vehicle airborne microbe concentrations were found to be similar to residential indoor values from other
reports, such as bacterial values between 10 and 103CFUm�3 and total fungal aerosol concentrations ranging from 10 to
103CFUm�3. It was suggested that motor vehicles in which many individuals spend a certain percentage of their day or
week for travel are also a potential microenvironment for individual exposure to airborne microbes.
r 2005 Elsevier Ltd. All rights reserved.
Keywords: Airborne microbe; In-vehicle; Outdoor; Fungi; Season
1. Introduction
Motor vehicles are an important microenviron-ment for environmental exposure, as many indivi-duals spend a certain percentage of their day or weektraveling inside motor vehicles. Furthermore, certainindividuals, such as taxicab, public bus, and truckdrivers, spend a significantly higher amount of time
e front matter r 2005 Elsevier Ltd. All rights reserved
mosenv.2005.09.013
ing author. Fax: +82 53 950 6579.
ess: [email protected] (W.-K. Jo).
inside motor vehicles compared to other vehicleusers. Consequently, the environmental exposureinside motor vehicles has become a subject ofincreasing concern over recent years. Several studies(Chan et al., 1991; Lawryk and Weisel, 1996; Jo andPark, 1999; Sapkota and Buckley, 2003; Gomez-Perales et al., 2004) have already reported thatoccupants of traveling motor vehicles are exposed toelevated levels of several pollutants, including carbonmonoxide, volatile organic compounds, poly aro-matic hydrocarbons, ozone, nitrogen dioxide, and
.

ARTICLE IN PRESSJ.-H. Lee, W.-K. Jo / Atmospheric Environment 39 (2005) 7342–7350 7343
particulate matter with an aerodynamic diameterequal to or less than 2.5mm (PM2.5), when comparedto the surrounding ambient atmosphere.However, information on such in-vehicle expo-
sure to airborne microbes is currently limited inexisting literature (Kumar et al., 1990), even thoughairborne microbes have been associated withadverse health effects (Pastuszka et al., 2000; Renet al., 2001; Jones and Harrison, 2004). Severalstudies have reported that exposure to large con-centrations of airborne microbes is often associatedwith asthma and rhinitis (Beaumont, 1988), hyper-sensitivity pneumonitis (Siersted and Gravesen,1993), and sick-building syndrome (American Con-ference of Governmental Industrial Hygienists(ACGIH), 1989; Dales et al., 1991). Plus, exposureto airborne microbes has also been associated with anumber of other health effects, including infections(Ren et al., 1999). For individual fungi, the thresh-old concentrations for evoking allergic symptomshave been estimated as 100 Alternaria spores percubic meter air and 3000 Cladosporium spores percubic meter air (Graveson, 1979), while Aspergillus
spore concentrations above 50 colony-forming unitsper cubic meter of air (CFUm�3) have beenpotentially associated with a higher prevalence ofsick-building syndrome (Holmberg, 1987). None-theless, owing to their ubiquitous presence innature, airborne microbes are essentially inevitablein most enclosed environments (Pastuszka et al.,2000; Jones and Harrison, 2004). Motor vehicleinteriors are well-enclosed environments, and sincecarpets and textiles are an important indoor sourceof microbes (Gravesen et al., 1986; Jenny Su et al.,2002), airborne microbes could originate from thevehicle floor mats and fabric seats as a result of theair turbulence inside vehicles caused by the use of anair-conditioning system or heating fan and airpenetration from outdoor, resulting in elevated in-vehicle airborne microbe levels compared to ambi-ent levels. However, it is also possible that the airfilters in air-conditioning systems may remove acertain amount of the airborne microorganismsinside vehicles, resulting in lowered in-vehicle air-borne microbe levels (Parat et al., 1996), suggestingthe need for further evidence to clarify the situation.Accordingly, the present study was performed to
investigate the airborne microbe concentrationsinside motor vehicles during commuting. Thepresent study focused on viable bacteria and fungi,which exist in an airborne state as single cells oraggregates (Pastuszka et al., 2000). The designated
study area was Daegu, the third largest city inKorea with a population of 2.49 million and densityof 2812 people km�2. The characteristics associatedwith the airborne microbe measurements includedthe vehicle type and seasonal variation. Public busesand cars were surveyed, since they are the two mostcommon forms of transport in the study area, as inmany other developing and developed countries.The experiment was performed during the twoseasons with the most extreme temperatures, winterand summer. Along with the air inside the motorvehicles, the outdoor air was also surveyed forbacteria and fungi. The seasonal variation wasexpected to reflect the effect of the relative humidityand temperature, both important parameters formicrobial growth (Jones and Cookson, 1983; Renet al., 2001), on the in-vehicle levels.
2. Methods
2.1. Study protocol
The current study measured the airborne microbeconcentrations inside passenger cars and publicbuses during commuting in two seasons: summer,June–August 2003, and winter, November 2003 andJanuary 2004. Five passenger cars, including theircommuters, and five public-bus commuters wererecruited from among graduate students in theDepartment of Environmental Engineering atKyungpook National University (KNU). Five ofthe 12 car-commuting graduate students who wereinvited to participate in this study also grantedpermission to measure the airborne microbe levelsinside their cars. The commuters were only chosen iftheir traveling time for a one-way commute wasbetween 20 and 40min. The same commutersparticipated in both the summer and winter studies.The information related to the passenger cars isshown in Table 1. The makes of the passenger carswere four Hyundai and one Kia, with engine sizesranging from 1500 to 2000 cc, model years rangingfrom 1994 to 2000, and mileage ranging from 45,000to 90,625. The public buses surveyed were 40-seaterand used diesel fuel. All the vehicles were apparentlyfunctioning normally during the entire experimentalperiod. A total of 10 commutes were monitored foreach participant in each season: two daily commutesduring the morning and evening rush hours on fivesampling days. One 2-min in-vehicle sample wascollected about midway through each commutefrom the breathing zone of the passengers. Roadside

ARTICLE IN PRESS
Table 1
Information on passenger cars surveyed in current studya
No. Manufacturing company Engine size (l) Model/year Mileage (m) Fuel injected
1 Hyundai 1.5 Accent/1995 128,000 Gasoline
2 Kia 1.8 Carens/2000 72,000 LPG
3 Hyundai 1.5 Accent/1994 145,000 Gasoline
4 Hyundai 2.0 Sonata/1994 140,000 Gasoline
5 Hyundai 1.5 Elantra/1996 138,000 Gasoline
aLPG represents liquid petroleum gas.
J.-H. Lee, W.-K. Jo / Atmospheric Environment 39 (2005) 7342–73507344
air samples were frequently collected along the sameroute within 10min after the in-vehicle sampling.The commuting routes were real, not hypothetical.The vehicle windows and vents were closed in thepassenger cars, yet not controlled in the publicbuses, with the temperature level and blower speedset to the personal comfort level of the occupants.To prevent any potential interference due totobacco smoke, the study participants were askednot to smoke during the sampling. The in-vehiclesamples were collected during morning (7:00–9:00)and evening (5:30–7:30) commutes on standardworkdays (Monday through Friday).
2.2. Sampling and analytical methods
Viable airborne microbe sampling was conductedusing single-stage Anderson samplers with 4000.25mm-diameter holes (Aerotech 6 Microbialsampler, Phoenix, Arizona), drawing air at a flowrate of 28.3 lmin�1 (corresponding to a velocity of24m s�1 (Jones et al., 1985). Samplers were cali-brated prior to and following the collection of eachsample using a flow calibrator (DCL-H, Bios,Butler, NJ). The average of these two rates wasused as the sample flow rate for all the volumecalculations. No samples departed more than 10%from the initial flow rate during the study.Temperature and relative humidity were alsorecorded during the sampling.In all, 100 in-vehicle airborne microbe samples
(50 for each vehicle type) were collected for eachseason, while 53 (35 for the cars and 18 for thebuses) and 36 (18 from each vehicle type) ambientsamples were collected for the winter and summer,respectively. The in-vehicle air was sampled fromthe front passenger’s breathing zone and theambient air sampled at a height of 6 ft above theground. Each airborne microbe sample was nomin-ally collected for 2min, following Nevalainen et al.
(1992), onto nutrient media (specific to either fungior bacteria) in Petri dishes located in an impactor. Amalt extract agar (MEA 2%, Becton Dickinson,Sparks, MD) and synthesized dichloran glycerol 18agar (DG-18, synthesized) were both used tofacilitate fungal growth, with chloramphenicoladded to inhibit any bacterial growth. Meanwhile,a trypcase soy agar (TSA, Becton Dickinson,Sparks, MD) was used to facilitate bacterial growth,with cycloheximide added to inhibit any fungalgrowth. The MEA, DG-18, and TSA plates wereincubated at 25 1C for 3–5 days, 5–7 days, and 2–3days, respectively. A shorter incubation period wasemployed for the MEA plates than for the DG-18plates to avoid colony overgrowth on the MEAplates, which were also checked daily during theincubation period. The counts from the air sampleplates were corrected for multiple impactions usingthe positive hole conversion method, and reportedas CFUm�3. The genera of certain fungal cultureswere identified based on their morphological char-acteristics, using standard taxonomic keys (Atlasand Bartha, 1981).
2.3. Statistical analyses
The statistical analyses were performed using theSAS program (Version 8). The Shapiro–Wilkstatistical test was employed to evaluate the normal-ity of the data. An analysis of variance (ANOVA)was used to compare the temperature and humiditydata sets, a paired t-test used to compare thebioaerosol data-sets for the in-vehicle and outdoorair, and a nonparametric test (Wilcoxon rank-sumtest) employed to compare the bioaerosol data setsfor the two vehicle types (passenger cars and publicbuses) and two seasons (summer and winter). Thegeometric mean (GM) and geometric standarddeviation (GSD) were used to characterize the log-normally distributed data, when this was indicated

ARTICLE IN PRESSJ.-H. Lee, W.-K. Jo / Atmospheric Environment 39 (2005) 7342–7350 7345
by the Shapiro–Wilk statistical test. The criterionfor significance in the procedures was po0:05.
3. Results
3.1. Prevalence levels of airborne microbes by agar
type
The total viable bacteria and total viable fungiprevalence levels identified in the air from inside andoutside the passenger cars and public buses weredetermined for two seasons (winter and summer),although detailed data are not presented in thispaper. Regardless of the agar type, the total bacteria
Table 2
Prevalence (%) of viable fungi, identified using MEA and DG-18 agars,
buses according to seasona
Fungi Season MEA D
Car Bus C
In Out In Out In
Cladosporium Winter 67 69 82 94 71
Summer 94 78 76 94 94
Penicillium Winter 52 53 50 63 46
Summer 72 78 44 50 84
Aspergillus Winter 25 31 40 50 29
Summer 42 50 11 13 72
Alternaria Winter 4.2 3.1 10 19 5.
Summer 12 50 6.5 44 18
Fusarium Winter oDLSummer 10 28 6.5 19 32
Paecilomyces Winter ND N
Summer 12 17 6.5 ND 2.
Rhizopus Winter ND 6.3 ND ND
Summer 4.0 5.6 ND 6.3 2.
Aureobasidium Winter ND
Summer 2.0 5.6 ND 6.3 4.
Pestalotia Winter ND
Summer ND 5.6 2.2 13 N
Exosporiella Winter ND
Summer 4.0 5.6 ND 6.3 N
Arthrinium Winter ND ND 2.0 ND
Summer ND N
Botrytis Winter ND ND ND 6.3
Summer ND N
Phoma Winter ND
Summer ND ND 2.2 6.3
Mucor Winter ND N
Summer ND
Nigrospora Winter ND
Summer ND 5.6 ND ND
aNumber of samples for both agars: N ¼ 48 for car-inside-winter,
N ¼ 18 for car-outside-summer, N ¼ 50 for bus-inside-winter, N ¼ 16 f
bus-outside-summer; oDL, less than detection limit; DL, 18CFUm�3
and total fungi detected in most samples had aprevalence level range of 90–100%. The four mostprevalent fungal genera detected on the DG-18 andMEA agars were Cladosporium, Penicillium, Asper-
gillus, and Alternaria (Table 2). Cladosporium wasthe most prevalent fungi, with prevalence levelswithin a range 67–100%. Meanwhile, Penicillium,Aspergillus, and Alternaria were present, respec-tively within ranges 44–94%, 11–83%, and3.1–63%. For the individual fungi, a higherprevalence was usually found on the DG-18 agarcompared to the MEA agar. In particular, theprevalence of Aspergillus was substantially higheron the DG-18 agar for the air from outside the
in air from inside (in) and outside (out) passenger cars and public
G-18 DG-18/MEA
ar Bus Car Bus
Out In Out In Out In Out
84 90 94 1.1 1.2 1.1 1.0
100 76 100 1.0 1.3 1.0 1.1
66 70 88 0.9 1.2 1.4 1.4
94 54 56 1.2 1.2 1.2 1.1
50 70 81 1.2 1.6 1.8 1.6
83 48 63 1.7 1.7 4.4 4.8
1 3.1 6.0 25 1.2 1.0 0.6 1.3
61 24 63 1.5 1.2 3.7 1.4
oDL NA
33 11 13 3.2 1.2 1.7 0.7
D 3.1 ND 6.3 NA
0 22 2.2 13 0.2 1.3 0.3 NA
ND NA
0 17 ND 6.3 0.5 3.0 NA 1.0
ND NA
0 5.6 8.7 6.3 2.0 1.0 NA 1.0
ND NA
D ND ND 13 NA NA NA 1.0
ND NA
D ND ND 6.3 NA NA NA 1.0
ND NA
D ND 2.2 6.3 NA
ND NA
D ND 2.2 ND NA
ND NA
ND NA
D 3.1 ND ND NA
ND NA
ND NA
ND NA
N ¼ 32 for car-outside-winter, N ¼ 50 for car-inside-summer,
or bus-outside-winter, N ¼ 46 for bus-inside-summer, N ¼ 16 for
; NA, not available.

ARTICLE IN PRESS
Table 3
In-vehicle concentrations of airborne microbes (CFUm�3), temperature (temp., 1C), and relative humidity (RH, %) measured for
passenger cars and public buses according to seasona
Airborne microbe/temp./RH Season Car Bus S/Wb Car/busc
GM GSD Min Max GM GSD Min Max Car Bus
Total viable bacteria Winter 201 3.7 9 654 233 2.5 19 1791 1.0 1.2 0.9
Summer 195 2.7 38 475 275 3.0 19 1403 0.7
Total viable fungi (DG18) Winter 196 2.9 9 607 209 2.9 9 835 2.4 1.2 0.9
Summer 478 3.9 9 4427 248 3.0 9 1244 1.9
Penicillium (DG18) Winter 24 1.4 18 38 34 2.1 18 332 2.7 1.3 0.7
Summer 64 2.9 15 1099 44 1.7 19 102 1.5
Aspergillus (DG18) Winter 21 2.7 18 568 30 2.3 18 616 4.7 1.3 0.7
Summer 99 3.9 7.5 1601 40 1.8 19 114 2.5
Cladosporium (DG18) Winter 42 2.2 18 155 56 2.3 18 230 3.3 1.2 0.8
Summer 137 3.9 19 1787 68 3.0 19 509 2.0
Alternaria (DG18) Winter 19 1.0 19 19 30 1.6 18 39 1.8 0.8 0.6
Summer 35 1.7 19 68 25 1.5 19 39 1.4
Temp. Winter 16 3.1 0.3 21 17 6.1 10 28 1.6 1.6 0.9
Summer 26 3.5 21 30 27 2.3 21 32 1.0
RH Winter 39 10 27 67 37 6.7 12 66 1.7 1.6 1.1
Summer 66 17 31 93 58 15 26 92 1.1
aNumber of samples: N ¼ 48 for car-winter, N ¼ 50 for car-summer, N ¼ 50 for bus-winter, N ¼ 46 for bus-summer; For temperature
and RH, the arithmetic mean and standard deviation are presented instead of the geometric mean (GM) and geometric standard deviation
(GSD) values, respectively; min, minimum; max, maximum.bGM concentration ratios for summer air to winter air; boldface indicates that data sets for two seasons were significantly different at
po0:05 or close to 0.05.cGM concentration ratios for passenger car air to public bus air; boldface indicates that data sets for passenger cars and public buses
were significantly different at po0:05.
J.-H. Lee, W.-K. Jo / Atmospheric Environment 39 (2005) 7342–73507346
public buses during the summer at 63%, yet only13% on the MEA. Consequently, hereinafter, thecurrent paper focuses on the four major fungicollected on the DG-18 agar, along with the totalbacteria and total fungi.
3.2. In-vehicle and outdoor airborne microbe
concentrations
The in-vehicle airborne microbe concentrationsfor the two seasons (winter and summer) aresummarized in Table 3. The summer in-vehiclebacterial concentrations were significantly higherfor the public buses than those for the passengercars, whereas the reverse was true for the summerin-vehicle total viable fungal concentrations. Thispattern was consistent with the summer outdoorresults (Table 4). The GM value for the summeroutside-bus bacteria (344CFUm�3) was about 1.2times higher than that for the summer outside-car bacteria (277CFUm�3), while the GM valuefor the summer outside-bus total viable fungi(311CFUm�3) was about one-third of that forthe summer outside-car total viable fungi
(972CFUm�3). Moreover, summer outdoor bacter-ial and total fungal concentrations were bothsignificantly higher than the in-vehicle concentra-tions for both vehicle types (Table 5). Along withwinter outdoor airborne microbe levels, winter in-vehicle airborne microbe levels also were similar forcars and buses.Table 5 also presents the ratios of in-vehicle
concentrations to outdoor concentrations for in-dividual fungi. In contrast to the total fungi,summer in-vehicle concentrations of Penicillium
and Aspergillus were higher than outdoor concen-trations. Conversely, in-vehicle concentrations ofCladosporium and Alternaria were lower than out-door concentrations. Ren et al. (1999) also pre-viously reported higher Penicillium and Aspergillus
concentrations inside homes than outside homes,and the reverse for Cladosporium and Alternaria.
3.3. Airborne microbe concentrations during winter
and summer
Table 4 also allows a comparison of the airbornemicrobe concentrations in the outdoor air of the

ARTICLE IN PRESS
Table 4
Outdoor concentrations of airborne microbes (CFUm�3), temperature (temp., 1C), and relative humidity (RH, %) measured for
passenger cars and public buses according to seasona
Airborne microbe/ temp./RH Season Car Bus S/Wb
GM GSD Min Max GM GSD Min Max Car Bus
Total viable bacteria Winter 303 2.5 38 1585 296 2.1 75 1199 0.9 1.2
Summer 277 4.4 9 1515 344 3.8 9 3465
Total viable fungi (DG18) Winter 249 3.0 18 961 227 2.3 19 485 3.9 1.4
Summer 972 2.5 171 5880 311 2.9 152 9309
Penicillium (DG18) Winter 34 1.9 18 136 43 2.0 19 136 1.2 0.9
Summer 41 2.0 19 135 38 4.0 19 1213
Aspergillus (DG18) Winter 30 1.9 18 155 37 2.0 19 155 1.3 1.1
Summer 40 1.7 20 1000 42 7.3 18 5867
Cladosporium (DG18) Winter 71 2.2 18 328 88 2.3 19 328 4.7 2.7
Summer 336 2.9 76 3183 236 3.1 19 2097
Alternaria (DG18) Winter 39 1 39 39 23 1.4 19 38 1.1 1.4
Summer 43 2.3 19 121 32 2.2 18 167
Temp. Winter 4.3 4.6 �3.7 18 7.1 4.4 0.3 15 6.8 4.2
Summer 29 5.5 21 42 30 3.6 24 35
RH Winter 41 16 23 84 39 8.3 20 54 1.7 2.1
Summer 70 17 28 99 60 15 29 78
aNumber of samples: N ¼ 32 for car-winter, N ¼ 18 for car-summer, N ¼ 16 for bus-winter, N ¼ 16 for bus-summer; for temperature
and RH, arithmetic mean and standard deviation are presented instead of geometric mean (GM) and geometric standard deviation (GSD)
values, respectively; min, minimum; max, maximum.bGM concentration ratios for summer air to winter air; boldface indicates that data sets for two seasons were significantly different at
po0:05 or close to 0.05.
Table 5
GM concentration ratios for in-vehicle airborne microbe to
outdoor airborne microbe according to vehicle type and seasona
Airborne microbe Season Car Bus
Total viable bacteria Winter 0.7 0.8
Summer 0.7 0.8
Total viable fungi (DG-18) Winter 0.8 0.9
Summer 0.5 0.8
Penicillium (DG-18) Winter 0.7 0.8
Summer 1.6 1.2
Aspergillus (DG-18) Winter 0.7 0.8
Summer 2.5 1.0
Cladosporium (DG-18) Winter 0.6 0.6
Summer 0.4 0.3
Alternaria (DG-18) Winter 0.5 1.3
Summer 0.8 0.8
aNumber of samples: N ¼ 48 for car-winter, N ¼ 50 for car-
summer, N ¼ 50 for bus-winter, N ¼ 46 for bus-summer.
J.-H. Lee, W.-K. Jo / Atmospheric Environment 39 (2005) 7342–7350 7347
surveyed vehicles for the two seasons. The outdoortotal viable fungal concentrations were significantlydifferent between summer and winter, whereasoutdoor bacterial concentrations were similar. Thetotal fungal concentration ratio for summer to
winter increased to 3.9 for the air outside thepassenger cars, while it increased to 1.4 for the airoutside public buses. Similar to total fungalconcentrations, outdoor concentrations of indivi-dual fungi were usually higher for the summer thanthose for the winter. As with outdoor airbornemicrobe concentrations, in-vehicle total fungal andindividual fungal concentrations were significantlyhigher for the summer than those for the winter,whereas in-vehicle bacterial concentrations re-mained similar (Table 3).
4. Discussion
The prevalence level of individual fungi variedwith fungi and agar type, whereas a constant higherprevalence (490%) was found for total viablebacteria and total viable fungi. The four mostprevalent fungal genera, which were consistent withprevious studies (Gravesen et al., 1986; Ren et al.,2001; Hong et al., 2003), were Cladosporium,Penicillium, Aspergillus, and Alternaria in a des-cending order. When compared with the MEA agar,the DG-18 agar was found to produce better counts

ARTICLE IN PRESSJ.-H. Lee, W.-K. Jo / Atmospheric Environment 39 (2005) 7342–73507348
for the target fungi. This finding is also supportedby Ren et al. (2001), who reported a significantlyhigher CFUm�3 on DG-18 compared to MEA forAlternaria, Aspergillus, and Cladosporium, yet notfor Penicillium. However, even though Ren et al.(2001) also reported significantly higher totalculturable fungi concentrations on MEA thanDG-18 with means of 1034 and 846CFUm�3
(po0:0005), respectively, they still suggested thatthe sole use of DG-18 to collect fungal samples wasadequate to represent the residential levels of thosefungi potentially related to health concerns, andusing one medium for sampling is more economical,practical, and saves time.It was found that the differences in the in-vehicle
airborne microbe concentrations between the carsand the buses were most likely due to the differentlycontaminated outdoor air that penetrated inside thevehicles. However, this finding invalidates theprevalent assumption that in-vehicle airborne mi-crobe levels are higher compared to ambient levels,supposedly due to the resuspension of microorgan-isms from vehicle floor mats and fabric seats as aresult of the air turbulence inside vehicles caused bythe use of an air-conditioning system or heating fanand air penetration from outside during traveling.Conversely, the present study seemed to indicatethat the assumed in-vehicle sources were not strongenough to outweigh the outdoor concentrations thatpenetrated inside the vehicle as regards the in-vehicle airborne microbe levels. Even so, thesummer in-vehicle samples were all collected whenusing an air-conditioning system with an air filter,and the vehicle windows and vents closed. Thus,another possible explanation for the lower summerin-vehicle levels compared to the ambient levels wasthat the air filters in the air-conditioning systemsremoved a certain amount of the airborne micro-organisms from both the outdoor air that pene-trated inside the vehicles and the recirculated airinside the vehicles, thereby lowering the in-vehicleairborne microbe levels. This assertion is supportedby Kumar et al. (1990), who reported significantlylower mold concentrations inside passenger carswhen using a filter compared to the concentrationswithout a filter.Both the in-vehicle and outdoor fungal concen-
trations were usually higher for the summer thanthose for the winter. This seasonal fungal trend isconsistent with Pastuszka et al.’s (2000) studyconducted in Upper Silesia, Poland, and Ren et al.’s(1999) study in the Greater New Haven, Connecti-
cut area. A possible cause for this result is thedifference in temperature and relative humiditybetween the two seasons, which is supported byRen et al. (2001), who reported that a higherenvironmental temperature and relative humiditytypically favor microbial growth. In fact, tempera-ture and relative humidity measured in the presentstudy along with the microbial measurementsrevealed that summer values for both outdoor(Table 4) and indoor air (Table 3) were signifi-cantly higher than those for the winter. Mean-while, for both the indoor and the outdoor air,Cladosporium was the fungal genus with the highestmeasurements.The airborne microbe concentrations measured
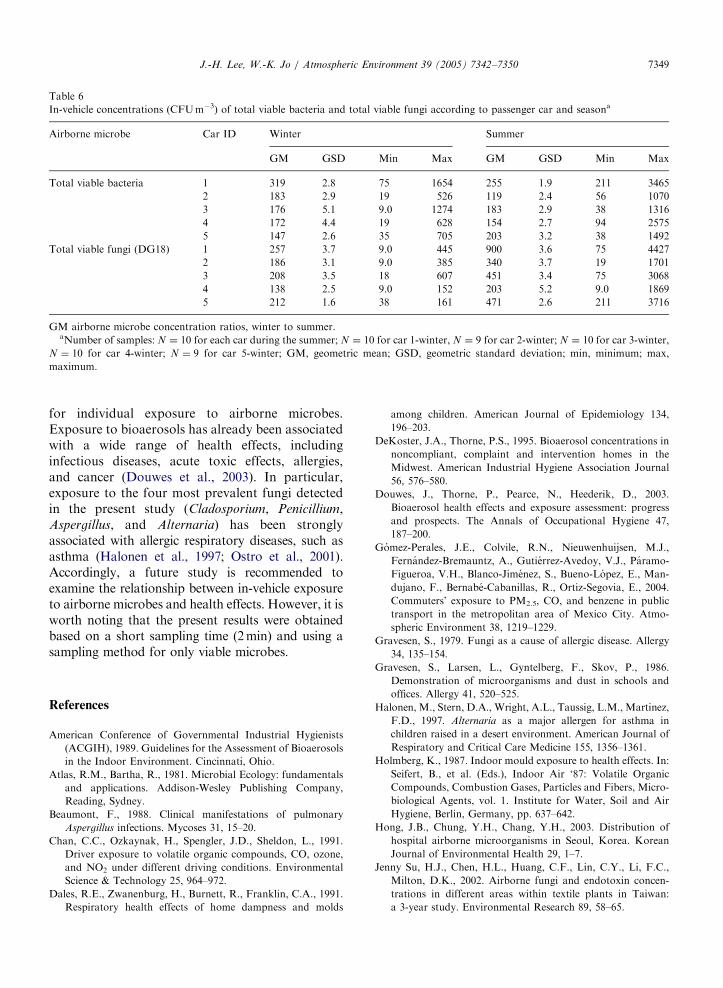
for the five passenger cars during the two seasonsare summarized in Table 6. Regardless of theseason, the highest GM and maximum airbornemicrobe concentrations were measured from car 1.According to interviews, the owner of car 1 statedthat the car interior had never been cleaned since thecar was purchased as a used car 2 years previously,whereas the owners of the other cars stated that theyclean the interior of their cars on at weekly ormonthly basis. Certain trash, including breadcrumbs and empty soda cans and milk cartons wereobserved on the floor mat of car 1 during mostmeasurement periods. The technician responsiblefor sampling car 1 also reported a bad odor insidethe car on most sampling days. Consequently, themicrobial degradation of the trash inside the car waslikely an important cause for the higher GM andmaximum concentrations measured in car 1.The current in-vehicle airborne microbe concen-
trations were found to be similar to residentialindoor values from other reports, such as bacterialvalues between 10 and 103CFUm�3 (DeKoster andThorne, 1995; Pastuszka et al., 2000) and totalfungal aerosol concentrations in homes rangingfrom 10 to 103CFUm�3 (Kuo and Li, 1994;DeKoster and Thorne, 1995; Pastuszka et al.,2000). However, the total fungal counts were notas high as the maximum residential levels reportedin other literature, for example, Pastuszka et al.(2000) reported maxima of almost 17,000CFUm�3
in Upper Silesia, Poland. Nonetheless, the currentmaximum in-vehicle microbial concentrations(Table 3) usually exceeded the Korean indoorbioaerosol guideline (800CFUm�3). As such, mo-tor vehicles in which many individuals spend acertain percentage of their day or week for travelingwould appear to be a potential microenvironment
ARTICLE IN PRESS
Table 6
In-vehicle concentrations (CFUm�3) of total viable bacteria and total viable fungi according to passenger car and seasona
Airborne microbe Car ID Winter Summer
GM GSD Min Max GM GSD Min Max
Total viable bacteria 1 319 2.8 75 1654 255 1.9 211 3465
2 183 2.9 19 526 119 2.4 56 1070
3 176 5.1 9.0 1274 183 2.9 38 1316
4 172 4.4 19 628 154 2.7 94 2575
5 147 2.6 35 705 203 3.2 38 1492
Total viable fungi (DG18) 1 257 3.7 9.0 445 900 3.6 75 4427
2 186 3.1 9.0 385 340 3.7 19 1701
3 208 3.5 18 607 451 3.4 75 3068
4 138 2.5 9.0 152 203 5.2 9.0 1869
5 212 1.6 38 161 471 2.6 211 3716
GM airborne microbe concentration ratios, winter to summer.aNumber of samples: N ¼ 10 for each car during the summer; N ¼ 10 for car 1-winter, N ¼ 9 for car 2-winter; N ¼ 10 for car 3-winter,
N ¼ 10 for car 4-winter; N ¼ 9 for car 5-winter; GM, geometric mean; GSD, geometric standard deviation; min, minimum; max,
maximum.
J.-H. Lee, W.-K. Jo / Atmospheric Environment 39 (2005) 7342–7350 7349
for individual exposure to airborne microbes.Exposure to bioaerosols has already been associatedwith a wide range of health effects, includinginfectious diseases, acute toxic effects, allergies,and cancer (Douwes et al., 2003). In particular,exposure to the four most prevalent fungi detectedin the present study (Cladosporium, Penicillium,Aspergillus, and Alternaria) has been stronglyassociated with allergic respiratory diseases, such asasthma (Halonen et al., 1997; Ostro et al., 2001).Accordingly, a future study is recommended toexamine the relationship between in-vehicle exposureto airborne microbes and health effects. However, it isworth noting that the present results were obtainedbased on a short sampling time (2min) and using asampling method for only viable microbes.
References
American Conference of Governmental Industrial Hygienists
(ACGIH), 1989. Guidelines for the Assessment of Bioaerosols
in the Indoor Environment. Cincinnati, Ohio.
Atlas, R.M., Bartha, R., 1981. Microbial Ecology: fundamentals
and applications. Addison-Wesley Publishing Company,
Reading, Sydney.
Beaumont, F., 1988. Clinical manifestations of pulmonary
Aspergillus infections. Mycoses 31, 15–20.
Chan, C.C., Ozkaynak, H., Spengler, J.D., Sheldon, L., 1991.
Driver exposure to volatile organic compounds, CO, ozone,
and NO2 under different driving conditions. Environmental
Science & Technology 25, 964–972.
Dales, R.E., Zwanenburg, H., Burnett, R., Franklin, C.A., 1991.
Respiratory health effects of home dampness and molds
among children. American Journal of Epidemiology 134,
196–203.
DeKoster, J.A., Thorne, P.S., 1995. Bioaerosol concentrations in
noncompliant, complaint and intervention homes in the
Midwest. American Industrial Hygiene Association Journal
56, 576–580.
Douwes, J., Thorne, P., Pearce, N., Heederik, D., 2003.
Bioaerosol health effects and exposure assessment: progress
and prospects. The Annals of Occupational Hygiene 47,
187–200.
Gomez-Perales, J.E., Colvile, R.N., Nieuwenhuijsen, M.J.,
Fernandez-Bremauntz, A., Gutierrez-Avedoy, V.J., Paramo-
Figueroa, V.H., Blanco-Jimenez, S., Bueno-Lopez, E., Man-
dujano, F., Bernabe-Cabanillas, R., Ortiz-Segovia, E., 2004.
Commuters’ exposure to PM2.5, CO, and benzene in public
transport in the metropolitan area of Mexico City. Atmo-
spheric Environment 38, 1219–1229.
Gravesen, S., 1979. Fungi as a cause of allergic disease. Allergy
34, 135–154.
Gravesen, S., Larsen, L., Gyntelberg, F., Skov, P., 1986.
Demonstration of microorganisms and dust in schools and
offices. Allergy 41, 520–525.
Halonen, M., Stern, D.A., Wright, A.L., Taussig, L.M., Martinez,
F.D., 1997. Alternaria as a major allergen for asthma in
children raised in a desert environment. American Journal of
Respiratory and Critical Care Medicine 155, 1356–1361.
Holmberg, K., 1987. Indoor mould exposure to health effects. In:
Seifert, B., et al. (Eds.), Indoor Air ‘87: Volatile Organic
Compounds, Combustion Gases, Particles and Fibers, Micro-
biological Agents, vol. 1. Institute for Water, Soil and Air
Hygiene, Berlin, Germany, pp. 637–642.
Hong, J.B., Chung, Y.H., Chang, Y.H., 2003. Distribution of
hospital airborne microorganisms in Seoul, Korea. Korean
Journal of Environmental Health 29, 1–7.
Jenny Su, H.J., Chen, H.L., Huang, C.F., Lin, C.Y., Li, F.C.,
Milton, D.K., 2002. Airborne fungi and endotoxin concen-
trations in different areas within textile plants in Taiwan:
a 3-year study. Environmental Research 89, 58–65.

ARTICLE IN PRESSJ.-H. Lee, W.-K. Jo / Atmospheric Environment 39 (2005) 7342–73507350
Jo, W.K., Park, K.H., 1999. Commuter exposure to volatile
organic compounds under different driving conditions.
Atmospheric Environment 33, 409–417.
Jones, B.L., Cookson, I.T., 1983. Natural atmospheric microbial
conditions in a typical suburban area. Applied and Environ-
mental Microbiology 45, 919–934.
Jones, A.M., Harrison, R.M., 2004. The effects of meteorological
factors on atmospheric airborne bioaerosol concentrations.
Science of the Total Environment 326, 151–180.
Jones, W., Morring, K., Morey, P., Sorenson, W., 1985.
Evaluation of the Anderson viable impactor for single stage
sampling. American Industrial Hygiene Association Journal
46, 294–298.
Kumar, P., Lopez, M., Fan, W., Cambre, K., Elston, R.C., 1990.
Mold contamination of automobile air conditioner systems.
Annals of Allergy 64, 174–177.
Kuo, Y.M., Li, C.S., 1994. Seasonal fungus prevalence inside and
outside of domestic environments in the subtropical climate.
Atmospheric Environment 28, 3125–3130.
Lawryk, N.J., Weisel, C.P., 1996. Concentrations of volatile
organic compounds in the passenger compartments of
automobiles. Environmental Science & Technology 30,
810–816.
Nevalainen, A., Pastuszka, J., Liebhaber, F., Willeke, K., 1992.
Performance of bioaerosol samplers: collection characteristics
and sampler design considerations. Atmospheric Environ-
ment 26A, 531–540.
Ostro, B., Lipsett, M., Mann, J., Braxton-Owens, H., White, M.,
2001. Air pollution and exacerbation of asthma in African-
American children in Los Angeles. Epidemiology 12, 200–208.
Parat, S., Fricker-Hidalgo, H., Perdrix, A., Bemer, D., Pelissier,
N., Grillot, R., 1996. Airborne fungal contamination in air-
conditioning systems: effect of filtering and humidifying
devices. American Industrial Hygiene Association Journal
57, 996–1001.
Pastuszka, J.S., kyaw Tha Paw, U., Lis, D.O., Wlaz"o, A., Ulfig,K., 2000. Bacterial and fungal aerosol in indoor environment
in Upper Silesia, Poland. Atmospheric Environment 34,
3833–3842.
Ren, P., Jankun, T.M., Leaderer, B.P., 1999. Comparisons of
seasonal fungal prevalence in indoor and outdoor air and in
house dusts of dwellings in one Northeast American county.
Journal of Exposure Analysis and Environmental Epidemiol-
ogy 9, 560–568.
Ren, P., Jankun, T.M., Belanger, K., Bracken, M.B., Leaderer,
B.P., 2001. The relation between fungal propagules in indoor
air and home characteristics. Allergy 56, 419–424.
Sapkota, A., Buckley, T.J., 2003. The mobile source effect on
curbside 1,3-butadiene, benzene, and particle-bound polycyclic
aromatic hydrocarbons associated at a tollbooth. Journal of
Air and Waste Management Association 53, 740–748.
Siersted, H.C., Gravesen, S., 1993. Extrinsic allergic alveolitis
after exposure to the yeast Rhodotorula rubra. Allergy 48,
298–299.