Embed Size (px)
Citation preview
Exposure to Radioactive Fallout to Residents of Southern Utah
An Overview by
Bruce W. Churchand
Antone L. Brooks
BASIC PREMISE
“THE POISON IS IN THE SIZE OF THE DOSE”
Radiation and Radioactivity
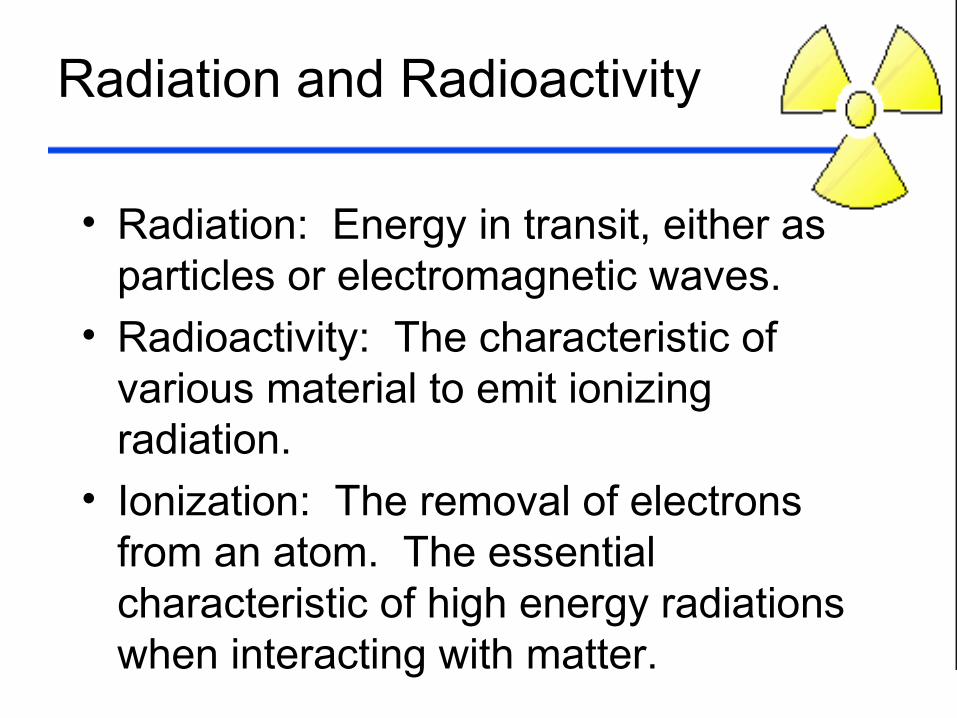
• Radiation: Energy in transit, either as particles or electromagnetic waves.
• Radioactivity: The characteristic of various material to emit ionizing radiation.
• Ionization: The removal of electrons from an atom. The essential characteristic of high energy radiations when interacting with matter.
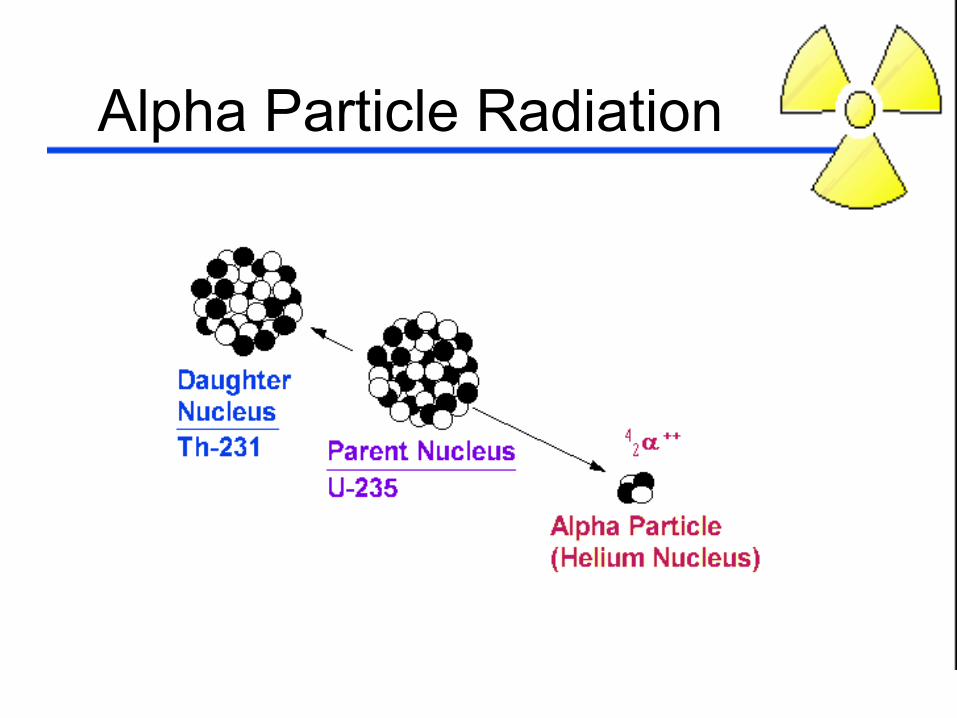
Alpha Particle Radiation
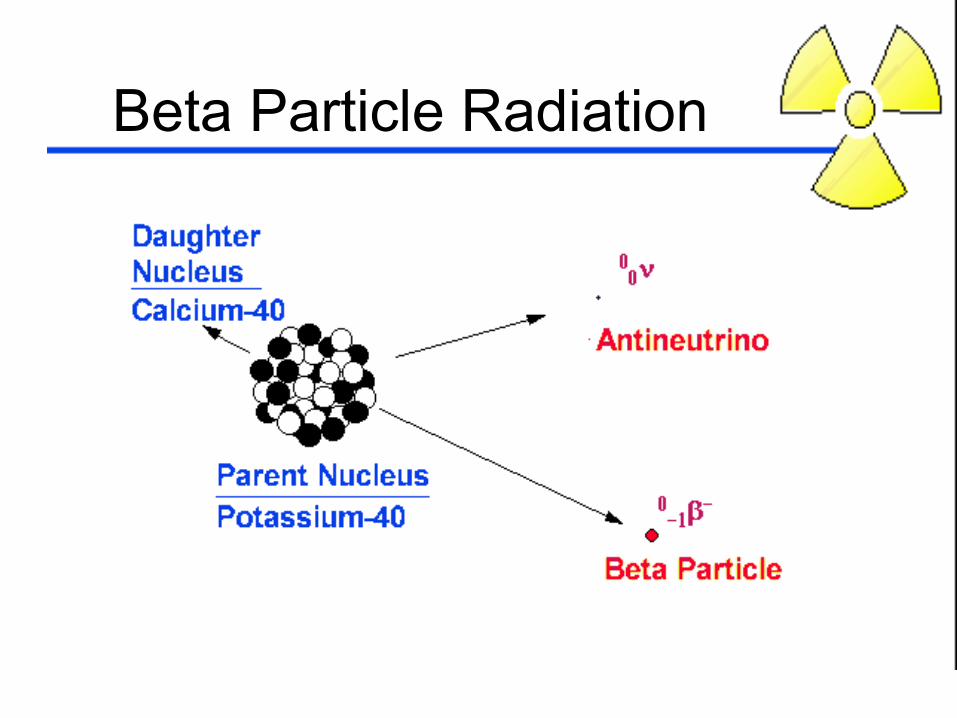
Beta Particle Radiation
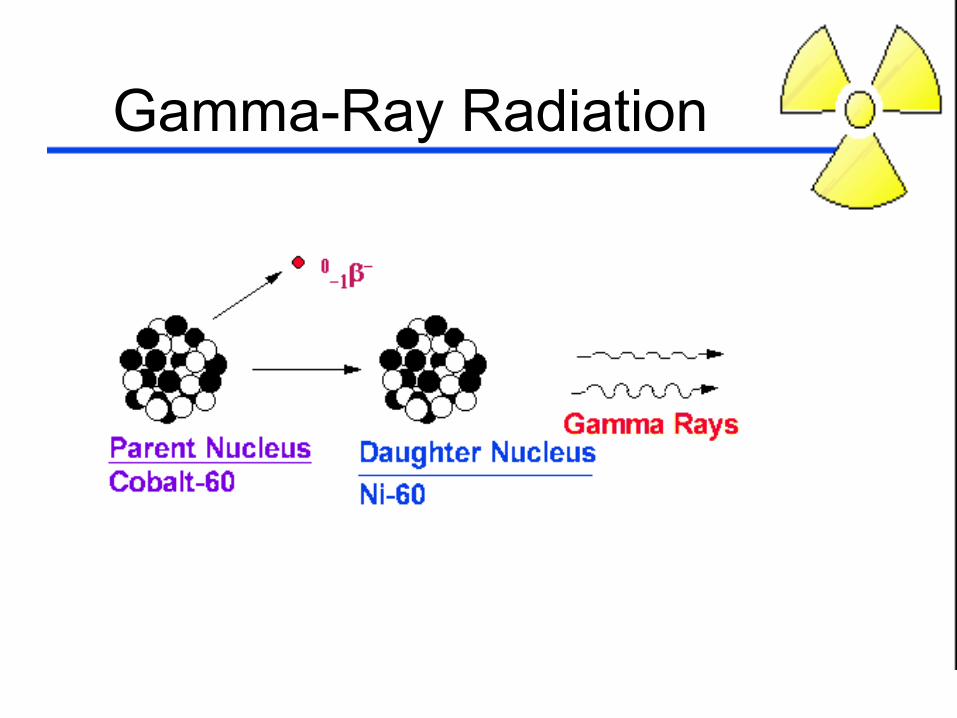
Gamma-Ray Radiation
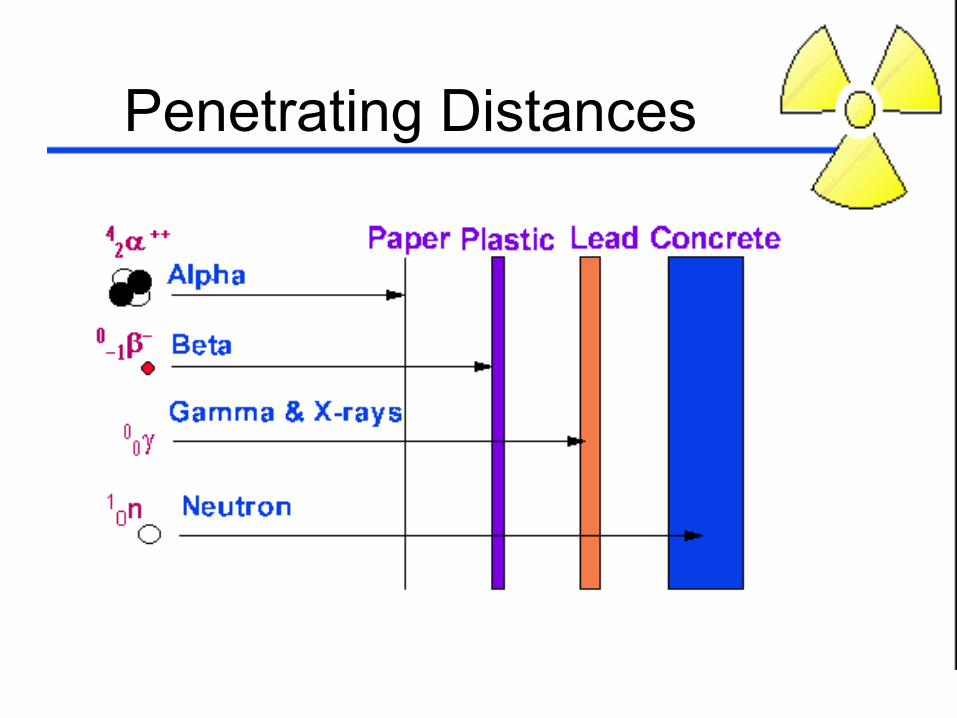
Penetrating Distances
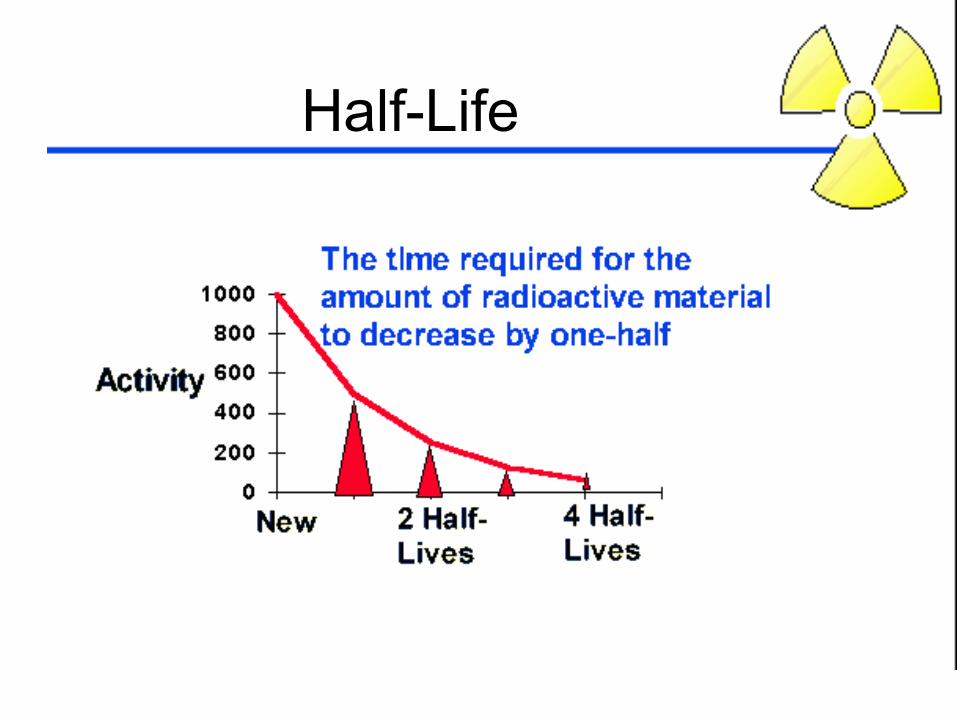
Half-Life
Measures of Radioactivity
Activity: The quantity of radioactive material at a given time:
– Curie(Ci): 3.7 1010 disintegrations per second(dps)
or– Becquerel (Bq): 1 dps
Measures of Exposure & Dose
• Exposure – Roentgen (R), 0.001 R = 1 mR• Dose equivalency:
– rem (old), 0.001 rem = 1 mrem– Sv (new); 1 Sv = 100 rem, 10 mSv = 1 rem
• Absorbed Dose:– rad (old), 0.001 rad = 1 mrad– Gray (new), 1 Gy = 100 rad, 10 mGy = 1 rad
Natural Background
• the average annual radiation doses received per capita in the United States from naturally occurring and manmade sources of radioactivity. The total yearly dose is approximately 0.0036 Sv (ie, 3.6 mSv).
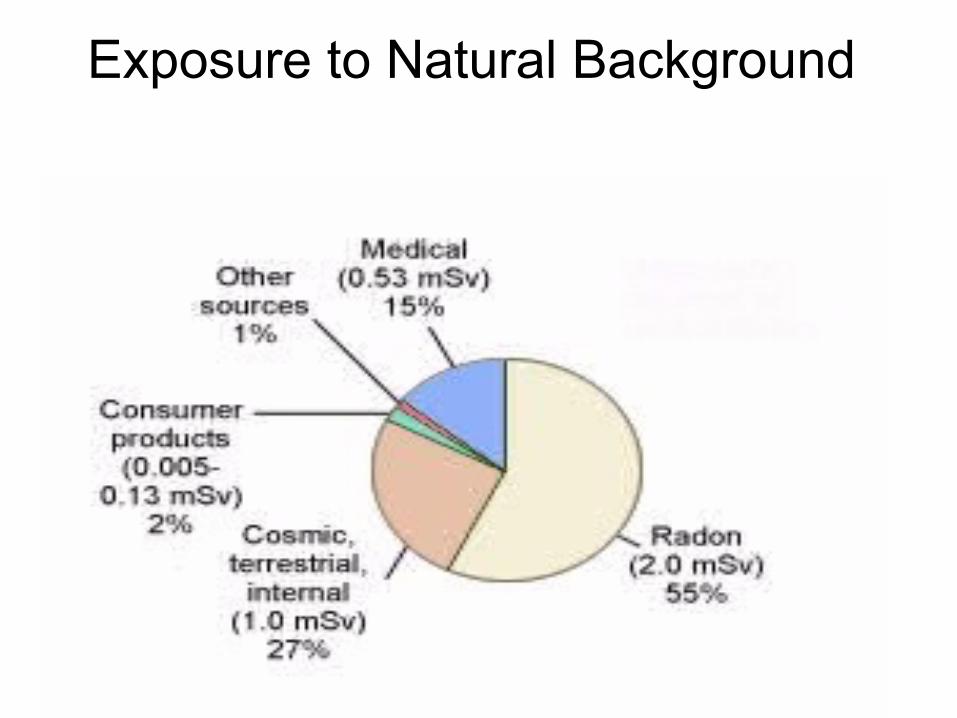
Exposure to Natural Background
Areas of High Background Radiation
Background doses in some areas of the world are exceptionally high when compared to other regions. Specifically areas in Iran, India, Brazil and China are high because of geologic formations, deposits and/or geothermal activity. Monazite sands, high in natural thorium and radium are the large contributors to the values seen in the following table taken from UNSCEAR 2000.
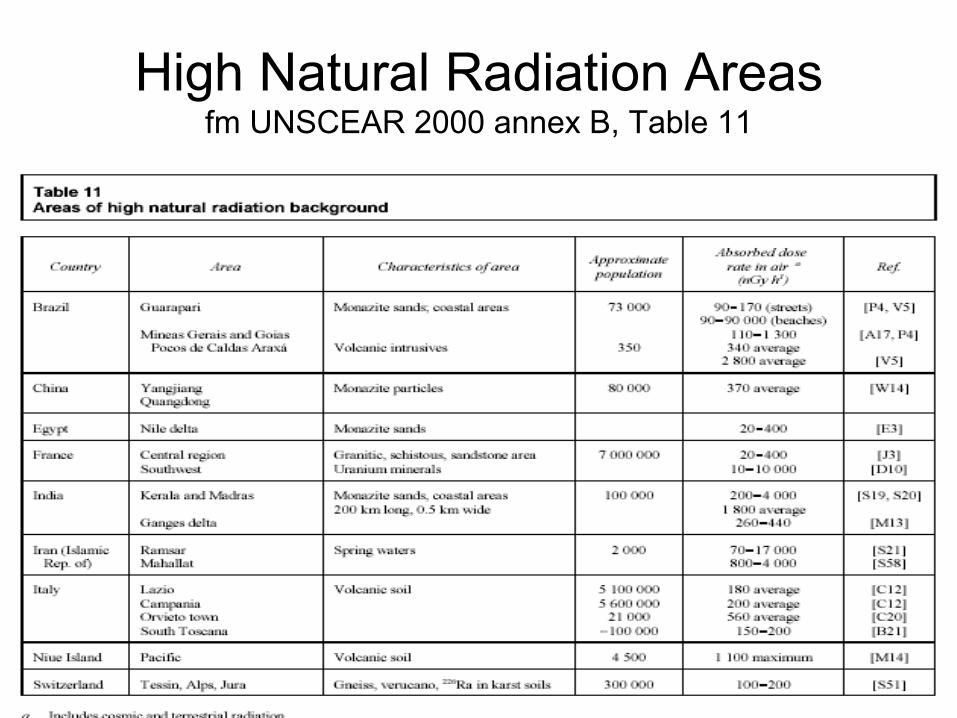
High Natural Radiation Areasfm UNSCEAR 2000 annex B, Table 11
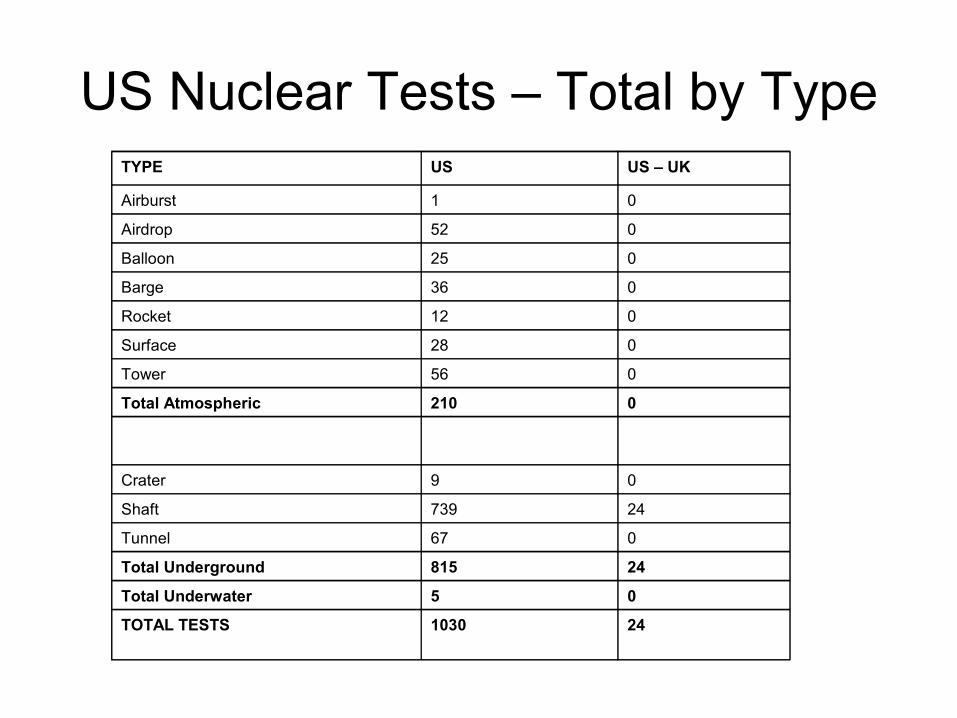
US Nuclear Tests – Total by TypeTYPE US US – UK
Airburst 1 0
Airdrop 52 0
Balloon 25 0
Barge 36 0
Rocket 12 0
Surface 28 0
Tower 56 0
Total Atmospheric 210 0
Crater 9 0
Shaft 739 24
Tunnel 67 0
Total Underground 815 24
Total Underwater 5 0
TOTAL TESTS 1030 24
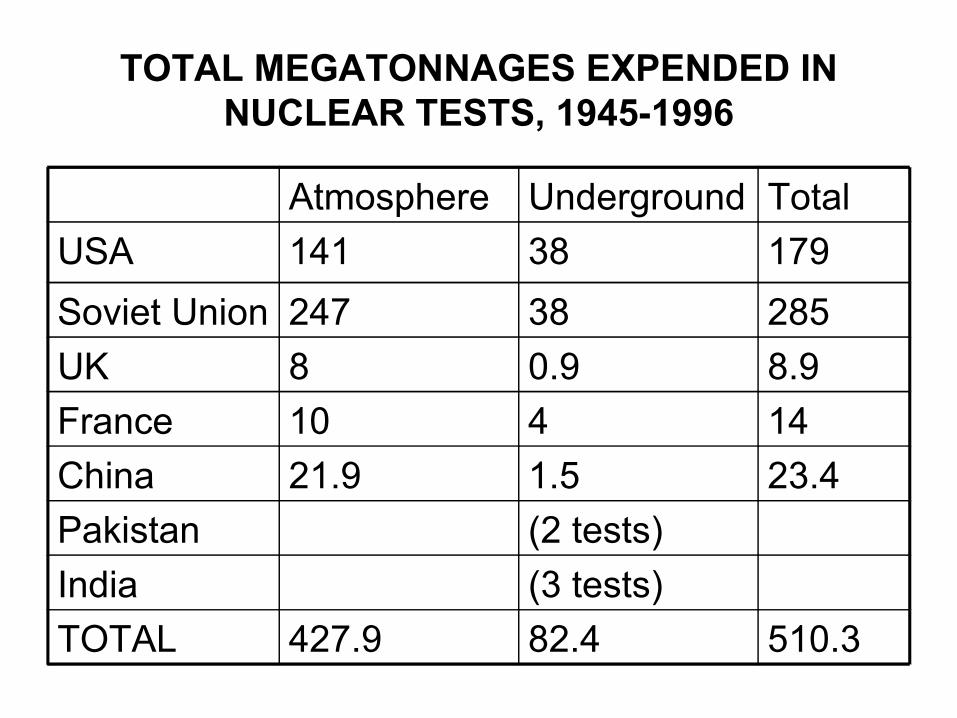
TOTAL MEGATONNAGES EXPENDED IN NUCLEAR TESTS, 1945-1996
Atmosphere Underground TotalUSA 141 38 179Soviet Union 247 38 285UK 8 0.9 8.9France 10 4 14China 21.9 1.5 23.4Pakistan (2 tests)India (3 tests)TOTAL 427.9 82.4 510.3
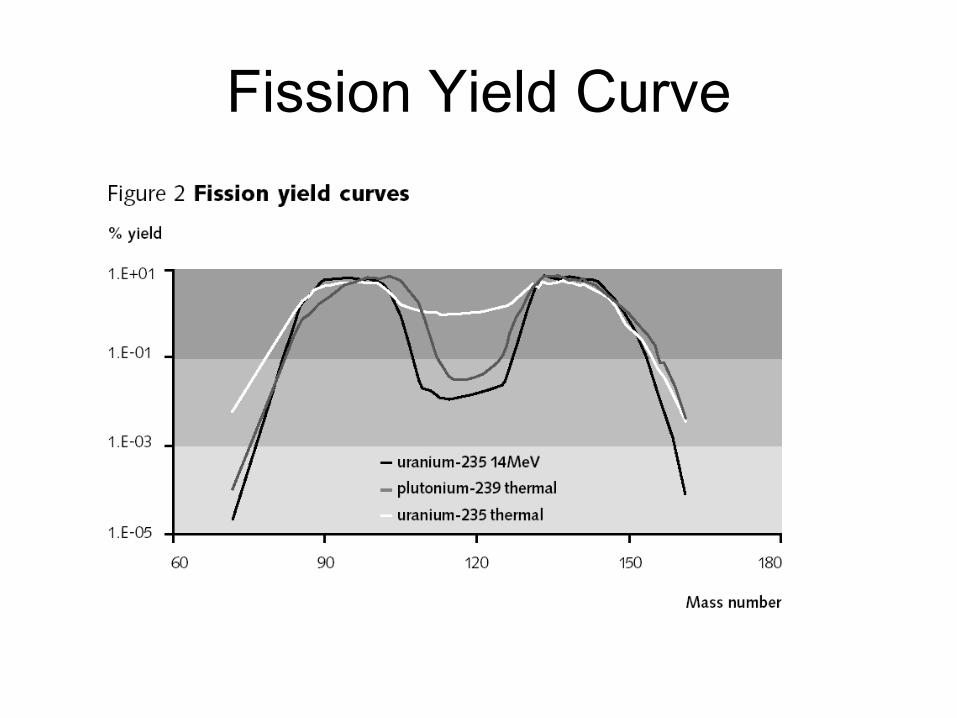
Fission Yield Curve
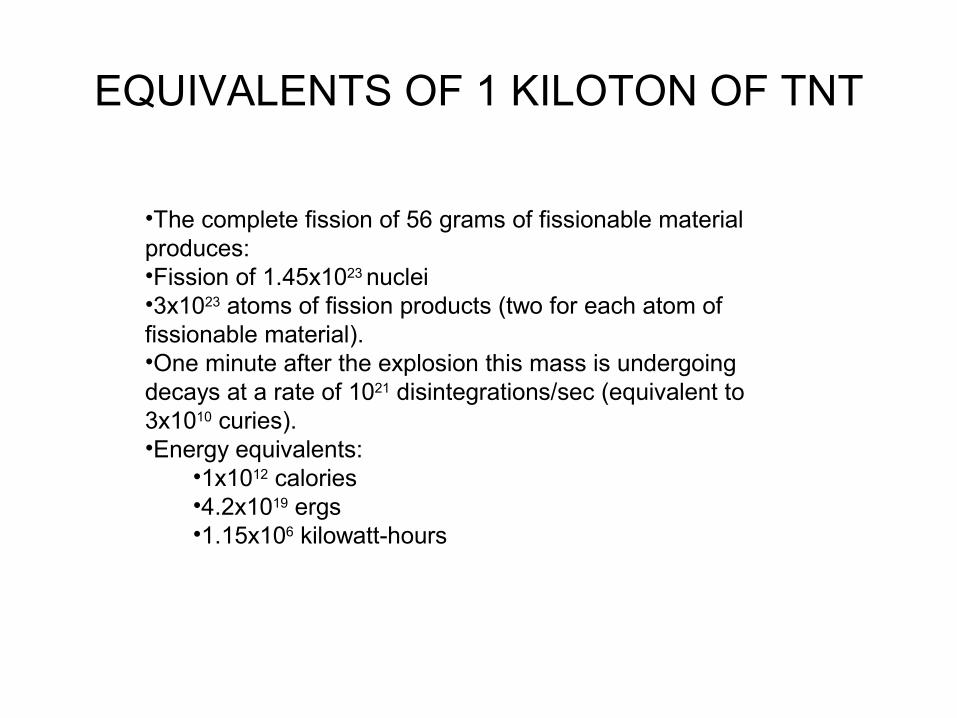
EQUIVALENTS OF 1 KILOTON OF TNT
•The complete fission of 56 grams of fissionable material produces:•Fission of 1.45x10²³ nuclei•3x10²³ atoms of fission products (two for each atom of fissionable material). •One minute after the explosion this mass is undergoing decays at a rate of 1021 disintegrations/sec (equivalent to 3x10¹⁰ curies). •Energy equivalents:
•1x10¹² calories•4.2x10¹⁹ ergs•1.15x10⁶ kilowatt-hours
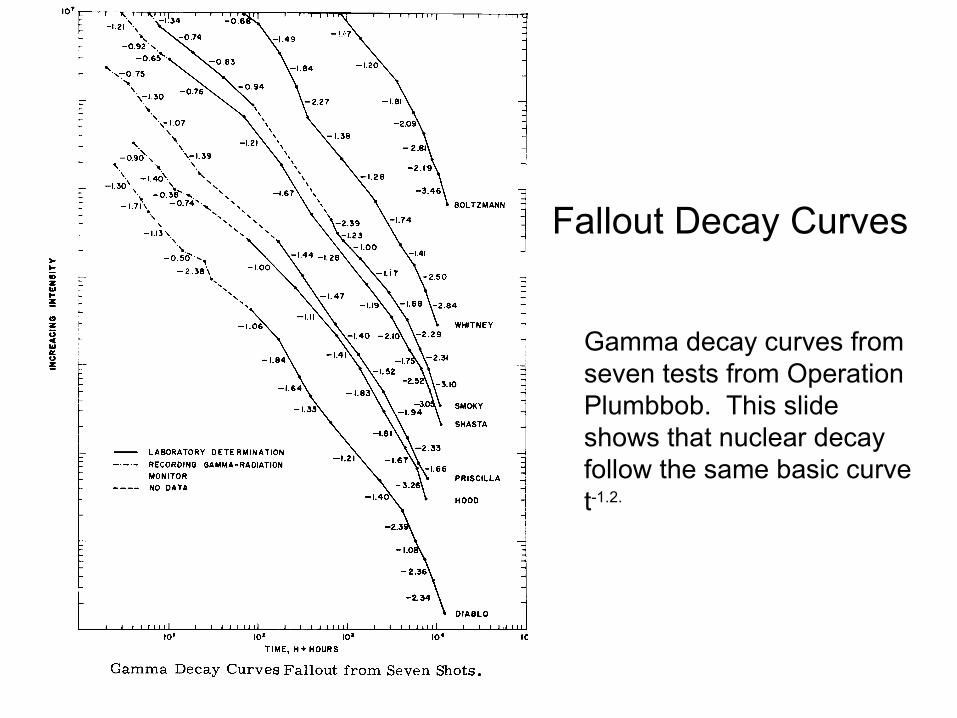
Gamma decay curves from seven tests from Operation Plumbbob. This slide shows that nuclear decay follow the same basic curve t-1.2.
Fallout Decay Curves
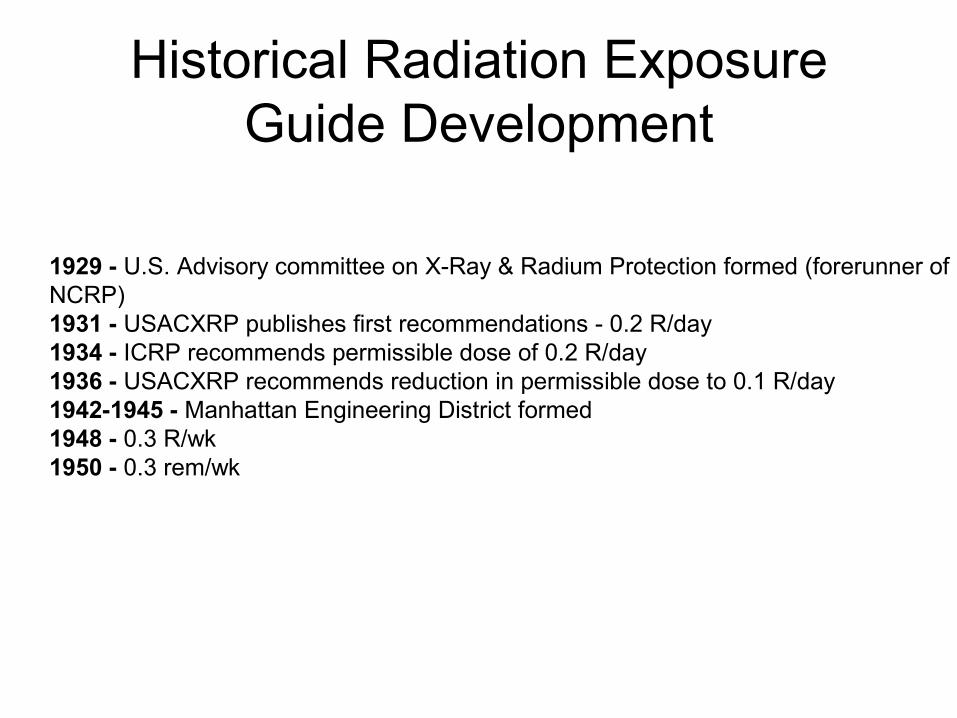
Historical Radiation Exposure Guide Development
1929 - U.S. Advisory committee on X-Ray & Radium Protection formed (forerunner of NCRP) 1931 - USACXRP publishes first recommendations - 0.2 R/day 1934 - ICRP recommends permissible dose of 0.2 R/day 1936 - USACXRP recommends reduction in permissible dose to 0.1 R/day 1942-1945 - Manhattan Engineering District formed 1948 - 0.3 R/wk 1950 - 0.3 rem/wk
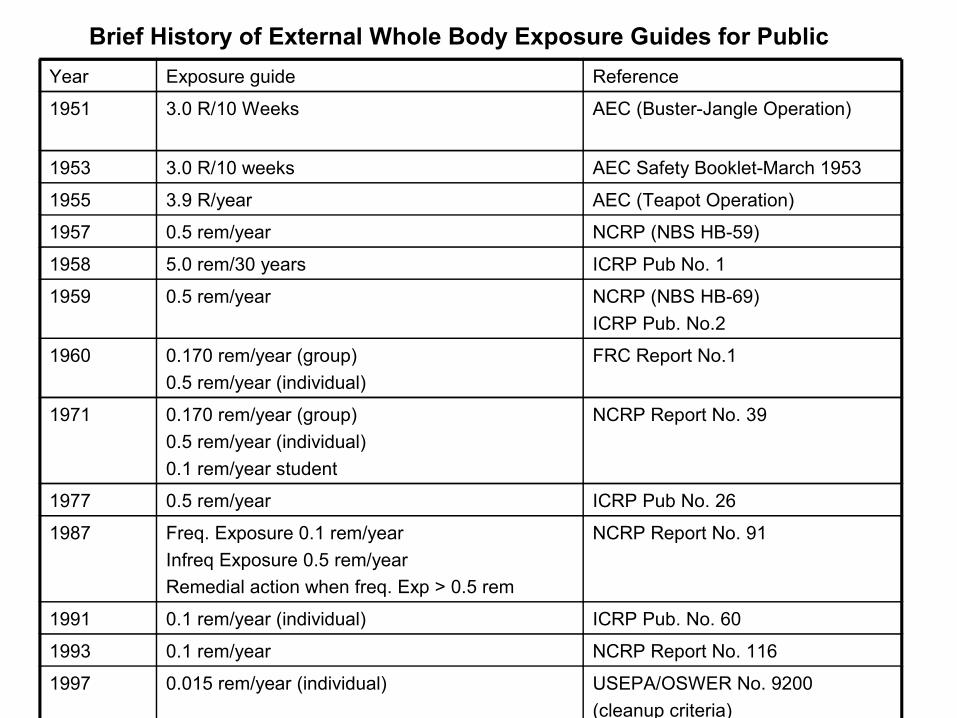
Year Exposure guide Reference
1951 3.0 R/10 Weeks AEC (Buster-Jangle Operation)
1953 3.0 R/10 weeks AEC Safety Booklet-March 1953
1955 3.9 R/year AEC (Teapot Operation)
1957 0.5 rem/year NCRP (NBS HB-59)
1958 5.0 rem/30 years ICRP Pub No. 1
1959 0.5 rem/year NCRP (NBS HB-69)ICRP Pub. No.2
1960 0.170 rem/year (group)0.5 rem/year (individual)
FRC Report No.1
1971 0.170 rem/year (group)0.5 rem/year (individual)0.1 rem/year student
NCRP Report No. 39
1977 0.5 rem/year ICRP Pub No. 26
1987 Freq. Exposure 0.1 rem/yearInfreq Exposure 0.5 rem/yearRemedial action when freq. Exp > 0.5 rem
NCRP Report No. 91
1991 0.1 rem/year (individual) ICRP Pub. No. 60
1993 0.1 rem/year NCRP Report No. 116
1997 0.015 rem/year (individual) USEPA/OSWER No. 9200 (cleanup criteria)
Brief History of External Whole Body Exposure Guides for Public
The primary contributors to Fallout in So. Utah
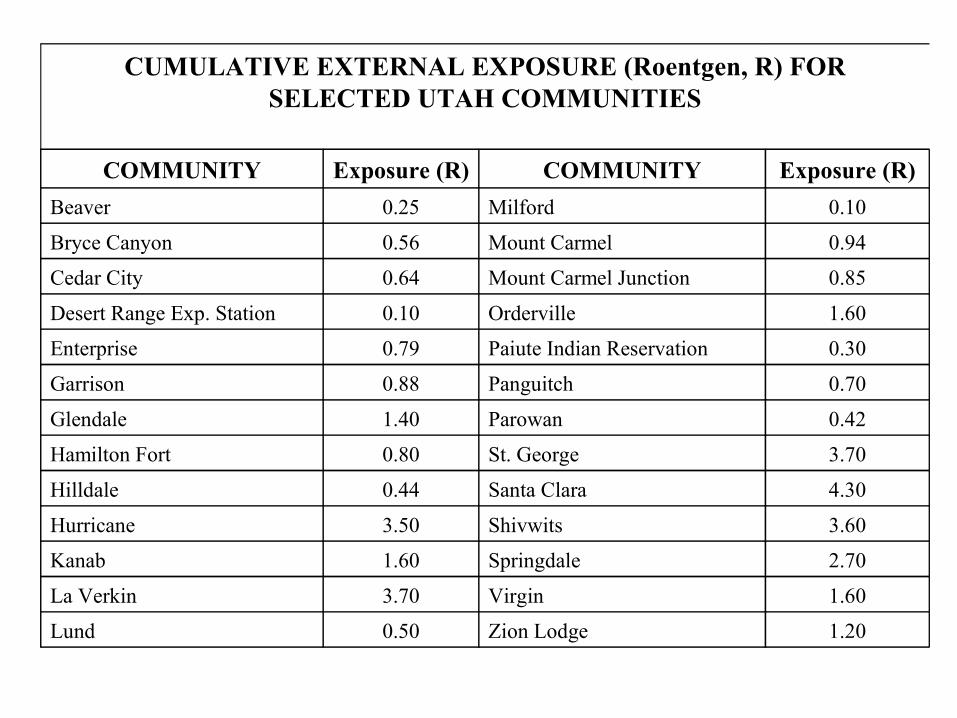
CUMULATIVE EXTERNAL EXPOSURE (Roentgen, R) FOR SELECTED UTAH COMMUNITIES
COMMUNITY Exposure (R) COMMUNITY Exposure (R)
Beaver 0.25 Milford 0.10
Bryce Canyon 0.56 Mount Carmel 0.94
Cedar City 0.64 Mount Carmel Junction 0.85
Desert Range Exp. Station 0.10 Orderville 1.60
Enterprise 0.79 Paiute Indian Reservation 0.30
Garrison 0.88 Panguitch 0.70
Glendale 1.40 Parowan 0.42
Hamilton Fort 0.80 St. George 3.70
Hilldale 0.44 Santa Clara 4.30
Hurricane 3.50 Shivwits 3.60
Kanab 1.60 Springdale 2.70
La Verkin 3.70 Virgin 1.60
Lund 0.50 Zion Lodge 1.20
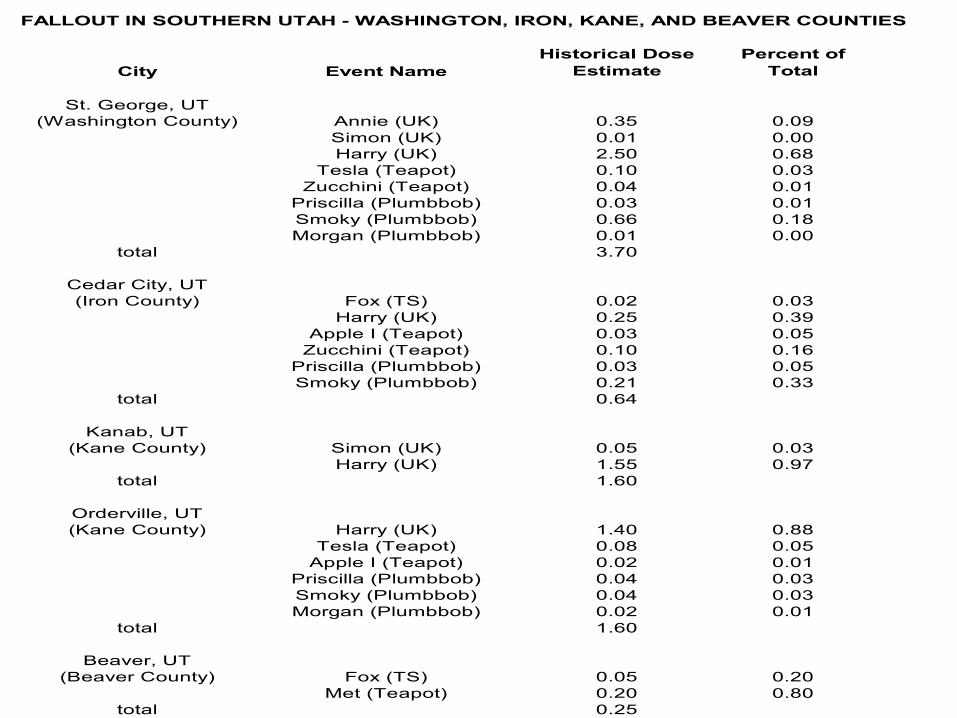
FALLOUT IN SOUTHERN UTAH - WASHINGTON, IRON, KANE, AND BEAVER COUNTIES
City Event NameHistorical Dose
EstimatePercent of
Total
St. George, UT(Washington County) Annie (UK) 0.35 0.09
Simon (UK) 0.01 0.00Harry (UK) 2.50 0.68
Tesla (Teapot) 0.10 0.03Zucchini (Teapot) 0.04 0.01
Priscilla (Plumbbob) 0.03 0.01Smoky (Plumbbob) 0.66 0.18Morgan (Plumbbob) 0.01 0.00
total 3.70
Cedar City, UT(Iron County) Fox (TS) 0.02 0.03
Harry (UK) 0.25 0.39Apple I (Teapot) 0.03 0.05
Zucchini (Teapot) 0.10 0.16Priscilla (Plumbbob) 0.03 0.05Smoky (Plumbbob) 0.21 0.33
total 0.64
Kanab, UT(Kane County) Simon (UK) 0.05 0.03
Harry (UK) 1.55 0.97total 1.60
Orderville, UT(Kane County) Harry (UK) 1.40 0.88
Tesla (Teapot) 0.08 0.05Apple I (Teapot) 0.02 0.01
Priscilla (Plumbbob) 0.04 0.03Smoky (Plumbbob) 0.04 0.03Morgan (Plumbbob) 0.02 0.01
total 1.60
Beaver, UT(Beaver County) Fox (TS) 0.05 0.20
Met (Teapot) 0.20 0.80total 0.25
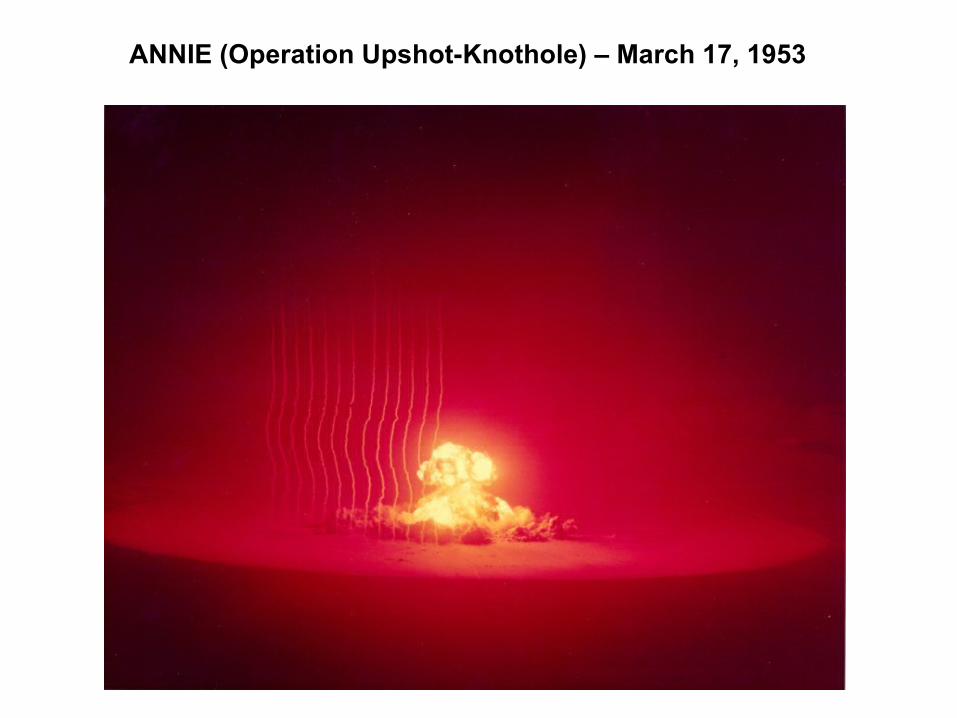
ANNIE (Operation Upshot-Knothole) – March 17, 1953
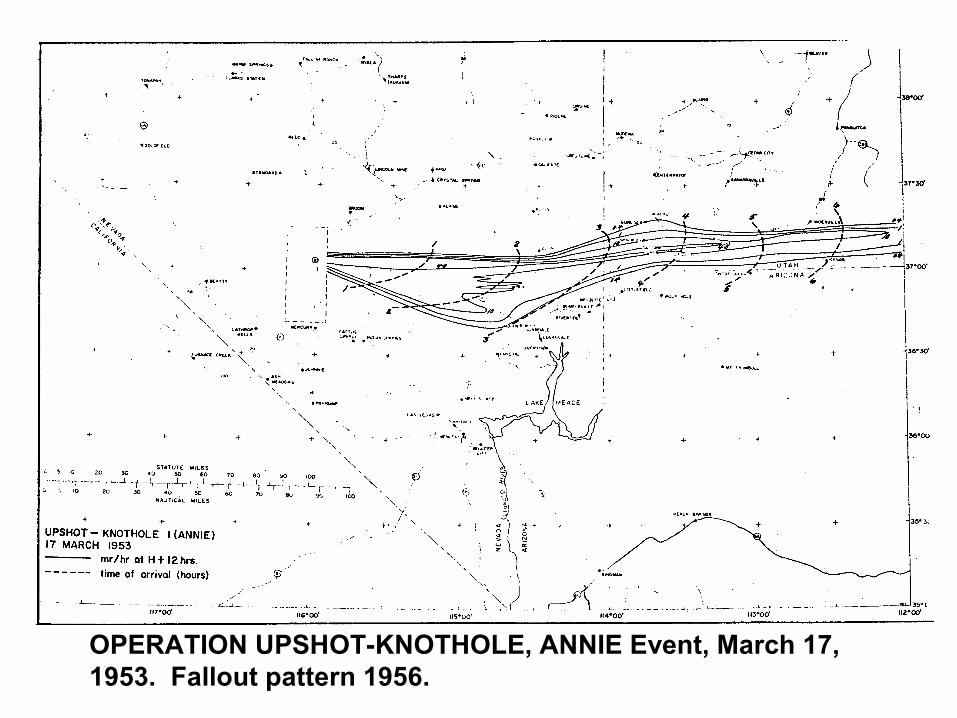
OPERATION UPSHOT-KNOTHOLE, ANNIE Event, March 17, 1953. Fallout pattern 1956.
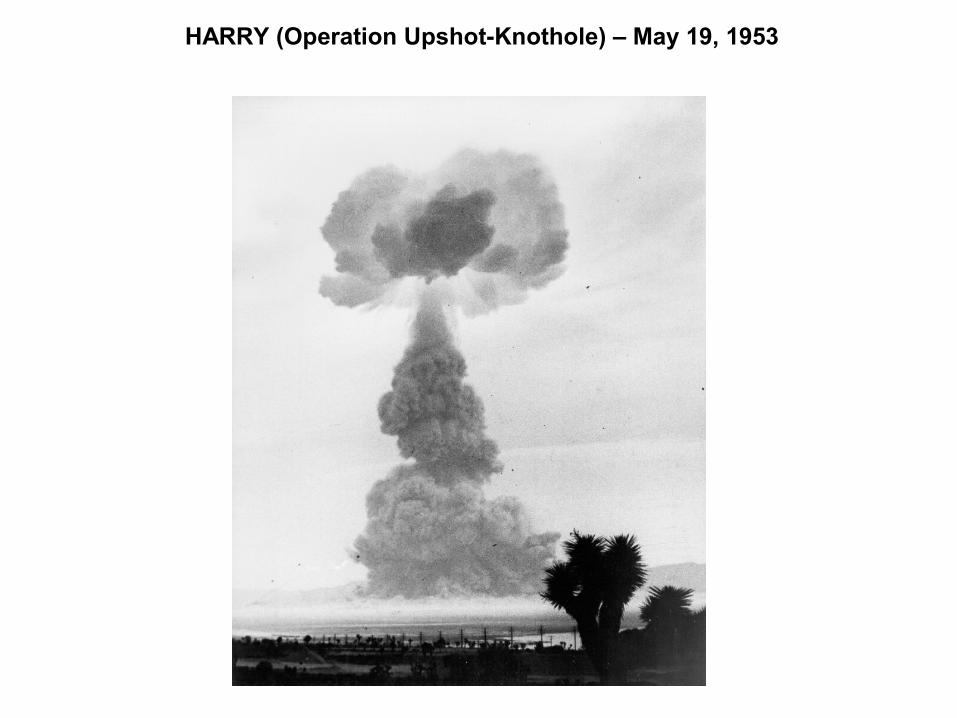
HARRY (Operation Upshot-Knothole) – May 19, 1953
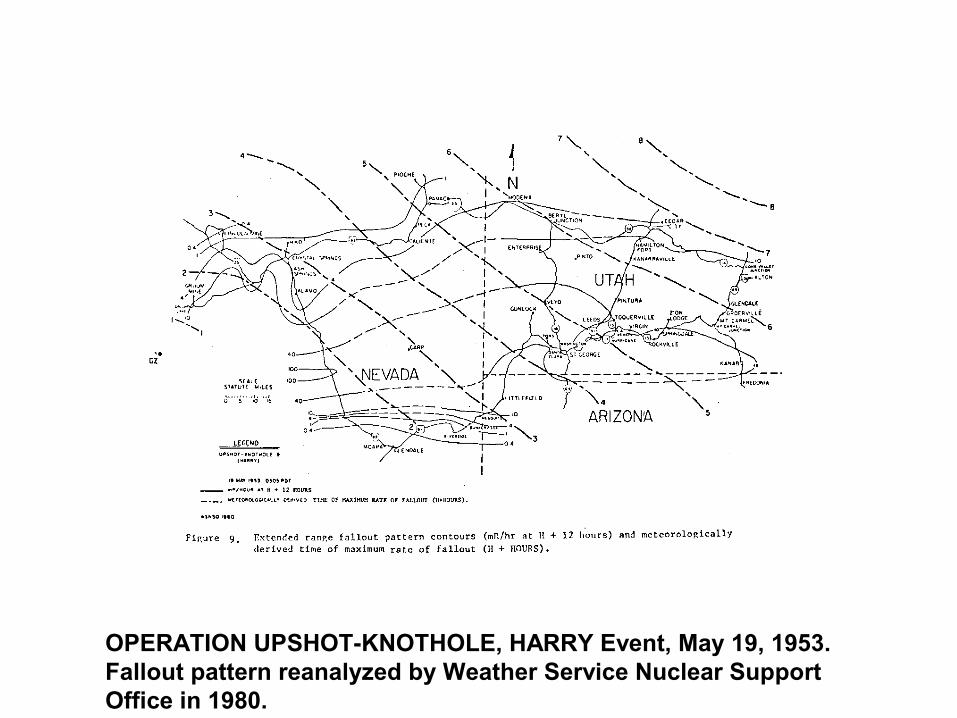
OPERATION UPSHOT-KNOTHOLE, HARRY Event, May 19, 1953. Fallout pattern reanalyzed by Weather Service Nuclear Support Office in 1980.
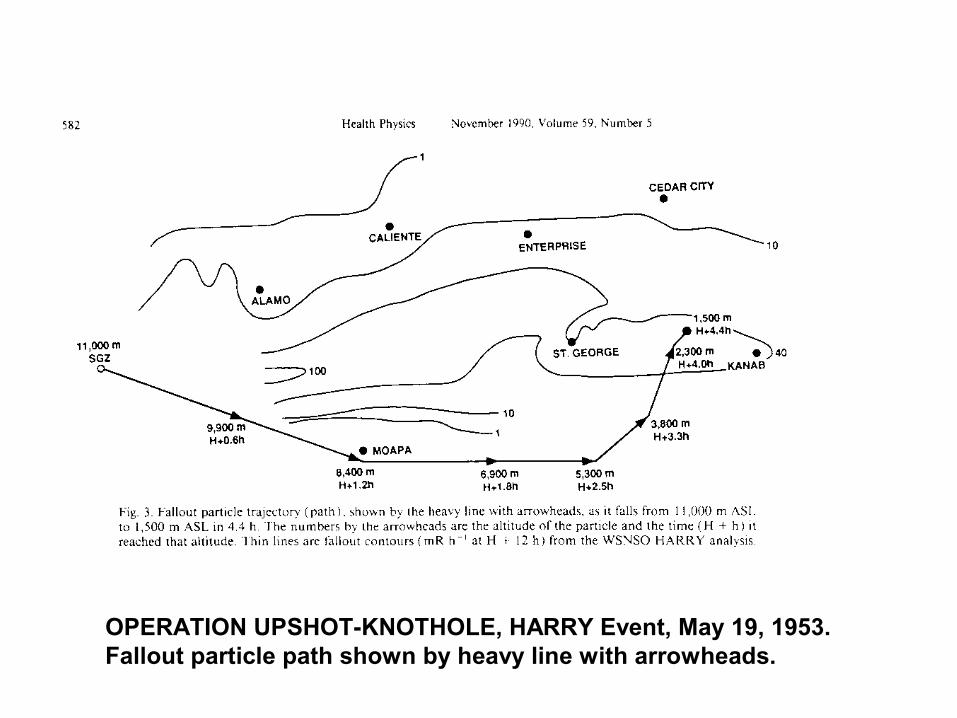
OPERATION UPSHOT-KNOTHOLE, HARRY Event, May 19, 1953. Fallout particle path shown by heavy line with arrowheads.
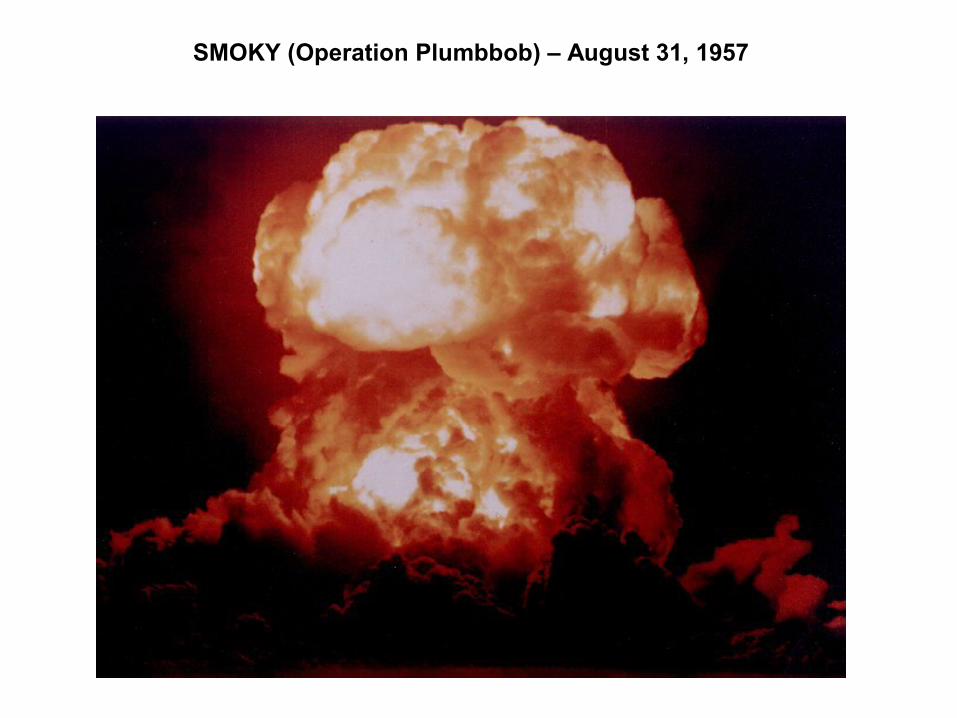
SMOKY (Operation Plumbbob) – August 31, 1957
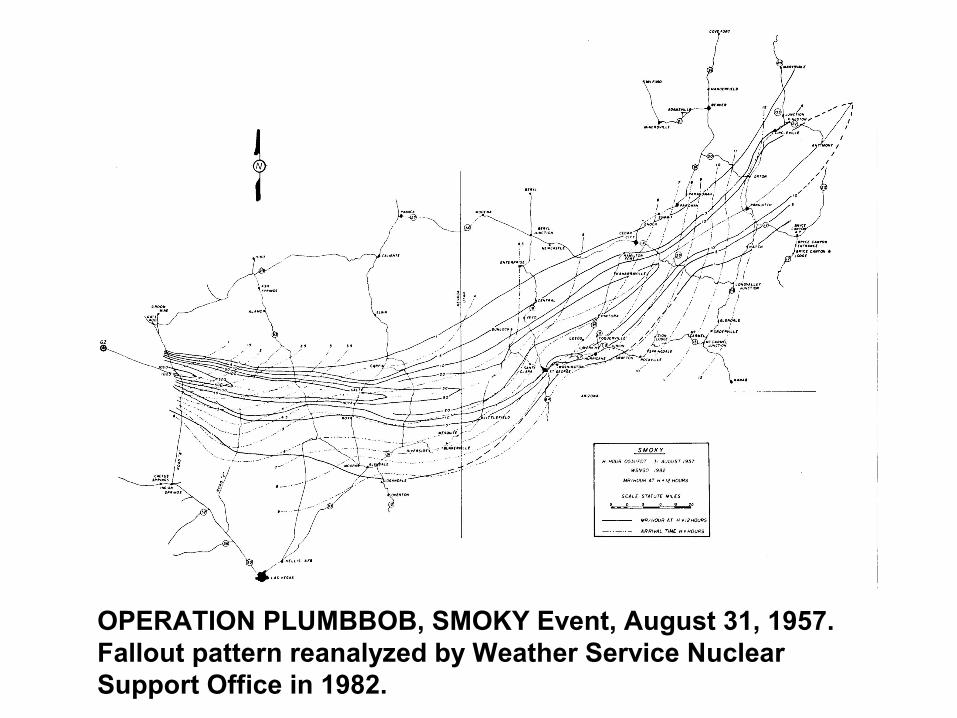
OPERATION PLUMBBOB, SMOKY Event, August 31, 1957. Fallout pattern reanalyzed by Weather Service Nuclear Support Office in 1982.
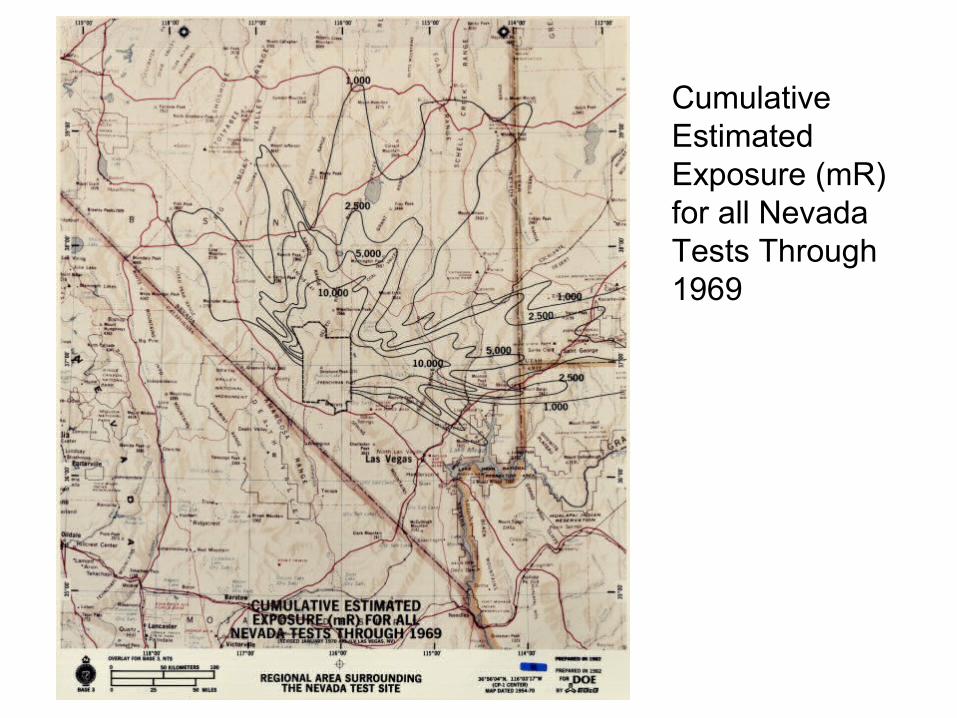
Cumulative Estimated Exposure (mR) for all Nevada Tests Through 1969
Soil Concentration Levels for Selected Cities
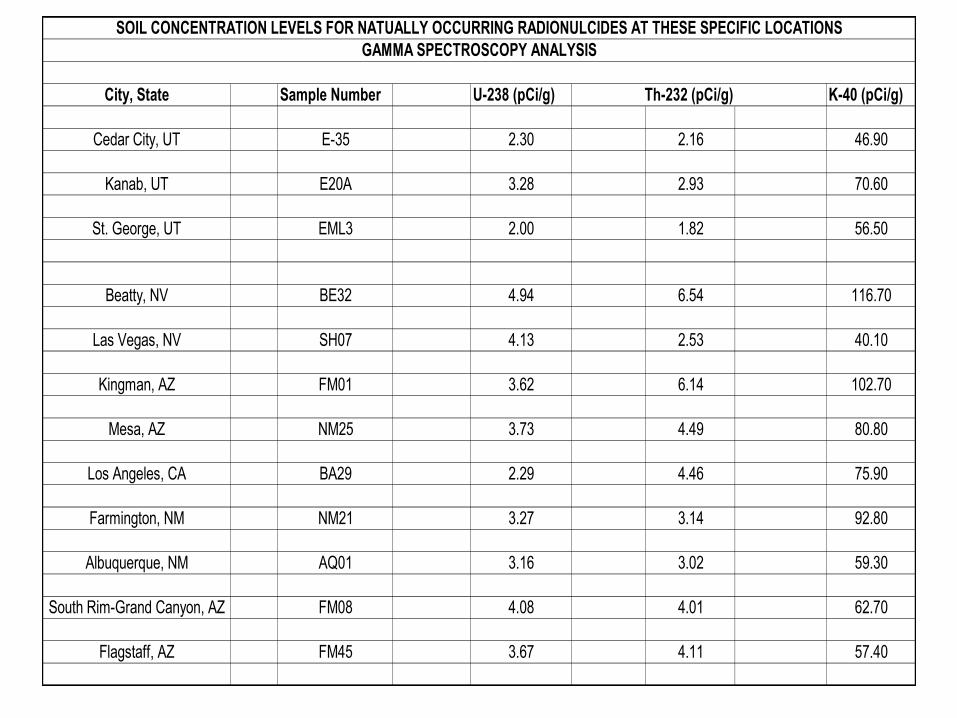
City, State Sample Number U-238 (pCi/g) Th-232 (pCi/g) K-40 (pCi/g)
Cedar City, UT E-35 2.30 2.16 46.90
Kanab, UT E20A 3.28 2.93 70.60
St. George, UT EML3 2.00 1.82 56.50
Beatty, NV BE32 4.94 6.54 116.70
Las Vegas, NV SH07 4.13 2.53 40.10
Kingman, AZ FM01 3.62 6.14 102.70
Mesa, AZ NM25 3.73 4.49 80.80
Los Angeles, CA BA29 2.29 4.46 75.90
Farmington, NM NM21 3.27 3.14 92.80
Albuquerque, NM AQ01 3.16 3.02 59.30
South Rim-Grand Canyon, AZ FM08 4.08 4.01 62.70
Flagstaff, AZ FM45 3.67 4.11 57.40
SOIL CONCENTRATION LEVELS FOR NATUALLY OCCURRING RADIONULCIDES AT THESE SPECIFIC LOCATIONSGAMMA SPECTROSCOPY ANALYSIS
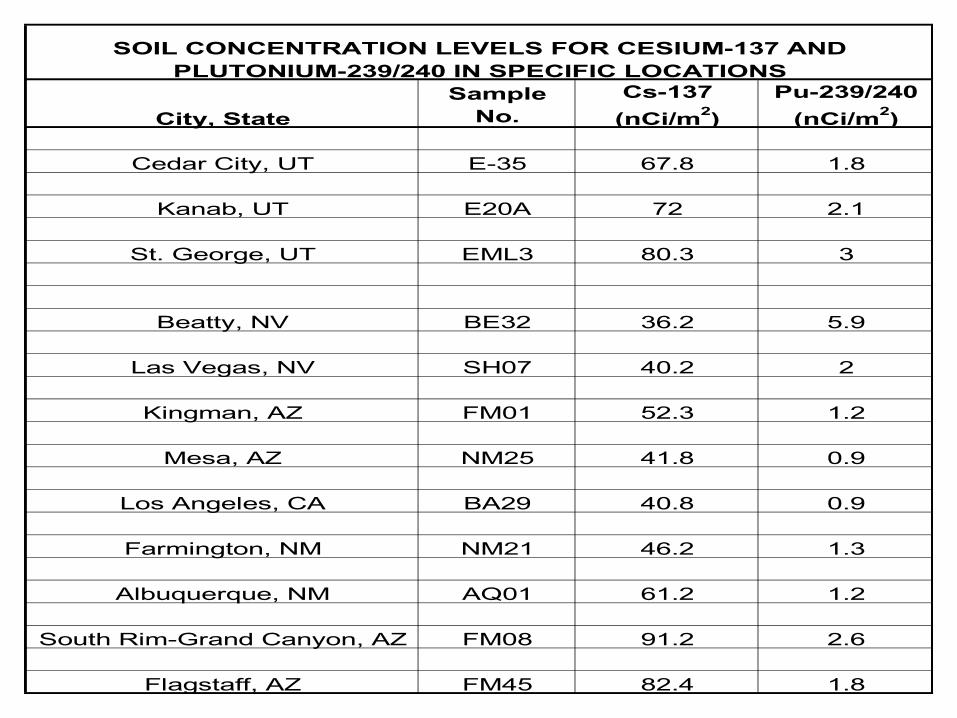
City, StateSample
No.Cs-137 (nCi/m2)
Pu-239/240 (nCi/m2)
Cedar City, UT E-35 67.8 1.8
Kanab, UT E20A 72 2.1
St. George, UT EML3 80.3 3
Beatty, NV BE32 36.2 5.9
Las Vegas, NV SH07 40.2 2
Kingman, AZ FM01 52.3 1.2
Mesa, AZ NM25 41.8 0.9
Los Angeles, CA BA29 40.8 0.9
Farmington, NM NM21 46.2 1.3
Albuquerque, NM AQ01 61.2 1.2
South Rim-Grand Canyon, AZ FM08 91.2 2.6
Flagstaff, AZ FM45 82.4 1.8
SOIL CONCENTRATION LEVELS FOR CESIUM-137 AND PLUTONIUM-239/240 IN SPECIFIC LOCATIONS
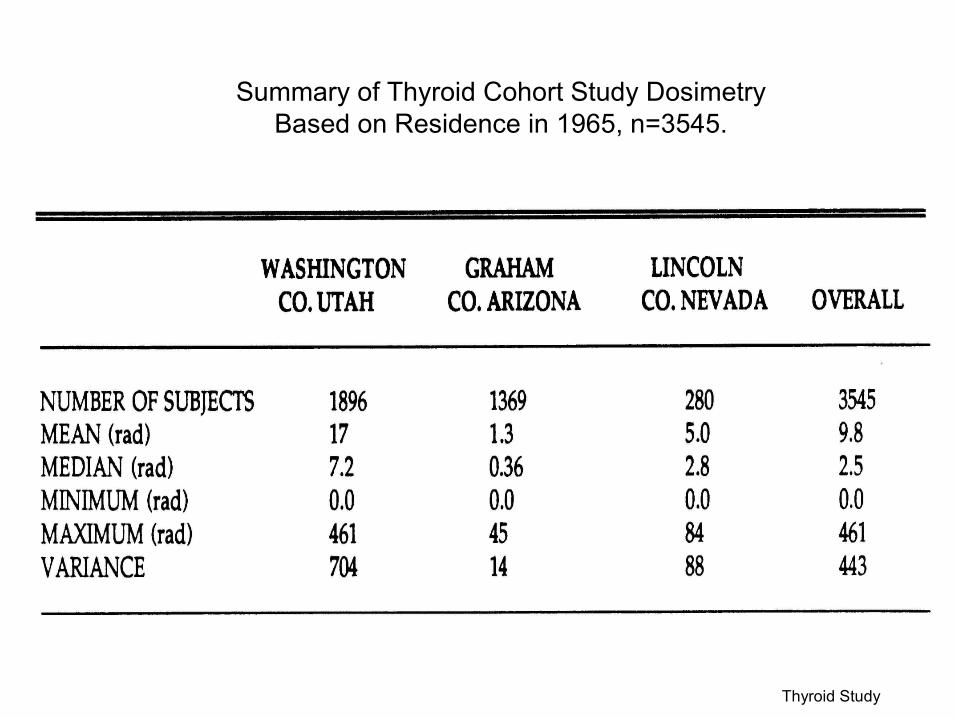
Summary of Thyroid Cohort Study Dosimetry Based on Residence in 1965, n=3545.
Thyroid Study
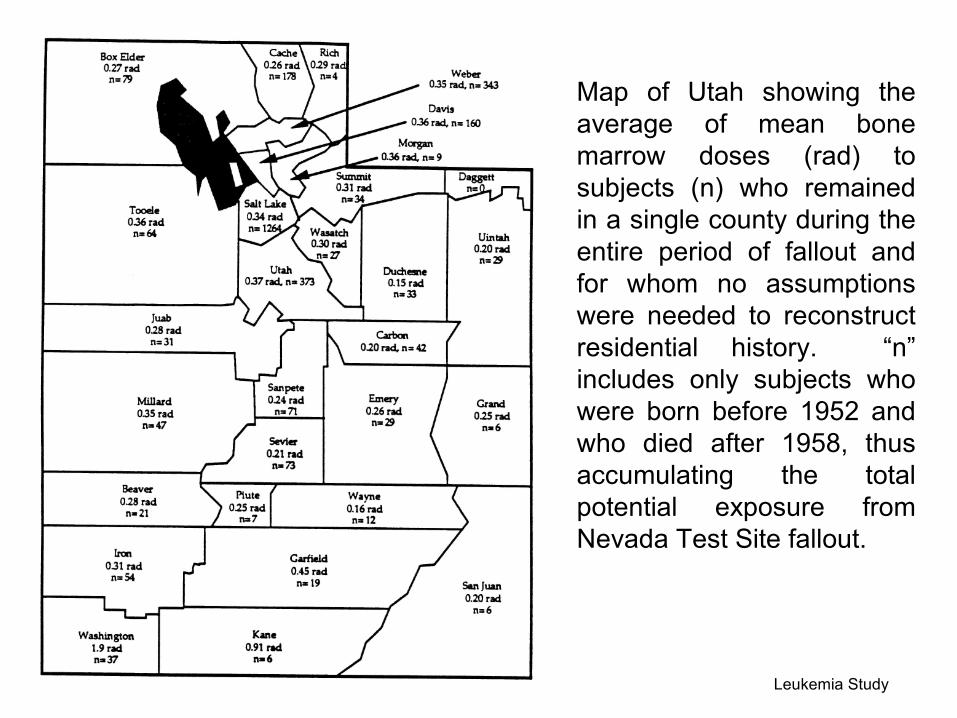
Map of Utah showing the average of mean bone marrow doses (rad) to subjects (n) who remained in a single county during the entire period of fallout and for whom no assumptions were needed to reconstruct residential history. “n” includes only subjects who were born before 1952 and who died after 1958, thus accumulating the total potential exposure from Nevada Test Site fallout.
Leukemia Study
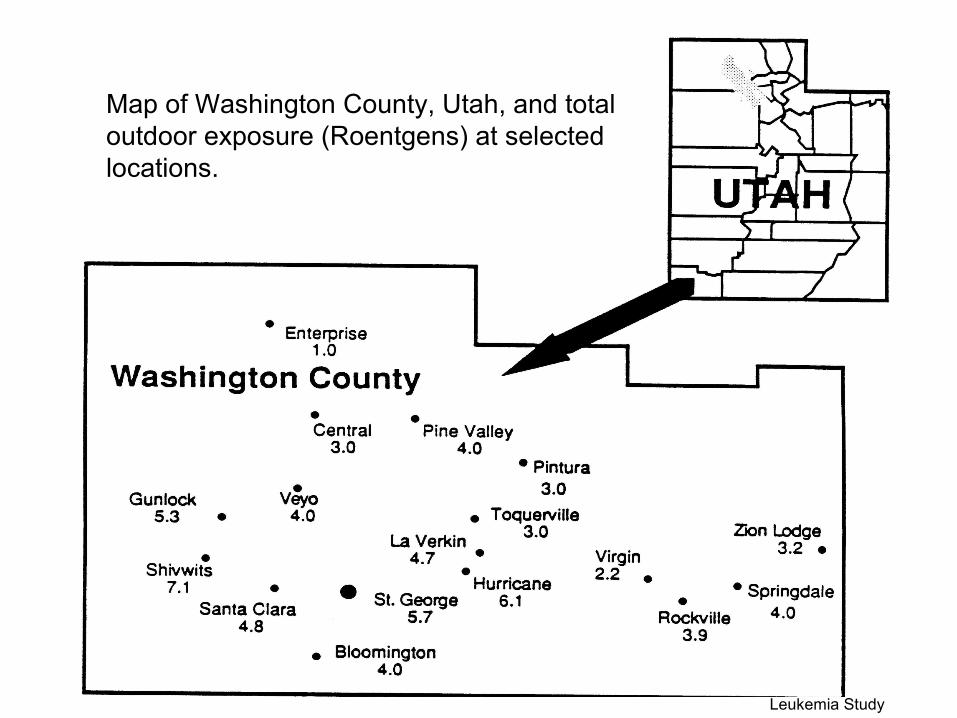
Map of Washington County, Utah, and total outdoor exposure (Roentgens) at selected locations.
Leukemia Study
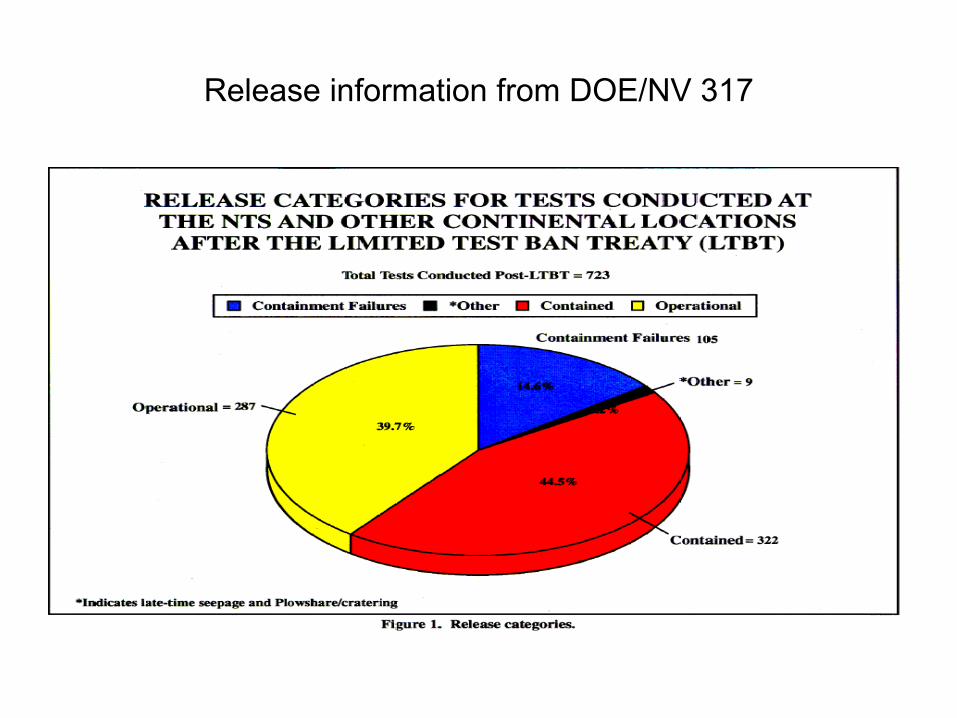
Release information from DOE/NV 317
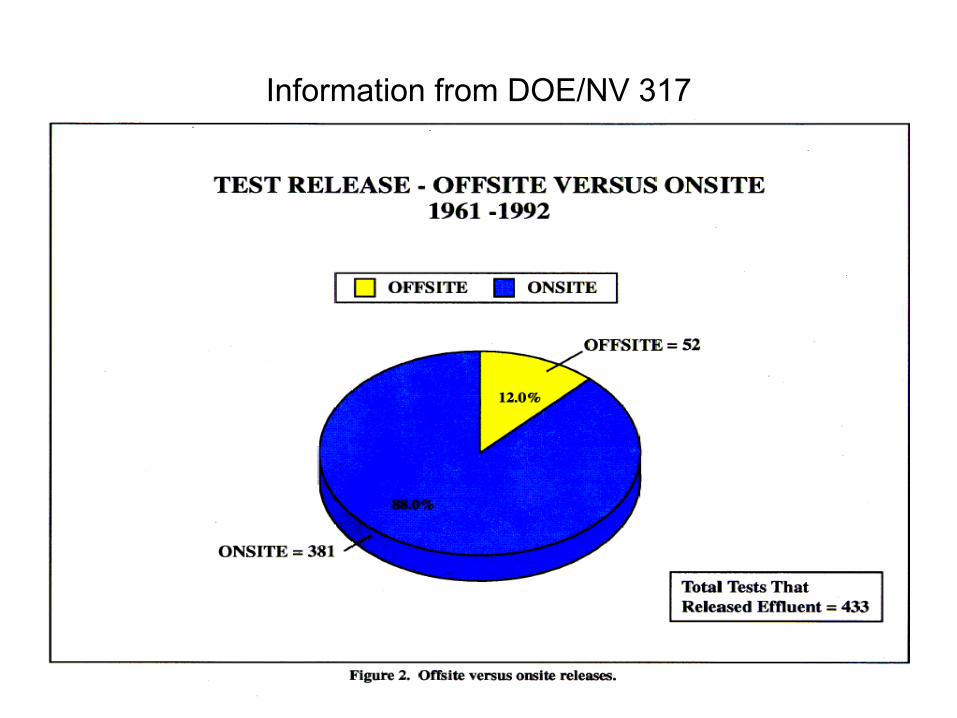
Information from DOE/NV 317
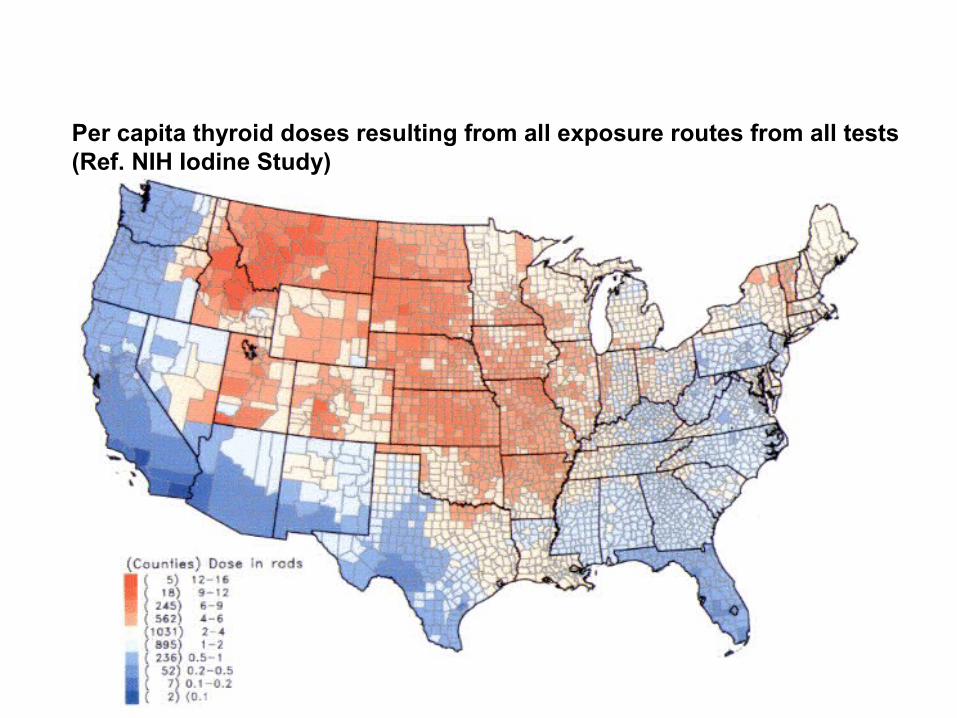
Per capita thyroid doses resulting from all exposure routes from all tests(Ref. NIH Iodine Study)
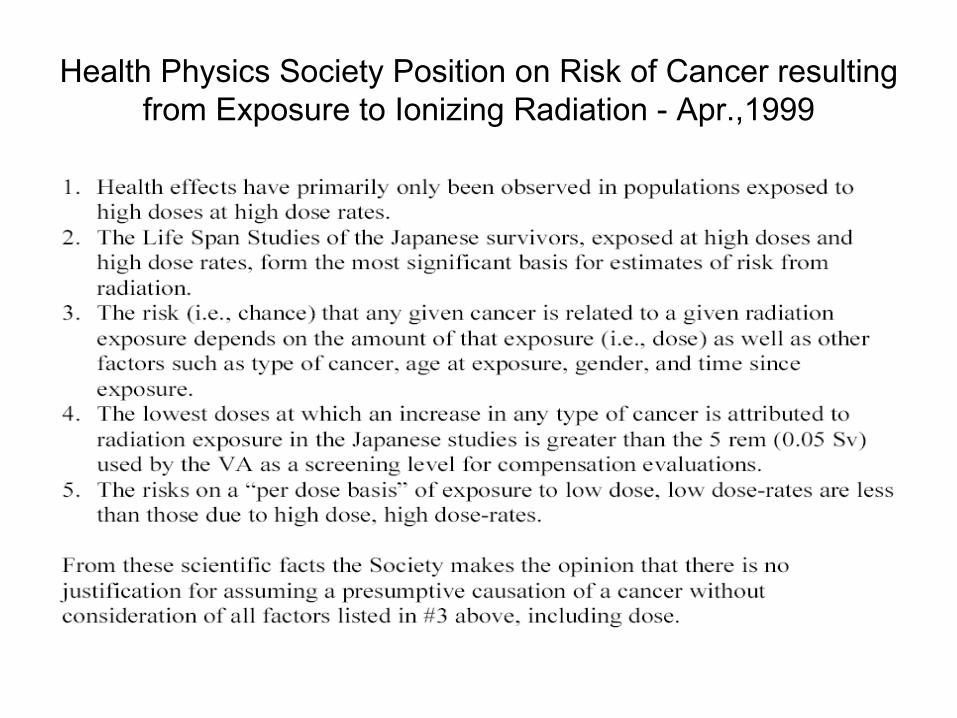
Health Physics Society Position on Risk of Cancer resulting from Exposure to Ionizing Radiation - Apr.,1999
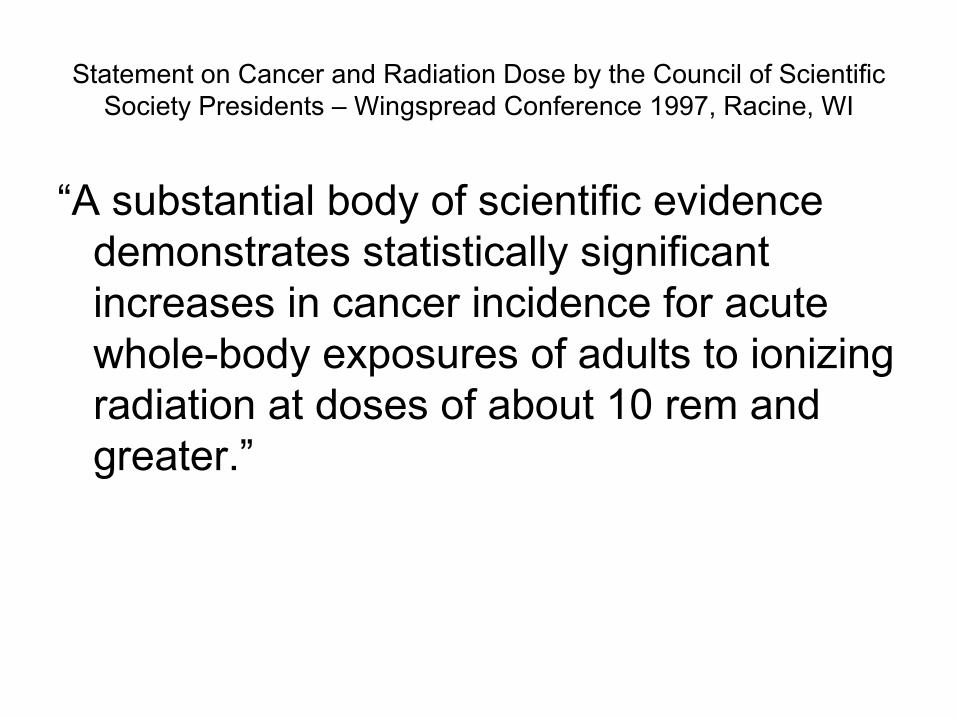
Statement on Cancer and Radiation Dose by the Council of Scientific Society Presidents – Wingspread Conference 1997, Racine, WI
“A substantial body of scientific evidence demonstrates statistically significant increases in cancer incidence for acute whole-body exposures of adults to ionizing radiation at doses of about 10 rem and greater.”
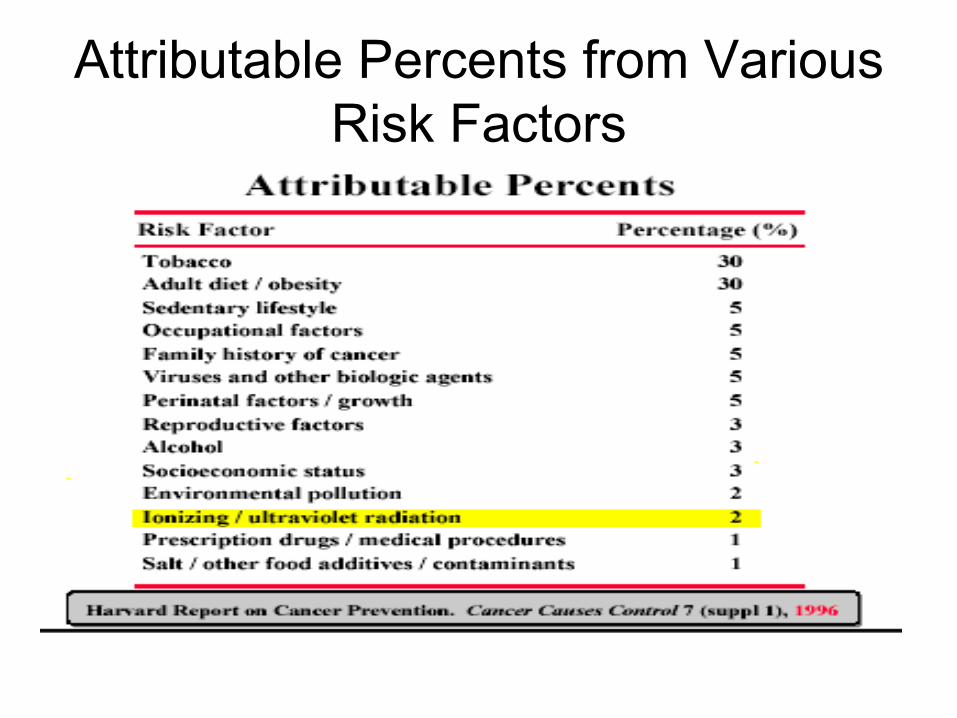
Attributable Percents from Various Risk Factors
Take Home Messages• Everyone is exposed to ionizing radiation
– From Natural Background– From Fallout
• Exposure/Dose is variable– Lifestyle– Geographic location
• Most Utah Residents received relatively modest exposures/doses from Fallout
• Risk is proportional to the size of the Dose