Embed Size (px)
Citation preview
Snoopin aroundSmall-cap visit note Thursday, 7 January 2016
Financials
Year to 30 June FY12A FY13A FY14A FY15A FY16ERevenue (RMm) 116.3 135.2 158.7 196.8 264.0Net profit (RMm) 8.7 13.6 23.4 28.3 37.0EPS (sen) 0.8 1.3 2.1 2.3 3.0EPS growth (% YoY) 24.3 53.6 61.1 9.4 31.1PE (x) 205.7 133.9 83.2 76.0 57.6Dividend yield (%) 1.3 1.1 0.5 0.7 0.6ROAE (%) 17.7 23.2 28.8 23.7 24.0PB (x) 4.9 8.0 18.9 12.0 n.a.Net gearing (%) 30.9 12.8 (17.5) (25.4) n.a.Source: CLSA, Bloomberg
Find CLSA research on Bloomberg, Thomson Reuters, Factset and CapitalIQ - and profit from our evalu@tor proprietary database at clsa.com
For important disclosures please refer to page 15.
Risk RewardMM ´´´´
GD Express (RM1.73 - N-R)Express delivery, express growthE-commerce boosts already-robust demand for last-mile delivery
GDEX, since the entry of a new CEO and controlling shareholder in 2000, has delivered an uninterrupted 23x increase in revenue over the last 15 years, underpinned by progressive process and capacity investments. Strong organic growth from a diverse, growing base of corporate customers is now being compounded by rapid growth in E-commerce ie, last-mile delivery demand from fast-expanding online retailers like Zalora, Groupon and Astro. Management guided for 2-3x the revenue growth of the industry’s 7-8%, withresilient, scale-supported margins; successful regional expansion will further boost growth.
Core operations: Express delivery servicesGDEX’s EDS division currently generates >90% of revenue and earnings, the rest being from a logistics division which supports E-commerce growth via related processing and warehousing services. Investment in national infrastructure and hub capacity has underpinned sustained market share gains and diversified base of blue-chip corporate clients (no single client is >5% of revenue). Entry of SingPost as a major shareholder in 2011 was an endorsement of management strategy and long-term growth potential.
E-commerce: Strong new growth driverOnce wholly dependent on B-to-B deliveries, GDEX’s B-to-C business has surged from under 5% of revenue a few years ago to 20% currently, as courier services demand from E-commerce has leapt. With online being <2% of national retail sales and proliferating E-commerce players (eg AstroHome Shopping), growth potential extends beyond last-mile delivery to value-add services ie, warehousing and inventory management/packaging.
Balance sheet: Ready for regional growth planAnnual capex of RM18m-20m, principally for expanding hub/truck capacity and upgrading IT infrastructure, is covered by operating cashflow, whilst dividend cash outflow is marginal given >95% acceptance for the DRP. Net cash position means versatility re domestic M&A or regional growth options.
Valuations: Paying up for quality, high-growth nicheWith a strong operating track record and proven management at the helm, the valuation premium accorded to GDEX for its niche exposure to the high-growth logistics/E-commerce segments is defendable, especially if its plan to secure a regionalisation-supportive strategic partner/investor is successful.
Anand Pathmakanthan +60 3 2056 [email protected]
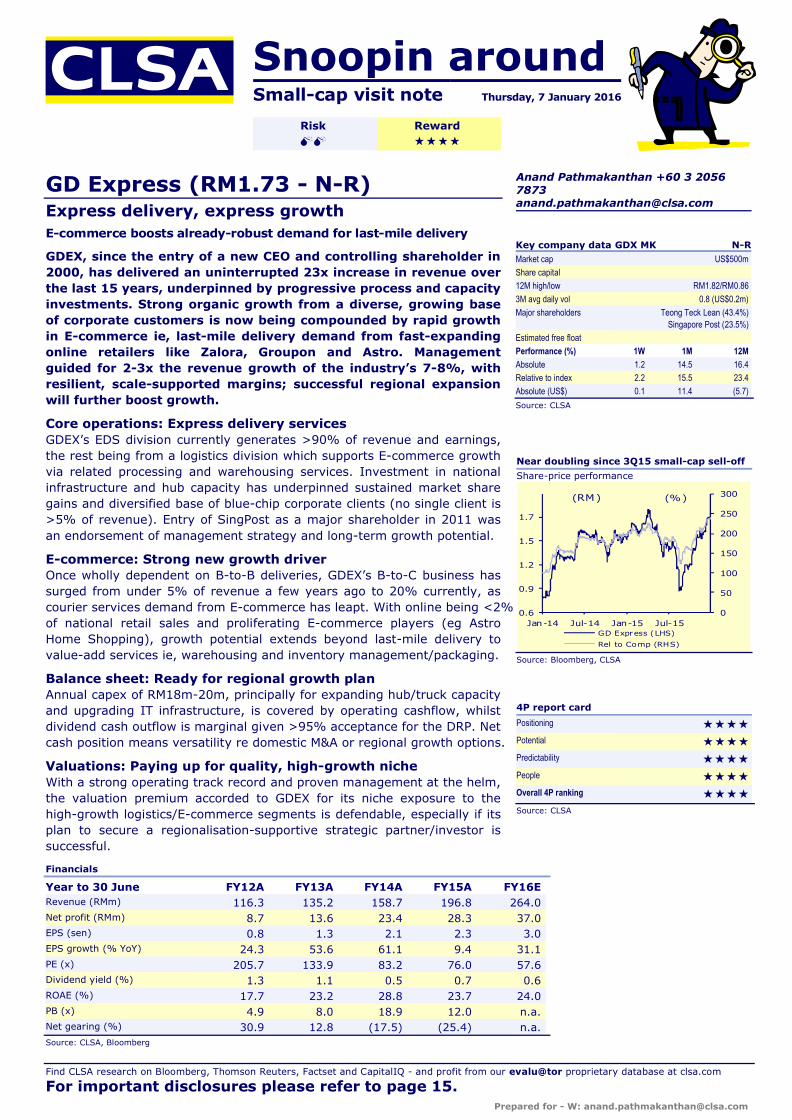
Near doubling since 3Q15 small-cap sell-off
Share-price performance
0
50
100
150
200
250
300
0.6
0.9
1.2
1.5
1.7
Jan-14 Jul-14 Jan-15 Jul-15GD Express (LHS)
Rel to Comp (RHS)
(RM) (%)
Source: Bloomberg, CLSA
Key company data GDX MK N-RMarket cap US$500m
Share capital
12M high/low RM1.82/RM0.86
3M avg daily vol 0.8 (US$0.2m)
Major shareholders Teong Teck Lean (43.4%)Singapore Post (23.5%)
Estimated free float
Performance (%) 1W 1M 12M
Absolute 1.2 14.5 16.4
Relative to index 2.2 15.5 23.4
Absolute (US$) 0.1 11.4 (5.7)
Source: CLSA
4P report card
Positioning ´´´´Potential ´´´´Predictability ´´´´People ´´´´Overall 4P ranking ´´´´Source: CLSA
GD Express - GDX MK Snoopin around
Page 2 of 18
Find CLSA research on Bloomberg, Thomson Reuters, Factset and CapitalIQ - and profit from our evalu@tor proprietary database at clsa.com
Key messagesq Core operations: GDEX is one of the dominant local express
delivery and integrated logistics services groups. Among its key customers are healthcare laboratories (eg, pick-up and delivery of time-sensitive medical test products), FMCG companies, banks, telcos (pick-up and delivery of mobile phones from distributors to agents nationwide) and E-commerce (providing logistical support to SMEs and E-commerce merchants in handling pick-up and delivery of goods worldwide). GDEX boasts a diverse customer base with no single customer generating more than 5% of group revenue.
q GDEX’s courier operations use a hub & spoke model ie, all shipments are sent to a central sorting hub (the group’s HQ in Petaling Jaya, just outside KL), sorted / documented and then shipped to the final destination. This model requires an integrated logistics solution underpinned by efficient warehouse / hub facilities and a large network of branches and stations (these are national localised collection points from which shipments are sent to the GDEX HQ Hub (hub) and where sorted shipments are sent for despatch delivery to recipients).
n Express delivery services (EDS): Covering express delivery of parcels and packages, this business currently contributes more than 90% of group revenue and earnings. Shipments are collected at collection stations across the country and shipped to the hub, sorted and then shipped out again to recipients.
n Logistics services: This is a relatively new service, having started operations only in 2011. It is tailored especially for E-commerce, with key E-commerce retail brands including Zalora and Groupon, as well as the recently-launched Astro Home Shopping service. Customers deliver bulk materials to GDEX’s warehouse where they are sorted and repacked into customised GDEX boxes. These boxes are addressed to the recipients and then sent to the hub for sorting and distribution. Revenue is still low (was loss-making until 1HFY14) but E-commerce is set to be a strong growth driver, especially given the comprehensive service which includes order processing, inventory management and accounts receivables processing.
q Staying ahead of the competition: Ability to build market share and deliver 15-year revenue CAGR of a hefty 23% has been underpinned by the CEO’s emphasis on constantly improving work processes and manpower skill levels, guided by the three operating priorities of speed, cost-efficiency and flexibility. Leadership has been demonstrated via GDEX’s many ‘firsts’ in the local express delivery sector, including: i) first to obtain ISO 9001:2000 certification (the International Organisation for Standardisation or ISO 9001 specifies requirements for a quality management system) – this was upgraded to ISO 9001:2008 in 2009; ii) first to deploy conveyor systems for both parcel and document sorting; and iii)first to obtain pioneer status from MIDA (Malaysia Investment Development Authority) ie, tax exemption on 70% of income derived from Integrated Logistics Services–related activities. GDEX is now pursuing Six Sigma (a disciplined, data-driven approach to eliminating defects in any process) for all operational procedures.
Company history
q GDEX was established in 1996 but quickly ran into difficulties due to the 1997 Asian Financial Crisis. Current CEO Teong Teck Lean, together with ex-CEO Leong Chee Tong (resigned April 2013) bought control of the group in 2000 and turned it around.
q Group revenue was RM9m in FY2000 – this hit RM197m in FY15, underpinned by its core expressdelivery services. Key milestones are: i) listing on the ACE Market in 2005, ii) entry of SingPost as a substantial shareholder in March 2011; and iii) transfer of listing status to the Main Board in 2013.
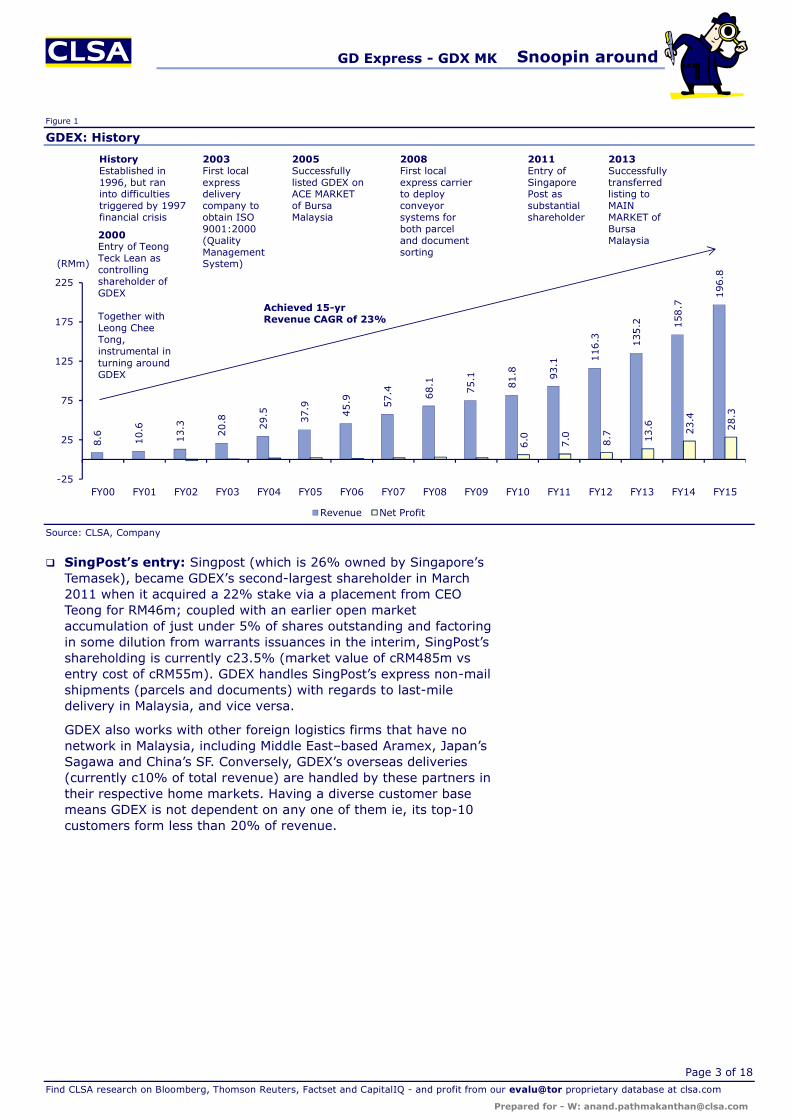
q Teong oversees the operations of the entire group and sets strategic direction; daily operations are run by a veteran team of senior management who on average have been with GDEX for over a decade.Chairman Dato Capt Ahmad Sufian is a Fellow of the Chartered Institute of Logistics & Transport.
Teong Teck Lean (55), MD and CEO
Dato Capt. Ahmad Sufian (66), Independent, Non-Exec Chairman
Lim Chee Seong (49), ED and CFO
GD Express - GDX MK Snoopin around
Page 3 of 18
Find CLSA research on Bloomberg, Thomson Reuters, Factset and CapitalIQ - and profit from our evalu@tor proprietary database at clsa.com
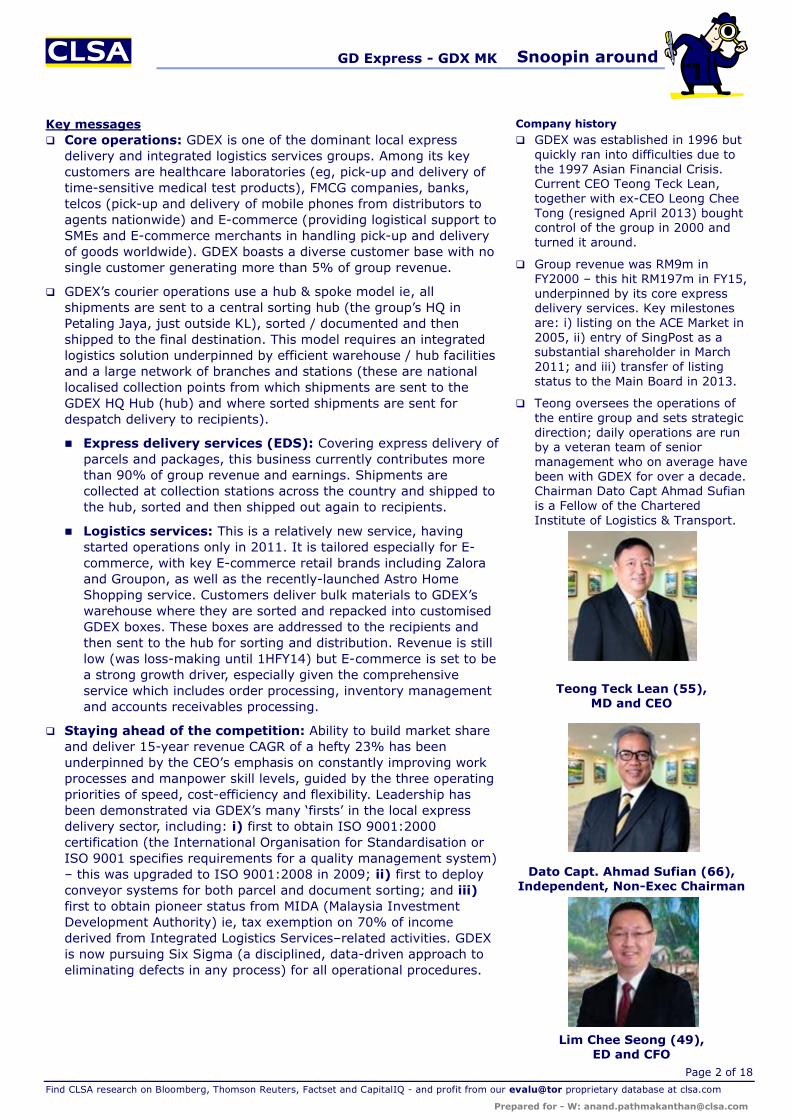
Figure 1
GDEX: History
Source: CLSA, Company
q SingPost’s entry: Singpost (which is 26% owned by Singapore’sTemasek), became GDEX’s second-largest shareholder in March 2011 when it acquired a 22% stake via a placement from CEO Teong for RM46m; coupled with an earlier open market accumulation of just under 5% of shares outstanding and factoring in some dilution from warrants issuances in the interim, SingPost’sshareholding is currently c23.5% (market value of cRM485m vs entry cost of cRM55m). GDEX handles SingPost’s express non-mail shipments (parcels and documents) with regards to last-mile delivery in Malaysia, and vice versa.
GDEX also works with other foreign logistics firms that have no network in Malaysia, including Middle East–based Aramex, Japan’s Sagawa and China’s SF. Conversely, GDEX’s overseas deliveries (currently c10% of total revenue) are handled by these partners in their respective home markets. Having a diverse customer base means GDEX is not dependent on any one of them ie, its top-10 customers form less than 20% of revenue.
8.6 10.6
13.3
20.8 29.5 37.9
45.9 57.4 68.1
75.1
81.8 93.1 1
16.3 135.2 158.7
196.8
6.0 7.0 8.7 13.6 23.4
28.3
-25
25
75
125
175
225
FY00 FY01 FY02 FY03 FY04 FY05 FY06 FY07 FY08 FY09 FY10 FY11 FY12 FY13 FY14 FY15
(RMm)
Revenue Net Profit
HistoryEstablished in 1996, but ran into difficulties triggered by 1997 financial crisis
2000Entry of Teong Teck Lean as controlling shareholder of GDEX
Together with Leong Chee Tong, instrumental in turning around GDEX
2003First local express delivery company to obtain ISO 9001:2000 (Quality Management System)
2008First local express carrier to deployconveyor systems for both parcel and document sorting
2011Entry of Singapore Post as substantialshareholder
2013Successfully transferredlisting to MAIN MARKET of Bursa Malaysia
Achieved 15-yr Revenue CAGR of 23%
2005Successfullylisted GDEX on ACE MARKET of Bursa Malaysia
GD Express - GDX MK Snoopin around
Page 4 of 18
Find CLSA research on Bloomberg, Thomson Reuters, Factset and CapitalIQ - and profit from our evalu@tor proprietary database at clsa.com
Figure 2
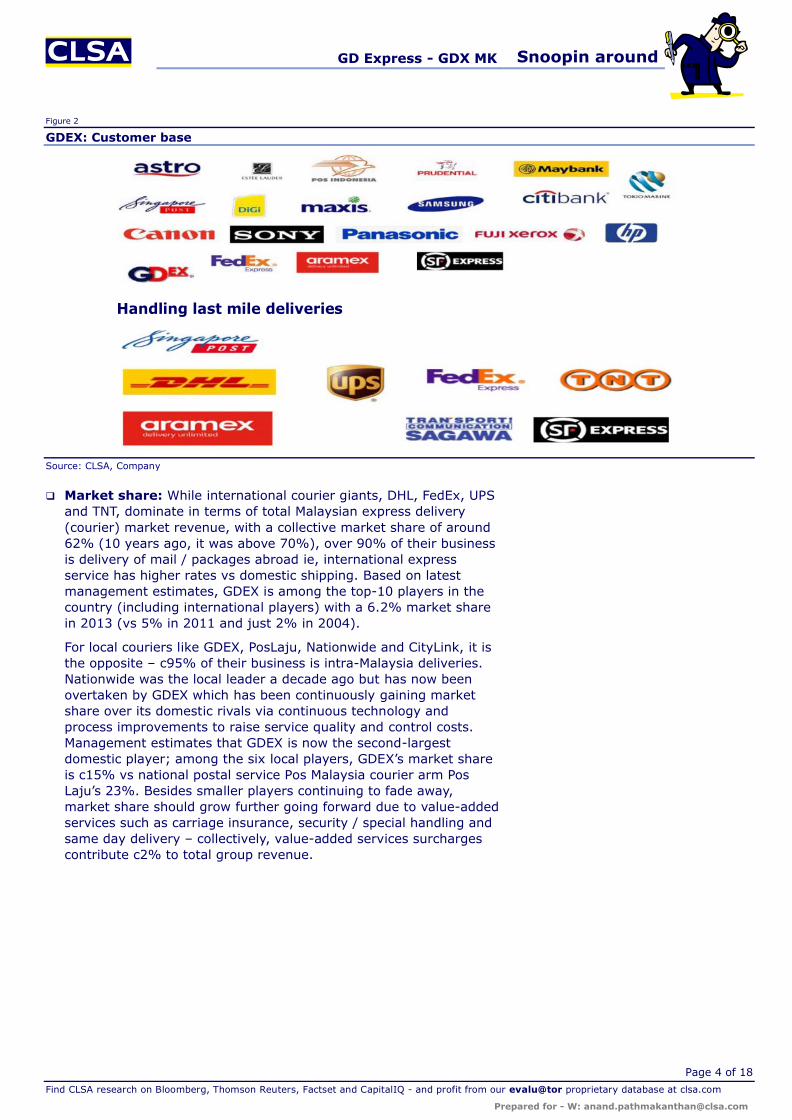
GDEX: Customer base
Source: CLSA, Company
q Market share: While international courier giants, DHL, FedEx, UPSand TNT, dominate in terms of total Malaysian express delivery (courier) market revenue, with a collective market share of around 62% (10 years ago, it was above 70%), over 90% of their business is delivery of mail / packages abroad ie, international express service has higher rates vs domestic shipping. Based on latest management estimates, GDEX is among the top-10 players in the country (including international players) with a 6.2% market share in 2013 (vs 5% in 2011 and just 2% in 2004).
For local couriers like GDEX, PosLaju, Nationwide and CityLink, it is the opposite – c95% of their business is intra-Malaysia deliveries. Nationwide was the local leader a decade ago but has now been overtaken by GDEX which has been continuously gaining market share over its domestic rivals via continuous technology and process improvements to raise service quality and control costs.Management estimates that GDEX is now the second-largest domestic player; among the six local players, GDEX’s market share is c15% vs national postal service Pos Malaysia courier arm Pos Laju’s 23%. Besides smaller players continuing to fade away, market share should grow further going forward due to value-added services such as carriage insurance, security / special handling and same day delivery – collectively, value-added services surcharges contribute c2% to total group revenue.
Handling last mile deliveries
GD Express - GDX MK Snoopin around
Page 5 of 18
Find CLSA research on Bloomberg, Thomson Reuters, Factset and CapitalIQ - and profit from our evalu@tor proprietary database at clsa.com
Figure 3 Figure 4
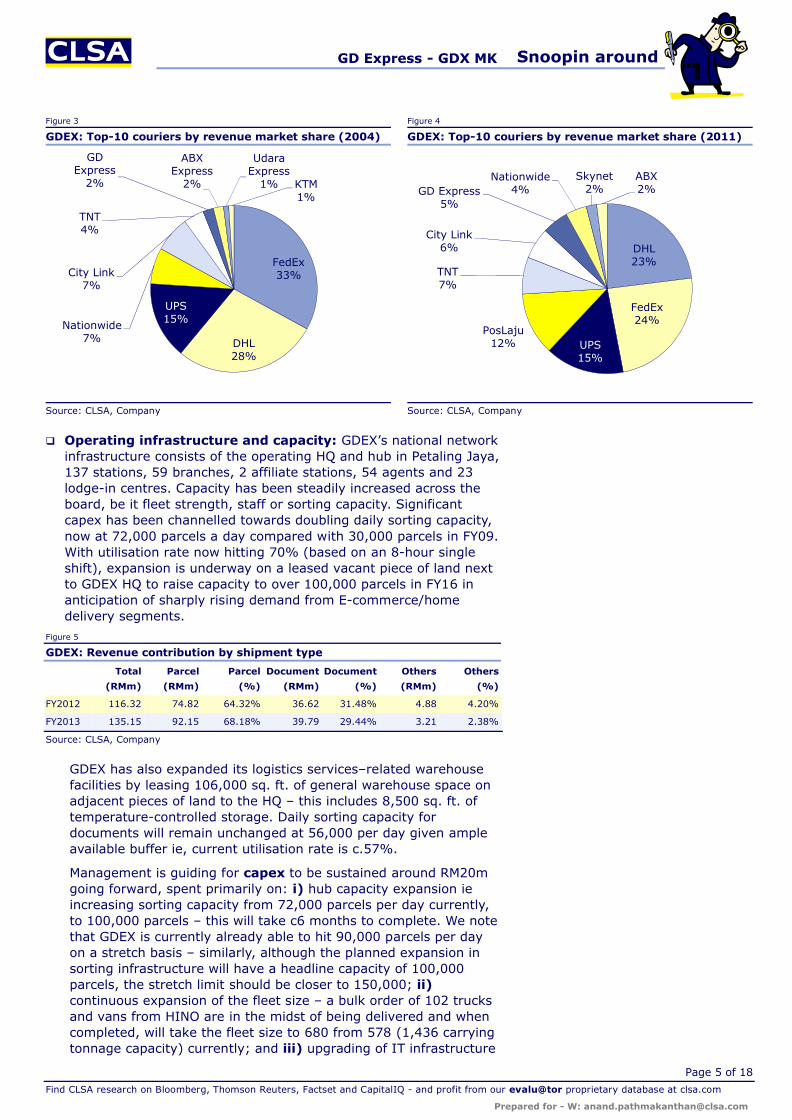
GDEX: Top-10 couriers by revenue market share (2004) GDEX: Top-10 couriers by revenue market share (2011)
Source: CLSA, Company Source: CLSA, Company
q Operating infrastructure and capacity: GDEX’s national network infrastructure consists of the operating HQ and hub in Petaling Jaya, 137 stations, 59 branches, 2 affiliate stations, 54 agents and 23 lodge-in centres. Capacity has been steadily increased across the board, be it fleet strength, staff or sorting capacity. Significant capex has been channelled towards doubling daily sorting capacity, now at 72,000 parcels a day compared with 30,000 parcels in FY09. With utilisation rate now hitting 70% (based on an 8-hour single shift), expansion is underway on a leased vacant piece of land next to GDEX HQ to raise capacity to over 100,000 parcels in FY16 in anticipation of sharply rising demand from E-commerce/home delivery segments.
Figure 5
GDEX: Revenue contribution by shipment type
Total Parcel Parcel Document Document Others Others
(RMm) (RMm) (%) (RMm) (%) (RMm) (%)
FY2012 116.32 74.82 64.32% 36.62 31.48% 4.88 4.20%
FY2013 135.15 92.15 68.18% 39.79 29.44% 3.21 2.38%
Source: CLSA, Company
GDEX has also expanded its logistics services–related warehouse facilities by leasing 106,000 sq. ft. of general warehouse space on adjacent pieces of land to the HQ – this includes 8,500 sq. ft. of temperature-controlled storage. Daily sorting capacity for documents will remain unchanged at 56,000 per day given ampleavailable buffer ie, current utilisation rate is c.57%.
Management is guiding for capex to be sustained around RM20mgoing forward, spent primarily on: i) hub capacity expansion ie increasing sorting capacity from 72,000 parcels per day currently, to 100,000 parcels – this will take c6 months to complete. We note that GDEX is currently already able to hit 90,000 parcels per day on a stretch basis – similarly, although the planned expansion in sorting infrastructure will have a headline capacity of 100,000 parcels, the stretch limit should be closer to 150,000; ii)continuous expansion of the fleet size – a bulk order of 102 trucks and vans from HINO are in the midst of being delivered and when completed, will take the fleet size to 680 from 578 (1,436 carrying tonnage capacity) currently; and iii) upgrading of IT infrastructure
FedEx33%
DHL28%
UPS15%Nationwide
7%
City Link7%
TNT4%
GD Express
2%
ABX Express
2%
Udara Express
1% KTM1%
DHL23%
FedEx24%
UPS15%
PosLaju12%
TNT7%
City Link6%
GD Express5%
Nationwide4%
Skynet2%
ABX2%
GD Express - GDX MK Snoopin around
Page 6 of 18
Find CLSA research on Bloomberg, Thomson Reuters, Factset and CapitalIQ - and profit from our evalu@tor proprietary database at clsa.com
to keep up with rising volumes as well as the greater sorting and tracking demands associated with a rapidly growing B-to-C business. Note GDEX has no intention to purchase warehousing capacity given its relative abundance and the flexibility of leasing rather than owning.
Operating cashflow can comfortably cover aforementioned capex plans, while dividend cash outflow (no dividend policy but guiding for around 40% annual payout) is likely to be minimal given strong interest in GDEX’s maiden dividend reinvestment plan (DRP) ie FY14 final dividend saw a 95% acceptance for equivalent new shares rather than cash dividend (similar to FY13 DRP take-up).
Figure 6 Figure 7
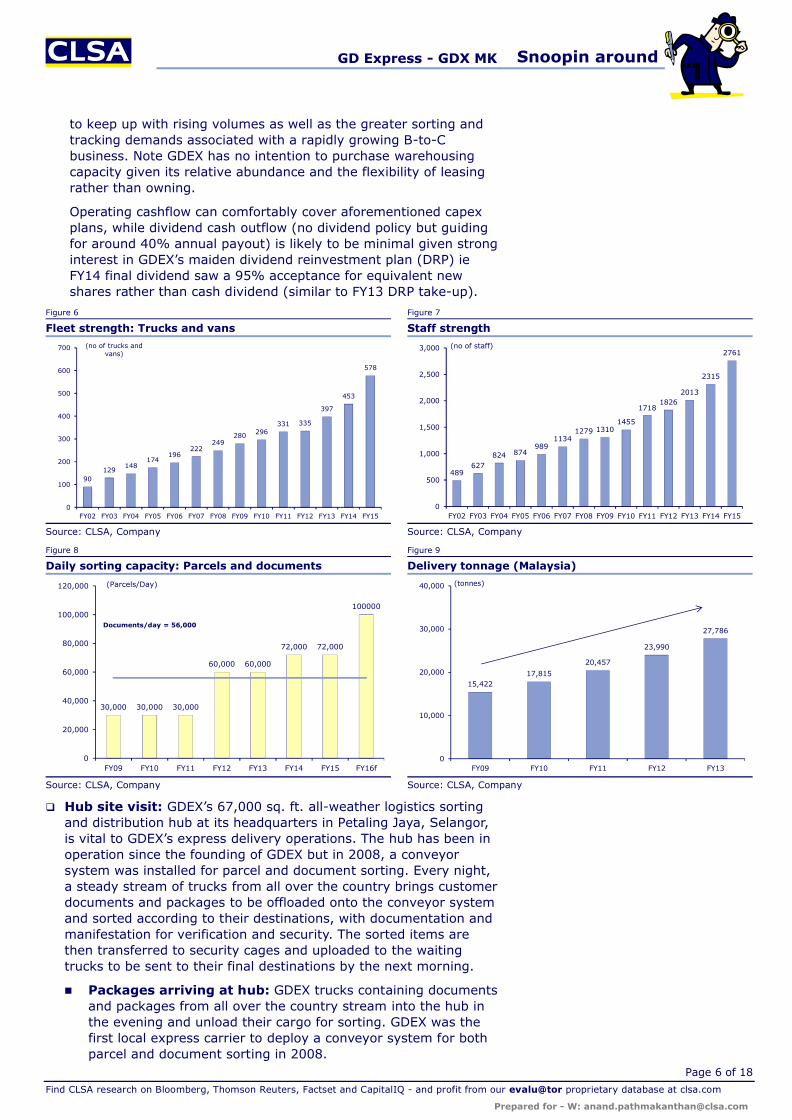
Fleet strength: Trucks and vans Staff strength
Source: CLSA, Company Source: CLSA, Company
Figure 8 Figure 9
Daily sorting capacity: Parcels and documents Delivery tonnage (Malaysia)
Source: CLSA, Company Source: CLSA, Company
q Hub site visit: GDEX’s 67,000 sq. ft. all-weather logistics sorting and distribution hub at its headquarters in Petaling Jaya, Selangor,is vital to GDEX’s express delivery operations. The hub has been in operation since the founding of GDEX but in 2008, a conveyor system was installed for parcel and document sorting. Every night, a steady stream of trucks from all over the country brings customer documents and packages to be offloaded onto the conveyor system and sorted according to their destinations, with documentation and manifestation for verification and security. The sorted items are then transferred to security cages and uploaded to the waiting trucks to be sent to their final destinations by the next morning.
n Packages arriving at hub: GDEX trucks containing documents and packages from all over the country stream into the hub in the evening and unload their cargo for sorting. GDEX was the first local express carrier to deploy a conveyor system for both parcel and document sorting in 2008.
90129
148174
196222
249280 296
331 335
397
453
578
0
100
200
300
400
500
600
700
FY02 FY03 FY04 FY05 FY06 FY07 FY08 FY09 FY10 FY11 FY12 FY13 FY14 FY15
(no of trucks and vans)
489627
824 874989
11341279 1310
1455
17181826
2013
2315
2761
0
500
1,000
1,500
2,000
2,500
3,000
FY02 FY03 FY04 FY05 FY06 FY07 FY08 FY09 FY10 FY11 FY12 FY13 FY14 FY15
(no of staff)
30,000 30,000 30,000
60,000 60,000
72,000 72,000
100000
0
20,000
40,000
60,000
80,000
100,000
120,000
FY09 FY10 FY11 FY12 FY13 FY14 FY15 FY16f
(Parcels/Day)
Documents/day = 56,000
15,42217,815
20,457
23,990
27,786
0
10,000
20,000
30,000
40,000
FY09 FY10 FY11 FY12 FY13
(tonnes)
GD Express - GDX MK Snoopin around
Page 7 of 18
Find CLSA research on Bloomberg, Thomson Reuters, Factset and CapitalIQ - and profit from our evalu@tor proprietary database at clsa.com
Figure 10 Figure 11
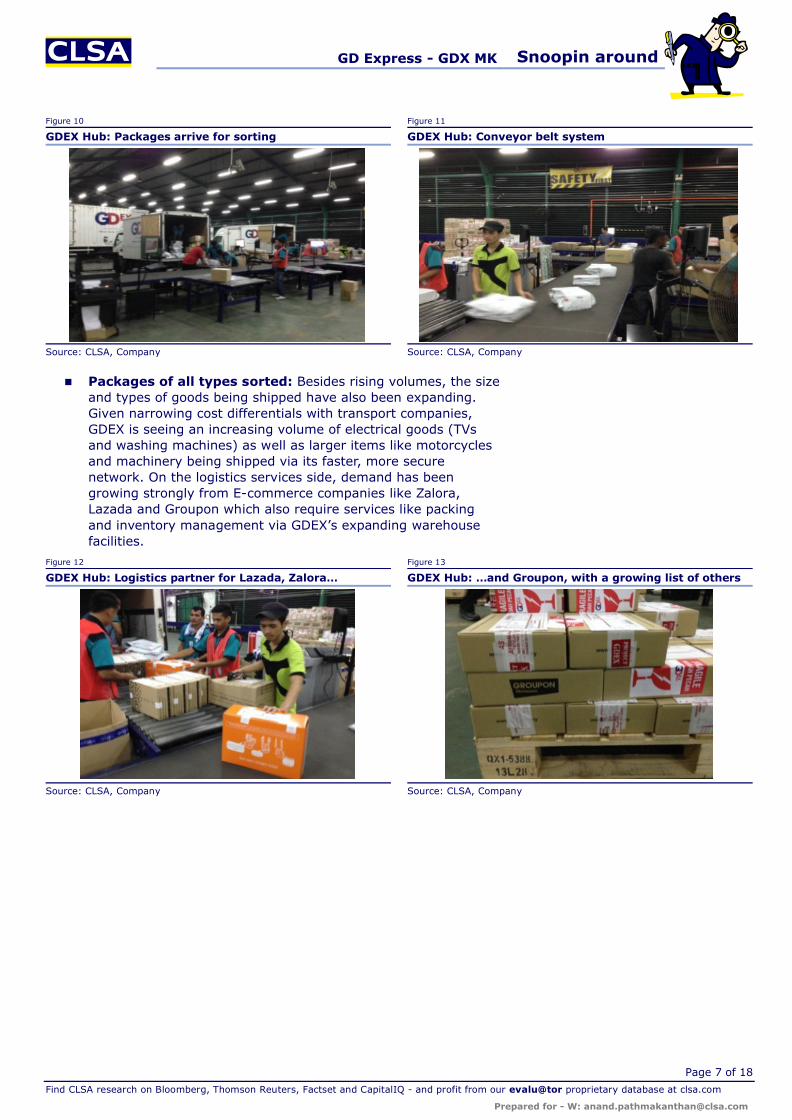
GDEX Hub: Packages arrive for sorting GDEX Hub: Conveyor belt system
Source: CLSA, Company Source: CLSA, Company
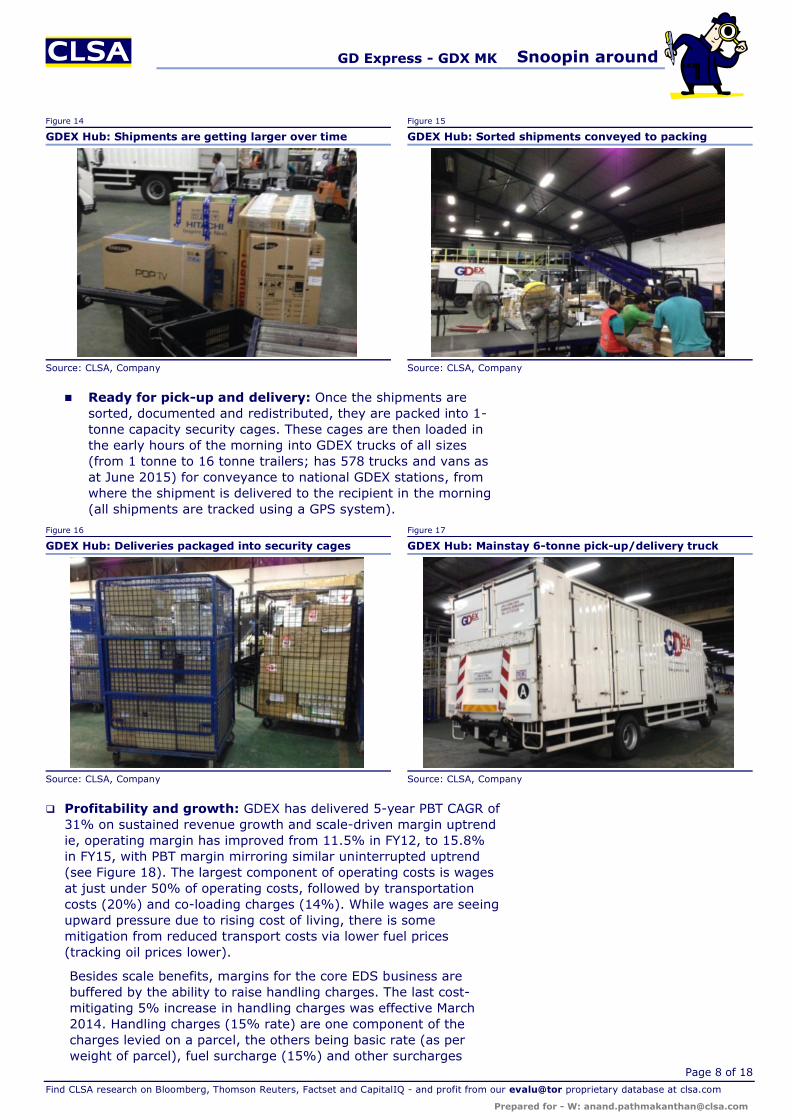
n Packages of all types sorted: Besides rising volumes, the size and types of goods being shipped have also been expanding. Given narrowing cost differentials with transport companies, GDEX is seeing an increasing volume of electrical goods (TVsand washing machines) as well as larger items like motorcycles and machinery being shipped via its faster, more secure network. On the logistics services side, demand has been growing strongly from E-commerce companies like Zalora, Lazada and Groupon which also require services like packing and inventory management via GDEX’s expanding warehouse facilities.
Figure 12 Figure 13
GDEX Hub: Logistics partner for Lazada, Zalora… GDEX Hub: …and Groupon, with a growing list of others
Source: CLSA, Company Source: CLSA, Company
GD Express - GDX MK Snoopin around
Page 8 of 18
Find CLSA research on Bloomberg, Thomson Reuters, Factset and CapitalIQ - and profit from our evalu@tor proprietary database at clsa.com
Figure 14 Figure 15
GDEX Hub: Shipments are getting larger over time GDEX Hub: Sorted shipments conveyed to packing
Source: CLSA, Company Source: CLSA, Company
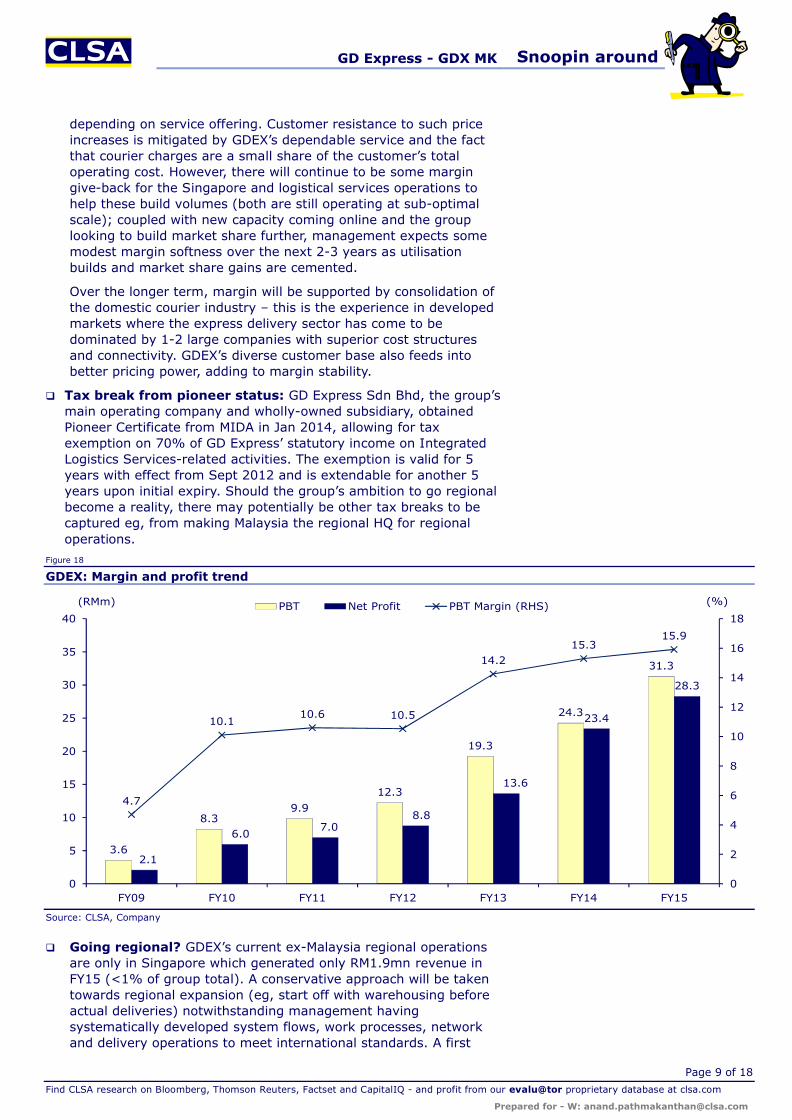
n Ready for pick-up and delivery: Once the shipments are sorted, documented and redistributed, they are packed into 1-tonne capacity security cages. These cages are then loaded in the early hours of the morning into GDEX trucks of all sizes (from 1 tonne to 16 tonne trailers; has 578 trucks and vans as at June 2015) for conveyance to national GDEX stations, from where the shipment is delivered to the recipient in the morning(all shipments are tracked using a GPS system).
Figure 16 Figure 17
GDEX Hub: Deliveries packaged into security cages GDEX Hub: Mainstay 6-tonne pick-up/delivery truck
Source: CLSA, Company Source: CLSA, Company
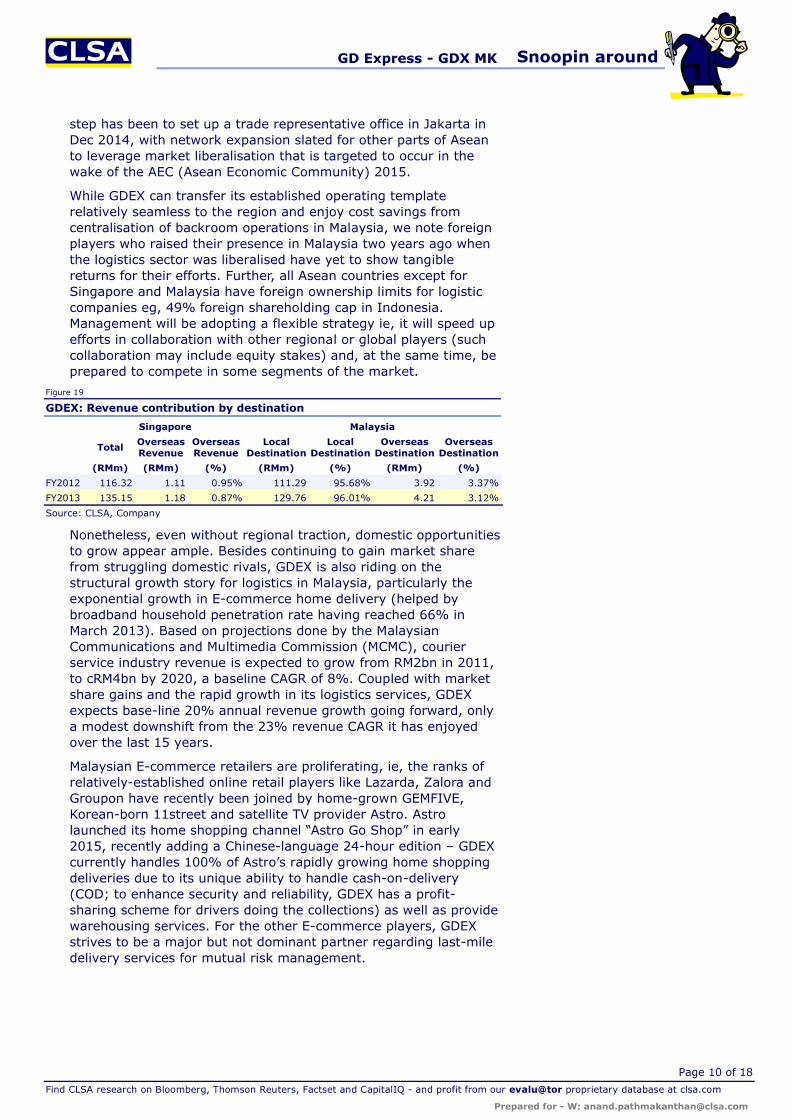
q Profitability and growth: GDEX has delivered 5-year PBT CAGR of 31% on sustained revenue growth and scale-driven margin uptrend ie, operating margin has improved from 11.5% in FY12, to 15.8% in FY15, with PBT margin mirroring similar uninterrupted uptrend (see Figure 18). The largest component of operating costs is wages at just under 50% of operating costs, followed by transportation costs (20%) and co-loading charges (14%). While wages are seeing upward pressure due to rising cost of living, there is some mitigation from reduced transport costs via lower fuel prices (tracking oil prices lower).
Besides scale benefits, margins for the core EDS business arebuffered by the ability to raise handling charges. The last cost-mitigating 5% increase in handling charges was effective March2014. Handling charges (15% rate) are one component of the charges levied on a parcel, the others being basic rate (as per weight of parcel), fuel surcharge (15%) and other surcharges
GD Express - GDX MK Snoopin around
Page 9 of 18
Find CLSA research on Bloomberg, Thomson Reuters, Factset and CapitalIQ - and profit from our evalu@tor proprietary database at clsa.com
depending on service offering. Customer resistance to such price increases is mitigated by GDEX’s dependable service and the fact that courier charges are a small share of the customer’s total operating cost. However, there will continue to be some margin give-back for the Singapore and logistical services operations to help these build volumes (both are still operating at sub-optimal scale); coupled with new capacity coming online and the group looking to build market share further, management expects some modest margin softness over the next 2-3 years as utilisation builds and market share gains are cemented.
Over the longer term, margin will be supported by consolidation of the domestic courier industry – this is the experience in developed markets where the express delivery sector has come to be dominated by 1-2 large companies with superior cost structures and connectivity. GDEX’s diverse customer base also feeds into better pricing power, adding to margin stability.
q Tax break from pioneer status: GD Express Sdn Bhd, the group’s main operating company and wholly-owned subsidiary, obtainedPioneer Certificate from MIDA in Jan 2014, allowing for tax exemption on 70% of GD Express’ statutory income on Integrated Logistics Services-related activities. The exemption is valid for 5 years with effect from Sept 2012 and is extendable for another 5 years upon initial expiry. Should the group’s ambition to go regional become a reality, there may potentially be other tax breaks to be captured eg, from making Malaysia the regional HQ for regional operations.
Figure 18
GDEX: Margin and profit trend
Source: CLSA, Company
q Going regional? GDEX’s current ex-Malaysia regional operations are only in Singapore which generated only RM1.9mn revenue in FY15 (<1% of group total). A conservative approach will be taken towards regional expansion (eg, start off with warehousing before actual deliveries) notwithstanding management having systematically developed system flows, work processes, network and delivery operations to meet international standards. A first
3.6
8.39.9
12.3
19.3
24.3
31.3
2.1
6.07.0
8.8
13.6
23.4
28.3
4.7
10.110.6 10.5
14.215.3
15.9
0
2
4
6
8
10
12
14
16
18
0
5
10
15
20
25
30
35
40
FY09 FY10 FY11 FY12 FY13 FY14 FY15
(RMm) (%)PBT Net Profit PBT Margin (RHS)
GD Express - GDX MK Snoopin around
Page 10 of 18
Find CLSA research on Bloomberg, Thomson Reuters, Factset and CapitalIQ - and profit from our evalu@tor proprietary database at clsa.com
step has been to set up a trade representative office in Jakarta in Dec 2014, with network expansion slated for other parts of Asean to leverage market liberalisation that is targeted to occur in the wake of the AEC (Asean Economic Community) 2015.
While GDEX can transfer its established operating template relatively seamless to the region and enjoy cost savings from centralisation of backroom operations in Malaysia, we note foreign players who raised their presence in Malaysia two years ago when the logistics sector was liberalised have yet to show tangible returns for their efforts. Further, all Asean countries except for Singapore and Malaysia have foreign ownership limits for logistic companies eg, 49% foreign shareholding cap in Indonesia.Management will be adopting a flexible strategy ie, it will speed up efforts in collaboration with other regional or global players (such collaboration may include equity stakes) and, at the same time, be prepared to compete in some segments of the market.
Figure 19
GDEX: Revenue contribution by destination
Singapore Malaysia
Total Overseas Revenue
Overseas Revenue
Local Destination
Local Destination
Overseas Destination
Overseas Destination
(RMm) (RMm) (%) (RMm) (%) (RMm) (%)
FY2012 116.32 1.11 0.95% 111.29 95.68% 3.92 3.37%
FY2013 135.15 1.18 0.87% 129.76 96.01% 4.21 3.12%
Source: CLSA, Company
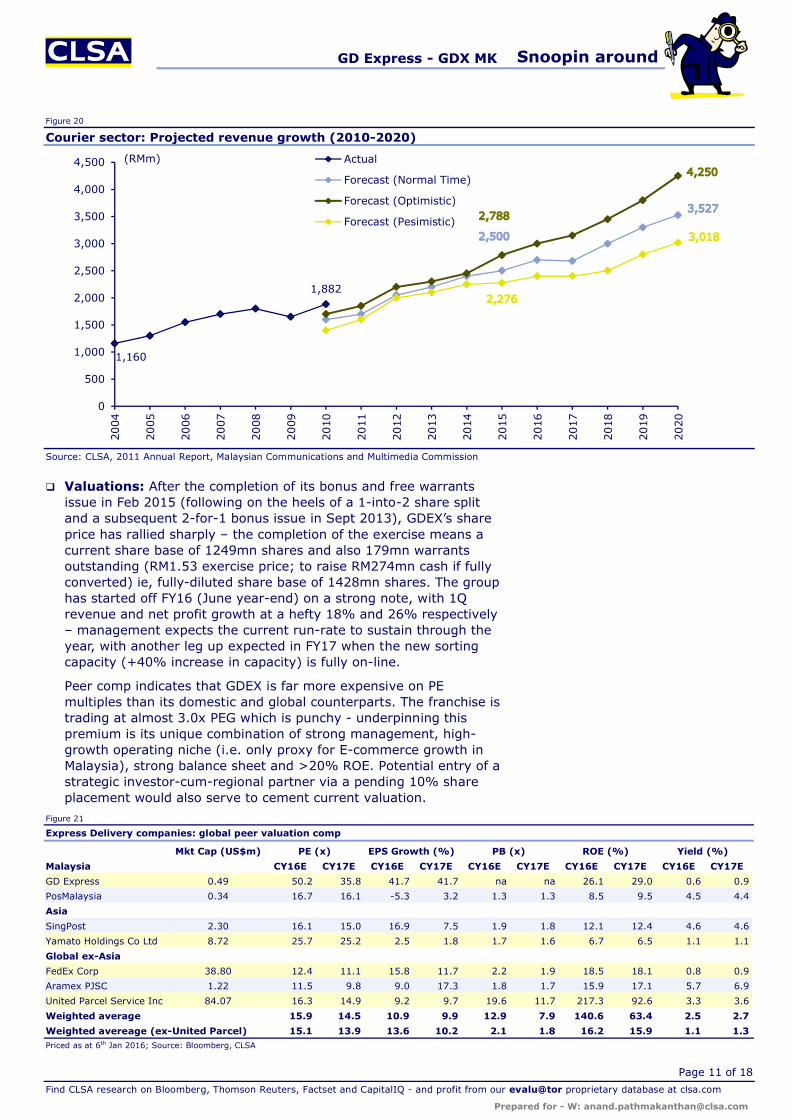
Nonetheless, even without regional traction, domestic opportunities to grow appear ample. Besides continuing to gain market share from struggling domestic rivals, GDEX is also riding on the structural growth story for logistics in Malaysia, particularly the exponential growth in E-commerce home delivery (helped by broadband household penetration rate having reached 66% in March 2013). Based on projections done by the Malaysian Communications and Multimedia Commission (MCMC), courier service industry revenue is expected to grow from RM2bn in 2011, to cRM4bn by 2020, a baseline CAGR of 8%. Coupled with market share gains and the rapid growth in its logistics services, GDEXexpects base-line 20% annual revenue growth going forward, only a modest downshift from the 23% revenue CAGR it has enjoyed over the last 15 years.
Malaysian E-commerce retailers are proliferating, ie, the ranks of relatively-established online retail players like Lazarda, Zalora and Groupon have recently been joined by home-grown GEMFIVE, Korean-born 11street and satellite TV provider Astro. Astro launched its home shopping channel “Astro Go Shop” in early 2015, recently adding a Chinese-language 24-hour edition – GDEX currently handles 100% of Astro’s rapidly growing home shopping deliveries due to its unique ability to handle cash-on-delivery (COD; to enhance security and reliability, GDEX has a profit-sharing scheme for drivers doing the collections) as well as provide warehousing services. For the other E-commerce players, GDEX strives to be a major but not dominant partner regarding last-mile delivery services for mutual risk management.
GD Express - GDX MK Snoopin around
Page 11 of 18
Find CLSA research on Bloomberg, Thomson Reuters, Factset and CapitalIQ - and profit from our evalu@tor proprietary database at clsa.com
Figure 20
Courier sector: Projected revenue growth (2010-2020)
Source: CLSA, 2011 Annual Report, Malaysian Communications and Multimedia Commission
q Valuations: After the completion of its bonus and free warrants issue in Feb 2015 (following on the heels of a 1-into-2 share split and a subsequent 2-for-1 bonus issue in Sept 2013), GDEX’s share price has rallied sharply – the completion of the exercise means a current share base of 1249mn shares and also 179mn warrants outstanding (RM1.53 exercise price; to raise RM274mn cash if fully converted) ie, fully-diluted share base of 1428mn shares. The group has started off FY16 (June year-end) on a strong note, with 1Q revenue and net profit growth at a hefty 18% and 26% respectively – management expects the current run-rate to sustain through the year, with another leg up expected in FY17 when the new sorting capacity (+40% increase in capacity) is fully on-line.
Peer comp indicates that GDEX is far more expensive on PE multiples than its domestic and global counterparts. The franchise is trading at almost 3.0x PEG which is punchy - underpinning this premium is its unique combination of strong management, high-growth operating niche (i.e. only proxy for E-commerce growth in Malaysia), strong balance sheet and >20% ROE. Potential entry of a strategic investor-cum-regional partner via a pending 10% share placement would also serve to cement current valuation.
Figure 21
Express Delivery companies: global peer valuation comp
Mkt Cap (US$m) PE (x) EPS Growth (%) PB (x) ROE (%) Yield (%)
Malaysia CY16E CY17E CY16E CY17E CY16E CY17E CY16E CY17E CY16E CY17E
GD Express 0.49 50.2 35.8 41.7 41.7 na na 26.1 29.0 0.6 0.9
PosMalaysia 0.34 16.7 16.1 -5.3 3.2 1.3 1.3 8.5 9.5 4.5 4.4
Asia
SingPost 2.30 16.1 15.0 16.9 7.5 1.9 1.8 12.1 12.4 4.6 4.6
Yamato Holdings Co Ltd 8.72 25.7 25.2 2.5 1.8 1.7 1.6 6.7 6.5 1.1 1.1
Global ex-Asia
FedEx Corp 38.80 12.4 11.1 15.8 11.7 2.2 1.9 18.5 18.1 0.8 0.9
Aramex PJSC 1.22 11.5 9.8 9.0 17.3 1.8 1.7 15.9 17.1 5.7 6.9
United Parcel Service Inc 84.07 16.3 14.9 9.2 9.7 19.6 11.7 217.3 92.6 3.3 3.6
Weighted average 15.9 14.5 10.9 9.9 12.9 7.9 140.6 63.4 2.5 2.7
Weighted avereage (ex-United Parcel) 15.1 13.9 13.6 10.2 2.1 1.8 16.2 15.9 1.1 1.3Priced as at 6th Jan 2016; Source: Bloomberg, CLSA
1,160
1,882
0
500
1,000
1,500
2,000
2,500
3,000
3,500
4,000
4,500
2004
2005
2006
2007
2008
2009
2010
2011
2012
2013
2014
2015
2016
2017
2018
2019
2020
(RMm) Actual
Forecast (Normal Time)
Forecast (Optimistic)
Forecast (Pesimistic)
GD Express - GDX MK Snoopin around
Page 12 of 18
Find CLSA research on Bloomberg, Thomson Reuters, Factset and CapitalIQ - and profit from our evalu@tor proprietary database at clsa.com
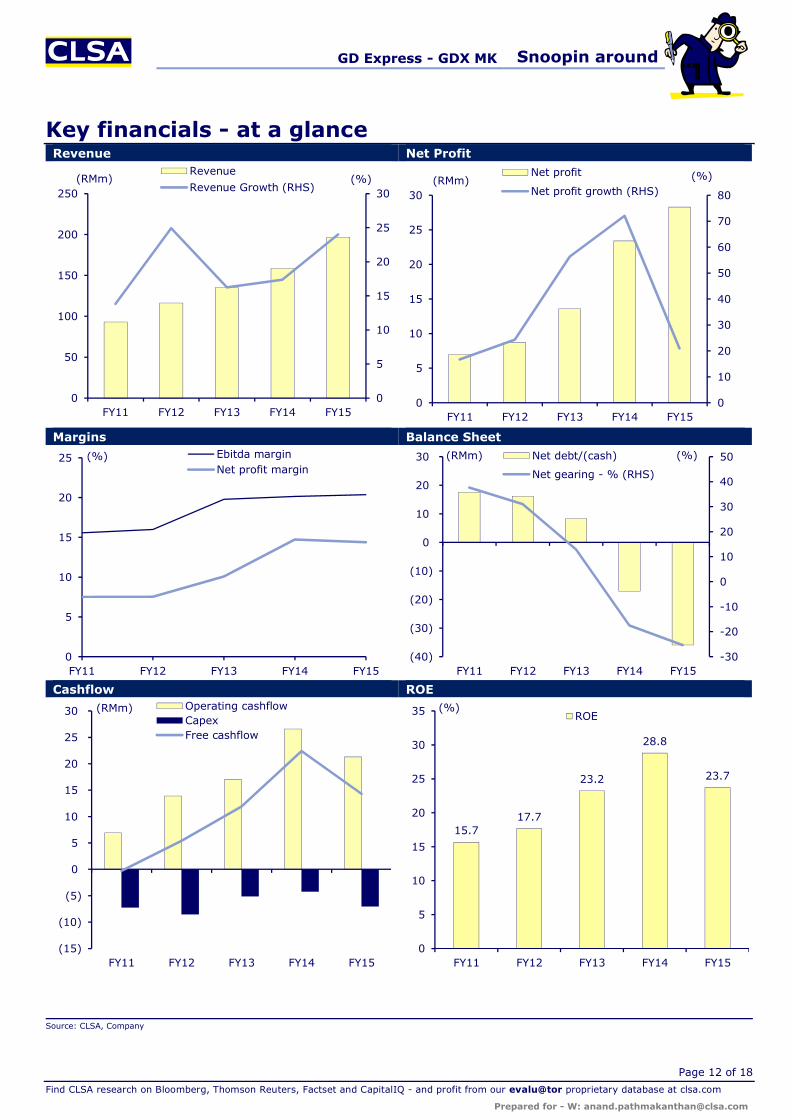
Key financials - at a glanceRevenue Net Profit
Margins Balance Sheet
Cashflow ROE
Source: CLSA, Company
0
5
10
15
20
25
30
0
50
100
150
200
250
FY11 FY12 FY13 FY14 FY15
(RMm) (%)Revenue
Revenue Growth (RHS)
0
10
20
30
40
50
60
70
80
0
5
10
15
20
25
30
FY11 FY12 FY13 FY14 FY15
(RMm) (%)Net profit
Net profit growth (RHS)
0
5
10
15
20
25
FY11 FY12 FY13 FY14 FY15
(%) Ebitda marginNet profit margin
-30
-20
-10
0
10
20
30
40
50
(40)
(30)
(20)
(10)
0
10
20
30
FY11 FY12 FY13 FY14 FY15
(RMm) (%)Net debt/(cash)
Net gearing - % (RHS)
(15)
(10)
(5)
0
5
10
15
20
25
30
FY11 FY12 FY13 FY14 FY15
(RMm) Operating cashflowCapexFree cashflow
15.717.7
23.2
28.8
23.7
0
5
10
15
20
25
30
35
FY11 FY12 FY13 FY14 FY15
(%)ROE
GD Express - GDX MK Snoopin around
Page 13 of 18
Find CLSA research on Bloomberg, Thomson Reuters, Factset and CapitalIQ - and profit from our evalu@tor proprietary database at clsa.com
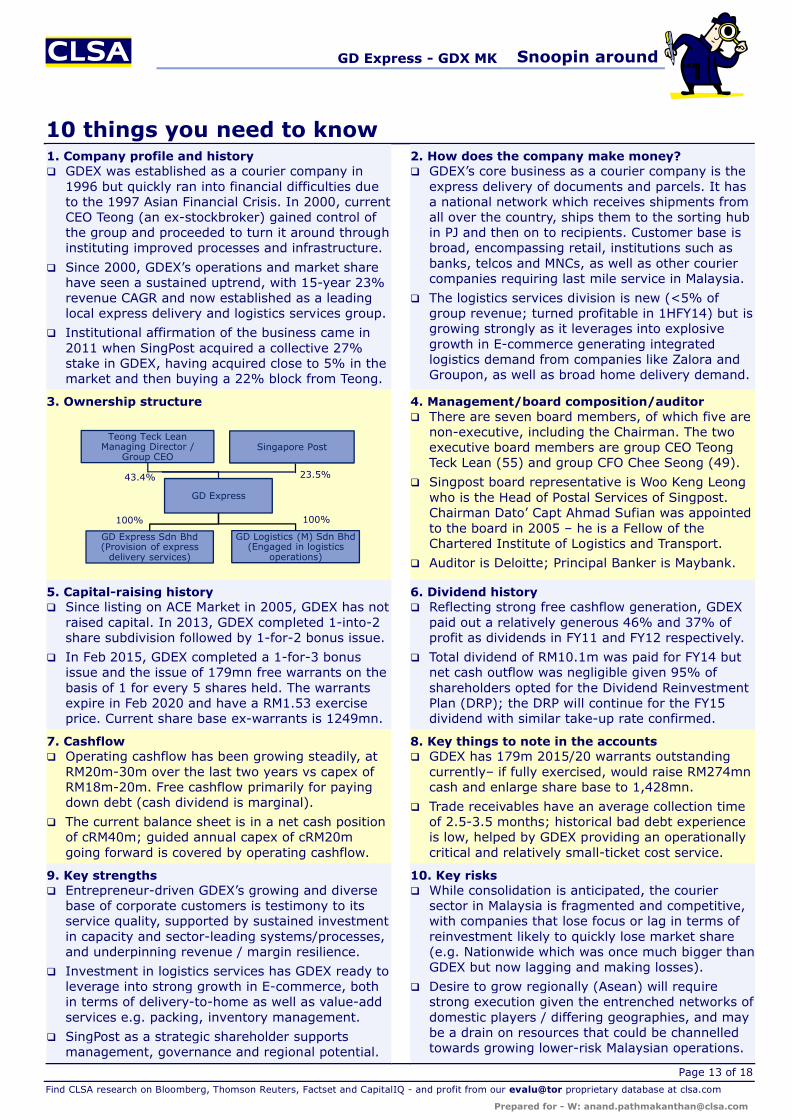
10 things you need to know1. Company profile and history 2. How does the company make money?q GDEX was established as a courier company in
1996 but quickly ran into financial difficulties due to the 1997 Asian Financial Crisis. In 2000, current CEO Teong (an ex-stockbroker) gained control of the group and proceeded to turn it around through instituting improved processes and infrastructure.
q Since 2000, GDEX’s operations and market share have seen a sustained uptrend, with 15-year 23% revenue CAGR and now established as a leading local express delivery and logistics services group.
q Institutional affirmation of the business came in 2011 when SingPost acquired a collective 27% stake in GDEX, having acquired close to 5% in the market and then buying a 22% block from Teong.
q GDEX’s core business as a courier company is the express delivery of documents and parcels. It has a national network which receives shipments from all over the country, ships them to the sorting hub in PJ and then on to recipients. Customer base is broad, encompassing retail, institutions such as banks, telcos and MNCs, as well as other courier companies requiring last mile service in Malaysia.
q The logistics services division is new (<5% of group revenue; turned profitable in 1HFY14) but is growing strongly as it leverages into explosive growth in E-commerce generating integrated logistics demand from companies like Zalora and Groupon, as well as broad home delivery demand.
3. Ownership structure 4. Management/board composition/auditorq There are seven board members, of which five are
non-executive, including the Chairman. The two executive board members are group CEO Teong Teck Lean (55) and group CFO Chee Seong (49).
q Singpost board representative is Woo Keng Leong who is the Head of Postal Services of Singpost. Chairman Dato’ Capt Ahmad Sufian was appointed to the board in 2005 – he is a Fellow of the Chartered Institute of Logistics and Transport.
q Auditor is Deloitte; Principal Banker is Maybank.
5. Capital-raising history 6. Dividend historyq Since listing on ACE Market in 2005, GDEX has not
raised capital. In 2013, GDEX completed 1-into-2 share subdivision followed by 1-for-2 bonus issue.
q In Feb 2015, GDEX completed a 1-for-3 bonus issue and the issue of 179mn free warrants on the basis of 1 for every 5 shares held. The warrants expire in Feb 2020 and have a RM1.53 exercise price. Current share base ex-warrants is 1249mn.
q Reflecting strong free cashflow generation, GDEX paid out a relatively generous 46% and 37% of profit as dividends in FY11 and FY12 respectively.
q Total dividend of RM10.1m was paid for FY14 but net cash outflow was negligible given 95% of shareholders opted for the Dividend Reinvestment Plan (DRP); the DRP will continue for the FY15 dividend with similar take-up rate confirmed.
7. Cashflow 8. Key things to note in the accountsq Operating cashflow has been growing steadily, at
RM20m-30m over the last two years vs capex of RM18m-20m. Free cashflow primarily for paying down debt (cash dividend is marginal).
q The current balance sheet is in a net cash position of cRM40m; guided annual capex of cRM20m going forward is covered by operating cashflow.
q GDEX has 179m 2015/20 warrants outstanding currently– if fully exercised, would raise RM274mn cash and enlarge share base to 1,428mn.
q Trade receivables have an average collection time of 2.5-3.5 months; historical bad debt experience is low, helped by GDEX providing an operationally critical and relatively small-ticket cost service.
9. Key strengths 10. Key risksq Entrepreneur-driven GDEX’s growing and diverse
base of corporate customers is testimony to its service quality, supported by sustained investment in capacity and sector-leading systems/processes, and underpinning revenue / margin resilience.
q Investment in logistics services has GDEX ready to leverage into strong growth in E-commerce, both in terms of delivery-to-home as well as value-add services e.g. packing, inventory management.
q SingPost as a strategic shareholder supports management, governance and regional potential.
q While consolidation is anticipated, the courier sector in Malaysia is fragmented and competitive, with companies that lose focus or lag in terms of reinvestment likely to quickly lose market share (e.g. Nationwide which was once much bigger than GDEX but now lagging and making losses).
q Desire to grow regionally (Asean) will require strong execution given the entrenched networks of domestic players / differing geographies, and may be a drain on resources that could be channelled towards growing lower-risk Malaysian operations.
Singapore PostTeong Teck Lean
Managing Director / Group CEO
GD Express
GD Logistics (M) Sdn Bhd (Engaged in logistics
operations)
GD Express Sdn Bhd (Provision of express
delivery services)
43.4% 23.5%
100% 100%
GD Express - GDX MK Snoopin around
Page 14 of 18
Find CLSA research on Bloomberg, Thomson Reuters, Factset and CapitalIQ - and profit from our evalu@tor proprietary database at clsa.com
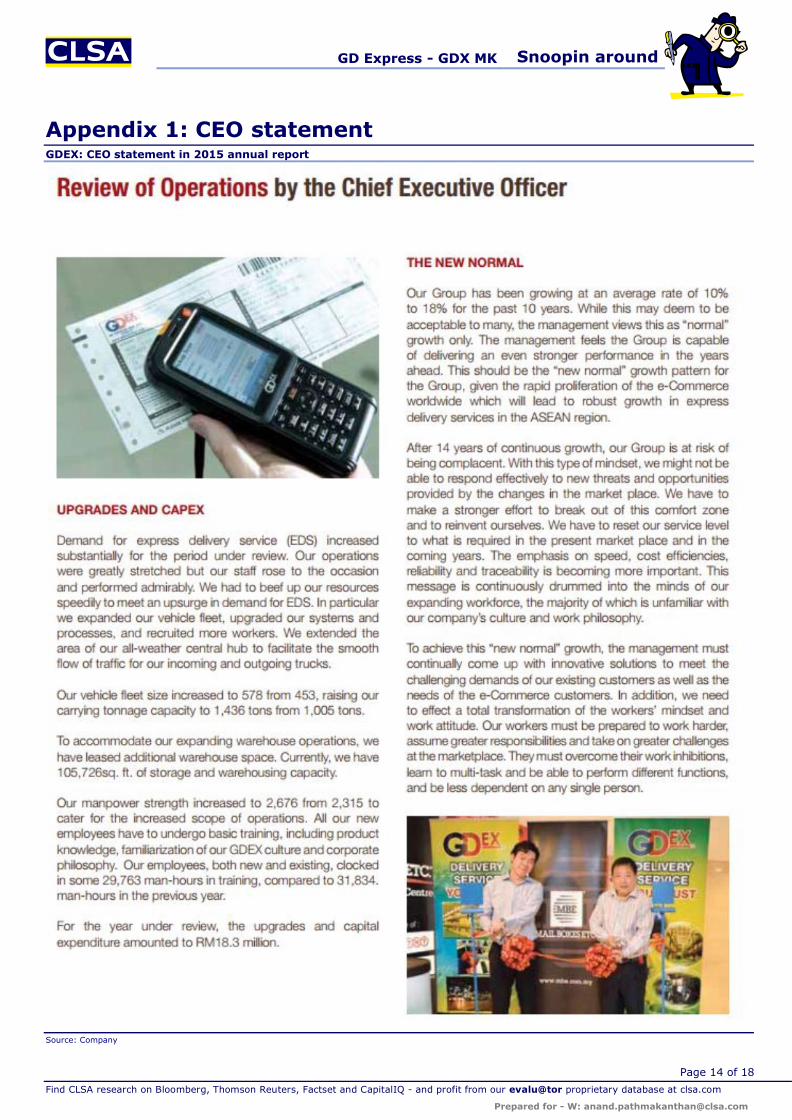
Appendix 1: CEO statementGDEX: CEO statement in 2015 annual report
Source: Company
GD Express - GDX MK Snoopin around
Page 15 of 18
Find CLSA research on Bloomberg, Thomson Reuters, Factset and CapitalIQ - and profit from our evalu@tor proprietary database at clsa.com
Companies mentionedGD Express (N-R)Aramex (N-R)Astro (N-R)Canon (7751 JP - ¥3,448 - BUY)¹Digi (DIGI MK - RM5.20 - BUY)¹Estee Lauder (EL US - US$85.09 - OUTPERFORM)²Fedex (N-R)GD Express (N-R)HP (HPQ US - US$11.29 - UNDERPERFORM)²Maxis (MAXIS MK - RM6.67 - UNDERPERFORM)¹Maybank (MAY MK - RM8.30 - OUTPERFORM)¹Panasonic (6752 JP - ¥1,170 - BUY)¹Pos Malaysia (N-R)Prudential (N-R)Samsung C&T (N-R)SingPost (SPOST SP - S$1.51 - BUY)¹Sony (6758 JP - ¥2,796 - BUY)¹Tokio Marine (N-R)UPS (N-R)Yamato (9064 JP - ¥2,420 - SELL)¹
¹ Covered by CLSA; ² Covered by CLSA Americas
Analyst certificationThe analyst(s) of this report hereby certify that the views expressed in this research report accurately reflect my/our own personal views about the securities and/or the issuers and that no part of my/our compensation was, is, or will be directly or indirectly related to the specific recommendation or views contained in this research report.
Important disclosuresThe policy of CLSA (which for the purpose of this
disclosure includes subsidiaries of CLSA B.V. and CLSA Americas, LLC ("CLSA Americas")), and Credit Agricole Securities (Taiwan) Company Limited (“CA Taiwan”) is to only publish research that is impartial, independent, clear, fair, and not misleading. Analysts may not receive compensation from the companies they cover. Regulations or market practice of some jurisdictions/markets prescribe certain disclosures to be made for certain actual, potential or perceived conflicts of interests relating to a research report as below. This research disclosure should be read in conjunction with the research disclaimer as set out at www.clsa.com/disclaimer.html and the applicable regulation of the concerned market where the analyst isstationed and hence subject to. This research disclosure is for your information only and does not constitute any recommendation, representation or warranty. Absence of a discloseable position should not be taken as endorsement on the validity or quality of the research report or recommendation.
To maintain the independence and integrity of CLSA’s research, our Corporate Finance, Sales Trading and Research business lines are distinct from one another. This means that CLSA’s Research department is not part of and
does not report to CLSA Corporate Finance (or “investment banking”) department or CLSA’s Sales and Trading business. Accordingly, neither the Corporate Finance nor the Sales and Trading department supervises or controls the activities of CLSA’s research analysts. CLSA’s research analysts report to the management of the Research department, who in turn report to CLSA’s senior management.
CLSA has put in place a number of internal controls designed to manage conflicts of interest that may arise as a result of CLSA engaging in Corporate Finance, Sales and Trading and Research activities. Some examples of these controls include: the use of information barriers and other information controls designed to ensure that confidential information is only shared on a “need to know” basis and in compliance with CLSA’s Chinese Wall policies and procedures; measures designed to ensure that interactions that may occur among CLSA’s Research personnel, Corporate Finance and Sales and Trading personnel, CLSA’s financial product issuers and CLSA’s research analysts do not compromise the integrity and independence of CLSA’s research.
Neither analysts nor their household
GD Express - GDX MK Snoopin around
Page 16 of 18
Find CLSA research on Bloomberg, Thomson Reuters, Factset and CapitalIQ - and profit from our evalu@tor proprietary database at clsa.com
members/associates/may have a financial interest in, or be an officer, director or advisory board member of companies covered by the analyst unless disclosed herein. In circumstances where an analyst has a pre-existing holding in any securities under coverage, those holdings are grandfathered and the analyst is prohibited from trading such securities.
Unless specified otherwise, CLSA/CLSA Americas/CA Taiwan did not receive investment banking/non-investment banking income from, and did not manage/co-manage a public offering for, the listed company during the past 12 months, and it does not expect to receive investment banking compensation from the listed company within the coming three months. Unless mentioned otherwise, CLSA/CLSA Americas/CA Taiwan does not own a material discloseable position, and does not make a market, in the securities.
As analyst(s) of this report, I/we hereby certify that the views expressed in this research report accurately reflect my/our own personal views about the securities and/or the issuers and that no part of my/our compensation was, is, or will be directly or indirectly related to the specific recommendation or views contained in this report or to any investment banking relationship with the subject company covered in this report (for the past one year) or otherwise any other relationship with such company which leads to receipt of fees from the company except in ordinary course of business of the company. The analyst/s also state/s and confirm/s that he/she/they has/have not been placed under any undue influence, intervention or pressure by any person/s in compiling this research report. In addition, the analysts included herein attest that they were not in possession of any material, nonpublic information regarding the subject company at the time of publication of the report. Save from the disclosure below (if any), the analyst(s) is/are not aware of any material conflict of interest.
Key to CLSA/CLSA Americas/CA Taiwan investment rankings: BUY: Total stock return (including dividends) expected to exceed 20%; O-PF: Total expected return below 20% but exceeding market return; U-PF: Total expected return positive but below market return; SELL: Total return expected to be negative. For relative performance, we benchmark the 12-month total forecast return (including dividends) for the stock against the 12-month forecast return (including dividends) for the market on which the stock trades.
In the case of US stocks, the recommendation is relative to the expected return for the S&P500 of 10%. Exceptions may be made depending upon prevailing market conditions. We define as “Double Baggers” stocks we expect to yield 100% or more (including dividends) within three years at the time the stocks are introduced to our “Double Bagger” list. "High Conviction" Ideas are not necessarily stocks with the most upside/downside, but those where the Research Head/Strategist believes there is the highest likelihood of positive/negative returns. The
list for each market is monitored weekly.
Overall rating distribution for CLSA/CLSA Americas only /CA Taiwan only Universe:
Overall rating distribution : Buy / Outperform - CLSA: 64.48%; CLSA Americas only: 61.15%; CA Taiwan only: 63.49%, Underperform / Sell - CLSA: 35.37%; CLSA Americas only: 38.85%; CA Taiwan only: 36.51%, Restricted - CLSA: 0.00%; CLSA Americas only: 0.00%; CA Taiwan only: 0.00%. Data as of 30 September 2015.
Investment banking clients as a % of rating category: Buy / Outperform - CLSA: 3.16%; CLSA Americas only: 0.63%; CA Taiwan only: 0.00%, Underperform / Sell -CLSA: 1.71%; CLSA Americas only: 0.00%; CA Taiwan only: 0.00%, Restricted - CLSA: 0.00%; CLSA Americas only: 0.00%; CA Taiwan only: 0.00% . Data for 12-month period ending 30 September 2015.
There are no numbers for Hold/Neutral as CLSA/CLSA Americas/CA Taiwan do not have such investment rankings.
For a history of the recommendations and price targets for companies mentioned in this report, as well as company specific disclosures, please write to: (a) CLSA Americas, Compliance Department, 1301 Avenue of the Americas, 15th Floor, New York, New York 10019-6022; (b) CLSA, Group Compliance, 18/F, One Pacific Place, 88 Queensway, Hong Kong and/or; (c) CA Taiwan Compliance (27/F, 95, Section 2 Dun Hua South Road, Taipei 10682, Taiwan, telephone (886) 2 2326 8188). © 2016 CLSA Limited, CLSA Americas, and/or CA Taiwan.
© 2016 CLSA Limited, CLSA Americas, LLC (“CLSA Americas”) and/or Credit Agricole Securities Taiwan Co., Ltd. (“CA Taiwan”)
This publication/communication is subject to and incorporates the terms and conditions of use set out on the www.clsa.com/disclaimer.html. Neither the publication/communication nor any portion hereof may be reprinted, sold, resold, copied, reproduced, distributed, redistributed, published, republished, displayed, posted or transmitted in any form or media or by any means without the written consent of CLSA, CLSA Americas and/or CA Taiwan.
CLSA, CLSA Americas and CA Taiwan have produced this publication/communication for private circulation to professional, institutional and/or wholesale clients only. This publication/communication may not be distributed or redistributed to retail investors. The information, opinions and estimates herein are not directed at, or intended for distribution to or use by, any person or entity in any jurisdiction where doing so would be contrary to law or regulation or which would subject CLSA, CLSA Americas and/or CA Taiwan to any additional registration or licensing requirement within such jurisdiction.
GD Express - GDX MK Snoopin around
Page 17 of 18
Find CLSA research on Bloomberg, Thomson Reuters, Factset and CapitalIQ - and profit from our evalu@tor proprietary database at clsa.com
The information and statistical data herein have been obtained from sources we believe to be reliable. Such information has not been independently verified and we make no representation or warranty as to its accuracy, completeness or correctness. Any opinions or estimates herein reflect the judgment of CLSA, CLSA Americas and/or CA Taiwan at the date of this publication/communication and are subject to change at any time without notice. Where any part of the information, opinions or estimates contained herein reflects the views and opinions of a sales person or a non-analyst, such views and opinions may not correspond to the published view of CLSA, CLSA Americas and/or CA Taiwan. This is not a solicitation or any offer to buy or sell. This publication/communication is for information purposes only and does not constitute any recommendation, representation, warranty or guarantee of performance. Any price target given in the report may be projected from one or more valuation models and hence any price target may be subject to the inherent risk of the selected model as well as other external risk factors. This is not intended to provide professional, investment or any other type of advice or recommendation and does not take into account the particular investment objectives, financial situation or needs of individual recipients. Before acting on any information in this publication/communication, you should consider whether it is suitable for your particular circumstances and, if appropriate, seek professional advice, including tax advice. CLSA, CLSA Americas and/or CA Taiwan do/does not accept any responsibility and cannot be held liable for any person’s use of or reliance on the information and opinions contained herein.
To the extent permitted by applicable securities laws and regulations, CLSA, CLSA Americas and/or CA Taiwan accept(s) no liability whatsoever for any direct or consequential loss arising from the use of this publication/communication or its contents. Where the publication does not contain ratings, the material should not be construed as research but is offered as factual commentary. It is not intended to, nor should it be used to, form an investment opinion about the non-rated companies.
Subject to any applicable laws and regulations at any given time, CLSA, CLSA Americas, CA Taiwan, their respective affiliates or companies or individuals connected with CLSA/CLSA Americas/CA Taiwan may have used the information contained herein before publication and may have positions in, may from time to time purchase or sell or have a material interest in any of the securities mentioned or related securities, or may currently or in future have or have had a business or financial relationship with, or may provide or have provided investment banking, capital markets and/or other services to, the entities referred to herein, their advisors and/or any other connected parties. As a result, investors should
be aware that CLSA, CLSA Americas, CA Taiwan and/or their respective affiliates or companies or such individuals may have one or more conflicts of interest. Regulations or market practice of some jurisdictions/markets prescribe certain disclosures to be made for certain actual, potential or perceived conflicts of interests relating to research reports. Details of the disclosable interest can be found in certain reports as required by the relevant rules and regulation and the full details are available at http://www.clsa.com/member/research_disclosures/. Disclosures therein include the position of CLSA, CLSA Americas and CA Taiwan only. Unless specified otherwise, CLSA did not receive any compensation or other benefits from the subject company covered in this research report.
If investors have any difficulty accessing this website, please contact [email protected] on +852 2600 8111. If you require disclosure information on previous dates, please contact [email protected].
This publication/communication is distributed for and on behalf of CLSA Limited (for research compiled by non-US and non-Taiwan analyst(s)), CLSA Americas (for research compiled by US analyst(s)) and/or CA Taiwan (for research compiled by Taiwan analyst(s)) in Australia by CLSA Australia Pty Ltd; in Hong Kong by CLSA Limited; in India by CLSA India Private Limited (formerly CLSA India Limited) (Address: 8/F, Dalamal House, Nariman Point, Mumbai 400021. Tel No: +91-22- 66505050. Fax No: +91-22-22840271; CIN: U67120MH1994PLC083118; SEBI Registration No: INZ000001735); in Indonesia by PT CLSA Indonesia; in Japan by CLSA Securities Japan Co., Ltd; in Korea by CLSA Securities Korea Ltd; in Malaysia by CLSA Securities Malaysia Sdn Bhd; in the Philippines by CLSA Philippines Inc (a member of Philippine Stock Exchange and Securities Investors Protection Fund); in Thailand by CLSA Securities (Thailand) Limited; in Taiwan by CA Taiwan; in Singapore by CLSA Singapore Pte Ltd and in United Kingdom by CLSA (UK).
India: CLSA India Private Limited, incorporated in November 1994 provides equity brokerage services (SEBI Registration No: INZ000001735), research services (SEBI Registration No: INH000001113) and merchant banking services (SEBI Registration No.INM000010619) to global institutional investors, pension funds and corporates. CLSA and its associates may have debt holdings in the subject company. Further, CLSA and its associates, in the past 12 months, may have received compensation for non-investment banking securities and/or non-securities related services from the subject company. For further details of “associates” of CLSA India please contact [email protected].
United States of America: Where any section of the research is compiled by US analyst(s), it is distributed by CLSA Americas. Where any section is compiled by non-US analyst(s), it is distributed into the United States by CLSA solely to persons who qualify as "Major US Institutional
GD Express - GDX MK Snoopin around
Page 18 of 18
Find CLSA research on Bloomberg, Thomson Reuters, Factset and CapitalIQ - and profit from our evalu@tor proprietary database at clsa.com
Investors" as defined in Rule 15a-6 under the Securities and Exchange Act of 1934 and who deal with CLSA Americas. However, the delivery of this research report to any person in the United States shall not be deemed a recommendation to effect any transactions in the securities discussed herein or an endorsement of any opinion expressed herein. Any recipient of this research in the United States wishing to effect a transaction in any security mentioned herein should do so by contacting CLSA Americas.
Canada: The delivery of this research report to any person in Canada shall not be deemed a recommendation to effect any transactions in the securities discussed herein or an endorsement of any opinion expressed herein. Any recipient of this research in Canada wishing to effect a transaction in any security mentioned herein should do so by contacting CLSA Americas.
United Kingdom: In the United Kingdom, this research is a marketing communication. It has not been prepared in accordance with the legal requirements designed to promote the independence of investment research, and is not subject to any prohibition on dealing ahead of the dissemination of investment research. The research is disseminated in the EU by CLSA (UK), which is authorized and regulated by the Financial Conduct Authority. This document is directed at persons having professional experience in matters relating to investments as defined in Article 19 of the FSMA 2000 (Financial Promotion) Order 2005. Any investment activity to which it relates is only available to such persons. If you do not have professional experience in matters relating to investments you should not rely on this document. Where the research material is compiled by the UK analyst(s), it is produced and disseminated by CLSA (UK). For the purposes of the Financial Conduct Rules this research is prepared and intended as substantive research material.
Singapore: In Singapore, research is issued and/or distributed by CLSA Singapore Pte Ltd (Company Registration No.: 198703750W), a Capital Markets Services license holder to deal in securities and an exempt financial adviser, solely to persons who qualify as institutional investor, accredited investor or expert
investor, as defined in Section 4A(1) of the Securities and Futures Act (Cap 289). Pursuant to Regulations 33, 34, 35 and 36 of the Financial Advisers (Amendment) Regulations 2005 of the Financial Advisers Act (Cap 110) with regards to an accredited investor, institutional investor, expert investor or overseas investor, Sections 25, 27 and 36 of the Financial Adviser Act (Cap 110) shall not apply to CLSA Singapore Pte Ltd. Please contact CLSA Singapore Pte Ltd (telephone No.: +65 6416 7888) in connection with queries on the report. [MCI (P) 013/11/2015]
The analysts/contributors to this publication/communication may be employed by any relevant CLSA entity, CA Taiwan or a subsidiary of CITIC Securities Company Limited which is different from the entity that distributes the publication/communication in the respective jurisdictions.
MSCI-sourced information is the exclusive property of Morgan Stanley Capital International Inc (MSCI). Without prior written permission of MSCI, this information and any other MSCI intellectual property may not be reproduced, redisseminated or used to create any financial products, including any indices. This information is provided on an "as is" basis. The user assumes the entire risk of any use made of this information. MSCI, its affiliates and any third party involved in, or related to, computing or compiling the information hereby expressly disclaim all warranties of originality, accuracy, completeness, merchantability or fitness for a particular purpose with respect to any of this information. Without limiting any of the foregoing, in no event shall MSCI, any of its affiliates or any third party involved in, or related to computing or compiling the information have any liability for any damages of any kind. MSCI, Morgan Stanley Capital International and the MSCI indexes are service marks of MSCI and its affiliates. The Global Industry Classification Standard (GICS) was developed by and is the exclusive property of MSCI and Standard & Poor's. GICS is a service mark of MSCI and S&P and has been licensed for use by CLSA.
EVA® is a registered trademark of Stern, Stewart & Co. Unless otherwise noted in the source, "CL" in charts and tables stands for CLSA/CLSA Americas estimates and “CT” stands for CA Taiwan estimates.
Research subscriptionsTo change your report distribution requirements, please contact your CLSA sales representative or email us at [email protected] can also fine-tune your Research Alert email preferences at https://www.clsa.com/member/tools/email_alert/.