Embed Size (px)
Citation preview
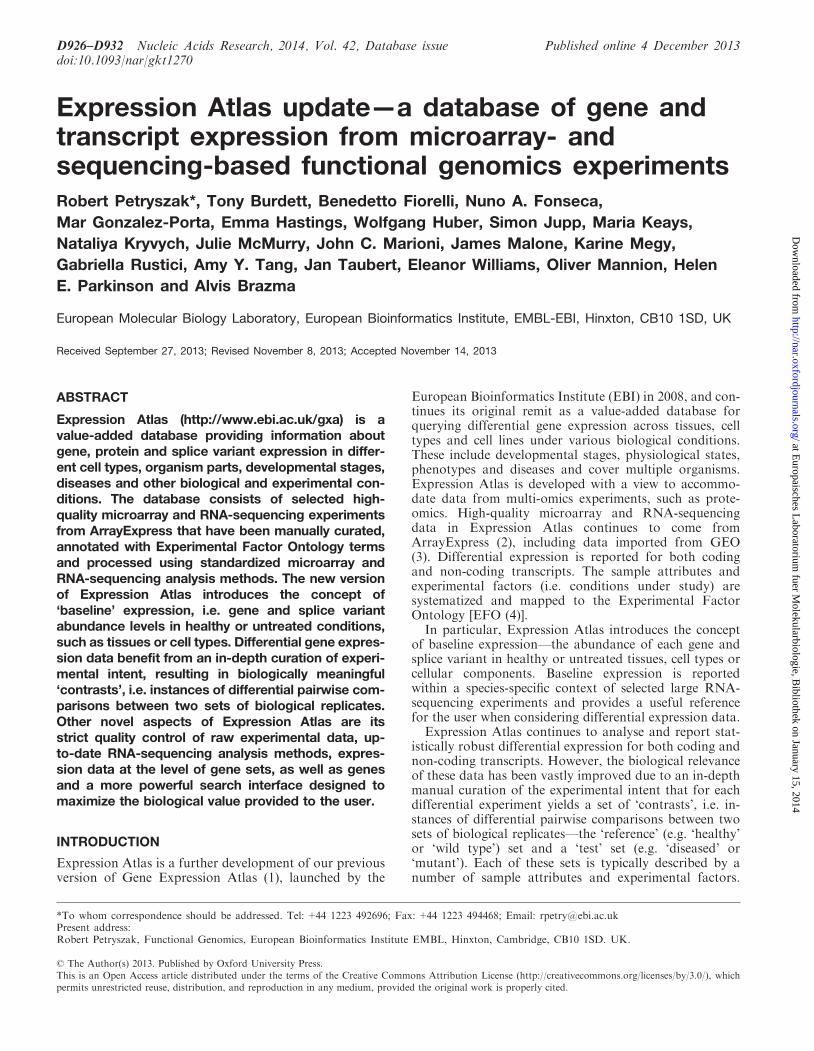
Expression Atlas updatemdasha database of gene andtranscript expression from microarray- andsequencing-based functional genomics experimentsRobert Petryszak Tony Burdett Benedetto Fiorelli Nuno A Fonseca
Mar Gonzalez-Porta Emma Hastings Wolfgang Huber Simon Jupp Maria Keays
Nataliya Kryvych Julie McMurry John C Marioni James Malone Karine Megy
Gabriella Rustici Amy Y Tang Jan Taubert Eleanor Williams Oliver Mannion Helen
E Parkinson and Alvis Brazma
European Molecular Biology Laboratory European Bioinformatics Institute EMBL-EBI Hinxton CB10 1SD UK
Received September 27 2013 Revised November 8 2013 Accepted November 14 2013
ABSTRACT
Expression Atlas (httpwwwebiacukgxa) is avalue-added database providing information aboutgene protein and splice variant expression in differ-ent cell types organism parts developmental stagesdiseases and other biological and experimental con-ditions The database consists of selected high-quality microarray and RNA-sequencing experimentsfrom ArrayExpress that have been manually curatedannotated with Experimental Factor Ontology termsand processed using standardized microarray andRNA-sequencing analysis methods The new versionof Expression Atlas introduces the concept oflsquobaselinersquo expression ie gene and splice variantabundance levels in healthy or untreated conditionssuch as tissues or cell types Differential gene expres-sion data benefit from an in-depth curation of experi-mental intent resulting in biologically meaningfullsquocontrastsrsquo ie instances of differential pairwise com-parisons between two sets of biological replicatesOther novel aspects of Expression Atlas are itsstrict quality control of raw experimental data up-to-date RNA-sequencing analysis methods expres-sion data at the level of gene sets as well as genesand a more powerful search interface designed tomaximize the biological value provided to the user
INTRODUCTION
Expression Atlas is a further development of our previousversion of Gene Expression Atlas (1) launched by the
European Bioinformatics Institute (EBI) in 2008 and con-tinues its original remit as a value-added database forquerying differential gene expression across tissues celltypes and cell lines under various biological conditionsThese include developmental stages physiological statesphenotypes and diseases and cover multiple organismsExpression Atlas is developed with a view to accommo-date data from multi-omics experiments such as prote-omics High-quality microarray and RNA-sequencingdata in Expression Atlas continues to come fromArrayExpress (2) including data imported from GEO(3) Differential expression is reported for both codingand non-coding transcripts The sample attributes andexperimental factors (ie conditions under study) aresystematized and mapped to the Experimental FactorOntology [EFO (4)]
In particular Expression Atlas introduces the conceptof baseline expressionmdashthe abundance of each gene andsplice variant in healthy or untreated tissues cell types orcellular components Baseline expression is reportedwithin a species-specific context of selected large RNA-sequencing experiments and provides a useful referencefor the user when considering differential expression data
Expression Atlas continues to analyse and report stat-istically robust differential expression for both coding andnon-coding transcripts However the biological relevanceof these data has been vastly improved due to an in-depthmanual curation of the experimental intent that for eachdifferential experiment yields a set of lsquocontrastsrsquo ie in-stances of differential pairwise comparisons between twosets of biological replicatesmdashthe lsquoreferencersquo (eg lsquohealthyrsquoor lsquowild typersquo) set and a lsquotestrsquo set (eg lsquodiseasedrsquo orlsquomutantrsquo) Each of these sets is typically described by anumber of sample attributes and experimental factors
To whom correspondence should be addressed Tel +44 1223 492696 Fax +44 1223 494468 Email rpetryebiacukPresent addressRobert Petryszak Functional Genomics European Bioinformatics Institute EMBL Hinxton Cambridge CB10 1SD UK
D926ndashD932 Nucleic Acids Research 2014 Vol 42 Database issue Published online 4 December 2013doi101093nargkt1270
The Author(s) 2013 Published by Oxford University PressThis is an Open Access article distributed under the terms of the Creative Commons Attribution License (httpcreativecommonsorglicensesby30) whichpermits unrestricted reuse distribution and reproduction in any medium provided the original work is properly cited
at Europaisches L
aboratorium fuer M
olekularbiologie Bibliothek on January 15 2014
httpnaroxfordjournalsorgD
ownloaded from
For example all biological replicates treated with a testcompound may be compared with untreated samplesStatistical analysis is then performed providing P-valuesand (for microarray only) t-statistics linking each gene todifferential contrasts in each experiment
Another novel aspect of Expression Atlas is its focus onquality control of raw experimental data and of experi-mental design A minimum acceptable number of biolo-gical sample replicates (three) is also enforced to ensuresufficient statistical power to detect differential expressionBefore submission into analysis pipelines all experimentalraw data undergo quality control In the case of RNA-sequencing experiments poor quality reads and thoseoriginating from contamination are excluded fromfurther analysis Outlier arrays in microarray experimentsare also removed before manual contrast identificationand statistical analysis
The focus on the quality of raw data and experimentaldesign has led to exclusion of low-quality experimentsThe manual curation of contrasts for all eligible experi-ments is also on-going leading to a temporary reductionin the number of experiments in Expression Atlas
Support of reproducible analysis is provided for eachexperiment by listing analysis methods and versions usedfor processing its raw data offering links to source codewhere possible as well as showing the version of Ensemblgenome reference used for mapping (for RNA-sequencingexperiments) and the version of miRBase (5) release fromwhich probe-set to microRNA mappings was taken formicroRNA microarray experiments The user shouldthus be able to reproduce the results presented inExpression Atlas by analysing the raw experimentaldata using the methods listed for that experiment
Expression Atlas search interface allows for queryinggene splice variant or protein attributes (includingorganism) at the level of individual genes or whole genesets The user can also search for sample attributes andexperimental factors Both baseline and differential com-ponents of Expression Atlas are queried by default Theexperiments returned are those in which the queriedsample attributes match either the studied healthy or un-treated biological conditions eg tissues or cell types(baseline expression) or match either a lsquotestrsquo or a lsquorefer-encersquo side of a differential contrast (differential expres-sion) Finally the set of queried experiments can berestricted by providing a list of accessions keywords orthe species of samples studied in them
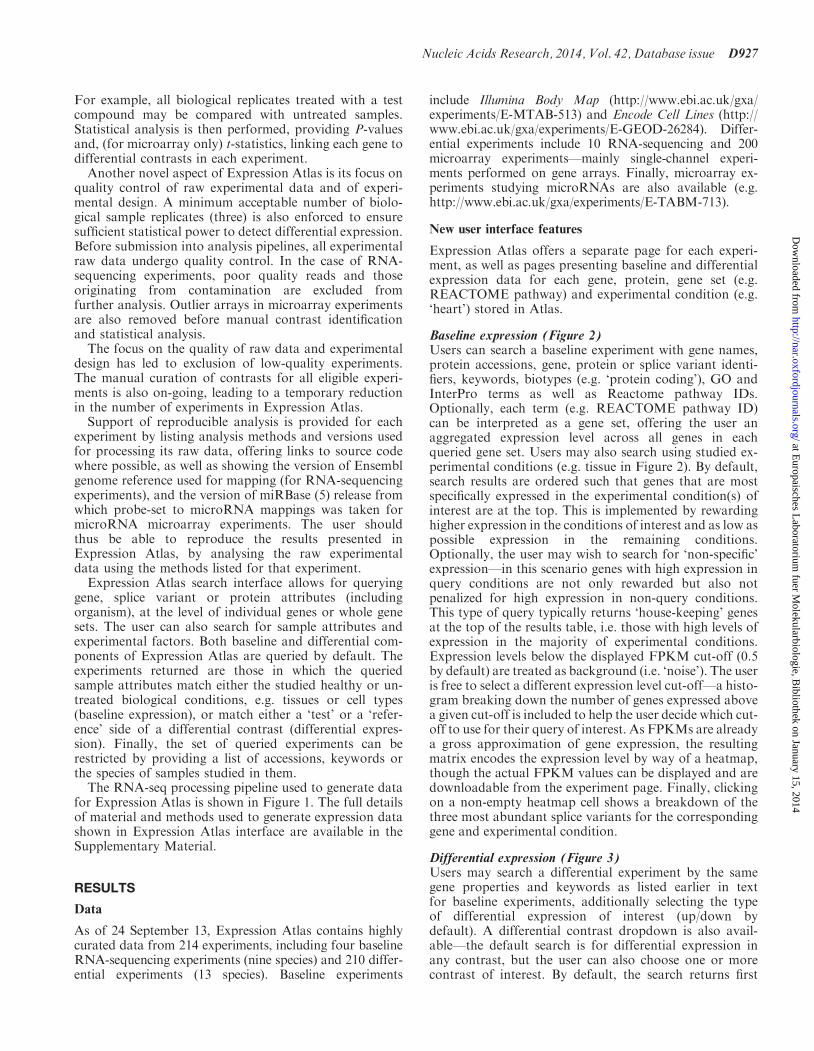
The RNA-seq processing pipeline used to generate datafor Expression Atlas is shown in Figure 1 The full detailsof material and methods used to generate expression datashown in Expression Atlas interface are available in theSupplementary Material
RESULTS
Data
As of 24 September 13 Expression Atlas contains highlycurated data from 214 experiments including four baselineRNA-sequencing experiments (nine species) and 210 differ-ential experiments (13 species) Baseline experiments
include Illumina Body Map (httpwwwebiacukgxaexperimentsE-MTAB-513) and Encode Cell Lines (httpwwwebiacukgxaexperimentsE-GEOD-26284) Differ-ential experiments include 10 RNA-sequencing and 200microarray experimentsmdashmainly single-channel experi-ments performed on gene arrays Finally microarray ex-periments studying microRNAs are also available (eghttpwwwebiacukgxaexperimentsE-TABM-713)
New user interface features
Expression Atlas offers a separate page for each experi-ment as well as pages presenting baseline and differentialexpression data for each gene protein gene set (egREACTOME pathway) and experimental condition (eglsquoheartrsquo) stored in Atlas
Baseline expression (Figure 2)Users can search a baseline experiment with gene namesprotein accessions gene protein or splice variant identi-fiers keywords biotypes (eg lsquoprotein codingrsquo) GO andInterPro terms as well as Reactome pathway IDsOptionally each term (eg REACTOME pathway ID)can be interpreted as a gene set offering the user anaggregated expression level across all genes in eachqueried gene set Users may also search using studied ex-perimental conditions (eg tissue in Figure 2) By defaultsearch results are ordered such that genes that are mostspecifically expressed in the experimental condition(s) ofinterest are at the top This is implemented by rewardinghigher expression in the conditions of interest and as low aspossible expression in the remaining conditionsOptionally the user may wish to search for lsquonon-specificrsquoexpressionmdashin this scenario genes with high expression inquery conditions are not only rewarded but also notpenalized for high expression in non-query conditionsThis type of query typically returns lsquohouse-keepingrsquo genesat the top of the results table ie those with high levels ofexpression in the majority of experimental conditionsExpression levels below the displayed FPKM cut-off (05by default) are treated as background (ie lsquonoisersquo) The useris free to select a different expression level cut-offmdasha histo-gram breaking down the number of genes expressed abovea given cut-off is included to help the user decide which cut-off to use for their query of interest As FPKMs are alreadya gross approximation of gene expression the resultingmatrix encodes the expression level by way of a heatmapthough the actual FPKM values can be displayed and aredownloadable from the experiment page Finally clickingon a non-empty heatmap cell shows a breakdown of thethree most abundant splice variants for the correspondinggene and experimental condition
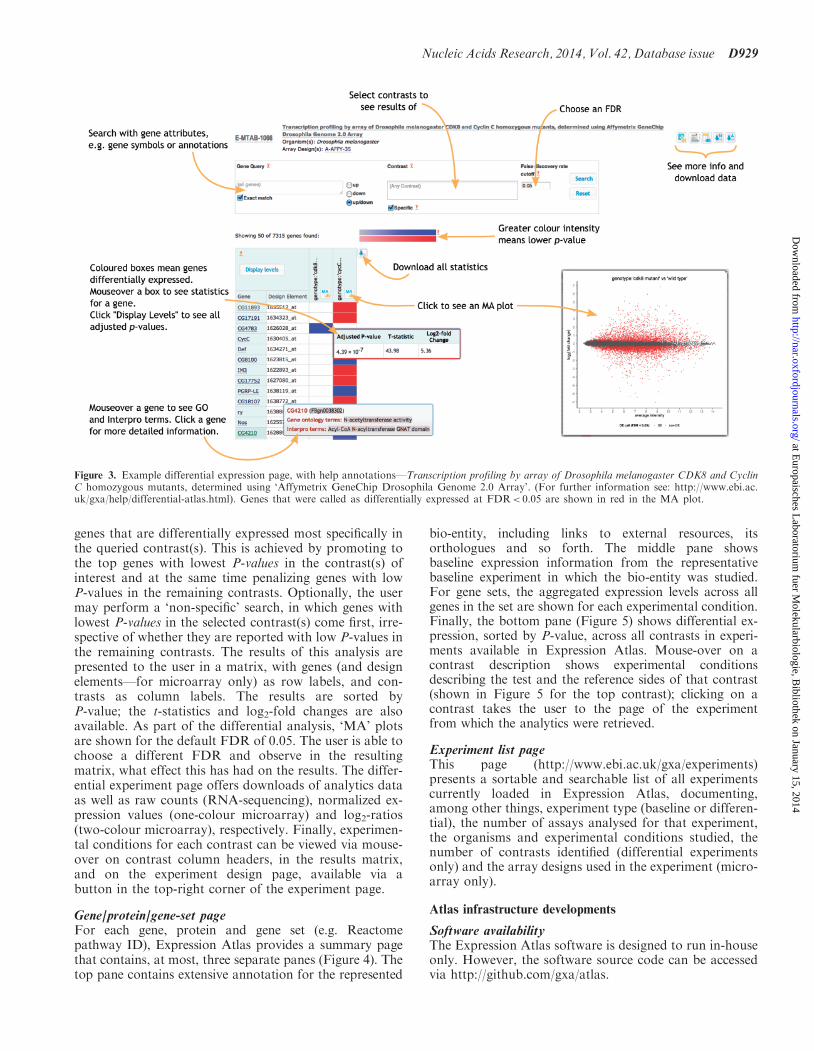
Differential expression (Figure 3)Users may search a differential experiment by the samegene properties and keywords as listed earlier in textfor baseline experiments additionally selecting the typeof differential expression of interest (updown bydefault) A differential contrast dropdown is also avail-ablemdashthe default search is for differential expression inany contrast but the user can also choose one or morecontrast of interest By default the search returns first
Nucleic Acids Research 2014 Vol 42 Database issue D927
at Europaisches L
aboratorium fuer M
olekularbiologie Bibliothek on January 15 2014
httpnaroxfordjournalsorgD
ownloaded from
Figure 1 The RNA-seq processing pipeline used to generate data for Expression Atlas The experimental metadata is retrieved from ArrayExpressThe raw FASTQ files retrieved from European Nucleotide Archive undergo a quality control procedure via FASTQC package to remove low-quality reads and uncalled bases Subsequently contaminated reads (eg bacterial in the cases of vertebrate samples) are removed TopHat 1 is usedfor mapping the reads to the reference genome Cufflinks 1 quantifies baseline expression for genes and transcripts and HTseq quantifies expressionused for subsequent differential expression analysis with DESeq The final (summarized) baseline expression count for a gene in a condition is amedian across first technical replicates then across biological replicates corresponding to that condition
Figure 2 Example baseline expression experiment page with help annotationsmdashIllumina Body Map (For further information see httpwwwebiacukgxahelpbaseline-atlashtml)
D928 Nucleic Acids Research 2014 Vol 42 Database issue
at Europaisches L
aboratorium fuer M
olekularbiologie Bibliothek on January 15 2014
httpnaroxfordjournalsorgD
ownloaded from
genes that are differentially expressed most specifically inthe queried contrast(s) This is achieved by promoting tothe top genes with lowest P-values in the contrast(s) ofinterest and at the same time penalizing genes with lowP-values in the remaining contrasts Optionally the usermay perform a lsquonon-specificrsquo search in which genes withlowest P-values in the selected contrast(s) come first irre-spective of whether they are reported with low P-values inthe remaining contrasts The results of this analysis arepresented to the user in a matrix with genes (and designelementsmdashfor microarray only) as row labels and con-trasts as column labels The results are sorted byP-value the t-statistics and log2-fold changes are alsoavailable As part of the differential analysis lsquoMArsquo plotsare shown for the default FDR of 005 The user is able tochoose a different FDR and observe in the resultingmatrix what effect this has had on the results The differ-ential experiment page offers downloads of analytics dataas well as raw counts (RNA-sequencing) normalized ex-pression values (one-colour microarray) and log2-ratios(two-colour microarray) respectively Finally experimen-tal conditions for each contrast can be viewed via mouse-over on contrast column headers in the results matrixand on the experiment design page available via abutton in the top-right corner of the experiment page
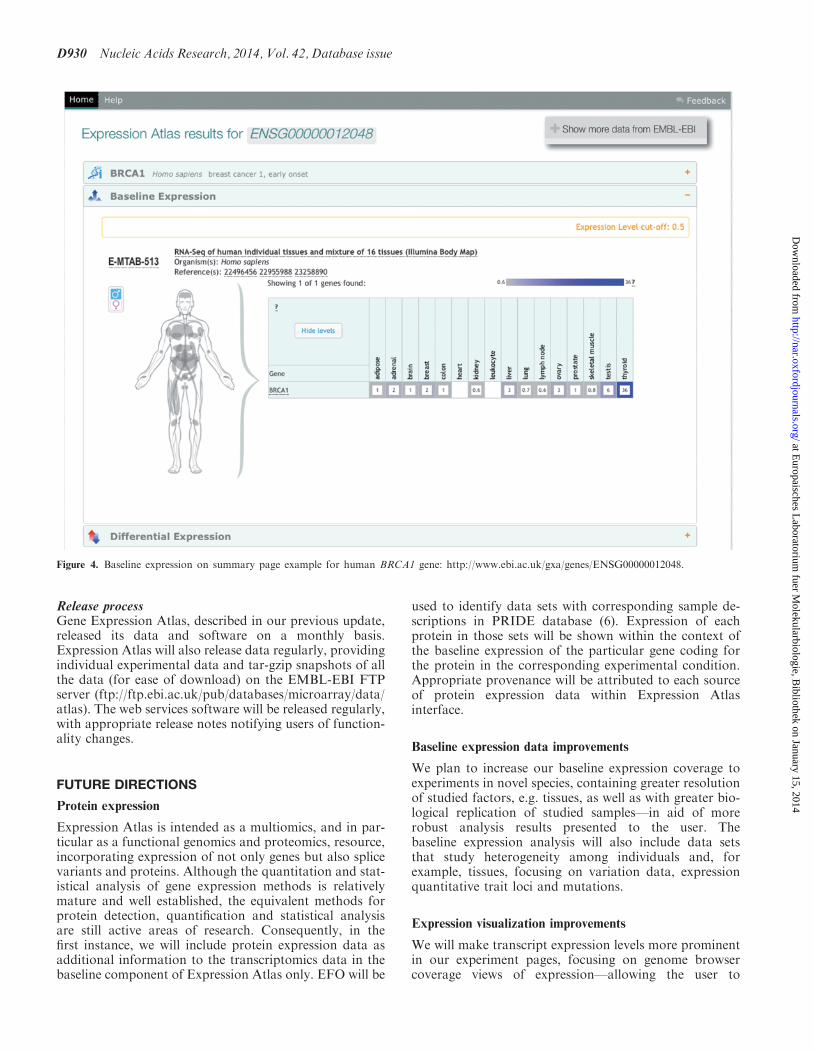
Geneproteingene-set pageFor each gene protein and gene set (eg Reactomepathway ID) Expression Atlas provides a summary pagethat contains at most three separate panes (Figure 4) Thetop pane contains extensive annotation for the represented
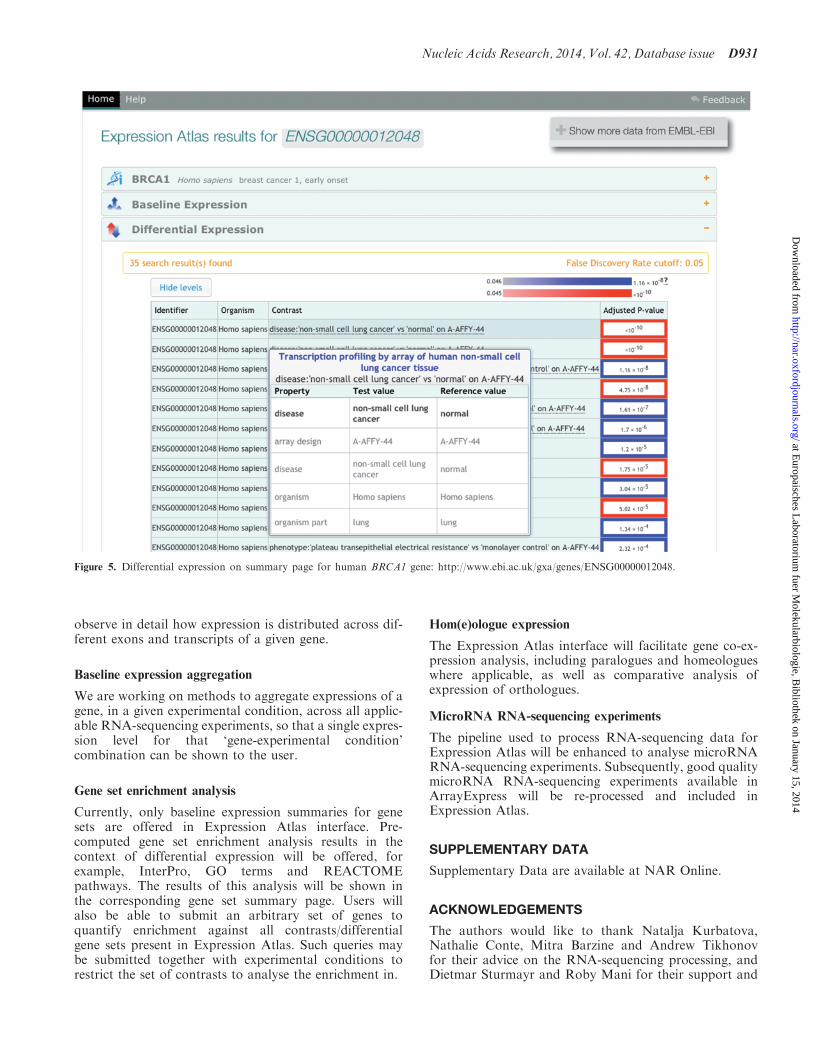
bio-entity including links to external resources itsorthologues and so forth The middle pane showsbaseline expression information from the representativebaseline experiment in which the bio-entity was studiedFor gene sets the aggregated expression levels across allgenes in the set are shown for each experimental conditionFinally the bottom pane (Figure 5) shows differential ex-pression sorted by P-value across all contrasts in experi-ments available in Expression Atlas Mouse-over on acontrast description shows experimental conditionsdescribing the test and the reference sides of that contrast(shown in Figure 5 for the top contrast) clicking on acontrast takes the user to the page of the experimentfrom which the analytics were retrieved
Experiment list pageThis page (httpwwwebiacukgxaexperiments)presents a sortable and searchable list of all experimentscurrently loaded in Expression Atlas documentingamong other things experiment type (baseline or differen-tial) the number of assays analysed for that experimentthe organisms and experimental conditions studied thenumber of contrasts identified (differential experimentsonly) and the array designs used in the experiment (micro-array only)
Atlas infrastructure developments
Software availabilityThe Expression Atlas software is designed to run in-houseonly However the software source code can be accessedvia httpgithubcomgxaatlas
Figure 3 Example differential expression page with help annotationsmdashTranscription profiling by array of Drosophila melanogaster CDK8 and CyclinC homozygous mutants determined using lsquoAffymetrix GeneChip Drosophila Genome 20 Arrayrsquo (For further information see httpwwwebiacukgxahelpdifferential-atlashtml) Genes that were called as differentially expressed at FDRlt 005 are shown in red in the MA plot
Nucleic Acids Research 2014 Vol 42 Database issue D929
at Europaisches L
aboratorium fuer M
olekularbiologie Bibliothek on January 15 2014
httpnaroxfordjournalsorgD
ownloaded from
Release processGene Expression Atlas described in our previous updatereleased its data and software on a monthly basisExpression Atlas will also release data regularly providingindividual experimental data and tar-gzip snapshots of allthe data (for ease of download) on the EMBL-EBI FTPserver (ftpftpebiacukpubdatabasesmicroarraydataatlas) The web services software will be released regularlywith appropriate release notes notifying users of function-ality changes
FUTURE DIRECTIONS
Protein expression
Expression Atlas is intended as a multiomics and in par-ticular as a functional genomics and proteomics resourceincorporating expression of not only genes but also splicevariants and proteins Although the quantitation and stat-istical analysis of gene expression methods is relativelymature and well established the equivalent methods forprotein detection quantification and statistical analysisare still active areas of research Consequently in thefirst instance we will include protein expression data asadditional information to the transcriptomics data in thebaseline component of Expression Atlas only EFO will be
used to identify data sets with corresponding sample de-scriptions in PRIDE database (6) Expression of eachprotein in those sets will be shown within the context ofthe baseline expression of the particular gene coding forthe protein in the corresponding experimental conditionAppropriate provenance will be attributed to each sourceof protein expression data within Expression Atlasinterface
Baseline expression data improvements
We plan to increase our baseline expression coverage toexperiments in novel species containing greater resolutionof studied factors eg tissues as well as with greater bio-logical replication of studied samplesmdashin aid of morerobust analysis results presented to the user Thebaseline expression analysis will also include data setsthat study heterogeneity among individuals and forexample tissues focusing on variation data expressionquantitative trait loci and mutations
Expression visualization improvements
We will make transcript expression levels more prominentin our experiment pages focusing on genome browsercoverage views of expressionmdashallowing the user to
Figure 4 Baseline expression on summary page example for human BRCA1 gene httpwwwebiacukgxagenesENSG00000012048
D930 Nucleic Acids Research 2014 Vol 42 Database issue
at Europaisches L
aboratorium fuer M
olekularbiologie Bibliothek on January 15 2014
httpnaroxfordjournalsorgD
ownloaded from
observe in detail how expression is distributed across dif-ferent exons and transcripts of a given gene
Baseline expression aggregation
We are working on methods to aggregate expressions of agene in a given experimental condition across all applic-able RNA-sequencing experiments so that a single expres-sion level for that lsquogene-experimental conditionrsquocombination can be shown to the user
Gene set enrichment analysis
Currently only baseline expression summaries for genesets are offered in Expression Atlas interface Pre-computed gene set enrichment analysis results in thecontext of differential expression will be offered forexample InterPro GO terms and REACTOMEpathways The results of this analysis will be shown inthe corresponding gene set summary page Users willalso be able to submit an arbitrary set of genes toquantify enrichment against all contrastsdifferentialgene sets present in Expression Atlas Such queries maybe submitted together with experimental conditions torestrict the set of contrasts to analyse the enrichment in
Hom(e)ologue expression
The Expression Atlas interface will facilitate gene co-ex-pression analysis including paralogues and homeologueswhere applicable as well as comparative analysis ofexpression of orthologues
MicroRNA RNA-sequencing experiments
The pipeline used to process RNA-sequencing data forExpression Atlas will be enhanced to analyse microRNARNA-sequencing experiments Subsequently good qualitymicroRNA RNA-sequencing experiments available inArrayExpress will be re-processed and included inExpression Atlas
SUPPLEMENTARY DATA
Supplementary Data are available at NAR Online
ACKNOWLEDGEMENTS
The authors would like to thank Natalja KurbatovaNathalie Conte Mitra Barzine and Andrew Tikhonovfor their advice on the RNA-sequencing processing andDietmar Sturmayr and Roby Mani for their support and
Figure 5 Differential expression on summary page for human BRCA1 gene httpwwwebiacukgxagenesENSG00000012048
Nucleic Acids Research 2014 Vol 42 Database issue D931
at Europaisches L
aboratorium fuer M
olekularbiologie Bibliothek on January 15 2014
httpnaroxfordjournalsorgD
ownloaded from
guidance on the Expression Atlas production infrastruc-ture and Nikolay Kolesnikov for his help with theArrayExpress interface They would also like to expressgratitude to Anton Enright and Matthew Davis for theirguidance on microarray analysis of microRNAs and toHenning Hermjakob Juan Antonio Vizcaino and AttilaCsordas for the knowledge of mass spectrometry andproteomics they imparted to the authors Also manythanks to Rafael Jimenez for his help with the BioJSframework and to Antonio Fabregat Mundo StevenJupe and David Croft for their help in integrating thebaseline expression component into the ReactomePathway Portal Special thanks are due to FrancisRowland and Sebastien Passeat for their keen assistanceon user interfaces The authors would also like to thankAlex Gutteridge of Pfizer for his user interface feedbackand guidance on specificity of expression Finally theywould like to thank Misha Kapushesky and otherprevious developers of Gene Expression Atlas for theirwork and input which will have inevitably influencedour efforts when developing its successor ExpressionAtlas
FUNDING
European Molecular Biology Laboratory (EMBL)member states the National Science Foundation[Gramene 1127112] the European Communityrsquos FP7EurocanPlatform [260791] and by GEUVADIS
[261123] Funding for open access charge EMBL centralpublication budget
Conflict of interest statement None declared
REFERENCES
1 KapusheskyM AdamusiakT BurdettT CulhaneA FarneAFilippovA HollowayE KlebanovA KryvychNKurbatovaN et al (2012) Gene Expression Atlas updatemdashavalue-added database of microarray and sequencing-basedfunctional genomics experiments Nucleic Acids Res 40D1077ndashD1081
2 RusticiG KolesnikovN BrandiziM BurdettT DylagMEmamI FarneA HastingsE IsonJ KeaysM et al (2013)ArrayExpress updatendashtrends in database growth and links to dataanalysis tools Nucleic Acids Res 41 D987ndashD990
3 BarrettT TroupDB WilhiteSE LedouxP EvangelistaCKimIF TomashevskyM MarshallKA PhillippyKHShermanPM et al (2011) NCBI GEO archive for functionalgenomics data setsmdash10 years on Nucleic Acids Res 39D1005ndashD1010
4 MaloneJ HollowayE AdamusiakT KapusheskyM ZhengJKolesnikovN ZhukovaA BrazmaA and ParkinsonH (2010)Modeling sample variables with an Experimental FactorOntology Bioinformatics 26 1112ndash1118
5 KozomaraA and Griffiths-JonesS (2011) miRBase integratingmicroRNA annotation and deep-sequencing data Nucleic AcidsRes 39 D152ndashD157
6 VizcaınoJA CoteRG CsordasA DianesJA FabregatAFosterJM GrissJ AlpiE BirimM ContellJ et al (2013)The Proteomics Identifications (PRIDE) database and associatedtools status in 2013 Nucleic Acids Res 41 D1063ndashD1069
D932 Nucleic Acids Research 2014 Vol 42 Database issue
at Europaisches L
aboratorium fuer M
olekularbiologie Bibliothek on January 15 2014
httpnaroxfordjournalsorgD
ownloaded from
For example all biological replicates treated with a testcompound may be compared with untreated samplesStatistical analysis is then performed providing P-valuesand (for microarray only) t-statistics linking each gene todifferential contrasts in each experiment
Another novel aspect of Expression Atlas is its focus onquality control of raw experimental data and of experi-mental design A minimum acceptable number of biolo-gical sample replicates (three) is also enforced to ensuresufficient statistical power to detect differential expressionBefore submission into analysis pipelines all experimentalraw data undergo quality control In the case of RNA-sequencing experiments poor quality reads and thoseoriginating from contamination are excluded fromfurther analysis Outlier arrays in microarray experimentsare also removed before manual contrast identificationand statistical analysis
The focus on the quality of raw data and experimentaldesign has led to exclusion of low-quality experimentsThe manual curation of contrasts for all eligible experi-ments is also on-going leading to a temporary reductionin the number of experiments in Expression Atlas
Support of reproducible analysis is provided for eachexperiment by listing analysis methods and versions usedfor processing its raw data offering links to source codewhere possible as well as showing the version of Ensemblgenome reference used for mapping (for RNA-sequencingexperiments) and the version of miRBase (5) release fromwhich probe-set to microRNA mappings was taken formicroRNA microarray experiments The user shouldthus be able to reproduce the results presented inExpression Atlas by analysing the raw experimentaldata using the methods listed for that experiment
Expression Atlas search interface allows for queryinggene splice variant or protein attributes (includingorganism) at the level of individual genes or whole genesets The user can also search for sample attributes andexperimental factors Both baseline and differential com-ponents of Expression Atlas are queried by default Theexperiments returned are those in which the queriedsample attributes match either the studied healthy or un-treated biological conditions eg tissues or cell types(baseline expression) or match either a lsquotestrsquo or a lsquorefer-encersquo side of a differential contrast (differential expres-sion) Finally the set of queried experiments can berestricted by providing a list of accessions keywords orthe species of samples studied in them
The RNA-seq processing pipeline used to generate datafor Expression Atlas is shown in Figure 1 The full detailsof material and methods used to generate expression datashown in Expression Atlas interface are available in theSupplementary Material
RESULTS
Data
As of 24 September 13 Expression Atlas contains highlycurated data from 214 experiments including four baselineRNA-sequencing experiments (nine species) and 210 differ-ential experiments (13 species) Baseline experiments
include Illumina Body Map (httpwwwebiacukgxaexperimentsE-MTAB-513) and Encode Cell Lines (httpwwwebiacukgxaexperimentsE-GEOD-26284) Differ-ential experiments include 10 RNA-sequencing and 200microarray experimentsmdashmainly single-channel experi-ments performed on gene arrays Finally microarray ex-periments studying microRNAs are also available (eghttpwwwebiacukgxaexperimentsE-TABM-713)
New user interface features
Expression Atlas offers a separate page for each experi-ment as well as pages presenting baseline and differentialexpression data for each gene protein gene set (egREACTOME pathway) and experimental condition (eglsquoheartrsquo) stored in Atlas
Baseline expression (Figure 2)Users can search a baseline experiment with gene namesprotein accessions gene protein or splice variant identi-fiers keywords biotypes (eg lsquoprotein codingrsquo) GO andInterPro terms as well as Reactome pathway IDsOptionally each term (eg REACTOME pathway ID)can be interpreted as a gene set offering the user anaggregated expression level across all genes in eachqueried gene set Users may also search using studied ex-perimental conditions (eg tissue in Figure 2) By defaultsearch results are ordered such that genes that are mostspecifically expressed in the experimental condition(s) ofinterest are at the top This is implemented by rewardinghigher expression in the conditions of interest and as low aspossible expression in the remaining conditionsOptionally the user may wish to search for lsquonon-specificrsquoexpressionmdashin this scenario genes with high expression inquery conditions are not only rewarded but also notpenalized for high expression in non-query conditionsThis type of query typically returns lsquohouse-keepingrsquo genesat the top of the results table ie those with high levels ofexpression in the majority of experimental conditionsExpression levels below the displayed FPKM cut-off (05by default) are treated as background (ie lsquonoisersquo) The useris free to select a different expression level cut-offmdasha histo-gram breaking down the number of genes expressed abovea given cut-off is included to help the user decide which cut-off to use for their query of interest As FPKMs are alreadya gross approximation of gene expression the resultingmatrix encodes the expression level by way of a heatmapthough the actual FPKM values can be displayed and aredownloadable from the experiment page Finally clickingon a non-empty heatmap cell shows a breakdown of thethree most abundant splice variants for the correspondinggene and experimental condition
Differential expression (Figure 3)Users may search a differential experiment by the samegene properties and keywords as listed earlier in textfor baseline experiments additionally selecting the typeof differential expression of interest (updown bydefault) A differential contrast dropdown is also avail-ablemdashthe default search is for differential expression inany contrast but the user can also choose one or morecontrast of interest By default the search returns first
Nucleic Acids Research 2014 Vol 42 Database issue D927
at Europaisches L
aboratorium fuer M
olekularbiologie Bibliothek on January 15 2014
httpnaroxfordjournalsorgD
ownloaded from
Figure 1 The RNA-seq processing pipeline used to generate data for Expression Atlas The experimental metadata is retrieved from ArrayExpressThe raw FASTQ files retrieved from European Nucleotide Archive undergo a quality control procedure via FASTQC package to remove low-quality reads and uncalled bases Subsequently contaminated reads (eg bacterial in the cases of vertebrate samples) are removed TopHat 1 is usedfor mapping the reads to the reference genome Cufflinks 1 quantifies baseline expression for genes and transcripts and HTseq quantifies expressionused for subsequent differential expression analysis with DESeq The final (summarized) baseline expression count for a gene in a condition is amedian across first technical replicates then across biological replicates corresponding to that condition
Figure 2 Example baseline expression experiment page with help annotationsmdashIllumina Body Map (For further information see httpwwwebiacukgxahelpbaseline-atlashtml)
D928 Nucleic Acids Research 2014 Vol 42 Database issue
at Europaisches L
aboratorium fuer M
olekularbiologie Bibliothek on January 15 2014
httpnaroxfordjournalsorgD
ownloaded from
genes that are differentially expressed most specifically inthe queried contrast(s) This is achieved by promoting tothe top genes with lowest P-values in the contrast(s) ofinterest and at the same time penalizing genes with lowP-values in the remaining contrasts Optionally the usermay perform a lsquonon-specificrsquo search in which genes withlowest P-values in the selected contrast(s) come first irre-spective of whether they are reported with low P-values inthe remaining contrasts The results of this analysis arepresented to the user in a matrix with genes (and designelementsmdashfor microarray only) as row labels and con-trasts as column labels The results are sorted byP-value the t-statistics and log2-fold changes are alsoavailable As part of the differential analysis lsquoMArsquo plotsare shown for the default FDR of 005 The user is able tochoose a different FDR and observe in the resultingmatrix what effect this has had on the results The differ-ential experiment page offers downloads of analytics dataas well as raw counts (RNA-sequencing) normalized ex-pression values (one-colour microarray) and log2-ratios(two-colour microarray) respectively Finally experimen-tal conditions for each contrast can be viewed via mouse-over on contrast column headers in the results matrixand on the experiment design page available via abutton in the top-right corner of the experiment page
Geneproteingene-set pageFor each gene protein and gene set (eg Reactomepathway ID) Expression Atlas provides a summary pagethat contains at most three separate panes (Figure 4) Thetop pane contains extensive annotation for the represented
bio-entity including links to external resources itsorthologues and so forth The middle pane showsbaseline expression information from the representativebaseline experiment in which the bio-entity was studiedFor gene sets the aggregated expression levels across allgenes in the set are shown for each experimental conditionFinally the bottom pane (Figure 5) shows differential ex-pression sorted by P-value across all contrasts in experi-ments available in Expression Atlas Mouse-over on acontrast description shows experimental conditionsdescribing the test and the reference sides of that contrast(shown in Figure 5 for the top contrast) clicking on acontrast takes the user to the page of the experimentfrom which the analytics were retrieved
Experiment list pageThis page (httpwwwebiacukgxaexperiments)presents a sortable and searchable list of all experimentscurrently loaded in Expression Atlas documentingamong other things experiment type (baseline or differen-tial) the number of assays analysed for that experimentthe organisms and experimental conditions studied thenumber of contrasts identified (differential experimentsonly) and the array designs used in the experiment (micro-array only)
Atlas infrastructure developments
Software availabilityThe Expression Atlas software is designed to run in-houseonly However the software source code can be accessedvia httpgithubcomgxaatlas
Figure 3 Example differential expression page with help annotationsmdashTranscription profiling by array of Drosophila melanogaster CDK8 and CyclinC homozygous mutants determined using lsquoAffymetrix GeneChip Drosophila Genome 20 Arrayrsquo (For further information see httpwwwebiacukgxahelpdifferential-atlashtml) Genes that were called as differentially expressed at FDRlt 005 are shown in red in the MA plot
Nucleic Acids Research 2014 Vol 42 Database issue D929
at Europaisches L
aboratorium fuer M
olekularbiologie Bibliothek on January 15 2014
httpnaroxfordjournalsorgD
ownloaded from
Release processGene Expression Atlas described in our previous updatereleased its data and software on a monthly basisExpression Atlas will also release data regularly providingindividual experimental data and tar-gzip snapshots of allthe data (for ease of download) on the EMBL-EBI FTPserver (ftpftpebiacukpubdatabasesmicroarraydataatlas) The web services software will be released regularlywith appropriate release notes notifying users of function-ality changes
FUTURE DIRECTIONS
Protein expression
Expression Atlas is intended as a multiomics and in par-ticular as a functional genomics and proteomics resourceincorporating expression of not only genes but also splicevariants and proteins Although the quantitation and stat-istical analysis of gene expression methods is relativelymature and well established the equivalent methods forprotein detection quantification and statistical analysisare still active areas of research Consequently in thefirst instance we will include protein expression data asadditional information to the transcriptomics data in thebaseline component of Expression Atlas only EFO will be
used to identify data sets with corresponding sample de-scriptions in PRIDE database (6) Expression of eachprotein in those sets will be shown within the context ofthe baseline expression of the particular gene coding forthe protein in the corresponding experimental conditionAppropriate provenance will be attributed to each sourceof protein expression data within Expression Atlasinterface
Baseline expression data improvements
We plan to increase our baseline expression coverage toexperiments in novel species containing greater resolutionof studied factors eg tissues as well as with greater bio-logical replication of studied samplesmdashin aid of morerobust analysis results presented to the user Thebaseline expression analysis will also include data setsthat study heterogeneity among individuals and forexample tissues focusing on variation data expressionquantitative trait loci and mutations
Expression visualization improvements
We will make transcript expression levels more prominentin our experiment pages focusing on genome browsercoverage views of expressionmdashallowing the user to
Figure 4 Baseline expression on summary page example for human BRCA1 gene httpwwwebiacukgxagenesENSG00000012048
D930 Nucleic Acids Research 2014 Vol 42 Database issue
at Europaisches L
aboratorium fuer M
olekularbiologie Bibliothek on January 15 2014
httpnaroxfordjournalsorgD
ownloaded from
observe in detail how expression is distributed across dif-ferent exons and transcripts of a given gene
Baseline expression aggregation
We are working on methods to aggregate expressions of agene in a given experimental condition across all applic-able RNA-sequencing experiments so that a single expres-sion level for that lsquogene-experimental conditionrsquocombination can be shown to the user
Gene set enrichment analysis
Currently only baseline expression summaries for genesets are offered in Expression Atlas interface Pre-computed gene set enrichment analysis results in thecontext of differential expression will be offered forexample InterPro GO terms and REACTOMEpathways The results of this analysis will be shown inthe corresponding gene set summary page Users willalso be able to submit an arbitrary set of genes toquantify enrichment against all contrastsdifferentialgene sets present in Expression Atlas Such queries maybe submitted together with experimental conditions torestrict the set of contrasts to analyse the enrichment in
Hom(e)ologue expression
The Expression Atlas interface will facilitate gene co-ex-pression analysis including paralogues and homeologueswhere applicable as well as comparative analysis ofexpression of orthologues
MicroRNA RNA-sequencing experiments
The pipeline used to process RNA-sequencing data forExpression Atlas will be enhanced to analyse microRNARNA-sequencing experiments Subsequently good qualitymicroRNA RNA-sequencing experiments available inArrayExpress will be re-processed and included inExpression Atlas
SUPPLEMENTARY DATA
Supplementary Data are available at NAR Online
ACKNOWLEDGEMENTS
The authors would like to thank Natalja KurbatovaNathalie Conte Mitra Barzine and Andrew Tikhonovfor their advice on the RNA-sequencing processing andDietmar Sturmayr and Roby Mani for their support and
Figure 5 Differential expression on summary page for human BRCA1 gene httpwwwebiacukgxagenesENSG00000012048
Nucleic Acids Research 2014 Vol 42 Database issue D931
at Europaisches L
aboratorium fuer M
olekularbiologie Bibliothek on January 15 2014
httpnaroxfordjournalsorgD
ownloaded from
guidance on the Expression Atlas production infrastruc-ture and Nikolay Kolesnikov for his help with theArrayExpress interface They would also like to expressgratitude to Anton Enright and Matthew Davis for theirguidance on microarray analysis of microRNAs and toHenning Hermjakob Juan Antonio Vizcaino and AttilaCsordas for the knowledge of mass spectrometry andproteomics they imparted to the authors Also manythanks to Rafael Jimenez for his help with the BioJSframework and to Antonio Fabregat Mundo StevenJupe and David Croft for their help in integrating thebaseline expression component into the ReactomePathway Portal Special thanks are due to FrancisRowland and Sebastien Passeat for their keen assistanceon user interfaces The authors would also like to thankAlex Gutteridge of Pfizer for his user interface feedbackand guidance on specificity of expression Finally theywould like to thank Misha Kapushesky and otherprevious developers of Gene Expression Atlas for theirwork and input which will have inevitably influencedour efforts when developing its successor ExpressionAtlas
FUNDING
European Molecular Biology Laboratory (EMBL)member states the National Science Foundation[Gramene 1127112] the European Communityrsquos FP7EurocanPlatform [260791] and by GEUVADIS
[261123] Funding for open access charge EMBL centralpublication budget
Conflict of interest statement None declared
REFERENCES
1 KapusheskyM AdamusiakT BurdettT CulhaneA FarneAFilippovA HollowayE KlebanovA KryvychNKurbatovaN et al (2012) Gene Expression Atlas updatemdashavalue-added database of microarray and sequencing-basedfunctional genomics experiments Nucleic Acids Res 40D1077ndashD1081
2 RusticiG KolesnikovN BrandiziM BurdettT DylagMEmamI FarneA HastingsE IsonJ KeaysM et al (2013)ArrayExpress updatendashtrends in database growth and links to dataanalysis tools Nucleic Acids Res 41 D987ndashD990
3 BarrettT TroupDB WilhiteSE LedouxP EvangelistaCKimIF TomashevskyM MarshallKA PhillippyKHShermanPM et al (2011) NCBI GEO archive for functionalgenomics data setsmdash10 years on Nucleic Acids Res 39D1005ndashD1010
4 MaloneJ HollowayE AdamusiakT KapusheskyM ZhengJKolesnikovN ZhukovaA BrazmaA and ParkinsonH (2010)Modeling sample variables with an Experimental FactorOntology Bioinformatics 26 1112ndash1118
5 KozomaraA and Griffiths-JonesS (2011) miRBase integratingmicroRNA annotation and deep-sequencing data Nucleic AcidsRes 39 D152ndashD157
6 VizcaınoJA CoteRG CsordasA DianesJA FabregatAFosterJM GrissJ AlpiE BirimM ContellJ et al (2013)The Proteomics Identifications (PRIDE) database and associatedtools status in 2013 Nucleic Acids Res 41 D1063ndashD1069
D932 Nucleic Acids Research 2014 Vol 42 Database issue
at Europaisches L
aboratorium fuer M
olekularbiologie Bibliothek on January 15 2014
httpnaroxfordjournalsorgD
ownloaded from
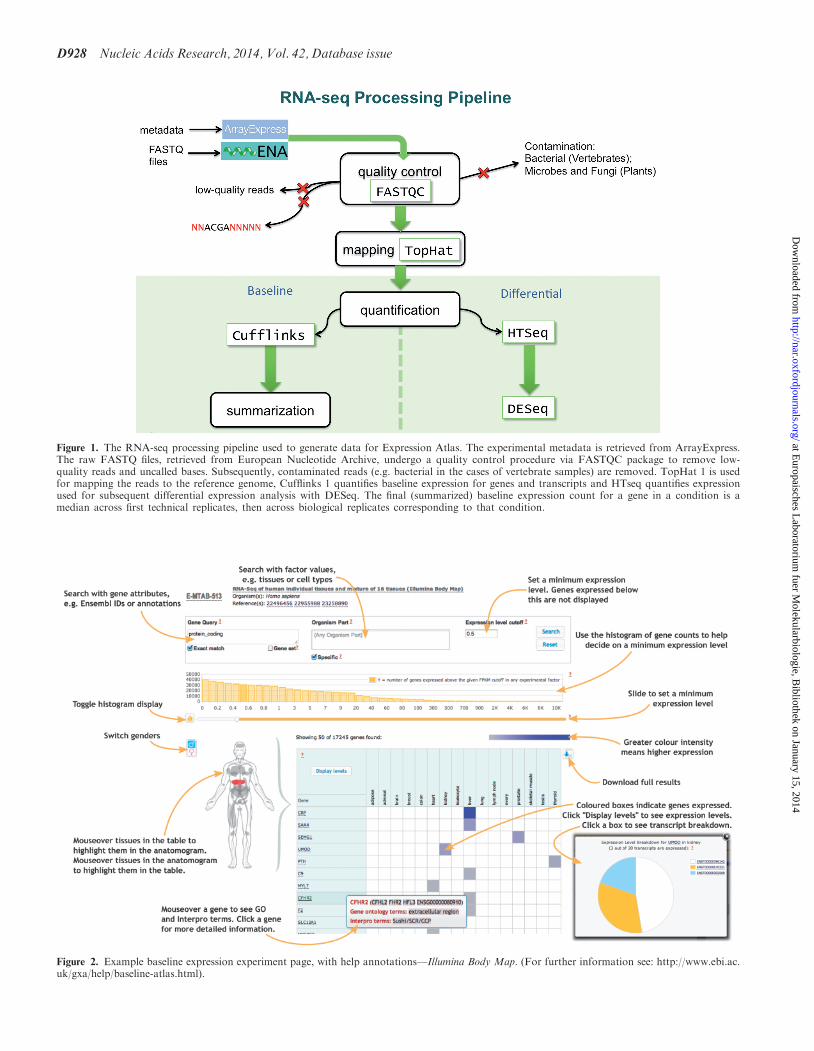