Embed Size (px)
Citation preview
Expression of carnitine palmitoyl-CoA transferase-1B is influenced by acis-acting eQTL in two chicken lines selected for high and low body weight
Sojeong Ka,1 Ellen Markljung,2 Henrik Ring,1 Frank W. Albert,3 Mohammad Harun-Or-Rashid,1
Per Wahlberg,2 Pablo M. Garcia-Roves,4 Juleen R. Zierath,4 D. Michael Denbow,5 Svante Pääbo,3,7
Paul B. Siegel,5 Leif Andersson,2,6 and Finn Hallböök1
1Department of Neuroscience, Uppsala University, Uppsala, Sweden; 2Science for Life Laboratory, Department of MedicalBiochemistry and Microbiology, Uppsala University, Uppsala, Sweden; 3Department of Evolutionary Genetics, Max PlanckInstitute for Evolutionary Anthropology, Leipzig, Germany; 4Department of Molecular Medicine and Surgery, IntegrativePhysiology, Karolinska Institute, Stockholm, Sweden; 5Department of Animal and Poultry Sciences, Virginia PolytechnicInstitute and State University, Blacksburg, Virginia; 6Science for Life Laboratory, Animal Breeding and Genetics, SwedishUniversity of Agricultural Sciences, Uppsala, Sweden; and 7Department of Immunology, Genetics and Pathology, UppsalaUniversity, Uppsala, Sweden
Submitted 15 June 2012; accepted in final form 18 March 2013
Ka S, Markljung E, Ring H, Albert FW, Harun-Or-Rashid M,Wahlberg P, Garcia-Roves PM, Zierath JR, Denbow DM, PääboS, Siegel PB, Andersson L, Hallböök F. Expression of carnitinepalmitoyl-CoA transferase-1B is influenced by a cis-acting eQTL intwo chicken lines selected for high and low body weight. PhysiolGenomics 45: 367–376, 2013. First published March 19, 2013;doi:10.1152/physiolgenomics.00078.2012.—Carnitine palmitoyl-CoAtransferase-1B is a mitochondrial enzyme in the fatty acid oxidationpathway. In a previous study, CPT1B was identified as differentiallyexpressed in the hypothalamus of two lines of chickens established bylong-term selection for high (HWS) or low (LWS) body weight.Mammals have three paralogs (CPT1a, b and c) while nonmammalianvertebrates only have two (CPT1A, B). CPT1A is expressed in liverand CPT1B in muscle. CPT1c is expressed in hypothalamus, where itregulates feeding and energy expenditure. We identified an introniclength polymorphism, fixed for different alleles in the two popula-tions, and mapped the hitherto missing CPT1B locus in the chickengenome assembly, to the distal tip of chromosome 1p. Based onmolecular phylogeny and gene synteny we suggest that chickenCPT1B is pro-orthologous of the mammalian CPT1c. Chicken CPT1Bwas differentially expressed in both muscle and hypothalamus but inopposite directions: higher levels in hypothalamus but lower levels inmuscle in the HWS than in the LWS line. Using an advancedintercross population of the lines, we found CPT1B expression to beinfluenced by a cis-acting expression quantitative trait locus in mus-cle. The increased expression in hypothalamus and reduced expres-sion in muscle is consistent with an increased food intake in the HWSline and at the same time reduced fatty acid oxidation in muscleyielding a net accumulation of energy intake and storage. The alteredexpression of CPT1B in hypothalamus and peripheral tissue is likelyto be a mechanism contributing to the remarkable difference betweenlines.
body weight; chromosomal mapping; fatty acid; genotyping; hypo-thalamus; malonyl-CoA; skeletal muscle; lipid metabolism; mito-chondria; mRNA expression; pectoral muscle
CARNITINE PALMITOYL-COENZYME A TRANSFERASE-1 (CPT1; palmi-toyl-CoA: L-carnitine O-palmitoyltransferase, EC 2.3.1.21) is akey enzyme in the control of fatty acid oxidation, whichcatalyzes the rate-limiting step of �-oxidation by translocating
fatty acids across the mitochondrial membranes. Malonyl-coenzyme A (CoA), an intermediate in fatty acid synthesis,inhibits CPT1 action, thus blocking the oxidation of fatty acidsduring times of fatty acid synthesis and energy surplus (26).There are three mammalian CPT1 paralogs. CPT1a is predom-inantly expressed in liver, CPT1b in muscle, while CPT1c ismainly expressed in the brain (30). Only two paralogs havebeen described in chicken, denoted CPT1A and B, but onlyCPT1A is present in the chicken genome assembly (WASHUC2,May 2006), whereas CPT1B is only known from cDNA se-quences (36). Malonyl-CoA as an intermediate metabolite inthe fatty acid metabolism has recently been shown to beinvolved in hypothalamic regulation of energy expenditure andfood intake (23, 27, 32, 40) and serves as an indicator of theenergy status in hypothalamic neurons. Experimental manipu-lation of the malonyl-CoA system alters feeding behaviors (10,17, 34). Although CPT1c is structurally similar to its mamma-lian paralogs CPT1a and b, it does not seem to catalyze theprototypical fatty acid transport (40). CPT1c is expressed in themammalian hypothalamus, and knockout mice exhibit amarked reduction in food intake, lower body weight, and lessbody-fat content than their wild-type littermates. This knock-out phenotype is consistent with a role for CPT1c as anenergy-sensing malonyl-CoA target (40), which regulates en-ergy homeostasis via the hypothalamus (20).
We have studied the chicken CPT1A and B in two chickenlines established by divergent selection for body weight at 56days of age for �50 generations from a founder population ofWhite Plymouth Rock chickens (8, 25, 35). The two popula-tions, the high-weight (HWS) and the low-weight (LWS)selection lines, now have more than a ninefold difference inbody weight at selection age. Several behavioral, metabolic,immunological, and endocrine differences between lines haveevolved during the course of the selection experiment (5, 7, 18,19). Among the correlated responses to the selection for bodyweight are differences in feeding behavior and food consump-tion (8). The involvement of the hypothalamus in these phe-notypic differences was implied after lesioning of the ventro-medial hypothalamus, which affected the feeding behavior (4).Interestingly, only minor differences were seen between lineswhen we analyzed the hypothalamic neuropeptide mediators ofappetite such as the melanocortin receptors (13, 15), indicating
Address for reprint requests and other correspondence: F. Hallböök, Dept. ofNeuroscience, Unit for Developmental Neuroscience, BMC, Box 593, S-75124 Uppsala, Sweden (e-mail: [email protected]).
Physiol Genomics 45: 367–376, 2013.First published March 19, 2013; doi:10.1152/physiolgenomics.00078.2012.
1094-8341/13 Copyright © 2013 the American Physiological Society 367
that the behavioral alteration cannot be explained solely bychanges in the hypothalamic neuropeptide regulatory system.Analysis of global gene expression in hypothalamus of the twolines have identified multiple differentially expressed genes innetworks and processes regulating neuronal plasticity and de-velopment, DNA metabolism and repair, and induction ofapoptosis (13). Although CPT1B, which is mainly expressed inmuscle, was identified as one of the most differentially ex-pressed genes in hypothalamus by the expression analysis, itscontribution to the phenotypes of these lines could not bepursued until now because its chromosomal location was notknown.
In this work we follow up on the observation that CPT1Bwas differentially expressed in our earlier array analysis ofhypothalamus of the two selected lines (13). We confirmed thatCPT1B, but not CPT1A, has higher expression levels in hypo-thalamic tissue from the HWS than from the LWS line.Interestingly, expression change in the opposite direction wasfound for CPT1B in muscle. These results suggested thehypothesis that the regulation of the expression of CPT1B hasbeen a target for the divergent selection with differentialCPT1B expression in the two lines as the result. We tested thisby identifying a genetic polymorphism in the CPT1B gene thatwas first used to determine the hitherto unknown position ofCPT1B in the chicken linkage map. The CPT1B polymorphismwas then genotyped in an advanced F9 intercross between thetwo chicken lines. Using body weight and CPT1B muscleexpression data in the F9 animals, we found that CPT1Bexpression is affected by an expression quantitative trait locus(eQTL). The data expose one possible regulatory mechanismthat underlies the genetics of variable behaviors to satisfy thequest for energy and food in vertebrates and shed light on the
molecular evolution and establishment of novel functions aftergene duplications in this important gene family.
MATERIALS AND METHODS
Animals and tissues. The LWS and HWS lines were establishedfrom a common founder population generated by crosses amongseven inbred lines of White Plymouth Rock chicken. The lines havebeen maintained as closed populations by continuous selection forhigh or low body weight at 56 days of age. Descriptions of theselection program and various correlated responses to the selectionwithin the lines are provided elsewhere (8, 11). For example, eachselected generation of the parental lines is hatched annually the firstTuesday in March, and dietary formulation has remained constantthroughout. Feed and water were supplied ad libitum. Animal han-dling and care were performed according to the National ResearchCouncil publication Guide for Care and Use of Laboratory Animalsand were approved by the Virginia Tech Institutional Animal Careand Use Committee. The experiment adheres to American Physiolog-ical Society’s Guiding Principles in the Care and Use of VertebrateAnimals in Research and Training.
HWS and LWS chickens from generation 45 (G45) were used forthe quantitative reverse transcription polymerase chain reaction (qRT-PCR) analysis in peripheral and brain tissues. Five males and fivefemales at 56 days (selection age) and three males and seven femalesat 4 days of age from each selected line and four White Leghornchickens were used for tissue dissections. Liver, pectoral muscle,adipose tissue, total brain, brain regions according to Fig. 1 includinghypothalamus, and a region containing diencephalon, mesencephalon,pons, and medulla (DMPM) were dissected at 56 days after hatch,immediately frozen in liquid nitrogen, and stored at �70°C until used.
A reciprocal advanced intercross population between HWS andLWS chickens was produced with the main purpose of identifyinggenes that explain the large difference in body weight and growthbetween the parental lines. The intercross was initiated from G41 of
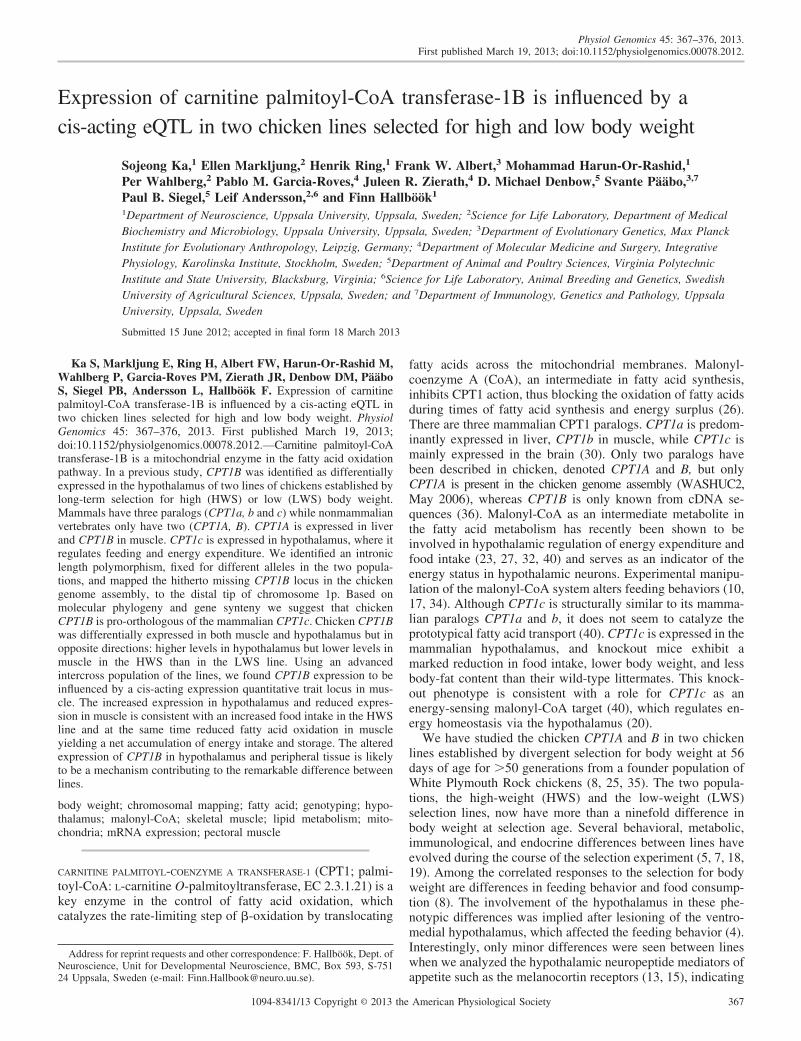
Fig. 1. Relative carnitine palmitoyl-coenzyme A trans-ferase-1(CPT1)A and CPT1B mRNA levels. Analysesof relative mRNA levels in peripheral tissues and brainfrom White Leghorn chickens at 56 days of age by usingqRT-PCR. Relative mRNA expression levels of CPT1B(A, B) and CPT1A (C, D) in liver, muscle, adiposetissues, whole brain, and in different brain regions. Theaverage level in brain was arbitrarily set to 1 and usedto relate the other samples to. Error bars � SD, n � 3.Brain, total brain; Ce, cerebellum; Hy, hypothalamus;Ma, medulla; Me, mesencephalon; Op, optic tectum;Po, pons; Te, telencephalon; Th, thalamus.
368 DIFFERENTIAL EXPRESSION OF CPT1B IN TWO CHICKEN LINES
Physiol Genomics • doi:10.1152/physiolgenomics.00078.2012 • www.physiolgenomics.org
the parental lines. Eight HWS males were mated to 22 LWS females,and 8 LWS males were mated to 19 HWS females to generate 150 F1
progeny in 40 families. Thereafter 40 pair-matings with one male andone female from each family were done for each generation duringnine generations (F9 intercross) as in Ref. 29 to minimize genetic drift.The husbandry of the intercross was identical to that of Refs. 11, 28.Body weights at 56 days were recorded for all individuals, and 42male and 38 female F9 chickens from the advanced intercross wereCPT1B genotyped. Pectoral muscle tissue from 28 females and 25males was dissected for total RNA preparation and used for analysisof relative CPT1B mRNA levels.
RNA preparation and quantitative RT-PCR. Total RNA was iso-lated with TRIzol (Invitrogen, Carlsbad, CA) purified with RNeasymini kit (Qiagen, Valencia, CA), the quality was checked with anAgilent 2100 Bioanalyzer (Agilent Technologies, Santa Clara, CA),and the RNA samples were frozen at �70°C until used. Complemen-tary DNA synthesis from total RNA and two-step quantitative (q)PCRwere performed as described (14). Random primers were used forfirst-strand cDNA synthesis (Superscript III RT, Invitrogen). Briefly,qRT-PCR was performed using the iQ SYBR Green supermix (Bio-Rad Laboratories) with MyiQ Single-Color Real-Time PCR DetectionSystem (Bio-Rad). Primers were designed with Primer Express v2.0(Applied Biosystems, Carlsbad, CA) with the default settings Tm60°C, 50% G/C, amplicon size minimum 100 base pairs. Each primersequence was BLASTed separately against GenBank and EMBL, andonly primers with one perfect match within the target sequence andwith the second best hit �75% identity were used. The primer pairswere checked for PCR efficiency, linear dynamic range, and speci-ficity. To confirm identity of amplified PCR products, dissociationcurve analysis and agarose gel electrophoresis were performed afteranalysis. The initial mRNA levels were first normalized to �-actin andTATA-box binding protein (TBP) mRNA levels to correct for varia-tions in the cDNA syntheses and experimental procedure. We vali-dated the use of �-actin and TBP for normalization purposes bytesting for the most stable mRNA expressions of TBP, �-actin,�-2-microglobulin, and glyceraldehyde 3-phosphate dehydrogenaseover the time points and tissues. The software geNorm (also includedin Bio-Rad MyIQ software package) was used. Control reactionscontaining primers but without reverse transcriptase were analyzed inparallel. The data were analyzed by the 2���Ct method (21). Analysisof variance (ANOVA) was used for the statistical analysis.
Phylogenetic and synteny analysis. Maximum likelihood phyloge-netic trees were based on deduced amino acid sequences of all
predicted and annotated CPT1 family homologs available in Ensembland constructed using the Ensemble on-line analysis software packageGene Tree. The reference tree is available on http://www.ensembl.org(GeneTree ENSGT00550000074345) (37). Syntenic regions in thechicken and human genome hosting CPT1 paralogs were identified bywhole genome alignment using BlastZ-net/Lastz-net pairwise align-ment analysis available in the Ensemble on-line analysis softwarepackage (16, 33).
Discovery of an intronic polymorphism and genotyping. A regionfrom the end of exon 23 to the beginning of exon 24 (numbering basedon human CPT1B) from two HWS and four LWS chickens wasamplified and sequenced with primers CTP1ex23F and CPTex24R(Table 1), and an intronic polymorphism was identified. A genotypingassay for the two intronic sequence alleles was designed. We used afluorescently labeled common forward primer located in exon se-quence and two different reverse primers located in intronic sequence(Table 1), giving a four base-pair size difference between the twoalleles (155 and 159 base pairs). The PCR reaction contained 0.2 �Mof each primer and PCR Buffer II, 1.5 mM MgCl2, 0.2 mM dNTP, 1U AmpliTaq GOLD polymerase (Applied Biosystems), and 40 ng ofDNA. The PCR cycling conditions were 95°C for 5 min, 8 touchdowncycles 95°C 30 s, 65–58°C 30 s, 72°C 20 s, 40 cycles 95°C 15 s, 58°C15 s, 72°C 20 s, and 72°C for 5 min. The difference in the fragmentlength was detected using a MegaBACE 1000 DNA Analysis System(Amersham Biosciences/GE Healthcare, Uppsala, Sweden) and ana-lyzed with Genetic Profiler (GE Healthcare). We genotyped 47 pa-rental animals (25 HWS and 22 LWS) and 10 F1 animals to assessfixation of the alleles in the two chicken lines. We used this assay togenotype 80 individuals from the F9 intercross, and a subset of F2
individuals (n � 108) from a large intercross pedigree between theHWS and LWS lines (38) was used for linkage analysis to mapCPT1B on the chicken linkage map. The analysis was carried out withthe CRI-MAP software package as previously described (38). Agenome-wide set of 432 markers previously scored in the pedigreewas included in a two-point linkage analysis.
Western blotting. Pectoral muscle tissue was dissected, frozen ondry ice, and later homogenized in a lysis buffer containing 20 mMHEPES pH 7.4, 100 mM NaCl, 100 mM NaF, 1% NP-40, 1 mMNa3VO4, 5 mM EDTA, and 1 protease inhibitor cocktail (HaltProtease and phosphatase inhibitor cocktail, #78440; Thermo Scien-tific, Rockford, IL). The protein lysate was subjected to two cycles offreezing and thawing on dry ice to release the mitochondrial proteins.Protein concentrations were determined with the DC Protein Assay
Table 1. Antibodies and PCR primer sequences
Antibody/Primer Name Antigen, Species/Sequence Catalog/Accession ID Note
CPT1-M carnitine palmitoyl transferase-1 muscle EC 2.3.1.21 CPT1M11-A Alpha Diagnostics rabbitNUO NADH-ubiquinol oxidoreductase, (complex I) EC 1.6.5.3 A21344 Molecular Probes mouseSUO succinate-ubiquinol oxidoreductase, (complex II) EC 1.3.5.1 A11142 Molecular Probes mouseActin �-isoform of actin 4970, Cell Signaling Technology rabbitchCPT1B.72F TGCTGCTTCCAATTCGACG DQ314726 qRT-PCRchCPT1B.157R TGCAGCGCGATCTGAATGchCPT1A F TCAACGAGTCAGACACCACAGC NM_001012898 qRT-PCRchCPT1A R CCGTAACCATCATCAGCCACA�-Actin F AGGTCATCACCATTGGCAATG NM_205518 qRT-PCR�-Actin R CCCAAGAAAGATGGCTGGAAGAPDH F GGGAAGCTTACTGGAATGGCT NM_204305.1 qRT-PCRGAPDH R GGCAGGTCAGGTCAACAACATBP F TAGCCCGATGATGCCGTAT NM_205103.1 qRT-PCRTBP R GTTCCCTGTGTCGCTTGCCPT1ex23F TGATGACGTCGATTTCTGCT DQ314726 intron amplificationCPT1ex24R ACGCCTCGTAGGTCAGACAGF Fam GATTTCTGCTGCTTCCAATTCGAC genotypingL_R TACTCCATAGCCGCCCCATACTGT genotypingH_R CCATAGCCGCCCCACACAGA genotyping
F, forward; R, reverse primer.
369DIFFERENTIAL EXPRESSION OF CPT1B IN TWO CHICKEN LINES
Physiol Genomics • doi:10.1152/physiolgenomics.00078.2012 • www.physiolgenomics.org
(Bio-Rad). We separated 20 �g protein per sample on 10% denaturingSDS polyacrylamide-electrophoresis Mini-Protean TGX Precast gels(Bio-Rad) and electrophoretically transferred that to Immun-BlotPVDF membrane (Bio-Rad) with the recommended buffers. Nonspe-cific binding was blocked in 4% bovine serum albumin in TBSTbuffer (20 mM Tris, 140 mM NaCl, 0.05% Tween-20) for 1 h at roomtemperature. The membrane was incubated with primary antibodydiluted in 1% bovine serum albumin in TBST at 4°C overnight.Primary antibodies are listed in Table 1. After washing the membrane,we incubated it with horseradish peroxidase-conjugated secondaryantibodies (Jackson ImmunoResearch Laboratories, West Grove, PA)that were detected by chemiluminescence with the ChemiDoc MPImaging System (Bio-Rad) and quantified with the software ImageLab (Bio-Rad) (9). Each sample was normalized to the actin level andrelated to the mean levels of the female LWS protein. The filter wasstripped from primary antibodies using 100 mM glycine buffer, pH2.5, overnight at 4°C and reprobed with a new primary antibody. Thesame filter was used for all four primary antibodies. ANOVA withTukey’s multiple-comparison post hoc test was used for the statisticalanalysis.
RESULTS
Organ-specific expression of CPT1B and CPT1A. Our ear-lier microarray analysis indicated that CPT1B is expressed in
nervous tissue (13). Using qRT-PCR we re-examined theexpression of CPT1A and B mRNA in peripheral and braintissues from White Leghorn chickens. Expression of CPT1BmRNA in brain tissue was confirmed at levels similar to thosein adipose tissue, but 100 times lower than in pectoral muscle.Background levels were seen in liver tissue (Fig. 1A). Whenbrain regions from 1 wk old chicks were analyzed, the highestexpression was found in hypothalamus, mesencephalon, andoptic tectum (Fig. 1B). Levels of CPT1A mRNA were high inliver compared with the other analyzed tissues (Fig. 1C) andwere not elevated in hypothalamus compared with the otherbrain regions (Fig. 1D).
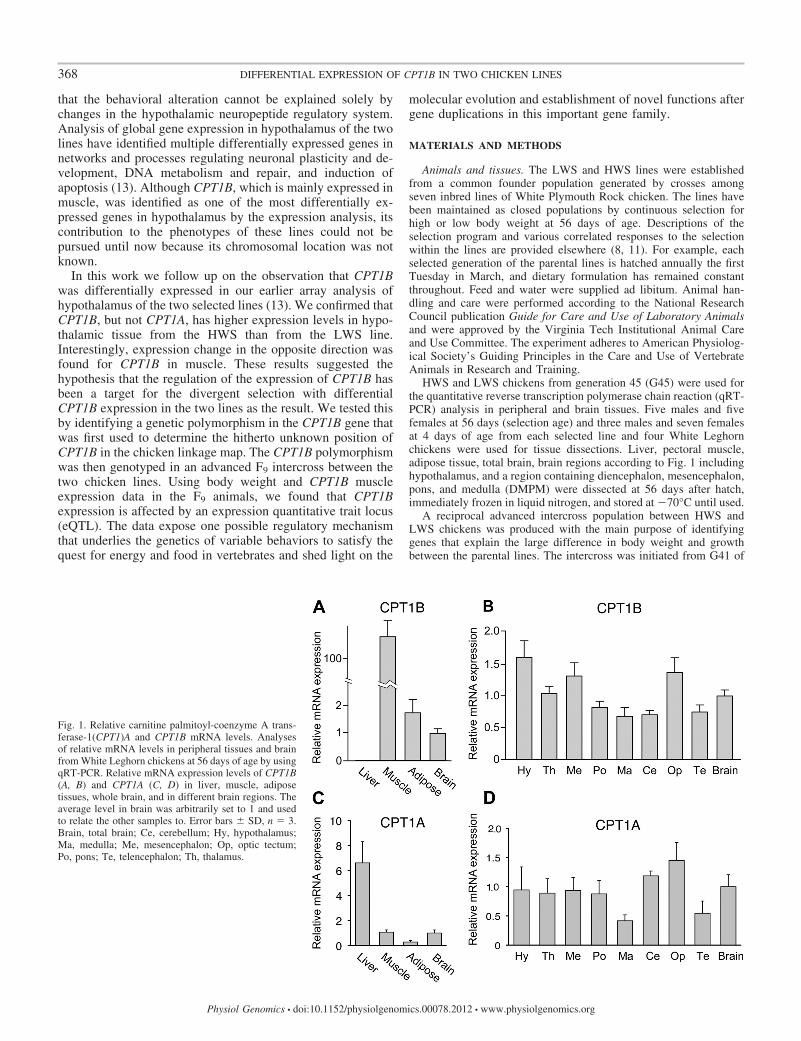
Differential CPT1B mRNA expression between HWS andLWS chicken in muscle and hypothalamus. The overall relativeCPT1B mRNA levels in muscle, liver, adipose, and brain tissuefrom the two selection lines were similar to those in WhiteLeghorn chicken tissue. However, in a comparison of the twolines, the expression in muscle was significantly higher (P �0.01) (adipose tissue borderline significantly higher, P � 0.06)in the LWS than HWS line (Fig. 2A). A differential hypotha-lamic CPT1B expression between the lines was initially sug-gested by one probe set in an Affymetrix array analysis (13)
Fig. 2. Relative CPT1B and CPT1A mRNA levels in the high-weight selection (HWS) and low-weight selection (LWS) lines. Relative mRNA expression levelswere analyzed in peripheral tissues and brain of HWS and LWS chickens. CPT1B mRNA expression in liver, muscle, adipose tissues and whole brain from56-day-old individuals (A), in hypothalamus of 4 and 56 days of age individuals by using Affymetric array analysis or qRT-PCR analysis (B), and in differentbrain regions from HWS and LWS individuals at 56 days of age (C). D: CPT1A mRNA expression in liver, muscle, adipose tissues, whole brain, andhypothalamus from 56-day old male lines. The average level in brain (A, C, D) and in HWS hippocampus (B) was arbitrarily set to 1 and was used to relate othersamples to. Error bars � SD. One-way ANOVA with Tukey’s multiple-comparison post hoc test. *P � 0.05, **P � 0.01, ***P � 0.001. 4M, 4-day-old males,n � 3 each line; 4F, 4-day-old females, n � 7 each line; 56M, 56-day-old males, n � 5 each line; 56F, 56-day-old females, n � 5 each line (n � 4 for eachof the HWS and LWS individuals for the other experimental groups). DMPM, a brain region consisting of diencephalons, mesencephalon, pons, and medulla(including hypothalamus).
370 DIFFERENTIAL EXPRESSION OF CPT1B IN TWO CHICKEN LINES
Physiol Genomics • doi:10.1152/physiolgenomics.00078.2012 • www.physiolgenomics.org
(probe ID: Gga.9299.1.S1_at, Reference sequence BU413970)having 99.9% sequence identity to the chicken CPT1B (acces-sion number DQ314726) (Fig. 2B). This differential expres-sion, with higher levels in the HWS than LWS line, wasconfirmed by qRT-PCR analysis in both hypothalamus from 4and 56 days of age and from both sexes (Fig. 2B) but not inwhole brain tissue, cerebellum, optic tectum, or in telenceph-alon (Fig. 2C). It is noteworthy that the differential CPT1BmRNA expression with high levels in the LWS line in muscleand adipose tissue was reversed in hypothalamus with signif-icantly lower levels (P � 0.05) in the LWS than HWS line.Differential CPT1A expression was not seen (Fig. 2D).
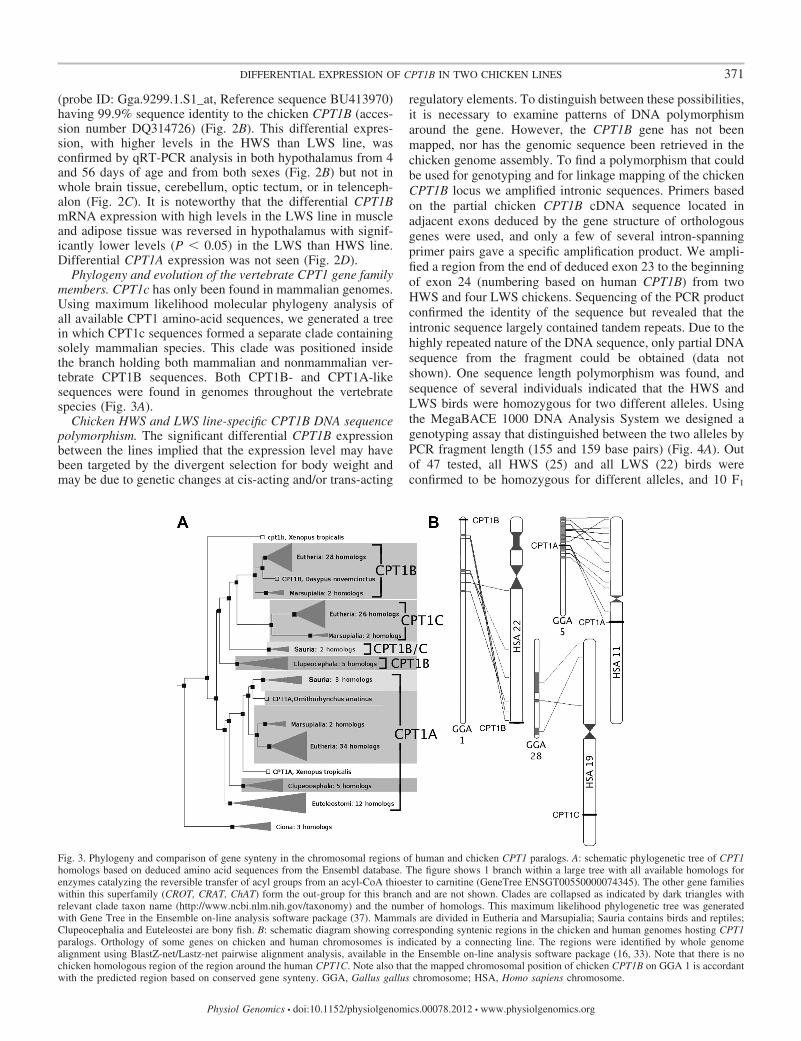
Phylogeny and evolution of the vertebrate CPT1 gene familymembers. CPT1c has only been found in mammalian genomes.Using maximum likelihood molecular phylogeny analysis ofall available CPT1 amino-acid sequences, we generated a treein which CPT1c sequences formed a separate clade containingsolely mammalian species. This clade was positioned insidethe branch holding both mammalian and nonmammalian ver-tebrate CPT1B sequences. Both CPT1B- and CPT1A-likesequences were found in genomes throughout the vertebratespecies (Fig. 3A).
Chicken HWS and LWS line-specific CPT1B DNA sequencepolymorphism. The significant differential CPT1B expressionbetween the lines implied that the expression level may havebeen targeted by the divergent selection for body weight andmay be due to genetic changes at cis-acting and/or trans-acting
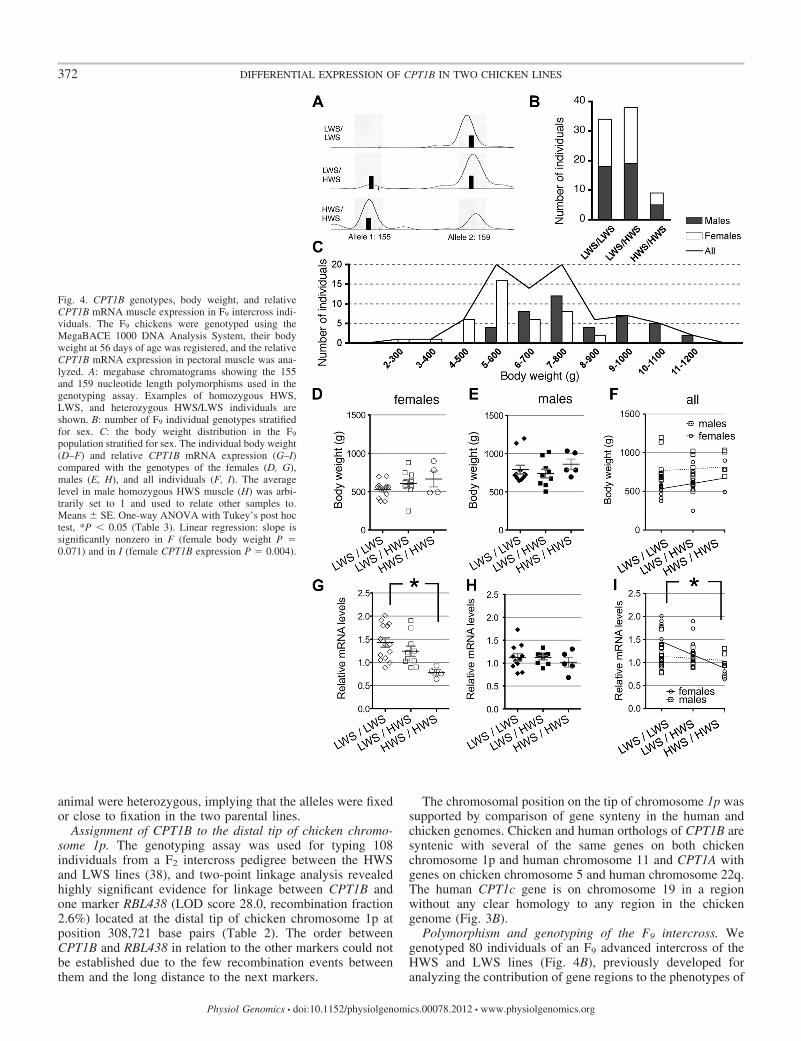
regulatory elements. To distinguish between these possibilities,it is necessary to examine patterns of DNA polymorphismaround the gene. However, the CPT1B gene has not beenmapped, nor has the genomic sequence been retrieved in thechicken genome assembly. To find a polymorphism that couldbe used for genotyping and for linkage mapping of the chickenCPT1B locus we amplified intronic sequences. Primers basedon the partial chicken CPT1B cDNA sequence located inadjacent exons deduced by the gene structure of orthologousgenes were used, and only a few of several intron-spanningprimer pairs gave a specific amplification product. We ampli-fied a region from the end of deduced exon 23 to the beginningof exon 24 (numbering based on human CPT1B) from twoHWS and four LWS chickens. Sequencing of the PCR productconfirmed the identity of the sequence but revealed that theintronic sequence largely contained tandem repeats. Due to thehighly repeated nature of the DNA sequence, only partial DNAsequence from the fragment could be obtained (data notshown). One sequence length polymorphism was found, andsequence of several individuals indicated that the HWS andLWS birds were homozygous for two different alleles. Usingthe MegaBACE 1000 DNA Analysis System we designed agenotyping assay that distinguished between the two alleles byPCR fragment length (155 and 159 base pairs) (Fig. 4A). Outof 47 tested, all HWS (25) and all LWS (22) birds wereconfirmed to be homozygous for different alleles, and 10 F1
Fig. 3. Phylogeny and comparison of gene synteny in the chromosomal regions of human and chicken CPT1 paralogs. A: schematic phylogenetic tree of CPT1homologs based on deduced amino acid sequences from the Ensembl database. The figure shows 1 branch within a large tree with all available homologs forenzymes catalyzing the reversible transfer of acyl groups from an acyl-CoA thioester to carnitine (GeneTree ENSGT00550000074345). The other gene familieswithin this superfamily (CROT, CRAT, ChAT) form the out-group for this branch and are not shown. Clades are collapsed as indicated by dark triangles withrelevant clade taxon name (http://www.ncbi.nlm.nih.gov/taxonomy) and the number of homologs. This maximum likelihood phylogenetic tree was generatedwith Gene Tree in the Ensemble on-line analysis software package (37). Mammals are divided in Eutheria and Marsupialia; Sauria contains birds and reptiles;Clupeocephalia and Euteleostei are bony fish. B: schematic diagram showing corresponding syntenic regions in the chicken and human genomes hosting CPT1paralogs. Orthology of some genes on chicken and human chromosomes is indicated by a connecting line. The regions were identified by whole genomealignment using BlastZ-net/Lastz-net pairwise alignment analysis, available in the Ensemble on-line analysis software package (16, 33). Note that there is nochicken homologous region of the region around the human CPT1C. Note also that the mapped chromosomal position of chicken CPT1B on GGA 1 is accordantwith the predicted region based on conserved gene synteny. GGA, Gallus gallus chromosome; HSA, Homo sapiens chromosome.
371DIFFERENTIAL EXPRESSION OF CPT1B IN TWO CHICKEN LINES
Physiol Genomics • doi:10.1152/physiolgenomics.00078.2012 • www.physiolgenomics.org
animal were heterozygous, implying that the alleles were fixedor close to fixation in the two parental lines.
Assignment of CPT1B to the distal tip of chicken chromo-some 1p. The genotyping assay was used for typing 108individuals from a F2 intercross pedigree between the HWSand LWS lines (38), and two-point linkage analysis revealedhighly significant evidence for linkage between CPT1B andone marker RBL438 (LOD score 28.0, recombination fraction2.6%) located at the distal tip of chicken chromosome 1p atposition 308,721 base pairs (Table 2). The order betweenCPT1B and RBL438 in relation to the other markers could notbe established due to the few recombination events betweenthem and the long distance to the next markers.
The chromosomal position on the tip of chromosome 1p wassupported by comparison of gene synteny in the human andchicken genomes. Chicken and human orthologs of CPT1B aresyntenic with several of the same genes on both chickenchromosome 1p and human chromosome 11 and CPT1A withgenes on chicken chromosome 5 and human chromosome 22q.The human CPT1c gene is on chromosome 19 in a regionwithout any clear homology to any region in the chickengenome (Fig. 3B).
Polymorphism and genotyping of the F9 intercross. Wegenotyped 80 individuals of an F9 advanced intercross of theHWS and LWS lines (Fig. 4B), previously developed foranalyzing the contribution of gene regions to the phenotypes of
Fig. 4. CPT1B genotypes, body weight, and relativeCPT1B mRNA muscle expression in F9 intercross indi-viduals. The F9 chickens were genotyped using theMegaBACE 1000 DNA Analysis System, their bodyweight at 56 days of age was registered, and the relativeCPT1B mRNA expression in pectoral muscle was ana-lyzed. A: megabase chromatograms showing the 155and 159 nucleotide length polymorphisms used in thegenotyping assay. Examples of homozygous HWS,LWS, and heterozygous HWS/LWS individuals areshown. B: number of F9 individual genotypes stratifiedfor sex. C: the body weight distribution in the F9
population stratified for sex. The individual body weight(D–F) and relative CPT1B mRNA expression (G–I)compared with the genotypes of the females (D, G),males (E, H), and all individuals (F, I). The averagelevel in male homozygous HWS muscle (H) was arbi-trarily set to 1 and used to relate other samples to.Means � SE. One-way ANOVA with Tukey’s post hoctest, *P � 0.05 (Table 3). Linear regression: slope issignificantly nonzero in F (female body weight P �0.071) and in I (female CPT1B expression P � 0.004).
372 DIFFERENTIAL EXPRESSION OF CPT1B IN TWO CHICKEN LINES
Physiol Genomics • doi:10.1152/physiolgenomics.00078.2012 • www.physiolgenomics.org
the two lines. Body weight measurements and skeletal muscletissue had been collected from each individual in the F9
intercross. The body weight at 8 wk was 200–900 g in femalesand 600–1,200 g in males (Fig. 4C). Comparisons of HWS andLWS genotypes and body weights did not reveal any signifi-cant association even when stratified for sex (Fig. 4, D–F). Atrend for association between lower body weight and the LWSgenotype in females could be seen (P � 0.06, Fig. 4F). Therelative CPT1B mRNA levels in pectoral muscle from the F9
intercross individuals were analyzed by qRT-PCR and werecompared with the genotypes of the individuals. CPT1BmRNA levels were significantly associated with genotype infemales (Table 3). Although the association was significantwhen all individuals were taken into consideration, it was notwhen analyzed only for males (Fig. 4, G–I).
The association, after nine generations of intercrosses, be-tween genotype (LWS CPT1B allele) and high mRNA levels infemale pectoral muscle (Fig. 4G) showed that the CPT1B locusis linked to an eQTL for CPT1B expression in muscle in theselines. We could not analyze the expression in hypothalamusbecause hypothalamus was not sampled at the time when the F9
intercross was collected. CPT1A mRNA expression was alsoanalyzed, but no differential expression between genotypes inthe F9 intercross was seen (data not shown), in line with theobservation of no difference between the lines (Fig. 2D). Whenwe re-examined the QTL data from previous intercross analy-sis with respect to the markers on the tip of chromosome 1pwith the CPT1B gene, there was no evidence for a significantQTL for growth that overlapped with the RBL438 marker (11,28, 38). This indicated that the CPT1B locus is not a majorQTL for growth under the investigated experimental condi-tions.
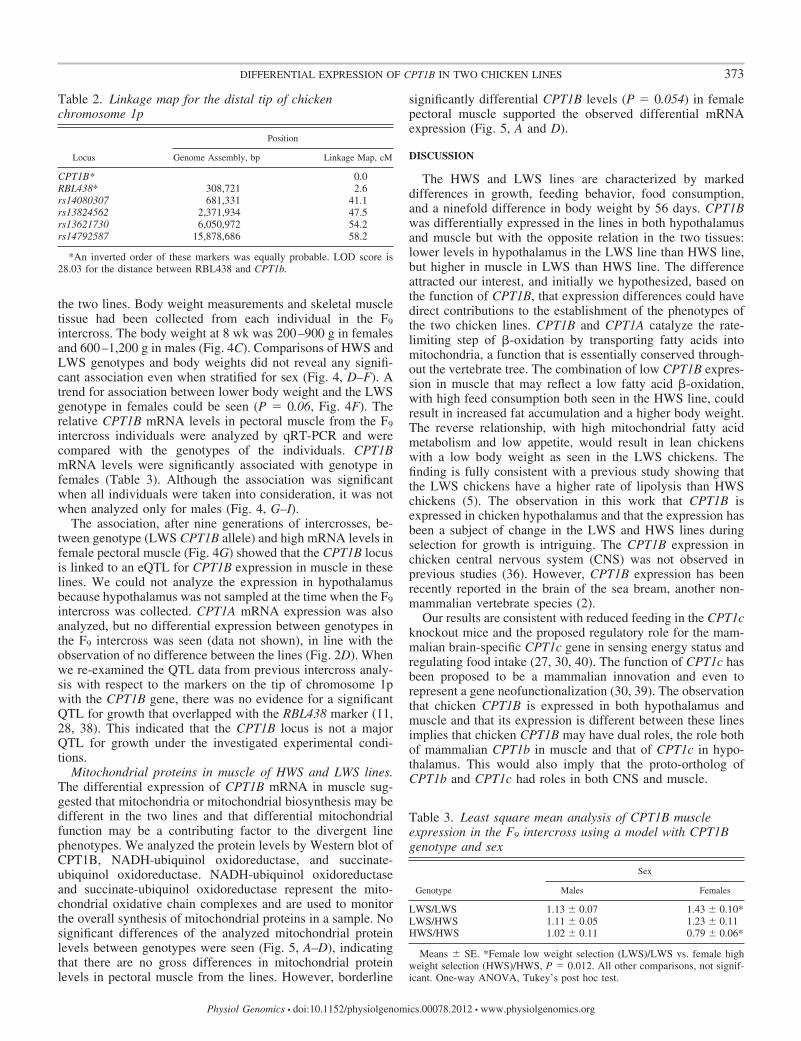
Mitochondrial proteins in muscle of HWS and LWS lines.The differential expression of CPT1B mRNA in muscle sug-gested that mitochondria or mitochondrial biosynthesis may bedifferent in the two lines and that differential mitochondrialfunction may be a contributing factor to the divergent linephenotypes. We analyzed the protein levels by Western blot ofCPT1B, NADH-ubiquinol oxidoreductase, and succinate-ubiquinol oxidoreductase. NADH-ubiquinol oxidoreductaseand succinate-ubiquinol oxidoreductase represent the mito-chondrial oxidative chain complexes and are used to monitorthe overall synthesis of mitochondrial proteins in a sample. Nosignificant differences of the analyzed mitochondrial proteinlevels between genotypes were seen (Fig. 5, A–D), indicatingthat there are no gross differences in mitochondrial proteinlevels in pectoral muscle from the lines. However, borderline
significantly differential CPT1B levels (P � 0.054) in femalepectoral muscle supported the observed differential mRNAexpression (Fig. 5, A and D).
DISCUSSION
The HWS and LWS lines are characterized by markeddifferences in growth, feeding behavior, food consumption,and a ninefold difference in body weight by 56 days. CPT1Bwas differentially expressed in the lines in both hypothalamusand muscle but with the opposite relation in the two tissues:lower levels in hypothalamus in the LWS line than HWS line,but higher in muscle in LWS than HWS line. The differenceattracted our interest, and initially we hypothesized, based onthe function of CPT1B, that expression differences could havedirect contributions to the establishment of the phenotypes ofthe two chicken lines. CPT1B and CPT1A catalyze the rate-limiting step of �-oxidation by transporting fatty acids intomitochondria, a function that is essentially conserved through-out the vertebrate tree. The combination of low CPT1B expres-sion in muscle that may reflect a low fatty acid �-oxidation,with high feed consumption both seen in the HWS line, couldresult in increased fat accumulation and a higher body weight.The reverse relationship, with high mitochondrial fatty acidmetabolism and low appetite, would result in lean chickenswith a low body weight as seen in the LWS chickens. Thefinding is fully consistent with a previous study showing thatthe LWS chickens have a higher rate of lipolysis than HWSchickens (5). The observation in this work that CPT1B isexpressed in chicken hypothalamus and that the expression hasbeen a subject of change in the LWS and HWS lines duringselection for growth is intriguing. The CPT1B expression inchicken central nervous system (CNS) was not observed inprevious studies (36). However, CPT1B expression has beenrecently reported in the brain of the sea bream, another non-mammalian vertebrate species (2).
Our results are consistent with reduced feeding in the CPT1cknockout mice and the proposed regulatory role for the mam-malian brain-specific CPT1c gene in sensing energy status andregulating food intake (27, 30, 40). The function of CPT1c hasbeen proposed to be a mammalian innovation and even torepresent a gene neofunctionalization (30, 39). The observationthat chicken CPT1B is expressed in both hypothalamus andmuscle and that its expression is different between these linesimplies that chicken CPT1B may have dual roles, the role bothof mammalian CPT1b in muscle and that of CPT1c in hypo-thalamus. This would also imply that the proto-ortholog ofCPT1b and CPT1c had roles in both CNS and muscle.
Table 2. Linkage map for the distal tip of chickenchromosome 1p
Locus
Position
Genome Assembly, bp Linkage Map, cM
CPT1B* 0.0RBL438* 308,721 2.6rs14080307 681,331 41.1rs13824562 2,371,934 47.5rs13621730 6,050,972 54.2rs14792587 15,878,686 58.2
*An inverted order of these markers was equally probable. LOD score is28.03 for the distance between RBL438 and CPT1b.
Table 3. Least square mean analysis of CPT1B muscleexpression in the F9 intercross using a model with CPT1Bgenotype and sex
Genotype
Sex
Males Females
LWS/LWS 1.13 � 0.07 1.43 � 0.10*LWS/HWS 1.11 � 0.05 1.23 � 0.11HWS/HWS 1.02 � 0.11 0.79 � 0.06*
Means � SE. *Female low weight selection (LWS)/LWS vs. female highweight selection (HWS)/HWS, P � 0.012. All other comparisons, not signif-icant. One-way ANOVA, Tukey’s post hoc test.
373DIFFERENTIAL EXPRESSION OF CPT1B IN TWO CHICKEN LINES
Physiol Genomics • doi:10.1152/physiolgenomics.00078.2012 • www.physiolgenomics.org
Mammals have three CPT1 paralogs, while nonmammalianvertebrates have two. Orthologs of CPT1A and CPT1B arefound in genomes throughout the vertebrate tree, and phylog-eny displays two monophyletic clades joined by a commonroot shared with agnathan and nonvertebrate CPT1 homologs.CPT1A and B are both located in two well-characterizedparalogons that were formed by the two total genome dou-blings at the base of the vertebrate tree (24). This stronglyindicates that vertebrate CPT1A and CPT1B were generated bythese genome doublings. All hitherto identified CPT1c or-thologs form one clade within the branch with CPT1B se-quences, separate from those of CPT1A (Fig. 3A), and sinceCPT1c only has been found in mammalian genomes, we concludethat CPT1c was formed by a duplication after the divergence ofsauropsids including chicken but before the mammalian speciesradiation. Our data showing a resemblance between mamma-lian CPT1c and chicken CPT1B but not CPT1A in the modeof regulation also suggest that chicken CPT1B rather thanCPT1A represents the proto-orthologous homolog to mam-malian CPT1c (and CPT1b). Furthermore, when the expres-sion of CPT1A and B was analyzed in hypothalamus,CPT1B but not CPT1A levels were elevated in hypothala-mus compared with the other brain regions. We suggest thatthe gene function in the proto-orthologous CPT1b/c wasdivided on the mammalian CPT1b and CPT1c paralogs and istherefore an initial subfunctionalization event with a rapidlydiverging CPT1c gene taking on the regulatory CNS functionsbut leaving the metabolic functions in muscle to the otherparalog: CPT1b. We also suggest that the fixation of two suchgene functions would have been accelerated by the presence ofdifferent regulatory genetic polymorphisms, similar to whathave been suggested in this study.
The phenotypes of the HWS and LWS chicken are a resultof selection at multiple loci across the genome. A recent
genome-wide analysis of 60,000 single nucleotide polymor-phisms in the lines identified �100 chromosomal regions thathave been divergently selected for during the 50 generationsafter the start of the selection (12). The analysis was restrictedto sequences present in the chicken genome assembly, andtherefore the CPT1B region not analyzed. The distal portion ofchicken chromosome 1p, which is present in the assembly andpresumably is adjacent to the CPT1B-region, shows a small butsignificant elevation of the signal for divergent selection in thelines (12). This suggests that the marked allele frequencydifference at the CPT1B locus between the lines is not a resultof genetic drift during the development of the HWS and LWSlines. It was unexpected that the allele frequency of the CPT1BHWS allele had dropped from 0.5 in the F1 generation to 0.35in the F9 generation (Fig. 4B) as the design with 40 pair-matings in each intercross generation should reduce randomgenetic drift. However, at present we cannot exclude thepossibility that this change in allele frequency is due to drift,but an alternative explanation would be that the HWS homozy-gotes have a lower viability or reduced fertility.
At least 13 QTL modifying growth have been detected (11,28, 38). CPT1B was assigned by linkage analysis to the distaltip of chromosome 1p. The absence of a QTL for growth on thetip of chicken chromosome 1 shows that the CPT1B locus isnot a major QTL for growth in these lines. However, there areseveral reasons why our QTL analysis may have failed todetect a QTL although it exists. First, it may be due to lack ofpower, although an F2 generation of 800 birds was used. Ourprevious studies have shown that a large number of QTL eachwith a rather small individual effect are underlying the dra-matic phenotypic differences between the HWS and LWSlines. Second, epistatic interaction between QTL has contrib-uted significantly to the selection response in these lines (6),making QTL detection even more challenging. Third, most F2
Fig. 5. Mitochondrial protein in muscle from HWS and LWSlines. Mitochondrial protein levels were analyzed by Westernblot analysis of pectoral muscle tissues from HWS and LWSline female and males. Each sample was normalized to the actinlevel, and the levels relative to the mean levels of the femaleLWS protein for CPT1B (A), NADH-ubiquinol oxidoreductase(NUO, B), and succinate-ubiquinol oxidoreductase (SUO, C)are shown in the graphs stratified for sex. D: Western blot gelimages for the female samples are shown. Means � SE.One-way ANOVA with Tukey’s post hoc test, n � 5. F,females; M, males; kD, kiloDalton.
374 DIFFERENTIAL EXPRESSION OF CPT1B IN TWO CHICKEN LINES
Physiol Genomics • doi:10.1152/physiolgenomics.00078.2012 • www.physiolgenomics.org
individuals have an intermediate body weight, and it is possiblethat the CPT1B locus has a more pronounced effect at the moreextreme body weights present in purebred HWS and/or LWSchickens. The preserved association between high CPT1BmRNA expression in pectoral muscle and the LWS genotypeeven after nine generations of intercrosses strongly suggeststhat the differential expression of CPT1B has a genetic com-ponent (Fig. 4G). We therefore conclude that the differentialexpression in muscle between lines most likely is caused by acis-acting eQTL.
It is very unlikely that the line-specific intronic sequencepolymorphism that was used for mapping and genotyping inthis study is by itself the regulatory mutation. Repeated at-tempts were made to isolate and sequence other nonexonicregions of the gene but were not successful. The difficulties inamplifying and sequencing the intron sequence and the factthat the region containing CPT1B on the distal chromosome 1pis missing from the chicken genome assembly suggest that theregion contains DNA with a repetitious nature that is difficultto sequence or even amplify. The poor coverage of this regionmay in fact have affected the result in the previously performedQTL analyses.
The gene structure of chicken CPT1B is not known, but otherCPT1 homologs all have a complex gene structures with �18exons and alternative splicing in the 5=-end of the gene (42).Transcripts with different 5=-exons encoding different 5=-untrans-lated region (UTR) sequences indicate different transcriptionalstart sites and the existence of multiple regulatory elements thateach separately may confer tissue-specific expression (http://www.ensembl.org; human CPT1A ENSG00000110090, CPT1BENSG00000205560, CPT1C ENSG00000169169). The hypotha-lamic and muscle-specific chicken CPT1B expressions can there-fore be regulated separately by unique regulatory elements thatwould allow for accumulation of cis- as well as trans-actingmutations with opposite effects in the two lines during the courseof divergent selection. Such a mode of regulation is consistentwith results showing that the human CPT1c 5=-UTR containsrepressing sequences under the regulation of specific conditions ofcellular energy availability (22).
Malonyl-CoA regulates lipid and glucose metabolism inskeletal muscle (3, 31). The levels of malonyl-CoA are phys-iologically regulated by fasting and feeding, and increasingamounts of evidence support a role for malonyl-CoA as asignaling mediator of energy balance in the CNS (10). Phar-macological inhibition of CPT1 in the CNS inhibits foodintake, suggesting that malonyl-CoA may suppress food intakethrough a CNS-expressed CPT1 (27). A similar regulatory rolein the chicken brain is suggested by the differential expressionof CPT1B without a general change in mitochondrial biogen-esis and regulation at 56 days as indicated by similar levels ofNADH-ubiquinol oxidoreductase and succinate-ubiquinol ox-idoreductase in muscle in the lines (Fig. 5). The AMP-activatedprotein kinase modulates the malonyl-CoA concentrations byregulating Acetyl-CoA carboxylases and is thereby linked viathe malonyl-CoA signaling mechanism to the role of CPT1 (1).In a recent experiment, food intake was studied after stimula-tion or inhibition of the AMP-activated protein kinase in thechicken lines used in this study (41). The result showeddifferences between the lines in the responses after the activityof the AMP-activated protein kinase was manipulated. The
differential CPT1B expression identified in this study may beone of the factors that contribute to these different responses.
We propose that altered regulation of CPT1B expression inboth hypothalamus and peripheral tissue is one importantmechanism underlying the remarkable differences in appetite,fat deposition, and growth between the HWS and LWS lines.This is supported by the findings that 1) the two lines are fixedor nearly fixed for different CPT1B alleles and 2) a cis-actingeQTL affects CPT1B expression at least in muscle. Our geneticdata and expression data suggest that both cis-acting andtrans-acting factors contribute to the differential CPT1B ex-pression in these lines. The increased expression of CPT1B inhypothalamus and its reduced expression in muscle are con-sistent with increased appetite and food intake in the HWS lineand at the same time reduced fatty acid oxidation in muscle,yielding a maximum net accumulation of energy intake andstorage. This inverse regulation of CPT1B expression, uncov-ered by the divergent selection for growth, may constitute amechanism that promotes fast accumulation of energy storesby combining large appetite and low fatty acid oxidation andmetabolism in the peripheral tissues. In nature this kind ofregulation may have been favorable for animals when efficientand fast accumulation of sufficient energy stores is required,for example during preparations for winter hibernation orlong-distance migration that are performed by many birdsevery year. The normal satiety mechanisms should in suchcases be set out of play, in order for the individual to collectsufficient reserves of energy. The results presented in this studythus uncover one link in the complex network that regulatesenergy homeostasis and appetite, which underlies the geneticfoundation for our variable responses that drive behaviors tosatisfy our quest for energy and food.
ACKNOWLEDGMENTS
Present addresses: S. Ka, Lab of Adipocyte and Metabolism Research. Inst.of Molecular Biology and Genetics, Seoul National Univ., Seoul, Korea; P.Wahlberg, Dept. of Medical Sciences, Molecular Medicine, Uppsala Univ.,Uppsala, Sweden; F. W. Albert, Lewis-Sigler Inst. for Integrative Genomics,Princeton Univ., Princeton, NJ; P. M. Garcia-Roves, Diabetes and ObesityLaboratory, Institut d’Investigacions Biomediques August Pi Sunyer, Barce-lona, Spain; E. Markljung, Dept. of Women’s and Children’s Health, Center ofMolecular Medicine, Karolinska Inst., Stockholm, Sweden.
GRANTS
The work was supported by the Swedish Research Council (20859-01-3,12187-15-3); the Swedish Research Council for Environment, AgriculturalSciences and Spatial Planning; Barncancerfonden (PROJ09/038); and a grantfrom the Swedish foundation for strategic research.
DISCLOSURES
No conflicts of interest, financial or otherwise, are declared by the author(s).
AUTHOR CONTRIBUTIONS
Author contributions: S.K., E.M., H.R., M.H.-OR., P.W., and D.M.D.performed experiments; S.K., E.M., H.R., F.W.A., P.W., P.M.G.-R., J.R.Z.,D.M.D., S.P., P.B.S., L.A., and F.H. analyzed data; S.K., E.M., H.R., F.W.A.,P.W., L.A., and F.H. interpreted results of experiments; S.K. prepared figures;S.K., E.M., H.R., F.W.A., M.H.-OR., P.W., P.M.G.-R., J.R.Z., D.M.D., S.P.,P.B.S., L.A., and F.H. approved final version of manuscript; F.W.A., P.B.S.,L.A., and F.H. edited and revised manuscript; P.M.G.-R., J.R.Z., D.M.D., S.P.,P.B.S., L.A., and F.H. conception and design of research; F.H. draftedmanuscript.
375DIFFERENTIAL EXPRESSION OF CPT1B IN TWO CHICKEN LINES
Physiol Genomics • doi:10.1152/physiolgenomics.00078.2012 • www.physiolgenomics.org
REFERENCES
1. Abu-Elheiga L, Matzuk MM, Abo-Hashema KA, Wakil SJ. Continu-ous fatty acid oxidation and reduced fat storage in mice lacking acetyl-CoA carboxylase 2. Science 291: 2613–2616, 2001.
2. Boukouvala E, Leaver MJ, Favre-Krey L, Theodoridou M, Krey G.Molecular characterization of a gilthead sea bream (Sparus aurata) muscletissue cDNA for carnitine palmitoyltransferase 1B (CPT1B). CompBiochem Physiol B Biochem Mol Biol 157: 189–197, 2010.
3. Bouzakri K, Austin R, Rune A, Lassman ME, Garcia-Roves PM,Berger JP, Krook A, Chibalin AV, Zhang BB, Zierath JR. Malonylcoenzyme A decarboxylase regulates lipid and glucose metabolism inhuman skeletal muscle. Diabetes 57: 1508–1516, 2008.
4. Burkhart CA, Cherry JA, Van Krey HP, Siegel PB. Genetic selectionfor growth rate alters hypothalamic satiety mechanisms in chickens. BehavGenet 13: 295–300, 1983.
5. Calabotta DF, Cherry JA, Siegel PB, Jones DE. Lipogenesis andlipolysis in fed and fasted chicks from high and low body weight lines.Poult Sci 64: 700–704, 1985.
6. Carlborg O, Jacobsson L, Ahgren P, Siegel P, Andersson L. Epistasisand the release of genetic variation during long-term selection. Nat Genet38: 418–420, 2006.
7. Denbow DM, Van Krey HP, Siegel PB. Selection for growth alters thefeeding response to injections of biogenic amines. Pharmacol BiochemBehav 24: 39–42, 1986.
8. Dunnington EA, Siegel PB. Long-term divergent selection for eight-weekbody weight in white Plymouth rock chickens. Poult Sci 75: 1168–1179,1996.
9. Garcia-Roves PM, Osler ME, Holmstrom MH, Zierath JR. Gain-of-function R225Q mutation in AMP-activated protein kinase gamma3 sub-unit increases mitochondrial biogenesis in glycolytic skeletal muscle. JBiol Chem 283: 35724–35734, 2008.
10. Hu Z, Cha SH, Chohnan S, Lane MD. Hypothalamic malonyl-CoA asa mediator of feeding behavior. Proc Natl Acad Sci USA 100: 12624–12629, 2003.
11. Jacobsson L, Park HB, Wahlberg P, Fredriksson R, Perez-Enciso M,Siegel PB, Andersson L. Many QTLs with minor additive effects areassociated with a large difference in growth between two selection lines inchickens. Genet Res 86: 115–125, 2005.
12. Johansson AM, Pettersson ME, Siegel PB, Carlborg O. Genome-wideeffects of long-term divergent selection. PLoS Genet 6: e1001188, 2010.
13. Ka S, Albert FW, Denbow M, Pääbo S, Siegel PB, Andersson L,Hallböök F. Differentially expressed genes in hypothalamus in relation togenomic regions under selection in two chicken lines resulting fromdivergent selection for high or low body weight. Neurogenetics 12:211–221, 2011.
14. Ka S, Kerje S, Bornold L, Liljegren U, Siegel PB, Andersson L,Hallböök F. Proviral integrations and expression of endogenous Avianleucosis virus during long term selection for high and low body weight intwo chicken lines. Retrovirology 6: 68, 2009.
15. Ka S, Lindberg J, Stromstedt L, Fitzsimmons C, Lindqvist N, Lun-deberg J, Siegel PB, Andersson L, Hallbook F. Extremely differentbehaviours in high and low body weight lines of chicken are associatedwith differential expression of genes involved in neuronal plasticity. JNeuroendocrinol 21: 208–216, 2009.
16. Kent WJ, Baertsch R, Hinrichs A, Miller W, Haussler D. Evolution’scauldron: duplication, deletion, and rearrangement in the mouse andhuman genomes. Proc Natl Acad Sci USA 100: 11484–11489, 2003.
17. Kim EK, Miller I, Landree LE, Borisy-Rudin FF, Brown P, Tihan T,Townsend CA, Witters LA, Moran TH, Kuhajda FP, Ronnett GV.Expression of FAS within hypothalamic neurons: a model for decreasedfood intake after C75 treatment. Am J Physiol Endocrinol Metab 283:E867–E879, 2002.
18. Kuo AY, Cline MA, Werner E, Siegel PB, Denbow DM. Leptin effectson food and water intake in lines of chickens selected for high or low bodyweight. Physiol Behav 84: 459–464, 2005.
19. Kuo AY, Lee JC, Magnin G, Siegel PB, Denbow DM. Differentialautonomic nervous system response in obese and anorexic chickens(Gallus gallus). Comp Biochem Physiol B Biochem Mol Biol 144: 359–364, 2006.
20. Lane MD, Wolfgang M, Cha SH, Dai Y. Regulation of food intake andenergy expenditure by hypothalamic malonyl-CoA. Int J Obes (Lond) 32,Suppl 4: S49–S54, 2008.
21. Livak KJ, Schmittgen TD. Analysis of relative gene expression datausing real-time quantitative PCR and the 2-delta delta C(T) method.Methods 25: 402–408, 2001.
22. Lohse I, Reilly P, Zaugg K. The CPT1C 5=UTR contains a repressingupstream open reading frame that is regulated by cellular energy avail-ability and AMPK. PloS One 6: e21486, 2011.
23. Lopez M, Lelliott CJ, Vidal-Puig A. Hypothalamic fatty acid metabo-lism: a housekeeping pathway that regulates food intake. Bioessays 29:248–261, 2007.
24. Lundin LG, Larhammar D, Hallbook F. Numerous groups of chromo-somal regional paralogies strongly indicate two genome doublings at theroot of the vertebrates. J Struct Funct Genomics 3: 53–63, 2003.
25. Marquez GC, Siegel PB, Lewis RM. Genetic diversity and populationstructure in lines of chickens divergently selected for high and low 8-weekbody weight. Poult Sci 89: 2580–2588, 2010.
26. McGarry JD, Foster DW. Regulation of hepatic fatty acid oxidation andketone body production. Annu Rev Biochem 49: 395–420, 1980.
27. Obici S, Feng Z, Arduini A, Conti R, Rossetti L. Inhibition of hypo-thalamic carnitine palmitoyltransferase-1 decreases food intake and glu-cose production. Nat Med 9: 756–761, 2003.
28. Park HB, Jacobsson L, Wahlberg P, Siegel PB, Andersson L. QTLanalysis of body composition and metabolic traits in an intercross betweenchicken lines divergently selected for growth. Physiol Genomics 25:216–223, 2006.
29. Pettersson M, Besnier F, Siegel PB, Carlborg O. Replication andexplorations of high-order epistasis using a large advanced intercross linepedigree. PLoS Genet 7: e1002180, 2011.
30. Price N, van der Leij F, Jackson V, Corstorphine C, Thomson R,Sorensen A, Zammit V. A novel brain-expressed protein related tocarnitine palmitoyltransferase I. Genomics 80: 433–442, 2002.
31. Rasmussen BB, Wolfe RR. Regulation of fatty acid oxidation in skeletalmuscle. Ann Rev Nutr 19: 463–484, 1999.
32. Ronnett GV, Kleman AM, Kim EK, Landree LE, Tu Y. Fatty acidmetabolism, the central nervous system, and feeding. Obesity (SilverSpring) 14, Suppl 5: 201S–207S, 2006.
33. Schwartz S, Kent WJ, Smit A, Zhang Z, Baertsch R, Hardison RC,Haussler D, Miller W. Human-mouse alignments with BLASTZ. Ge-nome Res 13: 103–107, 2003.
34. Shimokawa T, Kumar MV, Lane MD. Effect of a fatty acid synthaseinhibitor on food intake and expression of hypothalamic neuropeptides.Proc Natl Acad Sci USA 99: 66–71, 2002.
35. Siegel PB, Wisman EL. Selection for body weight at eight weeks of age.6 Changes of appetite and feed utilization. Poult Sci 45: 1391–1397, 1966.
36. Skiba-Cassy S, Collin A, Chartrin P, Medale F, Simon J, Duclos MJ,Tesseraud S. Chicken liver and muscle carnitine palmitoyltransferase 1:nutritional regulation of messengers. Comp Biochem Physiol B BiochemMol Biol 147: 278–287, 2007.
37. Vilella AJ, Severin J, Ureta-Vidal A, Heng L, Durbin R, Birney E.EnsemblCompara GeneTrees: complete, duplication-aware phylogenetictrees in vertebrates. Genome Res 19: 327–335, 2009.
38. Wahlberg P, Carlborg O, Foglio M, Tordoir X, Syvanen AC, LathropM, Gut IG, Siegel PB, Andersson L. Genetic analysis of an F(2)intercross between two chicken lines divergently selected for body-weight.BMC Genomics 10: 248, 2009.
39. Wolfgang MJ, Cha SH, Millington DS, Cline G, Shulman GI, Suwa A,Asaumi M, Kurama T, Shimokawa T, Lane MD. Brain-specific carni-tine palmitoyl-transferase-1c: role in CNS fatty acid metabolism, foodintake, and body weight. J Neurochem 105: 1550–1559, 2008.
40. Wolfgang MJ, Kurama T, Dai Y, Suwa A, Asaumi M, Matsumoto S,Cha SH, Shimokawa T, Lane MD. The brain-specific carnitine palmi-toyltransferase-1c regulates energy homeostasis. Proc Natl Acad Sci USA103: 7282–7287, 2006.
41. Xu P, Siegel PB, Denbow DM. AICAR and Compound C regulate foodintake independently of AMP-activated protein kinase in lines of chickensselected for high or low body weight. Comp Biochem Physiol A Mol IntegrPhysiol 159: 401–412, 2011.
42. Yamazaki N, Yamanaka Y, Hashimoto Y, Shinohara Y, Shima A,Terada H. Structural features of the gene encoding human muscle typecarnitine palmitoyltransferase I. FEBS Lett 409: 401–406, 1997.
376 DIFFERENTIAL EXPRESSION OF CPT1B IN TWO CHICKEN LINES
Physiol Genomics • doi:10.1152/physiolgenomics.00078.2012 • www.physiolgenomics.org


![carnitine deficiency[1]](https://img.pdfslide.net/doc/110x75/577d20c11a28ab4e1e93ae46/carnitine-deficiency1.jpg)