Embed Size (px)
Citation preview
Örebro University
School of medicine
Medicine, Advanced course
Degree project, 15 ECTS
May 2014
Expression of CD24 and CD44 in breast cancer cells
after cytotoxic drug exposure
Author: Daniel Forsman
Supervisor: Elisabet Tina, BMA, PhD
Laboratory technician supervisor: Anna Göthlin-Eremo,MSc
Clinical Research Center, Örebro, Sweden
i
ABSTRACT
Background
Each year approximately 1.38 million women are diagnosed with breast cancer and 458 000
die from the disease. Despite increasing knowledge about the risk factors and better therapies
the mortality rate remains high and is the leading cause of death from cancer in women. Two
cell surface markers, CD24 and CD44, can be used to identify cancer stem cells and have a
prognostic value for disease free survival. The aim of present study was to investigate how the
subpopulations of CD24+/CD44
- and CD24
+/CD44
+ cells changed when exposed to three
widely used cytostatic drugs.
Methods
The cell lines BT-474, MCF-7 and ZR-75-1 were analyzed for HER2 and ER protein
expression by Western blot and for gene expression by using qPCR. Further, BT-474 and
MCF-7 were exposed to three different cytostatic drugs tamoxifen, trastuzumab and paclitaxel
for 72h and then flow cytometry was used to analyze their expression of CD24 and CD44.
Results
ZR-75-1 overexpresses the HER2 receptor but shows a low expression of ER. The cell lines
BT-474 and MCF-7 both express the HER2 and ER but with intermediary values. Western
blot showed that all the cell lines have proteins corresponding to the ER but ZR-75-1 lacked
the HER2 protein, which seems to be an error from the western blot. MCF-7 showed an
increased expression of CD24+/CD44
+ when treated with paclitaxel and
trastuzumab/paclitaxel.
Conclusions
Exposure to cytostatic drugs does not result in a statistically significant change in the
expression of the CD24 and CD44 cell surface markers in the breast cancer cell lines.
ii
CONTENTS
ABSTRACT ................................................................................................................................ i
CONTENTS ............................................................................................................................... ii
ABBREVITIONS ...................................................................................................................... iii
INTRODUCTION ...................................................................................................................... 1
Subtypes in breast cancer ....................................................................................................... 1
Treatment ................................................................................................................................ 2
Cancer stem cells and the cell surface markers CD24 and CD44 .......................................... 3
Aim ......................................................................................................................................... 4
MATERIAL AND METHODS ................................................................................................. 4
Breast cancer cell lines ........................................................................................................... 4
Ethical considerations ............................................................................................................. 4
Extraction of DNA, RNA and proten ..................................................................................... 5
Synthesis of cDNA ................................................................................................................. 5
qPCR ....................................................................................................................................... 5
Protein concentration .............................................................................................................. 5
Western blot ............................................................................................................................ 6
Exposure to cytostatic drug .................................................................................................... 6
Flow cytometry ....................................................................................................................... 7
Statistics .................................................................................................................................. 7
RESULTS ................................................................................................................................... 9
Basal gene expression ............................................................................................................. 9
Western blot analysis ............................................................................................................ 10
Drug exposure alters CD24 and CD44 expression ............................................................... 11
Changes in cell cycle phase distribution ............................................................................... 12
DISCUSSION .......................................................................................................................... 14
CONCLUSION ........................................................................................................................ 15
ACKNOWLEDGEMENTS ..................................................................................................... 15
REFERENCES ......................................................................................................................... 16
iii
ABBREVITIONS
ADCC Antibody-dependent cell-mediated cytotoxicity
ATCC American type culture collection
CSC Cancer stem cell
ER Estrogen receptor
HER2 Human epidermal growth factor 2
MFI Median fluorescence intensity
PBS Phosphate buffer saline
PR Progesterone receptor
SD Standard deviation
qPCR Quantitative polymerase chain reaction
1
INTRODUCTION
Breast cancer is the most common form of cancer that affects women. Each year, 1.38 million
new cases are diagnosed and 485 000 women die due to the disease. The highest incidence
rate can be found in Western Europe and lowest in the developing countries [1]. The lifetime
risk of getting the disease is 1/8 but only 5 percent of the cases occur before the age of 40 [2].
The origin of breast cancer is not fully known although hereditary factors have shown to
affect its development and be the cause of 5-10% of the cases. Breast cancer normally arises
from epithelial cells that can be found within the breast, and show a great heterogeneity both
at molecular and clinical level, which complicates the choice of treatment [3]. Breast cancer is
primarily categorized depending on the localization (lobules or ducts) and the molecular
subtype.
Subtypes in breast cancer
To distinguish the different types of breast cancer from each other, five major molecular
subtypes, Luminal A, Luminal B, Normal breast-like, Human epidermal growth factor 2
(HER2) and Basal-like have been defined. The subtypes have different clinical outcomes and
respond with a great variety to cytostatic therapies. The luminal A and B subtypes show a
striking resemblance to the luminal cells in the breast and are both ER positive.
Approximately 70% of all cases of breast cancer are ER positive which makes it an important
factor when choosing between therapies [4]. Luminal A grows slowly and has high survival
rates and lower recurrence rates than luminal B which is more aggressive and also
overexpresses the HER2 receptor. The normal breast-like subtype are ER positive and
resembles normal breast tissue which have raised the question if this really should be defined
as a molecular subtype. The HER2 subtype is ER negative but overexpresses the HER2
receptor. It is highly aggressive and metastases to the brain can often be found. The basal-like
subtype is called “triple-negative” due to its absence of overexpressed ER-PR-HER2
receptors. It is aggressive and metastases to the brain and viscera. It can be found in women
with BRCA1 mutations and have a similar expression to the myoepithelial cells in the breast
with P-cadherin, P63 or laminin [5].
The breast epithelium is constantly exposed to estrogen and a high cumulative exposure
increases the risk of breast cancer [4]. Some factors that influence the cumulative exposure
are time of menarche, oral contraceptives, pregnancies and time of menopause [6]. Two
hypotheses exist to describe how the increased estrogen stimulation can lead to breast cancer.
2
First, stimulation of the estrogen receptor increases the proliferation of mammary cells, which
may lead to replication errors and mutations. Second, the metabolism of estrogen may give
rise to genotoxic products that result in mutations by damaging the DNA [7]. The estrogen
receptor can be found in two different isoypes, ERα and ERβ, which are expressed in various
levels in different tissues and are encoded by the genes ESR1 and ESR2 respectively. ESR1
can be found on chromosome 6 and ESR2 on chromosome 14 [8]. When the receptor is
activated it forms homodimers or heterodimers between the different ERα and ERβ and act as
a transcription factor upstream of genes by binding estrogen response elements [9]. ERα is
frequently upregulated in breast cancer and used to determine ER status in clinical patients
[10].
HER2 overexpression can be found in 20-30% of the breast cancer cases and is associated
with a more aggressive disease, decreased survival and high recurrence rate [11]. The HER2
gene can be found on chromosome 17 and codes for a transmembrane protein that have
tyrosine kinase activity [12]. HER2 has no known ligand but has the ability to undergo
dimerization with other EGF receptors such as EGFR (HER1), HER3 and HER4 and triggers
PI3K-Akt, MAPK, PLC-PKC, JAK-STAT –intracellular signaling pathways. The activation
of these pathways leads to cell-differentiation, -migration, -proliferation and inhibition of
apoptosis [13].
Treatment
Tamoxifen is used for the treatment of ER positive breast cancer and also has a preventive
effect in high-risk women [14]. It is used in both pre-menopausal women and post-
menopausal women with ER positive breast cancer, although post-menopausal women are
more often treated with aromatase inhibitors [15]. Tamoxifen is metabolized to 4-
hydroxytamoxifen and endoxifen in the liver by cytochrome P450 enzymes (e.g. CYP2D6
and CYP3A4) and the metabolites have a high affinity for the estrogen receptor [16]. 4-
hydroxytamoxifen and endoxifen bind the estrogen receptor competitively and acts as an
antagonist in the breast [17].
Herceptin (trastuzumab) is one of the most widely used therapies against HER2 positive
breast cancer due to its ability to block signaling through the HER2-receptor. It is a
monoclonal humanized antibody belonging to the immunoglobulin G1 type and binds the
extracellular domain of HER2. According to some theories, the Fc portion of the antibody
will activate natural killer cells which lead to antibody-dependent cell-mediated cytotoxicity
3
(ADCC) and the death of the cell. Trastuzumab also inhibits signaling by the PI3K pathway
which promotes apoptosis and arrest of proliferation [18].
Paclitaxel is a mitotic inhibitor that binds to and stabilizes B-tubulin which in turn inhibits the
microtubules instability. This leads to stabilization of the microtubule polymer and protects it
from disassembly [19]. The treated cells have defects in chromosome segregation and mitotic
spindle assembly and can no longer progress through the mitosis. This will eventually lead to
an activation of the mitochondrial pathway of apoptosis and cell death [20].
Cancer stem cells and the cell surface markers CD24 and CD44
Cancer stem cells (CSCs) are cells that can differentiate, undergo self-renewal and give rise to
all cells in the tumor. During the last decade, more and more research has been done in search
for surface markers in CSCs that can help predict initiation, invasion, metastasis,
heterogeneity and therapeutic resistance. The expressions of the different markers also have a
tendency to change in the tumor during its different stages which makes them hard to find and
draw any conclusions from. The cell surface markers CD24 and CD44 are associated with
CSCs and several studies have been made to extract these cells from breast cancer and normal
breast tissue [21].
CD24 is a small protein molecule that is heavily and distinctly glycosylated in different cells.
It has an important role/function in cell-matrix and cell-cell interactions. It is expressed in
multiple forms of cancer such as ovarian, prostate, renal, breast and lung cancer. Earlier
research have shown that it have an important role in both metastasis and cell adhesion and
therefore is a poor prognostic factor for disease free survival [22]. CD24 seems to be able to
be a ligand for P-selectin which can be found on platelets and endothelial cells and the
interaction facilitate the entry of tumor cells into the bloodstream [23].
CD44 is a transmembrane glycoprotein that is expressed on almost every cell and is a receptor
for hyaluronic acid. The binding between the receptor and hyaluronic acid promotes migration
and also transmits survival signals which are pro-oncogenic. The glycoprotein has a great
variety of functions and can present cytokines and chemokines for their complementary
receptor and regulates angiogenesis, differentiation, motility, survival and growth [24]. In
different forms of cancer there often occurs alternative splicing’s of CD44 which encodes for
different isoforms. One of these is osteopontin which is a chemokine-like protein and
promotes metastasis and invasiveness in several cancers [25, 26]. Women in late pregnancy
show a decreasing amount of CD44+ stem cells in the breast, which correlate well with the
4
theories of terminal differentiation caused from pregnancy [27]. This is one of the possible
reasons why women with pregnancies early in life might have an increased protection from
breast cancer [28].
Research made earlier has shown that the cell surface markers CD24-/CD44
+ CSC had a far
greater capacity to form tumors then CD24-/CD44
- in MCF-7 cell lines. The proportions of
CD24-/CD44
+ population of cells were also larger than in normal breast tissue [29]. The cell
lines BT-474 and MCF-7 have in earlier research shown high amounts of CD24+/CD44
+ and
low amounts of CD24+/CD44
+ cells when these are untreated. But no research about the effect
of trastuzumab, tamoxifen and paclitaxel on these subpopulations could be found.
Aim
The aim of this study is to analyze how three widely used cytostatic drugs tamoxifen,
trastuzumab and paclitaxel can affect the expression of CD24+/CD44
- and CD24
+/CD44
+ in
the MCF-7 and BT-474 cell lines.
MATERIAL AND METHODS
Breast cancer cell lines
All the cell lines were bought from American Type Culture Collection (ATCC) and they all
originate from breast cancer epithelium. MCF-7 and ZR-75-1 belongs to luminal A, and BT-
474 to luminal B subtype. The cell line MCF-7 was grown in an IMDM-phenol free medium
(Life technologies) with the addition of 10% Fetal bovine serum (FBS) and 10µg/ml insulin.
The BT-474 and ZR-75-1 cells were grown in RPMI -1640-phenolfree medium (Gibco® Life
technologies,Paisley,UK) and supplemented with 2.5% HEPES,10% FBS and BT-474 also
with an additional 10µg/ml insulin. The cell lines were grown in 75cm2 cell culture flasks and
the medium with its supplements were changed every three days to optimize cell growth. The
cells were kept in an incubator with a temperature of 37oC and 5% CO2.
Ethical considerations
No ethical approval was needed in the study as only cell lines were used. The patients consent
for using the cell lines in scientific research cannot be found in any records and in the
seventies a written consent were not always taken. Despite this the cells have been used for
over 40 years and the question still remains how similar the cells now are when compared to
the ones taken originally.
5
Extraction of DNA, RNA and proten
The cells from the cell lines BT-474, ZR-75-1 and MCF-7 were counted with a Bürker
chamber and duplicate samples with 1x10⁶ cells were taken from each cell line for DNA,
RNA and protein extraction with Allprep DNA/RNA/Protein mini kit
(Qiagen,Hilden,Germany). The instructions from the manufacturer were followed and the
protein dissolved in 5% SDS and stored in -20oC. The DNA was stored at -20
oC and RNA
was stored in -80oC for future use.
Synthesis of cDNA
Using a Nanodrop spectrophotometer, the concentration of RNA in the samples was measured
from the cell lines. Volumes corresponding to 1µg RNA were taken from each sample and
then used with a High capacity cDNA reverse transcription kit (Life technologies) according
to the manufacturer’s instructions. The cDNA was synthesized at 25°C for 10 min, 37°C for
120 min, 85°C for 5 min and cooled to 4°C by using the MJ Research PTC-200 Peltier
Thermal Cycler (GMI inc.Ramsey,MI). The cDNA was kept in -20oC for future use.
qPCR
For gene specific qPCR (quantitative polymerase chain reaction), 15µl Taqman®
mastermix
(Life technologies) 1.5 µl of the primers for ER (Hs00174860_m1), HER2
(Hs01001580_m1), B-actin (Hs99999903_m1), ABL (Hs01104728_m1) and 12µl MilliQ
water were mixed. 13.5µl of the solution were then added to a 96-well plate along with 1.5µl
(40ng) of cDNA. The plate was then put in a Biorad CFX96 C1000 Touch Termal Cylinder.
The plate was run at 2 min at 50oC and then 95
oC for 20sec, then 40 cycles of 95
oC for 3 sec
and 60oC for 30 sec. The Ct values were acquired and the standard deviation (SD) calculated
for the target genes and reference genes.
Protein concentration
Each protein sample was diluted with a factor of 2 and 5 before put into a 96 –well plate. As
reference, bovine serum albumin (BSA) (Sigma-Aldrich, A9418) was solved in MilliQ water
with known concentrations of 0, 0.2, 1.0 and 1.5 mg/ml and added into separate wells. DC
protein assay kit (Bio-rad,Copenhagen,Denmark) was used according to manufacturer’s
instructions. Absorbance was read at 750nm with multiskan ascent (Thermo
labsystem,Helsinki,Finland) and protein concentration calculated for each sample.
6
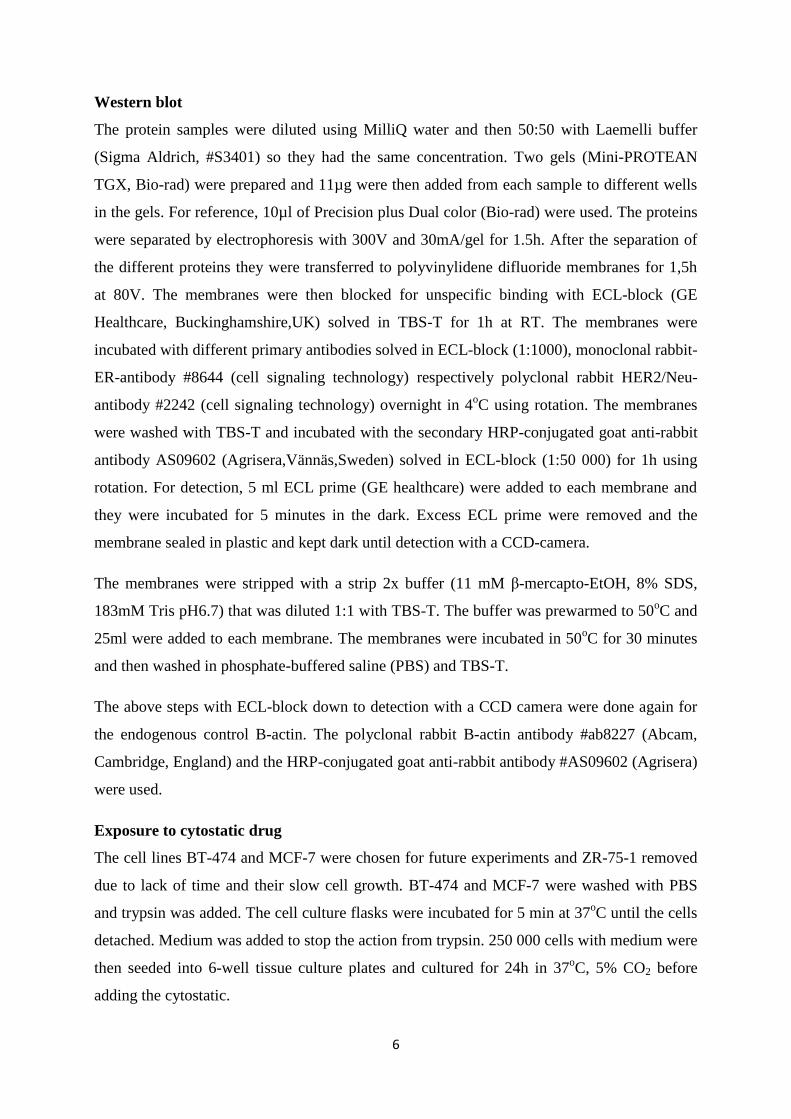
Western blot
The protein samples were diluted using MilliQ water and then 50:50 with Laemelli buffer
(Sigma Aldrich, #S3401) so they had the same concentration. Two gels (Mini-PROTEAN
TGX, Bio-rad) were prepared and 11µg were then added from each sample to different wells
in the gels. For reference, 10µl of Precision plus Dual color (Bio-rad) were used. The proteins
were separated by electrophoresis with 300V and 30mA/gel for 1.5h. After the separation of
the different proteins they were transferred to polyvinylidene difluoride membranes for 1,5h
at 80V. The membranes were then blocked for unspecific binding with ECL-block (GE
Healthcare, Buckinghamshire,UK) solved in TBS-T for 1h at RT. The membranes were
incubated with different primary antibodies solved in ECL-block (1:1000), monoclonal rabbit-
ER-antibody #8644 (cell signaling technology) respectively polyclonal rabbit HER2/Neu-
antibody #2242 (cell signaling technology) overnight in 4oC using rotation. The membranes
were washed with TBS-T and incubated with the secondary HRP-conjugated goat anti-rabbit
antibody AS09602 (Agrisera,Vännäs,Sweden) solved in ECL-block (1:50 000) for 1h using
rotation. For detection, 5 ml ECL prime (GE healthcare) were added to each membrane and
they were incubated for 5 minutes in the dark. Excess ECL prime were removed and the
membrane sealed in plastic and kept dark until detection with a CCD-camera.
The membranes were stripped with a strip 2x buffer (11 mM β-mercapto-EtOH, 8% SDS,
183mM Tris pH6.7) that was diluted 1:1 with TBS-T. The buffer was prewarmed to 50oC and
25ml were added to each membrane. The membranes were incubated in 50oC for 30 minutes
and then washed in phosphate-buffered saline (PBS) and TBS-T.
The above steps with ECL-block down to detection with a CCD camera were done again for
the endogenous control B-actin. The polyclonal rabbit B-actin antibody #ab8227 (Abcam,
Cambridge, England) and the HRP-conjugated goat anti-rabbit antibody #AS09602 (Agrisera)
were used.
Exposure to cytostatic drug
The cell lines BT-474 and MCF-7 were chosen for future experiments and ZR-75-1 removed
due to lack of time and their slow cell growth. BT-474 and MCF-7 were washed with PBS
and trypsin was added. The cell culture flasks were incubated for 5 min at 37oC until the cells
detached. Medium was added to stop the action from trypsin. 250 000 cells with medium were
then seeded into 6-well tissue culture plates and cultured for 24h in 37oC, 5% CO2 before
adding the cytostatic.
7
The cytostatic drugs used were (z)-4-hydroxytamoxifen (Sigma-Aldrich,H7904) with the
concentration of 10-6
M, Herceptin (Roche Pharma AG, Grenzach-Wyhlen,Germany) with the
concentration of 10µg/ml and paclitaxel (Actavis,Hafnarfjordur,Island) with the concentration
of 137µg/ml. The total volume added to each well was 2ml and consisted of medium with
supplements and the cytostatic drug. During the trials with a combination of Herceptin and
paclitaxel the same final concentration of 10µg/ml and 137µg/ml respectively were achieved.
The cells were exposed for the cytostatic drugs for 72h.
Flow cytometry
After 72h, the experiment was stopped and the cells were prepared for flow cytometry using
the Intrastain, fixation and permeabilization kit for flow cytometry (Dako,Glostrup,Denmark).
The old medium including dead cells were saved and the 6-well tissue culture plate cells were
washed with PBS. Trypsin was added and the cells incubated for 5 min at 37oC. When the
cells detached they were transferred to the old medium. The tubes were centrifuged for 5 min
at 300g and the supernatant discarded. 50µl of PBS were added and then 10µl CD44-FITC
(Beckman Coulter,Marseille,France), 10µl CD24-APC (Beckman Coulter),10µl IgG1-FITC
(Beckman Coulter) and 10µl IgG1-APC (Beckman Coulter) to the respective tubes. The tubes
were kept in the dark for 15 min, added 100µl reagent A and then incubated them again for
15min in the dark. The tubes were centrifuged for 5 min at 300g and the supernatant
discarded. 2ml PBS, 100µl Reagent B and 20µl DAPI viability dye (Beckman Coulter) were
added. The tubes were incubated in the dark for 15 min, centrifuged for 5 min at 300g and the
supernatant discarded. 500µl PBS was added to each tube before analyzing it. The GalliusTM
(Beckman Coulter, Brea,CA,USA) with blue laser (488 nm) for FITC-conjugated, red laser
(638 nm) for APC-conjugated and violet laser (405 nm) for DAPI detection were used. The
data were acquired with Kaluza Flow Cytometry Analysis v1.2 (Beckman Coulter) and the
proportion of CD24+/CD44
- and CD24
+/CD44
+ together with Median Fluorescent Intensity
(MFI) measured. MFI was calculated and ± standard deviation (SD) from the trials when
untreated (n=6) or when treated with Tamoxifen (n=4), Trastuzumab (n=4), Paclitaxel (n=4)
or Paclitaxel/Trastuzumab (n=4).
Statistics
Mean and SD for Median Fluorescence Intensity (MFI) and qPCR reference gene/target genes
were calculated with graphpad Prism v6.0 software. The statistical significance were
calculated with a Mann-Whitney U test.

8
9
RESULTS
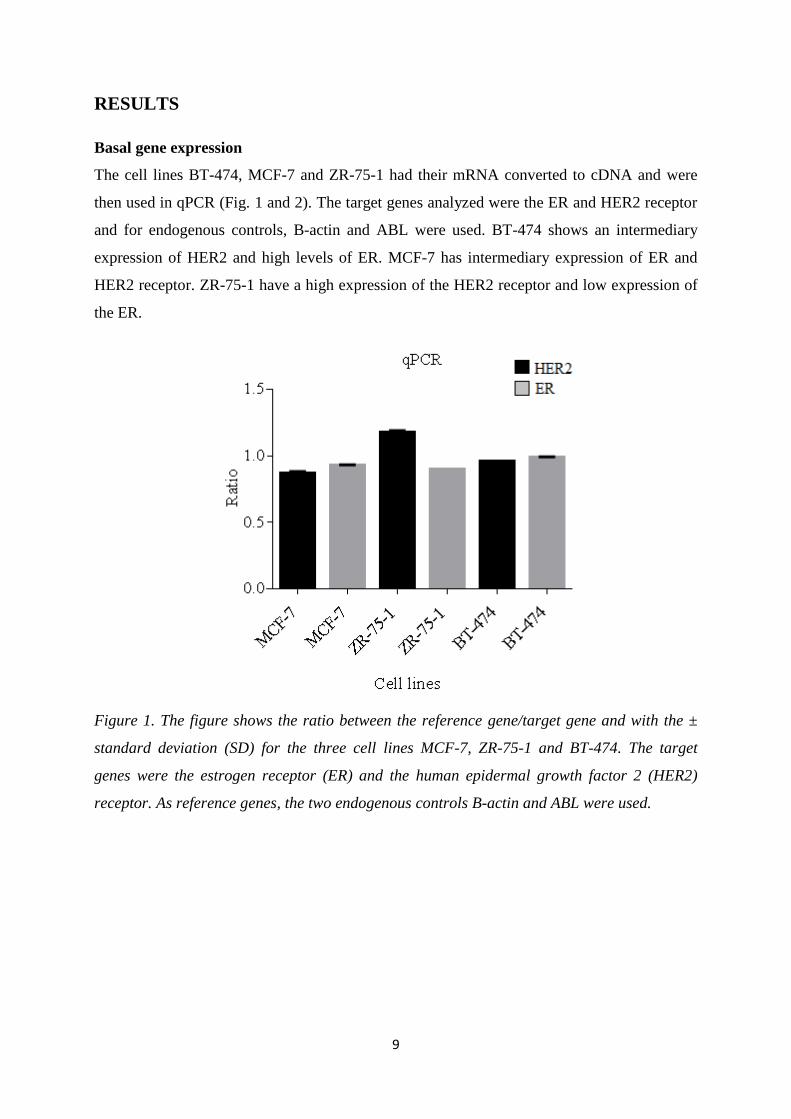
Basal gene expression
The cell lines BT-474, MCF-7 and ZR-75-1 had their mRNA converted to cDNA and were
then used in qPCR (Fig. 1 and 2). The target genes analyzed were the ER and HER2 receptor
and for endogenous controls, B-actin and ABL were used. BT-474 shows an intermediary
expression of HER2 and high levels of ER. MCF-7 has intermediary expression of ER and
HER2 receptor. ZR-75-1 have a high expression of the HER2 receptor and low expression of
the ER.
Figure 1. The figure shows the ratio between the reference gene/target gene and with the ±
standard deviation (SD) for the three cell lines MCF-7, ZR-75-1 and BT-474. The target
genes were the estrogen receptor (ER) and the human epidermal growth factor 2 (HER2)
receptor. As reference genes, the two endogenous controls B-actin and ABL were used.
10
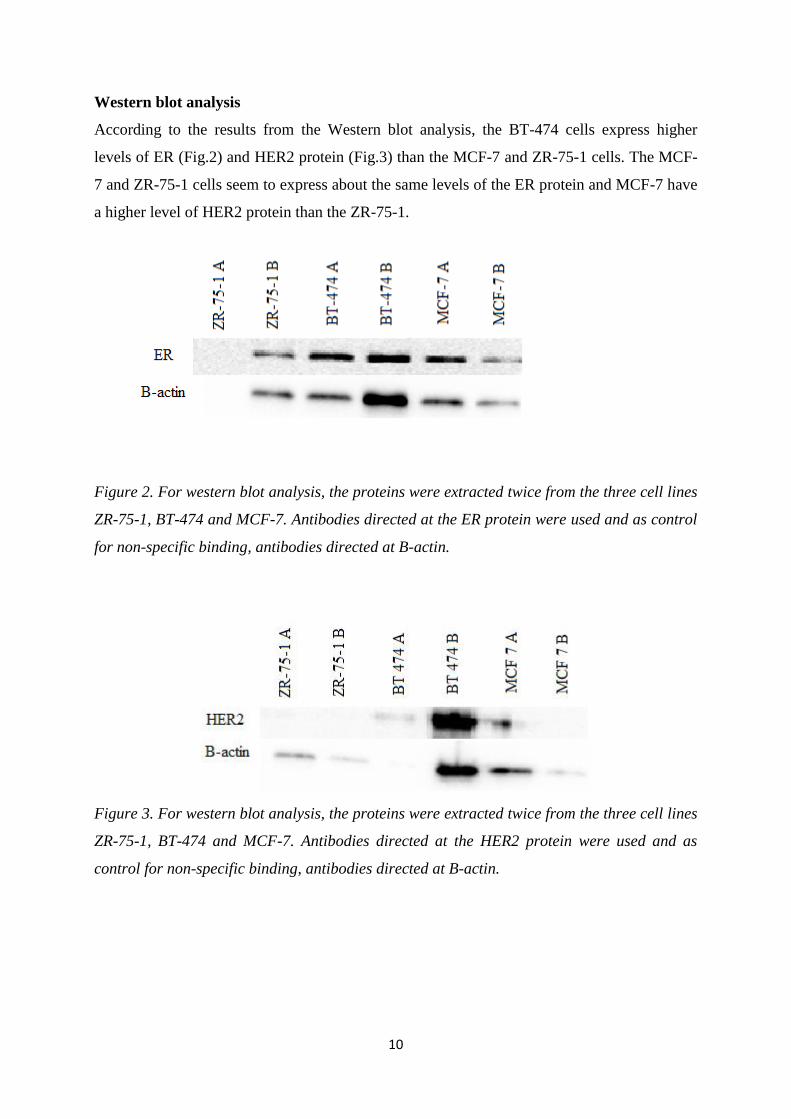
Western blot analysis
According to the results from the Western blot analysis, the BT-474 cells express higher
levels of ER (Fig.2) and HER2 protein (Fig.3) than the MCF-7 and ZR-75-1 cells. The MCF-
7 and ZR-75-1 cells seem to express about the same levels of the ER protein and MCF-7 have
a higher level of HER2 protein than the ZR-75-1.
Figure 2. For western blot analysis, the proteins were extracted twice from the three cell lines
ZR-75-1, BT-474 and MCF-7. Antibodies directed at the ER protein were used and as control
for non-specific binding, antibodies directed at B-actin.
Figure 3. For western blot analysis, the proteins were extracted twice from the three cell lines
ZR-75-1, BT-474 and MCF-7. Antibodies directed at the HER2 protein were used and as
control for non-specific binding, antibodies directed at B-actin.
11
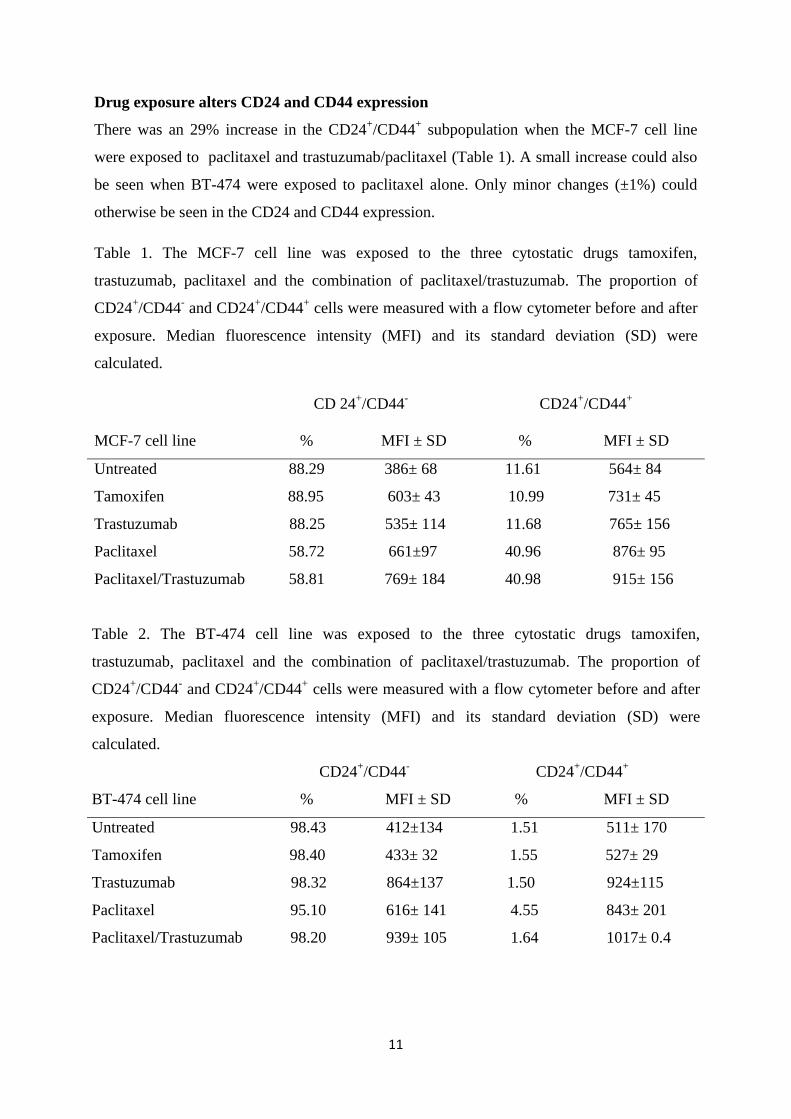
Drug exposure alters CD24 and CD44 expression
There was an 29% increase in the CD24+/CD44
+ subpopulation when the MCF-7 cell line
were exposed to paclitaxel and trastuzumab/paclitaxel (Table 1). A small increase could also
be seen when BT-474 were exposed to paclitaxel alone. Only minor changes (±1%) could
otherwise be seen in the CD24 and CD44 expression.
Table 1. The MCF-7 cell line was exposed to the three cytostatic drugs tamoxifen,
trastuzumab, paclitaxel and the combination of paclitaxel/trastuzumab. The proportion of
CD24+/CD44
- and CD24
+/CD44
+ cells were measured with a flow cytometer before and after
exposure. Median fluorescence intensity (MFI) and its standard deviation (SD) were
calculated.
CD 24+/CD44
- CD24
+/CD44
+
MCF-7 cell line % MFI ± SD % MFI ± SD
Untreated 88.29 386± 68 11.61 564± 84
Tamoxifen 88.95 603± 43 10.99 731± 45
Trastuzumab 88.25 535± 114 11.68 765± 156
Paclitaxel 58.72 661±97 40.96 876± 95
Paclitaxel/Trastuzumab 58.81 769± 184 40.98 915± 156
Table 2. The BT-474 cell line was exposed to the three cytostatic drugs tamoxifen,
trastuzumab, paclitaxel and the combination of paclitaxel/trastuzumab. The proportion of
CD24+/CD44
- and CD24
+/CD44
+ cells were measured with a flow cytometer before and after
exposure. Median fluorescence intensity (MFI) and its standard deviation (SD) were
calculated.
CD24+/CD44
- CD24
+/CD44
+
BT-474 cell line % MFI ± SD % MFI ± SD
Untreated 98.43 412±134 1.51 511± 170
Tamoxifen 98.40 433± 32 1.55 527± 29
Trastuzumab 98.32 864±137 1.50 924±115
Paclitaxel 95.10 616± 141 4.55 843± 201
Paclitaxel/Trastuzumab 98.20 939± 105 1.64 1017± 0.4
12
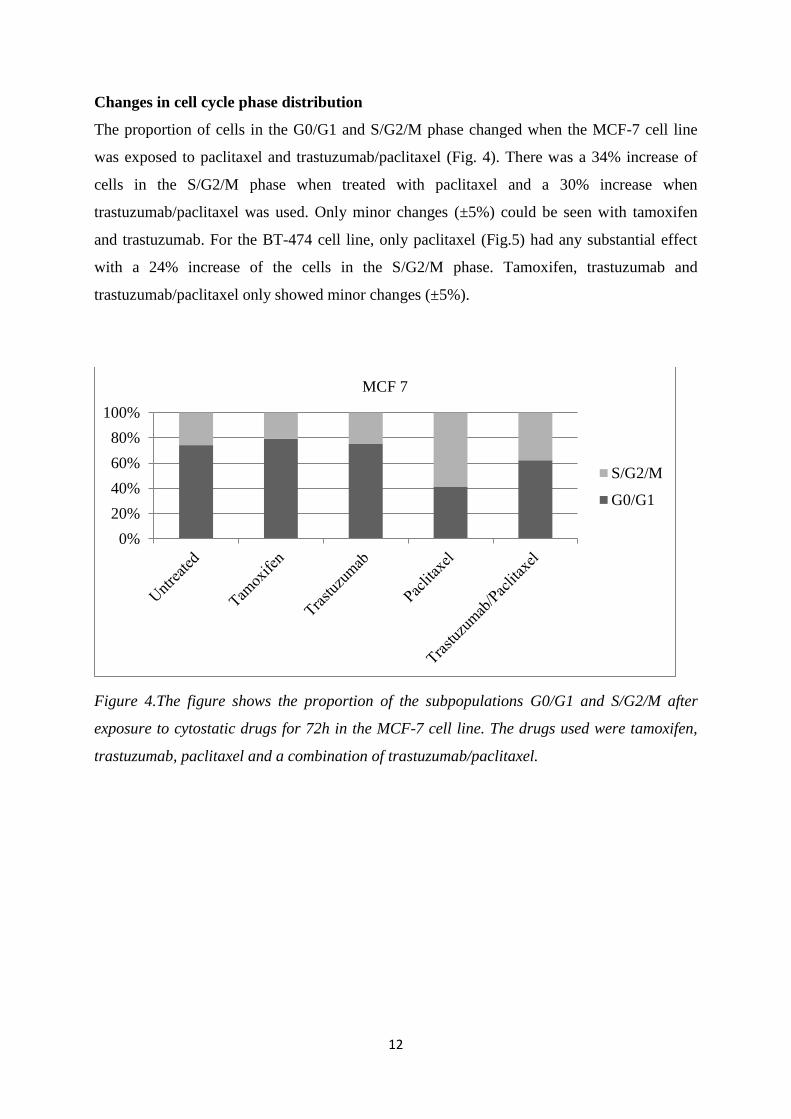
Changes in cell cycle phase distribution
The proportion of cells in the G0/G1 and S/G2/M phase changed when the MCF-7 cell line
was exposed to paclitaxel and trastuzumab/paclitaxel (Fig. 4). There was a 34% increase of
cells in the S/G2/M phase when treated with paclitaxel and a 30% increase when
trastuzumab/paclitaxel was used. Only minor changes (±5%) could be seen with tamoxifen
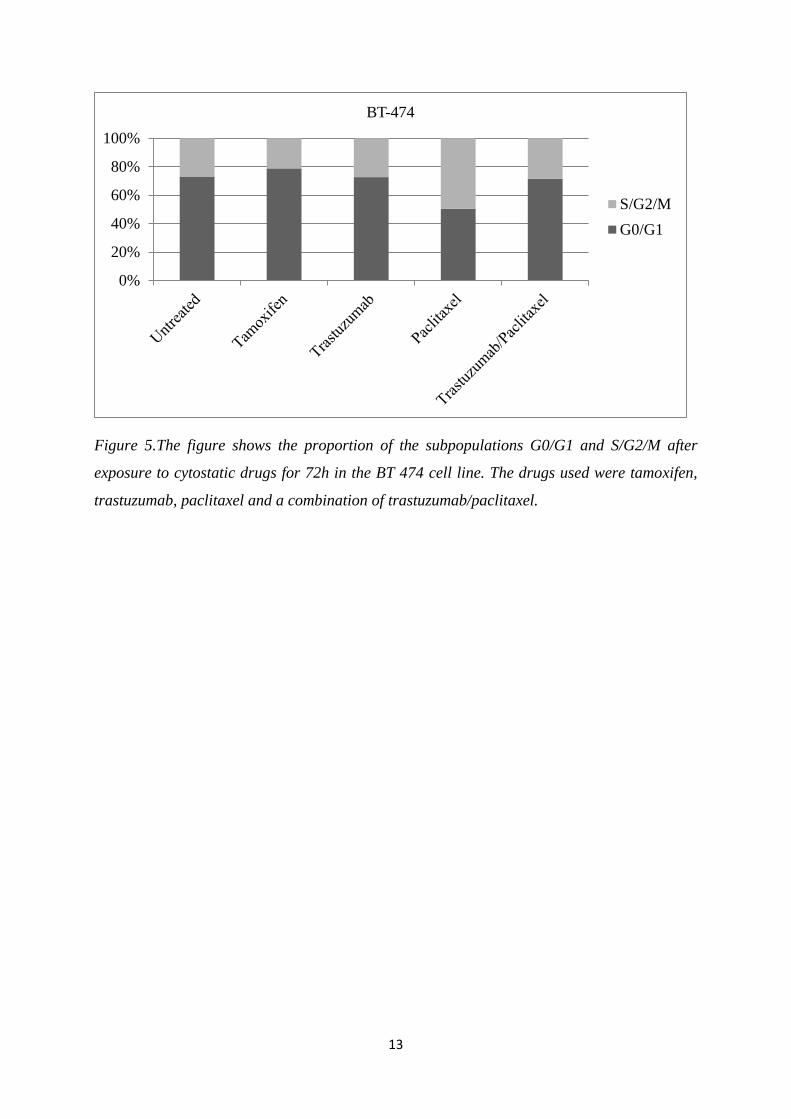
and trastuzumab. For the BT-474 cell line, only paclitaxel (Fig.5) had any substantial effect
with a 24% increase of the cells in the S/G2/M phase. Tamoxifen, trastuzumab and
trastuzumab/paclitaxel only showed minor changes (±5%).
Figure 4.The figure shows the proportion of the subpopulations G0/G1 and S/G2/M after
exposure to cytostatic drugs for 72h in the MCF-7 cell line. The drugs used were tamoxifen,
trastuzumab, paclitaxel and a combination of trastuzumab/paclitaxel.
0%
20%
40%
60%
80%
100%
MCF 7
S/G2/M
G0/G1
13
Figure 5.The figure shows the proportion of the subpopulations G0/G1 and S/G2/M after
exposure to cytostatic drugs for 72h in the BT 474 cell line. The drugs used were tamoxifen,
trastuzumab, paclitaxel and a combination of trastuzumab/paclitaxel.
0%
20%
40%
60%
80%
100%
BT-474
S/G2/M
G0/G1
14
DISCUSSION
The cancer stem cell markers CD24 and CD44 can be found in different forms of breast
cancer and their expression is important for the breast cancers survival and invasiveness. In
our trial we used three breast cancer cell lines and analyzed their basal gene expression of
HER2 and ER and then exposed these to three different cytostatic drugs for 72h. We then
used flow cytometry to see if there were any difference in their expression of CD24 and
CD44.
The cell lines MCF-7 and BT-474 have in our and earlier studies shown high amounts (table
1) of the CD24+/CD44
- subpopulation and lower for CD24
+/CD44
+ when the cells are
untreated[32]. And after the treatment with the different cytostatic drugs we could only see a
major change in MCF-7 that was treated with paclitaxel or trastuzumab/paclitaxel. The
amount of cells that co-expressed the CD24 and CD44 cell surface markers had gone up with
roughly 30% and the MFI increased. This may seem as a bad prognostic factor according to
earlier research, but some studies have proven that CD44 can in some cases slow down tumor
progression through inducing cell differentiation and apoptosis [33]. CD44 also has the ability
to activate the Ras-MAPK and PI3K/AKT intracellular signaling pathways so this might
actually be one of the reasons why we see an increased CD44 expression in response to
paclitaxel exposure [34]. This theory has its flaws due to the fact that we cannot see increased
expression in the BT-474 cell line and due to the low level of trials (n=4), we had no
possibility to see if the results for the cell lines were statistically significant.
The three cell lines MCF-7, BT-474 and ZR-75-1 are epithelial cells that were extracted from
different women in the 1970’s. Since then, these cell lines have undergone extensive research
and their genomes have been mapped. We could see in our protein analysis with Western blot
that MCF-7, ZR-75-1 and BT-474 express the ER and the HER2 receptor (Fig.2 and 3) and
BT-474 overexpress the HER2 receptor. In the ZR-75-1 sample B we could detect proteins
but not in sample A. This is probably due to some error in the loading of the protein into the
gel before electrophoresis, which can have a variety of different reasons [30]. We also
performed qPCR (Fig. 1) which show that BT-474 has high amounts of HER2 mRNA and
lower for ER. MCF-7 and ZR-75-1 both express ER and HER2 mRNA at intermediary levels.
The qPCR test requires small volumes and minor mistakes can lead to great changes in the
acquired results. But with earlier research in mind, it seems more likely that something went
wrong while performing the western blot [31].
15
The proportion of cells in the G0/G1 and S/G2/M showed small changes in the cell lines that
were treated with tamoxifen or trastuzumab alone (Fig. 4 and 5). When treated with paclitaxel
or the combination of trastuzumab/paclitaxel we can see a 30% increase in the S/G2/M
population as expected. The effect is due to the fact that paclitaxel can work as a mitotic
inhibitor which makes the cells stop in the S/G2/M phase and cannot undergo cell division
[20]. The trials with a combination of trastuzumab and paclitaxel resulted in an intermediary
sized population of S/G2/M because trastuzumab blocks the HER2 receptor and make the
cells less likely to start cell division [18]. Due to the few number of samples (n=4) we could
not make any statistic calculations and find any statistic significance.
Despite CSCs has been studied for over a decade there has never been any proof for their
existence in vivo until just recently [35]. All the trials have been done in vitro and this has
some crucial limitations that can also be found in this paper. For example, trastuzumab with
its HER2 inhibiting function can possibly work as an activator of ADCC and lead to cell
death in vivo[18]. To improve this work in vitro, more samples, cytostatic drug
concentrations, different exposure times and cell lines are needed. And there still exist some
question marks to why only MCF-7 upregulated its CD44 expression and not BT-474. In the
future there will hopefully be some way to do the tests in vivo so you can get more accurate
results and easier see the possibility for better cancer treatment in humans.
CONCLUSION
No statistically significant change in the proportion of the subpopulations for CD24+/CD44
-
and CD24+/CD44
+ cells could be seen after treatment with tamoxifen, trastuzumab, paclitaxel
and trastuzumab/paclitaxel for 72h.
ACKNOWLEDGEMENTS
First, I would like to thank my great supervisors Elisabet Tina and Anna Göthlin-Eremo for
all their help and giving me the opportunity to do this project. I really enjoyed it and I feel that
this work has given me a deeper knowledge and understanding of the process behind the
laboratory techniques and when writing an essay. I would also want to thank Hanna Arnesson,
a molecular biologist at Clinical Research Center (CRS) for helping me with the fun but cruel
Western blot that I hope that I will never have to do again. Without her help it wouldn’t have
been possible. Lastly, I want to thank everyone at CRS for helping and being so nice to a
confused medical student.

16
REFERENCES
1. Ferlay J, Shin HR, Bray F, Forman D, Mathers C, Parkin DM. Estimates of worldwide
burden of cancer in 2008: GLOBOCAN 2008. Int J Cancer 2010 Dec 15;127(12):2893-
2917.
2. Jemal A, Siegel R, Ward E, Hao Y, Xu J, Thun MJ. Cancer statistics, 2009. CA Cancer J
Clin 2009 Jul-Aug;59(4):225-249.
3. Gage M, Wattendorf D, Henry LR. Translational advances regarding hereditary breast
cancer syndromes. J Surg Oncol 2012 Apr 1;105(5):444-451.
4. Henderson BE, Feigelson HS. Hormonal carcinogenesis. Carcinogenesis 2000
Mar;21(3):427-433.
5. Reis-Filho JS, Pusztai L. Gene expression profiling in breast cancer: classification,
prognostication, and prediction. Lancet 2011 Nov 19;378(9805):1812-1823.
6. Kelsey JL, Gammon MD, John EM. Reproductive factors and breast cancer. Epidemiol
Rev 1993;15(1):36-47.
7. Yue W, Wang JP, Li Y, Bocchinfuso WP, Korach KS, Devanesan PD, et al. Tamoxifen
versus aromatase inhibitors for breast cancer prevention. Clin Cancer Res 2005 Jan
15;11(2 Pt 2):925s-30s.
8. Mueller SO, Korach KS. Estrogen receptors and endocrine diseases: lessons from estrogen
receptor knockout mice. Curr Opin Pharmacol 2001 Dec;1(6):613-619.
9. Couse JF, Korach KS. Estrogen receptor null mice: what have we learned and where will
they lead us? Endocr Rev 1999 Jun;20(3):358-417.
10. Holst F, Stahl PR, Ruiz C, Hellwinkel O, Jehan Z, Wendland M, et al. Estrogen receptor
alpha (ESR1) gene amplification is frequent in breast cancer. Nat Genet 2007
May;39(5):655-660.
11. Slamon DJ, Clark GM, Wong SG, Levin WJ, Ullrich A, McGuire WL. Human breast
cancer: correlation of relapse and survival with amplification of the HER-2/neu
oncogene. Science 1987 Jan 9;235(4785):177-182.
12. Akiyama T, Sudo C, Ogawara H, Toyoshima K, Yamamoto T. The product of the human
c-erbB-2 gene: a 185-kilodalton glycoprotein with tyrosine kinase activity. Science 1986
Jun 27;232(4758):1644-1646.
13. Mosesson Y, Yarden Y. Oncogenic growth factor receptors: implications for signal
transduction therapy. Semin Cancer Biol 2004 Aug;14(4):262-270.
14. Heel RC, Brogden RN, Speight TM, Avery GS. Tamoxifen: a review of its
pharmacological properties and therapeutic use in the treatment of breast cancer. Drugs
1978 Jul;16(1):1-24.
17
15. BIG 1-98 Collaborative Group, Mouridsen H, Giobbie-Hurder A, Goldhirsch A,
Thurlimann B, Paridaens R, et al. Letrozole therapy alone or in sequence with tamoxifen
in women with breast cancer. N Engl J Med 2009 Aug 20;361(8):766-776.
16. Desta Z, Ward BA, Soukhova NV, Flockhart DA. Comprehensive evaluation of tamoxifen
sequential biotransformation by the human cytochrome P450 system in vitro: prominent
roles for CYP3A and CYP2D6. J Pharmacol Exp Ther 2004 Sep;310(3):1062-1075.
17. Sawka CA, Pritchard KI, Paterson AH, Sutherland DJ, Thomson DB, Shelley WE, et al.
Role and mechanism of action of tamoxifen in premenopausal women with metastatic
breast carcinoma. Cancer Res 1986 Jun;46(6):3152-3156.
18. Valabrega G, Montemurro F, Aglietta M. Trastuzumab: mechanism of action, resistance
and future perspectives in HER2-overexpressing breast cancer. Ann Oncol 2007
Jun;18(6):977-984.
19. Bharadwaj R, Yu H. The spindle checkpoint, aneuploidy, and cancer. Oncogene 2004 Mar
15;23(11):2016-2027.
20. Bhalla KN. Microtubule-targeted anticancer agents and apoptosis. Oncogene 2003 Dec
8;22(56):9075-9086.
21. Al-Hajj M, Wicha MS, Benito-Hernandez A, Morrison SJ, Clarke MF. Prospective
identification of tumorigenic breast cancer cells. Proc Natl Acad Sci U S A 2003 Apr
1;100(7):3983-3988.
22. Lee HJ, Choe G, Jheon S, Sung SW, Lee CT, Chung JH. CD24, a novel cancer biomarker,
predicting disease-free survival of non-small cell lung carcinomas: a retrospective study
of prognostic factor analysis from the viewpoint of forthcoming (seventh) new TNM
classification. J Thorac Oncol 2010 May;5(5):649-657.
23. Aigner S, Ramos CL, Hafezi-Moghadam A, Lawrence MB, Friederichs J, Altevogt P, et
al. CD24 mediates rolling of breast carcinoma cells on P-selectin. FASEB J 1998
Sep;12(12):1241-1251.
24. Naor D, Wallach-Dayan SB, Zahalka MA, Sionov RV. Involvement of CD44, a molecule
with a thousand faces, in cancer dissemination. Semin Cancer Biol 2008 Aug;18(4):260-
267.
25. Rangaswami H, Bulbule A, Kundu GC. Osteopontin: role in cell signaling and cancer
progression. Trends Cell Biol 2006 Feb;16(2):79-87.
26. Shevde LA, Samant RS. Role of osteopontin in the pathophysiology of cancer. Matrix
Biology 2014.
27. Russo J, Tay LK, Russo IH. Differentiation of the mammary gland and susceptibility to
carcinogenesis. Breast Cancer Res Treat 1982;2(1):5-73.
28. Costarelli V, Yiannakouris N. Breast cancer risk in women: the protective role of
pregnancy. Nurs Stand 2010 Jan 6-12;24(18):35-40.
18
29. Murohashi M, Hinohara K, Kuroda M, Isagawa T, Tsuji S, Kobayashi S, et al. Gene set
enrichment analysis provides insight into novel signalling pathways in breast cancer stem
cells. Br J Cancer 2010 Jan 5;102(1):206-212.
30. Mahmood T, Yang PC. Western blot: technique, theory, and trouble shooting. N Am J
Med Sci 2012 Sep;4(9):429-434.
31. Sorlie T, Perou CM, Tibshirani R, Aas T, Geisler S, Johnsen H, et al. Gene expression
patterns of breast carcinomas distinguish tumor subclasses with clinical implications.
Proc Natl Acad Sci U S A 2001 Sep 11;98(19):10869-10874.
32. Naor D, Nedvetzki S, Golan I, Melnik L, Faitelson Y. CD44 in cancer. Crit Rev Clin Lab
Sci 2002 Nov;39(6):527-579.
33. Naor D, Wallach-Dayan SB, Zahalka MA, Sionov RV. Involvement of CD44, a molecule
with a thousand faces, in cancer dissemination. Semin Cancer Biol 2008 Aug;18(4):260-
267.
34. Naor D, Sionov RV, Ish-Shalom D. CD44: structure, function, and association with the
malignant process. Adv Cancer Res 1997;71:241-319.
35. Myelodysplastic Syndromes Are Propagated by Rare... [Cancer Cell. 2014] - PubMed -
NCBI. Available at:
http://www.ncbi.nlm.nih.gov/pubmed/?term=Myelodysplastic+Syndromes+Are+Propaga
ted+by+Rare+and+Distinct+Human+Cancer+Stem+Cells+In+Vivo. Accessed 5/25/2014,
2014.