Embed Size (px)
Citation preview

Dissertation Braun Andreas
- 1 -
Expression of human liver cytochrome P450 enzymes in
the non-conventional yeast Yarrowia lipolytica for the
evaluation of two-liquid biphasic whole-cell
biotransformation of steroids
Dissertation
zur Erlangung des Grades
des Doktors der Naturwissenschaften
im Bereich Molekulare Biowissenschaften und Biotechnologie
der Fachrichtung technische Chemie, Verfahrenstechnik u. Biotechnologie
der technischen Universität Graz
von
Andreas Braun
2012

Dissertation Braun Andreas
- 2 -
Acknowledgment
I want to take the chance to thank a few people who helped me become what I am today. I want to thank … my parents Brigitte and Reinhard, for their love and their unimpaired financial and mental support. my wife Natascha for her love, her patience, her mental support and for just being there for me. my aunt Elisabeth, who helped me a lot in my life, financially as well as personally. my brothers Martin and Christian and their families, for the often needed distraction. my fellow student and co-worker Martina for her friendship, her aid in mastering the study and for enduring me during the long hours at work. my sister-in-law Andrea for enduring me all this years as a flat mate and for just being the nice person she is. my parents-in-law Doris and Andreas, for their love and from time to time the most welcome distraction. Also I want to thank some people who made this work possible. I want to thank … Dr. Toni Glieder, for the opportunity to do my PhD thesis in his group and work with interesting people in the Oxygreen project. all my coworkers (Andrea alias Mandy, Christine, Laura, Tanja, Katrin, Flo, Andrea C. and many more) for their support, creating a fun and enjoyable working environment and for bearing me all these years. all partners involved in the Oxygreen project for the opportunity to learn a lot and for their support. Dr. Harald Pichler, for always being there, open for discussions and ideas and not to mention his friendship.

Dissertation Braun Andreas
- 3 -
Index
1. Abbreviations ____________________________________________________________ 4
2. Abstract _________________________________________________________________ 7
3. Zusammenfassung ________________________________________________________ 8
4. Introduction _____________________________________________________________ 9
4.1. Whole cell biotransformation in two-liquid phase system __________________________ 9
4.2. Cytochrome P450 family ____________________________________________________ 11
4.3. Human CYP2D6 and CYP3A4 _______________________________________________ 14
4.4. Steroids __________________________________________________________________ 16
4.5. Heterologous expression of P450 enzymes______________________________________ 17
4.6. The non conventional yeast Yarrowia lipolytica__________________________________ 18
4.7. Protein engineering and comprehensive mutein data base ________________________ 20
4.8. Aim of the work ___________________________________________________________ 21
5. Materials and Methods____________________________________________________ 23
5.1. Growth media_____________________________________________________________ 23 5.1.1. media for Escherichia coli (E. coli) _________________________________________________ 23 5.1.2. Growth media for Yarrowia lipolytica (Y. lipolytica) ___________________________________ 23
5.2. Strains ___________________________________________________________________ 24
5.3. Plasmids _________________________________________________________________ 24
5.4. Oligonucleotides ___________________________________________________________ 24
5.5. Methods__________________________________________________________________ 24 5.5.1. DNA electrophoresis and manipulation______________________________________________ 24 5.5.2. DNA restriction and ligation ______________________________________________________ 24 5.5.3. DNA purification and DNA sequencing _____________________________________________ 28 5.5.4. Vector construction _____________________________________________________________ 28 5.5.5. E. coli cultivation and transformation _______________________________________________ 31 5.5.6. Preparation of electro-competent E. coli cells _________________________________________ 31 5.5.7. Transformation and preparation of chemical competent Y. lipolytica cells __________________ 31 5.5.8. Transformation and preparation of electro-competent Y. lipolytica cells ____________________ 32 5.5.9. Cultivation of Y. lipolytica cells and induction ________________________________________ 33 5.5.10. Ethanol determination during induction ____________________________________________ 33 5.5.11. Microsome preparation _________________________________________________________ 34 5.5.12. SDS (sodium dodecylsulfate) polyacrylamid gel electrophoresis _________________________ 34 5.5.13. Immunologic detection of proteins ________________________________________________ 34 5.5.14. Genomic DNA isolation ________________________________________________________ 35 5.5.15. Southern blot _________________________________________________________________ 36 5.5.16. Real-time QPCR ______________________________________________________________ 37 5.5.17. CO difference spectrum_________________________________________________________ 37 5.5.18. NADPH cytochrome c reductase (NCR) activity _____________________________________ 38 5.5.19. Hydroxylation assay / CYP activity of microsomes ___________________________________ 38 5.5.20. Hydroxylation assay / aqueous whole cell bioconversion ______________________________ 38 5.5.21. Hydroxylation assay / two-liquid biphasic whole cell bioconversion _____________________ 39 5.5.22. Y. lipolytica Fed-batch culture in bioreactor _________________________________________ 39 5.5.23. Bioreactor aqueous and two-liquid biphasic whole cell bioconverison_____________________ 40 5.5.24. HPLC-MS analysis methods _____________________________________________________ 40
6. Publications ____________________________________________________________ 42
6.1. Manuscript 1 (muteinDB – published in database; doi:10.1093/database/bas028) _____ 42
6.2. Manuscript 2 (Y. lipolytica – accepted for publication in Microbial cell factories) ______ 42

Dissertation Braun Andreas
- 4 -
7. Standard Operating Procedure (SOP) – ______________________________________ 43
7.1. SOP I (HPLC-MS) _________________________________________________________ 43
7.2. SOP II (Y. lipolytica) _______________________________________________________ 43
8. Additional results and discussion:___________________________________________ 44
8.1. HPLC-MS method development______________________________________________ 44 8.1.1. Bufuralol measurement __________________________________________________________ 44 8.1.2. Steroid measurement ____________________________________________________________ 45 8.1.3. High-throughput HPLC screening of testosterone metabolites ____________________________ 46
8.2. Proof of principle solubility of hydroxysteroid in aqueous phase ___________________ 47
8.3. CDW vs. OD ______________________________________________________________ 48
8.4. Southern blot _____________________________________________________________ 49
8.5. Ethanol consumption _______________________________________________________ 51
8.6. Microsomal conversion with GDH regeneration system __________________________ 52
8.7. Optimized conditions for Y. lipolytica whole cell conversion of steroids______________ 53
8.8. Fermentation and biotransformation procedure in bioreactors ____________________ 54
8.9. Influence of organic solvents on the biphasic whole cell conversion _________________ 58
8.10. Biphasic whole cell conversion of steroids by P. pastoris harboring human CYP2D6 _ 61
8.11. CO spectrum_____________________________________________________________ 61
8.12. Heterologous promoters from P. pastoris______________________________________ 62
8.13. CYP2D6 mutants _________________________________________________________ 64
9. Conclusion and Outlook __________________________________________________ 64
10. References_____________________________________________________________ 68
11. Appendix______________________________________________________________ 77
11.1. Index of Figures __________________________________________________________ 77
11.2. Index of Tables ___________________________________________________________ 77
11.3. Materials and Methods ____________________________________________________ 78 11.3.1. Reagents, Media, Buffer ________________________________________________________ 78 11.3.2. Instruments/Devices used _______________________________________________________ 82 11.3.3. oligonucleotides_______________________________________________________________ 84
12. Supplementary Data_____________________________________________________ 89

Dissertation Braun Andreas
- 5 -
1. Abbreviations
ADH alcoholdehydrogenase Alk alkane AmpR ampicillin resistence gene coding for beta-lactamases AOX alcoholoxidase BM3 CYP102A1 cytochrome P450 enzyme from Bacillus megaterium cDNA complementary DNA, is DNA synthesized from a messenger RNA CDW cell dry weight CYP cytochrome P450 CYP2D6 human cytochrome P450 2D6 CYP3A4 human cytochrome P450 3A4 DAS dihydroxyacetone synthase DBP dibutylphthalate ddH2O double distilled H2O DIG digoxigenin DNA deoxyribonucleic acid dNTP desoxyribonukleosidtriphosphate E. coli Escherichia coli
ESI electron spray ionization ET electron transfer EtOH or Eth ethanol FAD flavine adenine dinucleotide FDA food and drug administration FMN flavine mononucleotide G / C guanidine, cytosine GC gas chromatography Glu glucose GRAS generally regarded as safe H. polymorpha Hansenual polymorpha
HCPR human cytochrome P450 reductase HF high fidelity HPLC high performance liquid chromatography HRP horseradish peroxidase ICL1 isocitrate lyase 1 gene IS internal standard K. lactis Kluyveromyces lactis
LB Luria-Bertani LiAc lithium acetate Lip lipide log P logarithm of partition coefficient LTR long terminal repeats MIST metabolites in safety testing MM mineral salt minimal medium MS mass spectrometry mü (µ) growth rate [s-1] mutein wildtype protein with one or several mutations NADH nicotinamide adenine dinucleotide NADPH nicotinamide adenine dinucleotide phosphate NCR NADH / NADPH cytochrome c reductase

Dissertation Braun Andreas
- 6 -
NIT nitrilase NL norm liter OD600 optical density measured at 600 nm ONC over night culture P. pastoris Pichia pastoris
PAMO phenylacetone monooxygenase PCR polymerase chain reaction PDB protein data base PEG polyethylene glycol PMSF phenyl methyl sulfonyl fluoride pO2 partial pressure of oxygen R2 coefficient of determination rDNA ribosomal DNA RNA ribonucleic acid RP reversed phase RT room temperature RT-QPCR real time quantitative polymerase chain reaction S. cerevisiae Saccharomyces cerevisiae
S. pombe Schizosaccharomyces pombe
SEM scanning electron microscope SOC super optimal broth with catabolite repression, nutrient-rich bacterial
growth medium Str streptomycine Suc sucrose TEM transmission electron microscopy Temp temperature Tet tetracycline Tgl triglyceride TY3 sub-class of LTR retrotransposons (Metaviridae) Ura urea WT wildtype Y. lipolytica Yarrowia lipolytica
YlCPR Yarrowia lipolytica cytochrome P450 reductase Ylt1 Yarrowia lipolytica retrotransposon YNB yeast nitrogen based with out amino acids, minimal mineral salt media YPD yeast extract peptone dextrose, complete medium for yeast growth YSX biomass production per carbon source consumed [g/g]

Dissertation Braun Andreas
- 7 -
2. Abstract
Often cytochrome P450 metabolites present the active form or toxic side product of
pharmaceuticals. Therefore there is a vast interest in such metabolites, which often can only
be prepared selectively using biotransformations. Two-liquid biphasic systems present a
valuable biotechnological tool for biotransformation of hydrophobic substrates, since most
typical cytochrome P450 substrates, e.g. steroids and other drugs, are mere immiscible in
water. The alkane utilizing, non-conventional yeast Y. lipolytica has been shown to be able to
grow in biphasic environments and efficiently utilize hydrophobic substrates. Furthermore, Y.
lipolytica has been identified as an attractive host for heterologous protein production and
therefore efficient genetic tools are available. The present work shows an evaluation of
functional expression of the human liver cytochrome P450 system consisting of human CPR
in combination with either CYP2D6 or CYP3A4 and possible advantages of such
recombinant Y.lipolytica srains for the oxidation of hydrophobic steroids in two-liquid
biphasic systems. Employing the organic solvent ethyl oleate, which can be also utilized as a
carbon source by Yarrowia, it was possible to increase the conversion rate by two-fold and
prolong the bioconversion for several days to an overall product concentration of at least 5
times higher than a biotransformation in aqueous system.
Additionally, in the course of this work several HPLC-MS methods including a high-
throughput HPLC-MS method for the analysis of steroids (e.g. testosterone and its
metabolites) were developed.
Furthermore, the MuteinDB, a database for storing high quality data about muteins and
their kinetic data towards different substrates, has been improved and further developed. After
the data format and general rules for data collection were determined, several comprehensive
data sets were collected and implemented (e.g. CYP3A4, CYP2D6, HRP, NIT, BM3
(CYP102A1), thereby providing a solid basis for future database supported protein
engineering concepts.

Dissertation Braun Andreas
- 8 -
3. Zusammenfassung
Sehr oft sind die von cytochrome P450 metabolisierten pharmazeutischen Substanzen die
eigentliche aktive bzw. auch toxische Form. Aus diesem Grund besteht ein großes Interesse
an solchen Metaboliten, die häufig nur mit Hilfe von selektiven Biotransformationen
dargestellt werden können. Zweiphasige Systeme bestehend aus einer wässrigen und einer
organischen Phase stellen ein wertvolles Werkzeug für die Biotransformation von
hydrophoben Substraten dar. Typische Substrate von cytochrome P450 Enzymen wie
beispielsweise Medikamente und Steroide, sind meist schwer wasserlöslich.
Es wurde gezeigt, dass die alkan-verwertende, unkonventionelle Hefe Y. lipolytica in solchen
zweiphasigen Milieus sehr gut wachsen und hydrophobe Substrate sehr gut verwerten kann.
Desweiteren wurde gezeigt, dass die Hefe Y. lipolytica als sehr attraktiver Hostorganismus für
die heterologe Expression von Proteinen ist was auch dadurch unterstützt wird, dass geeignete
genetische Werkzeuge vorhanden sind. In dieser Arbeit wird die funktionelle Expression von
dem cytochrome P450 System der menschlichen Leber, welches aus der menschlichen
cytochrome P450 Reduktase in Verbindung mit entweder dem CYP2D6 oder dem CYP3A4
besteht, evaluiert. Desweiteren wird die Verwendung von zweiphasigen Systemen für die
Oxidation von hydrophoben Stereoiden mit Hilfe der Hefe Y. lipolytica als
Ganzzellbiokatalysator gezeigt. Durch die Verwendung des verwertbaren organischen
Lösungsmittels Ölsäureethylester als organische Phase, welche durch Y. lipolytica verwertet
werden kann, war es möglich die Umsetzungsrate um den Faktor zwei zu erhöhen, zusätzlich
den Biokonversionzeitraum um mehrere Tage zu verlängern und eine um mindestens fünffach
höhere Produktkonzentration im Vergleich zum wässrigen System zu erreichen.
Zusätzlich wurden, während dieser Arbeit mehrere HPLC-MS Methoden inklusive einer
hoch-druchsatz HPLC-MS Methode für die Analyse von Steroiden, beispielsweise
Testosteron und deren Metaboliten entwickelt.
Desweiteren wurde die MuteinDB, eine Datenbank für das Sammeln und Speichern von hoch
qualitativen Daten über Muteine und deren kinetischen Informationen von verschiedenen
Substraten, verbessert und weiter entwickelt. Nach festlegen des Datenformats und
allgemeiner Regeln für das Datensammeln wurden mehrere umfangreiche Datensätze für
CYP3A4, CYP2D6, HRP, NIT, BM3 auch bekannt als CYP102A1 und PAMO gesammelt
und in die Datenbank aufgenommen. Die Datenbank bietet nun eine solide Grundlage für
zukünftige „protein engineering“ Projekte.

Dissertation Braun Andreas
- 9 -
4. Introduction
4.1. Whole cell biotransformation in two-liquid phase system
Yeasts and other microorganisms have been used for centuries; simple products like beer,
wine and cheese feeding mankind since thousands of years belong to the oldest forms of
biotechnology. In the past 100 years, more and more organisms were used as whole cell
biocatalysts, to perform chemical transformations on natural or non-natural organic
compounds. By the development of recombinant protein technologies, producing larger
amounts of heterologous proteins with desired catalytic activities became possible and the
number of available technical enzymes and whole cell catalysts increased significantly.
Recombinant enzymes expressed in various hosts, have either been expressed and purified
from the expression host with more or less expensive and labour/cost-intensive down-stream
processing, or have been used for biotransformation by exposing a whole cell lysate or the
recombinant strain directly to the substrate mix. However, whole cell catalysis shows
advantages as well as disadvantages compared to isolated enzymes.
On the one hand, the encapsulation by the supramolecular structure of cell membranes acts as
a protective shield against environmental influences like, for example, sheer forces or
denaturing agents. Moreover, some enzymatic systems, i.e. cytochrome P450s, are
multicomponent, membrane-bound enzyme systems, which are difficult to isolate and in
addition their catalytic reactions depend on expensive and labile redox cofactors (NADH,
NADPH). Due to economic reasons, viable whole cells are therefore often preferred over
isolated enzymes, as they provide cofactor regeneration during biotransformation using cheap
carbon soures as an energy supply. On the other hand, substrates have to pass the outer cell
membranes in order to be transformed; furthermore, endogenous proteins and the cell’s own
metabolism can catalyze unwanted side reactions (Nikolova et al., 1993).
Two-liquid phase biotransformation systems, consisting of an organic water-immiscible
solvent and an aqueous solution, are a particular example of whole cell biocatalysis, and a
valuable biotechnological tool for biotransformation of hydrophobic substrates (Fig 1). These
systems have been intensively studied as a viable alternative to tackle the problem of the poor
solubility in aqueous media of many organic compounds of commercial interest and the
discovery of microorganisms able to grow in presence of organic solvents has further
increased the research efforts in this field (Bühler et al., 2004; León, 1998). In such systems,
cells are either grown or incubated in the presence of 10-50% organic phase, where the
substrate of interest is dissolved in. Carbon for cell growth is mainly provided by water
soluble substrates such as sugar, glycerol or fatty acids. The biomass is then used for

Dissertation Braun Andreas
- 10 -
biocatalysis either in the form of resting cells or as growing culture. Growing cells are
considered more favorable than resting cells when expressing a protein with low stability,
since they enable a constant protein expression during biotransformation. However, resting
cells have the advantage that the desired reaction can be investigated independently from
growth. Additionally, this can minimize side reactions and allows the identification of
potential limitations (Becker et al., 2007). Also resting cells are usually supplemented with
some carbon source, i.e. glucose, to maintain energy metabolism for cofactor regeneration
(Siedler et al., 2011).
Biocatalysis in two-phase systems shows several key advantages; the presence of organic
solvent can increase the overall concentration of poorly water-soluble substrates and products
and at the same time reduce toxic and inhibitory effects by regulation of their concentration in
the aqueous phase. Additionally hydrolysis of substrates and products, and mass-transfer
limitations may be reduced. Furthermore, the stereoselectivity of a biotransformation may be
improved and in situ product recovery, favors the bioconversion by shifting the
thermodynamic equilibrium, while an easier recovery of both product and biocatalyst can be
achieved.
Nevertheless, the system or reactors are not the most crucial steps in developing a biphasic
two-liquid phase system, but rather the selection of the right organic solvent. Several
parameters have to be considered. First of all, many solvents are cytotoxic or show inhibitory
effects. Furthermore many of the non-toxic organic solvents are highly apolar and therefore
have rather restricted solvent capabilities and as such are of limited use as a solvent for
substrates and products of interest. Additionally, different cell types, lines, or indeed
individual strains may vary considerably in their response to a given solvent, even under the
same physiological conditions: it has been reported that conditions which give high initial
substrate conversion activities show poor stability of whole cells. Different solvent parameters
have been introduced to correlate observed effects. The most widely used parameter is log P,
definded as the partition coefficient in a standard ocotanol: water mixture. Even though
solvents with high log P have been observed to promote the retention of biocatalytic activity,
no simple relation exists between these parameters and the different solvent classes. Therefore
the toxicity and inactivation of cells can only be addressed by selection of appropriate
solvents and studying the damaging effect on cells (Salter et al., 1995). Furthermore, when
aiming for large-scale processes challenges for subsequent downstream processing,
environmental implications and safety issues have to be considered (Schmid et al., 1998).

Dissertation Braun Andreas
- 11 -
Fig 1: Schematic representation of whole cell biotransformation.
As mentioned before, whole cell biocatalysis is especially suitable for membrane bound, multi
compound enzyme systems such as the cytochrome P450 systems. Additionally, typical P450
substrates for example steroids are very hydrophobic, which would promote the use of a two-
liquid phase system for the bioconversion of steroids with whole cells harboring
heterologously expressed P450 system.
4.2. Cytochrome P450 family
Cytochrome P450 (CYP) enzymes comprise a large and functionally diverse superfamily of
heme-thiolate monooxygenases, where the heme domain is bound via a conserved cysteine
thiolate group forming the fifth ligand of the heme iron. CYP enzymes have been identified in
all domains of life, from prokaryotic organisms like bacteria and archaea, to simple
eukaryotes like yeasts and fungi, to mammalians. Even some viruses have been identified to
carry genes coding for P450 enzymes (Nelson et al., 1993). More than 6000 members of this
CYP superfamily have been identified so far
(http://drnelson.uthsc.edu/cytochromeP450.html). Prokaryotic CYPs are typically involved in
biosynthesis of antibiotics and catalyze important reactions for the degradation of a variety of
hydrocarbons. In fungi, CYPs are often required for the synthesis of steroids and catalyze the
detoxification of defense chemicals of target host plants therefore enabling pathogenesis. In
plants, many secondary metabolites require CYPs e.g. to synthesize phytohormone, pigment
and other compounds serving a wide range of functions. One central and well known role of
CYPs in mammalian cells is the degradation of foreign chemicals by catalyzing the first
oxidative step (phase I) of the detoxification process in liver. Mammalian CYPs are
furthermore involved in natural metabolic pathways, such as steroid biosynthesis and
metabolism of fatty acids. CYP-catalyzed reactions can be broadly classified into four
organic solvent
O2
H2O
NADH/ NADPH
NAD+/
NADP+
co-protein substrate
product
e.g. e-
biocatalyst
aqueous phase
organic phase
substrate
product
regeneration system glucose
CO2
organic solvent
organic solvent + substrate
transporter
protrusions emulsifier
microorganism

Dissertation Braun Andreas
- 12 -
categories. The most common one is the hydroxylation reaction where a hydroxyl group is
incorporated replacing a hydrogen atom (Fig 2). The second one is the epoxidation reaction
where oxygen is introduced into a carbon-carbon bond. Furthermore, CYPs can catalyse the
oxidation of heteroatoms where oxygen is added to nitrogen, sulfur or other heteroatom.
Additionally, they are able to catalyze the reduction of oxygen and xenobiotics, which can
take place under conditions of limited oxygen (Danielson, 2002).
Fe(II)
S
Cys
O
C
OH2
ROHRH
OH2
CO
COO
2
O2
Fe(II)
S
Cys
O
H H
Fe(IV)
S
Cys
O
Fe(III)
S
Cys
O O
Fe(II)
S
Cys
O
O
Fe(III)
S
Cys
Fe(II)
S
Cys
OH2
e-
e-
e-
2H+ XOH XOOH
*+
Peroxide Shunt
pentacoordinateferic complex(high-spin)
pentacoordinateferrous complex(high-spin)
hexacoordinateferrous-O2 adduct(low-spin)
ferric peroxycomplex(low-spin)
second electronreduction
first electronreduction
oxyferrylintermediate(low-spin)
Product release Substrate Binding
hexacoordinateferrous-COinhibitor complex(low-spin)
native hexacoordinateferric form (low-spin)
Fig 2: The proposed catalytic cycle of cytochrome P450 for hydroxylation reactions.
Upon substrate binding, the heme iron shifts to a high spin state. Substrate binding is accompanied by an increased redox potential which allows reduction of the iron to form a pentacoordinate ferrous complex that binds molecular oxygen to yield a semistable, low-spin, hexacoordinate ferrous-O2 adduct. Reduction by a second electron is thought to produce a low-spin, ferric peroxycomplex and oxyferryl (Fe+4=O) intermediates. It is hypothesized that transfer of an oxygen atom from this intermediate to the substrate via an oxygen rebound mechanism yields the oxidized product and regenerates the native hexacoordinate state of the P450. The so called “peroxide shunt” pathway allows in the presence of external oxygenation agents, e.g. peracids, to directly form the oxyferryl species from pentacoordinate ferrous. By binding of CO to the pentacoordinated ferrous complex a hexacoordinated ferous-CO complex is formed showing a distinct absorption at 450 nm, giving this enzyme class its name. Picture redrown based on picture from literature (Danielson, 2002)
Many of the members of the P450 family catalyze multiple reactions; therefore the usual
method of naming enzymes is inadequate for this group of proteins. Based on structural
homology, a systematic nomenclature has been derived. P450 genes are identified by the
abbreviation CYP (cytochrome P450) followed by a number, indicating the gene family

Dissertation Braun Andreas
- 13 -
(proteins with more than 40% sequence identity), a capital letter specifying the subfamily
(more than 55% identity) and a final number for the individual gene within the subfamily, for
example CYP2D6 (Nelson et al., 1993). Despite the low sequence identity among cytochrome
P450s, the overall fold topography is highly conserved. All members of the CYP protein
family consist of carboxy-terminal part, having a relatively high abundance in alpha helix and
an amino-terminal domain with a relatively high abundance in beta sheet, which build up a
common globular-to-triangular structural framework.
Depending on their subcellular localization, cytochrome P450s can be additionally
categorized into three broad groups. While all prokaryotic CYPs belong to the soluble
cytosolic form, almost all eukaryotic CYPs are embedded in the membrane of either the
mitochondria (mitochondrial-type) or the endoplasmic reticulum (microsomal-type).
Membrane bound CYPs are tethered to membranes by an amino-terminal signal-anchor
sequence composed of a string of hydrophobic residues.
The vast majority of cytochrome P450s needs helper proteins to form an active cytochrome
P450s system. This systems are composed of the cytochrome P450 itself and one or two
additional proteins (i.e. FAD-containing reductase + ferredoxin, FAD/FMN-containing
reductase) constituting an electron transfer chain (ET) that shuttles reducing equivalents from
a cofactor (i.e. NADH or NADPH) to the cytochrome P450. There are already more then 10
electron transfer chains described in literature (Hannemann et al., 2007). However, the most
common monooxygenase system in eukaryotes is the class II (Fig 3). In the simplest form,
they contain two integral membrane proteins: the cytochrome P450 and the flavin containing
cytochrome P450 reductase (CPR), which transfers both required electrons from NADPH to
one of the many cytochrome P450 isozymes. Therefore, the activity of CYPs is not only
determined by its abundance, but also by the abundance of the electron transport partners
(Crespi et al., 1999). Recent studies showed that the redox partners do not only provide the
necessary reduction equivalents, but they are also important for the regulation of the catalytic
cycle, where the CPR binding acts as an internal timer of the reaction (Fishelovitch et al.,
2010).

Dissertation Braun Andreas
- 14 -
Fig 3: Schematic organization of of the most comone cytochrome P450 systems.
(A) Class I, bacterial system; (B) class I, mitochondiral system; (C) class II microsomal system. Picture is based on picture from literature (Hannemann et al., 2007)
As mentioned before, P450 enzymes play a vital role in metabolism of many drugs and
xenobiotics and carcinogens, and are therefore of particularly scientific interest. In this work,
a particular focus has been given on human CYP2D6 and CYP3A4.
4.3. Human CYP2D6 and CYP3A4
Human P450s are membrane bound proteins and are expressed in many tissues. So far, 57
cytochrome P450 enzymes and 58 pseudogenes have been identified in the human genome
(Zöllner et al., 2010). The highest levels are found in the liver, where they have the principal
function to introduce an oxygen atom into hydrophobic substrates. The increased
hydrophilicity of the product facilitates its elimination from the human body. Several
xenobiotic-metabolizing CYPs are expressed in human liver, among which CYP1A2,
CYP2C9, CYP2C19, CYP2D6 and CYP3A4 appear to be most commonly responsible for the
metabolism of many structurally diverse drugs and chemicals. Furthermore, many of the liver
P450s are involved in endogenous metabolism pathways; i.e. of fatty acids and steroids
(Spatzenegger et al., 1995). Many of these drug-metabolizing CYPs are subject to
Fdx
P450 FdR
NADH + H+
NAD +
RH + O2
R-OH + H2O
Fdx
P450 FdR
NADH + H+
NAD +
RH + O2
R-OH + H2O
inner mitochondrial membrane
P450
NADH + H+
NAD +
RH + O2
R-OH + H2O
ER membrane
CPR
Cytoplasm
Matrix
(C)
(B)
(A)

Dissertation Braun Andreas
- 15 -
polymorphism: these sequence variants are associated with modified levels of expression or
catalytic activities. Physicians recognized that patients responded differently to applied drugs,
according to which allelic variant their genomes were carrying (Shastry, 2006); interestingly,
very often, when the influence of polymorphism on pharmacokinetic is mentioned, the redox
partners of CYPs are ignored, even though they show a high level of polymorphism as well
(Miller et al., 2010).
CYP2D6 is a highly polymorphous, microsomal cytochrome P450 found mainly in the
liver and to some extend in duodenum and brain as well. It accounts only for 2% of the
expressed hepatic CYPs. Nevertheless, this enzyme is responsible for the metabolism of
roughly 25% of available pharmaceuticals. These compounds vary in chemical structure,
although they all contain a basic nitrogen and a planar aromatic ring as common feature
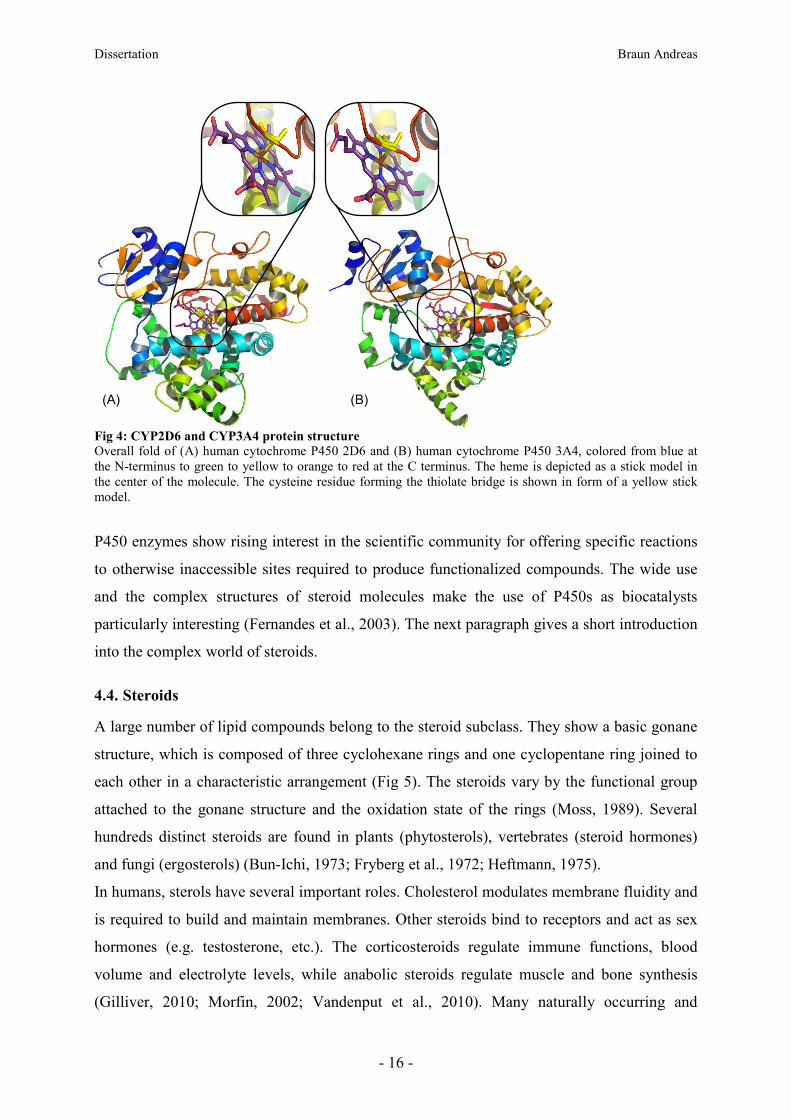
(Strobl et al., 1993; Unwalla et al., 2010). In 2006, the structure of CYP2D6 was resolved and
deposited in the protein data base (PDB: 2F9Q) (Fig 4). The 3D structure was made possible
truncating the membrane-bound N-terminal domain and introducing two mutations at position
L230 and L231 that helped to solubilize the protein (Rowland et al., 2006).
CYP3A4 is a polymorphous, microsomal cytochrome P450. It is the most abundant one
and found mainly in the liver and in the human intestine. Up to 60% of the total hepatic
cytochrome P450 is comprised by CYP3A4. It has been shown that a huge variety of
pharmaceuticals and drugs are metabolized by CYP3A4, which is therefore responsible for
the metabolization of roughly 60% of available pharmaceuticals (McKinnon et al., 1995;
Shimada et al., 1994). In 2004, the structure of CYP3A4 was resolved and deposited in the
protein data base (PDB: 1W0F) (Fig 4). Likewise for CYP2D6, the protein was truncated to
facilitate solubility and crystallization (Williams et al., 2004).
Dissertation Braun Andreas
- 16 -
Fig 4: CYP2D6 and CYP3A4 protein structure Overall fold of (A) human cytochrome P450 2D6 and (B) human cytochrome P450 3A4, colored from blue at the N-terminus to green to yellow to orange to red at the C terminus. The heme is depicted as a stick model in the center of the molecule. The cysteine residue forming the thiolate bridge is shown in form of a yellow stick model.
P450 enzymes show rising interest in the scientific community for offering specific reactions
to otherwise inaccessible sites required to produce functionalized compounds. The wide use
and the complex structures of steroid molecules make the use of P450s as biocatalysts
particularly interesting (Fernandes et al., 2003). The next paragraph gives a short introduction
into the complex world of steroids.
4.4. Steroids
A large number of lipid compounds belong to the steroid subclass. They show a basic gonane
structure, which is composed of three cyclohexane rings and one cyclopentane ring joined to
each other in a characteristic arrangement (Fig 5). The steroids vary by the functional group
attached to the gonane structure and the oxidation state of the rings (Moss, 1989). Several
hundreds distinct steroids are found in plants (phytosterols), vertebrates (steroid hormones)
and fungi (ergosterols) (Bun-Ichi, 1973; Fryberg et al., 1972; Heftmann, 1975).
In humans, sterols have several important roles. Cholesterol modulates membrane fluidity and
is required to build and maintain membranes. Other steroids bind to receptors and act as sex
hormones (e.g. testosterone, etc.). The corticosteroids regulate immune functions, blood
volume and electrolyte levels, while anabolic steroids regulate muscle and bone synthesis
(Gilliver, 2010; Morfin, 2002; Vandenput et al., 2010). Many naturally occurring and
(A)
(B)
(B)

Dissertation Braun Andreas
- 17 -
synthetic steroids are abused by athletes for faster muscle buildup and are also routinely used
as therapeutics in medicine (Fragkaki et al., 2009).
Efficient production methods of steroid metabolites are of a general industrial interest. In
mammalian cells, cytochrome P450 enzymes are mainly responsible for sterol oxidative
metabolism. In particular, progesterone and testosterone belong to the steroid hormones and
were used in this work. Testosterone shows anabolic (promotes protein synthesis) and
androgenic (stimulation and control of male characteristics development) effects;
progesterone belongs to the progestogene hormone family, which has the main function of
maintaining pregnancy. Furthermore, progestogenes serve as precursors to all other steroids
and therefore play a vital role in steroidogenesis (Bun-Ichi, 1973).
Fig 5: Structure of steroids
(A) basic skeleton of steroids, (B) human hormone progesterone
4.5. Heterologous expression of P450 enzymes
In the past 20 years, several recombinant expression systems have been investigated. From
the more complicated and expensive mammalian (Langenbach et al., 1992) and baculovirus-
mediated insect cell system (Asseffa et al., 1989), often exhibiting low levels of functional
enzyme, to the “simpler” expression host E. coli. Besides the cheap and ease handling, E. coli
has the additionally advantage of lacking native P450s. However, for high level expression N-
terminal truncation or modifications are needed in E. coli: changing its native form can lead to
a change in the product spectrum of the enzyme (Kim et al., 2008).
In recent years the focus shifted more and more to yeast systems, which combine the ease
of handling of prokaryotic systems (cheap media, single cell organism, high cell density) with
the features of a eukaryotic system (an endoplasmic reticulum (ER) membrane environment,
protein expression and modification processes that resemble those of higher eukaryotes). The
endogenous CPR homologues of the different yeasts are able to interact to some extent with
heterologously expressed CYPs, although the co-expression of the heterologous P450 redox
partner in general leads to an increased CYP activity (Zöllner et al., 2010). A couple of
mammalian microsomal CYPs have been functionally expressed so far in S. cerevisiae
(A) (B)
H
H
H H
H
H R
1
2
3
4
5
6
7
8
9
10
1112
1314
15
16
17
H H
H
H
O
O
Dissertation Braun Andreas
- 18 -
(Kalsotra et al., 2004; Krynetski et al., 1995; Rao et al., 2010; Renaud et al., 1990; Urban et
al., 1990), P. pastoris (Dietrich et al., 2005; Kolar et al., 2007) and S. pombe (Bureik et al.,
2002; Drăgan et al., 2011; Zehentgruber et al., 2010) and the non-conventional yeasts Y.
lipolytica (Juretzek et al., 2000; Novikova et al., 2009; Nthangeni et al., 2004).
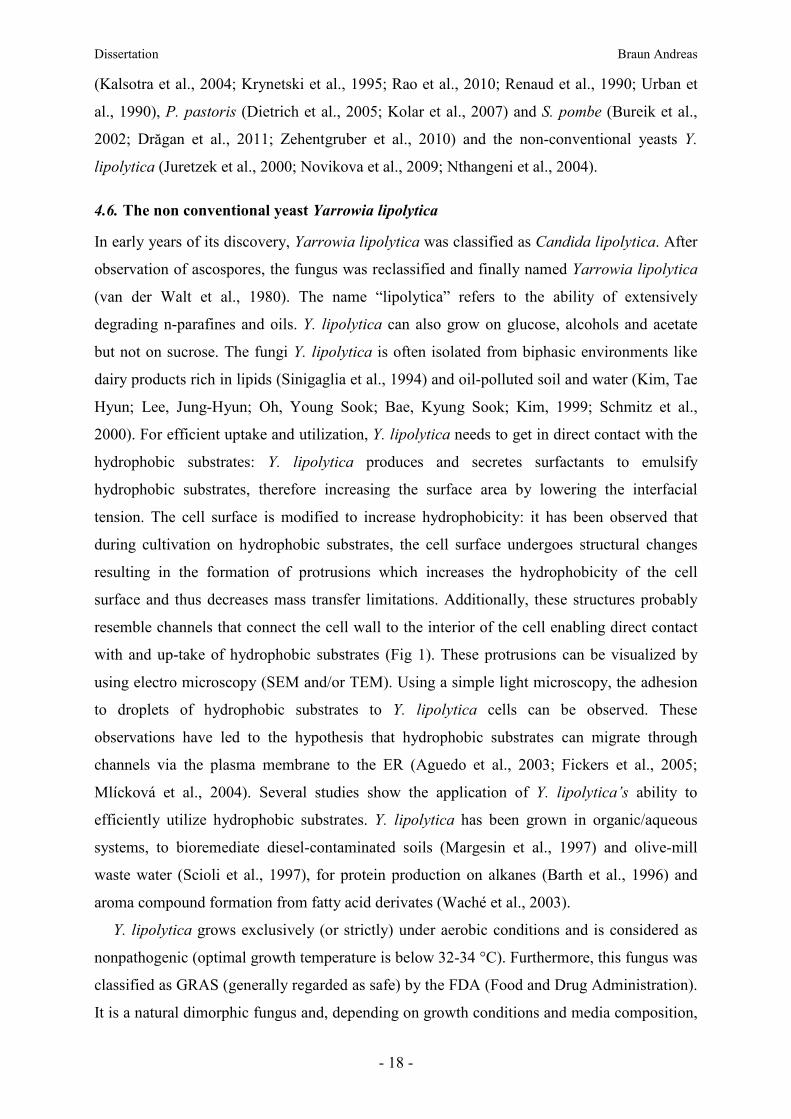
4.6. The non conventional yeast Yarrowia lipolytica
In early years of its discovery, Yarrowia lipolytica was classified as Candida lipolytica. After
observation of ascospores, the fungus was reclassified and finally named Yarrowia lipolytica
(van der Walt et al., 1980). The name “lipolytica” refers to the ability of extensively
degrading n-parafines and oils. Y. lipolytica can also grow on glucose, alcohols and acetate
but not on sucrose. The fungi Y. lipolytica is often isolated from biphasic environments like
dairy products rich in lipids (Sinigaglia et al., 1994) and oil-polluted soil and water (Kim, Tae
Hyun; Lee, Jung-Hyun; Oh, Young Sook; Bae, Kyung Sook; Kim, 1999; Schmitz et al.,
2000). For efficient uptake and utilization, Y. lipolytica needs to get in direct contact with the
hydrophobic substrates: Y. lipolytica produces and secretes surfactants to emulsify
hydrophobic substrates, therefore increasing the surface area by lowering the interfacial
tension. The cell surface is modified to increase hydrophobicity: it has been observed that
during cultivation on hydrophobic substrates, the cell surface undergoes structural changes
resulting in the formation of protrusions which increases the hydrophobicity of the cell
surface and thus decreases mass transfer limitations. Additionally, these structures probably
resemble channels that connect the cell wall to the interior of the cell enabling direct contact
with and up-take of hydrophobic substrates (Fig 1). These protrusions can be visualized by
using electro microscopy (SEM and/or TEM). Using a simple light microscopy, the adhesion
to droplets of hydrophobic substrates to Y. lipolytica cells can be observed. These
observations have led to the hypothesis that hydrophobic substrates can migrate through
channels via the plasma membrane to the ER (Aguedo et al., 2003; Fickers et al., 2005;
Mlícková et al., 2004). Several studies show the application of Y. lipolytica’s ability to
efficiently utilize hydrophobic substrates. Y. lipolytica has been grown in organic/aqueous
systems, to bioremediate diesel-contaminated soils (Margesin et al., 1997) and olive-mill
waste water (Scioli et al., 1997), for protein production on alkanes (Barth et al., 1996) and
aroma compound formation from fatty acid derivates (Waché et al., 2003).
Y. lipolytica grows exclusively (or strictly) under aerobic conditions and is considered as
nonpathogenic (optimal growth temperature is below 32-34 °C). Furthermore, this fungus was
classified as GRAS (generally regarded as safe) by the FDA (Food and Drug Administration).
It is a natural dimorphic fungus and, depending on growth conditions and media composition,

Dissertation Braun Andreas
- 19 -
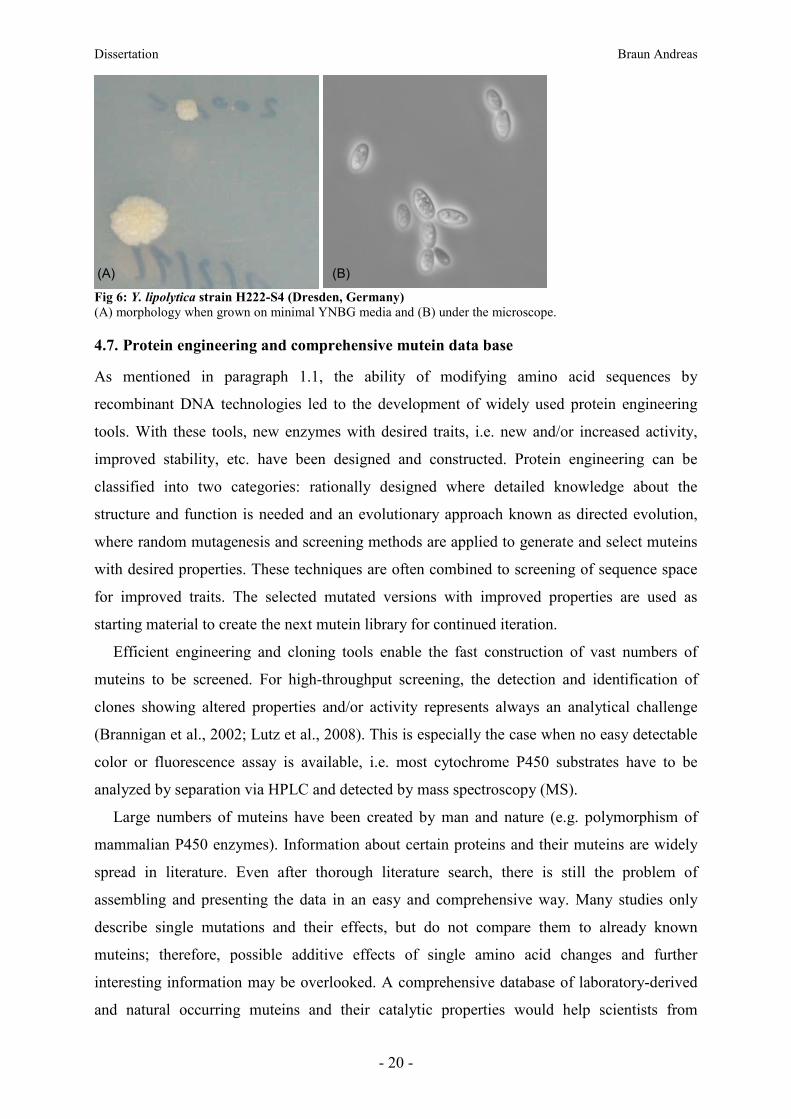
forms yeast cells, pseudohyphae or septate hyphae (Barth et al., 1997) (Fig 6). The complete
genome sequence has been made publicly available in 2004 (Dujon et al., 2004). Genome
analysis revealed that the organism contains 6 chromosomes that show a high frequency of
introns and a rather high G+C content. The organism is distantly related to Saccharomyces
cerevisiae, and displays an expansion of protein families and genes involved in hydrophobic
substrate utilization (Dujon et al., 2004; Thevenieau et al., 2009). The ability to grow on n-
paraffins as sole carbon source and the capability to secrete large amounts of protein aroused
interest and in the mid 80s efficient genetic tools for gene integration became available. Y.
lipolytica shows a natural resistance to most commonly used antibiotics. Still, auxotrophy
markers are generally used to date as selection method for transformants (Madzak et al.,
2004). No natural replicative vectors exist; however, an artificial replicative vector containing
both replicative and centromeric functions has been developed, stably maintained as on to
three copies per cell (Madzak et al., 2000; Vernis et al., 2001). Integrative vectors are mainly
used for heterologous protein production. To increase copy numbers of the integrated
expression cassettes, vectors containing defective ura3d4 alleles as selection marker have
been used. The defective allele harbors a degenerated ura3d4 promoter, which gives only
sufficient amounts of uracyl when several copies of the vector are integrated into the genome,
allowing the selection for clones where multicopy integrations or gene multiplications have
occurred (Le Dall et al., 1994). As integration target for multicopy integration, rDNA or LTR
sites of a Y. lipolytica retrotransposon (Ylt1), belonging to the TY3 family, have been used.
This retrotransposone is only found in strains isolated from America (Schmid-Berger et al.,
1994). For protein expression, several promoters, including non-natural synthetic ones,
secretion signals and terminators are available and have been used successfully (Madzak et
al., 2005). In a comprehensive study, several yeasts (S. cerevisiae, H. polymorpha, K. lactis,
S. pombe, and Y. lipolytica) have been compared for their efficiency as hosts for heterologous
protein production (Müller et al., 1998). In the mentioned study, Y. lipolytica was identified as
one of the most attractive hosts for heterologous protein production.
Furthermore, new and efficient tools for recombinant protein expression and high-throughput
screening with Y. lipolytica have been developed (Bordes et al., 2007; Emond et al., 2010).
This makes Y. lipolytica a potent and desirable alternative to other expression systems.
Dissertation Braun Andreas
- 20 -
Fig 6: Y. lipolytica strain H222-S4 (Dresden, Germany)
(A) morphology when grown on minimal YNBG media and (B) under the microscope.
4.7. Protein engineering and comprehensive mutein data base
As mentioned in paragraph 1.1, the ability of modifying amino acid sequences by
recombinant DNA technologies led to the development of widely used protein engineering
tools. With these tools, new enzymes with desired traits, i.e. new and/or increased activity,
improved stability, etc. have been designed and constructed. Protein engineering can be
classified into two categories: rationally designed where detailed knowledge about the
structure and function is needed and an evolutionary approach known as directed evolution,
where random mutagenesis and screening methods are applied to generate and select muteins
with desired properties. These techniques are often combined to screening of sequence space
for improved traits. The selected mutated versions with improved properties are used as
starting material to create the next mutein library for continued iteration.
Efficient engineering and cloning tools enable the fast construction of vast numbers of
muteins to be screened. For high-throughput screening, the detection and identification of
clones showing altered properties and/or activity represents always an analytical challenge
(Brannigan et al., 2002; Lutz et al., 2008). This is especially the case when no easy detectable
color or fluorescence assay is available, i.e. most cytochrome P450 substrates have to be
analyzed by separation via HPLC and detected by mass spectroscopy (MS).
Large numbers of muteins have been created by man and nature (e.g. polymorphism of
mammalian P450 enzymes). Information about certain proteins and their muteins are widely
spread in literature. Even after thorough literature search, there is still the problem of
assembling and presenting the data in an easy and comprehensive way. Many studies only
describe single mutations and their effects, but do not compare them to already known
muteins; therefore, possible additive effects of single amino acid changes and further
interesting information may be overlooked. A comprehensive database of laboratory-derived
and natural occurring muteins and their catalytic properties would help scientists from
(A) (B)

Dissertation Braun Andreas
- 21 -
medicine and pharmacokinetics, to structural biology or applied biocatalysis. So far, only a
few databases are addressing this complex issue (Fischer et al., 2007; Kawabata et al., 1999;
Preissner et al., 2010; Schomburg et al., 2004); however, none of these databases gives
detailed information about kinetic characteristics of muteins allowing, at the same time, a fast,
systematic and easy way to search for known mutations and catalyzed reactions of interest
resulting in a comparative output of muteins in respect to their catalytic properties. Retrieved
informations can give potential starting points for directed evolution experiments. The
MuteinDB (http://www.muteindb.org) is meant as a platform to collect experimentally
derived data about muteins from publicly available sources. Additionally it allows easy access
by flexible searches options.
4.8. Aim of the work
As mentioned before, most of the typical substrates for cytochrome P450 enzymes are very
hydrophobic. One of the biggest obstacles in performing bioconversions with hydrophobic
substrates is the very low solubility in the aqueous phase, which limits cell uptake and
represent a frequent bottleneck to the overall biotransformation performance. The unique
properties of alkane-utilizing yeast Y. lipolytica to efficiently utilize and grow on hydrophobic
substrates have been shown in several examples. However, so far its potential for the
biotransformation of hydrophobic substrates in a two-liquid biphasic setup with heterologous
expressed proteins has not been studied. Furthermore, Y. lipolytica has been identified as a
potential host for the heterologous production of cytochrome P450 enzymes, but only a few
examples exist so far.
The main topic of this work was to use and improve the available genetic tools for this
species to functionally express the human liver CYP system CYP2D6 and CYP3A4 in
combination with either functionally expressed human cytochrome P450 oxidoreductase
and/or the endogenous cytochrome P450 oxidoreductase in Y. lipolytica.
The next step after the successful expression of the human liver CYP system was the
assessment of Y. lipolytica as a whole cell biocatalyst in biphasic two-liquid phase systems for
hydroxylation of hydrophobic substrates. In this work I focused on the bioconversion of the
very hydrophobic substance class of steroids, namely testosterone, 17alpha-
methyltestosterone and progesterone. For the analysis of steroids and their bioconversion
products several HPLC-MS methods have been developed. Additionally, a HPLC-MS high-
throughput screening methods for the screening of P450 mutants showing changed steroid
metabolite production has been developed.
Dissertation Braun Andreas
- 22 -
The second part of this work focused on the improvement and further development of the
muteinDB. As mentioned before, the MuteinDB (http://www.muteindb.org) provides a
platform for not only collecting but also for searching for in-depth information of
experimentally derived kinetic properties of muteins. This comprehensive database will help
researchers from the field of applied biocatalysis to identify potential starting points for
further enzyme engineering. As an additional use, medical scientists can also get information
about the influence of mutations on drug metabolization and in vivo activation. The new
implemented structure search will allow the prediction of structure scaffolds that are accepted
by muteins, which might provide helpful information for the development of new biocatalysts
and most probably will facilitate drug metabolite prediction in pharmaceutical research and
development.
To accomplish this goal, the data collection was standardized and general rules for data
collections were written down. The informatics part was done by and in close cooperation
with Bettina Halwachs and Gerhard G. Thallinger (Institute for Genomics and Bioinformatics,
TU Graz). Several exemplary datasets of different enzyme classes were collected to
demonstrate the general applicability of the database. Information about CYP3A4, CYP2D6,
HRP, NIT were collected at the TU Graz by myself (Andreas Braun, IMBT) and co-workers
(Katrin Weinhandl, Martina Geier, IMBT). Data about the BM3 also known as CYP102A1
were collected by cooperation partners at the RWTH Aachen University (Jan Marienhagen,
Anna Joelle Ruff, Department of Biotechnology), and cooperation partners from the
University of Groningen helped with the data collection about PAMO (Daniel E. Torres
Pazmino, Groningen Biomolecular Sciences and Biotechnology Institute). All data sets were
curated at the TU Graz (Andreas Braun, Bettina Halwachs) before implementation to the
database.

Dissertation Braun Andreas
- 23 -
5. Materials and Methods
More detailed informations about reagents, media and used devices are given in the appendix.
5.1. Growth media
All following media were prepared and sterilized by either autoclaving (20 min at 121 °C) or
sterile filtration (0.22 µm filter, Roth, Germany). Solid form was obtained by setting up a 15
g/L agar concentration.
5.1.1. media for Escherichia coli (E. coli)
• LB medium (Luria-Bertani)
When needed, ampicillin was added to a final concentration of 100 µg/ml.
• SOC medium
SOC is a suitable medium for use in the final step of cell transformation to obtain
maximum transformation efficiency of E. coli (Hanahan, 1983).
5.1.2. Growth media for Yarrowia lipolytica (Y. lipolytica)
• YPD
Complex standard medium often used for growing yeast.
• YNB (Yeast nitrogen based with out amino acids)
Standard media for classification of yeasts based on amino acid and carbohydrate
requirements. D-glucose was added as carbon source to a final concentration of 0.5 – 1
%. When needed, amino acids and bases were added (Uracile, Leucine) to a final
concentration of 20 – 50 mg/L
• MM (mineral salt minimal medium) (Mauersberger et al., 1996)
More or less the same composition as YNB w/o amino acids, but salts were adopted
from the Reader-Medium (Reader, 1929). D-glucose was added as carbon source to a
final concentration of 0.5 – 1 %.

Dissertation Braun Andreas
- 24 -
5.2. Strains
Strains used in this work are summarized in Table 1.
5.3. Plasmids
p64ICL1, p65ICL1, p67RYI were provided by Dr. Mauersberger (TU Dresden, Germany)
Plasmids used in this work are summarized in Table 2.
5.4. Oligonucleotides
All primers used during this work were obtained from the company IDT (Integrated DNA
Technologies, USA). The sequences as well as the purpose of each oligonucleotide used in
this work are given in the appendix section.
5.5. Methods
Unless stated otherwise, all genetic methods applied during this work were carried out
according to the standard methods as described previously (Sambrook et al., 2001).
5.5.1. DNA electrophoresis and manipulation
Products from PCR and endonuclease reactions were analysed by agarose gel electrophoresis
using agarose concentration of 1 % (w/v) in TBE-buffer. The GeneRulerTM 1kb plus DNA
Ladder and MassRulerTM DNA Ladder (Fermentas, Germany) have been used as reference
DNA. The ethidium bromide stained DNA fragment of interest was isolated from gel and
purified using a commercially available kit (Promega, USA), according to the manufacturer’s
instructions. DNA concentration was determined either by comparing to MassRuler DNA
ladder (Fermentas, Germany) or spectroscopically at 260 nm using nanodrop (Thermo
Scientific, Germany).
5.5.2. DNA restriction and ligation
All used restriction endonucleases were from Fermentas (Fermentas, Germany). All
restriction reactions were performed according to the manufacturer’s instructions in the
recommended buffers. Double restrictions were simultaneously performed in the most
appropriate buffers. Ligation of DNA fragments were performed using the commercially
available T4 DNA ligase™ from Fermentas (Fermentas, Germany). The ligation reactions
were performed according to the manufacturer’s instructions, at different molar ratios of
plasmid backbone to insert.
Dis
sert
atio
n
B
raun
And
reas
-
25 -
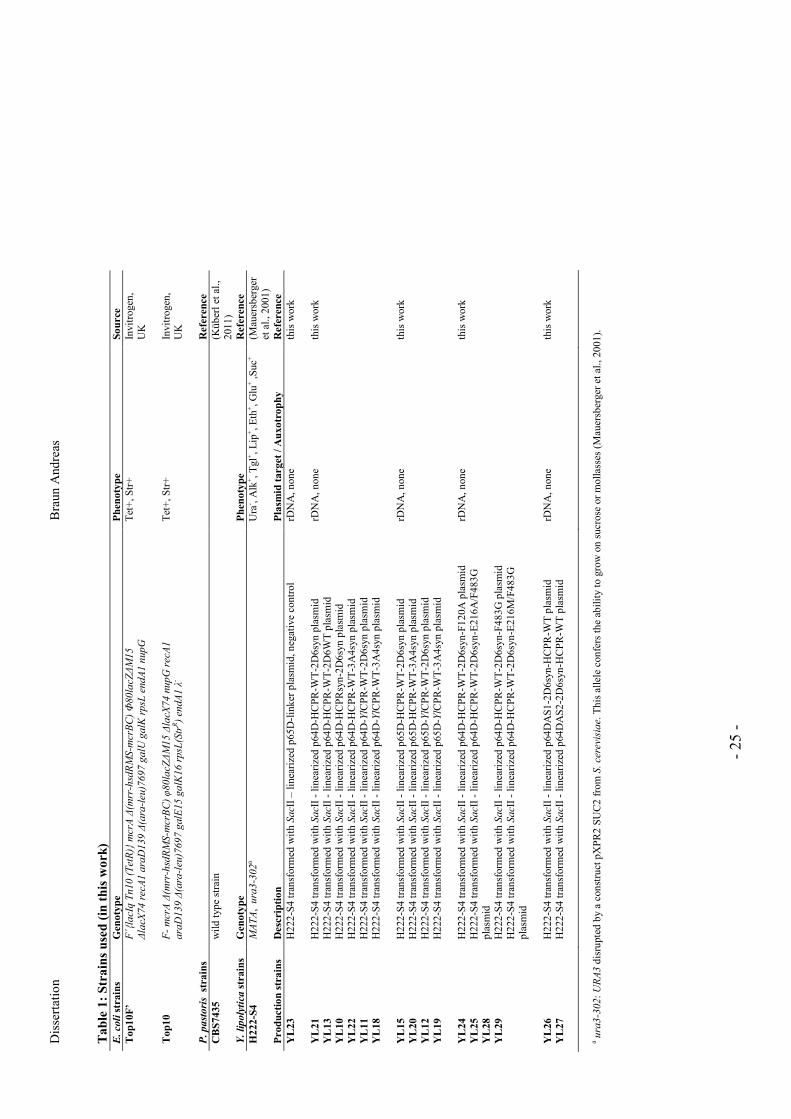
Ta
ble
1:
Str
ain
s u
sed
(in
th
is w
ork
) E. coli s
train
s G
eno
typ
e P
hen
oty
pe
So
urc
e
To
p1
0F
’
F´
lacI
q T
n10
(T
etR
) m
crA
∆(m
rr-h
sdR
MS
-mcr
BC
) Φ
80
lacZ
∆M
15
∆la
cX74
rec
A1
ara
D139
∆(a
ra-l
eu)7
697
ga
lU g
alK
rp
sL e
nd
A1
nup
G
Tet
+, S
tr+
In
vitr
ogen
, U
K
To
p1
0
F-
mcr
A ∆
(mrr
-hsd
RM
S-m
crB
C)
φ80
lacZ
∆M
15
∆la
cX74
nu
pG
rec
A1
ara
D13
9 ∆
(ara
-leu
)769
7 g
alE
15
ga
lK16
rp
sL(S
trR)
endA
1 λ
- T
et+
, Str
+
Invi
trog
en,
UK
P. pastoris s
tra
ins
Ref
eren
ce
CB
S74
35
w
ild
type
str
ain
(Küb
erl
et a
l.,
2011
) Y. lipolytica
str
ain
s G
eno
typ
e P
hen
oty
pe
Ref
eren
ce
H2
22
-S4
MA
TA
, u
ra3
-302
a U
ra- , A
lk+, T
gl+, L
ip+, E
th+, G
lu+ ,S
uc+
(Mau
ersb
erge
r et
al.,
200
1)
Pro
du
ctio
n s
tra
ins
Des
crip
tio
n
Pla
smid
targ
et /
Au
xo
tro
ph
y
Ref
eren
ce
YL
23
H22
2-S
4 tr
ansf
orm
ed w
ith
Sa
cII
– li
near
ized
p65
D-l
inke
r pl
asm
id, n
egat
ive
cont
rol
rDN
A, n
one
this
wor
k
YL
21
YL
13
YL
10
YL
22
YL
11
YL
18
H22
2-S
4 tr
ansf
orm
ed w
ith
Sa
cII
- li
near
ized
p64
D-H
CP
R-W
T-2
D6s
yn p
lasm
id
H22
2-S
4 tr
ansf
orm
ed w
ith
Sa
cII
- li
near
ized
p64
D-H
CP
R-W
T-2
D6W
T p
lasm
id
H22
2-S
4 tr
ansf
orm
ed w
ith
Sa
cII
- li
near
ized
p64
D-H
CP
Rsy
n-2D
6syn
pla
smid
H
222-
S4
tran
sfor
med
wit
h Sa
cII
- li
near
ized
p64
D-H
CP
R-W
T-3
A4s
yn p
lasm
id
H22
2-S
4 tr
ansf
orm
ed w
ith
Sa
cII
- li
near
ized
p64
D-Y
lCP
R-W
T-2
D6s
yn p
lasm
id
H22
2-S
4 tr
ansf
orm
ed w
ith
Sa
cII
- li
near
ized
p64
D-Y
lCP
R-W
T-3
A4s
yn p
lasm
id
rDN
A, n
one
this
wor
k
YL
15
YL
20
YL
12
YL
19
H22
2-S
4 tr
ansf
orm
ed w
ith
Sa
cII
- li
near
ized
p65
D-H
CP
R-W
T-2
D6s
yn p
lasm
id
H22
2-S
4 tr
ansf
orm
ed w
ith
Sa
cII
- li
near
ized
p65
D-H
CP
R-W
T-3
A4s
yn p
lasm
id
H22
2-S
4 tr
ansf
orm
ed w
ith
Sa
cII
- li
near
ized
p65
D-Y
lCP
R-W
T-2
D6s
yn p
lasm
id
H22
2-S
4 tr
ansf
orm
ed w
ith
Sa
cII
- li
near
ized
p65
D-Y
lCP
R-W
T-3
A4s
yn p
lasm
id
rDN
A, n
one
this
wor
k
YL
24
YL
25
YL
28
YL
29
H22
2-S
4 tr
ansf
orm
ed w
ith
Sa
cII
- li
near
ized
p64
D-H
CP
R-W
T-2
D6s
yn-F
120A
pla
smid
H
222-
S4
tran
sfor
med
wit
h Sa
cII
- li
near
ized
p64
D-H
CP
R-W
T-2
D6s
yn-E
216A
/F48
3G
plas
mid
H
222-
S4
tran
sfor
med
wit
h Sa
cII
- li
near
ized
p64
D-H
CP
R-W
T-2
D6s
yn-F
483G
pla
smid
H
222-
S4
tran
sfor
med
wit
h Sa
cII
- li
near
ized
p64
D-H
CP
R-W
T-2
D6s
yn-E
216M
/F48
3G
plas
mid
rDN
A, n
one
this
wor
k
YL
26
YL
27
H22
2-S
4 tr
ansf
orm
ed w
ith
Sa
cII
- li
near
ized
p64
DA
S1-
2D6s
yn-H
CP
R-W
T p
lasm
id
H22
2-S
4 tr
ansf
orm
ed w
ith
Sa
cII
- li
near
ized
p64
DA
S2-
2D6s
yn-H
CP
R-W
T p
lasm
id
rDN
A, n
one
this
wor
k
a ura
3-3
02
: UR
A3
dis
rupt
ed b
y a
cons
truc
t pX
PR
2 S
UC
2 fr
om S
. ce
revi
sia
e. T
his
alle
le c
onfe
rs t
he a
bili
ty t
o gr
ow o
n su
cros
e or
mol
lass
es (
Mau
ersb
erge
r et
al.,
200
1).

Dis
sert
atio
n
B
raun
And
reas
-
26 -
Ta
ble
2:
Pla
smid
s u
sed
(in
th
is w
ork
) P
lasm
id
Des
crip
tio
n
Ma
rker
gen
e (s
elec
tio
n i
n y
east
) R
efer
ence
p6
4IC
L1
p6
5IC
L1
pare
ntal
vec
tor
pare
ntal
vec
tor
u
ra3d
4 (
mc)
a u
ra3d
1 (
sc) a
(F
örst
er e
t al
., 20
07)
p6
7R
YL
so
urce
for
Y.
lipo
lyti
ca c
ytoc
hrom
e P
450
redu
ctas
e (Y
lCP
R-W
T)
ura
3d
4 (
mc)
a (F
örst
er, 2
001;
Nth
ange
ni e
t al
., 20
04)
pN
MT
S-C
YP
-OR
-sp
e
pB
dp
Trc
Red
-3A
4(1
92
v)w
tA305
S
sour
ce f
or c
odon
opt
imiz
ed h
uman
cyt
ochr
ome
P45
0 3A
4 (3
A4s
yn)
sour
ce f
or c
odon
opt
imiz
ed h
uman
cyt
ochr
ome
P45
0 re
duct
ase
(HC
PR
syn)
Wei
s et
al.,
unp
ubli
shed
ID3
091
541
1
ID7
262
313
ID7
262
313
cDN
A w
ild-
type
hum
an c
ytoc
hrom
e P
450
2D6
(2D
6-W
T)
cDN
A w
ild-
type
hum
an c
ytoc
hrom
e P
450
3A4
(3A
4-W
T)
cDN
A w
ild-
type
hum
an c
ytoc
hrom
e P
450
redu
ctas
e (H
CP
R-W
T)
B
ioC
at G
mbH
, Ger
man
y
Clonin
g vectors for in
tegra
tion into Y
. lipolytica
:
pJ
et1.2
cl
onin
g ve
ctor
Fer
men
tas
p6
4D
-lin
ker
p6
5D
-lin
ker
clon
ing
and
expr
essi
on v
ecto
r cl
onin
g, e
xpre
ssio
n ve
ctor
and
neg
ativ
e co
ntro
l
ura
3d
4 (
mc)
a
ura
3d
1 (
sc) a
th
is w
ork
p6
4D
AS
1-l
ink
er
p6
5D
AS
2-l
ink
er
clon
ing
and
expr
essi
on v
ecto
r cl
onin
g, e
xpre
ssio
n ve
ctor
and
neg
ativ
e co
ntro
l u
ra3d
4 (
mc)
a
ura
3d
1 (
sc) a
th
is w
ork
Integra
tive vec
tors for CPR and P
450 pro
duction in Y
. lipolytica
: p
64
D-H
CP
R-W
T-2
D6
syn
p6
4D
-HC
PR
-WT
-2D
6W
T
p6
4D
-HC
PR
syn
-2D
6sy
n
p6
4D
-HC
PR
-WT
-3A
4sy
n
p6
4D
-HC
PR
-WT
-3A
4W
T
p6
4D
-YlC
PR
-WT
-2D
6sy
n
p6
4D
-YlC
PR
-WT
-2D
6W
T
p6
4D
-YlC
PR
-WT
-3A
4sy
n
p6
4D
-YlC
PR
-WT
-3A
4W
T
mul
ti c
opy
co-e
xpre
ssio
n of
hum
an w
ild-
type
CP
R o
r Y
. li
po
lyti
ca o
wn
wil
d-ty
pe
CP
R in
com
bina
tion
wit
h w
ild-
type
or
codo
n op
tim
ized
CY
P2D
6 or
wil
d-ty
pe o
r co
don
opti
miz
ed C
YP
3A4,
res
pect
ivel
y
ura
3d
4 (
mc)
a
this
wor
k
p6
5D
-HC
PR
-WT
-2D
6sy
n
p6
5D
-HC
PR
-WT
-2D
6W
T
p6
5D
-HC
PR
-WT
-3A
4sy
n
p6
5D
-HC
PR
-WT
-3A
4W
T
p6
5D
-YlC
PR
-WT
-2D
6sy
n
p6
5D
-YlC
PR
-WT
-2D
6W
T
p6
5D
-YlC
PR
-WT
-3A
4sy
n
p6
5D
-YlC
PR
-WT
-3A
4W
T
sing
le c
opy
co-e
xpre
ssio
n of
hum
an w
ild
type
CP
R, c
odon
opt
imiz
ed C
PR
or
Y.
lip
oly
tica
ow
n w
ild
type
CP
R in
com
bina
tion
wit
h w
ild
type
/ c
odon
opt
imiz
ed
CY
P2D
6 or
wil
d ty
pe/
codo
n op
tim
ized
CY
P3A
4, r
espe
ctiv
ely
ura
3d
1 (
sc) a
th
is w
ork
Integra
tive vec
tors for CPR and C
YP2D6 m
utant pro
duction in Y
. lipolytica:
p6
4D
-HC
PR
-WT
-2D
6sy
n-F
12
0A
p6
4D
-HC
PR
-WT
-2D
6sy
n-E
216
A/F
483
G
p6
4D
-HC
PR
-WT
-2D
6sy
n-F
48
3G
p6
4D
-HC
PR
-WT
-2D
6sy
n-
E216
M/F
48
3G
mul
ti c
opy
co-e
xpre
ssio
n of
hum
an w
ild-
type
CP
R in
com
bina
tion
wit
h co
don
opti
miz
ed C
YP
2D6
mut
ants
u
ra3d
4 (
mc)
a
this
wor
k
Integra
tive vec
tors for CPR and C
YP2D6 m
utant pro
duction in Y
. lipolytica:
Dis
sert
atio
n
B
raun
And
reas
-
27 -
p6
4D
AS
1-2
D6
syn
-HC
PR
-WT
p6
4D
AS
2-2
D6
syn
-HC
PR
-WT
mul
ti c
opy
co-e
xpre
ssio
n of
cod
on o
ptim
ized
CY
P2D
6 in
com
bina
tion
wit
h hu
man
w
ild-
type
CP
R w
here
2D
6syn
is
unde
r th
e co
ntro
l of
the
DA
S1
or D
AS
2 pr
omot
er
from
P.
pa
sto
ris
ura
3d
4 (
mc)
a
this
wor
k
a U
RA
3 m
arke
r ge
nes
for
sing
le c
opy
(sc,
ura
3d1
) or
mul
tico
py (
mc,
ura
3d4)
sele
ctio
n w
ith
diff
eren
t pro
mot
er le
ngth
s; A
bbre
viat
ions
: HC
PR
-WT
, wil
d ty
pe h
uman
cyt
ochr
ome
P45
0 re
duct
ase;
YlC
PR
-WT
, wil
d ty
pe Y
. li
poly
tica
cyt
ochr
ome
P45
0 re
duct
ase;
2D
6syn
, cod
on o
ptim
ized
hum
an c
ytoc
hrom
e 2D
6; 2
D6W
T, w
ild
type
hum
an c
ytoc
hrom
e 2D
6; 3
A4-
sp-o
pt, c
odon
opt
imiz
ed h
uman
cyt
ochr
ome
3A4;
3A
4WT
, wil
d ty
pe h
uman
cy
toch
rom
e 3A
4

Dissertation Braun Andreas
- 28 -
5.5.3. DNA purification and DNA sequencing
Plasmid purification was performed using a commercially available kit (Fermentas, Germany)
according to the manufacturer’s instructions. After isolation, the plasmid concentration was
determined either by comparing to MassRuler DNA ladder (Fermentas, Germany) or
spectroscopically at 260 nm using nanodrop (Thermo Scientific, Germany).
Correctness of all DNA inserts was verified by sequencing (LGC Genomics, Germany)
5.5.4. Vector construction
The multicopy vectors p64D-linker and single copy vector p65D-linker were obtained by
replacing the ORF and intron of the ICL1 gene with a linker, containing cutting site SpeI and
AscI, in parental vectors p64ICL1 and p65ICL1 (Förster et al., 2007), respectively (Fig 7).
Both vectors contain the URA3 as selection marker. The p64 vector variant contains a
degenerated ura3d4 promoter which gives only sufficient amounts of urea when several
copies of the vector are integrated into the genome. This allows the selection for clones where
multicopy integrations or gene multiplications have occurred. The p65 vector variant contains
the normal ura3d1 promoter for single copy selection. Multicopy Vectors containing DAS1 or
DAS2 promoter from P. pastoris instead of the ICL1 promoter were obtained by replacing the
SphI and SpeI flanking fragment of the p64D-linker plasmid with DAS1 or DAS2 isolated
from wild-type P. pastoris strain CBS7435 (Küberl et al., 2011) respectively.
Genes of interest were amplified from plasmid- or genomic DNA using PCR (Table 3).
p67RYL was used to isolate wild-type Y. lipolytica CPR. pNMTS-CYP-OR-spe and
pBdpTrcRed-3A4(192v)wtA305S were used to isolate codon optimized human CYP3A4syn
and codon optimized human CPRsyn respectively. Both genes were optimized for yeast
expression (hybrid optimized for P. pastoris, S. pombe and S. cerevisiae). They were already
available in our laboratory from previous studies (Weis et al., unpublished).
Wild-type human CYP2D6 (ID30915411), wild-type human CYP3A4 (ID7262313) and wild-
type human CPR (ID3882411) were isolated from cDNA clones. (BioCat GmbH, Germany),
For the codon optimization of CYP2D6, the free software “Gene Designer V1.1.4.1” (DNA
2.0, USA) was used to create an optimized gene for yeast expression (hybride optimized for
Pichia pastoris and Y. lipolytica). The codon optimized gene 2D6syn was synthesized by
GenScript Corporation (USA).

Dissertation Braun Andreas
- 29 -
Table 3: PCR reaction setup for DNA amplification - example
Yarrowia lipolytica CPR WT
1 µL temp (p67RYI ~100ng) 5 µL Primer YlCPR_WT_fw (5µM) 5 µL Primer YlCPR_WT_rv (5µM) 5 µL dNTPmix (2mM each) 10 µL Phusion Buffer HF 5x 24,5 µL deion. H2O 0,5 µL Phusion Polymerase 50µL
98°C 30’’ (98°C 5’’ – 58°C 20’’ – 72°C 35’’) x 30 72°C 5’ 4°C ∞
Co-expression single and multicopy vectors with combinations of different CPR’s and
cytochrome P450’s were obtained by cloning overlap PCR inserts at the corresponding site
into the linker region (Fig 7). To have each gene under the control of their own promoter, the
inserts were constructed by overlap extension PCR. Shortly: Each part (CPR, isocitrate lyase
(ICL1) promoter and terminator and CYP) was amplified via PCR using Primer with
overhangs containing homologues regions with the adjusting parts. The second PCR was done
in two steps (Table 4). The first step is the actual overlap PCR. All fragments were added to
the PCR reaction mix and the PCR was run for 20 cycles using Phusion Polymerase
(FINNZYMES, Finland). After the first step flanking primers were added to the reaction and
the PCR was run for another 35 cycles to amplify the overlap construct. This PCR construct
were then cloned into pJet1.2 according to manufacturer’S instructions using the CloneJET™
PCR Cloning Kit (Fermentas, Germany) and sequences verified by sequencing. The inserts
were than isolated using the corresponding restriction enzymes.
Table 4: overlap extension PCR reaction setup - example 2 HCPR_T_pD_2D6syn (6005bp) 1 µL ol-temp HCPR _ol_T (preOL 1) 1 µL ol-temp ol_HCPR _T_ol_pD (preOL 2) 1 µL ol-temp ol_T _pD_ ol_2D6syn (preOL 7) 1 µL ol-temp ol_p_2D6syn (preOL 6) 5 µL dNTPmix (2mM each) 10 µL Phusion Buffer HF 5x 30,5 µL deion. H2O 0,5 µL Phusion Polymerase 50µL + (after 20 cycles) 5 µL Primer HCPR_pp_opt_fw (5µM) 5 µL Primer 2D6_syn_rv (5µM) 4 µL Phusion Buffer HF 5x 2 µL dNTPmix (2mM each) 3,5 µL deion. H2O 0,5 µL Phusion Polymerase 70µL
98°C 30’’ (98°C 5’’ – 69°C 20’’– 72°C 3’) x 20 72°C 5’ 4°C ∞ 98°C 30’’ (98°C 5’’ – 69°C 20’’ – 72°C 3’) x 35 72°C 5’ 4°C ∞
Multicopy co-expression vectors with combinations of human CPR and different CYP2D6
mutants were obtained by applying the QuikChange® Site-Directed Mutagenesis Kit
(Stratagene, USA) according to the supplier’s instructions. pJet1.2 vectors containing the

Dissertation Braun Andreas
- 30 -
HCPR-WT-CYP2D6syn insert were used as template and sequences were verivied by
sequencing. Subsequently, the appropriate DNA fragment of the overlap PCR insert was
cloned into the corresponding site of the p64D-linker multicopy vector.
Fig 7: Schematic representation of multi copy co-expression vector concstruction
Construction of multi copy co-expression vectors by inserting overlap extention PCR fragments into the multi copy integrative vector p64D-linker (constructed by removing the open reading frame (ORF) as well as the ICL1 Intron) containing the selective multi copy ura3d4 marker. Green arrows, ICL1 promoter; light violet ICL1 intron; stroked goalpost, ICL1 terminator; red box, rDNA integration region; brown arrows, selection marker for E. coli or Y. lipolytica respectively; gene localization and orientation are indicated by orange arrows
rDNA
Sac
IIcloning
overlap PCR
SpeI
AscI
CPR pICL1D
ICL1-T CYP
rDNA
pICL1D
I
Sph
Sac
II
1D
RF

Dissertation Braun Andreas
- 31 -
5.5.5. E. coli cultivation and transformation
Unless otherwise noted, E. coli cells were grown in LB medium (100 µg/mL ampicillin) and
incubated at 37°C and 180 rpm.
Transformation of 80 µL competent E. coli cells after addition of approximately 100 ng
plasmid-DNA was performed via electroporation. Mix was transferred into prechilled
electroporation cuvettes. The cuvettes were placed into the electroporator (Bio-rad, Germany)
and transformation was done with 1.25 kV/mm charging voltage, 200 Ω resistance and 25 µF
capacitance. Afterwards, 920 µL SOC-Media were added and the suspension was transferred
to Eppendorf tubes. For regeneration, tubes were shaken at 37°C, 650 rpm for 1 h in a
thermomixer (Eppendorf, Germany). Aliquots were plated on LB-agar plates (100 µg/mL
ampicillin)
5.5.6. Preparation of electro-competent E. coli cells
For overnight culture (ONC), 50 mL LB media in 100 mL culture flasks were inoculated with
a single colony of E. coli Top10F’, picked from a freshly grown LB-Agar plate. The ONCs
were incubated at 37°C overnight while shaking.
The next day, 500 mL LB media in 2 L baffled flasks were inoculated with 5 mL overnight
cultures. The main cultures were incubated at 37°C while shaking, until they reached an
OD600 between 0.7 and 0.8 (2-3 h). Then they were chilled on ice for approximately 30 min.
For cell harvest, cultures were transferred to prechilled 500 mL centrifuge bottles and
centrifuged at 2,000 g for 15 min at 4°C. The supernatants were discarded and the pellets
were twice resuspended in prechilled 500 mL ddH2O, centrifuged at 2,000 g for 15 min and
the supernatants discarded. Then, the cell pellets were resuspended in 35 mL prechilled,
sterile 10% glycerol and centrifuged at 4,000 g for 15 min and the supernatants were
discarded. Each pellet was resuspended in 1 mL cold, sterile 10% glycerole.
The pooled cell suspension was then aliquoted (80 µL) into Eppendorf tubes and frozen in
liquid N2 or stored on ice to be used freshly respectively.
5.5.7. Transformation and preparation of chemical competent Y. lipolytica cells
Procedures were performed according to literature (Barth et al., 1996). Short: 5 mL of YPD
(pH 4.0) was inoculate in the morning with a loop of cells and incubated in 100 mL flasks at
28°C while shaking. In the evening 10 mL of YPD (pH 4.0) were inoculated to an OD600 of
0.001, 0.004, 0.008 and 0.016 and incubated in 100 ml flasks at 28°C overnight while
shaking. The culture showing the optimal OD600 between 5 and 6 was chosen and cells
harvested by centrifugation for 5 min at 2000 g and 28°C. Cells were washed twice with TE-

Dissertation Braun Andreas
- 32 -
buffer (prewarmed at 28°C). Cells were resuspended in 0.1 M lithium acetate (pH 6.0)
(prewarmed at 28°C) and incubated for one hour at 28°C while gently shaking (60-100 rpm).
Afterwards, cells were centrifuged at 28°C and 1000 g for 5 min and resuspended in one-tenth
of the volume in lithium acetate buffer (pH 6.0). These competent cells were directly used for
transformation as follows.
For transformation all operations were performed on ice, if not stated otherwise. 0.5-1 µg of
transforming DNA (linearized Vector) were placed at the bottom of a 2 ml Eppendorf tube,
heatshocked at 95°C for 5min and place immediately on ice. Denatured carrier DNA (5µL per
trafo, heatshocked for 5min at 95°C) was added to the transforming DNA. DNA mix was
overlaid with 100 µl of competent cells (the cells are very sensitive, the tips of the pipetting
tips were cut off). Cells and DNA were gently mixed and incubate at 28 °C for 15 min
without shaking. Afterwards, 0.7 ml 40 % PEG 4000 solved in lithium acetate buffer (pH 6.0,
0.1 M) was added and suspensions gently mixed and incubate for 1 h at 28 °C, while shaking.
Subsequently the mix was heatshocked at 39 °C for 10 min in a water bath and 1.2 ml lithium
acetate buffer (pH 6.0, 0.1 M) added. Transformation suspension was gently plated in aliquots
of 200 µL on selective YNB medium. Single copy tranformants appeard after 1-2 days,
multicopy transformants took up to 3-4 weeks. Positive transformants were transferred to
fresh YNB.
5.5.8. Transformation and preparation of electro-competent Y. lipolytica cells
Procedures were performed according to condensed Pichia pastoris transformation protocol
from literature (Lin-Cereghino et al., 2005). Short: 5-10 ml of YPD media (pH 4.0) was
incubated in 300 mL buffled flask overnight at 28°C while shaking. Next day, 50 mL YPD
media (pH 4.0) were inoculated to an OD600 of 0.15 – 0.20 in a 300 mL buffled flask. Cells
were grown to an OD600 of 0.8 – 1.0 at 28°C while shaking. Cells were harvested by
centrifugation at room temperature (RT) and 500g for 5 min. Afterwards, cells were
resuspended in 9 mL of ice-cold BEDS solution supplemented with 1 mL DTT (1 M) and
incubated for 5 min at 100 rpm and 28 °C. Subsequently cells were centrifuged again at RT
and 500g for 5 min. Finally, the cells were resuspend in 1 mL (0.02 volumes) of BEDS
solution without DTT. The competent cells were directly used for transformation as follows.
Linearized plasmid DNA (0.5-1 µg for single copy, 4-8 µg for multicopy) was transferred to
an electroporation cuvette and overlaid with 80 - 100 µL of competent cells. The cell and
DNA mix was incubate for 2 min on ice. Electroporation was performed with Gene PulserTM
(BIO-RAD, USA) (conditions: cuvette gap, 2.0 mm; charging voltage, 1.5 (single copy) – 2.0
(multicopy) kV; resistance, 200 Ω; capacitance, 25 µF). Immediately after electroporation 1

Dissertation Braun Andreas
- 33 -
mL cold sorbitol (1.0 M) was added and gently mixed. Aliquots were plate on selective
YNBG media.
5.5.9. Cultivation of Y. lipolytica cells and induction
Yeast clones were incubated in YNBG (1% D-glucose) overnight at 28°C while shaking.
Exponentially growing cells were taken to inoculate the YNBG (0.6% D-glucose) main
culture to a starting OD600 of ~ 0.5. The main culture was incubated overnight at 28°C while
shaking. After roughly 17- 20 hours D-glucose was depleted. After additional 1-2 h the
expression of CPR and CYP under the control of the ICL1 promoter was induced by adding
ethanol to a final concentration of 1%. Additional 1% ethanol was added after ~ 8 h and ~ 20
h. After 24h the cells were harvested and further used for either whole cell conversions or
microsome isolation (Fig 8).
Fig 8: Formula for determination of ethanol
5.5.10. Ethanol determination during induction
Samples were taken shortly before and shortly after addition of ethanol. The ethanol
concentration was determined with ENZYTECTM fluid ethanol test kit (scil diagnostics
GmbH, Germany) according to manufacturer’s instructions. Short: cell suspension was
centrifuged at 4°C and 16100g for 10 min. pH was adjusted to 8-9 by adding a potassium
hydroxide solution (2 M) and incubated for 15 min on ice. ddH2O was used to determine
reagent blank (RB, no sample) and sample blank (SB, no reagent 2). Reagent 1 and diluted
sample were incubated for 3 min at RT. Reagent 2 was added, mixed and further incubated at
R for 15 min. Absorption was measured at 340, 334 and 365 nm using UV/Vis DU 800
spectrophotometer (Beckman Coulter, USA). Ethanol concentration was calculated as shown
in Fig 9.
∆A = (A2 – df * A1)sample – (A2 – df * A1)SB – (A2 – df * A1)RB
df = (sample volume + R1)/sample volume + R1 + R2) V (total volume) MW (molecular weight) d (optical path) v (sample volume) ε (extinction coefficient NADH) 340 nM = 6.3, 334 nm = 6.18, 365 nm = 3.4 L/mmol/cm
1000vdε
∆AMWV[g/L]CEthanol
∗∗∗
∗∗=

Dissertation Braun Andreas
- 34 -
Fig 9: Principle scheme of the Y. lipolytica cultivation, heterologous protein production in shake flasks
5.5.11. Microsome preparation
Yeast cells were harvested by centrifugation at 2000g for 10 min. The cell pellet was washed
twice with water. 4-6 g cells were resuspended in ~ 20 ml buffer A. Crude enzyme lysate was
obtained by “Merkenschlager homogenization” (Merkenschlager et al., 1957).
Homogenization bottles were filled to 1/3 with glass beats (0.25-0.5 µm) and mixed with cell
suspension. After homogenization for 3 min at 2-8°C with Merkenschlager homogenizer, cell
debris and glass beats were removed by centrifugation at 10000 g and 4°C for 10 min. To
pellet the microsomes the supernatant was centrifuged at 100000 g and 4°C for 1 hour. The
brownish pellet was resuspended in buffer A (~ 1 mg microsome pellet per mL buffer) using
potter homogenizer. The microsomes were stored at -20°C till use.
5.5.12. SDS (sodium dodecylsulfate) polyacrylamid gel electrophoresis
Total protein concentrations of microsomal preparations were determined according to the
manufacturer’s instructions (Bio-Rad, Germany). 20 µg total proteins were added to 15 µl of
NuPage loading buffer. Samples mix were incubated at 40°C for 10 min and loaded onto
NuPAGE Novex Bis-Tris-Gel (Separation Gel: 4-12%, Stacking Gel: 4%, 1.0 mm thick).
SDS-PAGE was run according to manufacturer’s instructions (Invitrogen, UK).
5.5.13. Immunologic detection of proteins
Western blotting was done according to protocol provided with the MAB-2D6 and WB-3A4
kit (BD Gentest™). Blotting was performed for 1 h with a current of 400 mA as the limiting
variable. Proteins were transferred electrophoretically from the polyacrylamide gel onto a
nitrocellulose membrane (GE Healthcare Europe GmbH) in a wet blotting system.
The Western blotting sandwich was built up as follows:
positive electrode (white) // sponge // filter // membrane // gel // filter // sponge // negative
electrode (black) (Fig 10)
pre culture induction main culture -47 -22 -3 0 24-28
WCC microsome
isolation
h

Dissertation Braun Andreas
- 35 -
Fig 10: Western blot sandwich (picture copied from manufacturer manual)
The membranes were stained with Ponceau S to detect proteins. Upon taking an image, the
membranes were washed with ddH2O and blocked with TBST-milk for 1 h at 37°C or
overnight at 4°C respectively. This step was followed by applying the primary antibody
(MAB-2D6, WB-3A4, BD Gentest, USA) for 1 h at 37°C with moderate shaking.
Subsequently, the membranes were washed 5 times with TBST for 5 min each. Then the
secondary antibody (antibody conjugated with alkaline phosphatase) was applied for 1 h at
37°C with moderate shaking, which was followed by washing 5 times with TBST for 5 min
each. Finally, detection was done by placing 2-3 mL BCIP/NBT substrate onto the
membranes for 2-3 min. The reaction was stopped by washing the membrane with water.
5.5.14. Genomic DNA isolation
Genomic DNA was isolated from Y. lipolytica tranformants grown at 28°C overnight in
minimal YNB media supplemented with 1% D-glucose (YNBG) essentially as described in
literature (Hoffman et al., 1987). Short: the equivalent volume of 100 OD units (100=
ODFINAL x Xml) of a 50 ml overnight yeast culture (OD600 4-6) was transferred into a 50ml
tube and centrifuged for 5 min at 500 g. Cell pellet was resuspended in 0.5 mL sterile distilled
water and transferred to 1.5 mL tube and centrifuged for 5sec at 16100 g. Supernatant was
discarded and resuspended in residual water. In the following order, 200 µL Yeast lysis
buffer, 200 µL Roti®-Phenol, and 0.3 g of acid-washed glass beads were added to the cell
suspension. Cells were homogenized by shaking (Vortex) for 3-4 min. 200 µL TE buffer were
added and gently mixed. After centrifugation for 5 min at 161000 g the aqueous phase was
transferred to a new tube. Genomic DNA was precipitated by adding 1 mL 100% EtOH and
gently mixing by inversion. After centrifugation for 1min at 161000 g the supernatant was
removed by aspiration. The remaining pellet was resuspended in 400 µL TE-buffer and 5 µL
RNAse A (10mg/ml) and incubate at 37°C for roughly 2 hours. Purified genomic DNA was
precipitated by adding 10 µL ammonium acetate (4M) and 1 mL 100% EtOH. After gently

Dissertation Braun Andreas
- 36 -
mixing by inversion, genomic DNA was centrifuged for 1 min at 16100 g and supernatant
was discarded. DNA was washed with 1 mL 70% EtOH. The remaining pellet was air-dried
and resuspended in 50 µL ddH20. DNA concentration was determined spectroscopically at
260 nm using nanodrop (Thermo Scientific, Germany).
5.5.15. Southern blot
Southern blotting was used to confirm that Y. lipolytica strain YL23 contains only one copy of
Amp target sequence. DIG DNA labeling and detection was performed according to the
manufacturer’s instructions (Roche, Germany). Short: using PCR a 540 bp long part of the
AmpR ORF was amplified and used as template for the generation of the DIG labled probe
according to the method of random primed labeling (Höltke et al., 1995). Labeling efficiency
was estimated by serial dilutions and comparing to DIG-labeled control DNA (Roche,
Germany). 5 µg genomic DNA of Y. lipolytica strains or 1 µg of control plasmid were
digested overnight with SpeI or AscI or with both and fragments separated with agarose gel
electrophoresis. DNA was depurinated by soaking the agarose gel in HCl (250 mM) and
denatured by submerging the gel in denaturing buffer. DNA was transferred to a nylon
membrane (Biodyne A, Pall, USA) by capillary transfer with transfer buffer (10x SSC) (Fig
11)
DNA was fixed by baking the air-dried membrane at 120°C for 30 min. Denatured DIG
labeled DNA probe in pre-heated hybridization buffer was added to the, in hybridization
buffer, prehybridized nylon membrane and incubated at 68°C overnight while shaking in a
hybridization oven. Nylon membrane was washed two times for 5 min with each washing
buffer. For the immunological detection an anti-digoxigenin-AP conjugate antibody was used.
After 30 min blocking the membrane was incubated for 30 min with antibody followed by
several washing and equilibration steps. Detection was accomplished by adding colorsubstrate
solution and reaction stopped by washing with TE-buffer.

Dissertation Braun Andreas
- 37 -
Fig 11: Principle scheme of the DNA transfer assembly.
Sheet of nitrocellulose membrane was laid over the agarose gel, and the separated DNA fragments were transferred to the sheet by blotting. The agarose gel was placed on a support bracket on top of a filter paper of which the ends are dipping in a bath of alkali buffer solution.
5.5.16. Real-time QPCR
Real-time QPCR (RT-QPCR) was used to estimate the copy number of the integrated
expression cassette. The ICL1 set of primers, ICL1-fw and ICL1-rv, anneal to the single-copy
of the endogenous Y. lipolytica ICL1 gene within the chromosome. The Amp primers, Amp-
fw and Amp-rv, target the Amp marker gene present on the integration cassette. Y. lipolytica
YL23 was used as a control organism with a single-copy of both the ICL1 and Amp target
sequences. Reaction mixes (18 µl) consisted of 100 pg template DNA, Power SYBR Green
Master Mix (Applied Biosystems, CA, USA), and 250 nM of each primer. Each reaction was
run in duplicate in an ABI PRISM 7300 Real Time PCR machine (Applied Biosystems,
USA). The profile used was: 95°C for 10 min; 40 cycles of 95°C for 15 s, 60°C for 60 s. Data
collection was done after each 60°C step. A melting curve analysis was conducted after the
amplification from 45°C to 95°C. Analysis was done using “Sequence Detection Software”
SDS (Applied Biosystems, version 1.2, CA, USA). Average Ct values of the 2 profiles (ICL1
and Amp) were used to estimate the relative copy number for the selected transformant (Livak
et al., 2001).
5.5.17. CO difference spectrum
P450 concentrations in the isolated microsomes were determined by reduced carbon
monoxide spectra (Omura et al., 1964). 0.4 mL microsome fraction (15–30 mg protein per
mL) was added to sodium phosphate buffer (0.1 M, pH 7.4) containing glycerol (20%) to the
end volume of 2 mL. 100 µL KCN (200 mM, pH 7.7) were added to mask the negative peak
of cytochrome oxidases at 445 nm (Förster, 2001). Some sodium dithionite was added to
reduce the CYP. The mixture was split into a reference and a measuring sample and
transferred into separate polystyrol/-styren cuvettes (Sarstedt, Germany) The reference
kg
weight
plate
buffer buffer support bracket
filter paper
Parafilm
Parafilm
membrane (nitrocellulose
or nylon)
stack of paper towels
agarose gel

Dissertation Braun Andreas
- 38 -
spectrum was recorded from 400 to 500 nm with the two-beam Specord 205 UV/Visible
spectrophotometer (Analytik Jena, Germany). The measuring cuvette was then slowly aerated
with carbon monoxide for 30-60 s, and the spectrum was measured again.
The cytochrome P450 concentration was calculated with an extinction coefficient of ε450nm =
91 /mM/cm (pmol/µL cytochrome P450 = ∆E450–490nm x dilution factor x 1 cm / ε)
5.5.18. NADPH cytochrome c reductase (NCR) activity
The reductase-catalyzed reduction of bovine heart cytochrome c at 550 nm was measured
essentially as described (Phillips et al., 1962). Cytochrome c solution (300 µM) in Tris-HCl
buffer (50 mM, pH 7.5) was mixed with diluted microsome fraction (1:50 – 1:400) and made
up with Tris-HCl buffer to 650 µL. 50 µL KCN solution (50mM, pH 7.7) was added to mask
the cytochrome c oxidase activity. Reaction was started by adding 50 µL aqueous NADPH
(1.5 mM). Activities were determined by measuring the increase of absorption at 550 nm
using UV/Vis DU 800 spectrophotometer (Beckman Coulter, USA) and calculated by using
an extinction coefficient of ε = 21/mM/cm.
5.5.19. Hydroxylation assay / CYP activity of microsomes
Microsomal substrate conversion was performed essentially as described (Phillips et al.,
2006). Short: Substrate (bufuralol solved in H2O 25 µM end concentration, steroids solved
in DMSO 2 mM end concentration) and NADPH (1mM end concentration) were added to
potassium phosphate buffer (100 mM, pH 7.4) and pre-incubated for few minutes at 37°C.
The reaction was started by adding 20 µL microsomal preparation to give the total volume of
200 µL. The reaction mixture was incubated at 37°C for 20 min (bufuralol) or 1 h
(progesterone) and stopped by adding 20 µL perchloric acid (70% v/v). After 20 min
incubation on ice IS (prednisolone) was added and the mixture centrifuged for 10 min at
161000g. 100 µL supernatant were transferred to a fresh microtiterplate and stored at -20°C
till analysis by HPLC-MS.
Alternatively a regeneration system for cofactor regeneration was added (Weckbecker et al.,
2005). Procedure was performed as described above with the addition of glucose
dehydrogenase (50 U/mL) and glucose (50 mM ~ 1%) to the reaction mixture.
5.5.20. Hydroxylation assay / aqueous whole cell bioconversion
Yeast cultures were centrifuged at 2000g for 15 min and resuspended in same growth media
(supplemented with 1% D-glucose) or in potassium phosphate buffer (100 mM, pH 7.4,
supplemented with 1% D-glucose) to an OD of ~ 40 (biomass concentration ~ 10 g/L CDW).
Stock solutions of substrate were added to 200 (Eppendorf tubes) or 1000 µL (PYREX tubes)

Dissertation Braun Andreas
- 39 -
of cell suspension. Bufuralol was solved in water (1 mM) and added to a final concentration
of 25 µM, steroids were solved in DMSO (80-100 mM) and added to a final concentration of
2 mM. The whole cell conversion was done at 30°C for 20 – 60 min with bufuralol or several
hours for progesterone. After the desired time internal standard (prednisolone or boldenone)
was added and the reaction stopped by centrifugation at 16100 g for 10 min. Supernatant was
transferred to a fresh Eppendorf tube.
5.5.21. Hydroxylation assay / two-liquid biphasic whole cell bioconversion
Yeast cultures were centrifuged at 2000g for 15 min and resuspended in potassium phosphate
buffer (100 mM, pH 7.4, 1% glucose) to an OD of ~ 40 (biomass concentration ~ 10 g/L
CDW). 1000 µL of organic solvent, containing steroid (20 mM), were added to 1000 µL cell
suspension. The biphasic whole cell conversion was done in 10 mL PYREX tubes at 30°C
while shaking at high speed for several hours. After the desired time the reaction was stopped
and the two phases separated by centrifugation at 16100 g for 10 min. 500 µL aqueous phase
was transferred to a fresh Eppendorf tube. Internal standard (prednisolone) was added and
samples were stored at -20°C. 500 µL organic phase was transferred to a fresh GC-Vial. 500
µL isopropanol and internal standard (prednisolone) was added and samples were stored at -
20°C.
5.5.22. Y. lipolytica Fed-batch culture in bioreactor
Cultivation process was performed in a 5 l stirred tank bioreactor (Biostat C, Sartorius). The
initial batch working volume was 3.5 l and increased to total of 4 l at the time of harvesting.
The set-points of all control variables were maintained the same during the entire process
duration and, thus, the cultivations were accomplished under the conditions of constant
temperature 28 C, 10 L/min airflow (i.e. without any oxygen enrichment), 1500 r.p.m.
agitation, pH 5.5. Automated control of the pH was achieved by using 25% ammonia solution
and 25% phosphoric acid. The process consisted of the biomass growth phase (i.e. in both
batch and exponentially fed fed-batch cultures) and the expression phase with linear feed
inducer. The cultivation began at time 0 h with a batch, during which the pO2 value
continuously decreased and the base consumption increased (i.e. no control of the pO2 set-
point applied). After 14–16 h, the pO2 rose again rapidly and the base consumption stopped.
At this point the exponential addition of D-glucose “feed solution 1” was started and
continued over 10 h in accordance with the function f(t)=1.05*e0.18*t (in gram of glucose per
hour). During the subsequent production phase, ethanol was added during the time period of
34-36 h in accordance with the function f(t)=1.05*e0.002*t (in gram of ethanol per hour)
Biomass concentration was determined by measuring cell dry weight (CDW) or by OD

Dissertation Braun Andreas
- 40 -
measurement and calculating cell dry weight (using a factor determined by correlating OD to
CDW). Cells were harvested by centrifugation at RT, 2000 g for 15 min and resuspended in
100 mM potassium phosphate buffer (pH 7.4) supplemented with 0.5% glucose to a desired
OD of 100 - 120 (biomass concentration ~ 25 g/L CDW).
5.5.23. Bioreactor aqueous and two-liquid biphasic whole cell bioconverison
Biotransformations were performed in a 1.5 L stirred tank bioreactor (DASGIP Parallel
Bioreactor Systems, DASGIP BioTools). The batch working volume was 600 mL for aqueous
phase system and 450 mL + 150 mL for biphasic system. The set-points of all control
variables were maintained the same during the entire biotransformation temperature 30°C, 1
NL/min airflow (i.e. without any oxygen enrichment), 1000 r.p.m. agitation, pH 7.4 .
The transformation began at time 0 h by adding progesterone (100 mM in DMSO) to an end
concentration of 2 mM or 150 mL water immiscible organic solvent as 2nd phase containing
20mM progesterone. Glucose was provided at a low constant rate of 0.17 g of glucose h-1.
Samples were taken at different time points and the reaction was stopped removing the cells
by centrifugation at 16100 g for 10 min. 500 µL aqueous phase was transferred to a fresh
Eppendorf tube. Internal standard (prednisolone) was added and samples were stored at -
20°C. 500 µL organic phase was transferred to a fresh GC-Vial. 500 µL isopropanol and
internal standard (prednisolone) were added and samples were stored at -20°C.
5.5.24. HPLC-MS analysis methods
Bufuralol metabolites in the supernatant were separated by HPLC with a XDB-C18, 1.8µm,
4.6x50mm column (Agilent technologies) at 50°C using following gradient: 0-1.6 min/20%
B; 1.61-3 min/40% B; 3.01-4/20% B, with a flow rate of 0.9 mL/min. Solvent A was aqueous
ammonium acetate (10 mM, pH 5.5) and solvent B was acetonitrile.
Steroids metabolites in aqueous and organic supernatant were separated by HPLC system
(1200 series, Agilent Technologies) with a Chromolith RP-C18e, 5µm, 4.6x100mm (MERCK
KGaA, Germany) at 26°C using following gradient: 0-3 min/25% B; 3-7 min/75% B; 7-9
min/75% B; 9.01-9.5 min/25% B; 9.5-10 min/25% for aqueous samples and 0-3 min/25% B;
3-7 min/75% B; 7-11.3 min/75% B; 11.31-13 min/25% B for organic samples, with a flow
rate of 1.0 mL/min. Solvent A was ddH2O acidulated (0.1% acetic acid) solvent B was
acetonitrile acidulated (0.1% acetic acid). Metabolites were detected using MSD SL detector
in positive mode equipped with an electron spray ionization (ESI) unit (Table 5). Yields of the
hydroxylated products were calculated by using an external calibration of a reference
metabolite or metabolite derivate.

Dissertation Braun Andreas
- 41 -
Table 5: m/z values for MSD detection
substance m/z substance m/z
17alpha-
methyltestosterone 303 hydroxyl-17alpha-methyltestosterone 319
testosterone 289 hydroxytestosterone 305 androstenedione 287 hydroxyandrostenedione 303 progesterone 315 hydroxyprogesterone 331 bufuralol 262 hydroxybufuralol 278 boldenone (IS) 287 prednisolone (IS) 361

Dissertation Braun Andreas
- 42 -
6. Publications
6.1. Manuscript 1 (muteinDB – published in database; doi:10.1093/database/bas028)
MuteinDB: The mutein database linking substrates, products and
enzymatic reactions directly with genetic variants of enzymes
see supplementary data 1
6.2. Manuscript 2 (Y. lipolytica – accepted for publication in Microbial cell factories)
Expression of human liver cytochrome P450s using the non conventional
yeast Yarrowia lipolytica for steroid hydroxylation in biphasic systems
see supplementary data 2

Dissertation Braun Andreas
- 43 -
7. Standard Operating Procedure (SOP) –
7.1. SOP I (HPLC-MS)
MT-HPCL-MS whole cell screening system for P450 mediated steroid
hydroxylation
see supplementary data 3
7.2. SOP II (Y. lipolytica)
Constructing a Y. lipolytica P450 expression strain
see supplementary data 4

Dissertation Braun Andreas
- 44 -
8. Additional results and discussion:
8.1. HPLC-MS method development
8.1.1. Bufuralol measurement
Bufuralol is a well-known standard substrate for CYP2D6 and was used to verify the
functional expression of CYP2D6. Therefore, a HPLC-MS method was developed (Fig 12).
The method to measure bufuralol and its hydroxylated products was optimized based on a
method from literature (Paine et al., 2003).
With this optimized method a bufuralol metabolite analysis takes only 4 minutes.
Method Name: AGB-Bufuralol-ESI.M
Column: XDB-C18, 1.8µm, 4.6x50mm Agilent, in-line filter unit (0.2 µm filter)
Column Temp: 50°C
Flow = 0.9 mL/min
Solvent A: 10mM Ammonium acetate + AA till pH 5.0
Solvent B: Acetonitril
Gradient: 0-1.6/ 20% B, 1.6-1.61/40% B, 1.61-3/40% B, 3-3.01/20% B, 3.01-4/20% B
StopTime: 4.0 min
Injection: 5 µL Sample was injected (100µL per Well in a 96 Well Plate)
Overlapped Injection, after 1.0 min
Detector: MS-ESI, positive, (3000V, drying gas flow 12.0 L/min, nebulizer pressure
410 kPa, drying gas temp. 350 °C), delayed MS start time (1.0 min), VWD
o MSD1 m/z = 278 hydroxybufuralol
o MSD2 m/z = 262 bufuralol
o MSD3 m/z = 361 IS (Prednisolone)
o VWD1 = 252 nm

Dissertation Braun Andreas
- 45 -
Fig 12: Method development for HPLC-MS analysis of bufuralol and its metabolites.
Mobile phase: ammonium acetate (solvent A, pH 5, 100 mM); acetonitril (solvent B). (A) isocratic 30% B, flow = 1 mL/min; (B) 0-1.6/20% B, 1.6-1.61/40% B, 1.61-3/40% B, 3-3.01/20% B, 3.01-5/20% B, flow = 1 mL/min; 0-(C) 1.6/20% B, 1.6-1.61/40% B, 1.61-3/40% B, 3-3.01/20% B, 3.01-5/20% B, flow = 0.9 mL/min, ammonium acetate (solvent A, pH 5, 10 mM). Peak designation: I, 1’-hydroxybufuralol; II, prednisolone (IS); III, bufuralol.
8.1.2. Steroid measurement
Steroids are a class of organic compounds synthesized from isopentenyl building blocks.
They belong to the family of lipids and are very hydrophobic. They occur in mammalian
plants and fungi where they have diverse functions from vitamins and sex hormones to toxins.
Many hormone derivates are used as anti-inflammatory drug or to increase muscle and bone
synthesis. There is vast interest in steroid metabolites which are generated mainly by
cytochrome P450 enzymes. Therefore steroids were chosen as hydrophobic substrates.
To be able to separate steroid substrate and hydroxylated products as well as organic
solvent of aqueous or organic phase samples, the Chromolith RP-c18e (5 mM, 4.6x100 mm,
MERCK) was used. The method was optimized based on a method from literature (Paine et
al., 2003). As mobile phase ddH2O acidulated with 0.1% formic acid (solvent A” and
acetonitril acidulated with 0.1% formic acid (solvent B)) were chosen. With the optimized
method, the favored separation could be achieved (Fig 13).
Method name: AGB-Testo-CL-ESI-DBP.M
Column: Chromolith RP-C18e, 5µm, 4.6x100mm Merk, in-line filter unit (0.2 µm filter)
Column Temp: 26°C
Flow:1.0 mL/min
Solvent A: ddH2O + 0.1% formic acid
Solvent B: Acetonitril + 0.1% formic acid
Gradient: 0-3/ 25% B, 3-7/75% B, 7-11.3/75% B, 11.3-11.31/25% B, 11.31-13/25% B
0 min 1 2 3 4
(A)
(B) (C)
I III II
I III II
I III II
0 min 1 2 3 4 5 6 7 8

Dissertation Braun Andreas
- 46 -
StopTime: 13.0 min
Injection: 5 µL Sample was injected (~100µL per Well in a 96 Well Plate)
Overlapped Injection: after 6.0 min
Detector: MS-ESI, positive, (3000V, drying gas flow 12.0 L/min, nebulizer
pressure 410 kPa, drying gas temp. 325 °C), delayed MS start time (2.5 min), VWD
o MSD1 m/z = 289 Testosterone
o MSD2 m/z = 305 Hydroxytestosterone
o MSD3 m/z = 287 Boldenone, Androstendione
o VWD1 = 240 nm
Fig 13: Method development for HPLC-MS analysis of steroids (A/B, testosterone; C/D, progesterone)
and their metabolites.
Mobile phase: ddH2O acidulated with 0.1% formic acid (solvent A); acetonitril acidulated with 0.1% formic acid (solvent B). (A/C) aqueous phase 0-3/ 25% B, 3-7/75% B, 7-8/75% B, 8-8.01/25% B, 8.01-.8.5/25%. (B/D) organic phase 0-3/ 25% B, 3-7/75% B, 7-11.3/75% B, 11.3-11.31/25% B, 11.31-13/25% B. Peak designation: I, 6beta-hydroxytestosterone; II, boldenone (IS); III, testosterone; IV, dibutylphthalate (DBP, organic solvent); V, prednisolone (IS); VI, 6beta-hydroxyprogesterone; VII, 16alpha-hydroxyprogesterone; VIII, progesterone.
8.1.3. High-throughput HPLC screening of testosterone metabolites
For managing many hundred samples in a reasonable time, a short analysis time per sample is
needed. This can be achieved by using short columns with small particle size packaging that
can withstand high pressures and optimization of the used mobile phases (Fig 14). With the
new established method one sample takes only 1.8 minutes to be analyzed, while at the same
time the different metabolites are still separated. With this method and the automated well
plate handler is it possible to analyze up to 700 samples per day.
Method name: AM-Testosterone-fast_ESI.M
Column: XDB-C18, 1.8µm, 4.6x50mm Agilent, in-line filter unit (0.2 µm filter)
Column Temp: 60°C/25°C
(A)
(B)
I III II
0 min 2 4 6 8 10 12
I III II IV
0 min 2 4 6 8 10 12
(C)
(D)
V VII VI
V VII VI
VIII
VIII
IV

Dissertation Braun Andreas
- 47 -
Flow = 1.5 mL/min
Solvent A: ddH2O + 0.1% formic acid
Solvent B: Acetonitril + 0.1% formic acid
Gradient: 0-0.5/40% B, 0.5-0.75/85% B, 0.75-1.2/75% B, 1.2-1.21/40% B, 1.21-1.6/40% B
StopTime: 1.6 min
Injection: 5 µL Sample was injected (~100µL per Well in a 96 Well Plate)
Overlapped injection: after 1.5 min
Detector: MS-ESI, positive, (2850V, drying gas flow 12.5 L/min, nebulizer pressure
410 kPa, drying gas temp. 350 °C), delayed MS start time (0.4 min), VWD
o MSD1 (80%) m/z = 305 Hydroxytestosterone
o MSD2 (10%) m/z = 289 Testosterone
o MSD3 (10%) m/z = 287 Boldenone (IS), Androstendione
o VWD1 = 240 nm
Fig 14: Method development for high-throughput HPLC-MS analysis of testosterone and their
metabolites.
Mobile phase: ddH2O acidulated with 0.1% formic acid (solvent A); acetonitril acidulated with 0.1% formic acid (solvent B). (A) 0-2/40% B, 2-3/70% B, 3-3.3/70% B, 3.3-3.31/40% B, 3.31-4.0/40%B, flow = 1.0 mL/min (B) 0-1/40% B, 1-2/70% B, 2-2.3/70% B, 2.3-2.31/40% B, 2.31-3/40% B, flow = 1.0 mL/min (C) 0-1/40% B, 1-2/70% B, 2-2.3/70% B, 2.3-2.31/40% B, 2.31-3/40% B, flow = 1.5 mL/min (D) 0-0.5/40% B, 0.5-0.75/85% B, 0.75-1.2/85% B, 1.2-1.21/40% B, 1.21-1.8/40% B, flow = 1.5 mL/min. Peak designation: I, 6beta-hydroxytestosterone; II, boldenone (IS); III, testosterone
8.2. Proof of principle solubility of hydroxysteroid in aqueous phase
All experiments with aqueous systems were done with steroid concentrations way above their
solubility limits in water. However, in none of the experiments with aqueous systems do we
reach the solubility limit of hydroxy-steroids. Nevertheless, to exclude the influence of the
buffer (supplemented with D-glucose) and high concentration of steroids, calibrations have
(A)
(B)
I III II
I III II
(C)
(D)
0 min 0.5 1 1.5 2 2.5 3 3.5 0 min 0.5 1 1.5 2 2.5 3 3.5
I III II
I III II
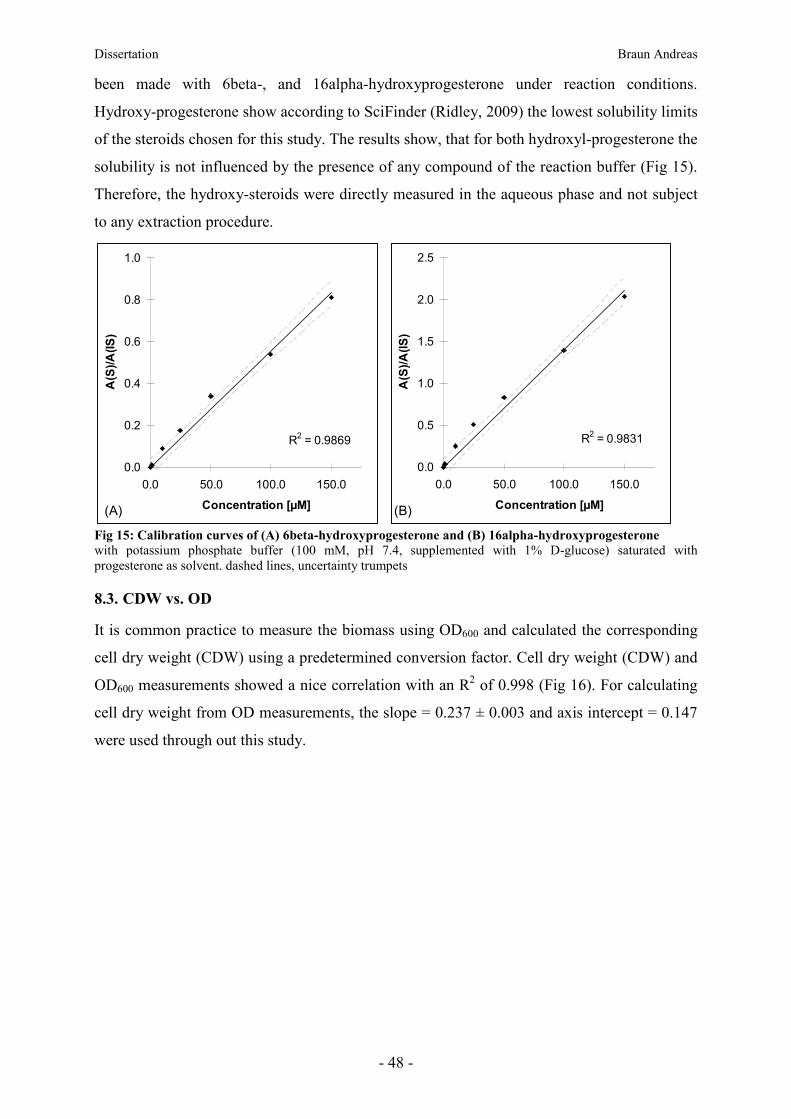
Dissertation Braun Andreas
- 48 -
been made with 6beta-, and 16alpha-hydroxyprogesterone under reaction conditions.
Hydroxy-progesterone show according to SciFinder (Ridley, 2009) the lowest solubility limits
of the steroids chosen for this study. The results show, that for both hydroxyl-progesterone the
solubility is not influenced by the presence of any compound of the reaction buffer (Fig 15).
Therefore, the hydroxy-steroids were directly measured in the aqueous phase and not subject
to any extraction procedure.
Fig 15: Calibration curves of (A) 6beta-hydroxyprogesterone and (B) 16alpha-hydroxyprogesterone
with potassium phosphate buffer (100 mM, pH 7.4, supplemented with 1% D-glucose) saturated with progesterone as solvent. dashed lines, uncertainty trumpets
8.3. CDW vs. OD
It is common practice to measure the biomass using OD600 and calculated the corresponding
cell dry weight (CDW) using a predetermined conversion factor. Cell dry weight (CDW) and
OD600 measurements showed a nice correlation with an R2 of 0.998 (Fig 16). For calculating
cell dry weight from OD measurements, the slope = 0.237 ± 0.003 and axis intercept = 0.147
were used through out this study.
R2 = 0.9869
0.0
0.2
0.4
0.6
0.8
1.0
0.0 50.0 100.0 150.0
Concentration [µM]
A(S
)/A
(IS
)
R2 = 0.9831
0.0
0.5
1.0
1.5
2.0
2.5
0.0 50.0 100.0 150.0
Concentration [µM]
A(S
)/A
(IS
)
(A) (B)

Dissertation Braun Andreas
- 49 -
R2 = 0.998
0
10
20
30
40
50
0 50 100 150 200
OD600
CD
W [
g/L
]
Fig 16: Correlation between cell dry weight (CDW) and OD600 of Y. lipolytica cells.
Samples taken during biomass production on in minim media (MM) supplemented with D-glucose in 5 L stirred tank reactor. dashed line, uncertainty trumpet
8.4. Southern blot
With Southern transfer and the associated hybridization techniques for DNA it is possible to
obtain information about the physical organization of single and multicopy sequences in
genomes. For obvious reasons the non-radioactive labeling digoxigenin-antidigoxigenin
detection systems was used. Part of the ampicillin resistance maker was used as target DNA
to create the DIG labeled probe. The ampicillin resistence marker does not naturally occur in
the Y. lipolytica genome but is present on both, single and multicopy shuttle vector plasmids
(p65D/p64D).
The DIG labeling of AmpR showed a high labeling efficiency. A concentration of 500 ng/µL
DIG labeled target DNA was achieved (Fig 17).
Looking at the agarose gel after electrophoresis did indicate that digestion with AscI did not
work as well as hoped for. Nevertheless, after DNA transfer to nylonmembrane and detection
with alkaline phosphatase substrate BCIP/NBT, showed that all digestions worked well
enough including the digestion with AscI, except for the single copy YL23 strain (Fig 18).
Depending on used restriction enzymes and integration events one would expect different
bands visible (Fig 19). The southern blot shows a mixture of head to tail, tail to tail and head
to head integration and duplication events that have occurred in strains harboring multiple
copies of the integration cassette (Fig 18). Unfortunately, it seems that some unspecific
binding of the AmpR probe did occur, as some small bands one would not expect were
visible. However, single copy transformants showed on specific band, as expected.

Dissertation Braun Andreas
- 50 -
Fig 17: Dot blot, determine the DIG labeling efficiency of AmpR target probes
Fig 18: Southern blot
(A) Agarose gel of digested genomic and control DNA. (B) Nylone membrane after southern bloting and detection with alkaline phosphatase substrate BCIP/NBT.
lane DNA enzyme
1 YL23 (sc) SpeI
2 YL23 (sc) AscI
3 YL23 (sc) SpeI/AscI
4 YL17 (mc) SpeI
5 YL17 (mc) AscI
6 YL17 (mc) SpeI/AscI
7 YL21 (mc) SpeI
8 YL21 (mc) AscI
9 YL21 (mc) SpeI/AscI
10 YL22 (mc) SpeI
11 YL22 (mc) AscI
12 YL22 (mc) SpeI/AscI
13 DNA marker 5 µL
14 10 ng control DNA SpeI/AscI
15 1 ng control DNA SpeI/AscI
(A)
(B)
23130
9416
6557
4361
2322 2027
1 2 3 4 5 6 7 8 9 10 11 12 13 14 15
1 ng/µL 100 pg/µL 10 pg/µL 1 pg/µL 0.1 pg/µL
1 : 10 1 : 10
2
1 : 10
3
1 : 10
4
1 : 10
5
AmpR probe standard DNA

Dissertation Braun Andreas
- 51 -
Fig 19: Expected bands of multicopy strains after southern blotting. Bands are depending on digestion setup and integrated orientation. grey arrows, DNA fragments that contain the sequence recognized by the probe
8.5. Ethanol consumption
Y. lipolytica can not produce but can utilize ethanol as sole carbon source. However,
concentrations above 3% are toxic (Barth et al., 1997). Therefore it is important to add the
right amount of ethanol for the induction of genes under the ICL1 promoter. The apparent
ethanol consumption is made up of two parts. The part that is utilized by the growing cells
and the part that is lost due to evaporation. During the induction phase of shake flask cultures,
ethanol is added at different time points leading to spikes in ethanol concentration (Fig 20). In
shake flask culture we observe a growth rate on ethanol of µ = 0.035 s-1 and an apparent
biomass production of YSX = 1.16 g per g ethanol consumed.
Under more controlled conditions in a bioreactor, the values differ significantly from that of
the shake flask culture. Ethanol is continuously fed to the cell suspension (Fig 20). There we
observe a growth rate on ethanol of µ = 0.002 s-1 and an apparent biomass production of YSX
= 0.06 g per g ethanol consumed.
The bioreactor results were used to calculate an optimal exponential feed of ethanol during
continuous induction, with the function f(t)=1.05*e0.002*t (in gram ethanol per hour). The
results show that the measured ethanol levels are well below toxic levels.
SpeI SacII SacII ampR AscI
linearized integration cassette (e.g. p64D-CPR-CYP)
11500 + ? 2500
8500 5500
5500 2500 6000
11500 + ?
5500
5500 6000
14000 2500
8500 14000
8000 2500 6000
8500
2500 6000
23000 2500
8500 11000
11000 2500 6000
SpeI
AscI
SpeI / AscI
2500
sc:
mc: head to tail
mc: head to head
5500
5500 6000
5000
5500 17000
5000 5500 6000
mc: tail to tail
11500 + ? 11500 + ?
SpeI
AscI
SpeI / AscI
SpeI
AscI
SpeI / AscI
SpeI
AscI
SpeI / AscI

Dissertation Braun Andreas
- 52 -
Fig 20: Ethanol concentration during induction of Y. lipolytica.
Strain expressing CYP3A4 and HCPR in (A) shake flask culture with spiked inducton and (B) in bioreactor with continuous ethanol feed. Samples were taken and cells removed by centrifugation. Ethanol concentration was determined with ENZYTECTM fluid ethanol test kit (scil diagnostics GmbH, Germany) according to manufacturer’s instructions. angular striped bars, measured ethanol; diamonds, biomass; triangles, total fed ethanol (calculated)
8.6. Microsomal conversion with GDH regeneration system
Cofactors are usually very expensive. This can be circumvented to some extent by using
regeneration systems for the regeneration of the cofactors. Several such regeneration systems
are known and have been used (Woodyer et al., 2004; Zhang et al., 2009). The glucose
dehydrogenase system was chosen as it was already available at our lab. Adding another
enzyme to an already complex system makes the system even more complex. A conversion
experiment, run for several hours, showed that the hydroxylation of progesterone more or less
stops after 30 – 60 minutes (Fig 21). This can be due to several reasons. Product or substrates
could show inhibitory effects on the heterologous expressed human CYP system. One of the
enzymes of the human CYP system, the CYP itself or the reductase is degenerated at this
conditions, which is unlikely as the optimal temperature for these enzymes is 37°C.
Furthermore, the glucose dehydrogenase is already degenerated and therefore the regeneration
of cofactors is failing. However, this results show that using regeneration systems at lab scale
is already problematic let alone for medium and large scale production of metabolites (Zöllner
et al., 2010).
0
5
10
15
20
25
30
0 8 12 18 24 32
Induction Time [h]
EtO
H f
ed
[g
/L]
0
10
20
30
40
50
60
CD
W [
g/L
]
0
5
10
15
20
25
be
fore
afte
r
be
fore
afte
r
be
fore
afte
r
start 2nd 3rd harvest
Induction Phase
EtO
H [
g/L
]
0
2
4
6
8
10
CD
W [
g/L
]
(A) (B)

Dissertation Braun Andreas
- 53 -
0
5
10
15
20
25
30
35
40
0 2 4 6 8
Time [h]
Pro
du
ct
[µM
]
Fig 21: Product formation during microsomal conversion of progesterone with glucose dehydrogenase as
regeneration system.
Y. lipolytica microsomes harboring human CYP3A4 and human CPR were used. solid line, 6beta-hydroxyprogesterone; dashed line, 16alpha-hydroxyprogesterone
8.7. Optimized conditions for Y. lipolytica whole cell conversion of steroids
The activity of biocatalysts and whole cell biocatalysts are typically influenced by pH and
temperature of the reaction system. In order to determine the optimum pH, the hydroxylation
of progesterone was performed under different pH values at 30°C (Fig 22). The results
indicate an optimal pH of 6.0 closely followed by pH 7.5. As pH 7.4 is the standard
conditions for hydroxylation experiments with cytochrome P450 enzymes (Phillips et al.,
2006), this pH value was used throughout this study. It is well-known that pH values have a
significant influence on the protonation sate of substrates, which can lead to decreased or
increased uptake rates. Additionally, pH values have also a big influence on the outer cell
wall leading also to an increased or decreased uptake rate.
With the increase of temperature from 20 to 40°C, hydroxylation rate of progesterone by Y.
lipolytica cells harboring CYP3A4 and HCPR increased as well, with extensive increase at
40°C. However, further increase in temperature led to a significant decrease in hydroxylation
rate. One reason for this increased activity at 40°C is probably due to the fact that most of the
mammalian CYPs have their optimum temperature at 37°C. Furthermore, elevated
temperatures increase the water solubility of very hydrophobic compounds such as
progesterone. However, even though elevated temperatures have an effect of permeabilization
of the cell wall, exceeding with the temperature leads to a point where the integrity of the cell
is compromised. Most of the Y. lipolytica species have their optimal growth and viability
around 30°C (Barth et al., 1996): although 40°C showed the highest whole cell hydroxylation
rates, 30°C was chosen as a compromise between long-time viability and whole cell
hydroxylation activity.
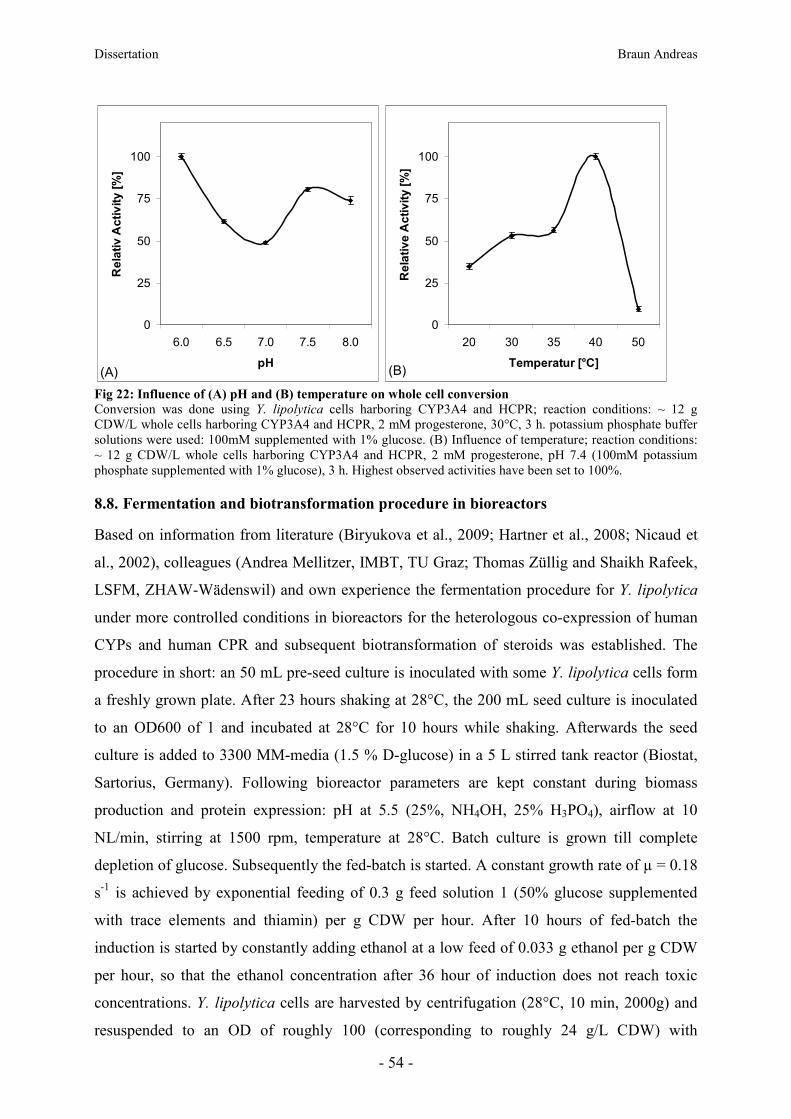
Dissertation Braun Andreas
- 54 -
Fig 22: Influence of (A) pH and (B) temperature on whole cell conversion
Conversion was done using Y. lipolytica cells harboring CYP3A4 and HCPR; reaction conditions: ~ 12 g CDW/L whole cells harboring CYP3A4 and HCPR, 2 mM progesterone, 30°C, 3 h. potassium phosphate buffer solutions were used: 100mM supplemented with 1% glucose. (B) Influence of temperature; reaction conditions: ~ 12 g CDW/L whole cells harboring CYP3A4 and HCPR, 2 mM progesterone, pH 7.4 (100mM potassium phosphate supplemented with 1% glucose), 3 h. Highest observed activities have been set to 100%.
8.8. Fermentation and biotransformation procedure in bioreactors
Based on information from literature (Biryukova et al., 2009; Hartner et al., 2008; Nicaud et
al., 2002), colleagues (Andrea Mellitzer, IMBT, TU Graz; Thomas Züllig and Shaikh Rafeek,
LSFM, ZHAW-Wädenswil) and own experience the fermentation procedure for Y. lipolytica
under more controlled conditions in bioreactors for the heterologous co-expression of human
CYPs and human CPR and subsequent biotransformation of steroids was established. The
procedure in short: an 50 mL pre-seed culture is inoculated with some Y. lipolytica cells form
a freshly grown plate. After 23 hours shaking at 28°C, the 200 mL seed culture is inoculated
to an OD600 of 1 and incubated at 28°C for 10 hours while shaking. Afterwards the seed
culture is added to 3300 MM-media (1.5 % D-glucose) in a 5 L stirred tank reactor (Biostat,
Sartorius, Germany). Following bioreactor parameters are kept constant during biomass
production and protein expression: pH at 5.5 (25%, NH4OH, 25% H3PO4), airflow at 10
NL/min, stirring at 1500 rpm, temperature at 28°C. Batch culture is grown till complete
depletion of glucose. Subsequently the fed-batch is started. A constant growth rate of µ = 0.18
s-1 is achieved by exponential feeding of 0.3 g feed solution 1 (50% glucose supplemented
with trace elements and thiamin) per g CDW per hour. After 10 hours of fed-batch the
induction is started by constantly adding ethanol at a low feed of 0.033 g ethanol per g CDW
per hour, so that the ethanol concentration after 36 hour of induction does not reach toxic
concentrations. Y. lipolytica cells are harvested by centrifugation (28°C, 10 min, 2000g) and
resuspended to an OD of roughly 100 (corresponding to roughly 24 g/L CDW) with
0
25
50
75
100
6.0 6.5 7.0 7.5 8.0
pH
Re
lati
v A
cti
vit
y [
%]
0
25
50
75
100
20 30 35 40 50
Temperatur [°C]
Re
lati
ve
Ac
tiv
ity
[%
]
(A) (B)

Dissertation Braun Andreas
- 55 -
potassium phosphate buffer (pH 7.4, 200 mM) supplemented with 0.5% D-glucose. For whole
cell bioconversion, 450 to 600 mL Y. lipolytica cell suspensions are transferred to 1.5 L
stirred tank reactor (DasGip, Germany). Following parameters are monitored and kept
constant: pH, airflow at 1 NL/min, stirring at 1000 rpm, temperature at 30°C. To
accommodate for the need of a carbon source for cell maintenance and cofactor regeneration a
low feed of 0.01 g D-glucose per g CDW per hour is provided. After 90 – 160 hours cells are
removed by centrifugation for 10 min at 10000g (Fig 23).
Fig 23: Principle scheme of the Y. lipolytica cultivation, heterologous protein production and
bioconversion in bioreactors
Results show, that the measured biomass formation is very similar to the calculated one. The
highest expression level was reached after 24 h of induction and stayed constant till the end of
the induction phase. Furthermore, the ethanol concentrations during the induction phase never
reach toxic levels (Fig 24). Hence, that the established bioreactor parameters and procedure
are suitable for the cultivation of Y. lipolytica and the heterologous protein production with
this host organism.
biomass growth induction biotransformation 0 16 26 62 65 89-158 h
pre seed culture seed culture
-33 -10 0

Dissertation Braun Andreas
- 56 -
Fig 24: Fermentation and biotransformation of Y. lipolytica in bioreactor (A) Biomass production and CYP3A4 activity towards progesterone of Y. lipolytica strain YL22, during fed-batch and induction phase under controlled conditions in bioreactor. Whole cell activity measurements were done as described in materials and methods. (B) Ethanol concentration during induction with continuous ethanol feed. Samples were taken and cells removed by centrifugation. Ethanol concentration was determined with ENZYTECTM fluid ethanol test kit (scil diagnostics GmbH, Germany) according to manufacturer’s instructions. The Roman numerals show the following process phases: I, batch growth with glucose; II, fed-batch exponential growth on D-glucose; III, induction phase (36 h). closed triangles, calculated biomass concentrations; open triangles, fed ethanol (calculated); squares, biomass concentrations determined as cell dry weight; filled bars, CYP expression levels measured as activity per volume of cell suspension; angular striped bars, measured ethanol
As mentioned before one disadvantage of using yeast systems can be the formation of
unwanted side products by endogenous P450 enzymes. However, not only endogenous P450
can present a problem. More or less any endogenous protein can show unwanted side
reactions when using whole cells, independent of the used host organism. When using
testosterone as substrate for the whole cell bioconversion with Y. lipolytica cells. Testosterone
is very efficiently converted to androstenedione (Fig 25). Apparently, this reaction is also
known in other yeasts (Mauersberger S., Geier M., personal communication). From the
beginning on is testosterone converted to androstenedione. After roughly 40 hours most of the
testosterone is gone. During the first 24 hours of the whole cell conversion, some
hydroxytestosterone is produced, after this time the hydroxytestosterone concentration is
rapidly reduced. From the start on the formation of hydroxyandrostenedione is observed. One
possibility is that androstenedione is recognized as substrate by the CYP3A4 and converted to
hydroxyandrostenedione, furthermore, hydroxytestosterone can by converted to
hydroxyandrostenedione by Y. lipolytica, which would be indicated by the steep reduction of
the hydroxytestosterone concentration after 24 hours. This side product formation was also
observed when using microsomes for Y. lipolytica cells harboring CYP3A4 for the conversion
of testosterone, however with much lower rate.
0
10
20
30
40
50
-25.0 0.0 25.0 50.0
Time [h]
CD
W [
g/L
]
0.0
0.2
0.4
0.6
0.8
1.0
1.2
1.4
Sp
ec
ific
Ac
tiv
ity
[U
/L]
0
5
10
15
20
25
30
35
40
45
0 4 8 12 16 20 24 28 32 36
Induction Time [h]
EtO
H f
ed
[g
/L]
0
10
20
30
40
50
60
CD
W [
g/L
]
I III II
(A) (B)
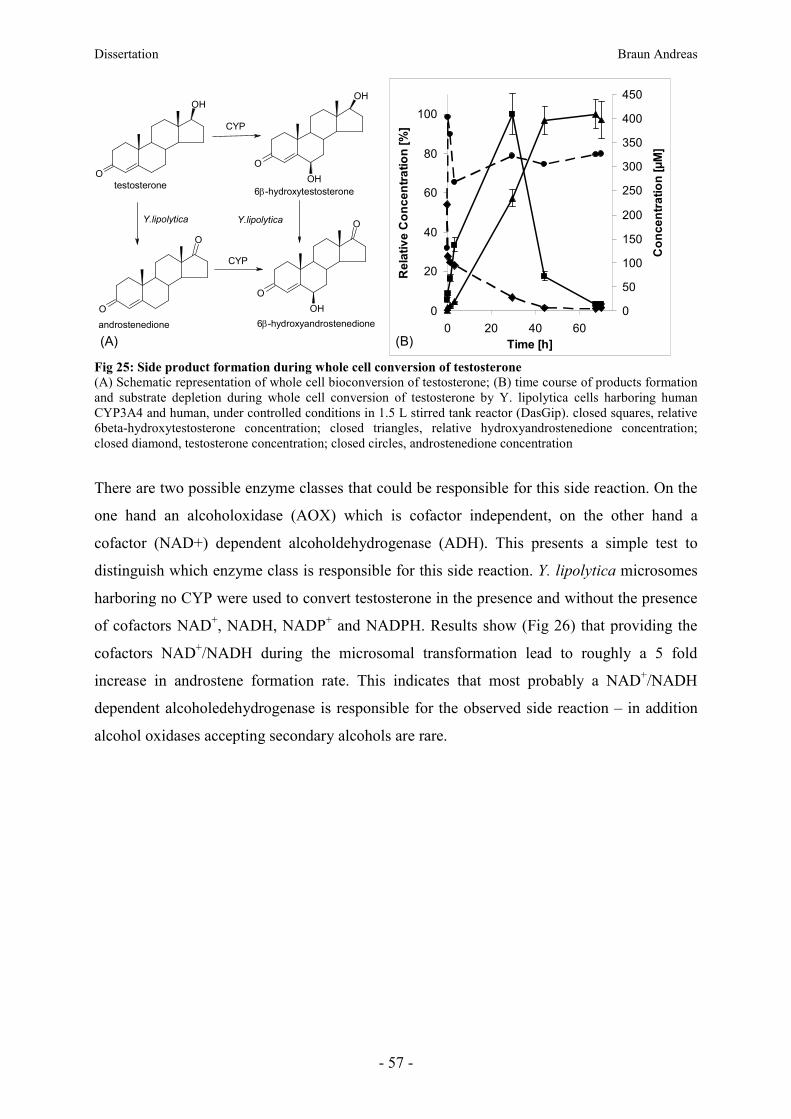
Dissertation Braun Andreas
- 57 -
Fig 25: Side product formation during whole cell conversion of testosterone
(A) Schematic representation of whole cell bioconversion of testosterone; (B) time course of products formation and substrate depletion during whole cell conversion of testosterone by Y. lipolytica cells harboring human CYP3A4 and human, under controlled conditions in 1.5 L stirred tank reactor (DasGip). closed squares, relative 6beta-hydroxytestosterone concentration; closed triangles, relative hydroxyandrostenedione concentration; closed diamond, testosterone concentration; closed circles, androstenedione concentration
There are two possible enzyme classes that could be responsible for this side reaction. On the
one hand an alcoholoxidase (AOX) which is cofactor independent, on the other hand a
cofactor (NAD+) dependent alcoholdehydrogenase (ADH). This presents a simple test to
distinguish which enzyme class is responsible for this side reaction. Y. lipolytica microsomes
harboring no CYP were used to convert testosterone in the presence and without the presence
of cofactors NAD+, NADH, NADP+ and NADPH. Results show (Fig 26) that providing the
cofactors NAD+/NADH during the microsomal transformation lead to roughly a 5 fold
increase in androstene formation rate. This indicates that most probably a NAD+/NADH
dependent alcoholedehydrogenase is responsible for the observed side reaction – in addition
alcohol oxidases accepting secondary alcohols are rare.
0
20
40
60
80
100
0 20 40 60
Time [h]
Re
lati
ve
Co
nc
en
tra
tio
n [
%]
0
50
100
150
200
250
300
350
400
450
Co
nc
en
tra
tio
n [
µM
]
(A) (B)
O
OH
O
OH
OH
O
O
OH
O
O
CYP
Y.lipolytica
testosterone6β-hydroxytestosterone
androstenedione 6β-hydroxyandrostenedione
CYP
Y.lipolytica

Dissertation Braun Andreas
- 58 -
0
100
200
300
400
500
600
700
no cof
acto
r
NAD
P+
NAD
PH
NAD
+
NAD
H
Re
lati
ve
Ac
tiv
ity
[%
]
Fig 26: Cofactor dependent conversion of testosterone to androstenedione.
Conversion rate of testosterone to androstenedione by Y. lipolytica microsomes harboring no heterologous CYPs in the presence or absence of cofactors. angular striped bar, conversion without any additional cofactor; full bars, conversion with addition of cofactors
Due to the side product formation when using testosterone, progesterone was choosen as
testsubstrate. Protesterone is a known standard substrate for CYP3A4 and no side product
formation could be observed during whole cell conversion. Additionally the structure is very
similar to that of testosterone, and several hydroxyprogesterone standards are commercially
available.
8.9. Influence of organic solvents on the biphasic whole cell conversion
Adding small amounts of water-immiscible organic solvents during induction should help the
cells to adjust themselves to the organic solvent before using them in the biphasic setup.
To determine if pre-adjusting the cells to an inert, not utilizable organic liquid would improve
the subsequent whole cell conversion in a biphasic setup with that inert organic solvent,
dibuthylphtalat (DBP) was chosen due to availability and convenient handling. It was
hypothesized that cells already adjusted to a hydrophobic environment would subsequently
give higher conversion rates during whole cell conversion in aqueous as well as biphasic
systems: surprisingly, this is not the case for biphasic whole cell conversion with inter organic
solvent dibuthylphtalat. Conversion rates of adjusted cells turned out to be considerable lower
in the aqueous system (Fig 27).
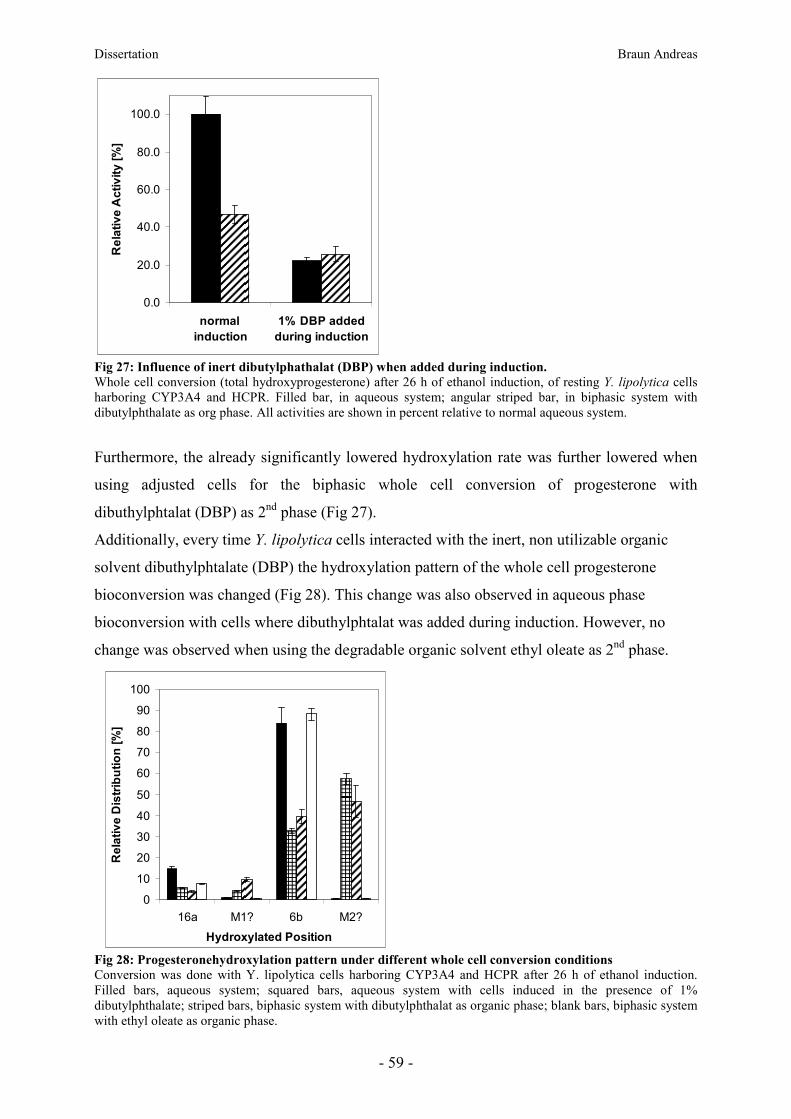
Dissertation Braun Andreas
- 59 -
0.0
20.0
40.0
60.0
80.0
100.0
normal
induction
1% DBP added
during induction
Re
lati
ve
Ac
tiv
ity
[%
]
Fig 27: Influence of inert dibutylphathalat (DBP) when added during induction.
Whole cell conversion (total hydroxyprogesterone) after 26 h of ethanol induction, of resting Y. lipolytica cells harboring CYP3A4 and HCPR. Filled bar, in aqueous system; angular striped bar, in biphasic system with dibutylphthalate as org phase. All activities are shown in percent relative to normal aqueous system.
Furthermore, the already significantly lowered hydroxylation rate was further lowered when
using adjusted cells for the biphasic whole cell conversion of progesterone with
dibuthylphtalat (DBP) as 2nd phase (Fig 27).
Additionally, every time Y. lipolytica cells interacted with the inert, non utilizable organic
solvent dibuthylphtalate (DBP) the hydroxylation pattern of the whole cell progesterone
bioconversion was changed (Fig 28). This change was also observed in aqueous phase
bioconversion with cells where dibuthylphtalat was added during induction. However, no
change was observed when using the degradable organic solvent ethyl oleate as 2nd phase.
0
10
20
30
40
50
60
70
80
90
100
16a M1? 6b M2?
Hydroxylated Position
Re
lati
ve
Dis
trib
uti
on
[%
]
Fig 28: Progesteronehydroxylation pattern under different whole cell conversion conditions
Conversion was done with Y. lipolytica cells harboring CYP3A4 and HCPR after 26 h of ethanol induction. Filled bars, aqueous system; squared bars, aqueous system with cells induced in the presence of 1% dibutylphthalate; striped bars, biphasic system with dibutylphthalat as organic phase; blank bars, biphasic system with ethyl oleate as organic phase.

Dissertation Braun Andreas
- 60 -
In regard to the hydroxylation pattern, even after 2 hour there is already a discrepancy in the
hydroxylation pattern of dibutylphthalate biphasic system, compared to the aqueous and the
ethyl oleate biphasic system. The longer bioconversion takes place, the bigger is the
discrepancy. At the beginning, the 6beta-hydroxylase activity is dominant. However, the
longer the Y. lipolytica cells adjust to the dibutylphthalate environment, the more the
hydroxylase specificity is shifted to an uncharacterized unknown modification. After roughly
4 hours, the hydroxylase rate towards the unknown position exceeds the rate towards the
6beta-position. At the end of the two-liquid phase bioreactor experiment the hydroxylation
pattern is considerable shifted (Fig 29), indicating that the changes of the cell surface, due to
the presence of the inert dibuthylphtalat, not only influence the uptake of progesterone, but
also its conversion.
0
10
20
30
40
50
60
70
80
0 20 40 60 80 100
Time [h]
Re
lati
ve
Dis
trib
uti
on
[%
]
Fig 29: Progesteronehydroxylation trend during biphasic DBP whole cell conversion in bioreactor
Conversion was done with resting Y. lipolytica cells harboring CYP3A4 and HCPR after 37 h of ethanol induction. Dashed line, unknown hydroxyprogesterone product; diamonds, 16alpha-hydroxyprogesterone; squares, unknown hydroxyprogesterone product M1; triangles, 6beta-hydroxyprogesterone; circles, unknown hydroxyprogesterone product M2.

Dissertation Braun Andreas
- 61 -
8.10. Biphasic whole cell conversion of steroids by P. pastoris harboring human CYP2D6
Fresh cultivated P. pastoris cells harboring human CYP2D6 and human CPR were provided
by Martina Geier (PhD Thesis, Geier, 2012). Biphasic whole cell conversion was performed
as described for Y. lipolytica. Compared to Y. lipolytica, P. pastoris showed a total different
behavior in the presence of inert organic solvents. There were no obvious physiological
changes or any interaction with the organic solvents e.g. cell aggregation, etc. visible.
However, the found conversion rates were very similar between P. pastoris and Y. lipolytica.
Both yeast systems showed at least 70 % reduced conversion rates during biphasic whole cell
conversion compared to the conversion in aqueous system (Fig 30).
Fig 30: Hydroxylation rates of 17alpha-methyltestosterone with P. pastoris under different conditions
Aqueous and biphasic conversions of 17alpha-methyltestosterone was done with resting cells (A) P. pastoris harboring CYP2D6 and HCPR after 72 h of methanol induction and (B) Y. lipolytica harboring CYP2D6 and HCPR after 26 h of ethanol induction.
As P. pastoris was not the scope of this thesis, these certainly curious results were not further
pursued.
8.11. CO spectrum
Measuring a CO difference spectrum may sound trivial, but its not. The measurement of
isolated soluble P450 proteins is quite simple. However, measurement of membrane bound
P450 in microsomes or even whole cells is much trickier especially when working with
eukaryotes. Most yeasts contain some cytochrome oxidase that can bind CO showing a
negative peak at 445 nm. This interferes with the CYP measurements which show, upon
reduction and binding of CO, a peak at 450 nm. Potassium cyanide (KCN) has to be added to
0
25
50
75
100
aque
ous
system
1-de
cano
l
1-do
deca
nol
met
hyl lau
rate
ethy
l ole
ate
dibu
tylpht
hala
t
Re
lati
ve
Ac
tiv
ity
[%
]
0
25
50
75
100
aque
ous
system
1-de
cano
l
1-do
deca
nol
met
hyl lau
rate
ethy
l ole
ate
dibu
tylpht
hala
t
Re
lati
ve
Ac
tiv
ity
[%
]
(A) (B)

Dissertation Braun Andreas
- 62 -
mask the negative cytochrome oxidase peak (Förster, 2001; Phillips et al., 2006). It was not
possible to measure the CO-spectrum of all expression strains. Only the once with the highest
copy numbers gave a CO-spectrum (Fig 31). The highest expression levels for human liver
cytochrome P450 2D6 was 92.34 ± 9.19 [pmol/mg total protein] corresponding to 140.1 ±
14.8 [nmol/g CDW]) and for human liver cytochrome P450 3A4 60.93 ± 5.86 [pmol/mg total
protein] corresponding to 55.2 ± 5.3 [nmol/g CDW].
Fig 31: CO spectra of Y. lipolytica microsomes harboring human CYPs
(A) Influence of KCN on the CO difference spectrum. dashed line, no KCN added; solid line, KCN added (B) CO difference spectrum of human liver CYPs measured in microsomes isolated from Y. lipolytica after 24 h of ethanol induction. doted black line, control (no P450); dashed black line, strain YL21 (HCPR-WT, 2D6syn) ; solid black line, Yl22 (HCPR-WT, 3A4syn)
8.12. Heterologous promoters from P. pastoris
Promoters play a vital role in heterologous protein expression. They are responsible for
efficient transcription of heterologous genes. There is a large variety of heterologous and
homologous promoters available for yeast systems. Although, homologous promoters are
preferred, heterologous promoters can some times have advantageous properties (Porro et al.,
2005).
Several promoters of Y. lipolytica have been described which are either constitutive (pTEF,
pRPS7), growth-phase-dependent (hp4d) or inducible (ICL1, XPR2, POX1,…). However, the
inducible promoters need undesirable conditions for effective induction and are not tightly
regulated. Therefore the “perfect” inducible promoter for Y. lipolytica remains to be found
(Juretzek et al., 2000; Madzak et al., 2004).
In this study we tested the heterologous promoters of DAS1 (GenBank: FJ752551) and DAS2
(GenBank: FJ752552) gene from the methylotrophic yeast P. pastoris for the expression of
-0.06
-0.04
-0.02
0
0.02
0.04
0.06
400 425 450 475 500
Wavelength [nm]
Ex
tin
cti
on
-0.05
-0.025
0
0.025
0.05
400 425 450 475 500
Wavelength [nm]
Ex
tin
cti
on
(A) (B)
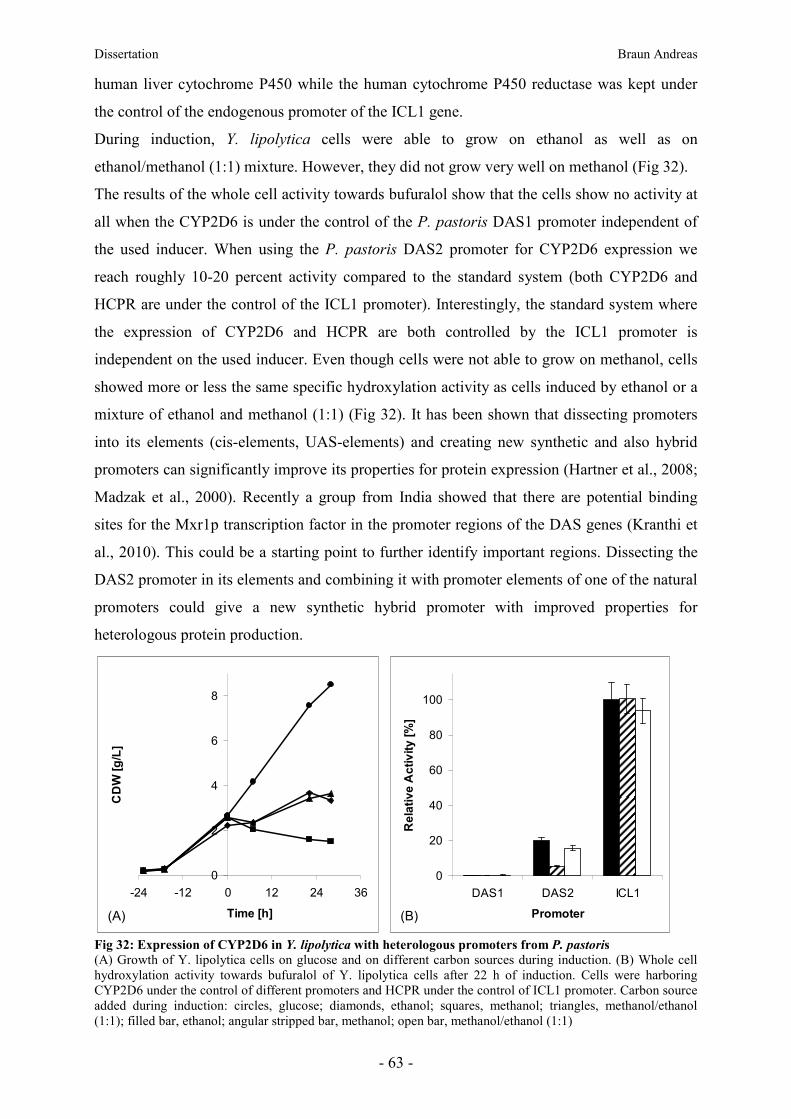
Dissertation Braun Andreas
- 63 -
human liver cytochrome P450 while the human cytochrome P450 reductase was kept under
the control of the endogenous promoter of the ICL1 gene.
During induction, Y. lipolytica cells were able to grow on ethanol as well as on
ethanol/methanol (1:1) mixture. However, they did not grow very well on methanol (Fig 32).
The results of the whole cell activity towards bufuralol show that the cells show no activity at
all when the CYP2D6 is under the control of the P. pastoris DAS1 promoter independent of
the used inducer. When using the P. pastoris DAS2 promoter for CYP2D6 expression we
reach roughly 10-20 percent activity compared to the standard system (both CYP2D6 and
HCPR are under the control of the ICL1 promoter). Interestingly, the standard system where
the expression of CYP2D6 and HCPR are both controlled by the ICL1 promoter is
independent on the used inducer. Even though cells were not able to grow on methanol, cells
showed more or less the same specific hydroxylation activity as cells induced by ethanol or a
mixture of ethanol and methanol (1:1) (Fig 32). It has been shown that dissecting promoters
into its elements (cis-elements, UAS-elements) and creating new synthetic and also hybrid
promoters can significantly improve its properties for protein expression (Hartner et al., 2008;
Madzak et al., 2000). Recently a group from India showed that there are potential binding
sites for the Mxr1p transcription factor in the promoter regions of the DAS genes (Kranthi et
al., 2010). This could be a starting point to further identify important regions. Dissecting the
DAS2 promoter in its elements and combining it with promoter elements of one of the natural
promoters could give a new synthetic hybrid promoter with improved properties for
heterologous protein production.
Fig 32: Expression of CYP2D6 in Y. lipolytica with heterologous promoters from P. pastoris
(A) Growth of Y. lipolytica cells on glucose and on different carbon sources during induction. (B) Whole cell hydroxylation activity towards bufuralol of Y. lipolytica cells after 22 h of induction. Cells were harboring CYP2D6 under the control of different promoters and HCPR under the control of ICL1 promoter. Carbon source added during induction: circles, glucose; diamonds, ethanol; squares, methanol; triangles, methanol/ethanol (1:1); filled bar, ethanol; angular stripped bar, methanol; open bar, methanol/ethanol (1:1)
0
2
4
6
8
-24 -12 0 12 24 36
Time [h]
CD
W [
g/L
]
0
20
40
60
80
100
DAS1 DAS2 ICL1
Promoter
Re
lati
ve
Ac
tiv
ity
[%
]
(A) (B)

Dissertation Braun Andreas
- 64 -
8.13. CYP2D6 mutants
Based on the information from the MuteinDB, site saturation mutagenesis on positions E216
and F483 of the cytochrome P450 2D6 have been performed (Geier et al. unpublished
results). These positions have been described to have an effect in substrate specificity (Paine
et al., 2003; Smith et al., 1998).
Selected mutants were created by site-directed mutagenesis (QuikChange®, Stratagene, USA)
and expressed in Y. lipolytica (Table 1). All selected mutants showed changed testosterone
hydroxylation patterns (Geier et al. unpublished results). Expressed CYP2D6 muteins showed
the expected changed testosterone hydroxylation patterns (Geier et al. unpublished results).
The observed hydroxylation pattern was different from CYP3A4 as well and CYP3A4 does
not show any formation of the new hydroxytestosterone (Fig 33).
0
25
50
75
100
6alpha 6beta ?? ?? 2beta
M1 M2 M3 M4 M5
Hydroxylated Product
Ra
tio
[%
]
Fig 33: Testosterone hydroxylation pattern of CYP2D6 muteins and CYP3A4, expressed in Y. lipolytica.
Y. lipolytica cells harboring native and mutated CYPs. filled bars, CYP2D6; angular striped bars, CYP3A4; open bars, CYP2D6-E216M/F483G; checked bars, CYP2D6-E216G/F483G
9. Conclusion and Outlook
In 2008 the US FDA published a guidance for metabolism studies and MIST (Metabolites In
Safety Testing). Many of the metabolites can not be synthesized by chemical means,
generating a need for efficient metabolite production using recombinant microorganisms
(Zöllner et al., 2010). As mentioned before, most of the substrates for P450 enzymes are very
hydrophobic, hence their involvement in the so called “Phase I: functionalization” of the
detoxification metabolism pathway. Many studies showed the potential usage of two-liquid
phase systems for the bioconversion of hydrophobic substrates employing whole cells as
catalysts (Bosetti et al., 1992; Bühler et al., 2004; Desmet et al., 1983; León, 1998; Liu et al.,
1996; Salter et al., 1995; Schmid et al., 1998).
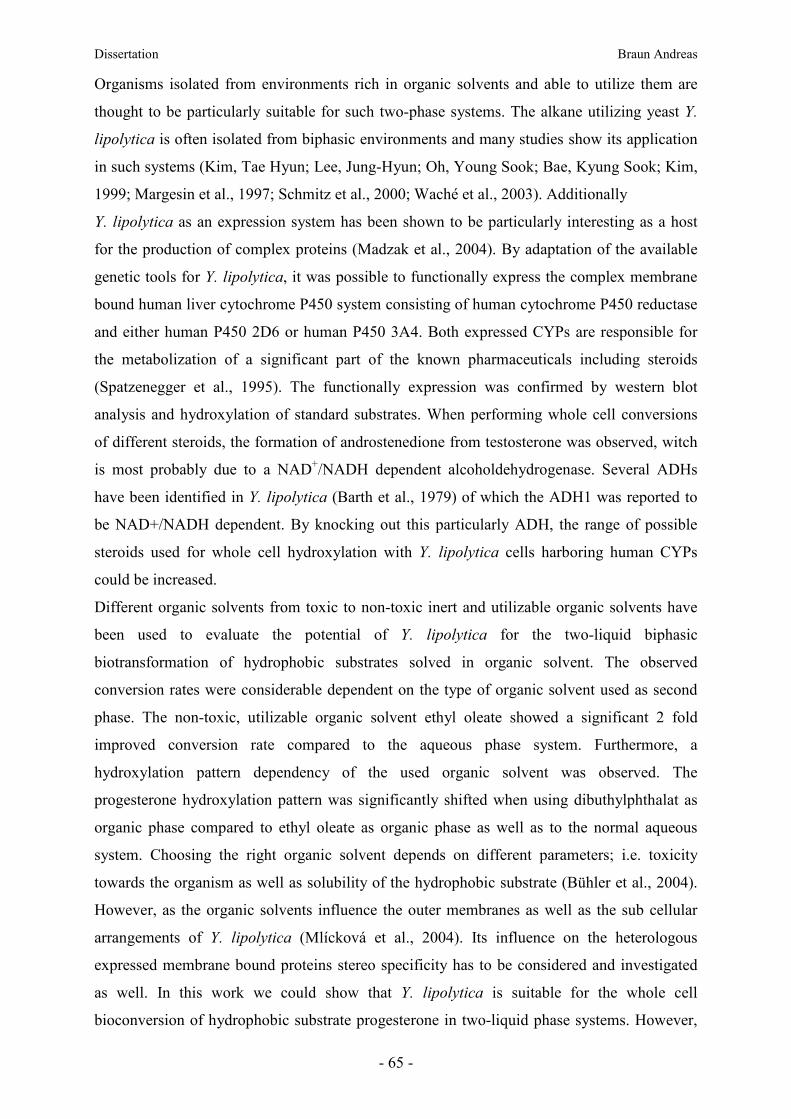
Dissertation Braun Andreas
- 65 -
Organisms isolated from environments rich in organic solvents and able to utilize them are
thought to be particularly suitable for such two-phase systems. The alkane utilizing yeast Y.
lipolytica is often isolated from biphasic environments and many studies show its application
in such systems (Kim, Tae Hyun; Lee, Jung-Hyun; Oh, Young Sook; Bae, Kyung Sook; Kim,
1999; Margesin et al., 1997; Schmitz et al., 2000; Waché et al., 2003). Additionally
Y. lipolytica as an expression system has been shown to be particularly interesting as a host
for the production of complex proteins (Madzak et al., 2004). By adaptation of the available
genetic tools for Y. lipolytica, it was possible to functionally express the complex membrane
bound human liver cytochrome P450 system consisting of human cytochrome P450 reductase
and either human P450 2D6 or human P450 3A4. Both expressed CYPs are responsible for
the metabolization of a significant part of the known pharmaceuticals including steroids
(Spatzenegger et al., 1995). The functionally expression was confirmed by western blot
analysis and hydroxylation of standard substrates. When performing whole cell conversions
of different steroids, the formation of androstenedione from testosterone was observed, witch
is most probably due to a NAD+/NADH dependent alcoholdehydrogenase. Several ADHs
have been identified in Y. lipolytica (Barth et al., 1979) of which the ADH1 was reported to
be NAD+/NADH dependent. By knocking out this particularly ADH, the range of possible
steroids used for whole cell hydroxylation with Y. lipolytica cells harboring human CYPs
could be increased.
Different organic solvents from toxic to non-toxic inert and utilizable organic solvents have
been used to evaluate the potential of Y. lipolytica for the two-liquid biphasic
biotransformation of hydrophobic substrates solved in organic solvent. The observed
conversion rates were considerable dependent on the type of organic solvent used as second
phase. The non-toxic, utilizable organic solvent ethyl oleate showed a significant 2 fold
improved conversion rate compared to the aqueous phase system. Furthermore, a
hydroxylation pattern dependency of the used organic solvent was observed. The
progesterone hydroxylation pattern was significantly shifted when using dibuthylphthalat as
organic phase compared to ethyl oleate as organic phase as well as to the normal aqueous
system. Choosing the right organic solvent depends on different parameters; i.e. toxicity
towards the organism as well as solubility of the hydrophobic substrate (Bühler et al., 2004).
However, as the organic solvents influence the outer membranes as well as the sub cellular
arrangements of Y. lipolytica (Mlícková et al., 2004). Its influence on the heterologous
expressed membrane bound proteins stereo specificity has to be considered and investigated
as well. In this work we could show that Y. lipolytica is suitable for the whole cell
bioconversion of hydrophobic substrate progesterone in two-liquid phase systems. However,

Dissertation Braun Andreas
- 66 -
each substrate has to be individually reviewed to find the optimized organic solvent. Now that
a procedure is available for analyzing two-liquid biphasic systems it would be of most interest
to compare other non-alkane utilizing yeasts with Y. lipolytica in such systems. Additionally,
it would be very interesting and most probably would give a deeper understanding to have
electro microscopy pictures of Y. lipolytica with different organic solvents. First “cryo TEM”
experiments have been done in cooperation with Nadejda Matsko (Institute for Electron
Microscopy and Fine Structure Research, FELMI, TU Graz). However, it seems that freezing
the samples for “cryo TEM” is more challenging than anticipated. So far it was not possible to
get usable pictures. To improve the possibility of getting meaningful pictures, people from the
Laboratoire de Microbiologie et Ge´ne´tique Mole´culaire (INRA INA-PG, France) who were
able to get nice TEM pictures before could be contacted for assistance (Mlícková et al., 2004).
It is well-known that comprehensive databases compiled of well revised and standardized data
sets can improve scientific research significantly. However, not only the quality of the data,
furthermore functionality of the database is important for a good workflow. Reviewing and
optimizing a database and its structure for a desired purpose is only possible when both sides,
the informatic and the scientific, work close and interactively together.
To standardize the data format and to constitute general rules for data collection made it
possible so that different scientists were able to collect data of the same quality. Several
exemplary datasets have been collected; CYP3A4, CYP2D6, HRP, NIT (Andreas Braun,
Katrin Weinhandl, Martina Geier, Institute of molecular biotechnology, TU Graz), BM3 also
known as CYP102A1 (Jan Marienhagen, Anna Joelle Ruff, Department of Biotechnology,
RWTH Aachen University), and PAMO (Daniel E. Torres Pazmino, Groningen Biomolecular
Sciences and Biotechnology Institute, University of Groningen). Searching the database
revealed, that besides CYP3A4 and some CYP102A1 muteins, CYP2D6 as well is able to
hydroxylate steroids. Two amino acid positions of CYP2D6 were identified to significantly
influence the activity and the hydroxylation pattern of CYP2D6 towards steroids. Generating
site saturation libraries at these two positions, separately and combined revealed new
hydroxylation patterns, as well as improved variants showing mainly one distinct
hydroxylated product (Geier et al. unpublished results). Selected muteins were expressed in Y.
lipolytica which showed the same changed hydroxylation patterns as reported before (Geier et
al. unpublished results). These examples show the usability of the MuteinDB as a fast way to
get important information about muteins and the influence of their mutations on substrate
specificity and kinetic data. To further improve the applicability and usability of the
MuteinDB, the database has to be populated with more datasets. Collecting datasets with this

Dissertation Braun Andreas
- 67 -
high quality is very time consuming. Therefore, this can only be done as a joint effort of a
working group and with help of the scientific community. Additionally, improving and
revising the database as well as the guidelines for data collection should be continued to be
able to adjust to new challenges in the future.
Dissertation Braun Andreas
- 68 -
10. References
Aguedo, M., Waché, Y., Mazoyer, V., Sequeira-Le Grand, A., & Belin, J.-M. (2003). Increased electron donor and electron acceptor characters enhance the adhesion between oil droplets and cells of Yarrowia lipolytica as evaluated by a new cytometric assay. J
Agric Food Chem, 51(10), 3007-11.
Asseffa, A., Smith, S. J., Nagata, K., Gillette, J., Gelboin, H. V., & Gonzalez, F. J. (1989). Novel exogenous heme-dependent expression of mammalian cytochrome P450 using baculovirus. Arch Biochem Biophys, 274(2), 481-90.
Barth, G., & Gaillardin, C. (1996). Yarrowia lipolytica. In K. Wolf (Ed.), Nonconventional
yeasts in biotechnology (pp. 313-388). Springer-Verlag.
Barth, G., & Gaillardin, C. (1997). Physiology and genetics of the dimorphic fungus Yarrowia lipolytica. FEMS microbiology reviews, 19(4), 219-37.
Barth, G., & Künkel, W. (1979). Alcohol dehydrogenase (ADH) in yeasts. II. NAD+-and NADP+-dependent alcohol dehydrogenases in Saccharomycopsis lipolytica. Zeitschrift
für allgemeine Mikrobiologie, 19(6), 381-90.
Becker, T., Breithaupt, D., Doelle, H. W., Fiechter, A., Griensven, M., & Kasper, C. (2007). Biotechnology. Ullmann’s Enzyclopedia of Industrial Chemistry (7th ed.). Wiley VCH Verlag GmbH & Co KGaA, Weinheim, Germany.
Biryukova, E. N., Arinbasarova, a. Y., & Medentsev, a. G. (2009). Adaptation of the yeast Yarrowia lipolytica to ethanol. Microbiology, 78(2), 154-159.
Bordes, F., Fudalej, F., Dossat, V., Nicaud, J.-M., & Marty, A. (2007). A new recombinant protein expression system for high-throughput screening in the yeast Yarrowia lipolytica. Journal of microbiological methods, 70(3), 493-502.
Bosetti, a, Vanbeilen, J., Preusting, H., Lageveen, R., & Witholt, B. (1992). Production of primary aliphatic alcohols with a recombinant Pseudomonas strain, encoding the alkane hydroxylase enzyme system. Enzyme Microb Technol, 14(9), 702-708.
Brannigan, J. A., & Wilkinson, A. J. (2002). Protein engineering 20 years on. Nature
reviews. Molecular cell biology., 3(12), 964-970.
Bun-Ichi, T. (1973). Steroidogenesis and cell structure: Biochemical pursuit of sites of steroid biosynthesis. Journal of Steroid Biochemistry, 4(1), 89-118.
Bureik, M., Schiffler, B., Hiraoka, Y., Vogel, F., & Bernhardt, R. (2002). Functional expression of human mitochondrial CYP11B2 in fission yeast and identification of a new internal electron transfer protein, etp1. Biochemistry, 41(7), 2311-21.
Bühler, B., & Schmid, A. (2004). Process implementation aspects for biocatalytic hydrocarbon oxyfunctionalization. J Biotechnol, 113(1-3), 183-210.

Dissertation Braun Andreas
- 69 -
Crespi, C. L., & Miller, V. P. (1999). The use of heterologously expressed drug metabolizing enzymes-state of the art and prospects for the future. Pharmacol Ther, 84(2), 121-31.
Danielson, P. B. (2002). The cytochrome P450 superfamily: biochemistry, evolution and drug metabolism in humans. Curr Drug Metab, 3(6), 561-97.
Desmet, M., Kingma, J., Wynberg, H., & Witholt, B. (1983). Pseudomonas oleovorans as a tool in bioconversions of hydrocarbons: growth, morphology and conversion characteristics in different two-phase systems. Enzyme Microb Technol, 5(5), 352-360.
Dietrich, M., Grundmann, L., Kurr, K., Valinotto, L., Saussele, T., Schmid, R. D., &
Lange, S. (2005). Recombinant production of human microsomal cytochrome P450 2D6 in the methylotrophic yeast Pichia pastoris. Chembiochem, 6(11), 2014-22.
Drăgan, C.-A., Peters, F. T., Bour, P., Schwaninger, A. E., Schaan, S. M., Neunzig, I.,
Widjaja, M., Zapp, J., Kraemer, T., Maurer, H. H., & Bureik, M. (2011). Convenient gram-scale metabolite synthesis by engineered fission yeast strains expressing functional human P450 systems. Appl Environ Microbiol, 163(8), 965-80.
Dujon, B., Sherman, D., Fischer, G., Durrens, P., et al. (2004). Genome evolution in yeasts. Nature, 430(6995), 35-44.
Emond, S., Montanier, C., Nicaud, J.-M., Marty, A., Monsan, P., André, I., & Remaud-
Siméon, M. (2010). New efficient recombinant expression system to engineer Candida antarctica lipase B. Applied and environmental microbiology, 76(8), 2684-7.
Fernandes, P., Cruz, a, Angelova, B., Pinheiro, H. ., & Cabral, J. M. . (2003). Microbial conversion of steroid compounds: recent developments. Enzyme and Microbial
Technology, 32(6), 688-705.
Fickers, P., Benetti, P.-H., Waché, Y., Marty, A., Mauersberger, S., Smit, M. S., &
Nicaud, J.-M. (2005). Hydrophobic substrate utilisation by the yeast Yarrowia lipolytica, and its potential applications. FEMS Yeast Res, 5(6-7), 527-43.
Fischer, M., Knoll, M., Sirim, D., Wagner, F., Funke, S., & Pleiss, J. (2007). The Cytochrome P450 Engineering Database: a navigation and prediction tool for the cytochrome P450 protein family. Bioinformatics, 23(15), 2015-7.
Fishelovitch, D., Shaik, S., Wolfson, H. J., & Nussinov, R. (2010). How does the reductase help to regulate the catalytic cycle of cytochrome P450 3A4 using the conserved water channel? The journal of physical chemistry. B, 114(17), 5964-70.
Fragkaki, a G., Angelis, Y. S., Koupparis, M., Tsantili-Kakoulidou, a, Kokotos, G., &
Georgakopoulos, C. (2009). Structural characteristics of anabolic androgenic steroids contributing to binding to the androgen receptor and to their anabolic and androgenic activities. Applied modifications in the steroidal structure. Steroids, 74(2), 172-97.
Fryberg, M., Oehlschlager, A. C., & Unrau, A. M. (1972). Biosynthetic routes to ergosterol in yeast. Biochemical and Biophysical Research Communications, 48(3), 593-597.

Dissertation Braun Andreas
- 70 -
Förster, A. (2001). Untersuchungen zur heterologen Expression von steroidwandelnden
Cytochrom P450 Systemen in der Hefe Y. lipolytica. Dresden University of Technology.
Förster, A., Jacobs, K., Juretzek, T., Mauersberger, S., & Barth, G. (2007). Overexpression of the ICL1 gene changes the product ratio of citric acid production by Yarrowia lipolytica. Appl Environ Microbiol, 77(4), 861-9.
Gilliver, S. C. (2010). Sex steroids as inflammatory regulators. The Journal of steroid
biochemistry and molecular biology, 120(2-3), 105-15. Elsevier Ltd.
Hanahan, D. (1983). Studies on transformation of Escherichia coli with plasmids. Journal of
molecular biology, 166(4), 557-80.
Hannemann, F., Bichet, A., Ewen, K. M., & Bernhardt, R. (2007). Cytochrome P450 systems--biological variations of electron transport chains. Biochim Biophys Acta, 1770(3), 330-44.
Hartner, F. S., Ruth, C., Langenegger, D., Johnson, S. N., Hyka, P., Lin-Cereghino, G.
P., Lin-Cereghino, J., Kovar, K., Cregg, J. M., & Glieder, A. (2008). Promoter library designed for fine-tuned gene expression in Pichia pastoris. Nucleic acids research, 36(12), e76.
Heftmann, E. (1975). Functions of steroids in plants. Phytochemistry, 14(4), 891-901.
Hoffman, C. S., & Winston, F. (1987). A ten-minute DNA preparation from yeast efficiently releases autonomous plasmids for transformation of Escherichia coli. Gene, 57(2-3), 267-72.
Höltke, H. J., Ankenbauer, W., Mühlegger, K., Rein, R., Sagner, G., Seibl, R., & Walter,
T. (1995). The digoxigenin (DIG) system for non-radioactive labelling and detection of nucleic acids--an overview. Cellular and molecular biology (Noisy-le-Grand, France), 41(7), 883-905.
Juretzek, T., Mauersberger, S., & Barth, G. (2000). Recombinant Haploid or diploid Y. lipolytica cells for the expression of CYP P450 systems - WO0003008A2.
Juretzek, T., Wang, H.-jie, Nicaud, J.-marc, Mauersberger, S., & Barth, G. (2000). Comparison of Promoters Suitable for Regulated Overexpression of β -Galactosidase in the Alkane-Utilizing Yeast Yarrowia lipolytica. Biotechnol. Bioprocess Eng., 5(5), 320-326.
Kalsotra, A., Turman, C. M., Kikuta, Y., & Strobel, H. W. (2004). Expression and characterization of human cytochrome P450 4F11: Putative role in the metabolism of therapeutic drugs and eicosanoids. Toxicol Appl Pharmacol, 199(3), 295-304.
Kawabata, T., Ota, M., & Nishikawa, K. (1999). The Protein Mutant Database. Nucleic
Acids Research, 27(1), 355-7.
Kim, D.-H., Kim, K.-H., Isin, E. M., Guengerich, F. P., Chae, H. Z., Ahn, T., & Yun, C.-
H. (2008). Heterologous expression and characterization of wild-type human cytochrome P450 1A2 without conventional N-terminal modification in Escherichia coli. Protein expression and purification, 57(2), 188-200.
Dissertation Braun Andreas
- 71 -
Kim, Tae Hyun; Lee, Jung-Hyun; Oh, Young Sook; Bae, Kyung Sook; Kim, S. J. (1999). Identification and Characterization of an Oil-degrading yeast Yarrowia lipolytica 180. J
Microbiol, 37(3), 128-135.
Kolar, N. W., Swart, A. C., Mason, J. I., & Swart, P. (2007). Functional expression and characterisation of human cytochrome P45017alpha in Pichia pastoris. J Biotechnol, 129(4), 635-44.
Kranthi, B. V., Kumar, H. R. V., & Rangarajan, P. N. (2010). Identification of Mxr1p-binding sites in the promoters of genes encoding dihydroxyacetone synthase and peroxin 8 of the methylotrophic yeast Pichia pastoris. Yeast, 27(9), 705-11.
Krynetski, E. Y., Drutsa, V. L., Kovaleva, I. E., & Luzikov, V. N. (1995). High yield expression of functionally active human liver CYP2D6 in yeast cells. Pharmacogenetics, 5(2), 103-9.
Küberl, A., Schneider, J., Thallinger, G. G., Anderl, I., Wibberg, D., Hajek, T., Jaenicke,
S., Brinkrolf, K., Goesmann, A., Szczepanowski, R., Pühler, A., Schwab, H.,
Glieder, A., & Pichler, H. (2011). High-quality genome sequence of Pichia pastoris CBS7435. Journal of biotechnology, 154(4), 312-20.
Langenbach, R., Smith, P. B., & Crespi, C. (1992). Recombinant DNA approaches for the development of metabolic systems used in in vitro toxicology. Mutat Res, 277(3), 251-75.
Le Dall, M. T., Nicaud, J. M., & Gaillardin, C. (1994). Multiple-copy integration in the yeast Yarrowia lipolytica. Current genetics, 26(1), 38-44.
León, R. (1998). Whole-cell biocatalysis in organic media. Enzyme Microb Technol, 23(7-8), 483-500.
Lin-Cereghino, J., Wong, W. W., Xiong, S., Giang, W., Luong, L. T., Vu, J., Johnson, S.
D., & Lin-Cereghino, G. P. (2005). Condensed protocol for competent cell preparation and transformation of the methylotrophic yeast Pichia pastoris. Biotechniques, 38(1), 44, 46, 48.
Liu, W.-hsiung, & Horng, W.-chang. (1996). Bioconversion of cholesterol to cholest-4-en-3-one in aqueous / organic solvent two-phase reactors. Enzyme, 0229(95), 184-189.
Livak, K. J., & Schmittgen, T. D. (2001). Analysis of relative gene expression data using real-time quantitative PCR and the 2(-Delta Delta C(T)) Method. Methods, 25(4), 402-8.
Lutz, S., & Bornscheuer, T. U. (2008). Protein Engineering Handbook. (S. Lutz & T. U. Bornscheuer, Eds.) (1st ed., p. 407). Wiley-VCH Verlag GmbH & Co. KGaA.
Madzak, C., Gaillardin, C., & Beckerich, J.-M. (2004). Heterologous protein expression and secretion in the non-conventional yeast Yarrowia lipolytica: a review. Journal of
biotechnology, 109(1-2), 63-81.
Madzak, C., Nicaud, J. M., & Gaillardin, C. (2005). Yarrowia lipolytica. Production of
Recombinant Proteins (pp. 163 -479). Wiley-VCH Verlag GmbH & Co. KGaA.

Dissertation Braun Andreas
- 72 -
Madzak, C., Tréton, B., & Blanchin-Roland, S. (2000). Strong hybrid promoters and integrative expression/secretion vectors for quasi-constitutive expression of heterologous proteins in the yeast Yarrowia lipolytica. Journal of molecular microbiology and
biotechnology, 2(2), 207-16.
Margesin, R., & Schinner, F. (1997). Efficiency of indigenous and inoculated cold-adapted soil microorganisms for biodegradation of diesel oil in alpine soils. Appl Environ
Microbiol, 63(7), 2660-4.
Mauersberger, S., Ohkuma, M., Schunck, W.-H., & Takagi, M. (1996). Candida maltosa. In K. Wolf (Ed.), Nonconventional yeasts in biotechnology (pp. 411-580). Springer-Verlag.
Mauersberger, S., Wang, H. J., Gaillardin, C., Barth, G., & Nicaud, J. M. (2001). Insertional mutagenesis in the n-alkane-assimilating yeast Yarrowia lipolytica: generation of tagged mutations in genes involved in hydrophobic substrate utilization. J
Bacteriol, 183(17), 5102-9.
McKinnon, R. A., Burgess, W. M., Hall, P. M., Roberts-Thomson, S. J., Gonzalez, F. J.,
& McManus, M. E. (1995). Characterisation of CYP3A gene subfamily expression in human gastrointestinal tissues. Gut, 36(2), 259-67.
Merkenschlager, M., Schlossmann, K., & Kurz, W. (1957). A mechanical cell homogenizer and its applicability to biological problems. Biochem Z, 329(4), 332-40.
Miller, W. L., Agrawal, V., Sandee, D., Tee, M. K., Huang, N., Choi, J. H., Morrissey,
K., & Giacomini, K. M. (2010). Consequences of POR mutations and polymorphisms. Molecular and cellular endocrinology, 336(1-2), 174-179. Elsevier Ireland Ltd.
Mlícková, K., Roux, E., Athenstaedt, K., D’Andrea, S., Daum, G., Chardot, T., &
Nicaud, J.-M. (2004). Lipid accumulation, lipid body formation, and acyl coenzyme A oxidases of the yeast Yarrowia lipolytica. Appl Environ Microbiol, 70(7), 3918-24.
Morfin, R. (2002). Involvement of steroids and cytochromes P(450) species in the triggering of immune defenses. The Journal of steroid biochemistry and molecular biology, 80(3), 273-90.
Moss, G. P. (1989). Nomenclature of Steroids. Pure & Appl. Chem., 61(10), 1783-1822.
Müller, S., Sandal, T., Kamp-Hansen, P., & Dalbøge, H. (1998). Comparison of expression systems in the yeasts Saccharomyces cerevisiae, Hansenula polymorpha, Klyveromyces lactis, Schizosaccharomyces pombe and Yarrowia lipolytica. Cloning of two novel promoters from Yarrowia lipolytica. Yeast, 14(14), 1267-83.
Nelson, D. R., Kamataki, T., Waxman, D. J., Guengerich, F. P., Estabrook, R. W.,
Feyereisen, R., Gonzalez, F. J., Coon, M. J., Gunsalus, I. C., & Gotoh, O. (1993). The P450 superfamily: update on new sequences, gene mapping, accession numbers, early trivial names of enzymes, and nomenclature. DNA and cell biology, 12(1), 1-51.
Nicaud, J.-M., Madzak, C., van Den Broek, P., Gysler, C., Duboc, P., Niederberger, P.,
& Gaillardin, C. (2002). Protein expression and secretion in the yeast Yarrowia lipolytica. FEMS yeast research, 2(3), 371-9.

Dissertation Braun Andreas
- 73 -
Nikolova, P., & Ward, O. P. (1993). Whole cell biocatalysis in nonconventional media. Journal of industrial microbiology, 12(2), 76-86.
Novikova, L. a., Faletrov, Y. V., Kovaleva, I. E., Mauersberger, S., Luzikov, V. N., &
Shkumatov, V. M. (2009). From structure and functions of steroidogenic enzymes to new technologies of gene engineering. Biochemistry (Mosc), 74(13), 1482-504.
Nthangeni, M. B., Urban, P., Pompon, D., Smit, M. S., & Nicaud, J.-M. (2004). The use of Yarrowia lipolytica for the expression of human cytochrome P450 CYP1A1. Yeast, 21(7), 583-92.
Omura, T., & Sato, R. (1964). The carbon monoxide-binding pigment of liver microsomes. I. Evidence for its hemoprotein nature. J Biol Chem, 239(7), 2370-8.
Paine, M. J. I., McLaughlin, L. a, Flanagan, J. U., Kemp, C. a, Sutcliffe, M. J., Roberts,
G. C. K., & Wolf, C. R. (2003). Residues glutamate 216 and aspartate 301 are key determinants of substrate specificity and product regioselectivity in cytochrome P450 2D6. J Biol Chem, 278(6), 4021-7.
Phillips, A. H., & Langdon, R. G. (1962). Hepatic triphosphopyridine nucleotide-cytochrome c reductase: isolation, characterization, and kinetic studies. J Biol Chem, 237(8), 2652-60.
Phillips, I. R., & Shephard, E. A. (2006). Cytochrome P450 Protocols. (I. R. Phillips & S. A. Elizabeth, Eds.) (2nd ed., p. 384). Humana Press Inc.
Porro, D., Sauer, M., Branduardi, P., & Mattanovich, D. (2005). Recombinant protein production in yeasts. Molecular biotechnology, 31(3), 245-59.
Preissner, S., Kroll, K., Dunkel, M., Senger, C., Goldsobel, G., Kuzman, D., Guenther,
S., Winnenburg, R., Schroeder, M., & Preissner, R. (2010). SuperCYP: a comprehensive database on Cytochrome P450 enzymes including a tool for analysis of CYP-drug interactions. Nucleic Acids Research, 38(Database issue), 237-43.
Rao, K. N. P., Suman, S. K., Kiran, Y. R., Kuanr, A. R., Gupta, A. K., Bhalla, K.,
Kumar, V., Kundu, P., Arora, K., & Soni, R. (2010). Co-expression of Recombinant Human CYP2C9 with Human Cytochrome P450 Reductase in Protease Deficient S. cerevisiae Strain at a Higher Scale Yields an Enzyme of Higher Specific Activity. Drug
Metab Lett.
Reader, V. (1929). The relation of the growth of certain micro-organisms to the composition of the medium: The addition of mannitol. The Biochemical journal, 23(1), 61-7.
Renaud, J. P., Cullin, C., Pompon, D., Beaune, P., & Mansuy, D. (1990). Expression of human liver cytochrome P450 IIIA4 in yeast. A functional model for the hepatic enzyme. European journal of biochemistry / FEBS, 194(3), 889-96.
Ridley, D. D. (2009). Information Retrieval: SciFinder (2nd ed., p. 226). J. Wiley & Sons.
Rowland, P., Blaney, F. E., Smyth, M. G., Jones, J. J., Leydon, V. R., Oxbrow, A. K.,
Lewis, C. J., Tennant, M. G., Modi, S., Eggleston, D. S., Chenery, R. J., & Bridges,
Dissertation Braun Andreas
- 74 -
A. M. (2006). Crystal structure of human cytochrome P450 2D6. The Journal of
biological chemistry, 281(11), 7614-22.
Salter, G. J., & Kell, D. B. (1995). Solvent selection for whole cell biotransformations in organic media. Crit Rev Biotechnol, 15(2), 139-77.
Sambrook, J., & Russell, D. W. (2001). Molecular Cloning: A Laboratory Manual (3rd ed., p. 999). Cold Spring Harbor Laboratory.
Schmid, A., Kollmer, A., Mathys, R. G., & Witholt, B. (1998). Developments toward large-scale bacterial bioprocesses in the presence of bulk amounts of organic solvents. Extremophiles, 2(3), 249-56.
Schmid-Berger, N., Schmid, B., & Barth, G. (1994). Ylt1, a highly repetitive retrotransposon in the genome of the dimorphic fungus Yarrowia lipolytica. Journal of
bacteriology, 176(9), 2477-82.
Schmitz, C., Goebel, I., Wagner, S., Vomberg, A., & Klinner, U. (2000). Competition between n-alkane-assimilating yeasts and bacteria during colonization of sandy soil microcosms. Appl Environ Microbiol, 54(1), 126-32.
Schomburg, I., Chang, A., Ebeling, C., Gremse, M., Heldt, C., Huhn, G., & Schomburg,
D. (2004). BRENDA, the enzyme database: updates and major new developments. Nucleic Acids Research, 32(Database issue), D431-3.
Scioli, C., & Vollaro, L. (1997). The use of Yarrowia lipolytica to reduce pollution in olive mill wastewaters. Water Res, 31(10), 2520-2524.
Shastry, B. S. (2006). Pharmacogenetics and the concept of individualized medicine. The
Pharmacogenomics Journal, 6(1), 16-21.
Shimada, T., Yamazaki, H., Mimura, M., Inui, Y., & Guengerich, F. P. (1994). Interindividual variations in human liver cytochrome P-450 enzymes involved in the oxidation of drugs, carcinogens and toxic chemicals: studies with liver microsomes of 30 Japanese and 30 Caucasians. The Journal of pharmacology and experimental
therapeutics, 270(1), 414-23.
Siedler, S., Bringer, S., & Bott, M. (2011). Increased NADPH availability in Escherichia coli: improvement of the product per glucose ratio in reductive whole-cell biotransformation. Applied microbiology and biotechnology, 929-937.
Sinigaglia, M., Lanciotti, R., & Guerzoni, M. E. (1994). Biochemical and physiological characteristics of Yarrowia lipolytica strains in relation to isolation source. Can J
Microbiol, 40(1), 54-9.
Smith, G., Modi, S., Pillai, I., Lian, L. Y., Sutcliffe, M. J., Pritchard, M. P., Friedberg,
T., Roberts, G. C., & Wolf, C. R. (1998). Determinants of the substrate specificity of human cytochrome P-450 CYP2D6: design and construction of a mutant with testosterone hydroxylase activity. The Biochemical journal, 331, 783-92.
Spatzenegger, M., & Jaeger, W. (1995). Clinical importance of hepatic cytochrome P450 in drug metabolism. Drug Metab Rev, 27(3), 397-417.
Dissertation Braun Andreas
- 75 -
Strobl, G. R., von Kruedener, S., Stöckigt, J., Guengerich, F. P., & Wolff, T. (1993). Development of a pharmacophore for inhibition of human liver cytochrome P-450 2D6: molecular modeling and inhibition studies. Journal of medicinal chemistry, 36(9), 1136-45.
Thevenieau, F., Nicaud, J.-M., & Gaillardin, C. (2009). Applications of the Non-Conventional Yeast Yarrowia lipolytica. In T. Satyanarayana & G. Kunze (Eds.), Yeast
Biotechnology: Diversity and Applications (3rd ed., pp. 589-613). Springer Netherlands.
Unwalla, R. J., Cross, J. B., Salaniwal, S., Shilling, A. D., Leung, L., Kao, J., & Humblet,
C. (2010). Using a homology model of cytochrome P450 2D6 to predict substrate site of metabolism. Journal of computer-aided molecular design, 24(3), 237-56.
Urban, P., Cullin, C., & Pompon, D. (1990). Maximizing the expression of mammalian cytochrome P-450 monooxygenase activities in yeast cells. Biochimie, 72(6-7), 463-72.
Vandenput, L., & Ohlsson, C. (2010). Sex steroid metabolism in the regulation of bone health in men. The Journal of steroid biochemistry and molecular biology, 121(3-5), 582-8. Elsevier Ltd.
Vernis, L., Poljak, L., Chasles, M., Uchida, K., Casarégola, S., Käs, E., Matsuoka, M.,
Gaillardin, C., & Fournier, P. (2001). Only centromeres can supply the partition system required for ARS function in the yeast Yarrowia lipolytica. Journal of molecular
biology, 305(2), 203-17.
Waché, Y., Aguedo, M., Nicaud, J.-M., & Belin, J.-M. (2003). Catabolism of hydroxyacids and biotechnological production of lactones by Yarrowia lipolytica. Appl Environ
Microbiol, 61(5-6), 393-404.
Weckbecker, A., & Hummel, W. (2005). Glucose Dehydrogenase for the Regeneration of NADPH and NADH. In J. L. Barredo & J. M. Walker (Eds.), Microbial Enzymes and
Biotransformations (Vol. 17, pp. 225-238). Humana Press.
Williams, P. a, Cosme, J., Vinkovic, D. M., Ward, A., Angove, H. C., Day, P. J.,
Vonrhein, C., Tickle, I. J., & Jhoti, H. (2004). Crystal structures of human cytochrome P450 3A4 bound to metyrapone and progesterone. Science, 305(5684), 683-6.
Woodyer, R. D., Johannes, T. W., & Zhao, H. (2004). Regeneration of Cofactors for Enzyme Biocatalysis. In A. Pandey, C. Webb, C. S. Soccol, & C. Larroche (Eds.), In
Enzyme Technology (Vol. 14, pp. 83-101). Asiatech Publishers INc.
Zehentgruber, D., Drăgan, C.-A., Bureik, M., & Lütz, S. (2010). Challenges of steroid biotransformation with human cytochrome P450 monooxygenase CYP21 using resting cells of recombinant Schizosaccharomyces pombe. J Biotechnol, 146(4), 179-85.
Zhang, J., Xu, J.-H., & Flickinger, M. C. (2009). Biocatalysis, Cofactor Regeneration. Encyclopedia of Industrial Biotechnology. John Wiley & Sons, Inc.
Zöllner, A., Buchheit, D., Meyer, M. R., Maurer, H. H., Peters, F. T., & Bureik, M. (2010). Production of human phase 1 and 2 metabolites by whole-cell biotransformation with recombinant microbes. Bioanalysis, 2(7), 1277-90.

Dissertation Braun Andreas
- 76 -
van der Walt, J. P., & von Arx, J. A. (1980). The yeast genus Yarrowia gen. nov. Antonie
van Leeuwenhoek, 46(6), 517-21.
Dissertation Braun Andreas
- 77 -
11. Appendix
11.1. Index of Figures
Fig 1: Schematic representation of whole cell biotransformation.___________________________________ 11 Fig 2: The proposed catalytic cycle of cytochrome P450 for hydroxylation reactions. ___________________ 12 Fig 3: Schematic organization of of the most comone cytochrome P450 systems. _______________________ 14 Fig 4: CYP2D6 and CYP3A4 protein structure _________________________________________________ 16 Fig 5: Structure of steroids _________________________________________________________________ 17 Fig 6: Y. lipolytica strain H222-S4 (Dresden, Germany) __________________________________________ 20 Fig 7: Schematic representation of multi copy co-expression vector concstruction______________________ 30 Fig 8: Formula for determination of ethanol ___________________________________________________ 33 Fig 9: Principle scheme of the Y. lipolytica cultivation, heterologous protein production in shake flasks ____ 34 Fig 10: Western blot sandwich (picture copied from manufacturer manual) ___________________________ 35 Fig 11: Principle scheme of the DNA transfer assembly. __________________________________________ 37 Fig 12: Method development for HPLC-MS analysis of bufuralol and its metabolites. ___________________ 45 Fig 13: Method development for HPLC-MS analysis of steroids (A/B, testosterone; C/D, progesterone) and their
metabolites. _____________________________________________________________________________ 46 Fig 14: Method development for high-throughput HPLC-MS analysis of testosterone and their metabolites. _ 47 Fig 15: Calibration curves of (A) 6beta-hydroxyprogesterone and (B) 16alpha-hydroxyprogesterone_______ 48 Fig 16: Correlation between cell dry weight (CDW) and OD600 of Y. lipolytica cells.____________________ 49 Fig 17: Dot blot, determine the DIG labeling efficiency of AmpR target probes ________________________ 50 Fig 18: Southern blot _____________________________________________________________________ 50 Fig 19: Expected bands of multicopy strains after southern blotting. ________________________________ 51 Fig 20: Ethanol concentration during induction of Y. lipolytica. ____________________________________ 52 Fig 21: Product formation during microsomal conversion of progesterone with glucose dehydrogenase as
regeneration system. ______________________________________________________________________ 53 Fig 22: Influence of (A) pH and (B) temperature on whole cell conversion____________________________ 54 Fig 23: Principle scheme of the Y. lipolytica cultivation, heterologous protein production and bioconversion in
bioreactors _____________________________________________________________________________ 55 Fig 24: Fermentation and biotransformation of Y. lipolytica in bioreactor ____________________________ 56 Fig 25: Side product formation during whole cell conversion of testosterone __________________________ 57 Fig 26: Cofactor dependent conversion of testosterone to androstenedione.___________________________ 58 Fig 27: Influence of inert dibutylphathalat (DBP) when added during induction. _______________________ 59 Fig 28: Progesteronehydroxylation pattern under different whole cell conversion conditions _____________ 59 Fig 29: Progesteronehydroxylation trend during biphasic DBP whole cell conversion in bioreactor________ 60 Fig 30: Hydroxylation rates of 17alpha-methyltestosterone with P. pastoris under different conditions _____ 61 Fig 31: CO spectra of Y. lipolytica microsomes harboring human CYPs______________________________ 62 Fig 32: Expression of CYP2D6 in Y. lipolytica with heterologous promoters from P. pastoris _____________ 63 Fig 33: Testosterone hydroxylation pattern of CYP2D6 muteins and CYP3A4, expressed in Y. lipolytica.____ 64
11.2. Index of Tables
Table 1: Strains used (in this work) __________________________________________________________ 25 Table 2: Plasmids used (in this work)_________________________________________________________ 26 Table 3: PCR reaction setup for DNA amplification - example _____________________________________ 29 Table 4: overlap extension PCR reaction setup - example _________________________________________ 29 Table 5: m/z values for MSD detection ________________________________________________________ 41 Table 6: Reagents used (in this work)_________________________________________________________ 78 Table 7: Media / Buffer used (in this work) ____________________________________________________ 80 Table 8: Instruments/Devices used (in this work) ________________________________________________ 82 Table 9: Primers for amplification ___________________________________________________________ 84 Table 10: Primers for overlap extension PCR __________________________________________________ 85 Table 11: Primers for site-directed mutagenesis ________________________________________________ 86 Table 12: Primers for sequencing____________________________________________________________ 87 Table 13: Primers for RT-QPCR ____________________________________________________________ 88 Table 14: Probe-Primers for southern blot_____________________________________________________ 88

Dissertation Braun Andreas
- 78 -
11.3. Materials and Methods
11.3.1. Reagents, Media, Buffer
Table 6: Reagents used (in this work)
Name description
1’-hydroxybufuralol BD Gentest, USA 11alpha-hydroxyprogesterone gift from TU Vienna 16alpha-hydroxyprogesterone Steraloids, Inc., USA 17alpha-hydroxyprogesterone Sigma-Aldrich, Germany 17alpha-methyltestosterone Sigma-Aldrich, Germany 1-decanol SAFC, USA 1-dodecanol Sigma-Aldrich, Germany 1-octanol Sigma-Aldrich, Germany 6beta-hydroxyprogesterone Steraloids, Inc., USA 6beta-hydroxytestosterone Sigma-Aldrich, Germany acetic acid Roth GmbH, Germany acetic acid (CH3COOH) Roth GmbH, Germany
acetonitrile J.T. Baker, Netherlands Roth GmbH, Germany VWR, Belgium
Agar Agar Roth GmbH, Germany agarose LE Biozyme, Germany ammonium acetate Sigma-Aldrich, Germany ammonium sulfate ((NH4)2SO4) Roth GmbH, Germany Ampicillin (Amp) Sigma-Aldrich, Germany androstendione Sigma-Aldrich, Germany anti-digoxigenin antibody conjugated with alkaline phosphatase (AP) (southern blot)
Roche, Germany
BCIP/NBT Calbiochem, USA bicin Roth GmbH, Germany bisethylhexylphthalate (BEHP) Merck, Germany blocking reagent Roche, Germany boldenone Sigma-Aldrich, Germany boric acid (H3BO3) Roth GmbH, Germany bovine serum albumin (BSA) Roth GmbH, Germany bufuralol BD Gentest, USA calcium chloride dehydrate (CaCl2 * 2H2O) Roth GmbH, Germany carrier DNA (fisch sperm, MB grade) Roche, Germany citric acid monohydrate Roth GmbH, Germany copper sulfate pentahydrate (CuSO4 * 5H2O) Merck, Germany cytochrome c Sigma-Aldrich, Germany decane Sigma-Aldrich, Germany D-glucose monohydrate (C6H12O6 * H2O = dextrose)
Roth GmbH, Germany
dibutylphthalate (DBP) Merck, Germany DIG labeled dNTP Mix (southern blot) Roche, Germany dimethylsulfoxid (DMSO) Roth GmbH, Germany dithiothreitol (DTT) Roth GmbH, Germany DNA ladder (MassRulerTM DNA ladder mix, GeneRulerTM 1 kb plus DNA Ladder)
Fermentas, Germany
dodecane Merck, Germany dry whey (low fat) and protein powder
bought in a local supermarket
EDTA disodium dihydrate Roth GmbH, Germany ethanol (C2H5OH) J.T. Baker, Netherlands ethyl oleate Sigma-Aldrich, Germany ethylene glycol Sigma-Aldrich, Germany glycerol Roth GmbH, Germany glycin (C2H5NO2) Roth GmbH, Germany goat anti-rabbit IgG antibody conjugated with alkaline phosphatase
BD Gentest, USA

Dissertation Braun Andreas
- 79 -
heptan Sigma-Aldrich, Germany hexanucleotide Mix (southern blot) Roche, Germany hydrochloric acid (HCl) Roth GmbH, Germany iron chloride (FeCl3 * 6H2O)
J.T. Baker, Netherlands
isopropanol Roth GmbH, Germany Klenow enzyme (southern blot) Roche, Germany lithium acetate Sigma-Aldrich, Germany MAB-2D6 mouse monoclonal antibody against human CYP2D6
BD Gentest, USA
magnesium chloride (MgCl2) Roth GmbH, Germany magnesium sulfate (MgSO4) Roth GmbH, Germany magnesium sulfate heptahydrate (MgSO4 * 7H2O)
Roth GmbH, Germany
maleic acid Roth GmbH, Germany manganese sulfate tetrahydrate (MnSO4 * 4H2O) Roth GmbH, Germany methyl laurate SAFC, USA NADPH-Na4 Roche, Germany n-lauroylsarcosine Sigma-Aldrich, Germany NuPAGE LDS sample buffer (4x) Invitrogen, UK NuPAGE SDS PAGE gel Invitrogen, UK NuPAGE® SDS Running Buffer (20x, MOPS) Invitrogen, UK PEG 4000 Roth GmbH, Germany perchloric acid 70% Fluka, Germany phenylmethylsulfonylfluoride (PMSF) Fluka, Germany phosphoric acid (H3PO4, 98%) Roth GmbH, Germany Ponceau S (C22H16N4O13S4) Sigma-Aldrich, Germany potassium chloride (KCl) Roth GmbH, Germany potassium cyanide Roth GmbH, Germany potassium dihydrogene-phosphate (KH2PO4) Roth GmbH, Germany potassium hydrogene-phosphate (K2HPO4) Roth GmbH, Germany potassium hydroxide (KOH) Roth GmbH, Germany potassium iodide (KI) Roth GmbH, Germany Power sYBR Green MM Applied Biosystems, UK prednisolone Sigma-Aldrich, Germany progesterone Sigma-Aldrich, Germany protein ladder ( PageRulerTM prestained) Fermentas, Germany rabbit anti-alpha-mouseto mouse IgG antibody conjugated with alkaline phosphatase
BD Gentest, USA
restriction enzymes (used in this work) Fermentas, Germany Roti®-Phenol Roth GmbH, Germany sodium acetate Roth GmbH, Germany sodium chloride (NaCl) Roth GmbH, Germany sodium dithionite Sigma-Aldrich, Germany sodium dodecyl sulfoxid (SDS) Roth GmbH, Germany sodium hydroxide (NaOH) Roth GmbH, Germany sodium molybdate dehydrate (Na2MoO4 * 2H2O)
Roth GmbH, Germany
sodium nitrate (NaNO3) Merck, Germany sorbitol (sorbit) Roth GmbH, Germany testosterone Sigma-Aldrich, Germany thiamin-hydrochlorid Roth GmbH, Germany toluol Sigma-Aldrich, Germany Tris Roth GmbH, Germany tri-sodium citrate dehydrate Roth GmbH, Germany Triton X 100 Roth GmbH, Germany
Trypton Roth GmbH, Germany Oxoid, USA Bacto Laboratories Pty Ltd, Australia
WB-3A4 rabbit antibody against human CYP3A4
BD Gentest, USA
Yeast extract Roth GmbH, Germany

Dissertation Braun Andreas
- 80 -
Oxoid, USA Bacto Laboratories Pty Ltd, Australia
zinc sulfate heptahydrate (ZnSO4 * 7H2O) Sigma-Aldrich, Germany
Table 7: Media / Buffer used (in this work)
Name description
ammonium acetate (pH 5.0, 10 mM)
0.7708 g ammonium acetate, acetic acid till pH 5.0, to 1 L with ddH2O
ampicillin Stock (Amp)
100 mg/mL dissolved in H2O 100 µg/mL final concentration
assay buffer (pH 7.4, 100 mM)
microsomal: 100 mL KPi-buffer (pH 7.4, 1 M), to 1 L with ddH2O whole cell conversion (WCC): 100 mL KPi-buffer (pH 7.4, 1 M), 50 mL D-glucose (20%), to 1 L with ddH2O
BEDS solution 1.63 g bicin ( 10 mM), NaOH till pH 7.3, 192 g sorbitol ( 1 M), 30 mL ethylene glycol, 50 mL DMSO, to 1 L with ddH2O
blocking solution (southern blot)
5 mL blocking stock solution to 50 mL with maleic acid buffer
blocking stock solution (10x, southern blot)
5 g blocking reagent to 100 mL with maleic acid buffer
buffer A (Merckenschlager)
50 mL KPi-buffer (pH 7.9, 1 M), 50mL glycerol, 5 mL PMSF (200 mM), 1 mL EDTA (1 M), 1 mL dithiothreitol (2 M), to 1 L with ddH2O
bufuralol (1 mM) 1 mg bufuralol, to 3.3 mL with assay buffer color-substrate solution (southern blot)
200 µL BCIP/NBT, to 10 mL with detection buffer
CO-spectra buffer (pH 7.4, 100 mM)
20 g glycerol, 10 g KPi-buffer (pH 7.4, 1 M), to 100 g with ddH2O
cyt c assay buffer (pH 7.5) 605.7 mg Tris ( 50 mM), 37.2 mg EDTA disodium dehydrate ( 1 mM), HCl till pH 7.5, to 100 mL with ddH2O
cytochrome c (300 µM) 18 mg cytochrome c, to 5 mL with cyt c assay buffer denaturing solution (southern blot)
10.0 g NaOH ( 0.5 M), 43.83 g NaCl ( 1.5 M) to 500 mL with ddH2O
detection buffer (pH 9.5, southern blot)
1.21 g Tris ( 0.1 M), 0.58 g NaCl ( 0.1 M), HCl till pH 8.0, to 200 mL with ddH2O
D-glucose solution 50%: 550 g D-glucose monohydrate, to 1 L with ddH2O 20%: 220 g D-glucose monohydrate, to 1 L with ddH2O
dithiothreitol (DTT) 1 M: 1.542 g dithiothreitol, to 10 mL with ddH2O 2 M: 3.08 g dithiothreitol, to 10 mL with ddH2O
EDTA disodium dihydrate (pH 8.0)
1 M: 3.72 g EDTA disodium dihydrate, NaOH till pH 8.0, to 10 mL with ddH2O 0.2 M: 3.72 g EDTA disodium dihydrate, NaOH till pH 8.0, to 50 mL with ddH2O
equilibration buffer (10x, southern blot)
250 mL SSC (20x, transfer buffer) to 500 mL with ddH2O
ethanol (75%) 30 mL ethanol, to 40 mL with ddH2O
feed solution 1 550 g D-glucose monohydrate, 3 mL trace element solution (PTM), 3 mL thiamin hydrochloride and 1 mL iron chloride, to 1 L with ddH2O
glycerol (10%) 25g glycerol, to 250 g with ddH2O HCl (250 mM) 10.4 mL conc. HCl (37%) to 500 mL with ddH2O
hybridization solution (southern blot)
50 mL SSC (20x 5x), 20 mL blocking stock solution ( 1%), 2 mL N-laurylsarcosine (10% 0.1%), 0.4 mL SDS (10% 0.02%), to 500 mL with ddH2O
interner standard (IS) 10 mg boldenone, to 34.915 with mL DMSO 10 mg prednisolone, to 27.743 mL with H2O/DMSO (1:1)
iron chloride solution (5000x)
3 g FeCl3 x 6 H2O, to 100 mL with ethanol
KCN (pH 7.7) 50 mM: 16.3 mg KCN, verd. HCl till pH 7.7, to 5 mL with cyt c assay buffer 200 mM: 65.1 mg KCN, verd. HCl till pH 7.7, to 5 mL with CO-spectra buffer
LB medium (Luria-Bertani)
10 g tryptone, 5 g yeast extract, 5 g NaCl, to 1 L with ddH2O solid form by adding 15 g/L agar
lithium acetate (pH 6.0, 100 mM)
10.2 g lithium acetate dehydrate, acetic acid till pH 6.0, to 1 L with ddH2O
Loading Buffer (NuPAGE® LDS Sample
250 µL NuPAGE LDS sample buffer (4x), to 1000 µL with ddH2O
Dissertation Braun Andreas
- 81 -
Buffer)
lysis buffer 4 mL triton X 100, 2 g SDS, 1.17g NaCl, 0.07 g EDTA disodium dehydrate, 0.24 g Tris, HCl or NaOH till pH 8.0, to 200 mL with ddH2O
maleic acid buffer (pH 7.5)
11.6 g maleic acid ( 0.1 M), 8.77 g NaCl ( 0.15 M), NaOH till pH 7.5, to 1 L with ddH2O
mineral salt solution (5x) 30 g (NH4)2SO4, 10 g KH2PO4, 1.2 g K2HPO4, 7 gMgSO4 x 7 H2O , 3 g NaCl, 2.9 g NaNO3, 1.9 g CaCl2, to 1 L with ddH2O
minimal media (self made)
400 mL mineral salt solution, 1 mL trace element solution (PTM) 0.2 mL iron chloride, 1 mL Thiamine hydrochloride, 30 mL dextrose solution (50%), to 1 L with ddH2O
MOPS (Nu Page® SDS Running Buffer)
50 mL NuPAGE® SDS Running Buffer (20x, MOPS), to 1000 mL with ddH2O
NADPH-Na4 20mM: 7 mg NADPH-Na4, to 420 µL with assay buffer 1.5 mM: 1.3 mg NADPH-Na4, to 1.04 mL with cyt c assay buffer
neutralization solution (southern blot, pH 7.4)
121.14 g Tris ( 1 M), 87.66 g NaCl ( 1.5 M), HCL till pH 7.4, to 1 L with ddH2O
N-lauroylsarcosine sodium salt (10%)
5.7 mL N-lauroylsarcosin (35%), to 20 mL with ddH2O
PEG4000 (40%) 4 g PEG4000, to 10 mL with lithium acetate (100 mM) phenylmethylsulfonyl fluoride (PMSF, 200 mM)
1.74 g PMSF, 10 mL ddH2O, to 50 mL with ethanol
phosphoric acid (25%) 294 g phosphoric acid (98%), to 1000 g with ddH2O Ponceau S solution 0.1% Ponceau S in 5% acetic acid potassium hydroxide solution (2 M)
4 g potassium hydroxide, to 50 mL with ddH2O
potassium phosphate buffer (KPi-buffer, different pH)
pH 6.5, 1 M: 57.39 g K2HPO4, 90.57 g KH2PO4, to 1 L with ddH2O pH 7.4, 1M: 139.69 g K2HPO4, 26.95 g KH2PO4, to 1 L with ddH2O pH 7.9, 1M: 160.94 g K2HPO4, 10.34 g KH2PO4, to 1 L with ddH2O + KOH till desired pH
primary antibody 5 µL primary antibody (MAB-2D6, or WB-3A4) in 30 mL TBST-Milk Roti®-Phenol (composition)
phenol : chloroform : isoamyl alcohol (25:24:1)
running solution (western blot)
50 mL 20x Transfer buffer, 100 mL methanol, to 1L with ddH2O
SDS PAGE (NuPAGE ® gel)
Bis-Tris Gel (separation gel 4-12%, stacking gel 4%, 1.0 mm thick)
SDS solution (10%) 2 g SDS, to 20 mL with ddH2O secondary antibody 5 µL secondary antibody (MAB-2D6, or WB-3A4) in 30 mL TBST-Milk
SOC-Media 20 g bacto tryptone, 0.58 g NaCl, 5 g bacto yeast extract, 2 g MgCl2, 0.16 g KCl, 2.46 g MgSO4, 3.46 g glucose, to 1 L with ddH2O
sodium acetate (3 M) 4.92 g sodim acetate, to 20 mL with ddH2O sodium citrate buffer (pH 4.0, 500 mM)
52.54 g citric acid monohydrate, NaOH till pH 4.0, to 1L with ddH2O
sorbitol (1 M) 18.2 g sorbitol, to 100 mL with ddH2O SSC (20x, transfer buffer, southern blot
350.64 g NaCl ( 3 M), 176.46 g tri-sodium citrate dehydrate ( 0.3 M), citric acid till pH 7.0, to 2L with ddH2O
steroid (80 mM) 10 mg testosterone, to 0.867 mL with DMSO 10 mg 17alpha-methyltestosterone, to 0.827 mL DMSO 10 mg progesterone, to 0.795 with DMSO
TBS-buffer (10x) 30.3 g Tris ( 0.25 M), 87.6 g NaCl ( 1.5 M), diluted HCl till pH 7.5, to 1 L with ddH2O
TBST-buffer (washing) 100 mL TBS-buffer (10x), 0.5 mL TritonX 100, to 1 L with ddH2O TBST-milk (blocking solution)
4 g dry whey powder, 1 g protein powder (90% protein), to 100 mL with TBST-buffer
TBST-milk (for antibodies)
0.4 g dry whey powder, 0.11 g protein powder (90% protein), to 100 mL with TBST-buffer
TE-Buffer (pH 8.0) 1.21 g tris ( 10 mM), 0.37 g EDTA disodium dehydrate ( 1 mM), HCl or NaOH till pH 8.0, to 1 L with ddH2O
thiamine hydrochloride solution (1000x)
400 mg thiamine-hydrochloride, to 100 mL with ddH2O
trace element solution (PTM, 1000x)
50 mg H3BO3, 4 mg CuSO4 x 5 H2O, 10 mg KI, 30 mg MnSO4 x 1 H2O, 20 mg Na2MoO4 x 2 H2O, 40 mg ZnSO4 x 7 H2O, to 100 mL with ddH2O
transfer buffer (20x, 14.5 g Tris ( 24M), 72 g Glycin ( 1920mM), to 500mL ddH2O

Dissertation Braun Andreas
- 82 -
western blot) Tris-HCl (pH 7.0, 100 mM)
12.1 g Tris diluted, to 1 L with ddH2O pH adjusted with 1 M HCl
washing buffer 3 (southern blot)
500 mL maleic acid buffer, 1.5 mL tritonX-100
washing solution 1 (southern blot)
50 mL SSC (20x 2x), 5 mL SDS (10% 0.1%), to 500 mL with ddH2O
washing solution 2 (southern blot)
2.5 mL SSC (20x 0.1x), 5 mL SDS (10% 0.1%), to 500 mL with ddH2O
YNB Difco (yeast nitrogen base , composition)
5 g ammonium sulfate, 2 µg biotin, 0.4 mg calcium pantothenate, 2 µg folic acid, 2 mg inositol, 0,4 mg niacin, 0.2 mg p-aminobenzoic acid, 0.4 mg pyridoxine hydrochloride, 0.2 mg riboflavin, 0.4 thiamine hydrochloride, 0.5 mg boric acid, 40 µg copper sulfate, 0.1 mg potassium iodide, 0.2 mg iron chloride, 0.4 mg manganese sulfate, 0.2 mg sodium molybdate, 0.4 mg zinc sulfate, 1 g potassium dihydrogene-phosphate, 0.5 g magnesium sulfate, 0.1 g sodium chloride, 0.1 g calcium chloride, to 1 L with H2O
YNB solution (10x) 67 g YNB Difco, to 1 L with ddH2O
YNBG (different glucose concentrations)
1%: 100 mL YNB (10x), 50 mL D-glucose (20%) and 200 mLKPi-Buffer (1M, pH 6.5), to 1 L with ddH2O 0.6%: 100 mL YNB (10x), 30 mL D-glucose (20%) and 200 mL KPi-Buffer (1M, pH 6.5), to 1 L with ddH2O solid form by adding 15 g/L agar
YPD
20 g tryptone, 10 g yeast extract, 100 mL D-glucose (20%), optional: 100 mL sodium citrate buffer (pH 4.0, 500 mM) to 1 L with ddH2O solid form by adding 15 g/L agar
11.3.2. Instruments/Devices used
Table 8: Instruments/Devices used (in this work)
used for…… description
absorption measurement (cyt c activity assay)
DU® 800 Spectrophotometer, Beckman CoulterTM, USA Cuvettes, same as for OD measurement
bioreactor for cell culture Biostat (5 L), Sartorius, Germany bioreactor for whole cell conversion (different setups)
DasGip (1.5 L), DasGip, Germany
centrifuge for cell harvesting
AvantiTM Centrifuge J-20XP + JA-14 rotor and JA-25,50 rotors, Beckman CoulterTM, USA
CloneJETTM PCR Clining Kit
Fermentas, Germany
CO differential spectra SPECORD 205, analytikjena, Germany
electro transformation Gene PulserTM, BIO-RAD, USA Electroporation Cuvettes (2mm gap) cellprojects Lt., UK
electrophoresis PowerPacTM Basic + Sub-Cell GT, Biorad, USA GeneJETTM Plasmid Miniprep Kit
Fermentas, Germany
mixing of small volumes Vortex-Genie 2/Scientific Industries Inc, USA
OD measurement BioPhotometer, Eppendorf, Germany Cuvettes (10x4x45mm), Sarstedt, Germany
PCR reaction GeneAmp®PCR System 2700, Applied Biosystems, USA PfuUltra ® II Fusion HS DNA Polymerase
Stratagene, USA
Phusion High-Fidelity DNA Polymerase
FINNZYMES, Finland
SDS Page XCellSurelock, Novex MiniCell, Invitrogen, UK shaker for small volumes Thermomixer comfort, Eppendorf, Germany shakers for cell culture AG20 and HT MiltronII, Infors AG, Swiss table centrifuge (also for cell harvest)
Centrifuge 5810, Eppendorf, Germany Centrifuge 5415R + A-4-62 and F34-6-38 rotor, Eppendorf, Germany
ultracentrifuge for microsome isolation
Optima LE-80K ultracentrifuge + TI 70 rotor, Beckman CoulterTM, USA Merkenschlager homogeniser, B.Braun, Germany

Dissertation Braun Andreas
- 83 -
western Plot TE 22 Mighty Small Transphor Tank Transfer Unit, Amersham Bioscience, USA Nitrocellulose membrane, Hybond-ECLTM, Amersham Biosciences, Sweden
Wizard ® SV Gel and PCR Clean-Up System
Promega, USA

Dissertation Braun Andreas
- 84 -
11.3.3. oligonucleotides
Table 9: Primers for amplification
name sequence information
ICL-T_PCR_rv AAAGGATCCGTAAAGTCACGATAG
ICL-T_PCR_fw AGGATCCCCAGTAGACTGACCAAGCATACAAAAAACTAGTAAAA
GGCGCGCCGCAGTTTGTTTAGCAAAATATATTTAAC
ICL-T_PCR2_fw AAAAGGATCCCCAGTAGACTGACC
BamHI-part of promoter-terminator-BamHI
ICLA_PCR_fw AAAAGTCGACGATCAGGACAAACAG
ICLA_PCR_rv AAAAGGATCCCCAGATCTATATATACTGC SalI-part of promoterA-BamHI
YlCPR_WT_fw AAAAACTAGTGCCACCATGCCTCTACTCGACTCTCTCG
YlCPR_WT_rv TTTTGGCGCGCCCTACCACACATCTTCCTGGTAGAC Yarrowia lipolytica CPR
2D6_syn_fw AAAAACTAGTGCCACCATGGGTTTGGAGGCTTTGG
2D6_syn_rv TTTTGGCGCGCCTTATCTTGGGACGGCACACAG CYP2D6 synthetisch
2D6_WT_fw AAAAACTAGTGCCACCATGGGGCTAGAAGCACTGG
2D6_WT_rv TTTTGGCGCGCCCTAGCGGGGCACAGCAC CYP2D6 short and long wild type
HCPR_pp_opt_fw AAAAACTAGTGCCACCATGGGTGACTCTCACGTTGAC
HCPR_pp_opt_rv TTTTGGCGCGCCTTAGGACCAAACGTCCAAAGAG human P450 reductase HCPRsyn codon optimized
ICLA_PCR2_rv TTTTACTAGTTTTTTGTATGCTTGGTCAGTCTACTGG
ICLA_PCR2_fw AAAAGTCGACGATCAGGACAAACAGAGGCC SalI-promoterA-SpeI
HCPR-WT_SpeI_fw AAAAACTAGTGCCACCATGGGAGACTCCCACGTGG
HCPR-WT_AscI_rv TTTTGGCGCGCCCTAGCTCCACACGTCCAGGG Human CPR WT
rDNA_SacII_fw AAAACCGCGGCAGACACTGC rDNA Y. lipolytica
3A4-sp-opt_fw AAAAACTAGTGCCACCATGGCTTTGATTCCTGATTTG
3A4-sp-opt_rv TTTTGGCGCGCCTTAAGCACCGGAAACAGTACC
3A4syn codon optimized
3A4WT_fw AAAAACTAGTGCCACCATGGCTCTCATCCCAGACTTG
3A4WT_rv TTTTGGCGCGCCTCAGGCTCCACTTACGGTG
3A4WT
Pro-Pp-DAS1-fw TTTGTCGACTTTTGATGTTTGATAGTTTGATAAGAGTG
Pro-Pp-DAS1-rv CCCACTAGTTTTGTTCGATTATTCTCCAGATAAAATC
P. pastoris DAS1 promoter
Pro-Pp-DAS2-fw CTCGTCGACTTTGTTCGATTATTCTCCAGATAAAATC
Pro-Pp-DAS2-rv CGTACTAGTTTTTGATGTTTGATAGTTTGATAAGAGTG
P. pastoris DAS2 promoter

Dissertation Braun Andreas
- 85 -
Table 10: Primers for overlap extension PCR
name SEQUENCE info
HCPR_ol_T_rv GCTAAACAAACTGCTTAGGACCAAACGTCCAAAGAGTAAC
T_ol_HCPR_vw CTTTGGACGTTTGGTCCTAAGCAGTTTGTTTAGCAAAATATATTTAACG Human CPR overlap with ICL1-Terminator
T_ol_pD_rv CAAGTATGTCCATCTCGAGGATCCGTAAAGTCACGATAGCTTAAC
pD_ol_T_fw CTATCGTGACTTTACGGATCCTCGAGATGGACATACTTGTATCGTC
ICL1-Terminator overlap with ICL1D-Promoter
variant
p_ol_2D6WT_rv GTGCTTCTAGCCCCATTTTTTGTATGCTTGGTCAGTCTACTGG
2D6WT_ol_p_fw CTGACCAAGCATACAAAAAATGGGGCTAGAAGCACTGGTG all ICL1-Promoter variants overlap with 2D6WT
YlCPR_ol_T_rv GCTAAACAAACTGCCTACCACACATCTTCCTGGTAGACG
T_ol_YlCPR_vw CCAGGAAGATGTGTGGTAGGCAGTTTGTTTAGCAAAATATATTTAACG
Yarrowia lipolytica CPR overlap with ICL1-
Terminator
p_ol_2D6syn_rv CAAAGCCTCCAAACCCATTTTTTGTATGCTTGGTCAGTCTACTGG
2D6syn_ol_p_fw CTGACCAAGCATACAAAAAATGGGTTTGGAGGCTTTGGTTC all ICL1-Promoter variants overlap with 2D6syn
T_ol_pC_rv GCTTCTACAGCGTCGACGGATCCGTAAAGTCACGATAGCTTAAC
pC_ol_T_fw CTATCGTGACTTTACGGATCCGTCGACGCTGTAGAAGCACATG ICL1-Terminator overlap with ICL1C-Promoter
T_ol_pA_rv CTCTGTTTGTCCTGATCGGATCCGTAAAGTCACGATAGCTTAAC
pA_ol_T_fw CTATCGTGACTTTACGGATCCGATCAGGACAAACAGAGGCCAC ICL1-Terminator overlap with ICL1A-Promoter
HCPR-WT_ol_T_rv GCTAAACAAACTGCCTAGCTCCACACGTCCAGGG
T_ol_HCPR-WT_vw GGACGTGTGGAGCTAGGCAGTTTGTTTAGCAAAATATATTTAACG WT Human CPR overlap with ICL1-Terminator
p_ol_3A4-sp_rv CAGGAATCAAAGCCATTTTTTGTATGCTTGGTCAGTCTACTGG
3A4-sp_ol_p_fw CTGACCAAGCATACAAAAAATGGCTTTGATTCCTGATTTGG all ICL1-Promoter variants overlap with 3A4syn
p_ol_3A4WT_rv CTGGGATGAGAGCCATTTTTTGTATGCTTGGTCAGTCTACTGG
3A4WT_ol_p_fw CTGACCAAGCATACAAAAAATGGCTCTCATCCCAGACTTGG all ICL1-Promoter variants overlap with 3A4WT
2D6syn_ol_T_rv GCTAAACAAACTGCTTATCTTGGGACGGCACACAG
T_ol_2D6syn_fw GTGCCGTCCCAAGATAAGCAGTTTGTTTAGCAAAATATATTTAACG Human 2D6syn overlap with ICL1-Terminator
P_ol_HCPR-WT_rv CGTGGGAGTCTCCCATTTTTTGTATGCTTGGTCAGTCTACTGG
HCPR-WT_ol_P_fw CTGACCAAGCATACAAAAAATGGGAGACTCCCACGTGG all ICL1-Promoter variants overlap with HCPR-WT

Dissertation Braun Andreas
- 86 -
Table 11: Primers for site-directed mutagenesis
name sequence information
2D6syn_F120A_fw CTCGTTCTCAGGGTGTCGCTCTGGCTAGATACGGTC
2D6syn_F120A_rv GACCGTATCTAGCCAGAGCGACACCCTGAGAACGAG
F120A mutation
2D6syn_E216G_fw CAAGAGGGTCTGAAGGAAGGCTCTGGATTCTTGAGAG
2D6syn_E216G_rv CTCTCAAGAATCCAGAGCCTTCCTTCAGACCCTCTTG
E216G mutation
2D6syn_F483G_fw CCATGGAGTCTTTGCTGGCTTGGTTTCTCCATCCC
2D6syn_F483G_rv GGGATGGAGAAACCAAGCCAGCAAAGACTCCATGG
F483G mutation
2D6syn_E216F_fw CAAGAGGGTCTGAAGGAATTCTCTGGATTCTTGAGAG
2D6syn_E216F_rv CTCTCAAGAATCCAGAGAATTCCTTCAGACCCTCTTG
E216F mutation
2D6syn_E216M_fw CAAGAGGGTCTGAAGGAAATGTCTGGATTCTTGAGAG
2D6syn_E216M_rv CTCTCAAGAATCCAGACATTTCCTTCAGACCCTCTTG
E216M mutation
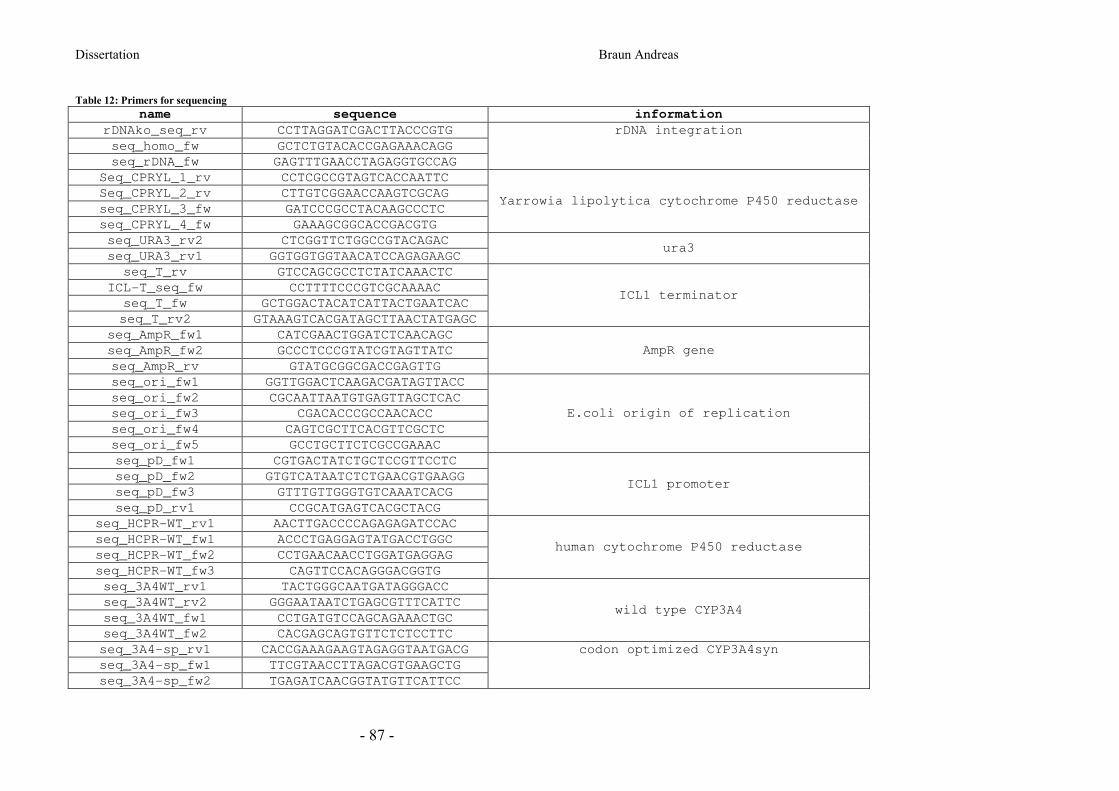
Dissertation Braun Andreas
- 87 -
Table 12: Primers for sequencing
name sequence information
rDNAko_seq_rv CCTTAGGATCGACTTACCCGTG
seq_homo_fw GCTCTGTACACCGAGAAACAGG
seq_rDNA_fw GAGTTTGAACCTAGAGGTGCCAG
rDNA integration
Seq_CPRYL_1_rv CCTCGCCGTAGTCACCAATTC
Seq_CPRYL_2_rv CTTGTCGGAACCAAGTCGCAG
seq_CPRYL_3_fw GATCCCGCCTACAAGCCCTC
seq_CPRYL_4_fw GAAAGCGGCACCGACGTG
Yarrowia lipolytica cytochrome P450 reductase
seq_URA3_rv2 CTCGGTTCTGGCCGTACAGAC
seq_URA3_rv1 GGTGGTGGTAACATCCAGAGAAGC ura3
seq_T_rv GTCCAGCGCCTCTATCAAACTC
ICL-T_seq_fw CCTTTTCCCGTCGCAAAAC
seq_T_fw GCTGGACTACATCATTACTGAATCAC
seq_T_rv2 GTAAAGTCACGATAGCTTAACTATGAGC
ICL1 terminator
seq_AmpR_fw1 CATCGAACTGGATCTCAACAGC
seq_AmpR_fw2 GCCCTCCCGTATCGTAGTTATC
seq_AmpR_rv GTATGCGGCGACCGAGTTG
AmpR gene
seq_ori_fw1 GGTTGGACTCAAGACGATAGTTACC
seq_ori_fw2 CGCAATTAATGTGAGTTAGCTCAC
seq_ori_fw3 CGACACCCGCCAACACC
seq_ori_fw4 CAGTCGCTTCACGTTCGCTC
seq_ori_fw5 GCCTGCTTCTCGCCGAAAC
E.coli origin of replication
seq_pD_fw1 CGTGACTATCTGCTCCGTTCCTC
seq_pD_fw2 GTGTCATAATCTCTGAACGTGAAGG
seq_pD_fw3 GTTTGTTGGGTGTCAAATCACG
seq_pD_rv1 CCGCATGAGTCACGCTACG
ICL1 promoter
seq_HCPR-WT_rv1 AACTTGACCCCAGAGAGATCCAC
seq_HCPR-WT_fw1 ACCCTGAGGAGTATGACCTGGC
seq_HCPR-WT_fw2 CCTGAACAACCTGGATGAGGAG
seq_HCPR-WT_fw3 CAGTTCCACAGGGACGGTG
human cytochrome P450 reductase
seq_3A4WT_rv1 TACTGGGCAATGATAGGGACC
seq_3A4WT_rv2 GGGAATAATCTGAGCGTTTCATTC
seq_3A4WT_fw1 CCTGATGTCCAGCAGAAACTGC
seq_3A4WT_fw2 CACGAGCAGTGTTCTCTCCTTC
wild type CYP3A4
seq_3A4-sp_rv1 CACCGAAAGAAGTAGAGGTAATGACG
seq_3A4-sp_fw1 TTCGTAACCTTAGACGTGAAGCTG
seq_3A4-sp_fw2 TGAGATCAACGGTATGTTCATTCC
codon optimized CYP3A4syn

Dissertation Braun Andreas
- 88 -
seq_3A4-sp_rv2 AAGGAAATCGAAACGCAAAAGC
2D6seq_syn_rv GCAAACGCAGAAATCTAGGGTC
2D6seq_syn_fw1 AGGAAGCTGCCTGTTTGTGC
2D6seq_syn_fw2 GACATCGAGGTTCAAGGTTTCC
codon optimized CYP2D6syn
2D6seq_fw TCTCTTGGACAAAGCCGTGAG
2D6seq_rv GACTCCTCCTTCAGTCCCTCC
2D6Seq_fw1 AACACTTCCTGGATGCCCAG
wild type CYP2D6
seq_Pro-Pp-DAS1_fw1 CGATGGTGTTGCTCAACAAAGG
seq_Pro-Pp-DAS1_fw2 GCTGGAACGCAGGTCCTTATG
seq_Pro-Pp-DAS1_fw3 CATTCTGTCGAAAATGGAAGCG
seq_Pro-Pp-DAS1_rv CCGCCCAAACGAACAGATAATAG
P. pastoris DAS 1+2 promoter
Table 13: Primers for RT-QPCR
name sequence binding region
RT-ampR-fw GCTATGTGGCGCGGTATTATC
RT-ampR-rv GTATGCGGCGACCGAGTT AmpR gene
RT-ICL1-fw CCAGCAGCCCGAGATTGA
RT-ICL1-rv ACTCAGCACCGGACCACTTC ICL1 promoter
Table 14: Probe-Primers for southern blot
name sequence binding region
Splot-ampR-fw cgcggtattatcccgtattg
Splot-ampR-rv atacgggagggcttaccatc AmpR gene

Dissertation Braun Andreas
- 89 -
12. Supplementary Data
Supplementary data 1
Manuscript I
(muteinDB - published in database; doi:10.1093/database/bas028)
MuteinDB: The mutein database linking substrates, products and
enzymatic reactions directly with genetic variants of enzymes

Original article
MuteinDB: the mutein database linkingsubstrates, products and enzymatic reactionsdirectly with genetic variants of enzymes
Andreas Braun1,y, Bettina Halwachs2,3,y, Martina Geier1, Katrin Weinhandl1,Michael Guggemos1, Jan Marienhagen4, Anna J. Ruff4, Ulrich Schwaneberg4, Vincent Rabin1,
Daniel E. Torres Pazmino5, Gerhard G. Thallinger2,3,* and Anton Glieder1,3
1Institute of Molecular Biotechnology, 2Institute for Genomics and Bioinformatics, Graz University of Technology, 3Austrian Centre of Industrial
Biotechnology (ACIB GmbH), 8010 Graz, Austria, 4Department of Biotechnology, RWTH Aachen University, 52074 Aachen, Germany and5Groningen Biomolecular Sciences and Biotechnology Institute (GBB), University of Groningen, 9747 AG Groningen, the Netherlands
*Corresponding author: Tel: +43 316 873 5343; Fax: +43 316 873 105343; Email: [email protected]
yThese authors contributed equally to this work.
Submitted 13 March 2012; Revised 11 May 2012; Accepted 31 May 2012
.............................................................................................................................................................................................................................................................................................
Mutational events as well as the selection of the optimal variant are essential steps in the evolution of living organisms.
The same principle is used in laboratory to extend the natural biodiversity to obtain better catalysts for applications in
biomanufacturing or for improved biopharmaceuticals. Furthermore, single mutation in genes of drug-metabolizing
enzymes can also result in dramatic changes in pharmacokinetics. These changes are a major cause of patient-specific
drug responses and are, therefore, the molecular basis for personalized medicine. MuteinDB systematically links
laboratory-generated enzyme variants (muteins) and natural isoforms with their biochemical properties including kinetic
data of catalyzed reactions. Detailed information about kinetic characteristics of muteins is available in a systematic way
and searchable for known mutations and catalyzed reactions as well as their substrates and known products. MuteinDB is
broadly applicable to any known protein and their variants and makes mutagenesis and biochemical data searchable and
comparable in a simple and easy-to-use manner. For the import of new mutein data, a simple, standardized, spreadsheet-
based data format has been defined. To demonstrate the broad applicability of the MuteinDB, first data sets have been
incorporated for selected cytochrome P450 enzymes as well as for nitrilases and peroxidases.
Database URL: http://www.MuteinDB.org
.............................................................................................................................................................................................................................................................................................
Introduction
One of nature’s fundamental mechanisms to create genetic
diversity in living organisms is the creation of mutants,
which, in turn, leads to evolution. Mutational events and
selection of the optimal variant are essential to obtain a
better catalyst. In human medicine, enzyme polymorphisms
arising from evolutionary events have been identified since
the 1960s (1). Physicians recognized that patients with the
same disease responded differently to drugs, according to
which allelic variant their genomes were carrying. This
opened the road to what is nowadays called ‘personalized
medicine’ (2). Additionally, industry desires to artificially
improve enzymes through mutation and selection. To this
end, efficient protein engineering tools to create tailor-
made enzyme variants, named ‘muteins’, have been de-
veloped over the past decades (3). Muteins generated
either by rational design or by directed or designed evolu-
tion were adapted to the needs of industrial processes or
for completely new applications.
Increasing interest in personalized medicine and in
tailor-made enzymes in the fast-growing biocatalysis indus-
try has led to an exponential increase of literature about
muteins and their influence on enzymes’ kinetic properties.
.............................................................................................................................................................................................................................................................................................
The Author(s) 2012. Published by Oxford University Press.This is an Open Access article distributed under the terms of the Creative Commons Attribution Non-Commercial License (http://creative-commons.org/licenses/by-nc/3.0), which permits unrestricted non-commercial use, distribution, and reproduction in any medium, providedthe original work is properly cited. Page 1 of 9
(page number not for citation purposes)
Database, Vol. 2012, Article ID bas028, doi:10.1093/database/bas028.............................................................................................................................................................................................................................................................................................
by g
uest o
n Ju
ly 5
, 2012
http
://datab
ase.oxfo
rdjo
urn
als.org
/D
ow
nlo
aded
from

In a plethora of examples, the artificial substitution of one
or more amino acids in a polypeptide resulted in a signifi-
cant increase or decrease of stability, turnover rate or sub-
strate specificity for the enzyme (4). Even new reactions or
activities on molecules that were not substrates for the nat-
ural parental enzyme can be caused by just a few or every
single mutation. For example, esterases could be changed
to hydroxynitrile lyases and epoxide hydrolases (5,6).
Papain, a protease, was modified to an enzyme with
efficient nitrile hydratase activity (7). Furthermore, the
fatty acid hydroxylase CYP102A1 and the camphor hydro-
xylase CYP101 were redesigned to efficient alkane hydro-
xylases (8–10). By a single mutation, the broadly applied
lipase CalB was modified to perform aldol additions and
epoxidations (11). More recently, a transaminase showing
almost no activity for a commercially interesting substrate
was mutated to a highly active and selective catalyst
enabling a new efficient industrial process for sitagliptin
production (12).
Information about specific proteins and their muteins
are widely spread in the literature. Many studies only
describe single mutation and its effects without comparison
to already known muteins. Possible additive effects of
single amino acid changes are scarcely described or used.
Even after a thorough and time-consuming literature
search, researchers face the problem of assembling and
presenting the data in an easy understandable and
comprehensive way. Essential information may be lost
such as details about potentially cooperative mutations or
reactions one would not expect in certain protein families.
Therefore, a web-accessible database combining available
knowledge about a specific enzyme and its muteins in
a single place are highly desirable. Such a database
would allow researchers to access relevant information
about their protein of interest in a fast and easy way
and accelerate the engineering of new and improved
variants.
Existing, comprehensive enzyme engineering databases
such as CYPED are mainly focused on enzyme sequences
and their structures (13). Only a few databases go beyond
that and contain, to some extent, information about
muteins and their properties. The most recently published
database introducing mutein information is SuperCYP (14),
which exclusively addresses human cytochrome P450s.
Another example is SPROUTS (15), which provides details
on the influence of point mutations on protein stability.
The Protherm database (16) contains experimental thermo-
dynamic data, and BRENDA (17), a well-known enzyme
databases, includes only a small section about muteins.
Finally, the Protein Mutant Database (18) includes refer-
ences to mutant proteins from the literature. However,
none of these databases provides kinetic characteristics of
muteins and allows a fast, systematic and user-friendly way
to search for known mutations and catalyzed reactions of
interest. All these databases focus on enzymes and provide
information about their variants from the view of the pro-
tein. Additionally, none of the existing databases is search-
able by substrate or product molecule structures allowing
comparison of muteins with respect to their catalytic
properties.
In this article, we present the novel database MuteinDB
(http://www.MuteinDB.org). It is a user-friendly graphically
appealing database devoted to provide easy access to de-
tailed information on naturally occurring and laboratory-
evolved muteins as well as on the influence of mutations on
kinetics of catalyzed reactions, including inhibition. It
allows to search for the best biocatalyst for a given sub-
strate, reaction or product simply by substrate name,
Chemical Abstracts Service (CAS) number or molecule struc-
ture. In addition, a structure search tool offers the possibil-
ity to predict muteins which most likely accept a new
substrate, if no enzyme/substrate properties were described
so far.
MuteinDB overview
The MuteinDB is a platform to collect, catalog, and store
experimentally derived data about muteins from publicly
available sources as well as data directly submitted by the
scientists. Additionally, it allows flexible searches by reac-
tion type, molecular (sub) structures, substrate, product or
mutein name. MuteinDB provides details on catalyzed re-
actions, kinetic data (activity, kinetic resolution) and experi-
mental conditions used for data generation as well as for
possible substrates or products consumed or produced by a
reaction of choice including relevant scientific publication
or patent information. Furthermore, it is possible to screen
all enzyme variants for known interactions with specific in-
hibitors. Substrate, product and inhibitor data are linked to
CAS and/or CID number (PubChem) as a unique identifier
for unambiguous reference. The use of these distinct iden-
tification numbers allows even to extract information
about (comparative) stereo- or enantioselectivity of individ-
ual muteins. Furthermore, once the user has identified a
mutein of interest, information about its sequence, the
employed expression hosts, cofactors, cosubstrates, and
coproteins can be directly shown. In the sequence view,
all mutations of a specific mutein are highlighted and
liked to other muteins with known mutations of the same
position. Additionally, the wild type sequence including all
known amino acid exchanges which are again linked to
muteins containing the modified position is illustrated for
all muteins.
For first-time users, a comprehensive frequently asked
question (FAQ) section and in-depth tutorial movies are
provided. The key features are described in more detail
below.
.............................................................................................................................................................................................................................................................................................
Page 2 of 9
Original article Database, Vol. 2012, Article ID bas028, doi:10.1093/database/bas028.............................................................................................................................................................................................................................................................................................
by g
uest o
n Ju
ly 5
, 2012
http
://datab
ase.oxfo
rdjo
urn
als.org
/D
ow
nlo
aded
from

Search options
In contrast to other databases, MuteinDB allows users not
only to query for muteins and mutations but also for sub-
strates, products, or inhibitors, using the corresponding
name or CAS number as well as catalyzed reaction types.
The database also provides means to easily and efficiently
search the data (e.g. by allowing to enter wildcards in the
values) and display it in a clear, tabular form.
Structural search
Another important difference to other existing databases is
the fully integrated (sub) structure search tool. It allows
searching for substances with a similar structure by drawing
an arbitrary chemical structure in the JME Molecule Editor
(19). The database will provide all possible hits related to
the drawn structure, and the user can navigate amongst
them to refine the search. Based on knowledge about
mutein/substrate combinations and their specific products,
this for the first time also allows predictions of other pos-
sible substrates and products for known muteins which
were not experimentally evaluated so far.
Individual features of MuteinDB
MuteinDB uses a mutein-based classification. A unique ID is
assigned to each mutein and is linked to the reference
source, the catalyzed reaction and the corresponding
wild type protein. This mutein-centric approach allows
more flexible and specific searches compared to the pub-
lication-based classification of the Protein Mutant Database
(18) or the reaction based classification of BRENDA (17).
Each reaction and publication reference can be independ-
ently surveyed, which is especially important when amino
acid changes result in new functionalities. An example for
such a case is the lipase CALB that was modified to a C–C
bond forming enzyme for aldol additions (11).
Basic information about underlying wild type protein
sequences, structures and source organism as well as com-
pound structures, their respective references and reactions
are retrieved from the public databases GenBank, PDB,
UniProt, PubChem, PubMed, CrossRef, and KEGG (20–24).
Wherever third party data is presented, it is linked to the
corresponding database entry.
Standardized format for datacollection and import
The recent introduction of experimental high-throughput
techniques required the development of standardized for-
mats for data from biological experiments. They facilitate
exchange of data, their storage in publicly accessible repo-
sitories, increase experimental transparency and allow re-
production of bioinformatic analyses from publications. For
example, such formats are available for DNA-microarray
experiments (25), proteomics studies (26), and data deriving
from qPCR experiments (27). Most of them are XML based,
which can be difficult to create and manipulate. Therefore,
simpler, spreadsheet-based formats have been introduced
which are more accessible for the individual researcher.
A prominent representative is the MAGE-TAB format for
45 DNA-microarray experiments (28).
Here, we propose a standardized spreadsheet-based
data exchange format for muteins and related experimen-
tal kinetic data. The MuteinDB import spreadsheet com-
prises seven sections for each entry: (i) basic data;
(ii) signal sequences; (iii) pH conditions; (iv) temperature
conditions; (v) storage stability; (vi) reaction data and
(vii) activity data. The basic data section includes the
enzyme’s name, the GenBank protein ID and the PDB ID
(if available). Additionally, the corresponding wild-type
name and the sequence mutations are illustrated for
muteins. The reaction section contains the substrate and
the product of the reaction (both with CAS number and
name), the enzyme classification (EC) number of the reac-
tion and the reaction type. The activity section can cover
one of following types: conversion activity, enatiomeric
excess or inhibition. All three types are followed by the
corresponding kinetic values and the experimental condi-
tions. The provided standards for kinetic data necessitate a
minimum quality of biochemical protein data (e.g enzyme
activity provided in mmol product made by mmol enzyme
per minute).
A detailed description of the fields along with guidelines
for data collection and a template spreadsheet are avail-
able on the MuteinDB homepage. Standardized entry of
data into the spreadsheet is ensured by drop-down lists
for fields with a defined value set. Drop-down lists can be
extended if new values for a field are required.
For data import, the files are checked for data consist-
ency according to the guidelines and compared with the
already existing mutein data to prevent duplicate entries
(Figure 1). A detailed report on the import is provided,
allowing focused modification of the data to adjust it con-
forming to the guidelines. Upon successful import, the data
is reviewed by an expert team at Graz University of
Technology and feedback is provided to the submitter.
After all inconsistencies are resolved, the new content is
publicly released. New data can be submitted any time
and is made available immediately after the review.
MuteinDB structure andimplementation
The MuteinDB is implemented using Java, an object-
oriented and platform-independent programming lan-
guage. The application is based on a 3-tier architecture
with an Oracle database as the persistence tier, an
.............................................................................................................................................................................................................................................................................................
Page 3 of 9
Database, Vol. 2012, Article ID bas028, doi:10.1093/database/bas028 Original article.............................................................................................................................................................................................................................................................................................
by g
uest o
n Ju
ly 5
, 2012
http
://datab
ase.oxfo
rdjo
urn
als.org
/D
ow
nlo
aded
from

application server (JBoss) as the middle tier and a WEB
interface as the client tier. Business logic is implemented
using Enterprise JavaBeans 3. The web interface depends
on JavaServer Faces 2, Asynchronous JavaScript and XML
and JBoss Seam. The relational database schema has been
designed to accommodate controlled vocabularies in form
of a data dictionary. Attributes with a defined value set are
linked to data dictionary entries to facilitate standardized
content in the database.
For substructure search (5), the JME Molecule Editor (19)
and the Chemistry Development Kid (CDK)—an open-
source Java library—are used.
Use of MuteinDB
The MuteinDB was developed as a user-friendly and
intuitive resource of mutein-related properties for scientists
in the fields of biology, biotechnology, organic chemistry
and pharmaceutical sciences. The top information bar
offers ‘FAQs’ where users will find helpful information.
Furthermore, first-time users will find tutorial movies
explaining the database usage and the different
MuteinDB sections.
The simplest search option ‘Search by Substrate’ is dir-
ectly accessible via the home screen. The left side naviga-
tion bar gives access to further querying options.
Search options
(i) Substrate: enables the user to search for muteins
that convert a certain substrate of interest.
(ii) Reaction: enables the user to search for specific re-
actions by entering a molecule name or a CAS
number for the substrate and/or the product
(including single enantiomers)
(iii) Structure: enables the user to draw chemical struc-
tures to search for similar or exact (sub) structure
matches in either one or all of the molecule cate-
gories (substrate, product and/or inhibitor).
(iv) Inhibitor: enables the user to search for inhibitors of
muteins and wild-type enzymes by entering a mol-
ecule name or a CAS number.
Figure 1. Schematic diagram of database structure. MuteinDB structure can be divided into two major parts. Firstly, the data
collection and import structure within MuteinDB, illustrated on the left. Detailed guidelines structure and specify the correct and
unified data collection as well as the data import. The standardized excel data import template guarantees data quality and
consistency. During the automated data import from the data import excel sheet, metadata from third party databases such as
PubMed, PubChem, GenBank and CrossRef are retrieved and added. The data import procedure ends either with a summary
including imported muteins, molecules, reactions, activities or with a detailed error report. Secondly, stored public mutein data
can be easily retrieved via various search mechanisms. For example, chemical structures can be used for identifying molecules of
interest and their catalyzed reactions. Results are presented in tabular listings with links to third party databases or to detailed
information contained in MuteinDB.
.............................................................................................................................................................................................................................................................................................
Page 4 of 9
Original article Database, Vol. 2012, Article ID bas028, doi:10.1093/database/bas028.............................................................................................................................................................................................................................................................................................
by g
uest o
n Ju
ly 5
, 2012
http
://datab
ase.oxfo
rdjo
urn
als.org
/D
ow
nlo
aded
from

(v) Mutation: enables the user to search for muteins
containing mutations at a certain position.
(vi) Wild type: enables the user to browse all muteins
and their reactions for a defined wild-type enzyme.
(vii) Mutein: enables the user to search for all relevant
reactions for a defined mutein name.
To keep the additional querying options simple and flex-
ible, further refinements of the query can, but do not have
to, be specified or selected. For example, the search can be
restricted amongst others to the reaction type, the under-
lying wild type protein, or to a specific organism.
All text fields are equipped with ‘suggest input’. While
typing a box will appear and provide suggestions one can
choose from. Furthermore, selected fields allow ‘wildcard
search’ with ‘*’ as a placeholder.
Example workflow
The ability to search for exact or similar structures is one of
the unique main features of the MuteinDB. Therefore, we
will describe this search type in more detail and use it as
example to demonstrate the ability of MuteinDB for valu-
able data retrieval (Figure 2).
Selecting ‘Search by Structure’ will open the JME
Molecule Editor Applet (19) and allows the user to draw
an arbitrary chemical structure (Figure 2A). After submit-
ting the search, results will be presented as a table listing
all molecules containing the drawn structure (Figure 2B).
The ‘structure result’ page proposes several related sub-
strates, products and inhibitors with similar structures to
the drawn molecule structure. In all result views, moving
the cursor over a molecule name will show its chemical
structure. Additionally, each molecule name is linked to
PubChem (22). This also facilitates the search if the CAS
number or the exact molecule name is unknown or if dif-
ferent trivial names of the molecule are commonly used.
One or several molecules can be selected via checkboxes
and can be used for a subsequent search by substrate/prod-
uct or inhibitor. The results are shown again in tabular form
listing all muteins that convert the selected substrates or
produce the selected products or are inhibited by the
chosen inhibitors.
Selecting ‘testosterone’ from the list for a subsequent
search reveals several muteins that are able to convert
this steroid (Figure 2C). This supports predictions about pos-
sible transformations of testosterone derivatives where
no experimental data is available so far. Hits from such
searches are preferred muteins for experimental evaluation.
Information about the catalyzed reactions such as sub-
strate, product and reaction type are presented in the ‘sub-
strate view’ (Figure 2D). A link to KEGG reaction (29) is
provided when a corresponding entry exists. As the kinetic
data are one of the most important pieces of information
stored in the database, kinetic parameters such as Km and
kcat are given. Furthermore, enantiomeric access and
E-values are provided if available. The view can be custo-
mized using ‘edit display settings’.
As multiple publications may have reported the same
reaction for a given mutein, the one stating the highest
activity is shown in the main result screen. By using the
expand button the data from the other reports are also
shown. Clicking on the mutein name will bring up the
‘mutein view’ where detailed information about the
mutein and the reaction are provided.
In the ‘substrate section’, several mouse-over buttons
(Figure 2D) give further information about the catalyzed
reaction. ‘C’ shows comments on the reaction, ‘W’ gives
activity data of the underlying wild-type reference, ‘R’
shows information about reaction conditions and analysis
and ‘L’ provides detailed information about the corres-
ponding literature. The PubMed ID or the digital object
identifier (DOI, http://crossref.org) of the publications are
given and directly linked to PubMed or to the webpage
associated with the digital object identifier, respectively.
Additionally, the EC number is provided and linked to the
comprehensive enzyme database BRENDA (Figure 2F–H).
The ‘sequence section’ shows the mutein sequence
aligned with its corresponding wild-type sequence
(Figure 2E). In the mutein sequence, the mutations are
highlighted in violet. The sequence can be downloaded as
FASTA format. The amino acids of the wild-type sequence
highlighted in blue mark the positions of known mutations.
These positions are linked to the ‘enzyme mutation view’.
In this view, all muteins that contain a mutation at this
position are listed. Via the mutein name it is possible to
navigate to the mutation view of the corresponding
mutein.
Another highlight of the MuteinDB is the ability to select
two or more muteins, which convert the substrate of inter-
est or form the product of interest, for comparison in side
by side view. In the ‘compare view’ the kinetic data of the
catalyzed reaction as well as information about the muta-
tions, expression system and involved cofactors and
coproteins are displayed.
Inhibitors have a special status and may have been
reported in the ‘structure result’ page for the inhibitor
search. The results are shown in tabular form (Figure 3)
listing muteins that are inhibited by the chemical com-
pound. Instead of kinetic data, the inhibitor constant Ki
or the IC50 value are provided. Additionally, the underlying
reaction used to determine the inhibitor constant is shown.
As the same inhibitor measurements can be found in
different publications, only the one with the highest inhib-
ition constant is shown as the main result. Via the expand
button, the data of the other literature sources is shown.
The mutein name is again linked to the ‘mutein view’,
where detailed information on the mutein and the inhib-
ition reaction are provided.
.............................................................................................................................................................................................................................................................................................
Page 5 of 9
Database, Vol. 2012, Article ID bas028, doi:10.1093/database/bas028 Original article.............................................................................................................................................................................................................................................................................................
by g
uest o
n Ju
ly 5
, 2012
http
://datab
ase.oxfo
rdjo
urn
als.org
/D
ow
nlo
aded
from

Figure 2. MuteinDB structure search, its results and the capabilities of the MuteinDB webinterface. (A) The MuteinDB (sub)
structure search uses the JME editor, which allows users to draw arbitrary molecular structures. (B) The user-drawn structure is
used as seed for the following database search and shown on top of the structure search result table. In this table all molecules,
.............................................................................................................................................................................................................................................................................................
Page 6 of 9
Original article Database, Vol. 2012, Article ID bas028, doi:10.1093/database/bas028.............................................................................................................................................................................................................................................................................................
(continued)
by g
uest o
n Ju
ly 5
, 2012
http
://datab
ase.oxfo
rdjo
urn
als.org
/D
ow
nlo
aded
from

Results and conclusions
MuteinDB is a comprehensive and carefully curated data-
base for specific muteins and their kinetic data of catalyzed
reactions including inhibition. It provides in-depth informa-
tion on mutein properties combined with flexible search
capabilities. The MuteinDB has been designed to be
broadly applicable to proteins and their muteins from any
enzyme class including those with no known catalytic func-
tion. We demonstrated this by entering data sets of several
enzymes and their variants of different enzyme classes.
Presently, the understanding of the structure–function
relationship of proteins is still limited. Scientists are trying
to tackle the problem from different perspectives (from
medicine and pharmacokinetics, to structural biology or
applied biocatalysis) and are, therefore, interested in how
mutations can influence catalytic properties.
By means of MuteinDB a user can find enzymes
that catalyze a particular reaction not only in expected
enzyme classes but also in others [e.g. a C–C bond forming
mutein derived from a hydrolase (30)]. This feature helps to
identify potential starting points for further enzyme engin-
eering. Moreover, medical scientists can get information
about the influence of mutations on the drug metabolism
and the in vivo activation. This helps to predict a patient’s
personal response to certain administereddrugs. In addition,
the implemented structure search for substrates, products
and inhibitors allows the prediction of structure scaffolds
that could be accepted by muteins. This might provide help-
ful information for the development of new biocatalysts
and, most probably, will facilitate drug metabolite predic-
tion in pharmaceutical research and development.
At present MuteinDB contains several thousand
reactions (Table 1) for muteins of different enzyme
Figure 2. Continued
substrates, products or inhibitors which contain the query structure are presented. A selection of these molecules can be used for
a subsequent ‘Search by Reaction’. (C) All wild type enzymes and muteins which catalyze the selected molecules are shown.
(D) For each row of the tabular result, further information can be obtained via the mutein or wild type name. The detailed
information is organized in four main categories: (i) basic data; (ii) properties; (iii) substrate and (iv) sequence. (E) The ‘Sequence’
tab of the selected mutein allows to explore the sequence of the mutein as well as the wild type sequence. Known mutations are
highlighted and linked to the corresponding entries of MuteinDB. (F) Information in the ‘Substrate’ tab is linked to third party
databases. For example, (F) molecules are linked to PubChem, (H) EC-Numbers to Brenda and (G) literature to PubMed or to its
DOI location. For muteins, experimental settings and wild type activity values are available from the ‘Substrate’ tab.
Figure 3. Result display of the MuteinDB web-interface for testosterone as a substrate. Information within the result listing for
each mutein is by default grouped into catalyzed reaction and kinetic data. Reaction information comprises the reaction type as
well as the catalyzed substrate and product. Molecules are directly linked to their corresponding PubChem entry. Additionally,
the molecule structure can be displayed by moving over the compound’s name. Important kinetic parameters such as K value,
activity value including its unit as well as the relative activity in (%) are directly available in the result view. All presented
information and further links for each mutein or wild type is directly linked by its name.
.............................................................................................................................................................................................................................................................................................
Page 7 of 9
Database, Vol. 2012, Article ID bas028, doi:10.1093/database/bas028 Original article.............................................................................................................................................................................................................................................................................................
by g
uest o
n Ju
ly 5
, 2012
http
://datab
ase.oxfo
rdjo
urn
als.org
/D
ow
nlo
aded
from

classes. It is the largest collection of kinetic data of
muteins compiled in a single database. To demonstrate
the general applicability of the database, different types
of enzymes from different origins have been searched
in literature and imported into MuteinDB. Data were
collected by searching SciFinder (www.cas.org) and
PubMed (21) abstracts for specific keywords. Detailed
data from texts, tables and figures were manually ex-
tracted from the matching full-text publications and
were curated by a team of scientists, who enriched the
published information with first-hand kinetic data wher-
ever possible.
CYP2D6 and CYP3A4 are human liver enzymes and
known to be involved in drug metabolism. Both enzymes
have been chosen as primary data sets due to their pro-
nounced polymorphism and high importance for human
drug and xenobiotic metabolism. We selected CYP102A1
(BM-3) from Bacillus megaterium as a prokaryotic represen-
tative. This protein is one of the most mutated and inves-
tigated proteins known.
To import the data, we used the standardized spread-
sheet-based import file format described previously. It con-
tains all attributes necessary to describe a mutein and its
properties.
In order to augment the database content, data col-
lection is on-going. To make the database as compre-
hensive and up-to-date as possible, we are addressing
the research community with a request to aid us in
the collection of kinetic data sets for enzymes of differ-
ent type and origin. We appreciate any contribution to
the database both updates to existing data and new
kinetic data sets.
Future directions
In the course of integrating new data sets, the MuteinDB
will be adapted, and the guidelines for data collectionwill be
adjusted. Feedback from end users and data collectors will
ensure a continued focus on a user-friendly development.
The collection of data sets was carried out as part of the
OXYGREEN (www.oxygreen.org) project, a research collab-
oration funded by the European Commission Seventh
Framework Programme (EU FP7), and will be continued to
do so. MuteinDB will be used and extended in the context
of BIONEXGEN, a recently funded EU project. To ensure
continuation of data collection and curation of the data-
base, MuteinDB will be integrated into future projects.
A downloadable version of the MuteinDB is in prepar-
ation. It will be provided for companies or universities that
would like to store their own data in-house. The data can
be integrated into the public online database on request.
The download will be available in exchange for newmutein
data sets or for a fee for database curation and data
collection.
Acknowledgements
We would like to thank Andrea Camattari, Peter Remler,
Norbert Klempier, Kurt Faber, Peter Macheroux, Helmut
Schwab and the whole OXYGREEN team for assistance
and fruitful discussions. Furthermore, we want to thank
Peter Ertl for providing the JME molecular editor applet.
Funding
EU-FP7 project OXYGREEN (EC grant 212281); the Austrian
Ministry of Science and Research GEN-AU project BIN
(FFG grant 820962). The Austrian Centre of Industrial
Biotechnology (ACIB) contribution was supported by FFG,
bmvit, mvwfi, ZIT, Zukunftsstiftung Tirol and Land
Steiermark within the Austrian COMET programme (FFG
grant 824186). Funding for open access charge: EU-FP7 pro-
ject OXYGREEN (EC grant 212281).
Conflict of interest. None declared.
References1. Ford,E.B. (1966) Genetic polymorphism. Proc. R. Soc. Lond. B Biol.
Sci., 164, 350–361.
2. Shastry,B.S. (2006) Pharmacogenetics and the concept of individua-
lized medicine. Pharmacogenomics J., 6, 16–21.
3. Lutz,S. and Bornscheuer,T.U. (2008) Protein Engineering Handbook.
Wiley-VCH GmbH & Co.KGaA, Weinheim, Germany.
4. Brannigan,J.A. and Wilkinson,A.J. (2002) Protein engineering 20
years on. Nat. Rev. Mol. Cell Biol., 3, 964–970.
5. Pan,K., Zhang,R., Sun,H. et al. (2008) An implementation of
substructure search in chemical database management system. In:
Table 1. MuteinDB data overview
Wild-type Name Muteins Reactions Activities Publications
CYP102A1 168 909 995 42
CYP102A2 0 4 4 1
CYP2D6 98 648 1259 213
CYP3A4 124 825 1908 220
HAPMO 6 106 114 5
HRP C1 17 32 45 8
Nitrilases 8 26 26 3
NITAf 11 42 42 2
P3H 0 1 12 1
P3H type1 0 21 31 3
P3H type2 0 16 23 2
P4H 0 21 53 4
PAMO 31 309 385 10
Total: 11 444 2892 4829 422
.............................................................................................................................................................................................................................................................................................
Page 8 of 9
Original article Database, Vol. 2012, Article ID bas028, doi:10.1093/database/bas028.............................................................................................................................................................................................................................................................................................
by g
uest o
n Ju
ly 5
, 2012
http
://datab
ase.oxfo
rdjo
urn
als.org
/D
ow
nlo
aded
from
Proceedings of the Third International Multi-symposiums on
Computer and Computational Sciences (IMSCCS’08). IEEE
Computer Society Press, pp. 203–206.
6. Padhi,S.K., Fujii,R., Legatt,G.A. et al. (2010) Switching from an es-
terase to a hydroxynitrile lyase mechanism requires only two amino
acid substitutions. Chem. Biol., 17, 863–871.
7. Reddy,S.Y., Kahn,K., Zheng,Y.J. et al. (2002) Protein engineering of
nitrile hydratase activity of papain: molecular dynamics study of a
mutant and wild-type enzyme. J. Am. Chem. Soc., 124,
12979–12990.
8. Urlacher,V. and Schmid,R.D. (2002) Biotransformations using pro-
karyotic P450 monooxygenases. Curr. Opin. Biotechnol., 13,
557–564.
9. Peters,M.W., Meinhold,P., Glieder,A. et al. (2003) Regio- and enan-
tioselective alkane hydroxylation with engineered cytochromes
P450 BM-3. J. Am. Chem. Soc., 125, 13442–13450.
10. Glieder,A., Farinas,E.T. and Arnold,F.H. (2002) Laboratory evolution
of a soluble, self-sufficient, highly active alkane hydroxylase. Nat.
Biotechnol., 20, 1135–1139.
11. Branneby,C., Carlqvist,P., Magnusson,A. et al. (2003) Carbon-carbon
bonds by hydrolytic enzymes. J. Am. Chem. Soc., 125, 874–875.
12. Savile,C.K., Janey,J.M., Mundorff,E.C. et al. (2010) Biocatalytic asym-
metric synthesis of chiral amines from ketones applied to sitagliptin
manufacture. Science, 329, 305–309.
13. Fischer,M., Knoll,M., Sirim,D. et al. (2007) The Cytochrome
P450 Engineering Database: a navigation and prediction tool
for the cytochrome P450 protein family. Bioinformatics, 23,
2015–2017.
14. Preissner,S., Kroll,K., Dunkel,M. et al. (2010) SuperCYP: a compre-
hensive database on Cytochrome P450 enzymes including a tool for
analysis of CYP-drug interactions. Nucleic Acids Res., 38,
D237–D243.
15. Lonquety,M., Lacroix,Z., Papandreou,N. et al. (2009) SPROUTS: a
database for the evaluation of protein stability upon point muta-
tion. Nucleic Acids Res., 37, D374–D379.
16. Kumar,M.D., Bava,K.A., Gromiha,M.M. et al. (2006) ProTherm and
ProNIT: thermodynamic databases for proteins and protein-nucleic
acid interactions. Nucleic Acids Res., 34, D204–D206.
17. Schomburg,I., Chang,A., Ebeling,C. et al. (2004) BRENDA, the
enzyme database: updates and major new developments. Nucleic
Acids Res., 32, D431–D433.
18. Kawabata,T., Ota,M. and Nishikawa,K. (1999) The Protein Mutant
Database. Nucleic Acids Res., 27, 355–357.
19. Ertl,P. (2010) Molecular structure input on the web.
J. Cheminform., 2, 1.
20. Benson,D.A., Karsch-Mizrachi,I., Clark,K. et al. (2012) GenBank.
Nucleic Acids Res., 40, D48–D53.
21. Wheeler,D.L., Church,D.M., Edgar,R. et al. (2004) Database re-
sources of the National Center for Biotechnology Information:
update. Nucleic Acids Res., 32, D35–D40.
22. Wang,Y., Xiao,J., Suzek,T.O. et al. (2009) PubChem: a public infor-
mation system for analyzing bioactivities of small molecules.
Nucleic Acids Res., 37, W623–W633.
23. The Uniprot-Consortium. Ongoing and future developments at the
Universal Protein Resource. Nucleic Acids Res., 39, D214–D219.
24. Berman,H., Henrick,K., Nakamura,H. et al. (2007) The worldwide
Protein Data Bank (wwPDB): ensuring a single, uniform archive
of PDB data. Nucleic Acids Res., 35, D301–D303.
25. Brazma,A., Hingamp,P., Quackenbush,J. et al. (2001) Minimum in-
formation about a microarray experiment (MIAME)-toward stand-
ards for microarray data. Nat. Genet., 29, 365–371.
26. Taylor,C.F., Paton,N.W., Lilley,K.S. et al. (2007) The minimum infor-
mation about a proteomics experiment (MIAPE). Nat. Biotechnol.,
25, 887–893.
27. Bustin,S.A., Benes,V., Garson,J.A. et al. (2009) The MIQE guidelines:
minimum information for publication of quantitative real-time PCR
experiments. Clin. Chem., 55, 611–622.
28. Rayner,T.F., Rocca-Serra,P., Spellman,P.T. et al. (2006) A simple
spreadsheet-based, MIAME-supportive format for microarray data:
MAGE-TAB. BMC Bioinformatics, 7, 489.
29. Kotera,M., Hirakawa,M., Tokimatsu,T. et al. (2012) The KEGG data-
bases and tools facilitating omics analysis: latest developments
involving human diseases and pharmaceuticals. Methods Mol.
Biol., 802, 19–39.
30. Li,C., Hassler,M. and Bugg,T.D. (2008) Catalytic promiscuity in the
alpha/beta-hydrolase superfamily: hydroxamic acid formation, C–C
bond formation, ester and thioester hydrolysis in the C–C hydrolase
family. Chembiochem., 9, 71–76.
.............................................................................................................................................................................................................................................................................................
.............................................................................................................................................................................................................................................................................................
Page 9 of 9
Database, Vol. 2012, Article ID bas028, doi:10.1093/database/bas028 Original article.............................................................................................................................................................................................................................................................................................
by g
uest o
n Ju
ly 5
, 2012
http
://datab
ase.oxfo
rdjo
urn
als.org
/D
ow
nlo
aded
from

Supplementary data 2
Manuscript II
(Y. lipolytica – accepted for publication in Microbial cell factories)
Expression of human liver cytochrome P450s using the non conventional
yeast Yarrowia lipolytica for steroid hydroxylation in biphasic systems
Y. lipolytica manuscript Braun Andreas
- 1 -
Steroid biotransformations in biphasic systems with
Yarrowia lipolytica expressing human liver cytochrome
P450 genes.
Andreas Braun 1, Martina Geier
1, Bruno Bühler
2, Andreas Schmid
2, Stephan Mauersberger
3, Anton Glieder
1§
1 Institute of Molecular Biotechnology, Graz University of Technology, Petersgasse 14, 8010
Graz, Austria
2 Laboratory of Chemical Biotechnology, TU Dortmund University, Emil-Figge-Strasse 66,,
44227 Dortmund, Germany
3 Institute of Microbiology, Dresden University of Technology, 01062 Dresden, Germany
§Corresponding author: current address, ACIB GmbH, Petersgasse 14, Graz
Email addresses:

Y. lipolytica manuscript Braun Andreas
- 2 -
Abstract
Background
Yarrowia lipolytica efficiently metabolizes and assimilates hydrophobic compounds such as
n-alkanes and fatty acids. Efficient substrate uptake is enabled by naturally secreted
emulsifiers and a modified cell surface hydrophobicity and protrusions formed by this yeast.
We were examining the potential of recombinant Y. lipolytica as a biocatalyst for the
oxidation of hardly soluble hydrophobic steroids. Furthermore, two-liquid biphasic culture
systems were evaluated to increase substrate availability. While cells, together with water
soluble nutrients, are maintained in the aqueous phase, substrates and most of the products are
contained in a second water-immiscible organic solvent phase.
Results
For the first time we have co-expressed the human cytochromes P450 2D6 and 3A4 genes in
Y. lipolytica together with human cytochrome P450 reductase (hCPR) or Y. lipolytica
cytochrome P450 reductase (YlCPR). These whole-cell biocatalysts were used for the
conversion of poorly soluble steroids in biphasic systems.
Employing a biphasic system with the organic solvent and Y. lipolytica carbon source ethyl
oleate for the whole-cell bioconversion of progesterone, the initial specific hydroxylation rate
in a 1.5 L stirred tank bioreactor was further increased 2-fold. Furthermore, the product
formation was significantly prolonged as compared to the aqueous system.
Co-expression of the human CPR gene lead to a 4-10-fold higher activity specific activity,
compared to the co-overexpression of the native Y. lipolytica CPR gene. Multicopy
transformants showed a 50-70-fold increase of activity as compared to single copy strains.

Y. lipolytica manuscript Braun Andreas
- 3 -
Conclusions
Alkane-assimilating yeast Yarrowia lipolytica, coupled with the described expression
strategies, demonstrated its high potential for biotransformations of hydrophobic substrates in
two-liquid biphasic systems. Especially organic solvents which can be efficiently taken up
and/or metabolized by the cell might enable more efficient bioconversion as compared to
aqueous systems and even enable simple, continuous or at least high yield long time
processes.
Keywords
Yarrowia lipolytica, biphasic sytem, cytochrome P450, steroid, whole-cell, bioconversion

Y. lipolytica manuscript Braun Andreas
- 4 -
Introduction
Cytochrome P450s (CYPs) are a large, ubiquitous family of heme-containing
monooxygenases that are responsible for the oxidative metabolism of a wide variety of drugs,
environmental chemicals and endogenous compounds, such as steroids, prostaglandins and
fatty acids [1].
Most cytochrome P450 systems are composed of a monooxygenase and one or two additional
proteins, constituting an electron transfer chain. Genes encoding these components are either
expressed individually or linked resulting in self sufficient CYPs. To some extent, the natural
electron transport chain from NAD(P)H to the heme containing cytochrome P450 can be
replaced by either homologues or different proteins with similar function e.g. flavodoxin and
flavodoxin reductase to support catalytic activity [2]. Therefore, the activity of CYPs is not
only determined by its abundance, but also by the abundance of the electron transport partners
[3] and possibly by their molar ratio.
Eukaryotic CYPs are membrane associated and many of those are located on the cytosolic
side of the endoplasmic reticulum membrane. However, several important CYPs such as the
vitamin D3 25-hydroxylase CYP27B1 are also associated to mitochondrial membrane [4]. In
mammalian cells, expression takes place in different tissues, but the highest levels are found
in the liver, where CYPs have the principal function to introduce an oxygen atom into
hydrophobic substrates. The increased hydrophilicity of the product facilitates its elimination
from the mammalian body.
Several genes of xenobiotic-metabolizing CYPs are expressed in human liver, among which
CYP1A2, CYP2C9, CYP2C19, CYP2D6 and CYP3A4 appear to be most commonly
responsible for drug metabolism [5]. The relative importance for drug metabolism is reflected
in the abundance of these enzymes, e.g., CYP3A4 being most abundant with ~ 30% of total
CYP in liver cells, and the preference to bind and/or metabolize chemicals with structures
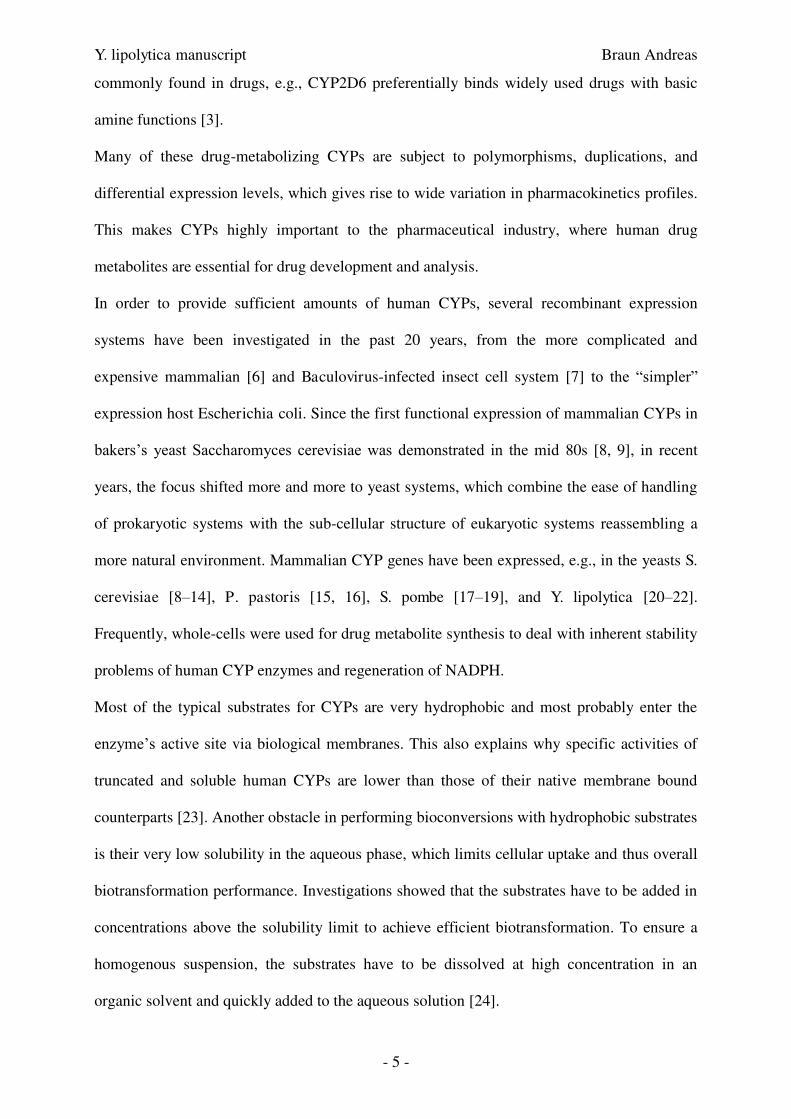
Y. lipolytica manuscript Braun Andreas
- 5 -
commonly found in drugs, e.g., CYP2D6 preferentially binds widely used drugs with basic
amine functions [3].
Many of these drug-metabolizing CYPs are subject to polymorphisms, duplications, and
differential expression levels, which gives rise to wide variation in pharmacokinetics profiles.
This makes CYPs highly important to the pharmaceutical industry, where human drug
metabolites are essential for drug development and analysis.
In order to provide sufficient amounts of human CYPs, several recombinant expression
systems have been investigated in the past 20 years, from the more complicated and
expensive mammalian [6] and Baculovirus-infected insect cell system [7] to the “simpler”
expression host Escherichia coli. Since the first functional expression of mammalian CYPs in
bakers’s yeast Saccharomyces cerevisiae was demonstrated in the mid 80s [8, 9], in recent
years, the focus shifted more and more to yeast systems, which combine the ease of handling
of prokaryotic systems with the sub-cellular structure of eukaryotic systems reassembling a
more natural environment. Mammalian CYP genes have been expressed, e.g., in the yeasts S.
cerevisiae [8–14], P. pastoris [15, 16], S. pombe [17–19], and Y. lipolytica [20–22].
Frequently, whole-cells were used for drug metabolite synthesis to deal with inherent stability
problems of human CYP enzymes and regeneration of NADPH.
Most of the typical substrates for CYPs are very hydrophobic and most probably enter the
enzyme’s active site via biological membranes. This also explains why specific activities of
truncated and soluble human CYPs are lower than those of their native membrane bound
counterparts [23]. Another obstacle in performing bioconversions with hydrophobic substrates
is their very low solubility in the aqueous phase, which limits cellular uptake and thus overall
biotransformation performance. Investigations showed that the substrates have to be added in
concentrations above the solubility limit to achieve efficient biotransformation. To ensure a
homogenous suspension, the substrates have to be dissolved at high concentration in an
organic solvent and quickly added to the aqueous solution [24].

Y. lipolytica manuscript Braun Andreas
- 6 -
However, there are several approaches to increase substrate availability. The addition of
water-miscible organic solvents or detergents has been tested [17], which may results in a
drastic increase of substrate solubility. Some solvents and most of the detergents, however,
have a strong impact on cell membranes, compromising cell integrity and viability, and thus
biocatalyst functionality.
In a more sophisticated approach, water-soluble cyclodextrins, toroid-shaped cyclic
oligosaccharids, have been used to capture hydrophobic substances in their cavities, thereby
increasing their apparent solubility. This approach has been successfully used with
Mycobacterium sp. [25], but seems to have toxic effects on yeast cells as well [17].
Biphasic systems consisting of an organic and an aqueous phase, represent a valuable tool for
the biotransformation of hydrophobic substrates [26–32]. The organic phase regulates the
substrate and product concentration in the aqueous phase, allowing high overall
concentrations of otherwise toxic hydrophobic substrates. Furthermore, such a system can be
used to avoid inhibition effects by substrate and/ or product and can help to guide equilibrium
reactions into the desired direction enhancing stereoselectivity. A crucial step is the choice of
the organic phase depending on different parameters, including toxic or inhibitory effects of
the solvent on the cells as well as substrate and product solubility [31, 32].
Our studies have been focused on Y. lipolytica which is naturally adapted to such two-phase
systems. Y. lipolytica is often isolated from biphasic environments like dairy products rich in
lipids [33] or oil-polluted soil and water [34, 35] . Applications of Y. lipolytica include
bioremediation of diesel-contaminated soils [36] and olive-mill waste water [37], protein
production on alkanes [38], and aroma compound formation from fatty acid derivatives [39].
When Y. lipolytica is grown on hydrophobic substrates, the cell surface is in direct contact
with substrate droplets and several modifications in cell structure occur, which are probably
related to hydrophobic substrate transport. These observations have led to the hypothesis that

Y. lipolytica manuscript Braun Andreas
- 7 -
hydrophobic substrates can migrate through channels via the plasma membrane to the ER [40,
41].
These unique properties of the alkane utilizing yeast Y. lipolytica together with the availability
of efficient genetic tools for this species underscore its potential for biotransformations in
biphasic systems. The yeast Yarrowia lipolytica has been revealed as one of the most suitable
host for heterologous protein production [42] and several CYP genes of mammalian e.g. from
Bos taurus and H. sapiens s. [20–22], plant e.g. green bell pepper [43], and fungal origin e.g.
Candida maltosa and Rhodotorula minuta [44, 45], have been expressed in this yeast so far.
In this study, we report the first example of functional co-expression of genes encoding the
important human liver CYPs CYP2D6 or CYP3A4 together with hCPR and intrinsic YlCPR
in Y. lipolytica and their use in biphasic whole-cell bioconversions aming at steroid oxidation
and as a model for the hydroxylation of other poorly soluble substrates.
Results and discussion
Cloning and expression of genes for human liver cytochrome P450s and CPRs
One of the most frequently studied bottlenecks in heterologous gene expression is the variable
codon-usage and -bias of different organisms. By exchanging rare codons with more
frequently used ones of the host, the expression of heterologous genes can be significantly
improved in some cases [46]. In some cases, however native genes provided better results
than codon optimized variants. In this study, we compared expression of wild-type and codon
optimized genes for CYP2D6, CYP3A4 and human CPR in Y. lipolytica.
Using Y. lipolytica, it is possible to create multicopy integration clones employing the
auxotrophic marker ura3 linked to a largely truncated and deficient promoter [47, 48]. This
approach previously allowed the human CYP1A1, YlCPR and bovine CYP17 gene
expression to be increased several fold [22, 49, 50].

Y. lipolytica manuscript Braun Andreas
- 8 -
In a similar approach, the genes encoding CYP2D6, CYP3A4, human cytochrome P450
reductase (hCPR) and Y. lipolytica cytochrome P450 reductase (YlCPR) were cloned and
ligated into (i) the integrative plasmid vector p64D-linker for selection of multicopy
transformants, as well as into (ii) p65D-linker promoting single copy integration. The
resulting series of expression vectors contained each of the two expression cassettes under the
control of the ICL1 promoter (pICL1D) and terminator (ICL1t), one for CYP and one for
CPR. Y. lipolytica H222-S4 was transformed with the resulting SacII (Fig. 1) linearized
plasmids.
Copy numbers of selected clones were verified by RT-PCR. Supposed single copy
transformants indeed showed one integrated copy, while multicopy transformants showed
between 10 and more than 40 integrated copies (Table 2) as determined by quantitative PCR,
which is in good accordance with previous results [20, 22, 47, 48, 51].
It is common knowledge that separating biomass production and the expression phase of
microbiologic cell cultures can be beneficial for heterologous protein production, both in
terms of a reduced metabolic burden and limitation of a potentially harmful toxic activity.
Therefore, Y. lipolytica was first grown in YNB medium with glucose as a sole carbon source
(YNBG). Upon depletion of glucose and a short starvation phase, heterologous protein
production in shake flasks was initiated by induction of the ICL1 promoter with addition of
ethanol. After a short lag phase, while switching from glucose to ethanol, a further increase in
biomass was observed (Fig. 2). Bufuralol and progesterone were used to assess CYP2D6 and
CYP3A4 activity, respectively. Already after 4 to 8 h of induction, Y. lipolytica cells
harboring CYP genes showed activity towards bufuralol or progesterone, the specific activity
did not further increase and remained constant for 70 h (Fig. 2). For practical reasons all
further experiments were carried out with cells harvested after 26 h of induction.

Y. lipolytica manuscript Braun Andreas
- 9 -
To confirm expression of heterologous cytochrome P450s, microsomal protein of each clone
sampled after 26 h of ethanol induction were analyzed by Western blotting. Bands of
CYP2D6 (~ 55 kDa) and CYP3A4 (~ 57 kDa) were detected at the correct sizes. No Western
blots were performed for CPR, since strong protein bands with the correct sizes for hCPR (~
75 kDa) and YlCPR (~ 85 kDa) were already detectable by Ponceau-staining of the blots for
multicopy transformants, indicating the high expression levels of CPR. (Fig. 3).
Human liver cytochromes P450 2D6 and 3A4 and human cytochrome P450 reductase (hCPR)
as well as Y. lipolytica cytochrome P450 reductase (YlCPR) were functionally expressed. The
codon optimized versions of either CYPs showed best activities in combination with wild-
type human CPR and wild-type Y. lipolytica CPR (data not shown). Therefore, these
combinations were used for Western blot analysis and further used throughout this study.
For both CYP2D6 and CYP3A4, the use of the p64D-derived multicopy integration vectors
led to a significant increase of expression (Fig. 3) and whole-cell CYP activity compared to
single copy integrants. CYP2D6 multicopy gene integration gave ~ 70 fold increase of
activity towards bufuralol, and multiple copies of the CYP3A4 coding sequence resulted in a
~ 50 fold increased activity towards progesterone (Fig. 4). These increase was similar to those
observed by overexpressing a CYP1A1 gene in the Y. lipolytica strain PO1d [22]. The highest
expression levels assessed by CO-spectra for human liver cytochrome P450 2D6 and 3A4
were 92.3 ± 9.2 and 60.9 ± 5.9 pmol per mg microsomal protein, respectively. No results from
CO spectra have been reported for CYP1A1 expression in Y. lipolytica. Expression levels in
the range of 90 and 51-250 pmol per mg microsomal protein have been reported for CYP2D6
and CYP3A4 in bakers yeast, respectively [12, 52, 53].

Y. lipolytica manuscript Braun Andreas
- 10 -
Coexpression of CYPs and CPRs
It has been shown that the coexpression of a functional CPR is important for optimal CYP
activity [54, 55]. In some cases the proteins of the native electron transfer chain can be
replaced by other proteins. For example, the adrenodoxin homologue of Schizosaccharomyces
pombe etp1fd was shown to be able to replace mammalian adrenodoxin and transfer electrons
from adrenodoxin reductase to CYP11B1 and CYP11B2 [56]. However, in most cases the
mammalian CPRs are more effective in supplying electrons to mammalian CYPs than other
CPRs [57]. This suggests that the intrinsic yeast CPRs may be a limiting factor in the
heterologous expression and application of mammalian CYPs in yeast. Therefore, we
coexpressed not only the endogenous Y. lipolytica CPR but also the human CPR.
P450 reductase activity measured as NADPH cytochrome c reductase activity was detected in
all clones expressing either human CPR or Y. lipolytica CPR, while a control strain
transformed with the empty vector showed only low endogenous CPR activity. The multicopy
effect described for the hydroxylation activity was also observed for the CPR activity towards
cytochrome c (Fig. 4).
Multicopy transformants YL11 and YL18 over-expressing the endogenous Y. lipolytica CPR
showed 7-fold or 40-fold higher activity towards cytochrome c compared to multicopy
transformants Yl21 and Yl22 over-expressing the human CPR, respectively. This may be due
to a higher affinity of the Y. lipolytica CPR to cytochrome c as compared to the human CPR.
However, the more likely reason might be the higher YlCPR expression level, as indicated by
the more intense band on the Western blot when compared to the human CPR (Fig. 3).
Despite the higher activity of over-expressed YlCPR towards cytochrome c, YlCPR
coexpression did yield much lower CYP activities than achieved with clones coexpressing the
human CPR (Fig. 4). This indicates that coupling of the human CYPs with Y. lipolytica CPR,
although possible, is inferior to coupling with human CPR. This is in accordance with earlier

Y. lipolytica manuscript Braun Andreas
- 11 -
results suggesting that mammalian CPR is more effective in transporting electrons to
mammalian CYPs as compared to alternative CPRs [3, 56, 58].
Determination of operation parameters
Resting and growing whole-cells can be employed as catalysts for biotransformations.
Growing cells are considered more favorable than resting-cells when expressing a protein
with low stability, since they permit sustained protein expression during biotransformation.
However, resting-cells have the advantage that the desired reaction can be investigated
independently of growth phenomena and at higher cell densities. Furthermore,
biotransformation conditions can be chosen independently from growth conditions
minimizing side reactions and allowing identification of potential limitations [59].
Differences between growing and resting cells on bufuralol and protesterone hydroxylation
rates were investigated for Y. lipolytica harboring hCPR combined with CYP2D6 and
CYP3A4, respectively. The hydroxylation rates were determined as product formation rates
measuring the concentrations of hydroxybufuralol or hydroxyprogesterone, respectively.
Resting-cells showed significantly higher hydroxylation rates than growing cells (data shown
in Additional File 1). Therefore, resting-cells were used further in this study.
Both CYP2D6 and CYP3A4 have also been tested for their ability to hydroxylate
testosterone, 17-alpha-methyltestosterone and progesterone. CYP2D6 usually prefers
substrates containing a basic amine function [3]. Nevertheless, some studies have shown that
CYP2D6 is also involved in steroid hydroxylation [60, 61]. Both recombinant human liver
cytochrome P450 whole-cell Yarrowia catalysts hydroxylated testosterone, 17alpha-
methyltestosterone and progesterone (Fig. 5). Although expression levels have been lower for
CYP3A4 compared to CYP2D6, Y. lipolytica cells harboring CYP3A4 and hCPR in all cases
showed the expected several-fold higher activity towards steroids, with a preference towards
testosterone. The untransformed control strain YL23 showed no formation of any
Y. lipolytica manuscript Braun Andreas
- 12 -
hydroxylated steroid. However, Y. lipolytica is oxidizing the hydroxy function of testosterone
at position 17 to the corresponding keto-function giving androstenedione [62, 63]. Such
undesired side reactions may hamper the reliability of activity measurements. Therefore,
testosterone was excluded and progesterone, another known standard substrate for CYP3A4,
was used for bioconversion studies. Furthermore, progesterone was used to investigate the
potential of two-liquid biphasic systems and Y. lipolytica catalysts for more efficient whole-
cell bioconversions.
Whole-cell conversion in biphasic systems
Most of the typical human liver CYP substrates are very hydrophobic. Hence, one main
function of CYPs is to incorporate a hydroxyl function to render the compound more water
soluble and to activate it for further metabolization. Alkane-utilizing yeasts, such as Y.
lipolytica, can excrete surfactants and adjust their cell surface and cell wall to directly interact
with water immiscible organic substrates, like alkanes, long-chain fatty acids and
triglycerides, facilitating their uptake [40, 41, 64–67]. These properties as well as metabolic
adaptations and the subcellular organization of the alkane-utilizing yeast cell are obviously
supporting the high in vivo turnover numbers observed for the host-own P450s of the CYP52
family involved in primary alkane and fatty acid oxidation [40, 41, 67–69].
In this study, we investigated whether the unique properties of Y. lipolytica will support also
the function of heterologously expressed CYPs in this yeast and will give this organism an
advantage in CYP-catalyzed bioconversion of hydrophobic substrates dissolved in organic
solvents. A spectrum of 10 water immiscible organic solvents ranging from (i) solvents with
known good solvent properties (toluene, 1-octanol), (ii) inert fluids (bis-ethyl hexyl phthalate,
dibutyl phthalate) to (iii) potential carbon sources (1-decanol, 1-dodecanol, methyl laureate,
ethyl oleate, n-decane, n-dodecane) [70, 71] were chosen. The solvents toluene and 1-octanol,
which are known to be toxic for microorganisms, enabled the highest solubility of steroids.
Indeed, they showed the expected toxic effect on Y. lipolytica cells, too. Two solvents, known

Y. lipolytica manuscript Braun Andreas
- 13 -
to be utilized as a carbon source by Y. lipolytica, n-decane and n-dodecane, conferred very
low solubility of progesterone and were therefore excluded from further analyses. 1-decanol,
1-dodecanol, methyl laureate, ethyl oleate, bisethylhexylphthalate (BEHP) and dibutyl
phthalate (DBP) had no obvious toxic effects and enabled reasonable solubility of steroids
(Additional File 2).
As mentioned before, exposing Y. lipolytica cells to water immiscible organic solvents
triggers changes in cell structure resulting in increased hydrophobicity [66]. Even when the
organic solvent is not utilized by Y. lipolytica, morphological changes of the cells
immediately become obvious. The cell suspensions become less homogenous and cell
agglomerates form. It has been reported that significant changes to the cell surface (increased
cell wall hydrophobicity, occurrence of protrusions and special channel like structures) are
important for the cells to attach to the hydrophobic substrates as well as for the uptake of
these substrates [40, 41, 66, 72, 73]. Y. lipolytica was observed to adsorb to the organic
solvent droplets of DBP and ethyl oleate, similarly to the previously observed adsorption to
hexadecane when cells are grown in media containing that alkane as sole carbon source [40,
41].
Based on the experiences with aqueous whole-cell bioconversions, biotransformations in
biphasic systems also were performed with resting-cells. Cells were taken after 26 h of
ethanol induction and resuspended in 100 mM potassium phosphate, pH 7.4, containing 1%
w/v glucose to a biomass concentration of ~ 12 g/L CDW. The cell suspension was then
mixed with an equal volume of the organic phase containing 20 mM of progesterone.
Conversions were performed at 30°C over night while shaking. All data were calculated with
respect to the aqueous phase volume. Based on other reported experiences [24] for conversion
in aqueous systems steroids were added above their solubility limit as DMSO stock solution
resulting in precipitation of most of the hydrophobic substrate. Surprisingly, most of the

Y. lipolytica manuscript Braun Andreas
- 14 -
tested water immiscible organic solvents led to a decrease in conversion rate of at least 50%
compared to the pure aqueous system where just the organic solvent of the pre-solubilized
substrate was added. Only ethyl oleate enabled a slightly increased conversion rate (Fig. 6).
Thus, ethyl oleate was identified as the most promising water immiscible organic solvent for
the biphasic conversion of progesterone in shake flask cultures. Comparing one utilizable and
one non degradable organic solvent, ethyl oleate and dibutyl phthalate [Mauersberger et al.
unpublished results][74], respectively, were chosen to perform bioconversions under more
controlled conditions in bioreactors.
Two-liquid phase bioreactor process
Biphasic and aqueous bioconversions of progesterone with recombinant Y. lipolytica catalysts
harboring CYP3A4 and hCPR have been performed in a stirred tank bioreactor. For biomass
production, a standard batch was run for 16 h (phase I) followed by a fed-batch run for 10 h at
a constant growth rate of µ = 0.18 /h (phase II). Subsequently CYP3A4 and hCPR production
was induced by a low, linearly increasing feed of ethanol over 36 h (phase III). Samples were
taken at different time points and specific 6-beta-hydroxyprogesterone formation was
determined in test tubes. Interestingly, a low CYP activity was already observed during fed-
batch (phase II) on glucose. This reflects a derepression of the pICL1 promoter under
conditions of glucose limited growth or glucose depletion. The highest specific 6-beta-
hydroxyprogesterone activity of 22 mU/g CDW was reached after roughly 12 h of ethanol-
induction and remained constant during the induction time. However, the highest volumetric
progesterone hydroxylation rate of 1 U/L (calculated from the specific activity) was reached
after roughly 24 h of induction (Fig. 7). Cells were harvested after 36 h of induction and
resuspended in glucose containing potassium phosphate buffer to a biomass concentration of
~ 25 g/L CDW. Aqueous and biphasic bioconversions in 1.5 L stirred tank reactors used the
same cell suspension as starting material. Glucose at a low constant feed of 0.007 g/h/g CDW
Y. lipolytica manuscript Braun Andreas
- 15 -
compared to exponential feed of 1.05 g/h/g CDW during fed batch, was provided as energy
source for cell maintenance and regeneration of cofactors.
While initially, i.e. during the first hour, both biphasic systems formed less
hydroxyprogesterone than the aqueous system, as of 2 h of conversion the ethyl oleate based
biphasic system provided the highest conversion rates (Fig. 8). However, after 6 h the product
formation rate of all systems started to drop significantly. While the product formation of the
aqueous system came even nearly to a halt after 6 h. The product formation of both biphasic
systems continued at a reduced rate throughout the whole biotransformation experiment (Fig.
8).
In the beginning of the bioconversion of the different systems the substrate is probably taken
up directly from the aqueous phase. The discrepancy in the hydroxylation rate of the different
bioconversion systems in this early phase of conversion, is likely due to the difference in
availability of progesterone in the aqueous phase. Indeed, 8 times and 42 times higher
concentrations of ethyl oleate and dibutyl phthalate, respectively were measured in the
aqueous system compared to the aqueous phases of the respective biphasic system. The
available substrate concentrations in the aqueous phases stayed more or less constant during
the whole bioconversion process excluding the influence of partitioning of substrate on
observed variations of bioconversion rates during the conversion process. Y. lipolytica cells
most probably need some time to adjust to the new hydrophobic environment. This seems to
be significantly faster for the naturally occurring utilizable ethyl oleate giving much faster
product formation compared to the inert non degradable dibutylphthalate.The generally lower
conversion rates in biphasic systems might be explained by lower substrate concentration in
the aqueous phase in presence of organic solvents.

Y. lipolytica manuscript Braun Andreas
- 16 -
Subsequently, the uptake of bioconversion substrate may be achieved in different ways; either
Y. lipolytica cells continue to take up the low concentrations of substrate from the aqueous
phase, or a direct uptake of substrate from the organic phase takes place. Although, the ethyl
oleate might be cleaved by secreted lipases, the most reasonable explanation would be the co-
uptake of ethyl oleate and dissolved steroid, similarly to the alkane uptake. In such a case, the
conversion rate might be limited by the uptake rate of the organic phase.
Although dibuthylphtalate was shown to be a very well suitable substrate for the conversion
of hydrophobic substrates in biphasic system using another alkane utilizing yeast [75], in our
study dibutyl phthalate as second phase enabled significantly lower conversion rates
compared to ethyl oleate.
After approximately 1.5 and 43 h, the overall product formation of both, the ethyl oleate and
DBP biphasic systems, respectively, exceed the aqueous system, with an ongoing catalyst
activity within the evaluated period of 100 h of bioconversion. However, it was observed that
surprisingly the use of DBP as organic phase also lead to a significant change in the product
profile formed from progesterone, while ethyl oleate did not. Already after 2 h there is a
discrepancy in the hydroxylation pattern in the dibutyl phthalate biphasic system, compared to
the aqueous and the ethyl oleate biphasic system. One might speculate that a different extent
of emulsification and transport effects in different solvent systems might contribute to this
effect. However no experiments were performed to proof this hypothesis. At the beginning, 6-
beta-hydroxylation is dominant. However, the hydroxylase specificity is shifted to the
formation of an unknown hydroxy product. After roughly 4 hours, the hydroxylase rate
towards the unknown position exceeds the rate towards the 6-beta-position. At the end of the
two-liquid phase bioreactor experiment the hydroxylation pattern is considerable shifted. The
unknown product makes up 65% of the total product compared to only traces in aqueous
system. By comparing the unknown product to in-house available hydroxyprogesterone
standards 6-beta, 11-alpha, 16-alpha and 17-alpha hydroxyprogesterone, we were not able to

Y. lipolytica manuscript Braun Andreas
- 17 -
identify the new product. Unfortunately the concentration was not high enough to identify the
product by other means e.g. NMR.
Oleate esters naturally occur in the membranes of Y. lipolytica. They are incorporated into
lipids or degraded as energy source and might show less influence on cellular membranes or
membrane bound proteins than dibutyl phthalate which is not degraded by Y. lipolytica.
Furthermore, DBP is more similar to steroids and may enter the binding pocket of CYP3A4
which might explain the distorted hydroxylation patterns.
Conclusion
The Y. lipolytica strain H222-S4 was engineered to express the human liver CYP2D6 and
CYP3A4. Co-expressing human cytochrome P450 reductase as well as increasing the copy
numbers of both genes improved the catalytic performance of these whole-cell biocatalysts.
However the human CYP reductase was the more efficient redox partner. Our results support
previous findings, stating that not only human CYP3A4 but to some extent also CYP2D6 is
able to hydroxylate steroid molecules such as testosterone, 17g-methyltestosterone and
progesterone which are non-typical CYP2D6 substrates.
By using bio-degradable ethyl oleate in a two-liquid biphasic setup instead of aqueous
systems, we could show that Y. lipolytica cells harboring human CYP3A4 and human CPR
can be applied as a whole-cell system with increased biocatalytic stability. This might be
caused by different cellular adaptation mechanisms to the organic compounds such as cell
wall adaptation or by different transport mechanisms. A systems biology approach might help
to clarify these issues, which was out of scope of this study. As expected the alkane-
assimilating yeast Yarrowia lipolytica, coupled with above described expression strategies,
demonstrated to be promising tools for biotransformations of hydrophobic substrates in two-
liquid biphasic systems. Especially organic solvents which can be efficiently taken up and/or
metabolized by the cell might enable more efficient bioconversion as compared to aqueous

Y. lipolytica manuscript Braun Andreas
- 18 -
systems and even enable simple, more stable, continuous or at least high yield long time
processes.
Materials and Methods
Chemicals and reagents
Unless stated otherwise, all chemicals were purchased from BD Bioscience (USA), Sigma–
Aldrich (Germany), Carl Roth GmbH (Germany), J.T. Baker (Netherlands) and Roche
Diagnostics (Germany) at the highest purity available. Oligonucleotides were purchased from
IDT (Belgium).
Strains, media and culture conditions
E. coli Top10 or E. coli Top10F’ (Invitrogen Corp.) strains were used as host for recombinant
plasmid propagation. Cells were grown on Luria-Bertani Agar (Carl Roth GmbH)
supplemented with 100 µg/mL ampicillin at 37°C. DNA isolation and purification was done
using Fermentas Miniprep kit or Promega Wizard SV Gel isolation and PCR cleanup kit.
In this study, the Y. lipolytica strain H222-S4 (MATA ura3-302) [76] was used as recipient
strain for integration of plasmids described in Table 1. The Y. lipolytica strains were grown at
28°C on solid complete medium YPD or on minimal medium YNB (Difco, BD Biosciences,
USA) supplemented with 2% w/v glucose (YNBD) and 15 g/L agar [48]. Transformants were
selected on solid YNBD (15 g/l agar). Cultivation in liquid media was performed with 200 or
250 mL of buffered minimal YNB medium supplemented with 0.6% w/v glucose and 200
mM potassium phosphate buffer, pH 6.5, in 1 L Erlenmeyer flasks at 28°C.
All seed and inoculum cultures were prepared using buffered minimal medium YNB (Difco)
supplemented with 1% w/v glucose and 200 mM potassium phosphate, pH 6.5. The defined
mineral medium used for the main fed-batch cultures contained per liter
6.0 g (NH4)2SO4, 2.0 g KH2PO4, 0.24 g K2HPO4, 1.4 g MgSO4 x 7 H2O, 0.6 g NaCl, 0.58 g
NaNO3, 0.38 g CaCl2, 1 mL PTM trace element solution , i.e. 0.5 g/L H3BO3, 0.04 g/L CuSO4

Y. lipolytica manuscript Braun Andreas
- 19 -
x 5 H2O, 0.1 g/L KI, 0.303 g/L MnSO4 x 1 H2O, 0.2 g/L Na2MoO4 x 2 H2O, 0.4 g/L ZnSO4 x
7 H2O, 0.2 mL of ethanolic iron chloride solution i.e. 30 g/L FeCl3 x 6 H2O, 1 mL thiamin
hydrochloride solution i.e. 4 g /L and 16.5 g glucose monohydrate.
The feed solution contained 550 g glucose monohydrate per liter, 3 mL PTM trace element
solution, 0.2 mL ethanolic iron chloride solution and 3 mL thiamin hydrochloride solution.
For induction of the pICL1-controlled CYP expression, pure ethanol was used as feed
solution.
Genes and vectors
The integrative multicopy and single copy Y. lipolytica vectors p64ICL1, p65ICL1 [51, 77,
78] were adapted by replacing the ICL1 intron and gene with a small linker containing SpeI
and AscI restriction sites and used for cloning and co-expressing CYPs and CPRs. The vector
p67RYL was used to isolate the Y. lipolytica CPR gene which is essentially the wild-type
gene but alanine at position 2 was chanced to proline [48, 79, 80]. pNMTS-CYP-OR-spe and
pBdpTrcRed-3A4(192v)wtA305S were used to isolate codon optimized human CYP3A4 and
codon optimized human CPR gene, respectively. Both were optimized for expression in yeast,
i.e. hybrid optimized for P. pastoris , S. pombe and S. cerevisiae (Weis et al., unpublished).
Wild-type human CYP2D6 (ID30915411), wild-type human CYP3A4 (ID7262313) and wild-
type human CPR (ID3882411) genes were isolated from cDNA clones (BioCat GmbH,
Germany).
For the codon optimization of the CYP2D6 gene, the free software “Gene Designer V1.1.4.1”
(DNA 2.0, USA) was used to design a gene optimized for expression in yeast, i.e. hybrid
optimized for P. pastoris and Y. lipolytica, and then synthesized.
Vectors constructions
For vector construction, standard molecular biology procedures were performed [81]. The
multicopy vector p64D-linker and single copy vector p65D-linker were obtained by replacing

Y. lipolytica manuscript Braun Andreas
- 20 -
the isocitric lyase 1 (ICL1) gene and intron with a linker containing SpeI and AscI site, in the
parental vectors p64ICL1 and p65ICL1, respectively. Both vectors contain the URA3
selection marker. The p64-vector variants contain a deficient, truncated ura3d4 promoter as
multicopy selection marker, which gives only sufficient amounts of gene product when
several copies (at least 8-10) of the vector are integrated into the genome. This allows for
selection of clones with multicopy integrations or gene multiplications. The p65-vector
variants contain the ura3d1 promoter sufficient for single copy selection [47, 48].
Co-expression of single and multicopy vectors with combinations of different CPRs and
cytochrome P450s were obtained by cloning overlap extension PCR products into the SpeI
and AscI sites (Fig. 1). Each gene was placed under the control of the ICL1 promoter [82].
Shortly; each fragment, i.e. CPR, ICL1 promoter and terminator, CYP was amplified via PCR
using primers with overhangs homologous to adjoining parts. Overlap extension PCR was
done in two steps. All fragments were added to the first reaction mix PCR was run for 20
cycles using Phusion Polymerase (NEB). Then flanking primers were added to the reaction
which was run for another 25 cycles to amplify the overlap construct. The fuel-length PCR
construct was then cloned into pJet1.2 using the CloneJET™ PCR Cloning Kit (Fermentas)
and verified by sequencing (LGC genomics, Germany). Confirmed inserts were cloned with
SpeI/AscI into p64D-linker or p65D-linker, respectively, using T4 DNA ligase (fermentas)
according to standard procedure.
Transformation into Y. lipolytica
Transformation of Y. lipolytica H222-S4 was performed by the lithium acetate method [38] or
by electroporation according to a condensed protocol [83]. All vectors contained the rDNA
(ribosomal DNA fragment) of Y. lipolytica as integration site and were digested by SacII
before transformation. The transformants were selected for Ura+ phenotype on minimal
YNBD medium (2% w/v glucose). Colonies appearing after 2-3 days (single copy) and 2-3
weeks (multicopy) were transferred onto fresh plates and sub-cultured. The resulting

Y. lipolytica manuscript Braun Andreas
- 21 -
prototrophic recombinant Y. lipolytica strains used for CYP and CPR expression and steroid
biotransformation studies and their estimated integrated vector copies are given in Table 2.
Real-time PCR (RT-PCR) was used to estimate the copy number of the integrated expression
cassettes. Genomic DNA was isolated from Y. lipolytica transformants grown overnight in
minimal YNB medium supplemented with 1% w/v glucose (YNBD) [84]. The ICL1 set of
primers, ICL1-fw (5ガ-CCA GCA GCC CGA GAT TGA-3ガ) and ICL1-rv (5ガ-ACT CAG CAC
CGG ACC ACT TC-3ガ), anneal to the single copy of the endogenous Y. lipolytica ICL1 gene
within the chromosome. The Amp primers, Amp-fw (5ガ-GCT ATG TGG CGC GGT ATT
ATC-3ガ) and Amp-rv (5ガ-GTA TGC GGC GAC CGA GTT-3ガ), target the ampR marker gene
present on the integrated vectors. Y. lipolytica YL23 was used as a control organism with a
single copy of both the ICL1 and ampR target sequences. Reaction mixes of 18 たl consisted of
100 pg template DNA, Power SYBR Green Master Mix (Applied Biosystems, CA, USA), and
250 nM of each primer. Each reaction was run in duplicate in an ABI PRISM 7300 Real Time
PCR machine (Applied Biosystems, CA, USA). The profile used was, 95°C for 10 min,
fallowed by 40 cycles of (95°C for 15 s, 60°C for 60 s). Data collection was done after each
60°C step. A melting curve analysis was conducted after the amplification, heating from 45°C
to 95°C. Analysis was done using Sequence Detection Software SDS (Applied Biosystems,
version 1.2). Average Ct values of the 2 profiles (ICL1 and Amp) were used to estimate the
relative copy number for the selected transformant [85].

Y. lipolytica manuscript Braun Andreas
- 22 -
CPR and CYP induction
Y. lipolytica clones were grown in YNBG (1% w/v glucose) overnight at 28°C and 220 rpm.
Exponentially growing cells were taken to inoculate the YNBG (0.6% w/v glucose) main
culture to a starting OD600 of ~ 0.5. The main culture was grown at 28°C and 220 rpm for 17 –
20 h until glucose was fully consumed. After additional 2-4 h, the expression of CPR and
CYP under the control of the ICL1 promoter was induced by adding ethanol to a final
concentration of 1% v/v. Additional 1% v/v ethanol was added after ~ 8 h and ~ 20 h. After
24 h the cells were harvested by centrifugation and further used for either whole-cell
biotransformation assays or microsome isolation.
Isolation of microsomes
Yeast cells were harvested by centrifugation at 2 000 g for 10 min and washed twice with
water. 4-6 g of cells were resuspended in ~ 20 ml disruption buffer (50 mM potassium
phosphate, pH 7.9, containing protease inhibitor 1 mM PMSF, 5% w/w glycerol, 1mM EDTA
and 2 mM DTT). A crude cell lysate was obtained by mechanical cell disruption using
“Merkenschlager homogenization” [86]. After cell disruption cell debris was removed by
centrifugation at 10 000 g and 4°C for 10 min. To pellet the microsomal fraction, the
supernatant was centrifuged at 100 000 g and 4°C for 1 h. The membrane pellet was
resuspended in disruption buffer to ~ 1 mg pellet per mL using a Dounce homogenizer and
pestle.
SDS-PAGE and Western blot analyses
Total protein content of the microsomal preparation was determined by Bradford using the
biorad protein assay kit (Bio-Rad, Germany) before separating the proteins by using the
NuPAGE® electrophoresis system (Invitrogen Ltd). Samples containing ~ 20 µg total protein
in 15- 25 µL loading buffer without reducing agent were incubated at RT for at least 10 min.
For separation, a NuPAGE Novex 4-12% Bis-Tris-Gel and MOPS buffer were used. The

Y. lipolytica manuscript Braun Andreas
- 23 -
PageRuler Prestained Protein Ladder (Fermentas) was used as molecular mass calibration
standard.
Western blotting was done according to the protocol provided with the MAB-2D6 and WB-
3A4 kits (BD Gentest™). On completion of PAGE, the proteins were transferred
electrophoretically onto nitrocellulose membrane (GE Healthcare Europe GmbH) in a wet
blotting system. Then the membranes were blocked at room temperature overnight with whey
powder. The blot was developed by incubation with NBT/BCIP at RT for 5 min.
NADPH cytochrome c reductase (NCR) activity
The cytochrome P450 reductase-catalysed reduction of bovine heart cytochrome c was
measured at 550 nm essentially as described [70]. A 300 µM cytochrome c solution in 50 mM
Tris-HCl buffer, pH 7.5, was mixed with 2 to 80 µg of microsomal protein and made up with
Tris-HCl to 650 µL. Fifty µL of 50 mM KCN solution, pH 7.7, were added to mask
cytochrome c oxidase activity. Reaction was started by adding 50 µL of 1.5 mM NADPH.
Activities were measured on a UV/Vis DU 800 spectrophotometer (Beckman Coulter, USA)
and calculated by using = 21 mM-1
cm-1
as molar extinction coefficient of cytochrome c.
Quantification of cytochrome P450
CYP concentrations in the isolated microsomes were determined by reduced carbon
monoxide spectra [87]. Six to 12 mg of microsomal protein were added to 100 mM sodium
phospate buffer, pH 7.4, containing 20% w/w glycerol to an end volume of 2 mL. One
hundred µL 200 mM KCN, pH 7.7, were added to mask the spectral interference of
cytochrome oxidase (negative absorption at 445 nm) with the CYP peak at 450 nm in the CO
difference spectrum [49]. A few grains sodium dithionite were added to reduce the CYP. The
mixture was transferred into polystyrene cuvettes (Sarstedt, Germany) and a reference
spectrum was recorded from 400 to 500 nm (Specord 205 UV/Visible spectrophotometer,
Y. lipolytica manuscript Braun Andreas
- 24 -
Analytik Jena, Germany). The mixture was then bubbled with carbon monoxide for 60 s, and
the spectrum was measured repeatedly several times.
The CYP concentration was calculated using a molar extinction coefficient of 450nm = 91 mM-
1 cm
-1.
CYP activity of microsomes and whole-cells
In vitro substrate conversion with microsomes was performed essentially as described in [88].
Twenty five µM bufuralol or 2 mM steroid (in DMSO) e.g. progesterone, 17alpha-
methyltestosterone or testosterone, and 1 mM NADPH were added to 100 mM possium
phosphate buffer, pH 7.4, and pre-incubated for 2-3 min at 37°C. The reaction was started by
adding 20 µL microsomal preparation (0.6 to 0.8 mg total protein) to give a total volume of
200 µL. The reaction mixture was incubated at 37°C for 20 min (bufuralol) or 1 h (steroid)
while shaking and stopped by adding 20 µL 70% perchloric acid. After 20 min of incubation
on ice, prednisolone (in DMSO) was added to a final concentration of 50 µM as internal
standard and the mixture centrifuged for 10 min at 16 100 g. One hundred µL supernatant
were transferred to a fresh microtiter plate and stored at -20°C.
For whole-cell conversions, yeast cultures were spun at 2000 g for 15 min and the cell pellets
were resuspended in 100 mM potassium phosphate buffer, pH 7.4, containing 1% w/v glucose
to a biomass concentration of ~ 10 g/L CDW. Stock solutions of substrate were added to 200
(eppendorf tube) or 1000 µL (PYREX tubes) of cell suspension. Bufuralol was added as 1
mM stock solution to cell suspension yielding a final concentration of 25 µM. Steroid e.g.
progesterone, 17alpha-methyltestosterone or testosterone was added as 100 mM stock
solution in DMSO to cell suspension yielding a final concentration of 2 mM. Whole-cell
conversion of bufuralol and progesterone was performed at 30°C for 20 – 60 min or several
hours while shaking, respectively. Then prednisolone (in DMSO) was added to a final
concentration of 50 µM as internal and the reaction was stopped by centrifugation at 16 100 g
for 10 min. Supernatants were transferred to fresh reaction tubes and stored at -20°C.
Y. lipolytica manuscript Braun Andreas
- 25 -
CYP activity in whole-cell biphasic systems
Twenty to fifty mL yeast cultures were centrifuged at 2 000 g for 15 min and the pellet was
resuspended either in induction media supplemented with 1% v/v ethanol or in 100 mM
potassium phosphate buffer, pH 7.4, containing 1% w/v glucose to a biomass concentration of
~ 10 g/L CDW. An equal volume of organic solvent containing 20 mM progesterone, was
added to 1000 µL of cell suspension. The biphasic whole-cell conversions were performed in
10 mL PYREX tubes at 30°C while shaking at 320 rpm for several hours. Reactions were
stopped at desired time points and the two phases were separated by centrifugation at 16 100
g for 10 min. Two to five hundred µL aqueous and organic phase were transferred to fresh
reaction tube or GC-vial, respectively. Prednisolone (in DMSO) was added to a final
concentration of 50 µM as internal standard. An equal volume of isopropanol was added to
the organic phase, and samples stored at -20°C.
Fed-batch cultivation in bioreactors
Cultivation process was performed in a 5 L stirred tank bioreactor (Biostat C, Sartorius,
Germany) The initial batch working volume was 3.5 L (minimal mineral salt medium M with
initial 1.5% w/v glucose) and was increased to 4 L at the time of harvesting. The set-points of
all control variables were maintained during the entire process, thus, the cultivations were
accomplished under the conditions of constant temperature of 28°C, 10 L/min air flow (i.e.
without any oxygen enrichment), 1500 rpm agitation, pH 5.5. Automated control of the pH
was achieved by using 25% ammonia and 25% phosphoric acid solutions. The process
consisted of the biomass growth phase on glucose, i.e. batch and exponential fed-batch
cultures, and the expression phase on ethanol with linear feed addition. The cultivation started
at time 0 h with a batch (1.5% w/v glucose) during which the pO2 value continuously
decreased and the base consumption increased, i.e. no control of the pO2 set-point was
applied. After 14–16 h, the pO2 increased rapidly and base consumption stopped due to
glucose depletion. At this point the exponential addition of glucose feed solution was started
Y. lipolytica manuscript Braun Andreas
- 26 -
and continued over 10 h according to the function f(t)=1.05*e0.18*t
in grams of glucose per
hour. During the subsequent production phase, 0.5% v/v ethanol was maintained for 34-36 h
in accordance with the function f(t)=1.05*e0.002*t
in grams of ethanol per hour. Biomass
concentration was determined by measuring cell dry weight (CDW) e.g. 2 mL cell suspension
was centrifuged at 16 000 g for 10 min. Supernatant was discarded and cell pellet dried at 100
°C till constant weight. Cells where harvested by centrifugation at RT and 2 000 g for 15 min
and cell pellets were resuspended in 100 mM potassium phosphate buffer, pH 7.4,
supplemented with 0.5% w/v glucose as energy source to a desired biomass concentration of
~ 25 g/L CDW.
Resting-cell biotransformation in bioreactor
Biotransformations were performed in a 1.5 L stirred tank bioreactor (DASGIP Parallel
Bioreactor Systems, DASGIP BioTools, Germany). The batch working volume was 600 mL
(phosphate buffer with glucose and ethanol-induced Y. lipolytica cells as indicated above) for
aqueous phase system and 450 mL aqueous phase plus 150 mL organic phase for biphasic
systems. The set-points of all control variables were maintained during the entire
biotransformation at 30°C, 1 NL/min airflow (i.e. without any oxygen enrichment), 500 rpm
agitation and pH 7.4.
The transformations began at 0 h by adding 100 mM progesterone stock solution (in DMSO)
to a final concentration of 2 mM or 150 mL water immiscible organic solvent containing 20
mM progesterone. Glucose was provided at a low constant rate of 0.17 g h-1
over the entire
biotransformation time of 90 hour. Samples were taken at different time points and the
reaction was stopped removing the cells by centrifugation at 16 100 g for 10 min. Aqueous
and organic phase samples were withdrawn as described above.

Y. lipolytica manuscript Braun Andreas
- 27 -
Analysis by HPLC-MS
Bufuralol and metabolites were separated by HPLC (1200 series, Agilent technologies, USA)
with a XDB-C18, 1.8 µm, 4.6 x 50 mm column (Agilent technologies, USA) using a gradient
based on 10 mM ammonium acetate, pH 5.5, and acetonitrile at a flow rate of 0.9 mL/min.
Metabolites were detected using MSD SL detector equipped with an electron spray ionization
(ESI) unit (Agilent technologies, USA).
Hydroxylated products were quantified by external calibration using reference metabolites or
metabolite derivates.
Steroid metabolites were separated by HPLC (1200 series, Agilent technologies, USA) with a
Chromolith RP-C18e, 5 µm, 4.6 x 100 mm column (MERCK KGaA, Germany) using a
gradient based on water and acetonitrile, both acidified with 0.1% v/v acetic acid, at a flow
rate of 1 mL/min.

Y. lipolytica manuscript Braun Andreas
- 28 -
List of abbreviations:
Yl, Yarrowia lipolytica; H, human; CPR, cytochrome P450 reductase; CYP, cytochrome
P450; DBP, dibuthylphtalat; EO, ethyl oleate; CDW, cell dry weight; NCR, NADPH
cytochrome c reductase; ICL1, isocitric lyase 1; sc, single copy; mc, multicopy.
Competing interests
The authors declare that they have no competing interests.
Author’s contributions
AG, SM, and AG drafted the outline of the expression experiments. BB, AS and AG drafted
the outline of the two-phase system and fermentation experiments. SM helped with the
selection of expression vectors, strains and cultivation conditions. AB and GM carried out the
experiments and analyzed the data. AB wrote the paper which was later revised and corrected
by AG and BB. All authors read and approved the final manuscript.
Acknowledgement
We are indebted to Mr. Harald Pichler and Mr. Andrea Camattari for carefully reviewing the
article and giving many useful suggestions and to Mrs. Anna-Maria Hatzl for excellent
technical support. This work was supported by the EU-FP7 project OXYGREEN (EC Grant
212281) and by the Austrian Ministry of Science and Research.

Y. lipolytica manuscript Braun Andreas
- 29 -
Literature
1. Danielson PB: The cytochrome P450 superfamily: biochemistry, evolution and drug
metabolism in humans. Curr Drug Metab 2002, 3:561-97.
2. Hannemann F, Bichet A, Ewen KM, Bernhardt R: Cytochrome P450 systems--biological
variations of electron transport chains. Biochim Biophys Acta 2007, 1770:330-44.
3. Crespi CL, Miller VP: The use of heterologously expressed drug metabolizing enzymes-
state of the art and prospects for the future. Pharmacol Ther 1999, 84:121-31.
4. Wikvall K: Cytochrome P450 enzymes in the bioactivation of vitamin D to its
hormonal form (review). Int J Mol Med. 2001, 7:201-9.
5. Spatzenegger M, Jaeger W: Clinical importance of hepatic cytochrome P450 in drug
metabolism. Drug Metab Rev 1995, 27:397-417.
6. Langenbach R, Smith PB, Crespi C: Recombinant DNA approaches for the
development of metabolic systems used in in vitro toxicology. Mutat Res 1992, 277:251-
75.
7. Asseffa A, Smith SJ, Nagata K, Gillette J, Gelboin HV, Gonzalez FJ: Novel exogenous
heme-dependent expression of mammalian cytochrome P450 using baculovirus. Arch
Biochem Biophys 1989, 274:481-90.
8. Oeda K, Sakaki T, Ohkawa H: Expression of rat liver cytochrome P-450MC cDNA in
Saccharomyces cerevisiae. DNA 1985, 4:203-10.
9. Sakaki T, Shibata M, Yabusaki Y, Murakami H, Ohkawa H: Expression of bovine
cytochrome P450c17 cDNA in Saccharomyces cerevisiae. DNA , 8:409-18.

Y. lipolytica manuscript Braun Andreas
- 30 -
10. Kalsotra A, Turman CM, Kikuta Y, Strobel HW: Expression and characterization of
human cytochrome P450 4F11: Putative role in the metabolism of therapeutic drugs and
eicosanoids. Toxicol Appl Pharmacol 2004, 199:295-304.
11. Rao KNP, Suman SK, Kiran YR, Kuanr AR, Gupta AK, Bhalla K, Kumar V, Kundu P,
Arora K, Soni R: Co-expression of Recombinant Human CYP2C9 with Human
Cytochrome P450 Reductase in Protease Deficient S. cerevisiae Strain at a Higher Scale
Yields an Enzyme of Higher Specific Activity. Drug Metab Lett 2010.
12. Krynetski EY, Drutsa VL, Kovaleva IE, Luzikov VN: High yield expression of
functionally active human liver CYP2D6 in yeast cells. Pharmacogenetics 1995, 5:103-9.
13. Urban P, Cullin C, Pompon D: Maximizing the expression of mammalian cytochrome
P-450 monooxygenase activities in yeast cells. Biochimie 1990, 72:463-72.
14. Renaud JP, Cullin C, Pompon D, Beaune P, Mansuy D: Expression of human liver
cytochrome P450 IIIA4 in yeast. A functional model for the hepatic enzyme. European
journal of biochemistry / FEBS 1990, 194:889-96.
15. Dietrich M, Grundmann L, Kurr K, Valinotto L, Saussele T, Schmid RD, Lange S:
Recombinant production of human microsomal cytochrome P450 2D6 in the
methylotrophic yeast Pichia pastoris. Chembiochem 2005, 6:2014-22.
16. Kolar NW, Swart AC, Mason JI, Swart P: Functional expression and characterisation
of human cytochrome P45017alpha in Pichia pastoris. J Biotechnol 2007, 129:635-44.
17. Zehentgruber D, Dr<gan C-A, Bureik M, Lütz S: Challenges of steroid
biotransformation with human cytochrome P450 monooxygenase CYP21 using resting
cells of recombinant Schizosaccharomyces pombe. J Biotechnol 2010, 146:179-85.

Y. lipolytica manuscript Braun Andreas
- 31 -
18. Dr<gan C-A, Peters FT, Bour P, Schwaninger AE, Schaan SM, Neunzig I, Widjaja M,
Zapp J, Kraemer T, Maurer HH, Bureik M: Convenient gram-scale metabolite synthesis by
engineered fission yeast strains expressing functional human P450 systems. Appl Environ
Microbiol 2011, 163:965-80.
19. Bureik M, Schiffler B, Hiraoka Y, Vogel F, Bernhardt R: Functional expression of
human mitochondrial CYP11B2 in fission yeast and identification of a new internal
electron transfer protein, etp1. Biochemistry 2002, 41:2311-21.
20. Juretzek T, Mauersberger S, Barth G: Recombinant Haploid or diploid Y. lipolytica
cells for the expression of CYP P450 systems. EU Patent number WO0003008A2. 2000.
21. Novikova L a., Faletrov YV, Kovaleva IE, Mauersberger S, Luzikov VN, Shkumatov
VM: From structure and functions of steroidogenic enzymes to new technologies of gene
engineering. Biochemistry (Mosc) 2009, 74:1482-504.
22. Nthangeni MB, Urban P, Pompon D, Smit MS, Nicaud J-M: The use of Yarrowia
lipolytica for the expression of human cytochrome P450 CYP1A1. Yeast 2004, 21:583-92.
23. Kempf AC, Zanger UM, Meyer UA: Truncated human P450 2D6: expression in
Escherichia coli, Ni(2+)-chelate affinity purification, and characterization of solubility
and aggregation. Arch Biochem Biophys 1995, 321:277-88.
24. Schmitz G: Regioselective oxidation of terfenadine with Cunninghamella
blakesleeana. J Mol Catal B Enzym 2000, 10:313-324.
25. Hesselink PGM, Vliet SV, Vries HD, Witholt B: Optimization of steroid side chain
deavage by Mycobacterium sp . in the presence of cydodextrins. Enzyme 1989, 11:398-
404.
Y. lipolytica manuscript Braun Andreas
- 32 -
26. León R: Whole-cell biocatalysis in organic media. Enzyme Microb Technol 1998,
23:483-500.
27. Salter GJ, Kell DB: Solvent selection for whole cell biotransformations in organic
media. Crit Rev Biotechnol 1995, 15:139-77.
28. Bosetti a, Vanbeilen J, Preusting H, Lageveen R, Witholt B: Production of primary
aliphatic alcohols with a recombinant Pseudomonas strain, encoding the alkane
hydroxylase enzyme system. Enzyme Microb Technol 1992, 14:702-708.
29. Desmet M, Kingma J, Wynberg H, Witholt B: Pseudomonas oleovorans as a tool in
bioconversions of hydrocarbons: growth, morphology and conversion characteristics in
different two-phase systems. Enzyme Microb Technol 1983, 5:352-360.
30. Liu W-hsiung, Horng W-chang: Bioconversion of cholesterol to cholest-4-en-3-one in
aqueous / organic solvent two-phase reactors. Enzyme 1996, 0229:184-189.
31. Bühler B, Schmid A: Process implementation aspects for biocatalytic hydrocarbon
oxyfunctionalization. J Biotechnol 2004, 113:183-210.
32. Schmid A, Kollmer A, Mathys RG, Witholt B: Developments toward large-scale
bacterial bioprocesses in the presence of bulk amounts of organic solvents. Extremophiles
1998, 2:249-56.
33. Sinigaglia M, Lanciotti R, Guerzoni ME: Biochemical and physiological characteristics
of Yarrowia lipolytica strains in relation to isolation source. Can J Microbiol 1994, 40:54-
9.

Y. lipolytica manuscript Braun Andreas
- 33 -
34. Schmitz C, Goebel I, Wagner S, Vomberg A, Klinner U: Competition between n-
alkane-assimilating yeasts and bacteria during colonization of sandy soil microcosms.
Appl Environ Microbiol 2000, 54:126-32.
35. Kim, Tae Hyun; Lee, Jung-Hyun; Oh, Young Sook; Bae, Kyung Sook; Kim SJ:
Identification and Characterization of an Oil-degrading yeast Yarrowia lipolytica 180. J
Microbiol 1999, 37:128-135.
36. Margesin R, Schinner F: Efficiency of indigenous and inoculated cold-adapted soil
microorganisms for biodegradation of diesel oil in alpine soils. Appl Environ Microbiol
1997, 63:2660-4.
37. Scioli C, Vollaro L: The use of Yarrowia lipolytica to reduce pollution in olive mill
wastewaters. Water Res 1997, 31:2520-2524.
38. Barth G, Gaillardin C: Yarrowia lipolytica. In Nonconventional yeasts in biotechnology.
edited by Wolf K Berlin: Springer-Verlag; 1996:313-388.
39. Waché Y, Aguedo M, Nicaud J-M, Belin J-M: Catabolism of hydroxyacids and
biotechnological production of lactones by Yarrowia lipolytica. Appl Environ Microbiol
2003, 61:393-404.
40. Fickers P, Benetti P-H, Waché Y, Marty A, Mauersberger S, Smit MS, Nicaud J-M:
Hydrophobic substrate utilisation by the yeast Yarrowia lipolytica, and its potential
applications. FEMS Yeast Res 2005, 5:527-43.
41. Thevenieau F, Beopoulos F, Desfougeres T, Sabirova J, Albertin K, Zinjarde S, Nicaud J-
M: Handbook of hydrocarbon and lipid microbiology. In Handbook of hydrocarbon and
lipid microbiology. 2nd edition. edited by Timmis K Berlin Heidelberg: Springer-Verlag;
2010:1514-1527.

Y. lipolytica manuscript Braun Andreas
- 34 -
42. Müller S, Sandal T, Kamp-Hansen P, Dalbøge H: Comparison of expression systems in
the yeasts Saccharomyces cerevisiae, Hansenula polymorpha, Klyveromyces lactis,
Schizosaccharomyces pombe and Yarrowia lipolytica. Cloning of two novel promoters
from Yarrowia lipolytica. Yeast 1998, 14:1267-83.
43. Bourel G, Nicaud J-M, Nthangeni B, Santiago-Gomez P, Belin J-M, Husson F: Fatty acid
hydroperoxide lyase of green bell pepper: cloning in Yarrowia lipolytica and biogenesis
of volatile aldehydes. Enzyme Microb Technol 2004, 35:293-299.
44. Prinz A: Testung des ICL1-Promotors zur funktionellen heterologen Expression von
Cytochrom P450 in der Hefe Yarrowia lipolytica. 1995.
45. Shiningavamwe A, Obiero G, Albertyn J, Nicaud J-M, Smit M: Heterologous expression
of the benzoate para-hydroxylase encoding gene (CYP53B1) from Rhodotorula minuta
by Yarrowia lipolytica. Appl Microbiol Biotechnol 2006, 72:323-9.
46. Gustafsson C, Govindarajan S, Minshull J: Codon bias and heterologous protein
expression. Trends Biotechnol 2004, 22:346-53.
47. Le Dall MT, Nicaud JM, Gaillardin C: Multiple-copy integration in the yeast Yarrowia
lipolytica. Current genetics 1994, 26:38-44.
48. Juretzek T, Le Dall M-T, Mauersberger S, Gaillardin C, Barth G, Nicaud J-M: Vectors
for gene expression and amplification in the yeast Yarrowia lipolytica. Yeast (Chichester,
England) 2001, 18:97-113.
49. Förster A: Untersuchungen zur heterologen Expression von steroidwandelnden
Cytochrom P450 Systemen in der Hefe Y. lipolytica. Master thesis. Dresden University of
Technology, Institute of Microbiology; 2001.
Y. lipolytica manuscript Braun Andreas
- 35 -
50. Juretzek T: Entwicklung von Wirts-Vektor-Systemen zur heterologen Expression von
Proteinen in der nichtkonventionellen Hefe Yarrowia lipolytica und ihre Anwendung
für die Cytochrom P450-katalysierte Stoffumwandlung. PhD thesis. Dresden University of
Technology, Institute of Microbiology;1999.
51. Förster A, Jacobs K, Juretzek T, Mauersberger S, Barth G: Overexpression of the ICL1
gene changes the product ratio of citric acid production by Yarrowia lipolytica. Appl
Environ Microbiol 2007, 77:861-9.
52. Renaud JP, Cullin C, Pompon D, Beaune P, Mansuy D: Expression of human liver
cytochrome P450 IIIA4 in yeast. A functional model for the hepatic enzyme. Eur J
Biochem 1990, 194:889-96.
53. Tsuzuki D, Takemi C, Yamamoto S, Tamagake K, Imaoka S, Funae Y, Kataoka H,
Shinoda S, Narimatsu S: Functional evaluation of cytochrome P450 2D6 with Gly42Arg
substitution expressed in Saccharomyces cerevisiae. Pharmacogenetics 2001, 11:709-18.
54. Truan G, Cullin C, Reisdorf P, Urban P, Pompon D: Enhanced in vivo monooxygenase
activities of mammalian P450s in engineered yeast cells producing high levels of
NADPH-P450 reductase and human cytochrome b5. Gene 1993, 125:49-55.
55. Guengerich FP, Krauser J a, Johnson WW: Rate-limiting steps in oxidations catalyzed
by rabbit cytochrome P450 1A2. Biochemistry 2004, 43:10775-88.
56. Schiffler B, Bureik M, Reinle W, Müller E-C, Hannemann F, Bernhardt R: The
adrenodoxin-like ferredoxin of Schizosaccharomyces pombe mitochondria. J Inorg
Biochem 2004, 98:1229-37.
57. Murakami H, Yabusaki Y, Ohkawa H: Expression of rat NADPH-cytochrome P-450
reductase cDNA in Saccharomyces cerevisiae. DNA 1986, 5:1-10.

Y. lipolytica manuscript Braun Andreas
- 36 -
58. Eugster HP, Bärtsch S, Würgler FE, Sengstag C: Functional co-expression of human
oxidoreductase and cytochrome P450 1A1 in Saccharomyces cerevisiae results in
increased EROD activity. Biochem Biophys Res Commun 1992, 185:641-7.
59. Becker T, Breithaupt D, Doelle HW, Fiechter A, Griensven M, Kasper C: Biotechnology.
In Ullmann’s Enzyclopedia of Industrial Chemistry. 7th edition. Wiley VCH Verlag GmbH &
Co KGaA, Weinheim, Germany.; 2007.
60. Kishimoto W, Hiroi T, Shiraishi M, Osada M, Imaoka S, Kominami S, Igarashi T, Funae
Y: Cytochrome P450 2D catalyze steroid 21-hydroxylation in the brain. Endocrinology
2004, 145:699-705.
61. Paine MJI, McLaughlin L a, Flanagan JU, Kemp C a, Sutcliffe MJ, Roberts GCK, Wolf
CR: Residues glutamate 216 and aspartate 301 are key determinants of substrate
specificity and product regioselectivity in cytochrome P450 2D6. J Biol Chem 2003,
278:4021-7.
62. Shkumatov VM, Frolova NS, Rudaia EV, Faletrov IV, Mauersberger S, Barth G: Range
of substrates and steroid bioconversion reactions performed by recombinant
microorganisms Saccharomyces cerevisiae and Yarrowia lipolytica expressing
cytochrome P450c17. Prikl Biokhim Mikrobiol 2006, 42:539-46.
63. Shkumatov VM, Usova EV, Frolova NS, Barth G, Mauersberger S: Effect of steroid
biosynthesis modificators on the progesterone biotransformation by a recombinant
yeasts expressing cytochrome P450c17. Biomedi Khim 2006, 52:298-308.
64. Aguedo M, Waché Y, Mazoyer V, Sequeira-Le Grand A, Belin J-M: Increased electron
donor and electron acceptor characters enhance the adhesion between oil droplets and

Y. lipolytica manuscript Braun Andreas
- 37 -
cells of Yarrowia lipolytica as evaluated by a new cytometric assay. J Agric Food Chem
2003, 51:3007-11.
65. Cirigliano MC, Carman GM: Isolation of a bioemulsifier from Candida lipolytica. Appl
Environ Microbiol 1984, 48:747-50.
66. Mlícková K, Roux E, Athenstaedt K, D’Andrea S, Daum G, Chardot T, Nicaud J-M:
Lipid accumulation, lipid body formation, and acyl coenzyme A oxidases of the yeast
Yarrowia lipolytica. Appl Environ Microbiol 2004, 70:3918-24.
67. Mauersberger S, Ohkuma M, Schunck W-H, Takagi M: Candida maltosa. In
Nonconventional yeasts in biotechnology. edited by Wolf K Berlin: Springer-Verlag;
1996:411-580.
68. Schunck W-H, Mauersberger S, Kärgel E, Huth J, Müller H-G: Function and regulation
of cytochrome P-450 in alkane-assimilating yeast II. Arch Microbiol 1987, 147:245-248.
69. Schunck W-H, Mauersberger S, Huth J, Riege P, Müller H-G: Function and regulation
of cytochrome P-450 in alkane-assimilating yeast I. Arch Microbiol 1987, 147:240-244.
70. Phillips AH, Langdon RG: Hepatic triphosphopyridine nucleotide-cytochrome c
reductase: isolation, characterization, and kinetic studies. J Biol Chem 1962, 237:2652-
60.
71. Coelho MAZ, Amaral PFF, Belo I: Yarrowia lipolytica - an industrial workhorse. In
Current Research, Technology and Education Topics in Applied Microbiology and Microbial
Biotechnology. 2010th edition. edited by Méndes-Vilas A Badajoz: Formatex Research
Center; 2010:930-944.

Y. lipolytica manuscript Braun Andreas
- 38 -
72. Thevenieau F, Nicaud J-M, Gaillardin C: Applications of the Non-Conventional Yeast
Yarrowia lipolytica. In Yeast Biotechnology: Diversity and Applications. 3rd edition. edited
by Satyanarayana T, Kunze G Dordrecht: Springer Netherlands; 2009:589-613.
73. Beopoulos A, Nicaud J-M, Gaillardin C: An overview of lipid metabolism in yeasts and
its impact on biotechnological processes. Appl Microbiol Biotechnol 2011, 90:1193-206.
74. Munk V, Volfová O, Dostálek M, Mostecký J, Pecka K: Cultivation of the yeast
Candida lipolytica on hydrocarbon. 3. Oxidation and utilization of individual pure
hydrocarbons. Folia Microbiol (Praha) 1969, 14:334-44.
75. Zhang W, Ni Y, Sun Z, Zheng P, Lin W, Zhu P, Ju N: Biocatalytic synthesis of ethyl
(R)-2-hydroxy-4-phenylbutyrate with Candida krusei SW2026: A practical process for
high enantiopurity and product titer. Process Biochem 2009, 44:1270-1275.
76. Mauersberger S, Wang HJ, Gaillardin C, Barth G, Nicaud JM: Insertional mutagenesis
in the n-alkane-assimilating yeast Yarrowia lipolytica: generation of tagged mutations in
genes involved in hydrophobic substrate utilization. J Bacteriol 2001, 183:5102-9.
77. Förster A, Aurich A, Mauersberger S, Barth G: Citric acid production from sucrose
using a recombinant strain of the yeast Yarrowia lipolytica. Applied microbiology and
biotechnology 2007, 75:1409-17.
78. Kruse K, Förster A, Juretzek T, Mauersberger S, Barth G: Method for the
biotechnological production of citric acid by means of a genetically-modified yeast
Yarrowia lipolytica. 2004.
79. Juretzek T, Mauersberger S, Barth G: Rekombinante haploide oder diploide Yarrowia
lipolytica Zellen zur funktionellen heterologen Expression von Cytochrom P450
Systemen. 2000.
Y. lipolytica manuscript Braun Andreas
- 39 -
80. Juretzek T, Prinz A, Schunck W-H, G B, S M: Expressionskassetten zur heterologen
Expression von Proteinen in der Hefe Yarrowia lipolytica unter der Kontrolle des
regulierbaren Promotors der Isocitratlyase. 1997.
81. Ausubel FM, Brent R, Kingston RE, Moore DD, Seidman JG, Smith JA, Struhl K:
Current Protocols in Molecular Biology. New York: John Wiley and Sons: New York;
2007:5300.
82. Sambrook J, Russell DW: Molecular Cloning: A Laboratory Manual. 3rd edition. Cold
Spring Harbor Laboratory; 2001:999.
83. Lin-Cereghino J, Wong WW, Xiong S, Giang W, Luong LT, Vu J, Johnson SD, Lin-
Cereghino GP: Condensed protocol for competent cell preparation and transformation of
the methylotrophic yeast Pichia pastoris. Biotechniques 2005, 38:44, 46, 48.
84. Hoffman CS, Winston F: A ten-minute DNA preparation from yeast efficiently
releases autonomous plasmids for transformation of Escherichia coli. Gene 1987, 57:267-
72.
85. Livak KJ, Schmittgen TD: Analysis of relative gene expression data using real-time
quantitative PCR and the 2(-Delta Delta C(T)) Method. Methods 2001, 25:402-8.
86. Merkenschlager M, Schlossmann K, Kurz W: A mechanical cell homogenizer and its
applicability to biological problems. Biochem Z 1957, 329:332-40.
87. Omura T, Sato R: The carbon monoxide-binding pigment of liver microsomes. I.
Evidence for its hemoprotein nature. J Biol Chem 1964, 239:2370-8.
88. Phillips IR, Shephard EA: Cytochrome P450 Protocols. 2nd edition. New Jersey: Humana
Press Inc.; 2006:384.

Y. lipolytica manuscript Braun Andreas
- 40 -
Figures
Fig. 1: Schematic representation of construction of the co-expression vector
Construction of multicopy coexpression vectors by inserting overlap extension PCR
fragments into the multicopy integrative vector p64D-linker containing the multicopy
selective ura3d4 marker.
Fig. 2: CYP activity and Y. lipolytica biomass production during induction
CYP2D6 (1’-hydroxybufuralol formation, A)and CYP3A4 (6く-hydroxyprogesterone
formation, B) activity during ethanol induction of Y. lipolytica strains YL21 and YL22,
respectively. The cultures were incubated at 28°C and induced by ethanol after
glucose depletion. The Roman numerals indicate the following process phases: I)
batch growth with glucose; II) induction phase of about 70 h. Squares highlight
biomass concentrations determined as cell dry weight, while bars document CYP
expression levels measured as specific whole-cell activity. Experiments were
performed in triplicates. Samples were taken after 4,8,21,26,31,45,50,55 and 69 h.
Fig. 3: Western blot analysis
Western blot analysis of microsomes isolated after 26 h of ethanol induction from
cultures of Y. lipolytica H222-S4 transformed with p64D- or p65D-based integrative
vectors, containing different combinations of CYPs and CPRs. Protein transfer was
monitored by Ponceau S (*) staining, where putative CPR-protein bands in multicopy
transformants were already visible. CYP-protein bands CYP2D6 (A) and CYP3A4 (B)
were immunodetected with anti CYP2D6 and CYP3A4 antibodies, respectively.–
CYP2D6 was detected in single copy clones (sc) YL12 and YL15 expressing YlCPR-
WT + 2D6syn (1), hCPR-WT + 2D6syn (2) respectively and multicopy clones (mc)
YL11, YL10 and YL21 expressing YlCPR-WT + 2D6syn (5), hCPRsyn + 2D6syn (6),
hCPR-WT + 2D6syn (7) respectively. CYP3A4 was detected in single copy clones
Y. lipolytica manuscript Braun Andreas
- 41 -
(sc) YL19 and YL20 expressing YlCPR-WT + 3A4syn (1), hCPR-WT + 3A4syn (2)
respectively and multicopy clones (mc) YL18 and YL22 expressing YlCPR-WT +
3A4syn (5), hCPR-WT + 3A4syn (6) respectively. YL23 clone harboring empty p65D-
linker vector (3+4 in both panels) was used as negative control. PageRuler
Prestained Protein Ladder (M) was used for monitoring protein separation and
transfer efficiency.
Fig. 4: Influence of copy number and type of reductase on CYP activity.
CYP2D6 (A) and CYP3A4 (B) activity of and CPR activities of Y. lipolytica single-
copy and multicopy transformants. Strains coexpressed under pICL1-control the
codon-optimized P450 2D6syn (A) or P450 3A4syn (B) in combination with the wild-
type human or Y. lipolytica NADPH-P450 reductases (hCPRwt, YlCPR) from
integrated single-copies or multiple vector copies as indicated, except the control
strain YL23 on the left in A and B, containing only one endogenous chromosomal
YlCPR copy, which is present as background in all strains. Cultivation at 28°C in
YNBG on glucose, induction by 1% ethanol, microsomes isolation, whole-cell CYP
activity and cytochrome P450 reductase (CPR) activity (determined as NADPH-
cytochrome c reductase, NCR) measurements were performed as described in
Materials and Methods. Filled bars, CPR activity; hatched bars, CYP activities; -, no
genes; + genes in single copy; ++ genes in multicopy
Fig. 5: Whole-cell hydroxylation of different steroids
Whole-cell hydroxylation of different steroids in aqueous phase system, employing Y.
lipolytica YL21 and YL22 cells harboring CYP2D6 (filled bars) or CYP3A4 (striped
bars), respectively. Data is shown as activity relative to the highest measured
apparent hydroxylation rate of testosterone (3.9 ± 0.1 mU per g CDW). Compounds
were converted by cells equivalent to ~ 10 g/L CDW for 16 hours. Activity was

Y. lipolytica manuscript Braun Andreas
- 42 -
determined in test tubes as product formation rate after adding steroids dissolved in
DMSO to a final concentration of 2 mM.
Fig. 6: Whole-cell conversions of Y. lipolytica in biphasic conditions.
Comparison of whole-cell conversion with resting Y. lipolytica YL22 cells harboring
CYP3A4 and hCPR in aqueous (striped bar) and biphasic systems (filled bars) using
different organic solvents as 2nd phase. Activity was determined as product formation
rate.
Fig. 7: Biomass and CYP3A4 activity during cultivation of Y. lipolytica YL22 in
bioreactor.
Time course of biomass concentration and volumetric whole-cell CYP3A4 activity
determined during fed-batch cultivation and ethanol induction. Open symbols,
biomass concentration determined as cell dry weight; closed symbol, CYP3A4
expression levels measured as volumetric whole-cell activity of 6beta-
hydroxyprogesterone formation determined by separate activity assays in test tubes.
The Roman numerals show the following process phases: I) batch growth with
glucose; II) fed-batch growth over 10 h with exponential addition of glucose at an
exponentially increasing feed rate; III) induction phase of about 36 h with a low linear
addition of ethanol.
Fig. 8: Hydroxyprogesterone formation during whole-cell conversion in
bioreactor.
Time course of hydroxyprogesterone formation during whole-cell conversion of
progesterone by Y. lipolytica YL22 cells harboring CYP3A4 and hCPR. Closed
triangles: aqueous phase system; open circles: with dibutylphthalate (DBP) as
second organic phase; open squares: with ethyl oleate as second organic phase.

Y. lipolytica manuscript Braun Andreas
- 43 -
Tables
Table 1: Plasmids used
Plasmid Description Marker gene
(selection in yeast)
Reference
p64ICL1
p65ICL1
Parental vector for multicopy integration in Y. lipolytica
Parental vector for single copy integration in Y. lipolytica
ura3d4 (mc)a
ura3d1 (sc) a
[51]
p67RYL Source for Y. lipolytica cytochrome P450 reductase (YlCPRwt) ura3d4 (mc)a [22, 49]
pNMTS-CYP-OR-spe
pBdpTrcRed-
3A4(192v)wtA305S
Source for codon optimized human cytochrome P450 3A4 (3A4syn)
Source for codon optimized human cytochrome P450 reductase (hCPRsyn)
Weis et al.,
unpublished (IMBT,
TU Graz)
ID7262313 Source for cDNA wild-type human cytochrome P450 reductase (hCPRwt) BioCat, Germany
Cloning vectors:
pJet1.2 E. coli cloning vector Fermentas, Germany
p64D-linker
p65D-linker
Cloning and basic integrative multicopy vector
Cloning and basic integrative single copy vector, negative control
ura3d4 (mc) a
ura3d1 (sc) a
This work
Integrative vectors for CPR and CYP expression in Y. lipolytica:
p64D-hCPRwt-2D6syn
p64D-hCPRsyn-2D6syn
p64D-hCPRwt-3A4syn
p64D-YlCPR-2D6syn
p64D-YlCPR-3A4syn
Multicopy coexpression of human wild-type CPR (hCPRwt), codon
optimized CPR (hCPRsyn) or Y. lipolytica-own CPR (YlCPR) in
combination with codon optimized CYP2D6 or codon optimized CYP3A4,
respectively.
ura3d4 (mc) a This work
p65D-hCPRwt-2D6syn
p65D-hCPRwt-3A4syn
p65D-YlCPR-2D6syn
p65D-YlCPR-3A4syn
Single copy coexpression of human wild-type CPR (hCPRwt) or Y.
lipolytica-onw CPR (YlCPR) in combination with codon optimized CYP2D6
or codon optimized CYP3A4, respectively.
ura3d4 (mc) a This work
a URA3 marker genes for single copy (sc, ura3d1) or multicopy (mc, ura3d4) selection with different promoter lengths
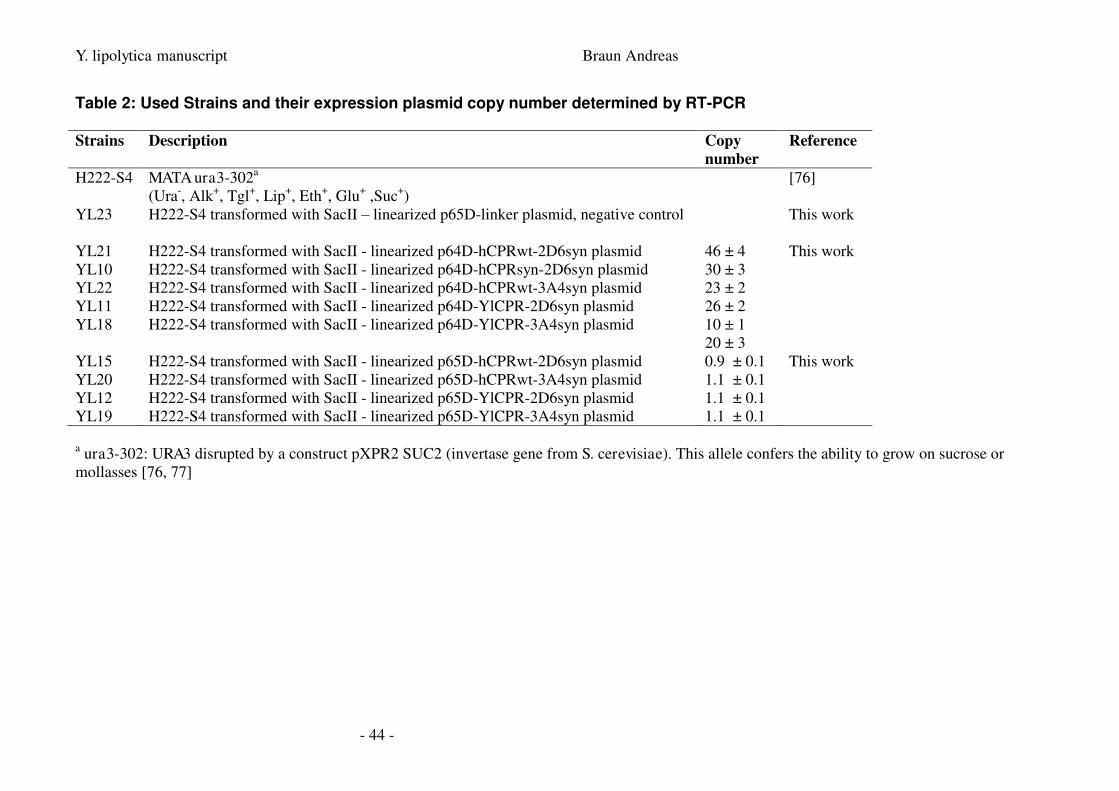
Y. lipolytica manuscript Braun Andreas
- 44 -
Table 2: Used Strains and their expression plasmid copy number determined by RT-PCR
Strains Description Copy
number
Reference
H222-S4
MATA ura3-302a
(Ura-, Alk
+, Tgl
+, Lip
+, Eth
+, Glu
+ ,Suc
+)
[76]
YL23
H222-S4 transformed with SacII – linearized p65D-linker plasmid, negative control This work
YL21
YL10
YL22
YL11
YL18
H222-S4 transformed with SacII - linearized p64D-hCPRwt-2D6syn plasmid
H222-S4 transformed with SacII - linearized p64D-hCPRsyn-2D6syn plasmid
H222-S4 transformed with SacII - linearized p64D-hCPRwt-3A4syn plasmid
H222-S4 transformed with SacII - linearized p64D-YlCPR-2D6syn plasmid
H222-S4 transformed with SacII - linearized p64D-YlCPR-3A4syn plasmid
46 ± 4
30 ± 3
23 ± 2
26 ± 2
10 ± 1
20 ± 3
This work
YL15
YL20
YL12
YL19
H222-S4 transformed with SacII - linearized p65D-hCPRwt-2D6syn plasmid
H222-S4 transformed with SacII - linearized p65D-hCPRwt-3A4syn plasmid
H222-S4 transformed with SacII - linearized p65D-YlCPR-2D6syn plasmid
H222-S4 transformed with SacII - linearized p65D-YlCPR-3A4syn plasmid
0.9 ± 0.1
1.1 ± 0.1
1.1 ± 0.1
1.1 ± 0.1
This work
a ura3-302: URA3 disrupted by a construct pXPR2 SUC2 (invertase gene from S. cerevisiae). This allele confers the ability to grow on sucrose or
mollasses [76, 77]

Y. lipolytica manuscript Braun Andreas
- 45 -
supplementary data
File name: Additional file 1
File format: pdf
Title: Influence of growth phase on whole-cell conversion rates
Description: Comparing Diagrams of whole-cell conversions in aqueous systems by growing
and resting cells of Y. lipolytica harboring CYP2D6 or CYP3A4, respectively
File name: Additional file 2
File format: pdf
Title: Solubility of progesterone in organic solvents.
Description: Solubility of progesterone in the different organic solvents shown as a diagram

Figure 1
rDNA
SacII
D
T
cloning SpeI/AscI
p64ICL1 overlap PCR
AscI CPR pICL1D
ICL1-T
CYP
CCGCGCGGTTTT SpeI
AAAAACTAGTGCCACCATG
kozak sequence

Figure 2
0
1
2
3
4
5
6
7
-25 0 25 50 75
Time [h]
CD
W [
g/L
]
0
5
10
15
20
25
30
Sp
ec
ific
Ac
tiv
ity
[m
U/g
]
0
1
2
3
4
5
6
7
-25 0 25 50 75
Time [h]
CD
W [
g/L
]
0
2
4
6
8
10
12
14
Sp
ec
ific
Ac
tiv
ity
[m
U/g
](A) (B)
I II I II

Figure 3
M 1 2 3 4 5 6 7 kDa
100
70
55
YlCPR
HCPR
CYP2D6
YlCPR
HCPR
CYP3A4
100
70
55
1 2 3 M 4 5 6
SC Empty MC
SC Empty MC (A)
(B)
(*)
(*)

Figure 4
0
20
40
60
80
100
-
-
-
+
-
+
+
+
-
++
-
++
++
++
-
CYP3A4
HCPR
YlCPR
Re
lati
ve
Ac
tiv
ity
[%
]
0
20
40
60
80
100
-
-
-
+
-
+
+
+
-
++
-
++
++
++
-
CYP2D6
HCPR
YlCPR
Re
lati
ve
Ac
tiv
ity
[%
]
(A) (B)

Figure 5
(A)
0
20
40
60
80
100
6beta-hydroxy 6beta-hydroxy 6beta-hydroxy
testosterone 17alpha-methyl
testosterone
progesterone
Rela
tive A
cti
vit
y [
%]

Figure 6
(A)
0
20
40
60
80
100
120
aqueous system
1-decanol
1-dodecanol
methyl laurate
ethyl oleate
BEHP
DBP
Organic Phase
Re
lati
ve
Ac
tiv
ity
[%
]

Figure 7
-20 0 20 40
0
10
20
30
40
50
Induction Time [h]
CD
W [
g/L
]
0
0.2
0.4
0.6
0.8
1
1.2
1.4
CY
P3
A4
Ac
tiv
ity
[U
/L]
I II III

Figure 8
(A)
0
10
20
30
40
50
0 1 2 3Time [h]
0
50
100
150
200
250
0 20 40 60 80 100Time [h]
Hy
dro
xy
pro
ge
ste
ron
e [
µM
]
Supplementary data 3
SOP I (HPLC-MS)
MT-HPCL-MS whole cell screening system for P450 mediated steroid
hydroxylation
ACIB Protocol
MT-HPCL-MS whole cell screening system for P450 mediated steroid hydroxylation Author: Braun Andreas [email protected]

MT-HPCL-MS whole cell screening system for P450 mediated steroid hydroxylation Valid from: Author: Andreas Braun Version: 1
Printed: 07/07/2012 ACIB Confidential Page 2 of 32
Creation date: December. 2011
Validity: until revoked/cancelled
This ACIB protocol replaces the version from:
Developed in project/working group: EU-Project Oxygreen
Notice of modification:
Written by: Andreas Braun
Date/signature:
Checked: Martina Geier Yes
No Date/Signature
Approved by:

MT-HPCL-MS whole cell screening system for P450 mediated steroid hydroxylation Valid from: Author: Andreas Braun Version: 1
Printed: 07/07/2012 ACIB Confidential Page 3 of 32
1. Purpose and Field of Application
A protocol for whole cell screening of heterologous expressed P450 mutein libraries for
their hydroxylation activity towards steroids and resulting hydroxylation patterns.
This method can be used to screen mutein libraries of membrane bound P450 enzymes ex-
pressed in Pichia pastoris, which show activities towards testosterone. The substrate con-
version is meant to be done with resting, whole cells to circumvent cumbersome cell disrup-
tion which often leads to activity loss of the P450 enzyme system due to reduced stability.
This is a medium throughput HPLC-MS screening method and therefore shows reliable but
preliminary results. Using this screening system one can determine activity trends and also
trends in the hydroxylation pattern.
The method is not limited to Pichia pastoris. Any expression host that is able to functionally
express membrane bound P450 enzymes and can be cultivated in 96 Deep-well plates can
be applied. For other host the cultivation and induction procedure in 96 Deep-well plates
have to be adjusted.
Furthermore, besides testosterone this system is also viable for the screening of other ster-
oids. For other steroids the MS signals have to be adjusted. Additionally, in some cases one
will have to adjust the mobile phases for optimal separation via HPLC.
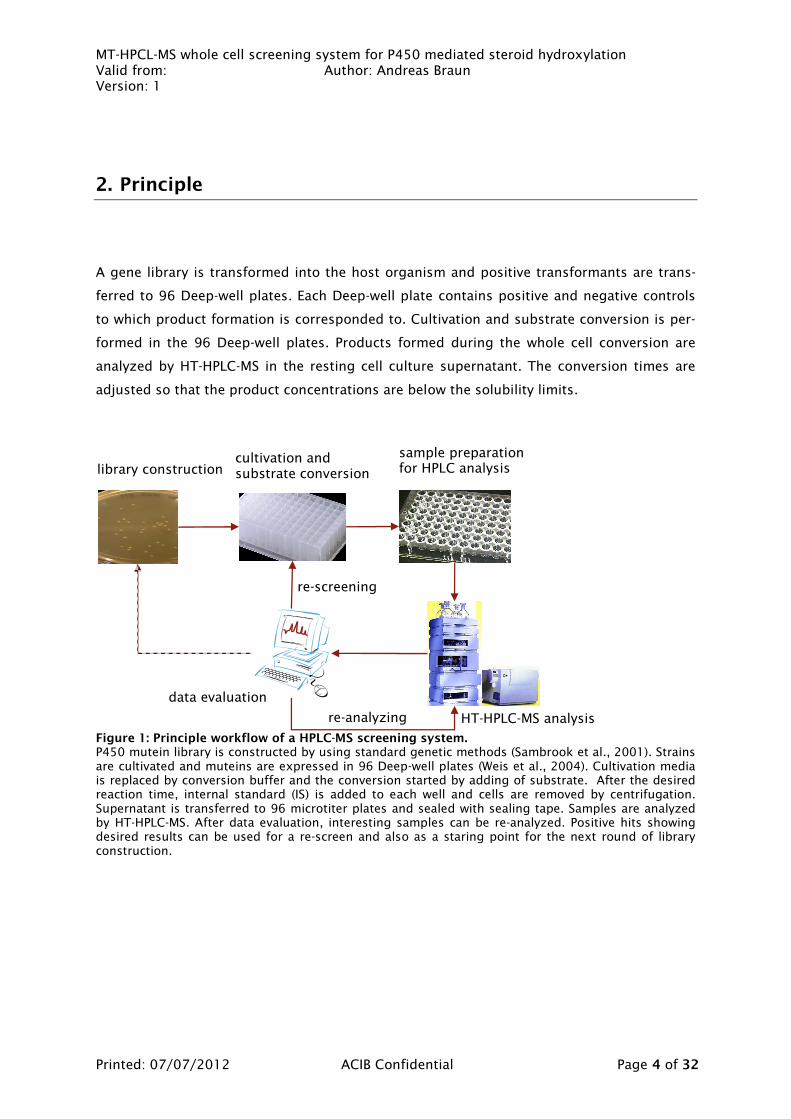
MT-HPCL-MS whole cell screening system for P450 mediated steroid hydroxylation Valid from: Author: Andreas Braun Version: 1
Printed: 07/07/2012 ACIB Confidential Page 4 of 32
2. Principle
A gene library is transformed into the host organism and positive transformants are trans-
ferred to 96 Deep-well plates. Each Deep-well plate contains positive and negative controls
to which product formation is corresponded to. Cultivation and substrate conversion is per-
formed in the 96 Deep-well plates. Products formed during the whole cell conversion are
analyzed by HT-HPLC-MS in the resting cell culture supernatant. The conversion times are
adjusted so that the product concentrations are below the solubility limits.
Figure 1: Principle workflow of a HPLC-MS screening system. P450 mutein library is constructed by using standard genetic methods (Sambrook et al., 2001). Strains are cultivated and muteins are expressed in 96 Deep-well plates (Weis et al., 2004). Cultivation media is replaced by conversion buffer and the conversion started by adding of substrate. After the desired reaction time, internal standard (IS) is added to each well and cells are removed by centrifugation. Supernatant is transferred to 96 microtiter plates and sealed with sealing tape. Samples are analyzed by HT-HPLC-MS. After data evaluation, interesting samples can be re-analyzed. Positive hits showing desired results can be used for a re-screen and also as a staring point for the next round of library construction.
data evaluation
HT-HPLC-MS analysis
library construction cultivation and substrate conversion
sample preparation for HPLC analysis
re-screening
re-analyzing

MT-HPCL-MS whole cell screening system for P450 mediated steroid hydroxylation Valid from: Author: Andreas Braun Version: 1
Printed: 07/07/2012 ACIB Confidential Page 5 of 32
Figure 2: Principle HPLC-MS setup for quantitative analysis of substrate and products. With high pressure a mobile phase is constantly pushed trough a tightly packed column. The analysis sample is injected into the mobile phase stream and substrate and products are separated by interac-tion with the packing material of the column. After separation, individual chemical compounds are detected by UV/VIS and MS. Detected peaks are used for identification and quantification. The peak area is proportional to the concentration (Dong, 2006).
autosampler and
Injector
pump2
pump1 column oven detector
waste mobile phase1
mobile phase2
column

MT-HPCL-MS whole cell screening system for P450 mediated steroid hydroxylation Valid from: Author: Andreas Braun Version: 1
Printed: 07/07/2012 ACIB Confidential Page 6 of 32
3. Key Words, Definitions & Abbreviations
Key words: HPLC-MS, hydroxylation pattern, cytochrome P450, mutein, Pichia pastoris,
whole cell screening, resting cells
Abbreviation Description
ACN acetonitril
CDW cell dry weight
ddH2O double distilled H2O
ESI electrospray ionization
FA formic acid
HPLC high pressure liquide chromatography
HT high throughput
MS mass spectroscopy
MT medium throughput
OD600 optical density at 600 nm
RT room temperature
UV ultra violet
VIS visibile

MT-HPCL-MS whole cell screening system for P450 mediated steroid hydroxylation Valid from: Author: Andreas Braun Version: 1
Printed: 07/07/2012 ACIB Confidential Page 7 of 32
4. Methodology
4.1. Reagents
List of the chemicals needed
Name Formula MW Purity Supplier Order No. Comments
6beta-hydroxytestos-
terone C19H28O3 304.42 ≥97%
Sigma-Aldrich
H-2898-25MG
acetonitrile CH3CN 412.05 ≥99.9% Bartelt
GmbH 9017.2500
biotin, D(+)- C10H16N2O3S 244.31 ≥98.5% Carl Roth
GmbH 3822.1 store at 4°C
boldenone C19H26O2 286.41 ≥97% Sigma-Aldrich
46431-10MG-R
D-glucose monohydrate
C6H12O6 * H2O 198.17 ≥99.5% Carl Roth
GmbH 6780.2
dimethylsul-foxid
(DMSO) (CH3)2SO 78.13 ≥99.8%
Carl Roth GmbH
4720.4
formic acid HCOOH 46.02 ≥98% Carl Roth
GmbH 4724.2
methanol CH3OH 32.04 ≥99.9% Carl Roth
GmbH 4621.2 highly toxic
phosphoric acid H3PO4 98.00 ≥85% Carl Roth
GmbH 6366.1
potassium di-hydrogene-phosphate
KH2PO4 136.09 ≥99% Carl Roth
GmbH 3904.1
potassium hy-drogene-
phosphate K2HPO4 174.18 ≥98%
Carl Roth GmbH
6875.1
potassium hy-droxide
KOH 56.11 ≥85% Carl Roth
GmbH 6751.1
sodium azide NaN3 65.01 ≥99.5% Sigma-Aldrich
71289-5G highly toxic
MT-HPCL-MS whole cell screening system for P450 mediated steroid hydroxylation Valid from: Author: Andreas Braun Version: 1
Printed: 07/07/2012 ACIB Confidential Page 8 of 32
testosterone C19H28O2 288.43 ≥99% Sigma-Aldrich
86500-25G

MT-HPCL-MS whole cell screening system for P450 mediated steroid hydroxylation Valid from: Author: Andreas Braun Version: 1
Printed: 07/07/2012 ACIB Confidential Page 9 of 32
4.2. Solutions
List of the solutions needed to perform the method
Name Ingredients Comments
6beta-hydroxytestos-terone stocks
10 mM: 5 mg 6beta-hydroxytestosterone, to 1.64 mL with DMSO
2 mM: 40 µL 10 mM stock solution, to 200 µL with DMSO
0.5 mM: 10 µL 10 mM stock solution, to 200 µL with DMSO
store in the dark
acidified H2O
mobile phase 1 1 L H2O + 1 mL formic acid + some grains of sodium azide
assay buffer (pH 7.4, 100
mM) 100 mL KPi-buffer (pH 7.4, 1 M), to 1 L with ddH2O
biotin (500x) 10 mg biton, to 50 mL with ddH2O store at 4°C
BMD1 1%: 100 mL YNB (20x), 50 mL D-glucose (20%) and 200 mL KPi-
Buffer (1M, pH 6.0), to 1 L with ddH2O store in the dark
BMM different methanol con-
centrations
BMM2 (1%): 50 mL YNB (20x), 2 mL methanol, 0.4 mL biotin (500x) and 200 mLKPi-Buffer (1M, pH 6.0), to 200 mL with
ddH2O
BMM10 (5%): 40 mL YNB (20x), 10 mL methanol, 0.4 mL biotin (500x) and 40 mL KPi-Buffer (1M, pH 6.0), to 200 mL with ddH2O
prepare fresh
boldenone 1 mM: 14 mg boldenone, to 50 mL with DMSO store in the dark
D-glucose solu-tion
20%: 220 g D-glucose monohydrate, to 1 L with ddH2O
interner stan-dard (IS)
10 mg boldenone, to 34.915 with mL DMSO store at -20°C
mobile phase 2
acidified ace-tonitrile
1 L acetonitrile + 1 mL formic acid store in the dark
potassium phosphate buffer (KPi-
buffer, different pH)
pH 6.0, 1 M: 22.99 g K2HPO4, 118.13 g KH2PO4, to 1 L with ddH2O
pH 7.4, 1M: 139.69 g K2HPO4, 26.95 g KH2PO4, to 1 L with ddH2O
+ KOH for phosphoric acid till desired pH
steroid (200 mM)
25 mg testosterone, to 0.867 mL with DMSO store in the dark
testosterone stock
200 mM: 577 mg testosterone, to 10 mL with DMSO store in the dark
YNB Difco 5 g ammonium sulfate, 2 µg biotin, 0.4 mg calcium pantothen- Supplier:

MT-HPCL-MS whole cell screening system for P450 mediated steroid hydroxylation Valid from: Author: Andreas Braun Version: 1
Printed: 07/07/2012 ACIB Confidential Page 10 of 32
(yeast nitrogen base , composi-
tion)
ate, 2 µg folic acid, 2 mg inositol, 0,4 mg niacin, 0.2 mg p-aminobenzoic acid, 0.4 mg pyridoxine hydrochloride, 0.2 mg
riboflavin, 0.4 thiamine hydrochloride, 0.5 mg boric acid, 40 µg copper sulfate, 0.1 mg potassium iodide, 0.2 mg iron chloride, 0.4 mg manganese sulfate, 0.2 mg sodium molybdate, 0.4 mg zinc sulfate, 1 g potassium dihydrogene-phosphate, 0.5 g mag-nesium sulfate, 0.1 g sodium chloride, 0.1 g calcium chloride, to
1 L with H2O
BD Biosciences
YNB solution (20x)
134 g YNB Difco, to 1 L with ddH2O store in the dark

MT-HPCL-MS whole cell screening system for P450 mediated steroid hydroxylation Valid from: Author: Andreas Braun Version: 1
Printed: 07/07/2012 ACIB Confidential Page 11 of 32
4.3. Materials
Description of materials needed to perform the method
Name Supplier Order No. Comments
96 Well microplates F-from
(25-340 µL volume)
Greiner, Ger-many
655101
96-Deep-Well Plate (2 mL volume) Bel-Art Products,
USA F378600000
Biohit Tips:
0,5-300 µL
50-1200 µL
Schmiedt Labor-geräte, Austria
790302
780043
column:
Zorbax Eclipse XDB-C18 TT HAT 600bar
JAS, Austria 927975-902
column:
Chromolith ® RP-18e Merck, Germany
1.02129.0001
Filter Disc 0.2x2.1mm (10 St.) JAS, Austria 5067-1555
seal foil Carl Roth GmbH,
Germany EN76.1
Tips, 10 µL Biozyme Scien-
tific GmbH, Germany
720031
Tips, 1000 µL Greiner, Ger-
many 740290
Tips, 200 µL Biozyme Scien-
tific GmbH, Germany
760201
Toothpicks PAPSTRAR, Ger-
many 12713
bought at a local ven-dor

MT-HPCL-MS whole cell screening system for P450 mediated steroid hydroxylation Valid from: Author: Andreas Braun Version: 1
Printed: 07/07/2012 ACIB Confidential Page 12 of 32
4.4. Apparatus
Description of the instruments needed to perform the test and specifications.
Name Supplier Comments
Centrifuge 5415 R + A-4-62 rotor
Eppendorf AG, Germany
HPLC 1200 Agilent technologies, USA
HT MiltronII shaker Infors AG, Swiss
MS (single quadrupol) Agilent technologies, USA
Multichannel pipettes: 5-100 µL, 50-1200 µL
Biohit, Germany
pipettes: 0.1 – 2,5 µl, 0.5 – 10 µl,
Eppendorf AG, Germany
pipettes: 2 – 20 µl, 20 – 200 µl, 100 – 1000 µL
Gilson Inc., USA
Platereader Spectramax Plus 384 Molecular Devices, Germany
RRLC Inline-Filter, max. 600bar Agilent technologies, USA
Splitter 1:2
(Figure 3)
selfmade using
Order
number Name
0890-1915 PEEK-Kapillare, 0,13mm ID
5063-6591 PEEK finger tight 1/16 in,
PK
5022-2144 T-Verbrauchsstück, PEEK 1/16 " , 057µl sewpt vol
MB 1650 Upchurch Tub. PEEK nature,
1/16"x0,064mm ID; 5ft
Vortex-Genie 2 Scientific Industries Inc, USA

MT-HPCL-MS whole cell screening system for P450 mediated steroid hydroxylation Valid from: Author: Andreas Braun Version: 1
Printed: 07/07/2012 ACIB Confidential Page 13 of 32
Figure 3: Splitter (1:2)
4.5. Software
List of the software needed to perform the method
Name Distributor
ChemStation B.04.01. SP1 Agilent technologies, USA
excel macro “Data Import” V2.1 Institute for genomics and bioinformatics
4.6. Procedure
4.6.1. Cultivation and induction
Cultivation and induction is performed as described (Weis et al., 2004). In short: clones are
picked and transferred to 96 Deep-well plates filled with 250 µL glucose minimal media
BMD1. The cultures are grown from Friday to Monday for 60 h at 28°C, 340 rpm and 80%
humidity in HT MiltronII shaker (Infors AG, Swiss). Protein expression is performed from
Monday to Thursday for 72 h at the same conditions used for growth. Induction is started by
adding 250 µL methanol minimal media BMM2 and subsequent addition of 50 µL methanol
minimal medium BMM10 after 10, 24, 34, 48 and 58 h of induction to a total volume of 750
µL.
Important: Each plate should contain negative and positive controls to which results are
corresponded to.
~ 1.5 mL/min ~ 1.0 mL/min
~ 0.5 mL/min
to waste
from column to MS-ESI
backpressure

MT-HPCL-MS whole cell screening system for P450 mediated steroid hydroxylation Valid from: Author: Andreas Braun Version: 1
Printed: 07/07/2012 ACIB Confidential Page 14 of 32
4.6.2. Resting, whole cell conversion
After induction, cells are centrifuged at RT and 500 g for 5 min. Cells are washed once with
water and re-suspended in 200 µL reaction buffer (100 mM potassium phosphate, pH 7,4).
The reaction is started by adding 5 µL testosterone stock solution (200 mM solved in DMSO)
to the end concentration of 10 mM. After 8 h of conversion 10 µL IS (1 mM boldenone
solved in 1:1 H2O/DMSO) is added to a final concentration of 50 µM. The reaction is
stopped by centrifugation at RT and 2000 g for 10 min. 100 µL supernatant are transferred
to fresh 96 microtiter plates and sealed with sealing tape. Samples can be stored at -20°C till
HPLC-MS analysis.
Important: To account for different growth, OD600 is measured before the reaction is
started.
As each plate contains positive and negative controls, only the relative OD600 to each other
is important.
4.6.3. OD600 measurement
Using the multichannel pipette 10 µL cell suspension is added to 90 µL H2O provided in a
96 well-plate. The plates are placed on a well-plate shaker at 2000 rpm for 5 min. The
OD600 is measured with Spectramax Platereader using the software SoftMax Pro.
SoftMax Pro
After double click on the SoftMax Pro icon on the desktop, go to “file” and “new” in the
menu bar. A new “Experiment” will pop up. Clicking on “Setup” in the ”experiment” screen
will bring up the “Instrument Settings” dialog box. OD600 is an “Endpoint” measurement. In
the “Wavelengths setup” enter the Wavelength 600 nm. “PathCheck” is left at “off”. Go to
“Automix&Blanking” and activate “Automixing” for 5 sec by activating the checkbox. Blank-
ing is not necessary as we only measure the relative OD600 of each well. “AutoCalibrate” is
left at “on”. Go to “Strips” and check that the whole plate is marked (underlined blue). If this
is not the case mark them by clicking the left mouse button at the A1 position, holding the
left mouse button and moving the mouse cursor to the A12 position. “AutoRead” is left at
“off”. Confirm the settings by clicking “Ok”. After placing the 96 well-plate in the drawer
click the “read” button to start the measurement.
To add several measurements (plates) to the same “experiment” click on “experiment” in the
menu bar and select new plate or use the key combination “Ctrl+K”. All new added plates
will have the same settings as the first plate. The grey underlined “plate bar” marks the se-
lected plate. By clicking with the left mouse button a different “plate bar” can be selected.
Clicking “read” again will start the next measurement and the OD600 date will be written in
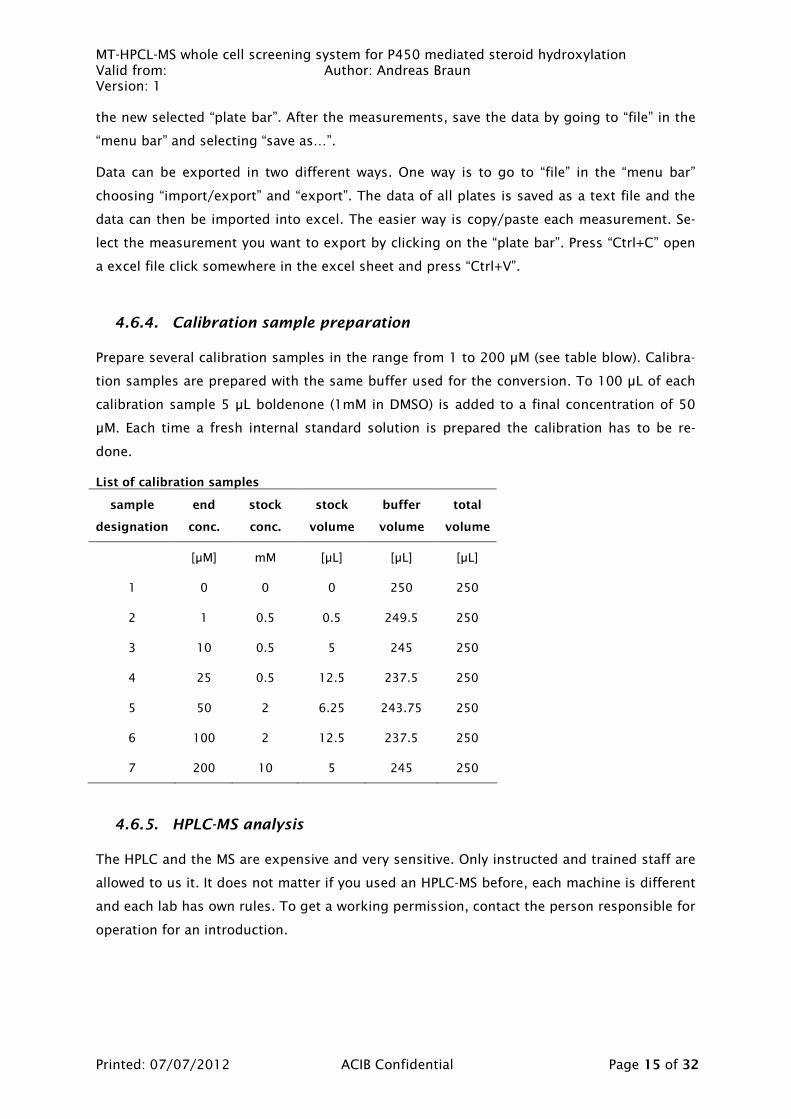
MT-HPCL-MS whole cell screening system for P450 mediated steroid hydroxylation Valid from: Author: Andreas Braun Version: 1
Printed: 07/07/2012 ACIB Confidential Page 15 of 32
the new selected “plate bar”. After the measurements, save the data by going to “file” in the
“menu bar” and selecting “save as…”.
Data can be exported in two different ways. One way is to go to “file” in the “menu bar”
choosing “import/export” and “export”. The data of all plates is saved as a text file and the
data can then be imported into excel. The easier way is copy/paste each measurement. Se-
lect the measurement you want to export by clicking on the “plate bar”. Press “Ctrl+C” open
a excel file click somewhere in the excel sheet and press “Ctrl+V”.
4.6.4. Calibration sample preparation
Prepare several calibration samples in the range from 1 to 200 µM (see table blow). Calibra-
tion samples are prepared with the same buffer used for the conversion. To 100 µL of each
calibration sample 5 µL boldenone (1mM in DMSO) is added to a final concentration of 50
µM. Each time a fresh internal standard solution is prepared the calibration has to be re-
done.
List of calibration samples
sample
designation
end
conc.
stock
conc.
stock
volume
buffer
volume
total
volume
[µM] mM [µL] [µL] [µL]
1 0 0 0 250 250
2 1 0.5 0.5 249.5 250
3 10 0.5 5 245 250
4 25 0.5 12.5 237.5 250
5 50 2 6.25 243.75 250
6 100 2 12.5 237.5 250
7 200 10 5 245 250
4.6.5. HPLC-MS analysis
The HPLC and the MS are expensive and very sensitive. Only instructed and trained staff are
allowed to us it. It does not matter if you used an HPLC-MS before, each machine is different
and each lab has own rules. To get a working permission, contact the person responsible for
operation for an introduction.
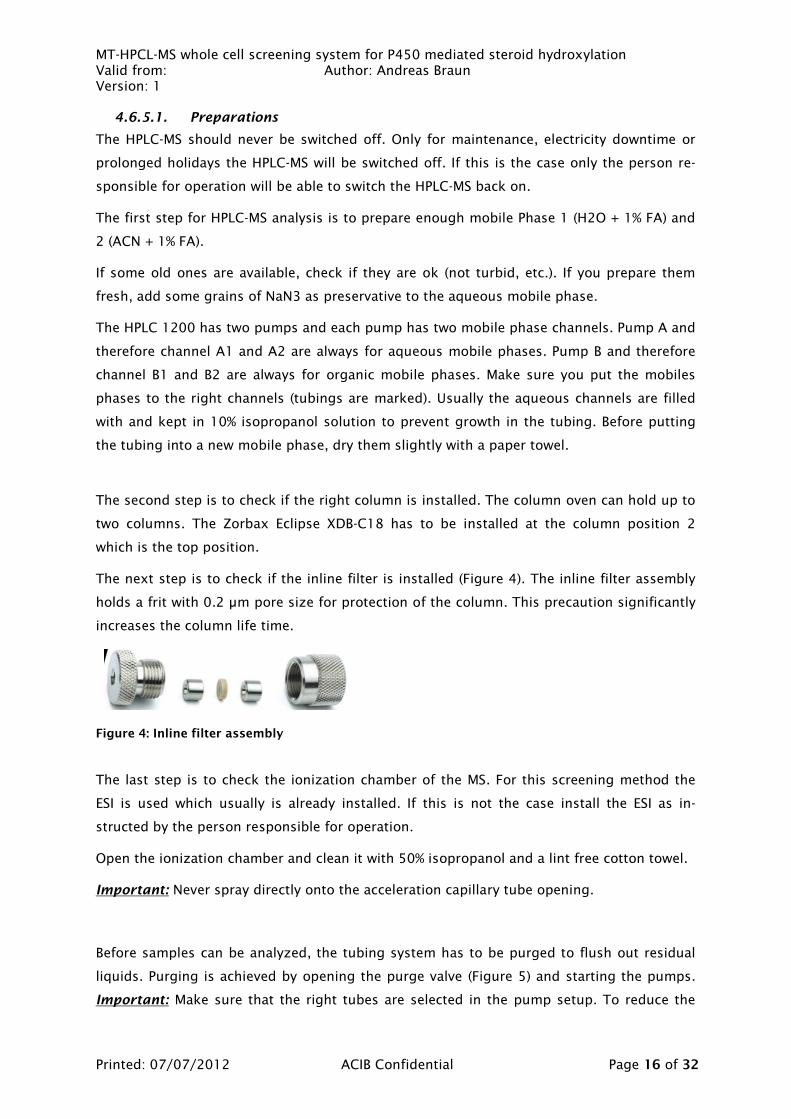
MT-HPCL-MS whole cell screening system for P450 mediated steroid hydroxylation Valid from: Author: Andreas Braun Version: 1
Printed: 07/07/2012 ACIB Confidential Page 16 of 32
4.6.5.1. Preparations
The HPLC-MS should never be switched off. Only for maintenance, electricity downtime or
prolonged holidays the HPLC-MS will be switched off. If this is the case only the person re-
sponsible for operation will be able to switch the HPLC-MS back on.
The first step for HPLC-MS analysis is to prepare enough mobile Phase 1 (H2O + 1% FA) and
2 (ACN + 1% FA).
If some old ones are available, check if they are ok (not turbid, etc.). If you prepare them
fresh, add some grains of NaN3 as preservative to the aqueous mobile phase.
The HPLC 1200 has two pumps and each pump has two mobile phase channels. Pump A and
therefore channel A1 and A2 are always for aqueous mobile phases. Pump B and therefore
channel B1 and B2 are always for organic mobile phases. Make sure you put the mobiles
phases to the right channels (tubings are marked). Usually the aqueous channels are filled
with and kept in 10% isopropanol solution to prevent growth in the tubing. Before putting
the tubing into a new mobile phase, dry them slightly with a paper towel.
The second step is to check if the right column is installed. The column oven can hold up to
two columns. The Zorbax Eclipse XDB-C18 has to be installed at the column position 2
which is the top position.
The next step is to check if the inline filter is installed (Figure 4). The inline filter assembly
holds a frit with 0.2 µm pore size for protection of the column. This precaution significantly
increases the column life time.
Figure 4: Inline filter assembly
The last step is to check the ionization chamber of the MS. For this screening method the
ESI is used which usually is already installed. If this is not the case install the ESI as in-
structed by the person responsible for operation.
Open the ionization chamber and clean it with 50% isopropanol and a lint free cotton towel.
Important: Never spray directly onto the acceleration capillary tube opening.
Before samples can be analyzed, the tubing system has to be purged to flush out residual
liquids. Purging is achieved by opening the purge valve (Figure 5) and starting the pumps.
Important: Make sure that the right tubes are selected in the pump setup. To reduce the
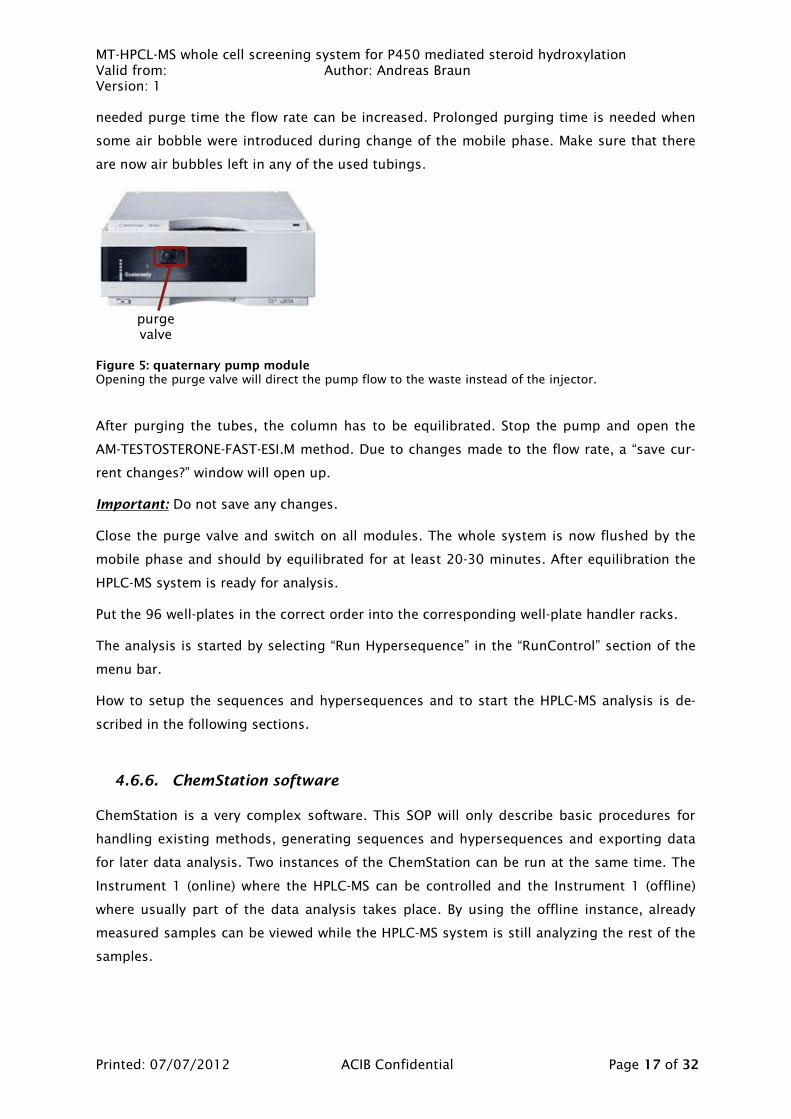
MT-HPCL-MS whole cell screening system for P450 mediated steroid hydroxylation Valid from: Author: Andreas Braun Version: 1
Printed: 07/07/2012 ACIB Confidential Page 17 of 32
needed purge time the flow rate can be increased. Prolonged purging time is needed when
some air bobble were introduced during change of the mobile phase. Make sure that there
are now air bubbles left in any of the used tubings.
Figure 5: quaternary pump module Opening the purge valve will direct the pump flow to the waste instead of the injector.
After purging the tubes, the column has to be equilibrated. Stop the pump and open the
AM-TESTOSTERONE-FAST-ESI.M method. Due to changes made to the flow rate, a “save cur-
rent changes?” window will open up.
Important: Do not save any changes.
Close the purge valve and switch on all modules. The whole system is now flushed by the
mobile phase and should by equilibrated for at least 20-30 minutes. After equilibration the
HPLC-MS system is ready for analysis.
Put the 96 well-plates in the correct order into the corresponding well-plate handler racks.
The analysis is started by selecting “Run Hypersequence” in the “RunControl” section of the
menu bar.
How to setup the sequences and hypersequences and to start the HPLC-MS analysis is de-
scribed in the following sections.
4.6.6. ChemStation software
ChemStation is a very complex software. This SOP will only describe basic procedures for
handling existing methods, generating sequences and hypersequences and exporting data
for later data analysis. Two instances of the ChemStation can be run at the same time. The
Instrument 1 (online) where the HPLC-MS can be controlled and the Instrument 1 (offline)
where usually part of the data analysis takes place. By using the offline instance, already
measured samples can be viewed while the HPLC-MS system is still analyzing the rest of the
samples.
purge valve
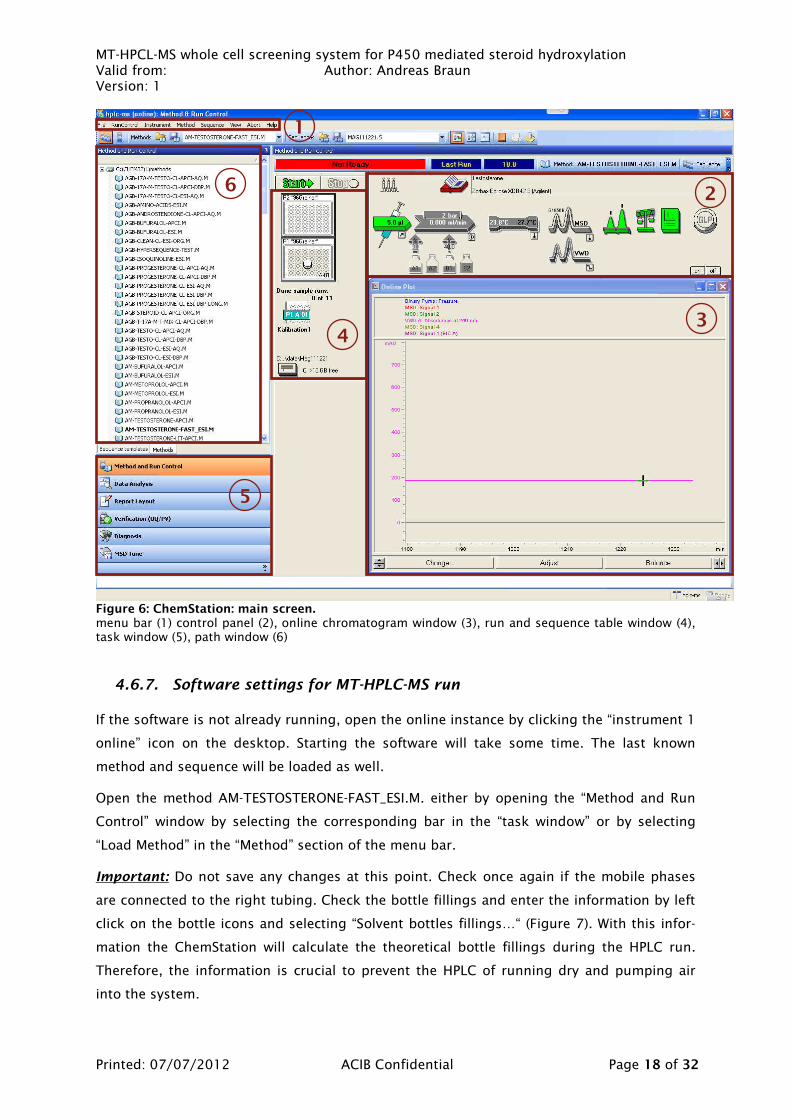
MT-HPCL-MS whole cell screening system for P450 mediated steroid hydroxylation Valid from: Author: Andreas Braun Version: 1
Printed: 07/07/2012 ACIB Confidential Page 18 of 32
Figure 6: ChemStation: main screen. menu bar (1) control panel (2), online chromatogram window (3), run and sequence table window (4), task window (5), path window (6)
4.6.7. Software settings for MT-HPLC-MS run
If the software is not already running, open the online instance by clicking the “instrument 1
online” icon on the desktop. Starting the software will take some time. The last known
method and sequence will be loaded as well.
Open the method AM-TESTOSTERONE-FAST_ESI.M. either by opening the “Method and Run
Control” window by selecting the corresponding bar in the “task window” or by selecting
“Load Method” in the “Method” section of the menu bar.
Important: Do not save any changes at this point. Check once again if the mobile phases
are connected to the right tubing. Check the bottle fillings and enter the information by left
click on the bottle icons and selecting “Solvent bottles fillings…“ (Figure 7). With this infor-
mation the ChemStation will calculate the theoretical bottle fillings during the HPLC run.
Therefore, the information is crucial to prevent the HPLC of running dry and pumping air
into the system.
1
2
3 4
5
6
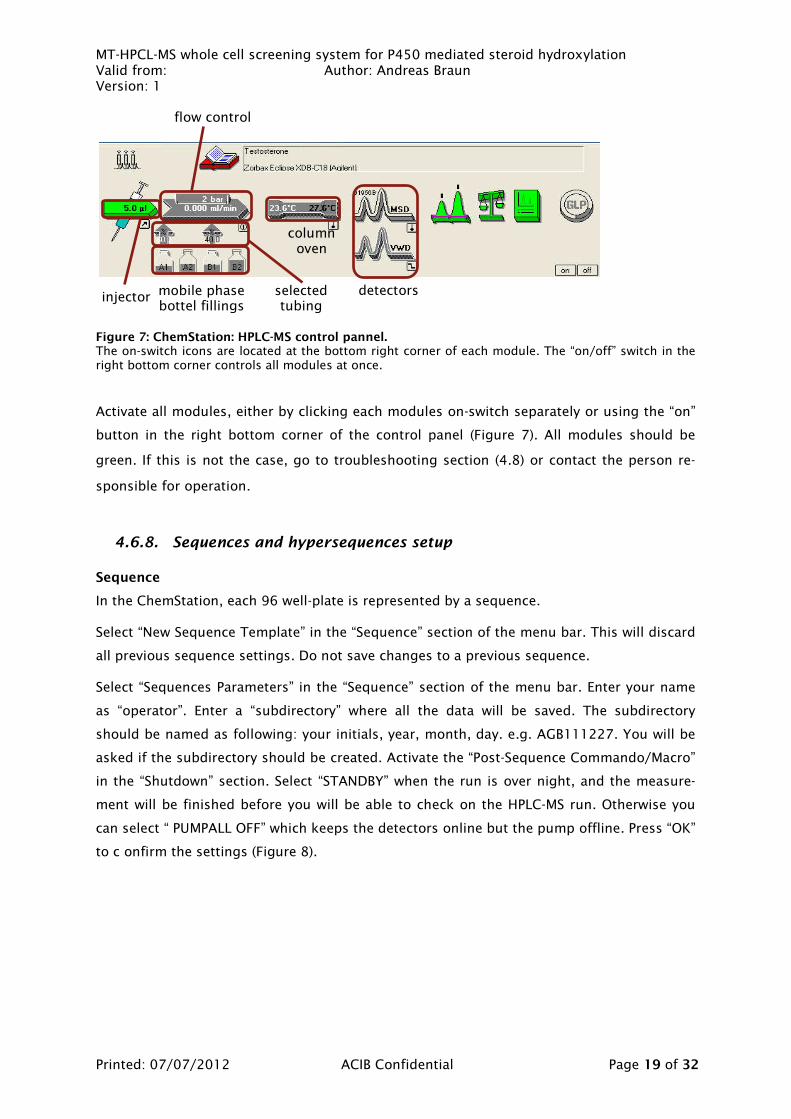
MT-HPCL-MS whole cell screening system for P450 mediated steroid hydroxylation Valid from: Author: Andreas Braun Version: 1
Printed: 07/07/2012 ACIB Confidential Page 19 of 32
Figure 7: ChemStation: HPLC-MS control pannel. The on-switch icons are located at the bottom right corner of each module. The “on/off” switch in the right bottom corner controls all modules at once.
Activate all modules, either by clicking each modules on-switch separately or using the “on”
button in the right bottom corner of the control panel (Figure 7). All modules should be
green. If this is not the case, go to troubleshooting section ( 4.8) or contact the person re-
sponsible for operation.
4.6.8. Sequences and hypersequences setup
Sequence
In the ChemStation, each 96 well-plate is represented by a sequence.
Select “New Sequence Template” in the “Sequence” section of the menu bar. This will discard
all previous sequence settings. Do not save changes to a previous sequence.
Select “Sequences Parameters” in the “Sequence” section of the menu bar. Enter your name
as “operator”. Enter a “subdirectory” where all the data will be saved. The subdirectory
should be named as following: your initials, year, month, day. e.g. AGB111227. You will be
asked if the subdirectory should be created. Activate the “Post-Sequence Commando/Macro”
in the “Shutdown” section. Select “STANDBY” when the run is over night, and the measure-
ment will be finished before you will be able to check on the HPLC-MS run. Otherwise you
can select “ PUMPALL OFF” which keeps the detectors online but the pump offline. Press “OK”
to c onfirm the settings (Figure 8).
detectors
column oven
flow control
injector selected tubing
mobile phase bottel fillings

MT-HPCL-MS whole cell screening system for P450 mediated steroid hydroxylation Valid from: Author: Andreas Braun Version: 1
Printed: 07/07/2012 ACIB Confidential Page 20 of 32
Figure 8: ChemStation: Sequence Parameters section.
Select “Sequences Table” in the “Sequence” section of the menu bar. In this section sample
locations and names are entered. Additionally the used method, times of injection sample
type and injection volume is entered.
The first row is selected and removed. Select the “Insert/FillDown Wizard” to enter all the
necessary informations (Figure 9). Plate locations are entered as “plate position in injector” +
position e.g. 2A1.
Important: For a sequence that will be integrated in a hypersequence the “position in injec-
tor” is always “2”.
Enter the location range from 2A1 to 2H12. Choose the “AM-Testosterone-Fast_esi” as
method. As “Sample name” enter an identifier corresponding to the whole plate. Enter “1” in
the “Inj./Location” field. The “Inj. volume” can be left empty. If left empty the 5 µL injection
volume set in the chosen method will by used. If for any reason you want to have a different
injection volume enter this volume here. Press “OK” to confirm the settings. The Sequence
Table will now contain 96 lines. Again press “OK” to confirm the settings. Save the sequence
by selecting “Save Sequence Table As …” in the “Sequence” section of the menu bar. Choose
a unique identifier that can be easily recognized later on.
Repeat this procedure for each plate.

MT-HPCL-MS whole cell screening system for P450 mediated steroid hydroxylation Valid from: Author: Andreas Braun Version: 1
Printed: 07/07/2012 ACIB Confidential Page 21 of 32
Figure 9: ChemStation: Sequence Table and Insert/Filldown Wizard section.
Hypersequence
Several sequences are combined to a hypersequence. Hypersequences are only available if a
well plate handler is installed.
Select “Hypersequence” and “New Hypersequence” in the “Sequence” section of the menu
bar. This will discard all previous sequence settings. Do not save changes to a previous se-
quence.
Select “Hypersequence” and “Hypersequence Parameters” in the “Sequence” section of the
menu bar. Activate the “Shutdown command” and “onError command” and put “Standby” in
the fields next to them. Select “Input” and “Output” racks. At least one rack must be marked
as the Input rack and at least one must be marked as the Output rack. If you mark four in-
put racks and one output rack, the first free input rack becomes an output rack, and so on.
Each rack can hold up to 10 “greiner” 96 well-plates. Enter a “Subdirectory” where all the
data will be saved. The subdirectory should be named as follows: your initials, year, month,
day. e.g. AGB111227 (Figure 10). Press “OK” to confirm the settings.

MT-HPCL-MS whole cell screening system for P450 mediated steroid hydroxylation Valid from: Author: Andreas Braun Version: 1
Printed: 07/07/2012 ACIB Confidential Page 22 of 32
Figure 10: ChemStation: Hypersequence Parameters.
Select “Hypersequence” and “Hypersequence Table” in the “Sequence” section of the menu
bar. Delete all existing rows. Select the “Hyperseq. Wizard”. Enter the numbers of plates to
be analyzed. Select the sequence corresponding to the first plate to be analyzed and enter
its name in the “Sequence name” field. Select AM-Testosterone-Fast_esi as “Method”. Select
the “96Greiner” as “Plate Type”. Press “OK” to confirm the settings.
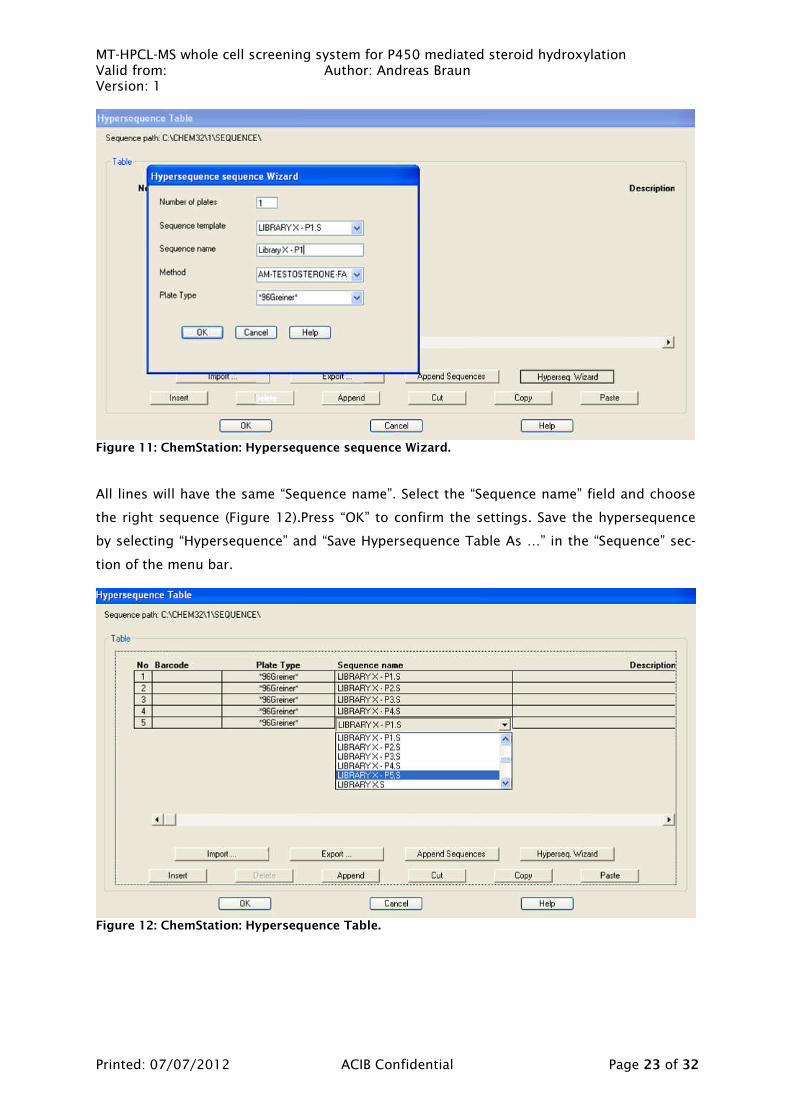
MT-HPCL-MS whole cell screening system for P450 mediated steroid hydroxylation Valid from: Author: Andreas Braun Version: 1
Printed: 07/07/2012 ACIB Confidential Page 23 of 32
Figure 11: ChemStation: Hypersequence sequence Wizard.
All lines will have the same “Sequence name”. Select the “Sequence name” field and choose
the right sequence (Figure 12).Press “OK” to confirm the settings. Save the hypersequence
by selecting “Hypersequence” and “Save Hypersequence Table As …” in the “Sequence” sec-
tion of the menu bar.
Figure 12: ChemStation: Hypersequence Table.

MT-HPCL-MS whole cell screening system for P450 mediated steroid hydroxylation Valid from: Author: Andreas Braun Version: 1
Printed: 07/07/2012 ACIB Confidential Page 24 of 32
4.7. Calculations
Calculations are done using Microsoft Excel. For that MS signals have to be integrated and peak areas exported to a text file. An excel macro is then used to import the data to a pre-pared excel sheet.
4.7.1. Export of the data from ChemStation software
Open the offline instance by clicking the “instrument 1 offline” icon on the desktop. Starting
the software will take some time. The offline instance looks the same as the online software
(Figure 6). If not already active, select “Data Analysis” in the “task window”. Open your “sig-
nals data” by clicking on the appropriate file in the “paths window” (Figure 13). Make sure
that the method used for integration is set to “Sequence Method”. Open the “Preference Dia-
log” and select “Sequence Method” in the “Signal/Review Options” and “Method used
for Reviews of Sequence Date” section.
Figure 13: ChemStation: “Data Analysis” screen. sample window (1) signals window (2), task window (3), path window (4)
1
2
3
4
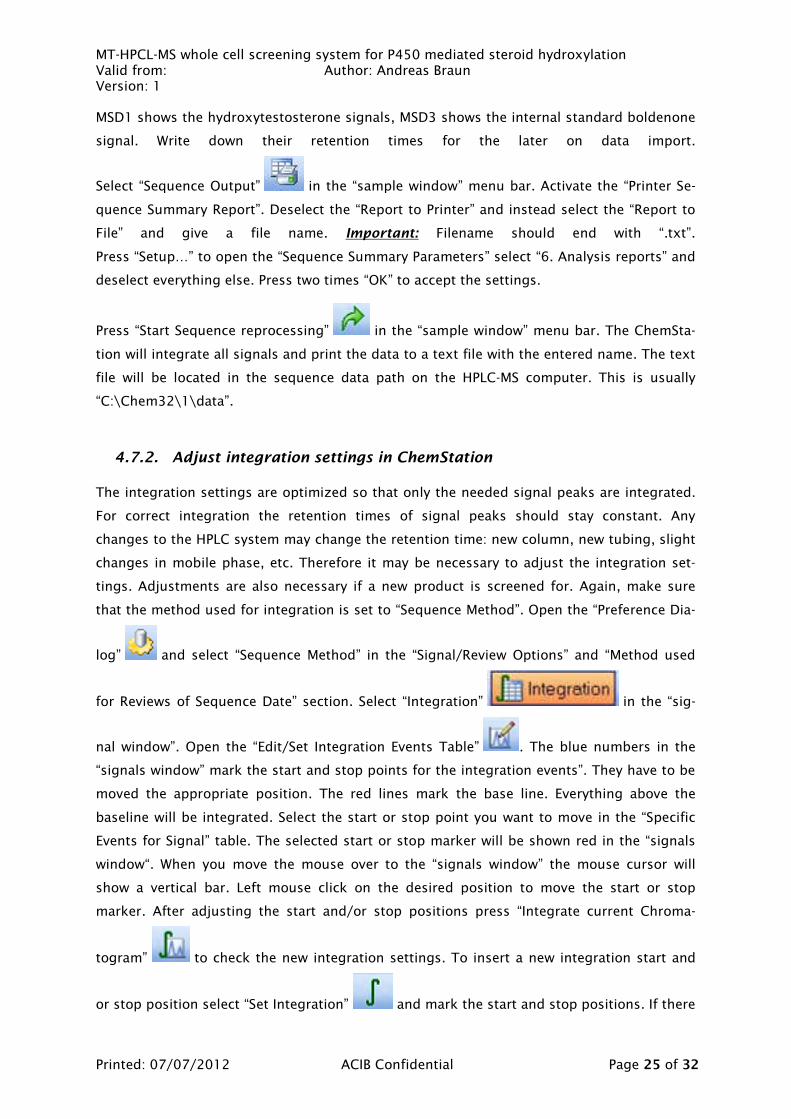
MT-HPCL-MS whole cell screening system for P450 mediated steroid hydroxylation Valid from: Author: Andreas Braun Version: 1
Printed: 07/07/2012 ACIB Confidential Page 25 of 32
MSD1 shows the hydroxytestosterone signals, MSD3 shows the internal standard boldenone
signal. Write down their retention times for the later on data import.
Select “Sequence Output” in the “sample window” menu bar. Activate the “Printer Se-
quence Summary Report”. Deselect the “Report to Printer” and instead select the “Report to
File” and give a file name. Important: Filename should end with “.txt”.
Press “Setup…” to open the “Sequence Summary Parameters” select “6. Analysis reports” and
deselect everything else. Press two times “OK” to accept the settings.
Press “Start Sequence reprocessing” in the “sample window” menu bar. The ChemSta-
tion will integrate all signals and print the data to a text file with the entered name. The text
file will be located in the sequence data path on the HPLC-MS computer. This is usually
“C:\Chem32\1\data”.
4.7.2. Adjust integration settings in ChemStation
The integration settings are optimized so that only the needed signal peaks are integrated.
For correct integration the retention times of signal peaks should stay constant. Any
changes to the HPLC system may change the retention time: new column, new tubing, slight
changes in mobile phase, etc. Therefore it may be necessary to adjust the integration set-
tings. Adjustments are also necessary if a new product is screened for. Again, make sure
that the method used for integration is set to “Sequence Method”. Open the “Preference Dia-
log” and select “Sequence Method” in the “Signal/Review Options” and “Method used
for Reviews of Sequence Date” section. Select “Integration” in the “sig-
nal window”. Open the “Edit/Set Integration Events Table” . The blue numbers in the
“signals window” mark the start and stop points for the integration events”. They have to be
moved the appropriate position. The red lines mark the base line. Everything above the
baseline will be integrated. Select the start or stop point you want to move in the “Specific
Events for Signal” table. The selected start or stop marker will be shown red in the “signals
window“. When you move the mouse over to the “signals window” the mouse cursor will
show a vertical bar. Left mouse click on the desired position to move the start or stop
marker. After adjusting the start and/or stop positions press “Integrate current Chroma-
togram” to check the new integration settings. To insert a new integration start and
or stop position select “Set Integration” and mark the start and stop positions. If there
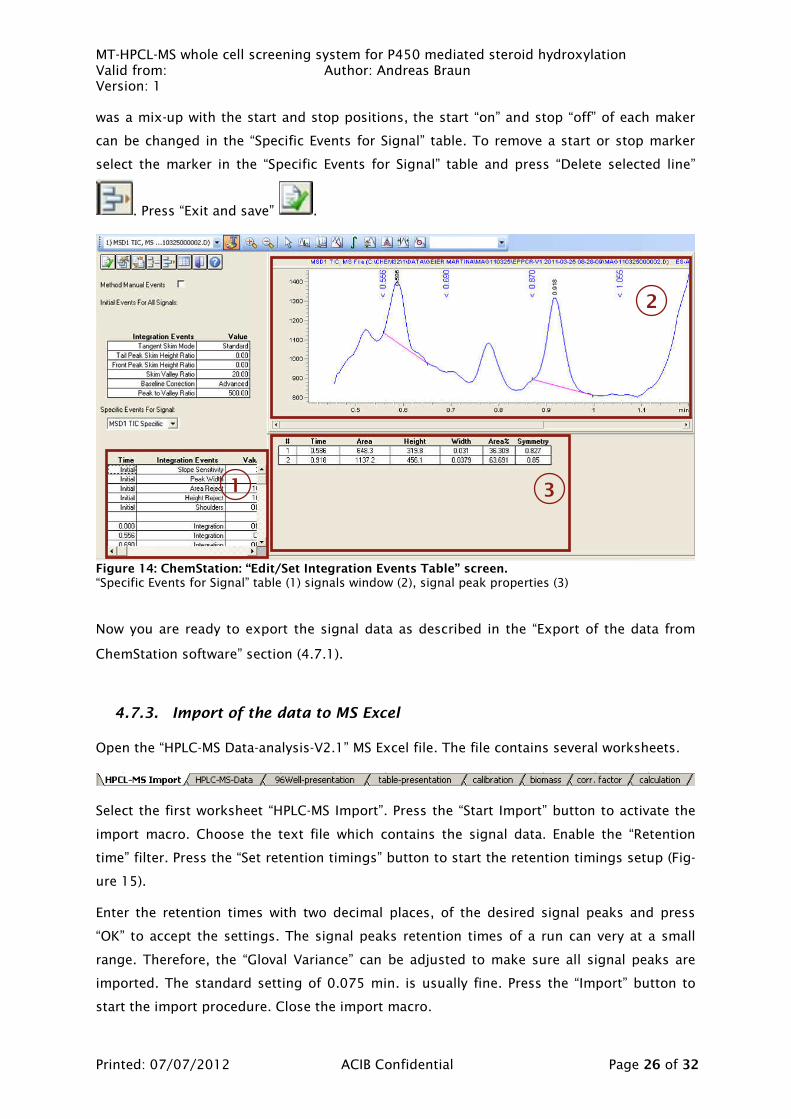
MT-HPCL-MS whole cell screening system for P450 mediated steroid hydroxylation Valid from: Author: Andreas Braun Version: 1
Printed: 07/07/2012 ACIB Confidential Page 26 of 32
was a mix-up with the start and stop positions, the start “on” and stop “off” of each maker
can be changed in the “Specific Events for Signal” table. To remove a start or stop marker
select the marker in the “Specific Events for Signal” table and press “Delete selected line”
. Press “Exit and save” .
Figure 14: ChemStation: “Edit/Set Integration Events Table” screen. “Specific Events for Signal” table (1) signals window (2), signal peak properties (3)
Now you are ready to export the signal data as described in the “Export of the data from
ChemStation software” section ( 4.7.1).
4.7.3. Import of the data to MS Excel
Open the “HPLC-MS Data-analysis-V2.1” MS Excel file. The file contains several worksheets.
Select the first worksheet “HPLC-MS Import”. Press the “Start Import” button to activate the
import macro. Choose the text file which contains the signal data. Enable the “Retention
time” filter. Press the “Set retention timings” button to start the retention timings setup (Fig-
ure 15).
Enter the retention times with two decimal places, of the desired signal peaks and press
“OK” to accept the settings. The signal peaks retention times of a run can very at a small
range. Therefore, the “Gloval Variance” can be adjusted to make sure all signal peaks are
imported. The standard setting of 0.075 min. is usually fine. Press the “Import” button to
start the import procedure. Close the import macro.
1
2
3

MT-HPCL-MS whole cell screening system for P450 mediated steroid hydroxylation Valid from: Author: Andreas Braun Version: 1
Printed: 07/07/2012 ACIB Confidential Page 27 of 32
Figure 15: HPLC-MS import MS excel macro. Macro main screen (1) Retention Timings setup screen (2)
4.7.4. Data analysis in MS Excel
The data analysis excel file is set up for up to 5 signals channels to be analyzed. For opti-
mized data handling there should be 8 rows: Position (first row), Name (second row), signal
rows (third to seventh) and internal standard (eighth and last row). After successfully import-
ing the HPLC-MS data insert the appropriate number of rows so that the internal standard is
the eight and last row (Figure 16).
Figure 16: HPLC-MS import: HPLC-MS Import worksheet.
Copy and paste the imported data at the correct position to the “HPLC-MS-DATA” worksheet.
If OD600 data was measured, copy and paste that data at the correct position to the
“OD600” worksheet, otherwise leave the values at “1”. If any correction factor needs to be
considered put them at the correct position to the “corr. factor” worksheet (Figure 17), oth-
erwise leave the values at ”1”. Enter the calibration data for each signal at the correct posi-
tion to the “calibration” worksheet.
1 2

MT-HPCL-MS whole cell screening system for P450 mediated steroid hydroxylation Valid from: Author: Andreas Braun Version: 1
Printed: 07/07/2012 ACIB Confidential Page 28 of 32
Figure 17: HPLC-MS import: corr. factor worksheet
The calculations are done in the “calculation” worksheet. The peak area of the sample sig-
nals is divided by the peak area of the internal standard signal. The axis intercept is sub-
tracted and then multiplied with the slope from the calibration. This new value is divided by
the biomass and multiplied with the correction factor, if entered. The resulting unit depends
if OD600 or cell dry weight in g/L was entered as biomass, µM/OD600 or µmol/g respec-
tively.
Results are shown as convenient 96 well-plate formats in the “96Well-presentation” work-
sheet. Enter the desired threshold above which clones are considered to be improved. This
is usually the mean value of the positive control times a desired factor. Improved clones will
be shown in green (Figure 18).
Figure 18: HPLC-MS import: 96Well-presentation worksheet

MT-HPCL-MS whole cell screening system for P450 mediated steroid hydroxylation Valid from: Author: Andreas Braun Version: 1
Printed: 07/07/2012 ACIB Confidential Page 29 of 32
4.8. Troubleshooting
Troubleshooting
Trouble Reason Solution
backpressure is to high
(pump module is red and shuts down)
set pressure limit of the column reached
- plastic columns 200 bar
- normal steal column 400 bar
- special HT steal columns 600 bar
column
back flush the column
exchange the column
exchange the in-line frit
contact the person responsible for operation
fluctuation of the backpressure probably some air is still in the
tubing or in the pump it self
prolonged purging
prolonged equilibration
fluctuation will decrease over time and should be below
plus/minus 5 bar
MS sends a shutdown signal
(all modules are red)
low drying gas pressure (N2)
N2 supply is connected to the liquid N2 tank, if the tank filling
is below a certain point the needed pressure can not be
maintained.
check if the N2 pressure is ok (gas valve between the two
HPLC)
check the N2 pressure in the liquid N2 tank next to the old
chemistry building
contact the person responsible for operation
only rack 1 and 5 can be used as input or output rack
the rack expansion is not acti-vated
Select “More Injector” and “Con-figuration…” in the “Instrument”
section of the menu bar
Klick on “Well-Plate Handler Config.>>” and activate the “Well-Plate Rack Extansion”
Press two times “OK” to confirm the settings.
software won’t start
one or several modules are not on-line
MS has some electronically problems
take a look if all the HPLC mod-ules are switched on (except the lowest one of the highest HPLC tower, this is a separate pump
module which is not needed and should be switched off)

MT-HPCL-MS whole cell screening system for P450 mediated steroid hydroxylation Valid from: Author: Andreas Braun Version: 1
Printed: 07/07/2012 ACIB Confidential Page 30 of 32
reset the MS as taught during the instruction lesson
contact the person responsible for operation
there are two rows for the same plate position
e.g. two rows for P2-C-11
used integration settings gave an additional peak in the vicinity
of one of the main peaks
reduce the “Global variance” during data import
adjust the integration settings
contact the person responsible for operation
total shutdown of all modules
(all modules are red) leak in the system
check all tubings and fittings
dry the leaked liquids
leaking sensor will take a while to dry (5-20 min)

MT-HPCL-MS whole cell screening system for P450 mediated steroid hydroxylation Valid from: Author: Andreas Braun Version: 1
Printed: 07/07/2012 ACIB Confidential Page 31 of 32
5. Safety Precautions
Please follow instructions described in “acib-Mitarbeiterleitfaden Gefahrstoff- und Laborord-
nung”
6. Documentation
Documentation
Information Location
HPLC-MS method development Dissertation Braun Andreas 2012
This handbook describes various concepts of
the Agilent ChemStation. It is intended to
increase your understanding of how the
ChemStation works.
Understanding your ChemStation – english.pdf
This presentation describes various concepts about integrating results in ChemStation.
It is intended to increase your understanding of how integration in ChemStation works.
Integrating My Results in ChemSta-tion_121008.pdf

MT-HPCL-MS whole cell screening system for P450 mediated steroid hydroxylation Valid from: Author: Andreas Braun Version: 1
Printed: 07/07/2012 ACIB Confidential Page 32 of 32
7. References
Dong, M. W. (2006). Modern HPLC for Practicing Scientists. Hoboken, NJ, USA: John Wiley & Sons, Inc.
Sambrook, J., & Russell, D. W. (2001). Molecular Cloning: A Laboratory Manual (3rd ed., p. 999). Cold Spring Harbor Laboratory.
Weis, R., Luiten, R., Skranc, W., Schwab, H., Wubbolts, M., & Glieder, A. (2004). Reliable high-throughput screening with Pichia pastoris by limiting yeast cell death phenomena. FEMS yeast research, 5(2), 179-89. Institute of Molecular Biotechnology and Research Centre Applied Biocatalysis, Petersgasse 14, A-8010 Graz, Austria.

Supplementary data 4
SOP II (Y. lipolytica)
Constructing a Y. lipolytica P450 expression strain

ACIB Protocol
Constructing a Y. lipolytica P450 expres-sion strain Author: andreas.braun [email protected]
Creation date: December. 2011

Constructing a Y. lipolytica P450 expressing strain from: Author: Andreas Braun Version: 1
Printed: 07/07/2012 ACIB Confidential Page 2 of 26
Validity: until revoked/cancelled
This ACIB protocol replaces the version from:
Developed in project/working group: EU-Project Oxygreen
Notice of modification:
Written by: Andreas Braun
Date/signature:
Checked: Martina Geier Yes
No Date/Signature
Approved by:
Constructing a Y. lipolytica P450 expressing strain from: Author: Andreas Braun Version: 1
Printed: 07/07/2012 ACIB Confidential Page 3 of 26
1. Purpose and Field of Application
A protocol for the construction of Y. lipolytica strains for functional expression of mammal-
ian P450 enzymes.
This protocol can be used for expression of any mammalian P450 system in the non-
conventional yeast Y. lipolytica. The human CYP2D6 and human CPR are described as an
example.

Constructing a Y. lipolytica P450 expressing strain from: Author: Andreas Braun Version: 1
Printed: 07/07/2012 ACIB Confidential Page 4 of 26
2. Principle
For a functional mammalian P450 system not only the P450 itself but also the flavin contain-
ing cytochrome P450 reductase (CPR) is needed. The CPR transfers required electrons from
NADPH to the cytochrome P450 during substrate conversion. In some cases the host own
CPR can sufficiently act as electron transport chain (Schiffler et al., 2004). However, in many
cases the mammalian CPRs are more effective in supplying electrons to mammalian CYPs
than other CPRs (Murakami et al., 1986).
Mammalian P450 and mammalian CPR genes are cloned into a multicopy shuttle vector and
integrated into the genome of the yeast expression host. Co-expression of both proteins
gives a functional mammalian P450 system in the host Y. lipolytica. Highest expression is
shown by Y. lipolytica clones containing multiple copies of the co-expression cassette
(Nthangeni et al., 2004).
Multicopy vectors derived from the p64ICL1 vector contain the URA3 selection marker. This
selection marker contains a degenerated ura3d4 promoter which gives only sufficient
amounts of uracil when several copies of the vector are integrated into the genome. This
allows for selection of clones with multicopy integrations or gene multiplications (Förster et
al., 2007).
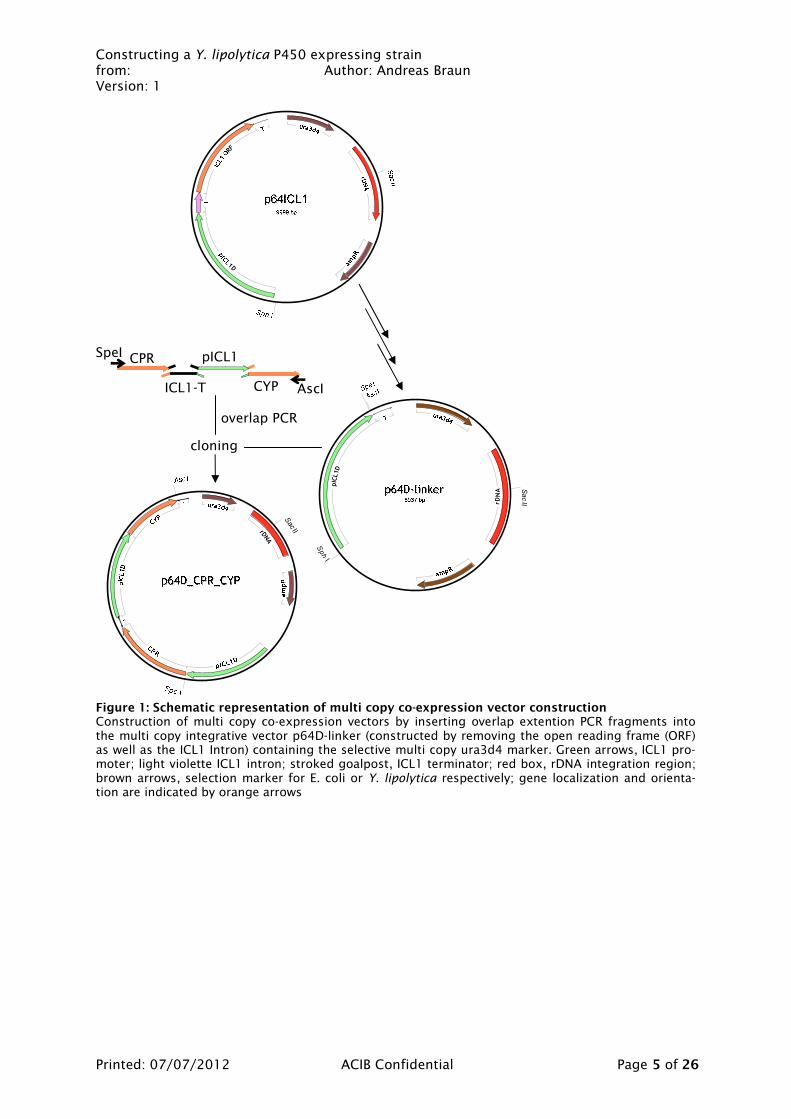
Constructing a Y. lipolytica P450 expressing strain from: Author: Andreas Braun Version: 1
Printed: 07/07/2012 ACIB Confidential Page 5 of 26
Figure 1: Schematic representation of multi copy co-expression vector construction Construction of multi copy co-expression vectors by inserting overlap extention PCR fragments into the multi copy integrative vector p64D-linker (constructed by removing the open reading frame (ORF) as well as the ICL1 Intron) containing the selective multi copy ura3d4 marker. Green arrows, ICL1 pro-moter; light violette ICL1 intron; stroked goalpost, ICL1 terminator; red box, rDNA integration region; brown arrows, selection marker for E. coli or Y. lipolytica respectively; gene localization and orienta-tion are indicated by orange arrows
rDNA
SacII
cloning
overlap PCR
SpeI
AscI
CPR pICL1D
ICL1-T CYP
rDNA
pICL1D
I
Sph
SacII
1D
RF

Constructing a Y. lipolytica P450 expressing strain from: Author: Andreas Braun Version: 1
Printed: 07/07/2012 ACIB Confidential Page 6 of 26
3. Key Words, Definitions & Abbreviations
Key words: cytochrome P450, Yarrowia lipolytica, non-conventional yeast, co-expression
Abbreviation Description AmpR ampicillin resistence gene coding for beta-
lactamases cDNA complementary DNA, is DNA synthesized from a
messenger RNA
CDW cell dry weight CPR cytochrome P450 reductase
CYP cytochrome P450 CYP2D6 human cytochrome P450 2D6
CYP3A4 human cytochrome P450 3A4 ddH2O double distilled H2O
DNA deoxyribonucleic acid dNTP desoxyribonukleosidtriphosphate
ET electron transfer EtOH or Eth ethanol
FAD flavine adenine dinucleotide FMN flavine mononucleotide
G / C guanidine, cytosine Glu glucose
GRAS generally regarded as safe HCPR human cytochrome P450 reductase
HF high fidelity ICL1 isocistrate lyase gene 1
LB Luria-Bertani LiAc lithium acetate
Lip lipide NADPH nicotinamide adenine dinucleotide phosphate
NCR NADH / NADPH cytochrome c reductase OD600 optical density measured at 600 nm
ONC over night culture PCR polymerase chain reaction
PEG polyethylene glycol rDNA ribosomal DNA
RNA ribonucleic acid RT room temperature
SOC Super Optimal broth with Catabolite repression, nutrient-rich bacterial growth medium
Str streptomycine Suc sucrose
Temp temperature Tet tetracycline
Tgl triglyceride Ura urea
WT wildtype Yl or Y. lipolytica
Yarrowia lipolytica
YlCPR Yarrowia lipolytica cytochrome P450 reductase YNB yeast nitrogen based with out amino acids, mini-
Constructing a Y. lipolytica P450 expressing strain from: Author: Andreas Braun Version: 1
Printed: 07/07/2012 ACIB Confidential Page 7 of 26
mal mineral salt media YPD yeast extract peptone dextrose, complete me-
dium for yeast growth

Constructing a Y. lipolytica P450 expressing strain from: Author: Andreas Braun Version: 1
Printed: 07/07/2012 ACIB Confidential Page 8 of 26
4. Methodology
4.1. Reagents
List of the chemicals needed
Name Formula MW Purity Supplier Order No. Comments
acetic acid CH3COOH 60.05 100 % Carl Roth GmbH,
Germany 3738.2
agar agar (Kope I)
- - - Carl Roth GmbH,
Germany 5210.2 10 g/L
agarose LE - - - Biozyme, Germany
840004
ammonium acetate
CH3COONH4 77.08 ≥98% Sigma-Aldrich, Germany
A1542-250G
ampicillin (Amp) Na-salt
C16H18N3NaO4S
371.39 ≥99% Carl Roth GmbH,
Germany K029.3
Bacto Peptone - - - BD & Co, France
211820
Bacto Yeast extract
- - - BD & Co, France
212720
bicin C6H13NO4 163.2 ≥98% Carl Roth GmbH,
Germany 9162.1
carrier DNA (fisch sperm,
MB grade) - - -
Roche Diagnos-tics, Ger-
many
11467140001
citric acid monohydrate
C6H8O2*H2O 210.14 ≥99.5 Carl Roth GmbH,
Germany 3958.1
D-glucose monohydrate
C6H12O6 * H2O 198.17 ≥99.5% Carl Roth GmbH,
Germany 6780.2
dimethylsul- (CH3)2SO 78.13 ≥99.8% Carl Roth 4720.4
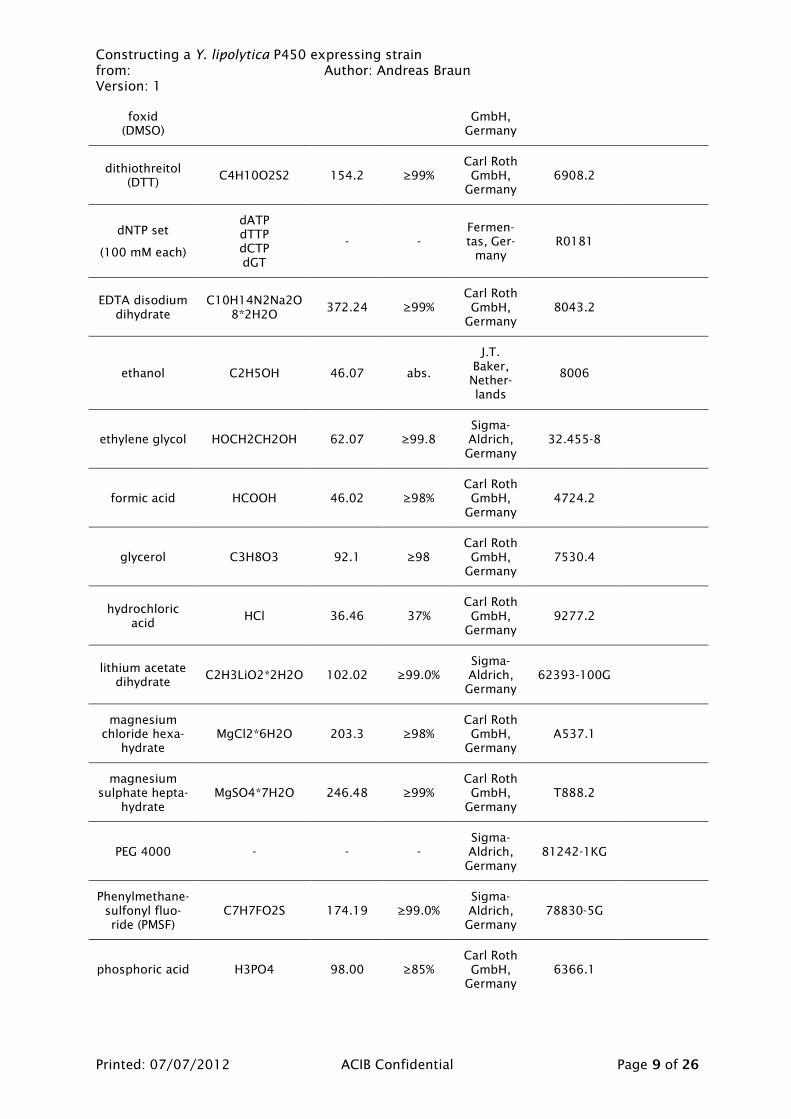
Constructing a Y. lipolytica P450 expressing strain from: Author: Andreas Braun Version: 1
Printed: 07/07/2012 ACIB Confidential Page 9 of 26
foxid (DMSO)
GmbH, Germany
dithiothreitol (DTT)
C4H10O2S2 154.2 ≥99% Carl Roth GmbH,
Germany 6908.2
dNTP set
(100 mM each)
dATP dTTP dCTP dGT
- - Fermen-tas, Ger-
many R0181
EDTA disodium dihydrate
C10H14N2Na2O8*2H2O
372.24 ≥99% Carl Roth GmbH,
Germany 8043.2
ethanol C2H5OH 46.07 abs.
J.T. Baker, Nether-lands
8006
ethylene glycol HOCH2CH2OH 62.07 ≥99.8 Sigma-Aldrich, Germany
32.455-8
formic acid HCOOH 46.02 ≥98% Carl Roth GmbH,
Germany 4724.2
glycerol C3H8O3 92.1 ≥98 Carl Roth GmbH,
Germany 7530.4
hydrochloric acid
HCl 36.46 37% Carl Roth GmbH,
Germany 9277.2
lithium acetate dihydrate
C2H3LiO2*2H2O 102.02 ≥99.0% Sigma-Aldrich, Germany
62393-100G
magnesium chloride hexa-
hydrate MgCl2*6H2O 203.3 ≥98%
Carl Roth GmbH,
Germany A537.1
magnesium sulphate hepta-
hydrate MgSO4*7H2O 246.48 ≥99%
Carl Roth GmbH,
Germany T888.2
PEG 4000 - - - Sigma-Aldrich, Germany
81242-1KG
Phenylmethane-sulfonyl fluo-ride (PMSF)
C7H7FO2S 174.19 ≥99.0% Sigma-Aldrich, Germany
78830-5G
phosphoric acid H3PO4 98.00 ≥85% Carl Roth GmbH,
Germany 6366.1

Constructing a Y. lipolytica P450 expressing strain from: Author: Andreas Braun Version: 1
Printed: 07/07/2012 ACIB Confidential Page 10 of 26
Phusion High-Fidelity DNA Polymerase
- - - NEB,
England M0530L
potassium chlo-ride
KCl 74.56 ≥99% Carl Roth GmbH,
Germany P017.1
potassium di-hydrogene-phosphate
KH2PO4 136.09 ≥99% Carl Roth GmbH,
Germany 3904.1
potassium hy-drogene-
phosphate K2HPO4 174.18 ≥98%
Carl Roth GmbH,
Germany 6875.1
potassium hy-droxide
KOH 56.11 ≥85% Carl Roth GmbH,
Germany 6751.1
restriction en-zymes
SpeI (BcuI)
AscI (SgsI)
SacII (Cfr42I)
- - Fermen-tas, Ger-
many
ER1251
ER1891
ER0201
sodium acetate CH3COONa 82.03 ≥99% Carl Roth GmbH,
Germany 6773.2
sodium chloride NaCl 58.44 ≥99.8% Carl Roth GmbH,
Germany 9265.1
sodium hydrox-ide
NaOH 40.00 ≥98% Carl Roth GmbH,
Germany P031.2
sorbitol (sorbit) C6H14O6 182.18 ≥98% Carl Roth GmbH,
Germany 6213.2
Tris C4H11NO3 121.14 ≥99.3% Carl Roth GmbH,
Germany AE15.3
tri-sodium cit-rate dihydrate
C6H5Na3O7*2H2O
294.1 ≥99% Carl Roth GmbH,
Germany 3580.1
Trypton / Peptone
- - - Carl Roth GmbH,
Germany 8952.2
Yeast extract - - - Carl Roth GmbH,
Germany 2363.2
YNB - - - BD & Co, France
291920

Constructing a Y. lipolytica P450 expressing strain from: Author: Andreas Braun Version: 1
Printed: 07/07/2012 ACIB Confidential Page 11 of 26
4.2. Solutions
List of the solutions needed to perform the method
Name Ingredients Comments
ammonium acetate (pH 5.0,
10 mM)
0.7708 g ammonium acetate, acetic acid till pH 5.0, to 1 L with ddH2O
ampicillin Stock
(Amp)
100 mg/mL dissolved in H2O
100 µg/mL final concentration
BEDS solution 1.63 g bicin ( 10 mM), NaOH till pH 7.3, 192 g sorbitol ( 1 M),
30 mL ethylene glycol, 50 mL DMSO, to 1 L with ddH2O
D-glucose solu-tion
20%: 220 g D-glucose monohydrate, to 1 L with ddH2O
dithiothreitol (DTT)
1 M: 1.542 g dithiothreitol, to 10 mL with ddH2O
2 M: 3.08 g dithiothreitol, to 10 mL with ddH2O
dNTP mix
(2 mM each)
25 µL dATP, 25 µL dTTP, 25 µL dCTP, 25 µL dGT, to 1250 µL ddH2O
EDTA disodium dihydrate (pH
8.0)
1 M: 3.72 g EDTA disodium dihydrate, NaOH till pH 8.0, to 10 mL with ddH2O
0.2 M: 3.72 g EDTA disodium dihydrate, NaOH till pH 8.0, to 50 mL with ddH2O
ethanol (75%) 30 mL ethanol (100%), to 40 mL with ddH2O
LB medium (Luria-Bertani)
10 g tryptone, 5 g yeast extract, 5 g NaCl, to 1 L with ddH2O
solid form by adding 15 g/L agar
lithium acetate (pH 6.0, 100
mM)
10.2 g lithium acetate dehydrate, acetic acid till pH 6.0, to 1 L with ddH2O
PEG4000 (40%) 4 g PEG4000, to 10 mL with lithium acetate (100 mM)
potassium phosphate buffer (KPi-
buffer, different pH)
pH 6.5, 1 M: 57.39 g K2HPO4, 90.57 g KH2PO4, to 1 L with ddH2OpH
7.4, 1M: 139.69 g K2HPO4, 26.95 g KH2PO4, to 1 L with ddH2O
+ KOH for phosphoric acid till desired pH
SOC
20 g bacto peptone, 5 g bacto yeast extract, 0.58 g NaCl, 0.18 g KCl, 2 g MgCl2 x 6H2O, 2.46 g MgSO4 x 7H2O, 100 mL D-
glucose (3.81g D-glucose monohydrate in 100 mL), to 1L with ddH2O
autoclave D-glucose sepa-
rately
sodium acetate 4.92 g sodium acetate, to 20 mL with ddH2O

Constructing a Y. lipolytica P450 expressing strain from: Author: Andreas Braun Version: 1
Printed: 07/07/2012 ACIB Confidential Page 12 of 26
(3 M)
sodium citrate buffer (pH 4.0,
500 mM)
65.56 g citric acid monohydrate, 27.62 g tri-sodium citrate monohydrate, NaOH till pH 4.0, to 1L with ddH2O
or
105.08 g citric acid monohydrate, NaOH till pH 4.0, to 1L with ddH2O
sorbitol (1 M) 18.2 g sorbitol, to 100 mL with ddH2O
TE-Buffer (pH 8.0)
1.21 g tris ( 10 mM), 0.37 g EDTA disodium dehydrate ( 1 mM), HCl or NaOH till pH 8.0, to 1 L with ddH2O
Tris-HCl
(pH 7.0, 100 mM)
12.1 g Tris diluted, to 1 L with ddH2O
pH adjusted with 1 M HCl
YNB Difco (yeast nitrogen base , composi-
tion)
5 g ammonium sulfate, 2 µg biotin, 0.4 mg calcium pantothen-ate, 2 µg folic acid, 2 mg inositol, 0,4 mg niacin, 0.2 mg p-
aminobenzoic acid, 0.4 mg pyridoxine hydrochloride, 0.2 mg riboflavin, 0.4 thiamine hydrochloride, 0.5 mg boric acid, 40 µg copper sulfate, 0.1 mg potassium iodide, 0.2 mg iron chloride, 0.4 mg manganese sulfate, 0.2 mg sodium molybdate, 0.4 mg zinc sulfate, 1 g potassium dihydrogene-phosphate, 0.5 g mag-nesium sulfate, 0.1 g sodium chloride, 0.1 g calcium chloride, to
1 L with H2O
Supplier: BD Biosciences
YNB solution (10x)
67 g YNB Difco, to 1 L with ddH2O sterilization by
filtration
YNBG
(different glu-cose concentra-
tions)
1%: 100 mL YNB (10x), 50 mL D-glucose (20%) and 200 mLKPi-Buffer (1M, pH 6.5), to 1 L with ddH2O
0.6%: 100 mL YNB (10x), 30 mL D-glucose (20%) and 200 mL KPi-Buffer (1M, pH 6.5), to 1 L with ddH2O
solid form by adding 15 g/L agar
autoclave D-glucose sepa-
rately
YPD (pH 4.0)
20 g tryptone (peptone), 10 g yeast extract, 100 mL D-glucose (20%), optional: 100 mL sodium citrate buffer (pH 4.0, 500 mM)
to 1 L with ddH2O
solid form by adding 15 g/L agar
autoclave D-glucose sepa-
rately

Constructing a Y. lipolytica P450 expressing strain from: Author: Andreas Braun Version: 1
Printed: 07/07/2012 ACIB Confidential Page 13 of 26
4.3. Materials
Description of materials needed to perform the method
Name Supplier Order No. Comments
Cellstar Tubes (15 mL) Greiner bio-one,
Germany 188271 Greinis
Cellstar Tubes (50 mL) Greiner bio-one,
Germany 210261 Greinis
CloneJETTM PCR Cleaning Kit Fermentas, Germany
# K1232
Cuvettes (10x4x45mm) Sarstedt, Ger-
many 67.742
Electroporation Cuvettes (2mm gap)
cellprojects Lt., UK
EP-102
GeneJETTM Plasmid Miniprep Kit Fermentas, Germany
# K0702
MF-Milipore Membrane Filters (0.025µm)
Millipore, Ger-many
VSWP01300
PCR Reaction Tubes (0.2 mL) Biozyme Scien-
tific GmbH, germany
711068
Petri Dish Greiner bio-one,
Germany 633180
Reaction tubes (1.5 mL) Greiner bio-one,
Germany 616 201 Eppis
Reaction tubes (2 mL) Eppendorf AG,
Germany 0030125.150 Eppis
Serological Pipette (10 mL) Sarstedt, Ger-
many 86.1254.001
Serological Pipette (25 mL) Greiner bio-one,
Germany 760 180
Serological Pipette (5 mL) Sarstedt, Ger-
many 86.1253.001
Tips, 10 µL Biozyme Scien-
tific GmbH, Germany
720031
Tips, 1000 µL Greiner, Ger-
many 740290

Constructing a Y. lipolytica P450 expressing strain from: Author: Andreas Braun Version: 1
Printed: 07/07/2012 ACIB Confidential Page 14 of 26
Tips, 200 µL Biozyme Scien-
tific GmbH, Germany
760201
Toothpicks PAPSTRAR, Ger-
many 12713
bought at a local ven-dor
Wizard ® SV Gel and PCR Clean-Up System
Promega, USA # A9282
Primers for construction of co-expression Vector containing CYP2D6-WT and HCPR-WT
name Sequence info
T_ol_pD_rv CAAGTATGTCCATCTCGAG-
GATCCGTAAAGTCACGATAGCTTAAC
pD_ol_T_fw CTATCGTGACTTTACGGATCCTCGA-
GATGGACATACTTGTATCGTC
ICL1-Terminator overlap with ICL1-Promoter
p_ol_2D6WT_rv
GTGCTTCTAGCCCCATTTTTTGTATGCTTGG
TCAGTCTACTGG
2D6WT_ol_p_fw
CTGACCAAGCATACAAAAAATGGGGCTA-
GAAGCACTGGTG
ICL1-Promoter overlap with 2D6WT
HCPR-WT_ol_T_rv
GCTAAACAAACTGCCTAGCTCCA-
CACGTCCAGGG
T_ol_HCPR-WT_vw
GGACGTGTGGAGCTAGGCAGTTTGTTTAG-
CAAAATATATTTAACG
WT Human CPR overlap with ICL1-Terminator
HCPR-WT_SpeI_fw
AAAAACTAGTGCCACCATGGGA-
GACTCCCACGTGG
2D6_WT_rv TTTTGGCGCGCCCTAGCGGGGCACAGCAC
Amplification of the whole overlap ex-tension PCR fragment
Y. lipolytica strain for co-expression of CYP2D6-WT and HCPR-WT
Y. lipolytica strains
Genotype Phenotype Reference
H222-S4 MATA, ura3-302a Ura-, Alk+, Tgl+,
Lip+, Eth+, Glu+ ,Suc+
(Mauersberger et al., 2001)
strain collection Institute of mo-lecular biotech-
nology
Nr. 3595

Constructing a Y. lipolytica P450 expressing strain from: Author: Andreas Braun Version: 1
Printed: 07/07/2012 ACIB Confidential Page 15 of 26
Plasmids used for construction of co-expression Vector containing CYP2D6-WT and HCPR-WT
Plasmid Description Marker gene
(selection in yeast) Reference
ID30915411
ID7262313
cDNA wild-type human cytochrome P450 2D6 (2D6-WT)
cDNA wild-type human cytochrome P450 reductase (HCPR-WT)
BioCat GmbH,
Germany
pJet1.2 Cloning vector Fermentas, Germany
p64D-linker Cloning and expression vector ura3d4 (mc)
(Braun et al., unpublished)
EC22
strain collection Institute of
molecular bio-technology
Nr. 6220
4.4. Apparatus
Description of the instruments needed to perform the test and specifications
Name Supplier Comments
BioPhotometer Eppendorf AG, Germany
Centrifuge 5810 Eppendorf AG, Germany
Gene PulserTM BIO-RAD, USA
GeneAmp®PCR System 2700 Applied Biosystems, USA
HT MiltronII shaker Infors AG, Swiss
Pipetboy Eppendorf AG, Germany
PowerPacTM Basic + Sub-Cell GT Biorad, USA
Thermomixer comfort Eppendorf AG, Germany
Vortex-Genie 2 Scientific Industries Inc, USA
Waterbath LAUDA, Germany
Nanodrop 2000 Thermo Scientific, USA
Centrifuge 5415 R + A-4-62 rotor
Eppendorf AG, Germany
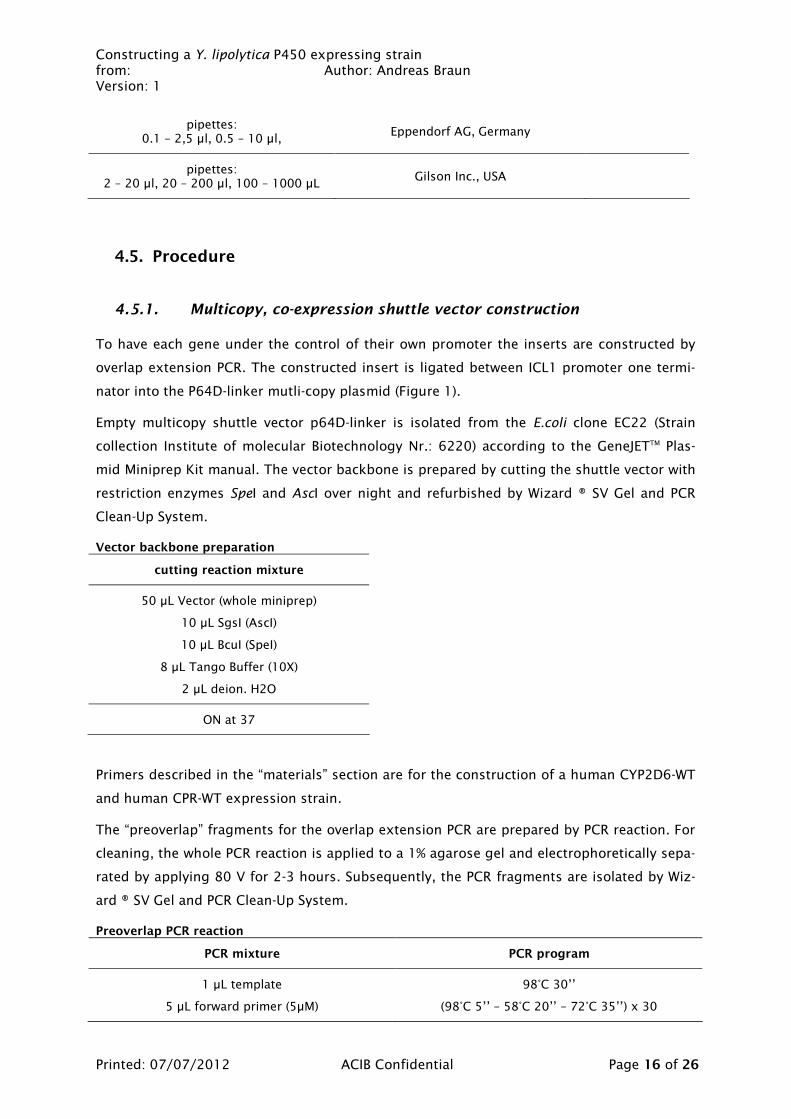
Constructing a Y. lipolytica P450 expressing strain from: Author: Andreas Braun Version: 1
Printed: 07/07/2012 ACIB Confidential Page 16 of 26
pipettes: 0.1 – 2,5 µl, 0.5 – 10 µl,
Eppendorf AG, Germany
pipettes: 2 – 20 µl, 20 – 200 µl, 100 – 1000 µL
Gilson Inc., USA
4.5. Procedure
4.5.1. Multicopy, co-expression shuttle vector construction
To have each gene under the control of their own promoter the inserts are constructed by
overlap extension PCR. The constructed insert is ligated between ICL1 promoter one termi-
nator into the P64D-linker mutli-copy plasmid (Figure 1).
Empty multicopy shuttle vector p64D-linker is isolated from the E.coli clone EC22 (Strain
collection Institute of molecular Biotechnology Nr.: 6220) according to the GeneJETTM Plas-
mid Miniprep Kit manual. The vector backbone is prepared by cutting the shuttle vector with
restriction enzymes SpeI and AscI over night and refurbished by Wizard ® SV Gel and PCR
Clean-Up System.
Vector backbone preparation
cutting reaction mixture
50 µL Vector (whole miniprep)
10 µL SgsI (AscI)
10 µL BcuI (SpeI)
8 µL Tango Buffer (10X)
2 µL deion. H2O
ON at 37
Primers described in the “materials” section are for the construction of a human CYP2D6-WT
and human CPR-WT expression strain.
The “preoverlap” fragments for the overlap extension PCR are prepared by PCR reaction. For
cleaning, the whole PCR reaction is applied to a 1% agarose gel and electrophoretically sepa-
rated by applying 80 V for 2-3 hours. Subsequently, the PCR fragments are isolated by Wiz-
ard ® SV Gel and PCR Clean-Up System.
Preoverlap PCR reaction
PCR mixture PCR program
1 µL template
5 µL forward primer (5µM)
98°C 30’’
(98°C 5’’ – 58°C 20’’ – 72°C 35’’) x 30

Constructing a Y. lipolytica P450 expressing strain from: Author: Andreas Braun Version: 1
Printed: 07/07/2012 ACIB Confidential Page 17 of 26
5 µL reverse p (5µM)
5 µL dNTPmix (2mM each)
10 µL Phusion Buffer HF 5x
23,5 µL deion. H2O
0,5 µL Phusion Polymerase (NEB)
72°C 10’
4°C ∞
The overlap extension PCR is done in two steps. The first step is the actual overlap PCR. All
fragments are added to the PCR reaction mix and the PCR is run for 20 cycles using Phusion
Polymerase. After the first step flanking primers are added to the reaction and the PCR is
run for another 35 cycles. This PCR construct is again subject to cleaning by applying it to a
1% agarose gel and electrophoretically separate it by applying 80 V for 2-3 hours. Subse-
quently, the overlap construct is isolated by Wizard ® SV Gel and PCR Clean-Up System.
Overlap PCR reaction
PCR mixture PCR program
1 µL ol-temp HCPR-WT_ol_T
1 µL ol-temp ol_HCPR-WT_T_ol_pD
1 µL ol-temp ol_T _pD_ ol_2D6WT
1 µL ol-temp ol_p_2D6WT (long)
5 µL dNTPmix (2mM each)
10 µL Phusion Buffer HF 5x
30,5 µL deion. H2O
0,5 µL Phusion Polymerase (NEB)
+ (after 20 cycles)
5 µL Primer HCPR-WT_SpeI_fw (5µM)
5 µL Primer 2D6_WT_rv (5µM)
4 µL Phusion Buffer HF 5x
2 µL dNTPmix (2mM each)
3,5 µL deion. H2O
0,5 µL Phusion Polymerase (NEB)
98°C 30’’
(98°C 5’’ – 69°C 20’’– 72°C 3’) x 20
72°C 5’
4°C ∞
98°C 30’’
(98°C 5’’ – 69°C 20’’ – 72°C 3’) x 35
72°C 5’
4°C ∞
The overlap extension PCR fragment is then cloned into pJet1.2 according to manufacturer’s
instructions using the CloneJET™ PCR Cloning Kit. Ligation is done at RT for 30 min. After-
wards the ligase is inactivated by incubation at 65°C for 10 min. The ligation reaction mix is
desalted by applying the mix 30 min to milipore dialysis membranes floating on ddH2O.
The mix is then directly used for transformation into electro competent E.Coli cells. 80 µL
competent cells are towed on ice. 2.5 µL desalted ligation mix is added and incubated on ice
for 2-5 min. The cell mixture is transferred to an electroporation cuvette. The cuvette is
pulsed by with Gene PulserTM by applying a current of 1.25 kv/mm while resistance and ca-

Constructing a Y. lipolytica P450 expressing strain from: Author: Andreas Braun Version: 1
Printed: 07/07/2012 ACIB Confidential Page 18 of 26
pacitance are kept constant at 200 Ω and 25 µF, respectively. Subsequently, 920 µL SOC-
media are added and the cell suspension transferred to a 1.5 mL eppi. The cell suspension
is incubated 1 h at 37°C and afterwards aliquots are plated on LB-Amp agar plates. The
plates are incubated at 37°C over night. Positive clones are picked, plasmid isolated accord-
ing to the GeneJETTM Plasmid Miniprep Kit manual and send for sequencing to confirm the
sequence.
pJet cloning
ligation reaction mix
5,0 µL Buffer (2)
0,5 µL pJet1.2 vector (3000bp, ca 25 ng)
1,0 µL overlap extension PCR fragment (6000bp)
3,0 µL H2O deion.
0,5 µL T4 DNA ligase
30 min at RT
heat inactivation at 65°C for 10 min
desalting via Milipore Membrane (30 min)
2,5 to 5 µL used for transformation in to e-
competent E.Coli Top10F’ cells
After confirming the sequence, the co-expression insert is prepared by cutting the pJet vec-
tor with restriction enzymes SpeI and AscI over night and refurbished by applying it to a 1%
agarose gel and electrophoretically separate the insert by applying 80 V for 2-3 hours. Sub-
sequently, the insert is isolated by Wizard ® SV Gel and PCR Clean-Up System by Wizard ® SV
Gel and PCR Clean-Up System.
The concentration of the co-expression insert and the multicopy vector backbone is deter-
mined using the Nanodrop 2000. The concentrations for the ligation are adjusted in the way
that the molar ration between vector backbone and insert is 1:3. The ligation, transforma-
tion and isolation are done as described above for the pJet cloning.
Ligation reaction of p64D-HCPR-WT-2D6WTlg
ligation reaction mixture
2µL Ligase Buffer Fermentas (10x 1x)
1µL T4 DNA Ligase Fermentas
1,0 µL Insert (Ol-PCR fragment, ca. 140 ng)
2,5 µL Vectorbackbone (ca. 50 ng)
13,0 µL H2O
ON at RT
10 min at 65°C heat inactivation
desalting with Millipor membrane filter
5µL, transformation direct into electro compe-tent cells (E.Coli)
The co-expression cassette is linearized with the restriction enzyme SacII. For optimal func-
tionality of the restriction enzyme a second cutting site is recommended. This can be
achieved by adding a small oligonucleotide sequence containing a SacII cutting site. Lineari-
zation is done over night at 37°C. The restriction enzyme is inactivated by incubation at
65°C for 10 min and refurbished by Wizard ® SV Gel and PCR Clean-Up System. To prepare
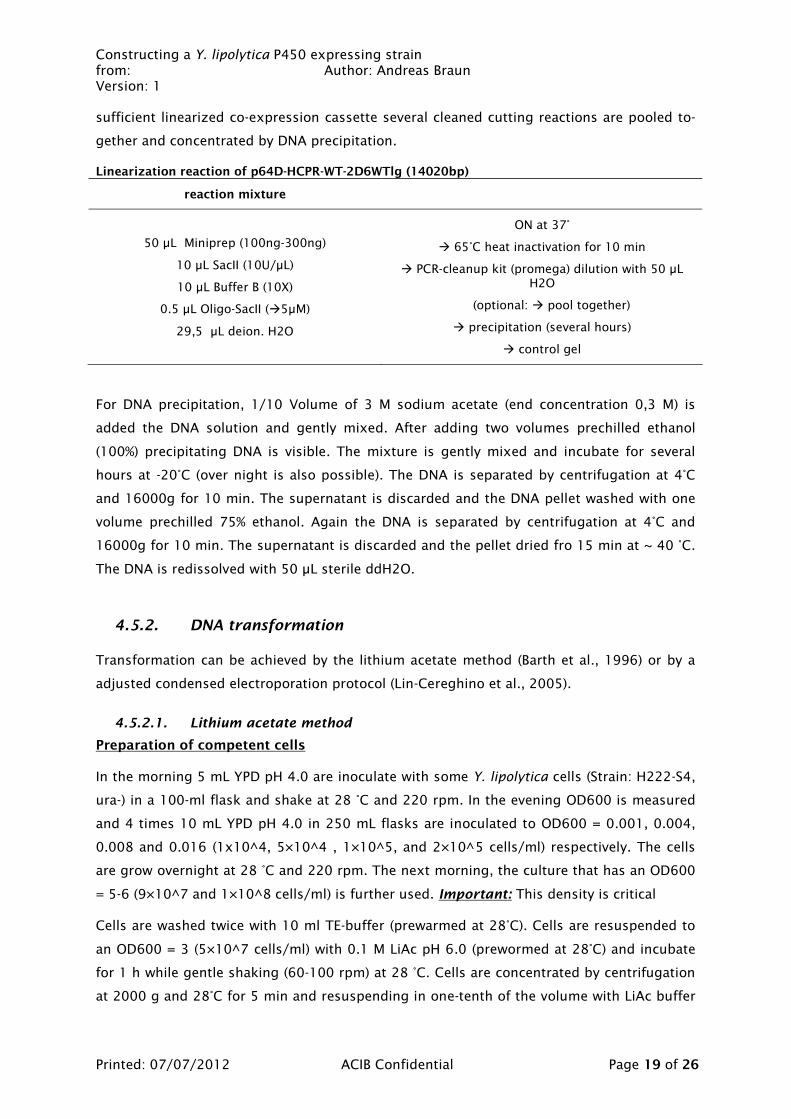
Constructing a Y. lipolytica P450 expressing strain from: Author: Andreas Braun Version: 1
Printed: 07/07/2012 ACIB Confidential Page 19 of 26
sufficient linearized co-expression cassette several cleaned cutting reactions are pooled to-
gether and concentrated by DNA precipitation.
Linearization reaction of p64D-HCPR-WT-2D6WTlg (14020bp)
reaction mixture
50 µL Miniprep (100ng-300ng)
10 µL SacII (10U/µL)
10 µL Buffer B (10X)
0.5 µL Oligo-SacII (5µM)
29,5 µL deion. H2O
ON at 37°
65°C heat inactivation for 10 min
PCR-cleanup kit (promega) dilution with 50 µL H2O
(optional: pool together)
precipitation (several hours)
control gel
For DNA precipitation, 1/10 Volume of 3 M sodium acetate (end concentration 0,3 M) is
added the DNA solution and gently mixed. After adding two volumes prechilled ethanol
(100%) precipitating DNA is visible. The mixture is gently mixed and incubate for several
hours at -20°C (over night is also possible). The DNA is separated by centrifugation at 4°C
and 16000g for 10 min. The supernatant is discarded and the DNA pellet washed with one
volume prechilled 75% ethanol. Again the DNA is separated by centrifugation at 4°C and
16000g for 10 min. The supernatant is discarded and the pellet dried fro 15 min at ~ 40 °C.
The DNA is redissolved with 50 µL sterile ddH2O.
4.5.2. DNA transformation
Transformation can be achieved by the lithium acetate method (Barth et al., 1996) or by a
adjusted condensed electroporation protocol (Lin-Cereghino et al., 2005).
4.5.2.1. Lithium acetate method
Preparation of competent cells
In the morning 5 mL YPD pH 4.0 are inoculate with some Y. lipolytica cells (Strain: H222-S4,
ura-) in a 100-ml flask and shake at 28 °C and 220 rpm. In the evening OD600 is measured
and 4 times 10 mL YPD pH 4.0 in 250 mL flasks are inoculated to OD600 = 0.001, 0.004,
0.008 and 0.016 (1x10^4, 5×10^4 , 1×10^5, and 2×10^5 cells/ml) respectively. The cells
are grow overnight at 28 °C and 220 rpm. The next morning, the culture that has an OD600
= 5-6 (9×10^7 and 1×10^8 cells/ml) is further used. Important: This density is critical
Cells are washed twice with 10 ml TE-buffer (prewarmed at 28°C). Cells are resuspended to
an OD600 = 3 (5×10^7 cells/ml) with 0.1 M LiAc pH 6.0 (prewormed at 28°C) and incubate
for 1 h while gentle shaking (60-100 rpm) at 28 °C. Cells are concentrated by centrifugation
at 2000 g and 28°C for 5 min and resuspending in one-tenth of the volume with LiAc buffer

Constructing a Y. lipolytica P450 expressing strain from: Author: Andreas Braun Version: 1
Printed: 07/07/2012 ACIB Confidential Page 20 of 26
to obtain around OD = 30 (5×10^8 cells/ml) These competent cells can by directly used for
transformation.
Note: Competent cells can be stored at -80°C. However, to obtain highest transformation
efficiencies, competent cells should be prepared fresh. Especially when going for multicopy
integration
Transformation
All operations are performed on ice. 0.5-1 µg of transforming DNA (linearized Vector) in 1-5
µL are placed at the bottom of a 2 ml reaction tube. The DNA is heat shocked at 95°C for
5min and placed immediately on ice. 5 µL denatured carrier DNA (heat shocked for 5min at
95°C and place on ice) is added to the transforming DNA. 100 µL competent cells are added
and gently mixed and incubated at 28°C for 15 min without shaking. Attention: the cells are
very sensitive, cut of the tip of the tips.
Cells are again gently mixed and 0.7 ml 40 % PEG 4000 is added, the mixture gently mixed
and incubate for 1 h at 28 °C, while shaking (rotary shaker at 100 rpm). The cell suspension
is heatshocked at 39 °C for 10 min in a water bath. Afterwards 1.2 ml 0.1 M LiAc buffer pH
6.0 is added in two portions and gently mixed. Aliquots of 200 µL are plated on selective
YNBG agar plates and incubated at 28°C. Y. lipolytica transformants are selected for ura+
phenotypes.
Single copy transformants appear after 1–2 days while multicopy transformants appear after
2-3 weeks. Positive transformants are transferred to fresh YNBG agar plates.
4.5.2.2. Condensed electroporation protocol
Preparation of competent cells
5-10 mL of YPD pH 4.0 in a 100-ml flask are inoculate with some Y. lipolytica cells (strain:
H222-S4, ura-) and incubated at 28 °C and 220 rpm over night. The next day 50 mL YPD pH
4 in 200 mL buffled flask are inoculated to an OD600 of 0.15 – 0.20. Cells are grown to an
OD600 of 0.8 – 1.0 at 28°C and 120 rpm. Note: based on generation time of 120 to 150
min, Y. lipolytica should take 5-6 h
Cells are harvested by centrifuge at RT and 500g for 5 min. The supernatant is discarded
and the cell pellet resuspended in 9 mL of ice-cold BEDS solution supplemented with 1 mL
DTT. The cell suspension is incubated at 28°C and 100 rpm for 5 min. Note: Gentle agitate
with the hand till the solution feels warm works also quite well.
The cell suspension is again centrifuged at RT and 500g for 5 min at RT and resuspended in
1 mL (0.02 volumes) of BEDS solution without DTT.

Constructing a Y. lipolytica P450 expressing strain from: Author: Andreas Braun Version: 1
Printed: 07/07/2012 ACIB Confidential Page 21 of 26
Note: if the OD600 is below 0.8 one can reduce the volume of BEDS accordingly (e.g. 0.6 –
0.8 ~ 0.8 mL, and so on).
These competent cells can be directly used for transformation.
Note: Alternatively, cells can be stored at -80°C. Freeze cells slowly in small aliquots. Cells
can be stored for at least 6 months at -80°C. However, to obtain highest transformation effi-
ciencies, competent cells should be prepared fresh
Transformation
5-15 µL linearized plasmid DNA (0.5 – 1 µg for single copy, 4-8 µg for multi copy) are mixed
with 80 - 100 µL of competent cells in an electroporation cuvette and incubated for 2 min on
ice. Electroporation is performed using Gene Pulser with following settings: 1.5 (single copy)
– 2.0 (multicopy) kV charging voltage, 200 Ω resistance and 25 µF capacitance. Immediately
after electroporation cell suspensions are resuspended in 1 mL cold 1.0 M sorbitol. Aliquots
are plated on selective YNBG agar plates and incubated at 28°C. Y. lipolytica transformants
are selected for ura+ phenotypes.
Optional: After electroporation and adding 1 mL cold 1.0 M sorbitol, incubate the cell sus-
pension for 15 min at 28 °C
Single copy transformants appear after 1–2 days while multicopy transformants appear after
2-3 weeks. Positive transformants are transferred to fresh YNBG agar plates.

Constructing a Y. lipolytica P450 expressing strain from: Author: Andreas Braun Version: 1
Printed: 07/07/2012 ACIB Confidential Page 22 of 26
4.5.3. Cultivation and Induction
Pre culture:
50mL YNBG1 in a 300 mL flask are inoculated with some cells of a positive Y. lipolytica
transformant from an agar plate. The cells are grown for 18-24 h at 28°C while shaking at
220 rpm.
Main culture:
250 mL YNBG0.6 in a 1 L flask are inoculated to a starting OD600 = 0.2.
Optional: Centrifuge preculture at 1000 g for 5 min and resuspend cells in 5 mL YNBG0.6.
The cell suspension is incubated at 28°C and 200 rpm till complete glucose depletion which
takes roughly 17-20 h. After glucose depletion cells are further incubated for another 2-4h
(starvation phase).
Induction:
The heterologue protein production of genes under the control of the ICL1 promoter is
started by adding EtOH to a concentration of 1%. Subsequently, after 8 h and 18-20 h addi-
tional EtOH is added to a concentration of 1%. Cells are harvested after 20-24 hours of in-
duction.
This cells can be used for whole cell conversion experiments as well as for microsome isola-
tion.
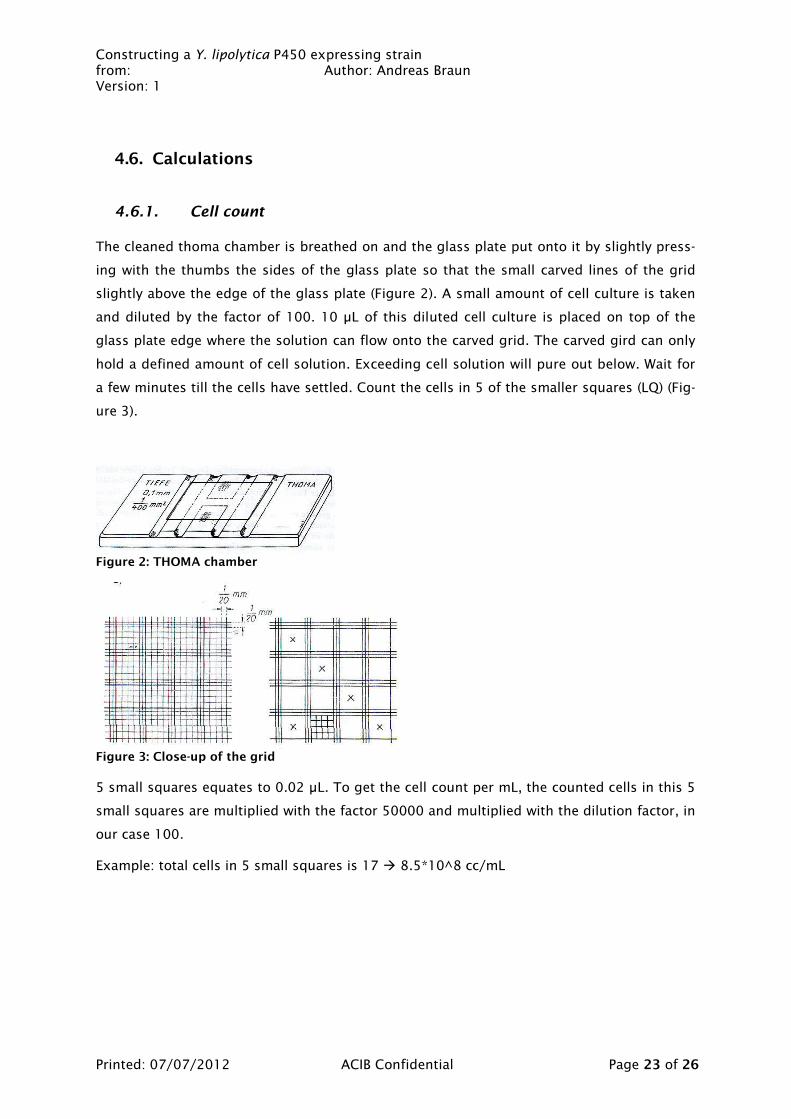
Constructing a Y. lipolytica P450 expressing strain from: Author: Andreas Braun Version: 1
Printed: 07/07/2012 ACIB Confidential Page 23 of 26
4.6. Calculations
4.6.1. Cell count
The cleaned thoma chamber is breathed on and the glass plate put onto it by slightly press-
ing with the thumbs the sides of the glass plate so that the small carved lines of the grid
slightly above the edge of the glass plate (Figure 2). A small amount of cell culture is taken
and diluted by the factor of 100. 10 µL of this diluted cell culture is placed on top of the
glass plate edge where the solution can flow onto the carved grid. The carved gird can only
hold a defined amount of cell solution. Exceeding cell solution will pure out below. Wait for
a few minutes till the cells have settled. Count the cells in 5 of the smaller squares (LQ) (Fig-
ure 3).
Figure 2: THOMA chamber
Figure 3: Close-up of the grid
5 small squares equates to 0.02 µL. To get the cell count per mL, the counted cells in this 5
small squares are multiplied with the factor 50000 and multiplied with the dilution factor, in
our case 100.
Example: total cells in 5 small squares is 17 8.5*10^8 cc/mL

Constructing a Y. lipolytica P450 expressing strain from: Author: Andreas Braun Version: 1
Printed: 07/07/2012 ACIB Confidential Page 24 of 26
4.6.2. Transformation rate
Colonies are counted of a plate where an aliquot of 200 µL has been plated. The colony
numbers are multiplied by 5 and divided by the µg DNA used for the transformation. This
gives a transformation frequency (rate) of colonies per µg DNA.

Constructing a Y. lipolytica P450 expressing strain from: Author: Andreas Braun Version: 1
Printed: 07/07/2012 ACIB Confidential Page 25 of 26
5. Safety Precautions
Please follow instructions described in “acib-Mitarbeiterleitfaden Gefahrstoff- und Laborord-
nung”
6. Documentation
Lab books AGB-1-3 (Braun Andreas) Dissertation Braun Andreas 2012

Constructing a Y. lipolytica P450 expressing strain from: Author: Andreas Braun Version: 1
Printed: 07/07/2012 ACIB Confidential Page 26 of 26
7. References
Barth, G., & Gaillardin, C. (1996). Yarrowia lipolytica. In K. Wolf (Ed.), Nonconventional yeasts in biotechnology (pp. 313-388). Springer-Verlag.
Förster, A., Jacobs, K., Juretzek, T., Mauersberger, S., & Barth, G. (2007). Overexpression of the ICL1 gene changes the product ratio of citric acid production by Yarrowia lipolytica. Applied microbiology and biotechnology, 77(4), 861-9.
Lin-Cereghino, J., Wong, W. W., Xiong, S., Giang, W., Luong, L. T., Vu, J., Johnson, S. D., & Lin-Cereghino, G. P. (2005). Condensed protocol for competent cell preparation and transformation of the methylotrophic yeast Pichia pastoris. BioTechniques, 38(1), 44, 46, 48.
Mauersberger, S., Wang, H. J., Gaillardin, C., Barth, G., & Nicaud, J. M. (2001). Insertional mutagenesis in the n-alkane-assimilating yeast Yarrowia lipolytica: generation of tagged mutations in genes involved in hydrophobic substrate utilization. Journal of bacteriol-ogy, 183(17), 5102-9.
Murakami, H., Yabusaki, Y., & Ohkawa, H. (1986). Expression of rat NADPH-cytochrome P-450 reductase cDNA in Saccharomyces cerevisiae. DNA, 5(1), 1-10.
Nthangeni, M. B., Urban, P., Pompon, D., Smit, M. S., & Nicaud, J.-M. (2004). The use of Yar-rowia lipolytica for the expression of human cytochrome P450 CYP1A1. Yeast, 21(7), 583-92.
Schiffler, B., Bureik, M., Reinle, W., Müller, E.-C., Hannemann, F., & Bernhardt, R. (2004). The adrenodoxin-like ferredoxin of Schizosaccharomyces pombe mitochondria. Journal of inorganic biochemistry, 98(7), 1229-37.

Curriculum Vitae

Page 1/3 - Curriculum vitae of Braun Andreas
For more information on Europass go to http://europass.cedefop.europa.eu © European Communities, 2003 20060628
Europass Curriculum Vitae
Personal information
First name(s) / Surname(s) Andreas Braun
Address(es) Gamperstrasse 5, 5400 Hallein, Austria
Telephone(s) Mobile: +43 (0)650 5442924
E-mail [email protected]
Nationality Austria
Date of birth 24.061978
Gender Male
Work experience
Dates 2008 - 20012
Occupation or position held scientific researcher in the framework of the EU-Project OXYGREEN (Project Nr. 212281)
Main activities and responsibilities Independent scientific research, planning and executing of complex research tasks in the area of molecular biotechnology and analytical chemistry in the framework of the PhD. responsible person for HPLC-MS including training of new co-worker
Name and address of employer Graz University of Technology Institute of molecular biotechnology Petersgasse 14, 8010 Graz, Austria
Type of business or sector University
Dates 07.2006 – 09.2006 07.2005 – 09.2005 02.2005 08.2004-09.2004
Occupation or position held analytic and quality management, Internship
Main activities and responsibilities routine analytics, establishing and validating of new analytical methods, relations with suppliers, training of co-workers
Name and address of employer Kraft Food Austria “Suchard”, Bludenz, AUT
Type of business or sector Manufacturer of confectionery
Dates Summer 2004
Occupation or position held Lab assistant, Internship
Main activities and responsibilities synthesis of silicon compounds
Name and address of employer Dr. Maschner, Institute of inorganic chemistry, University of applied technology, Graz, AUT
Type of business or sector Research

Page 2/3 - Curriculum vitae of Braun Andreas
For more information on Europass go to http://europass.cedefop.europa.eu © European Communities, 2003 20060628
Education and training
Dates 2008 – 2012
Title of qualification awarded PhD in engineering sciences (Biotechnology, Biochemistry and food chemistry)
Principal subjects/occupational skills covered
engineering sciences with major in Biotechnology, biochemistry and food chemistry Dissertation Title: Expression of human liver cytochrome P450 enzymes in the non-conventional yeast Yarrowia lipolytica for the evaluation of two-liquid biphasic whole-cell biotransformation of steroids
Name and type of organisation providing education and training
Graz University of Technology, Graz, AUT
Level in national or international classification
ISCED 6
Dates 2005-2008
Title of qualification awarded Master of science in chemical engineering
Principal subjects/occupational skills covered
chemical engineering with major in biochemistry, biotechnology and food chemistry Thesis Title: ‘Random mutagenesis of industrially important esterase APLE (alternative pig liver esterase)’, Protein engineering that contributes to the understanding of the structure-function relationship.
Name and type of organisation providing education and training
Graz University of Technology, Graz, AUT
Level in national or international classification
ISCED 5A
Dates 2002-2005
Title of qualification awarded
Principal subjects/occupational skills covered
chemical engineering
Name and type of organisation providing education and training
Graz University of Technology, Graz, AUT
Level in national or international classification
ISCED 5A
Dates 1997-2002
Principal subjects/occupational skills covered
chemical engineering with major in Environmental engineering
Name and type of organisation providing education and training
higher technical education institute HTL, Dornbirn, AUT
Level in national or international classification
ISCED 3A
Dates 1993 – 1997
Title of qualification awarded trained worker
Principal subjects/occupational skills covered
chemical laboratory worker
Name and type of organisation providing education and training
vocational industry school, Dornbirn, AUT JM Fussenegger Textil, Dornbirn, AUT
Level in national or international classification
ISCED 3C

Page 3/3 - Curriculum vitae of Braun Andreas
For more information on Europass go to http://europass.cedefop.europa.eu © European Communities, 2003 20060628
Personal skills and competences
Mother tongue(s) German
Other language(s)
Self-assessment Understanding Speaking Writing
European level (*) Listening Reading Spoken interaction Spoken production
English C2 Proficient user C2 Proficient user C1 proficient user C1 proficient user B2 Independent user
(*) Common European Framework of Reference for Languages
Social skills and competences ∗ supervision: During my diploma thesis I took care of two trainees from abroad.
∗ team work: I was involved in various types of teams during my internships and studies.
∗ communication qualities: as researcher in the framework of an international EU-project I was able to practice my presentation and communication skills at the regularly project meetings
Organisational skills and competences
∗ sense of organization (organized a big school event for 1500 people)
∗ leadership qualities: during my Master thesis and PhD I was overseeing exchange students from abroad (USA, Croatia). Additionally I was involved in teaching and tutoring seminars and lab courses. In the summer semester of 2011 I lectured applied Bioinformatics at the university of applied sciences Graz
∗ independence: as research associate I planned and executed independently complex scientific tasks
Technical skills and competences ∗ high throughput screening: For my diploma thesis I used a modern automated picking system to generate ordered screening arrays
∗ Bioreactors: during my PhD I worked with Sartorius and DasGIP fermentation systems
∗ HPLC-MS: during my PhD I worked and was responsible for maintenance of the HPLC-MS system additionally I was responsible for training of new co-workers
∗ GC-MS: at my current employment I am responsible to setting up a new GC-MS system (Shimadzu) for routine analytics
Computer skills and competences ∗ good command of Microsoft Office tools (Word, Excel and PowerPoint)
∗ good knowledge of Bioinformatics tools (VNTI, PyMOL, SeqMen, …)
∗ good knowledge of Internet tools (FTP, …)


![Cytochrome P450 Enzymes and Microbial Drug Preparation...arteannuic acid after CYP450 enzymes catalysis [1]. Enzyme modification . The application value of CYP450 enzymes in microbial](https://img.pdfslide.net/doc/110x75/5eccdb00dac3cb715e57d5ad/cytochrome-p450-enzymes-and-microbial-drug-preparation-arteannuic-acid-after.jpg)