Embed Size (px)
Citation preview

7/23/2019 Expt 4 Fracture 2015
http://slidepdf.com/reader/full/expt-4-fracture-2015 1/8
Page 1 of 8
___________________________________________________________________________
PART 1A EXPERIMENTAL ENGINEERING
FIRST YEAR MATERIALS LABORATORY EXPERIMENT 4
(LONG LAB)
PLASTICITY AND FRACTURE
_________________________________________________________________________________________________________________
OBJECTIVES
1. To perform standard tensile tests on specimens of low carbon (‘mild’) steel or copper at
room temperature and at ~l96°C in liquid nitrogen.
2. To use the stress-strain responses to obtain values for Young’s modulus ( E ), yield stress
(σy), tensile strength (σts) , and strain-to-failure (or ductility, ε f ).
3. To examine the effects of work-hardening and temperature on mechanical properties.
4. To observe and record the distinguishing features of ductile and brittle failure.
INTRODUCTION
This experiment investigates the
behaviour of mild steel and copper
under tensile load,measuring some
of the key mechanical properties
for design: the elastic (Young’s)
modulus, yield stress and tensile
strength, and also measuring the
strain to fracture (see Figure).
Comparison of these properties
across all materials, and their usein material selection, are covered
in lectures.
Not all materials are used at room temperature – for applications at high or low temperatures
we need to know the properties of the material at the appropriate temperature. Cryogenic
temperatures (e.g. storage of liquefied gases), or even just cold winter and polar conditions, can
have a major effect on the properties of steel. In this experiment, we test mild steel in liquid
nitrogento determine whether it can be used safely at very low temperatures.
The testing machineuses standard samples with a uniform cross-section to characterize the
elastic and plastic properties. Notches, cracks and changes in cross-section give very non-uniform stress distributions, and have important consequences in engineering design,
particularly in relation to fracture – these aspects will be discussed in lectures. We use a small
notch in the low temperature steel samples as a ‘stress concentration’, to ensure that they fail
within the load capacity of the machine.
SAFETY
1. Wear safety glasses during a test.
2. Take extra care with liquid nitrogen. Avoid skin contact with liquid nitrogen and with cold
parts of the equipment.
7/23/2019 Expt 4 Fracture 2015
http://slidepdf.com/reader/full/expt-4-fracture-2015 2/8
Page 2 of 8
APPARATUS AND MATERIALS
Hounsfield Tensometer: maximum tensile load = 20 kN (steel), 10 kN (copper)
extension scale magnification = 16× (steel), 8× (copper)
Initial specimen dimensions: diameter of shank = 5.05 mm
cross-sectional area of shank = 20 mm2
length of shank (‘gauge length’) = 25.2 mm
Strain-gauged demonstration sample, micrometer, microscopes.
Materials: two specimens of either pure copper, or ‘mild steel’ (iron + 0.1% carbon, 0.4%
manganese).
PERFORMING THE EXPERIMENT
(1) Determining the machine ‘characteristic line’
The demonstrator will show you how to obtain the characteristic load-extension line for your
tensometer, using a large dummy specimen. Because of its size, the specimen effectively has
zero extension at the loads used in the tests. The measured extension is therefore that of the
tensometer itself at any particular load.
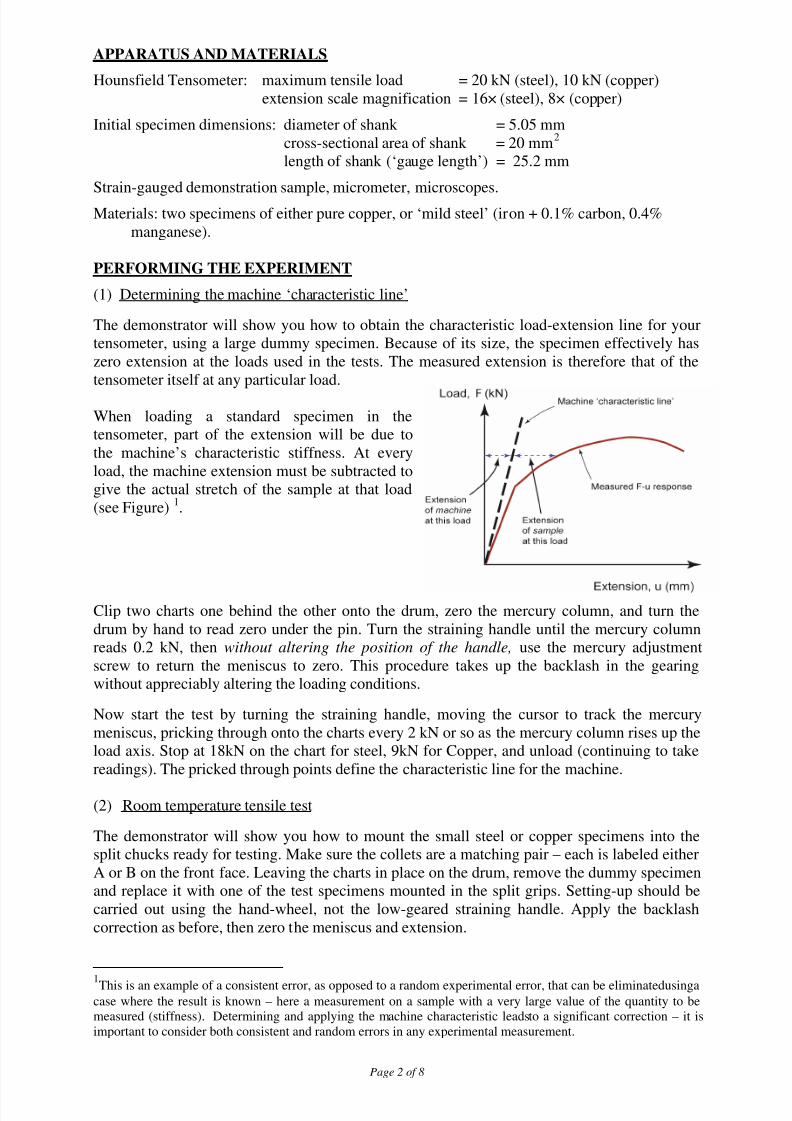
When loading a standard specimen in the
tensometer, part of the extension will be due to
the machine’s characteristic stiffness. At every
load, the machine extension must be subtracted to
give the actual stretch of the sample at that load
(see Figure)1.
Clip two charts one behind the other onto the drum, zero the mercury column, and turn the
drum by hand to read zero under the pin. Turn the straining handle until the mercury column
reads 0.2 kN, then without altering the position of the handle, use the mercury adjustment
screw to return the meniscus to zero. This procedure takes up the backlash in the gearing
without appreciably altering the loading conditions.
Now start the test by turning the straining handle, moving the cursor to track the mercury
meniscus, pricking through onto the charts every 2 kN or so as the mercury column rises up the
load axis. Stop at 18kN on the chart for steel, 9kN for Copper, and unload (continuing to take
readings). The pricked through points define the characteristic line for the machine.
(2) Room temperature tensile test
The demonstrator will show you how to mount the small steel or copper specimens into the
split chucks ready for testing. Make sure the collets are a matching pair – each is labeled either
A or B on the front face. Leaving the charts in place on the drum, remove the dummy specimen
and replace it with one of the test specimens mounted in the split grips. Setting-up should be
carried out using the hand-wheel, not the low-geared straining handle. Apply the backlash
correction as before, then zero the meniscus and extension.
1This is an example of a consistent error, as opposed to a random experimental error, that can be eliminatedusingacase where the result is known – here a measurement on a sample with a very large value of the quantity to bemeasured (stiffness). Determining and applying the machine characteristic leadsto a significant correction – it is
important to consider both consistent and random errors in any experimental measurement.

7/23/2019 Expt 4 Fracture 2015
http://slidepdf.com/reader/full/expt-4-fracture-2015 3/8
Page 3 of 8
Begin the test as instructed by the demonstrator. Prick through at a frequency sufficient to
define a curve. When you reach an extension of 10 cm on the chart for steel, or 3 cm for
copper, unload the sample to a small tensile value, pricking through as the specimen contracts
elastically. Use a micrometer to measure the new unloaded diameter of the specimen in-situ.
Take 5 readings of the diameter and record them in your lab book, evaluating the mean. Find
the new length, using the measured extension after unloading. Write the new diameter and
length of the shank at this point onto the chart.
Reload, pricking through as before until the specimen fractures – be ready for a drop in theload, and observe the localized necking of the sample before fracture. The reloading curve can
be regarded as the load-extension curve for a specimen that has been pre-strained.Do not
remove the charts from the drum until you have completed the low temperature test. Use
gauges to measure the finalelongation and reduction in area, as instructed by the demonstrator.
Write the values on the chart.
(3) Tensile test at -l96°C
Mount a second specimen in the grips and pin these in place in the box provided, then mount
the whole box in the tensometer. After the specimen has been covered by liquid nitrogen allow
at least10 minutes for cooling before starting the test. The demonstrator will tell you when tobegin. Do not to touch the liquid nitrogen or the cold parts of the apparatus.
Before starting, apply the backlash correction and zero the mercury as before. Offset the strain
origin by about 4cm on the chart in order to avoid overlapping the first curve. Prick through as
the load rises. Do not unload in this test but continue until the specimen fractures. Do not
exceed a load of 19 kN for steel, 9kN for copper.
After the broken specimen has warmed to near room temperature, measure the elongation and
reduction in area. If there has been no plastic deformation take both values as zero. Write the
readings on the chart.
(4) Strain-gauge test
There will be a demonstration of how an accurate value of E can be obtained from elastic strain
measurements made using an electrical strain gauge. Enter the data in your laboratory
notebooks.
RECORDING RESULTS IN YOUR LAB BOOK
Start on a new page with a heading and date. Leave a space for the chart containing the raw
data.
Room temperature tests
(i) Sample dimensions after unloading during test
5 micrometer readings of diameter (mm):
Mean diameter:
(ii) Yield stress of the annealed specimen σy
Yield Stress,σy= load at yield (from chart) = MPa
initial cross-sectional area
The yield stress is that at the onset of plastic deformation. Take the yield load as the point
where the load-extension plot deviates from linearity. Theinitial cross-sectional area = 20 mm2.

7/23/2019 Expt 4 Fracture 2015
http://slidepdf.com/reader/full/expt-4-fracture-2015 4/8
Page 4 of 8
(iii) Tensile Strength σ ts
Tensile Strength, σts = maximum load supported (from chart) = MPa
initial cross-sectional area
Note that strains are large at this point, and the actual area has significantly reduced. Tensile
strength is therefore defined using the 'nominal' stress, rather than the 'true' stress.
(iv) Strain-to-fracture (ductility) for the annealed specimen
The strain-to-fracture, or ductility, is the strain (= change in length of the shank / initial length)
after fracture. Note that the final length is that after unloading, not at the point of fracture – the
broken pieces contract elastically after fracture (see Figure, p.1).
Strain-to-fracture, ε f = %
Note that this is not a strict material property, i.e. its value will depend on the size of the
sample used (unlike Young’s modulus or yield stress). But by comparing values from a
standard sample, it can be used (with caution) to indicate the extent of plasticity before fracture.
(v) Percentage reduction in area for the annealed specimen
This is another approximate measure of ductility (also sample size dependent, and not therefore
a strict material property). It is the fractional reduction in cross-sectional area measured at the
fracture location.
Percentage reduction in area = %
(vi) Young’s modulus E (from the strain gauge test)
E is defined as the ratio of tensile stress to the elastic tensile strain produced by the stress.
Tensile stress = load = MPa
initial cross-sectional area
Tensile strain = fractional extension given by the strain gauge = (dimensionless)
Young’s modulus, E = tensile stress = GPa
tensile strain
(vii) Yield Strain
The yield strain is the maximum strain that is fully elastic and reversible, given by dividing the
yield stress by the modulus:
Yield Strain, εy= σy / E= %
Notice that this is very small, for reasons that will be explained in lectures. The change in
dimensions in the elastic region is therefore very small –here it makes little difference whether
we use the loaded or unloaded dimensions in calculating stress and strain.
7/23/2019 Expt 4 Fracture 2015
http://slidepdf.com/reader/full/expt-4-fracture-2015 5/8
Page 5 of 8
Tests at 196°C
Evaluate the following quantities (using the definitions above as required), for the low
temperature tests. Note that if brittle fracture occurs before yielding, there will be no
measurement for (i), while (iii) and (iv) are both zero.
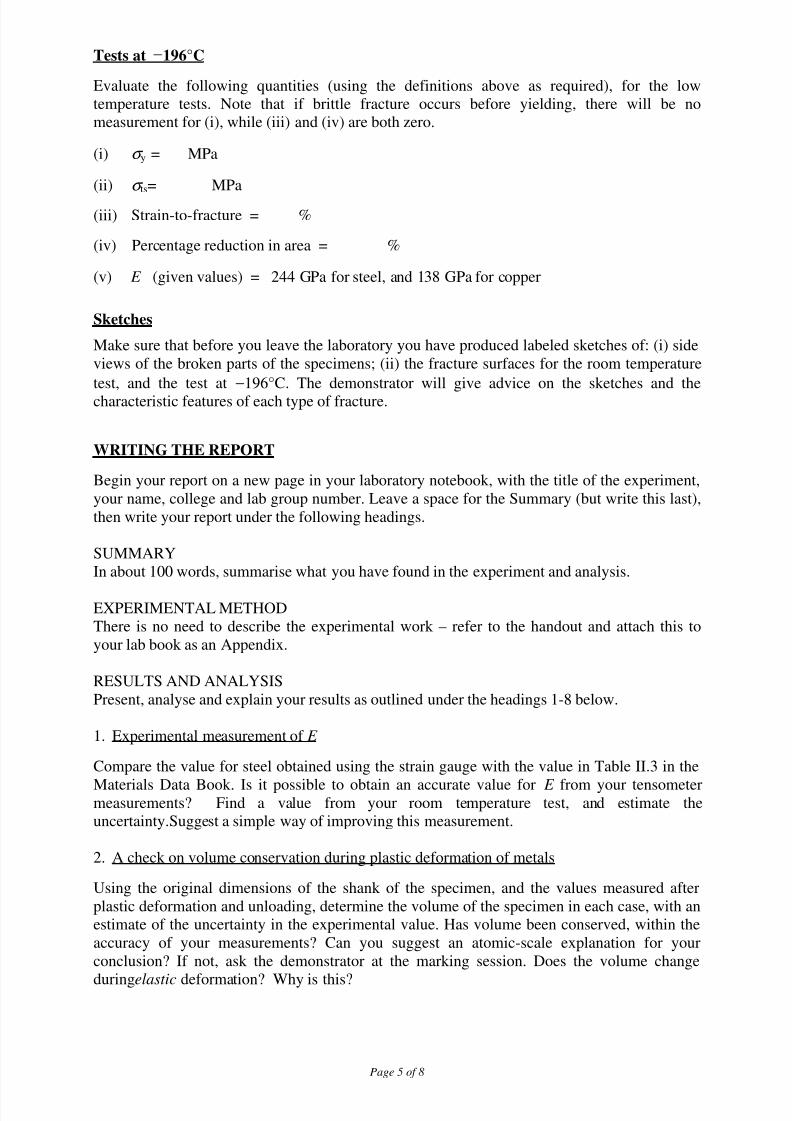
(i) σ y = MPa
(ii) σ ts= MPa
(iii) Strain-to-fracture = %
(iv) Percentage reduction in area = %
(v) E (given values) = 244 GPa for steel, and 138 GPa for copper
Sketches
Make sure that before you leave the laboratory you have produced labeled sketches of: (i) side
views of the broken parts of the specimens; (ii) the fracture surfaces for the room temperature
test, and the test at −196°C. The demonstrator will give advice on the sketches and the
characteristic features of each type of fracture.
WRITING THE REPORT
Begin your report on a new page in your laboratory notebook, with the title of the experiment,
your name, college and lab group number. Leave a space for the Summary (but write this last),
then write your report under the following headings.
SUMMARY
In about 100 words, summarise what you have found in the experiment and analysis.
EXPERIMENTAL METHOD
There is no need to describe the experimental work – refer to the handout and attach this to
your lab book as an Appendix.
RESULTS AND ANALYSIS
Present, analyse and explain your results as outlined under the headings 1-8 below.
1. Experimental measurement of E
Compare the value for steel obtained using the strain gauge with the value in Table II.3 in the
Materials Data Book. Is it possible to obtain an accurate value for E from your tensometermeasurements? Find a value from your room temperature test, and estimate the
uncertainty.Suggest a simple way of improving this measurement.
2. A check on volume conservation during plastic deformation of metals
Using the original dimensions of the shank of the specimen, and the values measured after
plastic deformation and unloading, determine the volume of the specimen in each case, with an
estimate of the uncertainty in the experimental value. Has volume been conserved, within the
accuracy of your measurements? Can you suggest an atomic-scale explanation for your
conclusion? If not, ask the demonstrator at the marking session. Does the volume change
duringelastic deformation? Why is this?
7/23/2019 Expt 4 Fracture 2015
http://slidepdf.com/reader/full/expt-4-fracture-2015 6/8
Page 6 of 8
3. The effect of work hardening on σ yand σ tsat room temperature
Work hardeningis caused by the accumulation of dislocations generated by plastic deformation.
As plastic deformation continues, the density of dislocations rises, and their mobility decreases
due to formation of dislocation tangles. This means that higherstresses are required to maintain
yielding, or to yield a pre-strained sample.
Given the definitions of σy andσts,the room temperature test effectively gives two load
extension curves: (i) for the specimen in the annealed state, with the origin at zero strain, and(ii) for the specimen which had been work-hardened by some plastic deformation
(approximately 20% strain).
Find the new values of σ y and σ ts after the unloading step. To obtain these values, use the
unloaded cross-sectional area, from the corresponding diameter recorded on your chart – this
becomes the ‘initial’ area for the re-test of the sample.
(i) Evaluate the percentage increases in σ y and σ ts caused by the work hardening of the
annealed steel in the first part of the test.
(ii) Determine from the chart the strain-to-fracture for the pre-strained sample, taking a new
origin for strain at the start of re-loading. Evaluate the percentage reduction that hasoccurred in the strain-to-fracture due to work hardening.
(iii) Why is the metal less ductile after work-hardening?
(Note that the copper used in the experiment has been drawn and is already work hardened to
some degree.Fully annealed copper would have a very low yield stress.)
4. Necking
On a sketch of the broken room temperature sample, indicate the part of the sample that
deformed plastically between the maximum load and final fracture.
(Explanatory note: When the material yields, the specimen elongatesuniformly, whilethe cross-sectional area is reduced. Initially, the work hardening more than compensates for the decrease
in area and the load continues to rise with increasing strain. Eventually, a point is reached
where the decrease in specimen cross-sectional area exceeds the capacity of the material to
increase the deformation load by work hardening. This limit will be reached in some part of the
specimen that is slightly weaker than the rest. All further plastic deformation is localised in this
region, and the specimen begins to neck or thin down locally. As the cross-sectional area
decreases rapidly, the load required to deform this part of the specimen also falls off, until
fracture occurs.)
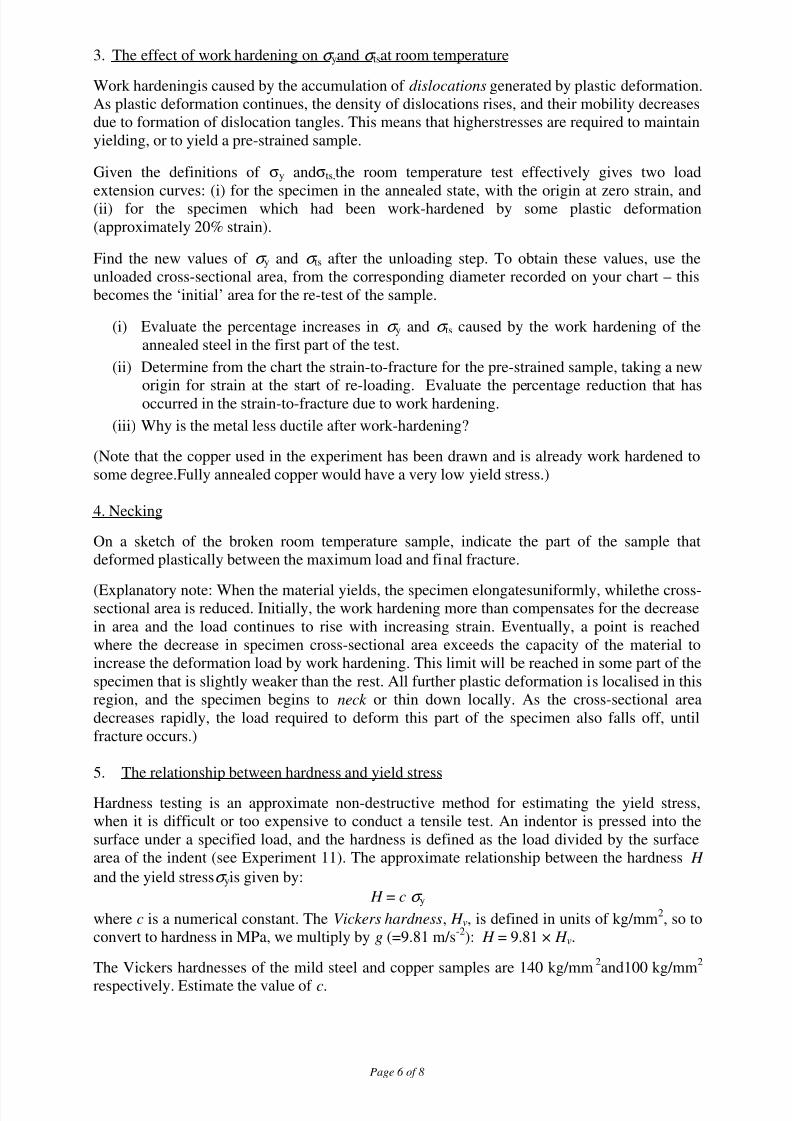
5. The relationship between hardness and yield stress
Hardness testing is an approximate non-destructive method for estimating the yield stress,
when it is difficult or too expensive to conduct a tensile test. An indentor is pressed into the
surface under a specified load, and the hardness is defined as the load divided by the surface
area of the indent (see Experiment 11). The approximate relationship between the hardness H
and the yield stressσ yis given by:
H = c σ y
where c is a numerical constant. The Vickers hardness, H v, is defined in units of kg/mm2, so to
convert to hardness in MPa, we multiply by g (=9.81 m/s-2
): H = 9.81 × H v.
The Vickers hardnesses of the mild steel and copper samples are 140 kg/mm2and100 kg/mm
2
respectively. Estimate the value of c.

7/23/2019 Expt 4 Fracture 2015
http://slidepdf.com/reader/full/expt-4-fracture-2015 7/8
Page 7 of 8
6.The effect of temperature on mechanical properties
Evaluate the percentage increase in E and σ y on cooling from room temperature to −196°C.
Comment on the differences in behaviour between mild steel and copper.
(Explanatory notes: Elastic properties are not very temperature-dependent well away from the
melting point. This is because they are a direct reflection of the inter-atomic forces. For yield
stress and ductility, low temperatures reveal a major difference between copper and steel. The
yield stress of copper change little, but that of steel rises significantly and the metal undergoesa ductile-brittle transition, while copper does not. This was the origin of the sudden catastrophic
fracture of a number of 'Liberty Ships' during World War II.The reasons are subtle but reflect
the different crystal structures: copper is face-centred cubic (fcc), whereasmild steel is body-
centred cubic (bcc). The fcc lattice has close-packed planes, with many independent slip
directions. In bcc, there are no close-packed planes and the dislocations in steel are more
readily pinned at low temperature by the interstitialsolid solution of carbon. For storage of
liquid gases for instance, it is therefore essential to use stainless steels (which are fcc), and not
(bcc) carbon steels.)
7. Fracture SurfacesYou have been handed a fractured steel component, for example, a broken bicycle crank, and
asked to decide from the appearance of the fracture surface whether the component failed either
by (a) ductile fracture, or (b) brittle fracture. Describe for each of these fractures two
distinguishing features that might enable you to classify the fracture of the component as
principally (a) or (b). Refer to the Appendix for characteristic images.
CONCLUSIONS
Your conclusions should indicate briefly what has been achieved with respect to the objectives.
Write down the time taken to write your report.
J.H. DurrellH.R. Shercliff, Lent 2015

7/23/2019 Expt 4 Fracture 2015
http://slidepdf.com/reader/full/expt-4-fracture-2015 8/8
Page 8 of 8
APPENDIX: Scanning electron microscope images of fracture surfaces
×400
Ductile Fracture
Note the presence of inclusions, which act as tiny stress concentrations.
They either fracture. or separate from the matrix, nucleating voids that grow
and link up, ultimatelycausing fracture.
×400
Brittle Fracture
Note the presence of flat cleavage facets. The fracture surface shows no
evidence of plastic flow.