Embed Size (px)
Citation preview

EXTENDING SHELF LIFE OF SEAFOODWITH ACETIC ACID
Y. Benja-arpom, S. Einarsson, and SM. ConstantinidesDepartment of Food Science and Nutrition
Food Science and Nutrition Center,University of Rhode IslandWest Kingston, RI, 02892
The seafood producing and exporting nations of the world are continuing toexperience the need to ship by air fresh fish stored in ice. It is well known thatfish stored in that manner have a rather short shelf life depending on a number offactors that ultimately determine the quality and safety of the product. Onedefinition of shelflife is the length of time from the day of capture that freshseafood can safely be in the marketplace (Regenstein and Regenstein, 1991).There are many ways of preserving seafood, such as drying, salting, smoking,and freezing. However, most of those method alter the original fresh seafoodcharacteristics.
Acetic acid has been used for centuries as an acidulant in foods. Therefore,acetic acid is not subjected to many food law restrictions. In the U.S., acetic acidis considered GRAS. It has a more powerful degenerative effect on living cellsthan mineral acids with the same hydrogen ion concentration because of itsability to dissolve lipids. The undissociated form of acetic acid is able topenetrate through the cell membrane and enter the interior of the cell where itacts to denature proteins. Between pH 6 and 5, the action of the acetic acid onlydoubles (Woolford, 1975), whereas, the undissociated portion increases aboutseven fold in this range. A study conducted by Adams and Hall (1988) providesconvincing support for the view that the undissociated part of acetic acid is theactive factor. A concentration of 1% and 3% acetic acid can provide a basicprotection against pathogenic microorganisms, especially Clostridia (Anderson,1984). Acetic acid is approved for use as a sanitizer on red meat carcasses(Federal Register, 1982). One logtereduction in count can be obtained fromproper sanitizing with acetic acid (Anderson, 1984). The effect of acetic acidwas studied on vacuum-packaged pork (Mendonca, 1989). Treatmentscontaining 3% acetic acid lowered the aerobic microbial counts and effectivelyinhibited Enterobacteriaceae. Dickson (1992) has shown that acetic acid as asanitizing agent on beef tissue was independent of the level of initialcontamination with a consistent reduction in populations, irrespective of cellnumbers.
The object of this study focused on studying the effect of acetic acid on bothfilleted and dressed fish stored at refrigeration temperature for different periodsof time.
241
MATERIALS AND METHODS
Preparation of fish
All seafood were obtained from local seafood processing plants, SeafreshU.S.A. Inc., Narragansett, RI and Town Dock, Galilee, RI. The fish werebrought in as whole fish except for dogfish which were brought in as fillets orbacks. After the fish had been headed, bled, and gutted, they were washed anddrained and then dipped in various concentrations of acetic acid for a differentperiods of time. The fish were then stored in open plastic bags at refrigerationtemperature. The following analyses were conducted periodically for up to 3weeks.
Microbiology analysis
a) Sample preparation : 11 g of fish were aseptically transferred to a sterileblender jar with 99 ml of 0.1% sterile peptone water and homogenized at a highspeed for 1 minute. This gave a 10ml dilution. Serial dilutions of 10-2, 10-s. and1 O-4 were prepared by using 0.1% peptone water.
b) Total Bacterial Count (TBC) : TBC was conducted aerobically by usingplate count agar method according to Post (1988). Plate count agar(Difco) wasprepared by homogenizing 23.5 g agar in 1000 ml of deionized water.
Duplicate samples of 1 ml and 0.1 ml of each dilution were pipetted intosterilized and appropriately labeled petri dish. Twelve to 15 ml of cooled (44-46OC) plate count agar were poured into each plate. The sample and agarmedium were immediately mixed and then allowed to solidify. The petri disheswere inverted and incubated aerobically at 370C for 48 hours. The total colonycounts were recorded as total bacterial counts or colony forming units per gram(cfu/g).
Biochemical analysis
a) Trimethylamine(TMA) was determined according to Woyewoda etal(1986). Twenty five g of comminuted fish and 50 ml of 7.5% Trichloroaceticacid (TCA) were added to a small blender jar and blended well, The homogenatewas filtered through Whatman #2 filter paper and was kept in the freezer (-2ooC)before further analysis.
Aliquots (1 or 2 ml) of samples and water (2-3 ml) was added to a cleanscrew-capped tube to bring the total volume to 4.0 ml for both standard andblank. 1.0, 2.0, and 3.0 ml of working standard solutions containing 10.0 ugTMA/ml were used. The blank contained 4.0 ml of water. One ml of 10%formaldehyde, 10 ml of dried toluene and 3 ml of 25% KOH were added to thetube respectively and the mixture was blended in a vortex mixer for 15 seconds.About 7 ml of toluene (upper layer) was transferred to another tube containing0.3-0.4 g of anhydrous Na2S04 and mixed with a vortex mixer again. Four ml ofthis toluene solution was transferred into a test tube containing 4 ml of 0.2%picric acid in toluene. The absorbance was measured in a Perkin Elmer Lamda4B Spectrophotometer at 410 nm. The result was expressed in mg TMA/l00 g.

243
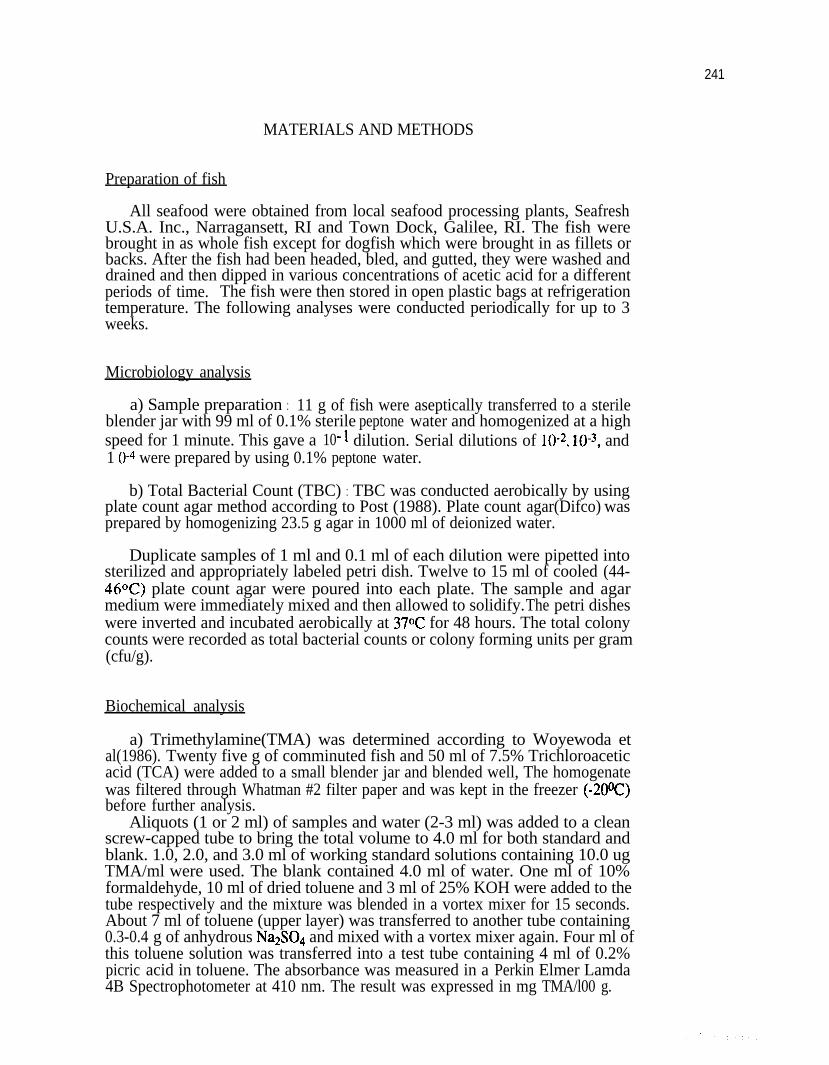
Table 1 showed the total bacterial count (cfu/g) for acetic acid treated dogfishfillets dipped for 2 minutes in different concentrations of acetic acid and stored at3-5OC for different periods of time. The untreated samples(contro1) showed theexpected increased microbial population with time. By dipping the fillets in thedifferent concentrations of acetic acid, a significant decrease in the bacterialcount was brought about with increasing concentration of acetic acid. A 10%solution of acetic acid arrested significantly the growth of the initial bacterialpopulation.
Table 2. TMA(mg TMAllOO g.) in acetic acid treated dogfish fillets, dipped for2 minutes in different concentrations of acetic acid and stored at 3-5 Oc
STORAGE TIMEDays
AMOUNT OF TMA (mE/lOQg) IN SAMPLESControl 2.5% 5% 10%
0 0.6 0.8 0.70.7
0.4
: 1.9. 1.1
::; 0.713
3z :*;z-i
:ft
0:90:8
2045:5 2:1
1.436 , 0.9 1.7
Table 2 shows the corresponding effect of acetic acid on the Trimethylamine(TMA) production on the same samples. Although the TMA level of the controlsample rose to about 45 mg per 100 g sample, the treated samples developed avery insignificant level of TMA.
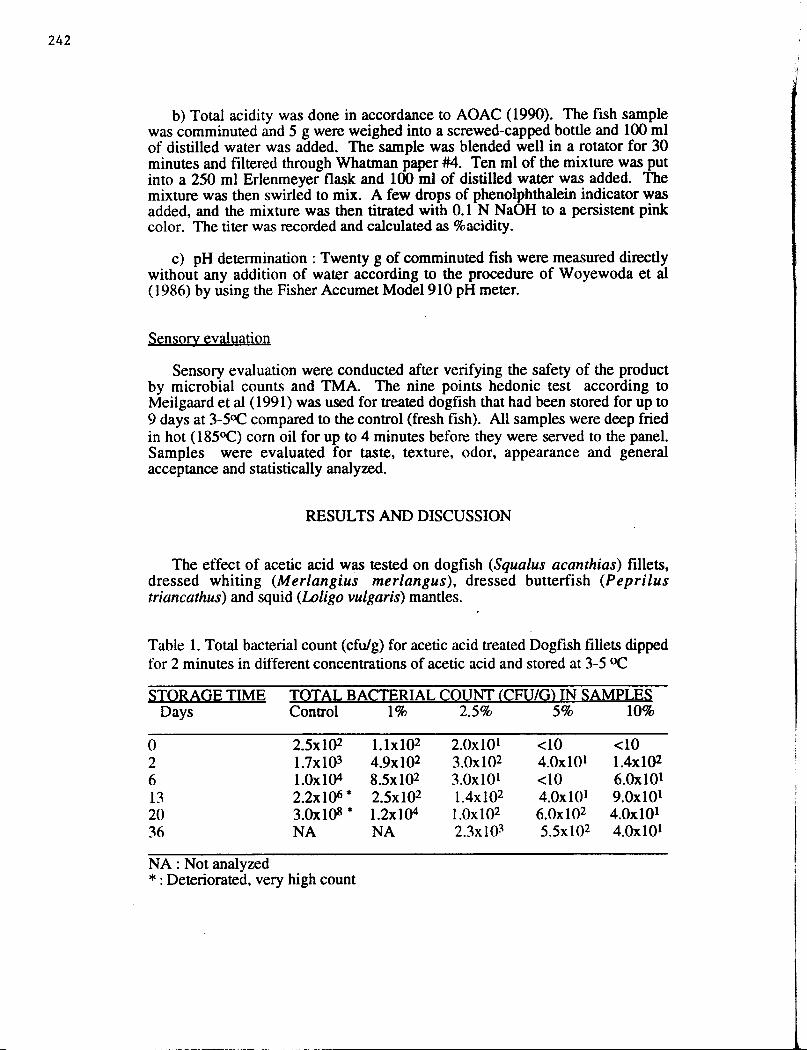
In Table 3 the pH and the % acetic acid levels of the different treatments areshown. Again there was a rise in the pH for the control group, from pH 6.3 topH 8.2 over a period of 20 days at refrigeration temperature. On the other hand,the treated samples either maintained the pH level at about pH 6.0 or lowered itto about pH 5.0 for the 10% acetic acid treatment. This pH drop may not besubstantial enough to produce dramatic microbial inhibition, yet in conjunctionwith the undissociated portion of acetic acid apparently does induce someinhibition as seen ‘in the previous tables. The absorbed acetic acid was about0.7% in the fillets and did not vary with time.
244
Table 3. pH and acetic acid content (%) in treated dogfish fillets, dipped for 2minutes in different concentrations of acetic acid and stored at 3-5oC
STORAGE TIME pH AND % ACIDITY IN SAMPLESDays Control 2.5% 5% 10%
pH %AA pH %AA pH %AA pH %AA
0 6.3 0.0 6.0 0.3 5.7 0.6 5.0 0.82 6.4 0.0 6.0 0.3 5.8 0.6 5.0 0.8
1:6.5 0.0 6.0 0.2 5.9 0.6 5.1 0.7
206.8 0.0 6.1 0.2 6.0 0.6 5.1 0.78.2 0.0 6.1 0.2 6.0 0.6 5.2 0.8
36 NA NA 6.2 0.2 6.0 0.6 5.4 0.7
NA :Not analyzed
It was of interest to examine the treated products organoleptically by a tastepanel. Table 4 shows that for the treated products at the 2 % acetic acidconcentration, there was little difference in the general acceptability score,however, that difference was significant if the 5% acetic acid treatment wascompared to the control (fresh sample). The general negative remark was theslightly sour taste of the heavily treated samples.
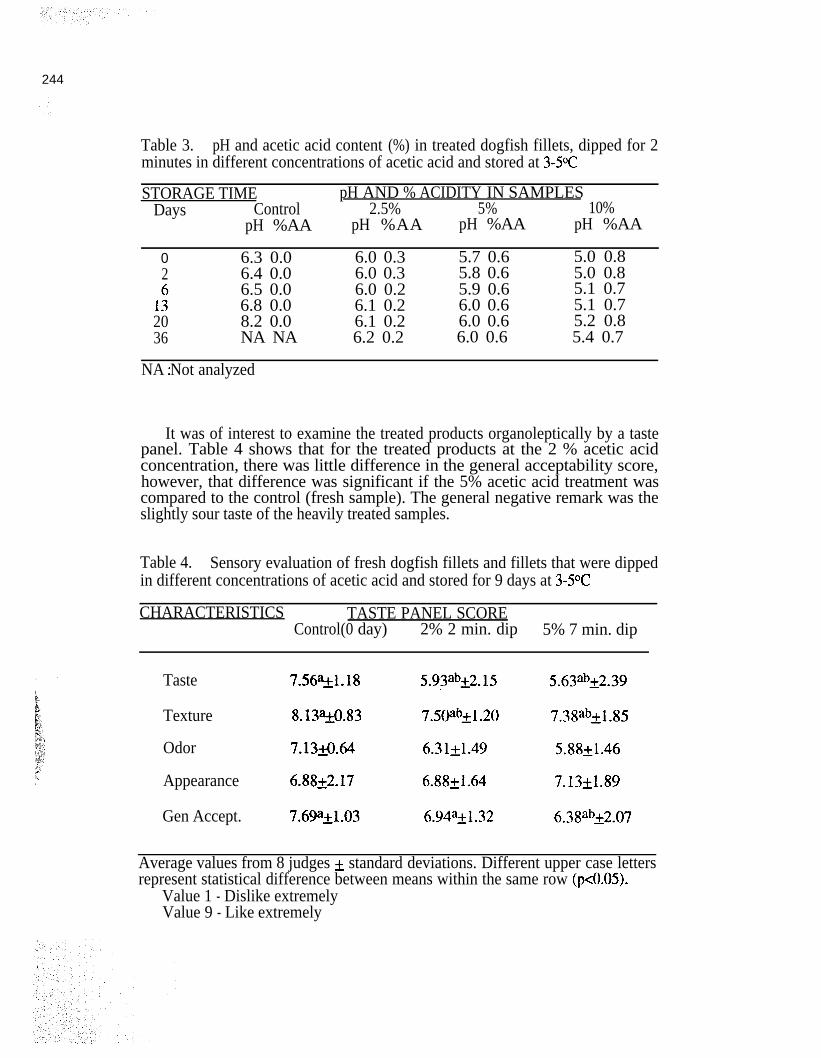
Table 4. Sensory evaluation of fresh dogfish fillets and fillets that were dippedin different concentrations of acetic acid and stored for 9 days at 3-5OC
CHARACTERISTICS TASTE PANEL SCOREControl(0 day) 2% 2 min. dip 5% 7 min. dip
Taste 7.56at1.18 5.93atQ2.15 5.63ahk2.39
Texture 8.13w.83 7.5oa”~l.2C) 7.38ahkl.85
Odor 7.13fl.64 6.3lkl.49 5.88kl.46
Appearance 6.8822.17 6.8821.64 7.13kl.89
Gen Accept. 7.6991.03 6.94akl.32 6.38ab&2.07
Average values from 8 judges + standard deviations. Different upper case lettersrepresent statistical difference between means within the same row (p&05).
Value 1 - Dislike extremelyValue 9 - Like extremely


247
CONCLUSIONS
Low concentrations (3-5%) acetic acid appeared to retard microbial growthin fish fillets and dressed fish when dipped in the acetic acid solution for a fewminutes. The TMA values remained very low throughout the storage period atrefrigeration temperature.
The process which can extend shelf life of fish for up to three weeksproduces a clean looking product, free of mucous, blood, etc. Using thistreatment on scombroids might be able to decrease the onset of histamineproduction in scombroid poisoning. The mild tartness which is oftenexperienced can be removed by dipping the fish in water before mealpreparations. Such an inexpensive process should allow temporary storage atrefrigeration temperature before transportation by air or other means.
ACKNOWLEDGMENTS
This research was partly supported by the New England FisheriesDevelopment Association, Inc., through a Saltonstall-Kennedy Grant from theNational Marine Fisheries Service. We are grateful for the fish supplied by SeaFresh U.S.A. Inc., Narragansett, RI; to Mr. Kevin Worthley and Mr. PaulHellund for their assistance in obtaining the fish. We are also thankful to Mr.Noah Clark of Town Dock, Galilee, RI for providing some of the species used.
REFERENCES
ADAMS, M.R., and C.J. HALL. 1988. Growth inhibition of food-bornepathogens by lactic and acetic acids and their mixtures. Intern. J. of FoodScience and Technology, 23 : 287.
ANDERSON, R.E. 1984. Growth and corresponding elevation of tomatojuice pH by Bucillus coagulans, J of Food Science, 49 : 647.
AOAC 1990. Official Methods of Analysis 15 * ed. Association of officialAnalytical Chemists, Arlington, Virginia.
DICKSON, J.S. 1992. Acetic acid action on beef tissue surfacescontamination with Salmonella typhimurium. J. of Food Science, 57 :297-301.
FEDERAL REGISTER. 1982. Rules and Regulations, 47 : No 123, Part184.
MEILGAARD, M., V.C. GAIL, AND B.T. CARR.1991 SensoryEvaluation Techniques, 2 nd ed. CRC Press, Inc Florida.
248
7
8
9
10
11
MENDONCA, A.F., R.A. MOLLINS, A.A. KRAFT, AND H.W.WALKER. 1989. Microbiological Chemical and Physical Changes in Freshvacuum-packaged pork treated with organic acids and salts. J. of FoodScience, 54 : 18-21.
POST, F.J. 1988. . A laboratory manual for food microbiology andbiotechnology. Star Publishing Co., Belmont, CA.
REGENSTEIN. J. M. , AND C. E. REGENSTEIN. 1991. Introduction tofish Technology. Van Nostrand Reinhold, N.Y.
WOOLFORD, M.K. 1975. Microbiological screening of the straight chainfatty acids (Cl-C12) as potential silage additives. J. of Food and Agriculture,26 : 219-228.
WOYEWODA, A.D., S.J. SHAW, P.J. KE, AND B.G. BURNS. 1986.Recommended Laboratory Methods for Assessment of fish quality.Canadian Technical Report of Fish and Aquatic Science, No 1448, 35-40.

249
PRESERVATION OF CURRY HYDROLYSATES WITH THE PROPIONICACID FERMENTATION
M. Mahmoud and R. E. LevinDepartment of Food Science, Agricultural Experiment
Station, University of Massachusetts, Amherst, MA 01002
When gurry hydrolysates are used as fertilizers,the reduction of their pH with a mineral acid such aSphosphoric acid or sulfuric acid to facilitatepreservation significantly reduces the pH of the soiland therefore greatly restricts repeated application formany crops. Alternatively the use of an organic acidto reduce the pH has the advantage that lactic acid orpropionic acid are completely utilized by soilmicroorganisms with repeated application of thefertilizer to soils. The pH of the soil is therefore notwith the use of organic acids for the reduction of pH ofgurry hydrolysates. Propionic acid is a well recognizedmycostatic agent at acidic pH values and if produced byfermentation entailsinoculum preparation,
only the cost of glucose andand eliminates the handling of
concentrated acids. Propionic acid bacteria convertglucose to propionic acid along with a smaller quantityof acetic acid according to the following equation (1)
1.5 %&206 ->I.8 5CH3CHgCQOH + 1.10 CH3COOH + 0.95 CO2glucose propionic acid acetic acid
Alternatively, the propionic acid bacteria will convertlactic acid as an initial substrate to propionic acidand acetic acid according to the following equation (2):
3 CH3CHOHCOOH-n cH3CHzCOOH+1.2 CH3COOH+lX!~+H~lactic acid Propionic acid acetic acid
==XtALS AND METHODS
Preparation of cod gurry hydrolysateCod gurry consisting of heads, tails, and frames
was ground and hydrolyzed with 0.05% papain at710~ for15 min. with constant agitation_ The temperature wasraised to 90°C for 5 min.,and the temperature
the bone chips screened outrapidly reduced to 30°C. In all
250
studies where absorbance at 600 nm was taken as adetermination of relative cell density, hydrolysate wascentrifuged at 10,000 g for 10 min, the pH reduced to4.0 with phosphoric acid, and then filter clarified andsterilized through 0.2m porosity membranes after theaddition of glucose and preservatives unless otherwisestated.
on studiesUnclarified cod hydrolysate was steam sterilized
in screw capped tubes (20 x 200 mm). Appropriatevolumes of a sterile glucose stock solution (8Og/120 ml,prepared with distilled water) were then added so as toyield glucose concentrations of 2.5%, 3.0%, 3.5%, and4.0% (w/v) in a final volume of 20 ml. Cells ofPropionibacterium acidipropionici ATCC 4875 wereinoculated into tubes containing 10 ml of MRS brothwhich were then incubated for 96 hr. The cell densityof ATCC culture 4875 was then determined with dark-phasemicroscopy with the use of a Petroff-Hausser bacteriacounting chamber. The cell density was then adjusted soas to yield 5 x lo6 cells/ml when 0.1 ml of culture wasadded to duplicate tubes containing 20 ml ofhydrolysate. The concentrations of glucose, propionicacid, and acetic acid were determined by highperformance liquid chromatography as previouslydescribed (3). All incubation was at 32OC unlessotherwise stated.
RESULTS AND DISCUSSION
We first screened 15 cultures of Propionibacteriumfor their ability to grow in Lactobacilli MRS broth(MRS) and in filter clarified cod gurry hydrolysatecontaining 3.0% glucose. Representative cultures anddata are given in Table 1. Cultures ATCC 4875 and CCM1860 yielded the lowest pH value in MRS broth (pH 4.5)after 96 hr .of incubation at 32OC (Table 1). With codhydrolysate, a pH of 4.0 was achieved only with cultureATCC 4875 after 96 hr of incubation. Culture ATCC 4875was therefore used in all further studies.
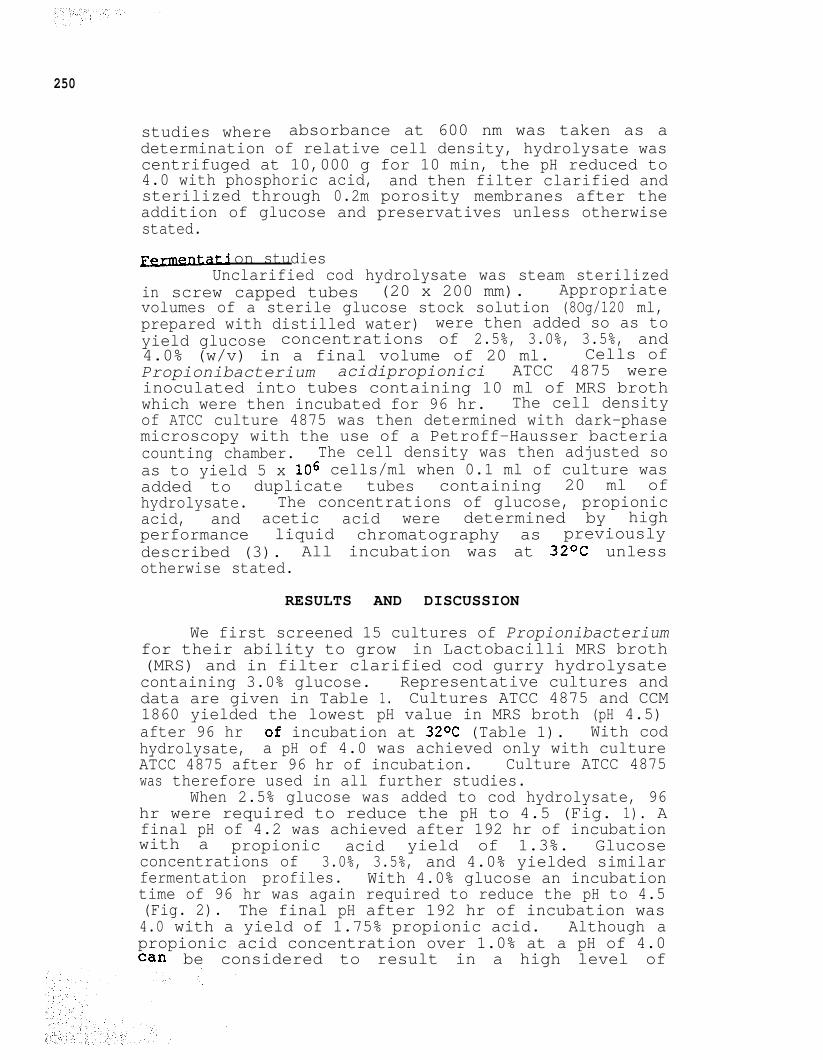
When 2.5% glucose was added to cod hydrolysate, 96hr were required to reduce the pH to 4.5 (Fig. 1). Afinal pH of 4.2 was achieved after 192 hr of incubationwith a propionic acid yield of 1.3%. Glucoseconcentrations of 3.0%, 3.5%, and 4.0% yielded similarfermentation profiles. With 4.0% glucose an incubationtime of 96 hr was again required to reduce the pH to 4.5(Fig. 2). The final pH after 192 hr of incubation was4.0 with a yield of 1.75% propionic acid. Although apropionic acid concentration over 1.0% at a pH of 4.0Can be considered to result in a high level of
251
Table 1. pH reduction by strains ofPropionibacterium a.
CULTURE FINAL pHb FINAL pH=
CCM 1857 P. freudenreichii 5.4 4.8subsp. freudenreichi
P95 P. freudenreichii 5.0 5.3subsp. shermanii
P26 P. jensenii 4.7 4.3P42 P. acidipropionici 4.6 4.5ATCC 4875 P. acidipropionici 4.5 4.0CCM 1860 P. jensenii 4.5 4.3
aIncubation was for 96 hr at 32%.bMFG broth containing 3.0% glucose (initial pH 5.9).=Cod hydrolysate containing 3.0% glucose (initial pH6.8).
n -m- pmpbnic &dd (%)
-+~Sid(y)
-A- okmrs (xl3 t PH
0 24 46 72 96 120 144 166 192 216 0 24 46 72 96 120 144 166 192HOURS HOURS
7
6
I,
5
Fig. 1. Rates of glucose Fig. 2. Rates of glucoseutilization, propionic utilization, propionicacid formation, acetic acid formation, aceticacid formation, and pH acid formation, and pHreduction in hydrolyzed reduction in hydrolyzedcod gurry containing cod gurry containing2.5% glucose 4.0% glucose.
preservation,the prolonged period of incubation requiredto reduce the pH to 4.5 cannot be considered acceptablein terms of allowing the development of contaminantsduring the first 48 hr of incubation in non sterile

252
hydrolysate as would be used by industry. This notablyslow fermentation is due to the well known slow growthof propionic acid bacteria and to the fact that themajority of propionic acid is produced after culturesreach a maximum cell population. The development ofcontaminants under similar conditions of fermentation innon sterile hydrolysate containing 4.0% glucose is shownin Figure 3. When a 20% inoculum (v/v) was used so as toresult initially in 1 x log colony forming units per mlof hydrolysate containing 4% glucose the ratio ofpropionibacteria to contaminants increased over 100-fold(Fig. 4). However, the time required to reduce the pH
106
I'@O
I24 48 72 96 120 144 168 192
H OURS
Fig. 3. Development ofCFU of P. acidipropionici& contaminants in codhydrolysate. Hydrolysatecontained 4.0% glucoseand was not sterilized.Initial CFU/ml of P.propionici were 5 x 10⁶.
109
* '10424 48 72 96
Fig. 4. Developmentof CFU of P.acidipropionici as20% inoculum andcontaminants in codgurry hydrolysate.Hydrolysate contained4.O% glucose.
to 4.5 was lowered only to 72 hr (Fig. 5). In contrast,the time required for Lactobacillus plantarum to reducethe pH to 4.5 with cod gurry hydrolysate containing 4.5%corn syrup is only 7 hr (Fig. 6).
Our major concern therefore, with respect to thepropionic acid fermenation of hydrolyzed gurry is theselective development of propionic acid resistantmicroorganisms. Recently, a commercial producer ofhydrolyzed gurry for use as fertilizer forwarded asample to us that contained an actively metabolizingyeast that resulted in the development of significantgas pressure inside the plastic container although

253
6
4w02 Ia
5
1
0 40 12 24 36 48 60 72 84 96
HOURS
Fig. 5. Rates of propionicacid and acetic acidformation and pH reductionwith the use of a 20%inoculum of P. acidilactici.Hydrolysate contained4.0% glucose and was notsterilized. An inoculum
3063HOURS
Fig. 6. Lactic acidfermentation ofhydrolyzed gurrycontaining 4.5% cornsyrup by L. plantarum.
volume of 20% (v/v) was used.
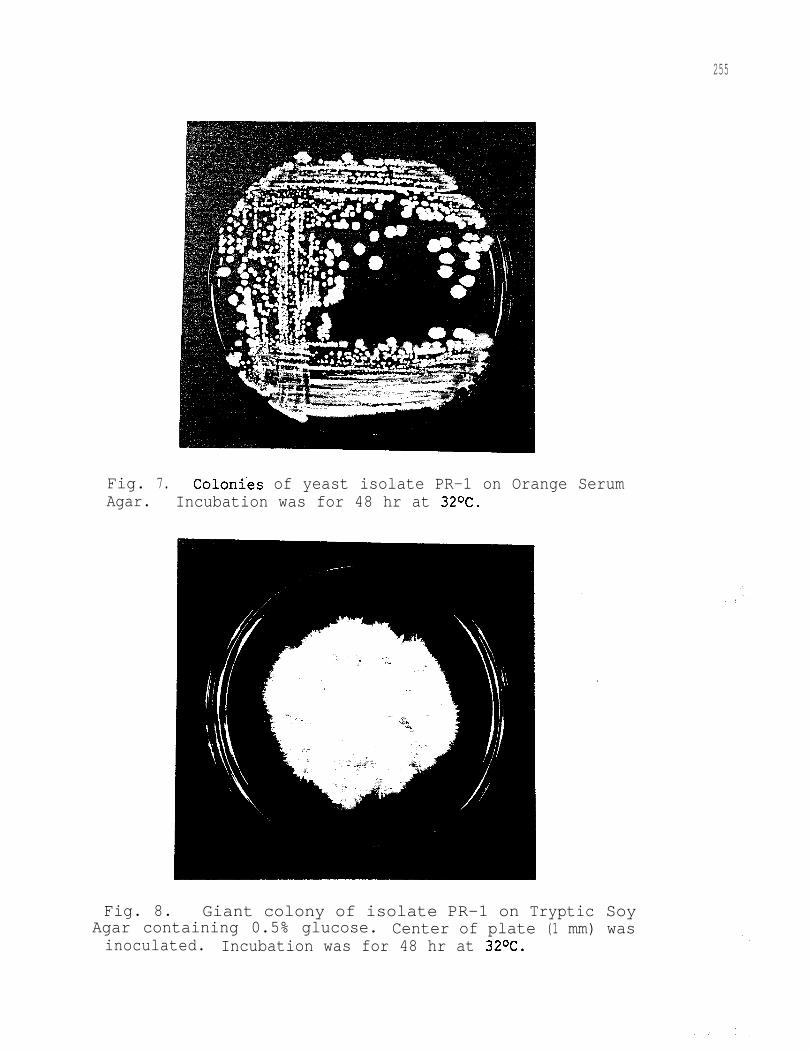
organoleptic spoilage did not occur. The commercialprocess involved the use of entrails at room temperaturefor proteolysis over a number of days followingacidification with phosphoric acid to a pH of 3.5 andthe addition of 0.2% propionic acid. The lack ofpasteurization apparently resulted in the selectivedevelopment and eventual dominance of a contaminatingyeast resistant to the level of propionic acid used. Wewere able to readily isolate this organism which wedesignated isolate PR-1 and found it to be ratherunique. Small well defined colonies 3 to 5 mm indiameter were produced on Orange Serum Agar plates (Fig.7) whereas on Mycological agar and Tryptic Soy Agar(containing 0.5% dextrose) giant colonies developedwhich completely filled the plate after 24 to 48 hr(Fig. 8). Static growth of isolate PR-1 in mediacontaining glucose results in extensive surface filmformation which characteristically rises about 1 cmabove the culture broth along the walls of the vessel.The organism is primariy oxidative but does producedetectable amounts of ethanol. Its morphologicalcharacteristics are quite unique in that it producescells with bipolar budding with multiple polar buds,particularly on acetate agar (Fig. 9). Ascospores arenot formed nor are pseudomycelium observed. The
254
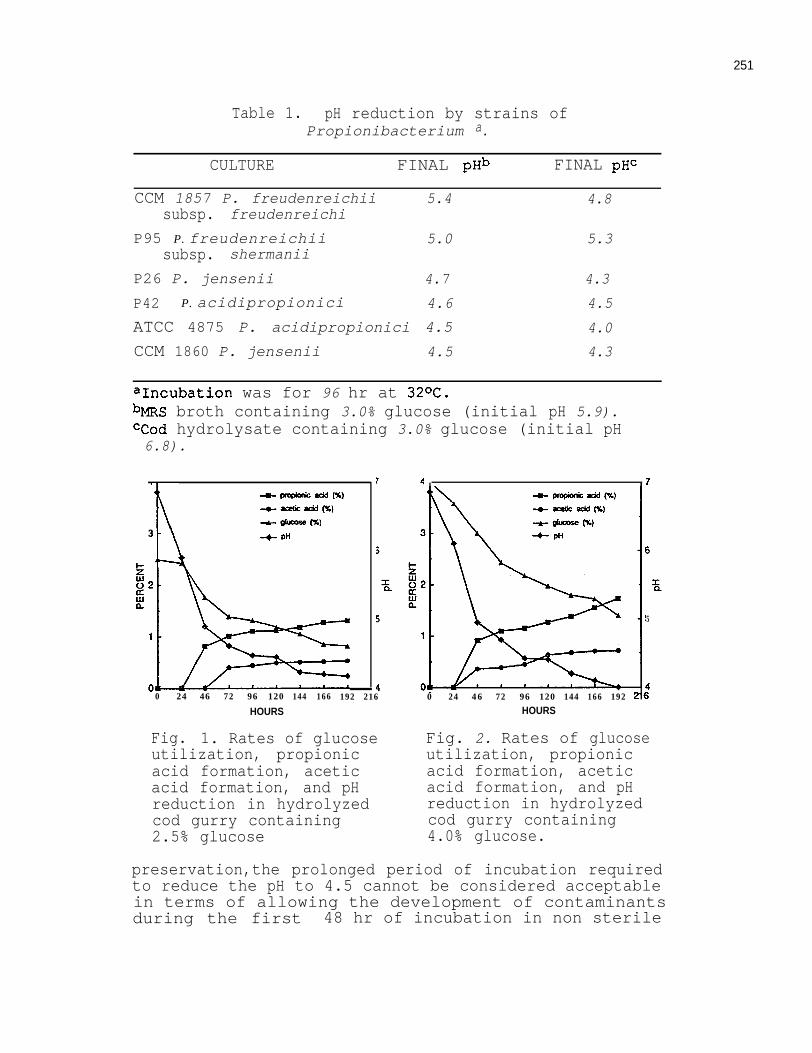
yeast like organisms were assessed for their relativeresistance to various concentrations of propionicacid. Representative isolates and data are given inTable 3. Isolate PR-1 was clearly the most resistant(Table 3). It is of interest that S. cerevisiae
Table 3. Static growth of yeasts in filter clarifiedcod hydrolysate containing 4.0% glucose and varying
concentrations of propionic acid at pH 4.0.afb_ _
PERCENT PROPIONIC ACID
Culture 0.0% 0.1% 0.2% 0.3% 0.4% 0.5%
PR-1 8.6
S. cerevisiae 8.0
D. hansenii 7.5
C. lipolytica 5.3
2. priorianus 3.3
E. fibuliger 1.3
H. saturnis 0.44
9.1 2.7 0.50 0.38 0.00
6.6 4.1 0.31 0.00 0.00
0.86 0.08 0.00 0.00 0.00
0.79 0.06 0.00 0.00 0.00
2.2 1.0 0.00 0.00 0.00
0.22 0.00 0.00 0.00 0.00
0.00 0.00 0.00 0.00 0.00
=Incubation was at 32OC for 72 hr. ’bNumerical values are absorbance readings at 600 nm.
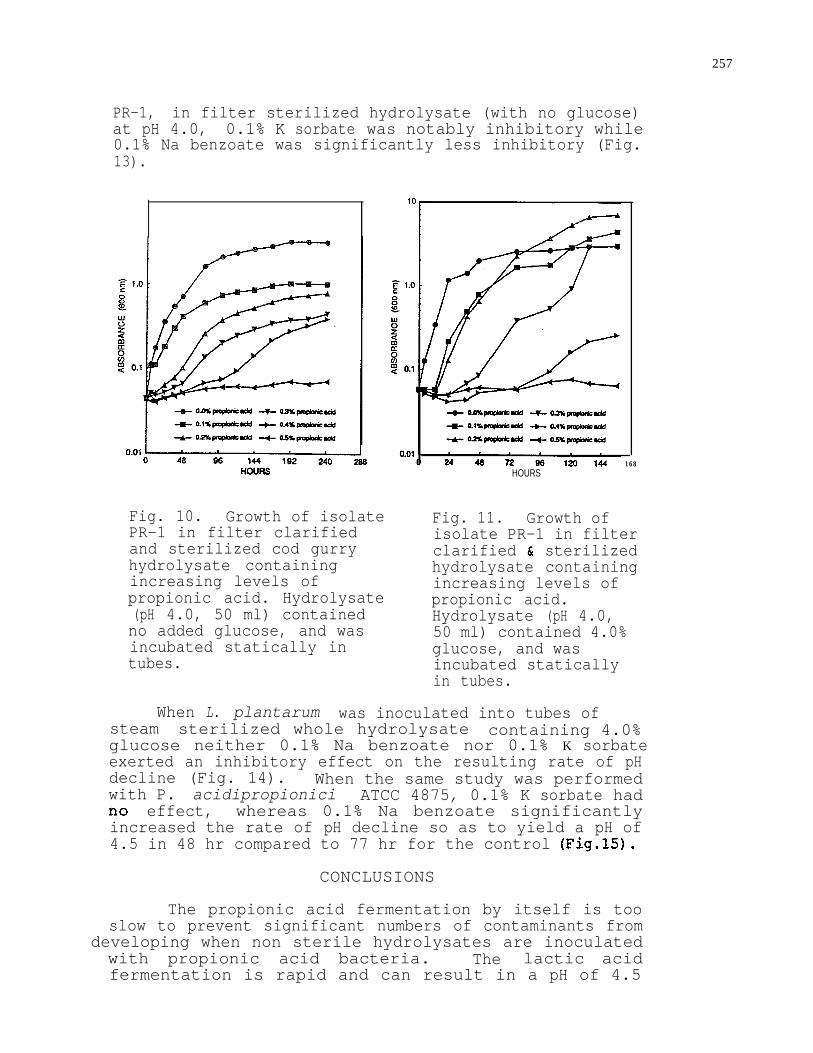
exhibited the next highest level of tolerance topropionic acid (Table 3) e When 50 ml volumes of filterclarified and sterilized hydrolysate in tubes (with noglucose added) containing increasing concentrations ofpropionic acid from 0 to 0.5% at a pH of 4.0 wereinoculated with isolate PR-1 and incubated statically, aconcentration of 0.5% propionic acid was required toinhibit the organism (Fig. 10). When this study wasrepeated with the addition of 4.0% glucose to tubes ofhydrolysate, growth was more rapid and 0.5% propionicacid was again required to inhibit growth (Fig. 11).When isolate PR-1 was incubated with rotary agitation(200 rpm) in 200 ml baffled flasks containing 100 ml offilter clarified and sterilized hydrolysate to which4.0% glucose was added at a pH of 4.0, both 0.1% sodiumbenzoate and 0.1% potassium sorbate were notablyinhibitory (Fig. 12). With static incubation of isolate
255
Fig. 7. Coloni'es of yeast isolate PR-1 on Orange SerumAgar. Incubation was for 48 hr at 32*C.
Fig. 8. Giant colony of isolate PR-1 on Tryptic SoyAgar containing 0.5% glucose. Center of plate (1 mm) wasinoculated. Incubation was for 48 hr at 32*C.

Fig. 9. Dark-phase photomicrographs of isolate PR-1grown on acetate agar. x 1,400.
organism grows from 15*C to 45OC which is an unusuallywide temperature range for a yeast. Among 36 carbonsources tested using the auxanographic plate techniqueonly glucose,, fructose, mannose, succinic acid, andglycerol were utilized. Neither disaccharides norpentose sugars were used, and the organism is neitherlipolytic nor proteolytic. Although nitrate is notutilized as a sole nitrogen source the organism is ableto readily utilize urea. The characteristics of theorganism are given in Table 2. A number of yeasts and
Table 2. Characteristics of yeast isolate PR-1
Colony morphology: Small colonies on orange serumagar. Giant colonies on Mycological Agar and TrypticSoy Agar.
Film formation at surface of static growth media:Positive
Metabolism: Primarily oxidative with weak fermentation.Morphology: Bipolar budding with multiple polar buds.
No pseudomycelium.Temperature range for growth: 15*C - 45*C.Ascospore formation: Negative.Carbon sources utilized of 36 tested: Glucose,
fructose, mannose, succinic acid, & glycerol.Disaccharides and pentoses not utilized.
Nitrate utilized as a sole N source: Negativeurea utilized as a sole N source: positive.Lipase: NegativeProtease: Negative
257
PR-1, in filter sterilized hydrolysate (with no glucose)at pH 4.0, 0.1% K sorbate was notably inhibitory while0.1% Na benzoate was significantly less inhibitory (Fig.13).
HOURS168
Fig. 10. Growth of isolate Fig. 11. Growth ofPR-1 in filter clarified isolate PR-1 in filterand sterilized cod gurry clarified & sterilizedhydrolysate containingincreasing levels of
hydrolysate containing
propionic acid. Hydrolysateincreasing levels ofpropionic acid.
(pH 4.0, 50 ml) contained Hydrolysate (pH 4.0,no added glucose, and was 50 ml) contained 4.0%incubated statically in glucose, and wastubes. incubated statically
in tubes.
When L. plantarum was inoculated into tubes ofsteam sterilized whole hydrolysate containing 4.0%glucose neither 0.1% Na benzoate nor 0.1% K sorbateexerted an inhibitory effect on the resulting rate of pHdecline (Fig. 14). When the same study was performedwith P. acidipropionici ATCC 4875, 0.1% K sorbate hadfi0 effect, whereas 0.1% Na benzoate significantlyincreased the rate of pH decline so as to yield a pH of4.5 in 48 hr compared to 77 hr for the control (Fig.lS).
CONCLUSIONS
The propionic acid fermentation by itself is tooslow to prevent significant numbers of contaminants from
developing when non sterile hydrolysates are inoculatedwith propionic acid bacteria. The lactic acidfermentation is rapid and can result in a pH of 4.5

t
100
g 108s3 1.02EtE3$ 0.1
I
0.01 t0
-I)- 0.1% Na benmate-& O.l%Kuxbam
12 2 4 3 6 4 8HOURS
Fig. 12. Growth of isolatePR-1 in filter clarified& sterilized cod gurryhydrolysate containing 0.1%Na benzoate or K sorbate.Hydrolysate (100 ml), pH 4.0)contained 4.0% glucose & wasin 250 ml baffled flaskswhich were incubated withrotary agitation (200 rpm) .
0 5 10 15HOURS
Fig. 14. Rates of pHreduction by L. plantarumin hydrolyzed cod gurryContaining 4.0% glucose &0.1% Na benzoate or Ksorbate. Hydrolysate(50 ml in tubes) was steamsterilized. Inc.was static.
2880 48 96 144 192 240 :HOURS
Fig. 13. Growth ofisolate PR-1 infilter clarified &sterilized cod gurryhydrolysate containing0.1% Na benzoate or0.1% K sorbate.Hydrolysate (50 mlin tubes, pH 4.0)contained no glucose.Incubation was static.
_e UJntlot
-& o.1Yaadiumbafuoate
6 * o.lxpcasaum~e
24 49 72 96 120HOURS
Fig. 15. Rates of pHreduction byP.acidipropionici in
1
hydrolyzed cod gurrycontaining 4.0% glucose& 0.1% Na benzoate or Ksorbate. Hydrolysate(50 ml in tubes) wassteam sterilized. Inc.was static.
259
being reached in 7 hr. If both a lactic acid bacteriumsuch as L. plantarum and a propionic acid bacteriumsuch as P. acidipropionici are used as inoculum plus3.0% to 4.0% glucose along with 0.1% K sorbate, a rapidreduction of pH will occur with preservation resultingfrom the presence of K sorbate (at reduced pH). Aslactic acid is formed,propionic acid.
it will be slowly converted to
1.O% propionicAt the end of the fermentation, about
acid will result so as to achieve anextremely high level of preservation in combination withthe 0.1% K sorbate.
LITERATURE CITED
1.
2.
van Niel, C.B. 1928. The Propionic AcidBacteria. Haarlem, J. W. Boissevain andCo., 187 pp.
Douglas, H.C. and S.E. Gunter. 1946. Thetaxonomic position of Corynebacterium acne.J. Bacterial. 52: 15-23.
3. Giurca, R. and R.E. Levin. 1993. Optimizationof the lactic acid fermentation ofhydrolyzed cod (Gadus morhua 1 gurry withcorn syrup as carbohydrate source. J. FoodBiochem.16: 277-289.

3
CAPILLARY ZONE ELECTROPHORESIS OF FRESHWATER WHITEFISH(COREGONUS CLUPEAFORMIS) SARCOPLASMIC PROTEINS DURING
MODIFIED ATMOSPHERE PACKAGING
Eileen L. LeBlanc, Zenia J. Hawrysh, N. Joan Turchinskyand Raynald J. LeBlanc*
Department of Food Science and NutritionUniversity of Alberta, Edmonton, AI3 CANADA T6G 2M8
andHBT AGRA Limited*
4810-93 Street, Edmonton, AI3 CANADA T6E 5M4
Demand for seafood (24) has increased primarily because of today’s consumer interest infieshrms, convenience, taste, nutritional value, and potential health benefits related to the presenceof w-3 fatty acids, The present trend in exports of either fresh or saltwater fish is toward increasedhigh quality, chilIed product. Current industrial competitiveness can be improved with the applicationof advanced technology (6) to help the congruent development of both fresh and saltwater fisheryresources. Of these advanced technologies, mod&d atmosphere packaging (MAP) (7) and shelf-lifeextension have been ranked as top Canadian priorities; of the Western Canadian freshwater fishspecies, industry has identified whitefish (Coregomrs clupeaformis) due to its abundance, quality, andsales value. It is widely accepted that if the high quality of this labile product could be extended, thenboth whitefish delivery to local markets, as well as exports to the United States, Europe and Asiacould be better developed. Conversely, a longer shelf-life might permit fish products to be sea orroad freighted to closer markets thus saving the high cost of air freight. These considerations haveled to research on extension of the shelf-life of packaged fresh fish using MAP (1,4, 8, 23, 25, 27)or controlled atmosphere packaging technology (CAP-TECH) (3, 22), the latter having beenoriginally developed for packaging of red meats (10, 11). However, minimal work has been donewith these packaging technologies to assess improvement in the shelf-life of freshwater fish species(2) Particularly those such as whitefish with a moderate-high fat content. To date, researchers (1,4,&w have reported that MAP of fish results in a significant increase in shelf-life but its maximumstorage life may not have been attained because of insufficient CO2. Under optimal conditions for redmeat (lo), a recent study (22) using CAP-TECH for medium microbiological quality snapper(Chrysophyrs auratus) fillets gave a storage life of ca. four weeks at -1 .O”C. Studies (10) of CAPof red meat at - 1. 5°C&0.50C gave a storage life of >24 weeks due to the superior microbiologicalquality of the red meat. Moreover, other investigations (9, 20, 26) on the efficacy of MAP of fish,under variable packaging and storage conditions, have focused on spoilage microflora; however,important nonbacterial changes which influence resultant fish quality also occur during extendedstorage (23). Some studies (8, 25) on sensory properties of MAP of stored fish have been flawed by

261
inappropriate sensory evaluation techniques (13, 29); hence data on color, odor, flavor and texturemay not give a true indication of this most important quality index. There is a paucity of publishedreports on the composite sensory, physical, biochemical and microstructural attributes of stored, fresh
or CAP-TECH systems. Indeed, a systematic investigation of this type seemswarranted to identify which is the preferable system for commercial application.
Conventional electrophoresis and high performance liquid chromatography (HPLC) methodsbased on sarcoplasmic protein (SAR) profiles of raw and/ or cooked fish are limited in theireffectiveness for routine quality control and storage change tests. However, capillary electrophoresis(CE) (17) is now becoming an important technique for fast and efficient separation, characterization,and quantitation of proteins. It offers a gentle, non-denaturing environment, making it a techniquethat is well suited to explore subtle differences in protein structures in their native state (12, 14).
.Recent work by Chen et al, (5) established potential capillary zone electrophoresis (CZE) conditionsfor analysis of model proteins, serum, and complex milk proteins. LeBlanc et al. (16) optimized aCZE method to analyze SAR for fish species identification and to detect changes in product duringfrozen storage. The purpose of the present work, a component of a major project that encompassessensory, physical, biochemical, microbiological, and microstructural assessments, was to apply theCZE method (16) to monitor changes in freshwater whitefish SAR during Aligal or CO2 modifiedatmosphere packaging storage at -2°C for 21 days.
MATERIALS AND METHODS
Exnerimental designFor the study, whole whitefish (Coregom chpeafonnis) was obtained through Billingsgate Fish
Co. Limited, Head Office, Calgary, AB. Same day, landed, gutted, bled, iced whitefish from LakeWabamun were butterfly-filleted, packed appropriately to maintain premium grade quality andtransported from the Billingsgate plant in Edmonton to the Alberta Agriculture Food ProcessingDevelopment Centre, Leduc, AB. A Multivac packaging machine (Model M855E PC, KnudSimonsen Industries Limited, Rexdale, ON) with Winpak high barrier top and bottom films (ESXE1250 S - composition 0.48 mil PVDC coated polyester/2 mil EVA copolymer; APETXE-37550 S -15.0 mil polyester/PVDC/ 2.0 mil polyethylene, Wmpalc Ltd., Winnipeg, MN) was used at the latterlocation for packaging the fillets. The respective forming and seal temperatures were 120°C and130°C. ThegasBushtime&erevacuati0nwas7swithi)Aligalcertifiedmixture(10.1%0,40.5%Ar, 49.4% COJ or ii) CO2 ( Canadian Liquid Air, Edmonton, AB) from individual cylinders. Thetop and bottom Gns had the following gas transmission rates: 0,7.2 cm3/m2/24 h, dry, 23°C andwater vapor, 6.0 g/m2124 h, 90% RH, 37.8”C; O,, 5.5 cm3/m2/24 h, dry, 23°C and water vapor, 2.9g/m’/24 h, 90% RH, 37.8OC. A Macon Oxytran (Model DL 200) was used to measure the 02transmission rate on empty but intact formed packages and gave average readings of 0.232cc/pkg/day under atmospheric conditions (20% O,), ambient temperature (22.5OC), and 20% RH.
Prior to packaging, all fillets were prescreened using a portable pH meter with a surface electrodeand weighed on a Mettler balance to ensure an initial pH range of 6.8-7.0 and weights between 450-500 g. A total of 384 kg butterflied, skin-on whitefish fillets were randomly allocated into 2 groupsof 192 kg - Group 1 for MAP with the Aligal gas mixture with argon (21) and Group 2 for CO,modified CAP-TECH (10, ll) processing. Wbite&h fillets designated to each treatment Group were
randomly a&fled to each of four different, evenly spaced storage intervals (0, 7, 14, 21 days) with48 kg of whitefish fillets assigned to each of six replications per gas mixture X storage intervalcombination. Fillets (ca. 500 g) were packed using the appropriate gas (Ahgd or COJ treatmentwith an inflation volume of 1.5 L of gas mixture/O.5 kg (11) of whitefish @lets to give a residual O2concentration of <0.5%. All samples for each of the six replications were stored in a Ballywa&_in cooler (Model 4884-11) at -2°C for the specified storage interval. Temperatures weremonitored in the cooler with two Delphi model 861 temperature loggers. Head space analysis wascarried out on each sampling day on four packages of each gas treatment/replication using a Hewlettpwhd gt~~ chromatograph (Model 5890A) equipped with a 6' Porapak Q column 80/100 mesh (CO*air separation) and a 10' molecular sieve 13X column 45/60 mesh (0, N2 separation). Oventemperature was 40°C, helium carrier gas flow rate was 24 cc/mm and the detector was thermalconductivity. The area under the peaks was measured using a Hewlett Packard (Model 3390Aintegrator calibrated with a Scatty I analyzed gas mix #237 (7.0032% CO, 14.9992% CO,, 4.5039%methane, 7.000 O2 + 2%).
Upon completion of these analyses at each specified storage interval (Days 0, 7, 14, 21), thepackages from the various replications were transported in coolers to the Department of FoodScience and Nutrition, University of Alberta. Packages f?om each replication were randomly assignedto the various sensory, physical, biochemical, microbiological, and microstructural analyses that wereto be done within the overall study of which this component was part of the protein assessment byCE.
pH of whitefish musclepH was determined on duplicate samples of fish muscle from each of the six replications of both
gas treatments at each storage interval according to the procedure of Woyewoda ef al. (28).Representative samples were cut into 2 cm3 cubes from each side of the filet and 60 g of muscle washomogenized for 1 min in a Cuisinart (Model RC1). The walls of the food processor were scrapeddown after 30 s and the sample was placed into a 25 mL glass beaker. A Fisher Accumet pH meter(Model 815MP) with a combination electrode standard&d at pH 6.0 and 7.0 was inserted into thecenter of the sample and the pH value obtained,
Preparation of SAR for CEDuplicate samples of fish fillets from each of the six replications of both gas treatments at each
storage interval were cut into 1 cm3 pieces, mixed, and 50 g samples were homogenized in 50 mLcold double-distilled, deionized water using a Virtis S23 homogenizer. The samples were blendedat high speed for four 1 5-sec intervals with a 30-sec cooling interval between each 15-sec run. Thehomogenization container was continually cooled in an ice bath. The homogenates were kept coolon ice and weighed immediately into pre-chilled centrifuge tubes. The latter were ultracentrifugedat 45,000 X g for 30 min in a Beckman Model L-2 preparative ukracentrifkge with an SW 27 rotorat -5°C. The supernatant was used immediately for protein profile separation by CE.
CZARPhosphate bufkr of pH 7.4 was prepared by mixing appropriate amounts of 0.5M mono-, di-,
dor t&odium phosphate. Au buff&s were made with doubl~ed, deionized water and Milli-Qtreated prior to filtering through a 0.22 Pm disposable filter before use. Protein standards were

263
obtained from Sigma Biochemicals as lyophilized powders. Protein standards were dissolved insample diluent buffer containing 75 m&I sodium chloride, 20 nM potassium phosphate, 0.01%sodium azide, pH 7.0 S) Each protein concentration was between 0.3-1.0 mg/mL. All fish SARsamples were diluted : 10 in PBS. CZE was performed with a Beckman P/ACE System 2100
h a DELL 316 SX expanded computer and post-run data analysis was carried outSystem Gold Version 7.1 software (Beckman Instruments, Fullerton, CA). A standard
untreated, fused siica capillary of 27 cm length (20 cm to detector window) X 20 µm i.d. (Beckmanpart no. 338475) was used with on-column UV absorbance detection with the P/ACE system set at200 nm with a 50 X 200 pm aperture in the P/ACE cartridge (Beckman part no. 338462). Thetemperature of the capillary during electrophoresis was programmed and maintained at 20°C. Theinlet was held at 10 kV and the samples were introduced by pressure injection for 30 s. Betweenruns, the capillary was sequentially washed with two column volumes of 1.0 N sodium hydroxide andwater (0.3 min high pressure rinsing each), followed by reconditioning with 5-10 column volumes ofrun buffer (1.5-2.0 min high pressure rinsing).
Protein content of SAR extractsProtein concentration of the extracted SAR was determined by the Lowry et al. (18) method with
BSA as a standard.
RESULTS AND DISCUSSION
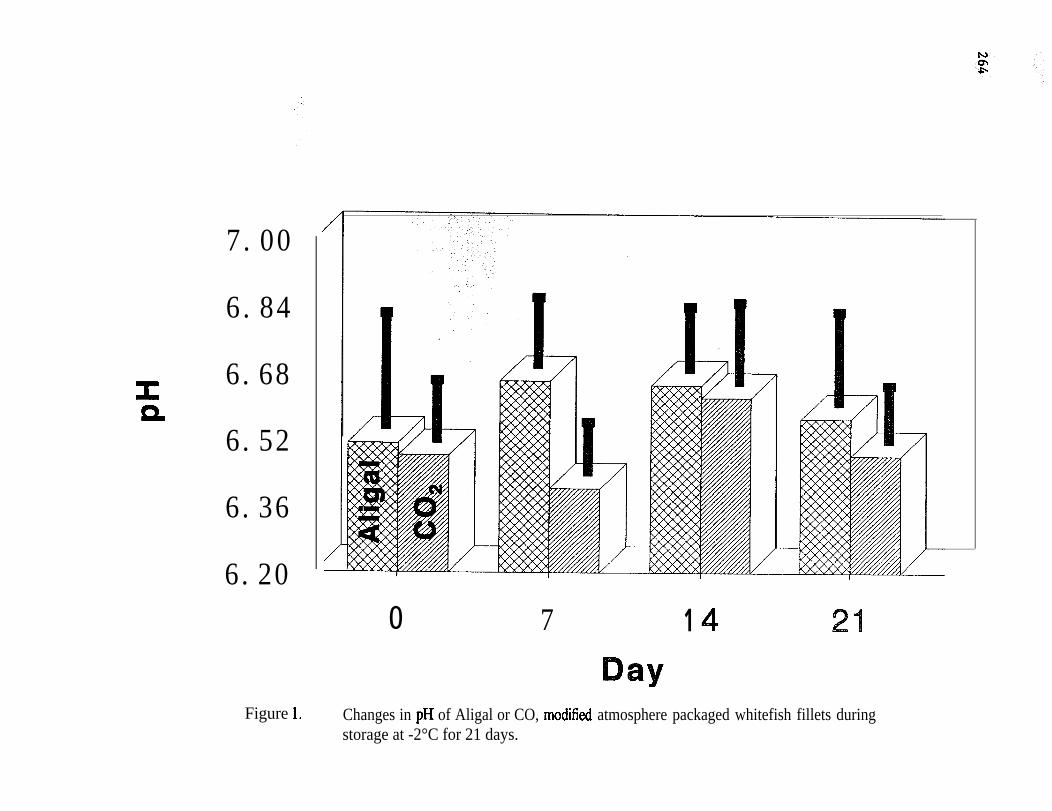
pH of whitefish muscleFigure 1 shows that the pH of the fillets ranged from 6.4w.13 for the CO2 treatment (Day 7) to
6669.17 for the Aligal (Day 7). The Aligal packaged fillets exhibited a significantly (psO.05) highermean pH during storage than that found for the CO2 packaged fillets. This difference may reflect thelower per cent of CO2 in the Aligal gas mixture (49.5%). In addition, the CO2 treatment had asignificantly (psO.05) lower pH on Day 21 compared to that found on Day 7. These valuesdemonstrate the solubility of CO2 and its concentration in this packaging treatment. Otherresearchers found similar pH ranges during storage for snapper (22), salmon (l), and swordfish steaks(15, 19) packaged in mod&d atmospheres that contained gases with lOO%, 90% 70% or 40% CO2.The extent to which pH decreases is proportional to the concentration of CO2 in the package, thebuffering capacity of the muscle, and the composition of the microbial flora (19). An increase in pHindicates bacterial growth which results corn rnicrobii deamination and the formation of basic aminecompounds such as ammonia and total volatile base nitrogen.
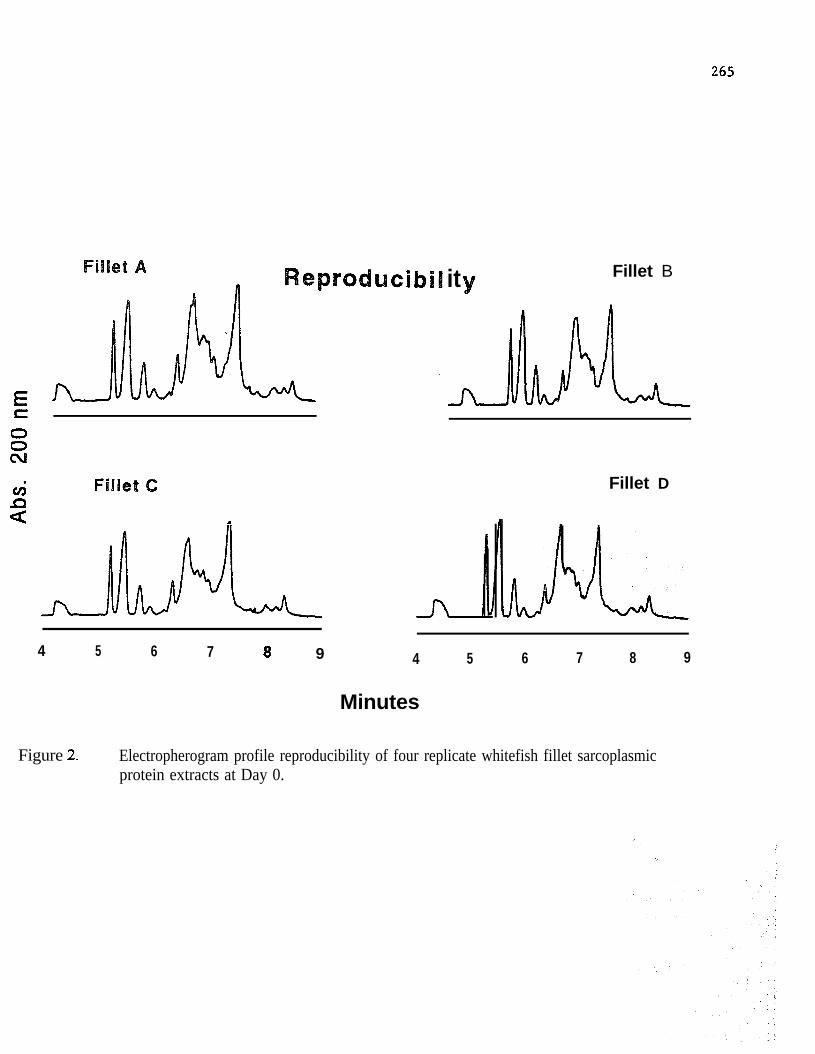
CZE of SARElectropherograms of SAR extracts of replicate whitefish fillets from Day 0 are presented in
Figure 2. The proties of four representative extracts show the reproducibility of the optimized CZEmethod (16) in that all replicates give similar electropherograms and the ratios among the peaks arecomparable. The relative standard deviation (R.S.D.) of the migration time for each of the samplesanalyzed is cl%. Washing of the capillary between runs enhanced the reproducibility in conjunctionwith the other CZE operating variables used. It is noteworthy that the SAK profiles were obtainedusing an injection volume of ca. 2.5 nL and a maximum absorbance of 0.02 units at 200 nm. Peakelution occurred in ca. 5 minutes within a run time of <l0 minutes. The electropherograms (Fig. 2)
7.00
6.84
I 6.68Q
6.52
6.36
6.20
Figure 1.
/
0 7 1
Changes in pH of Aligal or CO, modified atmosphere packaged whitefish fillets duringstorage at -2°C for 21 days.
265
d it
c
zN
4 Fillet c2 .
4 5 6 7 8 9
Fillet B
Fillet D
4 5 6 7 8 9
Minutes
Figure 2. Electropherogram profile reproducibility of four replicate whitefish fillet sarcoplasmicprotein extracts at Day 0.
266
contain 215 well resolved peaks under these CZE conditions. As well, the use of a high NaClconcentration in the phosphate buffer did not result in either a noisy electropherogram or poor IJVdetection.
Fig-ure 3 shows the SAR profiles of Aligal or CO2 packaged whitefish fillets during modifiedatmosphere storage at -2°C for 21 days. Whitefish fillets were of comparable initial quality as shownby the SAR profiles on Day 0. The Aligal packaged whitefish fillets show a decrease in the SARbetween 6 and 8 min. migration time for Days 7, 14, and 21. Conversely, the CO2 packagedwhitefish fillets exhibit an increase in the SAR between 4.8 and 5.6 min. migration time for Days 14and 21. The electropherograms also show three peaks having similar ratios at ca. 4.8 min. migrationtime; a fourth peak becomes apparent at 6 min. migration time in the electropherograms for Days 14and 21. The major peak at 7.2 min. migration time is absent only in the Day 21 Aligalelectropherogram. It is of interest to note that the SAR profiles do not change substantially until Day14 fbr Aligal and Day 21 for CO2; however, there is a notable decrease by Day 21 in the number ofSAR peaks with either gas treatment. It seems likely that any of the degradative changes apparentare associated with bacterial activity and hydrolysis by the naturally occurring proteolytic enzymesof the muscle. These are retarded more effectively by the CO, packaging treatment because of itsgreater effect on PH. The electropherograms (Fig. 3) support the fact that fewer changesOcculTed in the SAR profiles of the CO, packaged fillets during storage thereby resulting in a higherquality product at Day 21.
Protein content of SAR extractsFigure 4 shows that there was no significant (psO.05) difference in protein content of the SAP
extracts from the Aligal or CO2 packaged whitefish fillets during storage at -2°C for 21 days.Therefore, no apparent relationship can be made with the changes observed in the SARelectrophoregrams (Fig. 3).
CONCLUSION
The CZE method optimized for SAP profile analysis for species identification and determinationof changes in fish products during frozen storage by LeBlanc et al. (16) was effectively used tomonitor changes in f&h Ahgal or CO2 modified atmosphere packaged whitefish fillets during storageat -2°C for 21 days. The present results show that CZE gives very reproducible data and that changesin SAR were monitored quickly by this technique using nL of SAR extract ami @ of bufkr.JXkrenw in the SAR profiles of either the Ahgal or CO2 packaged whitefish fillets during storagewere detectable by CZE even thou& there was no significant (p50.05) difference in the proteincontent of the extmcts determined by the Lowry (18) analysis. Fewer changes occurred in the SARProfiles of the CO* modified atmosphere packaged whitefish fillets during storage and these findingsare supported by the decrease in pH found in the muscle for this treatment.to result in better quality product as shown by the CZE data.
CO2 packaging appearsThis advantageous CZE method may
potentially be used to monitor SAP profiles for quality assessment of fresh fish and the applicationof this approach is presently under investigation.

267
Day I4
Day 21
4.0 4.8 5.6 6.4 7.2 8.0 4.0 4.8 5.6 6.4 7.2 8.0
MinutesFigure 3. Electropherograms of sarcoplasmic protein profiles of Aiigal or CO2 modified
atmosphere packaged whitefish fillets during storage at -2°C for 21 days.

II
II
II
00ni0
0
0
0
0
ci3 cv
00d-
0.
..
..
70
0
0
(W/6U
J) WW
Jd
P-
0

269
REFERENCES
1.
2.
3.
4.
5.
6.
7.
8.
9.
10.
11.
B TT, H. J., STONE, F.E., ROBERTS, G.C., Hunter, P. J., Nelson, R.W. and Kwok,J.1982. A study on the use of a high concentration of CO2 in a modified atmosphereto preserve fresh salmon. Mar. Fish. Rev. 42(3): 7- 11.
, J.L., SAY, RC. and STUIBER, D.A. 1991. Adenine nucleotide degradationin modified atmosphere chill-stored fresh fish. J. Food Sci. 56: 1267-1270.
BREMNER, H.A. and STATHAM, J.A. 1987. Packaging in COz extends shelf-life ofscallops. Food Technol. Aust. 39: 177-179.
BRODY, AL. 1989. Modified atmosphere packaging of seafoods. p. 59-65. In AL. Brody(ed.), Controlled/modified atmospher&a.cuum packaging of foods. Food 8z NutritionPress,Inc., Trumbull, CT.
CHEN, F.k, KELLY, L., PALMlER& R, BIEHLER, R. and SCHWARTZ, H. 1992. Useof high ionic strength buffers for the separation of proteins and peptides with capillaryelectrophoresis. J. Liq. Chromatogr. 15: 1143-1161
DONNAN, D.C. and SIMPSON, K.E. 1991. Advanced technology for cost, quality andservice improvement in the Canadian fishing industry. Fisheries Council of Canada,Peat M&wick Stevenson and Kellogg. Industry, Science and Technology of Canada,Ottawa ON KlA 0H5, Technical Report T8, April 15,1991.
ELWORTHY, L., NEW, E. and TORRIE, K. 1989. Emballage a atmosphere modifee.Direction des produits ahmentaires. Industry, Science and Technology of Canada,Ottawa, ON KlA 0H5, Technology Series No. 3, March 1989.
FEY, M. S. and REGENSTEIN, J.M. 1982. Extending shelf-life of fresh red hake andsalmon using COz-0, modified atmosphere and potassium sot-bate at 1°C. J. FoodSci. 47: 1048-1054.
GENIGEORGIS, C. 1985. Microbial and safety implications of the use of modifiedatmospheres to extend the storage life of fresh meat and fish. Int. J. Food Microbial.1: 237-251.
GILL, CO. 1986. The contol of microbial spoilage in fresh meats. & A.M. Pearson andT.R. Dutson (eds.), Adv. Meat Res. 2: 48-88, AVI Publishing Co. Inc., Westport,CT.
GILL, CO., HARRISON, J.C.L. and PENNY, N. 1990. The storage life of chickencarcasses packaged under carbon dioxide. Int. J. Food Microbial. 11: 15 1-157.

270
12. GROSSMAN, P.D., COLBURN, J.C., LAUER, H.H., NIELSEN, R.G.,SITTAMPALAM, G.S. and RICKARD, E.C. 1989. Application of free-solutioncapillary electrophoresis to the analytical scale separation of proteins and peptides.Anal. Chem. 61: 1186-1194.
13. IFT. 1981. Sensory evaluation guide for testing food and beverage products. SensoryEvaluation Division. Food Technol. 35: 50-59.
14. KARGER, B.L., COHEN, A.S. and GUTTMAN, A. 1989. High performance capillaryelectrophoresis in the biological sciences. J. Chromatogr. 492: 585-614.
15. LANNELONGUE, M., FINNE, G., HANNA, M.O., NICKELSON II, R. andVANDERZANT, C. 1982. Microbiological and chemical changes during storage ofswordfish (Xiphias gladus) steaks in retail packages containing CO2-enrichedatmospheres. J. Food Prot. 45: 1197-1203.
16. LEBLANC, E.L., SINGH, S. and LEBLANC, R.J. 1993. Capillary zone electrophoresisof fish muscle sarcoplasmic proteins. Paper #56, Session 8 Chemical Composition ofFoods, Institute of Food Technologists’ Conference, 9-15 July 1993, Chicago, IL.
17. LI, S.F.Y. 1992. Capillary electrophoresis - principles, practices and applications. J.Chromatogr. Library Series, 23, Elsevier Scientific Publishers, Amsterdam.
18. LOWRY, O.H., ROSEBROUGH, N.J., FARR, AL. and RANDALL, R.J. 1951. Proteinmeasurement with the folin phenol reagent. J. Biol. Chem. 193 : 265-275.
19. OBERLENDER, V., HANNA, M.O., MIGET, R, VANDERZANT, C., and FINN& G.1983. Storage characteristics of fresh swordfish steaks stored in carbon dioxide-enriched controlled (flow-through) atmospheres. J. Food Prot. 46: 434-440.
20. POST, L.S., LEE, D.A., SOLBERG, M., FURGANG, D., SPECCHIO, J. and GRAHAM,C. 1985. Development of botulinal toxin and sensory deterioration during storageof vacuum and modified atmosphere packaged fish fillets. J. Food Sci. 50: 990-996.
21. SCHVESTER, P. 1990. MAP of seafood: a new and critical analysis to evaluate itspotential. Conference Proceedings, Session A-3, Pack Alimentaire ‘90, InnovativeExpositions, Inc., Princeton, NJ.
22. SCOTT, D.N., FLETCHER, G.C. and HOGG, M.G. 1986. Storage of snapper fillets inmodified atmospheres at -1°C. Food Technol. Aust. 38:234-238.
23. STAMMER, K., GERDES, D. and CAPORASO, F. 1990. Mod&d atmosphere packagingof seafood. CRC Crit. Rev. Food Sci. Nutr. 29:301-3 31.
271
24. STATISTICS CANADA. 1989. Catalogue 32-229, Annual, Supply & Services Canada,Ottawa, Ontario.
25. VII&E G., Sm, R.E. and PICARD, G. 1986. Bulk storage of cod fillets(Cadus’morhuQ) under carbon dioxide atmosphere. J. Food Sci. 51: 317-320.
26. WANG, .Y. and OGRYDZIAK, D.M. 1986. Residual effect of storage in an elevatedcarbon dioxide atmosphere on the microbial flora of rock cod (Se&&es spp.). Appl.Environ. crobiol. 4: 727-737.
27. WO~W~~~ AD., BLIGH, E.G. and SHAW, S.J. 1984. Controlled and modifiedatmosphere storage of cod fillets. Can. Inst. Food Sci. Technol. J. 17: 24-27.
28. WOYEWODA, AD., SHAW, S.J., KE, P.J. and BURNS, B.G. 1986. Recommendedlaboratory methods for assessment of fish quality. Canadian Technical Report ofFisheries and Aquatic Sciences No. 1448, Ministry of Supply and Services, Ottawa,ON.
29. YORK, RK. 1989. Canadian fishery products - fish inspection and sensory evaluation. Can.Inst. Food Sci. Technol. J. 22: AT/441-444.

PROTEIN HYDROLYZATES FROM AQUATIC SPECIES
Fereidoon ShahidVJ, Xiao-Qing Han', Jozef Synowiecki1and Ryszard Amarowicz'
Departments of Biochemistry1 and Chemist+Memorial University of Newfoundland
St. John's, NF Canada AlB 3X9
Enzymatic hydrolysis is carried out for improving nutritionaland/or functional properties of protein ingredients as well as toretard quality deterioration and off-flavour development. Theseproducts may be prepared from a variety of protein sourcesoriginating from plant, animal and fungi. Underutilized aquaticspecies as well as processing discards of muscle foods may also serveas raw materials for production of hydrolyzates (Shahidi, 1993).
Protein hydrolyzates may be used in a variety of foodformulations intended for hypoallergenic and immune-compromisedindividuals since peptides are involved in the initiation of theimmune response and in the process by which the body is able todifferentiate self from non-self (Mills et al., 1992).Their use ininfant foods and for patients with digestive tract complications isalso commonplace. In fact short peptides are among the most potentpharmacologically active agents known. Furthermore, proteinhydrolyzates may be used as growth enhancing components for juvenilefish in aquaculture operations.
Amongst the aquatic species common to Newfoundland waters arecapelin (Mallotus vi.Zlosus) and harp seal (Phoca groenlandica).Capelin is a small silvery fish related to smelt which is foundabundantly in the offshore and inshore beaches of Newfoundland andLabrador in months of June and July. Spawning stocks consist of 3to 4 years old capelin. Female roe capelin is an important productin the Japanese market, referred to as "shishamo". However, male andspent capalin are generally dumped or are reduced to silage and mealSmall amounts of capelin is also used for production of cornedproducts, fish sauce and pet food. Harp seal carcasses are alsogenerally dumped or reduced to silage, although research from ourlaboratories has demonstrated that seal meat is superior to othertypes of meat with respect to its protein content, amino acidprofile, omega-3 fatty acid constituents as well as mineral andvitamin contents.
As part of an on-going research program in our laboratories forpreparation of value-added products from processing discards andunderutilized aquatic species (Shahidi et al., 1990, 1991a; Shahidiand Synowiecki, 1991), we have investigated production of proteinhydrolyzates from capelin and seal meat. Some characteristics of the

273
resultant protein hydrolyzates referred to as Biocapelin and Biosea-Lhave been studied and their potential applications in a variety offood formulations is being evaluated.
PRODUCTION OF HYDROLYZATES
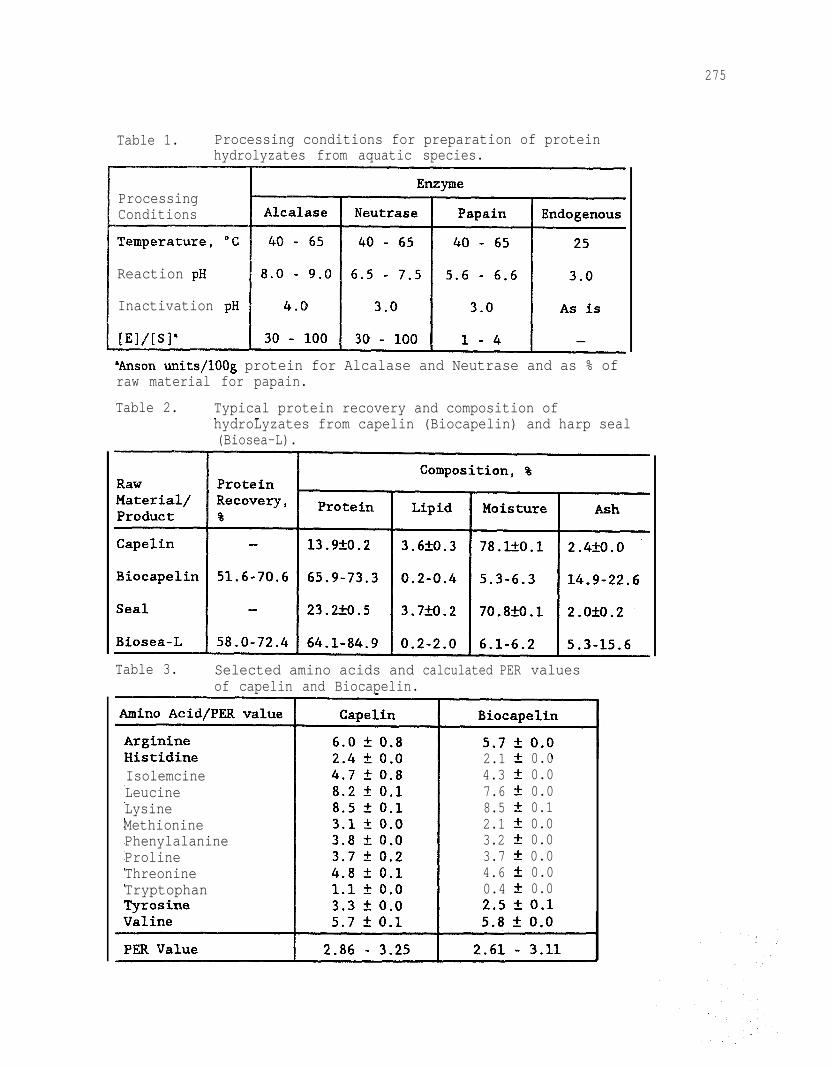
Production of protein hydrolyzates involves comminution of rawmaterial followed by their dissolution or suspension in water.Enzyme is added to the slurry and the reaction proceeds for 2 hoursto 1 week, depending on the activity of the enzymes employed as wellas other factors. After separation of solids, the aqueous layer isclarified and dehydrated (Figure 1). The process may includesterilization at different stages, if necessary.
Table 1 summarizes typical processing conditions forpreparation of hydrolyzates from processing discards andunderutilized species using selected enzymes. Typical yield ofprotein and proximate composition of Biocapelin and Biosea-L aregiven in Table 2. Although many factors affect the yield ofhydrolysis, the type of enzyme employed has a marked effect on thisand also on the characteristics of the final product.
A close scrutiny of the results presented in Table 2 indicatesthat hydrolyzates generally have a much lower lipid content thantheir original protein source, on a dry weight basis. As hydrolysisproceeds, elaborate membrane system of the muscle cells tend to roundup and form insolublevesicles,thus allowing the removal of membranestructural lipids. Therefore, based on highly unsaturated nature oflipid fatty acids from marine species, the resultant products areconsiderably more stable towards oxidative deterioration.
SOME CHARACTERISTICS OF HYDROLYZATES
The amino acid composition of Biocapelin produced by Alcalase-assisted hydrolysis was determined and compared with that of theoriginal capelin. Although sensitive amino acids such as methionineand tryptophan were affected, in general the nutritional value ofproteins in the hydrolyzate were reasonably well preserved. This iswell demonstrated by using an amino acid scoring procedure tocalculate protein efficiency ratio (PER) values of the resultantproducts (Lee & &_., 1978). Thus, the PER values of thehydrolyzates were 2.61-3.11 as compared with 2.86-3.25 for thestarting material. A similar observation was made when the resultsfor mechanically separated seal meat and Biosea-L were compared.Furthermore,all protein preparations so obtained had an ivory-whitecolour with Hunter L values ranging from 74.2 to 84.6.
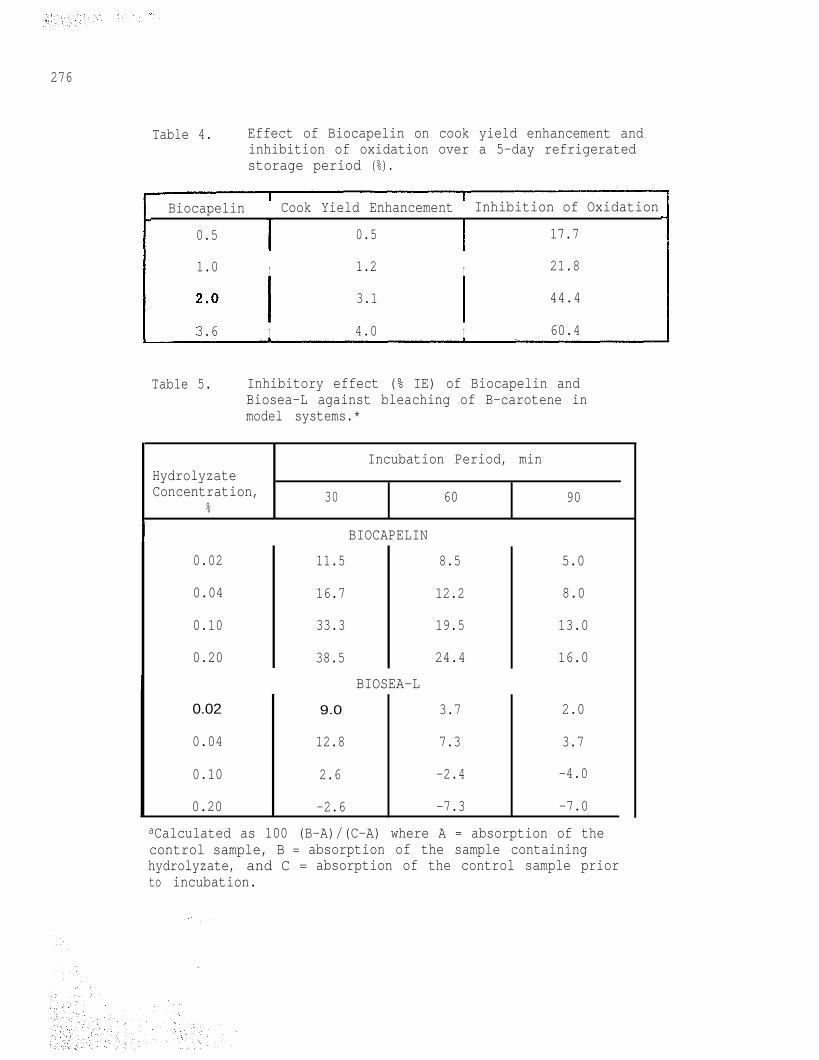
The hydrolyzates so prepared had excellent fat absorption,water solubility and moisture absorption and whippabilitycharacteristics (Shahidi & a., 1991b). In addition, whenBiocapelin was added to meat model systems, a large reduction in theamount of drip water was noticed. Furthermore, Biocapelin hadexcellent ability in preventing cooking loss and development of

274
GRINDINGDISSOLUTION/SUSPENSION HYDROLYSIS
DRYHYDROLYSATE 4 DEHYDRATION
SEPARATION &CLARIFICATION
Figure 1. Scheme for preparation of protein hydrolysate fromaquatic species.
275
Table 1. Processing conditions for preparation of proteinhydrolyzates from aquatic species.
ProcessingConditions
Reaction pH
Inactivation pH
'Anson units/lOOg protein for Alcalase and Neutrase and as % ofraw material for papain.
Table 2. Typical protein recovery and composition of_ _ _hydroLyzates from capelin (Biocapelin) and harp seal(Biosea-L).
Table 3. Selected amino acids and calculated PER valuesof capelin and Biocapelin.
2.1 + 0.0Isolemcine 4.3 + 0.0Leucine 7.6 rt 0.0Lysine 8.5 It 0.1Methionine 2.1 * 0.0Phenylalanine 3.2 +_ 0.0Proline 3.7 If: 0.0Threonine 4.6 rt 0.0Tryptophan 0.4 Zk 0.0
25+,01
276
Table 4. Effect of Biocapelin on cook yield enhancement andinhibition of oxidation over a 5-day refrigeratedstorage period (%).
Biocapelin Cook Yield Enhancement Inhibition of Oxidation
0.5 0.5 17.7
1.0 I 1.2 I 21.8
3.1 ~ 44.4
3.6 I 4.0 I 60.4
Table 5. Inhibitory effect (% IE) of Biocapelin andBiosea-L against bleaching of B-carotene inmodel systems.*
Incubation Period, minHydrolyzateConcentration, 30 60 90
%
I BIOCAPELIN
0.02 11.5 8.5 5.0
0.04 16.7 12.2 8.0
0.10 33.3 19.5 13.0
0.20 38.5 24.4 16.0
BIOSEA-L
0.02 9.0 3.7 2.0
0.04 12.8 7.3 3.7
0.10 2.6 -2.4 -4.0
0.20 -2.6 -7.3 -7.0aCalculated as 100 (B-A)/(C-A) where A = absorption of thecontrol sample, B = absorption of the sample containinghydrolyzate, and C = absorption of the control sample priorto incubation.

277
rancidity in meat model systems as summarized in Table 4. However, a study of the inhibitoryeffects of Biocapelin and Biosea-L against bleaching of ß-carotene in a ß-carotene/linoleate(M&r, 1971) system demonstrated that while the former always exhibited an inhibitory effect,the latter had pro-oxidant activity when used at higher concentrations (Table 5).~hnmatographic separation of the hydrolyzates indicated that while their antioxidant activitywas due to ninhydrin-positive components, proxidant components were ninhydrin-negative.Further studies towards structuraI identification of the biologically active components of thehydrolyzates are in progress.
ACKNOWLEDGEMENTS
We are grateful to the Department of Fisheries and Oceans and the Natural Sciencesand Engineering Research Council of Canada f thhor e award of a Subvention grant in support ofthe present work.
1.
2.
3.
4.
5.
6.
7.
8.
REFERENCES
LEE, Y.B., J.G. ELLIOT, D.A. RICKANSRUD, and E.C. HAGBERG. 1978.Predicting protein efficiency ratio by the chemical determination of connectivetissue content in meat. J. Food Sci. 43: 1359-1362.
MILLER, E.E. 1971. A simplified method for the evaluation of antioxidants. J. Am.Oil Chem. Sot. 45: 91.
MILLS, E.N.C., M.J.C. ALCOCER, and M.RA. MORGAN. 1992. Biochemicalinteractions of food-derived peptides. Trends Food Sci. Technol. 3: 64-68.
SI-IAHIDI, F. and J. SYNOWIECKI 1991. Isolation and characterization of nutrientsand value-added products from snow crab (Chinoecetes opilio) and shrimp(Pundahs borealis) processing discards. J. Agric. Food Chem. 39: 1527-1532.
SHAHIDI, F., X.Q. HAN, J. SYNOWIECKI, and J. BALEJKO. 1991b. Enzymaticmodification of marine proteins: 1. Male and spent cap&n. Presented at the1991 Atlantic Fisheries Technological Conf~ce. Per&, Quetic.
SHAHIDI, F., M. NACZK, R.B. PEGG, and J. SYNOWIECKI. 199la. Chemicalcomposition and nutritional value of processing discards of cod (Gadusmorhuu) Food Chem. 42: 145-153.
SHAHIDI, F., J. SYNOWIECKI, and M. NACZK. 1990. Seal meat - - A potentialsource of muscle food: Chemical composition, essential amino acids and coiourcharacteristics. Can Inst. Food Sci. Technol. J. 23: 137-139.
SHAHIDI, F. 1993. Pmteins from seafood processing discards. In Seafood Proteins.ed. Sikorski, Z.E., Pan, B.S. and Shah.& F. Chapman and Hail, New York.In press.

278
AN ECONOMIC ANALYSIS OF THESOUTHEAST U.S. SEAFOOD PROCESSING INDUSTRY, 1973-901
Walter R. Keithly, Jr. and Kenneth J. Roberts*Coastal Fisheries InstituteLouisiana State University
Baton Rouge, Louisianaand
Office of Sea Grant Development andLouisiana Agricultural Center*
A variety of species are harvested in the Southeast UnitedStates, i.e., the coastal states of North Carolina through Texas.These regional catches, together with domestic and foreignimports, provide the raw material product needed to support aprocessing sector valued at $1.4 billion (includes only theproduction of edible products) in 1990. This equates to about 20%of the $7.0 billion national industry (edible.).
Despite the size of the Southeast processing industry andits importance to many of the local communities, economicinformation concerning its structure, conduct, and performance isnot readily available. The purpose of this paper is to provide abrief economic analysis of the Southeast edible seafood processingsector. The analysis covers the 1973-90 period and is based oninformation collected and maintained by the National MarineFisheries Service, Fisheries Statistics Division. The informationpresented is derived from a final report by Keithly et al. (l),and the reader is referred to that report for a more detailedanalysis which examines processing at a much more disaggregatedand area specific level.
In order to achieve the stated objective, the paper proceedsas follows. First, some general industry characteristics arepresented followed by a presentation of issues related to thestructure, conduct, and performance within the industry. Then,historical Southeast edible seafood landings are briefly reviewed.The paper concludes with an examination of processing activitiesin relation to landings.
279
RESULTS
GENERAL. INDUSTRY CHARACTERISTICS
As indicated in Table 1, the reported number of Southeastedible seafood processors clearly increased when evaluated inthree-year intervals. In 1973-75, for example, about 500 firmswere engaged in seafood processing on an annual basis and thisnumber increased to 623 during 1988-90. These 623 firms, whilerepresenting a 25% increase above the number reported during theinitial three-year period, represented a decrease of more thantwenty from 1982-84, when a maximum 646 firms were reported. Asindicated, the 1979-81 period was one of particularly pronouncedgrowth in firm numbers.
Production of processed edible seafood, expressed on aproduct weight basis, averaged 400 million pounds annually in1988-90 compared to 273 million pounds in 1973-75, an annualizedgrowth rate of about three percent. Overall, production increasedduring each three-year interval of analysis except for the mostrecent when production fell slightly, i.e., less than two percent.Observed changes in aggregate seafood processing activities, byand large, represented changes in shrimp processing activities.As will be shown shortly, this reflects the dominance of thissingle species in the aggregate.
For purposes of analysis, the product weight poundage wasalso converted to an equivalent edible-meat-weight basis and live-weight basis and the conversions are presented in Table 1. Asindicated, the estimated edible-meat-weight poundage consistentlyaveraged from about 75%-85% of the product weight poundage, thedifference reflecting shell and additional ingredients that areincluded in the calculation of product weight. The estimatedlive-weight poundage, on the other hand, traditionally exceededthe product weight poundage by 80%-90%.
The value of Southeast U.S. seafood processing activitiesincreased by a factor of two during the period of analysis, whenexamined in three-year intervals, from $459 million annually in1973-75 to $1.37 billion annually in 1988-90 (Table 1). Most ofthis increase, however, was inflationary based. After removingthe effects of inflation, the value of Southeast seafoodprocessing activities has remained relatively stable since 1976-78with the exception of about a 10% decline during the most recentthree-year period. An increasing production in conjunction with astable deflated value indicates a declining deflated processedprice. This decline is clearly identified in Table 1. Theaverage annual deflated price in 1988-90, $3.63 per product-weightpound (expressed in 1990 dollars) ,was less than 80% of the 1973-75 average price of $4.50 per pound and less than 70% of the peakprice of $5.62 per pound which occurred during the 1976-78 period.
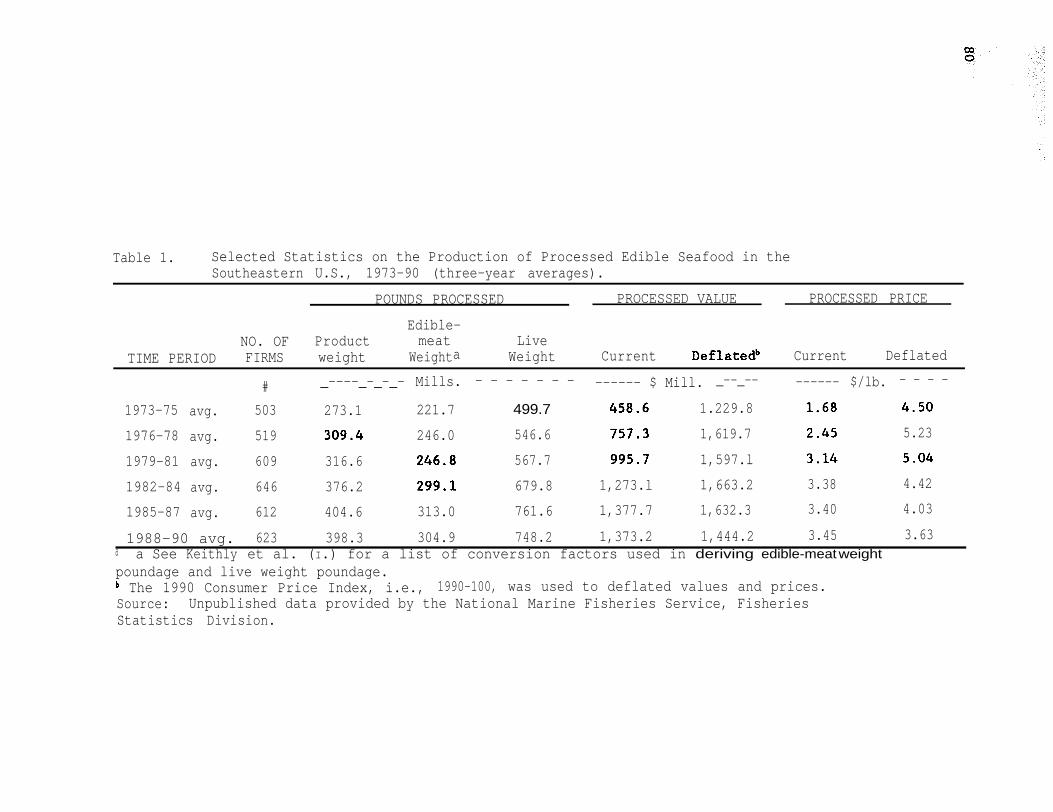
Table 1. Selected Statistics on the Production of Processed Edible Seafood in theSoutheastern U.S., 1973-90 (three-year averages).
POUNDS PROCESSED PROCESSED VALUE PROCESSED PRICE
Edible-NO. OF Product meat Live
TIME PERIOD FIRMS weight Weighta Weight Current Deflatedb Current Deflated
# _----_-_-_- Mills. - - - - - - - ------ $ Mill. _--_-- ------ $/lb. - - - -
1973-75 avg. 503
1976-78 avg. 519
1979-81 avg. 609
1982-84 avg. 6461985-877 avg. 612
273.1
316.6
376.2404.6 313.0
221.7
246.0
499.7
546.6
567.7
679.8761.6
1,273.l1,377.7
1.229.8
1,619.7
1,597.l1,663.21,632.3
3.38 4.42
3.40 4.03
5.23
1988-90 avg. 623 398.3 304.9 748.2 1,373.2 1,444.2 3.45 3.63a a See Keithly et al. (I.) for a list of conversion factors used in deriving edible-meat weightpoundage and live weight poundage.b The 1990 Consumer Price Index, i.e., 1990-100, was used to deflated values and prices.Source: Unpublished data provided by the National Marine Fisheries Service, FisheriesStatistics Division.

281
The composition of aggregate Southeast processingactivities, expressed as a percent of total value by key species(or groups), is presented in Table 2. As indicated, shellfishconsistently represented in excess of 90% of aggregate Southeastprocessing activities (edible) when measured by value and, inearlier years, exceeded 95%. Shrimp represented, by far, thelargest component of aggregate activities, from about 70% to 80%.Much of the remaining shellfish processing activities wereattributable to blue crabs and oysters. The contribution to thetotal by finfish species, while relatively small, increased from4.2% during 1973-75 to 7.8% during 1988-90, or by 85%.
Table 2. Contribution to the Total Value of Southeast U.S.Seafood Processing Activities, Expressed on aPercentage Basis, 1973-90.
TIME BLUE OTHER TOTAL TOTALPERIOD SHRIMP CRAB OYSTER SHELLFISH SHELLFISH FINFISH
----------------------% of Tota~~~__~~~~___~_~~_~~_~__
1973-75 76.5 8.6 5.4 5.3 95.8 4.2
1976·=78 80.7 6.4 5.1 4.2 96.4 3.6
1979-81 77.6 6.1 4.0 7.1 94.8 5.2
1982-84 74.1 6.8 4.9 7.8 93.6 6.4
1985-87 73.9 7.9 4.7 5.6 92.1 7.8
1988-90 73.7 7.9 3.6 7.0 92.2 7.8Source: Unpublished data provided by the National Marine FisheriesService, Fisheries Statistics Division.
ECONOMIC STRUCTURE, CONDUCT, AND PERFORMANCE
Several aspects of the economic structure, conduct, andperformance of the Southeast processing industry are presentedbelow. They include (i) productivity within the Southeastprocessing industry and changes therein, (ii) the sizedistribution of firms within the industry and changes therein, and(iii) industry concentration and changes therein.
Productivity of the Southeast Processing Industry
Productivity within the Southeast seafood processingindustry was evaluated using two methods. The first was theestimation of production per firm. The second was the estimationof production per worker.

282
Production per Firm. Production per firm among Southeasternseafood processors is given in Table 3 for the 1973-90 period.Production per firm over the 18- year period of analysis averaged590.4 thousand pounds, when evaluated on a product weight basis.Production averaging 639.7 thousand pounds annually during 1987-90exceeded the comparable statistic for the 1973-75 period by almost100 thousand pounds (18%) but was below peak production of 661.2thousand pounds per firm (1985-87 avg.) by about three percent.
Table 3. Per Firm Production of Edible Processed Seafood in theSoutheastern United States, 1973-90 (three-yearaverages).
VALUE PER FIRM
TIME PERIOD POUNDS/FIm Current Deflatedb--- 1,000s --- ____________ $l,OOOs _-----_-___-
1975-75 avg. 543.0 911.8 2,445.0
1976-78 avg. 596.2 1,459.2 3,120.8
1979-81 avg. 519.9 1,634.9 2,622.4.
1982-84 avg. 582.7 1,971.8 2,575.9
1985-87 avg. 661.2 2,251.2 2,667.l
1988-90 avg. 639.7 2,205.3 2,319.3' Given on a product weight basis.b The deflated values are expressed in 1990 dollars and are basedon the Consumer Price Index.Source: Unpublished data provided by the National MarineFisheries Service, Fisheries Statistics Division..
Evaluated on a deflated value basis (1990 base year),production per firm averaged $2.63 million during the 18-yearperiod of analysis. Production peaked during 1976-78 at $3.12million which exceeded the low production of $2.32 million byabout 35%. The low production occurred during the most recentthree-year period and, in general, the deflated value ofproduction per firm has been declining since 1976-78.
In general, there was an increase in production per firmsince the mid 198Os, when evaluated on a poundage basis, comparedto earlier years. Because of the decline in the deflated perpound price of the processed product, however, a concurrentincrease in the deflated value of processing activities per firmwas not identified.
Production per Worker. As indicated by the information containedin Table 4 the average Southeast seafood processing firm employed28 workers on an annual basis' during 1973-75. Each of theseworkers produced an average of 19.7 thousand pounds of seafood
283
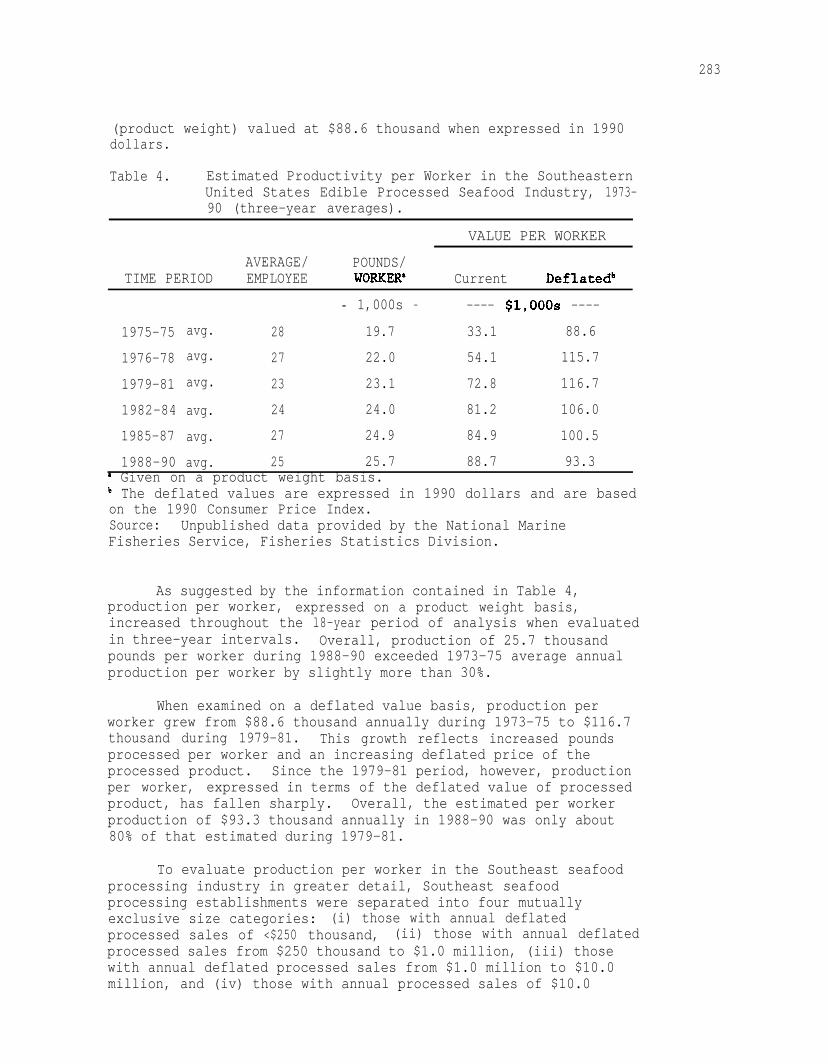
(product weight) valued at $88.6 thousand when expressed in 1990dollars.
Table 4. Estimated Productivity per Worker in the SoutheasternUnited States Edible Processed Seafood Industry, 1973-90 (three-year averages).
VALUE PER WORKER
AVERAGE/ POUNDS/TIME PERIOD EMPLOYEE woRKER^ Current Deflatedb
- 1,000s - ---- $l,OOOs ----
1975-75 avg. 28 19.7 33.1 88.6
1976-78 avg. 27 22.0 54.1 115.7
1979-81 avg. 23 23.1 72.8 116.7
1982-84 avg. 24 24.0 81.2 106.0
1985-87 avg. 27 24.9 84.9 100.5
1988-900 avg. 25 25.7 88.7 93.3* Given on a product weight basis.b The deflated values are expressed in 1990 dollars and are basedon the 1990 Consumer Price Index.Source: Unpublished data provided by the National MarineFisheries Service, Fisheries Statistics Division.
As suggested by the information contained in Table 4,production per worker, expressed on a product weight basis,increased throughout the l8-year period of analysis when evaluatedin three-year intervals. Overall, production of 25.7 thousandpounds per worker during 1988-90 exceeded 1973-75 average annualproduction per worker by slightly more than 30%.
When examined on a deflated value basis, production perworker grew from $88.6 thousand annually during 1973-75 to $116.7thousand during 1979-81. This growth reflects increased poundsprocessed per worker and an increasing deflated price of theprocessed product. Since the 1979-81 period, however, productionper worker, expressed in terms of the deflated value of processedproduct, has fallen sharply. Overall, the estimated per workerproduction of $93.3 thousand annually in 1988-90 was only about80% of that estimated during 1979-81.
To evaluate production per worker in the Southeast seafoodprocessing industry in greater detail, Southeast seafoodprocessing establishments were separated into four mutuallyexclusive size categories: (i) those with annual deflatedprocessed sales of <$250 thousand, (ii) those with annual deflatedprocessed sales from $250 thousand to $1.0 million, (iii) thosewith annual deflated processed sales from $1.0 million to $10.0million, and (iv) those with annual processed sales of $10.0
284
million o r more. Selected information pertaining to new workerproductivity among firms in each of these four groupings ispresented in Table 5.
As indicated, employment per firm with annual deflated salesless than $250 thousand generally averaged from about six to eightworkers annually. The number increased in relation to firm sizewith the largest firms, i.e., those with annual processed sales inexcess of $10 million, generally reporting in excess of 150workers annually.
An examination of the information contained in Table 5indicates that production per worker, expressed in terms of eitherpounds or value, increased rapidly with firm size. For example,production per worker in 1988-90 averaged 4.8 thousand poundsamong the smallest firms, 7.4 thousand pounds among firms withannual sales from $250 thousand to $1.0 million, 22.5 thousandpounds among firms with annual sales from $1.0 million to $10.0million, and 43.7 thousand pounds among firms, with annual sales10.0 million or more.
Four hypotheses can be offered to explain the differences inproductivity per worker in relation to firm size. First, workersin the smaller firms may function in more than one role. Forexample, they may carry administrative duties in addition to timespent actually involved in processing. Second, many of the largercompanies tend to be shrimp oriented which tend to be moremechanized (see Keithly et al., 1). Third, larger firms arelikely to have a steady supply of raw product and, hence, workerstend to be more full-time oriented and may in some instances workmore overtime hours. Finally, there may be some economies toscale in relation to firm size.
Overall, there was a clear increase in production per worker(measured in pounds) during the 1973-90 period among the twolarger classification of firms. Among firms in the $1.0 to $10.0million processed sales range, production per worker increasedone-third, from 16.6 thousand pounds annually during 1973-75 to22.5 thousand pounds during 1988-90. Among firms with annualsales greater or equal to $10.0 million, production per workerrose 40%, from 32.2 thousand pounds to 43.7 thousand pounds.Because of a decline in the per pound processed price, however,the deflated value of processed sales per employee has fallensharply since the 1979-81 period.
Size Distribution
To examine the size distribution of seafood processing firmsin the Southeast, and changes therein through time, firm's weregrouped into four categories based upon deflated value ofProcessed sales: (i) firms with annual sales <$250 thousand, (ii)firms with annual sales from $250 thousand to $1.0 million,

285
Table 5. Estimated Productivity per Worker in the SoutheastU.S. Processed Seafood Industry (Edible), by Size ofFirm, 1973-90 (three-year averages).
OUTPUT VALUE PER WORKER
POUNDS/WORKER Current DeflatedTIME PERIOD WORKERS/FIRM (1,000s)a ($1,000s) (Sl,CCCs)
____-_______________--- < $250,000 ____________--_-____---
1973-75 avg. 6 3.7 5.4 14.4
1976-78 avg. 7 3.7 6.9 14.7
1979-81 avg. 6 4.1 10.3 16.5
1982-84 avg. 7 3.3 9.6 12.5
1985-87 avg. 7 3.9 10.9 13.0
1988-90 avg. 6 4.5 13.4 14.0---------------- $250,000 - $1.0 Million _~_-~-_-~--c~_-_
1973-75 avg. 17 8.1 12.2 32.1
1976-78 avg. 17 6.5 13.9 29.8
1979-81 avg. 16 7.9 20.5 32.7
1928-84 avg. l8 7.9 22.8 29.8
1985-87 avg. 20 7.4 23.8 28.1
1988-90 avg. 18 7.4 28.9 30.5----_-__-_--__ $1.0 Million to $10.0 Million --_______-__--
1973-75 avg. 42 16.6 28.9 76.7
1976-788 avg. 37 16.7 . 39.6 85.01979-81 avg. 33 20.6 60.2 95.7
1982-84 avg. 36 21.6 69.0 90.2
1985-87 avg. 36 21.5 75.1 88.9
1988-90 avg. 36 22.5 80.0 84.4___----_-____________ 2 $10.0 Million ____--______________*
1973-75 avg. 186 31.2 52.5 141.4
1976-78 avg. 141 37.9 95.6 204.2
1979-81 avg. 155 38.5 127.6 205.4
1982-84 avg. 161 42.1 148.6 194.1
1985-87 avg. 163 44.4 151.0 179.0
1988-90 avg. 164 43.7 147.5 154.9a expressed on a product weight basisSource: Unpublished data provided by the National MarineFisheries Service, Fisheries Statistics Division.

286(iii) firms with annual deflated sales of $1.0 million to $10.0million, and (iv) firms with annual deflated processed sales of$10.0 million or more.
As indicated from the information contained in Table 6,little change occurred in the size distribution of the Southeastseafood processing sector during 1973-90 when evaluated on thebasis of the deflated value of processed sales. From about 40% to46% of the establishments consistently exhibited sales of lessthan $250 thousand when examined in three-year intervals. Another27% to 32% exhibited sales in the $250 thousand to $1.0 millionrange. From 20% to 23% of the firms consistently reported salesin the $1.0 to $10.0 million range. The remaining 5% to 8% of theestablishments reported sales of $10.0 million or more.
Table 6. Size Distribution Among Firms in the Southeastern U.S.Seafood Processing Industry, 1973-90 (three-yearaverages).
DEFLATED VALUE OF PROCESSED SALES
TIME c $250,000 $250,000- $1.0 Million- 1 $10.0PERIOD $1.0 Million $10.0 Million Million
_____________________~~ _____________-_-__-----X1973-75 43 28 23 6avg.
1976-78 39 32 21 8avg.
1979-81 44 30 20 6avg.1982-84 46 27 21 5avg.
1985-87 43 28 23 6avg.
1988-90 46 28 21 6avg.
Source: Unpublished data provided by the National MarineFisheries Service, Fisheries Statistics Division.
It is noteworthy that size distribution of firms within theindustry remained relatively constant during 1973-90, despite asharp increase in the number of firms. This suggests that rawproduct may not have been a limiting factor in industry growthduring 1973-90. If it were, one would expect to find that alarger percentage of firms would fall into the smaller sizeclasses through time as the total number of firms expanded.
Industry Concentration
Concentration among firms in the Southeast seafoodprocessing industry during 1973-90 and changes therein can beevaluated using several alternative methods. One method commonly
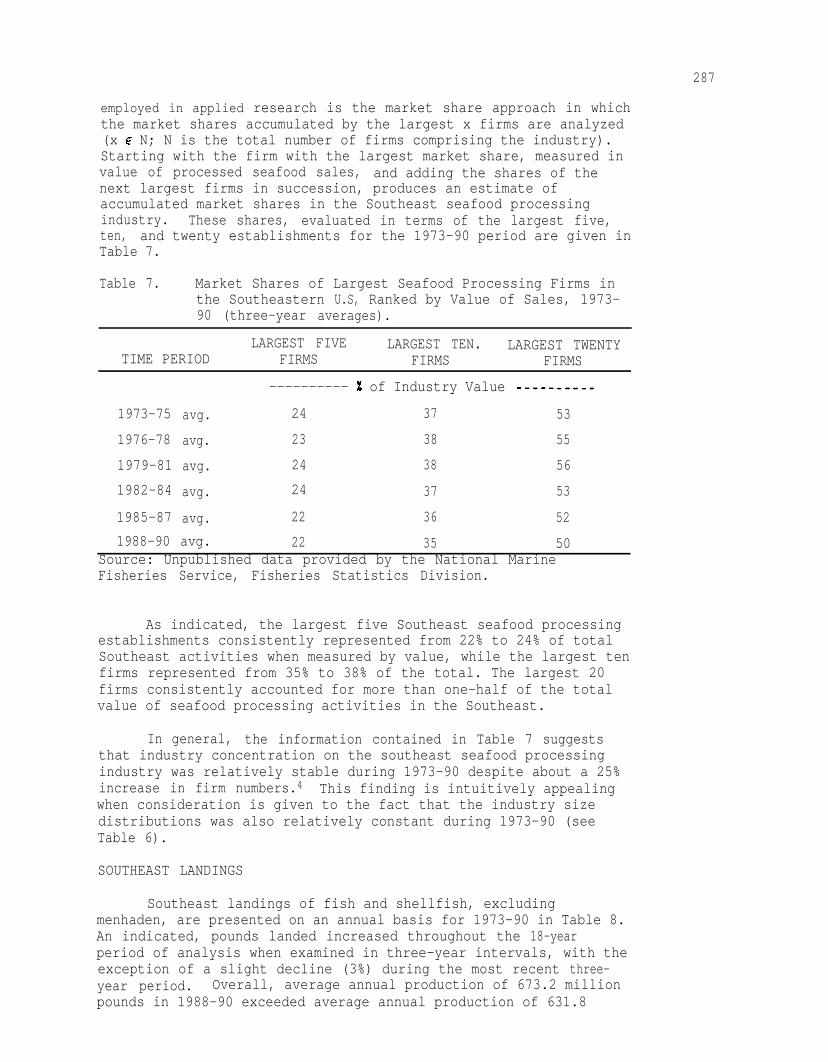
287
employed in applied research is the market share approach in whichthe market shares accumulated by the largest x firms are analyzed(x E N; N is the total number of firms comprising the industry).Starting with the firm with the largest market share, measured invalue of processed seafood sales, and adding the shares of thenext largest firms in succession, produces an estimate ofaccumulated market shares in the Southeast seafood processingindustry. These shares, evaluated in terms of the largest five,ten, and twenty establishments for the 1973-90 period are given inTable 7.
Table 7. Market Shares of Largest Seafood Processing Firms inthe Southeastern U.S, Ranked by Value of Sales, 1973-90 (three-year averages).
LARGEST FIVE LARGEST TEN. LARGEST TWENTYTIME PERIOD FIRMS FIRMS FIRMS
---------- X of Industry Value --___---__
1973-75 avg. 24 37 53
1976-78 avg. 23 38 55
1979-81 avg. 24 38 561982-84 avg. 24 37 53
1985-87 avg. 22 36 521988-90 avg. 22 35 50
Source: Unpublished data provided by the National MarineFisheries Service, Fisheries Statistics Division.
As indicated, the largest five Southeast seafood processingestablishments consistently represented from 22% to 24% of totalSoutheast activities when measured by value, while the largest tenfirms represented from 35% to 38% of the total. The largest 20firms consistently accounted for more than one-half of the totalvalue of seafood processing activities in the Southeast.
In general, the information contained in Table 7 suggeststhat industry concentration on the southeast seafood processingindustry was relatively stable during 1973-90 despite about a 25%increase in firm numbers.4 This finding is intuitively appealingwhen consideration is given to the fact that the industry sizedistributions was also relatively constant during 1973-90 (seeTable 6).
SOUTHEAST LANDINGS
Southeast landings of fish and shellfish, excludingmenhaden, are presented on an annual basis for 1973-90 in Table 8.An indicated, pounds landed increased throughout the 18-yearperiod of analysis when examined in three-year intervals, with theexception of a slight decline (3%) during the most recent three-year period. Overall, average annual production of 673.2 millionpounds in 1988-90 exceeded average annual production of 631.8

million pounds in 1979-81 by about 7% and exceeded 1973-75 averageannual production of 524.0 million pounds by 28%.
Table 8. Southeast Seafood Landings (less menhaden), 1973-90(three-year averages).
VALUE
TIME PERIOD POUNDSa Current Deflatedb
--- 1,000s --- _______"___ $l,OOOss --------
1973-75 avg. 524,028 286,444 699,8851976-78 avg. 585,583 439,706 942,3541979-81 avg. 631,787 607,856 975,9231982-84 avg. 634,284 705,111 925,364
1985-87 avg. 690,540 848,825 968,959
1988-90 avg. 673,161 812,653 875,153a Expressed on a live-weight basisb The deflated values are expressed in 1990 dollars and are basedon the 1990 Consumer Price Index.Source: Unpublished data provided by the National MarineFisheries Service.
The current value of Southeast fish and shellfish landings(excluding menhaden) increased from $286.4 million annually in1973-75 to $812.7 million annually in 1988-90 (Table 8). Afteradjusting for inflation, however, the value of Southeast landingshas remained relatively stable in the $925 million to $975 millionrange since 1976-78 with the exception of a decline in 1988-90 to$875 million. This decline reflects both a decline in harvest anda decline in deflated price.
PROCESSING ACTIVITIES IN RELATION TO LANDINGS
Southeast edible seafood processing activities, expressed ona line-weight basis, were presented in Table 1 while Southeastedible seafood landings, also expressed on a live-weight basis,were given in Table 8. A comparison of the relevant informationin the two tables indicates that processed quantity averaged from90% to 95% of Southeast landings (less menhaden) through 1979-81.Since 1982-84, however, processed quantity has exceeded landingsand the margin has been increasing. While difficult to documentwith the limited available data, the information suggests thatmost reported domestic landings in the earlier time periods wentinto processing activities. With increased imports throughout thedecade of the 1980's, particularly shrimp, processing activitiesadvanced in relation to landings, i.e., a portion of the increasedimports were used in Southeast processing activities. Thisincreased usage in shrimp processing activities was documented byRoberts et al (2) and the reader is referred to Keithly et al. (1)for additional insight as to the relationship between processingactivities and landings of individual species processed in theSoutheastern United States.
289
1.
2.
1.
2.
3.
4.
REFERENCES
KEITHLY, W. R., JR., K. J. ROBERTS, AND H. E. KEARNEY.1993. The southeastern seafood processing industry:An economic assessment for private and publicmanagement decision making. Final Report to NationalMarine Fisheries Service (contract no. NA9OAA-H-SK-53). 900+ pages.
ROBERTS, K. J., W. R. KEITHLY, AND C. ADAMS. 1992.Determinants of imported shrimp and their role in thesoutheast shrimp processing sector. NMFS TechnicalMemorandum (NMFS/SEFC-305). 33pp.
ENDNOTES
The authors acknowledge support from the National MarineFisheries Service, Saltonstall-Kennedy Project # NA90AA-H-SK053.
Farm-raised catfish was excluded from the analysis.
Administrative employees are not included in this estimate.Rather, the estimated number includes only those workers whocome in contact with the product during processingoperations, i.e., the production workers. The number ofworkers used in calculations reflects the yearly averagewhich tends to be below the maximum number of workersemployed by firms during peak production months.
More advanced techniques to measure concentration were alsopresented by Keithly et al. (1993). In general, they allagreed with the findings associated with the market shareapproach.