Embed Size (px)
Citation preview
Extension and Outreach/Department of Economics
2015 Crop Market Outlook
Apr. 26, 2015
Chad HartAssociate Professor/Crop Markets Specialist
Extension and Outreach/Department of Economics
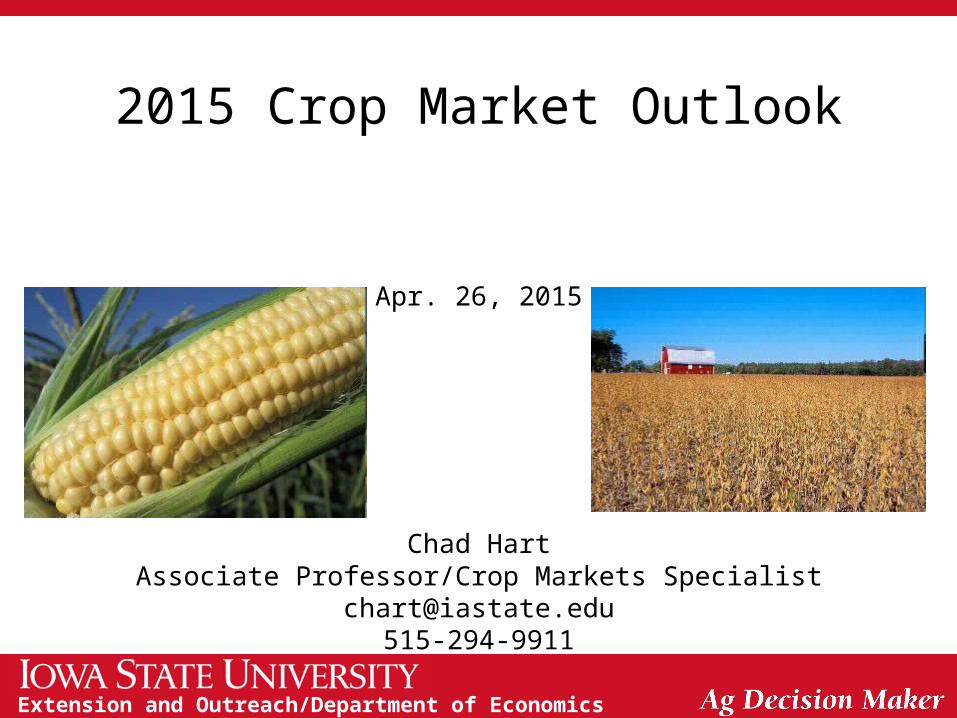
U.S. Corn Supply and Use2011 2012 2013 2014 2015
Area Planted (mil. acres) 91.9 97.3 95.4 90.6 89.2
Yield (bu./acre) 147.2 123.1 158.1 171.0 166.8
Production (mil. bu.) 12,360 10,755 13,829 14,216 13,625
Beg. Stocks (mil. bu.) 1,128 989 821 1,232 1,827
Imports (mil. bu.) 29 160 36 25 25
Total Supply (mil. bu.) 13,517 11,904 14,686 15,472 15,477
Feed & Residual (mil. bu.) 4,557 4,315 5,036 5,250 5,275
Ethanol (mil. bu.) 5,000 4,641 5,134 5,200 5,225
Food, Seed, & Other (mil. bu.) 1,428 1,397 1,367 1,395 1,410
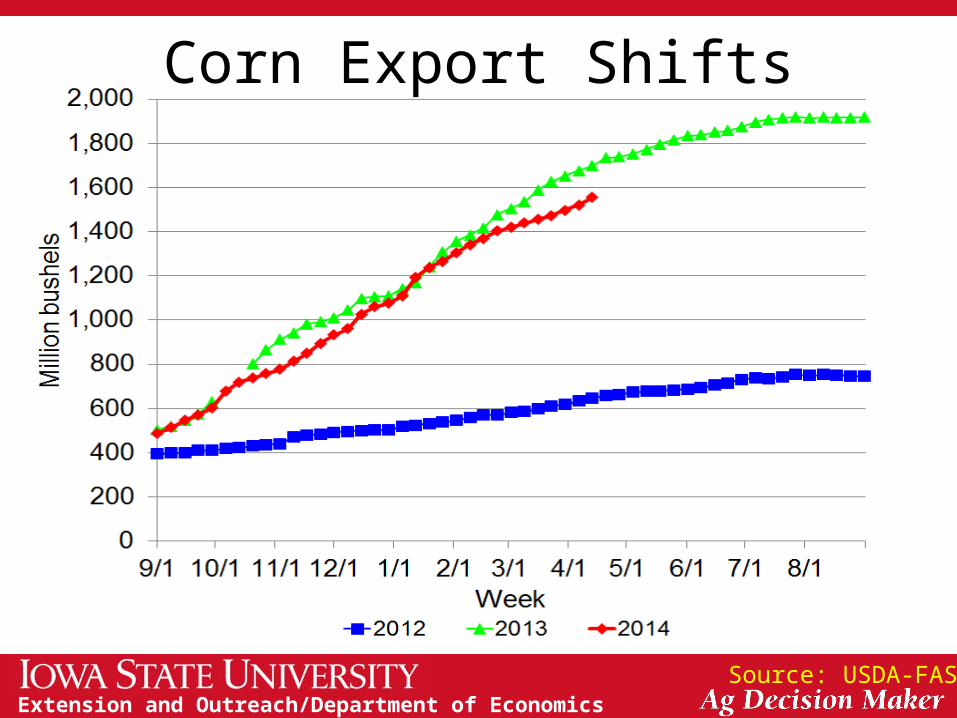
Exports (mil. bu.) 1,543 730 1,917 1,800 1,850
Total Use (mil. bu.) 12,528 11,083 13,454 13,645 13,760
Ending Stocks (mil. bu.) 989 821 1,232 1,827 1,717
Season-Average Price ($/bu.) 6.22 6.89 4.46 3.70 3.50
Sources: USDA-WAOB 2011-14, USDA-OCE 2015
Extension and Outreach/Department of Economics
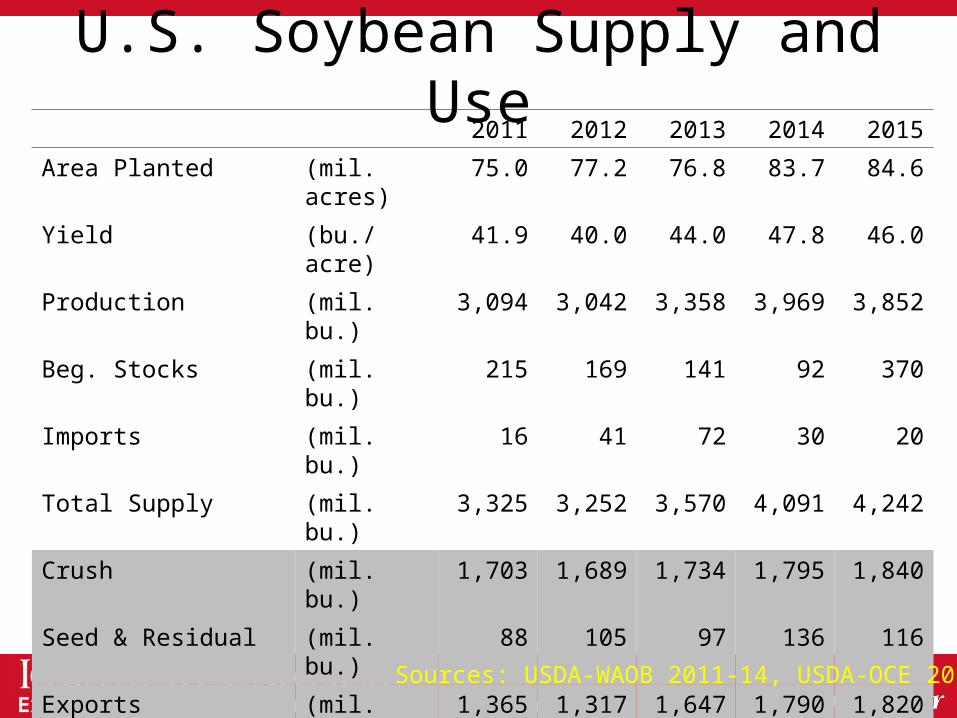
U.S. Soybean Supply and Use2011 2012 2013 2014 2015
Area Planted (mil. acres) 75.0 77.2 76.8 83.7 84.6
Yield (bu./acre) 41.9 40.0 44.0 47.8 46.0
Production (mil. bu.) 3,094 3,042 3,358 3,969 3,852
Beg. Stocks (mil. bu.) 215 169 141 92 370
Imports (mil. bu.) 16 41 72 30 20
Total Supply (mil. bu.) 3,325 3,252 3,570 4,091 4,242
Crush (mil. bu.) 1,703 1,689 1,734 1,795 1,840
Seed & Residual (mil. bu.) 88 105 97 136 116
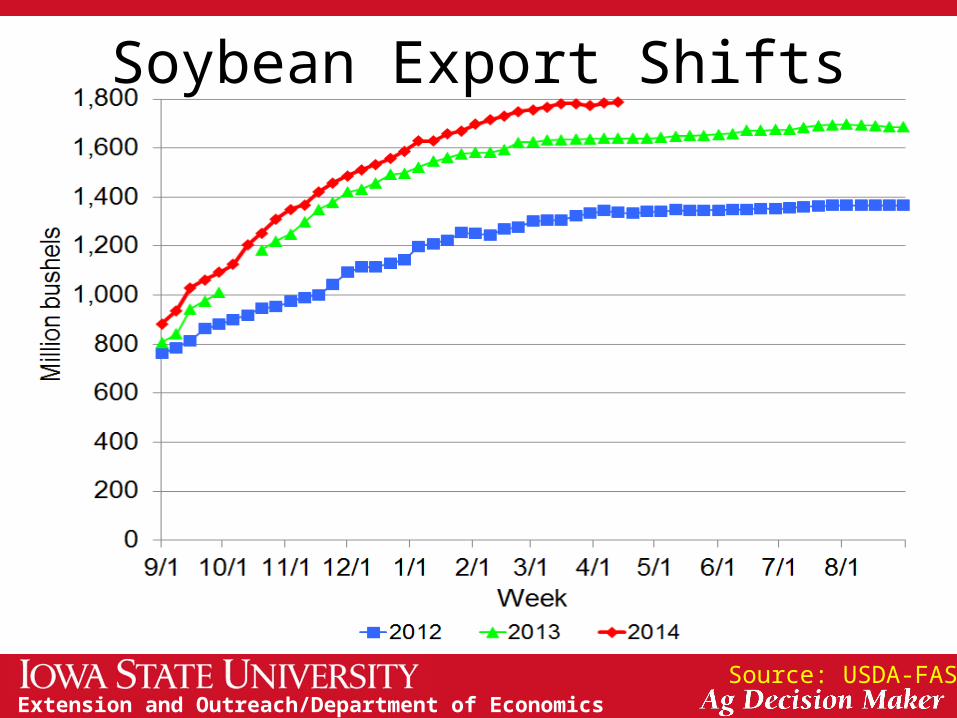
Exports (mil. bu.) 1,365 1,317 1,647 1,790 1,820
Total Use (mil. bu.) 3,155 3,111 3,478 3,721 3,775
Ending Stocks (mil. bu.) 169 141 92 370 467
Season-Average Price ($/bu.) 12.50 14.40 13.00 10.10 9.00
Sources: USDA-WAOB 2011-14, USDA-OCE 2015
Extension and Outreach/Department of Economics
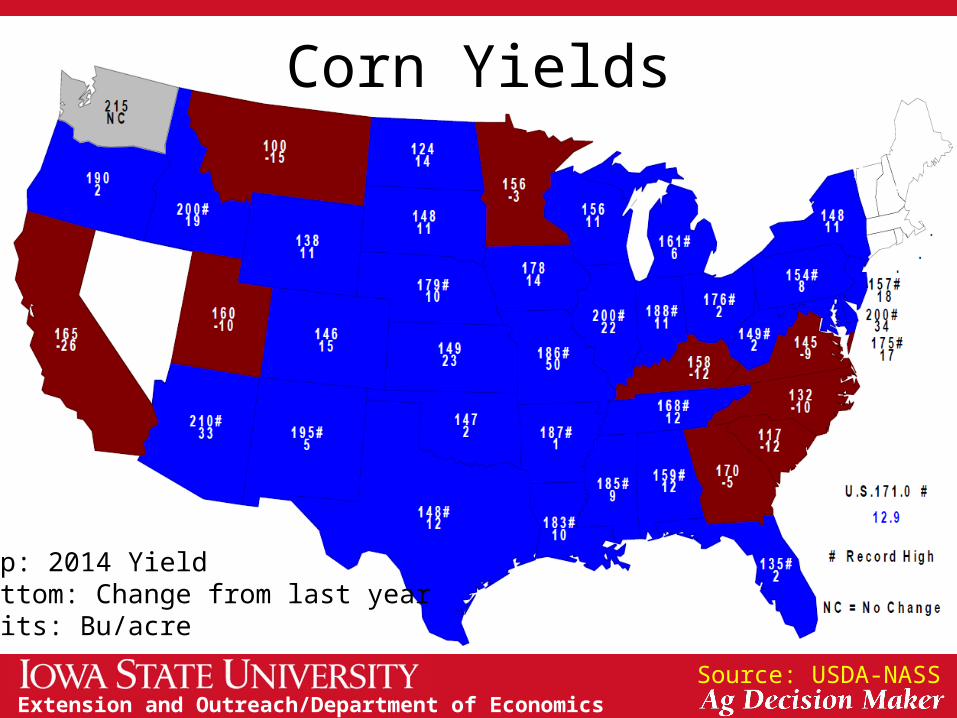
Corn Yields
Source: USDA-NASS
Top: 2014 YieldBottom: Change from last yearUnits: Bu/acre
Extension and Outreach/Department of Economics
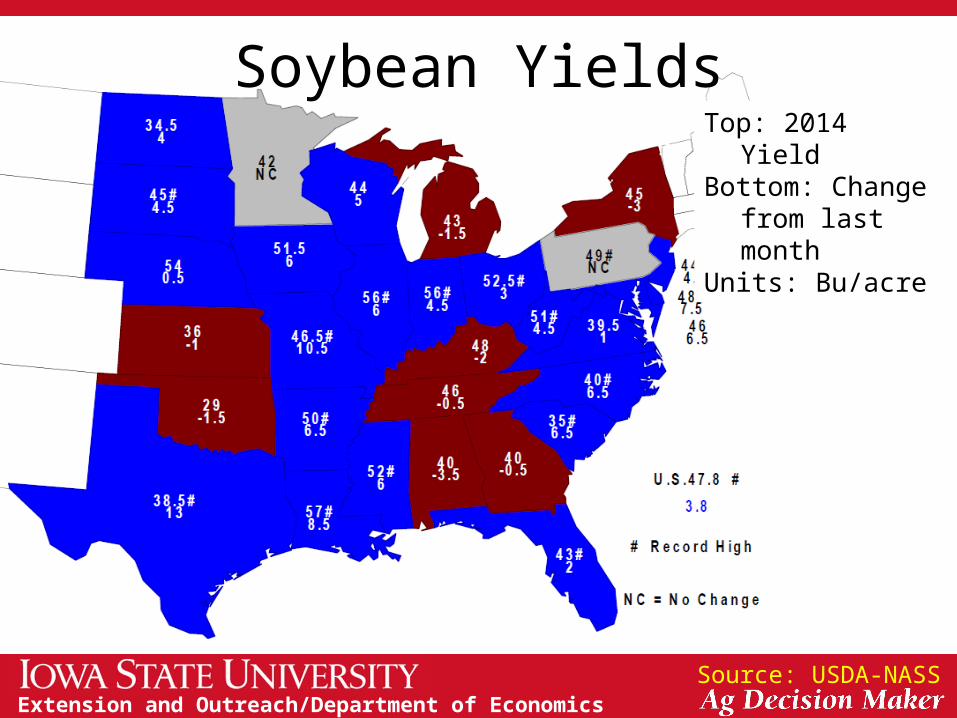
Soybean Yields
Source: USDA-NASS
Top: 2014 YieldBottom: Change
from last monthUnits: Bu/acre
Extension and Outreach/Department of Economics
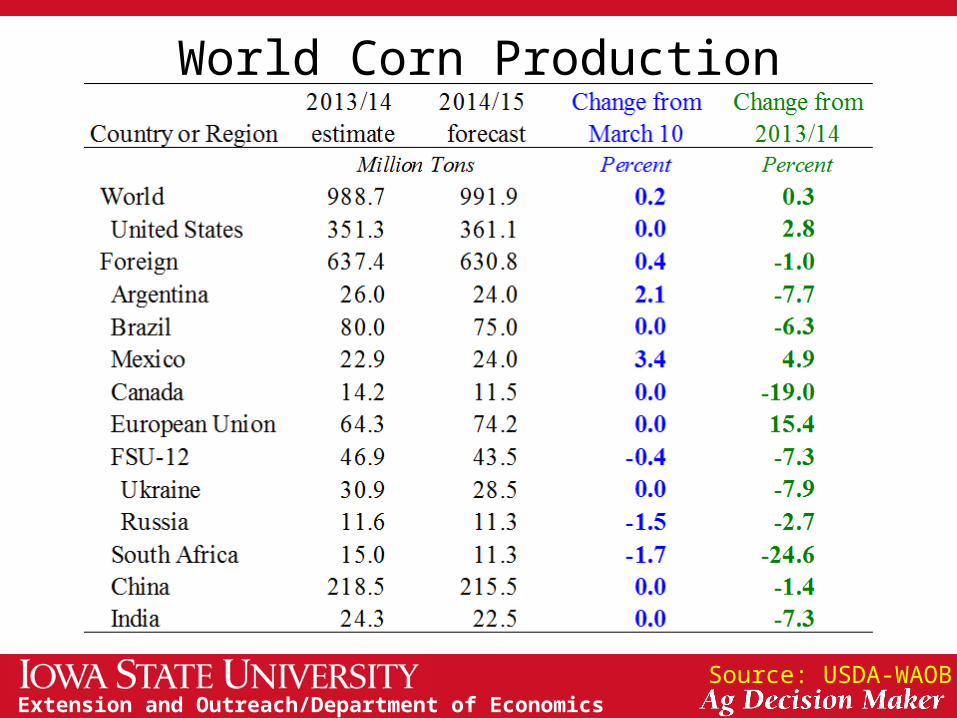
World Corn Production
Source: USDA-WAOB
Extension and Outreach/Department of Economics
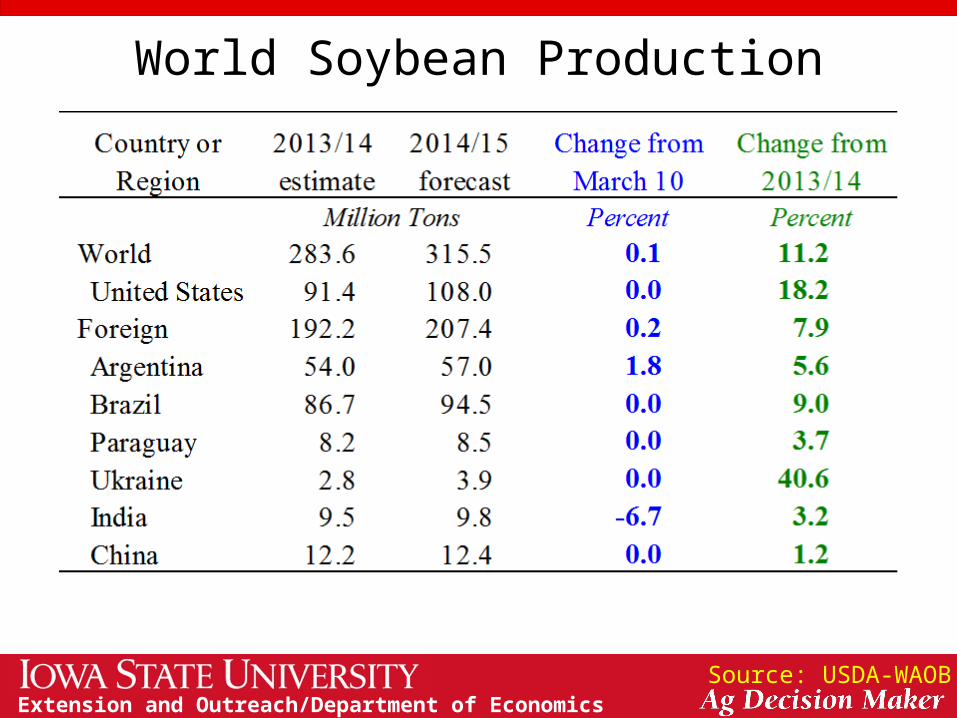
World Soybean Production
Source: USDA-WAOB
Extension and Outreach/Department of Economics
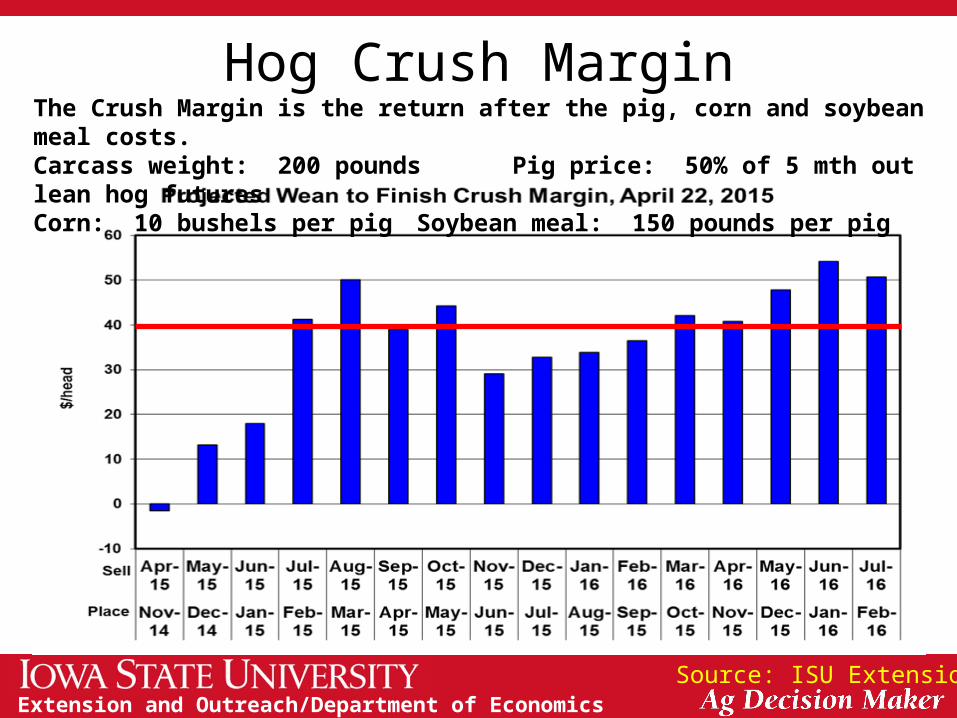
Hog Crush Margin
Source: ISU Extension
The Crush Margin is the return after the pig, corn and soybean meal costs.Carcass weight: 200 pounds Pig price: 50% of 5 mth out lean hog futuresCorn: 10 bushels per pig Soybean meal: 150 pounds per pig
Extension and Outreach/Department of Economics
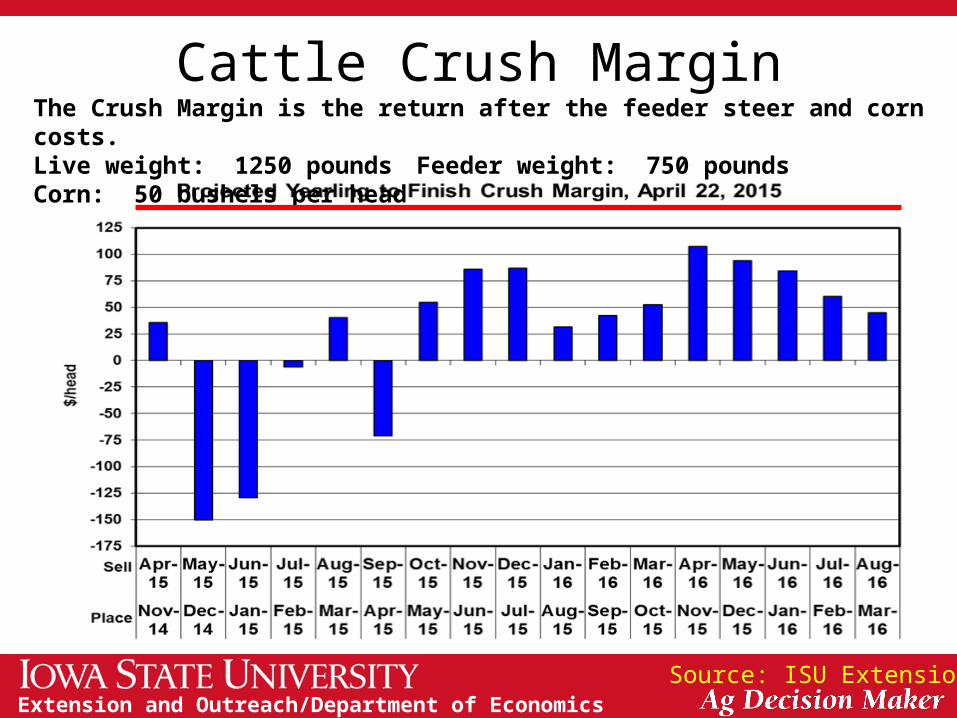
Cattle Crush Margin
Source: ISU Extension
The Crush Margin is the return after the feeder steer and corn costs.Live weight: 1250 pounds Feeder weight: 750 pounds Corn: 50 bushels per head
Extension and Outreach/Department of Economics
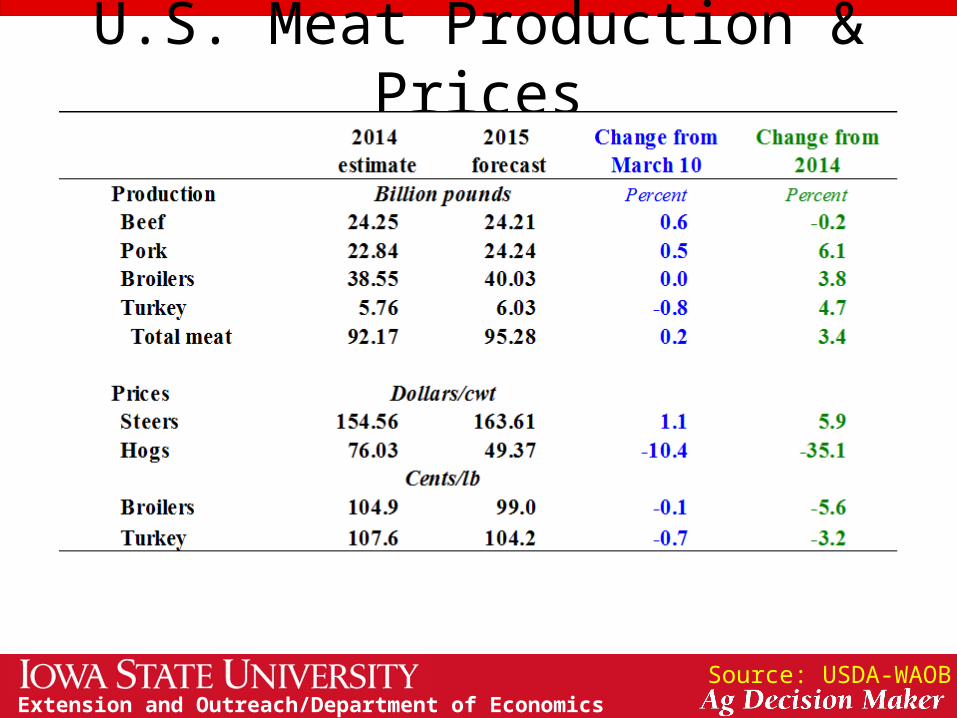
U.S. Meat Production & Prices
Source: USDA-WAOB
Extension and Outreach/Department of Economics
Corn Export Shifts
Source: USDA-FAS
Extension and Outreach/Department of Economics
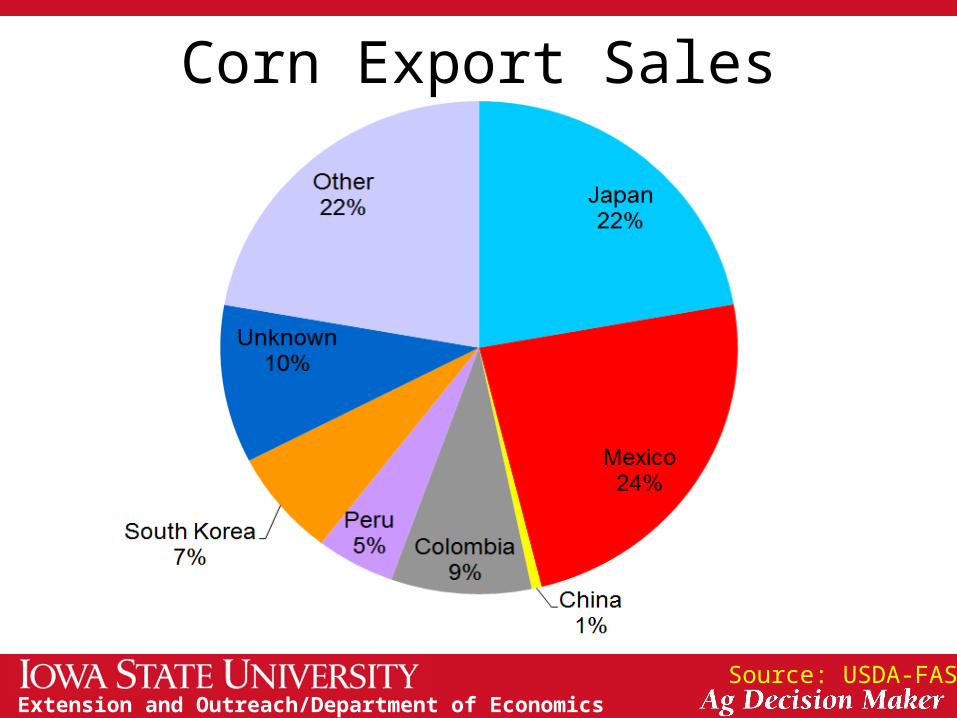
Corn Export Sales
Source: USDA-FAS
Extension and Outreach/Department of Economics
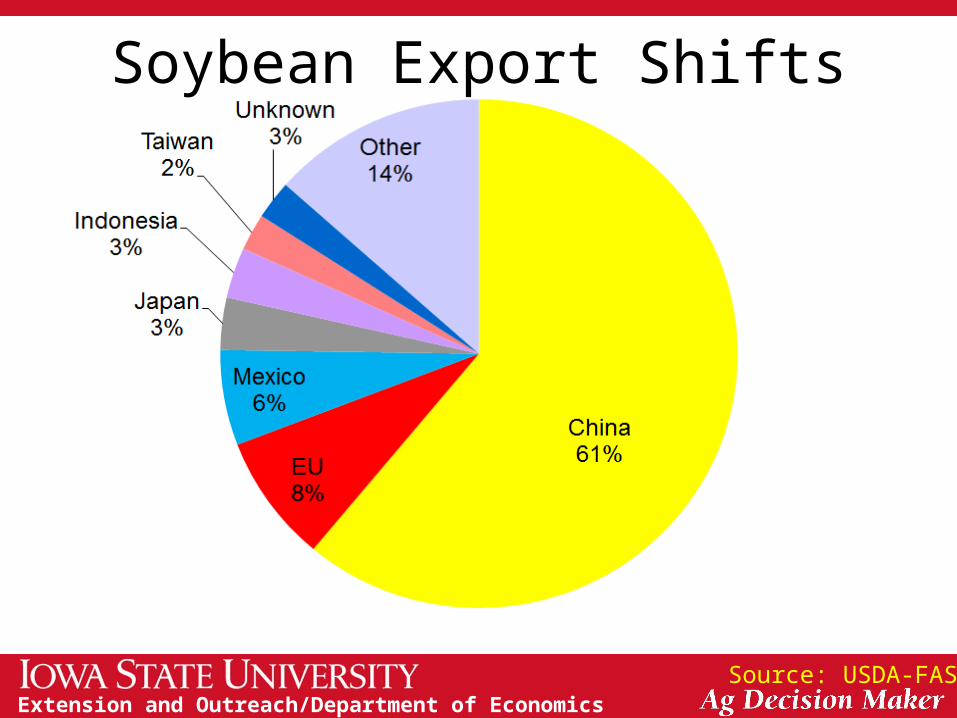
Soybean Export Shifts
Source: USDA-FAS
Extension and Outreach/Department of Economics
Soybean Export Shifts
Source: USDA-FAS
Extension and Outreach/Department of Economics
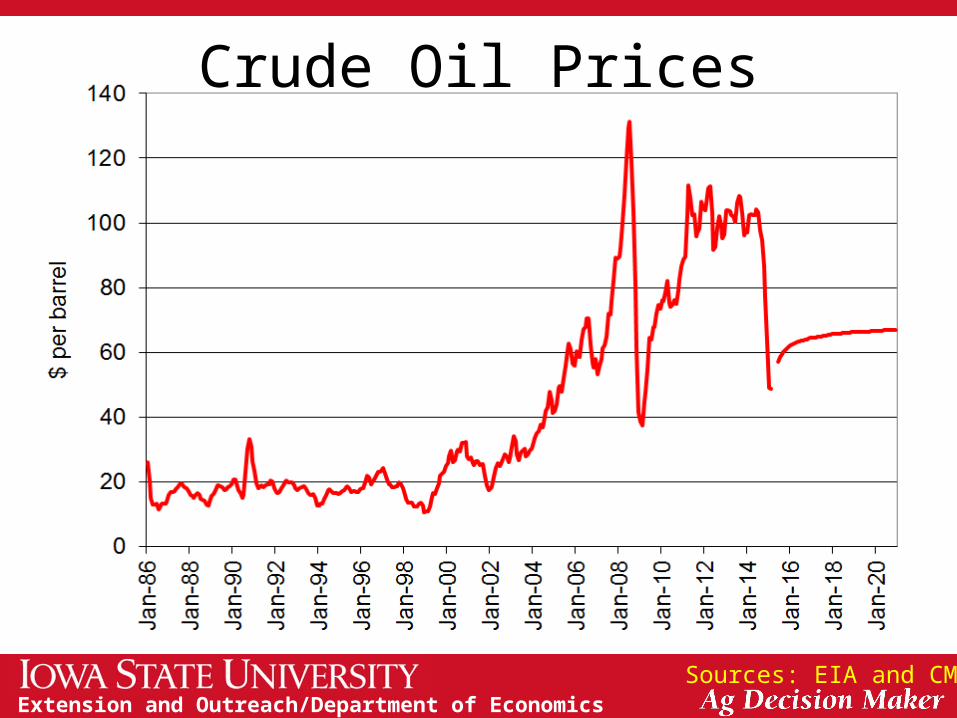
Crude Oil Prices
Sources: EIA and CME
Extension and Outreach/Department of Economics
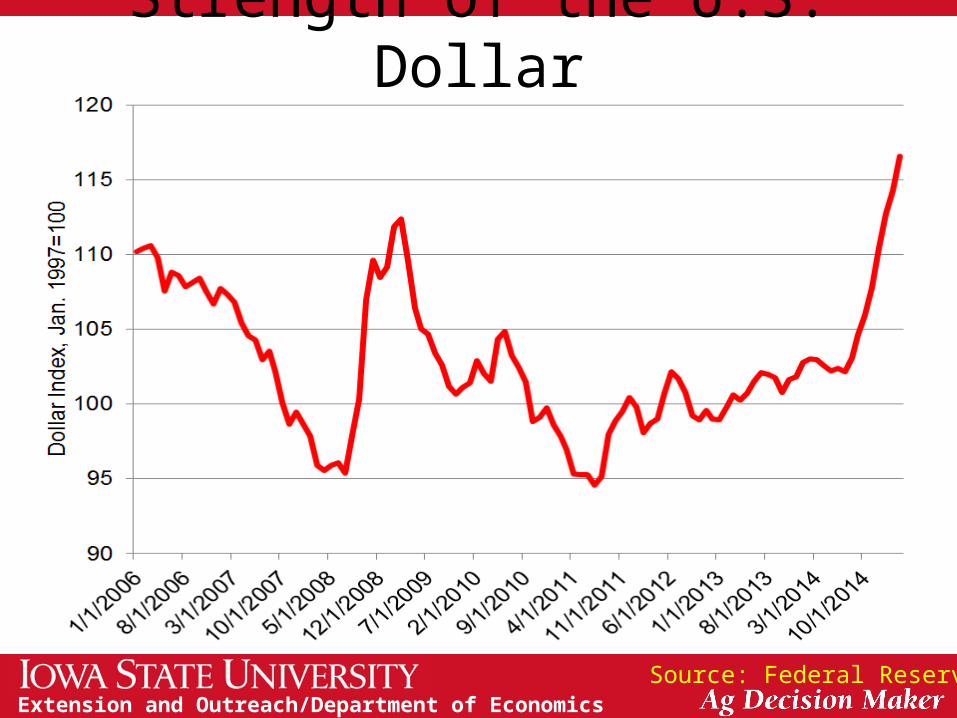
Strength of the U.S. Dollar
Source: Federal Reserve
Extension and Outreach/Department of Economics
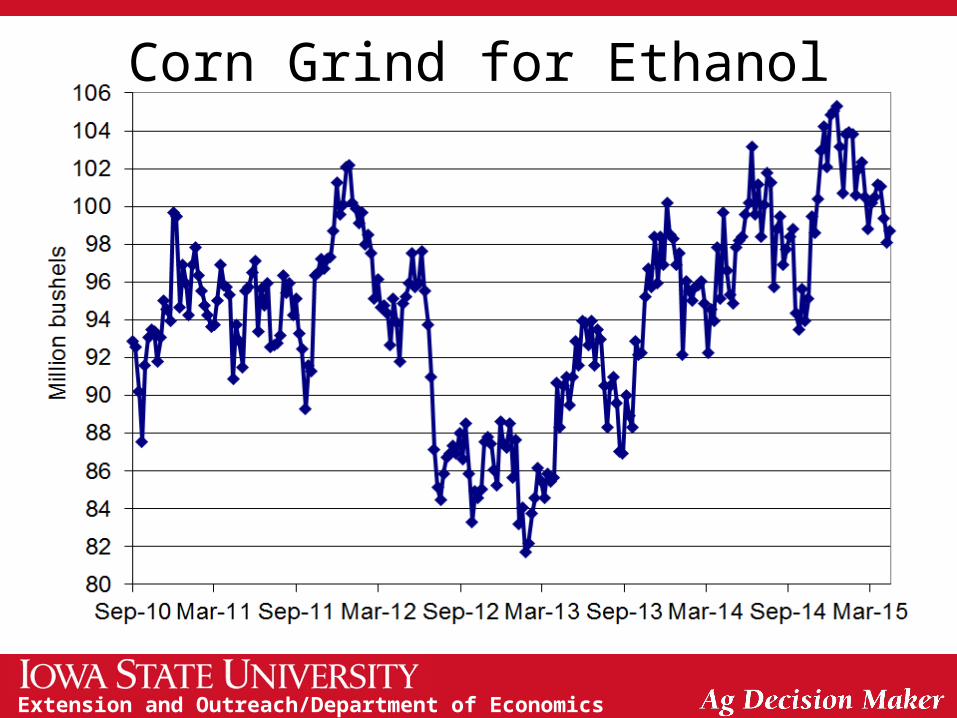
Corn Grind for Ethanol
Extension and Outreach/Department of Economics
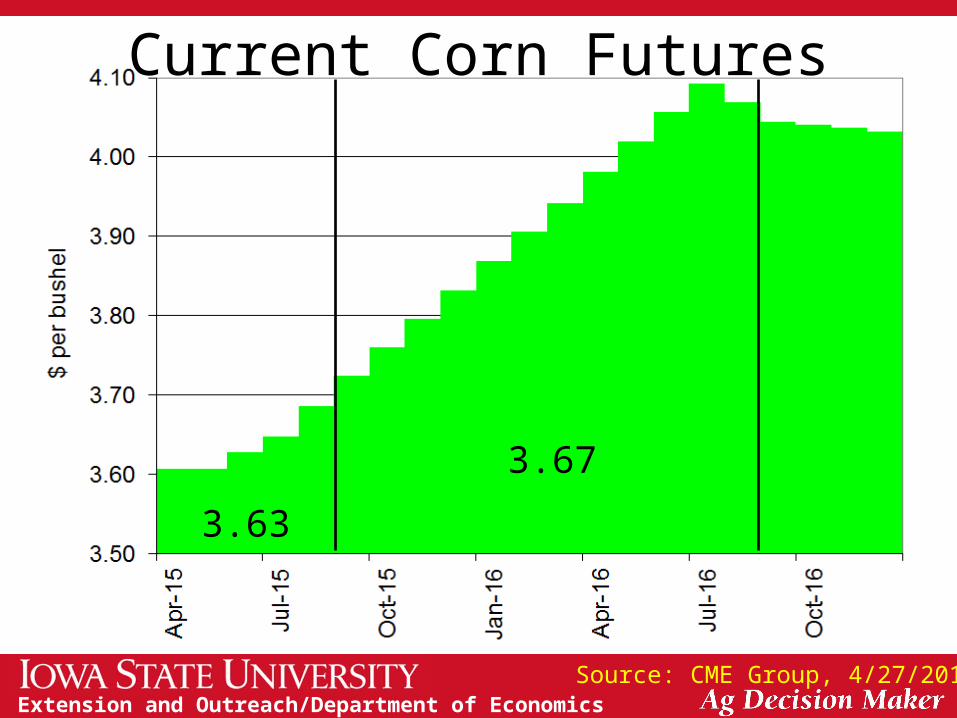
Current Corn Futures
Source: CME Group, 4/27/2015
3.63
3.67
Extension and Outreach/Department of Economics
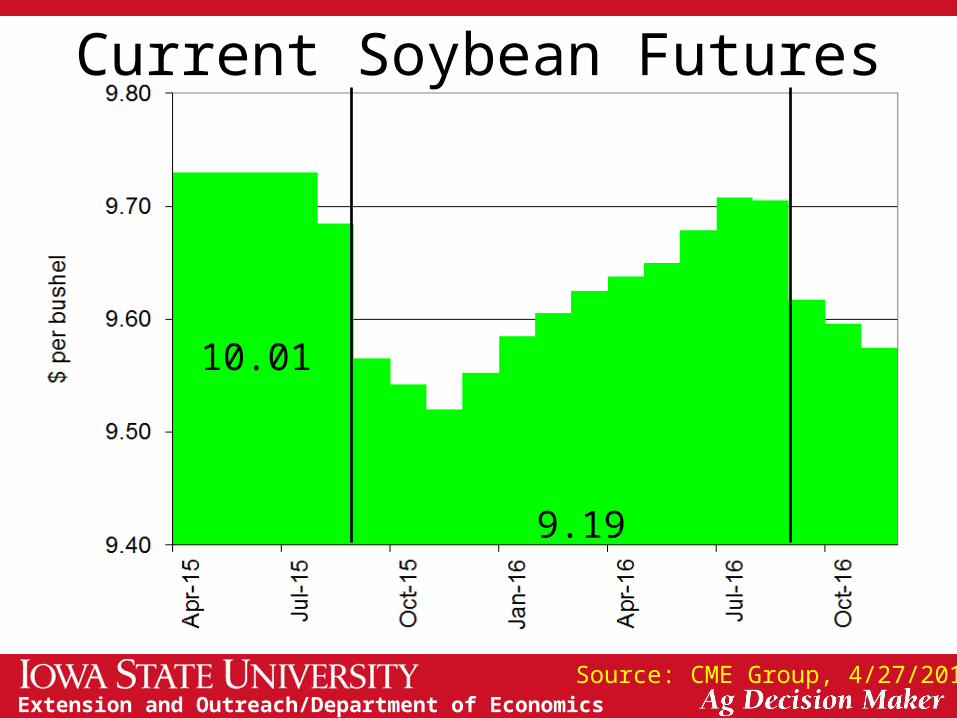
Current Soybean Futures
Source: CME Group, 4/27/2015
10.01
9.19
Extension and Outreach/Department of Economics
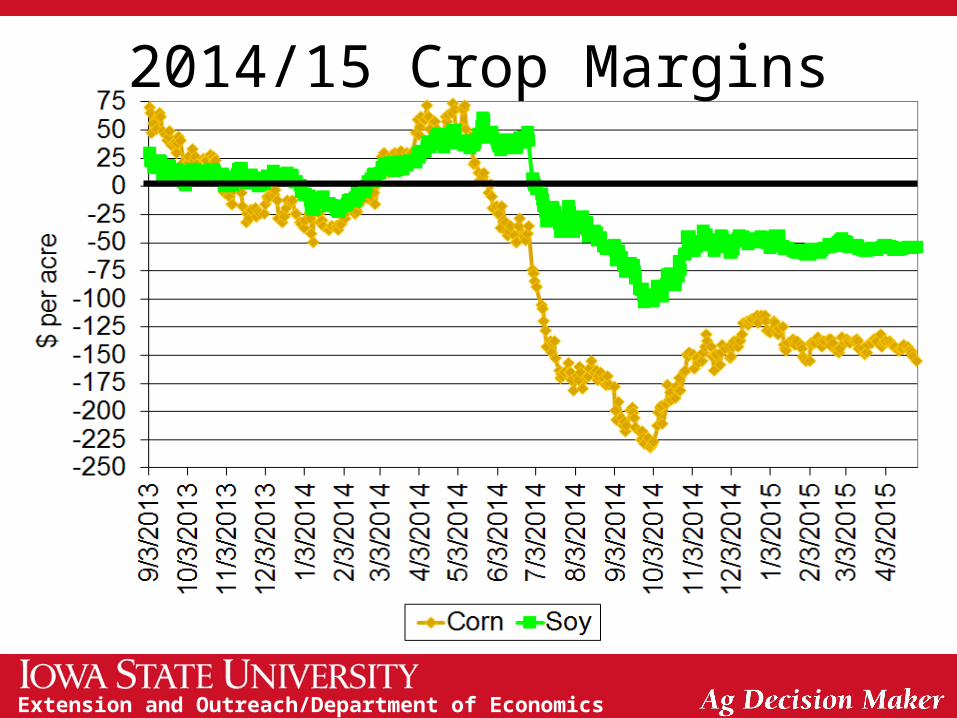
2014/15 Crop Margins
Extension and Outreach/Department of Economics
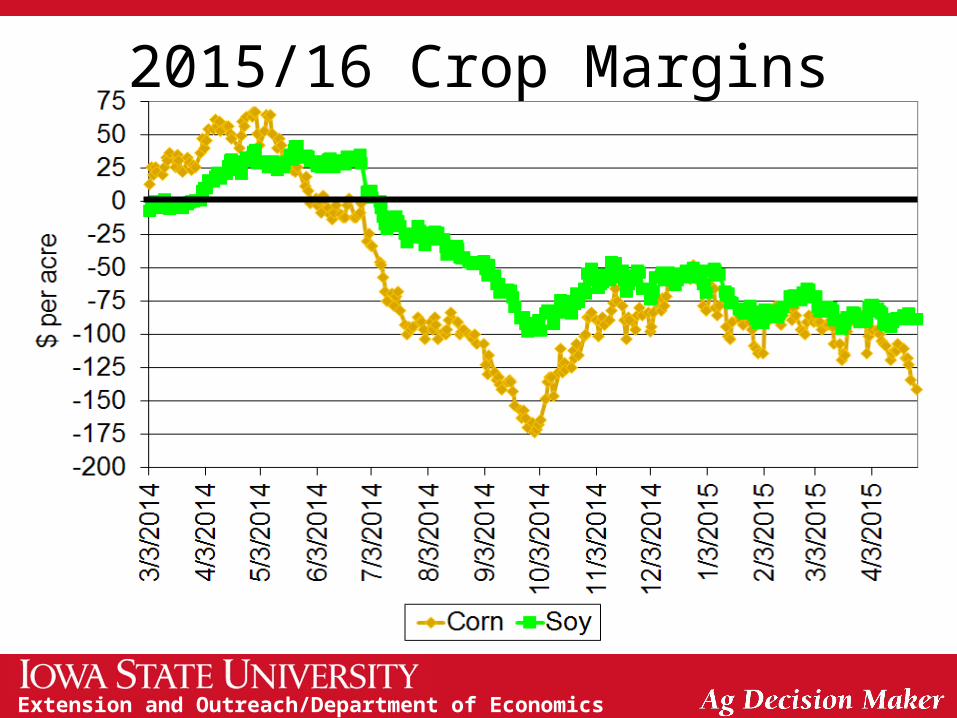
2015/16 Crop Margins
Extension and Outreach/Department of Economics
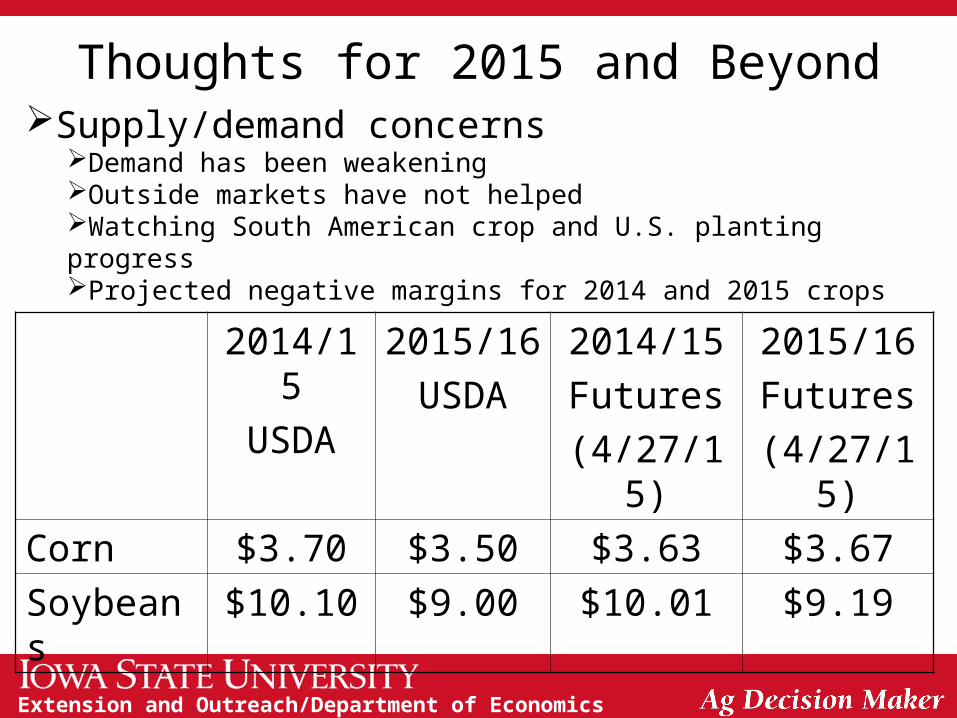
Thoughts for 2015 and BeyondSupply/demand concerns
Demand has been weakeningOutside markets have not helpedWatching South American crop and U.S. planting progressProjected negative margins for 2014 and 2015 crops
2014/15
USDA
2015/16
USDA
2014/15
Futures
(4/27/15)
2015/16
Futures
(4/27/15)
Corn $3.70 $3.50 $3.63 $3.67
Soybeans $10.10 $9.00 $10.01 $9.19
Extension and Outreach/Department of Economics
Thank you for your time!
Any questions?
My web site:http://www.econ.iastate.edu/~chart/
Iowa Farm Outlook:http://www.econ.iastate.edu/ifo/
Ag Decision Maker:http://www.extension.iastate.edu/agdm/