Embed Size (px)
Citation preview
30 Churchill Place ● Canary Wharf ● London E14 5EU ● United Kingdom
An agency of the European Union
Telephone +44 (0)20 3660 6000 Facsimile +44 (0)20 3660 5555 Send a question via our website www.ema.europa.eu/contact
© European Medicines Agency, 2016. Reproduction is authorised provided the source is acknowledged.
28 April 2016 EMA/390543/2016 Committee for Medicinal Products for Human Use (CHMP)
Extension of indication variation assessment report
Invented name: Afinitor
International non-proprietary name: everolimus
Procedure No. EMEA/H/C/001038/II/0048
Marketing authorisation holder (MAH): Novartis Europharm Ltd
Note Variation assessment report as adopted by the CHMP with all information of a commercially confidential nature deleted.
Extension of indication variation assessment report EMA/390543/2016 Page 2/80
Table of contents
1. Background information on the procedure .............................................. 4 1.1. Type II variation .................................................................................................. 4 1.2. Steps taken for the assessment of the product ......................................................... 5
2. Scientific discussion ................................................................................ 6 2.1. Introduction......................................................................................................... 6 2.2. Non-clinical aspects .............................................................................................. 7 2.2.1. Ecotoxicity/environmental risk assessment ........................................................... 7 2.2.2. Discussion on non-clinical aspects...................................................................... 11 2.2.3. Conclusion on the non-clinical aspects ................................................................ 12 2.3. Clinical aspects .................................................................................................. 12 2.3.1. Introduction .................................................................................................... 12 2.3.2. Pharmacokinetics............................................................................................. 12 2.3.3. Pharmacodynamics .......................................................................................... 14 2.3.4. Discussion on clinical pharmacology ................................................................... 15 2.3.5. Conclusions on clinical pharmacology ................................................................. 16 2.4. Clinical efficacy .................................................................................................. 17 2.4.1. Main study ...................................................................................................... 17 2.4.2. Discussion on clinical efficacy ............................................................................ 47 2.4.3. Conclusions on the clinical efficacy ..................................................................... 50 2.5. Clinical safety .................................................................................................... 50 2.5.1. Discussion on clinical safety .............................................................................. 67 2.5.2. Conclusions on clinical safety ............................................................................ 69 2.5.3. PSUR cycle ..................................................................................................... 69 2.6. Risk management plan ........................................................................................ 69 2.7. Update of the Product information ........................................................................ 75 2.7.1. User consultation ............................................................................................. 75
3. Benefit-Risk Balance.............................................................................. 75
4. Recommendations ................................................................................. 80
5. EPAR changes ........................................................................................ 80
Extension of indication variation assessment report EMA/390543/2016 Page 3/80
List of abbreviations ADR adverse drug reaction AE adverse event AKT protein kinase B ALT alanine transaminase AST aspartate transaminase AUC Area under the curve BSC best supportive care CgA chromogranin A CI confidence interval Cmin trough concentration CNAE clinically notable adverse event CP clinical pharmacology CTCAE Common Terminology Criteria for Adverse Events CUP carcinoma of unknown primary CYP3A4 cytochrome P450 3A4 ECG electrocardiogram EMA European Medicines Agency FACT-G Functional Assessment of Cancer Therapy – General FAS full analysis set FDA Food and Drug Administration GEP-NET gastroenteropancreatic neuroendocrine tumour GI gastrointestinal γGT γ-glutamyltransferase increased HR hazard ratio IAC independent adjudicated central assessment ICH International Conference on Harmonisation of Technical Requirements for Registration of
Pharmaceuticals for Human Use IDMC Independent Data Monitoring Committee IFN interferon IGF-1 insulin-like growth factor-1 IRC independent central radiology review MedDRA Medical Dictionary for Regulatory Activities mTOR mammalian target of rapamycin NCI National Cancer Institute NET neuroendocrine tumour NSE neuron-specific enolase ORR objective response rate OS overall survival PD pharmacodynamics PD progressive disease/disease progression PFS progression-free survival PgP P-glycoprotein PI3K phosphoinositide 3-kinase PK pharmacokinetics PRO patient-reported outcomes PRRT peptide receptor radionuclide therapy PS performance status PT preferred term QoL quality of life RCC renal cell carcinoma RECIST Response Evaluation Criteria In Solid Tumours SAE serious adverse event SEER Surveillance, Epidemiology, and End Results SmPC Summary of Product Characteristics SOC system organ class SSA somatostatin analogue TSC tuberous sclerosis complex ULN upper limit of normal WHO World Health Organization

Extension of indication variation assessment report EMA/390543/2016 Page 4/80
1. Background information on the procedure
1.1. Type II variation
Pursuant to Article 16 of Commission Regulation (EC) No 1234/2008, Novartis Europharm Ltd submitted to the European Medicines Agency on 3 August 2015 an application for a variation.
The following variation was requested:
Variation requested Type Annexes affected
C.I.6.a C.I.6.a - Change(s) to therapeutic indication(s) - Addition of a new therapeutic indication or modification of an approved one
Type II I, II, IIIA and IIIB
Extension of Indication to include a new indication for the treatment of unresectable or metastatic, well-differentiated non-functional neuroendocrine tumours of gastrointestinal or lung origin in adults with progressive disease; as a consequence, sections 4.1, 4.4, 4.8 and 5.1 of the SmPC are updated. The Package Leaflet is updated in accordance. Furthermore, the PI is brought in line with the latest QRD template version 9.1.
The requested variation proposed amendments to the Summary of Product Characteristics, Annex II and Package Leaflet and to the Risk Management Plan (RMP).
Information on paediatric requirements
Pursuant to Article 8 of Regulation (EC) No 1901/2006, the application included EMA Decisions on the granting of a product-specific waiver (P/0004/2015 and P/2/2007) and on the granting of a class waiver (CW/1/2011 and CW/0001/2015).
Information relating to orphan market exclusivity
Similarity
Pursuant to Article 8 of Regulation (EC) No. 141/2000 and Article 3 of Commission Regulation (EC) No 847/2000, the applicant did not submit a critical report addressing the possible similarity with authorised orphan medicinal products because there is no authorised orphan medicinal product for a condition related to the proposed indication.
Scientific advice
The applicant received Scientific Advice from the CHMP on 23 February 2006 and 27 July 2006. The Scientific Advice pertained to clinical aspects of the dossier.
Extension of indication variation assessment report EMA/390543/2016 Page 5/80
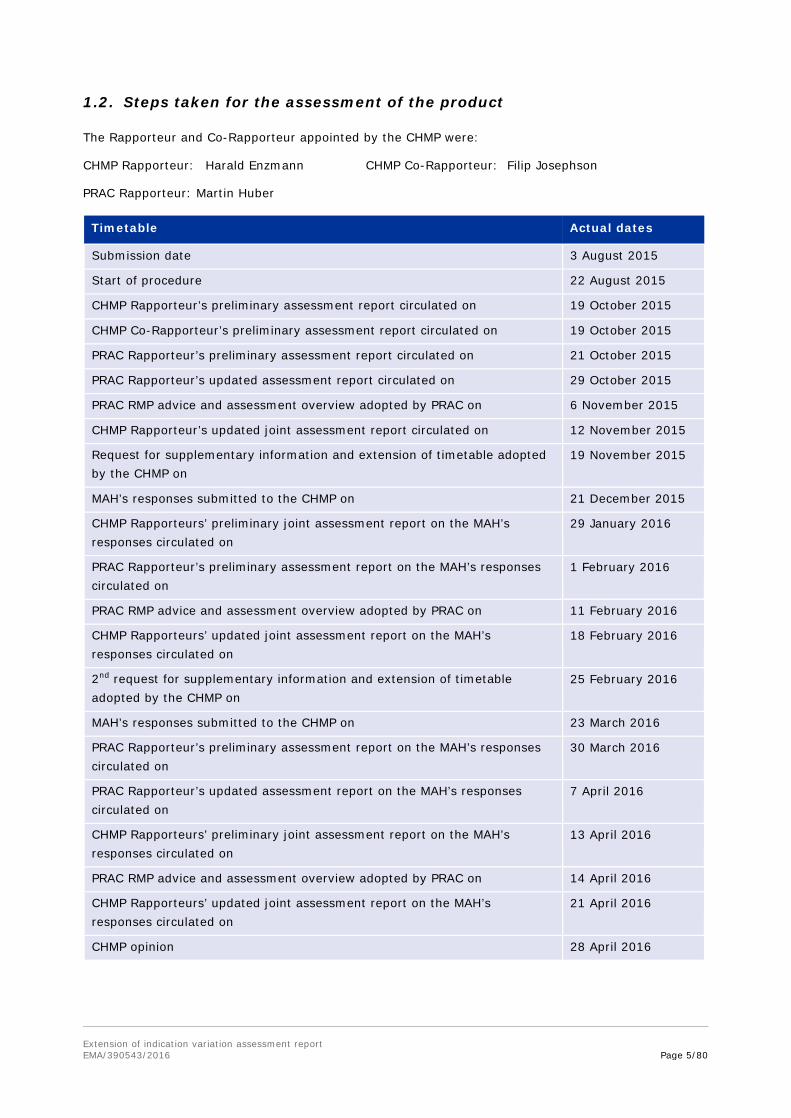
1.2. Steps taken for the assessment of the product
The Rapporteur and Co-Rapporteur appointed by the CHMP were:
CHMP Rapporteur: Harald Enzmann CHMP Co-Rapporteur: Filip Josephson
PRAC Rapporteur: Martin Huber
Timetable Actual dates
Submission date 3 August 2015
Start of procedure 22 August 2015
CHMP Rapporteur’s preliminary assessment report circulated on 19 October 2015
CHMP Co-Rapporteur’s preliminary assessment report circulated on 19 October 2015
PRAC Rapporteur’s preliminary assessment report circulated on 21 October 2015
PRAC Rapporteur’s updated assessment report circulated on 29 October 2015
PRAC RMP advice and assessment overview adopted by PRAC on 6 November 2015
CHMP Rapporteur’s updated joint assessment report circulated on 12 November 2015
Request for supplementary information and extension of timetable adopted by the CHMP on
19 November 2015
MAH’s responses submitted to the CHMP on 21 December 2015
CHMP Rapporteurs’ preliminary joint assessment report on the MAH’s responses circulated on
29 January 2016
PRAC Rapporteur’s preliminary assessment report on the MAH’s responses circulated on
1 February 2016
PRAC RMP advice and assessment overview adopted by PRAC on 11 February 2016
CHMP Rapporteurs’ updated joint assessment report on the MAH’s responses circulated on
18 February 2016
2nd request for supplementary information and extension of timetable adopted by the CHMP on
25 February 2016
MAH’s responses submitted to the CHMP on 23 March 2016
PRAC Rapporteur’s preliminary assessment report on the MAH’s responses circulated on
30 March 2016
PRAC Rapporteur’s updated assessment report on the MAH’s responses circulated on
7 April 2016
CHMP Rapporteurs’ preliminary joint assessment report on the MAH’s responses circulated on
13 April 2016
PRAC RMP advice and assessment overview adopted by PRAC on 14 April 2016
CHMP Rapporteurs’ updated joint assessment report on the MAH’s responses circulated on
21 April 2016
CHMP opinion 28 April 2016
Extension of indication variation assessment report EMA/390543/2016 Page 6/80
2. Scientific discussion
2.1. Introduction
Neuroendocrine tumours (NETs) comprise a group of neoplasms derived from peptide- and amine-producing cells of the neuroendocrine system. They are characterised histologically by the intracellular presence of markers of endocrine tissue, such as chromogranin A (CgA), synaptophysin, and neuron-specific enolase. NETs may be classified according to their embryological origin, as arising from the foregut (e.g., bronchial or gastric NET), midgut (e.g., small intestine or appendiceal NET), or hindgut (e.g., colon or rectal NET). NETs are broadly subcategorised into functional when they present with clinical symptoms due to hypersecretion of hormones or bioactive amines or nonfunctional when these symptoms are absent.
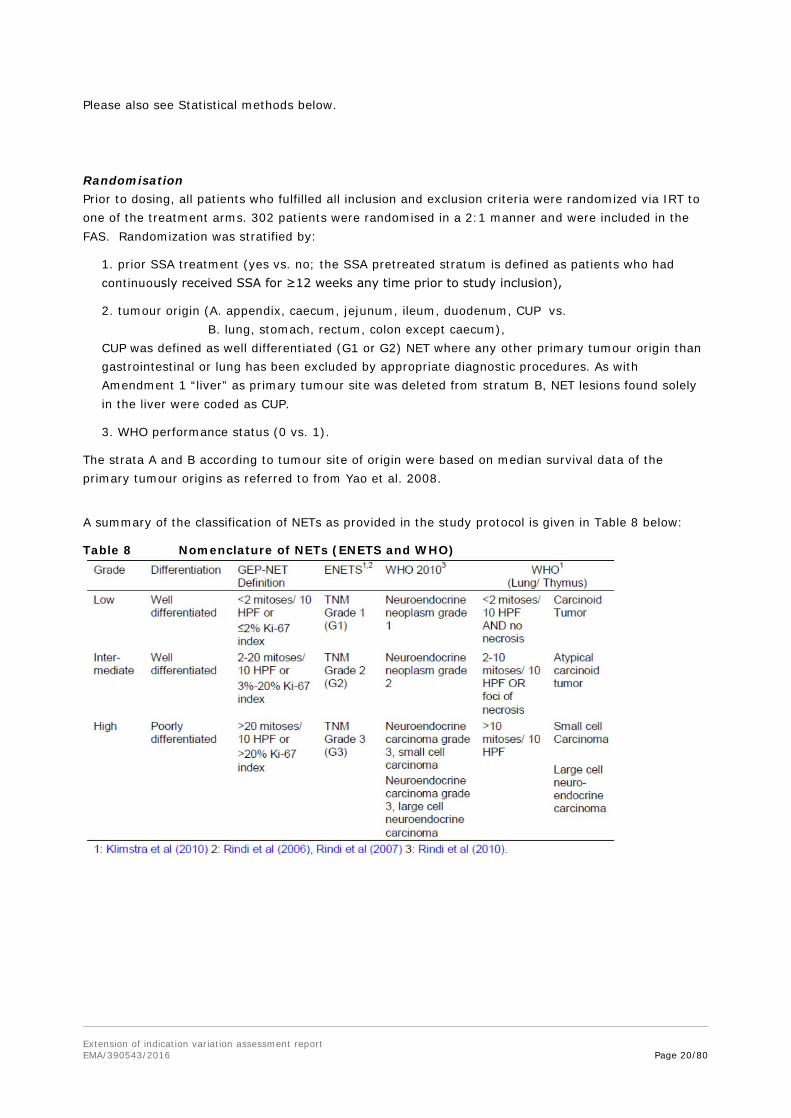
The WHO staging system classifies gastroenteropancreatic NET (GEP-NET) based on primary tumour localization, size, mitotic activity, invasiveness, and functional status (Klöppel et al 2004). In addition, the European Neuroendocrine Tumor Society (ENETS) has established a TNM staging system (Klöppel et al 2009). Tumour grading is based on the determination of mitotic activity of the tumour measured by Ki-67 staining or by counting mitotic figures. Low grade (G1) tumours show Ki-67 in ≤2%, intermediate grade tumours (G2) >3-20% and high grade tumours (G3) in >20% of tumour cells. Low and intermediate grade NETs are also referred to as well-differentiated NETs, and high grade tumours are referred to as poorly differentiated NETs. For tumours of thoracic (lung/thymus) origin, the WHO tumour grading relies on the mitotic rate or the presence and extent of necrosis. Prognosis is dependent primarily on stage, histologic differentiation, grading and origin.
The main primary sites of origin for NETs are the gastrointestinal tract (62% to 67%) and the lung (22% to 27%). Around 40-50% of NETs are functional tumours, which are typically diagnosed due to the presence of specific symptoms. Nonfunctional tumours typically present with symptoms of advanced tumour growth (Modlin et al 2011). Overall, 40% to 60% of patients with NET are asymptomatic at presentation. As NETs are difficult to diagnose, approximately 40% of patients have advanced disease at initial presentation (Yao et al 2008), with up to 75% with liver metastases at the time of diagnosis. Common signs and symptoms include, but are not limited to, abdominal pain, intestinal obstruction, abdominal mass, GI bleeding, rectal bleeding, melena, constipation, diarrhoea, and flushing. The variety and intensity of NET symptoms increase with tumour progression.
Management of NETs is generally guided by the primary site, extent of disease (stage), proliferative index (grade), and degree of differentiation. High-grade or poorly-differentiated NETs have an aggressive course, and their management parallels that of small-cell lung cancer. Well- to moderately-differentiated NETs are considered to be more indolent but are resistant to most cytotoxic agents. At present, surgery is the only curative treatment for NETs. For advanced NETs, therapeutic options focus on controlling the hormonal syndrome and inhibiting tumour growth. The somatostatin analogues (octreotide and lanreotide), sunitinib and everolimus have been approved in the EU for the treatment of neuroendocrine tumours with different sites of primary origin, grades and stages. Other treatments include angiogenesis inhibitors, chemotherapy, and radiotherapy, interferon (IFN), surgical resection and embolisation of hepatic metastases. Peptide receptor radiotherapy (radiolabeled therapy) represents an additional option available in a limited number of medical centres.
Everolimus, a derivative of rapamycin, acts as a signal transduction inhibitor, selectively inhibiting the mammalian target of rapamycin (mTOR), a key serine-threonine kinase regulating protein synthesis and ultimately cell growth, cell proliferation, angiogenesis, and survival. mTOR is a component in the PI3K/AKT /mTOR pathway known to be deregulated in numerous human cancers. A role for everolimus

Extension of indication variation assessment report EMA/390543/2016 Page 7/80
in the treatment of NETs has been suggested by the regulatory role of mTOR in cell growth, metabolism and protein translation, coupled with the observation that the PI3K/mTOR pathway is activated by insulin-like growth factor-1 (IGF-1) in NETs. IGF-1 activates the PI3K/mTOR pathway in pancreatic and other neuroendocrine tumour cells, is a known autocrine regulator of cell growth in NET, and stimulates chromogranin A (CgA) secretion.
The MAH applied for an Extension of Indication to include a new indication for Afinitor, as follows:
Afinitor is indicated for the treatment of unresectable or metastatic, well-differentiated non-functional neuroendocrine tumours of gastrointestinal or lung origin in adults with progressive disease.
The approved indication is
Afinitor is indicated for the treatment of unresectable or metastatic, well-differentiated (Grade 1 or Grade 2) non-functional neuroendocrine tumours of gastrointestinal or lung origin in adults with progressive disease (see sections 4.4 and 5.1).
2.2. Non-clinical aspects
No new non-clinical data have been submitted in this application, which was considered acceptable by the CHMP.
2.2.1. Ecotoxicity/environmental risk assessment
The applicant submitted an environmental risk assessment on the active ingredient everolimus dated July 2015. The ERA included a Phase I and a Phase II assessment according to the Guideline EMEA/CHMP/SWP/4447/00 corr 2.
Assessment of persistence, bioaccumulation potential and toxicity for Everolimus
The applicant provided a value of the n-octanol/water partition coefficient for Everolimus based on a study report according to the OECD guideline for testing of chemicals 117. No screening for persistence, bioaccumulation and toxicity was deemed necessary since the value of LogKow is 4.0 and therefore below 4.5.
The CHMP agreed that there is no need for a PBT assessment.
Phase I Assessment
The applicant provided an initial calculation of PECsurface water according to the Guideline EMEA/CHMP/SWP/4447/00 corr 2 using a daily dose of 20mg everolimus and representing the worst case scenario. The calculation resulted in a value of 0.1µg/L. Therefore a phase II environmental risk fate and effect analysis had to be performed.
The worst case approach of the applicant is appreciated. Since the resulting PECsw is above the trigger value of 0.01µg/L a Phase II environmental fate and effect assessment has to be provided. Phase II Assessment Tier A A refined PECsw has been calculated and resulting in a value of 0.17ng/L. According to the guideline, the PECgroundwater was also calculated resulting in a value of 0.0425ng/L for everolimus.

Extension of indication variation assessment report EMA/390543/2016 Page 8/80
The refinement of the PECsurface water estimated by the applicant is acceptable. The value of 0.17ng/L for the refined PECsw can be used for risk assessment. The PECgroundwater calculated by the applicant can also be used for further risk assessment. Physico-chemical properties and fate The applicant provided information on the n-octanol/water partition coefficient, adorption/desorption properties as well as data on ready biodegradability and aerobic and anaerobic transformation in aquatic sediment systems. The information can be summarized as follows:
Table 1: Data on physico- chemical properties and fate
Data Result References
n-octanol/water partition coefficient /OECD 117
Log KOW: 4.0 RAD 001 NOTOX Project 255667
Adsorption-Desorption/ OECD 106 (sewage sludge)
Koc (sludge) = 1’654 – 3’294 mL/g Kd (sludge) = 470 – 1’029 mL/g Koc (soils) = 50’197 – > 2’348'392 mL/g Kd (soils) = 432 – > 36’635 mL/g
[14C] Everolimus BHT/DS 01: Adsorption/Desorption on three soils and two sludges Harlan Laboratories Study C65480): C 65480
Ready Biodegradability Test/ OECD 301F
Not readily biodegradable 2% (28d)
Ready Biodegradability of RAD N BHT (Manometric Respirometry Test), Study number G 550 06
Aerobic and Anaerobic Transformation in Aquatic Sediment systems/ OECD 308
River and pond system, 20oC: DT50 water: 0.29 resp. 0.35 d DT50 whole system: 3.1 resp. 2.0 d DT50 sediment: 26.9 resp. 24.4 d Mineralisation: 24.1 resp. 29.0 % (103 d) Bound residues: 22.1 resp. 23.0 % (103 d) Sediment shifting: yes: 25.6 resp. 17.7 % (Day 14) Metabolite: M4 max. 28.6 %, not identified, but DT50 calculated: DT50 whole system: 2.5 resp. 5.1 d
Harlan Laboratories Study : C67572
The submitted studies on physico- chemical properties as well as on fate are acceptable for environmental risk assessment.
Effect Data
The Phase II Tier A effect data provided by the applicant are summarized in table 2.

Extension of indication variation assessment report EMA/390543/2016 Page 9/80
Table 2: Effect data Phase II Tier A
Data Result References
Algae Growth Inhibition Test (OECD 201)
NOEC = 1.5 μg /L
Harlan Laboratories Study D53915
Daphnia Reproduction Test (OECD 211)
21d-NOEC = 0.014 μg/L
Harlan Laboratories Study C65478
Fish Early Life Stage Toxicity Test (OECD 210)
30d-NOEC = 2.1 μg/L Harlan Laboratories Study C65467
Activated Sludge Respiration Inhibition Test (OECD 209)
3h-NOEC > 1000 mg/L
Ecotox Test No. G 550 05
The submitted effect studies are considered acceptable for environmental risk assessment.
Risk characterization Phase II Tier A
Resulting from the study on the n-octanol/water partition coefficient (OECD 117) a study on bioaccumulation potential has to be conducted in Phase II Tier B since the Log Kow exceeds 3.0.
According to the results of the study on Adsorption/ Desorption (OECD 106) no assessment of the terrestrial compartment is deemed necessary because the Koc value is below the action limit of 10 000 L/kg.
The study on transformation of everolimus in water-sediment systems according to guideline
OECD 308 revealed significant partitioning of everolimus into sediments and, consequently, a risk assessment for the sediment compartment has to be conducted in Phase II-Tier B.
Everolimus is considered to constitute no significant risk to microorganism’s and therefore to sewage treatment plants.
Everolimus shows high chronic toxicity on growth of Daphnia magna being the most sensitive endpoint investigated. However, no risk could be identified for surfacewater as well as for groundwater (see table 3).
Table 3 Risk quotients for Daphnia magna in surfacewater and groundwater
PEC NOEC in µg/L AF PNEC
[µg/L] PEC/PNEC Conclusion
Surfacewater
0.00017 µg/L
Daphnia 0.014
10 0.0014 0.00017/0.0014= 0.12
no risk
Groundwater
0.0000425 µg/L
Daphnia 0.014
10 0.0014 0.000043/0.0014 <<1
no risk
The CHMP considered the results of the Phase II Tier A assessment acceptable.
Phase II Assessment Tier B The results of the effect studies provided by the applicant are summarized in table 4:

Extension of indication variation assessment report EMA/390543/2016 Page 10/80
Table 4: Effect data on Tier B
Data Result References
Sediment dwelling organism OECD 218/ 28d/ Chironomus riparius
28d-NOEC = 2.5 mg /L
Harlan Laboratories Study D45714
Bioaccumulation study/OECD 305 BCFss = 23 (plateau level 10-14 days) BCFk = 28 (fitted BCFss)
Harlan Laboratories Study D58696
The applicant calculated a PECsediment based on an average of the provided Koc values in sludge and soil resulting in a PECsediment of 3.98 µg/kg.
The submitted Tier B effect studies are considered acceptable for environmental risk assessment.
The assessor calculates the PECsediment based on the highest Kd soil resulting in a slightly higher PECsediment of 5.13 µg/kg.
Risk characterization Phase II Tier B
In order to conduct the risk characterization for sediment organisms the applicant calculated a PNECsediment based on the NOEC for the development of the sediment-dwelling larvae of
Chironomus riparius, normalized to standard sediment with 10% organic carbon content and including an assessment factor of 100, resulting in a value of 112.1 μg/kg. The risk ratio for sediment was calculated by the applicant as: PEC/PNECsediment = 3.98 μg/kg / 112.1 μg/kg = 0.0355
It was concluded that the result indicates that everolimus does not constitute any significant risk to sediment compartments. The BCF was considered to be significantly below 500 and everolimus has therefore only a low potential for bioconcentration. Everolimus can therefore not be considered a PBT substance and therefore no further risk assessment needs to be performed (no “secondary poisoning”).
The approach of the applicant regarding calculation of the PNECsediment by normalization to standard sediment is not considered acceptable. Using the PNECsediment without normalization of organic carbon to a content of 10%, this results in a PEC/PNECsediment as follows: PEC/PNECsediment = 5.13 μg/kg / 25 μg/kg = 0.21 Both risk ratios calculated by above as well as by the applicant are below 1. Therefore it can be concluded that everolimus does not constitute any significant risk to sediment compartments. Therefore, the conclusion of the applicant that everolimus has only a low potential for bioconcentration is acceptable. There is no further request for assessment. Summary of main study results
Substance (INN/Invented Name): Everolimus CAS-number (if available): 159351-69-6 PBT screening Result Conclusion Bioaccumulation potential- log Kow
OECD117 4.0 Potential PBT N
Phase I

Extension of indication variation assessment report EMA/390543/2016 Page 11/80
Calculation Value Unit Conclusion PEC surfacewater , default 0.1 µg/L > 0.01 threshold
Y PEC surfacewater , refined (e.g. prevalence, literature)
0.00017 µg/L acceptable for risk assessment Phase II
Phase II Physical-chemical properties and fate Study type Test protocol Results Remarks Adsorption-Desorption OECD 106 Koc sludge :
1654-3294L/kg Kd sludge: 470 – 1029 L/kg Koc soil: 50197->2348392 L/kg Kd (soils): 432 – > 36635 L/kg
Ready Biodegradability Test OECD 301 2% in 28d Not biodegradable
Aerobic and Anaerobic Transformation in Aquatic Sediment systems
OECD 308 DT50, water =0.29 resp. 0.35 d DT50, sediment =26.9 resp. 24.4 d DT50, whole system =3.1 resp. 2.0d % shifting to sediment = Yes: 25.6 resp.17.7% (14d) Metabolite: M4 max. 28.6 %, not identified, but DT50 calculated: DT50 whole system: 2.5 resp. 5.1 d
Phase IIa Effect studies Study type Test protocol Endpoint value Unit Remarks
Algae, Growth Inhibition (Pseudokirchneriella subcapitata)
OECD 201 NOEC 1.5 µg/L
Daphnia sp. Reproduction (Daphnia magna)
OECD 211 NOEC 0.014 µg/L
Fish, Early Life Stage Toxicity (Brachydanio rerio)
OECD 210 NOEC 2.1 µg/L
Activated Sludge, Respiration Inhibition Test
OECD 209 EC50 >1000 mg/L
Phase IIb Studies Bioaccumulation
OECD 305 BCF 25-28
L/kg 5 % lipid
Sediment dwelling organism (Chironomus riparius)
OECD 218 NOEC 2.5 mg/kg
2.2.2. Discussion on non-clinical aspects
The environmental risk assessment of the active substance everolimus can be finalized based on the data provided. Everolimus is thus considered to constitute no significant risk to surface waters, sewage treatment plants, groundwater and sediments.

Extension of indication variation assessment report EMA/390543/2016 Page 12/80
2.2.3. Conclusion on the non-clinical aspects
The updated ERA data submitted in this application do not lead to a significant increase in environmental exposure further to the use of everolimus.
Considering the above data, everolimus is not expected to pose a risk to the environment and it is not considered to be a PBT substance.
2.3. Clinical aspects
2.3.1. Introduction
GCP
The Clinical trials were performed in accordance with GCP as claimed by the applicant
The applicant has provided a statement to the effect that clinical trials conducted outside the community were carried out in accordance with the ethical standards of Directive 2001/20/EC.
• Tabular overview of clinical studies
Table 5 Tabular overview of clinical studies
Study no. Design Population Patients and treatments
Treatment duration
Endpoints
T2302 97 centres 25 countries
Multicenter, double-blind, randomized (2:1), parallel-group, Phase III Efficacy and safety
Patients with histologically-confirmed advanced (nonresectable or metastatic) low or intermediate grade non-functional NET of GI or lung origin (with measurable disease at baseline whose disease had progressed within the 6 months prior to randomization)
Total: 302 Everolimus 10 mg/day plus BSC (n=205) Placebo plus BSC (n=97)
Until disease progression, unacceptable toxicity or death, or withdrawal of consent
Primary: PFS Key secondary: OS Other secondary: safety and tolerability, ORR/DCR, QoL, biomarkers, WHO PS score
BSC Best supportive care; DCR Disease control rate; GI Gastrointestinal; NET Neuroendocrine tumour; ORR Objective response rate; OS Overall survival; PFS Progression-free survival; QoL Quality of life; WHO PS World Health Organization performance status
2.3.2. Pharmacokinetics
ADME
In Study T2302 steady state trough concentrations (Cmin) of everolimus were measured.
Methods:
A pre-dose PK blood sample was collected in all patients by direct venipuncture prior to dosing at Visit 3, Cycle 2 (Day 29).
Only valid pre-dose blood samples were included in the analysis (confirmed blood samples collected at steady-state, collected immediately prior to dosing on the same study day, and collected at approximately 24 ± 4 hours after the previous dose and with no vomiting within the first 4 hours following the last dose).
Results:
Extension of indication variation assessment report EMA/390543/2016 Page 13/80
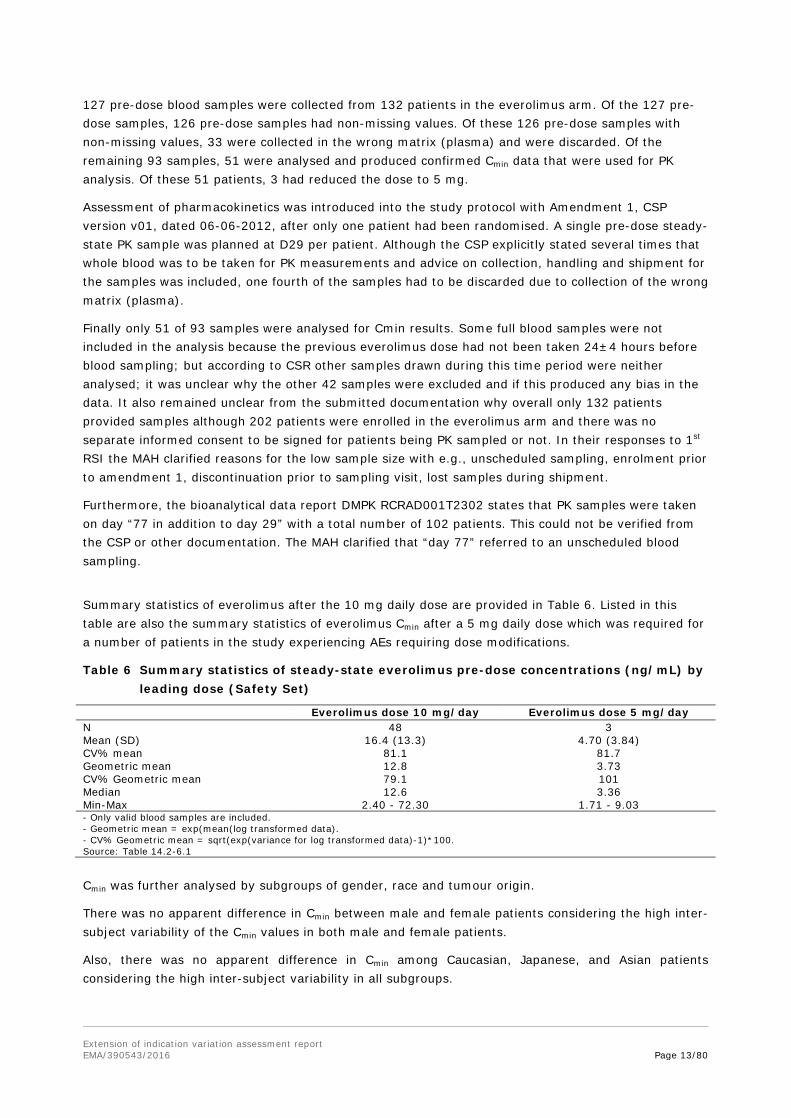
127 pre-dose blood samples were collected from 132 patients in the everolimus arm. Of the 127 pre-dose samples, 126 pre-dose samples had non-missing values. Of these 126 pre-dose samples with non-missing values, 33 were collected in the wrong matrix (plasma) and were discarded. Of the remaining 93 samples, 51 were analysed and produced confirmed Cmin data that were used for PK analysis. Of these 51 patients, 3 had reduced the dose to 5 mg.
Assessment of pharmacokinetics was introduced into the study protocol with Amendment 1, CSP version v01, dated 06-06-2012, after only one patient had been randomised. A single pre-dose steady-state PK sample was planned at D29 per patient. Although the CSP explicitly stated several times that whole blood was to be taken for PK measurements and advice on collection, handling and shipment for the samples was included, one fourth of the samples had to be discarded due to collection of the wrong matrix (plasma).
Finally only 51 of 93 samples were analysed for Cmin results. Some full blood samples were not included in the analysis because the previous everolimus dose had not been taken 24±4 hours before blood sampling; but according to CSR other samples drawn during this time period were neither analysed; it was unclear why the other 42 samples were excluded and if this produced any bias in the data. It also remained unclear from the submitted documentation why overall only 132 patients provided samples although 202 patients were enrolled in the everolimus arm and there was no separate informed consent to be signed for patients being PK sampled or not. In their responses to 1st RSI the MAH clarified reasons for the low sample size with e.g., unscheduled sampling, enrolment prior to amendment 1, discontinuation prior to sampling visit, lost samples during shipment.
Furthermore, the bioanalytical data report DMPK RCRAD001T2302 states that PK samples were taken on day “77 in addition to day 29” with a total number of 102 patients. This could not be verified from the CSP or other documentation. The MAH clarified that “day 77” referred to an unscheduled blood sampling.
Summary statistics of everolimus after the 10 mg daily dose are provided in Table 6. Listed in this table are also the summary statistics of everolimus Cmin after a 5 mg daily dose which was required for a number of patients in the study experiencing AEs requiring dose modifications.
Table 6 Summary statistics of steady-state everolimus pre-dose concentrations (ng/mL) by leading dose (Safety Set)
Everolimus dose 10 mg/day Everolimus dose 5 mg/day N 48 3 Mean (SD) 16.4 (13.3) 4.70 (3.84) CV% mean 81.1 81.7 Geometric mean 12.8 3.73 CV% Geometric mean 79.1 101 Median 12.6 3.36 Min-Max 2.40 - 72.30 1.71 - 9.03 - Only valid blood samples are included. - Geometric mean = exp(mean(log transformed data). - CV% Geometric mean = sqrt(exp(variance for log transformed data)-1)*100. Source: Table 14.2-6.1
Cmin was further analysed by subgroups of gender, race and tumour origin.
There was no apparent difference in Cmin between male and female patients considering the high inter-subject variability of the Cmin values in both male and female patients.
Also, there was no apparent difference in Cmin among Caucasian, Japanese, and Asian patients considering the high inter-subject variability in all subgroups.

Extension of indication variation assessment report EMA/390543/2016 Page 14/80
Pre-planned subgroup analyses demonstrated a consistent positive treatment effect across major demographic and prognostic subgroups, although numerical differences were evident for some subgroups, including ileum as the primary site of tumour origin (see efficacy assessment below). Considering the high inter-subject variability of the mean everolimus Cmin values in both subgroups no obvious difference after the 10 mg daily dose was measured.
Steady state pre-dose concentrations obtained from sparse sampling from 48 GI and lung NET-patients receiving 10 mg everolimus and 3 patients receiving the reduced dose of 5 mg daily in the pivotal study were generally consistent with previous data in patients with solid tumours (phase I), renal cell carcinoma, pNET and breast cancer. Geometric mean Cmin after 10 mg was 12.8 ng/ml with a variation coefficient of 79.1%, and for the 5 mg dose 3.73 ng/ml with CV 101%.
Inter-subject variability for Cmin was generally high with CV up to 90% for reasonable group sizes.
Special populations No new information on PK in special populations was generated in support of this application.
Pharmacokinetic interaction studies
No drug-drug interaction study was performed.
From study T2302, no difference was evidenced between everolimus Cmin values under co-administration of CYP3A4 and/or PgP substrates (mean ± SD = 23.2 ± 20.1 ng/mL [n=10]) and the everolimus Cmin observed in all patients with valid Cmin values (mean ± SD = 16.4 ± 13.3 ng/mL [n=48]) after the 10 mg daily dose.
2.3.3. Pharmacodynamics
Exposure-response relationship
The relationship between everolimus exposure and PFS was investigated by fitting a Cox regression model for patients with confirmed everolimus Cmin data. The model included prior SSA treatment, tumour origin and baseline WHO performance status as strata and time-normalized everolimus Cmin as a covariate. Results of the Cox model suggested a trend of longer PFS with a two-fold increase in everolimus Cmin value (HR = 0.898 [95% CI: 0.586, 1.374]. As the result was not statistically significant no definitive conclusion can be drawn. The results are not interpretable due to small event/patient numbers in the higher Cmin category and the fact that stratification factors were not taken into consideration in the analysis.
Among the 49 patients with confirmed everolimus Cmin data, there was no statistically significant relationship between percent change in sum of longest diameter of all target lesions and time-normalized everolimus Cmin. However, a marginal generalized linear mixed model analysis showed that everolimus Cmin was related to the probability of tumour size reduction (parameter estimate for ln-Cmin=0.663; p=0.0005) with an odds ratio of 1.58 [95% CI: 1.23, 2.04] for a two-fold increase in Cmin.
The relationships between change from baseline in the biomarkers (CgA and NSE) and time-normalized Cmin were not statistically significant.
No statistically relevant results for an exposure-response relationship were observed in this patient population.
Extension of indication variation assessment report EMA/390543/2016 Page 15/80
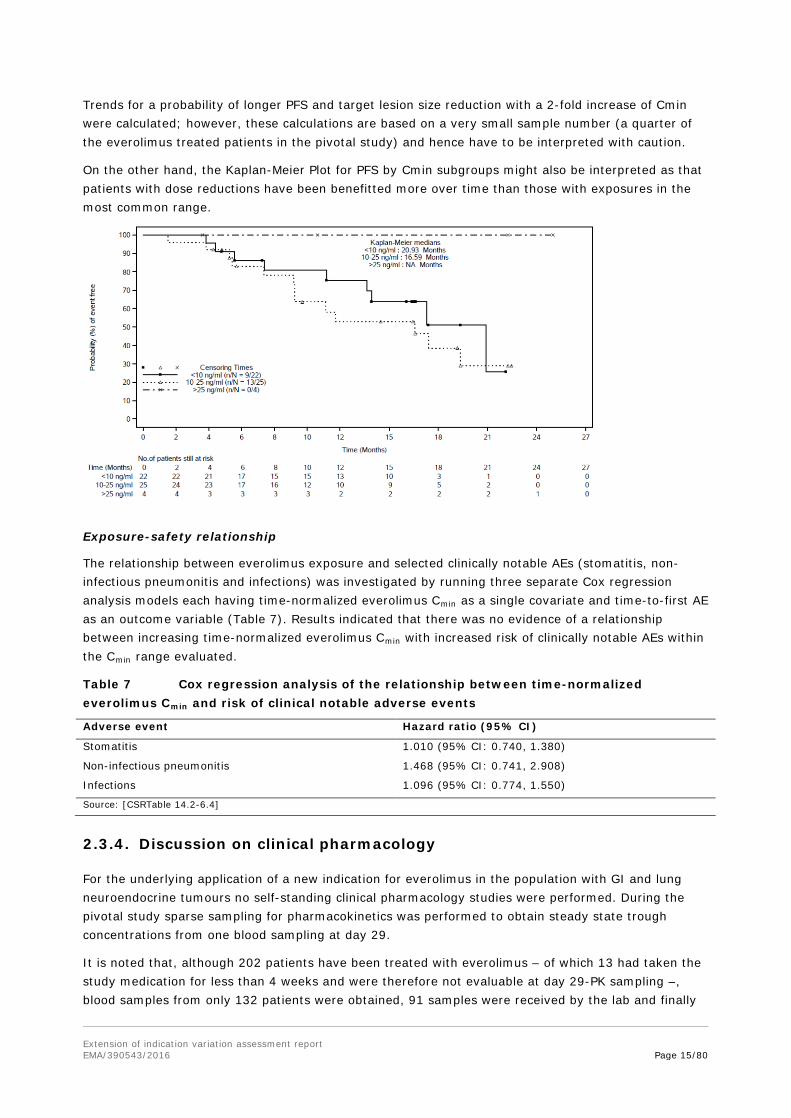
Trends for a probability of longer PFS and target lesion size reduction with a 2-fold increase of Cmin were calculated; however, these calculations are based on a very small sample number (a quarter of the everolimus treated patients in the pivotal study) and hence have to be interpreted with caution.
On the other hand, the Kaplan-Meier Plot for PFS by Cmin subgroups might also be interpreted as that patients with dose reductions have been benefitted more over time than those with exposures in the most common range.
Exposure-safety relationship
The relationship between everolimus exposure and selected clinically notable AEs (stomatitis, non-infectious pneumonitis and infections) was investigated by running three separate Cox regression analysis models each having time-normalized everolimus Cmin as a single covariate and time-to-first AE as an outcome variable (Table 7). Results indicated that there was no evidence of a relationship between increasing time-normalized everolimus Cmin with increased risk of clinically notable AEs within the Cmin range evaluated.
Table 7 Cox regression analysis of the relationship between time-normalized everolimus Cmin and risk of clinical notable adverse events
Adverse event Hazard ratio (95% CI)
Stomatitis 1.010 (95% CI: 0.740, 1.380)
Non-infectious pneumonitis 1.468 (95% CI: 0.741, 2.908)
Infections 1.096 (95% CI: 0.774, 1.550)
Source: [CSRTable 14.2-6.4]
2.3.4. Discussion on clinical pharmacology
For the underlying application of a new indication for everolimus in the population with GI and lung neuroendocrine tumours no self-standing clinical pharmacology studies were performed. During the pivotal study sparse sampling for pharmacokinetics was performed to obtain steady state trough concentrations from one blood sampling at day 29.
It is noted that, although 202 patients have been treated with everolimus – of which 13 had taken the study medication for less than 4 weeks and were therefore not evaluable at day 29-PK sampling –, blood samples from only 132 patients were obtained, 91 samples were received by the lab and finally

Extension of indication variation assessment report EMA/390543/2016 Page 16/80
only 51 patients were (considered) evaluable for Cmin calculation. This questions the quality of study training for the site personnel by the sponsor, the communication strategy between PK lab and sponsor and the selection of evaluable blood samples.
From the (few) samples finally analysed for Cmin it is concluded that mean pre-dose trough concentrations of both 10 mg and 5 mg everolimus obtained at steady state on D29 were in the same range as previously measured in other cancer entities. In general, everolimus Cmin showed a broad inter-subject variability (approx. 81%), which also confirmed earlier observations. Subgroup analyses according to gender, ethnicity and CYP3A and/or PgP inhibitor intake did not reveal differences between groups, under consideration of the partially very small groups (1-3 patients) and the high variability (about 90% CV in reasonably large subgroups). However, trough concentrations of only about two third of the respective other group was measured when comparing samples of stratum A with stratum B and tumour origin ileum with other tumour origins.
The MAH stated that no apparent differences in mean trough concentrations were observed between genders, ethnicities or tumour origins, considering the high variability. This was not fully agreed with. As evident from the MAH’s responses to 1st RSI, the geo-mean Cmin levels for the ileum subgroup are only slightly lower than those seen in the pancreatic NET study C2324. The comparison of everolimus trough levels between different tumour entities as obtained from phase III studies shows that the geometric mean Cmin in the studied populations varied between 11.1-16.5ng/ml with moderate to high variation coefficients of 53.6-109.5%. The Cmin of the total GI/lung NET population in study T2302 of 12.8ng/ml is fully in this range. Also the variability of 79% in the new population is in the same moderate to high range than observed in earlier populations. It is concluded that the dose of 10mg seems adequate also for the GI/lung NET population.
Whether full or partial resection of the small intestine might have had an influence on the absorption of everolimus cannot be revealed as the available small number of patient samples is too low.
Exposure-response relationship was investigated. While most variables did not show a relationship with exposure, as measured by Cmin, a trend for a relation for PFS and reduction of sum of lesion diameters with 2-fold increase of Cmin was suggested. However, due to the small sample numbers, these results have to be interpreted with caution, also in view of the Kaplan-Meier curve shapes for PFS by Cmin subgroups.
An exposure-safety relationship for the most clinically notable ADRs stomatitis, non-infectious pneumonitis and infection could not be determined.
2.3.5. Conclusions on clinical pharmacology
In general, the geometric mean trough plasma levels of everolimus showed a moderate to high variability. Although within this study the ileum group had a Cmin of only 77% of the non-ileum group and stratum A only had 66% of stratum B, no reliable conclusion can be drawn from these trough level-differences in relation to PFS.
Whether full or partial resection of the small intestine might have had an influence on the absorption of everolimus can neither be revealed as the available small number of patient samples is too low.
In conclusion, from the new pharmacology results no clinically relevant new information was obtained.
Extension of indication variation assessment report EMA/390543/2016 Page 17/80
2.4. Clinical efficacy
2.4.1. Main study
A randomized, double-blind, multicenter, phase III study of everolimus (RAD001) plus best supportive care versus placebo plus best supportive care in the treatment of patients with advanced NET of GI or lung origin - RADIANT-4
Methods
Study participants
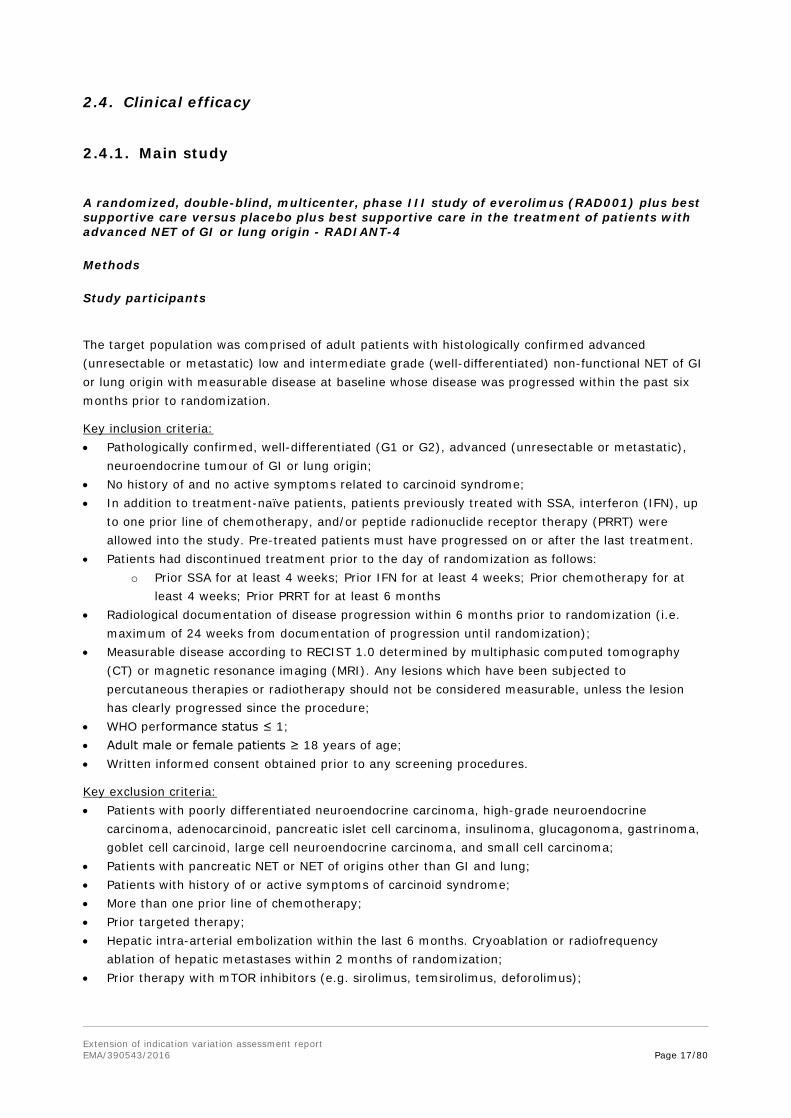
The target population was comprised of adult patients with histologically confirmed advanced (unresectable or metastatic) low and intermediate grade (well-differentiated) non-functional NET of GI or lung origin with measurable disease at baseline whose disease was progressed within the past six months prior to randomization.
Key inclusion criteria: • Pathologically confirmed, well-differentiated (G1 or G2), advanced (unresectable or metastatic),
neuroendocrine tumour of GI or lung origin; • No history of and no active symptoms related to carcinoid syndrome; • In addition to treatment-naïve patients, patients previously treated with SSA, interferon (IFN), up
to one prior line of chemotherapy, and/or peptide radionuclide receptor therapy (PRRT) were allowed into the study. Pre-treated patients must have progressed on or after the last treatment.
• Patients had discontinued treatment prior to the day of randomization as follows: o Prior SSA for at least 4 weeks; Prior IFN for at least 4 weeks; Prior chemotherapy for at
least 4 weeks; Prior PRRT for at least 6 months • Radiological documentation of disease progression within 6 months prior to randomization (i.e.
maximum of 24 weeks from documentation of progression until randomization); • Measurable disease according to RECIST 1.0 determined by multiphasic computed tomography
(CT) or magnetic resonance imaging (MRI). Any lesions which have been subjected to percutaneous therapies or radiotherapy should not be considered measurable, unless the lesion has clearly progressed since the procedure;
• WHO performance status ≤ 1; • Adult male or female patients ≥ 18 years of age; • Written informed consent obtained prior to any screening procedures.
Key exclusion criteria: • Patients with poorly differentiated neuroendocrine carcinoma, high-grade neuroendocrine
carcinoma, adenocarcinoid, pancreatic islet cell carcinoma, insulinoma, glucagonoma, gastrinoma, goblet cell carcinoid, large cell neuroendocrine carcinoma, and small cell carcinoma;
• Patients with pancreatic NET or NET of origins other than GI and lung; • Patients with history of or active symptoms of carcinoid syndrome; • More than one prior line of chemotherapy; • Prior targeted therapy; • Hepatic intra-arterial embolization within the last 6 months. Cryoablation or radiofrequency
ablation of hepatic metastases within 2 months of randomization; • Prior therapy with mTOR inhibitors (e.g. sirolimus, temsirolimus, deforolimus);
Extension of indication variation assessment report EMA/390543/2016 Page 18/80
• Known intolerance or hypersensitivity to everolimus or other rapamycin analogs (e.g. sirolimus, temsirolimus);
• Known impairment of gastrointestinal function or gastrointestinal disease that may significantly alter the absorption of oral everolimus.
Countries and number of centres (total 97): Austria (2), Belgium (4), Canada (7), China (5), Columbia (1), Czech Republic (3), Germany (7), UK (6), Greece (1), Hungary (2), Italy (13), Japan (3), Korea (5), Lebanon (2), Netherlands (1), Poland (2), Russia (1), Saudi Arabia (1), Slovakia (1), South Africa (1), Spain (3), Taiwan (5), Thailand (2), Turkey (2), USA (17)
Treatments Everolimus and matching placebo, both in conjunction with best supportive care based on the treating physician's best medical judgment.
Patients were instructed to take two tablets of 5 mg (10 mg total daily dose) of study drug orally with a glass of water, once daily at the same time each day, consistently either with or without food.
Best supportive care included: all care provided to patients deemed necessary, e.g., (but not restricted to) anti-diarrhoeals and analgesics. Radiation or surgery with the intent of palliation was allowed.
Best supportive care excluded: use of anti-tumour therapies, e.g., SSAs, interferon, tumour ablative procedures, and radiation and/or concurrent chemotherapy.
Treatment recommendations concerning time and food intake were in line with those in the approved SmPC for Afinitor.
Objectives Primary objectives
• To determine whether treatment with everolimus 10 mg daily plus best supportive care prolonged progression-free survival (PFS) compared with placebo plus best supportive care in patients with advanced NET of GI or lung origin without a history of, or current symptoms of carcinoid syndrome.
Key secondary objective
• To compare overall survival (OS) between study arms.
Other secondary objectives
• To determine the safety and tolerability of everolimus in this patient population. • To evaluate overall response rate (ORR) and disease control rate (DCR) in the two study arms. • To compare the Health-Related Quality of Life (HRQoL) based on the Functional Assessment of
Cancer Therapy-General (FACT-G) total score between study arms. • To compare changes from baseline in chromogranin A (CgA) and neuron specific enolase (NSE)
levels between study arms. • To compare time to deterioration for WHO performance status between study arms. • To determine the exposure of everolimus at the steady-state pre-dose concentration (Cmin) at
Cycle 2 (Day 29).
Exploratory objectives
• To evaluate the correlation between PFS and HRQoL in the two study arms. • To evaluate PFS by baseline liver tumour burden in the two study arms.

Extension of indication variation assessment report EMA/390543/2016 Page 19/80
• To explore the relationship between Cmin and PFS • To explore the relationship between Cmin and safety endpoints • To explore the potential predictive value of baseline blood/tumour biomarkers • To explore the potential predictive value of change from baseline blood markers
Outcomes/endpoints Primary endpoint: PFS as per central radiology, evaluated per modified RECIST 1.0 as defined in the CSP (see below). PFS as per local Investigator review was supportive. The primary analysis for PFS was performed on the FAS and compares the distribution of PFS between the two treatment groups using a stratified log-rank test at one-sided 2.5% level of significance.
Key secondary endpoint: OS. Tested between the 2 treatment groups using a stratified log-rank test in a hierarchal way when PFS was found significant. A group sequential methodology with alpha-spending function was implemented for OS testing to maintain the family-wise error rate.
Other secondary endpoints:
- Safety and tolerability: mainly based on AEs and laboratory values out of pre-determined ranges - ORR and DCR: as per modified RECIST 1.0 as defined in the CSP and according to central evaluation - HRQoL: based on time to definitive deterioration in FACT-G total score, where deterioration is defined as a decrease by at least 7 points compared to baseline - Changes in CgA and NSE levels - Time to deterioration of WHO performance status: defined as an increase of at least one category compared to baseline.
Modified RECIST 1.0 was defined in the CSP as to guide the declaration of disease progression (1) based on new “unequivocal” liver lesions, i.e. single lesions with a size of ≥10mm or multiple new lesions of <10mm at one evaluation, and (2) based on non-target lesions with an overall level of substantial worsening of the non-target disease which requires treatment discontinuation, even in case of SD or PR of the target-disease.
Independent central review of routine local tumour assessment was conducted by image submission from site to imaging CRO within 48 hours and timely reading. In cases of investigator assessed disease progression, an expedited IRC review was to be requested and central review by radiologist was to be performed within 5 working days to minimize bias. Until progression was confirmed by the IRC the patient was to continue treatment, if indicated. IRC-confirmed progression should result in treatment discontinuation.
Sample size Sample size assumptions in this study were partly based on the data from the PROMID study. The median PFS in the placebo arm was expected to be around 5 months. This was lower than the TTP of 6 months observed in the control arm of the PROMID study due to the differences in patient population, endpoint, and treatment line, as a retrospective case series in patients with more advanced NET had shown a median TTP after 2nd line therapy of 5 months. It was hypothesized that treatment with everolimus resulted in a 41% reduction in the hazard rate (corresponding to 70% increase in the median PFS to 8.5 months).
PFS analysis was to be performed when a total of 176 PFS events were observed. Assuming about 15% of the patients were drop-outs for the PFS evaluation, a total of 285 patients was planned to be randomized between the two study arms in a 2:1 ratio (190 in everolimus arm and 95 in placebo arm).
Extension of indication variation assessment report EMA/390543/2016 Page 20/80
Please also see Statistical methods below.
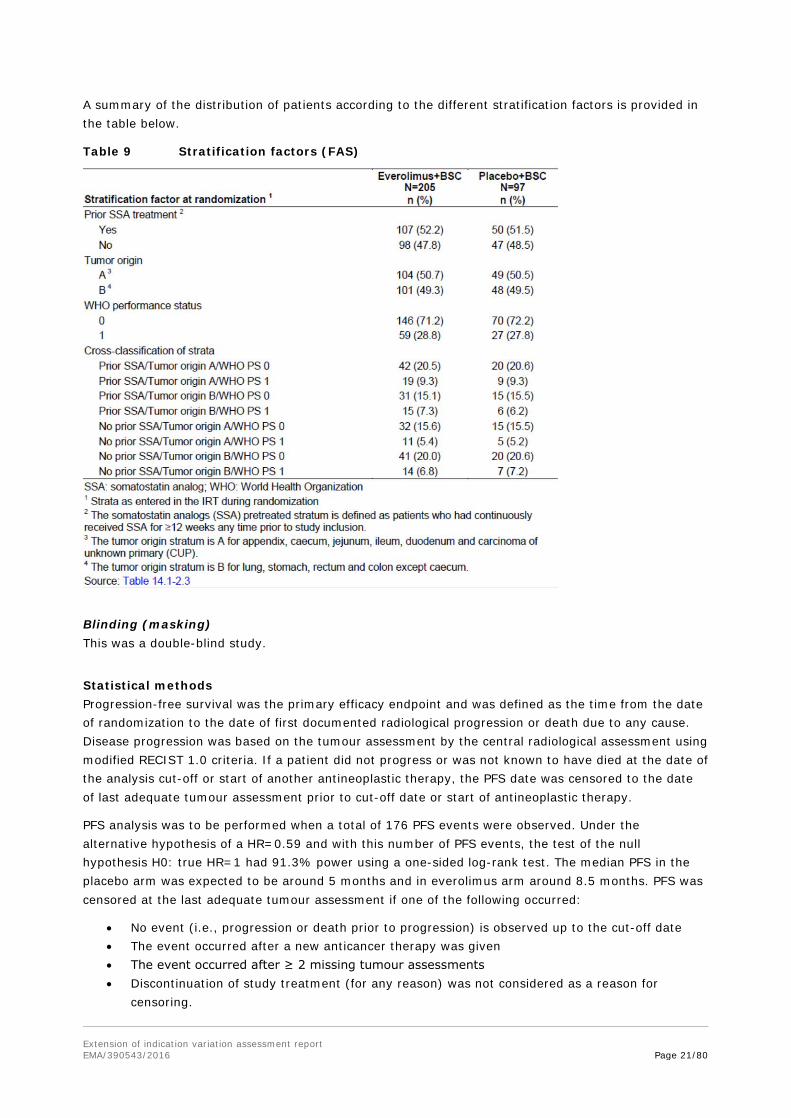
Randomisation Prior to dosing, all patients who fulfilled all inclusion and exclusion criteria were randomized via IRT to one of the treatment arms. 302 patients were randomised in a 2:1 manner and were included in the FAS. Randomization was stratified by:
1. prior SSA treatment (yes vs. no; the SSA pretreated stratum is defined as patients who had continuously received SSA for ≥12 weeks any time prior to study inclusion),
2. tumour origin (A. appendix, caecum, jejunum, ileum, duodenum, CUP vs. B. lung, stomach, rectum, colon except caecum),
CUP was defined as well differentiated (G1 or G2) NET where any other primary tumour origin than gastrointestinal or lung has been excluded by appropriate diagnostic procedures. As with Amendment 1 “liver” as primary tumour site was deleted from stratum B, NET lesions found solely in the liver were coded as CUP.
3. WHO performance status (0 vs. 1).
The strata A and B according to tumour site of origin were based on median survival data of the primary tumour origins as referred to from Yao et al. 2008.
A summary of the classification of NETs as provided in the study protocol is given in Table 8 below:
Table 8 Nomenclature of NETs (ENETS and WHO)
Extension of indication variation assessment report EMA/390543/2016 Page 21/80
A summary of the distribution of patients according to the different stratification factors is provided in the table below.
Table 9 Stratification factors (FAS)
Blinding (masking) This was a double-blind study.
Statistical methods Progression-free survival was the primary efficacy endpoint and was defined as the time from the date of randomization to the date of first documented radiological progression or death due to any cause. Disease progression was based on the tumour assessment by the central radiological assessment using modified RECIST 1.0 criteria. If a patient did not progress or was not known to have died at the date of the analysis cut-off or start of another antineoplastic therapy, the PFS date was censored to the date of last adequate tumour assessment prior to cut-off date or start of antineoplastic therapy.
PFS analysis was to be performed when a total of 176 PFS events were observed. Under the alternative hypothesis of a HR=0.59 and with this number of PFS events, the test of the null hypothesis H0: true HR=1 had 91.3% power using a one-sided log-rank test. The median PFS in the placebo arm was expected to be around 5 months and in everolimus arm around 8.5 months. PFS was censored at the last adequate tumour assessment if one of the following occurred:
• No event (i.e., progression or death prior to progression) is observed up to the cut-off date • The event occurred after a new anticancer therapy was given • The event occurred after ≥ 2 missing tumour assessments • Discontinuation of study treatment (for any reason) was not considered as a reason for
censoring.
Extension of indication variation assessment report EMA/390543/2016 Page 22/80
The primary efficacy analysis was the comparison of the distribution of PFS between the two treatment groups in the FAS using a stratified log-rank test at one-sided 2.5% cumulative level of significance (strata information according to randomization). Distribution of PFS was estimated using the Kaplan-Meier method. The number of ties in the analysis of PFS, (events recorded with exactly the same times), was expected to be rather large due to the discrete tumour/HRQoL/WHO assessment scheme. In the SAS PHREG procedure, the Breslow approximation was avoided since it performs poorly and the STRATA statement in LIFETEST procedure was used instead. The stratified Cox regression with treatment as a single covariate was used to estimate the hazard ratio (HR) of PFS, along with 95% confidence interval. Overall survival was identified as the key secondary endpoint. Cox proportional hazards model will be implemented using PHREG procedure with option TIES=EXACT. It assumes that there is a true but unknown ordering for the tied event times
OS was defined as the time from the date of randomization to date of death due to any cause. If a death was not observed by the date of analysis cutoff, then OS was censored at the date of last contact. The OS analysis was performed in the FAS. The distribution of OS was compared between the two treatment groups using a group sequential design with a stratified log-rank test, 3 looks (Lan-DeMets group sequential design with O’Brien- Fleming type boundaries) at one-sided cumulative 2.5% level of significance. The distribution function of OS was estimated using the Kaplan-Meier method. The median OS along with 95% confidence intervals was presented by two treatment groups. The stratified Cox regression was used to estimate HR of OS, along with 95% confidence interval.
Interim analyses for PFS and OS were planned and the interim analysis plan was revised twice. First, in order to have more mature data and to decrease the risk of bias in the estimation of the PFS hazard ratio, the timing of the interim analysis was changed from 60% (102 events) to 80% (140 events) of the total number of targeted PFS events. This change also impacted the total number of required PFS events and the total sample size. Second, due to the rapid enrolment, the DMC meeting for the interim efficacy analysis (at 80% of the events) was predicted to occur when the number of events (N=176) for the final PFS analysis was already observed. Therefore, the interim analysis for PFS was cancelled. The DMC and the Steering Committees agreed with the recommendation to cancel the interim analysis for PFS. Two interim analyses were planned for OS, one at the time of PFS interim analysis and one at the time of PFS final analysis. Due to the cancelation of the PFS interim analysis, the first of the planned interim analyses for OS was cancelled and replaced by a later interim analysis at 50% of the final OS events (at approximately 95 OS events). The final OS analysis is expected 90 months after FPFV.
The type I error was controlled for the primary endpoint PFS and the key secondary endpoint OS using a hierarchical approach where OS was to be tested if the PFS results were significant. For the OS analyses a Lan-DeMets group sequential design with O’Brien- Fleming type boundaries was used with three analysis time points defined.
Several analyses were performed that confirm the results of the primary efficacy analysis for PFS and there are no concerns about the robustness of the results. Results based on investigator radiology review are very similar. Censoring patterns between the arms are comparable and censoring due to initiation of a new cancer therapy occurred with the same frequency in the arms. The impact of missing scans was explored with two sensitivity analyses using backdated events and actual event time. Both types of analysis yield very similar results.
The additional analyses performed for subgroups are welcomed to further explore results with differing treatment effects in subgroups. Some subgroup results could suggest differences in treatment effects, but from a statistical perspective there are arguments that support the view that the subgroups results could be due to chance. Stratified randomization can balance allocation to the treatment arms in subgroups with factors used for stratification, but does not guarantee balance for
Extension of indication variation assessment report EMA/390543/2016 Page 23/80
other factors with small numbers in the treatment arms. Differences between analyses with and without stratification in certain subgroups suggest that there is an imbalance for the factors used for stratified randomization, influencing the subgroups analysis. Smaller hazard ratios in analyses using additional covariates for the analyses of primary tumour origin subgroups (which include the ileum subgroup) also suggest confounding by other factors.
The results in the subgroups analysis by tumour origin are of special interest due to the differing results in the ileum subgroup. Due to fewer events in this subgroup the confidence intervals are wider than for other tumour origin subgroups. While the Gail-Simon test (ileum subgroup vs. other origins) indicates no qualitative interaction and therefore no concern arises, it has to be considered that this test has only limited power.
Results
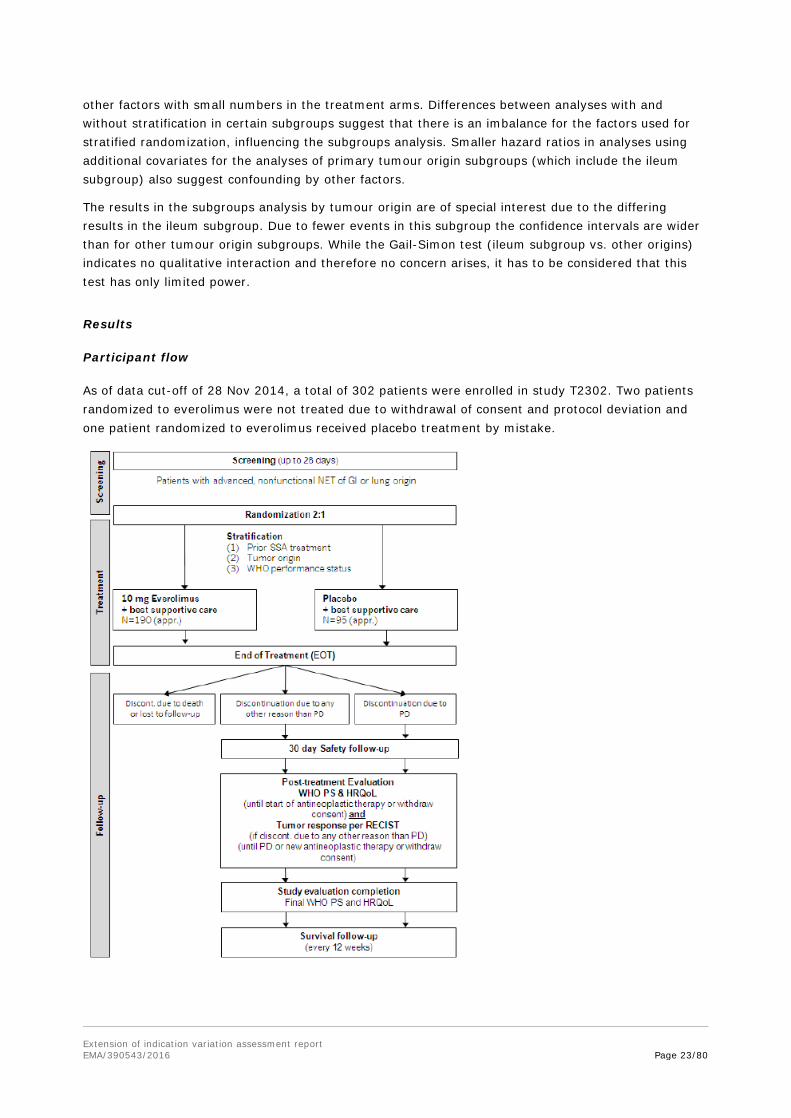
Participant flow
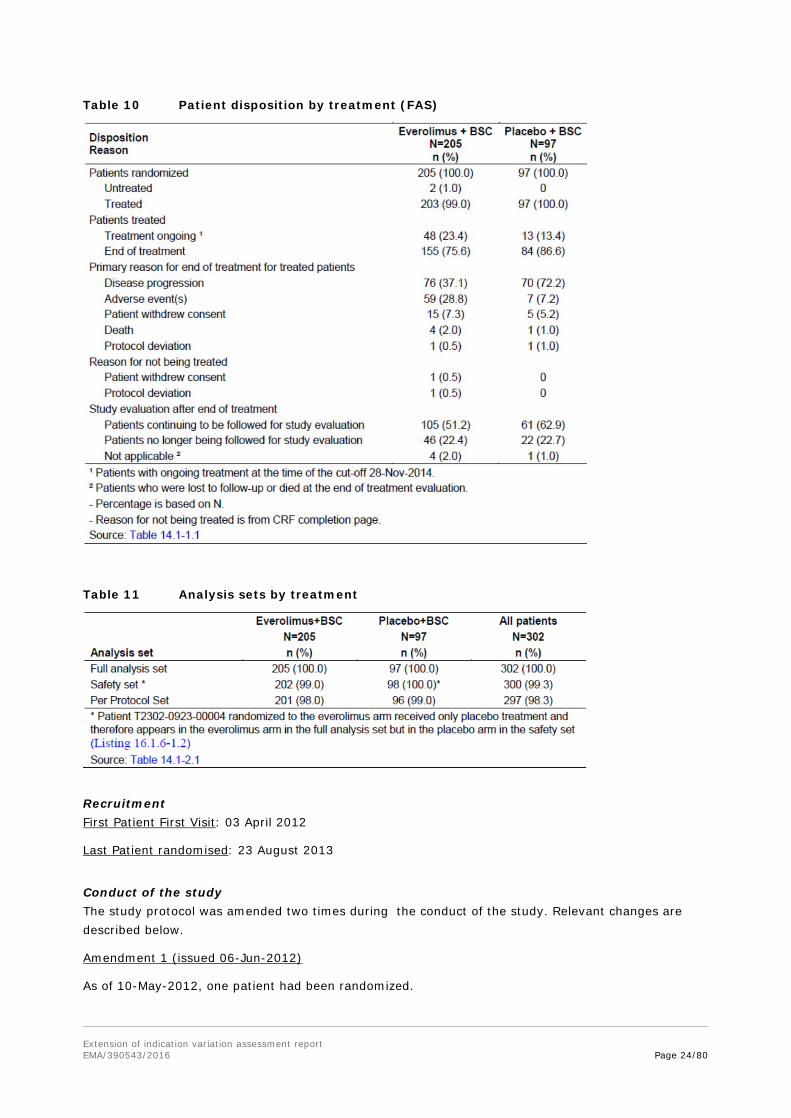
As of data cut-off of 28 Nov 2014, a total of 302 patients were enrolled in study T2302. Two patients randomized to everolimus were not treated due to withdrawal of consent and protocol deviation and one patient randomized to everolimus received placebo treatment by mistake.
Extension of indication variation assessment report EMA/390543/2016 Page 24/80
Table 10 Patient disposition by treatment (FAS)
Table 11 Analysis sets by treatment
Recruitment First Patient First Visit: 03 April 2012
Last Patient randomised: 23 August 2013
Conduct of the study The study protocol was amended two times during the conduct of the study. Relevant changes are described below.
Amendment 1 (issued 06-Jun-2012)
As of 10-May-2012, one patient had been randomized.
Extension of indication variation assessment report EMA/390543/2016 Page 25/80
“Liver” as primary tumour site was deleted from stratum B. This rationale was based on clinical observation that most, if not all, liver NET are metastases of other primary NET locations (although in some patients no primary NET outside the liver can be detected). Therefore, NET lesions found solely in the liver were to be coded as “Carcinoma of Unknown Primary (CUP)”, which was included in stratum A.
Interval from time of last radiological progression to randomization was increased from 3 to 6 months to better align with current standard of care, which was generally to scan patients every six months (to facilitate recruitment).
A single pre-dose PK blood sample was integrated at pre-dose Visit 3, Cycle 2, Day 29.
The timing of the interim analysis was changed from 60% (102 events) to 80% (140 events) of the total number of targeted PFS events. This change also impacted the total number of required PFS events and the total sample size.
Exclusion 15 was modified to also allow patients with curatively resected other prior tumours if they were in complete remission for >5 years (to increase recruitment).
For a new lesion to be unequivocal, the progression date was established when the new lesion reached a size ≥10 mm.
Amendment 2 (issued 28-Jan-2014)
At the time of this protocol amendment, all patients (N=302) were randomized as planned. As of 21-Jan-2014, 123 patients were still receiving treatment.
Due to the rapid enrolment, the DMC meeting for the interim efficacy analysis (at 80% of the events) was predicted to occur when the number of events (N=176) for the final PFS analysis was already observed. Therefore, the interim analysis for PFS was cancelled.
Two interim analyses were planned for OS: one at the time of PFS interim analysis and one at the time of PFS final analysis. Due to the cancelation of the PFS interim analysis, the first of the planned interim analyses for OS was cancelled and replaced by a later interim analysis at 50% of the final OS events (at approximately 95 OS events). Final OS analysis is expected 90 months after FPFV.
Also, OS was a pre-specified key secondary endpoint in this study. The process of unblinding and communication of interim OS results between the sponsor, Health Authorities, and other parties was revised. Protocol Amendment 2 clarified that Novartis will be performing the OS Interim Analysis at the time of PFS analysis in order to facilitate Health Authority interactions on the basis of past discussions and feedback from Health Authorities on other trials conducted by Novartis. Therefore, at the time of final PFS analysis, the clinical and statistical teams within Novartis had access to the unblinded OS data and the interim OS results and will share these data with Health Authorities and other parties as needed. Patients and Investigators remained blinded to study treatment until final OS analysis (or earlier if OS reached statistical significance at any of the interim analyses) unless the Sponsor deems unblinding of patients and Investigators appropriate.
Concerning the interim analyses please also refer to the statistical methods above.
• Protocol deviations
Major protocol deviations led to the exclusion from the Per Protocol set of 4 patients from the everolimus arm and 1 patient from the placebo arm.

Extension of indication variation assessment report EMA/390543/2016 Page 26/80
Table 12 Major protocol deviations (FAS)
Minor protocol deviations were primarily ’Incorrect stratification factor used for randomization’ (~14% both arms), ‘No radiological documentation of disease progression within 3/6 months prior to randomization’ (5% only everolimus arm), ‘Study drug interrupted for more than 4 weeks but study drug not discontinued’ and ‘Missing pregnancy test’ (both ~3% both arms).
Reported data on randomization based on wrong stratification factors were as follows: numbers were low for WHO performance status and tumour origin (0-7 of all 302 patients with 0-4 per stratum). Prior use of SSA was incorrectly given at randomization for 17 and 9/302 patients, of which in the everolimus arm 14 patients were randomized as “SSA= yes” but had none before and 7 randomized to “SSA=no” but were pretreated.
• GCP Audits and inspections
5 investigator sites (2x Italy, Japan, United Kingdom, US) were audited by the sponsor during conduct of the study (Mar 2013 – Aug 2014). There were no known Health Authority inspections conducted at sites participating in this study.
The MAH was asked to provide information on the results of the internal GCP site audits and clarified that they did not reveal relevant GCP issues that could have impacted the conduct of the study
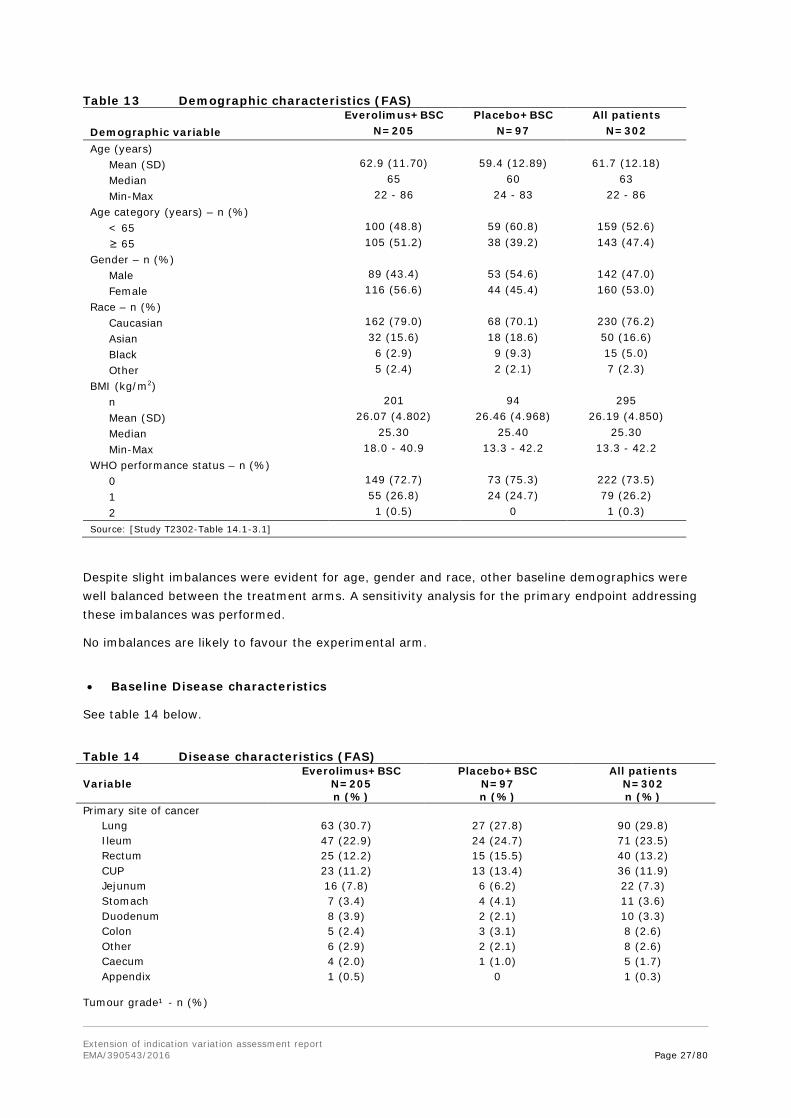
Baseline data • Baseline Demographics
The median age of all patients was 63 years (range: 22 to 86 years) (Table 13). Overall, the two treatment arms were well balanced with respect to demographic and baseline characteristics. Except, patients in the everolimus arm were slightly older (65 years, range: 22 to 86 years) than the patients in the placebo arm (60 years, range: 24 to 83 years). Further, a higher percentage of females were seen in the everolimus arm (56.6% vs. 45.4%) and also a higher percentage of Caucasians (79.0% vs. 70.1%).
Extension of indication variation assessment report EMA/390543/2016 Page 27/80
Table 13 Demographic characteristics (FAS) Everolimus+BSC Placebo+BSC All patients Demographic variable N=205 N=97 N=302 Age (years) Mean (SD) 62.9 (11.70) 59.4 (12.89) 61.7 (12.18) Median 65 60 63 Min-Max 22 - 86 24 - 83 22 - 86 Age category (years) – n (%) < 65 100 (48.8) 59 (60.8) 159 (52.6) ≥ 65 105 (51.2) 38 (39.2) 143 (47.4) Gender – n (%) Male 89 (43.4) 53 (54.6) 142 (47.0) Female 116 (56.6) 44 (45.4) 160 (53.0) Race – n (%) Caucasian 162 (79.0) 68 (70.1) 230 (76.2) Asian 32 (15.6) 18 (18.6) 50 (16.6) Black 6 (2.9) 9 (9.3) 15 (5.0) Other 5 (2.4) 2 (2.1) 7 (2.3) BMI (kg/m2) n 201 94 295 Mean (SD) 26.07 (4.802) 26.46 (4.968) 26.19 (4.850) Median 25.30 25.40 25.30 Min-Max 18.0 - 40.9 13.3 - 42.2 13.3 - 42.2 WHO performance status – n (%) 0 149 (72.7) 73 (75.3) 222 (73.5) 1 55 (26.8) 24 (24.7) 79 (26.2) 2 1 (0.5) 0 1 (0.3) Source: [Study T2302-Table 14.1-3.1]
Despite slight imbalances were evident for age, gender and race, other baseline demographics were well balanced between the treatment arms. A sensitivity analysis for the primary endpoint addressing these imbalances was performed.
No imbalances are likely to favour the experimental arm.
• Baseline Disease characteristics
See table 14 below.
Table 14 Disease characteristics (FAS) Everolimus+BSC Placebo+BSC All patients Variable N=205
n (%) N=97 n (%)
N=302 n (%)
Primary site of cancer Lung 63 (30.7) 27 (27.8) 90 (29.8) Ileum 47 (22.9) 24 (24.7) 71 (23.5) Rectum 25 (12.2) 15 (15.5) 40 (13.2) CUP 23 (11.2) 13 (13.4) 36 (11.9) Jejunum 16 (7.8) 6 (6.2) 22 (7.3) Stomach 7 (3.4) 4 (4.1) 11 (3.6) Duodenum 8 (3.9) 2 (2.1) 10 (3.3) Colon 5 (2.4) 3 (3.1) 8 (2.6) Other 6 (2.9) 2 (2.1) 8 (2.6) Caecum 4 (2.0) 1 (1.0) 5 (1.7) Appendix
1 (0.5) 0 1 (0.3)
Tumour grade¹ - n (%)
Extension of indication variation assessment report EMA/390543/2016 Page 28/80
Everolimus+BSC Placebo+BSC All patients Variable N=205
n (%) N=97 n (%)
N=302 n (%)
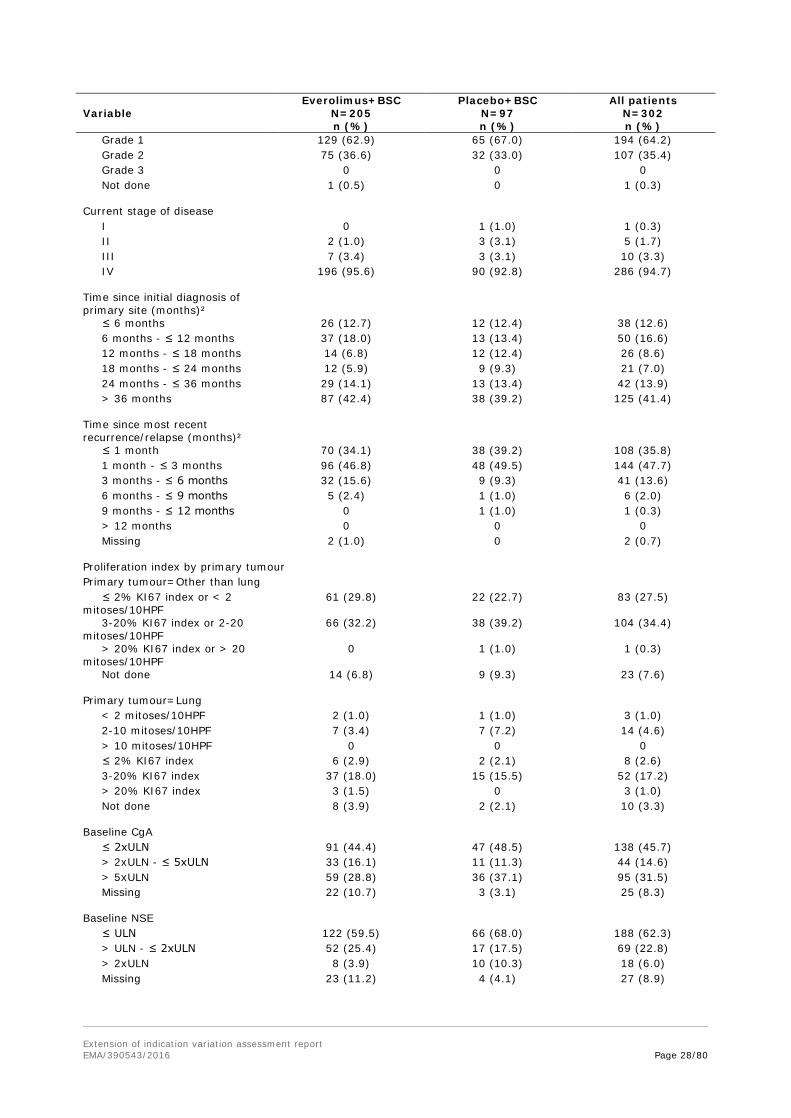
Grade 1 129 (62.9) 65 (67.0) 194 (64.2) Grade 2 75 (36.6) 32 (33.0) 107 (35.4) Grade 3 0 0 0 Not done
1 (0.5) 0 1 (0.3)
Current stage of disease I 0 1 (1.0) 1 (0.3) II 2 (1.0) 3 (3.1) 5 (1.7) III 7 (3.4) 3 (3.1) 10 (3.3) IV
196 (95.6) 90 (92.8) 286 (94.7)
Time since initial diagnosis of primary site (months)²
≤ 6 months 26 (12.7) 12 (12.4) 38 (12.6) 6 months - ≤ 12 months 37 (18.0) 13 (13.4) 50 (16.6) 12 months - ≤ 18 months 14 (6.8) 12 (12.4) 26 (8.6) 18 months - ≤ 24 months 12 (5.9) 9 (9.3) 21 (7.0) 24 months - ≤ 36 months 29 (14.1) 13 (13.4) 42 (13.9) > 36 months
87 (42.4) 38 (39.2) 125 (41.4)
Time since most recent recurrence/relapse (months)²
≤ 1 month 70 (34.1) 38 (39.2) 108 (35.8) 1 month - ≤ 3 months 96 (46.8) 48 (49.5) 144 (47.7) 3 months - ≤ 6 months 32 (15.6) 9 (9.3) 41 (13.6) 6 months - ≤ 9 months 5 (2.4) 1 (1.0) 6 (2.0) 9 months - ≤ 12 months 0 1 (1.0) 1 (0.3) > 12 months 0 0 0 Missing
2 (1.0) 0 2 (0.7)
Proliferation index by primary tumour Primary tumour=Other than lung ≤ 2% KI67 index or < 2 mitoses/10HPF
61 (29.8) 22 (22.7) 83 (27.5)
3-20% KI67 index or 2-20 mitoses/10HPF
66 (32.2) 38 (39.2) 104 (34.4)
> 20% KI67 index or > 20 mitoses/10HPF
0 1 (1.0) 1 (0.3)
Not done
14 (6.8) 9 (9.3) 23 (7.6)
Primary tumour=Lung < 2 mitoses/10HPF 2 (1.0) 1 (1.0) 3 (1.0) 2-10 mitoses/10HPF 7 (3.4) 7 (7.2) 14 (4.6) > 10 mitoses/10HPF 0 0 0 ≤ 2% KI67 index 6 (2.9) 2 (2.1) 8 (2.6) 3-20% KI67 index 37 (18.0) 15 (15.5) 52 (17.2) > 20% KI67 index 3 (1.5) 0 3 (1.0) Not done
8 (3.9) 2 (2.1) 10 (3.3)
Baseline CgA ≤ 2xULN 91 (44.4) 47 (48.5) 138 (45.7) > 2xULN - ≤ 5xULN 33 (16.1) 11 (11.3) 44 (14.6) > 5xULN 59 (28.8) 36 (37.1) 95 (31.5) Missing
22 (10.7) 3 (3.1) 25 (8.3)
Baseline NSE ≤ ULN 122 (59.5) 66 (68.0) 188 (62.3) > ULN - ≤ 2xULN 52 (25.4) 17 (17.5) 69 (22.8) > 2xULN 8 (3.9) 10 (10.3) 18 (6.0) Missing
23 (11.2) 4 (4.1) 27 (8.9)

Extension of indication variation assessment report EMA/390543/2016 Page 29/80
Everolimus+BSC Placebo+BSC All patients Variable N=205
n (%) N=97 n (%)
N=302 n (%)
Liver tumour burden, n (%) 0% 34 (16.6) 14 (14.4) 48 (15.9) > 0-10% 119 (58.0) 61 (62.9) 180 (59.6) > 10-25% 29 (14.1) 8 (8.2) 37 (12.3) > 25-50% 9 (4.4) 4 (4.1) 13 (4.3) > 50% 12 (5.9) 10 (10.3) 22 (7.3) Unknown 2 (1.0) 0 2 (0.7) CgA: chromogranin A; NSE: neuron specific enolase ¹ Based on a mapping between histological grade and WHO grade. ² Time since initial diagnosis and time since most current relapse until randomization date. Source: [Study T2302-Table 14.1-3.2] and [Study T2302-Table 14.1-3.13a]
Primary site of tumour origin was lung with about 30% of patients, followed by ileum with about one quarter and rectum and CUP of 12-13% of patients in both treatment arms. In view of the respective inclusion criteria, the proportion of patients with lung NET was higher than in both previous everolimus studies (pNET C2324: 14% as involved organ; carcinoid C2325: 5 and 15% as primary site).
The majority of tumours were of grade 1. According to tumour staging, nearly 95% had stage IV (metastatic) disease and only 3% with stage III. 40% of patients had their primary diagnosis more than 3 years ago. The latter is in accordance with grade 1 and 2 well-differentiated NETs often progressing slowly.
One patient was included in the placebo arm with a proliferation index of grade 3, and likewise were 3 patients in the everolimus arm. The MAH stated that these patients were retained in the study and were not considered to be protocol deviations based on the investigators’ confirmation of eligibility.
There were a high number of patients (FAS: everolimus arm 49.3%; placebo arm 40.2%) for whom no histological grading was done at screening, although the inclusion criterion 1 required pathologically confirmed disease and the CSP requested that “the tumor pathology report should be verified and should confirm histology and grade of neuroendocrine tumor”. It was clarified that all of the patients without a ‘histologic grade’ were assessed per WHO tumour grading, or vice versa.
However, additional discrepancies appeared between tumour grading and Ki-67/mitotic index, e.g., 79 patients documented with tumour grade 1 had a Ki67-index or mitotic count of grade 2. 34 patients had no Ki-67/MI parameters obtained at baseline. Therefore the MAH was requested to perform new PFS analyses accounting for the correct(ed) tumour grade and discuss the predictive value of Ki-67/mitotic index for everolimus treatment.
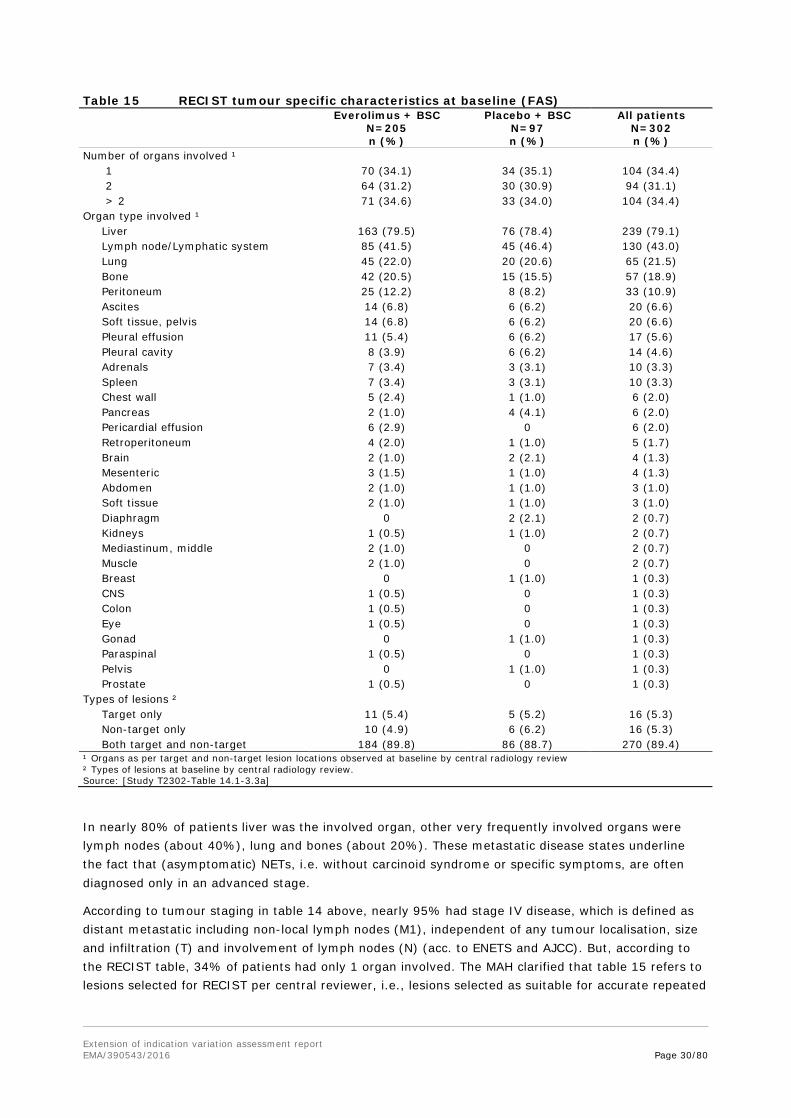
An almost equal proportion of patients had one, two, or more than two organs involved in their disease (Table 15).
Extension of indication variation assessment report EMA/390543/2016 Page 30/80
Table 15 RECIST tumour specific characteristics at baseline (FAS)
Everolimus + BSC
N=205 n (%)
Placebo + BSC N=97 n (%)
All patients N=302 n (%)
Number of organs involved ¹ 1 70 (34.1) 34 (35.1) 104 (34.4) 2 64 (31.2) 30 (30.9) 94 (31.1) > 2 71 (34.6) 33 (34.0) 104 (34.4) Organ type involved ¹ Liver 163 (79.5) 76 (78.4) 239 (79.1) Lymph node/Lymphatic system 85 (41.5) 45 (46.4) 130 (43.0) Lung 45 (22.0) 20 (20.6) 65 (21.5) Bone 42 (20.5) 15 (15.5) 57 (18.9) Peritoneum 25 (12.2) 8 (8.2) 33 (10.9) Ascites 14 (6.8) 6 (6.2) 20 (6.6) Soft tissue, pelvis 14 (6.8) 6 (6.2) 20 (6.6) Pleural effusion 11 (5.4) 6 (6.2) 17 (5.6) Pleural cavity 8 (3.9) 6 (6.2) 14 (4.6) Adrenals 7 (3.4) 3 (3.1) 10 (3.3) Spleen 7 (3.4) 3 (3.1) 10 (3.3) Chest wall 5 (2.4) 1 (1.0) 6 (2.0) Pancreas 2 (1.0) 4 (4.1) 6 (2.0) Pericardial effusion 6 (2.9) 0 6 (2.0) Retroperitoneum 4 (2.0) 1 (1.0) 5 (1.7) Brain 2 (1.0) 2 (2.1) 4 (1.3) Mesenteric 3 (1.5) 1 (1.0) 4 (1.3) Abdomen 2 (1.0) 1 (1.0) 3 (1.0) Soft tissue 2 (1.0) 1 (1.0) 3 (1.0) Diaphragm 0 2 (2.1) 2 (0.7) Kidneys 1 (0.5) 1 (1.0) 2 (0.7) Mediastinum, middle 2 (1.0) 0 2 (0.7) Muscle 2 (1.0) 0 2 (0.7) Breast 0 1 (1.0) 1 (0.3) CNS 1 (0.5) 0 1 (0.3) Colon 1 (0.5) 0 1 (0.3) Eye 1 (0.5) 0 1 (0.3) Gonad 0 1 (1.0) 1 (0.3) Paraspinal 1 (0.5) 0 1 (0.3) Pelvis 0 1 (1.0) 1 (0.3) Prostate 1 (0.5) 0 1 (0.3) Types of lesions ² Target only 11 (5.4) 5 (5.2) 16 (5.3) Non-target only 10 (4.9) 6 (6.2) 16 (5.3) Both target and non-target 184 (89.8) 86 (88.7) 270 (89.4) ¹ Organs as per target and non-target lesion locations observed at baseline by central radiology review ² Types of lesions at baseline by central radiology review. Source: [Study T2302-Table 14.1-3.3a]
In nearly 80% of patients liver was the involved organ, other very frequently involved organs were lymph nodes (about 40%), lung and bones (about 20%). These metastatic disease states underline the fact that (asymptomatic) NETs, i.e. without carcinoid syndrome or specific symptoms, are often diagnosed only in an advanced stage.
According to tumour staging in table 14 above, nearly 95% had stage IV disease, which is defined as distant metastatic including non-local lymph nodes (M1), independent of any tumour localisation, size and infiltration (T) and involvement of lymph nodes (N) (acc. to ENETS and AJCC). But, according to the RECIST table, 34% of patients had only 1 organ involved. The MAH clarified that table 15 refers to lesions selected for RECIST per central reviewer, i.e., lesions selected as suitable for accurate repeated
Extension of indication variation assessment report EMA/390543/2016 Page 31/80
measurements. In addition, most patients had their primary lesion resected, thus, it is expected that many patients would be enrolled with a single metastatic site.
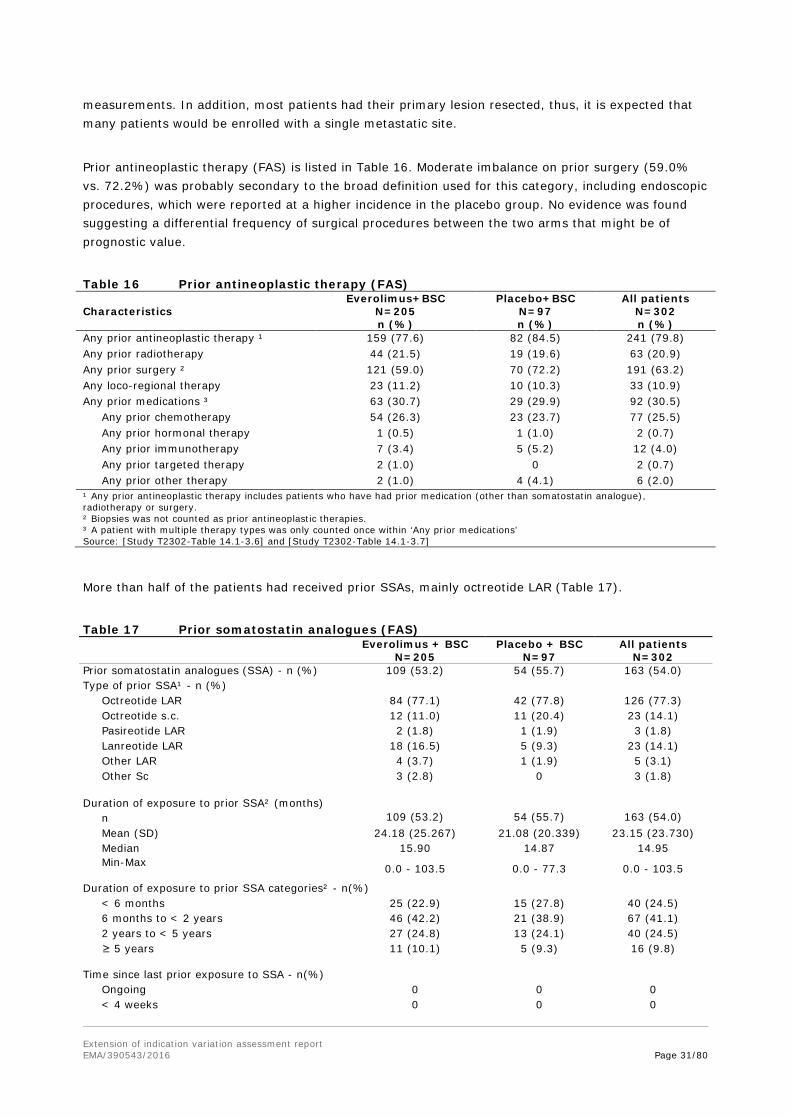
Prior antineoplastic therapy (FAS) is listed in Table 16. Moderate imbalance on prior surgery (59.0% vs. 72.2%) was probably secondary to the broad definition used for this category, including endoscopic procedures, which were reported at a higher incidence in the placebo group. No evidence was found suggesting a differential frequency of surgical procedures between the two arms that might be of prognostic value.
Table 16 Prior antineoplastic therapy (FAS) Everolimus+BSC Placebo+BSC All patients Characteristics N=205
n (%) N=97 n (%)
N=302 n (%)
Any prior antineoplastic therapy ¹ 159 (77.6) 82 (84.5) 241 (79.8) Any prior radiotherapy 44 (21.5) 19 (19.6) 63 (20.9) Any prior surgery ² 121 (59.0) 70 (72.2) 191 (63.2) Any loco-regional therapy 23 (11.2) 10 (10.3) 33 (10.9) Any prior medications ³ 63 (30.7) 29 (29.9) 92 (30.5) Any prior chemotherapy 54 (26.3) 23 (23.7) 77 (25.5) Any prior hormonal therapy 1 (0.5) 1 (1.0) 2 (0.7) Any prior immunotherapy 7 (3.4) 5 (5.2) 12 (4.0) Any prior targeted therapy 2 (1.0) 0 2 (0.7) Any prior other therapy 2 (1.0) 4 (4.1) 6 (2.0) ¹ Any prior antineoplastic therapy includes patients who have had prior medication (other than somatostatin analogue), radiotherapy or surgery. ² Biopsies was not counted as prior antineoplastic therapies. ³ A patient with multiple therapy types was only counted once within ‘Any prior medications’ Source: [Study T2302-Table 14.1-3.6] and [Study T2302-Table 14.1-3.7]
More than half of the patients had received prior SSAs, mainly octreotide LAR (Table 17).
Table 17 Prior somatostatin analogues (FAS)
Everolimus + BSC
N=205 Placebo + BSC
N=97 All patients
N=302 Prior somatostatin analogues (SSA) - n (%) 109 (53.2) 54 (55.7) 163 (54.0) Type of prior SSA¹ - n (%) Octreotide LAR 84 (77.1) 42 (77.8) 126 (77.3) Octreotide s.c. 12 (11.0) 11 (20.4) 23 (14.1) Pasireotide LAR 2 (1.8) 1 (1.9) 3 (1.8) Lanreotide LAR 18 (16.5) 5 (9.3) 23 (14.1) Other LAR 4 (3.7) 1 (1.9) 5 (3.1) Other Sc
3 (2.8) 0 3 (1.8)
Duration of exposure to prior SSA² (months) n 109 (53.2) 54 (55.7) 163 (54.0) Mean (SD) 24.18 (25.267) 21.08 (20.339) 23.15 (23.730) Median 15.90 14.87 14.95 Min-Max 0.0 - 103.5 0.0 - 77.3 0.0 - 103.5
Duration of exposure to prior SSA categories² - n(%) < 6 months 25 (22.9) 15 (27.8) 40 (24.5) 6 months to < 2 years 46 (42.2) 21 (38.9) 67 (41.1) 2 years to < 5 years 27 (24.8) 13 (24.1) 40 (24.5) ≥ 5 years
11 (10.1) 5 (9.3) 16 (9.8)
Time since last prior exposure to SSA - n(%) Ongoing 0 0 0 < 4 weeks 0 0 0
Extension of indication variation assessment report EMA/390543/2016 Page 32/80
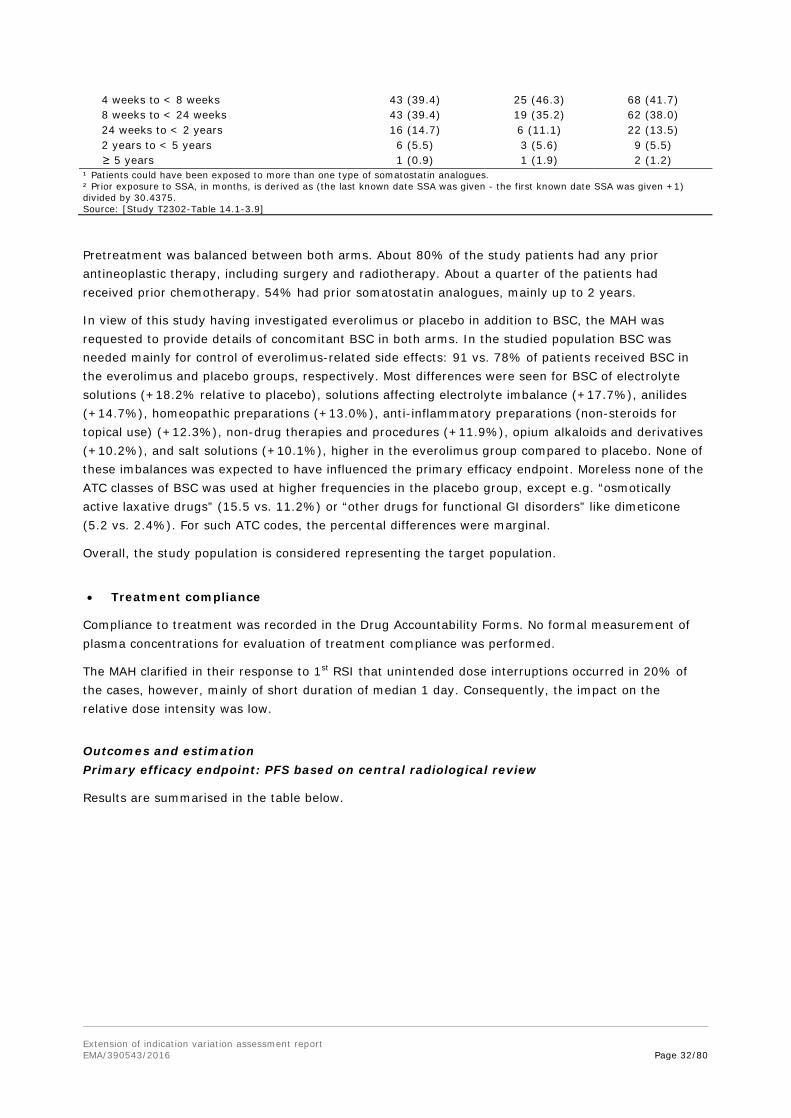
4 weeks to < 8 weeks 43 (39.4) 25 (46.3) 68 (41.7) 8 weeks to < 24 weeks 43 (39.4) 19 (35.2) 62 (38.0) 24 weeks to < 2 years 16 (14.7) 6 (11.1) 22 (13.5) 2 years to < 5 years 6 (5.5) 3 (5.6) 9 (5.5) ≥ 5 years 1 (0.9) 1 (1.9) 2 (1.2) ¹ Patients could have been exposed to more than one type of somatostatin analogues. ² Prior exposure to SSA, in months, is derived as (the last known date SSA was given - the first known date SSA was given +1) divided by 30.4375. Source: [Study T2302-Table 14.1-3.9]
Pretreatment was balanced between both arms. About 80% of the study patients had any prior antineoplastic therapy, including surgery and radiotherapy. About a quarter of the patients had received prior chemotherapy. 54% had prior somatostatin analogues, mainly up to 2 years.
In view of this study having investigated everolimus or placebo in addition to BSC, the MAH was requested to provide details of concomitant BSC in both arms. In the studied population BSC was needed mainly for control of everolimus-related side effects: 91 vs. 78% of patients received BSC in the everolimus and placebo groups, respectively. Most differences were seen for BSC of electrolyte solutions (+18.2% relative to placebo), solutions affecting electrolyte imbalance (+17.7%), anilides (+14.7%), homeopathic preparations (+13.0%), anti-inflammatory preparations (non-steroids for topical use) (+12.3%), non-drug therapies and procedures (+11.9%), opium alkaloids and derivatives (+10.2%), and salt solutions (+10.1%), higher in the everolimus group compared to placebo. None of these imbalances was expected to have influenced the primary efficacy endpoint. Moreless none of the ATC classes of BSC was used at higher frequencies in the placebo group, except e.g. “osmotically active laxative drugs” (15.5 vs. 11.2%) or “other drugs for functional GI disorders” like dimeticone (5.2 vs. 2.4%). For such ATC codes, the percental differences were marginal.
Overall, the study population is considered representing the target population.
• Treatment compliance
Compliance to treatment was recorded in the Drug Accountability Forms. No formal measurement of plasma concentrations for evaluation of treatment compliance was performed.
The MAH clarified in their response to 1st RSI that unintended dose interruptions occurred in 20% of the cases, however, mainly of short duration of median 1 day. Consequently, the impact on the relative dose intensity was low.
Outcomes and estimation Primary efficacy endpoint: PFS based on central radiological review
Results are summarised in the table below.
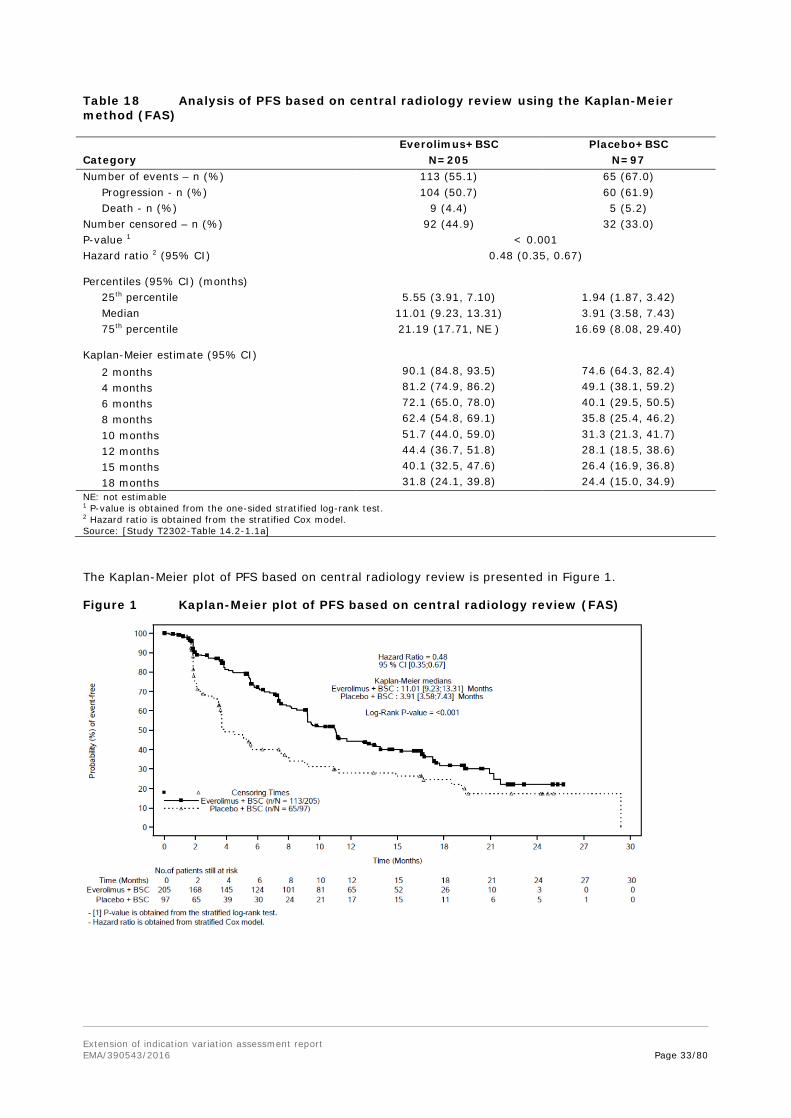
Extension of indication variation assessment report EMA/390543/2016 Page 33/80
Table 18 Analysis of PFS based on central radiology review using the Kaplan-Meier method (FAS)
Everolimus+BSC Placebo+BSC Category N=205 N=97 Number of events – n (%) 113 (55.1) 65 (67.0) Progression - n (%) 104 (50.7) 60 (61.9) Death - n (%) 9 (4.4) 5 (5.2) Number censored – n (%) 92 (44.9) 32 (33.0) P-value 1 < 0.001 Hazard ratio 2 (95% CI)
0.48 (0.35, 0.67)
Percentiles (95% CI) (months) 25th percentile 5.55 (3.91, 7.10) 1.94 (1.87, 3.42) Median 11.01 (9.23, 13.31) 3.91 (3.58, 7.43) 75th percentile
21.19 (17.71, NE ) 16.69 (8.08, 29.40)
Kaplan-Meier estimate (95% CI) 2 months 90.1 (84.8, 93.5) 74.6 (64.3, 82.4) 4 months 81.2 (74.9, 86.2) 49.1 (38.1, 59.2) 6 months 72.1 (65.0, 78.0) 40.1 (29.5, 50.5) 8 months 62.4 (54.8, 69.1) 35.8 (25.4, 46.2) 10 months 51.7 (44.0, 59.0) 31.3 (21.3, 41.7) 12 months 44.4 (36.7, 51.8) 28.1 (18.5, 38.6) 15 months 40.1 (32.5, 47.6) 26.4 (16.9, 36.8) 18 months 31.8 (24.1, 39.8) 24.4 (15.0, 34.9) NE: not estimable 1 P-value is obtained from the one-sided stratified log-rank test. 2 Hazard ratio is obtained from the stratified Cox model. Source: [Study T2302-Table 14.2-1.1a]
The Kaplan-Meier plot of PFS based on central radiology review is presented in Figure 1.
Figure 1 Kaplan-Meier plot of PFS based on central radiology review (FAS)

Extension of indication variation assessment report EMA/390543/2016 Page 34/80
Table 18a Reasons for Censoring, Central review
• Sensitivity analysis
PFS result was confirmed in several sensitivity analyses, subgroup analyses and by the investigator review. The impact of missing scans was assessed using the ‘actual event’ and ‘backdating’ approaches and confirmed the limited impact of missing scans on the overall study results (Table 19).
Table 19 Sensitivity analysis of PFS per central radiology review (FAS)
Median PFS (95% CI) - months Everolimus + BSC Placebo + BSC HR (95% CI) Primary analysis 11.0 (9.2, 13.3) 3.9 (3.6, 7.4) 0.48 (0.35, 0.67) Stratified Cox model (adjusting for baseline covariates)" 11.0 (9.2, 13.3) 3.9 (3.6, 7.4) 0.42 (0.29, 0.60)
Clinical progression sensitivity analysis 1 11.0 (9.2, 13.1) 3.7 (3.6, 5.6) 0.49 (0.35, 0.67)
Central/Investigator combination sensitivity analysis 2 9.5 (8.2, 11.1) 3.7 (3.1, 5.4) 0.45 (0.34, 0.61)
Actual event sensitivity analysis 3 11.0 (9.2, 13.5) 3.9 (3.6, 7.4) 0.48 (0.35, 0.66)
Backdating sensitivity analysis 4 11.0 (9.2, 12.7) 3.7 (3.6, 7.4) 0.49 (0.35, 0.67) 1 ‘Clinical progression' sensitivity analysis includes the event reported on the end of treatment and study discontinuation page even without documented progression; 2 'Central/Investigator combination’ sensitivity analysis uses a conservative combination approach; if there is a PFS event for both source then PFS is defined as min[PFS per central radiology, PFS per Investigator]; If a PFS event is observed in one of the sources, time to this event is taken; If both sources are censored then PFS is defined as min[PFS per central radiology, PFS per Investigator]; 3 'Actual event' analysis includes the event whenever it occurs even after 2 or more missing tumor assessments; 4 'Backdating’ analysis uses the date of the next scheduled assessment for events occurring after 1 or more missing assessments. Source: [Study T2302-Table 14.2-1.2], [Study T2302-Table 14.2-1.4]
• Subgroup analyses of PFS per central radiology assessment
Analysis by stratification factors
Subgroup analyses of PFS by stratification factors known to have prognostic value were consistent with the primary efficacy analysis and demonstrate homogeneity of treatment effect across those subgroups (Figure 2).
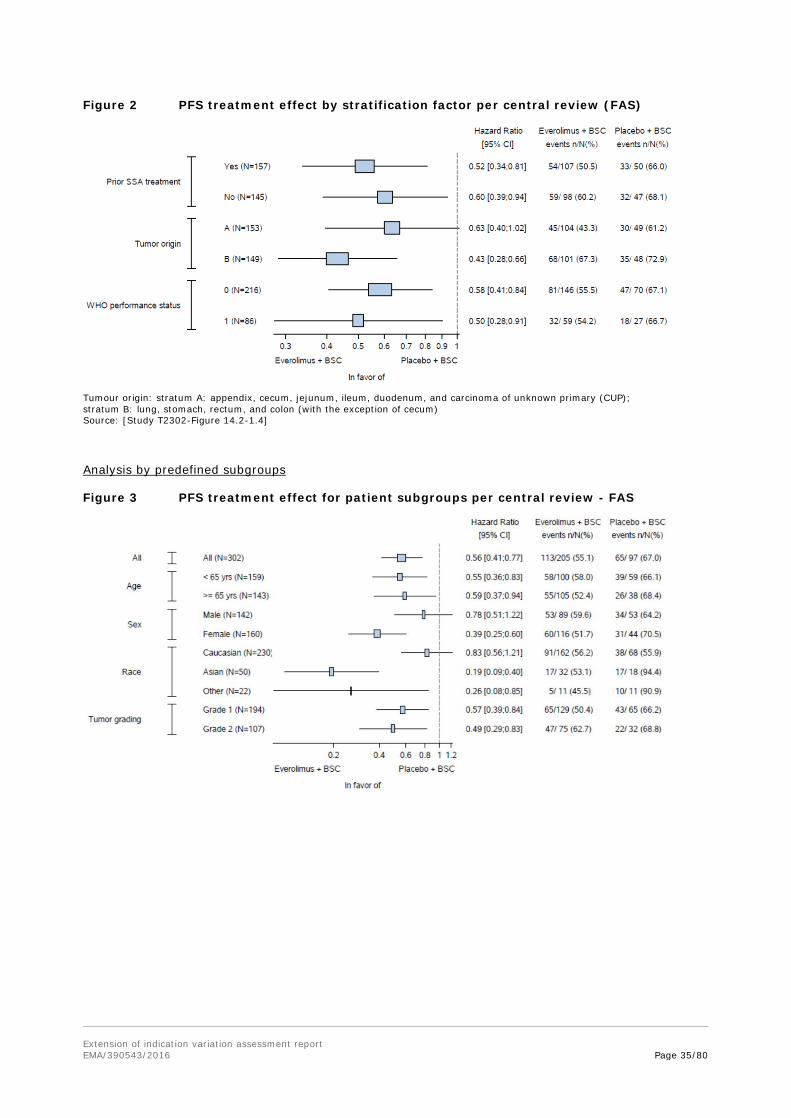
Extension of indication variation assessment report EMA/390543/2016 Page 35/80
Figure 2 PFS treatment effect by stratification factor per central review (FAS)
Tumour origin: stratum A: appendix, cecum, jejunum, ileum, duodenum, and carcinoma of unknown primary (CUP); stratum B: lung, stomach, rectum, and colon (with the exception of cecum) Source: [Study T2302-Figure 14.2-1.4]
Analysis by predefined subgroups
Figure 3 PFS treatment effect for patient subgroups per central review - FAS
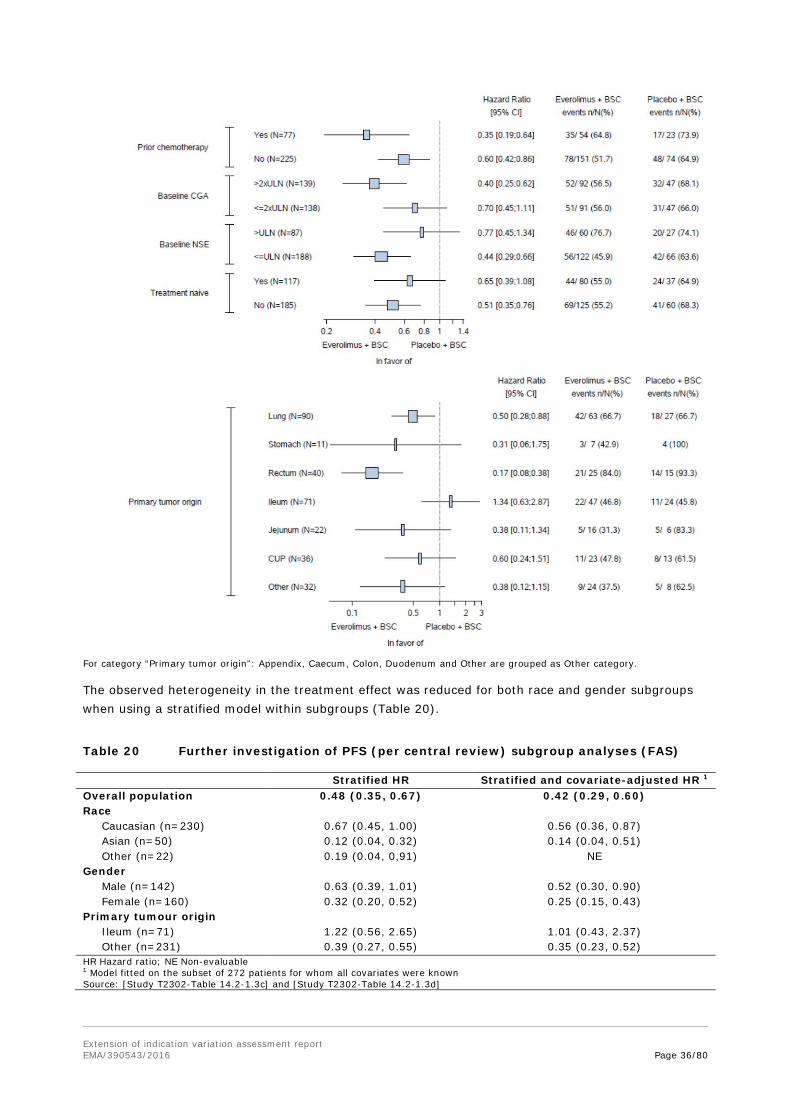
Extension of indication variation assessment report EMA/390543/2016 Page 36/80
For category “Primary tumor origin”: Appendix, Caecum, Colon, Duodenum and Other are grouped as Other category.
The observed heterogeneity in the treatment effect was reduced for both race and gender subgroups when using a stratified model within subgroups (Table 20).
Table 20 Further investigation of PFS (per central review) subgroup analyses (FAS)
Stratified HR Stratified and covariate-adjusted HR 1 Overall population 0.48 (0.35, 0.67) 0.42 (0.29, 0.60) Race Caucasian (n=230) 0.67 (0.45, 1.00) 0.56 (0.36, 0.87) Asian (n=50) 0.12 (0.04, 0.32) 0.14 (0.04, 0.51) Other (n=22) 0.19 (0.04, 0,91) NE Gender Male (n=142) 0.63 (0.39, 1.01) 0.52 (0.30, 0.90) Female (n=160) 0.32 (0.20, 0.52) 0.25 (0.15, 0.43) Primary tumour origin Ileum (n=71) 1.22 (0.56, 2.65) 1.01 (0.43, 2.37) Other (n=231) 0.39 (0.27, 0.55) 0.35 (0.23, 0.52) HR Hazard ratio; NE Non-evaluable 1 Model fitted on the subset of 272 patients for whom all covariates were known Source: [Study T2302-Table 14.2-1.3c] and [Study T2302-Table 14.2-1.3d]

Extension of indication variation assessment report EMA/390543/2016 Page 37/80
Stratified HR refers to adjustment for the stratification factors used in the trial (WHO PS, primary tumour location, prior use of SSA).
These adjustments resulted in surprisingly large changes: Caucasians (HR 0.83 to 0.56) and males (HR 0.78 to 0.52).
Even after adjustment for covariates and stratification factors, PFS remained above 1 (1.34 to 1.01) for the ileum subgroup.
In Table 21 median PFS results for the subgroups are summarized.
Table 21 Summary of PFS per central radiology by baseline characteristics and treatment (FAS) Everolimus+BSC Placebo+BSC Category N=205
(months; 95% CI) N=97
(months; 95% CI) Full population 11.01 (9.23, 13.31) 3.91 (3.58, 7.43) Prior SSA=Yes 11.1 (9.2,13.9) 4.5 (3.6,7.9) Prior SSA=No 9.5 (8.2,16.6) 3.7 (2.6,8.1) Tumour origin=A 16.6 (11.2,17.7) 7.5 (3.7,16.7) Tumour origin=B 9.2 (7.1,9.5) 3.5 (1.9,3.7) WHO performance status= 0 11.1 (9.2,13.9) 5.4 (3.6,8.1) WHO performance status= 1 9.2 (6.1,16.6) 3.7 (2.0,5.6) Gender=Male 9.2 (6.4,11.1) 5.1 (3.4,11.2) Gender=Female 13.6 (9.2,17.3) 3.7 (3.1,7.9) Age <65 11.1 (9.2,16.6) 3.7 (3.5,5.6) Age ≥65 9.9 (7.6,15.2) 5.6 (2.1,11.2) Race=Asian 11.1 (7.3,NE) 3.1 (1.8,3.7) Race=Caucasian 11.0 (9.2,13.3) 8.1 (3.7,16.7) Race=Other 10.9 (1.9,NE) 3.7 (1.9,5.1) Ethnicity=Chinese 11.6 (3.8,NE) 1.9 (1.7,19.4) Ethnicity=Hispanic/Latino 11.0 (7.2,20.9) 14.9 (2.1,NE) Ethnicity=Japanese 19.4 (11.1,NE) 4.6 (3.6,7.5) Ethnicity=Other 9.5 (9.2,12.7) 3.9 (3.5,7.4) Tumour grade=Grade 1 11.2 (9.2,17.3) 5.1 (3.5,9.3) Tumour grade=Grade 2 9.2 (7.6,11.7) 3.7 (3.1,5.6) Primary tumour origin=CUP 13.6 (4.1,NE) 7.5 (1.9,18.5) Primary tumour origin=Ileum 16.6 (9.2,17.7) 16.7 (7.4,29.4) Primary tumour origin=Jejunum 17.3 (3.5,NE) 4.5 (3.6,NE) Primary tumour origin=Lung 9.2 (6.8,10.9) 3.6 (1.9,5.1) Primary tumour origin=Rectum 7.4 (5.5,11.1) 1.9 (1.7,3.6) Primary tumour origin=Stomach 9.4 (1.2,NE) 2.0 (1.7,3.5) Primary tumour origin=Other NE (7.4,NE) 10.9 (2.3,19.1) Treatment naive=Yes 11.0 (9.2,17.3) 5.6 (3.5,14.9) Treatment naive=No 11.0 (7.6,13.1) 3.7 (2.4,5.6) Prior chemotherapy=Yes 9.2 (5.6,11.7) 2.1 (1.9,3.7) Prior chemotherapy=No 11.2 (9.2,16.6) 5.4 (3.7,9.0) Baseline CgA > 2xULN 11.0 (8.2,15.2) 3.7 (3.1,5.1) Baseline CgA ≤ 2xULN 9.2 (7.6,16.6) 7.5 (3.5,11.2) Baseline NSE > ULN 5.8 (4.4,8.5) 3.6 (2.4,4.5) Baseline NSE ≤ ULN 16.6 (11.1,20.9) 5.6 (3.7,9.3) Treatment naïve is defined as no Prior somatostatin analog for at least 12 weeks (as per CRF) and no prior chemotherapy Primary tumour origin category: Appendix, Caecum, Colon, Duodenum and Other are grouped as Other category.
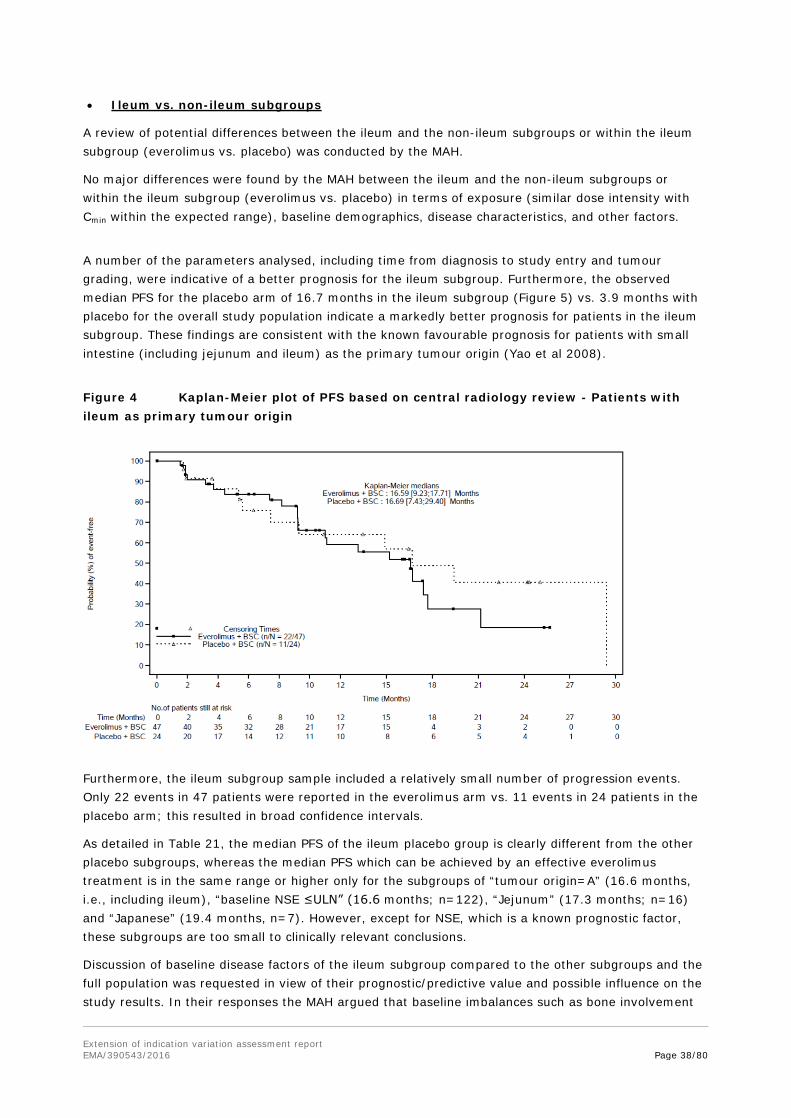
Extension of indication variation assessment report EMA/390543/2016 Page 38/80
• Ileum vs. non-ileum subgroups
A review of potential differences between the ileum and the non-ileum subgroups or within the ileum subgroup (everolimus vs. placebo) was conducted by the MAH.
No major differences were found by the MAH between the ileum and the non-ileum subgroups or within the ileum subgroup (everolimus vs. placebo) in terms of exposure (similar dose intensity with Cmin within the expected range), baseline demographics, disease characteristics, and other factors.
A number of the parameters analysed, including time from diagnosis to study entry and tumour grading, were indicative of a better prognosis for the ileum subgroup. Furthermore, the observed median PFS for the placebo arm of 16.7 months in the ileum subgroup (Figure 5) vs. 3.9 months with placebo for the overall study population indicate a markedly better prognosis for patients in the ileum subgroup. These findings are consistent with the known favourable prognosis for patients with small intestine (including jejunum and ileum) as the primary tumour origin (Yao et al 2008).
Figure 4 Kaplan-Meier plot of PFS based on central radiology review - Patients with ileum as primary tumour origin
Furthermore, the ileum subgroup sample included a relatively small number of progression events. Only 22 events in 47 patients were reported in the everolimus arm vs. 11 events in 24 patients in the placebo arm; this resulted in broad confidence intervals.
As detailed in Table 21, the median PFS of the ileum placebo group is clearly different from the other placebo subgroups, whereas the median PFS which can be achieved by an effective everolimus treatment is in the same range or higher only for the subgroups of “tumour origin=A” (16.6 months, i.e., including ileum), “baseline NSE ≤ULN” (16.6 months; n=122), “Jejunum” (17.3 months; n=16) and “Japanese” (19.4 months, n=7). However, except for NSE, which is a known prognostic factor, these subgroups are too small to clinically relevant conclusions.
Discussion of baseline disease factors of the ileum subgroup compared to the other subgroups and the full population was requested in view of their prognostic/predictive value and possible influence on the study results. In their responses the MAH argued that baseline imbalances such as bone involvement

Extension of indication variation assessment report EMA/390543/2016 Page 39/80
could have contributed to the PFS differences. Exploratory analyses supported that patients with bone involvement at baseline, i.e., the patients with more aggressive disease, benefit more from everolimus treatment than those without. However, in contrast to non-ileum patients (HR 0.37; 95%CI 0.26-0.53), for ileal NET patients this was not statistically significant HR 1.34 (95%CI 0.63-2.87).
PFS subgroup analyses for baseline NSE levels or tumour grading according to Ki-67/mitotic index were also inconclusive for the ileum subgroup. However, applying a threshold of >/≤ ULN for baseline CgA a point estimate for the HR of 2.90 (95%CI 0.5-16.9) for the stratified analysis was obtained for normal CgA levels at baseline. From a clinical point of view, this HR in NET patients with primary tumours of ileal origin with a normal baseline CgA together with clinical factors is regarded a sufficient base to recommend careful consideration before treating such patients with everolimus.
The tumour subgroup of “Other” included different entities which also had higher PFS results than the FAS.
A second subgroup of patients, with Hispanic/Latino ethnicity (17 and 8 patients; both ~8%), also showed a longer PFS under placebo (14.9 months) than under everolimus (11.0 months) treatment.
Key secondary efficacy endpoint: Overall Survival
As the primary endpoint of the study was statistically significant, the key secondary endpoint of OS was formally tested with an interim OS analysis performed with a total of 70 deaths (37% information fraction of the total targeted 191 deaths for final OS analysis). At this interim analysis the difference in OS was not statistically significant (stratified log-rank test p=0.037, one-sided) (Table 22) as the p-value threshold to claim significance for OS at this interim analysis was 0.000213. From the HR, for OS a 36% risk reduction was estimated.
Results were consistent in the unstratified analysis of OS; the HR was 0.66 (95% CI: 0.41, 1.06)
Table 22 Analysis of overall survival using Kaplan-Meier method (FAS)
Everolimus+BSC Placebo+BSC Category N=205 N=97 Number of events – n (%) 42 (20.5) 28 (28.9) Number censored – n (%) 163 (79.5) 69 (71.1) P-value 1 0.037 Hazard ratio 2 (95% CI) 0.64 (0.40, 1.05) Percentiles (95% CI) (months) 25th percentile 23.66 (17.61; 27.27) 16.46 (9.00; 20.96) Median 27.27 (27.27; NE) NE (22.18; NE) 75th percentile NE (27.27; NE) NE Kaplan-Meier estimate (95% CI) 3 months 98.0 (94.7; 99.2) 97.9 (91.9; 99.5) 6 months 94.9 (90.6; 97.2) 90.3 (82.2; 94.8) 9 months 92.7 (88.0; 95.6) 84.6 (75.3; 90.6) 12 months 88.8 (83.4; 92.6) 82.2 (72.6; 88.7) 15 months 84.3 (78.1; 88.8) 77.2 (66.9; 84.7) 18 months 80.6 (73.8; 85.8) 72.8 (61.7; 81.1) NE: Not estimable
1 P-value is obtained from the one-sided stratified log-rank test. 2 Hazard ratio is obtained from the stratified Cox model. Source: [Study T2302-Table 14.2-2.1a]
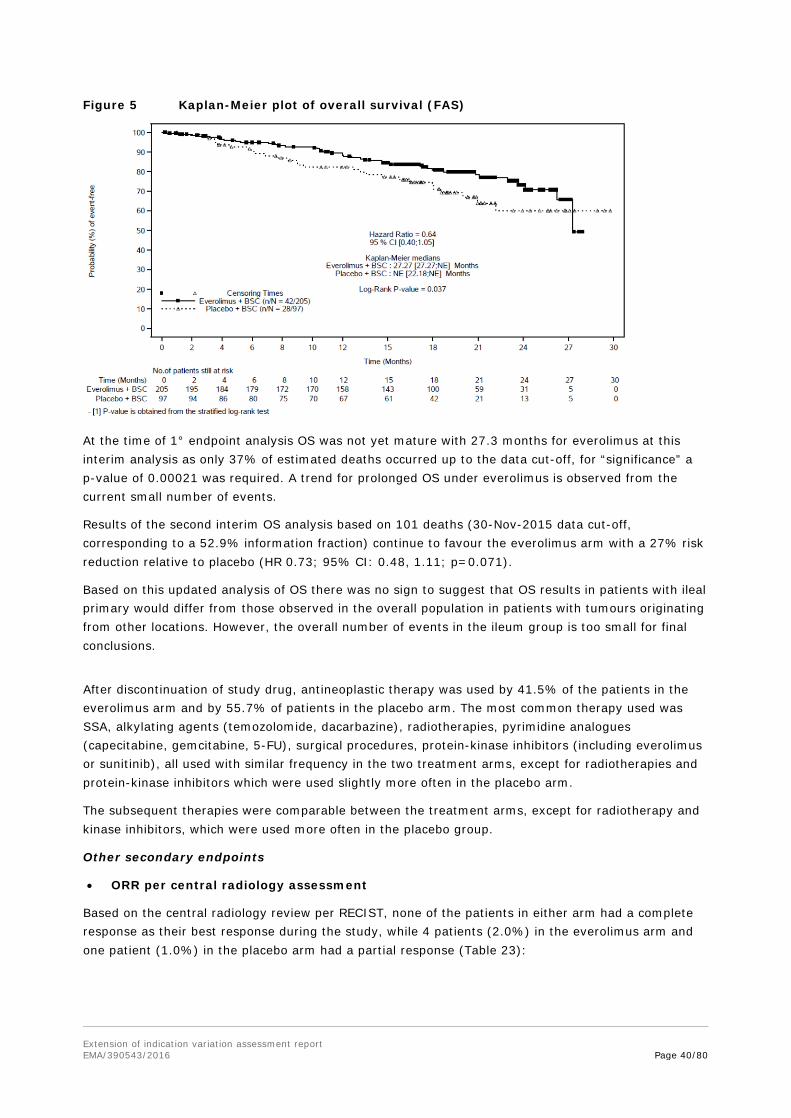
Extension of indication variation assessment report EMA/390543/2016 Page 40/80
Figure 5 Kaplan-Meier plot of overall survival (FAS)
At the time of 1° endpoint analysis OS was not yet mature with 27.3 months for everolimus at this interim analysis as only 37% of estimated deaths occurred up to the data cut-off, for “significance” a p-value of 0.00021 was required. A trend for prolonged OS under everolimus is observed from the current small number of events.
Results of the second interim OS analysis based on 101 deaths (30-Nov-2015 data cut-off, corresponding to a 52.9% information fraction) continue to favour the everolimus arm with a 27% risk reduction relative to placebo (HR 0.73; 95% CI: 0.48, 1.11; p=0.071).
Based on this updated analysis of OS there was no sign to suggest that OS results in patients with ileal primary would differ from those observed in the overall population in patients with tumours originating from other locations. However, the overall number of events in the ileum group is too small for final conclusions.
After discontinuation of study drug, antineoplastic therapy was used by 41.5% of the patients in the everolimus arm and by 55.7% of patients in the placebo arm. The most common therapy used was SSA, alkylating agents (temozolomide, dacarbazine), radiotherapies, pyrimidine analogues (capecitabine, gemcitabine, 5-FU), surgical procedures, protein-kinase inhibitors (including everolimus or sunitinib), all used with similar frequency in the two treatment arms, except for radiotherapies and protein-kinase inhibitors which were used slightly more often in the placebo arm.
The subsequent therapies were comparable between the treatment arms, except for radiotherapy and kinase inhibitors, which were used more often in the placebo group.
Other secondary endpoints
• ORR per central radiology assessment
Based on the central radiology review per RECIST, none of the patients in either arm had a complete response as their best response during the study, while 4 patients (2.0%) in the everolimus arm and one patient (1.0%) in the placebo arm had a partial response (Table 23):

Extension of indication variation assessment report EMA/390543/2016 Page 41/80
Table 23 Best overall response as per central radiology (FAS)
Everolimus+BSC Placebo+BSC
N=205 n (%)
N=97 n (%)
Best overall response Complete response (CR) 0 0 Partial response (PR) 4 (2.0) 1 (1.0) Stable disease (SD) 165 (80.5) 62 (63.9) Progressive disease (PD) 19 (9.3) 26 (26.8) Unknown (UNK) 17 (8.3) 8 (8.2) Response analysis Overall response rate ORR (CR or PR) 4 (2.0) 1 (1.0) 95% CI for ORR 1 (0.5; 4.9) (0.0; 5.6) Disease control rate DCR (CR or PR or SD) 169 (82.4) 63 (64.9) 95% CI for DCR (76.5; 87.4) (54.6; 74.4) 1 The 95% CI for the frequency distribution of each variable were computed using exact binomial method. Source: [Study T2302-Table 14.2-3.1a]
Results from the corresponding waterfall plot as per central radiology review showed that 63.6% of patients in the everolimus arm experienced any degree of tumour shrinkage versus 25.9% in the placebo arm (Figure 7), although the extent of this shrinkage in most cases was less than the magnitude required for an objective response of PR or CR per RECIST.
Figure 6 Best percentage change from baseline in sum of longest diameters based on central radiology review (FAS)
• Health-related quality of life
The mean changes from baseline of Functional Assessment of Cancer Therapy: General (FACT-G) total score/subscales were similar in both arms and never exceeded the threshold of 7 points, defined as the minimal clinically important difference between treatment arms. From the HR of 0.81, no significant differences were observed in the time to definitive deterioration of the FACT-G total score. This was further confirmed by longitudinal modelling with similar trends for the physical, social/family, emotional, and functional domain scores.
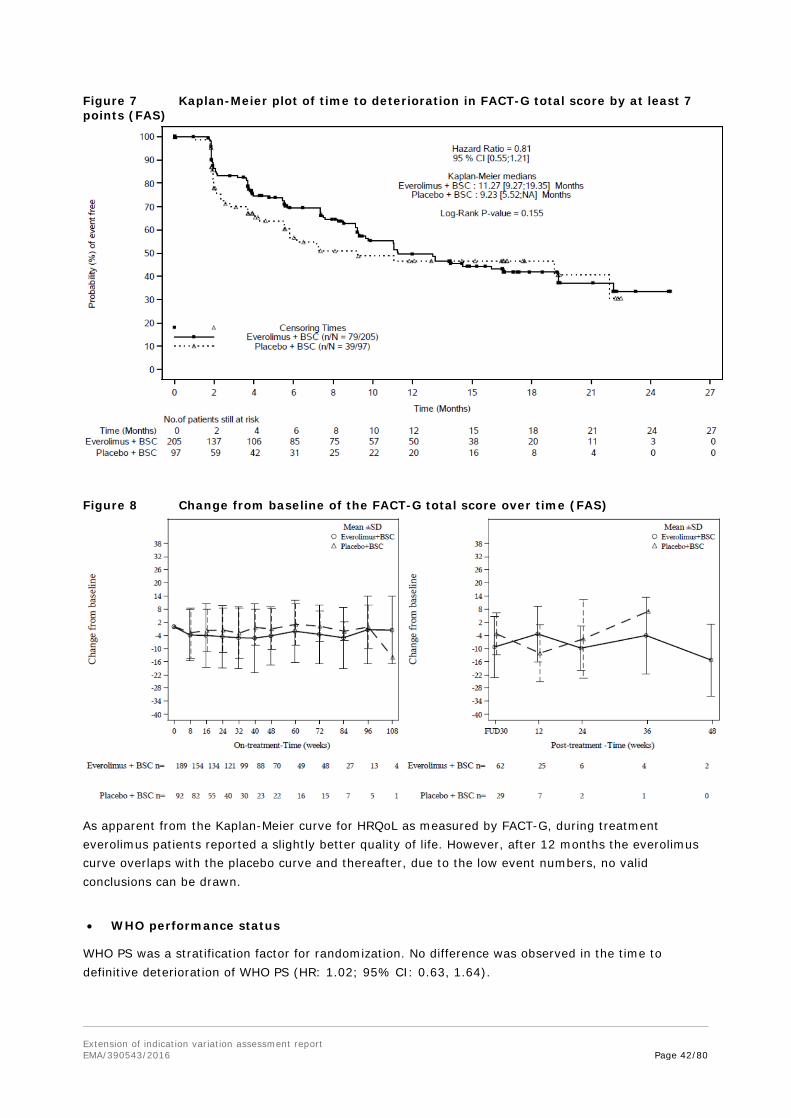
Extension of indication variation assessment report EMA/390543/2016 Page 42/80
Figure 7 Kaplan-Meier plot of time to deterioration in FACT-G total score by at least 7 points (FAS)
Figure 8 Change from baseline of the FACT-G total score over time (FAS)
As apparent from the Kaplan-Meier curve for HRQoL as measured by FACT-G, during treatment everolimus patients reported a slightly better quality of life. However, after 12 months the everolimus curve overlaps with the placebo curve and thereafter, due to the low event numbers, no valid conclusions can be drawn.
• WHO performance status
WHO PS was a stratification factor for randomization. No difference was observed in the time to definitive deterioration of WHO PS (HR: 1.02; 95% CI: 0.63, 1.64).
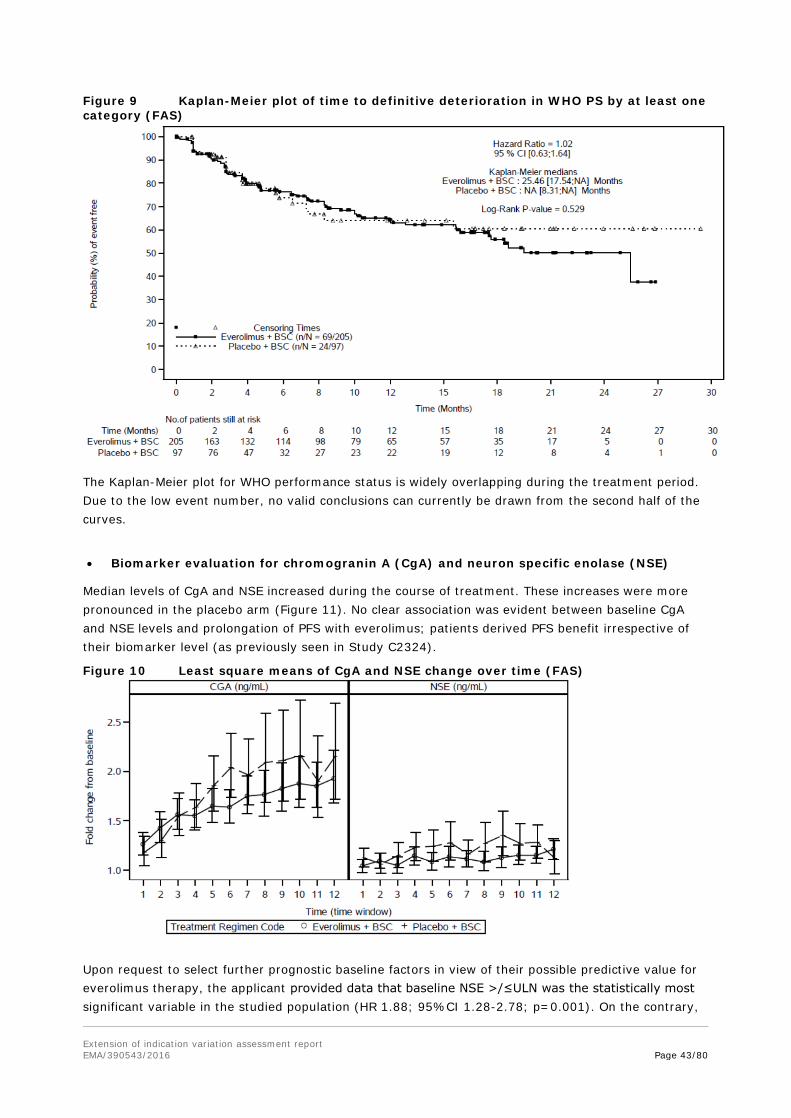
Extension of indication variation assessment report EMA/390543/2016 Page 43/80
Figure 9 Kaplan-Meier plot of time to definitive deterioration in WHO PS by at least one category (FAS)
The Kaplan-Meier plot for WHO performance status is widely overlapping during the treatment period. Due to the low event number, no valid conclusions can currently be drawn from the second half of the curves.
• Biomarker evaluation for chromogranin A (CgA) and neuron specific enolase (NSE)
Median levels of CgA and NSE increased during the course of treatment. These increases were more pronounced in the placebo arm (Figure 11). No clear association was evident between baseline CgA and NSE levels and prolongation of PFS with everolimus; patients derived PFS benefit irrespective of their biomarker level (as previously seen in Study C2324).
Figure 10 Least square means of CgA and NSE change over time (FAS)
Upon request to select further prognostic baseline factors in view of their possible predictive value for everolimus therapy, the applicant provided data that baseline NSE >/≤ULN was the statistically most significant variable in the studied population (HR 1.88; 95%CI 1.28-2.78; p=0.001). On the contrary,
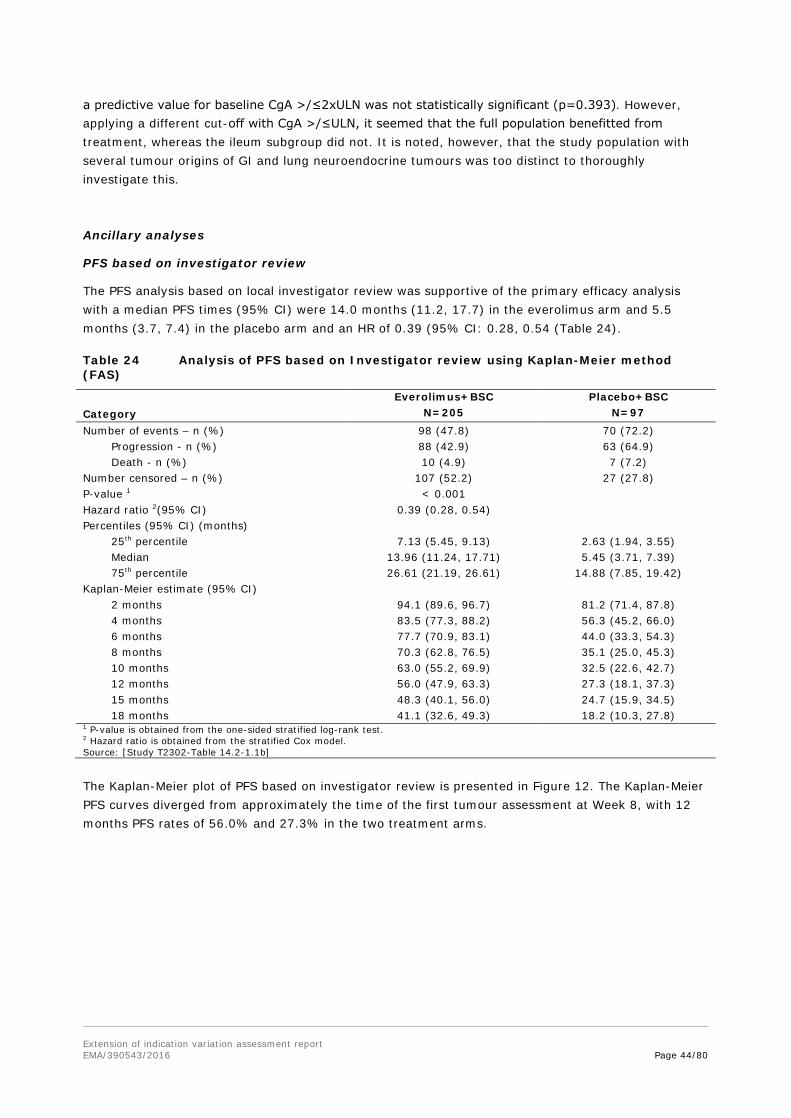
Extension of indication variation assessment report EMA/390543/2016 Page 44/80
a predictive value for baseline CgA >/≤2xULN was not statistically significant (p=0.393). However, applying a different cut-off with CgA >/≤ULN, it seemed that the full population benefitted from treatment, whereas the ileum subgroup did not. It is noted, however, that the study population with several tumour origins of GI and lung neuroendocrine tumours was too distinct to thoroughly investigate this.
Ancillary analyses
PFS based on investigator review
The PFS analysis based on local investigator review was supportive of the primary efficacy analysis with a median PFS times (95% CI) were 14.0 months (11.2, 17.7) in the everolimus arm and 5.5 months (3.7, 7.4) in the placebo arm and an HR of 0.39 (95% CI: 0.28, 0.54 (Table 24).
Table 24 Analysis of PFS based on Investigator review using Kaplan-Meier method (FAS)
Everolimus+BSC Placebo+BSC Category N=205 N=97 Number of events – n (%) 98 (47.8) 70 (72.2) Progression - n (%) 88 (42.9) 63 (64.9) Death - n (%) 10 (4.9) 7 (7.2) Number censored – n (%) 107 (52.2) 27 (27.8) P-value 1 < 0.001 Hazard ratio 2(95% CI) 0.39 (0.28, 0.54) Percentiles (95% CI) (months) 25th percentile 7.13 (5.45, 9.13) 2.63 (1.94, 3.55) Median 13.96 (11.24, 17.71) 5.45 (3.71, 7.39) 75th percentile 26.61 (21.19, 26.61) 14.88 (7.85, 19.42) Kaplan-Meier estimate (95% CI) 2 months 94.1 (89.6, 96.7) 81.2 (71.4, 87.8) 4 months 83.5 (77.3, 88.2) 56.3 (45.2, 66.0) 6 months 77.7 (70.9, 83.1) 44.0 (33.3, 54.3) 8 months 70.3 (62.8, 76.5) 35.1 (25.0, 45.3) 10 months 63.0 (55.2, 69.9) 32.5 (22.6, 42.7) 12 months 56.0 (47.9, 63.3) 27.3 (18.1, 37.3) 15 months 48.3 (40.1, 56.0) 24.7 (15.9, 34.5) 18 months 41.1 (32.6, 49.3) 18.2 (10.3, 27.8) 1 P-value is obtained from the one-sided stratified log-rank test. 2 Hazard ratio is obtained from the stratified Cox model. Source: [Study T2302-Table 14.2-1.1b]
The Kaplan-Meier plot of PFS based on investigator review is presented in Figure 12. The Kaplan-Meier PFS curves diverged from approximately the time of the first tumour assessment at Week 8, with 12 months PFS rates of 56.0% and 27.3% in the two treatment arms.
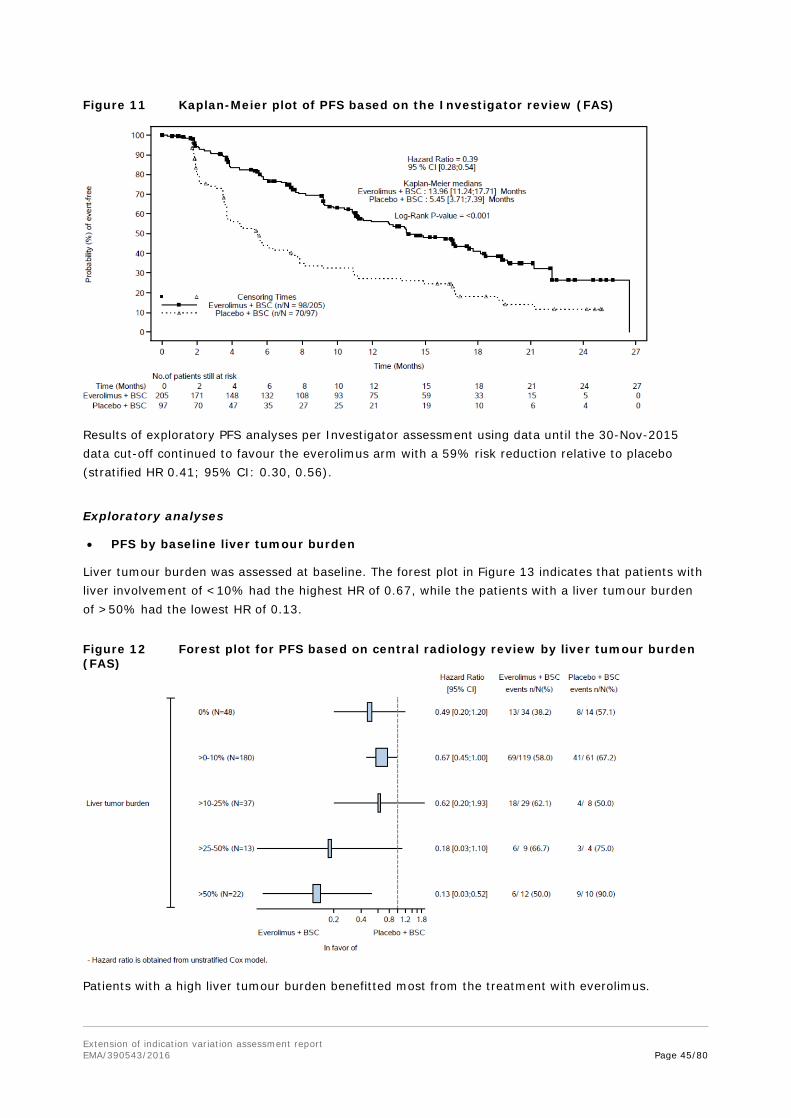
Extension of indication variation assessment report EMA/390543/2016 Page 45/80
Figure 11 Kaplan-Meier plot of PFS based on the Investigator review (FAS)
Results of exploratory PFS analyses per Investigator assessment using data until the 30-Nov-2015 data cut-off continued to favour the everolimus arm with a 59% risk reduction relative to placebo (stratified HR 0.41; 95% CI: 0.30, 0.56).
Exploratory analyses
• PFS by baseline liver tumour burden
Liver tumour burden was assessed at baseline. The forest plot in Figure 13 indicates that patients with liver involvement of <10% had the highest HR of 0.67, while the patients with a liver tumour burden of >50% had the lowest HR of 0.13.
Figure 12 Forest plot for PFS based on central radiology review by liver tumour burden (FAS)
Patients with a high liver tumour burden benefitted most from the treatment with everolimus.
Extension of indication variation assessment report EMA/390543/2016 Page 46/80
• Change in functional status (carcinoid syndrome) of the tumour
A comparable percentage of patients in both treatment arms (5 and 7%) experienced a change of functional status under treatment (days 22 - 679) with symptoms of diarrhoea, flushing and others, which necessitated medical intervention including SSA.
Summary of main study
The following table summarise the efficacy results from the main studies supporting the present application. These summaries should be read in conjunction with the discussion on clinical efficacy as well as the benefit risk assessment (see later sections).

Extension of indication variation assessment report EMA/390543/2016 Page 47/80
Table 25 Summary of Efficacy for trial CRAD001T2302
Title: A randomized, double-blind, multicenter, phase III study of everolimus (RAD001) plus best supportive care versus placebo plus best supportive care in the treatment of patients with advanced NET of GI or lung origin - RADIANT-4 Study identifier CRAD001T2302 Design randomized, double-blind, multicentre, phase III
Duration of main phase: 03 April 2012 - 28 Nov 2014 (data cut-off date; study ongoing)
Duration of Run-in phase: not applicable Duration of Extension phase: not applicable
Hypothesis Superiority Treatments groups
Everolimus + BSC Everolimus 10 mg/d + best supportive care (205 patients)
Placebo + BSC Placebo + best supportive care (97 patients) Endpoints and definitions
Primary endpoint
PFS based on central radiological review (modified RECIST 1.0)
Secondary endpoints
key secondary endpoint: OS secondary endpoints: ORR and DCR (modified RECIST 1.0); HRQoL based on FACT-G; changes in chromogranin A and neuron specific enolase levels; time to deterioration of WHO performance status; exposure at steady state pre-dose concentration; safety and tolerability
Database lock cut-off date: 28 Nov 2014 (study ongoing)
Results and Analysis
Analysis description Primary Analysis Analysis population and time point description
Full Analysis Set (FAS)
Descriptive statistics and estimate variability
Treatment group Everolimus+BSC
Placebo+BSC
Number of subject 205 97 PFS (median; months) 11.0 3.9
95% CI 9.2 - 13.3 3.6 - 7.4 OS (number of events) 42 (20.5%) 28 (28.9%)
(number censored) 163 (79.5 %) 69 (71.1 %) ORR (CR or PR) (n) 4 (2.0%) 1 (1.0%)
95% CI 0.5; 4.9 0.0; 5.6 DCR (CR, PR or SD) (n) 169 (82.4 %) 63(64.9 %)
95% CI 76.5; 87.4 54.6; 74.4 Effect estimate per comparison
Primary endpoint: PFS
Comparison groups everolimus vs. placebo
Hazard ratio 0.48 95% CI 0.35 - 0.67 P-value < 0.001
key secondary endpoint: OS
Comparison groups everolimus vs. placebo
hazard ratio 0.64 95% CI 0.40, 1.05 P-value 0.037 (not significant)
Notes As the primary endpoint of the study was statistically significant, the key secondary endpoint of OS was formally tested with an interim OS analysis performed with a total of 70 deaths (37% information fraction of the total targeted 191 deaths for final OS analysis). At this interim analysis the difference in OS was not statistically significant (stratified log-rank test p=0.037, one-sided) as the p-value threshold to claim significance for OS at this interim analysis was 0.000213.
2.4.2. Discussion on clinical efficacy
Design and conduct of clinical studies Between April 2012 and August 2013 a total of 97 study sites worldwide randomised 302 patients in a 2:1 manner, stratified by prior treatment with somatostatin analogues, WHO performance status and

Extension of indication variation assessment report EMA/390543/2016 Page 48/80
tumour origin.
The study population with gastrointestinal or lung neuroendocrine tumours was included based on in- and exclusion criteria which defined the target population in satisfactory detail. The inclusion and exclusion criteria defined a population of pathologically (i.e. histologically confirmed) well-differentiated (G1 or G2), advanced (unresectable or metastatic), neuroendocrine tumours of GI or lung origin without a history and no active symptoms of carcinoid syndrome. The in- and exclusion criteria also distinguished the study population satisfactorily from the previously studied populations with everolimus in study C2325 who had a carcinoid syndrome, and in C2324 who selected patients with pancreatic NET only. Importantly, current progress at baseline had to be confirmed radiologically. For this population with grade 1 and 2 well-differentiated NETs a WHO performance status of ≤1 is reasonable. Prior treatment including hepatic intra-arterial embolization had to be stopped sufficient time prior to randomisation. No more than 1 line of chemotherapy was allowed in advance. In summary, the inclusion and exclusion criteria seem adequate.
No cross-over was allowed prior to the analysis of the primary endpoint. Of note, only 7 patients switched to everolimus after the primary analysis (data not shown).
The primary endpoint was progression free survival of everolimus plus best supportive care vs. placebo plus best supportive care, as assessed by central radiological review. This real time central review for the primary endpoint is highly endorsed as it provides a higher degree of standardisation and comparability of the results. Overall survival was the key secondary endpoint and investigator assessed PFS was a supportive analysis. PFS as the primary endpoint was accepted by CHMP for other applications in similar study populations previously and is hence accepted provided no detrimental effect on overall survival is evident. The study specific modifications of the RECIST criteria to assess tumour progression are considered reasonable. OS as the key secondary endpoint is endorsed.
Regarding the randomisation of patients, the stratification led to fully balanced treatment arms with regard to prior SSA treatment, tumour origins and WHO PS. Stratification for SSA pre-treatment and performance status is considered adequate. For tumour origin, the strata were planned based on their estimated aggressiveness, i.e. stratum A comprised tumours of origins appendix, caecum, jejunum, ileum, duodenum and cancer of unknown primary (CUP), stratum B those of lung, stomach, rectum, and colon except caecum. Stratum B was hence considered the treatment arm with worse prognoses.
The study was placebo-controlled and double-blind and no blind was broken during the treatment period.
Overall the statistical methods are considered appropriate.
Overall, the study design and conduct is considered adequate, with a limited amount of missing data and few major deviations from the study protocol. There is a concern, however, about the rather high percentage (about 16%) of patients lost to follow-up in the OS analysis.
Efficacy data and additional analyses The result of the primary analysis was statistically significant with median PFS of 11.01 months with everolimus vs. 3.91 months with placebo and a HR of 0.48 (95% CI 0.35;0,67). This PFS result was confirmed in several sensitivity analyses, subgroup analyses and by the investigator review.
It was noted by the CHMP that the consistency with PFS by IRC review is reassuring. Absolute median PFS by investigator was longer than after IRC review in both arms (for everolimus almost 3 months). This can be explained by the higher number of censored observations compared to the IRC review.
Multiple additional pre-planned sensitivity analyses of PFS demonstrated that the observed benefit was
Extension of indication variation assessment report EMA/390543/2016 Page 49/80
robust and consistent with the primary analysis. The CHMP noted that the pre-planned sensitivity analysis confirmed the primary endpoint. Although, there appears to be some heterogeneity in PFS data so, that the outcome seems less favourable in Caucasians, males and in case of ileal primary tumour. This seems to be indicative of an imbalance in stratification factors. According to the MAH, the covariates used in the stratified and covariate adjusted analysis were predefined. However, it should be noted that all of the HRs presented for these subgroup analyses were unstratified and unadjusted for any covariates. After adjustment for the stratification factors used at baseline and predefined covariates there was a surprisingly large change: Caucasians (HR 0.83 to 0.56) and males (HR 0.78 to 0.52) and ileal origin (1.34 to 1.01) whilst the overall HR remained reasonably stable (0.56 to 0.42). It is acknowledged and reassuring that after adjustment the benefit for Caucasians and male patients also became significant, even if not as pronounced as for other races and females.
From the results of subgroup analyses for the primary endpoint PFS a major objection was raised: patients with ileum as primary tumour origin and who comprised almost a quarter of the total study population, did not show any beneficial effect and gain in PFS with everolimus; rather, the median PFS with everolimus was slightly lower with 16.6 months vs. 16.7 months under placebo. As obvious from the almost 13 month longer PFS in the placebo group compared to the total placebo group, in the ileum subgroup, patients with less unfavourable disease characteristics and hence an overall better prognosis were included. The Kaplan-Meier curves crossed at about 1 year and the everolimus patients performed worse thereafter. This was considered a random finding by the applicant.
Notably, also the patients with ileum originated NETs studied here were patients with often resected primary and mainly metastatic disease, for whom currently no treatment is approved after failure of SSAs. Hence, while the treating oncologist will always make an individual benefit-risk assessment, this could be demanding especially in a patient who has a relatively favourable prognostic baseline status. Then the oncologist should be aided by sufficiently detailed information in the SmPC.
Tthere were three patients in the ileum group out of 4 patients in total who showed a partial response and this confirmed an effect of everolimus in ileal NETs, however it remained unclear which ileal NET patients could benefit from treatment.
The activity of everolimus is clearly lower as estimated by hazard ratios in patients with tumour of good prognosis. This has some biological plausibility and was repeatedly shown. Therefore it was proposed that “prognosis” should be the main issue for discussion, not the anatomical site of the tumour. Obviously site of tumour could be a prognostic factor per se, but within anatomical sites there is a high likelihood of heterogeneity. The CHMP concurred, that as to the currently available study data a lower efficacy of everolimus is especially manifested in the ileum subgroup, which is known to have a better prognosis than tumours of other NET origins. To elucidate this further, the MAH was requested to analyse prognostic factors.
A review of potential differences between the ileum and the non-ileum subgroups or within the ileum subgroup (everolimus vs. placebo) was conducted
Looking at the results from a clinical point of view, in contrast to the full population, in the ileum subgroup patients without bone involvement did not benefit as much from everolimus treatment as those with. But even more careful consideration should oncologists apply before starting treatment in ileum patients with normal CgA levels at baseline.
Therefore, the additional information for section 5.1 pf the SmPC was endorsed, supplemented by further details about good prognostic factors in section 4.4.
Extension of indication variation assessment report EMA/390543/2016 Page 50/80
2.4.3. Conclusions on the clinical efficacy
The major objection concerning efficacy of everolimus in patients with NET of ileal origin was sufficiently resolved. With the MAH’s proposed inclusion of information about subgroup PFS results in SmPC section 5.1 and further revision of the SmPC as commented by the CHMP, the conclusion on efficacy is now positive.
The CHMP recommended that the submission of mature OS data of RADIANT-4 study, in particular the primary ileum location should be submitted post approval.
2.5. Clinical safety
Introduction
Everolimus is currently approved in 3 oncology indications under the trade name Afinitor. Very common metabolic side effects reported with mTOR inhibitors result from inhibitory effects on mTOR-regulated lipid and glucose pathways, while infections result from the immunosuppressive properties of these agents. Non-infectious pneumonitis is a recognized side effect of rapamycin and its derivatives, and represents one of the most important clinical issues seen with everolimus therapy; in result, consensus treatment recommendations have been published for the management of mTOR inhibitor-associated non-infectious pneumonitis.
Additional known risks with everolimus therapy that require close monitoring and evaluation include: severe infections, hypersensitivity (anaphylactic reactions), stomatitis, wound healing complications, increased creatinine/proteinuria/renal failure, hyperglycaemia/new onset diabetes mellitus, dyslipidaemia, hypophosphatemia, cardiac failure, cytopenia, haemorrhage, thrombotic and embolic events, female fertility (including secondary amenorrhea), pre-existing infections (reactivation, aggravation or exacerbation), and safety in patients with hepatic impairment.
Hyperlipidaemia, stomatitis/oral mucositis, skin toxicity (rash and related events), hyperglycaemia, pneumonitis/non-infectious pneumonitis, and infection are all considered to be class effects of mTOR inhibitors.
This safety evaluation of everolimus 10 mg daily is based on data from patients who have been exposed to everolimus or matching placebo at the recommended 10-mg daily dose. Included are 300 of the 302 randomized patients with advanced progressive non-functional NET of GI or lung origin from the pivotal, phase-III study CRAD001T2302. Beyond the pivotal study population, the focus broadens to the 850 patients who received the 10-mg daily dose across the earlier RADIANT program. This program comprises patients in similar (but distinct) disease-related settings in NET (studies C2239, C2324 and C2325). Safety data of 9 other ongoing clinical studies and additional sources of information (such as literature review or post-marketing experience) was also reviewed.
At least 17914 patients are estimated to have received everolimus in both the oncology and TSC (brand name: Votubia) settings in ongoing and completed investigational clinical studies sponsored by Novartis as of 31 Mar 2015, and the cumulative estimated post-marketing exposure is 84021 PTY.
Patient exposure Study T2302 was a prospective, randomized, double-blind, multi-centre, parallel-group, placebo-controlled, 2-arm Phase-III study comparing the efficacy and safety of everolimus 10 mg daily plus best supportive care (BSC) to placebo plus BSC, in patients with advanced NET of GI or lung origin without a history of, or current symptoms of carcinoid syndrome. A total of 285 patients were planned
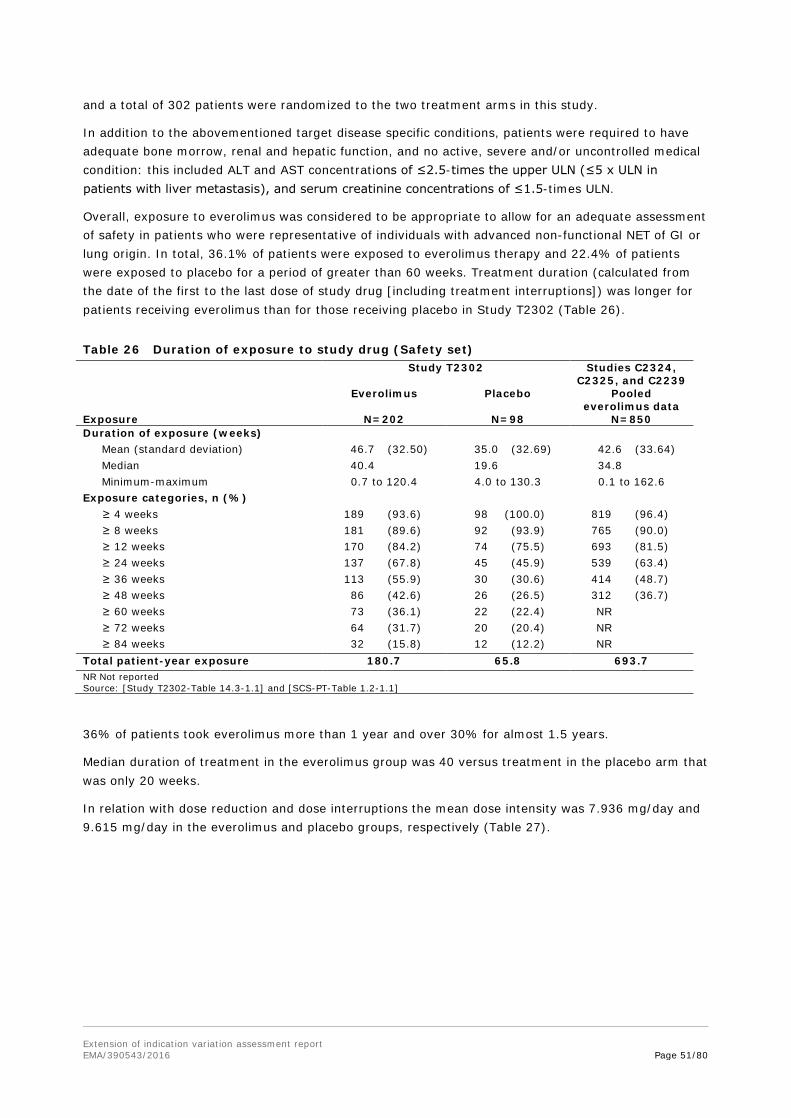
Extension of indication variation assessment report EMA/390543/2016 Page 51/80
and a total of 302 patients were randomized to the two treatment arms in this study.
In addition to the abovementioned target disease specific conditions, patients were required to have adequate bone morrow, renal and hepatic function, and no active, severe and/or uncontrolled medical condition: this included ALT and AST concentrations of ≤2.5-times the upper ULN (≤5 x ULN in patients with liver metastasis), and serum creatinine concentrations of ≤1.5-times ULN.
Overall, exposure to everolimus was considered to be appropriate to allow for an adequate assessment of safety in patients who were representative of individuals with advanced non-functional NET of GI or lung origin. In total, 36.1% of patients were exposed to everolimus therapy and 22.4% of patients were exposed to placebo for a period of greater than 60 weeks. Treatment duration (calculated from the date of the first to the last dose of study drug [including treatment interruptions]) was longer for patients receiving everolimus than for those receiving placebo in Study T2302 (Table 26).
Table 26 Duration of exposure to study drug (Safety set) Study T2302 Studies C2324,
C2325, and C2239 Everolimus Placebo Pooled
everolimus data Exposure N=202 N=98 N=850 Duration of exposure (weeks) Mean (standard deviation) 46.7 (32.50) 35.0 (32.69) 42.6 (33.64) Median 40.4 19.6 34.8 Minimum-maximum 0.7 to 120.4 4.0 to 130.3 0.1 to 162.6 Exposure categories, n (%) ≥ 4 weeks 189 (93.6) 98 (100.0) 819 (96.4) ≥ 8 weeks 181 (89.6) 92 (93.9) 765 (90.0) ≥ 12 weeks 170 (84.2) 74 (75.5) 693 (81.5) ≥ 24 weeks 137 (67.8) 45 (45.9) 539 (63.4) ≥ 36 weeks 113 (55.9) 30 (30.6) 414 (48.7) ≥ 48 weeks 86 (42.6) 26 (26.5) 312 (36.7) ≥ 60 weeks 73 (36.1) 22 (22.4) NR ≥ 72 weeks 64 (31.7) 20 (20.4) NR ≥ 84 weeks 32 (15.8) 12 (12.2) NR Total patient-year exposure 180.7 65.8 693.7 NR Not reported Source: [Study T2302-Table 14.3-1.1] and [SCS-PT-Table 1.2-1.1]
36% of patients took everolimus more than 1 year and over 30% for almost 1.5 years.
Median duration of treatment in the everolimus group was 40 versus treatment in the placebo arm that was only 20 weeks.
In relation with dose reduction and dose interruptions the mean dose intensity was 7.936 mg/day and 9.615 mg/day in the everolimus and placebo groups, respectively (Table 27).
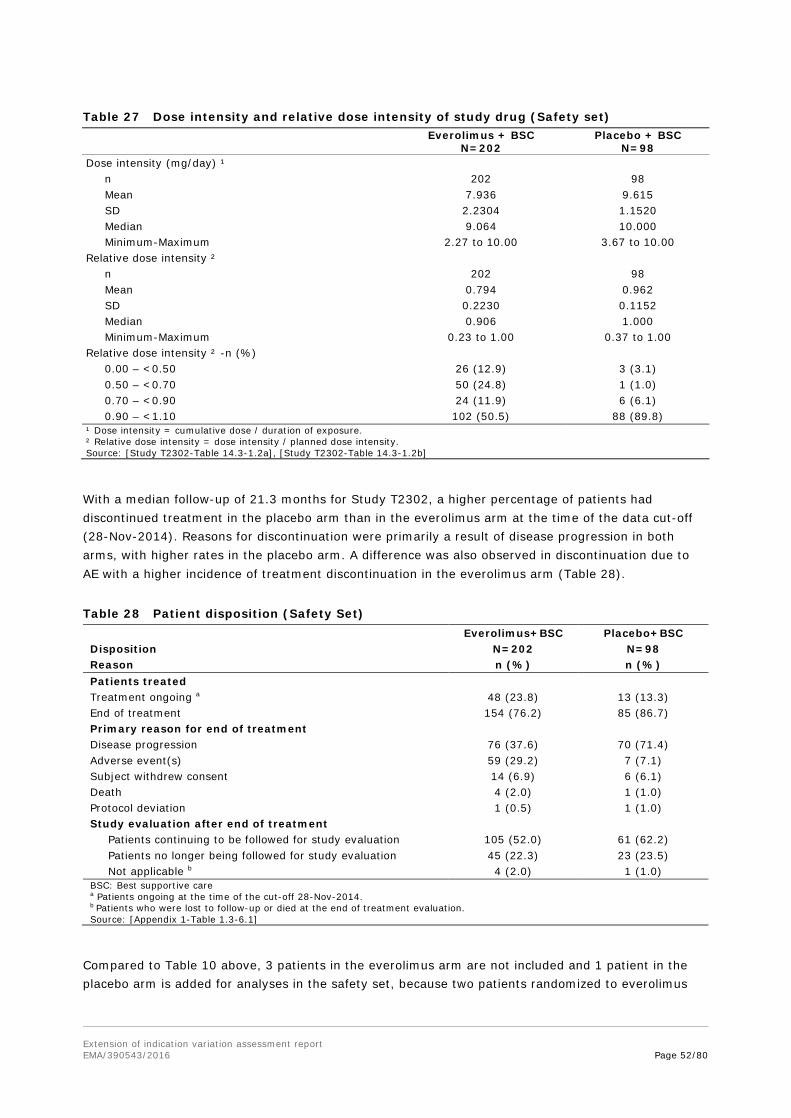
Extension of indication variation assessment report EMA/390543/2016 Page 52/80
Table 27 Dose intensity and relative dose intensity of study drug (Safety set)
Everolimus + BSC N=202
Placebo + BSC N=98
Dose intensity (mg/day) ¹ n 202 98 Mean 7.936 9.615 SD 2.2304 1.1520 Median 9.064 10.000 Minimum-Maximum 2.27 to 10.00 3.67 to 10.00 Relative dose intensity ² n 202 98 Mean 0.794 0.962 SD 0.2230 0.1152 Median 0.906 1.000 Minimum-Maximum 0.23 to 1.00 0.37 to 1.00 Relative dose intensity ² -n (%) 0.00 – <0.50 26 (12.9) 3 (3.1) 0.50 – <0.70 50 (24.8) 1 (1.0) 0.70 – <0.90 24 (11.9) 6 (6.1) 0.90 – <1.10 102 (50.5) 88 (89.8) ¹ Dose intensity = cumulative dose / duration of exposure. ² Relative dose intensity = dose intensity / planned dose intensity. Source: [Study T2302-Table 14.3-1.2a], [Study T2302-Table 14.3-1.2b]
With a median follow-up of 21.3 months for Study T2302, a higher percentage of patients had discontinued treatment in the placebo arm than in the everolimus arm at the time of the data cut-off (28-Nov-2014). Reasons for discontinuation were primarily a result of disease progression in both arms, with higher rates in the placebo arm. A difference was also observed in discontinuation due to AE with a higher incidence of treatment discontinuation in the everolimus arm (Table 28).
Table 28 Patient disposition (Safety Set) Everolimus+BSC Placebo+BSC Disposition N=202 N=98 Reason n (%) n (%) Patients treated Treatment ongoing a 48 (23.8) 13 (13.3) End of treatment 154 (76.2) 85 (86.7) Primary reason for end of treatment Disease progression 76 (37.6) 70 (71.4) Adverse event(s) 59 (29.2) 7 (7.1) Subject withdrew consent 14 (6.9) 6 (6.1) Death 4 (2.0) 1 (1.0) Protocol deviation 1 (0.5) 1 (1.0) Study evaluation after end of treatment
Patients continuing to be followed for study evaluation 105 (52.0) 61 (62.2) Patients no longer being followed for study evaluation 45 (22.3) 23 (23.5) Not applicable b 4 (2.0) 1 (1.0)
BSC: Best supportive care a Patients ongoing at the time of the cut-off 28-Nov-2014. b Patients who were lost to follow-up or died at the end of treatment evaluation. Source: [Appendix 1-Table 1.3-6.1]
Compared to Table 10 above, 3 patients in the everolimus arm are not included and 1 patient in the placebo arm is added for analyses in the safety set, because two patients randomized to everolimus

Extension of indication variation assessment report EMA/390543/2016 Page 53/80
were not treated due to withdrawal of consent and protocol deviation and one patient randomized to everolimus inadvertently received placebo treatment.
Almost 30% of patients discontinued everolimus treatment due to AEs. A slightly higher percentage (38%) discontinued due to progression of disease under everolimus treatment; this was nearly half as in the placebo group.
52-62% of patients are continued to be followed for further evaluations after end of study drug treatment, which is about 2/3 of applicable patients in both arms.
Dose adjustments were primarily attributable to AEs (Table 29).
Table 29 Number of patients requiring dose interruptions and/or reductions of study drug (Safety set)
Everolimus + BSC
N=202 n (%)
Placebo + BSC N=98 n (%)
Interruptions No of patients requiring dose interruption 128 (63.4) 28 (28.6) 1 dose interruption 49 (24.3) 15 (15.3) ≥ 2 dose interruptions 79 (39.1) 13 (13.3) Reason for dose interruption Adverse event 124 (61.4) 15 (15.3) Concomitant medication affecting drug exposure 5 (2.5) 0 Dispensing error 2 (1.0) 0 Dosing error 18 (8.9) 14 (14.3) Scheduling conflict 7 (3.5) 3 (3.1) Reductions No of patients requiring dose reduction 91 (45.0) 7 (7.1) 1 dose reduction 64 (31.7) 7 (7.1) ≥ 2 dose reductions 27 (13.4) 0 Reason for dose reduction Adverse event 28 (13.9) 2 (2.0) Concomitant medication affecting drug exposure 0 1 (1.0) Dosing error 3 (1.5) 0 Re-escalation 71 (35.1) 4 (4.1) - A patient with multiple occurrences of a reason for dose reduction or interruption is only counted once in that category. - A patient with multiple reasons for dose reduction or interruption is only counted once in the total row. Source: [Study T2302-Table 14.3-1.3]
45 vs. 7% of patients needed dose reductions, of which about one third was attributed to AEs.
Re-escalation was the main reason for dose reductions. This was clarified in the responses as temporary interruptions, e.g. for AEs or interacting drug treatment, and re-start with the next lower dose.
Adverse events
High numbers of patients with AEs were reported in both treatment groups. In the everolimus group, there were higher proportions of grade 3/4 AEs (69.3% vs. 28.6% for placebo), SAEs (42.1% vs. 19.4%) and AEs leading to treatment discontinuation (29.2% vs. 7.1%) (Table 30). It should be noted that the median duration of exposure was longer for patients in the everolimus group than in the placebo group (40.4 vs. 19.6 weeks, respectively).
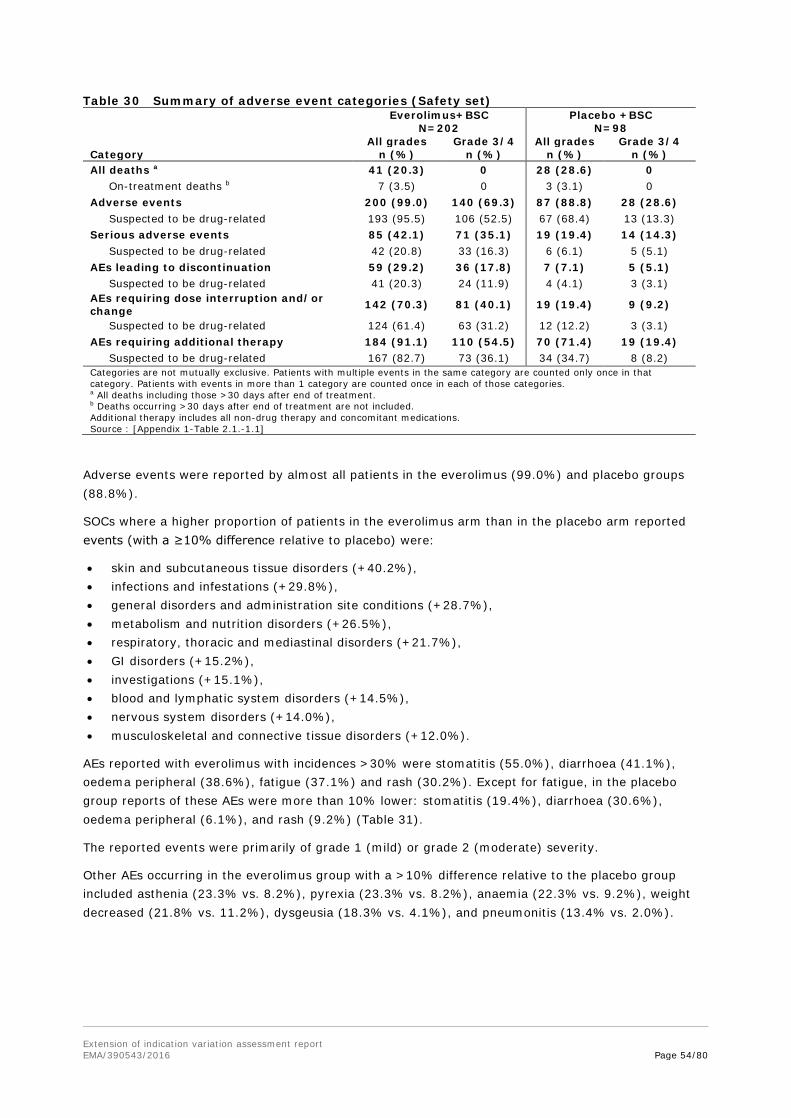
Extension of indication variation assessment report EMA/390543/2016 Page 54/80
Table 30 Summary of adverse event categories (Safety set) Everolimus+BSC Placebo +BSC N=202 N=98 All grades Grade 3/4 All grades Grade 3/4 Category n (%) n (%) n (%) n (%) All deaths a 41 (20.3) 0 28 (28.6) 0 On-treatment deaths b 7 (3.5) 0 3 (3.1) 0 Adverse events 200 (99.0) 140 (69.3) 87 (88.8) 28 (28.6) Suspected to be drug-related 193 (95.5) 106 (52.5) 67 (68.4) 13 (13.3) Serious adverse events 85 (42.1) 71 (35.1) 19 (19.4) 14 (14.3) Suspected to be drug-related 42 (20.8) 33 (16.3) 6 (6.1) 5 (5.1) AEs leading to discontinuation 59 (29.2) 36 (17.8) 7 (7.1) 5 (5.1) Suspected to be drug-related 41 (20.3) 24 (11.9) 4 (4.1) 3 (3.1) AEs requiring dose interruption and/or change 142 (70.3) 81 (40.1) 19 (19.4) 9 (9.2)
Suspected to be drug-related 124 (61.4) 63 (31.2) 12 (12.2) 3 (3.1) AEs requiring additional therapy 184 (91.1) 110 (54.5) 70 (71.4) 19 (19.4) Suspected to be drug-related 167 (82.7) 73 (36.1) 34 (34.7) 8 (8.2) Categories are not mutually exclusive. Patients with multiple events in the same category are counted only once in that category. Patients with events in more than 1 category are counted once in each of those categories. a All deaths including those >30 days after end of treatment. b Deaths occurring >30 days after end of treatment are not included. Additional therapy includes all non-drug therapy and concomitant medications. Source : [Appendix 1-Table 2.1.-1.1]
Adverse events were reported by almost all patients in the everolimus (99.0%) and placebo groups (88.8%).
SOCs where a higher proportion of patients in the everolimus arm than in the placebo arm reported events (with a ≥10% difference relative to placebo) were:
• skin and subcutaneous tissue disorders (+40.2%), • infections and infestations (+29.8%), • general disorders and administration site conditions (+28.7%), • metabolism and nutrition disorders (+26.5%), • respiratory, thoracic and mediastinal disorders (+21.7%), • GI disorders (+15.2%), • investigations (+15.1%), • blood and lymphatic system disorders (+14.5%), • nervous system disorders (+14.0%), • musculoskeletal and connective tissue disorders (+12.0%).
AEs reported with everolimus with incidences >30% were stomatitis (55.0%), diarrhoea (41.1%), oedema peripheral (38.6%), fatigue (37.1%) and rash (30.2%). Except for fatigue, in the placebo group reports of these AEs were more than 10% lower: stomatitis (19.4%), diarrhoea (30.6%), oedema peripheral (6.1%), and rash (9.2%) (Table 31).
The reported events were primarily of grade 1 (mild) or grade 2 (moderate) severity.
Other AEs occurring in the everolimus group with a >10% difference relative to the placebo group included asthenia (23.3% vs. 8.2%), pyrexia (23.3% vs. 8.2%), anaemia (22.3% vs. 9.2%), weight decreased (21.8% vs. 11.2%), dysgeusia (18.3% vs. 4.1%), and pneumonitis (13.4% vs. 2.0%).
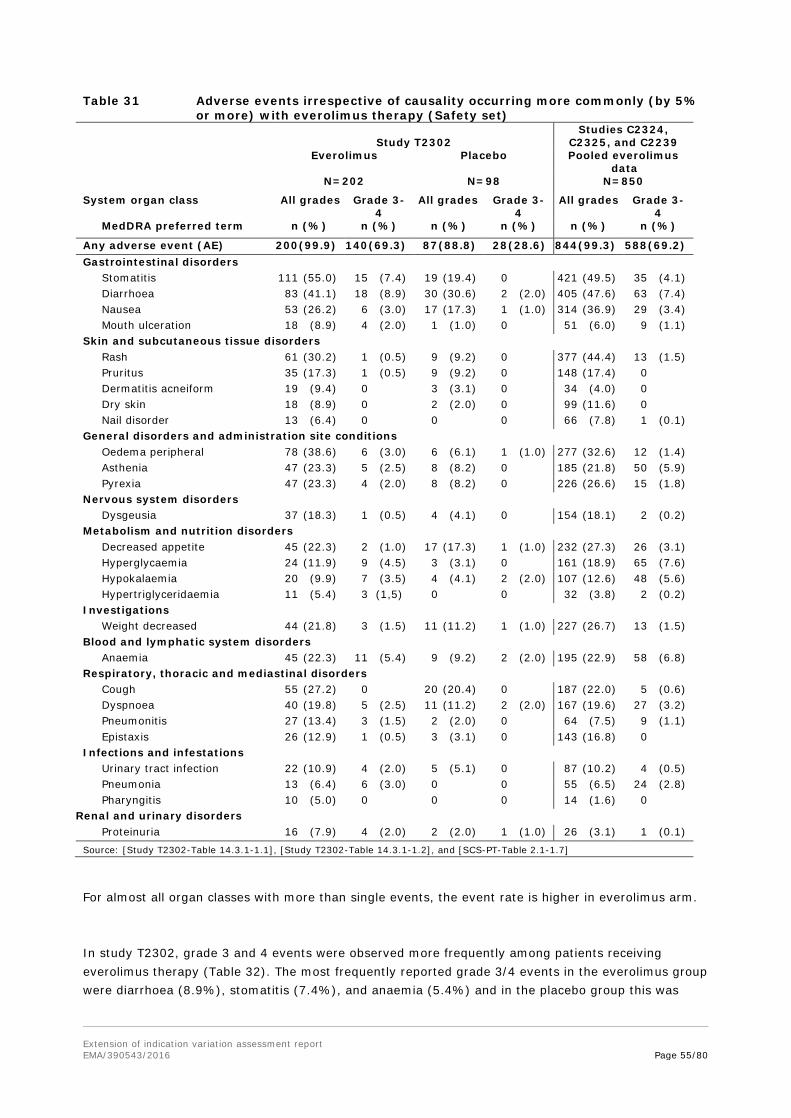
Extension of indication variation assessment report EMA/390543/2016 Page 55/80
Table 31 Adverse events irrespective of causality occurring more commonly (by 5% or more) with everolimus therapy (Safety set)
Study T2302
Studies C2324, C2325, and C2239
Everolimus Placebo Pooled everolimus data
N=202 N=98 N=850
System organ class All grades Grade 3-4
All grades Grade 3-4
All grades Grade 3-4
MedDRA preferred term n (%) n (%) n (%) n (%) n (%) n (%)
Any adverse event (AE) 200 (99.9) 140 (69.3) 87 (88.8) 28 (28.6) 844 (99.3) 588 (69.2) Gastrointestinal disorders Stomatitis 111 (55.0) 15 (7.4) 19 (19.4) 0 421 (49.5) 35 (4.1) Diarrhoea 83 (41.1) 18 (8.9) 30 (30.6) 2 (2.0) 405 (47.6) 63 (7.4) Nausea 53 (26.2) 6 (3.0) 17 (17.3) 1 (1.0) 314 (36.9) 29 (3.4) Mouth ulceration 18 (8.9) 4 (2.0) 1 (1.0) 0 51 (6.0) 9 (1.1) Skin and subcutaneous tissue disorders Rash 61 (30.2) 1 (0.5) 9 (9.2) 0 377 (44.4) 13 (1.5) Pruritus 35 (17.3) 1 (0.5) 9 (9.2) 0 148 (17.4) 0 Dermatitis acneiform 19 (9.4) 0 3 (3.1) 0 34 (4.0) 0 Dry skin 18 (8.9) 0 2 (2.0) 0 99 (11.6) 0 Nail disorder 13 (6.4) 0 0 0 66 (7.8) 1 (0.1) General disorders and administration site conditions Oedema peripheral 78 (38.6) 6 (3.0) 6 (6.1) 1 (1.0) 277 (32.6) 12 (1.4) Asthenia 47 (23.3) 5 (2.5) 8 (8.2) 0 185 (21.8) 50 (5.9) Pyrexia 47 (23.3) 4 (2.0) 8 (8.2) 0 226 (26.6) 15 (1.8) Nervous system disorders Dysgeusia 37 (18.3) 1 (0.5) 4 (4.1) 0 154 (18.1) 2 (0.2) Metabolism and nutrition disorders Decreased appetite 45 (22.3) 2 (1.0) 17 (17.3) 1 (1.0) 232 (27.3) 26 (3.1) Hyperglycaemia 24 (11.9) 9 (4.5) 3 (3.1) 0 161 (18.9) 65 (7.6) Hypokalaemia 20 (9.9) 7 (3.5) 4 (4.1) 2 (2.0) 107 (12.6) 48 (5.6) Hypertriglyceridaemia 11 (5.4) 3 (1,5) 0 0 32 (3.8) 2 (0.2) Investigations Weight decreased 44 (21.8) 3 (1.5) 11 (11.2) 1 (1.0) 227 (26.7) 13 (1.5) Blood and lymphatic system disorders Anaemia 45 (22.3) 11 (5.4) 9 (9.2) 2 (2.0) 195 (22.9) 58 (6.8) Respiratory, thoracic and mediastinal disorders Cough 55 (27.2) 0 20 (20.4) 0 187 (22.0) 5 (0.6) Dyspnoea 40 (19.8) 5 (2.5) 11 (11.2) 2 (2.0) 167 (19.6) 27 (3.2) Pneumonitis 27 (13.4) 3 (1.5) 2 (2.0) 0 64 (7.5) 9 (1.1) Epistaxis 26 (12.9) 1 (0.5) 3 (3.1) 0 143 (16.8) 0 Infections and infestations Urinary tract infection 22 (10.9) 4 (2.0) 5 (5.1) 0 87 (10.2) 4 (0.5) Pneumonia 13 (6.4) 6 (3.0) 0 0 55 (6.5) 24 (2.8) Pharyngitis 10 (5.0) 0 0 0 14 (1.6) 0
Renal and urinary disorders Proteinuria 16 (7.9) 4 (2.0) 2 (2.0) 1 (1.0) 26 (3.1) 1 (0.1) Source: [Study T2302-Table 14.3.1-1.1], [Study T2302-Table 14.3.1-1.2], and [SCS-PT-Table 2.1-1.7]
For almost all organ classes with more than single events, the event rate is higher in everolimus arm.
In study T2302, grade 3 and 4 events were observed more frequently among patients receiving everolimus therapy (Table 32). The most frequently reported grade 3/4 events in the everolimus group were diarrhoea (8.9%), stomatitis (7.4%), and anaemia (5.4%) and in the placebo group this was
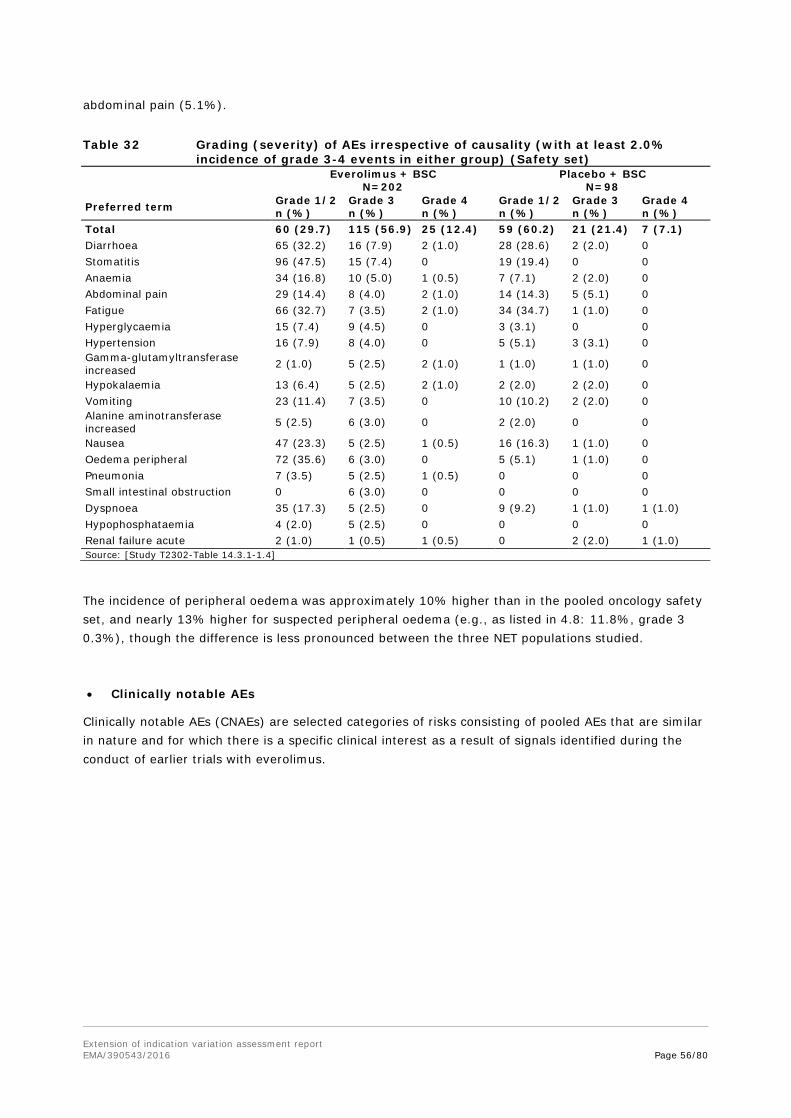
Extension of indication variation assessment report EMA/390543/2016 Page 56/80
abdominal pain (5.1%).
Table 32 Grading (severity) of AEs irrespective of causality (with at least 2.0% incidence of grade 3-4 events in either group) (Safety set)
Everolimus + BSC N=202
Placebo + BSC N=98
Preferred term Grade 1/2 n (%)
Grade 3 n (%)
Grade 4 n (%)
Grade 1/2 n (%)
Grade 3 n (%)
Grade 4 n (%)
Total 60 (29.7) 115 (56.9) 25 (12.4) 59 (60.2) 21 (21.4) 7 (7.1) Diarrhoea 65 (32.2) 16 (7.9) 2 (1.0) 28 (28.6) 2 (2.0) 0 Stomatitis 96 (47.5) 15 (7.4) 0 19 (19.4) 0 0 Anaemia 34 (16.8) 10 (5.0) 1 (0.5) 7 (7.1) 2 (2.0) 0 Abdominal pain 29 (14.4) 8 (4.0) 2 (1.0) 14 (14.3) 5 (5.1) 0 Fatigue 66 (32.7) 7 (3.5) 2 (1.0) 34 (34.7) 1 (1.0) 0 Hyperglycaemia 15 (7.4) 9 (4.5) 0 3 (3.1) 0 0 Hypertension 16 (7.9) 8 (4.0) 0 5 (5.1) 3 (3.1) 0 Gamma-glutamyltransferase increased 2 (1.0) 5 (2.5) 2 (1.0) 1 (1.0) 1 (1.0) 0
Hypokalaemia 13 (6.4) 5 (2.5) 2 (1.0) 2 (2.0) 2 (2.0) 0 Vomiting 23 (11.4) 7 (3.5) 0 10 (10.2) 2 (2.0) 0 Alanine aminotransferase increased 5 (2.5) 6 (3.0) 0 2 (2.0) 0 0
Nausea 47 (23.3) 5 (2.5) 1 (0.5) 16 (16.3) 1 (1.0) 0 Oedema peripheral 72 (35.6) 6 (3.0) 0 5 (5.1) 1 (1.0) 0 Pneumonia 7 (3.5) 5 (2.5) 1 (0.5) 0 0 0 Small intestinal obstruction 0 6 (3.0) 0 0 0 0 Dyspnoea 35 (17.3) 5 (2.5) 0 9 (9.2) 1 (1.0) 1 (1.0) Hypophosphataemia 4 (2.0) 5 (2.5) 0 0 0 0 Renal failure acute 2 (1.0) 1 (0.5) 1 (0.5) 0 2 (2.0) 1 (1.0) Source: [Study T2302-Table 14.3.1-1.4]
The incidence of peripheral oedema was approximately 10% higher than in the pooled oncology safety set, and nearly 13% higher for suspected peripheral oedema (e.g., as listed in 4.8: 11.8%, grade 3 0.3%), though the difference is less pronounced between the three NET populations studied.
• Clinically notable AEs
Clinically notable AEs (CNAEs) are selected categories of risks consisting of pooled AEs that are similar in nature and for which there is a specific clinical interest as a result of signals identified during the conduct of earlier trials with everolimus.
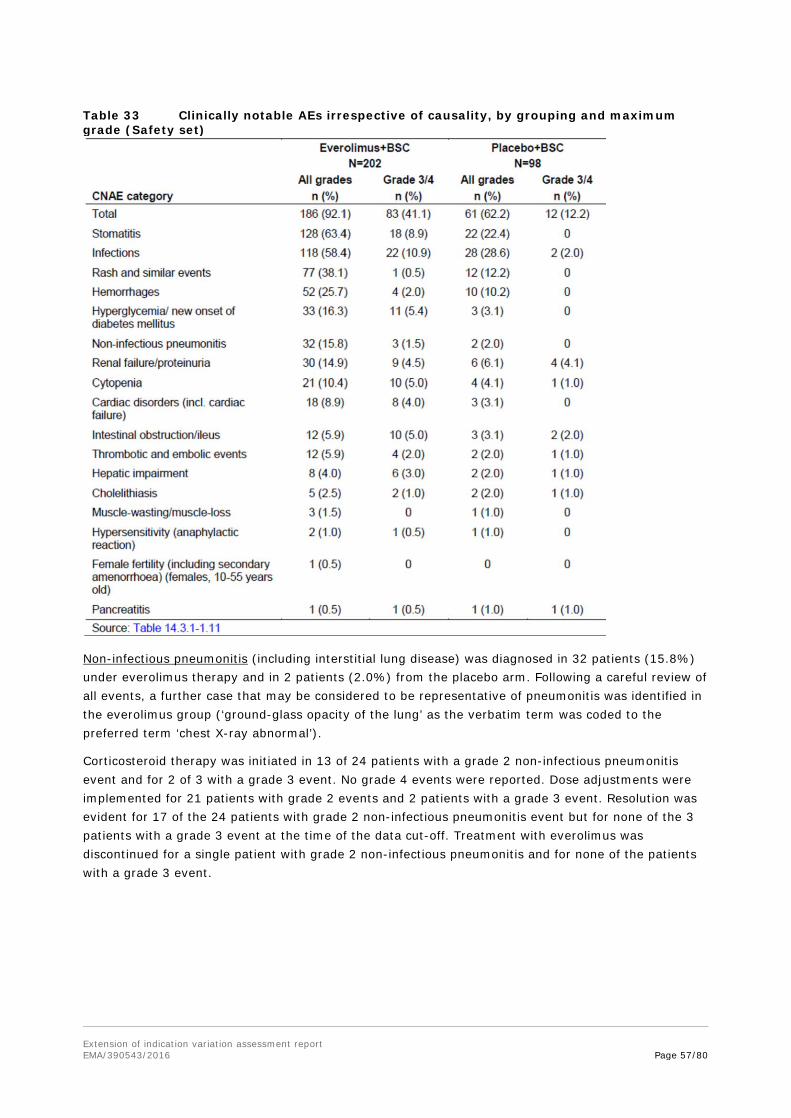
Extension of indication variation assessment report EMA/390543/2016 Page 57/80
Table 33 Clinically notable AEs irrespective of causality, by grouping and maximum grade (Safety set)
Non-infectious pneumonitis (including interstitial lung disease) was diagnosed in 32 patients (15.8%) under everolimus therapy and in 2 patients (2.0%) from the placebo arm. Following a careful review of all events, a further case that may be considered to be representative of pneumonitis was identified in the everolimus group (‘ground-glass opacity of the lung’ as the verbatim term was coded to the preferred term ‘chest X-ray abnormal’).
Corticosteroid therapy was initiated in 13 of 24 patients with a grade 2 non-infectious pneumonitis event and for 2 of 3 with a grade 3 event. No grade 4 events were reported. Dose adjustments were implemented for 21 patients with grade 2 events and 2 patients with a grade 3 event. Resolution was evident for 17 of the 24 patients with grade 2 non-infectious pneumonitis event but for none of the 3 patients with a grade 3 event at the time of the data cut-off. Treatment with everolimus was discontinued for a single patient with grade 2 non-infectious pneumonitis and for none of the patients with a grade 3 event.

Extension of indication variation assessment report EMA/390543/2016 Page 58/80
Figure 13 Time to first occurrence of non-infectious pneumonitis (Safety Set)
Infections were diagnosed in 118 patients (58.4%) under everolimus and 28 patients (28.6%) taking placebo. Taking into account the higher exposure to everolimus relative to placebo, this difference was reduced when the exposure-adjusted incidence rates (i.e. the numbers of patients with the event per 100 patient-year exposure) were compared (65.3 and 42.6 for the everolimus and placebo treatment groups, respectively [corresponding to a ratio of 1.5:1]).
Six patients (3.0%) with everolimus reported 8× grade 4 infections (bronchopulmonary aspergillosis, pneumonia, respiratory tract infection, peritonitis, sepsis, septic shock [×2], and viral myocarditis). Grade 3 infections occurred in 16 patients (7.9%) on everolimus. In comparison, 1 placebo-treated patient (1.0%) was diagnosed with a grade 4 infection and 1 patient (1.0%) with a grade 3 event.
Stomatitis, as a common treatment-limiting side effect of cancer therapy, led to 6 patients (3.0%) discontinuing from therapy (1 as the result of a grade 1 event, 3 from grade 2 events, and 2 due to grade 3 events). Most cases were suspected by the investigator to be treatment-related. While reported more frequently in the everolimus group, grade 3 stomatitis-related events were relatively uncommon and no grade 4 stomatitis-related events were reported.
Figure 14 Time to first occurrence of stomatitis/related events (Safety Set)

Extension of indication variation assessment report EMA/390543/2016 Page 59/80
Stomatitis is an important ADR from a patient perspective. For grade 1 and 2 events of stomatitis, the event may resolve without dose adjustment or any other action. In case of grade 3, 12/15 underwent dose adjustment.
In the CSR an analysis of the clinical/therapeutic impact of the everolimus-related clinically notable AEs is provided, discussing the frequencies of discontinuation and dose adjustment/interruption due to AE. According to this analysis, the highest impact for treatment discontinuation was found for infections and stomatitis events (both 3.0%), and for dose adjustments/interruptions for infection (17.8%), followed by stomatitis (15.8%) and non-infectious pneumonitis (11.9%).
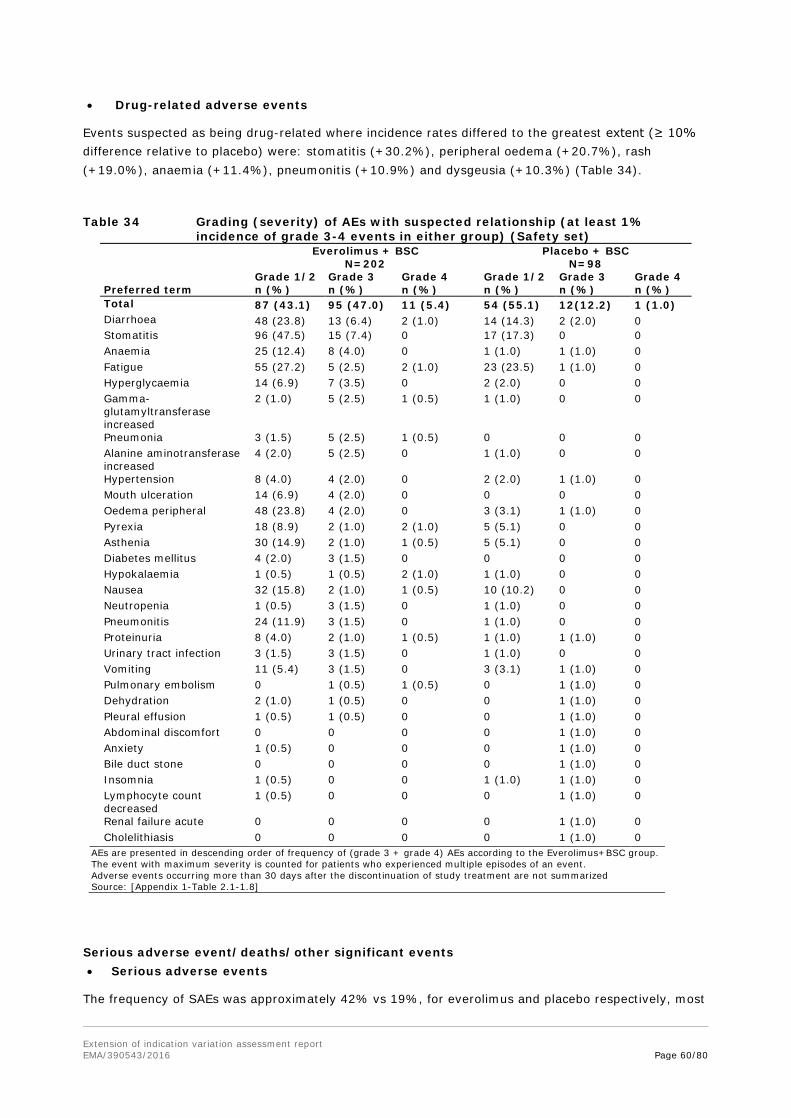
Extension of indication variation assessment report EMA/390543/2016 Page 60/80
• Drug-related adverse events
Events suspected as being drug-related where incidence rates differed to the greatest extent (≥ 10% difference relative to placebo) were: stomatitis (+30.2%), peripheral oedema (+20.7%), rash (+19.0%), anaemia (+11.4%), pneumonitis (+10.9%) and dysgeusia (+10.3%) (Table 34).
Table 34 Grading (severity) of AEs with suspected relationship (at least 1% incidence of grade 3-4 events in either group) (Safety set)
Everolimus + BSC
N=202 Placebo + BSC
N=98
Preferred term Grade 1/2 n (%)
Grade 3 n (%)
Grade 4 n (%)
Grade 1/2 n (%)
Grade 3 n (%)
Grade 4 n (%)
Total 87 (43.1) 95 (47.0) 11 (5.4) 54 (55.1) 12(12.2) 1 (1.0) Diarrhoea 48 (23.8) 13 (6.4) 2 (1.0) 14 (14.3) 2 (2.0) 0 Stomatitis 96 (47.5) 15 (7.4) 0 17 (17.3) 0 0 Anaemia 25 (12.4) 8 (4.0) 0 1 (1.0) 1 (1.0) 0 Fatigue 55 (27.2) 5 (2.5) 2 (1.0) 23 (23.5) 1 (1.0) 0 Hyperglycaemia 14 (6.9) 7 (3.5) 0 2 (2.0) 0 0 Gamma-glutamyltransferase increased
2 (1.0) 5 (2.5) 1 (0.5) 1 (1.0) 0 0
Pneumonia 3 (1.5) 5 (2.5) 1 (0.5) 0 0 0 Alanine aminotransferase increased
4 (2.0) 5 (2.5) 0 1 (1.0) 0 0
Hypertension 8 (4.0) 4 (2.0) 0 2 (2.0) 1 (1.0) 0 Mouth ulceration 14 (6.9) 4 (2.0) 0 0 0 0 Oedema peripheral 48 (23.8) 4 (2.0) 0 3 (3.1) 1 (1.0) 0 Pyrexia 18 (8.9) 2 (1.0) 2 (1.0) 5 (5.1) 0 0 Asthenia 30 (14.9) 2 (1.0) 1 (0.5) 5 (5.1) 0 0 Diabetes mellitus 4 (2.0) 3 (1.5) 0 0 0 0 Hypokalaemia 1 (0.5) 1 (0.5) 2 (1.0) 1 (1.0) 0 0 Nausea 32 (15.8) 2 (1.0) 1 (0.5) 10 (10.2) 0 0 Neutropenia 1 (0.5) 3 (1.5) 0 1 (1.0) 0 0 Pneumonitis 24 (11.9) 3 (1.5) 0 1 (1.0) 0 0 Proteinuria 8 (4.0) 2 (1.0) 1 (0.5) 1 (1.0) 1 (1.0) 0 Urinary tract infection 3 (1.5) 3 (1.5) 0 1 (1.0) 0 0 Vomiting 11 (5.4) 3 (1.5) 0 3 (3.1) 1 (1.0) 0 Pulmonary embolism 0 1 (0.5) 1 (0.5) 0 1 (1.0) 0 Dehydration 2 (1.0) 1 (0.5) 0 0 1 (1.0) 0 Pleural effusion 1 (0.5) 1 (0.5) 0 0 1 (1.0) 0 Abdominal discomfort 0 0 0 0 1 (1.0) 0 Anxiety 1 (0.5) 0 0 0 1 (1.0) 0 Bile duct stone 0 0 0 0 1 (1.0) 0 Insomnia 1 (0.5) 0 0 1 (1.0) 1 (1.0) 0 Lymphocyte count decreased
1 (0.5) 0 0 0 1 (1.0) 0
Renal failure acute 0 0 0 0 1 (1.0) 0 Cholelithiasis 0 0 0 0 1 (1.0) 0
AEs are presented in descending order of frequency of (grade 3 + grade 4) AEs according to the Everolimus+BSC group. The event with maximum severity is counted for patients who experienced multiple episodes of an event. Adverse events occurring more than 30 days after the discontinuation of study treatment are not summarized Source: [Appendix 1-Table 2.1-1.8]
Serious adverse event/deaths/other significant events • Serious adverse events
The frequency of SAEs was approximately 42% vs 19%, for everolimus and placebo respectively, most
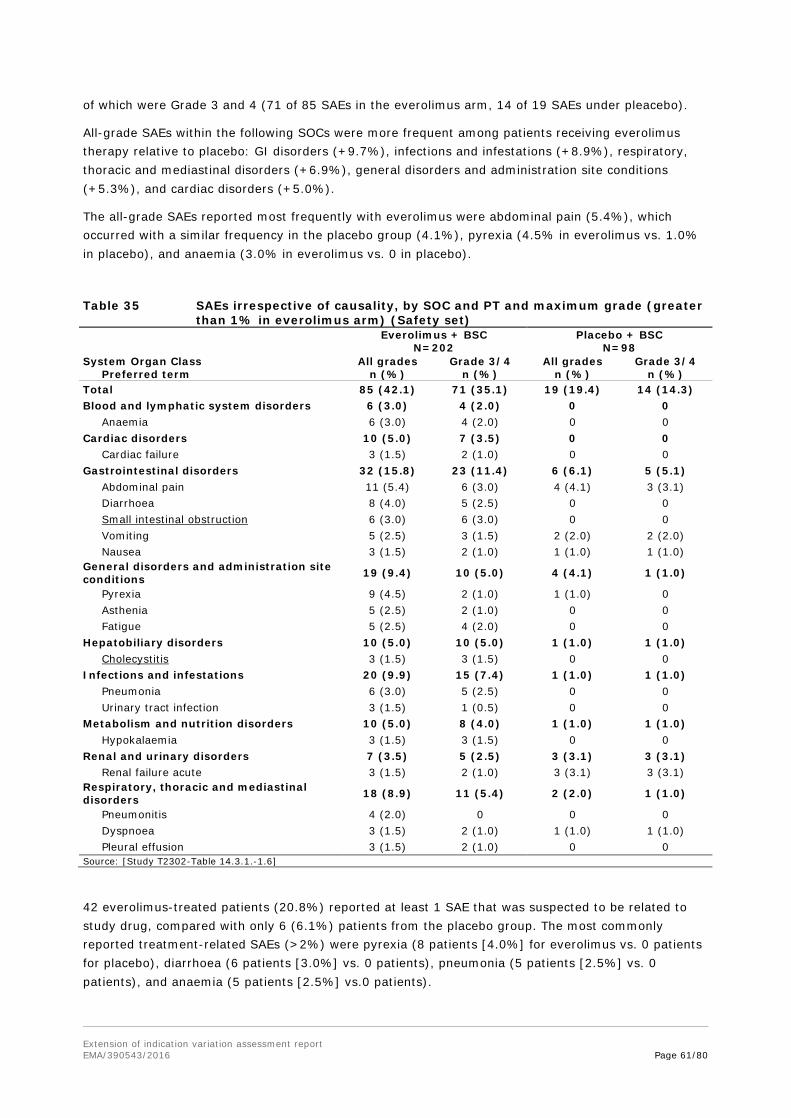
Extension of indication variation assessment report EMA/390543/2016 Page 61/80
of which were Grade 3 and 4 (71 of 85 SAEs in the everolimus arm, 14 of 19 SAEs under pleacebo).
All-grade SAEs within the following SOCs were more frequent among patients receiving everolimus therapy relative to placebo: GI disorders (+9.7%), infections and infestations (+8.9%), respiratory, thoracic and mediastinal disorders (+6.9%), general disorders and administration site conditions (+5.3%), and cardiac disorders (+5.0%).
The all-grade SAEs reported most frequently with everolimus were abdominal pain (5.4%), which occurred with a similar frequency in the placebo group (4.1%), pyrexia (4.5% in everolimus vs. 1.0% in placebo), and anaemia (3.0% in everolimus vs. 0 in placebo).
Table 35 SAEs irrespective of causality, by SOC and PT and maximum grade (greater than 1% in everolimus arm) (Safety set)
Everolimus + BSC N=202
Placebo + BSC N=98
System Organ Class Preferred term
All grades n (%)
Grade 3/4 n (%)
All grades n (%)
Grade 3/4 n (%)
Total 85 (42.1) 71 (35.1) 19 (19.4) 14 (14.3) Blood and lymphatic system disorders 6 (3.0) 4 (2.0) 0 0 Anaemia 6 (3.0) 4 (2.0) 0 0 Cardiac disorders 10 (5.0) 7 (3.5) 0 0 Cardiac failure 3 (1.5) 2 (1.0) 0 0 Gastrointestinal disorders 32 (15.8) 23 (11.4) 6 (6.1) 5 (5.1) Abdominal pain 11 (5.4) 6 (3.0) 4 (4.1) 3 (3.1) Diarrhoea 8 (4.0) 5 (2.5) 0 0 Small intestinal obstruction 6 (3.0) 6 (3.0) 0 0 Vomiting 5 (2.5) 3 (1.5) 2 (2.0) 2 (2.0) Nausea 3 (1.5) 2 (1.0) 1 (1.0) 1 (1.0) General disorders and administration site conditions 19 (9.4) 10 (5.0) 4 (4.1) 1 (1.0)
Pyrexia 9 (4.5) 2 (1.0) 1 (1.0) 0 Asthenia 5 (2.5) 2 (1.0) 0 0 Fatigue 5 (2.5) 4 (2.0) 0 0 Hepatobiliary disorders 10 (5.0) 10 (5.0) 1 (1.0) 1 (1.0) Cholecystitis 3 (1.5) 3 (1.5) 0 0 Infections and infestations 20 (9.9) 15 (7.4) 1 (1.0) 1 (1.0) Pneumonia 6 (3.0) 5 (2.5) 0 0 Urinary tract infection 3 (1.5) 1 (0.5) 0 0 Metabolism and nutrition disorders 10 (5.0) 8 (4.0) 1 (1.0) 1 (1.0) Hypokalaemia 3 (1.5) 3 (1.5) 0 0 Renal and urinary disorders 7 (3.5) 5 (2.5) 3 (3.1) 3 (3.1) Renal failure acute 3 (1.5) 2 (1.0) 3 (3.1) 3 (3.1) Respiratory, thoracic and mediastinal disorders 18 (8.9) 11 (5.4) 2 (2.0) 1 (1.0)
Pneumonitis 4 (2.0) 0 0 0 Dyspnoea 3 (1.5) 2 (1.0) 1 (1.0) 1 (1.0) Pleural effusion 3 (1.5) 2 (1.0) 0 0 Source: [Study T2302-Table 14.3.1.-1.6]
42 everolimus-treated patients (20.8%) reported at least 1 SAE that was suspected to be related to study drug, compared with only 6 (6.1%) patients from the placebo group. The most commonly reported treatment-related SAEs (>2%) were pyrexia (8 patients [4.0%] for everolimus vs. 0 patients for placebo), diarrhoea (6 patients [3.0%] vs. 0 patients), pneumonia (5 patients [2.5%] vs. 0 patients), and anaemia (5 patients [2.5%] vs.0 patients).
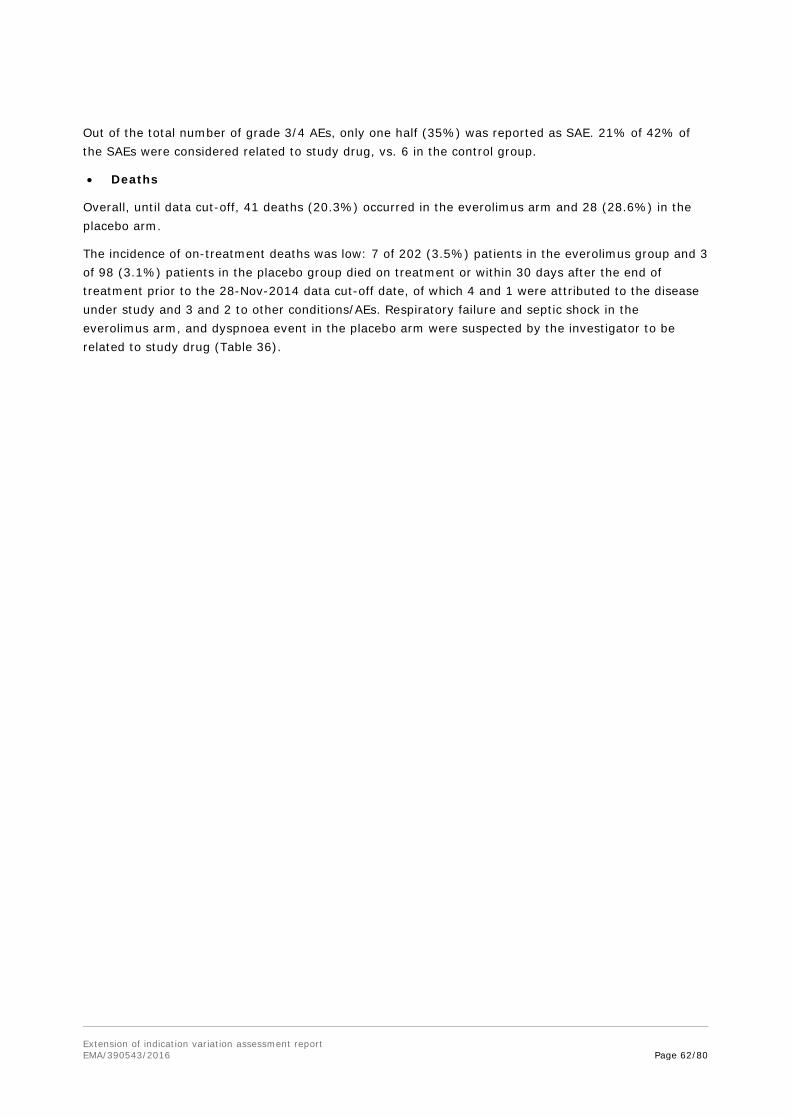
Extension of indication variation assessment report EMA/390543/2016 Page 62/80
Out of the total number of grade 3/4 AEs, only one half (35%) was reported as SAE. 21% of 42% of the SAEs were considered related to study drug, vs. 6 in the control group.
• Deaths
Overall, until data cut-off, 41 deaths (20.3%) occurred in the everolimus arm and 28 (28.6%) in the placebo arm.
The incidence of on-treatment deaths was low: 7 of 202 (3.5%) patients in the everolimus group and 3 of 98 (3.1%) patients in the placebo group died on treatment or within 30 days after the end of treatment prior to the 28-Nov-2014 data cut-off date, of which 4 and 1 were attributed to the disease under study and 3 and 2 to other conditions/AEs. Respiratory failure and septic shock in the everolimus arm, and dyspnoea event in the placebo arm were suspected by the investigator to be related to study drug (Table 36).
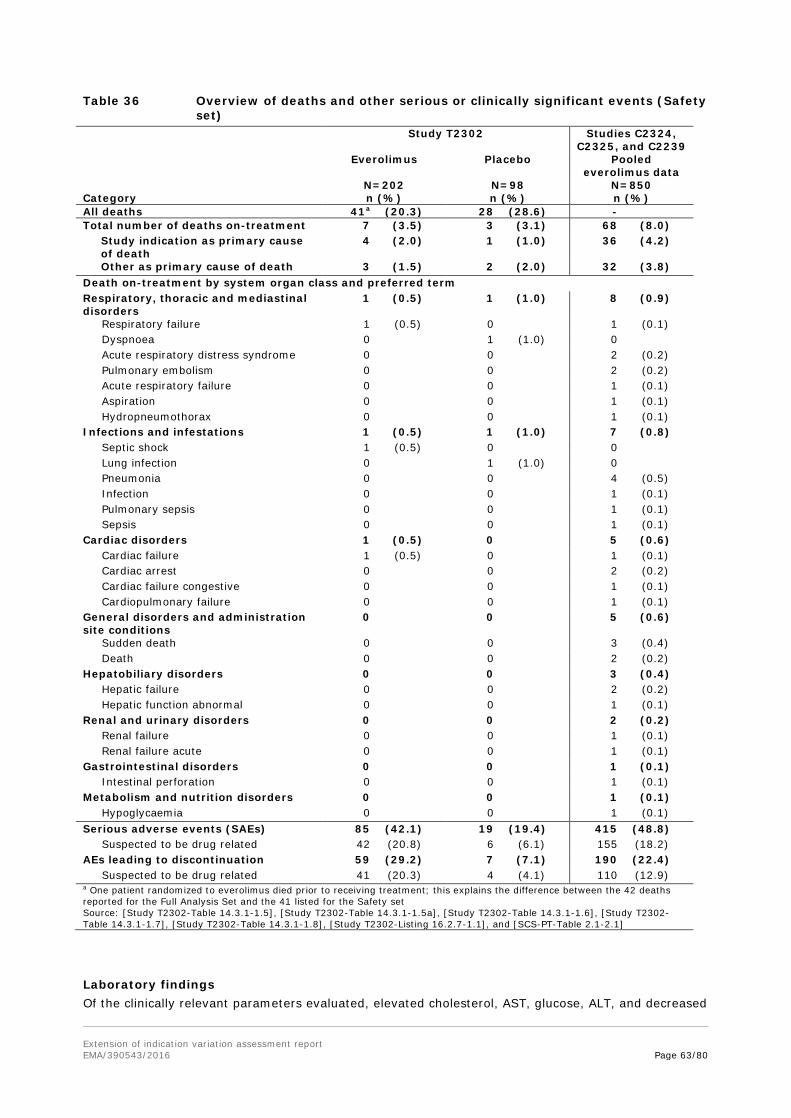
Extension of indication variation assessment report EMA/390543/2016 Page 63/80
Table 36 Overview of deaths and other serious or clinically significant events (Safety set)
Study T2302 Studies C2324, C2325, and C2239
Everolimus Placebo Pooled everolimus data
N=202 N=98 N=850 Category n (%) n (%) n (%) All deaths 41a (20.3) 28 (28.6) - Total number of deaths on-treatment 7 (3.5) 3 (3.1) 68 (8.0) Study indication as primary cause
of death 4 (2.0) 1 (1.0) 36 (4.2)
Other as primary cause of death 3 (1.5) 2 (2.0) 32 (3.8) Death on-treatment by system organ class and preferred term Respiratory, thoracic and mediastinal disorders
1 (0.5) 1 (1.0) 8 (0.9)
Respiratory failure 1 (0.5) 0 1 (0.1) Dyspnoea 0 1 (1.0) 0 Acute respiratory distress syndrome 0 0 2 (0.2) Pulmonary embolism 0 0 2 (0.2) Acute respiratory failure 0 0 1 (0.1) Aspiration 0 0 1 (0.1) Hydropneumothorax 0 0 1 (0.1) Infections and infestations 1 (0.5) 1 (1.0) 7 (0.8) Septic shock 1 (0.5) 0 0 Lung infection 0 1 (1.0) 0 Pneumonia 0 0 4 (0.5) Infection 0 0 1 (0.1) Pulmonary sepsis 0 0 1 (0.1) Sepsis 0 0 1 (0.1) Cardiac disorders 1 (0.5) 0 5 (0.6) Cardiac failure 1 (0.5) 0 1 (0.1) Cardiac arrest 0 0 2 (0.2) Cardiac failure congestive 0 0 1 (0.1) Cardiopulmonary failure 0 0 1 (0.1) General disorders and administration site conditions
0 0 5 (0.6)
Sudden death 0 0 3 (0.4) Death 0 0 2 (0.2) Hepatobiliary disorders 0 0 3 (0.4) Hepatic failure 0 0 2 (0.2) Hepatic function abnormal 0 0 1 (0.1) Renal and urinary disorders 0 0 2 (0.2) Renal failure 0 0 1 (0.1) Renal failure acute 0 0 1 (0.1) Gastrointestinal disorders 0 0 1 (0.1) Intestinal perforation 0 0 1 (0.1) Metabolism and nutrition disorders 0 0 1 (0.1) Hypoglycaemia 0 0 1 (0.1) Serious adverse events (SAEs) 85 (42.1) 19 (19.4) 415 (48.8) Suspected to be drug related 42 (20.8) 6 (6.1) 155 (18.2) AEs leading to discontinuation 59 (29.2) 7 (7.1) 190 (22.4) Suspected to be drug related 41 (20.3) 4 (4.1) 110 (12.9) a One patient randomized to everolimus died prior to receiving treatment; this explains the difference between the 42 deaths reported for the Full Analysis Set and the 41 listed for the Safety set Source: [Study T2302-Table 14.3.1-1.5], [Study T2302-Table 14.3.1-1.5a], [Study T2302-Table 14.3.1-1.6], [Study T2302-Table 14.3.1-1.7], [Study T2302-Table 14.3.1-1.8], [Study T2302-Listing 16.2.7-1.1], and [SCS-PT-Table 2.1-2.1]
Laboratory findings Of the clinically relevant parameters evaluated, elevated cholesterol, AST, glucose, ALT, and decreased
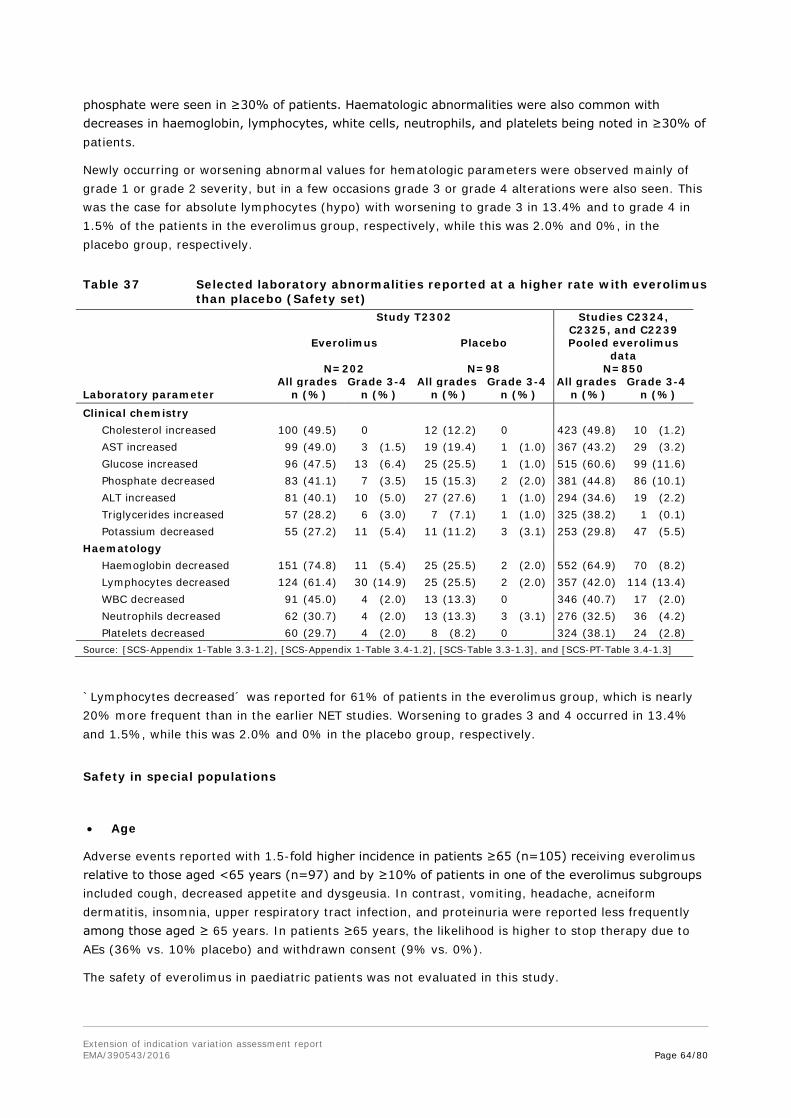
Extension of indication variation assessment report EMA/390543/2016 Page 64/80
phosphate were seen in ≥30% of patients. Haematologic abnormalities were also common with decreases in haemoglobin, lymphocytes, white cells, neutrophils, and platelets being noted in ≥30% of patients.
Newly occurring or worsening abnormal values for hematologic parameters were observed mainly of grade 1 or grade 2 severity, but in a few occasions grade 3 or grade 4 alterations were also seen. This was the case for absolute lymphocytes (hypo) with worsening to grade 3 in 13.4% and to grade 4 in 1.5% of the patients in the everolimus group, respectively, while this was 2.0% and 0%, in the placebo group, respectively.
Table 37 Selected laboratory abnormalities reported at a higher rate with everolimus than placebo (Safety set)
Study T2302 Studies C2324, C2325, and C2239
Everolimus Placebo Pooled everolimus data
N=202 N=98 N=850 All grades Grade 3-4 All grades Grade 3-4 All grades Grade 3-4 Laboratory parameter n (%) n (%) n (%) n (%) n (%) n (%)
Clinical chemistry Cholesterol increased 100 (49.5) 0 12 (12.2) 0 423 (49.8) 10 (1.2) AST increased 99 (49.0) 3 (1.5) 19 (19.4) 1 (1.0) 367 (43.2) 29 (3.2) Glucose increased 96 (47.5) 13 (6.4) 25 (25.5) 1 (1.0) 515 (60.6) 99 (11.6) Phosphate decreased 83 (41.1) 7 (3.5) 15 (15.3) 2 (2.0) 381 (44.8) 86 (10.1) ALT increased 81 (40.1) 10 (5.0) 27 (27.6) 1 (1.0) 294 (34.6) 19 (2.2) Triglycerides increased 57 (28.2) 6 (3.0) 7 (7.1) 1 (1.0) 325 (38.2) 1 (0.1) Potassium decreased 55 (27.2) 11 (5.4) 11 (11.2) 3 (3.1) 253 (29.8) 47 (5.5) Haematology Haemoglobin decreased 151 (74.8) 11 (5.4) 25 (25.5) 2 (2.0) 552 (64.9) 70 (8.2) Lymphocytes decreased 124 (61.4) 30 (14.9) 25 (25.5) 2 (2.0) 357 (42.0) 114 (13.4) WBC decreased 91 (45.0) 4 (2.0) 13 (13.3) 0 346 (40.7) 17 (2.0) Neutrophils decreased 62 (30.7) 4 (2.0) 13 (13.3) 3 (3.1) 276 (32.5) 36 (4.2) Platelets decreased 60 (29.7) 4 (2.0) 8 (8.2) 0 324 (38.1) 24 (2.8) Source: [SCS-Appendix 1-Table 3.3-1.2], [SCS-Appendix 1-Table 3.4-1.2], [SCS-Table 3.3-1.3], and [SCS-PT-Table 3.4-1.3]
`Lymphocytes decreased´ was reported for 61% of patients in the everolimus group, which is nearly 20% more frequent than in the earlier NET studies. Worsening to grades 3 and 4 occurred in 13.4% and 1.5%, while this was 2.0% and 0% in the placebo group, respectively.
Safety in special populations
• Age
Adverse events reported with 1.5-fold higher incidence in patients ≥65 (n=105) receiving everolimus relative to those aged <65 years (n=97) and by ≥10% of patients in one of the everolimus subgroups included cough, decreased appetite and dysgeusia. In contrast, vomiting, headache, acneiform dermatitis, insomnia, upper respiratory tract infection, and proteinuria were reported less frequently among those aged ≥ 65 years. In patients ≥65 years, the likelihood is higher to stop therapy due to AEs (36% vs. 10% placebo) and withdrawn consent (9% vs. 0%).
The safety of everolimus in paediatric patients was not evaluated in this study.

Extension of indication variation assessment report EMA/390543/2016 Page 65/80
• Gender
For some events the incidence was 1.5-fold greater for one gender relative to the other. With an incidence of ≥ 10% in the everolimus arm there was:
- more prominent in males: pain in extremity (12.6 vs. 6.1%)
- more prominent in females: cough (33.0 vs. 19.5%), vomiting (17.4 vs. 11.5%), pruritus (22.6 vs. 10.3%), and arthralgia (15.7 vs. 6.9%).
• Race
Comparison was possible between the Caucasian and Asian subpopulations (Table 38). Events where the incidence was 1.5-fold greater for one race relative to the other and with an incidence of ≥ 10% in the everolimus group:
- More prominent in Caucasians: diarrhoea, fatigue, nausea, abdominal pain, dyspnoea, dysgeusia, vomiting, hypertension, urinary tract infection, dry mouth, upper abdominal pain, pain in extremity, and dry skin
- More prominent in Asians: epistaxis, hyperglycaemia, and headache.
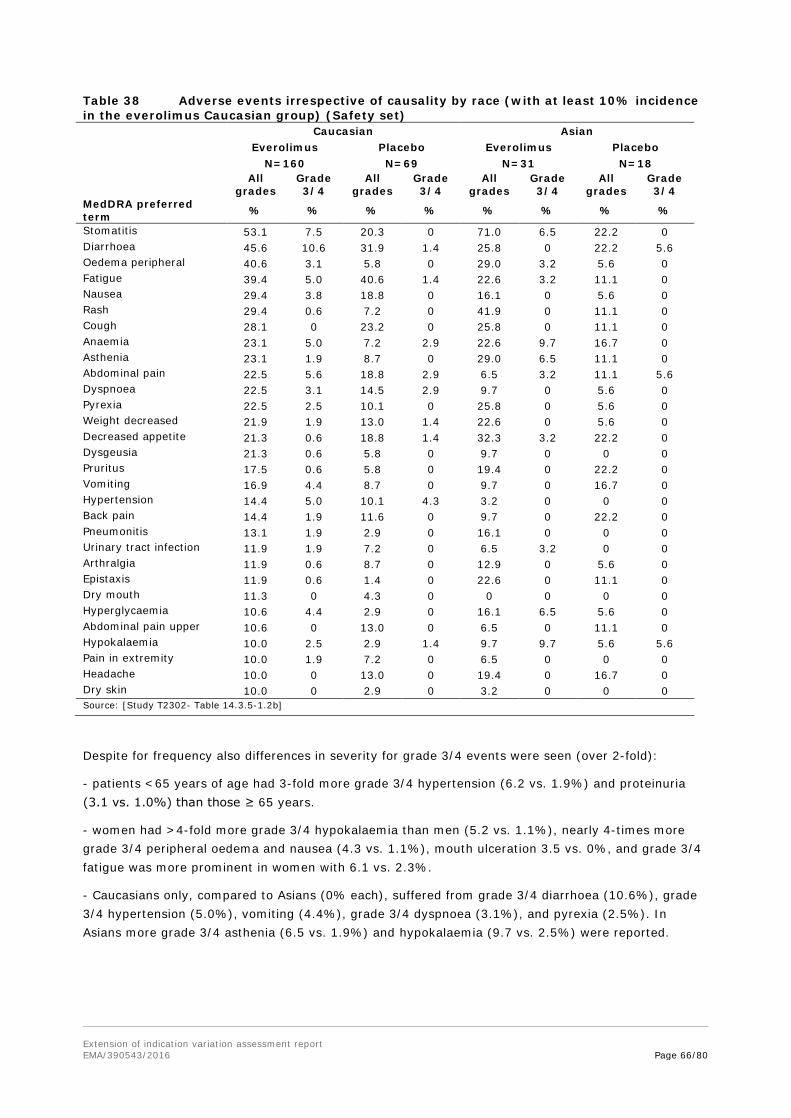
Extension of indication variation assessment report EMA/390543/2016 Page 66/80
Table 38 Adverse events irrespective of causality by race (with at least 10% incidence in the everolimus Caucasian group) (Safety set) Caucasian Asian Everolimus Placebo Everolimus Placebo N=160 N=69 N=31 N=18 All
grades Grade 3/4
All grades
Grade 3/4
All grades
Grade 3/4
All grades
Grade 3/4
MedDRA preferred term % % % % % % % %
Stomatitis 53.1 7.5 20.3 0 71.0 6.5 22.2 0 Diarrhoea 45.6 10.6 31.9 1.4 25.8 0 22.2 5.6 Oedema peripheral 40.6 3.1 5.8 0 29.0 3.2 5.6 0 Fatigue 39.4 5.0 40.6 1.4 22.6 3.2 11.1 0 Nausea 29.4 3.8 18.8 0 16.1 0 5.6 0 Rash 29.4 0.6 7.2 0 41.9 0 11.1 0 Cough 28.1 0 23.2 0 25.8 0 11.1 0 Anaemia 23.1 5.0 7.2 2.9 22.6 9.7 16.7 0 Asthenia 23.1 1.9 8.7 0 29.0 6.5 11.1 0 Abdominal pain 22.5 5.6 18.8 2.9 6.5 3.2 11.1 5.6 Dyspnoea 22.5 3.1 14.5 2.9 9.7 0 5.6 0 Pyrexia 22.5 2.5 10.1 0 25.8 0 5.6 0 Weight decreased 21.9 1.9 13.0 1.4 22.6 0 5.6 0 Decreased appetite 21.3 0.6 18.8 1.4 32.3 3.2 22.2 0 Dysgeusia 21.3 0.6 5.8 0 9.7 0 0 0 Pruritus 17.5 0.6 5.8 0 19.4 0 22.2 0 Vomiting 16.9 4.4 8.7 0 9.7 0 16.7 0 Hypertension 14.4 5.0 10.1 4.3 3.2 0 0 0 Back pain 14.4 1.9 11.6 0 9.7 0 22.2 0 Pneumonitis 13.1 1.9 2.9 0 16.1 0 0 0 Urinary tract infection 11.9 1.9 7.2 0 6.5 3.2 0 0 Arthralgia 11.9 0.6 8.7 0 12.9 0 5.6 0 Epistaxis 11.9 0.6 1.4 0 22.6 0 11.1 0 Dry mouth 11.3 0 4.3 0 0 0 0 0 Hyperglycaemia 10.6 4.4 2.9 0 16.1 6.5 5.6 0 Abdominal pain upper 10.6 0 13.0 0 6.5 0 11.1 0 Hypokalaemia 10.0 2.5 2.9 1.4 9.7 9.7 5.6 5.6 Pain in extremity 10.0 1.9 7.2 0 6.5 0 0 0 Headache 10.0 0 13.0 0 19.4 0 16.7 0 Dry skin 10.0 0 2.9 0 3.2 0 0 0 Source: [Study T2302- Table 14.3.5-1.2b]
Despite for frequency also differences in severity for grade 3/4 events were seen (over 2-fold):
- patients <65 years of age had 3-fold more grade 3/4 hypertension (6.2 vs. 1.9%) and proteinuria (3.1 vs. 1.0%) than those ≥ 65 years.
- women had >4-fold more grade 3/4 hypokalaemia than men (5.2 vs. 1.1%), nearly 4-times more grade 3/4 peripheral oedema and nausea (4.3 vs. 1.1%), mouth ulceration 3.5 vs. 0%, and grade 3/4 fatigue was more prominent in women with 6.1 vs. 2.3%.
- Caucasians only, compared to Asians (0% each), suffered from grade 3/4 diarrhoea (10.6%), grade 3/4 hypertension (5.0%), vomiting (4.4%), grade 3/4 dyspnoea (3.1%), and pyrexia (2.5%). In Asians more grade 3/4 asthenia (6.5 vs. 1.9%) and hypokalaemia (9.7 vs. 2.5%) were reported.
Extension of indication variation assessment report EMA/390543/2016 Page 67/80
Safety related to drug-drug interactions and other interactions No new safety information related to drug-drug interactions has been generated in Study T2302. No specific analyses were conducted to evaluate the use of other drugs, tobacco, alcohol, or food habits on the tolerability and safety of everolimus.
Discontinuation due to adverse events The frequency of AEs leading to discontinuation was higher with everolimus (29.2% vs. 7.1% for placebo). The most commonly reported AEs leading to discontinuation of everolimus therapy were stomatitis (3.0%), diarrhoea (1.5%), and γGT increased (1.5%). Discontinuation as the result of AEs from the following SOCs were also more common with everolimus (relative to placebo): GI disorders (+7.9%), general disorders and administration site conditions (+3.0%), infections and infestations (+3.0%), investigations (+3.0%), and skin and subcutaneous tissue disorders (+2.5%).
The most commonly reported AEs leading to everolimus dose adjustment/interruption were stomatitis (14.4%), pneumonitis (9.9%), fatigue (7.4%), diarrhoea (6.9%), peripheral oedema (6.4%), pyrexia (6.4%), and anaemia (5.4%). Dose adjustments/interruptions as the result of AEs from the following SOCs were more common with everolimus (with incidences ≥5% greater than placebo): GI disorders (+23.1%), respiratory, thoracic and mediastinal disorders (+14.7%), general disorders and administration site conditions (+14.1%), infections and infestations (+13.7%), investigations (+7.4%), metabolism and nutrition disorders (+7.4%), skin and subcutaneous tissue disorders (+7.4%), blood and lymphatic system disorders (+6.9%), and musculoskeletal and connective tissue disorders (+5.0%).
45 vs. 7% (for everolimus and placebo respectively) needed dose reductions due to AEs and discontinuations due to AE were frequent with nearly 30% in the everolimus group vs. 7% in the placebo group.
Post marketing experience The total worldwide cumulative market exposure to Afinitor/Votubia in the Oncology and TSC settings combined through 31-Mar-2015 is estimated to be 84021 patient treatment years. The worldwide total cumulative patient exposure based on the worldwide sales of tablets sold per defined daily dose (DDD), has been estimated at 79,056 PTY for the Oncology setting and 4,965 PTY for the TSC setting.
2.5.1. Discussion on clinical safety
Safety of 10mg everolimus was analysed from the new pivotal study T2302 in a population with well-differentiated advanced or metastatic neuroendocrine tumours of GI and lung origin without history or symptoms related to carcinoid syndrome (non-functional tumours), compared to placebo and plus best supportive case. The analysed dataset is considered adequate as regards size (n=202 and n=98 placebo) and duration of exposure (40 weeks vs. 20 weeks under placebo) to assess the safety profile of everolimus in this new population. Median duration of treatment with 40 weeks is comparable to that in the previous NET/NET-related studies (pNET: 38 weeks; carcinoid: 37 weeks; pooled studies: 35 weeks). The mean dose intensity of everolimus in this study was lower (7.9 mg/day vs. 9.6 mg/day for placebo) than for the earlier studies in pNET (8.6 mg/d) and carcinoid (8.3 mg/d). Overall, exposure to everolimus was considered to be appropriate to allow for an adequate assessment of safety in patients who were representative of individuals with advanced non-functional NET of GI or lung origin.
The reported adverse events in this GI and lung NET population included the system organ classes known to be compromised by everolimus. Frequencies were, overall, comparable to data obtained from
Extension of indication variation assessment report EMA/390543/2016 Page 68/80
the pooled NET/NET-related studies (C2324, C2325, C2239) and no important new safety concerns were identified. Compared to the everolimus safety profile as listed in the Afinitor SmPC based on 2470 patients in all approved oncologic indications, some AEs were reported at obvious higher frequencies and gradings in study T2302. Although the medical history and current medical conditions of the study patients do not show relevantly frequent respective preconditions, such events may, at least partially, also be symptoms attributable to the underlying tumour entities of GI and lung NET, especially the about 10% higher frequency seen for peripheral oedema. The reported AEs were considered comparable in the three different NET population. Most AEs were manageable and reversible with dose interruptions/reductions. The nature of events is consistent with the known safety profile of everolimus and they were primarily of grade 1 (mild) or grade 2 (moderate) severity. For almost all organ classes with more than single events, the event rate is higher in everolimus arm. Time at risk, however, must be taken into account. In general, all grade AEs ≥5% were reported in comparable frequencies in study T2302 as in the pooled dataset of the previous NET/NET-related studies.
Sections 4.4 and 4.8 of the SmPC, covers non-infectious pneumonitis in a mainly adequate way, but the wording in 4.4 “Non-infectious pneumonitis (including interstitial lung disease) has been described in patients taking Afinitor” implies a low frequency. “Non-infectious pneumonitis (including interstitial lung disease) has been frequently reported in patients taking Afinitor (see 4.8)” is more appropriate.
Considering that investigators would have already been aware of the known safety profile of Afinitor as listed in the SmPC, in study T2302 the AEs reported with a suspected relationship were consistent with this and no new safety findings became evident.
Most SAEs were similar in nature and in frequency compared to the earlier NET studies. However, some of the SAEs reported are events not listed in 4.8 (small intestine obstruction). Small intestine obstruction is clearly more likely to be related to the underlying disease and regarding cholecystitis no causality could be established.
No unusual or new clinically significant findings were observed and data relating to deaths were consistent with the established safety profile of everolimus and the clinical condition of patients enrolled in Study T2302. Overall, the primary causes of death were comparable to those observed in the earlier studies in a NET population. Cases attributed to AEs were typically complex and confounded by the natural history of the disease and concurrent comorbidities and no consistent pattern was evident in the nature or timing of these events.
Frequencies and grades of laboratory abnormalities were comparable to those observed in previous NET studies and were also consistent with those labelled. Lymphocytes decreased, however, were reported with 61%, which is nearly 20% more frequent than in the earlier NET studies.
No consistent trends were evident that were considered indicative of an increased risk for an event on the basis of age. The pattern of events reported in the gender subgroup analysis was consistent with that reported for the overall population. From subgroup analyses some differences of everolimus AEs between ages, genders or races were evident and despite for frequency also differences in severity for grade 3/4 events were seen. Patients <65 years of age had 3-fold more grade 3/4 hypertension and proteinuria than those ≥65 years. Women had >4-fold more grade 3/4 hypokalaemia than men, and suffered nearly 3-4-times more often from grade 3/4 peripheral oedema and nausea, mouth ulceration and fatigue. For Caucasians only, compared to Asians, grade 3/4 diarrhoea, hypertension, vomiting, dyspnoea and pyrexia were reported. In Asians more grade 3/4 asthenia and hypokalaemia were reported. When comparing these data to the currently approved oncology safety profile, for the grade 3/4 events of the concerned subgroups with the higher occurrences (hypokalaemia, peripheral oedema, mouth ulceration, diarrhoea, vomiting, and pyrexia) each of these was reported at the next higher frequency category.

Extension of indication variation assessment report EMA/390543/2016 Page 69/80
Safety analyses between the subgroups with ileal/non-ileal NETs showed no relevant differences for the everolimus treated patients concerning the high frequency of all-grade or grade 3/4 AEs or SAEs. However, the ileal-NET placebo patients experienced only one half of grade 3/4 events (AEs 16% vs. 32.9%, SAEs 8% vs. 16.4%), which confirms the better “overall condition” of the patients with NETs of ileal primary origin.
The mean dose intensity of everolimus in this study was lower (7.9 mg) as reported in the earlier studies in similar populations (pNET 8.6 mg, carcinoid 8.3 mg). 45 vs. 7% (for placebo) of patients needed dose reductions due to AEs, discontinuations due to AE were frequent with nearly 30% (vs. 7%). When compared to the previous pNET study, in that study only 19.1% AEs led to discontinuation (28% in carcinoid study). Progression under treatment leading to discontinuation was reported for nearly 38%, whereas 71% discontinued due to progression on placebo.
As derived from MAH’s safety review of the pivotal study T2302 as well as from final data cut-offs of 2 newly-completed studies already in the safety pool (pivotal studies C2324 [pNET] and Y2301 [mBC]), the MAH proposed some updates of the safety profile in section 4.8. The amendments were considered reasonable. Of note, new safety-related information received with the responses to 1st RSI didn’t warrant changes of the SmPC.
2.5.2. Conclusions on clinical safety
Despite some uncertainties, the safety data reported in the GI and lung NET population in study T2302 is in agreement with what is already known for Afinitor in other oncologic indications, i.e., rather poorly tolerated but severe irreversible toxicity is less of a concern. No clinically relevant new safety findings became evident.
2.5.3. PSUR cycle
PSURs shall be submitted in accordance with the requirements set out in the list of Union reference dates (EURD list) provided for under Article 107c(7) of Directive 2001/83/EC and published on the European medicines web-portal. Marketing authorisation holders shall continuously check the European medicines web-portal for the DLP and frequency of submission of the next PSUR.
2.6. Risk management plan
The CHMP received the following PRAC Advice on the submitted Risk Management Plan (RMP)
The PRAC considered that the RMP version 12.0 (dated 15 March 2016) is acceptable. The PRAC endorsed PRAC Rapporteur assessment report is attached.
The CHMP endorsed this advice with the following changes:
• To further confirm the benefit of Afinitor, in particular in the primary ileum location, mature OS data of the RADIANT-4 study should be submitted by the MAH as post authorisation measure (PAM).
The MAH committed to comply with the above noted recommendation.
The CHMP endorsed the Afinitor RMP version 12.1 (dated 25 April 2016) with the following content:
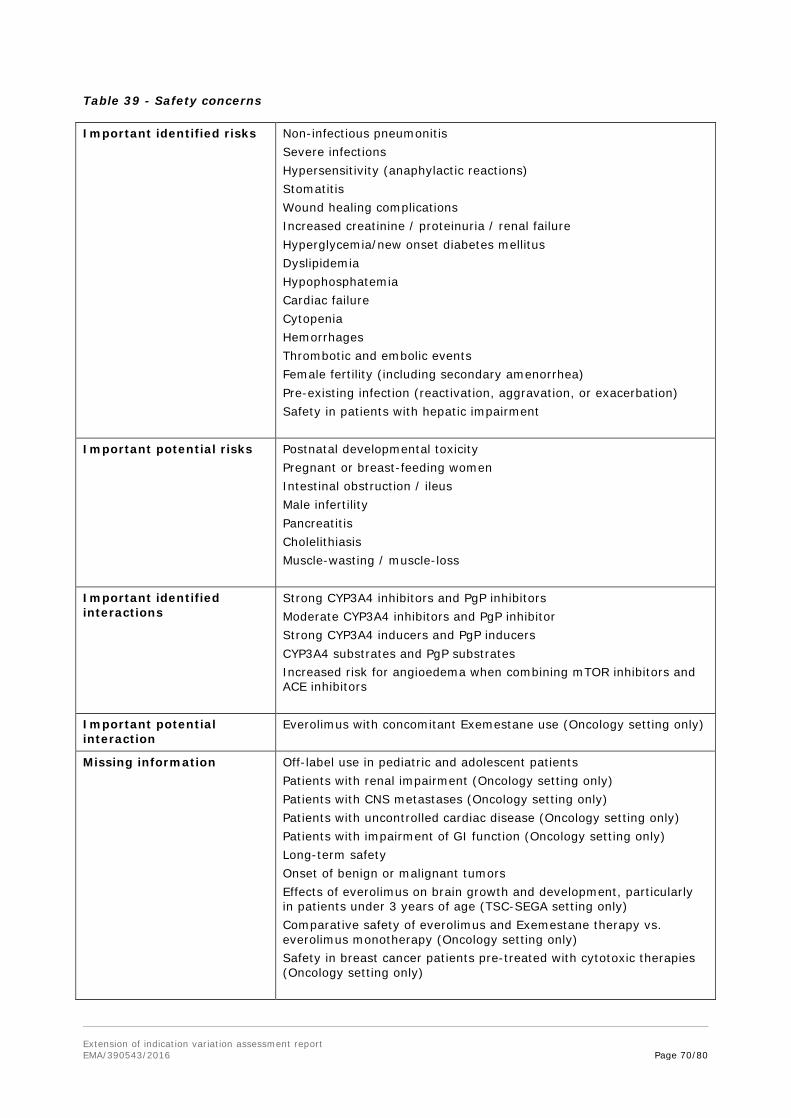
Extension of indication variation assessment report EMA/390543/2016 Page 70/80
Table 39 - Safety concerns
Important identified risks Non-infectious pneumonitis Severe infections Hypersensitivity (anaphylactic reactions) Stomatitis Wound healing complications Increased creatinine / proteinuria / renal failure Hyperglycemia/new onset diabetes mellitus Dyslipidemia Hypophosphatemia Cardiac failure Cytopenia Hemorrhages Thrombotic and embolic events Female fertility (including secondary amenorrhea) Pre-existing infection (reactivation, aggravation, or exacerbation) Safety in patients with hepatic impairment
Important potential risks Postnatal developmental toxicity Pregnant or breast-feeding women Intestinal obstruction / ileus Male infertility Pancreatitis Cholelithiasis Muscle-wasting / muscle-loss
Important identified interactions
Strong CYP3A4 inhibitors and PgP inhibitors Moderate CYP3A4 inhibitors and PgP inhibitor Strong CYP3A4 inducers and PgP inducers CYP3A4 substrates and PgP substrates Increased risk for angioedema when combining mTOR inhibitors and ACE inhibitors
Important potential interaction
Everolimus with concomitant Exemestane use (Oncology setting only)
Missing information Off-label use in pediatric and adolescent patients Patients with renal impairment (Oncology setting only) Patients with CNS metastases (Oncology setting only) Patients with uncontrolled cardiac disease (Oncology setting only) Patients with impairment of GI function (Oncology setting only) Long-term safety Onset of benign or malignant tumors Effects of everolimus on brain growth and development, particularly in patients under 3 years of age (TSC-SEGA setting only) Comparative safety of everolimus and Exemestane therapy vs. everolimus monotherapy (Oncology setting only) Safety in breast cancer patients pre-treated with cytotoxic therapies (Oncology setting only)
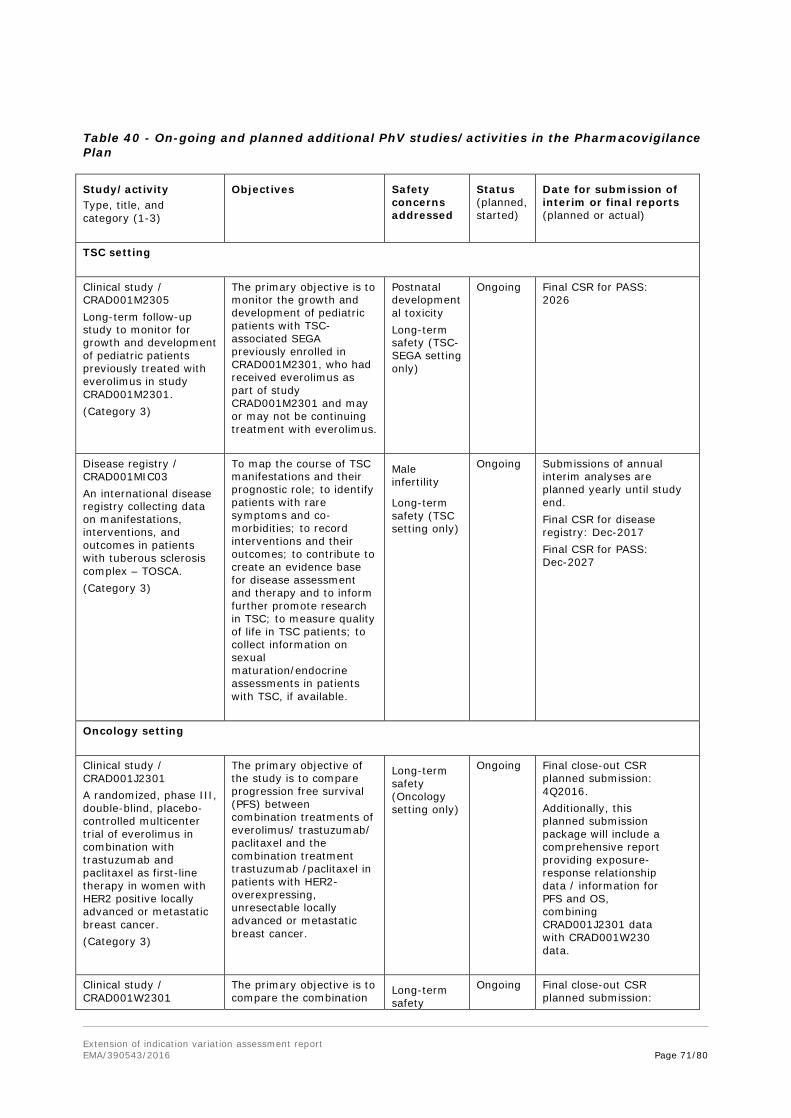
Extension of indication variation assessment report EMA/390543/2016 Page 71/80
Table 40 - On-going and planned additional PhV studies/activities in the Pharmacovigilance Plan
Study/activity Type, title, and category (1-3)
Objectives Safety concerns addressed
Status (planned, started)
Date for submission of interim or final reports (planned or actual)
TSC setting Clinical study / CRAD001M2305 Long-term follow-up study to monitor for growth and development of pediatric patients previously treated with everolimus in study CRAD001M2301. (Category 3)
The primary objective is to monitor the growth and development of pediatric patients with TSC-associated SEGA previously enrolled in CRAD001M2301, who had received everolimus as part of study CRAD001M2301 and may or may not be continuing treatment with everolimus.
Postnatal developmental toxicity Long-term safety (TSC-SEGA setting only)
Ongoing Final CSR for PASS: 2026
Disease registry / CRAD001MIC03 An international disease registry collecting data on manifestations, interventions, and outcomes in patients with tuberous sclerosis complex – TOSCA. (Category 3)
To map the course of TSC manifestations and their prognostic role; to identify patients with rare symptoms and co-morbidities; to record interventions and their outcomes; to contribute to create an evidence base for disease assessment and therapy and to inform further promote research in TSC; to measure quality of life in TSC patients; to collect information on sexual maturation/endocrine assessments in patients with TSC, if available.
Male infertility
Long-term safety (TSC setting only)
Ongoing Submissions of annual interim analyses are planned yearly until study end. Final CSR for disease registry: Dec-2017 Final CSR for PASS: Dec-2027
Oncology setting Clinical study / CRAD001J2301 A randomized, phase III, double-blind, placebo-controlled multicenter trial of everolimus in combination with trastuzumab and paclitaxel as first-line therapy in women with HER2 positive locally advanced or metastatic breast cancer. (Category 3)
The primary objective of the study is to compare progression free survival (PFS) between combination treatments of everolimus/ trastuzumab/ paclitaxel and the combination treatment trastuzumab /paclitaxel in patients with HER2-overexpressing, unresectable locally advanced or metastatic breast cancer.
Long-term safety (Oncology setting only)
Ongoing Final close-out CSR planned submission: 4Q2016. Additionally, this planned submission package will include a comprehensive report providing exposure-response relationship data / information for PFS and OS, combining CRAD001J2301 data with CRAD001W230 data.
Clinical study / CRAD001W2301
The primary objective is to compare the combination
Long-term safety
Ongoing Final close-out CSR planned submission:
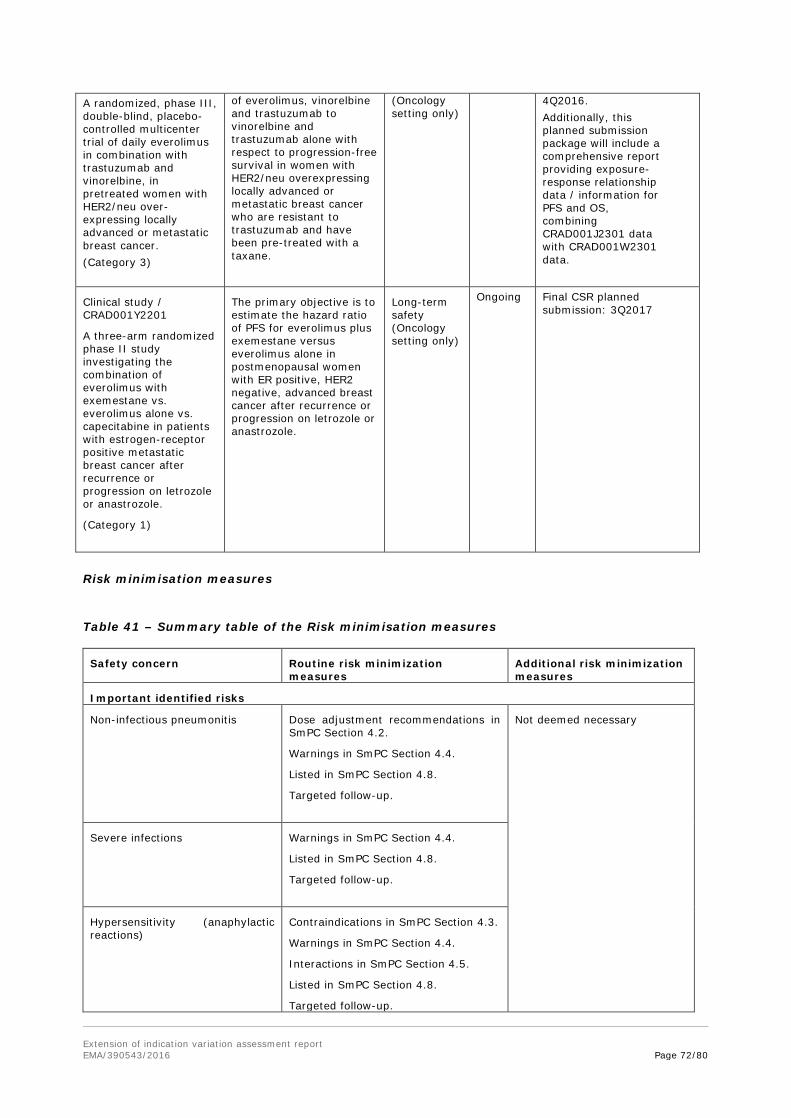
Extension of indication variation assessment report EMA/390543/2016 Page 72/80
A randomized, phase III, double-blind, placebo-controlled multicenter trial of daily everolimus in combination with trastuzumab and vinorelbine, in pretreated women with HER2/neu over-expressing locally advanced or metastatic breast cancer. (Category 3)
of everolimus, vinorelbine and trastuzumab to vinorelbine and trastuzumab alone with respect to progression-free survival in women with HER2/neu overexpressing locally advanced or metastatic breast cancer who are resistant to trastuzumab and have been pre-treated with a taxane.
(Oncology setting only)
4Q2016. Additionally, this planned submission package will include a comprehensive report providing exposure-response relationship data / information for PFS and OS, combining CRAD001J2301 data with CRAD001W2301 data.
Clinical study / CRAD001Y2201
A three-arm randomized phase II study investigating the combination of everolimus with exemestane vs. everolimus alone vs. capecitabine in patients with estrogen-receptor positive metastatic breast cancer after recurrence or progression on letrozole or anastrozole.
(Category 1)
The primary objective is to estimate the hazard ratio of PFS for everolimus plus exemestane versus everolimus alone in postmenopausal women with ER positive, HER2 negative, advanced breast cancer after recurrence or progression on letrozole or anastrozole.
Long-term safety (Oncology setting only)
Ongoing Final CSR planned submission: 3Q2017
Risk minimisation measures
Table 41 – Summary table of the Risk minimisation measures
Safety concern Routine risk minimization measures
Additional risk minimization measures
Important identified risks
Non-infectious pneumonitis Dose adjustment recommendations in SmPC Section 4.2.
Warnings in SmPC Section 4.4.
Listed in SmPC Section 4.8.
Targeted follow-up.
Not deemed necessary
Severe infections Warnings in SmPC Section 4.4.
Listed in SmPC Section 4.8.
Targeted follow-up.
Hypersensitivity (anaphylactic reactions)
Contraindications in SmPC Section 4.3.
Warnings in SmPC Section 4.4.
Interactions in SmPC Section 4.5.
Listed in SmPC Section 4.8.
Targeted follow-up.
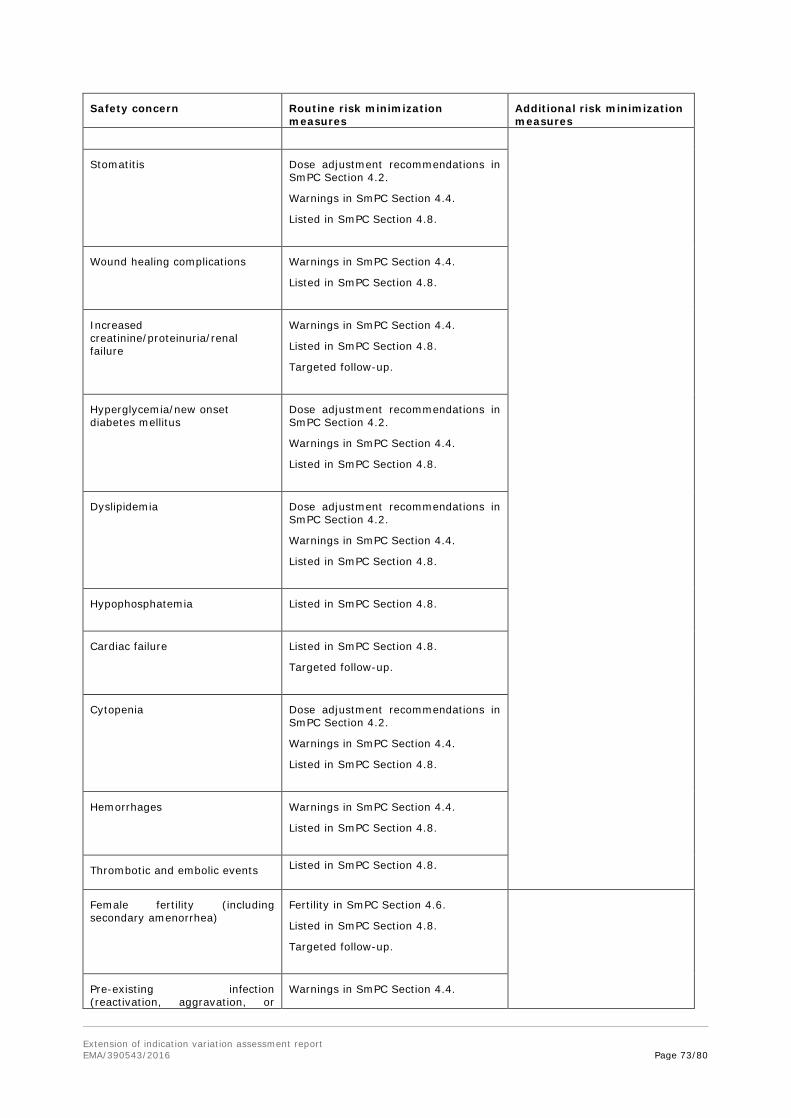
Extension of indication variation assessment report EMA/390543/2016 Page 73/80
Safety concern Routine risk minimization measures
Additional risk minimization measures
Stomatitis Dose adjustment recommendations in SmPC Section 4.2.
Warnings in SmPC Section 4.4.
Listed in SmPC Section 4.8.
Wound healing complications Warnings in SmPC Section 4.4.
Listed in SmPC Section 4.8.
Increased creatinine/proteinuria/renal failure
Warnings in SmPC Section 4.4.
Listed in SmPC Section 4.8.
Targeted follow-up.
Hyperglycemia/new onset diabetes mellitus
Dose adjustment recommendations in SmPC Section 4.2.
Warnings in SmPC Section 4.4.
Listed in SmPC Section 4.8.
Dyslipidemia Dose adjustment recommendations in SmPC Section 4.2.
Warnings in SmPC Section 4.4.
Listed in SmPC Section 4.8.
Hypophosphatemia Listed in SmPC Section 4.8.
Cardiac failure Listed in SmPC Section 4.8.
Targeted follow-up.
Cytopenia Dose adjustment recommendations in SmPC Section 4.2.
Warnings in SmPC Section 4.4.
Listed in SmPC Section 4.8.
Hemorrhages Warnings in SmPC Section 4.4.
Listed in SmPC Section 4.8.
Thrombotic and embolic events Listed in SmPC Section 4.8.
Female fertility (including secondary amenorrhea)
Fertility in SmPC Section 4.6.
Listed in SmPC Section 4.8.
Targeted follow-up.
Pre-existing infection (reactivation, aggravation, or
Warnings in SmPC Section 4.4.

Extension of indication variation assessment report EMA/390543/2016 Page 74/80
Safety concern Routine risk minimization measures
Additional risk minimization measures
exacerbation) Listed in SmPC Section 4.8.
Targeted follow-up.
Safety in patients with hepatic impairment
Special populations in SmPC Section 4.2.
Warnings in SmPC Section 4.4.
Special populations in SmPC Section 5.2.
Important potential risks
Postnatal developmental toxicity Breast-feeding in Package Leaflet Information for the Patients. Targeted follow-up.
Stated additional PV activity for TSC-SEGA setting only: CRAD001M2305.
Pregnant or breast-feeding women
Pregnancy in SmPC Section 4.6. Breast-feeding in SmPC Section 4.6. Targeted follow-up.
Not deemed necessary
Intestinal obstruction/ileus This potential risk is currently considered adequately addressed based on the current PV monitoring plan; risk minimization measures are evaluated on an ongoing basis.
Male infertility Contraception in SmPC Section 4.6.
Fertility in SmPC Section 4.6:
Preclinical safety data in SmPC Section 5.3.
Stated additional PV activity for TSC setting only: CRAD001MIC03 Substudy.
Pancreatitis This potential risk is currently considered adequately addressed based on the current PV monitoring plan; risk minimization measures are evaluated on an ongoing basis.
Cholelithiasis This potential risk is currently considered adequately addressed based on the current PV monitoring plan; risk minimization measures are evaluated on an ongoing basis.
Muscle-wasting/muscle-loss This potential risk is currently considered adequately addressed based on the current PV monitoring plan; risk minimization measures are evaluated on an ongoing basis.
Identified interactions Warnings in SmPC Section 4.4.
Interactions with other medicinal products in SmPC Section 4.5.
Listed in SmPC Section 4.8.
Not deemed necessary
Potential interaction Interactions with other medicinal products in Afinitor SmPC Section 4.5.
Missing information Safety concerns due to limitations of the current CDP are summarized in Table 5-4 of the RMP. All are considered adequately addressed based on the current PV monitoring
Stated additional PV activity for Long-term safety in TSC setting only: CRAD001MIC03 Sub-study.
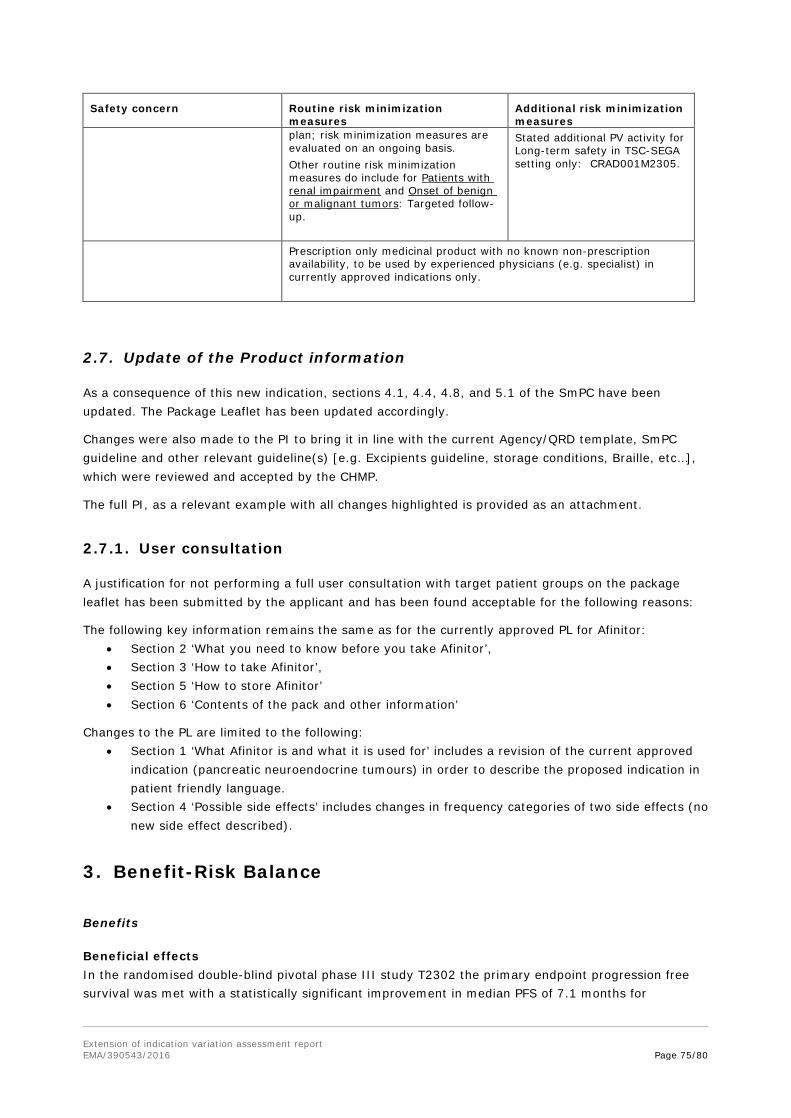
Extension of indication variation assessment report EMA/390543/2016 Page 75/80
Safety concern Routine risk minimization measures
Additional risk minimization measures
plan; risk minimization measures are evaluated on an ongoing basis. Other routine risk minimization measures do include for Patients with renal impairment and Onset of benign or malignant tumors: Targeted follow-up.
Stated additional PV activity for Long-term safety in TSC-SEGA setting only: CRAD001M2305.
Prescription only medicinal product with no known non-prescription availability, to be used by experienced physicians (e.g. specialist) in currently approved indications only.
2.7. Update of the Product information
As a consequence of this new indication, sections 4.1, 4.4, 4.8, and 5.1 of the SmPC have been updated. The Package Leaflet has been updated accordingly.
Changes were also made to the PI to bring it in line with the current Agency/QRD template, SmPC guideline and other relevant guideline(s) [e.g. Excipients guideline, storage conditions, Braille, etc…], which were reviewed and accepted by the CHMP.
The full PI, as a relevant example with all changes highlighted is provided as an attachment.
2.7.1. User consultation
A justification for not performing a full user consultation with target patient groups on the package leaflet has been submitted by the applicant and has been found acceptable for the following reasons:
The following key information remains the same as for the currently approved PL for Afinitor: • Section 2 ‘What you need to know before you take Afinitor’, • Section 3 ‘How to take Afinitor’, • Section 5 ‘How to store Afinitor’ • Section 6 ‘Contents of the pack and other information’
Changes to the PL are limited to the following: • Section 1 ‘What Afinitor is and what it is used for’ includes a revision of the current approved
indication (pancreatic neuroendocrine tumours) in order to describe the proposed indication in patient friendly language.
• Section 4 ‘Possible side effects’ includes changes in frequency categories of two side effects (no new side effect described).
3. Benefit-Risk Balance
Benefits
Beneficial effects In the randomised double-blind pivotal phase III study T2302 the primary endpoint progression free survival was met with a statistically significant improvement in median PFS of 7.1 months for
Extension of indication variation assessment report EMA/390543/2016 Page 76/80
everolimus vs. placebo, plus best supportive care, as assessed by independent central radiological review (HR 0.48). In this population of patients with GI and lung NET PFS is an accepted relevant endpoint. In addition, neuroendocrine tumours are often slowly growing with low aggressiveness, so that measurement of overall survival as the primary endpoint would gain relevant study results only with a substantial time delay. PFS was also accepted by CHMP in other studies in other NET populations, e.g. the everolimus studies for pNET and carcinoid NETs and other drug substances like sunitinib for pNET. The realtime independent central radiological review for PFS guaranteed comparable and reliable results for PFS.
The benefit of everolimus on median PFS was supported by similar results from several sensitivity analyses, by investigator local assessment and several predefined and post-hoc analysed subgroups, including exploratory analyses of baseline prognostic factors.
Both pre-planned interim OS analyses showed a trend for OS in favour of everolimus vs. placebo with hazard ratios of 0.64 and 0.73.
The breakdown of the response rates was comparable with previous observations in the pNET population and the knowledge of the antiproliferative but not cytotoxic mechanism of action of everolimus. The rate of stable disease and the disease control rate obtained with everolimus were substantially higher than under placebo, with 80.5% vs. 63.9% SD as best overall response, while objective response were rarely seen (PR in 4 patients=2.0% vs. 1 patient=1.0%; no CR). PD as best overall response was reduced to 9.3% with everolimus vs. 26.8% under placebo.
In the subgroup with ileum-originated NET, partial response was reported for 3 patients.
While the rate of deaths on treatment was similar (3.5% and 3.1%), the rate of all deaths was lower under everolimus (20.3% vs. 28.6%)
Uncertainty in the knowledge about the beneficial effects The overall impression from conducted subgroup analyses was that efficacy in terms of PFS HRs was more favourable in case of poorer prognosis. Thus prior chemotherapy, high baseline CgA, high Ki-67/mitotic index, high liver tumour burden were all apparently associated with a more favourable HR. In the subgroup with ileum as the primary site of tumour origin no beneficial effect of everolimus vs. placebo was observed (PFS HR close to one after adjustment). In this subgroup median PFS in the placebo group was also clearly longer than in the full study population. No individual prognostic factor accounted for this absence of demonstrated PFS benefit, but normal CgA and absence of bone involvement might be of importance. On the other hand three partial responses were observed in 47 patients in the everolimus group, i.e. more than expected underlying the heterogeneity in this subgroup. These data are adequately reflected in the SmPC sections 4.4 and 5.1.
Baseline NSE >/≤ULN was the statistically most significant prognostic factor in the studied population, in contrast to baseline CgA >/≤2xULN. However, applying a different cut-off with CgA >/≤ULN, it seemed that the full population benefitted from treatment, whereas the ileum subgroup did not. Notably, the study population with several tumour origins of GI and lung neuroendocrine tumours was too distinct to thoroughly investigate this. These data are adequately reflected in the SmPC section 5.1.
Risks
Unfavourable effects With regard to the nature of known and listed adverse reactions, the overall toxicity profile was comparable to those observed in earlier NET populations and in the full oncology safety pool and is
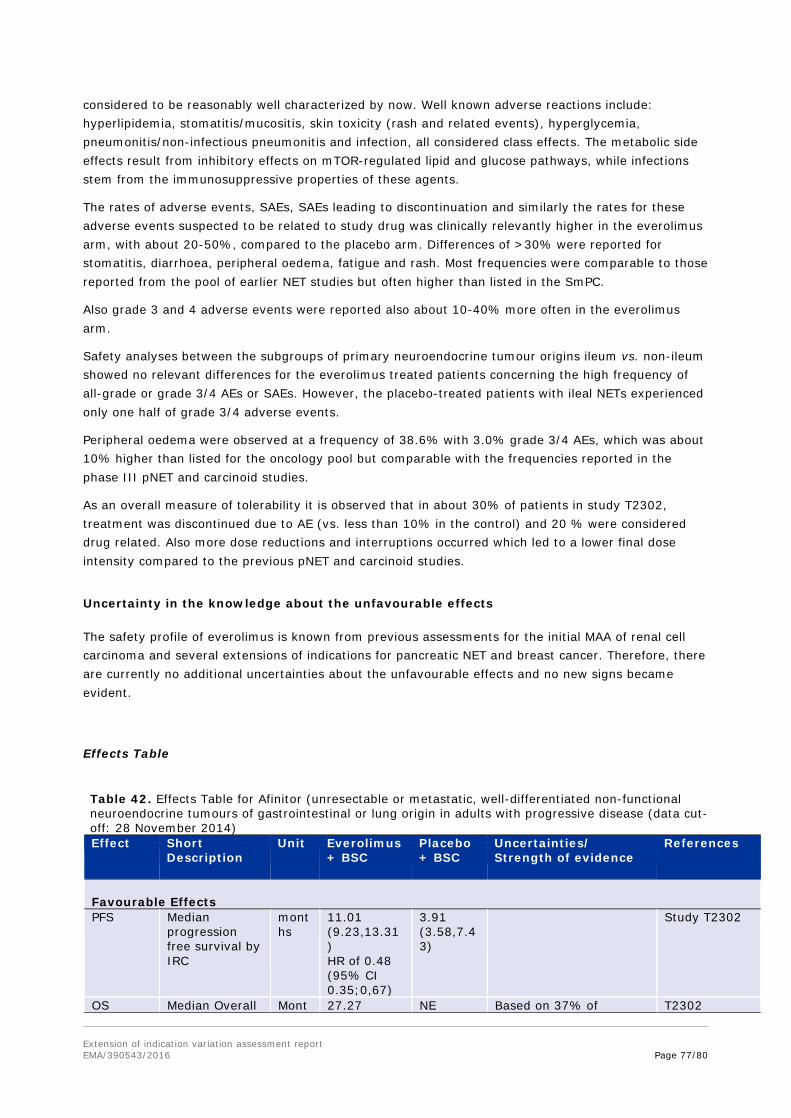
Extension of indication variation assessment report EMA/390543/2016 Page 77/80
considered to be reasonably well characterized by now. Well known adverse reactions include: hyperlipidemia, stomatitis/mucositis, skin toxicity (rash and related events), hyperglycemia, pneumonitis/non-infectious pneumonitis and infection, all considered class effects. The metabolic side effects result from inhibitory effects on mTOR-regulated lipid and glucose pathways, while infections stem from the immunosuppressive properties of these agents.
The rates of adverse events, SAEs, SAEs leading to discontinuation and similarly the rates for these adverse events suspected to be related to study drug was clinically relevantly higher in the everolimus arm, with about 20-50%, compared to the placebo arm. Differences of >30% were reported for stomatitis, diarrhoea, peripheral oedema, fatigue and rash. Most frequencies were comparable to those reported from the pool of earlier NET studies but often higher than listed in the SmPC.
Also grade 3 and 4 adverse events were reported also about 10-40% more often in the everolimus arm.
Safety analyses between the subgroups of primary neuroendocrine tumour origins ileum vs. non-ileum showed no relevant differences for the everolimus treated patients concerning the high frequency of all-grade or grade 3/4 AEs or SAEs. However, the placebo-treated patients with ileal NETs experienced only one half of grade 3/4 adverse events.
Peripheral oedema were observed at a frequency of 38.6% with 3.0% grade 3/4 AEs, which was about 10% higher than listed for the oncology pool but comparable with the frequencies reported in the phase III pNET and carcinoid studies.
As an overall measure of tolerability it is observed that in about 30% of patients in study T2302, treatment was discontinued due to AE (vs. less than 10% in the control) and 20 % were considered drug related. Also more dose reductions and interruptions occurred which led to a lower final dose intensity compared to the previous pNET and carcinoid studies.
Uncertainty in the knowledge about the unfavourable effects
The safety profile of everolimus is known from previous assessments for the initial MAA of renal cell carcinoma and several extensions of indications for pancreatic NET and breast cancer. Therefore, there are currently no additional uncertainties about the unfavourable effects and no new signs became evident.
Effects Table
Table 42. Effects Table for Afinitor (unresectable or metastatic, well-differentiated non-functional neuroendocrine tumours of gastrointestinal or lung origin in adults with progressive disease (data cut-off: 28 November 2014) Effect Short
Description Unit Everolimus
+ BSC Placebo + BSC
Uncertainties/ Strength of evidence
References
Favourable Effects PFS
Median progression free survival by IRC
months
11.01 (9.23,13.31) HR of 0.48 (95% CI 0.35;0,67)
3.91 (3.58,7.43)
Study T2302
OS Median Overall Mont 27.27 NE Based on 37% of T2302
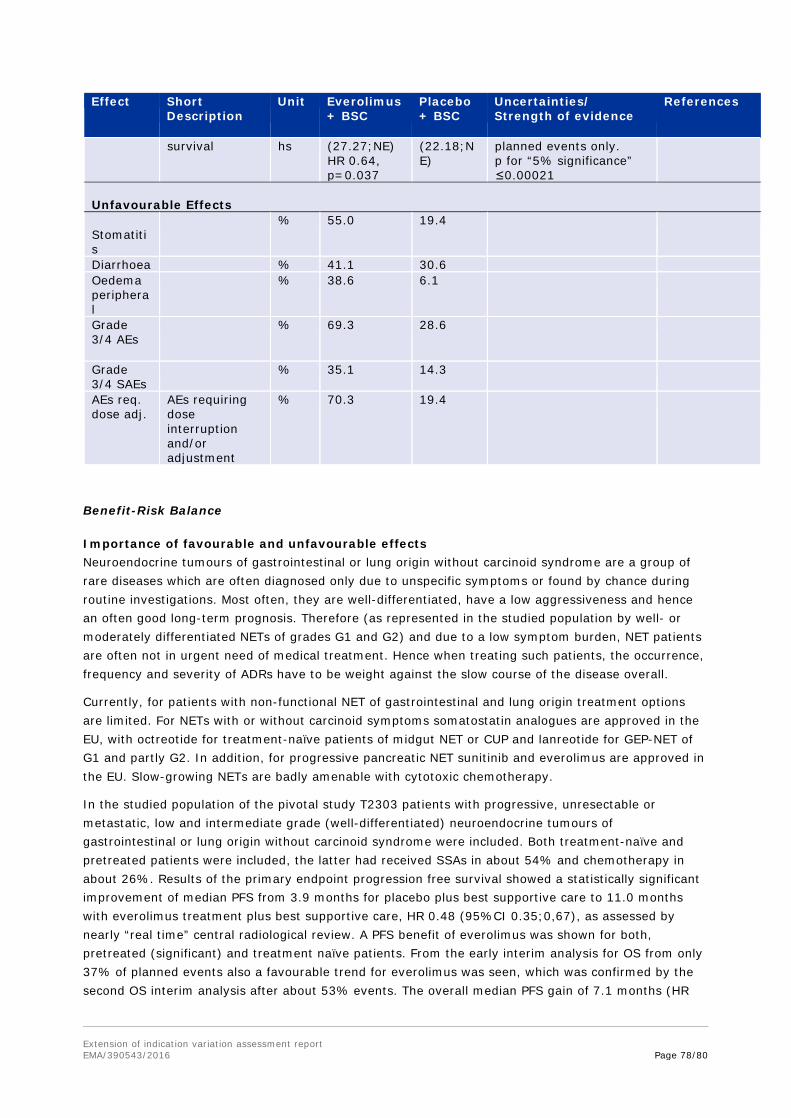
Extension of indication variation assessment report EMA/390543/2016 Page 78/80
Effect Short Description
Unit Everolimus + BSC
Placebo + BSC
Uncertainties/ Strength of evidence
References
survival hs (27.27;NE) HR 0.64, p=0.037
(22.18;NE)
planned events only. p for “5% significance” ≤0.00021
Unfavourable Effects Stomatitis
% 55.0 19.4
Diarrhoea % 41.1 30.6 Oedema peripheral
% 38.6 6.1
Grade 3/4 AEs
% 69.3 28.6
Grade 3/4 SAEs
% 35.1 14.3
AEs req. dose adj.
AEs requiring dose interruption and/or adjustment
% 70.3 19.4
Benefit-Risk Balance
Importance of favourable and unfavourable effects Neuroendocrine tumours of gastrointestinal or lung origin without carcinoid syndrome are a group of rare diseases which are often diagnosed only due to unspecific symptoms or found by chance during routine investigations. Most often, they are well-differentiated, have a low aggressiveness and hence an often good long-term prognosis. Therefore (as represented in the studied population by well- or moderately differentiated NETs of grades G1 and G2) and due to a low symptom burden, NET patients are often not in urgent need of medical treatment. Hence when treating such patients, the occurrence, frequency and severity of ADRs have to be weight against the slow course of the disease overall.
Currently, for patients with non-functional NET of gastrointestinal and lung origin treatment options are limited. For NETs with or without carcinoid symptoms somatostatin analogues are approved in the EU, with octreotide for treatment-naïve patients of midgut NET or CUP and lanreotide for GEP-NET of G1 and partly G2. In addition, for progressive pancreatic NET sunitinib and everolimus are approved in the EU. Slow-growing NETs are badly amenable with cytotoxic chemotherapy.
In the studied population of the pivotal study T2303 patients with progressive, unresectable or metastatic, low and intermediate grade (well-differentiated) neuroendocrine tumours of gastrointestinal or lung origin without carcinoid syndrome were included. Both treatment-naïve and pretreated patients were included, the latter had received SSAs in about 54% and chemotherapy in about 26%. Results of the primary endpoint progression free survival showed a statistically significant improvement of median PFS from 3.9 months for placebo plus best supportive care to 11.0 months with everolimus treatment plus best supportive care, HR 0.48 (95%CI 0.35;0,67), as assessed by nearly “real time” central radiological review. A PFS benefit of everolimus was shown for both, pretreated (significant) and treatment naïve patients. From the early interim analysis for OS from only 37% of planned events also a favourable trend for everolimus was seen, which was confirmed by the second OS interim analysis after about 53% events. The overall median PFS gain of 7.1 months (HR

Extension of indication variation assessment report EMA/390543/2016 Page 79/80
0.48) has to be seen in the context of the trend to improvement in overall survival and provides a clinically meaningful benefit for the everolimus treated patient population in study T2302.
Literature and clinical guidelines (e.g. ENETS) describe jejuno-ileal NETs as a certain NET entity with distinct clinical and mainly good prognostic characteristics and thus different treatment approaches compared to other gastrointestinal NETs. In the ileum group everolimus provided no additional clinical advantage in terms of median PFS; on the other hand, NETs of jejunum had a considerable worse prognosis compared to ileum NETs.
The pivotal study showed that the overall treatment benefit of everolimus is minimal compared to placebo treatment in the ileum patient group, but everolimus has relevant side effects, which were as pronounced in the ileum group as in the overall population.
The requested elaboration of relevant prognostic factors from the ileum and non-ileum patient groups provided statistically significant results for baseline NSE and grading according to Ki-67/mitotic index for the full population, whereas for the ileum group also normal baseline CgA levels and no bone involvement are considered clinically relevant for a treatment decision.
Respective new information was included in the SmPC.
The toxicity profile of everolimus has been known for several years based on clinical studies and post-marketing data in various approved oncologic (and for other non-oncologic) indications. Certain (very) common toxicities obviously impair the daily life of the patients with diarrhoea, stomatitis, rash, infections, etc. While it is acknowledged that adverse reactions are often graded mild to moderate and possible to control in clinical practice by administration of supportive care, the safety results of study T2301 showed details of an increased toxicity in terms of frequencies and severities in the GI and lung NET population, as compared to other NET and tumour entities, and resulted in more dose adjustments, and finally overall lower dose intensity. With a median duration of therapy of 40+ weeks, this makes everolimus rather poorly tolerated.
However, although the substantial toxicity of everolimus is obvious according to the HRQOL data there is no clinically important disadvantage in HRQOL for the entire population.
Benefit-risk balance For patients with progressive unresectable or metastatic GI or lung NET the gain in median PFS of 7.1 months in study T2302 is considered to be a clinically relevant benefit, in spite of the known toxicities of everolimus treatment. The PFS benefit in progressive patients was independent of pretreatment with SSAs or chemotherapy, thus a clinical advantage compared to standard of care, which is here best supportive care only (i.e. placebo) was shown.
A benefit in terms of median PFS gain is not significant in the subgroup of patients with ileum as tumour origin and it has been shown that the efficacy of everolimus is clearly lower in patients with tumours of good prognosis. However, TEAEs and TESAEs were seen at similar frequencies in patients with ileal and non-ileal NETs. As a result, new information concerning prognostic factors that could guide the clinician in the individual benefit-risk assessment was included in the SmPC.
The nature of toxicities seen in this population was comparable to the known safety profile, however with certain higher frequencies or severity grade compared to the oncology safety pooled data. This resulted in more dose interruptions and dose reductions than observed in previous NET studies. Nevertheless, even with overall lower dose intensities the gain in PFS and trend for prolonged OS were seen. Thus, the benefit-risk balance in the proposed indication is considered positive.
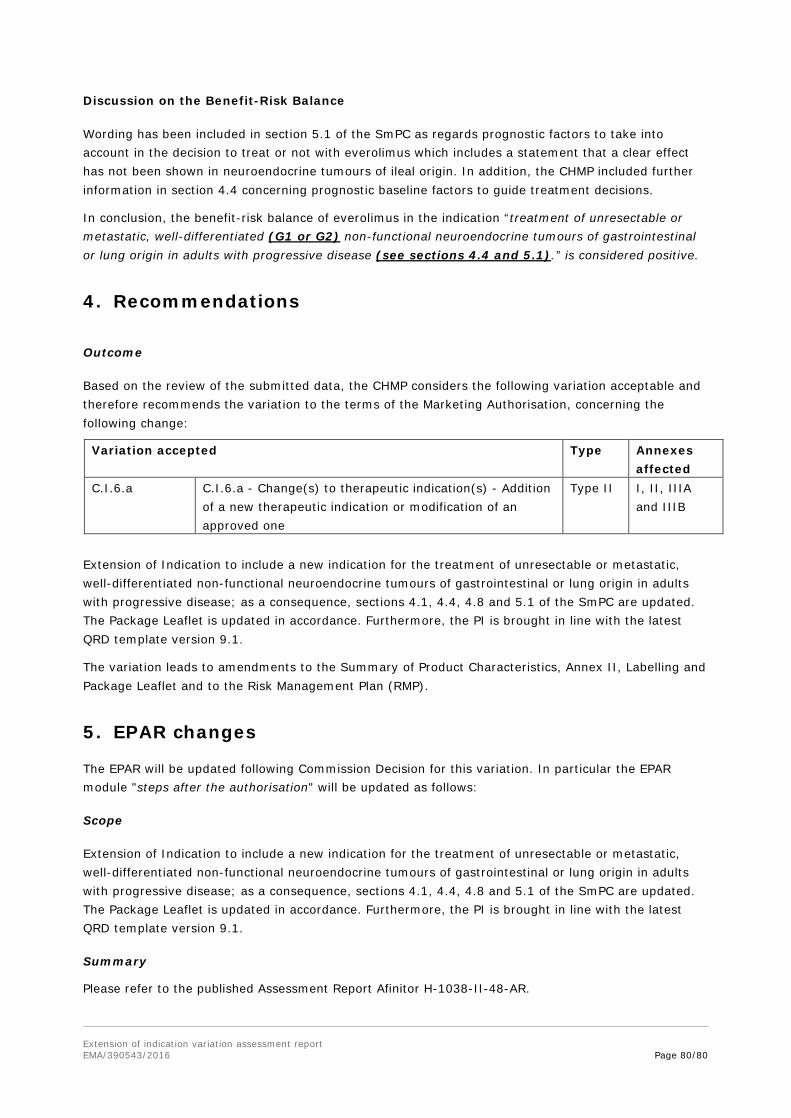
Extension of indication variation assessment report EMA/390543/2016 Page 80/80
Discussion on the Benefit-Risk Balance
Wording has been included in section 5.1 of the SmPC as regards prognostic factors to take into account in the decision to treat or not with everolimus which includes a statement that a clear effect has not been shown in neuroendocrine tumours of ileal origin. In addition, the CHMP included further information in section 4.4 concerning prognostic baseline factors to guide treatment decisions.
In conclusion, the benefit-risk balance of everolimus in the indication “treatment of unresectable or metastatic, well-differentiated (G1 or G2) non-functional neuroendocrine tumours of gastrointestinal or lung origin in adults with progressive disease (see sections 4.4 and 5.1).” is considered positive.
4. Recommendations
Outcome
Based on the review of the submitted data, the CHMP considers the following variation acceptable and therefore recommends the variation to the terms of the Marketing Authorisation, concerning the following change:
Variation accepted Type Annexes affected
C.I.6.a C.I.6.a - Change(s) to therapeutic indication(s) - Addition of a new therapeutic indication or modification of an approved one
Type II I, II, IIIA and IIIB
Extension of Indication to include a new indication for the treatment of unresectable or metastatic, well-differentiated non-functional neuroendocrine tumours of gastrointestinal or lung origin in adults with progressive disease; as a consequence, sections 4.1, 4.4, 4.8 and 5.1 of the SmPC are updated. The Package Leaflet is updated in accordance. Furthermore, the PI is brought in line with the latest QRD template version 9.1.
The variation leads to amendments to the Summary of Product Characteristics, Annex II, Labelling and Package Leaflet and to the Risk Management Plan (RMP).
5. EPAR changes
The EPAR will be updated following Commission Decision for this variation. In particular the EPAR module "steps after the authorisation" will be updated as follows:
Scope
Extension of Indication to include a new indication for the treatment of unresectable or metastatic, well-differentiated non-functional neuroendocrine tumours of gastrointestinal or lung origin in adults with progressive disease; as a consequence, sections 4.1, 4.4, 4.8 and 5.1 of the SmPC are updated. The Package Leaflet is updated in accordance. Furthermore, the PI is brought in line with the latest QRD template version 9.1.
Summary
Please refer to the published Assessment Report Afinitor H-1038-II-48-AR.


![Gastrointestinal bleeding from Dieulafoy’s lesion ... · hematemesis and melena[9]. For example, in a review of 177 cases, 51% presented with hematemesis and melena, 28% of patients](https://img.pdfslide.net/doc/110x75/60621e43b491de54ad247179/gastrointestinal-bleeding-from-dieulafoyas-lesion-hematemesis-and-melena9.jpg)