Embed Size (px)
Citation preview

Extension of the Single-Event Microkinetic Model to AlkylSubstituted Monoaromatics Hydrogenation on a Pt CatalystTapan Bera, Joris W. Thybaut,* and Guy B. Marin
Laboratory for Chemical Technology, Ghent University, Krijgslaan 281−S5, B-9000 Ghent, Belgium
ABSTRACT: The Single-Event MicroKinetic (SEMK) method-ology, which had been successfully applied to benzene hydro-genation on a Pt catalyst, has now been extended towardsubstituted monoaromatics, that is, toluene and o-xylene. Thesingle-event concept combined with thermodynamic constraintsallowed to significantly reduce the number of adjustableparameters. In addition to the number of unsaturated nearestneighbor carbon atoms, H-atom addition rate and equilibriumcoefficients were assumed to depend on the carbon atom type,that is, secondary or tertiary. This leads to three additionalreaction families compared to benzene hydrogenation. Gas phasetoluene and o-xylene hydrogenation experiments were performedon 0.5 wt % Pt/ZSM-22 in a temperature range from 423 to 498K, a total pressure range from 1 to 3 MPa, H2 inlet partialpressures between 100 and 600 kPa and aromatic inlet partialpressures between 10 and 60 kPa. A simultaneous regression ofthe SEMK model to an experimental data set consisting of 39toluene and 37 o-xylene hydrogenation experiments resulted in activation energies of H additions to tertiary carbon atoms thatare 10.5 kJ mol−1 higher than to secondary carbon atoms. This can be related to the steric hindrance experienced during Haddition to a carbon atom bearing a substituent. The presence of a substituent on the aromatic ring was found not to affect thechemisorption enthalpies. The reaction path analysis has been carried out via differential contribution analysis and identified thatthe hydrogenation first occurs at secondary carbon atoms prior to the hydrogenation of the tertiary carbon atoms in thehydrogenation sequence. This is in line with the distribution of hydrocarbon species on the catalyst surface.
KEYWORDS: hydrogenation, monoaromatics, toluene, o-xylene, platinum, noble metal, single-event microkinetic modeling
1. INTRODUCTIONBoth quality and environmental concerns continue to imposestringent restrictions on the aromatics content of transportationfuels. Hydrocracking of heavier petroleum fractions is one of themost important processes in the refining industry for theproduction of high quality fuels. Typical hydrocracking feedscontain a significant aromatics fraction. The high aromaticscontent in distillate fuels lowers their quality and contributessignificantly to the formation of environmentally harmfulemissions.1 The reduction of the aromatics concentration indiesel increases the cetane number and generally improvescombustion characteristics. The catalytic hydrogenation ofaromatic compounds is an important reaction to overcomethese constraints. The increased interest from refiners in dieseldesulfurization and dearomatization has resulted in numerousinvestigations on hydrogenation of model molecules andcomplex mixtures over different types of catalysts. Abundantliterature concerning monoaromatics hydrogenation overvarious catalysts is available. The hydrogenation of benzene,biphenyl, tetralin, and its alkyl derivatives have been studied oversulfided catalysts (Mo, NiMo, CoMo, NiW, FeMo)2−5 as well ason supported noble metal catalysts.6−8 Supported noble metal
catalysts are well-known for their higher hydrogenation activitybut also for their susceptibility to sulfur poisoning and, hence, aretypically only used in the second stage of present-day commercialhydrotreating processes aiming at deep aromatics hydro-genation.9
Kinetic models play a critical role in process and catalystdesign, development, and optimization. Numerous kineticmodels have been proposed in attempts to capture laboratoryexperimental data on aromatics hydrogenation. These modelsare either power law models in their most simple form, whichtypically limits their application to a restricted range of processconditions, or more fundamental Langmuir−Hinshelwood−Hougen−Watson (LHHW) type of models considering a rate-determining step (RDS) which may depend upon the feedstockconsidered or also on the operating conditions. Some authorsproposed the addition of the first H2 molecule or thesimultaneous addition of the first two H atoms as ratedetermining.10−13 Lin and Vannice14 selected a model where
Received: January 24, 2012Revised: April 4, 2012Published: May 9, 2012
Research Article
pubs.acs.org/acscatalysis
© 2012 American Chemical Society 1305 dx.doi.org/10.1021/cs300051j | ACS Catal. 2012, 2, 1305−1318

the first H-atom addition was rate determining for benzene andtoluene hydrogenation on supported Pt catalyst. Other authorsproposed a model with equal rate coefficients for all hydro-genation steps.13,15 Thybaut et al.16 constructed a model withequal surface reaction rate coefficients up to the fourth H-addition step for toluene hydrogenation data on Pt/ZSM-22. ALHHW type of kinetic model for the same data set was alsodeveloped based on a detailed first-principles density functionaltheory calculations and corresponding reaction path analysis.17,18
The Single-Event MicroKinetic (SEMK) methodology goesbeyond the above-mentioned types of kinetic models byexplicitly accounting for the rates of all elementary steps thatare considered in the reaction mechanism and not assuming arate-determining step. The adequate classification of elementarysteps into reaction families ensures the feedstock independenceof the corresponding kinetic parameters.19 It is believed thatSEMK models offer the ability to cover a broader range ofoperating conditions as the entire reaction network is beingconsidered, along with improved accuracy. The SEMK method-ology based upon elementary steps has been developed andapplied mainly for acid catalyzed reaction steps such asisomerization, cracking, and alkylation of hydrocarbons in themethanol-to-olefins (MTO) process,20 catalytic cracking,21−23
or Hydrocracking.24−28 The SEMK methodology has since beenextended to metal catalyzed reactions with Fischer−Tropschsynthesis as example reaction.29 More recently, the samemethodology has been developed and validated for benzenehydrogenation on a Pt catalyst based on atomic H addition to the(partially hydrogenated) aromatic species on the catalystsurface.30
In this work, the SEMK methodology as developed forbenzene hydrogenation is further extended toward substitutedmonoaromatics. The hydrogenation of toluene and o-xylene overa Pt catalyst is used to assess the model parameters related totertiary carbon atoms. Relying on the single-event concept andthe corresponding feed independence of the model parameters,the values obtained for H addition to secondary carbon atoms inthe benzene hydrogenation study30 are used without furtheradjustments in the regression of the toluene and o-xylenehydrogenation data set. A set of physically significant activationenergies and reaction enthalpies was determined by regressionwhile pre-exponential factors were calculated a priori usingstatistical mechanics. Of course, the thermodynamic consistencyof the parameter values was guaranteed. The challenge is toelucidate the detailed surface hydrogenation reaction mechanismand to identify a potential dominant reaction path or theoccurrence of potentially rate-determining steps.
2. PROCEDURES2.1. Catalyst. A 0.5 wt % Pt on ZSM-22 catalyst was used to
investigate aromatics hydrogenation. The zeolite was calcined,exchanged with ammonium cations, and impregnated with anaqueous solution of Pt(NH3)4Cl2 to obtain 0.5 wt % Ptloading.16,31 The deposited Pt metal clusters with a diameter of3 nm were located on the external surface of zeolite crystallites asthe narrow micropores of the zeolite only have a cross section of0.45 nm × 0.55 nm. Hence, the hydrogenation occurred in theintercrystalline pores of the zeolite, devoid of any shapeselectivity. Consecutive acid catalyzed isomerization andcracking reactions were suppressed because of the shape-selective character of the intracrystalline pores of the zeoliteand the corresponding pore mouths. The total concentration ofactive sites was determined at 1 × 10⁻² mol kgcat
−1 which
corresponds to the number of accessible Pt atoms.16,30 The use ofcatalyst pellets with diameters between 0.8 and 1.0 mm wassufficient to avoid diffusion limitations. These catalyst pelletswere prepared by compressing the dry zeolite powder into flakesand subsequent crushing and sieving. The catalyst was calcined inoxygen and afterward reduced in hydrogen at 673 K.More detailsabout the catalyst have been reported in previous publica-tions.16,30
Aromatics hydrogenation is reported to be a structure-insensitive reaction and, hence, the catalyst activity only dependsupon the total number of surface metal atoms and does notdepend upon metal dispersion, crystal plane, or defectstructure.32,33As a result, no (significant) material gap shouldexist in the case of aromatics hydrogenation on Pt, andmechanistic insights remain valid beyond the laboratory scaletesting as discussed in the present work.
2.2. Setup and Operating Conditions. Toluene (AcrosOrganics, 99%) and o-xylene (Acros Organics, 99%) wereselected as substituted model aromatic compounds and hydro-genated in separate experiments in a Berty type reactor which isof the continuous stirred tank reactor (CSTR) type. The reactorset up has been described in previous work.34 Nitrogen (AirLiquide, 99.8%) was used along with hydrogen (Air Liquide,99.99%, H2O and O2 content <10 ppm), and the selected modelhydrocarbon compound to establish the desired hydrogen andhydrocarbon partial pressures. Methane (Air Liquide, 99.9%)was used as internal standard to calculate the hydrocarbon outletflow rates for the verification of the carbon andmass balance overthe reactor. On line analysis of the reactor effluent sample wasperformed using an HP series II 5890 gas chromatographequipped with a 50 m (i.d. = 0.25 mm.) RSL-150 column with a0.25 μm poly dimethylsiloxane film after 1 h stabilization time ofthe equipment. A small H2 flow was sent through the reactor toavoid significant catalyst deactivation between two experimentalruns as a slight decrease in catalytic activity was observed inexperimental runs of 2 to 4 h. Only experiments with values fortotal mass and carbon balance between 95% and 105% areretained. In the further treatment of the data, the outlet flow rateswere normalized to a 100% carbon balance.16 A total of 39 and 37experiments were carried out for toluene and o-xylene hydro-genation respectively with varying temperature, total pressure,H2 inlet partial pressure, molar H2 to aromatics inlet ratio andspace time as specified in Table 1.
The absence of mass transport limitations in intercrystallinepores was verified by calculatingWeisz moduli (∼10−2) for all theexperimental runs.35,36 As hydrogenation occurred on theexternal crystallite surface, intracrystalline diffusion is notrelevant.16 The operating conditions, together with reactantand reactor type were selected to measure intrinsic kinetics, freefrom transport limitations and reactor flow pattern nonidealities.
Table 1. Range of Experimental Conditions in AromaticsHydrogenation Experiments
experimental hydrogenation conditions toluene16 o-xylene
temperature (K) 423−498 423−473total pressure (MPa) 1.0−3.0 1.0−3.0inlet H2 partial pressure (kPa) 10−60 10−60inlet molar H2 to aromatics ratio (γH2/Aro) 5−10 5−10space time (kgcat s mol−1) 27−82 29−90conversion range (mol %) 5−74 0.8−59number of experiments 39 37
ACS Catalysis Research Article
dx.doi.org/10.1021/cs300051j | ACS Catal. 2012, 2, 1305−13181306

The catalyst performance reproducibility was confirmed byrepeating some experiments on two different catalyst batchesimmediately after activation as well as on the same catalyst batchafter performing a series of experiments.Results are reported in terms of the aromatics reactant
conversion which was calculated as follows:
=−
XF F
FA0
A
A0
(1)
Where FA0 and FA represent the aromatics inlet and outlet molar
flow rates.2.3. Parameter Estimation. The estimation of the kinetic
parameters was performed by minimizing the sum of squares ofthe residuals between the experimentally observed and modelcalculated responses. In the present work the molar outlet flowrate of the product cycloalkane was used as a single response. Itwas modeled by adjusting the model parameter vector b, which isexpected to approach the real parameter vector β when theoptimum is reached.
∑= − →=
SSQ F F( ) Minj
nob
j jb
1CA, CA,
2
(2)
Here FCA,j is the experimentally observed molar outlet flow ratefor the cycloalkane produced by hydrogenation of thecorresponding aromatic compound in the jth experiment andFCA,j is the corresponding, model calculated value. Animplementation of the Levenberg−Marquardt algorithm, thatis, the “ordinary least-squares” (OLS) option of the ODRPACK-package version 2.01 was used to perform the minimization.37,38
Some additional source code was added to ODRPACK toretrieve additional statistical information.For a given kinetic model, the cycloalkane molar outlet flow
rate is calculated by solving the non linear equation
− =F R T p F F W( , , , ) 0j j t j jCA, CA, CA, A0
(3)
that is, via the mass balance for this cycloalkane over the reactor,if the latter is not fed. The cycloalkane net production rate iscalculated from the kinetic model, which gives rise to a set ofalgebraic equations, discussed in section 4.3. These algebraicequations are solved simultaneously with the mass balanceequation using a hybrid Powell method.39
The iterative procedure for parameter estimation began byperforming simulations to obtain good initial guesses of theparameters. Once simulation results were within 1 order ofmagnitude of the experimental ones, an optimization procedurewas initiated in which successive iterations according to theLevenberg−Marquardt algorithm were performed for ultimateparameter estimation. Prior to this regression, as manyparameters as possible were calculated from first principles orwere related to each other via thermodynamic constraints, seealso Section 4.4.The significance of the regression is tested by the calculation of
the ratio of the regression sum of squares and the residual sum ofsquares divided by their respective degrees of freedom, that is, theso-called F test for the global significance of the regression. Ahigh F value corresponds to a high significance of the globalregression. The estimated parameters are also tested forstatistical significance on the basis of their individual t values,which are related to the sensitivity of the model calculations onthe values of the individual parameters. A parameter is estimatedsignificantly different from zero when its individual t value is
higher than the corresponding tabulated t value, given bytnobnresp‑npar (0.95). A high t value corresponds to a high sensitivityto the corresponding parameter and, hence, a high significance ora narrow 95% approximate individual confidence interval of thecorresponding parameter. The model discrimination was basedon the physical meaning of the parameters and by comparison ofthe global regression results through the obtained F value.
2.4. Contribution Analysis. A contribution analysis is auseful tool to obtain insight in a complex reaction network.40 Adifferential contribution analysis has been carried out to assessthe relative importance of the various elementary steps in thereaction network. The differential disappearance contributionfactor (ϕ) of reaction step l toward the disappearance ofcomponent j is defined as the ratio of the rate of disappearance ofcomponent j resulting from reaction l to the total rate ofdisappearance of component j via all reaction steps k in whichcomponent j is consumed:
ϕ =∑
r
rl jl j
k k j,d ,
d
,d
(4)
The contribution analysis is typically carried out correspond-ing to a given conversion of the feed component at a certainposition inside the reactor, that is, at a certain composition ofreaction mixture. The analysis is used to quantify the relativeimportance of various elementary steps occurring in the reactionnetwork. This methodology is based on reaction rates and, hence,accounts for the effects of rate coefficients and of surfaceconcentration of reactant species.41 Note that in case of a CSTR,no distinction has to be made between a differential and integralcontribution analysis.
3. EXPERIMENTAL RESULTS: EFFECT OF THEOPERATING CONDITIONS ON HYDROGENATION
The main reaction products of the hydrogenation of toluene ando-xylene were methylcyclohexane (MCH) and 1,2-dimethylcy-clohexane (DMCH) respectively. cis- and trans-1,2-Dimethylcy-clohexane isomers are formed during hydrogenation of o-xylene.An adequate description of the stereochemistry goes beyond thescope of the current work; however, and, hence, cis- and trans-1,2-dimethylcyclohexane isomers are lumped into a singleDMCHoutlet flow rate. Neither partially hydrogenated productssuch as alkylcyclohexadienes and alkylcyclohexenes nor ring-opening products were observed. Only minor amounts (<5%) ofalkyl cyclopentanes and 1,3- and 1,4-dimethylcyclohexanes wereformed by the consecutive isomerization of the productalkylcyclohexane at Bronsted acid sites located at ZSM-22 poremouths. Isomerization reactions are restricted by the shapeselectivity induced by ZSM-22 framework as well as by the largertime scale required for this reaction compared to the hydro-genation reaction. Hence, for all practical purposes, the presentstudy can be limited to the selective hydrogenation of tolueneand o-xylene to methylcyclohexane and dimethylcyclohexane,respectively, and the amounts of cycloalkane isomers observedwere added to the corresponding cycloalkane response.The effect of the operating conditions on the toluene and o-
xylene conversion is consistent with what is typically reported inthe literature.13,14,16,30,42,43 The conversion showed a maximumas a function of the temperature, see Figure 1. From the optimumtemperature onward, the increase of the hydrogenation ratecoefficient with the temperature is overcompensated by thedecrease of the surface concentrations of the (partiallyhydrogenated) aromatic species. Mass transport limitations
ACS Catalysis Research Article
dx.doi.org/10.1021/cs300051j | ACS Catal. 2012, 2, 1305−13181307

cannot be invoked to explain the phenomenon as the intrinsiccharacter of the kinetic data was verified. Other possible causes,such as thermodynamic limitations and catalyst poisoning havealso been verified and can be discarded.8,13
An increase in the hydrogen inlet partial pressure enhances thearomatics hydrogenation, see Figure 2.16,30 Hydrogen partialreaction orders have been determined previously for toluenehydrogenation and range from 0.6 at 423 K over 1.1 and 1.8 at448 and 473 K to 1.3 at 498 K.16 The increase in hydrogen inletpartial pressure keeping all other experimental variables fixedresults in a corresponding increase of the hydrogen surfaceconcentration and, hence, an enhanced cyclohexane outlet flowrate at all temperatures. Hydrogen partial reaction orders alsoallow identifying the position of a rate-determining step, if any, inthe reaction mechanism. The hydrogen partial reaction orderamounts to 0.5 if the most abundant surface intermediate isconsumed in the rate-determining step. For every additionalhydrogen addition required to form the surface intermediate thatis consumed in the rate-determining step out of the mostabundant surface intermediate, the hydrogen partial reactionorder increases by 0.5. As a result hydrogen partial reactionorders up to 1.8 indicate that at least 3 to 4 hydrogen additionsneed to occur prior to a possible rate-determining step, which,hence, if it occurs at all, will be situated near the end of thehydrogenation sequence on the catalyst surface.An opposite effect, that is, no effect or negative effect is
observed for the aromatics inlet partial pressure, see Figure 3.16,30
The corresponding partial reaction orders for toluene have beendetermined at−0.2 at 423 and 448 K and increase to−0.1 at 473and to 0.3 at 498 K.16 The negative partial reaction orders at thelower temperatures are indicative of inhibition effects, that is, thehigher surface concentration of partially hydrogenated species athigher aromatic inlet partial pressures is significantly hinderingthe hydrogen chemisorption. The expected increase in hydro-genation conversion because of the higher surface concentrationsof the partially hydrogenated intermediates is overcompensatedby a corresponding decrease in hydrogen surface concentration.As a result a decrease in hydrogenation conversion is observedwith increasing aromatics inlet partial pressure. The higheraromatic partial reaction order at higher temperatures is a logical
consequence of decreasing (partially hydrogenated) aromatics
surface concentrations with the temperature. As a result, the
inhibition effects are no longer observed at the highest
temperatures.
Figure 1. Toluene (■) and o-xylene (▲) conversion as a function oftemperature at a total pressure of 1 MPa. Symbols: experimentallyobserved values. Lines: calculated based on the net rate of hydro-genation eq 7 and reactor model eq 3 with the pre-exponential factorsfrom Table 2 and the activation energies and reaction enthalpies fromTable 4. Reaction conditions: Toluene hydrogenation: p0T = 20.3 kPa,inlet γH2/T ratio 5,W/F0T = 27.3 kgcat s mol
−1; o-xylene hydrogenation:p0X = 10.1 kPa; inlet γH2/X ratio 10, W/F0X = 29.8 kgcat s mol
−1.
Figure 2. Effect of hydrogen inlet partial pressure on (a) toluene and (b)o-xylene conversion at a total pressure 1 MPa. Symbols: experimentallyobserved values. Lines: calculated based on the net rate of hydro-genation eq 7 and reactor model eq 3 with the pre-exponential factorsfrom Table 2 and the activation energies and reaction enthalpies fromTable 4. Reaction conditions: (a) p0T = 20 kPa; T = 473 K;W/F0T = 40.9kgcat s mol
−1 (■), 27.3 kgcat s mol−1 (□) (b) p0X = 10 kPa;T = 473 K;W/
F0X = 89.3 kgcat s mol−1 (▲), 29.8 kgcat s mol
−1 (Δ).
Figure 3. Toluene (■) and o-xylene (▲) conversion as a function ofaromatics inlet pressure. Reaction conditions: pt = 1 MPa, T = 473 K,p0H2 = 100 kPa,W/F0T = 81.8 kgcat s mol
−1,W/F0X = 29.3 kgcat s mol−1.
Symbols: experimentally observed values. Lines: calculated based on thenet rate of hydrogenation eq 7 and reactor model eq 3 with the pre-exponential factors from Table 2 and the activation energies andreaction enthalpies from Table 4.
ACS Catalysis Research Article
dx.doi.org/10.1021/cs300051j | ACS Catal. 2012, 2, 1305−13181308

4. SEMK MODEL FOR ALKYL SUBSTITUTEDMONOAROMATICS HYDROGENATION
4.1. Surface Reaction Families and Single-EventConcept. Activation energies and surface reaction enthalpiesfor benzene hydrogenation have been assessed using DFTmethods.17,18,44 The number of unsaturated nearest carbonatoms (m = 0, 1, 2) to the carbon atom to which the H atom isbeing added was found to be one of the distinctive featuresbetween the values obtained for the activation energies andreaction enthalpies of the various H-atom additions.30 Hereunsaturated carbon atom means the carbon which has a freeelectron to make a double bond. In addition the activation energyand reaction enthalpy of H-addition elementary steps can alsoreasonably be assumed to depend on the secondary or tertiarycharacter of the carbon atom (n = 2, 3) involved, for example,considering the potential steric hindrance in H addition/subtraction and changing bond stability with the degree ofsubstitution of the reacting carbon atom.30
In addition to this classification of rate coefficients intoreaction families based on energetic considerations, within such areaction family, rate coefficients can still differ from each otherbecause of symmetry effects. This is illustrated in Figure 4, wherethe first hydrogen atom addition to benzene can occur in 6equivalent positions whereas the first hydrogen atom addition totoluene has at most 2 equivalent positions.
The symmetry factor in the rate coefficients was factored outvia the number of single-events, ne, which is defined as the ratio ofsymmetry number of the reactant and the activated complex:
σ
σ= ⧧ne
globr
glob (5)
The detailed development of the single-event methodology isdescribed elsewhere.45 The rate coefficient for an elementarystep is written as the product of the number of single-events andthe single-event rate coefficient:
= · k m n n k m n( , ) ( , )e (6)
A single-event rate coefficient, khyd(m,n), and the correspondingequilibrium coefficient, K(m,n), are assigned to each hydro-genation step. Here m represents the saturation state of nearestneighbors (0, 1, or 2) and n the degree of branching of thereacting carbon atom (2 or 3). This results in six differentreaction families with specific activation energies and reactionenthalpies. The detailed development of the surface reactionfamilies and SEMK model for aromatics hydrogenation isdescribed in our earlier work.30
4.2. Reaction Network for Toluene and o-XyleneHydrogenation. The application of the SEMK methodologyfor aromatics hydrogenation requires the construction of adetailed reaction network for the selected aromatic modelcomponent at the molecular level. Aromatics hydrogenation onPt catalysts is generally assumed to occur through a Horiuti−Polanyi mechanism involving atomic H-addition steps. Com-
pared to benzene hydrogenation, the methyl branching of thearomatic ring in toluene and o-xylene breaks the symmetry that ispresent in the aromatic ring. As a result, the number of parallel H-addition pathways is significantly increased: while in the benzenehydrogenation network, 13 components are interconnectedthrough 20 H additions and 20 H abstractions,30 for toluene 40components are interconnected by 104 H additions and 104 Habstractions, see Figure 5, while for o-xylene 36 components and96 H additions and abstractions are involved, see Figure 6. Themetal atoms were not included in the species representationduring reaction network generation of toluene and o-xylenehydrogenation.30
The reaction network of toluene and o-xylene hydrogenationconsists of several consecutive and parallel elementary steps. Inthe toluene hydrogenation network, 4 partially hydrogenatedintermediates can be formed after a single H addition, 9 after twoH additions, 12 after three H additions, 9 after four H additions,and 4 after five additions before, finally methylcycohexane(MCH) is formed, see Figure 5. Similarly, in the case of o-xylenehydrogenation, 3, 9, 10, 9, and 3 partially hydrogenatedintermediates can be formed after a single, two, three, four, andfive H additions, respectively, before 1,2-dimethylcyclohexane isformed, see Figure 6.
4.3. Kinetic Equations. Unlike in previous Langmuir−Hinshelwood models13,14,16,18,42,43 no dominant reaction path isconsidered in the SEMK model. This implies that the entirehydrogenation network is considered, including the position inwhich the hydrogen atoms are being added. No rate-determiningstep is assumed, either. All H-atom additions and abstractions areconsidered to be non quasi equilibrated. Reactant chemisorptionand product desorption are assumed to be quasi equilibrated.The main assumptions in the SEMK model for substitutedaromatics hydrogenation are identical to those in the case ofbenzene hydrogenation30 and are summarized below:
(i) Competitive, dissociative H2 and molecular aromaticschemisorption on identical sites.
(ii) H2, aromatics and cycloalkane chemisorption are quasi-equilibrated.
(iii) No dehydrogenated surface species are considered.44
(iv) No rate-determining step or dominant reaction path isassumed.
(v) Each reaction step of the network is considered to bereversible.
(vi) The steady state hypothesis is applied for the partiallyhydrogenated surface intermediates.
(vii) The single-event rate coefficients for atomic H additiononly depend on the number of unsaturated nearestneighbor carbon atoms (m) with respect to the carbonatom involved in the H addition and branching degree (n)of the reacting carbon atom.
In the SEMK model developed for benzene hydrogenationonly the saturation sate of the adjacent carbon atoms to thereacting carbon atom plays a role. In the case of toluene and o-xylene hydrogenation, because of the presence of a methylsubstituent, the branching degree of the reactive carbon atommay also affect the elementary H-addition kinetics, see Section4.1.Each elementary step of the reaction network is considered
reversible and potentially contributes to the net production rate.The net production rate of the hydrogenated aromatics in the gasphase is assumed to be equal to the net production rate of thechemisorbed hydrogenated aromatics. For determining the
Figure 4. Symmetry effects in hydrogen atom addition.
ACS Catalysis Research Article
dx.doi.org/10.1021/cs300051j | ACS Catal. 2012, 2, 1305−13181309

latter, the concentrations of all surface intermediates arerequired. The pseudosteady state hypothesis is applied todetermine these concentrations of partially hydrogenated surfaceintermediates. The net production rate (Rj) of any intermediate jis calculated using eq 7.
∑
∑
= −
= + *
− + *
→ →
→ *
→ *
R r r
n k m n C k m n C C
n k m n C k m n C C
( )
{ [ ( , ) ( , ) ]
[ ( , ) ( , ) ] }
ji
i j j i
ie i j i i i i i
e j i j j j j j
hyd/deh deh/hyd
, hyd H deh
, hyd H deh (7)
In the latter equation, the single-event dehydrogenation ratecoefficient kdeh(m,n) is calculated from single-event hydro-genation rate coefficient, khyd(m,n) and the correspondingequilibrium coefficient, K(m,n).4.4. Reduction of Number of Adjustable Model
Parameters. The SEMK model for the benzene hydrogenationcontains 9 coefficients, each consisting of a pre-exponential factorand an activation energy or a reaction enthalpy.30 The extension
of the SEMK hydrogenation model toward substituted aromaticssuch as toluene and o-xylene, requires accounting for the additionof hydrogen atoms to tertiary carbon atoms. This doubles thenumber of single-event rate and equilibrium coefficients. Whilethe experimental data have been acquired separately, theregression analysis for toluene and o-xylene hydrogenation wasdone simultaneously. As a result of the above-discussedconsiderations, the SEMK model for toluene and o-xylenehydrogenation contains 17 coefficients, that is, 6 single-eventhydrogenation rate coefficients, 6 single-event (de)-hydro-genation equilibrium coefficients, and 5 chemisorption equili-brium coefficients. The temperature dependence of eachparameter doubles the number of adjustable parameters to 34,which is an excessive number of parameters to be determinedaccurately based on a single response, that is, the molar outletflow rate of the hydrogenated aromatic component. Hence, areduction in the number of adjustable parameters is necessary byusing statistical thermodynamics and thermodynamic consis-tency.
Figure 5. Toluene hydrogenation reaction network indicating the number of partially hydrogenated intermediates on the catalyst surface as well as therate coefficients with different color and corresponding reaction families involved in the various hydrogen atom addition reactions. Contribution analysisfor toluene hydrogenation on Pt/ZSM-22 at T = 473 K,W/F0T = 81.8 kg s mol
−1; pt = 1 MPa; p0T = 10 kPa, inlet γH2/T ratio 10 for the simplified model.Numbers above and below the arrows, calculated using eq 4, indicate percentage contributions of the corresponding elementary step toward the overallconsumption of the considered species. Numbers indicating hydrogenation steps are in bold. The thickness of the reversible arrows is scaled according tolog(r). Rates below 10−4 mol kgcat
−1s−1 are indicated by dashed arrows. Numbers inside the rings are the calculated percentage distributions between thehydrocarbon species. “Preferred” reaction pathway of toluene hydrogenation on Pt catalyst is shown by full line arrow as per the SEMK model.
ACS Catalysis Research Article
dx.doi.org/10.1021/cs300051j | ACS Catal. 2012, 2, 1305−13181310

4.4.1. Statistical Thermodynamics. Analogous to the SEMKmodel for benzene hydrogenation, all pre-exponential factors ofthe single-event rate coefficients k (m,n), the single-eventequilibrium coefficients K(m,n), and the chemisorption equili-brium coefficients were assessed using transition state theory andstatistical thermodynamics.46,47 These pre-exponential factorswere kept fixed during the model regression to determine theactivation energies and reaction enthalpies. As a result, thenumber of adjustable parameters was reduced from 34 to 17. Thepre-exponential factors of the single-event rate and equilibriumcoefficients were assumed to be independent of the carbon atomtype considered, that is, identical values were used irrespective ofthe secondary or tertiary nature of the carbon atom involved inthe reaction. The pre-exponential factor calculations were basedon physically reasonable assumptions with respect to themobility of the species involved in the considered elementarysteps. Hence, similar mobility is assumed for benzene, toluene,and o-xylene.18 Regressions have been performed with varioussets of pre-exponential factor values which were in the range ofphysically acceptable values. The selected set of pre-exponentialfactor values, see Table 2, was that giving rise to the leastsystematic deviations between experimental observations andmodel calculations as well as to the physically most significant setof activation energies and reaction enthalpies. This set
corresponded with a significant loss of translational freedom
upon toluene and o-xylene chemisorption, while the hydrogen
mobility on the catalyst surface was higher. More details on the
pre-exponential factor calculations and their physical significance
are reported in previous work.16,30
4.4.2. Thermodynamic Consistency. Thermodynamic con-
sistency can be applied between elementary steps on the catalyst
surface as well as for the entire aromatics hydrogenation pathway
to establish relationships between model parameters and, hence,
further reduce the number of adjustable parameters.30 The
relationships below are those constructed based on thermody-
namic consistency for benzene hydrogenation:30
· = · K K K K(1, 2) (1, 2) (2, 2) (0, 2) (8)
Figure 6. o-Xylene hydrogenation reaction network indicating the number of the partially hydrogenated intermediates on the catalyst surface as well asthe rate coefficients with different color and corresponding reaction families involved in the various hydrogen atom addition reactions. Contributionanalysis for o-xylene hydrogenation on Pt/ZSM-22 at T = 473 K,W/F0X = 89.3 kg s mol
−1; pt = 1MPa; p0X = 10 kPa, inlet γH2/x ratio 10 for the simplifiedmodel. Numbers above and below the arrows, calculated using eq 4, indicate percentage contributions of the corresponding elementary step toward theoverall consumption of the considered species. Numbers indicating hydrogenation steps are in bold. The thickness of the reversible arrows is scaledaccording to log(r). Rates below 10−4 mol kgcat
−1 s−1 are indicated by dashed arrows. Numbers inside the rings are the calculated percentage distributionsbetween the hydrocarbon species. “Preferred” reaction pathway of o-xylene hydrogenation on Pt catalyst is shown by full line arrow as per the SEMKmodel.
Table 2. Values for the Pre-Exponential Factors Used duringRegression30
K0(m,n) (s−1)a K0(m,n)a KA0 (Pa−1) KH2
0 ) (Pa−1)
1016 1 10−12 10−11
am = 0, 1, 2; n = 2, 3.
ACS Catalysis Research Article
dx.doi.org/10.1021/cs300051j | ACS Catal. 2012, 2, 1305−13181311

Δ = Δ + Δ
Δ = Δ + Δ
⎧⎨⎪⎪
⎩⎪⎪
HH H
SS S
(1, 2)(2, 2) (0, 2)
2
(1, 2)(2, 2) (0, 2)
2 (9)
These relationships remain valid for toluene and o-xylenehydrogenation as similar pathways exist within the complexreaction network of these two compounds.The presence of surface intermediates with one or more
tertiary carbon atoms brings two additional independent Born−Haber cycles with them, see Figure 7. The hydrogenation of 2-
hydrotoluene to 1,2,6-trihydrotoluene, see Figure 7a, can occurthrough two thermodynamically different pathways leading tothe following constraints on the corresponding reactionenthalpies and entropies based on the principle of thermody-namic consistency:
= K K K K(1, 3) (1, 2) (2, 2) (0, 3) (10)
Δ + Δ= Δ + Δ
Δ + Δ = Δ + Δ
⎧⎨⎪
⎩⎪H H
H H
S S S S
(1, 3) (1, 2)(2, 2) (0, 3)
(1, 3) (1, 2) (2, 2) (0, 3) (11)
Similarly, the hydrogenation of 3-hydrotoluene to 1,2,3-trihydrotoluene, see Figure 7b, leads to two additionalconstraints:
= K K K K(1, 3) (1, 2) (2, 3) (0, 2) (12)
Δ + Δ= Δ + Δ
Δ + Δ = Δ + Δ
⎧⎨⎪
⎩⎪H H
H H
S S S S
(1, 3) (1, 2)(2, 3) (0, 2)
(1, 3) (1, 2) (2, 3) (0, 2) (13)
Thermodynamic consistency can also be applied toward theentire catalytic cycle of toluene and o-xylene hydrogenation:
Δ = Δ + Δ + Δ+ Δ + Δ− Δ
Δ = Δ + Δ + Δ+ Δ + Δ− Δ
⎧
⎨
⎪⎪⎪⎪
⎩
⎪⎪⎪⎪
H H H HH H
H
S S S SS S
S
3 (0, 2)4 (1, 2) (2, 3)
3 (0, 2)4 (1, 2) (2, 3)
g
g
,MCH T H
MCH
,MCH T H
MCH
2
2
(14)
Δ = Δ + Δ + Δ+ Δ + Δ+ Δ − Δ
Δ = Δ + Δ + Δ+ Δ + Δ+ Δ − Δ
⎧
⎨
⎪⎪⎪⎪
⎩
⎪⎪⎪⎪
H H H HH H
H H
S S S SS S
S S
3 (0, 2)3 (1, 2) (1, 3)
(2, 3)
3 (0, 2)3 (1, 2) (1, 3)
(2, 3)
g x
g x
,DMCH H
DMCH
,DMCH H
DMCH
2
2
(15)
From eqs 14 and 15, values for the chemisorption enthalpies andentropies of methylcyclohexane and 1,2-dimethylcyclohexanehave been determined.It can be noted that, because of the thermodynamic
consistency relationships eqs 9, 11, 13, the relationships eqs 14and 15 are independent of the actual pathway followed on thesurface. As a result, the number to kinetic parameters to beestimated is further reduced from 17 to 13. Hence 6 activationenergies [Ea(0,2), Ea(1,2), Ea(2,2), Ea(0,3), Ea(1,3), Ea(2,3)], 3reaction enthalpies [ΔH(0,2), ΔH(2,2), ΔH(0,3)] and 3chemisorption enthalpies [ΔHT, ΔHX, ΔHH2] are to beestimated in the SEMK model for aromatics hydrogenation.
4.4.3. Single-Event Methodology. The kinetic and thermo-dynamic parameters in the SEMK aromatics hydrogenationmodel related to secondary carbon atoms have been estimated aspart of previous work on benzene hydrogenation on a Ptcatalyst.30 Relying on the single-event concept and thecorresponding feed independence of the model parameters, theactivation energies and reaction enthalpies for H addition tosecondary carbon atoms as well as chemisorption enthalpy ofhydrogen, obtained from selected SEMK model of benzenehydrogenation, are used without further adjustments in theregression of the toluene and o-xylene hydrogenation data set. Asa result, only the activation energies and surface reactionenthalpies of the H addition to tertiary carbon atoms and thechemisorption enthalpies of toluene and o-xylene are to bedetermined from regression. Hence, the ultimate number ofadjustable kinetic parameters in the extended SEMK model forsubstituted aromatics is limited to 6; 3 activation energies[Ea(0,3), Ea(1,3), Ea(2,3)], 1 reaction enthalpy [ΔH(0,3)] and 2chemisorption enthalpies [ΔHT, ΔHX].
5. REGRESSION RESULTS AND DISCUSSION
Nonisothermal regression analysis was performed for tolueneand o-xylene hydrogenation data simultaneously. As a referencemodel all 6 adjustable parameters have been estimated withoutfurther constraints. The obtained results are discussed in Section5.1 and have suggested guidelines for further modelsimplification which are subsequently addressed in Section 5.2.
5.1. Reference Model: 6 Adjustable Parameters. In thisreference model all 6 remaining adjustable parametersmentioned in Section 4.4.3 are estimated simultaneously withoutfurther constraints using the toluene and o-xylene hydrogenationdata sets. The agreement that can be reached between theexperimentally observed and model calculated methylcyclohex-ane and 1,2-dimethylcyclohexane molar outlet flow rates isshown in the parity diagrams in Figure 8. An F value for the globalsignificance of the regression amounting to 352 was obtained,indicating that the regression was indeed significant. Theparameter estimates along with their individual 95% confidenceintervals are reported in Table 3 and are in agreement withliterature reported values.14,16,18,48−50 The activation energies arein the range of 55 to 70 kJ mol−1 for H addition to a secondary or
Figure 7. Thermodynamic consistency for hydrogenation of (a) 2-hydrotoluene to 1,2,6-trihydrotoluene and (b) 3-hydrotoluene to 1,2,3-trihydrotoluene.
ACS Catalysis Research Article
dx.doi.org/10.1021/cs300051j | ACS Catal. 2012, 2, 1305−13181312

a tertiary aromatic carbon atom, see Table 3 . Lin and Vanniceestimated apparent activation energies in the range of 50−60 kJmol−1 for benzene, toluene and xylene hydrogenation onsupported Pt catalyst, which leads to even higher true activationenergies considering a typical aromatics chemisorption enthalpyof 60 kJ mol−1.14 Thybaut et al. estimated a true activation energyin the range of 40 to 50 kJ mol−1 for toluene hydrogenation onthe same Pt catalyst which is used in this study.16 The activationenergies for H addition to a tertiary carbon atom aresystematically higher than those for H addition to a secondarycarbon atom. This can be related to the steric hindrance causedby the methyl group. Given the identical pre-exponential factors
that were used, the H additions to tertiary carbon atoms have alower rate coefficient than those to secondary carbon atoms.It is to be noted that Ea(1,3) and Ea(2,3) have a much wider
confidence intervals compared to Ea(0,3). It indicates that the Haddition to a tertiary aromatic carbon atom with saturatedneighboring carbon atoms is kinetically more relevant than the Hadditions to a tertiary aromatic carbon atom with at least oneunsaturated neighboring carbon atom. Moreover, Ea(0,3) islower than Ea(1,3) and Ea(2,3), and, hence, the hydrogen atomwill be preferentially added at a tertiary carbon after H additionshave occurred on the neighboring carbon atoms. This indicatesthat a dominant reaction pathway, if any, will have the H additionto a tertiary carbon atom near the end of the hydrogenationsequence.Surface reaction enthalpies were estimated significantly
although the values are rather close to zero. They indicate aslight endothermicity of the hydrogenation reactions on thecatalyst surface which agrees with quantum chemically obtainedvalues and with the conclusion that the aromaticity of thereactant is lost upon chemisoption on Pt catalyst surface.16,18
Practically no difference in values was noticeable for theestimated toluene and o-xylene chemisorption enthalpies, that is,−54.6 versus −56.4 kJ mol−1. Lin and Vannice14 foundchemisorption enthalpies in the range of −50 to −70 kJ mol−1
for toluene hydrogenation on supported Pt catalyst, whileThybaut et al.16 estimated a value of −70 kJ mol−1 for toluenechemisorption on Pt. Moreover, with a value of −56 kJ mol−1
estimated with the SEMK model,30 also the benzenechemisorption enthalpy is of the same order of magnitude and,hence, the differences between the aromatic chemisorptionenthalpies are insufficient to explain the differences in hydro-genation kinetics of the various components. It seems from thesevalues that aromatic chemisorption is mainly governed by theloss of the aromaticity of the ring, regardless its substitutiondegree. As a result, according to the SEMK model, differences inhydrogenation rates between the investigated monoaromaticcomponents are primarily due to differences in H addition ratecoefficients rather than in chemisorption strength.As calculated from thermodynamic consistency, the chem-
isorption of the hydrogenated products is almost thermoneutralto even endothermic. This is in agreement with a rapid,irreversible desorption from the catalyst surface as it was alsoconcluded for the benzene hydrogenation data.30
5.2. Simplified Model: 4 Adjustable Parameters. Asevident from the results of the unconstrained regression in thereference model, the difference between the activation energiesfor H addition to a secondary or a tertiary carbon atom seemspractically independent from the number of unsaturatedneighboring carbon atoms. As a result, in the present paragraph,the performance of a simplified model is investigated in which aidentical increment between activation energies for H addition tosecondary and tertiary carbon atoms, regardless of the number ofunsaturated nearest neighbor atoms [ΔEater‑sec = Ea(0,3) −Ea(0,2) = Ea(1,3) − Ea(1,2) = Ea(2,3) − Ea(2,2)], is assumedbetween the corresponding activation energies. This reduces thenumber of adjustable parameters in the simultaneous regressionof toluene and o-xylene hydrogenation data to 4.An F value amounting to 517 was obtained for the global
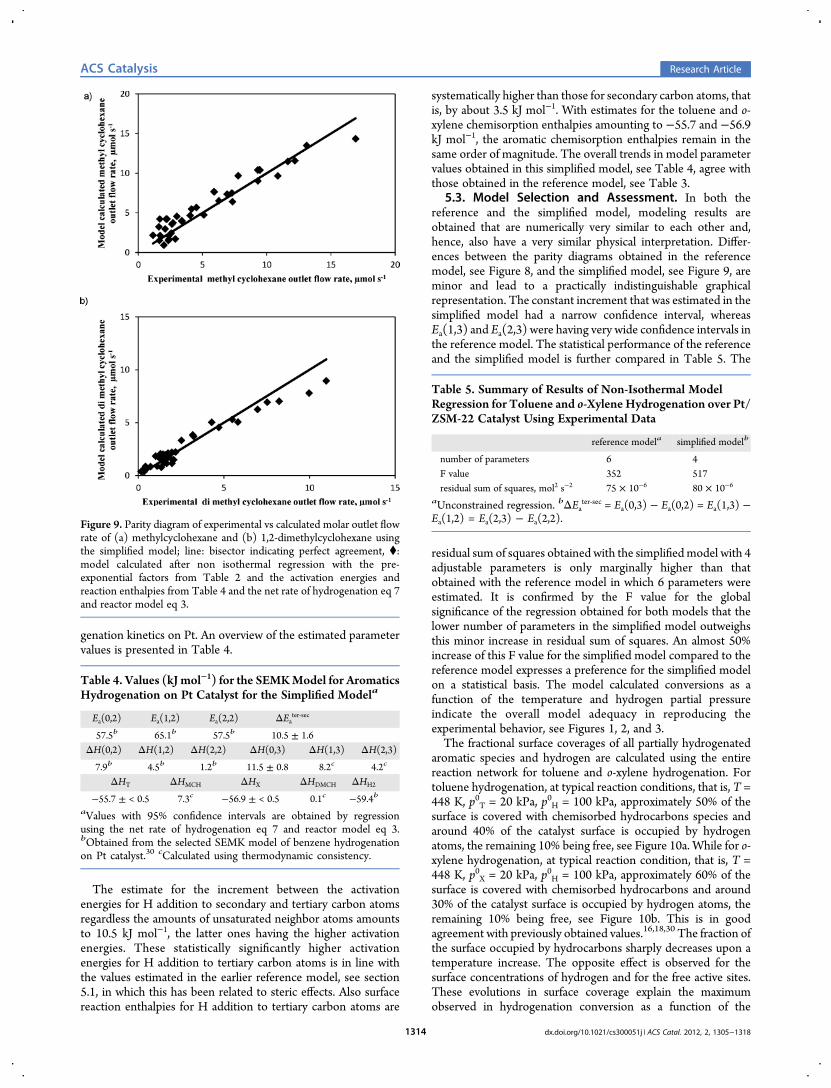
significance of the regression. The parity diagrams for outlet flowrate of methylcyclohexane and 1,2-dimethylcyclohexane aregiven in Figure 9 and indicate that also the simplified model isable to adequately describe the toluene and o-xylene hydro-
Figure 8. Parity diagram of experimental vs calculated molar outlet flowrate of (a) methylcyclohexane and (b) 1,2-dimethylcyclohexane usingthe reference model; line: bisector indicating perfect agreement, ⧫:model calculated after non isothermal regression with the pre-exponential factors from Table 2 and the activation energies andreaction enthalpies from Table 3 and the net rate of hydrogenation eq 7and reactor model eq 3.
Table 3. Parameter Values (kJ mol−1) for the SEMKModel forAromatics Hydrogenation on Pt Catalyst in the ReferenceModela
Ea(0,2) Ea(1,2) Ea(2,2) Ea(0,3) Ea(1,3) Ea(2,3)
57.5b 65.1b 57.5b 68.8 ± 11.5 72.7 ± 64 70.3 ± 58ΔH(0,2) ΔH(1,2) ΔH(2,2) ΔH(0,3) ΔH(1,3) ΔH(2,3)
7.9b 4.5b 1.2b 10.9 ± 1.5 7.6c 4.2c
ΔHT ΔHMCH ΔHX ΔHDMCH ΔHH2
−54.6 ± < 0.5 8.4c −56.4 ± < 0.5 0.6c −59.4baValues with confidence intervals are obtained by regression using thenet rate of hydrogenation eq 7 and reactor model eq 3. bObtainedfrom the selected SEMK model of benzene hydrogenation on Ptcatalyst.30 cCalculated using thermodynamic consistency.
ACS Catalysis Research Article
dx.doi.org/10.1021/cs300051j | ACS Catal. 2012, 2, 1305−13181313
genation kinetics on Pt. An overview of the estimated parametervalues is presented in Table 4.
The estimate for the increment between the activationenergies for H addition to secondary and tertiary carbon atomsregardless the amounts of unsaturated neighbor atoms amountsto 10.5 kJ mol−1, the latter ones having the higher activationenergies. These statistically significantly higher activationenergies for H addition to tertiary carbon atoms is in line withthe values estimated in the earlier reference model, see section5.1, in which this has been related to steric effects. Also surfacereaction enthalpies for H addition to tertiary carbon atoms are
systematically higher than those for secondary carbon atoms, thatis, by about 3.5 kJ mol−1. With estimates for the toluene and o-xylene chemisorption enthalpies amounting to −55.7 and −56.9kJ mol−1, the aromatic chemisorption enthalpies remain in thesame order of magnitude. The overall trends in model parametervalues obtained in this simplified model, see Table 4, agree withthose obtained in the reference model, see Table 3.
5.3. Model Selection and Assessment. In both thereference and the simplified model, modeling results areobtained that are numerically very similar to each other and,hence, also have a very similar physical interpretation. Differ-ences between the parity diagrams obtained in the referencemodel, see Figure 8, and the simplified model, see Figure 9, areminor and lead to a practically indistinguishable graphicalrepresentation. The constant increment that was estimated in thesimplified model had a narrow confidence interval, whereasEa(1,3) and Ea(2,3) were having very wide confidence intervals inthe reference model. The statistical performance of the referenceand the simplified model is further compared in Table 5. The
residual sum of squares obtained with the simplifiedmodel with 4adjustable parameters is only marginally higher than thatobtained with the reference model in which 6 parameters wereestimated. It is confirmed by the F value for the globalsignificance of the regression obtained for both models that thelower number of parameters in the simplified model outweighsthis minor increase in residual sum of squares. An almost 50%increase of this F value for the simplified model compared to thereference model expresses a preference for the simplified modelon a statistical basis. The model calculated conversions as afunction of the temperature and hydrogen partial pressureindicate the overall model adequacy in reproducing theexperimental behavior, see Figures 1, 2, and 3.The fractional surface coverages of all partially hydrogenated
aromatic species and hydrogen are calculated using the entirereaction network for toluene and o-xylene hydrogenation. Fortoluene hydrogenation, at typical reaction conditions, that is, T =448 K, p0T = 20 kPa, p0H = 100 kPa, approximately 50% of thesurface is covered with chemisorbed hydrocarbons species andaround 40% of the catalyst surface is occupied by hydrogenatoms, the remaining 10% being free, see Figure 10a. While for o-xylene hydrogenation, at typical reaction condition, that is, T =448 K, p0X = 20 kPa, p0H = 100 kPa, approximately 60% of thesurface is covered with chemisorbed hydrocarbons and around30% of the catalyst surface is occupied by hydrogen atoms, theremaining 10% being free, see Figure 10b. This is in goodagreement with previously obtained values.16,18,30 The fraction ofthe surface occupied by hydrocarbons sharply decreases upon atemperature increase. The opposite effect is observed for thesurface concentrations of hydrogen and for the free active sites.These evolutions in surface coverage explain the maximumobserved in hydrogenation conversion as a function of the
Figure 9. Parity diagram of experimental vs calculated molar outlet flowrate of (a) methylcyclohexane and (b) 1,2-dimethylcyclohexane usingthe simplified model; line: bisector indicating perfect agreement, ⧫:model calculated after non isothermal regression with the pre-exponential factors from Table 2 and the activation energies andreaction enthalpies from Table 4 and the net rate of hydrogenation eq 7and reactor model eq 3.
Table 4. Values (kJ mol−1) for the SEMKModel for AromaticsHydrogenation on Pt Catalyst for the Simplified Modela
Ea(0,2) Ea(1,2) Ea(2,2) ΔEater‑sec
57.5b 65.1b 57.5b 10.5 ± 1.6ΔH(0,2) ΔH(1,2) ΔH(2,2) ΔH(0,3) ΔH(1,3) ΔH(2,3)
7.9b 4.5b 1.2b 11.5 ± 0.8 8.2c 4.2c
ΔHT ΔHMCH ΔHX ΔHDMCH ΔHH2
−55.7 ± < 0.5 7.3c −56.9 ± < 0.5 0.1c −59.4baValues with 95% confidence intervals are obtained by regressionusing the net rate of hydrogenation eq 7 and reactor model eq 3.bObtained from the selected SEMK model of benzene hydrogenationon Pt catalyst.30 cCalculated using thermodynamic consistency.
Table 5. Summary of Results of Non-Isothermal ModelRegression for Toluene and o-Xylene Hydrogenation over Pt/ZSM-22 Catalyst Using Experimental Data
reference modela simplified modelb
number of parameters 6 4F value 352 517residual sum of squares, mol2 s−2 75 × 10−6 80 × 10−6
aUnconstrained regression. bΔEater‑sec = Ea(0,3) − Ea(0,2) = Ea(1,3) −Ea(1,2) = Ea(2,3) − Ea(2,2).
ACS Catalysis Research Article
dx.doi.org/10.1021/cs300051j | ACS Catal. 2012, 2, 1305−13181314

temperature.18,51,52 Such a maximum was also observed in thepresent work, see Figure 1 in section 3. From a certaintemperature onward, that is, about 450 K, the increase in the ratecoefficient is overcompensated by the decrease in hydrocarbonsurface concentration.5.4. Reaction Path Analysis. The relative importance of the
various H addition reactions has been assessed via a contributionanalysis based on initial rates of disappearance. Such acontribution analysis allows achieving a better insight in thesurface reaction mechanism as well as the determination of apotential, “preferred” reaction pathway. Figures 5 and 6 presentthe corresponding analyses at 473 K in pictorial form showing allthe surface elementary steps involved in saturation productformation from toluene and o-xylene respectively according tothe selected model where an identical increment betweenactivation energies for H additions to secondary and tertiarycarbon atoms was assumed, regardless of the number ofunsaturated nearest neighbor atoms. Numbers written aboveand below of arrows indicate percentage contributions of thecorresponding elementary step toward the overall consumptionof the considered species, calculated using eq 4, at 16% tolueneconversion and 10% o-xylene conversion. The thickness of thearrows corresponds to the magnitude of the reaction rates scaledaccording to log(r). Rates below 10−4 mol kgcat
−1 s−1 areindicated by dashed arrows.The calculated percentage distribution between the hydro-
carbon species on a Pt surface at 473 K, 1 MPa total pressure and10 kPa inlet aromatic partial pressure obtained from the modelregression in case of toluene and o-xylene is also given Figure 5and Figure 6 respectively. At this condition, it was calculated that13.5% of the surface is covered by hydrocarbon species, 56.2% byhydrogen and that the rest is free. In case of o-xylenehydrogenation, at 473 K, it was calculated that 17.8% of thesurface is covered by hydrocarbon species, 53.6% by hydrogen,and that the rest is free. The percentage distributions of 13.5%and 17.8% hydrocarbon species are written inside the ring inFigure 5 and Figure 6 respectively. The surface concentrations ofmethylcyclohexane and dimethylcyclohexane are negligiblebecause of its low chemisorption coefficient.5.4.1. Toluene Hydrogenation Network. Figure 5 presents
the contribution analysis for toluene hydrogenation on a Ptcatalyst with the selected model. The first H addition to tolueneis mainly occurring via intermediate 3 and 4 where hydrogen isadded in the ortho and meta position with respect to the methyl
substituent, each intermediate accounting for 39% of the toluenedisappearance. Because 36% of intermediate 4 will bedehydrogenated back into toluene rather than further hydro-genated to methylcyclohexane, while this is only limited to 30%of intermediate 3, the latter will be the “preferred” intermediateafter first H addition. The secondH additionmainly occurs in themeta and para position with respect to first H addition throughintermediates 9, 10, and 11. From the latter, intermediate 11 isthe one which undergoes the least reverse dehydrogenation, thatis, 56% versus 66% and even 86% for intermediates 9 and 10 and,hence, can be considered as the “preferred” intermediate.Moreover, intermediate 11 has the most considerable concen-tration (1.2%) among the intermediates formed after two Hadditions to toluene. The addition of the third hydrogen tointermediate 11 mainly leads to intermediates 22 and 25. Thelatter intermediate experiences severe reverse dehydrogenation,amounting to 87% of its consumption, while 34% of the former isfurther hydrogenating and, hence, intermediate 22 can be clearlybe denoted as the “preferred” intermediate after three Hadditions. It also has the higher concentration (0.8%) among theintermediates formed after three H additions of toluene. Thefourth H addition to intermediate 22 can occur only in twodistinct positions, that is, one on the tertiary carbon atom leadingto intermediate 30 and another one on a secondary carbon atomleading to intermediate 33. Given the higher activation energy forH addition to a tertiary carbon atom compared to a secondarycarbon atom, intermediate 33 is clearly the preferredintermediate after the fourth H addition. Similarly, intermediate39 is the preferred intermediate over intermediate 36 after thefifth H addition, despite the fact that it is undergoing morepronounced dehydrogenation rather than hydrogenation. More-over, intermediates 33 and 39 have concentrations 0.4% and0.05%, respectively, and, hence, are the most abundant surfaceintermediates to which 4 and 5 hydrogen atoms have been added.Given the identical single-event rate coefficients along the abovedetermined pathway, the lower concentrations of the species towhich more H atoms have been added are indicative of thepotentially rate-determining character of the H atom additions inwhich they are involved. This is even more pronounced for thefinal hydrogen addition step, which is starting from intermediate39, that is, the one with the lowest concentration in thedetermined pathway and which is having the highest activationenergy, because of the tertiary character of the carbon atominvolved. These findings are in line with the discussion of the
Figure 10. Effect of temperature on the surface concentrations of hydrocarbons (◆), hydrogen (●), and free sites (▲). Calculated based on the net rateof hydrogenation eq 7 and reactor model eq 3 with the pre-exponential factors from Table 2 and the activation energies and enthalpies from Table 4.[(a.) Toluene hydrogenation: pt = 1MPa, p0T = 20 kPa, inlet γH2/T ratio 5;W/F0T = 81.8 kgcat s mol
−1; (b.) o-xylene hydrogenation: pt = 1MPa, p0X = 20kPa; inlet γH2/X ratio 5; W/F0X = 89.3 kgcat s mol
−1].
ACS Catalysis Research Article
dx.doi.org/10.1021/cs300051j | ACS Catal. 2012, 2, 1305−13181315
experimental results as made in Section 3 and with thepreviously, quantum chemically obtained conclusion by Saeyset al.18 in their first-principle based kinetic model for thehydrogenation of toluene. Hence the most preferable surfacereaction route will be 1−3−11−22−33−39−40 in case oftoluene hydrogenation as shown by the full thick arrow in Figure5. The identified dominant reaction pathway also passes via themost abundant surface species. The above discussion andinterpretation of the contribution analysis is in line with the Haddition predominantly in meta position, as was also observed inbenzene hydrogenation.30
The simulation of the inhibitory effect at the lowesttemperatures has further been assessed at a temperature of 423K, a total pressure of 1 MPa, a hydrogen inlet partial pressure of100 kPa, and a space time 81.8 kgcat s mol−1 using the SEMKmodel. It was found that increasing the inlet partial pressure oftoluene from 10 to 20 kPa, the surface coverage of hydrocarbonspecies increases from 54 to 76.9% and the hydrogen surfacecoverage decreases from 30 to 18.9%. As a result the conversiondecreases from 13.3 to 7.3%. The corresponding, simulatedpartial reaction order with respect to hydrocarbon speciesamounted to −0.15, which corresponds well with that reportedpreviously16 and discussed in Section 3. When increasing thehydrogen inlet partial pressure from 100 to 200 kPa at a tolueneinlet partial pressure of 20 kPa, the hydrogen surface coverageincreased from 18.9 to 32.0% while the hydrocarbon surfacecoverage decreased from 76.9 to 67.0%. As a result the overallconversion increased from 7.3 to 16.7%, corresponding with ahydrogen partial reaction order of 0.7, which, again is in niceagreement with previously reported values16 as well as thosediscussed in Section 3.5.4.2. o-Xylene Hydrogenation Network. A similar con-
tribution analysis as for toluene hydrogenation has also beenperformed for o-xylene hydrogenation to dimethylcyclohexane,see Figure 6. In this case, the first H addition is mainly going viaintermediates 3 and 4 having an equal surface concentration of1.5%, that is, via an addition to a secondary carbon atom. As thelatter intermediate is rather undergoing dehydrogenation thanhydrogenation, intermediate 3 is the “preferred” forwardelementary step in the hydrogenation sequence. Intermediates10 and 11 are mainly formed after the second H addition tointermediate 3. However, 90% of intermediate 10 is ratherundergoing dehydrogenation than hydrogenation, while 32% ofintermediate 11 is further hydrogenating. Moreover, intermedi-ate 11 has the higher concentration (2.1%) among theintermediates formed after two H additions of o-xylene. Hence,intermediate 11 is considered as the “preferred” intermediate inthe hydrogenation sequence. The addition of a third hydrogenatom to intermediate 11 leads to intermediate 23, that is, 25%compared to 2% and 1% to intermediates 17 and 20, clearlyindicating intermediate 23 as the “preferred” one after the thirdH addition. Although intermediate 23 is rather undergoingreverse dehydrogenation than forward hydrogenation, it canundergo H addition on one of its tertiary carbon atoms leading tointermediates 28 or 31 or on the last unsaturated secondarycarbon atom leading to intermediate 32. Since the latterpossibility has the lowest activation energy and, hence, thehighest rate coefficient, this will be the preferred one for thefourth H addition. It can also be noted that once intermediate 11undergoes hydrogenation to intermediate 22, although itscontribution is limited to 4% only, it finds a “preferred” pathwayto form intermediate 32 after the fourth hydrogenation. Hencethis pathway can be considered as an alternative “preferred”
hydrogenation pathway, certainly if it is realized thatintermediate 22 has the higher concentration (1.2%) amongthe intermediates formed after three H additions to o-xylene.Because of symmetry reasons, a unique pathway remains for theaddition of the fifth and the sixth H addition to intermediates 32and 35. Because they both involve a tertiary carbon atom, these Hadditions have the lowest absolute rates in the hydrogenationsequence and, hence, have a determining character on the overallrate. The most preferable surface reaction route as identifiedabove is 1−3−11−22 & 23−32−35−36 for o-xylene hydro-genation. The so-called “meta H-addition pathway” is clearlyidentified as the “preferred” reaction pathway at the beginning ofthe hydrogenation sequence, followed by H addition tosecondary carbon atoms and finally to the tertiary carbonatoms of the ring in the o-xylene hydrogenation on a Pt catalystaccording to the SEMK model.Similar to the case of toluene hydrogenation, also for o-xylene
hydrogenation the inhibitory effect at the lower temperatures hasbeen further assessed at 423 K, a total pressure 1 MPa, an inlethydrogen partial pressure 100 kPa, and a space time 89.3 kgcat smol−1. It was found that increasing the inlet partial pressure of o-xylene from 10 to 20 kPa, the surface coverage of hydrocarbonspecies increases from 42 to 58% but the hydrogen surfacecoverage decreases from 42.8 to 29%. As a result the conversiondecreases with increasing inlet o-xylene partial pressure from 10.7to 9.5%. The corresponding, simulated partial reaction orderwith respect to hydrocarbon species amounted to −0.1, whichcorresponds well with the partial reaction orders discussed inSection 3. When increasing the hydrogen inlet partial pressurefrom 50 to 100 kPa at an o-xylene inlet partial pressure of 10 kPa,the hydrogen surface coverage increased from 5 to 14% while thehydrocarbon surface coverage decreased from 73 to 71%. As aresult the o-xylene hydrogenation conversion increased from 2.7to 10.7%, corresponding with a hydrogen partial reaction orderamounting to 1.5 which is in good agreement with the observedvalues around 2.
6. CONCLUSIONSThe SEMK methodology has been successfully extended frombenzene hydrogenation toward the hydrogenation of mono- anddi- substituted aromatics compounds on a Pt catalyst. Thejudicious definition of the reaction families has allowed theadequate description of the experimental data using a limitednumber of adjustable parameters. The fundamental nature of theSEMK model has ensured the applicability of the kinetic andthermodynamic parameters, determined from benzene hydro-genation, to the substituted aromatics, for example, toluene ando-xylene hydrogenation. On the basis of a statistical analysis whilesimultaneously accounting for the physical significance of theindividual parameter estimates and the kinetic model as a whole,a simplified model with a constant increment between theactivation energies for H addition to secondary and tertiarycarbon atoms, irrespective of the number of unsaturatedneighboring carbon atoms, was retained. H additions tosecondary carbon atoms are faster than to tertiary carbonatoms. Steric hindrance results in a higher activation energy for Haddition to a tertiary carbon atom compared to a secondarycarbon atom. The presence of a methyl substituent on anaromatic ring only has a minor effect on the chemisorptionenthalpies of the corresponding component. As a result,differences in aromatics hydrogenation behavior between alkylsubstituted monoaromatics compounds are mainly governed bydifferences in H-addition kinetics rather than by chemisorption
ACS Catalysis Research Article
dx.doi.org/10.1021/cs300051j | ACS Catal. 2012, 2, 1305−13181316

thermodynamics. A differential contribution analysis of thevarious elementary steps to the product formation illustrates howthe simplified model simulates that hydrogenation first occurs atsecondary carbon atoms following a “meta H-addition pathway”prior to the hydrogenation of the tertiary carbon atoms at the endof the hydrogenation sequence. A rate-determining step, if any,occurs near the end of the hydrogenation reaction mechanism.Experimentally observed inhibition effects at lower temperaturesare adequately reproduced by the model and explained by highhydrocarbon surface coverages. With increasing temperature,these inhibition effects disappear as the hydrocarbon surfacecoverages are decreasing.
■ AUTHOR INFORMATIONCorresponding Author*E-mail: [email protected]. Fax: +32 (0)9 264 49 99.
FundingThis work was undertaken in the framework of a bilateralcollaboration between UGent-LCT and BP. This work was alsosupported by the Interuniversity Attraction Poles Programme−Belgian State−Belgian Science Policy and the Long TermStructural Methusalem Funding by the Flemish Government.
NotesThe authors declare no competing financial interest.
■ NOMENCLATURE* active site on catalyst surface· electron location on carbon atom of aromatic ringA aromaticsb model parameter vector containing the estimated
parameter valuesCj surface concentration of component j (mol kgcat
−1)C* free site concentration (mol kgkat
−1)CA cycloalkaneEa activation energy (J mol−1)F molar flow rate (mol s−1)F value F value for the significance of the regressiong gasH enthalpy (J mol−1)k rate coefficient of elementary step (kgkat mol−1 s−1)K reaction equilibrium coefficientKi chemisorption equilibrium coefficient for species i
(Pa−1)m number of unsaturated carbon atoms adjacent to
reacting carbon atom (-)n degree of branching of reacting carbon atom (-)ne number of single-events (-)nob number of observationnpar number of parametersnresp number of responsespt total pressure (Pa)pi partial pressure of component i (Pa)r reaction rate (mol kgcat
−1 s−1)Ri net production rate of component i (mol kgcat
−1 s−1)S entropy (J mol−1 K−1)SEMK Single-Event MicroKineticsSSQ sum of squared residual between the experimental and
model calculated outlet molar flow rates (mol2 s−2)T temperature (K)t Student t value for the significance of an individual
parameter (-)W catalyst mass (kg)
X conversion (mol mol −1)
Greek Symbolsβ model parameter vector containing the estimated
parameter valuesΔ differenceγH2/A molar hydrogen to aromatics ratio (-)ϕ contribution factorσ symmetry numberSubscriptscat catalystd disappearancedeh dehydrogenationDMCH dimethyl cyclohexaneglob globalH hydrogenhyd hydrogenationHC hydrocarboni→j component/intermediate i to component/intermedi-
ate jj experimental observation indexMCH methyl cyclohexaneT tolueneX o-xyleneSuperscripts∧ model calculated∼ intrinsic, single-event⧧ activated complexhyd/deh via hydrogenation and dehydrogenationo reactor inlet valueo pre-exponential factor (Pa−1, s−1)r reactantsec secondary ring carbon atomter tertiary ring carbon atom
■ REFERENCES(1) Cooper, B. H.; Donnis, B. B. L. Appl. Catal., A 1996, 137 (2), 203−223.(2) Nag, N. K. Appl. Catal. 1984, 10 (1), 53−62.(3) Sapre, A. V.; Gates, B. C. Ind. Eng. Chem. Proc. Des. Dev. 1981, 20(1), 68−73.(4) Girgis, M. J.; Gates, B. C. Ind. Eng. Chem. Res. 1991, 30 (9), 2021−2058.(5) Aubert, C.; Durand, R.; Geneste, P.; Moreau, C. J. Catal. 1988, 112(1), 12−20.(6) Rautanen, P. A.; Lylykangas, M. S.; Aittamaa, J. R.; Krause, A. O. I.Stud. Surf. Sci. Catal. 2001, 133, 309−316.(7) Corma, A.; Iglesias, M.; Sanchez, F. Catal. Lett. 1995, 32 (3−4),313−318.(8) Keane, M. A.; Patterson, P. M. Ind. Eng. Chem. Res. 1999, 38 (4),1295−1305.(9) Rynkowski, J.; Rajski, D.; Szyszka, I.; Grzechowiak, J. R. Catal.Today 2004, 90 (1−2), 159−166.(10) Smeds, S.; Murzin, D.; Salmi, T. Appl. Catal., A 1997, 150 (1),115−129.(11)Mirodatos, C.; Dalmon, J. A.; Martin, G. A. J. Catal. 1987, 105 (2),405−415.(12) Rahaman, M. V.; Vannice, M. A. J. Catal. 1991, 127 (1), 267−275.(13) Lindfors, L. P.; Salmi, T.; Smeds, S. Chem. Eng. Sci. 1993, 48 (22),3813−3828.(14) Lin, S. D.; Vannice, M. A. J. Catal. 1993, 143 (2), 563−572.(15) Vanmeerten, R. Z. C.; Coenen, J. W. E. J. Catal. 1977, 46 (1), 13−24.(16) Thybaut, J. W.; Saeys, M.; Marin, G. B.Chem. Eng. J. 2002, 90 (1−2), 117−129.
ACS Catalysis Research Article
dx.doi.org/10.1021/cs300051j | ACS Catal. 2012, 2, 1305−13181317

(17) Saeys, M.; Reyniers, M. F.; Neurock, M.; Marin, G. B. J. Phys.Chem. B 2005, 109 (6), 2064−2073.(18) Saeys,M.; Reyniers, M. F.; Thybaut, J. W.; Neurock,M.;Marin, G.B. J. Catal. 2005, 236 (1), 129−138.(19) Froment, G. F. Catal. Rev.- Sci. Eng. 2005, 47 (1), 83−124.(20) Park, T. Y.; Froment, G. F. Ind. Eng. Chem. Res. 2001, 40 (20),4172−4186.(21) Feng, W.; Vynckier, E.; Froment, G. F. Ind. Eng. Chem. Res. 1993,32 (12), 2997−3005.(22) Dewachtere, N. V.; Santaella, F.; Froment, G. F. Chem. Eng. Sci.1999, 54 (15−16), 3653−3660.(23) Beirnaert, H. C.; Alleman, J. R.; Marin, G. B. Ind. Eng. Chem. Res.2001, 40 (5), 1337−1347.(24) Svoboda, G. D.; Vynckier, E.; Debrabandere, B.; Froment, G. F.Ind. Eng. Chem. Res. 1995, 34 (11), 3793−3800.(25) Martens, G. G.; Marin, G. B.; Martens, J. A.; Jacobs, P. A.; Baron,G. V. J. Catal. 2000, 195 (2), 253−267.(26) Martens, G. G.; Thybaut, J. W.; Marin, G. B. Ind. Eng. Chem. Res.2001, 40 (8), 1832−1844.(27) Thybaut, J. W.; Marin, G. B. Chem. Eng. Technol. 2003, 26 (4),509−514.(28) Thybaut, J. W.; Marin, G. B.; Baron, G. V.; Jacobs, P. A.; Martens,J. A. J. Catal. 2001, 202 (2), 324−339.(29) Lozano-Blanco, G.; Thybaut, J. W.; Surla, K.; Galtier, P.; Marin, G.B. Ind. Eng. Chem. Res. 2008, 47 (16), 5879−5891.(30) Bera, T.; Thybaut, J.W.;Marin, G. B. Ind. Eng. Chem. Res. 2011, 50(23), 12933−12945.(31) Martens, J. A.; Parton, R.; Uytterhoeven, L.; Jacobs, P. A.;Froment, G. F. Appl. Catal. 1991, 76 (1), 95−116.(32) Neurock, M. J. Catal. 2003, 216 (1−2), 73−88.(33) Somorjai, G. A. Chemistry in two dimensions: surfaces; CornellUniversity Press: Ithaca, NY, 1981; p 575.(34) Steijns, M.; Froment, G. F. Ind. Eng. Chem. Prod. Res. Dev. 1981,20 (4), 660−668.(35) Bos, A. N. R.; Lefferts, L.; Marin, G. B.; Steijns, M. H. G. M. Appl.Catal., A 1997, 160 (1), 185−190.(36) Berger, R. J.; Stitt, E. H.; Marin, G. B.; Kapteijn, F.; Moulijn, J. A.Cattech 2001, 5 (1), 30−60.(37) Marquardt, D. W. J. Soc. Ind. Appl. Math. 1963, 11 (2), 431−441.(38) NETLIB, http://www.netlib.org.(39) Powell, M. J. D. A Hybrid Method for Nonlinear Equations. InNumerical Methods for Nonlinear Algebraic Equations; Rabinowitz, P.,Ed.; Gordon and Breach Science Publishers: New York, 1988.(40) Qi, C.; Hoebink, J. H. B. J.; Marin, G. B. Ind. Eng. Chem. Res. 1991,30 (9), 2088−2097.(41) Quintana-Solorzano, R.; Thybaut, J. W.; Galtier, P.; Marin, G. B.Catal. Today 2007, 127 (1−4), 17−30.(42) Vanmeerten, R. Z. C.; Degraaf, T. F. M.; Coenen, J. W. E. J. Catal.1977, 46 (1), 1−12.(43) Huang, T. C.; Kang, B. C. Ind. Eng. Chem. Res. 1995, 34 (9),2955−2963.(44) Saeys, M.; Reyniers, M. F.; Marin, G. B.; Neurock, M. J. Phys.Chem. B 2002, 106 (30), 7489−7498.(45) Vynckier, E., Froment, G. F. Modelling of the kinetics of complexprocesses based upon elementary steps; Elsevier: Amsterdam, TheNetherlands, 1991; pp 131−161.(46) Dumesic, J. A., Rudd, D. F., Aparicio, L. M., Rekoske, J. E.,Trevino, A. A. The Microkinetics of Heterogeneous Catalysis; AmericalChemical Society: Washington, DC, 1993.(47) Campbell, C. T.; Sun, Y. K.; Weinberg, W. H. Chem. Phys. Lett.1991, 179 (1−2), 53−57.(48) Toppinen, S.; Rantakyla, T. K.; Salmi, T.; Aittamaa, J. Ind. Eng.Chem. Res. 1996, 35 (6), 1824−1833.(49) Toppinen, S.; Rantakyla, T. K.; Salmi, T.; Aittamaa, J. Ind. Eng.Chem. Res. 1996, 35 (12), 4424−4433.(50) Kubicka, D.; Salmi, T.; Murzin, D. Y. Catal. Today 2005, 100 (3−4), 453−456.(51) Lin, S. D.; Vannice, M. A. J. Catal. 1993, 143 (2), 539−553.
(52) Backman, H.; Neyestanaki, A. K.; Murzin, D. Y. J. Catal. 2005, 233(1), 109−118.
ACS Catalysis Research Article
dx.doi.org/10.1021/cs300051j | ACS Catal. 2012, 2, 1305−13181318