Embed Size (px)
Citation preview
External Financing of Last Resort? Bank Lines of Credit as a Source of Long-term Finance
Xin Chang Cambridge Judge Business School, University of Cambridge
Nanyang Business School, Nanyang Technological University [email protected]
Yunling Chen
Department of Finance Tsinghua University
Sudipto Dasgupta Department of Finance
Lancaster University; Hong Kong University of Science and Technology; CEPR and ABFER [email protected]
Ronald W. Masulis
UNSW School of Business University of New South Wales, ECGI, ABFER
This draft: September 25, 2017
* We are grateful to Tai-Yuan Chen for sharing with us his data. Chang acknowledges financial support from Rega Capital Management Limited and Academic Research Fund Tier 1 provided by Ministry of Education (Singapore) under grant numbers SUG FY08, M58010006. Chen acknowledges financial support from the National Natural Science Foundation of China (Approval Number 71502089). Dasgupta acknowledges research support from Hong Kong’s Research Grant Council under grant No. HKUST6499/06H.
1
External Financing of Last Resort? Bank Lines of Credit as a Source of Long-
term Finance
ABSTRACT
We investigate lines of credit as a source of long-term finance. We find that long-term debt arising from credit line drawdowns constitutes 10% of a typical firm’s total assets. Consistent with credit lines serving as a liquidity buffer and financing source of last resort, long-term drawdowns are more likely when other external capital sources become problematic due to unfavorable equity and bond market conditions. They are also more likely when firms expect to spend more on capital expenditures (consistent with maturity matching). Our findings reveal long-term use of credit lines as an important buffer against adverse capital market conditions.
JEL classification: G21, G31, G32
Keywords: Lines of Credit, Financing of Last Resort, Liquidity Buffer
2
1 Introduction
The recent empirical literature on bank lines of credit has stressed its role in short-term liquidity
management. More specifically, researchers analyze how lines of credit help mitigate temporary
mismatches between cash inflow and outflow (such as an unexpected deficit in net working
capital). Sufi (2009) serves as a good example. He examines firm choices between lines of credit
and cash holdings as alternative sources of liquidity. This literature typically does not explicitly
address the use of lines of credit in bridging longer-term mismatches of cash flows (e.g. when a
firm undertakes an investment project that cannot be adequately financed with internal funds). In
this study, we attempt to fill this gap in our understanding of credit lines with an analysis of a
large sample of U.S. S&P 1500 firms over the period 1996-2008, where we examine: (a) the
extent to which firms rely on credit line drawdowns as a source of long-term financing, (b) the
conditions under which they are more likely to draw down these credit lines, and (c) the types of
firms most likely to use such drawdowns. To the best of our knowledge, this is the first large-
sample panel data study that examines the long-term use of lines of credit.
We capture credit line drawdowns, which are collected manually from U.S. Securities and
Exchange Commission (SEC) 10-K filings. According to the Statement of Financial Accounting
Standards (SFAS No.6), credit line drawdowns for long-term uses (i.e., longer than a year)
should be classified as long-term debt. Thus, we use credit line drawdowns reported in the long-
term debt section of a firm’s balance sheet to measure credit line use for long-term financing
purposes. We find that credit line use for long-term purposes is pervasive and substantial. Using
our sample, we find that about 28% of firms with lines of credit have drawdowns classified as
3
long-term debt. For these firms, on average, total long-term drawdowns amount to 10% of total
assets and nearly 40% of total debt. New long-term drawdowns (the change in total long-term
drawdowns from the prior year) equal roughly 1.1% of total assets, which is more than double
the size of new drawdowns for short-term uses.
We begin our analysis by investigating the determinants of long-term credit line drawdowns.
We find that companies’ long-term investment needs, which are estimated using predicted
capital expenditures, have a significantly positive association with both the likelihood and size of
new long-term drawdowns, suggesting that they are used primarily for financing long-term
investment. Examining long-term drawdown initiations (a positive long-term drawdown where
none existed in the prior year) and terminations (full repayments of long-term drawdowns with
credit line retention), we find that the likelihood of initiations (terminations) is positively
(negatively) related to the borrower’s capital investment.
We then analyze the conditions under which firms are likely to use lines of credit for long-
term financing. While several studies argue that lines of credit are like cash, serving the role of a
liquidity buffer (e.g., Sufi, 2009; Acharya et al., 2014), the existing evidence on the importance
of lines of credit in protecting firms from adverse shocks to the availability of long-term
financing remains limited and indirect. Acharya et al. (2014) find that firms that rely on bond
financing raise their cash holdings and exhibit declines in their unused credit lines following
liquidity shocks.1 While these results appear to suggest that firms substitute cash for lines of
credit when subject to liquidity shocks which impair their ability to raise external financing, they 1 Acharya et al. (2014) examine two liquidity shocks. One is due to ratings downgrades of General Motors and Ford in 2005, while the other is downward pressure on equity prices due to aggregate mutual fund outflows.
4
are also consistent with firms drawing down credit lines and expanding cash holdings when
external financing costs rise. However, these researchers do not directly examine credit line
drawdowns, or whether such drawdowns constitute a source of long-term financing. Campello et
al. (2011, 2012) find that in the 2008-2009 financial crisis, firms with larger untapped credit lines
cut investment less frequently.2,3
To examine whether lines of credit serve as a liquidity buffer, we argue that a liquid asset
that serves as a “liquidity buffer” is a financing source of “last resort”, and is only used when
other sources of finance become more costly or less feasible to obtain. Accordingly, we examine
whether firms are more likely to draw down credit lines for long-term uses when other sources of
long-term external finance dry up. We find that the likelihood and size of new long-term
drawdowns rise as equity and debt market conditions become less favorable. More specifically,
using recent weak stock market returns or the fraction of initial public offerings (IPOs) priced
below their initial filing range to represent generally adverse equity market conditions, and using
credit spreads and default spreads to represent general credit market conditions, we find that they
all affect the likelihood and size of new long-term drawdowns in a manner consistent with firms
relying more heavily on credit lines drawdowns when current equity and credit market
conditions are less favorable or deteriorating.
2 Again, this needs not imply that lines of credit are actually used to meet funding shortfalls on investment projects. For example, it is possible for firms with better credit line access to also have better access to other external financing sources during the crisis compared to other firms, so that firms with untapped lines are able to invest relatively more in the crisis period. 3 Ivashina and Scharfstein (2009) show that while there was a large rise in overall drawdowns in the second half of 2008, these drawdowns did not lead to a rise in investments, but instead to more cash holdings. They further find that some of these cash drawdowns are returned to the banks by the end of the second quarter of 2009. They argue that this behavior is consistent with the evidence in Ivashina and Scharfstein (2010) that the primary motivation behind the drawdowns was panic due to financial market uncertainty.
5
Our results are consistent with the survey evidence in Lins, Servaes, and Tufano (2010), who
find that the amount of credit lines as a proportion of total assets is higher when managers state
that they need to hedge against possible frictions in obtaining external financing to fund projects.
Unlike these researchers, however, we are able to directly examine credit line drawdowns that
are classified as long-term debt when external capital market conditions deteriorate. Regression
models of the choice between long-term drawdowns and other types of financing provide
consistent results.
While some earlier studies focus on the 2008-2009 financial crisis, we are able with our
panel data to contrast the use of credit lines during the 2008 recession with their use in the
previous 2001 recession. The differences in these recessions allow us to distinguish between two
major determinants of long-term drawdowns outlined above – namely, the demand for long-term
finance to support investment activity, and reductions in aggregate supply captured by weak
equity and debt market conditions. While the 2001 recession saw a major reduction in the supply
and demand for credit due to weak borrower balance sheets and poor investment prospects
respectively, the decline in the demand for credit during the 2008 recession was much more
modest. On the other hand, overall equity and credit market conditions were significantly worse
during the 2008 recession, and the commercial paper market experienced a major disruption.
We find that long-term credit line drawdowns fell significantly in the 2001 recession relative
to an average sample year, consistent with both lower demand for long-term finance as well as a
reduced supply of credit lines. In contrast, during the 2008 recession, drawdowns rose in spite of
a tighter credit supply and a modest decline in demand for finance compared to an average
6
benchmark year. Moreover, while commercial paper (CP) is an important source of long-term
financing for highly rated firms (Kahl, Shivdasani and Wang, 2015), its use as a source of long-
term finance declined noticeably in the 2008 recession, while credit line drawdowns for long-
term uses rose, including a large fraction of highly rated firms with credit lines.4 These findings
highlight an important pattern in corporate financing decisions, namely that as external capital
market conditions seriously deteriorate, firms rely more heavily on credit lines as a financing
source of last resort, including firms far from default and least financially constrained.
Our next set of findings concern the types of firms that rely more heavily on long-term
drawdowns from credit lines. We find that smaller and younger firms are more likely to rely on
long-term drawdowns. This suggests that contractual features associated with loan commitments
(e.g., those that allow banks to condition their credit exposure on regular monitoring of a
borrower’s balance sheet) are especially valuable for firms with higher information asymmetry,
captured by a small firm indicator, relative to external arms-length finance.5 By the same token,
we find firms with credit ratings, which make obtaining long term credit through bond issuance
easier, are less likely to draw down credit lines for long-term use, and more likely to repay
existing long-term drawdowns. They also use long-term drawdowns less frequently relative to all
other forms of long term financing.
Interestingly, while unrated firms are more likely to draw down credit lines for long-term use
than rated firms, our evidence is more nuanced in that the use of long-term drawdowns is not
4 According to the Statement of Financial Accounting Standards (SFAS No.6), CP should be reported as long-term debt if firms plan to roll it over for a period longer than one year. 5 We obtain similar results using firm age as our asymmetric information measure.
7
monotonic across credit rating quality. Unrated firms, along with firms in the intermediate rating
categories (from BB- to BB+), rely the most heavily on credit line drawdowns. Firms in the
highest rating (A- or above) and lowest rating (B+ or lower) categories use long-term drawdowns
the least. The highest rated firms have better access to credit lines than other types of firms, but
they draw down credit lines much less frequently relative to other firms with credit rating. This is
consistent with these firms having easy access to other sources of external financing and the
previous finding in the literature that the primary use of credit lines for highly rated firms is to
back-up other types of short-term debt financing, such as commercial paper programs (Boyd and
Gertler, 1994; Saidenberg and Strahan, 1999; Gatev and Strahan, 2006). In contrast, the lowest
rated firms are the least profitable and most likely to have credit lines denied or severely rationed
given their high default risk. Thus, they are less able to access credit line drawdowns for long-
term financing.
Our analysis illustrates an important feature of lines of credit that differentiates it from other
types of credit, such as term loans. While credit lines allow a borrower to draw down a line when
other sources of financing dry up, this flexibility also creates agency problems. Specifically,
credit lines can be exploited by borrowers when their financial condition deteriorates or when
they have unprofitable projects that are difficult to externally finance on their own (Sufi, 2005,
2009; Acharya, Almeida, and Campello, 2013). One consequence of this moral hazard problem
is that covenants are likely to be tighter for credit lines than for term loans, an issue that we
8
explore later in this study. 6 As borrower profitability improves, earnings-based financial
covenants are more likely to be met, enabling a borrower to confidently draw down a greater
amount of credit from its line, with little concern for triggering covenants that force early
repayment.
Consistent with these expectations, we find that two common earnings-based financial
covenants are stricter for credit lines than for term loans when comparing (i) firms with similar
profitability levels, or (ii) the same borrower using both credit instruments. Further, we find that
lagged firm profitability is positively related to the amount of long-term drawdowns under credit
lines and, more importantly, to the use of long-term drawdowns relative to other types of
financing. This is likely to reflect both banks’ willingness to supply more credit when
profitability improves as well as a firm’s willingness to draw down larger portions of the line
when the risk of violating earnings-based covenants is lower. Overall, these results suggest that
suppliers of credit lines impose credit rationing both by setting tighter covenants when lines are
originated and by adjusting credit line limits to reflect changing firm profitability.
Our study contributes to the literature on lines of credit in several dimensions. First, we
document the importance of credit line drawdowns as a source of long-term finance – both in
normal periods and financial crisis periods – using a long panel that includes two recessions. In
this regard, we build on the survey evidence in Lins, Servaes, and Tufano (2010) who argue that
lines of credit are used to fund future investment opportunities (in contrast to cash, which is held
6 Credit lines are most often senior debt and sometimes secured (Dennis, Nandy and Sharpe, 2000). Shockley and Thakor (1997) finds that committed credit lines typically contain a “material adverse change” (MAC) clause, which gives the bank wide latitude to limit borrowing under the commitment if the borrower's condition deteriorates.
9
for general liquidity insurance), and Campello et al. (2011, 2012) who find that the availability of
credit lines in the 2008-2009 financial crisis supported corporate spending.
Second, theories of lines of credit (e.g., Boot, Thakor, and Udell, 1987; Holmstrom and
Tirole, 1998; Acharya, Almeida, and Campello, 2013) primarily focus on their role as a short-
term liquidity buffer to alleviate investment distortions when there are adverse liquidity shocks.
However, there is little direct empirical evidence that credit lines are used as a buffer against
adverse debt and equity market conditions. Our finding that long-term drawdowns rise after
negative shocks to debt and equity markets is consistent with this buffering behavior.
Third, we provide new evidence on which types of firms rely more on long-term drawdowns
of credit lines. In particular, we show that while unrated firms depend more on long-term
drawdowns than rated firms, there is considerable granularity to the relationship between credit
quality and the use of credit line drawdowns as a source of long-term financing. Finally, we find
that while suppliers of credit lines set tighter covenants than in terms loans, the use of long-term
drawdowns is much more sensitive to past profitability than any other type of financing,
suggesting that banks adjust the supply of credit lines more quickly to their exposure to a
borrower's financial condition, which represents a potentially important source of contractual
advantage for lines of credit.
2 Bank Lines of Credit
2.1 Background of Bank Lines of Credit and Long-term Drawdowns
10
A line of credit is also called a revolving facility, a revolving credit agreement, or a revolving
credit loan. Under such a facility, a bank or several banks stand ready to lend a pre-agreed
amount of funds to a borrower on demand at any time during a given period. The term of
agreement is typically under five years, and is often renewed or revised before the end of the
contract period. Credit lines generally have covenants to ensure a borrower adheres to specific
financial conditions. Covenant violations can trigger tighter loan contract conditions, such as a
smaller credit line, shorter maturity or a higher interest rate.
Credit lines offer more flexibility to borrowers than term loans. In contrast to the latter, under
a credit line arrangement, while the term of the credit line can be as long as 5 years, borrowers
may withdraw funds up to the credit limit and then repay any time within the contract period. A
key attraction of credit lines is that prepaid loans generally can be re-borrowed multiple times.
Because of the above flexibility, the maturity of drawdowns from long-term credit lines (i.e.,
longer than one year) depends on the intended length of the credit line drawdown. More
specifically, when drawdowns are used, for example, to fill a gap due to a temporary mismatch
between cash inflows and cash outflows (such as an unexpected deficit in net working capital),
they are reported as short-term debt. On the other hand, drawdowns intended to be outstanding
for more than one year, are classified as long-term debt.7
In Appendix A, we provide an example that distinguishes between long term and short term
credit line use. Carmax, Inc. reports in its 10-K filing that at the end of fiscal year 2007, it had a
7 According to the Statement of Financial Accounting Standards (SFAS No.6), short-term debt obligations should be classified as long-term if the firm (a) intends to refinance the short-term obligation on a long-term basis, and (b) can demonstrate that it has the ability to refinance. The latter condition is met if a line of credit extends beyond one year.
11
$500 million revolving credit facility available, which expires in December 2011. Of this line of
credit, $300.2 million was drawn down, with $100.2 million (including $79.2 million classified
as the current portion of long-term debt) treated as a short-term credit line drawdown, While the
remaining $200.0 million represents a long-term credit line drawdown, as reported on its
balance sheet.8
2.2 A Brief Literature Review
The early literature on bank lines of credit focuses mainly on their role in corporate liquidity
management. Boot, Thakor, and Udell (1987) and Holmstrom and Tirole (1998) present models
that illustrate the intuition that in a stochastic environment, loan commitments mitigate the
adverse consequences of short term liquidity shocks. Both models show that moral hazard
problems are exacerbated in certain future states of the economy if there are adverse shocks to
liquid balances or interest rates, causing firms to invest sub-optimally. By granting firms loan
commitments, banks can provide insurance against these liquidity shocks, and ex-ante recoup the
expected losses from defaults by charging commitment fees.9
It is frequently argued that lines of credit, as pre-committed loan facilities, suffer less credit
rationing, and thus, can provide insurance against market-wide credit crunches. Consistent with
8 It is possible that firms classify credit line drawdowns as long-term to improve the current ratio, and avoid triggering loan covenant violations. However, if this is the case, then the practice works against our tests that attempt to show that drawdowns classified as long-term debt are used to finance long-term investments. In unreported results, we find that the effect of current ratio on the choice between long-term credit line drawdowns and short-term debt is marginal. In the Internet Appendix Table IA.I, we find that short-term drawdowns are not used for capital investment, but long-term drawdowns are. These findings suggest that improving the current ratio is an unlikely major motive for classifying drawdowns as long-term in our sample. 9 Other papers that rationalize lines of credit in an optimal contracting framework are Berkovitch and Greenbaum (1991), Duan and Yoon (1993), Morgan (1994), and Shockley (1995), and more recently, DeMarzo and Fishman (2007) and Sannikov (2007).
12
this view, Barakova and Parthasarathy (2012) find that during a credit crunch, banks generally
honor their existing line commitments and provide liquidity to almost all lower risk firms, as
well as higher risk firms that have substantial unused credit lines. Banks cut credit limits only
when a firm’s credit quality has seriously deteriorated or firms have used up most of the credit
limit. Campello et al. (2011) find credit lines eased the impact of the 2008–2009 financial crisis
on corporate spending. Campello et al. (2012) show that financially constrained firms (small,
private, non-investment-grade, and unprofitable) draw down more funds from their credit lines
during the crisis than their relatively unconstrained counterparts (large, public, investment-grade,
and profitable firms).
Credit lines and cash are often viewed as alternative methods to buffer unexpected liquidity
demand, and the choice between these two sources of liquidity is a topic of much recent research.
However, lines of credit are conditional (i.e., available only if firms do not violate covenants),
and this feature makes lines of credit an imperfect mechanism for liquidity management. On the
other hand, the literature also suggests several costs of holding cash and liquid assets for liquidity
purposes, such as minimal interest earned, loss of purchasing power in inflationary environments,
wealth transfers to bondholders, and potential misuse by management.
Sufi (2005) observes that bank credit line flexibility comes at a cost – namely, it aggravates
the moral hazard problem between borrowers and banks. In particular, asset substitution, debt
overhang, and the pursuit of pet projects are especially severe risks when borrowers have low
profitability. Sufi argues that these agency problems imply that banks are less likely to extend
lines of credit to firms with low profitability, and will condition continued availability of credit
13
lines on the maintenance of minimum profitability levels. He documents that funds availability
under lines of credit is contingent on numerous financial covenants, of which the maintenance of
profitability is the most common, and also the most likely to be violated. He also documents that
a negative profitability shock leads to “technical defaults” on these covenants, which lead to
restrictions on the unused portion of the line of credit. Consistent with these earlier findings, Sufi
(2009) reports less profitable firms hold fewer credit lines and more cash balances.
Acharya et al. (2014) argue that firms are likely to draw down credit lines in exactly those
states when such drawdowns are negative net present value investments for banks. This can lead
to a loss of credit lines (e.g. due to covenant violations) when firms experience negative shocks.
As a result, firms more prone to such shocks are likely to substitute cash holdings for lines of
credit. The authors also show that firms with more hedging needs (i.e. low correlation between
cash flows and growth opportunities) are less likely to use credit lines as opposed to cash.
Acharya, Almeida, and Campello (2013) also show theoretically and empirically that firms with
high exposure to systematic risk face higher credit line costs and exhibit higher ratios of cash to
credit lines (see also Disatnik, Duchin, and Schmidt, 2014; Acharya et al., 2014).
While cash and lines of credit both serve as liquidity buffers, given the above differences,
they are likely to be employed to hedge against different risks. Based on an international survey,
Lins, Servaes, and Tufano (2010) find that lines of credit appear to be held to hedge against
shortfalls in funds for future growth options. In contrast, cash appears to be held as general
purpose insurance. We explore the importance of credit lines for longer term investment
purposes below.
14
3 Data
3.1 Sample
We manually collect data on long-term credit line drawdowns from 10-K SEC filings
available through EDGAR (www.sec.gov) for all U.S.-based firms in Compustat and the S&P
1500 for any year in the 1996-2008 period. We focus on S&P 1500 firms given the high cost of
manual data collection of other firms. Following common practice, we exclude heavily regulated
financial (SIC codes 6000-6999) and utility (SIC codes 4000-4999) firms.10 Our sample period
begins in 1996 because all firms are mandated to submit electronic 10-K SEC filings beginning
in 1996 (Sufi, 2009).
For our study, a long-term drawdown is defined as credit line borrowings reported as “long-
term debt”. A long-term drawdown is extracted from the long-term debt section of the Notes to a
firm’s consolidated financial statements.11 The underlying credit line supporting a drawdown
must exceed one year for it to be categorized as long-term financing. From our reading of 10-K
filings, a drawdown is typically reported as short-term when it is expected to be repaid within a
year or the remaining maturity of the existing credit line is less than one year; otherwise, it is
categorized as long term.
10 Utility firms are excluded because they are heavily regulated. We discard financial firms because they are heavily regulated and their financing decisions are affected by very different factors (e.g., capital adequacy regulations) than nonfinancial firms. 11 We read the notes to the credit line to ensure (1) the maturity of the line is no shorter than one year; and (2) borrowings are drawn from the revolving facility of the credit line rather than from a term loan tranche, which is more akin to installment credit.
15
To study the determinants of long-term drawdowns, we first require firms to have access to
lines of credit. We obtain information on the availability of credit lines for S&P 1500 firms from
Sufi’s (2009) sample between 1996 and 2003, and extend it to 2008.12 We obtain information on
the total amount of credit line drawdowns (i.e., the sum of short- and long-term drawdowns)
from Capital IQ after 2002.13 Data on stock prices and returns are obtained from the Center for
Research on Security Prices (CRSP) files. Appendix B summarizes the databases used in this
study and the information they provide.
In addition, we require firms to have valid information on total assets, market capitalization,
changes in cash holdings, capital expenditure, and external financing. We require that the market
value of assets and annual sales are at least $1 million, and that their annual asset growth rate
does not exceed 100%.14 This financial reporting data comes from Compustat. All dollar values
are converted into year 2000 constant dollars using a GDP deflator. To mitigate the impact of
outliers or mis-recorded data, all firm-specific continuous variables are winsorized at the 0.5%
level in both tails of the distribution.15 The final dataset is an unbalanced panel of 9,154 firm-
year observations over the 1996-2008 sample period.
3.2 Long-term Credit Line Drawdown Patterns
12 Detailed descriptions and discussions of this data are available on Amir Sufi’s homepage. This data is extended by Tai-Yuan Chen, who also collected data on the amount of unused credit line, which is used in Table IA.V of the Internet Appendix. 13 Sufi’s (2009) sample also contains the amount of the credit line that is used for 300 randomly-selected firms. However, only around one sixth of them also exist in our sample. Thus, we chose not to use this limited data. 14 Very small firms (with the market value of assets or sales less than $1 million) are excluded given their severely limited access to capital markets. Our results are essentially unchanged if we raise the cutoff for defining very small firms from $1 million to $5 million. Firms experiencing extremely high growth are eliminated as they are normally involved in major corporate events, such as mergers and acquisitions. 15 Our results are virtually the same if we censor the data instead of winsorizing at 0.5%.
16
[Insert Table 1 here]
Panel A of Table 1 shows the prevalence of long-term credit line drawdowns and its time
trend. Column (3) shows that on average, 28% of our sample firms in any given year have long-
term drawdowns. The takedown proportion increases over the early part of the sample period,
and peaks in 2000, followed by a sharp drop in the 2001 recession. It bottoms out in 2004, and
then continues to rise until the end of the sample period. Column (4) shows long-term
drawdowns as a percentage of assets (conditional on positive drawdowns). This variable shows a
time trend that is very similar to that in Column (3). The magnitude of a typical new long-term
drawdown (∆LTDraw), i.e., annual change in long-term drawdowns, is substantial. Column (5)
shows that among firm-years with non-zero new long-term drawdowns, these drawdowns on
average represent 1.1% of a firm’s total assets. To put this in perspective, the average proceeds
from net equity issues minus repurchases is -1.1% of total assets, and the net proceeds of long-
term debt issues other than credit line drawdowns is 1.3% of total assets.
Panel B contains summary statistics for the sample where we have information on the size of
credit lines. Column (7) shows that on average, 47% of these firms draw down from their long-
term credit lines in any given year. For firms with drawdowns, the total amount represents about
7.1% of book assets, or 36% of total debt (untabulated), with about half of this amount
representing long-term drawdowns. Columns (10) and (11) show that on average, the size of new
long-term drawdowns (∆LTDraw) is more than twice new short-term drawdowns (∆STDraw).
4 Testable Hypotheses and Empirical Specifications
17
4.1 Testable hypotheses
In this section, we motivate our empirical analysis of the role of bank lines of credit in long-
term financing. The principle of matching the maturity of assets and liabilities suggests that
drawdowns classified as long-term debt should be used to finance long-term investments, rather
than short-term assets such as net working capital (Guedes and Opler, 1996). We start by
examining whether credit line drawdowns respond to financing needs for long-term investment,
as captured by capital expenditures. Existing empirical literature, while emphasizing the
importance of lines of credit as a liquidity management tool, does not distinguish between the
use of credit lines for managing temporary shortfalls in working capital and managing shortfalls
in long-term financing. The theoretical literature, on the other hand, mainly emphasizes the role
of credit lines for financing investment projects, just like other forms of long-term financing such
as term loans and equity. Thus, we expect to find that long-term drawdowns are positively
related to a firm’s long-term investment needs:
Hypothesis 1 (H1): Firms with greater investment needs are more (less) likely to initiate
(end) long-term drawdowns of credit lines and to draw down additional amounts for long-
term use relative to firms with lower investment needs.
One of the key properties of credit lines as a liquidity buffer is that they serve as a financing
method of last resort. This idea is implicit in the theoretical models of Boot, Thakor, and Udell
(1987) and Holmstrom and Tirole (1998), among others, who emphasize that lines of credit are
valuable due to a time-consistency problem in the event of adverse liquidity or interest rate
shocks. It is well established that capital market conditions influence firm financial choices.
18
Graham and Harvey (2001) find that firms issue debt when they believe their equity is
undervalued, and issue short-term debt if they expect future debt market conditions to improve.
Security market conditions can change because of time-varying adverse selection and moral
hazard concerns which are related to overall economic conditions, shifts in market sentiment,
and idiosyncratic misevaluation of firms. If managers believe their stocks are temporarily
undervalued, or credit market conditions are unfavorable, then they have the option to rely more
heavily on long-term drawdowns from credit lines to finance capital expenditures until market
conditions are more favorable for debt or equity issuance.16
Hypothesis 2 (H2): Firms are more (less) likely to initiate (end) long-term drawdowns, and
to drawdown larger amounts, when general credit market and equity market conditions are
poorer. Under these adverse capital market conditions, firms are likely to rely more heavily
on credit line drawdowns for long-term use relative to other types of financing.
Lines of credit are attractive to borrowers because they offer a flexible form of financing that
can serve as a financing avenue of last resort and as insurance against adverse conditions in debt
and equity markets. However, this flexibility can also create agency problems for lenders in that
lines can be drawn down precisely when a borrower’s credit worthiness declines. Thus, we
expect covenants associated with lines of credit to be more stringent compared to term loans.17
16 Campello et al. (2011) find that credit lines ease the impact of the 2008 financial crisis on corporate spending. 17 Another reason that covenants on credit lines should be tighter than on term loans is that banks themselves may face liquidity risks (as in 2008). Credit lines are similar to call option contracts where a bank promises to lend to a borrower at a specified rate over a future period, even if market-wide liquidity is poor. Tighter covenants give the lender the option of rolling over fewer revolving facilities in the event of an adverse liquidity shock. In contrast, a bank can simply stop originating new term loans during such periods.
19
Hypothesis 3 (H3): Lines of credit are associated with more stringent financial covenants
than term loans for matching firms of similar profitability and for the same firm using both
forms of credit at nearby years.
Although we expect that covenants associated with lines of credit will be tighter compared to
term loan originations all else equal, these covenants can be relaxed (tightened) by a lender based
on updates of positive (negative) information about a borrower’s financial strength. Moreover,
improved firm profitability itself should make it more likely that a borrower can continue to meet
covenant thresholds and thus, encourages more credit line drawdowns. In other words, new
credit line drawdowns are expected to be more sensitive to firm profitability as both the elasticity
of demand and supply of these loans with respect to profitability is higher than other types of
financing. These considerations lead to the following predictions:
Hypothesis 4 (H4): Profitable firms are more (less) likely to initiate (end) long-term credit
line drawdowns and to make larger drawdowns relative to total assets. These firms are more
likely to rely on credit lines drawdowns for long-term use relative to other sources of
financing.
Moral hazard and adverse selection costs are more severe for certain types of firms, for
example, smaller firms, firms with fewer tangible assets, and firms without credit ratings, which
tend to be characteristics of younger firms. Consequently, such firms are more likely to suffer
from adverse misvaluation than other firms. Banks, on the other hand, specialize in monitoring
and screening loan customers. Consequently, firms that suffer from adverse selection vis-à-vis
arms-length providers of finance, but are able to obtain credit lines from banks, are more likely
20
to draw down their credit lines for long-term financing purposes. This analysis leads to the
following hypothesis:
Hypothesis 5 (H5): Younger and smaller firms and firms without credit ratings, are more
(less) likely to initiate (end) long-term drawdowns from credit lines, and to draw down larger
amounts of credit than other firms. They are also more likely to draw down lines of credit for
long-term use relative to relying on other sources of financing.
While lower rated or unrated firms are more likely to be dependent on line of credit
drawdowns for long-term financing, the relationship between rating quality and use of line of
credit drawdowns is unlikely to be monotonic. Compared to intermediate rated firms, the lowest
rated firms – to the extent that they have weaker balance sheets than even unrated firms – are
likely to face particularly tight covenant thresholds and to have less access to lines of credit. As
such, they are likely to be less reliant on long-term credit line drawdowns. In contrast, while the
highest rated firms generally have access to large credit lines, they are the least likely to actively
draw them down since they can easily access other potentially cheaper funding sources. Unrated
firms, on the other hand, to the extent that they are not financially weak, but suffer more from
information asymmetry vis-à-vis arms-length providers of finance, are more dependent on credit
line drawdowns.18
Hypothesis 6 (H6): Dependence on long-term line of credit drawdowns is non-monotonic in
a firm’s credit rating quality, with unrated and intermediate rated firms more reliant on such
financing. 18 Panel A of Table 6 shows that unrated firms are smaller and have fewer tangible assets than rated firms.
21
Firms with particularly low credit ratings are less likely to be able to take down credit lines
due to stricter covenants and credit line origination standards and a higher likelihood of covenant
violations, while firms with high credit ratings are the least likely to draw down credit lines since
they generally have cheaper and less restrictive sources of funds available.
4.2 Empirical specifications
We investigate the determinants of credit line use for long-term financing with lagged firm-
specific characteristics and concurrent general market conditions. The main dependent variables
of interest are the amount of new long-term credit line drawdowns (∆LTDraw), the likelihoods of
long-term drawdown initiation (StartD) and termination (EndD), and the likelihood of large
long-term drawdowns (∆LTDraw > 1%). The amount of new long-term credit line drawdowns
(∆LTDraw) is defined as the change in total long-term drawdowns from the prior year scaled by
lagged total assets. Among firms with no long-term drawdowns in the previous year, the
initiation of long-term drawdown (StartD) takes a value of one if the firm starts to use long-term
credit line drawdowns in the current year, and zero otherwise. Among firms having long-term
drawdowns in the previous year, EndD takes a value of one if a firm retires all of its long-term
drawdowns this year, and zero otherwise. Initiation of a large long-term drawdown (∆LTDraw >
1%) is an indicator variable, which takes a value of one when new long-term drawdowns exceed
1% of the firm’s beginning-of-period total assets, and zero otherwise.
The decision to use long-term credit line drawdowns can be viewed as a financing or capital
structure decision, where firms presumably weigh the costs and benefits of alternative forms of
finance in choosing credit lines for long-term financing. These drawdowns also represent a debt
22
maturity structure decision. Accordingly, we explain the use of long-term credit line drawdowns
in terms of some standard control variables that capture the costs and benefits of different
financing choices. Specifically, we consider major firm characteristics shown in previous studies
to affect financing decisions, plus a set of control variables capturing capital market conditions
as determinants of long-term drawdown decisions. Detailed definitions of these variables are
provided in Appendix C.
We use capital expenditure level (Capex) as a proxy for a firm’s long-term investment needs
to test whether long-term drawdowns are related to a firm’s investment needs (H1). Since the
actual amount of Capex could be partially determined by the amount of financing a firm can
access and management incentives, we use the fitted value of Capex based on a regression
prediction model to capture a firm’s long-term investment needs.19 We obtain very similar results
if we instead use lagged Capex in our analysis.
To investigate the effect of capital market conditions on the long-term use of credit lines
(H2), we examine several metrics that capture capital market condition. These metrics include (i)
the cumulative annual stock market return (Stock market return) defined as the monthly returns
on the CRSP value-weighted index of NYSE, NASDAQ, and AMEX traded stocks, compounded
over the fiscal year,20 (ii) the fraction of initial public offerings (IPOs) in a given year priced
below the initial filing range to capture overall stock market weakness,21 and (iii) the credit
19 Control variables include market-to-book ratio, firm size, sales growth, and industry and year fixed effects. All control variables are lagged one year. The model estimations are reported in Appendix D. 20 For ease of reporting results, it is multiplied by 100. 21 It is extracted from Table 6 of Initial Public Offerings Statistics (updated on August 8, 2017) prepared by Jay R. Ritter (http://bear.warrington.ufl.edu/ritter/ipodata.htm).
23
spread (Credit Spread), and (iv) the default spread (Default Spread) to capture debt market
conditions. The credit spread is the difference between the December commercial paper
annualized yield and the annualized December 3-month Treasury bill rate and reflects the current
tightness in credit markets, while the default spread is measured by the difference between the
December yields on Moody’s Baa and Aaa rated corporate bonds with maturities of
approximately 20-25 years. High levels of both spreads generally suggest low liquidity and high
credit market risk. Finally, we use two measures of firm-specific equity market conditions. To
measure firm-specific stock performance, we use the firm’s lagged cumulative excess stock
return (Excess Stock Return), which is calculated as the prior 12 month compounded stock return
minus the prior 12 month compounded return of the overall stock market index.22 To capture a
firm’s long-term growth potential as well as equity market conditions, we use a firm’s market-to-
book ratio (MB) lagged one year.
In all our specifications, we include GDP Growth, the percentage increase in real GDP in
2000 dollars, as a measure of the general state of the economy, which is also an inverse measure
of poor aggregate macroeconomic conditions. Since our sample period encompasses only
thirteen years, in our baseline regressions, we employ aggregate stock market returns to reflect
general equity market conditions, and credit spread to reflect general debt market conditions. In
the Internet Appendix, we report results using alternative measures of capital market conditions
for robustness analysis.
22 The results are similar if we use the risk-adjusted return (the compounded monthly CAPM-adjusted stock returns in the past 12 months) to measure a company’s stock performance.
24
To measure firm profitability, we use return on assets (ROA), which is required to test
Hypotheses H3 and H4. To test the effect of information asymmetry on the use of credit lines for
the long-term financing hypothesis H5, we use the logarithm of book value of assets to measure
firm size. To capture a company’s access to bond markets, we use a debt rating indicator variable
(Rating Indicator) that equals one if the firm has a long-term domestic issuer rating assigned by
Standard & Poor’s, and zero otherwise.
We also include several other control variables which are common to firm leverage studies.
We use the ratio of fixed to total assets to represent asset tangibility (Tangible Assets), which is
an important determinant of financing choice. We include a firm's leverage ratio (Lev), defined
as total debt (the sum of short-term and long-term debt) divided by total assets. The predicted
sign of the leverage ratio on new drawdowns for long-term use is ambiguous. Credit lines usually
contain such financial covenants as maximum leverage, debt to cash flow, and debt to tangible
net worth ratios, which prohibit firms from holding too much debt. Thus, higher leverage
increases the likelihood of covenant violations, which discourages firms from drawing down
credit lines for long-term use. On the other hand, firms exhausting their debt capacity or unable
to meet debt payments due to liquidity shocks are very likely to draw down their credit lines,
barring a covenant violation. This suggests a positive association between leverage and long-
term drawdowns. Finally, we use the Current Ratio to measure a company's liquidity status and
ability to pay off short-term debt. This ratio is often used as one of the main covenants associated
with regular bank loans. Thus, the threat of a violation of this covenant could prompt firms to
25
replace short term debt with long-term debt, including lines of credit, so as to improve the
current ratio.
5 Empirical Results
We begin by examining the determinants of the use of long-term credit line drawdowns and
what governs their use relative to other financing choices, including short term debt, long-term
debt other than long-term drawdowns, equity, and cash. Next, we explore why the use of credit
lines for long-term purposes differs in the two recessions that fall within our sample period. We
follow this with a discussion of some contractual features that are unique to credit lines,
including a comparison of covenants in credit lines and term loans. Finally, we examine how
reliance on lines of credit for long-term finance is affected by a firm’s creditworthiness and
implicitly by a credit line’s covenants.
5.1 Determinants of the use of long-term credit line drawdowns
[Insert Table 2 here]
Table 2 presents our results on the factors affecting long-term drawdowns. The first column
of Panel A reports results from an OLS model where the dependent variable is the amount of
new long-term drawdowns (∆LTDraw), while columns (2) - (4) report logit model estimates of
the determinants of long-term drawdown initiations (StartD) and terminations (EndD), as well as
large additions to long-term drawdowns (∆LTDraw >1%). Column (5) reports logit regression
results on the choice between long-term drawdowns and other types of financing. Specifically,
the dependent variable takes a value of 1 if ∆LTDraw exceeds 1% of a firm’s total assets while
26
no other source of finance (i.e., short-term debt issuance, other long-term debt issuance, equity
issuance or depletion of cash holdings) exceeds 1% of its total asset; and is zero if ∆LTDraw is
less than 1% of total assets and at least one of other sources of finance exceeds 1%. Cases where
both financing sources are > 1% or < 1% of total assets are excluded.23
To enable us to examine the effect of cross-sectional heterogeneity of some firm-specific
characteristics, all the models in Panel A of Table 2 incorporate 2-digit SIC industry fixed effects
and firm-level clustering of standard errors. Results in Panel B of Table 2 incorporate firm-fixed
effects and explore “within-variation”. This is particularly important in our context for the
following reason. All the regressions are conditional on firms having available credit lines, and
in our sample, over 90% of firms have credit lines, with very little year-to-year variation in this
percentage.24 Thus, credit line availability is highly persistent. In our sample, there is a 98%
probability, that conditional on having a credit line today, the firm will have a credit line in three
years. In view of this strong persistence and potential endogeneity concerns, we attempt to
absorb unobservable firm-specific time invariant factors that could affect credit line supply and
demand. Since incorporating firm fixed effects in non-linear models is problematic, we first
report estimates from a OLS model in Table 2, Panel B, Column (1). Then for the same set of
dependent variables used in Panel A of Table 2, we report estimates from a linear probability
23 In unreported results, we examine the choice between long-term drawdowns and other types of financing one at a time, and receive qualitatively similar results. 24 This number is higher than the one reported in Sufi (2009), which is 82%, as he examines the entire Compustat sample.
27
model (LPM) with firm fixed effects, and standard error clustered at the firm level in columns
(2)-(5) (as well as in the remaining tables).25
Columns (1)-(4) of both panels of Table 2 show that firms with higher predicted capital
expenditures (Predicted Capex) borrow more through long-term drawdowns, and are more (less)
likely to initiate (terminate) long-term drawdowns. The effects of capital spending are also
economically significant. In Panel A of Table 2, a one standard deviation rise in the predicted
capital expenditure level above the sample mean is associated with new long-term drawdowns
(as a fraction of total assets) of 0.0038. Given that the sample mean is 0.0037, this represents a
104% increase above the sample mean.26 Also, a one standard deviation increase in the predicted
capital expenditure level above the sample mean leads to a 7% (59%) increase (decrease) in the
probability of an initiation (termination) of a long-term drawdown relative to its sample mean.
These results support the conclusion that long-term drawdowns are used to finance long-term
investment projects, consistent with H1.27
25 Note that in the regression model of long-term drawdown initiation (StartD) in Table 2, Panel B, the number of observations in Column (2) falls to 6,665 as firm-years with outstanding long-term drawdowns in the prior year are excluded. Similarly, the number of observations in the regression model examining long-term drawdown termination (EndD) in Column (3) drops to 2,489 due to the exclusion of firms with no outstanding long-term drawdowns in the prior year. The number of observations in the regression model examining the choice between new long-term drawdowns and other types of financing in Column (5) drops to 5,870 because cases of both being >1% or <1% are excluded. In addition, columns (2)-(5) in Panel A of Table 2 are less than those in Panel B, because we include industry fixed effects in Panel A and thus logit regressions drop observations when the values of the dependent variable are the same for a given industry over the sample period. 26 About 2/3rd of the net changes in long-term drawdowns in our sample are zero. Of the remaining 1/3rd, Table 1, Column (5) of shows that they average 1.1% of book value of assets. Thus, the unconditional average is 0.0037. 27 In results reported in the Internet Appendix Table IA.VII, we find that the significant relationship between predicted capital expenditures and long-term credit line drawdowns is largely driven by firms with low internal liquidity, measured either by the difference between cash flow and predicted capital expenditures or alternatively by predicted cash holdings. These results are consistent with the Pecking Order theory which suggests that firms draw down credit lines to finance capital expenditure when internal liquidity is insufficient.
28
An important ancillary question is whether short-term drawdowns behave in a different
manner from long-term drawdowns and whether they are also involved in financing long term
investments. For a subsample of firms where we have information on both the amounts of short-
and long-term credit line drawdowns over the period 2003-2008, we are able to further examine
whether short-term drawdowns are more commonly used for short-term operational purposes.
We use changes in net working capital which excludes changes in cash or short-term debt
(∆NWC) as a measure of a firm’s short-term liquidity needs and report the results in Table IA.I
of the Internet Appendix. We again use predicted capital expenditures to capture a firm’s
investment activity. We find that short-term drawdowns (∆STDraw) rise with working capital
investment, but long-term drawdowns (∆LTDraw) do not, although neither is statistically
significant. On the other hand, variation in capital expenditures has a positive and significant
effect on changes in long-term drawdowns only. These results are consistent with the maturity
matching principle and suggest that reporting practices for credit line drawdowns generally
comport with the standard classification of current and long-term liabilities.
A key property of lines of credit is that they constitute a financing choice of last resort. To
test this proposition as formalized in hypothesis H2, we examine the effects of market conditions
on new credit line drawdowns for long-term use. Table 2 reports our basic findings, which are
supportive of hypothesis H2. More specifically, the amount and likelihood of new long-term
drawdowns are higher when conditions in the aggregate equity market (Stock Market Return),
and the credit market (Credit Spread) are less favorable. In Panel A of Table 2, a one standard
deviation decrease in Stock Market Return from its sample mean leads to a 22% rise in the
29
amount of new long-term drawdowns (as a percentage of total assets) and a 10% rise (7% fall) in
the probability of an initiation (a termination) of a long-term drawdown from their sample means.
A one standard deviation increase in Credit Spread from its sample mean leads to a 95% increase
in the amount of new long-term drawdowns (as a percentage of total assets) and a 12% increase
(19% decrease) in the probability of an initiation (termination) of a long-term drawdown from
their sample means. Results are robust to the inclusion of firm fixed effects.
All of the above results are consistent with lines of credit acting as a “long term financing
buffer” when other (long-term) financing options are unavailable or too costly. These results are
robust to alternative proxies for stock and credit market conditions, as discussed in the next
section.28
In Column (5) of both panels of Table 2, we examine the determinants of the choice between
new long-term credit line drawdowns and other sources of external and internal financing, i.e.,
short term debt, other long-term debt, equity and depletion of cash holdings under different fixed
effect specifications. Consistent with H2, firms are more likely to draw down lines of credit for
long-term funding, rather than engage in other types of financing when the overall stock market
conditions are relatively poor (Stock Market Return), and default risk (Credit Spread) is
relatively high. These results are inconsistent with the conclusions that the earlier findings in the
first four columns of this table are actually due to a change in a firm’s overall financing needs.
5.2 Alternative proxies for market conditions and other robustness checks
28 Drawdowns are positively related to GDP growth, suggesting that as GDP growth picks up, demand for funds for long-term investment, not captured by expected capital expenditures, is rising. These drawdowns can also occur in periods when external capital markets are exhibiting crowding out effects as firms generally seek more external funding. We revisit this issue in section 5.3.
30
To assess the robustness of our results concerning capital market conditions, we examine
several alternative measures. For overall equity market conditions, we use the percentage of
IPOs priced below their initial filing range (indicating weak equity market conditions) in place of
cumulative market return, and for general credit market conditions, we use default spread in
place of credit spreads. We also report a correlation matrix of GDP growth and our measures of
aggregate debt and equity market conditions in the Internet Appendix Table IA.II. The two
measures of aggregate equity market conditions are negatively correlated (recall that one of these
is an inverse measure) and each is significantly correlated with default spread and GDP growth.
However, none of these variables is highly correlated with credit spread.
As further robustness analysis, we report results for alternative measures of general equity
and credit market conditions, individually as well as in combination with other measures of
capital market conditions. Table IA.III of the Internet Appendix shows that the results in Table 2
are consistent across all our specifications, as well as when alternative metrics for debt and
equity market conditions are included. Interestingly, although GDP growth is positively
correlated with our measures of equity market conditions, it also has a positive effect on
drawdowns – possibly because it captures periods of higher aggregate demand for external
capital and investment.
One concern with our findings on the effect of capital market conditions on long term credit
line drawdowns is that while they are consistent with the “financing source of last resort”
hypothesis, it is possible that in periods of adverse external market conditions, banks behave
differently and withdraw credit lines from low quality firms and instead offer these to higher
31
quality firms. Since high quality firms are less likely to violate covenants, such a reallocation of
credit lines could then lead to more drawdowns overall, if the higher quality users draw down
credit lines more intensively than lower quality users. However, in examining this conjecture, we
find in Table IA.IV of the Internet Appendix that if we pool firms into high and low credit
quality groups based on the firm’s previous year ROA or Z-score, then under adverse capital
market conditions (the 2008 recession (yr08)), we do not obtain stronger effects for high
compared to low credit quality firms.
To further isolate the effect of market conditions on drawdowns from the effect on a firm’s
credit line availability of banks reallocating credit lines, we examine a subsample of firms where
information on the total credit line size is available. We then regress the long-term drawdown
amount (∆LTDraw) on the change in credit line size (∆Line), as well as firm-specific financial
conditions and aggregate capital market conditions. Table IA.V of the Internet Appendix shows
that after controlling for the change in credit line size, ∆Line, the measures of equity and long
term debt market conditions all remain significant at a 5% or lower level. This evidence also
shows evidence of a substitution effect in that when market conditions worsen, we find an
offsetting rise in demand for long term credit line drawdowns, consistent with H2.
5.3 New long-term credit line drawdowns in the 2001 and 2008 recessions
To this point, our results show that firms tend to use credit lines as a source of long-term
finance when they step up capital expenditures and when capital market conditions weaken. The
former pattern can be viewed as a general demand-driven need for long term finance, whereas
the latter pattern is a supply driven need for capital as alternative sources of external finance dry
32
up. To explore the strength of these two influences, we exploit the fact that our sample covers
two recession periods, i.e., the 2001 and 2008. While both recessions involved contractions of
credit and tightening of lending standards, they also provide interesting contrasts that illustrate
the relative strengths of these supply and demand effects.
The 2001 recession was associated with sharp cutbacks in investment spending reflecting
considerable excess capacity in manufacturing. According to the Economist Intelligence Unit
report for U.S. in March 2002, the annualized growth rates of non-residential fixed investment
are -0.2%, -14.6%, -8.5%, and -13.1% respectively in the four quarters of 2001, while in the four
quarters of 2000 the analogous growth rates are 15.7%, 12.2%, 7.1%, and 1.0%, respectively.
This decline in investment resulted in a fall in credit demand. At the same time, credit supply
also tightened.
Figure IA.I in the Internet Appendix presents the time trend in commercial and industrial
(C&I) loan demand and bank lending standards over our sample period. The solid blue line plots
the net percentage of banks reporting stronger demand for C&I loans from large and middle-
market firms. The dashed red line represents the net percentage of banks tightening lending
standards and terms for C&I loans to large and middle-market firms.29 Both data are from the
Federal Reserve’s Senior Loan Officer Opinion Survey on Bank Lending Practices.30 The figure
shows a significant decline in C&I loan demand in the 2001 recession (the blue solid line) that
29 The net percentage of banks reporting stronger demand for C&I loans is the difference between the percentage of banks reporting stronger demand for C&I loans and the percentage of banks reporting weaker demand for C&I loans. The net percentage of banks tightening lending standards measures the difference between the percentage of banks tightening lending standards and banks easing their lending standards. 30 Source: http://www.federalreserve.gov/boarddocs/snloansurvey/.
33
coincides with a surge in the net percentage of banks tightening lending standards (the red
dashed line). In the 2001 Senior Loan Officer Opinion Survey reports, banks that tightened
standards and terms on C&I loans generally indicated that one of the most important reasons for
the tighter loan standards was “weaker demand for C&I loans”. The U.S. country reports by
Economist Intelligence Unit in 2001 also state that “[The weak economy is] attributable mainly
to sharply reduced spending by businesses on fixed investment and inventories.”
In 2001, faced with tightening bank lending standards and weaker expectations of future
profitability, firms slowed the pace of borrowing. In contrast, the 2008 recession was largely
triggered by a liquidity crisis in the financial services industry, i.e., a contraction in the supply of
funds (Brunnermeier, 2009; Gorton and Metrick, 2012). In the 2008 recession, there is another
spike in the net fraction of banks tightening lending standards and loan terms. However, the
demand for funds barely contracts. The percentage of banks reporting stronger demand for C&I
loans was, on average, only around 10% less than those reporting weaker demand for C&I loans
over the four quarters of 2008, compared with a 53% drop in strong C&I loan demand in 2001.
In the 2008 Senior Loan Officer Opinion Survey reports, many banks claimed that “a
deterioration of their banks’ current or expected capital or liquidity positions had contributed to
the tightening of lending standards”.
Thus, both recessions are accompanied by a comparable surge in credit tightening, but for
distinctly different reasons. While the 2001 recession saw a contraction in credit because of
banks’ unwillingness to lend to firms with weak balance sheets, the 2008 recession was largely
precipitated by negative supply shocks to banks’ financial health and to credit market conditions
34
more generally. Reflecting this difference, loan demand contracted sharply in the 2001 recession,
while loan demand experienced a comparatively mild decline in the 2008 recession. Not only
was the supply of bank loans seriously impacted by the 2008 recession, but inter-bank lending
was disrupted and the commercial paper market was effectively shut down, while corporate bond
and equity issuance levels were seriously depressed.
Almeida et al. (2011) show that spreads on both short-term financing instruments and long-
term bonds (not only high-yield, but also investment grade bonds) jumped significantly in
August 2007, reaching a historical high in 2008. As a result of these adverse market conditions,
firms found it difficult to raise funds in the credit market. 31 Thus, 2008 is a particularly
interesting period to study since bank loan demand did not decline substantially, yet the supply
of many sources of external funding including bank loans seriously contracted.
[Insert Table 3 here]
To empirically examine the effects of the 2001 and 2008 recessions on new long-term
drawdowns, we use recession indicators for years 2001 (yr01) and 2008 (yr08). The average
sample year outside of these two recession periods serves as the normal benchmark level of
drawdowns in our regressions. Table 3 shows that firms retire more long-term drawdowns in
2001, consistent with weakening aggregate loan demand and reduced credit line availability,
relative to the benchmark level. In contrast, firms make significantly more drawdowns for long-
term use in 2008 relative to a normal year. A likely explanation for the latter effect is that despite
a small contraction in demand, other sources of external finance abruptly dried up relative to a 31 Using the August 2007 financial panic, they find that firms with larger fractions of long-term debt maturing at the time of the crisis cut their investment more significantly.
35
normal year. Thus, firms lacked other sources of external financing in the 2008 credit crunch. In
other words, they resorted to their financing choice of last resort, long-term credit line
drawdowns, in face of this severe supply shock to external sources of funding.32
One source of finance that was severely affected in the year 2008 recession was the market
for commercial paper (CP). Kahl, Shivdasani and Wang (2015) argue that due to low transaction
costs and quick access to funds, CP is often used as bridge financing for high-quality firms intent
on undertaking new investment. The main drawback of CP, however, is its short maturity, which
increases issuer rollover risk. Consistent with this concern, Kahl et. al. find that highly-rated CP
issuers refinance CP with long-term bonds to reduce rollover risk during the 2008 financial crisis.
According to the Statement of Financial Accounting Standards (SFAS No.6), CP should be
reported as long-term debt if firms plan to roll it over for more than one year and it is backed up
by a long-term credit line. In our sample, we find long term CP issues backed up by long-term
credit lines fell in 2008 (Panel A of Appendix E), while long-term credit line drawdowns rose
(Table 1). Using logit and OLS models to study the choice between new long-term drawdowns
and long-term CP issuance, we find that drawdowns are preferred during the 2008 recession
(Appendix F). Since only the most creditworthy firms can issue CP, these results indicate that
highly rated firms also rely on long-term credit line drawdowns when other sources of finance
dry up, which is again consistent with the notion that credit lines act as a financing choice of last
resort.
32 Another possible reason, as argued by Ivashina and Scharfstein (2010), is that borrowers drew down from their lines aggressively because they feared that lines could be withdrawn due to bank insolvency and diminished liquidity in the system.
36
5.4 Firm profitability, covenants, and credit line drawdowns
As discussed earlier, long term credit lines can subject banks to greater moral hazard risk
than term loans given the credit line’s much earlier origination date relative to the loan
drawdown point. In Table 4, we test whether credit lines are associated with tighter financial
covenants than term loans, to reflect the potentially higher agency problems associated with
credit lines as predicted by H3. We measure average covenant thresholds of term loans and long
term credit lines for maturities over one year, focusing on four common financial covenants:
namely, interest coverage, leverage ratio, debt-to-cash flow ratio, and the current ratio. The
financial covenant thresholds are obtained from the DealScan database.33
[Insert Table 4 here]
In Table 4, Panel A contrasts the financial covenant thresholds for long-term credit lines and
term loans issued in 1996-2008, regardless of firm characteristics. Panel B compares long-term
credit lines and term loans issued by the same firm, and Panel C matches long-term credit lines
and term loans for three firm profitability classes.34,35 In the unmatched sample and most of the
matched samples, we find that interest coverage and cash to debt ratio covenants included in
long-term credit lines are significantly stricter than those found in term loans, while no
33 The maturity of long-term credit lines is generally less than 5 years, and is shorter than that of term loans. In our sample, the average (median) maturity of term loans is 56.4 months (59 months), while that of long-term credit lines is 44.4 months (41 months). When requiring the maturity of both term loans and credit lines to be less than 60 months, we find our results are qualitative similar (not reported but available upon request). 34 To obtain firm profitability, we merge DealScan with Compustat through Dealscan-Compustat Link Data, which is obtained from Michael Roberts’ website: http://finance.wharton.upenn.edu/~mrrobert/styled-9/styled-12/index.html. Observations are excluded that either remain unmatched with Compustat or lack the necessary data for constructing ROA. 35 At loan origination, firms with ROA levels in the bottom (top) three deciles are grouped into the low (high) ROA category. The rest are classified in the median ROA category.
37
significant differences in the strictness of the debt ratio and current ratio covenants across the
two debt instruments are observed.
[Insert Table 5 here]
Table 5 confirms this finding in a regression setting. Here, following Demiroglu and James
(2010), we measure financial covenant tightness by comparing covenant thresholds of firms with
similar financial ratios (i.e., covenant variables) at the loan’s origination date. More specifically,
in each year when loan agreements are originated, we group borrowers into quintiles based on
the covenant threshold level. For thresholds of minimum current ratio and interest coverage
(thresholds of maximum debt ratio and debt-to-cash flow), the borrower is considered choosing a
tight covenant if its covenant threshold is above (below) the median value of the covenant
threshold within the quintile. We estimate separate regressions for each financial covenant,
where the dependent variable in Table 5 is an indicator variable that takes a value of 1 if the
covenant is tight, and is zero otherwise. The key explanatory variable of interest is the indicator
variable for a long-term credit line (Credit Line Indicator). This indicator variable has a
significantly positive coefficient for interest coverage and debt-to-cash flow, but is insignificant
for the other two financial covenants.
To evaluate the importance of firm profitability on the use of long-term credit line
drawdowns as predicted by H4, we revisit Table 2 and focus on firm profitability coefficients.
We find evidence of a significant coefficient for individual firm profitability (ROA) in all the
credit line drawdown regressions. The estimates in Panel A of Table 2 show that a one standard
deviation increase in ROA above its mean leads to a 64% increase in the level of new long-term
38
drawdowns (as a percentage of total assets) and a 29% increase in the likelihood of a long-term
drawdown initiation relative to their respective sample means.
5.5 Firm quality, credit ratings and new long-term drawdowns
In Panel A of Table 2, firm size (Ln(Assets)) and credit ratings (Rating Indicator) are
negatively associated in the cross section with long-term credit lines use. In particular, firm size
is negatively related to the size of drawdowns, the likelihood of long-term drawdown initiation
and of large long-term drawdowns, as well as the likelihood of large drawdowns relative to the
use of other sources of financing. Rated firms are more likely to terminate drawdowns, and less
likely to drawdown larger amounts, even relative to the use of other types of financing. These
results are consistent with hypothesis H5, in that smaller and unrated firms are less transparent,
and typically have more difficulty obtaining external financing. Consequently, borrowing
through a credit line can be an attractive way for these firms to subject themselves to more
frequent monitoring, while at the same time building their reputations and their credit market
relationships.
We next explore in more detail the relationship between firm creditworthiness and its use of
credit lines for long-term financing. We use historical S&P long-term domestic credit ratings as a
measure of a firm’s credit quality. We partition firm-years into classes based on their credit
ratings. Firms with ratings equal to or below B+ are defined as very low-rated firms. Firms with
BB- to BB+ ratings are defined as low-rated firms. Firms with BBB- to BBB+ ratings are
classified as intermediate-rated. Firms with ratings equal to or above A- are defined as high-
rated. Unrated firms have no credit ratings, and are labeled “No Rating”.
39
[Insert Table 6 here]
In Panel A of Table 6, we present descriptive statistics for firms in each of these rating
categories. Not surprisingly, high-rated firms are the most profitable, largest in size, have the
highest market-to-book ratio and the lowest earnings volatility, whereas very low rated firms (B+
rated or below) have the lowest profitability, highest leverage and smallest market-to-book ratio.
Interestingly, unrated firms are almost as profitable as intermediate-rated firms, and their market-
to-book ratio are only surpassed by high-rated firms. However, unrated firms have the highest
earnings volatility and the lowest asset tangibility, suggesting that outside capital providers view
these borrowers as having high information asymmetry. Consistent with this view, their observed
debt ratios are the lowest of the five groups.36
In Panels B and C of Table 6, we present summary statistics on long-term drawdowns and
the credit lines in each ratings category. Column (3) of Panel B shows that larger percentages of
unrated, intermediate-rated and low-rated firms draw down their credit lines for long-term use
compared to high-rated and very low-rated firms. Unrated firms also have more debt in the form
of long-term drawdowns (Column (4) of Panel B) and they draw down more than other firms
(Column (5) of Panel B). This is consistent with the idea that unrated firms are more vulnerable
to losing access to other sources of external capital. As a result, they rely more heavily on pre-
approved credit lines for long-term financing. Interestingly, unrated firms also hold the highest
levels of cash reserves (Column (8) of Panel A), presumably because credit lines only offer a
36 We also find that long-term drawdowns decline almost monotonically in firm age.
40
conditional source of external capital, while they often experience large liquidity needs due to
high earnings volatility, when credit line covenants could be violated.
Results in Panels B and C of Table 6 suggest that the relationship between rating quality and
drawdowns of lines of credit is not monotonic, consistent with hypothesis H6. Column (3) shows
that high-rated firms and very low-rated firms are the least likely to drawdown credit lines for
long-term financing purposes. Column (7) shows that these two groups of firms draw down
either long term or short-term credit lines less frequently. Column (8) shows that high-rated
firms have the lowest size drawdowns (classified as either short-term or long-term debt) on their
balance sheets. In contrast, Column (9) shows that the fraction of long-term drawdowns relative
to total credit line drawdown is only 15.4% for high-rated firms, which is at most a fourth the
size of the drawdowns by firms in any other ratings category.
These results suggest that while high-rated firms enjoy easy access to credit lines, they
seldom draw them down for long-term use. One use of credit lines is as a backup funding source
for other types of debt that a firm issues, such as commercial paper. On the other hand, very low-
rated firms are less reliant on long-term drawdowns, possibly because of a greater likelihood of
covenant violations. It follows that unrated and intermediate rated firms are the heaviest users of
credit lines for long-term financing purposes.
In our regression analysis, we find that once we control for firm characteristics, the non-
monotonic pattern disappears.37 Unrated firms are the heaviest users of credit line drawdowns for
long-term financing purposes, and the highest-rated firms use them the least. Yet, no major
37 These results are not reported in a table, but are available on request.
41
differences are observed for the categories in between. Thus, firm characteristics appear to
explain why, for example, very low-rated firms do not depend on drawdowns as much as
intermediate rated firms do.38
6 Conclusion
While the theoretical literature on credit lines and optimal financial contracting has long
thought of lines of credit as a buffer to meet shortfalls in capital expenditures, there is little
empirical evidence exploring the extent to which credit lines are used as a source of long term
finance when external capital is difficult to obtain, rather than simply a tool for short term
liquidity management. Our study addresses this issue by using hand-collected information from
firm 10-K filings of drawdowns of credit lines for long-term use. We find that long-term
drawdowns on average constitute a significant fraction (39%) of total debt and 10% of book
value of assets, making them a very important financing tool for U.S. public companies.
Our results suggest that such drawdowns are used mainly as a financing method of last resort,
which is tapped when other forms of long-term finance dry up, primarily due to capital market
disruptions rather than weakening firm financial condition. This is consistent with the notion that
lines of credit serve as a liquidity buffer for firms as predicted by the existing theoretical
literature on credit lines (Boot, Thakor, and Udell, 1987; Holmstrom and Tirole, 1998). We find
evidence that such drawdowns are especially valuable for firms subject to relatively high
38 Consistently, results in Panel A of the Internet Appendix Table IA.VI show that high quality firms use more long-term drawdowns. Panel B further shows that using more long-term drawdowns is not indicative of deterioration in firm credit quality nor of subsequent financial distress.

42
information asymmetry. Finally, we find evidence that long-term drawdowns are much more
sensitive to within-firm variations in profitability than other sources of external financing, and
that this effect is driven by the responsiveness of the supply of credit lines to changes in firm
profitability, operating through the credit line’s protective covenant channel. Our evidence is
consistent with the view that one major benefit of credit lines is that lenders can automatically
adjust their exposure levels to a particular borrower based on new publicly available information
about a borrower’s profitability, which represents a more flexible and efficient form of credit
rationing. At the same time, this lender flexibility makes the duration of the loan more uncertain,
which limits its use as a long-term source of financing for many potential borrowers.
43
References
Acharya, Viral V., Heitor Almeida, and Murillo Campello, 2013. Aggregate Risk and the Choice between Cash and Lines of Credit. Journal of Finance 68, 2059–2116.
Acharya, Viral V., Heitor Almeida, Filippo Ippolito, and Ander Perez, 2014. Credit Lines as Monitored Liquidity Insurance: Theory and Evidence. Journal of Financial Economics 112, 287–319.
Altman, Edward I., 1968. Financial Ratios, Discriminant Analysis and the Prediction of Corporate Bankruptcy. Journal of Finance 23, 589–609.
Almeida, Heitor, Murillo Campello, Bruno Laranjeira, and Scott Weisbenner, 2011. Corporate Debt Maturity and the Real Effects of the 2007 Credit Crisis. Critical Finance Review 1, 3–58.
Barakova, Irina, and Harini Parthasarathy, 2012. How Committed are Bank Corporate Line Commitments. Unpublished Working paper.
Berkovitch, Elazar, and Stuart I. Greenbaum, 1991. The Loan Commitment as an Optimal Financing Contract. Journal of Financial and Quantitative Analysis 26, 83–95.
Boot, Arnoud, Anjan V. Thakor, and Gregory F. Udell, 1987. Competition, Risk Neutrality and Loan Commitments. Journal of Banking and Finance, 11, 449–471.
Boyd, John, and Mark Gertler, 1994. Are Banks Dead? Or, Are the Reports Greatly Exaggerated? Quarterly Review (summer), 1–19, Federal Reserve Bank of Minneapolis.
Brunnermeier, Markus K., 2009. Deciphering the Liquidity and Credit Crunch 2007–2008. Journal of Economic Perspectives 23, 77–100.
Campello, Murillo, Erasmo Giambona, John R. Graham and Campbell R. Harvey, 2011. Liquidity Management and Corporate Investment During a Financial Crisis. Review of Financial Studies 24, 1944–1979.
Campello, Murillo, Erasmo Giambona, John R. Graham and Campbell R. Harvey, 2012. Access to Liquidity and Corporate Investment in Europe During the Financial Crisis. Review of Finance 16, 323–346.
DeMarzo, Peter M., and Michael J. Fishman 2007. Optimal Long-Term Financial Contracting. Review of Economic Studies 20, 2079–2128.
44
Demiroglu, Cem, and Christopher M. James, 2010. The Information Content of Bank Loan. Review of Financial Studies 23, 3700–3737.
Dennis, Steven, Debarshi Nandy, and Ian G. Sharpe, 2000. The Determinants of Contract Terms in Bank Revolving Credit Agreements. Journal of Financial and Quantitative Analysis 35, 87–110.
Disatnik, David, Ran Duchin, and Breno Schmidt, 2014. Cash Flow Hedging and Liquidity Choices. Review of Finance 18, 715–748.
Duan, Jin-Chuan, and Suk Heun Yoon, 1993. Loan Commitments, Investment Decisions, and the Signaling Equilibrium. Journal of Banking and Finance 17, 645–661.
Gatev, Evan, and Phillip E. Strahan, 2006. Banks’ Advantage in Hedging Liquidity Risk: Theory and Evidence from the Commercial Paper Market. Journal of Finance 61, 867–892.
Graham, John R., and Campbell R. Harvey, 2001. The Theory and Practice of Corporate Finance: Evidence from the Field. Journal of Financial Economics 60, 187–243.
Gorton, Gary, Metrick, Andrew, 2012. Securitized Banking and the Run on Repo. Journal of Financial Economics 104, 425–451.
Guedes, Jose, and Tim Opler, 1996. The Determinants of the Maturity of Corporate Debt Issues. Journal of Finance 51, 1809–1833.
Holmstrom, Bengt, and Jean Tirole, 1998. Private and Public Supply of Liquidity. Journal of Political Economy 106, 1–40.
Ivashina, Victoria and David Scharfstein, 2009. Liquidity Management in the Financial Crisis. Unpublished Working Paper.
Ivashina, Victoria and David Scharfstein, 2010. Bank Lending During the Financial Crisis of 2008. Journal of Financial Economics 97, 319–338.
Kahl, Matthias, Anil Shivdasan, and Yihui Wang, 2015. Short-Term Debt as Bridge Financing: Evidence from the Commercial Paper Market. Journal of Finance 70, 211-255.
Lins, Karl V., Henri Servaes, and Peter Tufano, 2010. What Drives Corporate Liquidity: An International Survey of Strategic Cash and Lines of Credit. Journal of Financial Economics 98, 160–176.
45
Morgan, Donald P., 1994. Bank Credit Commitments, Credit Rationing, and Monetary Policy. Journal of Money, Credit, and Banking 26, 87–101.
Saidenberg, Marc R., and Phillip E. Strahan. 1999. Are Banks Still Important for Financing Large Businesses? Federal Reserve Bank of New York Current Issues in Economics and Finance 5, 1–6.
Sannikov, Yuliy, 2007. Agency Problems, Screening and Increasing Credit Lines. Unpublished Working paper.
Shockley, Richard L., 1995. Bank Loan Commitments and Corporate Leverage. Journal of Financial Intermediation 4, 272–301.
Shockley, Richard L., and Anjan V. Thakor. 1997. Bank Loan Commitment Contracts: Data Theory and Tests. Journal of Money, Credit, and Banking 29, 517–34.
Sufi, Amir, 2005. Bank Lines of Credit in Corporate Finance: An Empirical Analysis. Unpublished Working paper.
Sufi, Amir, 2009. Bank Lines of Credit in Corporate Finance: An Empirical Analysis. Review of Financial Studies 22, 1057–1088.
46
Table 1 Summary statistics: Long-term credit line drawdowns The full sample contains all non-financial and non-utility U.S.-based firms from Compustat that belong to the S&P 1500 and have access to lines of credit from 1996 through 2008. Information on the availability of credit lines is obtained from Sufi’s (2009) sample, and a sample extending Sufi’s sample to 2008 for S&P 1500 firms. Long-term credit line drawdowns (LTDraw) are collected from Edgar 10-K SEC filings. Panel A presents the distribution of long-term drawdowns for the full sample. Panel B reports the distribution of long-term drawdowns for a subsample with total credit line drawdown information from 2002 through 2008. The total amount of credit line drawdown information is obtained from Capital IQ database. Long-term credit line drawdowns (LTDraw) is the amount of borrowing under a credit line, which is reported in the “long-term debt” section of a firm’s Notes to Consolidated Financial Statements. Column (3) reports the percentage of firms with long-term drawdowns. Column (4) reports the amount of long-term drawdowns outstanding as a percentage of lagged book value of assets when it is positive. Columns (5) and (10) report the amount of new long-term drawdowns (i.e., the annual change in long-term drawdowns) as a percentage of lagged book value of assets (∆LTDraw) when it is non-zero. Column (7) reports the percentage of firms that draw down from credit lines. The drawdowns can be reported as short- or long-term debt in the balance sheet. Column (8) reports the total amount of credit line drawdowns (both short- and long-term) as a percentage of lagged book value of assets. Column (9) reports the percentage of long-term drawdowns (LTDraw) out of total drawdowns. Column (11) reports the amount of new short-term drawdowns (i.e., the annual change in short-term drawdowns) as a percentage of lagged book value of assets (∆STDraw) when it is non-zero. Short-term drawdowns (STDraw) are defined as the difference between total drawdowns and long-term drawdowns. All variables are defined in Appendix C.
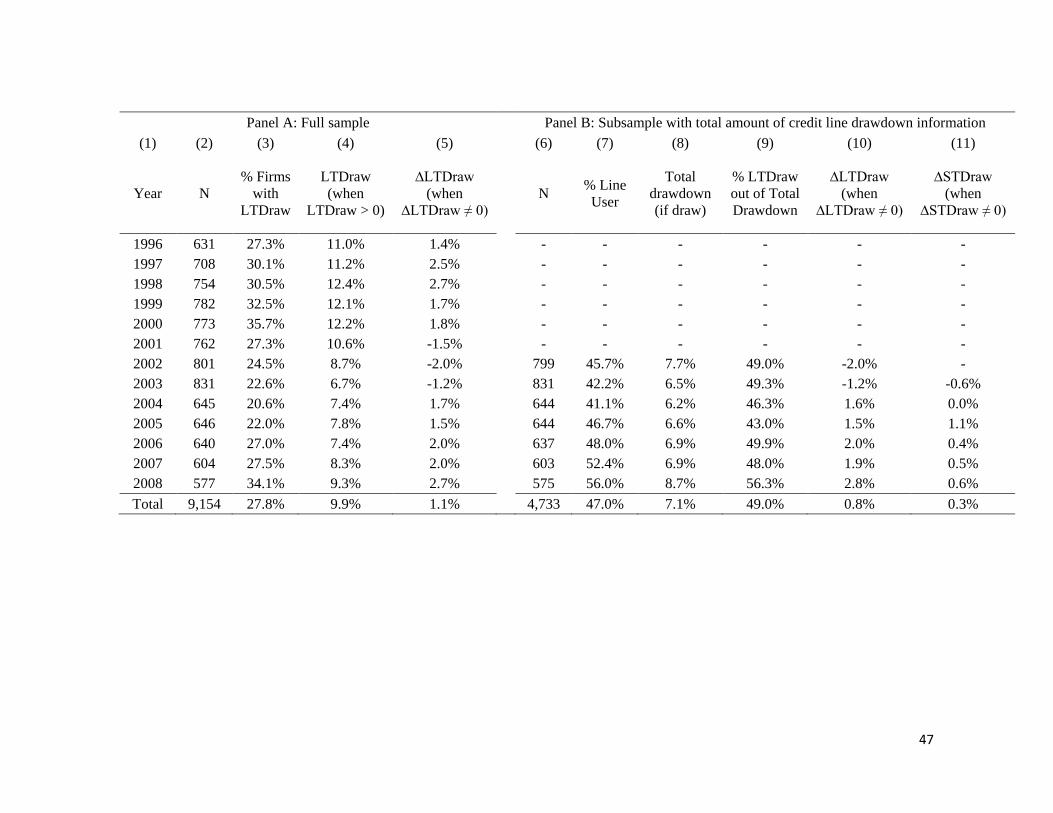
47
Panel A: Full sample Panel B: Subsample with total amount of credit line drawdown information
(1) (2) (3) (4) (5) (6) (7) (8) (9) (10) (11)
Year N % Firms
with LTDraw
LTDraw (when
LTDraw > 0)
∆LTDraw (when
∆LTDraw ≠ 0) N % Line User
Total drawdown (if draw)
% LTDraw out of Total Drawdown
∆LTDraw (when
∆LTDraw ≠ 0)
∆STDraw (when
∆STDraw ≠ 0)
1996 631 27.3% 11.0% 1.4% - - - - - - 1997 708 30.1% 11.2% 2.5% - - - - - - 1998 754 30.5% 12.4% 2.7% - - - - - - 1999 782 32.5% 12.1% 1.7% - - - - - - 2000 773 35.7% 12.2% 1.8% - - - - - - 2001 762 27.3% 10.6% -1.5% - - - - - - 2002 801 24.5% 8.7% -2.0% 799 45.7% 7.7% 49.0% -2.0% - 2003 831 22.6% 6.7% -1.2% 831 42.2% 6.5% 49.3% -1.2% -0.6% 2004 645 20.6% 7.4% 1.7% 644 41.1% 6.2% 46.3% 1.6% 0.0% 2005 646 22.0% 7.8% 1.5% 644 46.7% 6.6% 43.0% 1.5% 1.1% 2006 640 27.0% 7.4% 2.0% 637 48.0% 6.9% 49.9% 2.0% 0.4% 2007 604 27.5% 8.3% 2.0% 603 52.4% 6.9% 48.0% 1.9% 0.5% 2008 577 34.1% 9.3% 2.7% 575 56.0% 8.7% 56.3% 2.8% 0.6% Total 9,154 27.8% 9.9% 1.1% 4,733 47.0% 7.1% 49.0% 0.8% 0.3%
48
Table 2 Determinants of long-term credit line drawdowns, their initiation and termination This table presents estimations of new long-term drawdowns (∆LTDraw), the likelihood of long-term drawdown initiation (StartD) and termination (EndD), the likelihood of large new long-term drawdowns (∆LTDraw > 1%), and the choice between new long-term drawdowns (∆LTDraw) and other types of financing (i.e., short-term debt issuance, other long-term debt issuance, equity issuance, and depletion of cash reserves). The dependent variables in Column (5) equals one if ∆LTDraw exceeds 1% of a firm's total assets, while no other source of financing (i.e., short-term debt issuance, other long-term debt issuance, equity issuance or depletion of cash holdings) exceeds 1% of its total assets; and is zero if ∆LTDraw is less than 1% of total assets and at least one of other sources of finance exceeds 1%. Cases where both financing sources are > 1% or < 1% of total assets are excluded. All variables are defined in Appendix C. All firm-specific variables are lagged one year. 2-digit SIC industry fixed effects are included in all regressions in Panel A. Firm fixed effects are included in all regressions in Panel B. Robust t-statistics adjusted for clustering at the firm level are reported in parentheses. Coefficients significant at the 10%, 5%, and 1% levels are marked with *,**, and *** in superscripts, respectively.
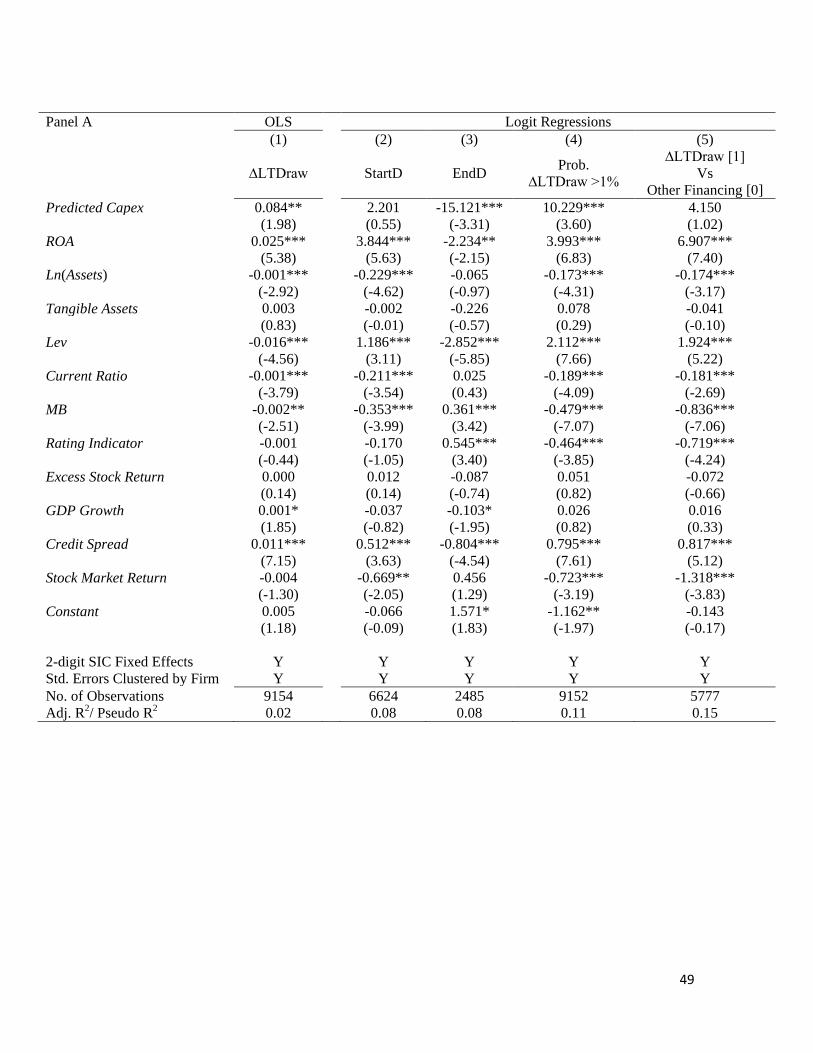
49
Panel A OLS Logit Regressions
(1) (2) (3) (4) (5)
∆LTDraw StartD EndD Prob. ∆LTDraw >1%
∆LTDraw [1] Vs
Other Financing [0] Predicted Capex 0.084** 2.201 -15.121*** 10.229*** 4.150
(1.98) (0.55) (-3.31) (3.60) (1.02) ROA 0.025*** 3.844*** -2.234** 3.993*** 6.907***
(5.38) (5.63) (-2.15) (6.83) (7.40) Ln(Assets) -0.001*** -0.229*** -0.065 -0.173*** -0.174***
(-2.92) (-4.62) (-0.97) (-4.31) (-3.17) Tangible Assets 0.003 -0.002 -0.226 0.078 -0.041
(0.83) (-0.01) (-0.57) (0.29) (-0.10) Lev -0.016*** 1.186*** -2.852*** 2.112*** 1.924***
(-4.56) (3.11) (-5.85) (7.66) (5.22) Current Ratio -0.001*** -0.211*** 0.025 -0.189*** -0.181***
(-3.79) (-3.54) (0.43) (-4.09) (-2.69) MB -0.002** -0.353*** 0.361*** -0.479*** -0.836***
(-2.51) (-3.99) (3.42) (-7.07) (-7.06) Rating Indicator -0.001 -0.170 0.545*** -0.464*** -0.719***
(-0.44) (-1.05) (3.40) (-3.85) (-4.24) Excess Stock Return 0.000 0.012 -0.087 0.051 -0.072
(0.14) (0.14) (-0.74) (0.82) (-0.66) GDP Growth 0.001* -0.037 -0.103* 0.026 0.016
(1.85) (-0.82) (-1.95) (0.82) (0.33) Credit Spread 0.011*** 0.512*** -0.804*** 0.795*** 0.817***
(7.15) (3.63) (-4.54) (7.61) (5.12) Stock Market Return -0.004 -0.669** 0.456 -0.723*** -1.318***
(-1.30) (-2.05) (1.29) (-3.19) (-3.83) Constant 0.005 -0.066 1.571* -1.162** -0.143
(1.18) (-0.09) (1.83) (-1.97) (-0.17)
2-digit SIC Fixed Effects Y Y Y Y Y Std. Errors Clustered by Firm Y Y Y Y Y No. of Observations 9154 6624 2485 9152 5777 Adj. R2/ Pseudo R2 0.02 0.08 0.08 0.11 0.15
50
Panel B OLS Regressions
(1) (2) (3) (4) (5)
∆LTDraw StartD EndD Prob. ∆LTDraw >1%
∆LTDraw [1] Vs
Other Financing [0] Predicted Capex 0.061* 0.170 -2.505*** 0.886*** 0.633**
(1.69) (0.49) (-3.16) (2.83) (2.01) ROA 0.030*** 0.102* -0.760*** 0.177*** 0.114**
(3.32) (1.95) (-2.87) (2.76) (2.15) Ln(Assets) -0.003* 0.022* 0.012 0.012 0.019
(-1.82) (1.73) (0.35) (0.95) (1.60) Tangible Assets 0.002 -0.039 -0.012 0.085 0.130*
(0.26) (-0.54) (-0.06) (1.15) (1.70) Lev -0.057*** 0.049 -0.481*** -0.114** -0.033
(-7.60) (0.94) (-3.40) (-2.22) (-0.61) Current Ratio -0.001** -0.010*** 0.002 -0.012*** -0.010***
(-2.40) (-3.23) (0.08) (-3.31) (-2.93) MB 0.000 0.001 0.023 -0.006 -0.013***
(-0.41) (0.10) (0.93) (-1.10) (-2.66) Rating Indicator 0.007* -0.003 0.080 -0.022 -0.010
(1.83) (-0.13) (1.56) (-0.86) (-0.39) Excess Stock Return -0.001 -0.012* 0.038 -0.014* -0.018**
(-0.47) (-1.81) (1.64) (-1.82) (-2.21) GDP Growth 0.001 0.000 -0.016 0.006 0.002
(1.54) (0.09) (-1.57) (1.47) (0.41) Credit Spread 0.010*** 0.032*** -0.075** 0.080*** 0.045***
(6.13) (2.59) (-2.07) (6.09) (3.11) Stock Market Return -0.005 -0.059** 0.079 -0.087*** -0.104***
(-1.31) (-2.34) (1.15) (-3.20) (-3.22) Constant 0.024* -0.081 0.545** -0.012 -0.098
(1.86) (-0.78) (1.99) (-0.12) (-0.97)
Firm Fixed Effects Y Y Y Y Y Std. Errors Clustered by Firm Y Y Y Y Y No. of Observations 9154 6665 2489 9154 5870 Adj. R2 0.01 0.29 0.19 0.20 0.23
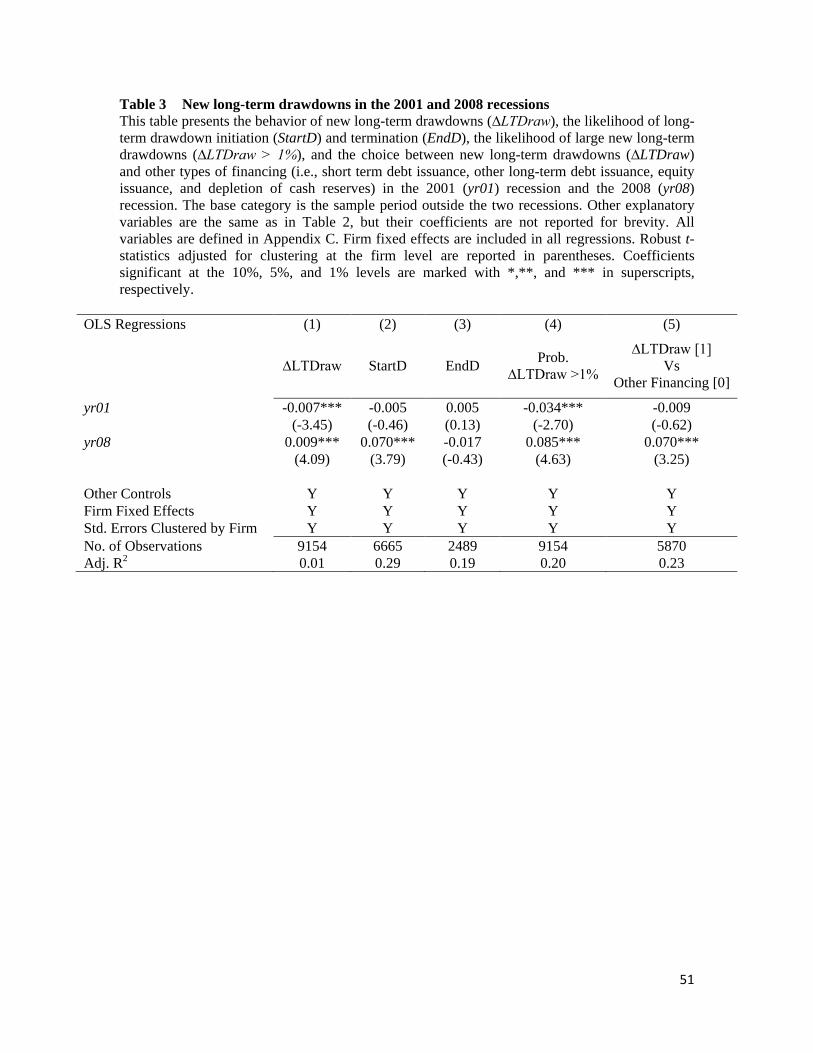
51
Table 3 New long-term drawdowns in the 2001 and 2008 recessions This table presents the behavior of new long-term drawdowns (∆LTDraw), the likelihood of long-term drawdown initiation (StartD) and termination (EndD), the likelihood of large new long-term drawdowns (∆LTDraw > 1%), and the choice between new long-term drawdowns (∆LTDraw) and other types of financing (i.e., short term debt issuance, other long-term debt issuance, equity issuance, and depletion of cash reserves) in the 2001 (yr01) recession and the 2008 (yr08) recession. The base category is the sample period outside the two recessions. Other explanatory variables are the same as in Table 2, but their coefficients are not reported for brevity. All variables are defined in Appendix C. Firm fixed effects are included in all regressions. Robust t-statistics adjusted for clustering at the firm level are reported in parentheses. Coefficients significant at the 10%, 5%, and 1% levels are marked with *,**, and *** in superscripts, respectively.
OLS Regressions (1) (2) (3) (4) (5)
∆LTDraw StartD EndD Prob. ∆LTDraw >1%
∆LTDraw [1] Vs
Other Financing [0]
yr01 -0.007*** -0.005 0.005 -0.034*** -0.009
(-3.45) (-0.46) (0.13) (-2.70) (-0.62) yr08 0.009*** 0.070*** -0.017 0.085*** 0.070***
(4.09) (3.79) (-0.43) (4.63) (3.25)
Other Controls Y Y Y Y Y Firm Fixed Effects Y Y Y Y Y Std. Errors Clustered by Firm Y Y Y Y Y No. of Observations 9154 6665 2489 9154 5870 Adj. R2 0.01 0.29 0.19 0.20 0.23
52
Table 4 Financial covenants: Credit lines versus term loans The following table shows summary statistics of common financial covenant requirements for credit lines and term loans with a maturity greater than one year. The financial covenant thresholds are obtained from DealScan Database. Both credit lines and term loans are originated in 1996-2008. Panel A contrasts the financial covenant thresholds of long-term credit lines and term loans regardless of firm characteristics. Panel B compares long-term credit lines and term loans issued by the same firm. Panel C matches long-term credit lines and term loans for three profitability classes. Borrower financial information is obtained from Compustat. *, **, and *** indicate the mean values or distribution equality (for the median values) between the “Long-term Credit Lines” group and the “Term Loans” group are statistically significant at 10%, 5%, and 1% level. The test of mean values is a two-tail test, while the test for distribution equality is a Kolmogorov–Smirnov nonparametric test. (1) (2) (3) (4) Min Interest Coverage Max Leverage Ratio Max Debt to Cash Flow Min Current Ratio
Long-term Credit Lines Term Loans
Long-term Credit Lines Term Loans
Long-term Credit Lines Term Loans
Long-term Credit Lines Term Loans
Panel A: Entire DealScan sample Mean 2.56 2.33 *** 56.2% 60.5% 3.68 4.73 *** 1.28 1.32
Median 2.50 2.00 *** 60.0% 60.0% 3.50 4.50 *** 1.15 1.23 N 3458 476 2010 187 4182 609 1084 134
Panel B: Issued by the same firm Mean 2.56 2.34 *** 57.7% 63.1% 3.72 4.42 *** 1.20 1.30
Median 2.50 2.25 *** 60.0% 60.0% 3.50 4.00 *** 1.08 1.20 N 476 241 254 109 494 270 96 48
Panel C: Match for three profitability classes
Low ROA Mean 2.37 2.06 *** 55.2% 54.8% 4.05 5.26 *** 1.30 1.31
Median 2.15 2.00 ** 60.0% 60.0% 3.50 4.75 *** 1.10 1.20 N 808 117 611 64 899 152 328 48
Median ROA
Mean 2.57 2.53 57.2% 66.8% 3.66 4.39 *** 1.32 1.22 Median 2.50 2.16 *** 60.0% 60.0% 3.50 4.25 *** 1.15 1.05
N 1299 155 817 58 1411 162 279 26
High ROA Mean 2.92 2.67 ** 55.9% 60.4% ** 3.13 3.85 *** 1.25 1.44 **
Median 3.00 2.50 ** 58.0% 60.0% 3.00 3.50 *** 1.10 1.30 ** N 880 71 404 25 1359 125 310 27
53
Table 5 Covenant tightness of credit lines and term loans in a multivariate setting Financial covenant tightness is measured by comparing covenant thresholds of firms with similar financial ratio (i.e., covenant variables) at the origination of the loan agreement. More specifically, in each year when loan agreements are originated, we group borrowers into quintiles based on the covenant threshold level. For thresholds of minimum current ratio and interest coverage (thresholds of maximum debt ratio and debt-to-cash flow), the borrower is considered choosing a tight covenant if its covenant threshold is above (below) the median value of the covenant threshold within the quintile. The dependent variables in the following tables equal one if the firm chooses a tight covenant, and zero otherwise. Credit Line Indicator equals one when the type of the loan is a long-term credit line, and zero when it is a term loan. Firm-specific explanatory variables are lagged one year. 2-digit SIC industry fixed effects and quarter effects are included in all regressions. Robust t-statistics adjusted for clustering at the quarterly level are reported in parentheses. Coefficients significant at the 10%, 5%, and 1% levels are marked with *,**, and *** in superscripts, respectively.
OLS Regressions
(1) (2) (3) (4)
Dependent Variable = Probability of Covenant Being Tight
Min Interest
Coverage Max Leverage
Ratio
Max Debt to Cash
Flow
Min Current Ratio
Credit Line Indicator 0.092** 0.059 0.084*** -0.054
(2.42) (1.04) (2.99) (-0.78) Ln(Assets) 0.021* -0.036*** -0.040*** 0.005
(1.93) (-2.92) (-5.32) (0.33) ROA -0.538 -0.486 0.171 0.166
(-1.25) (-0.81) (0.62) (1.01) Z-Score 0.043* -0.033 0.013*** -0.012
(1.88) (-1.24) (3.15) (-0.86) Package Amount 0.131** -0.384*** -0.226*** -0.155*
(2.63) (-3.21) (-4.15) (-1.78) Ln(Loan Maturity (in months)) 0.058 -0.006 -0.107*** -0.014
(1.59) (-0.18) (-4.29) (-0.38) Constant -0.005 0.802*** 0.946*** 0.944***
(-0.04) (5.74) (9.08) (6.31) Industry and Quarter Fixed Effects Y Y Y Y Std. Errors Clustered by Quarter Y Y Y Y No. of Observations 2052 1323 3290 905 Adj. R2 0.13 0.21 0.11 0.03
54
Table 6 Summary statistics by credit rating groups This table presents summary statistics for firms sorted by S&P long-term domestic issuer credit rating. High rating refers to ratings equal or above A-. Intermediate Rating refers to ratings from BBB- to BBB+. Low Rating refers to ratings from BB- to BB+. Very Low Rating refers to ratings equal or below B+. No Rating refers to those with no rating. Panel A presents descriptive statistics for firms in each of these rating categories, while Panels B and C present summary statistics for the use of long-term drawdowns and credit lines in each of rating categories. Panel B is for the full sample, while Panel C is for a subsample with total credit line drawdown information from 2002 through 2008. Column (3) of Panel B reports the percentage of firms that have long-term credit line drawdowns (% firms with LTDraw). Column (4) of Panel B reports the amount of long-term drawdowns outstanding as a percentage of lagged book value of assets. Columns (5) of Panel B and (10) of Panel C report the amount of new long-term drawdowns (i.e., the annual change in long-term drawdowns) as a percentage of lagged book value of assets (∆LTDraw), when it is non-zero. Column (7) of Panel C reports the percentage of firms that draw down from credit line. The drawdowns can be reported as short- or long-term debt in the balance sheet. Column (8) of Panel C reports the total amount of credit line drawdowns (both short- and long-term) as a percentage of lagged book value of assets. Column (9) of Panel C reports the percentage of long-term drawdowns (LTDraw) out of total drawdowns. Column (11) of Panel C reports the amount of new short-term drawdowns (i.e., the annual change in short-term drawdowns) as a percentage of lagged book value of assets (∆STDraw) when it is non-zero. A Short-term drawdown (STDraw) is the difference between total drawdowns and long-term drawdowns. All variables are defined in Appendix C.
Panel A (1) (2) (3) (4) (5) (6) (7) (8)
Credit Rating ROA Ln(Assets) Tangible Assets Lev MB Earnings Volatility Cash Holding
High Rating [A-, AAA] 13.9% 9.10 33.2% 23.7% 2.41 3.0% 7.2%
Intermediate Rating [BBB-,BBB+] 9.9% 8.45 35.2% 27.1% 1.66 3.7% 7.0%
Low Rating [BB-,BB+] 8.2% 7.60 34.4% 33.4% 1.48 4.9% 8.5%
Very Low (≤B+) 4.2% 7.11 33.7% 38.4% 1.47 6.8% 13.5%
No Rating 9.5% 6.08 28.8% 15.9% 2.03 6.9% 13.6%
Total 9.9% 7.28 31.7% 22.7% 1.93 5.4% 10.6%
55
Panel B: Full sample Panel C: Subsample with total amount of credit line drawdown information
(1) (2) (3) (4) (5) (6) (7) (8) (9) (10) (11)
Credit Rating N % Firms
with LTDraw
LTDraw (when
LTDraw > 0)
∆LTDraw (when
∆LTDraw ≠ 0) N %
Line User
Total Drawdown (if draw)
% LTDraw out of Total Drawdown
∆LTDraw (when
∆LTDraw ≠ 0)
∆STDraw (when
∆STDraw ≠ 0)
High Rating [A-, AAA] 1,516 7.7% 5.3% 0.4% 762 30.4% 2.3% 15.4% 1.0% 0.1%
Intermediate Rating [BBB-,BBB+] 1,717 30.0% 7.8% 0.6% 985 50.8% 4.8% 45.0% 0.5% 0.5%
Low Rating [BB-,BB+] 1,249 39.9% 9.8% 0.6% 807 54.3% 8.1% 61.7% 0.6% 0.1%
Very Low (≤B+) 395 22.0% 7.1% 0.0% 258 45.0% 6.7% 44.4% -0.1% 0.6%
No Rating 4,277 31.1% 11.4% 1.7% 1,921 48.9% 9.1% 54.0% 1.1% 0.3%
Total 9,154 27.8% 9.9% 1.1% 4,733 47.0% 7.1% 49.0% 0.8% 0.3%
56
Appendix A An example of short-term and long-term credit line drawdowns By the end of fiscal year 2007 (February 29, 2008), Carmax, Inc (gvkey: 64410) had a $500 million revolving credit facility which was due in December 2011. As of February 29, 2008, $300.2 million was outstanding under the credit agreement. In our sample, we classify $100.217 million as short-term drawdown and $200 million as long-term drawdown. The following is excerpted from footnotes in page 37–38 of Carmax's 10-K filing reported on April 25, 2008. (Source: http://www.sec.gov/Archives/edgar/data/1170010/000117001008000043/tenk.htm) 9. DEBT
As of February 29 or 28
(In thousands) 2008 2007
Revolving credit agreement $300,217 $150,690
Obligations under capital leases 27,614 34,787
Total debt 327,831 185,477
Less current portion:
Revolving credit agreement 100,217 150,690
Obligations under capital leases 461 1,043
Total long-term debt, excluding current portion $227,153 $33,744
We have a $500 million revolving credit facility (the “credit agreement”) with Bank of America, N.A. and various other financial institutions. The credit agreement is secured by vehicle inventory and contains customary representations and warranties, conditions and covenants. Borrowings accrue interest at variable rates based on LIBOR, the federal funds rate, or the prime rate, depending on the type of borrowing. We pay a commitment fee on the used and unused portions of the available funds. All outstanding principal amounts will be due and payable in December 2011, and there are no penalties for prepayment.
As of February 29, 2008, $300.2 million was outstanding under the credit agreement, with the remainder fully available to us. The outstanding balance included $21.0 million classified as short-term debt, $79.2 million classified as current portion of long-term debt and $200.0 million classified as long-term debt. We classified $79.2 million of the outstanding balance as of February 29, 2008, as current portion of long-term debt based on our expectation that this balance will not remain outstanding for more than one year.
57
Appendix B Datasets summary
Data source Sample Period Information Provided
Compustat financial statement data Our hand-collected data 1996 - 2008 the amount of long-term credit line
drawdowns for all non-financial and non-utility U.S.-based firms that belong to the S&P 1500
Sufi (2009) 1996 - 2003 availability of credit lines of all non-financial U.S.-based firms
Tai-Yuan Chen’s sample (Extending Sufi’s sample for S&P 1500 firms to 2008)
2000 - 2008 availability of credit lines and the amount of unused line for all non-financial and non-utility U.S.-based firms that belong to the S&P 1500
Capital IQ 2002 - the amount of used line (both short-term and long-term) of all public firms
CRSP stock prices and returns
58
Appendix C Variable Definitions Acquisition: acquisitions scaled by total assets
Capex: capital expenditures scaled by lagged assets Cash Flow (CF): the ratio of operating income before depreciation, after interest, dividends,
and taxes to lagged total book assets. Credit Line Indicator: equal to when the type of the loan is a long-term credit line, and zero
when it is a term loan
Credit Spread: the difference between the December commercial paper annualized yield and the annualized December 3-month Treasury bill rate, and then times 100.
Current Ratio: current assets/current liabilities Default Spread: the difference between the December yields on Moody’s Baa and Aaa rated
corporate bonds with maturities of approximately 20-25 years Dividend Indicator: equal to 1 if a firm paid a common dividend in a given year, and zero
otherwise. Earnings Volatility: the standard deviation of the ratio of EBIT to assets over the past 5 years EndD: among firms with long-term credit line drawdowns at t-1, it equals one for firms with
no long-term drawdowns at t, and zero otherwise. Excess Stock Return: the prior 12 month compounded stock return minus the prior 12 month
compounded return of the overall stock market index % Firms with LTDraw: the percentage of firms that have long-term credit line drawdowns GDP Growth: the percentage increase in real GDP in 2000 dollars. High Rating: the S&P long-term domestic issuer rating is A- or above; Industry Sigma: volatility of cash flow (CF) within the 2-digit SIC group of a firm.
Specifically, we first calculate the standard deviation of cash flow over the previous 10 years for each firm. A firm must have at least three observed cash flow over the previous 10 years to be counted. Then for each year, we take the average across each 2-digit SIC industry of the standard deviations of firm cash flow.
Intermediate Rating: the S&P long-term domestic issuer rating is from BBB- to BBB+ % IPOs with OP<Lo: Percentage of IPOs priced below the initial file price range (For the
ease of the result reporting, it times 100.). It is extracted from Table 6 of Initial Public Offerings Statistics (updated on August 8, 2017) prepared by Jay R. Ritter (http://bear.warrington.ufl.edu/ritter/ipodata.htm).
Lev: book leverage defined as face value of debt divided by total book assets.
59
∆Line: changes in total amount of credit line, scaled by lagged assets. % Line User: the percentage of firms with (either short-term or long-term) credit line
drawdowns
Long-term CP : the amount of commercial paper reported in the long-term debt section of balance sheet
Low Rating: the S&P long-term domestic issuer rating is from BB- to BB+ LTDraw: long-term credit line drawdowns scaled by total assets. Long-term credit line
drawdowns is the amount of borrowing under a credit line, which is reported in the “long-term debt” section of a firm’s Notes to Consolidated Financial Statements.
∆LTDraw: changes in long-term credit line draw-downs, scaled by lagged total assets % LTDraw out of Total Drawdown: the proportion of long-term credit line drawdowns out of
total drawdowns.
MB: market-to-book ratio
NWC: working capital net of cash or short-term debt, scaled by lagged total assets No Rating: firms with no S&P long-term domestic rating Other Financing: It includes short-term debt issuance, other long-term debt issuance, equity
issuance, and depletion of cash reserves. Short-term debt issuance is the change in current debt in one year scaled by lagged assets. Other long-term debt issuance is the difference between the change in long-term debt in one year and ∆LTDraw, scaled by lagged assets. Equity issuance is sale of common and preferred stock - purchase of common and preferred stock, scaled by lagged assets. Depletion of cash reserves is the decrease of cash and cash equivalents in one year, scaled by lagged assets
Package Amount: the amount of the entire loan package, scaled by total assets
Rating Indicator: equals one when a firm has a long-term domestic issuer rating assigned by
Standard & Poor’s in a given year, and zero otherwise. R&D: ratio of R&D expenditures to sales. If R&D is missing from Compustat, then R&D is
set equal to 0.
ROA: EBIT scaled by assets
Sales Growth: the percentage increase in annual total sales Short-term CP: the amount of commercial paper reported in the short-term debt section of
balance sheet StartD: among firms with no long-term credit line drawdowns at t-1, it equals one for firms
with long-term drawdowns at t, and zero otherwise.
60
STDraw: the difference between total credit line drawdowns and long-term drawdowns
(LTDraw) ∆STDraw: changes in short-term credit line drawdowns (STDraw), scaled by lagged assets Stock Market Return: annualized stock market return computed by compounding monthly
returns on the CRSP value-weighted index of NYSE, NASDAQ, and AMEX traded stocks over the fiscal year. (For the ease of the result reporting, it is multiplied by 100.)
Tangible Assets: net PPE scaled by lagged assets Total Drawdown: the amount of both short-term and long-term credit line drawdowns as a
percentage of lagged assets
Very Low Rating: the S&P long-term domestic issuer rating is B+ or below
Violation: equals one if a firm experiences any financial covenant violation in the previous four quarters, and zero otherwise
y01: equals one in year 2001 and zero in other years y08: equals one in year 2008 and zero in other years
Z-Score: It is Altman's (1968) unlevered Z-Score, which is calculated as follows. (3.3 ×
pretax income + sales + 1.4 × retained earnings + 1.2 × (current assets - current liabilities)) / total assets.
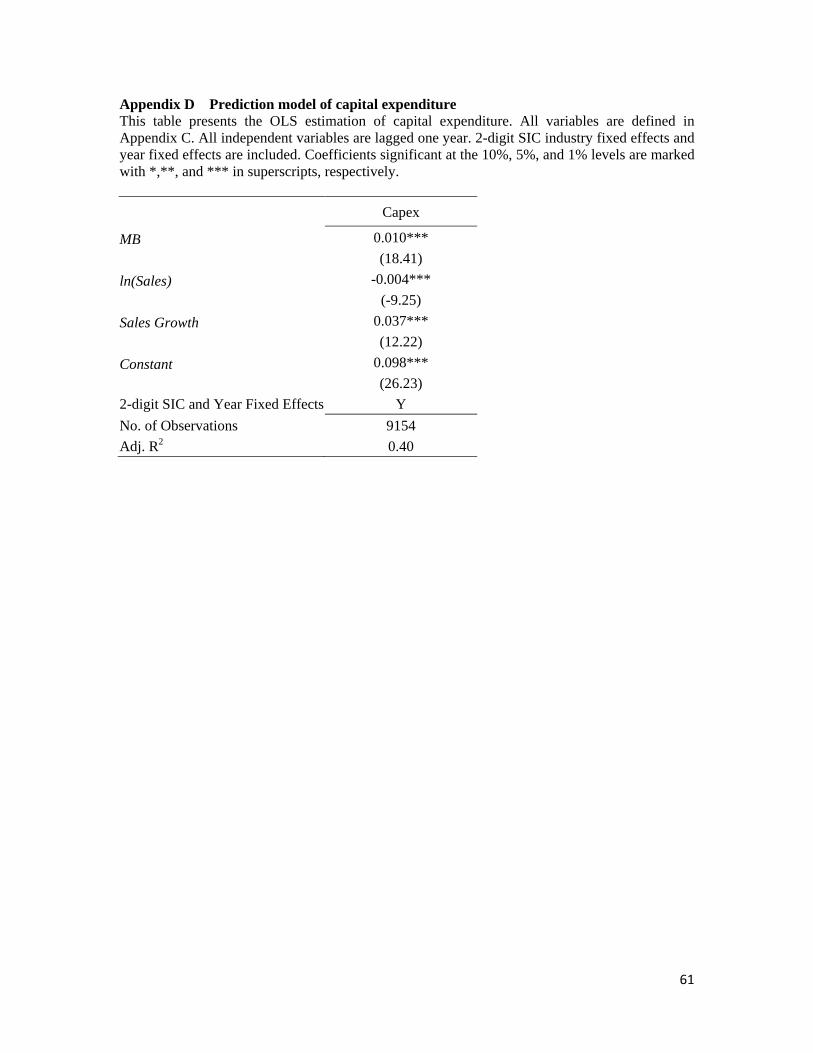
61
Appendix D Prediction model of capital expenditure This table presents the OLS estimation of capital expenditure. All variables are defined in Appendix C. All independent variables are lagged one year. 2-digit SIC industry fixed effects and year fixed effects are included. Coefficients significant at the 10%, 5%, and 1% levels are marked with *,**, and *** in superscripts, respectively.
Capex
MB 0.010***
(18.41) ln(Sales) -0.004***
(-9.25) Sales Growth 0.037***
(12.22) Constant 0.098***
(26.23) 2-digit SIC and Year Fixed Effects Y No. of Observations 9154 Adj. R2 0.40
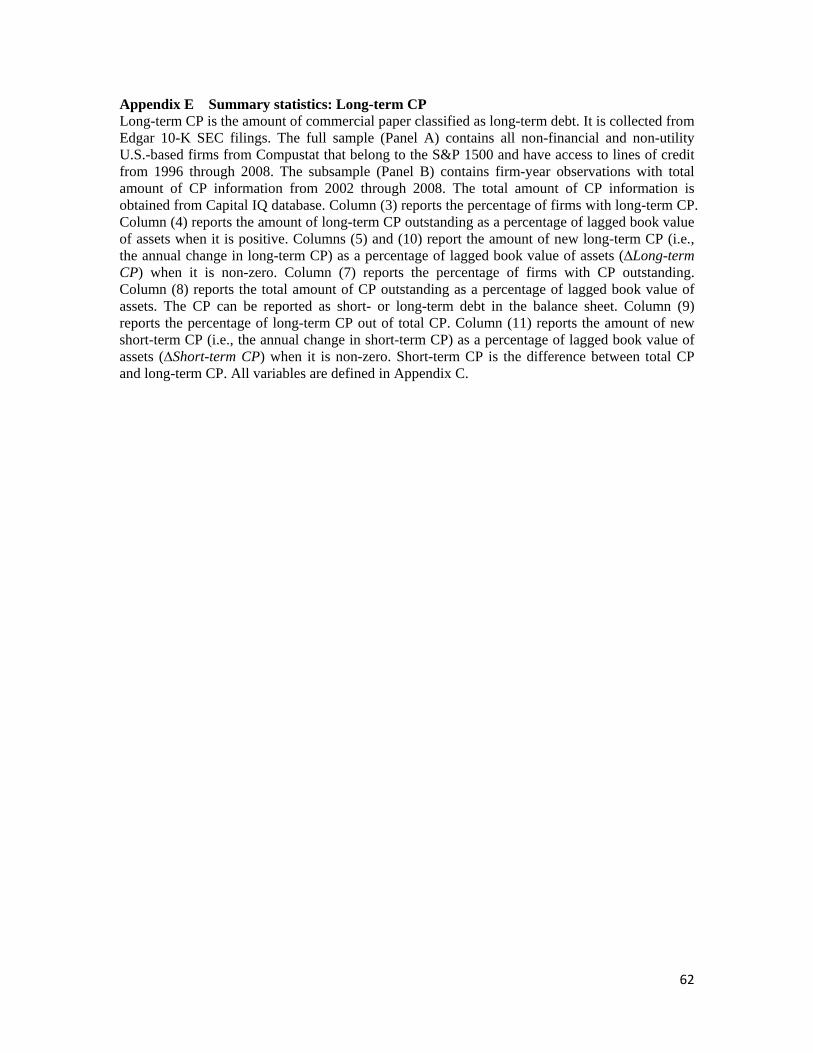
62
Appendix E Summary statistics: Long-term CP Long-term CP is the amount of commercial paper classified as long-term debt. It is collected from Edgar 10-K SEC filings. The full sample (Panel A) contains all non-financial and non-utility U.S.-based firms from Compustat that belong to the S&P 1500 and have access to lines of credit from 1996 through 2008. The subsample (Panel B) contains firm-year observations with total amount of CP information from 2002 through 2008. The total amount of CP information is obtained from Capital IQ database. Column (3) reports the percentage of firms with long-term CP. Column (4) reports the amount of long-term CP outstanding as a percentage of lagged book value of assets when it is positive. Columns (5) and (10) report the amount of new long-term CP (i.e., the annual change in long-term CP) as a percentage of lagged book value of assets (∆Long-term CP) when it is non-zero. Column (7) reports the percentage of firms with CP outstanding. Column (8) reports the total amount of CP outstanding as a percentage of lagged book value of assets. The CP can be reported as short- or long-term debt in the balance sheet. Column (9) reports the percentage of long-term CP out of total CP. Column (11) reports the amount of new short-term CP (i.e., the annual change in short-term CP) as a percentage of lagged book value of assets (∆Short-term CP) when it is non-zero. Short-term CP is the difference between total CP and long-term CP. All variables are defined in Appendix C.
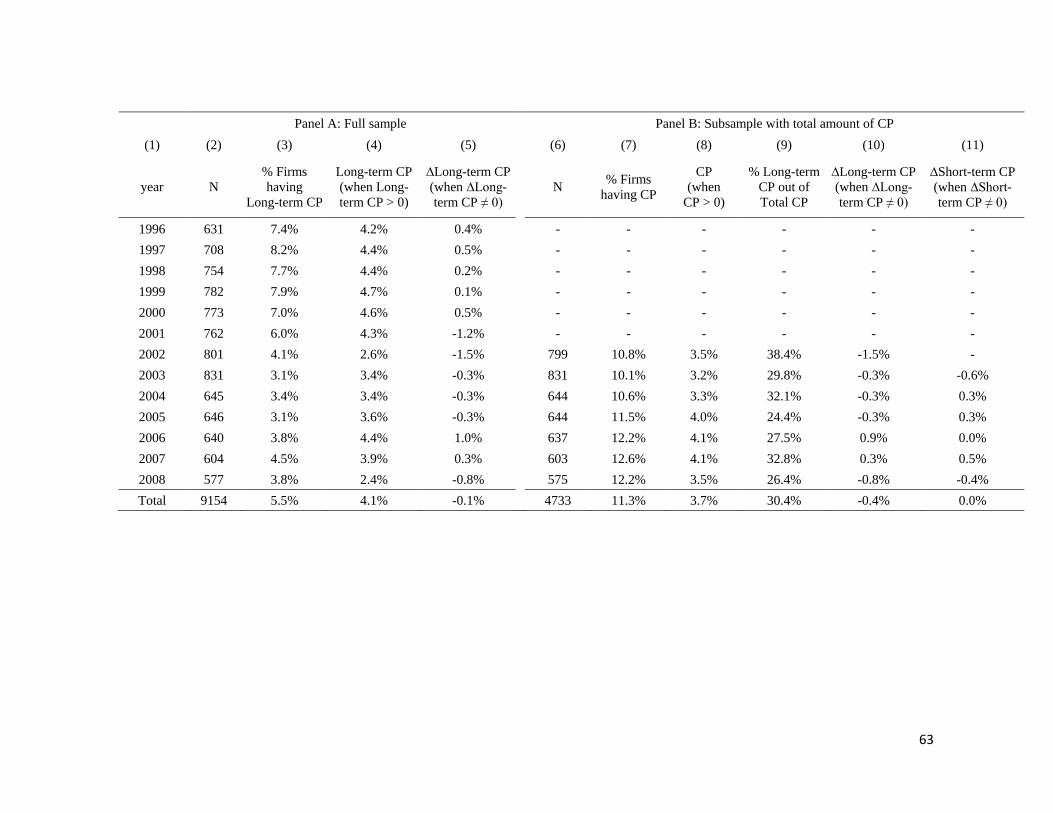
63
Panel A: Full sample Panel B: Subsample with total amount of CP (1) (2) (3) (4) (5) (6) (7) (8) (9) (10) (11)
year N % Firms having
Long-term CP
Long-term CP (when Long-term CP > 0)
∆Long-term CP (when ∆Long-term CP ≠ 0) N % Firms
having CP
CP (when
CP > 0)
% Long-term CP out of Total CP
∆Long-term CP (when ∆Long-term CP ≠ 0)
∆Short-term CP (when ∆Short-term CP ≠ 0)
1996 631 7.4% 4.2% 0.4% - - - - - - 1997 708 8.2% 4.4% 0.5% - - - - - - 1998 754 7.7% 4.4% 0.2% - - - - - - 1999 782 7.9% 4.7% 0.1% - - - - - - 2000 773 7.0% 4.6% 0.5% - - - - - - 2001 762 6.0% 4.3% -1.2% - - - - - - 2002 801 4.1% 2.6% -1.5% 799 10.8% 3.5% 38.4% -1.5% - 2003 831 3.1% 3.4% -0.3% 831 10.1% 3.2% 29.8% -0.3% -0.6% 2004 645 3.4% 3.4% -0.3% 644 10.6% 3.3% 32.1% -0.3% 0.3% 2005 646 3.1% 3.6% -0.3% 644 11.5% 4.0% 24.4% -0.3% 0.3% 2006 640 3.8% 4.4% 1.0% 637 12.2% 4.1% 27.5% 0.9% 0.0% 2007 604 4.5% 3.9% 0.3% 603 12.6% 4.1% 32.8% 0.3% 0.5% 2008 577 3.8% 2.4% -0.8% 575 12.2% 3.5% 26.4% -0.8% -0.4% Total 9154 5.5% 4.1% -0.1% 4733 11.3% 3.7% 30.4% -0.4% 0.0%
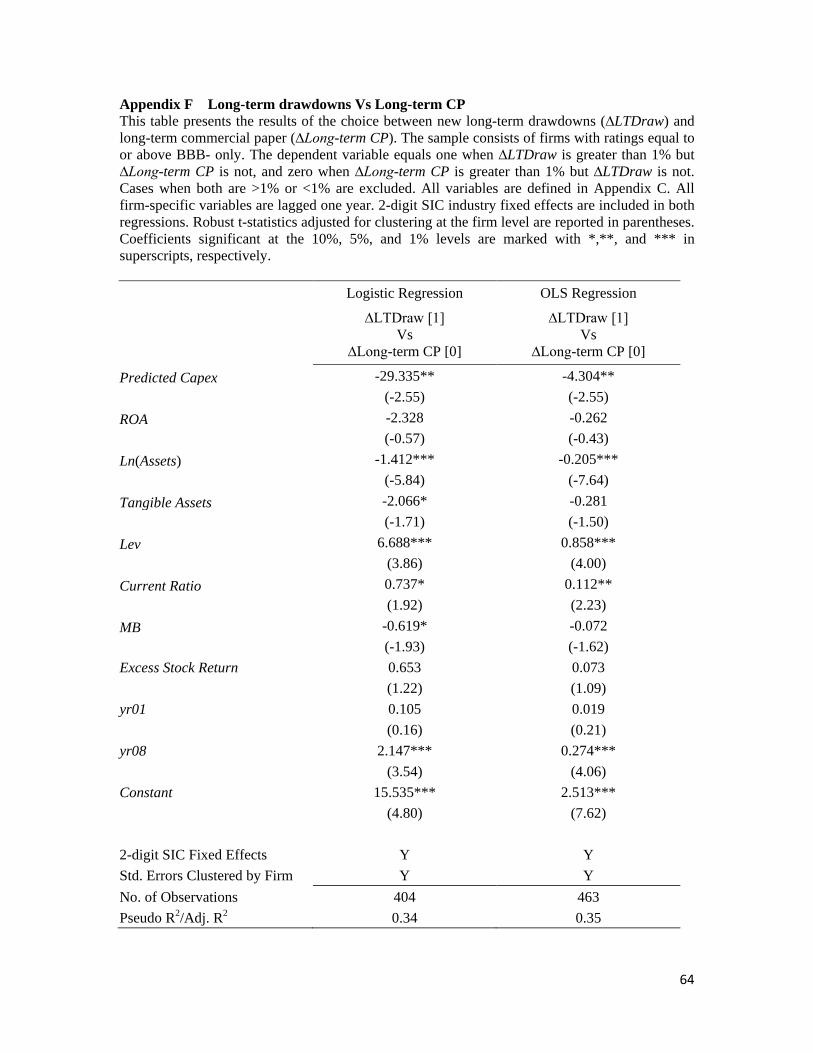
64
Appendix F Long-term drawdowns Vs Long-term CP This table presents the results of the choice between new long-term drawdowns (∆LTDraw) and long-term commercial paper (∆Long-term CP). The sample consists of firms with ratings equal to or above BBB- only. The dependent variable equals one when ∆LTDraw is greater than 1% but ∆Long-term CP is not, and zero when ∆Long-term CP is greater than 1% but ∆LTDraw is not. Cases when both are >1% or <1% are excluded. All variables are defined in Appendix C. All firm-specific variables are lagged one year. 2-digit SIC industry fixed effects are included in both regressions. Robust t-statistics adjusted for clustering at the firm level are reported in parentheses. Coefficients significant at the 10%, 5%, and 1% levels are marked with *,**, and *** in superscripts, respectively.
Logistic Regression OLS Regression
∆LTDraw [1] Vs
∆Long-term CP [0]
∆LTDraw [1] Vs
∆Long-term CP [0]
Predicted Capex -29.335** -4.304**
(-2.55) (-2.55) ROA -2.328 -0.262
(-0.57) (-0.43)
Ln(Assets) -1.412*** -0.205***
(-5.84) (-7.64)
Tangible Assets -2.066* -0.281
(-1.71) (-1.50)
Lev 6.688*** 0.858***
(3.86) (4.00)
Current Ratio 0.737* 0.112**
(1.92) (2.23) MB -0.619* -0.072
(-1.93) (-1.62) Excess Stock Return 0.653 0.073
(1.22) (1.09) yr01 0.105 0.019
(0.16) (0.21) yr08 2.147*** 0.274***
(3.54) (4.06) Constant 15.535*** 2.513***
(4.80) (7.62)
2-digit SIC Fixed Effects Y Y Std. Errors Clustered by Firm Y Y No. of Observations 404 463 Pseudo R2/Adj. R2 0.34 0.35