Embed Size (px)
Citation preview
External tufted cells in the main olfactory bulb form twodistinct subpopulations
Miklos Antal, Mark Eyre, Bryson Finklea and Zoltan NusserLaboratory of Cellular Neurophysiology, Institute of Experimental Medicine, Hungarian Academy of Sciences, Szigony Street 43,1083 Budapest, Hungary
Keywords: cluster analysis, in vitro physiology, olfactory bulb, principal component analysis, reconstruction
Abstract
The glomeruli of the main olfactory bulb are the first processing station of the olfactory pathway, where complex interactions occurbetween sensory axons, mitral cells and a variety of juxtaglomerular neurons, including external tufted cells (ETCs). Despite anumber of studies characterizing ETCs, little is known about how their morphological and functional properties correspond to eachother. Here we determined the active and passive electrical properties of ETCs using in vitro whole-cell recordings, and correlatedthem with their dendritic arborization patterns. Principal component followed by cluster analysis revealed two distinct subpopulationsof ETCs based on their electrophysiological properties. Eight out of 12 measured physiological parameters exhibited significantdifference between the two subpopulations, including the membrane time constant, amplitude of spike afterhyperpolarization,variance in the interspike interval distribution and subthreshold resonance. Cluster analysis of the morphological properties of thecells also revealed two subpopulations, the most prominent dissimilarity between the groups being the presence or absence ofsecondary, basal dendrites. Finally, clustering the cells taking all measured properties into account also indicated the presence of twosubpopulations that mapped in an almost perfect one-to-one fashion to both the physiologically and the morphologically derivedgroups. Our results demonstrate that a number of functional and structural properties of ETCs are highly predictive of one another.However, cells within each subpopulation exhibit pronounced variability, suggesting a large degree of specialization evolved to fulfilspecific functional requirements in olfactory information processing.
Introduction
In mammals, olfactory sensory neurons in the nasal epitheliumexpressing the same odourant receptors project their axons to one or afew glomeruli in each main olfactory bulb (MOB; Ressler et al., 1994;Vassar et al., 1994). The olfactory glomeruli are clear examples of theprinciple of grouping neural elements and synapses into well definedmodules. These spherical regions of neuropil are the first processingstation of the olfactory pathway, where sensory axons form synapseson the apical dendrites of the principal cells (mitral and tufted cells)and on some intrinsic neurons (Pinching & Powell, 1971b; Kosakaet al., 1998; Shepherd et al., 2004). Complex dendro-dendritic andaxo-dendritic interactions also occur within the glomeruli betweenprincipal cells and juxtaglomerular cells (JGCs) and among JGCs(Kosaka et al., 1998, 2001; Hayar et al., 2004a, 2005; Shepherd et al.,2004; Kosaka & Kosaka, 2005). Cell bodies of JGCs are locatedaround the glomeruli, creating a cell-rich neuropil.It has long been recognized that JGCs are morphologically diverse
and comprise short-axon, periglomerular and external tufted cells(ETCs; Cajal, 1911; Pinching & Powell, 1971a; Shepherd et al.,2004). Among the JGCs, ETCs have the largest somata (10–15 lm)and have a single, relatively sparse, fan-shaped apical dendritic tuftthat most often arborizes in a single glomerulus. Most ETCs lacksecondary dendrites. However, ETCs with basal dendrites have alsobeen described, as have ETCs with apical tufts ramifying in two
glomeruli (Pinching & Powell, 1971a; Macrides & Schneider, 1982;Hayar et al., 2004b; Shepherd et al., 2004), indicating the morpho-logical heterogeneity of these cells. In contrast, periglomerular cells(PGCs) have the smallest somata among JGCs and a small, spine-bearing dendritic tuft (Pinching & Powell, 1971a; Shepherd et al.,2004). Short-axon cells of the glomerular layer (GL) have anintermediate soma size and are distinguished by dendrites that arborizearound the glomeruli in the periglomerular region without forming anapical tuft (Pinching & Powell, 1971a; Aungst et al., 2003; Shepherdet al., 2004). Juxtaglomerular cells are also diverse, based on theiractive and passive electrical properties and their synaptic connectivity(Puopolo & Belluzzi, 1998; McQuiston & Katz, 2001; Hayar et al.,2004a, 2004b). Recently, Hayar et al. (2004a) have functionallycharacterized several JGCs and found robust differences betweenPGCs, ETCs and short-axon cells, but most physiological properties ofthe ETCs were found to be rather uniform.To understand the cellular and synaptic mechanisms of olfactory
information processing, the intrinsic properties and synaptic connec-tivity of these different types of nerve cells need to be deciphered. Thisrequires the identification of whether structural and functionalheterogeneity correlate with each other, resulting in well definedsubpopulations of cells, or whether these measured features of thecells vary independently, resulting in a single but highly diversepopulation. In the present study, we aimed to characterize the intrinsicelectrical and morphological properties of ETCs in the rat MOB.Based on a large number of measured physiological and morpholo-gical parameters, we asked whether ETCs comprise a single popula-tion or whether multiple subpopulations exist. We also aimed to
Correspondence: Dr Zoltan Nusser, as above.E-mail: [email protected]
Received 30 April 2006, revised 7 June 2006, accepted 12 June 2006
European Journal of Neuroscience, Vol. 24, pp. 1124–1136, 2006 doi:10.1111/j.1460-9568.2006.04988.x
ª The Authors (2006). Journal Compilation ª Federation of European Neuroscience Societies and Blackwell Publishing Ltd
determine whether the pattern of dendritic arborization of ETCs couldbe predicted from their active and passive electrical properties, andvice versa. Over 30 electrophysiological and 18 morphologicalparameters were measured and calculated for > 60 randomly selectedETCs. These parameters were subject to principal component analysis(PCA) followed by cluster analysis, which revealed two subpopula-tions of ETCs. Over two-thirds of the measured parameters signifi-cantly differed between the two subpopulations. Although pronouncedvariability in several parameters was still present within eachsubpopulation, further subdivisions were not justified statistically.Interestingly, there was an almost perfect match between thesubgroups derived from the morphological and electrophysiologicalparameters, demonstrating that a number of functional and structuralproperties of ETCs are highly predictive of one another.
Materials and methods
Acute slice preparation
Male Wistar rats (26–78 days old; mean ± SD, 36.1 ± 9.7 days) wereanaesthetized with ketamine (50 mg per animal) in accordance withthe ethical guidelines of the Institute of Experimental Medicine,Hungarian Academy of Sciences. After decapitation, the brain wasremoved and placed into ice-cold artificial cerebrospinal fluid (ACSF)containing (in mm): sucrose, 230; KCl, 2.5; glucose, 25; NaH2PO4,1.25; NaHCO3, 24; MgCl2, 4; and CaCl2, 0.5. Horizontal or sagittalslices from the olfactory bulb were cut at 300 lm thickness with aVibratome (Leica VT1000S; Leica Microsystems, Vienna, Austria)and were stored in ACSF containing (in mm): NaCl, 85; sucrose, 75;KCl, 2.5; glucose, 25; NaH2PO4, 1.25; NaHCO3, 24; MgCl2, 4; andCaCl2, 0.5. After 30 min, this medium was gradually replaced withnormal ACSF containing (in mm): NaCl, 126; KCl, 2.5; glucose, 25;NaH2PO4, 1.25; NaHCO3, 24; MgCl2, 2; and CaCl2, 2. Allextracellular solutions were bubbled continuously with 95% O2 and5% CO2, resulting in a pH of 7.4. After an additional 30–60-minperiod of recovery at 33 �C, slices were incubated at room temperatureuntil they were transferred to the recording chamber.
Electrophysiological recordings
Cell-attached and somatic whole-cell voltage recordings were per-formed at 33–36 �C. Cells were identified with an infrared differentialinterference contrast or an oblique illumination technique using anOlympus BX50WI microscope and a 40· water-immersion objective.Recordings were carried out from somata with a diameter of > 10 lmand with a juxtaglomerular location [within the GL or at the border ofexternal plexiform layer (EPL) and GL, but not in the EPL]. Cellswere recorded with a potassium gluconate-based intracellular solution(containing, in mm: K-gluconate, 120; KCl, 5; MgCl2, 2; EGTA, 0.05;HEPES, 10; Mg-ATP, 2; Mg-GTP, 0.4; creatinine phosphate, 10; andbiocytin, 5.3–8; pH 7.25, osmolarity 270–290 mOsm). Recordingswere performed with a MultiClamp 700A amplifier (Axon Instru-ments, Foster City, CA, USA). Patch pipettes (3–8 MW) were pulled(Zeitz Universal Puller; Zeitz-Instrumente Vertriebs, Munich, Ger-many) from thick-walled borosilicate glass capillaries with an innerfilament (1.5 mm outer diameter, 0.86 mm inner diameter; SutterInstruments, Novato, CA, USA). Trains of action potentials (APs)were evoked by injecting 1-s-long depolarizing current pulses ofdifferent amplitudes (20–200 pA). The passive membrane propertieswere derived from single exponentials fitted to traces of membranevoltage responses to small (1–20 pA, 400 ms) hyper- and depolarizingcurrent injections. For testing the subthreshold resonance properties,
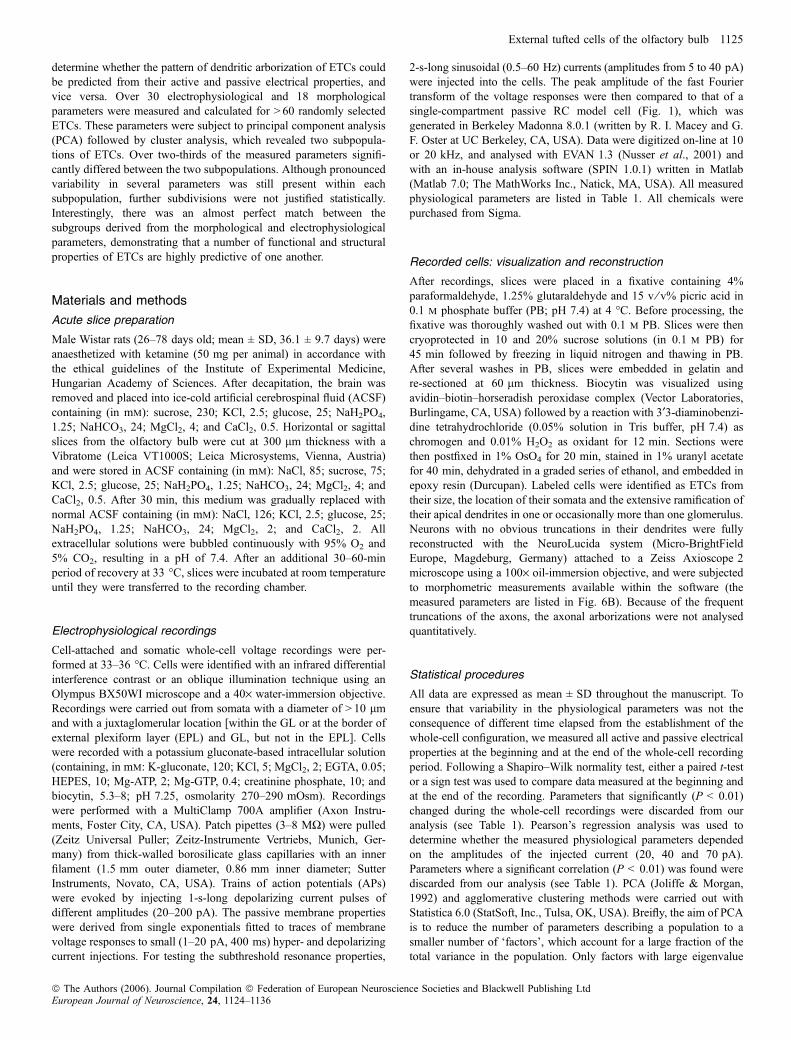
2-s-long sinusoidal (0.5–60 Hz) currents (amplitudes from 5 to 40 pA)were injected into the cells. The peak amplitude of the fast Fouriertransform of the voltage responses were then compared to that of asingle-compartment passive RC model cell (Fig. 1), which wasgenerated in Berkeley Madonna 8.0.1 (written by R. I. Macey and G.F. Oster at UC Berkeley, CA, USA). Data were digitized on-line at 10or 20 kHz, and analysed with EVAN 1.3 (Nusser et al., 2001) andwith an in-house analysis software (SPIN 1.0.1) written in Matlab(Matlab 7.0; The MathWorks Inc., Natick, MA, USA). All measuredphysiological parameters are listed in Table 1. All chemicals werepurchased from Sigma.
Recorded cells: visualization and reconstruction
After recordings, slices were placed in a fixative containing 4%paraformaldehyde, 1.25% glutaraldehyde and 15 v ⁄ v% picric acid in0.1 m phosphate buffer (PB; pH 7.4) at 4 �C. Before processing, thefixative was thoroughly washed out with 0.1 m PB. Slices were thencryoprotected in 10 and 20% sucrose solutions (in 0.1 m PB) for45 min followed by freezing in liquid nitrogen and thawing in PB.After several washes in PB, slices were embedded in gelatin andre-sectioned at 60 lm thickness. Biocytin was visualized usingavidin–biotin–horseradish peroxidase complex (Vector Laboratories,Burlingame, CA, USA) followed by a reaction with 3¢3-diaminobenzi-dine tetrahydrochloride (0.05% solution in Tris buffer, pH 7.4) aschromogen and 0.01% H2O2 as oxidant for 12 min. Sections werethen postfixed in 1% OsO4 for 20 min, stained in 1% uranyl acetatefor 40 min, dehydrated in a graded series of ethanol, and embedded inepoxy resin (Durcupan). Labeled cells were identified as ETCs fromtheir size, the location of their somata and the extensive ramification oftheir apical dendrites in one or occasionally more than one glomerulus.Neurons with no obvious truncations in their dendrites were fullyreconstructed with the NeuroLucida system (Micro-BrightFieldEurope, Magdeburg, Germany) attached to a Zeiss Axioscope 2microscope using a 100· oil-immersion objective, and were subjectedto morphometric measurements available within the software (themeasured parameters are listed in Fig. 6B). Because of the frequenttruncations of the axons, the axonal arborizations were not analysedquantitatively.
Statistical procedures
All data are expressed as mean ± SD throughout the manuscript. Toensure that variability in the physiological parameters was not theconsequence of different time elapsed from the establishment of thewhole-cell configuration, we measured all active and passive electricalproperties at the beginning and at the end of the whole-cell recordingperiod. Following a Shapiro–Wilk normality test, either a paired t-testor a sign test was used to compare data measured at the beginning andat the end of the recording. Parameters that significantly (P < 0.01)changed during the whole-cell recordings were discarded from ouranalysis (see Table 1). Pearson’s regression analysis was used todetermine whether the measured physiological parameters dependedon the amplitudes of the injected current (20, 40 and 70 pA).Parameters where a significant correlation (P < 0.01) was found werediscarded from our analysis (see Table 1). PCA (Joliffe & Morgan,1992) and agglomerative clustering methods were carried out withStatistica 6.0 (StatSoft, Inc., Tulsa, OK, USA). Breifly, the aim of PCAis to reduce the number of parameters describing a population to asmaller number of ‘factors’, which account for a large fraction of thetotal variance in the population. Only factors with large eigenvalue
External tufted cells of the olfactory bulb 1125
ª The Authors (2006). Journal Compilation ª Federation of European Neuroscience Societies and Blackwell Publishing LtdEuropean Journal of Neuroscience, 24, 1124–1136
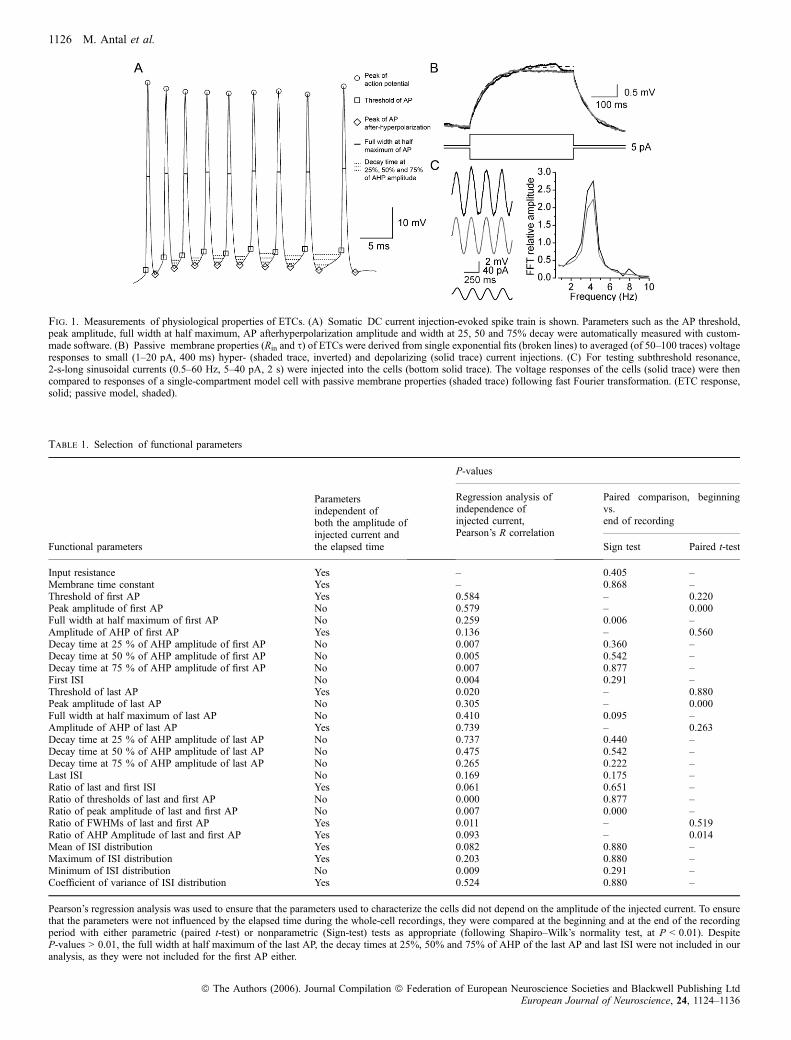
Fig. 1. Measurements of physiological properties of ETCs. (A) Somatic DC current injection-evoked spike train is shown. Parameters such as the AP threshold,peak amplitude, full width at half maximum, AP afterhyperpolarization amplitude and width at 25, 50 and 75% decay were automatically measured with custom-made software. (B) Passive membrane properties (Rin and s) of ETCs were derived from single exponential fits (broken lines) to averaged (of 50–100 traces) voltageresponses to small (1–20 pA, 400 ms) hyper- (shaded trace, inverted) and depolarizing (solid trace) current injections. (C) For testing subthreshold resonance,2-s-long sinusoidal currents (0.5–60 Hz, 5–40 pA, 2 s) were injected into the cells (bottom solid trace). The voltage responses of the cells (solid trace) were thencompared to responses of a single-compartment model cell with passive membrane properties (shaded trace) following fast Fourier transformation. (ETC response,solid; passive model, shaded).
Table 1. Selection of functional parameters
Functional parameters
Parametersindependent ofboth the amplitude ofinjected current andthe elapsed time
P-values
Regression analysis ofindependence ofinjected current,Pearson’s R correlation
Paired comparison, beginningvs.end of recording
Sign test Paired t-test
Input resistance Yes – 0.405 –Membrane time constant Yes – 0.868 –Threshold of first AP Yes 0.584 – 0.220Peak amplitude of first AP No 0.579 – 0.000Full width at half maximum of first AP No 0.259 0.006 –Amplitude of AHP of first AP Yes 0.136 – 0.560Decay time at 25 % of AHP amplitude of first AP No 0.007 0.360 –Decay time at 50 % of AHP amplitude of first AP No 0.005 0.542 –Decay time at 75 % of AHP amplitude of first AP No 0.007 0.877 –First ISI No 0.004 0.291 –Threshold of last AP Yes 0.020 – 0.880Peak amplitude of last AP No 0.305 – 0.000Full width at half maximum of last AP No 0.410 0.095 –Amplitude of AHP of last AP Yes 0.739 – 0.263Decay time at 25 % of AHP amplitude of last AP No 0.737 0.440 –Decay time at 50 % of AHP amplitude of last AP No 0.475 0.542 –Decay time at 75 % of AHP amplitude of last AP No 0.265 0.222 –Last ISI No 0.169 0.175 –Ratio of last and first ISI Yes 0.061 0.651 –Ratio of thresholds of last and first AP No 0.000 0.877 –Ratio of peak amplitude of last and first AP No 0.007 0.000 –Ratio of FWHMs of last and first AP Yes 0.011 – 0.519Ratio of AHP Amplitude of last and first AP Yes 0.093 – 0.014Mean of ISI distribution Yes 0.082 0.880 –Maximum of ISI distribution Yes 0.203 0.880 –Minimum of ISI distribution No 0.009 0.291 –Coefficient of variance of ISI distribution Yes 0.524 0.880 –
Pearson’s regression analysis was used to ensure that the parameters used to characterize the cells did not depend on the amplitude of the injected current. To ensurethat the parameters were not influenced by the elapsed time during the whole-cell recordings, they were compared at the beginning and at the end of the recordingperiod with either parametric (paired t-test) or nonparametric (Sign-test) tests as appropriate (following Shapiro–Wilk’s normality test, at P < 0.01). DespiteP-values > 0.01, the full width at half maximum of the last AP, the decay times at 25%, 50% and 75% of AHP of the last AP and last ISI were not included in ouranalysis, as they were not included for the first AP either.
1126 M. Antal et al.
ª The Authors (2006). Journal Compilation ª Federation of European Neuroscience Societies and Blackwell Publishing LtdEuropean Journal of Neuroscience, 24, 1124–1136
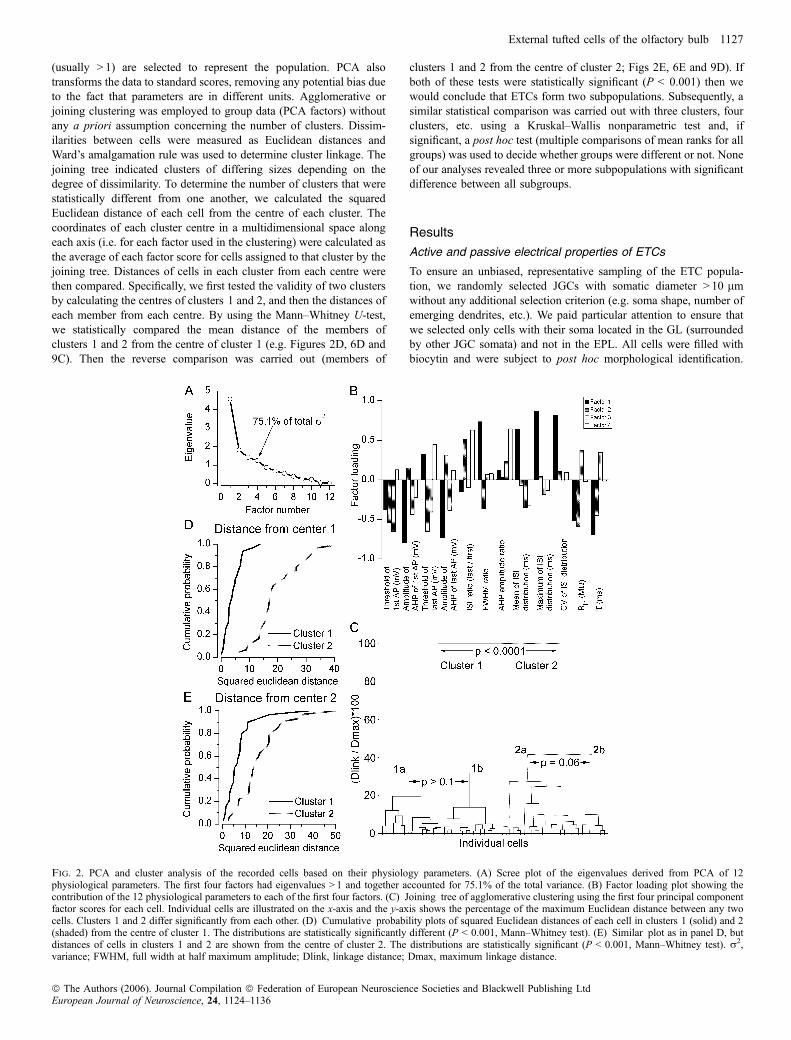
(usually > 1) are selected to represent the population. PCA alsotransforms the data to standard scores, removing any potential bias dueto the fact that parameters are in different units. Agglomerative orjoining clustering was employed to group data (PCA factors) withoutany a priori assumption concerning the number of clusters. Dissim-ilarities between cells were measured as Euclidean distances andWard’s amalgamation rule was used to determine cluster linkage. Thejoining tree indicated clusters of differing sizes depending on thedegree of dissimilarity. To determine the number of clusters that werestatistically different from one another, we calculated the squaredEuclidean distance of each cell from the centre of each cluster. Thecoordinates of each cluster centre in a multidimensional space alongeach axis (i.e. for each factor used in the clustering) were calculated asthe average of each factor score for cells assigned to that cluster by thejoining tree. Distances of cells in each cluster from each centre werethen compared. Specifically, we first tested the validity of two clustersby calculating the centres of clusters 1 and 2, and then the distances ofeach member from each centre. By using the Mann–Whitney U-test,we statistically compared the mean distance of the members ofclusters 1 and 2 from the centre of cluster 1 (e.g. Figures 2D, 6D and9C). Then the reverse comparison was carried out (members of
clusters 1 and 2 from the centre of cluster 2; Figs 2E, 6E and 9D). Ifboth of these tests were statistically significant (P < 0.001) then wewould conclude that ETCs form two subpopulations. Subsequently, asimilar statistical comparison was carried out with three clusters, fourclusters, etc. using a Kruskal–Wallis nonparametric test and, ifsignificant, a post hoc test (multiple comparisons of mean ranks for allgroups) was used to decide whether groups were different or not. Noneof our analyses revealed three or more subpopulations with significantdifference between all subgroups.
Results
Active and passive electrical properties of ETCs
To ensure an unbiased, representative sampling of the ETC popula-tion, we randomly selected JGCs with somatic diameter > 10 lmwithout any additional selection criterion (e.g. soma shape, number ofemerging dendrites, etc.). We paid particular attention to ensure thatwe selected only cells with their soma located in the GL (surroundedby other JGC somata) and not in the EPL. All cells were filled withbiocytin and were subject to post hoc morphological identification.
Fig. 2. PCA and cluster analysis of the recorded cells based on their physiology parameters. (A) Scree plot of the eigenvalues derived from PCA of 12physiological parameters. The first four factors had eigenvalues > 1 and together accounted for 75.1% of the total variance. (B) Factor loading plot showing thecontribution of the 12 physiological parameters to each of the first four factors. (C) Joining tree of agglomerative clustering using the first four principal componentfactor scores for each cell. Individual cells are illustrated on the x-axis and the y-axis shows the percentage of the maximum Euclidean distance between any twocells. Clusters 1 and 2 differ significantly from each other. (D) Cumulative probability plots of squared Euclidean distances of each cell in clusters 1 (solid) and 2(shaded) from the centre of cluster 1. The distributions are statistically significantly different (P < 0.001, Mann–Whitney test). (E) Similar plot as in panel D, butdistances of cells in clusters 1 and 2 are shown from the centre of cluster 2. The distributions are statistically significant (P < 0.001, Mann–Whitney test). r2,variance; FWHM, full width at half maximum amplitude; Dlink, linkage distance; Dmax, maximum linkage distance.
External tufted cells of the olfactory bulb 1127
ª The Authors (2006). Journal Compilation ª Federation of European Neuroscience Societies and Blackwell Publishing LtdEuropean Journal of Neuroscience, 24, 1124–1136
Several cells with somatic diameter of > 10 lm were subsequentlyidentified as short-axon cells, which were discarded from the presentstudy (i.e. only anatomically identified ETCs are included in thepresent study). First we assessed the spontaneous spiking activity ofthe ETCs in cell-attached recording configuration. The recorded cellsdisplayed large heterogeneity based on their spontaneous firingbehaviour. A large proportion of the cells (57%) fired bursts of APs(from 0.03 to 8 Hz; see Hayar et al., 2004b), some (25%) firedindividual APs at frequencies ranging from 0.1 to 38 Hz, and theremaining 18% of the cells were completely silent. This spontaneousactivity was also observed during the first minute of whole-cellrecordings, similar to that found by Hayar et al. (2004b). When a cellshowed spontaneous suprathreshold activity, small hyperpolarizingDC current was injected to keep the membrane potential just below
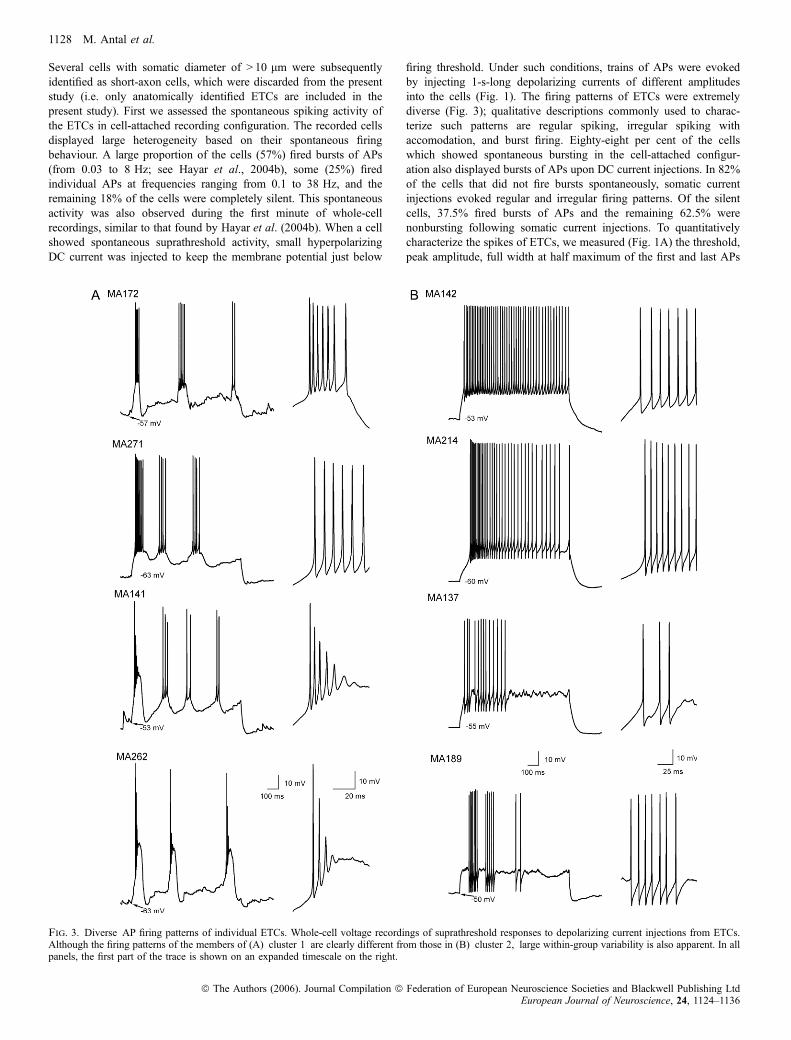
firing threshold. Under such conditions, trains of APs were evokedby injecting 1-s-long depolarizing currents of different amplitudesinto the cells (Fig. 1). The firing patterns of ETCs were extremelydiverse (Fig. 3); qualitative descriptions commonly used to charac-terize such patterns are regular spiking, irregular spiking withaccomodation, and burst firing. Eighty-eight per cent of the cellswhich showed spontaneous bursting in the cell-attached configur-ation also displayed bursts of APs upon DC current injections. In 82%of the cells that did not fire bursts spontaneously, somatic currentinjections evoked regular and irregular firing patterns. Of the silentcells, 37.5% fired bursts of APs and the remaining 62.5% werenonbursting following somatic current injections. To quantitativelycharacterize the spikes of ETCs, we measured (Fig. 1A) the threshold,peak amplitude, full width at half maximum of the first and last APs
Fig. 3. Diverse AP firing patterns of individual ETCs. Whole-cell voltage recordings of suprathreshold responses to depolarizing current injections from ETCs.Although the firing patterns of the members of (A) cluster 1 are clearly different from those in (B) cluster 2, large within-group variability is also apparent. In allpanels, the first part of the trace is shown on an expanded timescale on the right.
1128 M. Antal et al.
ª The Authors (2006). Journal Compilation ª Federation of European Neuroscience Societies and Blackwell Publishing LtdEuropean Journal of Neuroscience, 24, 1124–1136
of the train, amplitude of spike afterhyperpolarization (AHP) anddecay times at 25, 50 and 75% of AHP amplitude after the first andlast AP. The ratios of these values were also calculated (parameter X oflast spike divided by that of the first spike). In addition, the first andlast interspike intervals (ISI) were measured and their ratio wascalculated. In the case of burst firing cells the first and last ISIs ofthe first burst were measured, but all ISIs (intra- and interburst) wereused to generate the ISI distribution (see below). To characterize thefiring patterns of ETCs we calculated the mean, maximum, minimumand coefficient of variation (CV) of the ISI distributions. These
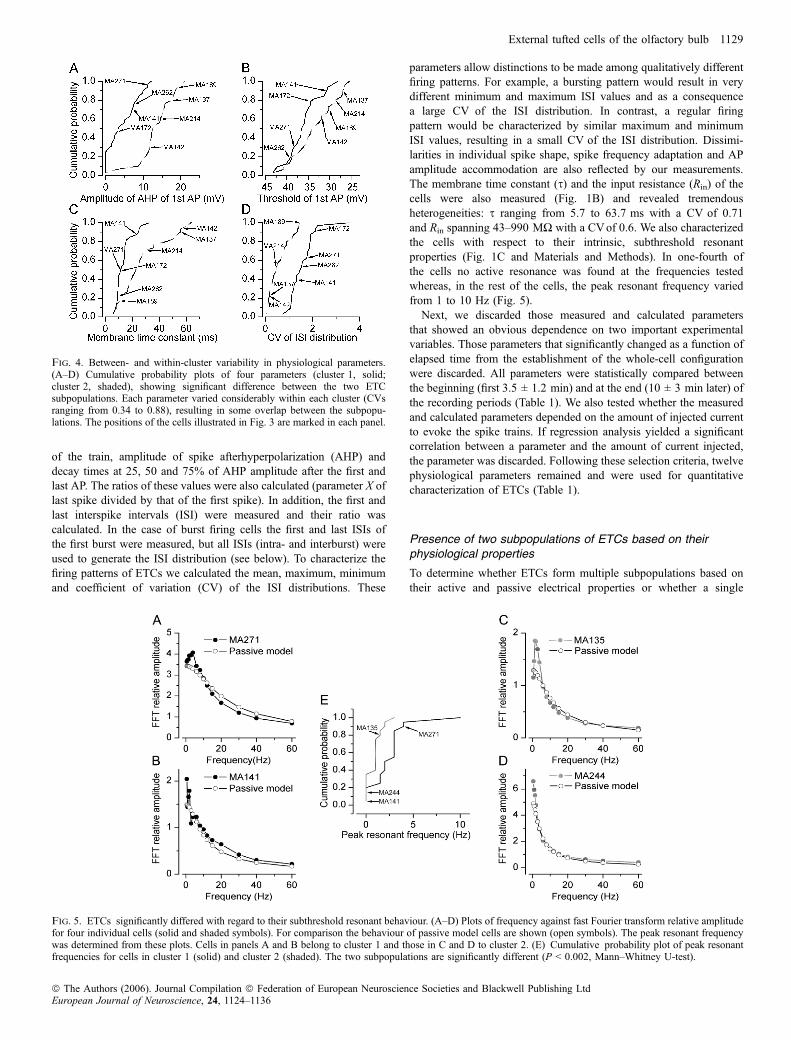
parameters allow distinctions to be made among qualitatively differentfiring patterns. For example, a bursting pattern would result in verydifferent minimum and maximum ISI values and as a consequencea large CV of the ISI distribution. In contrast, a regular firingpattern would be characterized by similar maximum and minimumISI values, resulting in a small CV of the ISI distribution. Dissimi-larities in individual spike shape, spike frequency adaptation and APamplitude accommodation are also reflected by our measurements.The membrane time constant (s) and the input resistance (Rin) of thecells were also measured (Fig. 1B) and revealed tremendousheterogeneities: s ranging from 5.7 to 63.7 ms with a CV of 0.71and Rin spanning 43–990 MW with a CVof 0.6. We also characterizedthe cells with respect to their intrinsic, subthreshold resonantproperties (Fig. 1C and Materials and Methods). In one-fourth ofthe cells no active resonance was found at the frequencies testedwhereas, in the rest of the cells, the peak resonant frequency variedfrom 1 to 10 Hz (Fig. 5).Next, we discarded those measured and calculated parameters
that showed an obvious dependence on two important experimentalvariables. Those parameters that significantly changed as a function ofelapsed time from the establishment of the whole-cell configurationwere discarded. All parameters were statistically compared betweenthe beginning (first 3.5 ± 1.2 min) and at the end (10 ± 3 min later) ofthe recording periods (Table 1). We also tested whether the measuredand calculated parameters depended on the amount of injected currentto evoke the spike trains. If regression analysis yielded a significantcorrelation between a parameter and the amount of current injected,the parameter was discarded. Following these selection criteria, twelvephysiological parameters remained and were used for quantitativecharacterization of ETCs (Table 1).
Presence of two subpopulations of ETCs based on theirphysiological properties
To determine whether ETCs form multiple subpopulations based ontheir active and passive electrical properties or whether a single
Fig. 4. Between- and within-cluster variability in physiological parameters.(A–D) Cumulative probability plots of four parameters (cluster 1, solid;cluster 2, shaded), showing significant difference between the two ETCsubpopulations. Each parameter varied considerably within each cluster (CVsranging from 0.34 to 0.88), resulting in some overlap between the subpopu-lations. The positions of the cells illustrated in Fig. 3 are marked in each panel.
Fig. 5. ETCs significantly differed with regard to their subthreshold resonant behaviour. (A–D) Plots of frequency against fast Fourier transform relative amplitudefor four individual cells (solid and shaded symbols). For comparison the behaviour of passive model cells are shown (open symbols). The peak resonant frequencywas determined from these plots. Cells in panels A and B belong to cluster 1 and those in C and D to cluster 2. (E) Cumulative probability plot of peak resonantfrequencies for cells in cluster 1 (solid) and cluster 2 (shaded). The two subpopulations are significantly different (P < 0.002, Mann–Whitney U-test).
External tufted cells of the olfactory bulb 1129
ª The Authors (2006). Journal Compilation ª Federation of European Neuroscience Societies and Blackwell Publishing LtdEuropean Journal of Neuroscience, 24, 1124–1136
heterogeneous population exists, we performed PCA and clusteranalysis (Fig. 2). Because the number of available cells (62 in total)is likely to be insufficient for clustering in a 12-dimensional space,PCA of the parameters was first carried out. As shown in the screeplot in Fig. 2A, the first four factors had eigenvalues of > 1 andaccounted for > 75% of the total variance; therefore they wereselected for subsequent cluster analysis. Agglomerative clusteringrevealed a joining tree with two dominant and several additionalsubbranches (Fig. 2C). Next we developed a method of objectivedetermination of the number of distinct subpopulations followingsuch clustering (see Materials and methods). We considered twoclusters significantly different in an n-dimensional space if thedistance of the members of cluster 1 from the centre of cluster 1 wassignificantly smaller than the distance of the members of cluster 2from the centre of cluster 1, and vice versa. By performing thisanalysis on ETCs based on the first four factors obtained with PCA,we found that two clusters differed significantly (Fig. 2D and E), butadditional subdivisions (into 3, 4 … clusters) were not supportedstatistically.
So far, our results demonstrate the presence of two subpopulationsof ETCs based on PCA factors calculated from parameters describingthe intrinsic electrical properties of the cells. Next we asked howdifferent the individual active and passive electrical properties betweenthe two subpopulations were. Statistical comparisons revealed that (i)the threshold of the first AP (cluster 1, )36.1 ± 3.7 mV vs. cluster 2,)33.3 ± 4.9 mV; Fig. 4B); (ii–iii) the amplitude of the AHP after thefirst (4.5 ± 4.0 vs. 13.3 ± 4.6 mV; Fig. 4A) and last (7.2 ± 3.8 vs.14.3 ± 3.7 mV) APs; (iv) the ratio of the last and first spike width(1.5 ± 0.4 vs. 1.1 ± 0.1); (v–vii) the mean (77.6 ± 35.2 vs. 39.8 ±18.7 ms), maximum (319.6 ± 140.3 vs. 104.1 ± 71.4 ms) and CV(1.6 ± 0.5 vs. 0.6 ± 0.5; Fig. 4D) of the ISI distributions; and (viii) themembrane time constants (13.6 ± 6.5 vs. 27.8 ± 17.2 ms; Fig. 4C)were significantly different between the two subpopulations. Quali-tatively, the most prominent difference between the two subpopula-tions was that all members of cluster 1 fired bursts of APs whereasthose of cluster 2 had regular or irregular firing patterns (Fig. 3) anddid not change to burst firing when hyperpolarized to )60 mVor morenegative membrane potentials. However, it is important to note that
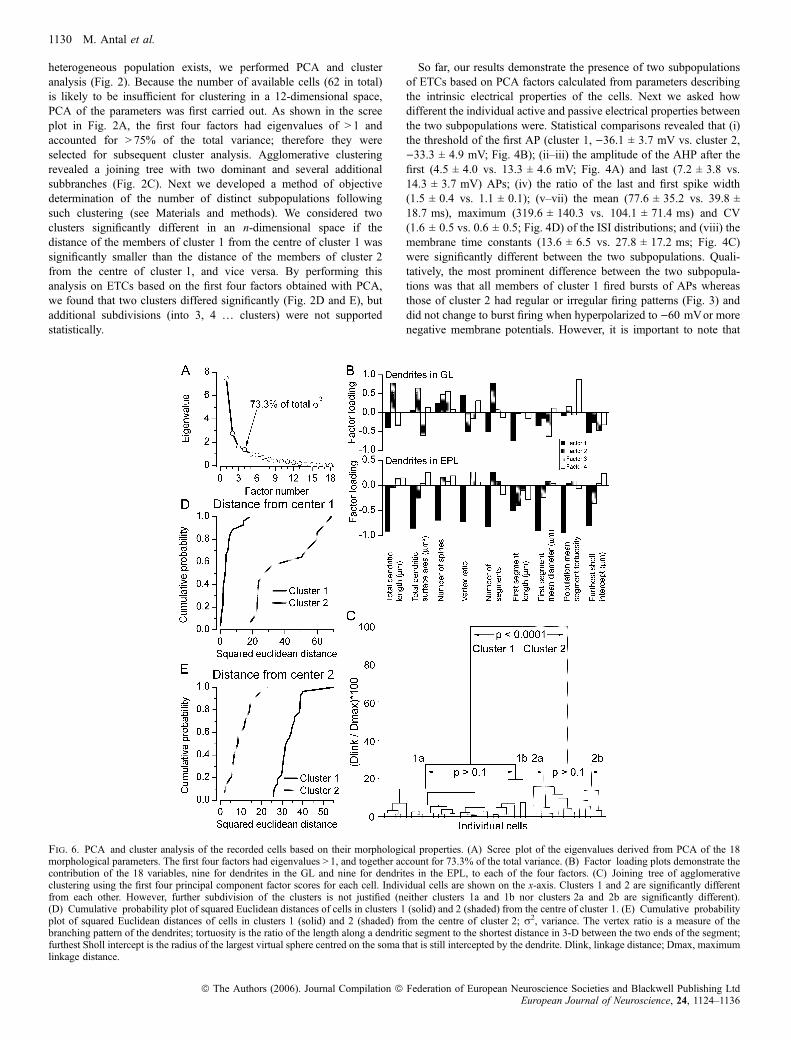
Fig. 6. PCA and cluster analysis of the recorded cells based on their morphological properties. (A) Scree plot of the eigenvalues derived from PCA of the 18morphological parameters. The first four factors had eigenvalues > 1, and together account for 73.3% of the total variance. (B) Factor loading plots demonstrate thecontribution of the 18 variables, nine for dendrites in the GL and nine for dendrites in the EPL, to each of the four factors. (C) Joining tree of agglomerativeclustering using the first four principal component factor scores for each cell. Individual cells are shown on the x-axis. Clusters 1 and 2 are significantly differentfrom each other. However, further subdivision of the clusters is not justified (neither clusters 1a and 1b nor clusters 2a and 2b are significantly different).(D) Cumulative probability plot of squared Euclidean distances of cells in clusters 1 (solid) and 2 (shaded) from the centre of cluster 1. (E) Cumulative probabilityplot of squared Euclidean distances of cells in clusters 1 (solid) and 2 (shaded) from the centre of cluster 2; r2, variance. The vertex ratio is a measure of thebranching pattern of the dendrites; tortuosity is the ratio of the length along a dendritic segment to the shortest distance in 3-D between the two ends of the segment;furthest Sholl intercept is the radius of the largest virtual sphere centred on the soma that is still intercepted by the dendrite. Dlink, linkage distance; Dmax, maximumlinkage distance.
1130 M. Antal et al.
ª The Authors (2006). Journal Compilation ª Federation of European Neuroscience Societies and Blackwell Publishing LtdEuropean Journal of Neuroscience, 24, 1124–1136
members of each subpopulation displayed large variability based onseveral parameters. For example, cells in cluster 1 showed largevariability in the degree of the spike amplitude accommodation(Fig. 3A) or the amplitude of the AHP (Figs 3A and 4A). Cellsbelonging to cluster 2 displayed very different spike frequencyadaptations (Figs 3B and 4D), amplitude and time course of AHP(Figs 3B and 4A) or s (Fig. 4C). The peak resonance of the cells wasalso significantly different; cells in cluster 1 displayed a higher peakresonant frequency (Fig. 5; 2.5 ± 2.2 vs. 0.9 ± 0.8 Hz). However, asshown in the cumulative probability plot in Fig. 5E, both subpopu-lations had cells without detectable subthreshold resonance (Fig. 5Band D), but cells that showed active subthreshold resonance had ahigher peak frequency in cluster 1.
Quantitative characterization of ETCs based on their dendriticarborizations
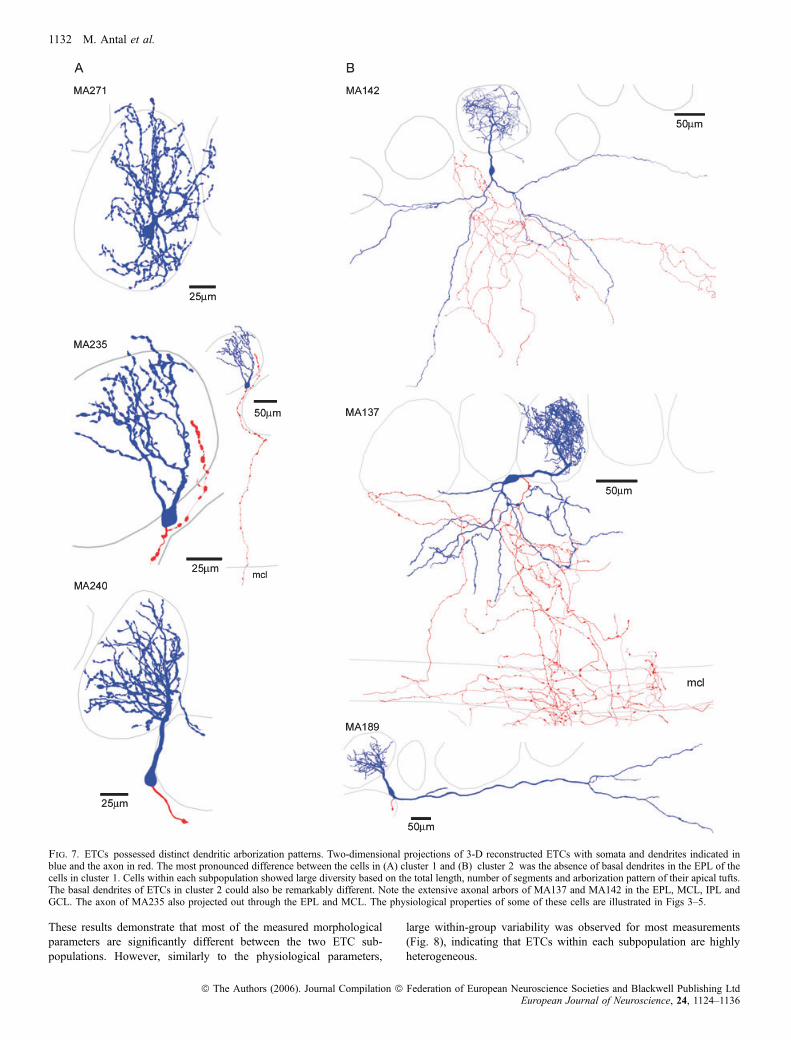
Following the recordings, biocytin was visualized and the cells wereanalysed at the light microscopic level and were judged forcompleteness. Cells with incomplete filling or with truncations intheir dendritic tree were discarded from our quantitative morpholo-gical analysis. However, if a cell showed signs of obvious truncation(e.g. secondary dendrites), but could be still positively identified as anETC (e.g. from the soma and apical tuft), it remained in our study forphysiological analysis only. The most noticeable difference betweenETCs was the presence of secondary, basal dendrites in approximatelyone-third of the cells (14 out of 41 cells; Fig. 7). The branchingpatterns of the basal dendrites were dissimilar; some cells had anonextensively branching large diameter basal dendrite, spanning alarge distance only in one direction from the soma (Fig. 7B, bottompanel), whereas in some other cells the basal dendrites extensivelybranched and symmetrically occupied the EPL below the cell (Fig. 7B,top and middle panels). Several additional morphological differenceswere also observed, including the presence of apical dendritesramifying in two glomeruli and large differences in the extent of
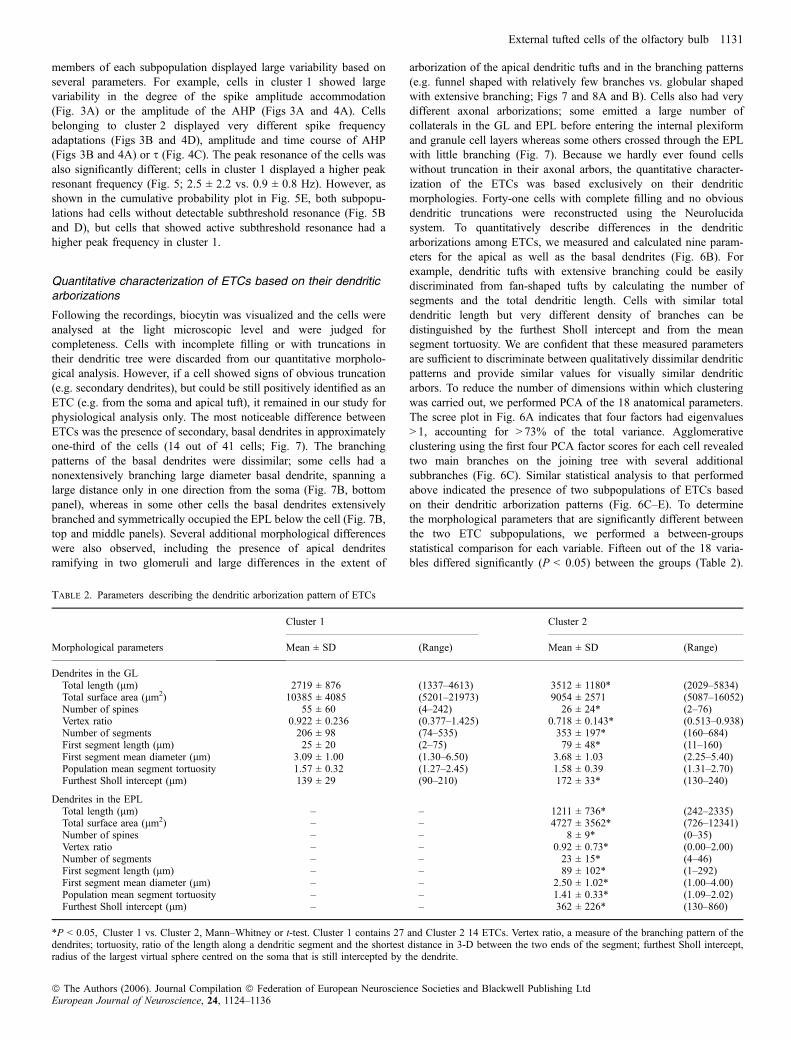
arborization of the apical dendritic tufts and in the branching patterns(e.g. funnel shaped with relatively few branches vs. globular shapedwith extensive branching; Figs 7 and 8A and B). Cells also had verydifferent axonal arborizations; some emitted a large number ofcollaterals in the GL and EPL before entering the internal plexiformand granule cell layers whereas some others crossed through the EPLwith little branching (Fig. 7). Because we hardly ever found cellswithout truncation in their axonal arbors, the quantitative character-ization of the ETCs was based exclusively on their dendriticmorphologies. Forty-one cells with complete filling and no obviousdendritic truncations were reconstructed using the Neurolucidasystem. To quantitatively describe differences in the dendriticarborizations among ETCs, we measured and calculated nine param-eters for the apical as well as the basal dendrites (Fig. 6B). Forexample, dendritic tufts with extensive branching could be easilydiscriminated from fan-shaped tufts by calculating the number ofsegments and the total dendritic length. Cells with similar totaldendritic length but very different density of branches can bedistinguished by the furthest Sholl intercept and from the meansegment tortuosity. We are confident that these measured parametersare sufficient to discriminate between qualitatively dissimilar dendriticpatterns and provide similar values for visually similar dendriticarbors. To reduce the number of dimensions within which clusteringwas carried out, we performed PCA of the 18 anatomical parameters.The scree plot in Fig. 6A indicates that four factors had eigenvalues> 1, accounting for > 73% of the total variance. Agglomerativeclustering using the first four PCA factor scores for each cell revealedtwo main branches on the joining tree with several additionalsubbranches (Fig. 6C). Similar statistical analysis to that performedabove indicated the presence of two subpopulations of ETCs basedon their dendritic arborization patterns (Fig. 6C–E). To determinethe morphological parameters that are significantly different betweenthe two ETC subpopulations, we performed a between-groupsstatistical comparison for each variable. Fifteen out of the 18 varia-bles differed significantly (P < 0.05) between the groups (Table 2).
Table 2. Parameters describing the dendritic arborization pattern of ETCs
Morphological parameters
Cluster 1 Cluster 2
Mean ± SD (Range) Mean ± SD (Range)
Dendrites in the GLTotal length (lm) 2719 ± 876 (1337–4613) 3512 ± 1180* (2029–5834)Total surface area (lm2) 10385 ± 4085 (5201–21973) 9054 ± 2571 (5087–16052)Number of spines 55 ± 60 (4–242) 26 ± 24* (2–76)Vertex ratio 0.922 ± 0.236 (0.377–1.425) 0.718 ± 0.143* (0.513–0.938)Number of segments 206 ± 98 (74–535) 353 ± 197* (160–684)First segment length (lm) 25 ± 20 (2–75) 79 ± 48* (11–160)First segment mean diameter (lm) 3.09 ± 1.00 (1.30–6.50) 3.68 ± 1.03 (2.25–5.40)Population mean segment tortuosity 1.57 ± 0.32 (1.27–2.45) 1.58 ± 0.39 (1.31–2.70)Furthest Sholl intercept (lm) 139 ± 29 (90–210) 172 ± 33* (130–240)
Dendrites in the EPLTotal length (lm) – – 1211 ± 736* (242–2335)Total surface area (lm2) – – 4727 ± 3562* (726–12341)Number of spines – – 8 ± 9* (0–35)Vertex ratio – – 0.92 ± 0.73* (0.00–2.00)Number of segments – – 23 ± 15* (4–46)First segment length (lm) – – 89 ± 102* (1–292)First segment mean diameter (lm) – – 2.50 ± 1.02* (1.00–4.00)Population mean segment tortuosity – – 1.41 ± 0.33* (1.09–2.02)Furthest Sholl intercept (lm) – – 362 ± 226* (130–860)
*P < 0.05, Cluster 1 vs. Cluster 2, Mann–Whitney or t-test. Cluster 1 contains 27 and Cluster 2 14 ETCs. Vertex ratio, a measure of the branching pattern of thedendrites; tortuosity, ratio of the length along a dendritic segment and the shortest distance in 3-D between the two ends of the segment; furthest Sholl intercept,radius of the largest virtual sphere centred on the soma that is still intercepted by the dendrite.
External tufted cells of the olfactory bulb 1131
ª The Authors (2006). Journal Compilation ª Federation of European Neuroscience Societies and Blackwell Publishing LtdEuropean Journal of Neuroscience, 24, 1124–1136
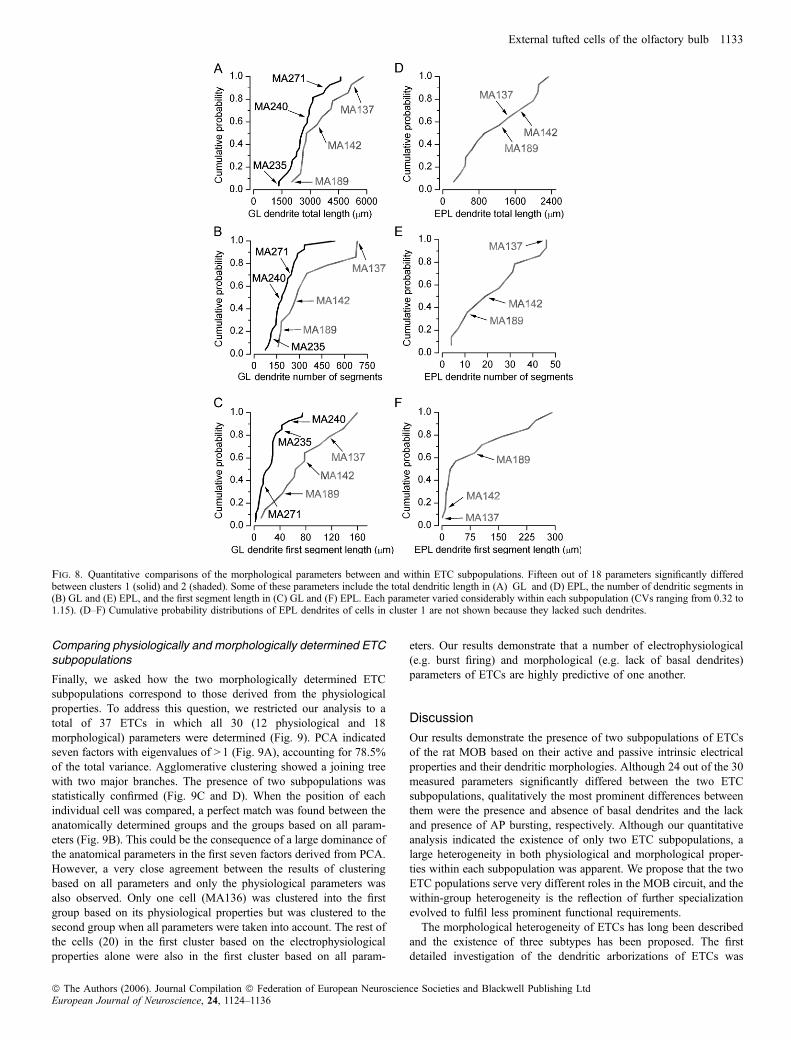
These results demonstrate that most of the measured morphologicalparameters are significantly different between the two ETC sub-populations. However, similarly to the physiological parameters,
large within-group variability was observed for most measurements(Fig. 8), indicating that ETCs within each subpopulation are highlyheterogeneous.
Fig. 7. ETCs possessed distinct dendritic arborization patterns. Two-dimensional projections of 3-D reconstructed ETCs with somata and dendrites indicated inblue and the axon in red. The most pronounced difference between the cells in (A) cluster 1 and (B) cluster 2 was the absence of basal dendrites in the EPL of thecells in cluster 1. Cells within each subpopulation showed large diversity based on the total length, number of segments and arborization pattern of their apical tufts.The basal dendrites of ETCs in cluster 2 could also be remarkably different. Note the extensive axonal arbors of MA137 and MA142 in the EPL, MCL, IPL andGCL. The axon of MA235 also projected out through the EPL and MCL. The physiological properties of some of these cells are illustrated in Figs 3–5.
1132 M. Antal et al.
ª The Authors (2006). Journal Compilation ª Federation of European Neuroscience Societies and Blackwell Publishing LtdEuropean Journal of Neuroscience, 24, 1124–1136
Comparing physiologically and morphologically determined ETCsubpopulations
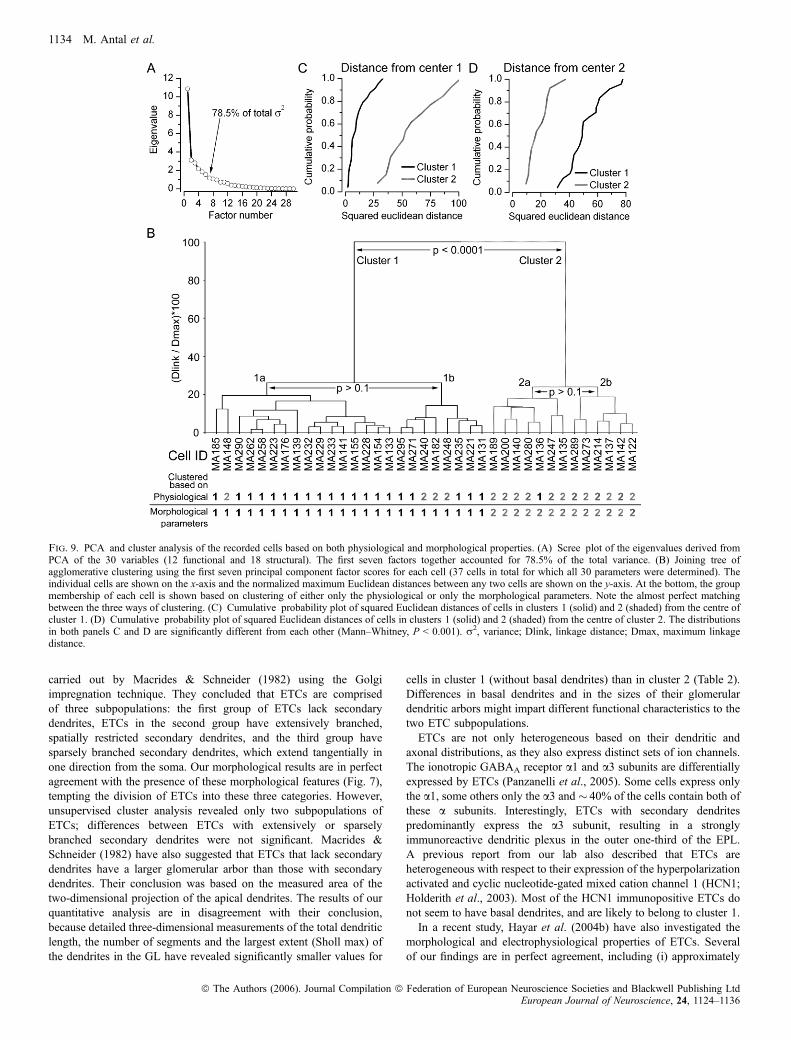
Finally, we asked how the two morphologically determined ETCsubpopulations correspond to those derived from the physiologicalproperties. To address this question, we restricted our analysis to atotal of 37 ETCs in which all 30 (12 physiological and 18morphological) parameters were determined (Fig. 9). PCA indicatedseven factors with eigenvalues of > 1 (Fig. 9A), accounting for 78.5%of the total variance. Agglomerative clustering showed a joining treewith two major branches. The presence of two subpopulations wasstatistically confirmed (Fig. 9C and D). When the position of eachindividual cell was compared, a perfect match was found between theanatomically determined groups and the groups based on all param-eters (Fig. 9B). This could be the consequence of a large dominance ofthe anatomical parameters in the first seven factors derived from PCA.However, a very close agreement between the results of clusteringbased on all parameters and only the physiological parameters wasalso observed. Only one cell (MA136) was clustered into the firstgroup based on its physiological properties but was clustered to thesecond group when all parameters were taken into account. The rest ofthe cells (20) in the first cluster based on the electrophysiologicalproperties alone were also in the first cluster based on all param-
eters. Our results demonstrate that a number of electrophysiological(e.g. burst firing) and morphological (e.g. lack of basal dendrites)parameters of ETCs are highly predictive of one another.
Discussion
Our results demonstrate the presence of two subpopulations of ETCsof the rat MOB based on their active and passive intrinsic electricalproperties and their dendritic morphologies. Although 24 out of the 30measured parameters significantly differed between the two ETCsubpopulations, qualitatively the most prominent differences betweenthem were the presence and absence of basal dendrites and the lackand presence of AP bursting, respectively. Although our quantitativeanalysis indicated the existence of only two ETC subpopulations, alarge heterogeneity in both physiological and morphological proper-ties within each subpopulation was apparent. We propose that the twoETC populations serve very different roles in the MOB circuit, and thewithin-group heterogeneity is the reflection of further specializationevolved to fulfil less prominent functional requirements.The morphological heterogeneity of ETCs has long been described
and the existence of three subtypes has been proposed. The firstdetailed investigation of the dendritic arborizations of ETCs was
Fig. 8. Quantitative comparisons of the morphological parameters between and within ETC subpopulations. Fifteen out of 18 parameters significantly differedbetween clusters 1 (solid) and 2 (shaded). Some of these parameters include the total dendritic length in (A) GL and (D) EPL, the number of dendritic segments in(B) GL and (E) EPL, and the first segment length in (C) GL and (F) EPL. Each parameter varied considerably within each subpopulation (CVs ranging from 0.32 to1.15). (D–F) Cumulative probability distributions of EPL dendrites of cells in cluster 1 are not shown because they lacked such dendrites.
External tufted cells of the olfactory bulb 1133
ª The Authors (2006). Journal Compilation ª Federation of European Neuroscience Societies and Blackwell Publishing LtdEuropean Journal of Neuroscience, 24, 1124–1136
carried out by Macrides & Schneider (1982) using the Golgiimpregnation technique. They concluded that ETCs are comprisedof three subpopulations: the first group of ETCs lack secondarydendrites, ETCs in the second group have extensively branched,spatially restricted secondary dendrites, and the third group havesparsely branched secondary dendrites, which extend tangentially inone direction from the soma. Our morphological results are in perfectagreement with the presence of these morphological features (Fig. 7),tempting the division of ETCs into these three categories. However,unsupervised cluster analysis revealed only two subpopulations ofETCs; differences between ETCs with extensively or sparselybranched secondary dendrites were not significant. Macrides &Schneider (1982) have also suggested that ETCs that lack secondarydendrites have a larger glomerular arbor than those with secondarydendrites. Their conclusion was based on the measured area of thetwo-dimensional projection of the apical dendrites. The results of ourquantitative analysis are in disagreement with their conclusion,because detailed three-dimensional measurements of the total dendriticlength, the number of segments and the largest extent (Sholl max) ofthe dendrites in the GL have revealed significantly smaller values for
cells in cluster 1 (without basal dendrites) than in cluster 2 (Table 2).Differences in basal dendrites and in the sizes of their glomerulardendritic arbors might impart different functional characteristics to thetwo ETC subpopulations.ETCs are not only heterogeneous based on their dendritic and
axonal distributions, as they also express distinct sets of ion channels.The ionotropic GABAA receptor a1 and a3 subunits are differentiallyexpressed by ETCs (Panzanelli et al., 2005). Some cells express onlythe a1, some others only the a3 and � 40% of the cells contain both ofthese a subunits. Interestingly, ETCs with secondary dendritespredominantly express the a3 subunit, resulting in a stronglyimmunoreactive dendritic plexus in the outer one-third of the EPL.A previous report from our lab also described that ETCs areheterogeneous with respect to their expression of the hyperpolarizationactivated and cyclic nucleotide-gated mixed cation channel 1 (HCN1;Holderith et al., 2003). Most of the HCN1 immunopositive ETCs donot seem to have basal dendrites, and are likely to belong to cluster 1.In a recent study, Hayar et al. (2004b) have also investigated the
morphological and electrophysiological properties of ETCs. Severalof our findings are in perfect agreement, including (i) approximately
Fig. 9. PCA and cluster analysis of the recorded cells based on both physiological and morphological properties. (A) Scree plot of the eigenvalues derived fromPCA of the 30 variables (12 functional and 18 structural). The first seven factors together accounted for 78.5% of the total variance. (B) Joining tree ofagglomerative clustering using the first seven principal component factor scores for each cell (37 cells in total for which all 30 parameters were determined). Theindividual cells are shown on the x-axis and the normalized maximum Euclidean distances between any two cells are shown on the y-axis. At the bottom, the groupmembership of each cell is shown based on clustering of either only the physiological or only the morphological parameters. Note the almost perfect matchingbetween the three ways of clustering. (C) Cumulative probability plot of squared Euclidean distances of cells in clusters 1 (solid) and 2 (shaded) from the centre ofcluster 1. (D) Cumulative probability plot of squared Euclidean distances of cells in clusters 1 (solid) and 2 (shaded) from the centre of cluster 2. The distributionsin both panels C and D are significantly different from each other (Mann–Whitney, P < 0.001). r2, variance; Dlink, linkage distance; Dmax, maximum linkagedistance.
1134 M. Antal et al.
ª The Authors (2006). Journal Compilation ª Federation of European Neuroscience Societies and Blackwell Publishing LtdEuropean Journal of Neuroscience, 24, 1124–1136
one-third of the ETCs possess basal dendrites; (ii) basal dendritesshow variable ramification patterns; (ii) the apical tuft of most ETCsarborizes in a single glomerulus, but a few per cent of the ETCsproject their apical dendrites into two glomeruli; (iv) the extent of theintraglomerular arborization of the apical dendrites varies considerably(five-fold) from small fan-like tufts to extensive globular tufts; and (v)some cells project their axons towards the mitral cell and granule celllayer without extensive ramification; whereas (vi) some other ETCshad extensive local axon collaterals. Interestingly, despite the observedmorphological heterogeneity of ETCs, Hayar et al. (2004b) describedrather uniform electrophysiological properties of the ETCs. Mostnotably, they reported only burst firing behaviours irrespective ofwhether spontaneous activity was monitored in cell-attached mode orfiring was evoked by current injections in the whole-cell configuration.Because they reported that one-third of their recorded cells had basaldendrites, but all cells showed bursting behaviour, it may beappropriate to designate cells with basal dendrites as also possessingbursting behaviour. This is in contrast with our results demonstratingthat the majority of cells in cluster 2 (which all have basal dendrites)did not fire bursts of APs. This conclusion is consistent with the resultsof our cell-attached recordings, demonstrating that the majority of thecells with basal dendrites lack spontaneous bursts of APs, and thuscannot be the consequence of dialysis of the cells during whole-cellrecordings. A possible reason for this discrepancy could be due to asubselection of ETCs recorded by Hayar et al. (2004b). As discussedabove, we have taken the utmost care to avoid any bias in oursampling of juxtaglomerular cells with diameter > 10 lm. Anotherpossible reason could be the different strain and age of the animals(Hayar, P21–29 Sprague–Dawley vs. our study, P26–78 Wistar). Someof the morphological features of cluster 2 cells are similar to some ofthe superficially located middle tufted cells (Macrides & Schneider,1982) or, as another study calls them, ‘superficial’ tufted cells(Hamilton et al., 2005). However, one obvious difference betweenthese cells and the ETCs in our study is that the somata of these cellsare located in the EPL, whereas all cells of our study were in ajuxtaglomerular position. Despite the different names, their functionalroles could be very similar in olfactory processing. It is interesting tonote that Hamilton et al. (2005) have described both bursting andnonbursting firing properties for ‘superficial’ tufted cells whereas, inour work, only a single cell in cluster 2 showed bursting behaviour;the rest displayed regular or irregular-accommodating firing patterns.
What could be the major functional differences between the twotypes of ETCs? As already discussed by Macrides & Schneider(1982), the main difference between ETCs with and without basaldendrites is their potential innervation and lack of innervation bygranule cells, respectively. ETCs without secondary dendrites(cluster 1 in our study) are likely to receive GABAergic inputs onlyfrom periglomerular and short-axon cells onto their apical tufts. Thesecells could still receive feedforward and feedback inhibition, andcould also sense the activity of some neighbouring glomeruli.However, ETCs with extensive secondary dendrites will also integratefeedback GABAergic inputs from granule cells and sample theneuronal activity from a much larger area of the bulb. Our results alsorevealed that these cells have significantly larger glomerular dendritictrees. If the two types of ETCs have similar synaptic densities per unitdendritic length, this would predict a more robust sensory innervationof ETCs with secondary dendrites. Our qualitative observation thatETCs with basal dendrites possess a much larger and more extensivelyramifying local axonal arbor predicts an additional functionaldifference between the two types of ETCs. In summary, ETCs incluster 2 are predicted to receive much more sensory input, formconnections with a higher number of cells in the GL and EPL and
sample the network activity through interacting with granule cellsfrom a much larger area of the bulb. It has also been suggested thatdifferent ETC populations may be responsible for the commissuralinnervation of the contralateral MOB through the anterior olfactorynucleus pars externa and for the lateromedial intrabulbar associationalconnection on the opposite side of the same bulb (Schoenfeld et al.,1985). These pathways allow communication among principal cellsvia granule cells, suggesting a key role for ETCs in processingolfactory sensory information. Whether the two ETC subpopulationsare responsible for this functional difference or whether cells withineach subgroup participate in both commissural and associationalprojections remains to be determined. However, these authors alsonoted that most if not all ETCs in the superficial two-thirds of the GLhave neither intrabulbar nor bulbofugal axonal projections. Interest-ingly, we found that most cells lacking basal dendrites (cluster 1) wererecorded from such locations.Another important feature of the ETCs with bursting firing pattern is
that they show different subthreshold resonant behaviours than cellswith basal dendrites. A larger proportion of the bursting cells haveactive resonance at the theta frequency range. In addition, a verysignificant proportion of these cells are spontaneously active at thetheta frequency range even in in vitro slices, indicating that theiractivity could be associated with the theta rhythm (Adrian, 1950;Freeman, 1975; Laurent & Davidowitz, 1994). ETCs with basaldendrites have an intrinsic resonant frequency below 1 Hz, afrequency range which is below the frequency of local field potentialoscillations observed in vivo (Adrian, 1950; Freeman, 1975; Laurent& Davidowitz, 1994). Thus, we predict that these ETCs may notparticipate in the theta frequency oscillation. Whether they areentrained to gamma frequency oscillations like mitral cells, middle ordeep tufted cells (Desmaisons et al., 1999), or do not fire rhythmicallyat all, remains to be determined.
Acknowledgements
Z.N. is the recipient of a European Commission Integrated Project grant(EUSynapse project; LSHM-CT-2005–019055), a European Young Investi-gator Award, a Postdoctoral Fellowship from the Boehringer Ingelheim Fondand a Wellcome Trust project grant. The financial support from theseFoundations is gratefully acknowledged. We would like to thank Dr SzabolcsKali for advice and useful discussions concerning PCA and clustering analysis.
Abbreviations
ACSF, artificial cerebrospinal fluid; AHP, afterhyperpolarization; AP, actionpotential; CV, coefficient of variation; EPL, external plexiform layer; ETC,external tufted cell; FWHM, full width at half maximum; GL, glomerular layer;ISI, interspike interval; JGC, juxtaglomerular cell; MOB, main olfactory bulb;PB, phosphate buffer; PCA, principal component analysis; PGC, periglomer-ular cell; Rin, input resistance; s, membrane time constant.
References
Adrian, E.D. (1950) The electrical activity of the mammalian olfactory bulb.Electroencephalogr. Clin. Neurophysiol., 2, 377–388.
Aungst, J.L., Heyward, P.M., Puche, A.C., Karnup, S.V., Hayar, A., Szabo, G.& Shipley, M.T. (2003) Centre-surround inhibition among olfactory bulbglomeruli. Nature, 426, 623–629.
Cajal, S.R. & y. (1911) Histologie Du Systeme Nerveux de l’Homme et DesVertebres. Maloine, Paris.
Desmaisons, D., Vincent, J.D. & Lledo, P.M. (1999) Control of action potentialtiming by intrinsic subthreshold oscillations in olfactory bulb output neurons.J. Neurosci., 19, 10727–10737.
Freeman, W.J. (1975) Mass Action in the Nervous System. Academic Press,New York.
External tufted cells of the olfactory bulb 1135
ª The Authors (2006). Journal Compilation ª Federation of European Neuroscience Societies and Blackwell Publishing LtdEuropean Journal of Neuroscience, 24, 1124–1136
Hamilton, K.A., Heinbockel, T., Ennis, M., Szabo, G., Erdelyi, F. & Hayar, A.(2005) Properties of external plexiform layer interneurons in mouse olfactorybulb slices. Neuroscience, 133, 819–829.
Hayar, A., Karnup, S., Ennis, M. & Shipley, M.T. (2004a) External tufted cells:a major excitatory element that coordinates glomerular activity. J. Neurosci.,24, 6676–6685.
Hayar, A., Karnup, S., Shipley, M.T. & Ennis, M. (2004b) Olfactorybulb glomeruli: external tufted cells intrinsically burst at theta frequencyand are entrained by patterned olfactory input. J. Neurosci., 24, 1190–1199.
Hayar, A., Shipley, M.T. & Ennis, M. (2005) Olfactory bulb external tuftedcells are synchronized by multiple intraglomerular mechanisms. J. Neurosci.,25, 8197–8208.
Holderith, N.B., Shigemoto, R. & Nusser, Z. (2003) Cell type-dependentexpression ofHCN1 in themain olfactory bulb.Eur. J. Neurosci., 18, 344–354.
Joliffe, I.T. & Morgan, B.J. (1992) Principal component analysis andexploratory factor analysis. Stat. Meth. Med. Res., 1, 69–95.
Kosaka, K., Aika, Y., Toida, K. & Kosaka, T. (2001) Structure ofintraglomerular dendritic tufts of mitral cells and their contacts witholfactory nerve terminals and calbindin-immunoreactive type 2 periglomer-ular neurons. J. Comp. Neurol., 440, 219–235.
Kosaka, T. & Kosaka, K. (2005) Intraglomerular dendritic link connected bygap junctions and chemical synapses in the mouse main olfactory bulb:Electron microscopic serial section analyses. Neuroscience, 131, 611–625.
Kosaka, K., Toida, K., Aika, Y. & Kosaka, T. (1998) How simple is theorganization of the olfactory glomerulus?: the heterogeneity of so-calledperiglomerular cells. Neurosci. Res., 30, 101–110.
Laurent, G. & Davidowitz, H. (1994) Encoding of olfactory information withoscillating neural assemblies. Science, 265, 1872–1875.
Macrides, F. & Schneider, S.P. (1982) Laminar organization of mitral and tuftedcells in the main olfactory bulb of the adult hamster. J. Comp. Neurol., 208,419–430.
McQuiston, A.R. & Katz, L.C. (2001) Electrophysiology of interneurons inthe glomerular layer of the rat olfactory bulb. J. Neurophysiol., 86, 1899–1907.
Nusser, Z., Naylor, D. & Mody, I. (2001) Synapse-specific contribution of thevariation of transmitter concentration to the decay of inhibitory postsynapticcurrents. Biophys. J., 80, 1251–1261.
Panzanelli, P., Perazzini, A.Z., Fritschy, J.M. & Sassoe-Pognetto, M. (2005)Heterogeneity of gamma-aminobutyric acid type A receptors in mitral andtufted cells of the rat main olfactory bulb. J. Comp. Neurol., 484, 121–131.
Pinching, A.J. & Powell, T.P. (1971a) The neuron types of the glomerular layerof the olfactory bulb. J. Cell Sci., 9, 305–345.
Pinching, A.J. & Powell, T.P. (1971b) The neuropil of the periglomerularregion of the olfactory bulb. J. Cell Sci., 9, 379–409.
Puopolo, M. & Belluzzi, O. (1998) Functional heterogeneity of periglomerularcells in the rat olfactory bulb. Eur. J. Neurosci., 10, 1073–1083.
Ressler, K.J., Sullivan, S.L. & Buck, L.B. (1994) Information coding in theolfactory system: evidence for a stereotyped and highly organized epitopemap in the olfactory bulb. Cell, 79, 1245–1255.
Schoenfeld, T.A., Marchand, J.E. & Macrides, F. (1985) Topographicorganization of tufted cell axonal projections in the hamster main olfactorybulb: an intrabulbar associational system. J. Comp. Neurol., 235, 503–518.
Shepherd, G.M., Chen, W.R. & Greer, C.A. (2004) Olfactory Bulb. OxfordUniversity Press, New York.
Vassar, R., Chao, S.K., Sitcheran, R., Nunez, J.M., Vosshall, L.B. & Axel, R.(1994) Topographic organization of sensory projections to the olfactory bulb.Cell, 79, 981–991.
1136 M. Antal et al.
ª The Authors (2006). Journal Compilation ª Federation of European Neuroscience Societies and Blackwell Publishing LtdEuropean Journal of Neuroscience, 24, 1124–1136