Embed Size (px)
Citation preview

Title Externalities of Urban Renewal: A Real Option Perspective
Author(s) Chau, KW; Wong, SK
Citation Journal of Real Estate Finance and Economics, 2014, v. 48 n. 3,p. 546-560
Issued Date 2014
URL http://hdl.handle.net/10722/200844
Rights The final publication is available at Springer viahttp://dx.doi.org/10.1007/s11146-013-9418-z

Externalities of Urban Renewal: A Real Option Perspective
K W Chau* and S K Wong
Revise May 8, 2012
Suggested Citation:
Chau, K. W. and Won, S. K. (2014) "Externalities of Urban Renewal: a Real Option Perspective" Journal of Real Estate Finance and Economics, 48(3), 546‐560.
URL: http://link.springer.com/article/10.1007%2Fs11146‐013‐9418‐z
DOI: 10.1007/s11146‐013‐9418‐z
*Please send comments to: K.W. Chau Department of Real Estate and Construction, The University of Hong Kong Pokfulam Road Hong Kong

Page 1
Externalities of Urban Renewal: A Real Option Perspective
K.W. Chau* Ronald Coase Centre for Property Rights Research, The University of Hong Kong, Hong Kong
S.K. Wong Ronald Coase Centre for Property Rights Research, The University of Hong Kong, Hong Kong
Abstract
If carefully planned, urban renewal may play an important role in regenerating a decaying neighborhood and mitigating the negative externality generated by dilapidated buildings in densely populated areas. Despite its potential benefits, in urban areas dominated by high‐rise developments, urban renewal has an unintended negative impact on nearby properties since it reduces their redevelopment option values.
In this study, we develop a number of hypotheses on how an urban renewal project, once made known to the public, affects neighborhood housing prices and test them with data in Hong Kong. Our empirical findings suggest that the degree of positive externalities brought by urban renewal depends on the scale of an urban renewal project, as well as the amount of commercial areas included in the project. Most importantly, through examining changes in the age coefficient, we found that an urban renewal project reduces the value of nearby buildings beyond the boundaries of the project. The negative effect was stronger for older buildings and for those buildings located closer to the project’s boundaries. These unintended consequences of urban renewal have not been analyzed or tested in previous studies.
Keywords: Age effect, externality, redevelopment option, transaction cost, urban renewal.
________________________________ *Please send comments to: K.W. Chau Department of Real Estate and Construction, The University of Hong Kong Pokfulam Road Hong Kong Acknowledgements: We are very grateful to an anonymous referee, Edward Coulson, Dogan Tirtiroglu, and participants of the Asia‐Pacific Real Estate Research Symposium for their useful comments on and suggestions for our paper. We would also like to thank Amber P. S. Leung and Daniel Y. F. Lo for their assistance in data collection.

Page 2
EXTERNALITIESOFURBANRENEWAL:AREALOPTIONPERSPECTIVE
1Introduction
A neighborhood is a physical and social environment where people interact with each other
and share a collective identity. If one maintains his / her property well, his / her neighbors
would also benefit. If all residents in the neighborhood maintain their properties well,
then everyone in it would benefit. However, this would not be the case if certain residents
want to free‐ride on the positive externality generated by well‐maintained buildings. The
consequence, as predicted by the Slumlords’ Dilemma, is that a neighborhood would end up
deteriorating because no one has an incentive to maintain his / her building for the benefit
of others (Davis and Whinston, 1962). This situation is even worse in densely populated
areas dominated by multiple ownership high rise buildings as high transaction cost prohibit
negotiation among property owners to research a win‐win solution. One solution for
clearing a deteriorating neighborhood or slum is to have the government intervene and use
its power of eminent domain to initiate urban renewal. However, in reality, urban renewal
is not always well‐received. For instance, the slum clearance projects in the U.S. during the
1960s – nicknamed the Federal Bulldozer – were viewed with extreme skepticism (e.g.
Anderson, 1964). In Beijing, China, many migrant workers were made homeless when the
slums (“urban villages”) they lived in were cleared for the Olympics.1
Since property is immobile and durable, its price can be used as an indirect channel through
which a neighborhood’s quality is captured and revealed. For example, properties with
pleasant views are known to command higher prices (Benson et al., 1998), which could be
as much as 37% of a property’s total value (Bourassa et al., 2004). Well‐managed open
spaces and parks are other positive neighborhood attributes. Well‐managed parks can
raise property prices by as much as 20%, while poorly managed ones can depress prices by
up to the same amount (Hendon, 1971). Despite increased levels of noise and air
1 See “China’s migrant workers: No place to call home,” The Economist, Jun 7
th, 2007.

Page 3
pollution, a property’s proximity to major transportation facilities is generally valued
positively (Poon, 1978; Chau and Ng, 1998). Yiu and Wong (2005) found that housing
prices were even able to reflect the expectations of a neighborhood’s residents of a new
tunnel to their area well before its completion.
This paper seeks to examine how urban renewal project affects property prices in the
neighborhood area (i.e. those outside of the urban renewal boundaries). Unlike the
well‐established neighborhood attributes examined in the preceding studies, urban renewal
is much more controversial in nature and, as we will discuss shortly, could have unintended
consequences on the redevelopment option value of nearby buildings. Some studies
showed that large scale improvement or redevelopment projects increased the values of
properties in the vicinity, especially in low‐income neighborhoods (Rosenthal and Helsley,
1994; Immergluck, 2009). Other studies, however, did not find any positive price impact
from urban renewal projects. Tse (2001) argued that only redeveloped buildings enjoyed
better environments and higher economic values, not those in their neighborhood. This
was later supported by Lai et al.’s (2007) empirical study, which found no significant price
spillover effect from urban renewal projects to neighborhood residential properties.
Therefore, the neighborhood effects due to urban renewal remain inconclusive.
To understand the conflicting results, the sources of external effects of urban renewal need
to be identified and analyzed separately. First, the demolition of old and deteriorated
buildings should reduce their negative externalities, such as health and safety hazards, to
the neighborhood. Second, the replacement of older buildings with amenities, such as
open public spaces, should produce positive externalities for the neighborhood. Sirpal
(1994), for example, found that shopping malls enhanced the value of surrounding
residential properties; the larger the shopping mall, the bigger the price effect. Third, if
older buildings were redeveloped into residential buildings, the increase in supply could well
depress the prices of nearby housing units. As a result, urban renewal does not necessarily
produce positive externalities, which depend on the types of new building or facility to be
built. In addition, an urban renewal project needs to be well‐planned so that it fits into the
surrounding urban landscape.

Page 4
One last possible neighborhood effect that has rarely been explored is that urban renewal
could reduce the redevelopment option value of buildings outside an urban renewal
project’s boundaries. This arises from the fact that urban renewal boundaries are typically
set for long periods of time and typically do not emanate outwards from their original
boundaries in densely populated areas. In addition, urban renewal priorities are typically
are set for districts rather than individual sites on an ad hoc basis. The presence of an
urban renewal project in an area indicates that not just the site being redeveloped but the
surrounding areas have also been studied. Therefore, after an urban renewal project in an
area has been approved, the chance that the government will initiate another urban
renewal project in the same area will be significantly reduced. In the traditional
decision‐making framework, redevelopment should take place when the replacement value
exceeds the sum of the use value of an existing building and the redevelopment costs
(Brueckner, 1980; Rosenthal and Helsley, 1994; Munneke, 1996). The real option theory
adds that in addition to the current use value, existing buildings also carry a non‐negative
real option for the flexibility to redevelop into higher intensity or alternative uses (Clapp et
al., 2007). As a building ages, its use value decreases, while its option value increases
(Clapp and Salavei, 2010; Clapp et al., 2012). For multiple ownership buildings, this option
value is also affected by the transaction cost of negotiation amongst owners of the units in
the building. Urban renewal can lower this transaction cost. However, if a building is
excluded from a nearby urban renewal project, its redevelopment option value will decline
as the chance it being included in another urban renewal project will decrease significantly.
We will test if the value of redevelopment options embedded in nearby buildings diminishes
as a result of urban renewal.
Cases in Hong Kong will be used to test the various neighborhood effects of urban renewal.
Hong Kong is a good place to study redevelopment value because of its high population
density, limited land supply, aging building stock, and popularity of multiple ownership
high‐rise buildings. Section 2 provides a background of urban renewal in Hong Kong.
Section 3 discusses the theoretical background and develops testable hypotheses on
changes in the age coefficient after a public announcement of an urban renewal project’s
boundaries. Section 4 shows the empirical model and data for testing the hypotheses.

Page 5
Section 5 presents the results and their implications. Section 6 concludes the study with
policy and practical implications.
2UrbanRenewalinHongKong2
Hong Kong’s urban area has grown quickly in response to its changing economic and social
demands. While its citizens have enjoyed the benefits of rapid economic growth over the
years, problems associated with urban decay and aging buildings have also increased.
There are now about 15,000 multiple ownership apartment buildings aged over 30 years in
Hong Kong’s urban areas, and this number is expected to increase by 50% to 22,500 in ten
years (Urban Renewal Authority, 2008). Without proper maintenance, these buildings
would deteriorate rapidly and become a burden to society. For instance, the collapse of a
rundown five‐storey residential building in 2010 killed four residents.3 This immediately
led the government to pull down the older adjacent buildings and the nearby old buildings
were designated as high priority urban renewal project.
The role of private developers in acquiring and redeveloping old properties is quite limited.
This is because residential building units in Hong Kong are held under multi‐ownership
titles,4 transaction costs of re‐development is high. To acquire a residential building
owned by many individuals, developers have to face the risk of holdout units, defective
titles, and untraceable owners. To manage these risks, developers do not normally seek to
comprehensively redevelop a large area, but rather small sites. Such a redevelopment
scale often did not benefit the neighbourhood and even made comprehensive
redevelopment of the whole area more complicated (Adams and Hastings, 2001) and
potentially inefficient.
Given that private redevelopment is relatively limited and slow, government intervene to
lower the transaction cost. The Urban Renewal Authority (URA), formerly the Land
2 In this study, urban renewal always refers to projects initiated by the public sector. Private sector projects are simply called redevelopment projects. 3 See “Fatal collapse due to ‘external forces’,” The Standard, April 27th, 2010. 4 A multi‐ownership title means the owner of a flat co‐owns the whole multi‐story building with other owners as a tenancy in common, while reserving the right to exclusively use his own flat (Nield, 1997).

Page 6
Development Corporation (LDC), is the major government agency involved in the urban
renewal process in Hong Kong,. According to its homepage, the URA aims to address the
problem of urban blight and improve the quality of neighborhoods by providing a cleaner
environment and upgrading street designs and community amenities. What makes the
URA superior to private developers is its statutory power to commandeer property free of
title or holdout problems as long as reasonable compensation is paid to the owners. Some
homeowners who lived in poorly‐maintained buildings are indeed waiting for the URA to
acquire their buildings and compensate them.
Because of its statutory power and public accountability, the URA’s projects are generally
larger and more comprehensive than those undertaken by private developers. Considering
the positive externalities alone (see Introduction), an URA project should more likely benefit
a neighborhood than a private one. The URA, however, is required to operate on
commercial principles – its projects should not only benefit society, but also be financially
sound. This has two effects on its site selection strategy. At the macro level, the URA
may have an incentive to renew districts that appreciate at a faster rate than the rest of the
city. At the project level, the URA may mark its urban renewal boundaries in such a way so
as to ensure that the sites included are financially viable. Buildings outside the boundaries
(i.e., those not targeted by the URA) would be accorded lower redevelopment priority and
lose the chance to be acquired and compensated in the near future. It is not uncommon
to hear complaints from homeowners who were excluded from URA projects. These
complaints may well reflect the real option idea we mentioned earlier – urban renewal
could have an unintended negative impact on nearby properties because their chances of
being redeveloped are lowered. We will formulate hypotheses based on this idea in the
next section.
3DevelopmentofHypotheses
This study makes use of the redevelopment projects initiated by the URA to study the
impact the neighborhood effects on nearby residential properties. Borrowing the idea of
Clapp et al. (2007), we model property value, P, as a sum of two components:
Page 7
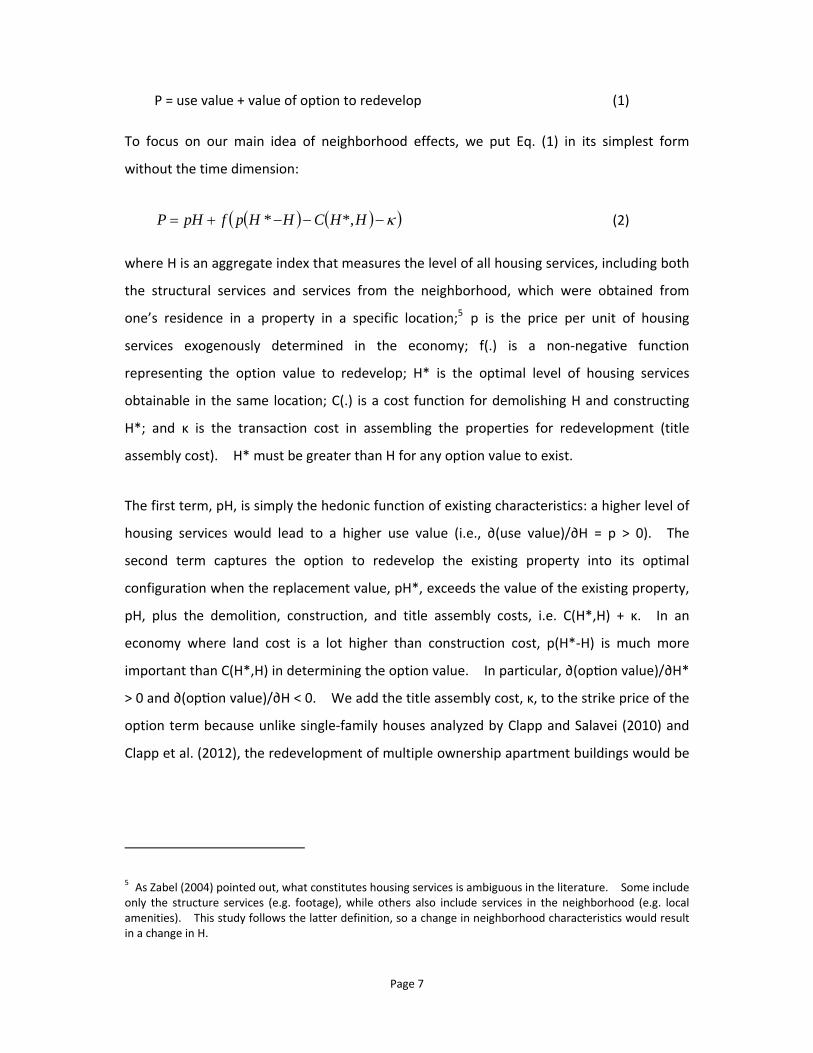
P = use value + value of option to redevelop (1)
To focus on our main idea of neighborhood effects, we put Eq. (1) in its simplest form
without the time dimension:
HHCHHpfpHP *,* (2)
where H is an aggregate index that measures the level of all housing services, including both
the structural services and services from the neighborhood, which were obtained from
one’s residence in a property in a specific location;5 p is the price per unit of housing
services exogenously determined in the economy; f(.) is a non‐negative function
representing the option value to redevelop; H* is the optimal level of housing services
obtainable in the same location; C(.) is a cost function for demolishing H and constructing
H*; and κ is the transaction cost in assembling the properties for redevelopment (title
assembly cost). H* must be greater than H for any option value to exist.
The first term, pH, is simply the hedonic function of existing characteristics: a higher level of
housing services would lead to a higher use value (i.e., ∂(use value)/∂H = p > 0). The
second term captures the option to redevelop the existing property into its optimal
configuration when the replacement value, pH*, exceeds the value of the existing property,
pH, plus the demolition, construction, and title assembly costs, i.e. C(H*,H) + κ. In an
economy where land cost is a lot higher than construction cost, p(H*‐H) is much more
important than C(H*,H) in determining the option value. In particular, ∂(op on value)/∂H*
> 0 and ∂(op on value)/∂H < 0. We add the title assembly cost, κ, to the strike price of the
option term because unlike single‐family houses analyzed by Clapp and Salavei (2010) and
Clapp et al. (2012), the redevelopment of multiple ownership apartment buildings would be
5 As Zabel (2004) pointed out, what constitutes housing services is ambiguous in the literature. Some include only the structure services (e.g. footage), while others also include services in the neighborhood (e.g. local amenities). This study follows the latter definition, so a change in neighborhood characteristics would result in a change in H.

Page 8
impossible without assembling all or a majority6 of the titles of apartment units in the first
place. A higher κ would lower the option value and property price (i.e., ∂P/∂κ < 0).
Then we formulate hypotheses for various neighborhood effects based on Eq. (2). We are
particularly interested in comparing the external effects of urban renewal on newer and
older buildings because the option value term in Eq. (2) becomes more important when a
building ages (Clapp and Salavei, 2010; Clapp et al., 2012).
Suppose newer and older buildings provide different levels of housing service denoted
respectively by Hnew and Hold. Due to depreciation and obsolescence, Hnew is usually larger
than Hold. The level of housing services given by a brand new building should be close to
the optimal (i.e., Hnew → H*), so we assume a new building has no option value and its price
can be solely described by its use value:
newnew pHP (3)
On the other hand, an older building’s service level normally falls below the optimal and
therefore its redevelopment option value cannot be ignored. The price of an older
building is the sum of its use and option values, with Hnew replacing H* in Eq. (2):
oldnewoldnewoldold HHCHHpfpHP , (4)
What would be the external effects on a building if urban renewal takes place in its
neighborhood? We hypothesize three effects. The first two effects are independent of
6 Before 1999, a developer has to have 100% shares of the equity interests of an apartment building in order
to redevelop it. Since 1999, the Land (Compulsory Sale for Redevelopment) Ordinance (LCSRO) (Cap. 545)
provides that a person who owns not less than 90% equity interests of an apartment building can apply to the
Lands Tribunal for a compulsory sale (by auction) of the whole building for the purpose of redevelopment. In
2010, the threshold was further lowered to 80% for residential buildings older than 50 years and for buildings
in which each unit represents more than 10% of the equity interest of the entire building.

Page 9
the option value term, while the last one is an “unintended consequence” drawn from
Eqs.(3) and (4).
First, urban renewal would improve a neighborhood’s quality by reducing its negative
externalities (e.g. removing unattractive and dilapidated buildings). The improvement in
neighborhood quality is reflected in our model by a higher level of housing services, H. We
assume that both Hnew and Hold increase by the same amount, as there is no a priori
knowledge that newer or older properties should benefit more. As a result, for both
newer and older buildings, only the use value term matters.7 The increase in use value
depends on the change in the magnitude of H, which, in turn, varies with the scale of urban
renewal. The larger the redevelopment area, the greater the neighborhood improvement.
Hence, the increase in H would be greater. This produces a higher property value
(∂P/∂H>0) and leads to our first hypothesis:
H1: Nearby properties benefit more from larger scale urban renewal projects.
If this hypothesis is true, larger redevelopment projects would give rise to a stronger value
enhancement effect on surrounding properties.
Second, urban renewal could also bring in positive externalities (e.g. shopping malls and
public spaces). Residents in the neighborhood could enjoy more shopping and social
interaction opportunities upon the completion of the redevelopment. Similar to the logic
in H1, the provision of commercial facilities would give rise to a higher level of housing
services, H, and enhance nearby residential property prices (∂P/∂H>0). Therefore, our
second hypothesis is:
H2: Nearby residential properties benefit more from urban renewal projects with a larger commercial component.
If this hypothesis is true, redevelopment projects with more commercial areas would have a
stronger value enhancement effect on surrounding properties.
7 In Eq. (4), if Hnew and Hold increased by the same percentage and their increase had a negligible impact on C, then the option value term would remain unchanged.

Page 10
Unlike H1 and H2, the final implication is the most interesting and perhaps counterintuitive,
as urban renewal could adversely affect the option value of nearby buildings through two
channels. First, these buildings lose the opportunity to enjoy synergy from being
redeveloped jointly with the area targeted for urban renewal. Synergy arises from
economies of scale when sites are combined to increase their development potential (e.g.
higher maximum development density). Larger sites can also accommodate more
common facilities and allow more flexible design, uses or configurations. For buildings
excluded from an urban renewal project, even if they were redeveloped in the future, their
optimal service level, H*, would not be as high as when synergetic opportunities were
available and their option value to redevelop would thus be reduced.
The second and more important channel through which nearby buildings lose value is that
urban renewal projects raises the expected title assembly cost of nearby buildings.
Consider a situation in which title assembly is very costly (e.g. acquiring multiple‐ownership
titles in apartment buildings), which means that κ is high. As mentioned in Section 2, a
powerful government agent like the URA is usually welcomed by homeowners because its
power of eminent domain can help lower κ and, hence, unlock the option value of the
properties included in its urban renewal projects. Let κU and κP be the title assembly costs
of the URA and private developers, respectively. Since the former has eminent domain
power, κU is smaller than κP. Given that the probability of a building to be redeveloped by
the URA is wU, the expected land assembly cost can be stated as:
PUUU ww 1 (5)
Limited by its objective of self‐financing, the URA has its own internal principles for
determining, for each district, which buildings should be targeted or prioritized for urban
renewal. Buildings not targeted have a lower wU; they would not be redeveloped by the
URA until higher priority projects in other districts are completed. The public does not
know the URA’s future targets, but whenever the URA announces its projects, the public
would know that nearby buildings excluded from the plans are unlikely to be redeveloped in
the near future. These buildings’ wU will decline substantially, raising their expected title
assembly costs towards κP, according to Eq. (5).

Page 11
Comparing Eq. (3) with Eq. (4), the option value term is present in the older building only.
Being excluded from a nearby urban renewal project implies a reduction in its
redevelopment option value (either because of a reduction in H* or an increase in κ. This
leads to our third hypothesis:
H3: Urban renewal reduces the redevelopment option value of nearby properties.
If this hypothesis is true, urban renewal projects will depress the value of nearby older
properties more than those of newer ones. Moreover, the negative impact due to loss in
synergistic opportunities and a rise in title‐assembly costs is more significant for buildings
closer to an urban renewal project. Therefore, if H3 is correct, the negative impact on
redevelopment options should be stronger for buildings that are situated closer to an urban
renewal project.
4ResearchDesign
4.1 Sample
To measure the neighborhood effects stemming from urban renewal, it is necessary to
collect records of property transactions in the immediate vicinity of the areas targeted for
urban renewal. In this study, we chose the residential properties located within 200
meters (i.e., about 650 ft) of an urban renewal area. One reason for our confinement to
such a small area is to capture the most direct effects brought about by urban renewal. A
Pittsburgh case study suggests that “property will suffer significant external effects only
from those features within one hundred and fifty feet of its boundaries” (Rueter, 1973,
p.321). Another reason is that we want to better control for the locational factors that
could affect the prices of a property. Limiting the sample to a small area would help us
avoid the problem of omitted variable bias.

Page 12
Since Hong Kong has a highly liquid housing market (Chau et al. 2005), we were able to
collect a sample of more than 40,000 condo sales records in the vicinity of the urban
renewal projects performed by the URA in ten districts from 1991 to 2011. We have
discarded pre‐sales transactions since their prices do not reflect spot market clearing prices.
We obtain the transaction data from EPRC8, which provides not only the transaction prices
of condo units registered at the Land Registry, but also key condo characteristics such as flat
size, floor level, and building age.
To ascertain the timing of any urban renewal effect, we need to identify when an urban
renewal project was announced. The first date of conducting the freezing survey is taken
as the announcement date of an urban renewal project.9 The public, including affected
owners, do not know about an urban renewal project before the URA conducted its freezing
survey.10 Most of the announcement dates of the urban renewal projects aree collected
from the URA’s press releases, while the rest are found from local newspaper archives.
Other details about the urban renewal projects are obtained from the Legislative Council
Panel Papers (e.g. Legislative Council, 2009). In these papers, the URA report its work
progress and plans for the coming year to the Legislative Council. The project highlights
include the size of each urban renewal site and the type and scale of the proposed new
development, which are essential information for testing Hypotheses 1 and 2.
4.2 The empirical Model
8 EPRC is third party value added data provider that supplies electronic property information in Hong Kong
including real estate transactions registered with the Land Registry of the Hong Kong SAR Government.
9 Freezing surveys are a snapshot of the ownership, tenancy, and other legal rights surrounding the property to be redeveloped. They are conducted when an urban renewal project is first published in the Government Gazette. 10 Hong Kong has a good reputation for its anti‐corruption measures, so cases of leaking urban renewal targets are rare. According to the 2012 Index of Economic Freedom compiled by the Heritage Foundation and Wall Street Journal, Hong Kong received a score of 84 (world ranking: 13th) in Freedom from Corruption.

Page 13
To test the three hypotheses developed in Section 3, we estimate the following hedonic
model using the ordinary least squares technique:
ln(RP) = α0 + α1ln(AGE) + α2ln(GFA) + α3ln(FLR) + β1T + β2T*SITE_SIZE
+ β3T*COM_SIZE + β4T*ln(AGE) + β5T*ln(AGE)*DIST + λk + ε (6a)
where:
RP = real property price in HK$million (obtained by deflating nominal transaction prices
by their corresponding district‐level property price indices);11
AGE = the age of the property in years;
GFA = Gross Floor Area of the property (condo unit) in square feet;
FLR = floor level of the property;
T = an event dummy variable that equals 1 after the announcement of an urban
renewal project and 0 otherwise;
SITE_SIZE = area of the site included in the urban renewal project (in ft2);
COM_SIZE = commercial floor area (in thousands of ft2) created by the urban renewal
project;
DIST = distance from the urban renewal project in feet;
λk = a set of nine location dummies indicating the district in which the urban renewal
project is located;
αi and βj = coefficients to be estimated; and
ε = error term
11 The price indices, known as HKU‐REIS, were constructed using Bailey et al.’s (1963) repeat‐sales method.
See Chau et al. (2005) for more details.
Page 14
The first three variables, AGE, GFA, and FLR, are the structural characteristics of the
property. These are the typical variables used for the hedonic analysis of condo unit
prices. The measurement of floor area deserves some discussion because different
definitions are adopted for Hong Kong. The most widely used definition is GFA, which
consists of the internal floor area (IFA) of a unit and the communal floor area (CFA) shared
by all units (e.g. a garden). If GFA is used, we have 42,473 valid usable transactions to
estimate Eq. (6a). However, buyers may not value exclusively‐owned space in the same
way as shared space. We therefore also break GFA down to IFA and CFA as a robustness
check:
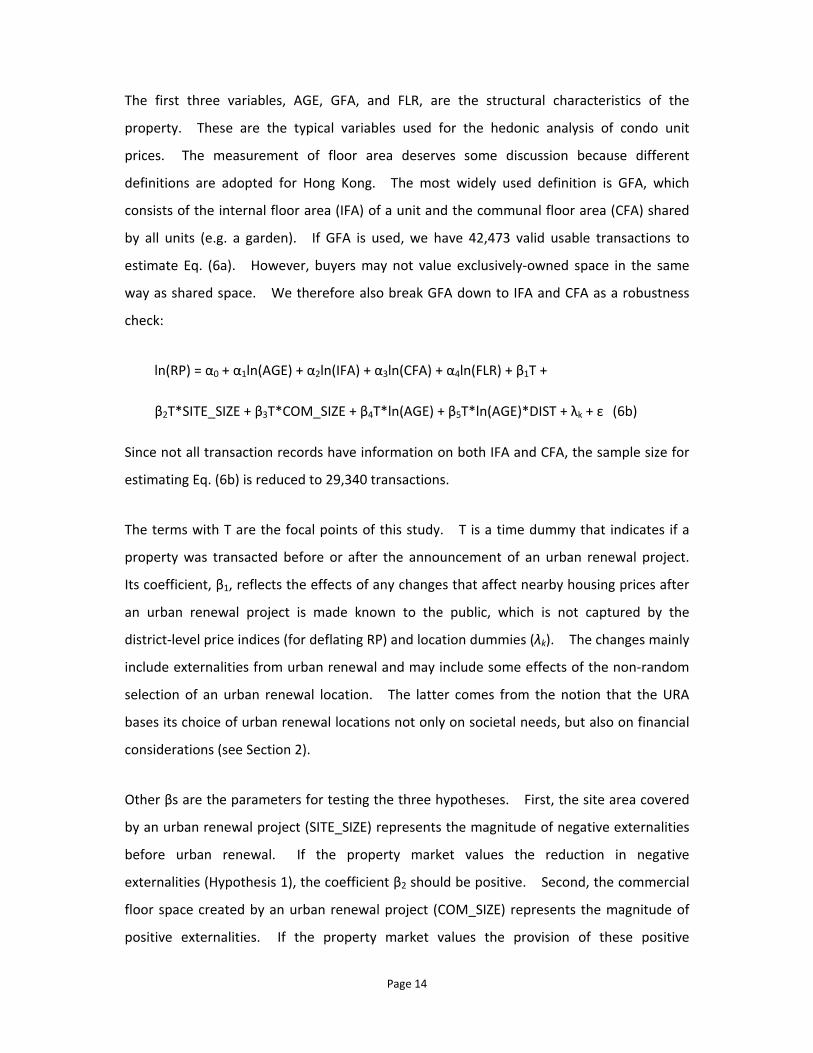
ln(RP) = α0 + α1ln(AGE) + α2ln(IFA) + α3ln(CFA) + α4ln(FLR) + β1T +
β2T*SITE_SIZE + β3T*COM_SIZE + β4T*ln(AGE) + β5T*ln(AGE)*DIST + λk + ε (6b)
Since not all transaction records have information on both IFA and CFA, the sample size for
estimating Eq. (6b) is reduced to 29,340 transactions.
The terms with T are the focal points of this study. T is a time dummy that indicates if a
property was transacted before or after the announcement of an urban renewal project.
Its coefficient, β1, reflects the effects of any changes that affect nearby housing prices after
an urban renewal project is made known to the public, which is not captured by the
district‐level price indices (for deflating RP) and location dummies (λk). The changes mainly
include externalities from urban renewal and may include some effects of the non‐random
selection of an urban renewal location. The latter comes from the notion that the URA
bases its choice of urban renewal locations not only on societal needs, but also on financial
considerations (see Section 2).
Other βs are the parameters for testing the three hypotheses. First, the site area covered
by an urban renewal project (SITE_SIZE) represents the magnitude of negative externalities
before urban renewal. If the property market values the reduction in negative
externalities (Hypothesis 1), the coefficient β2 should be positive. Second, the commercial
floor space created by an urban renewal project (COM_SIZE) represents the magnitude of
positive externalities. If the property market values the provision of these positive

Page 15
externalities (Hypothesis 2), the coefficient β3 should be positive. Third, according to
Hypothesis 3, urban renewal should have a larger negative impact on older buildings (AGE),
while the negative impact should be weakened if a building is situated farther away from
the urban renewal site (DIST). If these are correct, the coefficient β4 should be negative,
while the coefficient β5 should be positive. A summary of the expected sign of each
coefficient is shown in Table 1.
[Table 1 about here]
5EmpiricalResults
The summary statistics of our sample are shown in Table 2. Over the whole sample period,
the average real (year 2000) price of a condo unit was HK$1.724 million (equivalent to
US$221,000). The mean price increased by 4% (from HK$1.691 to HK$1.757 million) after
an announcement of an urban renewal project. An “average” transacted condo unit has
the following characteristics: 13 years old, 520 ft2 large (407 ft2 internal space and 136 sf2
communal space), 13 floors above the ground level, and 416 ft away from the concerned
urban renewal project. This specification is quite standard for a two‐to‐four‐person family
in Hong Kong. Except for building age, the average characteristics are quite similar before
and after an announcement.
[Table 2 about here]
The estimated results of the hedonic equations in Eqs.(6a) and (6b) are presented in Table
3. Both have an adjusted R‐squared of 83%, which is similar to the R‐squared reported in
other hedonic studies of condo units. Indeed, both sets of results are highly similar, so
how condo unit size is measured does not matter in this study. The results of both
equations will be discussed together unless otherwise specified.
[Table 3 about here]
All estimated coefficients of the structural attributes are statistically significant at the 1%
level. These coefficients represent the implicit prices of these attributes before any urban
Page 16
renewal effects (i.e., T=0). As expected, real property prices decrease with building age,
but increase with the condo unit’s size and floor level. A 10% increase in building age
reduces property prices by 0.7%, which roughly corresponds to a 0.54% annual depreciation
for a building of average age in our sample. A 10% increase in flat size raises property
prices by 11%; an extra square foot for an average‐sized unit cost about HK$4,500. In Eq.
(6b), when the gross floor area is broken down into internal and communal areas, we found
that the implicit price of internal area (elasticity = 0.969) is almost ten times that of
communal area (elasticity = 0.110). A higher value is therefore attached to
exclusively‐owned space. As for floor level, a 10% increase raises property prices by about
0.8%. This is consistent with the magnitude found in other hedonic studies on Hong Kong
(e.g. Wong et al. 2011).
Next, we turn to the coefficients concerning the urban renewal effects (i.e., T=1). Consider
an average property in our sample. An announcement of an urban renewal project
increases neighborhood property prices by an average of 4.0% (Eq.6a) and 3.4% (Eq.6b).12
The coefficients of the two interaction variables, T*SITE_SIZE and T*COM_SIZE, are positive
and significant at the 1% level.13 For a 10,000 ft2 increase in the site area of an urban
renewal project, neighborhood property prices increases by 0.6%. On the other hand, for
a 10,000 ft2 increase in the commercial area of an urban renewal project, neighborhood
property prices increase by 0.9% (Eq.6a) and 1.3% (Eq.6b). The results show that the
property values capitalize both the reduction in negative externalities and the addition of
positive externalities arising from nearby urban renewal projects, with the latter being more
valuable in our sample. These results are consistent with the predictions of H1 and H2.
Finally, we assess whether urban renewal has a negative impact on redevelopment option
value of nearby properties. The coefficients of the last two interaction variables, T*ln(AGE)
12 Since T enters the equations on its own, as well as with other variables, its effect includes not just the coefficient on T, but also the coefficients of its interactive terms.
13 We used the White heteroskedasticity‐consistent standard errors. If clustered robust standard errors are
used, the two coefficients would become insignificant. We take this as a caveat to readers.

Page 17
and T*ln(AGE)*DIST, are negative and positive, respectively. They are both significant at
the 1% level.14 This suggested that the older housing units depreciate faster after the
announcement of an urban renewal project. For a 10% increase in building age, property
prices depreciate by 1.2%, which is larger than the 0.7% depreciation before the
announcement of an urban renewal project.15 Moreover, older buildings closer to the site
of an urban renewal project show greater price depreciation. With respect to a property
with an average building age, a 100‐ft decrease in distance from an urban renewal project
lower its property price by 1.3% (Eq.6a) and 0.6% (Eq.6b). These results, therefore,
confirm the empirical implications of H3: urban renewal project has stronger negative
impact on the values of older units than those of newer nearby buildings and that such
impact diminishes as distant from the urban renewal project increases.
6Conclusion
A well‐planned urban renewal project in a densely populated areas dominated by high‐rise
developments may have a positive external effect on its neighborhood area, as it helps to
reduce the negative externalities posed by dilapidated buildings. Besides, urban renewal
may create a better environment and introduce new amenities into a community. These
positive externalities would be reflected in higher property values in the neighborhood of
the urban renewal project.
However, after breaking down the property values into their current uses and
redevelopment option components, we found that urban renewal projects actually
generates two opposite effects on nearby properties values. On the one hand, the impact
on the current use value is positive and that the impact is stronger for larger urban renewal
projects and for projects with more commercial facilities. On the other hand, the impact
14 We used the White heteroskedasticity‐consistent standard errors. Their coefficients are still significant at
the 1% and 10% levels when clustered robust standard errors are used.
15 The 1.2% figure was calculated with respect to a building located at an average distance from the urban renewal project.

Page 18
on the redevelopment option value is negative since the nearby buildings are, by definition,
excluded from the urban renewal project. We hypothesize that the negative impact
mainly arises from the high transaction costs of redeveloping a multiple‐ownership of
high‐rise buildings, which can be most easily overcome by government led initiatives such as
urban renewal. In addition, the nearby buildings, even if redeveloped by private
developers in the future, would not be able to enjoy the scale effect of being redeveloped
together with the nearby urban renewal project. This negative externality of urban
renewal has rarely been considered in any economic impact analysis of urban renewal
projects; therefore any positive externality brought about by urban renewal might have
been overestimated. Our study also provides an economic explanation for why owners of
older units may be disappointed when a nearby urban renewal project is announced.

Page 19
REFERENCES
Adams, D. and Hastings, E.M. (2001), “Urban renewal in Hong Kong: transition from development corporation to renewal authority,” Land Use Policy, 18, pp.245‐258.
Anderson, M. (1964) The Federal Bulldozer: A Critical Analysis of Urban Renewal, 1949‐1962, M.I.T. Press: Cambridge, Mass.
Bailey, M.J., Muth, R.F. and Nourse, H.O. (1963), “A regression method for real estate price index construction,” Journal of the American Statistical Association, 58, 304, pp.933‐942.
Benson, E.D., Hansen, J.L., Schwartz, A.L. Jr., and Smersh, G.T. (1998), “Pricing residential amenities: The value of a view,” Journal of Real Estate Finance and Economics, 16, 1, pp.55‐73.
Bourassa, S.C., Hoesli, M. and Sun, J. (2004), “What’s in a view,” Environment and Planning A, 36, 8, pp.1427‐1450.
Brueckner, J.K. (1980), “A vintage model of urban growth,” Journal of Urban Economics, 8, 3, pp.389‐402.
Chau, K.W. and Ng, F.F. (1998), “The effects of improvement in public transportation capacity on residential price gradient in Hong Kong,” Journal of Property Valuation and Investment, 16, pp.397‐410.
Chau, K.W., Wong, S.K., Yiu, C.Y. and Leung, H.F. (2005), “Real estate prices indices in Hong Kong,” Journal of Real Estate Literature, 13, 3, pp.337‐356.
Clapp, J.M. and Salavei, K. (2010), “Hedonic pricing with redevelopment options: A new approach to estimating depreciation effects,” Journal of Urban Economics, 67, 3, pp.362‐377.
Clapp, J.M., Jou, J.B. and Lee, T.C. (2007), “Buy to scrape? The hedonic model with redevelopment options,” paper presented at the Asian Real Estate Society Conference, Macau, 9‐12 July 2007.
Clapp, J.M., Bardos, K.S. and Wong, S.K. (2012), “Empirical estimation of the option premium for residential redevelopment,” Regional Science and Urban Economics, 42, 240‐256.
Davis, O.A. and Whinston, A. (1962) “Externalities, welfare, and the theory of games,” Journal of Political Economy, 70(3), 241‐262.
Hendon, W.S. (1971), “The park as a determinant of property value,” American Journal of

Page 20
Economics and Sociology, 30, pp.289‐300.
Immergluck, D. (2009), “Large scale redevelopment initiatives, housing values, and gentrification: The case of the Atlanta Beltline,” Urban Studies, 46, 1725‐1747.
Lai, L.W.C., Chau, K.W., Yiu, C.Y. and Wong, S.K. (2007), “Measuring and interpreting the effects of a public sector‐led urban renewal project on housing prices – an empirical study of a comprehensive development area zone developed upon ‘taking’ in Hong Kong,” Environment and Planning B: Planning and Design, 34, pp.524‐538.
Legislative Council (2009), Legislative council panel on development – Progress of work of the Urban Renewal Authority, Legislative Council: Hong Kong, available at: http://www.legco.gov.hk/yr08-09/english/panels/dev/papers/dev0623cb1-1947-3-e.pdf, accessed on Mar 2010.
Munneke, H.J. (1996), “Redevelopment decisions for commercial and industrial properties,” Journal of Urban Economics, 39, 2, pp.229‐253.
Nield, S. (1997) Hong Kong Land Law, Hong Kong: Longman.
Poon, L.C.L. (1978), “Railway externalities and residential property prices,” Land Economics, 54, 2, pp.218‐227.
Rosenthal, S.S. and Helsley R.W. (1994), “Redevelopment and the urban land price,” Journal of Urban Economics, 35, 2, pp.182‐200.
Rueter, F.H. (1973), “Externalities in urban property markets: An empirical test of the zoning ordinance of Pittsburgh,” Journal of Law and Economics, 16, 2, pp.319‐349.
Sirpal, R. (1994), “Empirical modeling of the relative impacts of various sizes of shopping centers on the values of surrounding residential properties,” Journal of Real Estate Research, 9, 4, pp.487‐505.
Tse, R.Y.C. (2001), “Impact of comprehensive development zoning on real estate development in Hong Kong,” Land Use Policy, 18, pp.321‐328.
Urban Renewal Authority (2008), Towards Urban Renewal 3.0. URA: Hong Kong.
Wong, S.K., Chau, K.W., Yau, Y. and Cheung, A.K.C. (2011) “Property price gradients: the vertical dimension,” Journal of Housing and the Built Environment, 26, pp.33‐45.
Yiu, C.Y. and Wong S.K. (2005), “Expectation effects of transportation improvement works on housing prices,” Urban Studies, 42, 1, pp.113‐125.

Page 21
Zabel, J.E. (2004) “The demand for housing services,” Journal of Housing Economics, 13, 16‐35.

ListofTables
Table 1 Summary of the expected sign for the coefficients in Eq. (6a) and (6b)
Description Variable name Expected sign Remark
Log building age ln(AGE) ‐ Control
Log gross floor area of a unit ln(GFA) + Control
Log internal floor area of a unit ln(IFA) + Control
Log communal floor area of a unit ln(CFA) + Control
Log floor level of a unit ln(FLR) + Control
A time dummy for the announcement of an urban renewal project
T +/‐ Control
T interacted with the site area of an urban renewal project
T*SITE_SIZE + Prediction of H1
T interacted with the commercial area of an urban renewal project
T*COM_SIZE + Prediction of H2
T interacted with log building age T*ln(AGE) ‐ Prediction of H3
T interacted with building age and commercial size
T*ln(AGE)*DIST + Prediction of H3
Note: The dependent variable is ln(real sales price).

Page 1
Table 2 Descriptive statistics for the variables, from 1991 to 2011
Description Variable name
Mean (overall) Mean (before urban renewal)
Mean (after urban renewal)
First quartile Third quartile Standard Deviation
No. of observations
Real property price (HK$Mil) RP 1.724 1.691 1.757 0.982 2.010 1.306 42,473
Building age (years) AGE 12.66 8.806 16.70 5.301 19.00 8.799 42,473
Gross floor area of a unit (ft2) GFA 520.3 519.7 520.9 381.0 570.0 238.9 42,473
Internal floor area of a unit (ft2)
IFA 406.6 407.6 405.7 307.0 445.0 192.0 29,341
Communal floor area of a unit (ft2)
CFA 136.2 131.6 140.6 99.0 166.0 55.76 29,341
Floor level of a unit FLR 13.14 12.10 14.23 6.00 18.00 9.225 42,473
Site area of an urban renewal project (’000s ft2)
SITE_SIZE 30.94 ‐ ‐ 14.90 38.06 20.80 42,473
Commercial area of an urban renewal project (’000s ft2)
COM_SIZE 23.25 ‐ ‐ 12.36 37.04 13.40 42,473
Distance from an urban renewal project (’000s ft)
DIST 0.416 0.418 0.415 0.316 0.531 0.150 42,473

Page 2
Table 3: Hedonic regression results
Eq. (6a)
Coefficient t‐stat
Eq. (6b)
Coefficient t‐stat
Intercept ‐6.114 ‐157.8 * ‐5.648 ‐126.1 *
ln(AGE) ‐0.072 ‐61.51 * ‐0.067 ‐48.89 * ln(GFA) 1.097 224.5 * ‐ ‐ ln(IFA) ‐ ‐ 0.969 163.5 * ln(CFA) ‐ ‐ 0.110 23.64 * ln(FLR) 0.080 47.45 * 0.088 48.31 *
T 0.129 16.79 * 0.137 17.25 * T*SITE_SIZE 6.04E‐04 5.428 * 6.11E‐04 5.095 * T*COM_SIZE 9.41E‐04 5.149 * 1.25E‐03 6.702 * T*ln(AGE) ‐0.072 ‐23.95 * ‐0.070 ‐19.38 * T*ln(AGE)*DIST 0.050 10.34 * 0.025 4.345 *
Observations 42,473 29,340 Adj. R2 0.826 0.830
Note: The dependent variable is ln(real sales price); * means the coefficient is significant at the 1% level; coefficients of the location dummies
are not shown here; both equations are estimated by OLS and the t‐stat is based on White heteroskedasticity‐consistent standard errors.