Embed Size (px)
Citation preview

Forest quality mitigates extinction risk in humidtropical vertebratesRajeev Pillay ( [email protected] )
University of Northern British Columbia https://orcid.org/0000-0002-7116-6855James Watson
University of QueenslandAndrew Hansen
Montana State University https://orcid.org/0000-0002-9545-3250Jose Aragon-Osejo
University of Northern British ColumbiaDolors Armenteras
Laboratorio de Ecología del Paisaje y Modelación de Ecosistemas, Departamento de Biología(ECOLMOD),Universidad Nacional de Colombia https://orcid.org/0000-0003-0922-7298Scott Atkinson
United Nations Development Programme https://orcid.org/0000-0001-5995-0199Patrick Burns
School of Informatics, Computing and Cyber Systems, Northern Arizona UniversityJamison Ervin
United Nations Development ProgramScott Goetz
Northern Arizona University https://orcid.org/0000-0002-6326-4308Pamela Gonzalez-del-Pliego
Universidade de EvoraPatrick Jantz
Northern Arizona UniversityChristina Supples
United Nations Development ProgramAnne Lucy Virnig
United Nations Development Program https://orcid.org/0000-0002-7903-7863Brooke Williams
University of Queensland https://orcid.org/0000-0002-0692-7507Oscar Venter
University of Northern British Columbia

Biological Sciences - Article
Keywords: biodiversity, deforestation, forest quality, environmental policy
Posted Date: February 16th, 2021
DOI: https://doi.org/10.21203/rs.3.rs-199037/v1
License: This work is licensed under a Creative Commons Attribution 4.0 International License. Read Full License

Forest quality mitigates extinction risk in humid tropical vertebrates
Authors
Rajeev Pillay1, James E.M. Watson2,3,4, Andrew J. Hansen5, Jose Aragon-Osejo1, Dolors
Armenteras6, Scott C. Atkinson7, Patrick Burns8, Jamison Ervin7, Scott J. Goetz8, Pamela
González-del-Pliego9, Patrick Jantz8, Christina Supples7, Anne L.S. Virnig7, Brooke A.
Williams2,3, and Oscar Venter1
1 Natural Resources and Environmental Studies Institute, University of Northern British
Columbia, Prince George, British Columbia, Canada.
2 Centre for Biodiversity and Conservation Science, The University of Queensland, Brisbane,
Queensland, Australia.
3 School of Earth and Environmental Sciences, The University of Queensland, Brisbane,
Queensland, Australia.
4 Global Conservation Program, Wildlife Conservation Society, New York, U.S.A.
5 Department of Ecology, Montana State University, Bozeman, Montana, U.S.A.
6 Departamento de Biología, Facultad de Ciencias, Universidad Nacional de Colombia, Bogotá,
Colombia.
7 United Nations Development Programme, New York, U.S.A.
8 School of Informatics, Computing and Cyber Systems, Northern Arizona University, Flagstaff,
Arizona, U.S.A.
9 Rui Nabeiro Biodiversity Chair, MED Institute, Universidade de Évora, Évora, Portugal.
Correspondence
Rajeev Pillay, Natural Resources and Environmental Studies Institute, University of Northern
British Columbia, 3333 University Way, Prince George, BC V2N 4Z9, Canada
Email: [email protected], [email protected]

2
Abstract 1
Reducing deforestation underpins efforts to conserve global biodiversity. However, this focus on 2
retaining forest cover1–4 overlooks the multitude of anthropogenic pressures that can degrade 3
forest quality in ways that may imperil biodiversity5. Here we use the latest remotely-sensed 4
measures of forest structural condition and associated human pressures across the global humid 5
tropics6,7 to provide the first estimates of the importance of forest quality, relative to forest cover, 6
in mitigating extinction risk for rainforest vertebrates worldwide. We found tropical rainforests 7
of intact structural condition and minimal human pressures played an outsized role in reducing 8
the odds of species being threatened or having a declining population. Further, the effects of 9
forest quality in mitigating extinction risk were stronger when small amounts of high quality 10
forest remained within species geographic ranges, as opposed to when large extents were 11
forested but of low quality. Our research underscores a critical need to focus global 12
environmental policy and conservation strategies toward the targeted protection of the last 13
remaining undisturbed forest landscapes, in concert with strategies aimed at preserving, restoring 14
and reconnecting remnant forest fragments across the hyperdiverse humid tropics. 15
Main 16
Conservation efforts to date have largely failed to arrest the global biodiversity crisis8,9. The 17
ongoing loss of biodiversity imperils the myriad ecosystem functions and services that people 18
receive from nature10,11. Consequently, halting biodiversity loss is imperative to sustained human 19
wellbeing9–11. Emerging evidence suggests undisturbed native forests with negligible human 20
pressures support greater biodiversity and ecosystem service values than lands converted and 21
degraded for agriculture and forestry12–14. However, international environmental agreements 22
such as the Convention on Biological Diversity (CBD)1, the New York Declaration on Forests2, 23
3
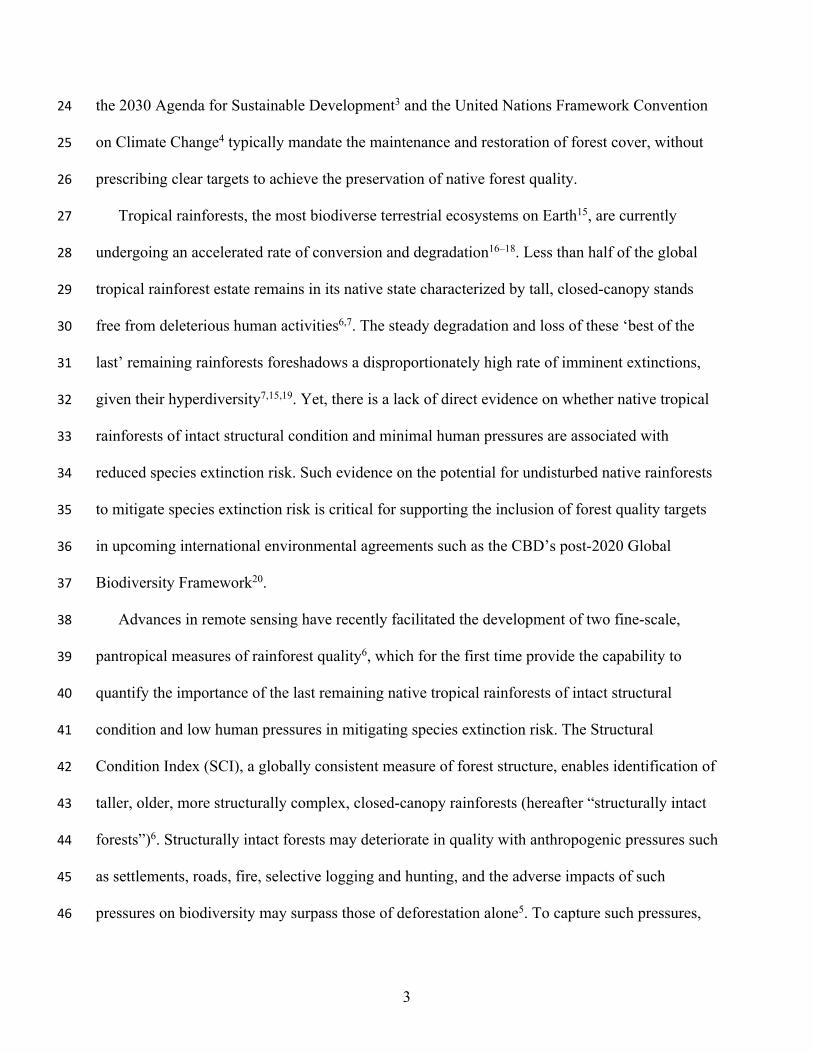
the 2030 Agenda for Sustainable Development3 and the United Nations Framework Convention 24
on Climate Change4 typically mandate the maintenance and restoration of forest cover, without 25
prescribing clear targets to achieve the preservation of native forest quality. 26
Tropical rainforests, the most biodiverse terrestrial ecosystems on Earth15, are currently 27
undergoing an accelerated rate of conversion and degradation16–18. Less than half of the global 28
tropical rainforest estate remains in its native state characterized by tall, closed-canopy stands 29
free from deleterious human activities6,7. The steady degradation and loss of these ‘best of the 30
last’ remaining rainforests foreshadows a disproportionately high rate of imminent extinctions, 31
given their hyperdiversity7,15,19. Yet, there is a lack of direct evidence on whether native tropical 32
rainforests of intact structural condition and minimal human pressures are associated with 33
reduced species extinction risk. Such evidence on the potential for undisturbed native rainforests 34
to mitigate species extinction risk is critical for supporting the inclusion of forest quality targets 35
in upcoming international environmental agreements such as the CBD’s post-2020 Global 36
Biodiversity Framework20. 37
Advances in remote sensing have recently facilitated the development of two fine-scale, 38
pantropical measures of rainforest quality6, which for the first time provide the capability to 39
quantify the importance of the last remaining native tropical rainforests of intact structural 40
condition and low human pressures in mitigating species extinction risk. The Structural 41
Condition Index (SCI), a globally consistent measure of forest structure, enables identification of 42
taller, older, more structurally complex, closed-canopy rainforests (hereafter “structurally intact 43
forests”)6. Structurally intact forests may deteriorate in quality with anthropogenic pressures such 44
as settlements, roads, fire, selective logging and hunting, and the adverse impacts of such 45
pressures on biodiversity may surpass those of deforestation alone5. To capture such pressures, 46
4
the Forest Structural Integrity Index (FSII)6 combines the SCI with the Human Footprint (HFP)21 47
to distinguish rainforests of intact structural condition and minimal human modification 48
(hereafter “high integrity forests”). 49
Here, we present the first assessment of the global importance of native high integrity forests 50
in mitigating species extinction risk, compared with structurally intact forests and forest cover 51
alone (i.e., without consideration of either structural condition or integrity). We use two IUCN 52
Red List of Threatened Species22 measures of extinction risk: (1) threatened status and (2) 53
declining population for 16,396 mammal, bird, reptile, and amphibian species whose geographic 54
ranges overlap the tropical rainforest biome23. We classified species as either rainforest endemic 55
or non-endemic on the basis of extent of range overlap with the tropical rainforest biome and 56
association with rainforest habitats15, expecting the potential effects of forest quality in 57
mitigating extinction risk would be stronger for endemic or rainforest dependent species than for 58
non-endemics. Within species ranges, we used the SCI and FSII datasets to calculate the area 59
(km2) of structurally intact and high integrity forests, relative to the area of structurally degraded 60
and low integrity forests. We also pooled all SCI values representing forest to calculate the total 61
area of forest cover within species ranges, relative to non-forest area. We then used a generalized 62
linear modeling framework that accounts for the phylogenetic non-independence of species24 to 63
test whether greater area of high integrity forests within species ranges is linked to a reduced 64
odds of species: (i) being threatened, and (ii) having a declining population, relative to greater 65
area of structurally intact forests and forest cover alone. Further, we test whether the potential 66
effects of forest quality in reducing the probability of species extinction risk are stronger when 67
small amounts of high quality forest remain within species ranges, as opposed to when large 68
extents are forested but of low quality. 69
5
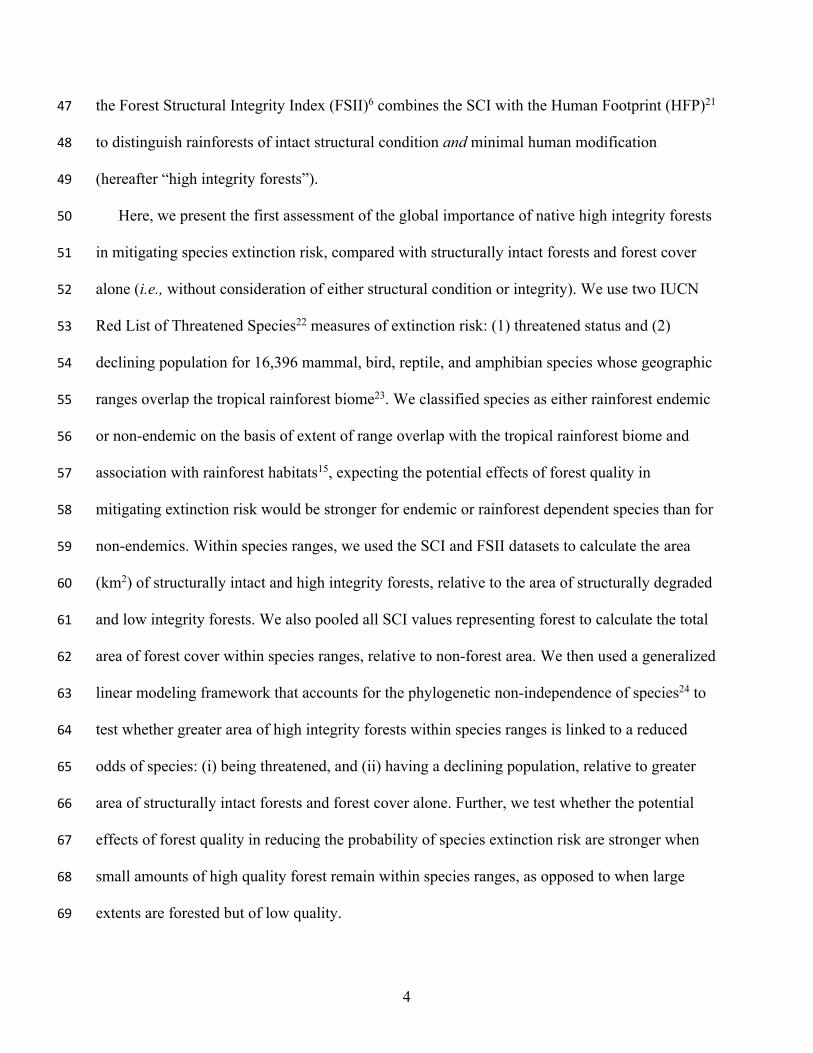
Across all endemic as well as non-endemic vertebrate groups, high integrity forests were 70
associated with significantly lower odds of extinction risk compared with forest cover alone (Fig. 71
1; 95% confidence intervals of estimated standardized coefficients did not overlap zero and false 72
discovery rate (FDR)-adjusted p < 0.05, Supplementary Table 2). For example, among endemic 73
mammals with average area of structurally intact forest and forest cover within their ranges, the 74
odds of being threatened reduced by 59.7% (95% CI: 51.8 – 67.0) for each 1% increase in high 75
integrity forest area. In contrast, among endemic mammals with average area of structurally 76
intact and high integrity forest within their ranges, each 1% increase in forest cover area was 77
associated with a 32.3% (0.0 – 76.8) increase in the odds of being threatened (Fig. 1: closed 78
circles). This greater likelihood of extinction risk with increasing forest cover may be surprising 79
given forest cover is known to have a positive effect on biodiversity19. However, the odds 80
reported here are derived from standardized partial regression coefficients representing unbiased 81
estimates of the effects of forest cover alone on species extinction risk, relative to structurally 82
intact and high integrity forests (i.e., controlling for the effects of the forest quality variables by 83
statistically holding them at their average values)25,26. Therefore, our results reflect how 84
structural degradation and human pressures within forest cover alone can be detrimental to 85
biodiversity, when isolated from and directly compared with high integrity forests. 86
We observed a general tendency for structurally intact forests to be associated with lower 87
odds of species extinction risk than forest cover alone. This pattern was stronger in some groups 88
(e.g., endemic and non-endemic birds being threatened and amphibians having a declining 89
population, Fig. 1) than others (e.g., non-endemic reptiles having a declining population). 90
However, structurally intact forests tended to be associated with higher odds of species 91
extinction risk than high integrity forests, with this pattern again being stronger in some groups 92
6
(e.g., endemic and non-endemic mammals, reptiles and amphibians being threatened, Fig. 1) than 93
others (e.g., endemic birds having a declining population). Inconsistent with our expectations, 94
the strength of the effects of high integrity forests in mitigating extinction risk was largely 95
similar for endemic and non-endemic vertebrates (95% CIs overlapped each other, Fig. 1). 96
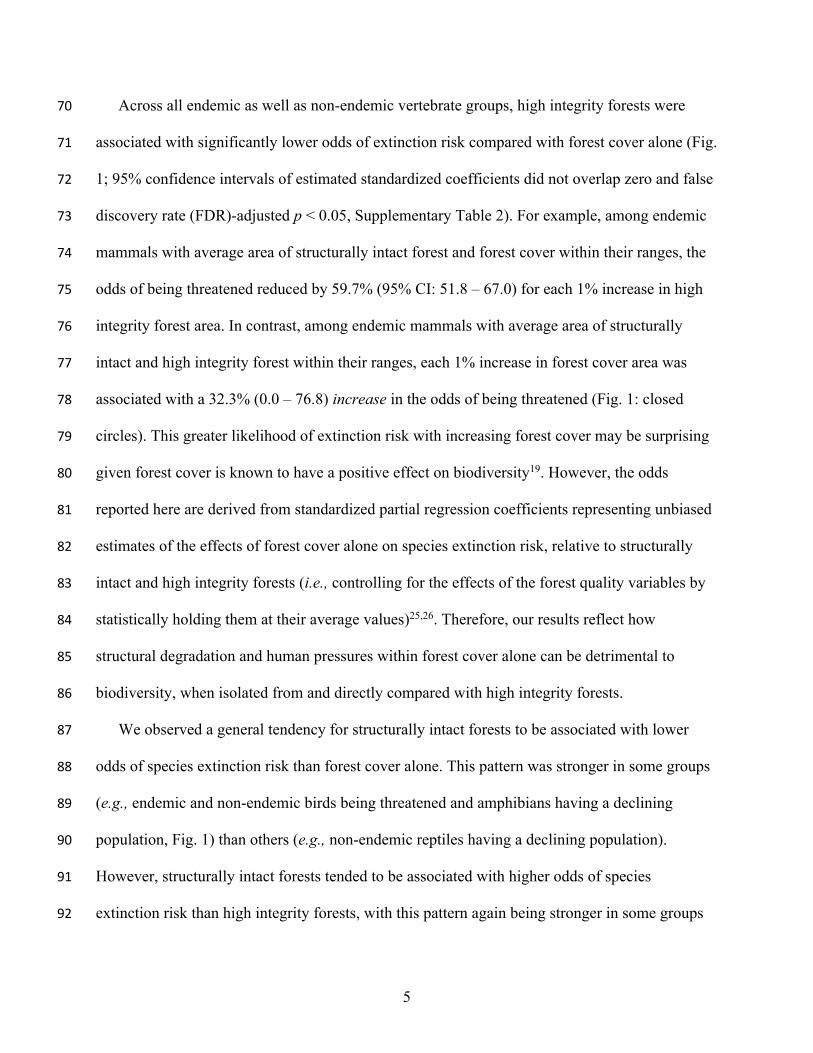
We found robust support for high integrity forest fragments playing a more important role in 97
mitigating species extinction risk than larger forested extents of low integrity. Endemic as well 98
as non-endemic vertebrates had a lower probability of being threatened and having a declining 99
population when small amounts of high integrity forest remained within species humid tropical 100
ranges, as opposed to when large extents were forested but of low integrity (Fig. 2). Evidence for 101
this finding is the strong positive statistical interaction (95% CIs did not overlap zero and FDR-102
adjusted p < 0.05) between forest cover and integrity in 10 out of 16 models testing for such 103
interactions on both response variables for each taxonomic group. A further four interactions 104
tended to be positive albeit statistically non-significant (95% CIs overlapped zero and FDR-105
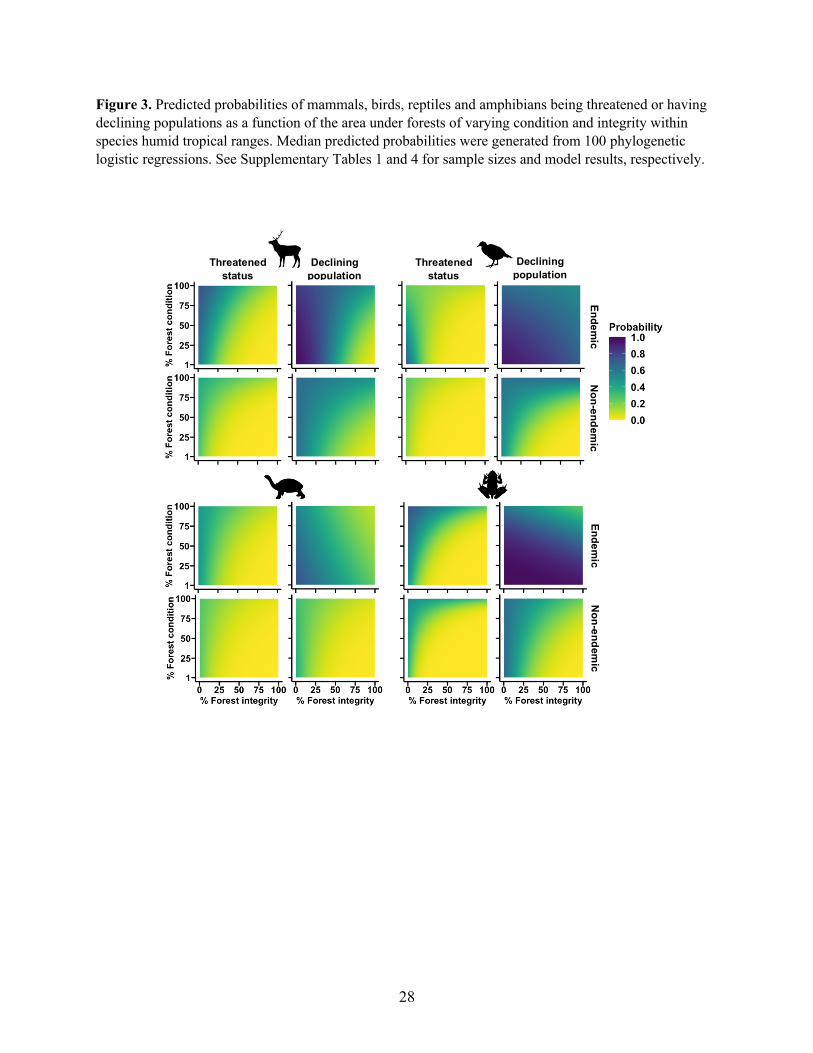
adjusted p > 0.05; Supplementary Table 3). Across all endemic and non-endemic vertebrate 106
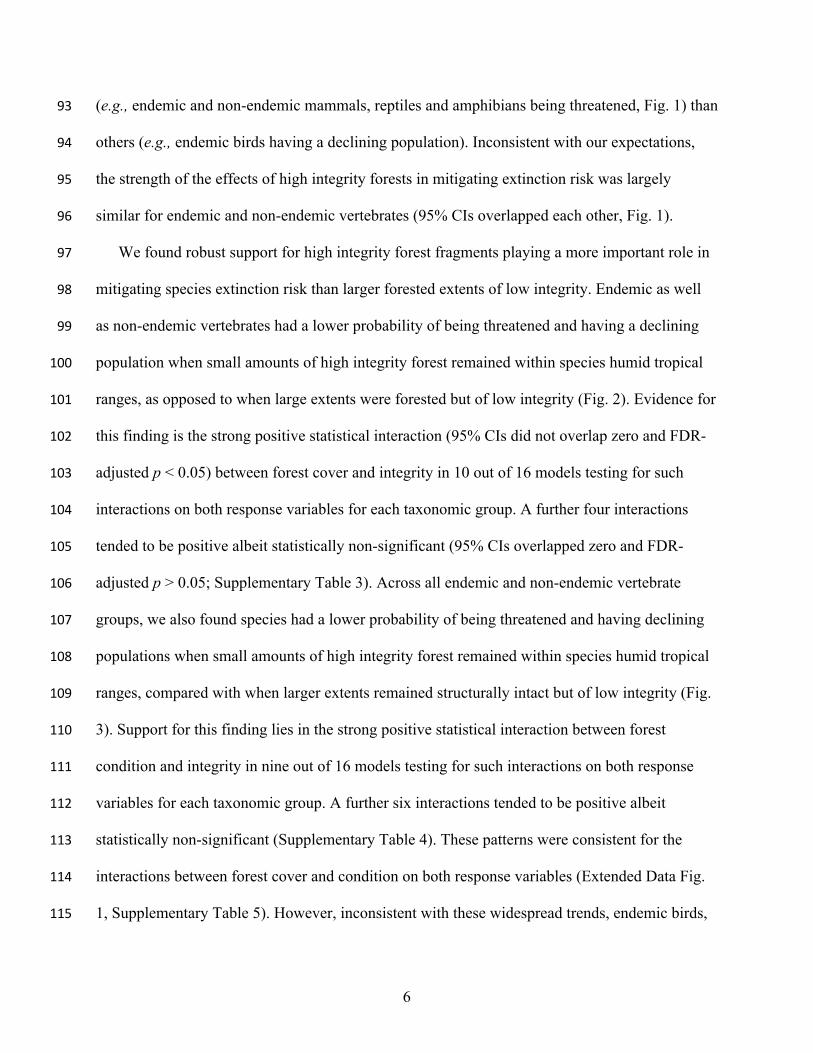
groups, we also found species had a lower probability of being threatened and having declining 107
populations when small amounts of high integrity forest remained within species humid tropical 108
ranges, compared with when larger extents remained structurally intact but of low integrity (Fig. 109
3). Support for this finding lies in the strong positive statistical interaction between forest 110
condition and integrity in nine out of 16 models testing for such interactions on both response 111
variables for each taxonomic group. A further six interactions tended to be positive albeit 112
statistically non-significant (Supplementary Table 4). These patterns were consistent for the 113
interactions between forest cover and condition on both response variables (Extended Data Fig. 114
1, Supplementary Table 5). However, inconsistent with these widespread trends, endemic birds, 115

7
reptiles and amphibians had a lower probability of having declining populations only when large 116
extents of high quality forest remained within species ranges (Figs. 2-3, Extended Data Fig. 1), 117
as supported by the negative interactions between forest cover, integrity and condition on 118
declining population probability in six out of 48 models (Supplementary Tables 3-5). 119
Reducing deforestation is a central pillar of global biodiversity conservation efforts1–4. Yet, 120
this attention on maintaining forest cover alone ignores the many human pressures that can 121
degrade the quality of forest cover in ways severely detrimental to biodiversity. Leveraging the 122
latest advances in remote sensing, we provide the first estimates of the importance of forest 123
quality, relative to forest cover, in mitigating extinction risk for humid tropical vertebrates 124
worldwide. Our analyses reveal the last remaining high integrity forests play a significant role in 125
reducing species extinction risk for all vertebrate groups, and serve as critical habitats not only 126
for species that occur exclusively in these ecosystems, but also for species that use them as 127
refugia or on a seasonal basis (e.g., wintering migratory birds15). Forest cover is known to have a 128
positive effect on biodiversity, relative to human land-uses such as agriculture and 129
development19. However, when compared with high integrity forests for the first time in this 130
study, forest cover was linked to a higher likelihood of species extinction risk, reflecting how 131
structural degradation and human pressures within forest cover alone can adversely affect 132
biodiversity. Furthermore, structurally intact forests tended to be associated with higher odds of 133
species extinction risk than high integrity forests, suggesting structural intactness alone can be 134
insufficient to prevent biodiversity loss without also limiting human pressures within intact 135
forests. 136
Large, well connected forest landscapes are known to be essential for biodiversity 137
conservation, especially in an era of climate change13,14,19. However, our research shows the 138

8
effects of forest quality in mitigating extinction risk for humid tropical vertebrates were 139
amplified when small amounts of high integrity forest remained within species ranges, compared 140
with when large extents were forested or remained structurally intact but were of low integrity. 141
Our findings add to the growing evidence that high integrity forest fragments can play a vital 142
supporting role in limiting biodiversity loss by providing refugia or habitat for numerous species, 143
and are thus worthy of inclusion in conservation planning7,27,28. Nevertheless, small forest 144
fragments face a higher likelihood of loss than larger forested tracts because of the severe land-145
use pressures around them and improved access for resource extraction29. Furthermore, 146
sensitivity to isolation in forest fragments may likely explain the higher probability of declining 147
populations even in high integrity forest fragments for endemic birds, reptiles and amphibians30, 148
potentially signaling the presence of an extinction debt for these vertebrate groups in fragmented 149
landscapes19. Therefore, proactively prioritising the protection of high integrity forest fragments 150
from loss, while simultaneously setting targets for restoring degraded forest fragments and re-151
establishing landscape connectivity is of paramount importance for limiting biodiversity loss27. 152
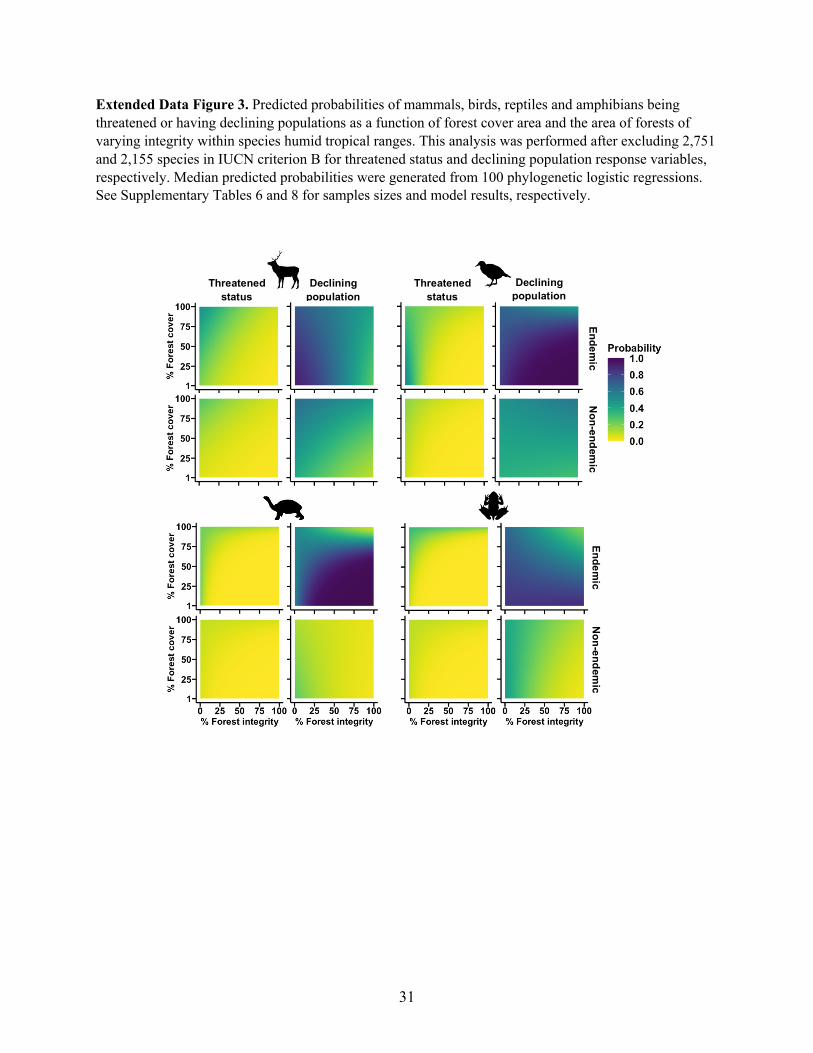
The positive role of high integrity forests in mitigating species extinction risk remained 153
evident even after excluding threatened vertebrates under criterion B of the IUCN Red List22 154
(Extended Data Fig. 2, Supplementary Tables 6-7). Species assessed under criterion B have 155
restricted geographic ranges, the habitats within which may be severely fragmented22. The 156
exclusion of criterion B species avoids potential circularity between comparative analyses of 157
extinction risk and the IUCN criteria used to assess extinction risk19. Our conclusions on the role 158
of high integrity forest fragments in playing a supporting role in biodiversity conservation also 159
remained largely robust to the exclusion of criterion B species (Extended Data Figs. 3-5). 160
However, the strength of the interactions between forest cover, integrity and condition 161

9
diminished and some coefficients reversed in sign from positive to negative (95% CIs 162
overlapped zero and FDR-adjusted p > 0.05 in 32 out of 48 models; Supplementary Tables 8-10). 163
These findings suggest high integrity forests may be particularly important for species that are 164
threatened because of restricted range area and forest fragmentation within these small ranges. 165
Human influence on the terrestrial biosphere is not limited to tropical rainforests but extends 166
over much of Earth’s land surface21. Therefore, future research needs to take advantage of global 167
forest integrity31 and ecosystem intactness32 datasets to comprehensively quantify the importance 168
of high integrity forest as well as non-forest ecosystems for biodiversity in all of the world’s 169
terrestrial biomes. Large-scale environmental perturbations such as climate change can interact 170
with the many human pressures impacting forest systems and their biodiversity33. However, 171
native high integrity forests are known to be more resilient to climate stressors than degraded 172
forests. Large, contiguous, high integrity forest landscapes also provide connectivity across 173
wide-ranging environmental gradients that can facilitate adaptive responses of species such as 174
disperal to track shifting climate13. Consequently, the importance of the last remaining high 175
integrity tropical rainforests for biodiversity conservation is likely to increase over time, given 176
forests that are already degraded will likely experience intensifying pressures exacerbated by 177
climate change34. 178
Tropical rainforests harbor the overwhelming majority of the world’s terrestrial 179
biodiversity15. However, these hyperdiverse ecosystems are also under overwhelming human 180
pressures worldwide16–18, such that the accelerating trends in their loss and degradation predict a 181
highly diminished and fragmented rainforest estate over the next few decades, depauperate in 182
much of the biodiversity extant today and with limited ecosystem services for humanity35. We 183
provide robust evidence of the global significance of native high integrity forests in mitigating 184

10
species extinction risk, emphasizing the necessity to ensure conservation strategies aim to 185
preserve and restore forest quality, as opposed to maintaining forest cover alone. A unique 186
opportunity to advance biodiversity conservation is at hand, given 86% of the last remaining 187
high integrity tropical rainforests remain unprotected7. Focusing conservation efforts on these 188
imperiled ecosystems through environmental policies and management actions geared at their 189
preservation will advance biodiversity conservation outcomes, particularly but not exclusively 190
for threatened and restricted range species7. 191
Our findings demonstrate a clear and urgent need for the targeted preservation of the last 192
remaining high integrity forest landscapes in tandem with strategies aimed at protecting, 193
restoring and reconnecting remnant forest fragments across the global humid tropics7,27,28,36,37. 194
On the basis of the evidence presented here, we argue the single most important policy action 195
nations can take to prevent catastrophic biodiversity loss in tropical rainforests is to commit to a 196
global target of “no net loss in area and integrity” of these endangered ecosystems38. Such 197
aggressive forest quality retention targets are urgently needed to ‘bend the curve’ on species loss 198
in the Anthropocene9,39, and ensure the CBD’s post-2020 Global Biodiversity Framework stands 199
a realistic chance “to put biodiversity on a path to recovery for the benefit of the planet and its 200
people” by 203020. 201
11
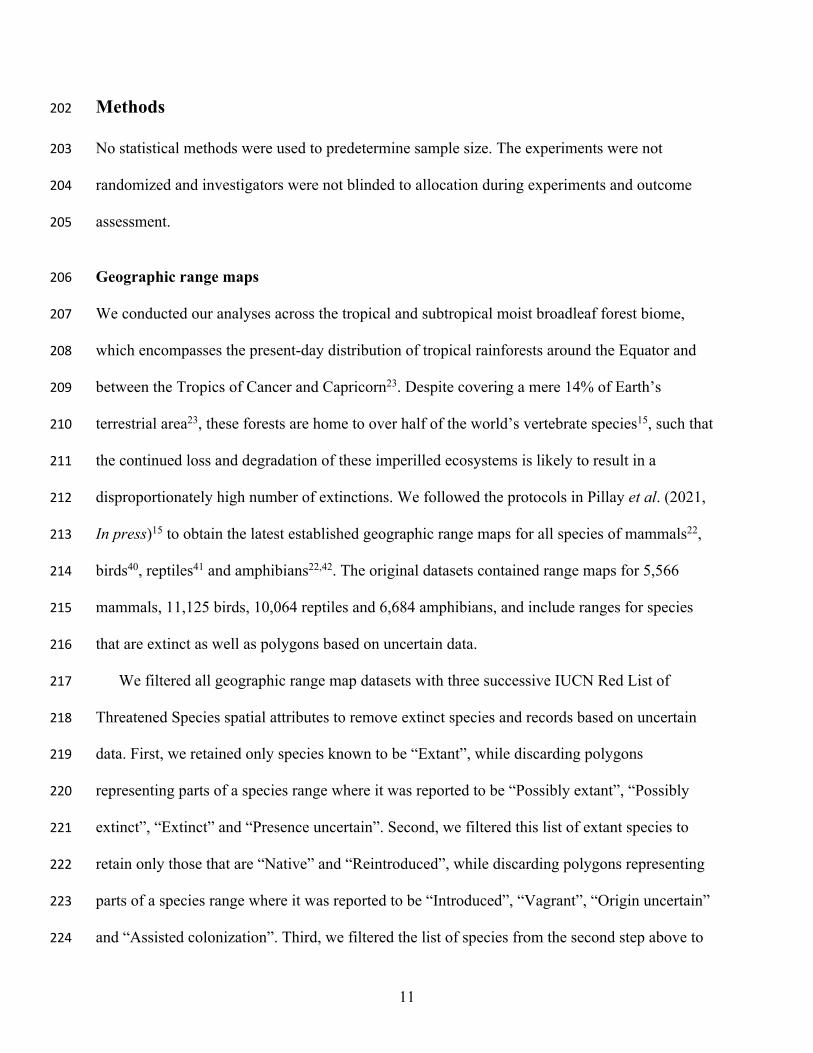
Methods 202
No statistical methods were used to predetermine sample size. The experiments were not 203
randomized and investigators were not blinded to allocation during experiments and outcome 204
assessment. 205
Geographic range maps 206
We conducted our analyses across the tropical and subtropical moist broadleaf forest biome, 207
which encompasses the present-day distribution of tropical rainforests around the Equator and 208
between the Tropics of Cancer and Capricorn23. Despite covering a mere 14% of Earth’s 209
terrestrial area23, these forests are home to over half of the world’s vertebrate species15, such that 210
the continued loss and degradation of these imperilled ecosystems is likely to result in a 211
disproportionately high number of extinctions. We followed the protocols in Pillay et al. (2021, 212
In press)15 to obtain the latest established geographic range maps for all species of mammals22, 213
birds40, reptiles41 and amphibians22,42. The original datasets contained range maps for 5,566 214
mammals, 11,125 birds, 10,064 reptiles and 6,684 amphibians, and include ranges for species 215
that are extinct as well as polygons based on uncertain data. 216
We filtered all geographic range map datasets with three successive IUCN Red List of 217
Threatened Species spatial attributes to remove extinct species and records based on uncertain 218
data. First, we retained only species known to be “Extant”, while discarding polygons 219
representing parts of a species range where it was reported to be “Possibly extant”, “Possibly 220
extinct”, “Extinct” and “Presence uncertain”. Second, we filtered this list of extant species to 221
retain only those that are “Native” and “Reintroduced”, while discarding polygons representing 222
parts of a species range where it was reported to be “Introduced”, “Vagrant”, “Origin uncertain” 223
and “Assisted colonization”. Third, we filtered the list of species from the second step above to 224

12
retain only “Resident” and “Non-breeding” parts of the range for mammals (the only ones 225
remaining for mammals after the first two filters above). For birds, we retained “Resident”, 226
“Breeding”, “Non-breeding” and “Passage” parts of the range, while discarding “Seasonal 227
occurrence uncertain”. For amphibians, we retained “Resident” parts of the range, which was the 228
only one remaining after the first two filters above. The final list of amphibians from the IUCN 229
Red List after this third filter included 6,607 species. However, this list of amphibians from the 230
IUCN do not comprise all known species. Therefore, we included range maps for 659 additional 231
amphibian species from González-del-Pliego et al. (2019)42, after cross-verification to omit 232
synonyms and extinct species. Because we obtained the reptile database from a source other than 233
the IUCN Red List 41, we were unable to perform the same suite of filters on reptiles. However, 234
our analyses showed that 10 species from this list are now regarded as extinct. Therefore, we 235
discarded these 10 species. After performing these filters, our list of species for subsequent 236
analyses included 5,529 mammals, 10,935 birds, 10,054 reptiles and 7,264 amphibians, for a 237
total of 33,782 species of extant terrestrial vertebrates worldwide. 238
We projected all geographic range maps to the World Mollweide projection prior to analyses, 239
and used Python code implemented with the ArcPy module in ArcGIS Pro 2.5.0 to perform a 240
union of the range map of each species with the map of the tropical rainforest biome. This 241
procedure allowed us to distinguish parts of the global range of species that overlap the tropical 242
rainforest biome, should there be such overlap for a given species. Thereafter, we used species-243
level attributes from the IUCN Red List of Threatened Species to obtain data on the major 244
habitats in which each species occurs to limit some forms of commission or false positive errors 245
that may occur with range maps. Specifically, these errors include species whose ranges may 246
overlap with the tropical rainforest biome but do not actually use the forests within that biome15. 247

13
For species having range overlap with the tropical rainforest biome, we retained only species 248
reported to occur in the tropical rainforest habitat types listed in the IUCN Habitats Classification 249
Scheme43. We merged this list of species reported to occur in tropical rainforest habitats with the 250
list of species whose ranges overlap the tropical rainforest biome to retain 3,327 mammals, 7,704 251
birds, 3,828 reptiles and 5,298 amphibians, for a total of 20,157 species with both range overlap 252
and habitat association with tropical rainforests15. We note that we discarded additional species 253
from this dataset on the basis of matching species names with those in the respective 254
phylogenetic trees (for the final list of species in this study, see Statistical analyses). 255
Definiton of tropical rainforest endemic species 256
We defined endemism to tropical rainforests on the basis of the criteria established by Pillay et 257
al. (2021, In press)15. We considered a species to be endemic if (1) 80-100% of its global range 258
overlapped with the tropical rainforest biome, and (2) it was near-exclusively reported from the 259
tropical rainforest habitat types listed in the IUCN Habitats Classification Scheme43. We did not 260
exclude wetlands, rocky and cave habitats from this second criterion, making the reasonable 261
assumption that for species with > 80% range overlap with the tropical rainforest biome and 262
nearly exclusively associated with rainforest habitats, these three other habitat types are likely to 263
be within tropical rainforests (e.g. bats that roost in caves within rainforest habitats). 264
Tropical rainforest structural condition and integrity indices and forest cover 265
We used two indices of tropical rainforest quality in our analyses – the Structural Condition 266
Index (SCI) and the Forest Structural Integrity Index (FSII)6,7. The SCI is a 30 m resolution 267
raster dataset that identifies locations of taller, older, more structurally complex, closed-canopy 268
rainforests across the humid tropics. It is derived from canopy cover, canopy height and time 269

14
since forest loss, and quantifies canopy stature, cover and disturbance history. The reference year 270
is 2013, with canopy cover from 2010, forest loss expressed as year of loss before 2018 and 271
canopy height for 2012. The SCI ranges from 1 to 18, with the lowest value delineating stands < 272
5 m tall, disturbed since 2012 or with canopy cover < 25%. The highest value represents tall, 273
closed-canopy stands undisturbed since 2000. The FSII is derived by overlaying the Human 274
Footprint (HFP), a 1 km resolution measure of the cumulative, in-situ pressures humans exert on 275
natural areas across terrestrial Earth21, on the SCI. The original 1993 HFP44 was updated to 276
200945, and more recently to 201321. The FSII ranges from 0.1 to 18 with the higher values 277
representing rainforests high in structural complexity and low in human pressure. For complete 278
details on the SCI and FSII indices, see Hansen et al. 20196, 20207. 279
As with the range maps, we projected the SCI and FSII rasters to the World Mollweide 280
projection prior to analyses. Given the differing resolutions of the SCI and FSII rasters, (30 m 281
and 1 km, respectively), we first made them comparable by resampling both to 1 km resolution 282
using bilinear interpolation in ArcGIS 10.7. After resampling, the SCI raster comprised 1 km 283
resolution pixels of values ranging from 1 to 18. We also converted the continuous pixel values 284
of the FSII dataset to the nearest integer, such that the resampled FSII raster comprised 1 km 285
resolution pixels of values ranging from 0 to 18. A relatively fine analytical resolution such as 286
used here facilitates the efficient identification of forest cover and structurally intact and high 287
integrity forests within species ranges and is recommended when the objective is to distinguish 288
the effects of such broad habitat categories on biodiversity46. 289
We then used Python code implemented with the ArcPy module in ArcGIS Pro 2.5.0 to 290
calculate the area (km2) of each of the 18 pixel values of the SCI and 19 pixel values of the FSII 291
rasters within the humid tropical range of each species. Following the criteria established by 292

15
Hansen et al. 20207, we pooled and categorized the area of SCI values ranging from 2 to 5 (> 293
25% canopy cover and > 5 m canopy height) as low SCI or structurally degraded forest, and the 294
area of SCI values ranging from 14 to 18 (> 75% canopy cover and > 15 m canopy height) as 295
high SCI or structurally intact forest. We note some secondary and selectively logged forests 296
have structural attributes similar to this high SCI class. When validating the SCI dataset, it was 297
observed ~20% of older secondary forests were within the high SCI class6. Older secondary 298
forests may not have all the structural intactness characteristics associated with forests that have 299
never undergone anthropogenic degradation. However, current remote sensing capabilities do not 300
allow discriminating these older secondary forests from unlogged native forests. Overall, the 301
high SCI forests in our data are largely representative of structurally intact native forests typical 302
of the humid tropics7. We followed a similar procedure to pool and categorize the area of FSII 303
values ranging from 1 to 5 as low FSII or low integrity forest and the area of FSII values ranging 304
from 14 to 18 as high FSII or high integrity forest. These high integrity forests represent 305
rainforests of not only intact structural condition but also low human pressures, specifically HFP 306
values ≤ 47. 307
Predictor variables 308
We calculated the relative difference between the area under high and low SCI forest within the 309
humid tropical range of a species as: !"#!!"#!%&'$!"#!()*%&'
!"#!!+,"-./)0"12(3)/45.1)64/. Similarly, we calculated the 310
relative difference between the area under high and low FSII forest within the humid tropical 311
range of a species as: !"#!!"#!7%''$!"#!()*7%''
!"#!!+,"-./)0"12(3)/45.1)64/. These calculated values range between -1 and + 312
1 and represent the relative percentage difference between the area under high and low SCI and 313
FSII forests within the humid tropical range of a species. Therefore, a value of -1 signifies 100% 314
16
of the humid tropical range of a species is encompassed by low SCI or low FSII forest, whereas a 315
value of + 1 means 100% of the humid tropical range of a species is covered in high SCI or high 316
FSII forest. 317
We also calculated the relative difference between the area of forest and non-forest cover 318
within the humid tropical range of a species as: !"#!3)/45.$!"#!8)893)/45.
!"#!!+,"-./)0"12(/28#4. We used the lowest SCI 319
value of 1 to identify stands < 5 m tall, disturbed since 2012 or with canopy cover < 25%, which 320
are considered highly disturbed, and categorized the area under this pixel value as non-forest7. 321
We pooled and categorized the remaining SCI values from 2 to 18 as forest. Similar to the SCI 322
and FSII relative difference values, these calculated values of forest cover also range between -1 323
(signifying 100% of the humid tropical range of a species consists of non-forest) and + 1 324
(signifying 100% of the humid tropical range of a species is forested). We thereby brought all 325
forest cover, condition and integrity data (the predictor variables in this study) to a consistent 326
scale for further analyses. 327
Statistical analyses 328
The response variables in this study are binary – threatened/non-threatened and declining 329
population/not declining in population. To achieve this binary classification, we defined species 330
in the IUCN Critically Endangered, Endangered and Vulnerable categories as threatened and 331
species in the Near Threatened and Least Concern categories as non-threatened, while discarding 332
species in the Data deficient category. With respect to the IUCN population trend data, we 333
defined species in the Decreasing category as declining in population and species in the 334
Increasing and Stable categories as not declining in population, while discarding species in the 335
Unknown category19. 336
17
We used a generalized linear modeling framework, specifically logistic regression, for 337
statistical inference. Our primary units of analyses – species – cannot be considered as 338
independent because of the variable degree of evolutionary relatedness between the species in 339
each taxonomic group. To account for the potential effect of evolutionary dependence, we first 340
obtained phylogenetic trees for mammals47, birds48, reptiles49 and amphibians50, and matched the 341
species lists from the previous steps to discard species not in the respective phylogenetic trees. 342
Our list of species after this step comprised 3,217 mammals, 6,674 birds, 3,735 reptiles and 343
5,069 amphibians, for a total of 18,695 species of vertebrates. We further discarded 2,299 Data 344
deficient species for a final total of 16,396 species in the analyses of threatened status. We also 345
discarded 5,842 species of Unknown population trend for a final total of 12,853 species in the 346
analyses of declining population (Supplementary Table 1). For each taxonomic group, we 347
partitioned species into rainforest endemic and non-endemic groups. Next, we randomly sampled 348
100 trees out of 10,000 available full phylogenetic trees for each taxonomic group, as 349
recommended by Jetz et al. (2012)48, to construct covariance matrices enumerating the 350
proportion of the evolutionary path shared between each pair of species. We used these 351
covariance matrices in phylogenetic logistic regression models to generate inferences corrected 352
for phylogenetic signal24. 353
We parameterized identical models for endemic and non-endemic species in each taxonomic 354
group to test whether greater area of high integrity forests within species ranges is linked to a 355
reduced odds of species: (i) being threatened, and (ii) having a declining population, relative to 356
greater area of structurally intact forests and forest cover alone. Prior to analyses, we 357
standardized each predictor variable (forest cover, condition and integrity) to have a mean of 0 358
and a standard deviation of 1 (z-transformation). We tested for the effects of the three predictor 359

18
variables on the respective response variable (threatened status or declining population) by 360
parameterizing them as additive effects in multiple phylogenetic logistic regression models, and 361
used the standardized partial coefficient of each predictor variable as a measure of its effect on 362
the response variable19,25. In this form of multiple logistic regression, the exponentiated 363
standardized partial coefficient of a given predictor variable represents the odds of a 1-unit 364
increase in that variable on the response, controlling for the effects of the other predictor 365
variables by statistically holding them at their average values25. Given the highly correlated 366
nature of the three predictor variables, standardized partial regression coefficients provide 367
unbiased estimates of the relative importance of forest cover, condition and integrity forest on 368
the odds of species being threatened or having a declining population26. We estimated 95% 369
confidence intervals for the estimated standardized coefficients in each regression with 2,000 370
parametric bootstraps as recommended by Ives and Garland (2010)24, and made inferences based 371
on the median of 100 regressions, each regression being performed with one phylogenetic tree 372
randomly drawn from 10,000 available trees48. Further, we tested for interactions between forest 373
cover and integrity, forest condition and integrity, and forest cover and condition by 374
incorporating two-way interactions between each of the above pairs of predictor variables in 375
phylogenetic logistic regression models. Interaction models were otherwise parameterized in an 376
identical manner to the additive models above. 377
We implemented phylogenetic logistic regression analyses via the package phylolm51 in the 378
R (v. 4.0.3) statistical programming language52. To limit bias in maximum likelihood estimates 379
of logistic regression coefficients, we used the maximum penalized likelihood method with 380
Firth’s correction implemented in the phyloglm function via the parameter “logistic_MPLE”24,51. 381
We conducted our analyses across thousands of species with three predictor variables in the case 382

19
of additive models and two predictor variables for interaction models, which risks inflating type 383
1 error rate. Therefore, we used a FDR procedure (graphically sharpened method53) which 384
corrects for multiple comparisons in comparative extinction risk modeling. We calculated FDR-385
adjusted p-values with the p.adjust function in R54. 386
Influence of phylogenetic correlation 387
In phylogenetic logistic regression, the parameter α measures the strength of the phylogenetic 388
correlation. When α = 1, evolution is approximately by Brownian motion on a given phylogeny, 389
with α > 1indicating lower phylogenetic correlations among species24. In most cases across all 390
taxonomic groups and models, the estimated phylogenetic signal α was close to zero 391
(Supplementary Tables 11-12), suggesting the predictor variables included in the models induced 392
phylogenetic signal in the residuals. 393
Data availability 394
All datasets used in this paper are openly available via the citations identified in the Methods. 395
Code availability 396
Custom Python and R code used for geospatial and statistical analyses will be uploaded to 397
GitHub/Zenodo upon acceptance. 398
References 399
1. COP 11 Decision X/2. Strategic Plan for Biodiversity 2011-2020. (Convention on 400
Biological Diversity, 2010). 401
2. New York Declaration on Forests. (United Nations Climate Summit, 2014). 402
3. Transforming Our World: The 2030 Agenda For Sustainable Development. A/RES/70/1 403

20
Resolution adopted by the United Nations General Assembly. (United Nations, 2015). 404
4. Adoption of the Paris Agreement. Proposal by the President. Draft Decision -/CP.21. 405
(UNFCCC, 2015). 406
5. Barlow, J. et al. Anthropogenic disturbance in tropical forests can double biodiversity loss 407
from deforestation. Nature 535, 144–147 (2016). 408
6. Hansen, A. et al. Global humid tropics forest structural condition and forest structural 409
integrity maps. Sci. Data 6, 232 (2019). 410
7. Hansen, A. J. et al. A policy-driven framework for conserving the best of Earth’s 411
remaining moist tropical forests. Nat. Ecol. Evol. 4, 1377–1384 (2020). 412
8. Tittensor, D. P. et al. A mid-term analysis of progress toward international biodiversity 413
targets. Science 346, 241–245 (2014). 414
9. Leclère, D. et al. Bending the curve of terrestrial biodiversity needs an integrated strategy. 415
Nature 585, 551–556 (2020). 416
10. Cardinale, B. J. et al. Biodiversity loss and its impact on humanity. Nature 486, 59–67 417
(2012). 418
11. Isbell, F. et al. Linking the influence and dependence of people on biodiversity across 419
scales. Nature 546, 65–72 (2017). 420
12. Gibson, L. et al. Primary forests are irreplaceable for sustaining tropical biodiversity. 421
Nature 478, 378–381 (2011). 422
13. Watson, J. E. M. et al. The exceptional value of intact forest ecosystems. Nat. Ecol. Evol. 423
2, 599–610 (2018). 424
14. Di Marco, M., Ferrier, S., Harwood, T. D., Hoskins, A. J. & Watson, J. E. M. Wilderness 425
areas halve the extinction risk of terrestrial biodiversity. Nature 573, 582–585 (2019). 426

21
15. Pillay, R. et al. Tropical forests are home to over half of the world’s vertebrate species. 427
Front. Ecol. Environ. (In press 2021, Accepted Oct 2020). 428
16. Turubanova, S., Potapov, P. V, Tyukavina, A. & Hansen, M. C. Ongoing primary forest 429
loss in Brazil, Democratic Republic of the Congo, and Indonesia. Environ. Res. Lett. 13, 430
074028 (2018). 431
17. Lovejoy, T. E. & Nobre, C. Amazon tipping point. Sci. Adv. 4, eaat2340 (2018). 432
18. Matricardi, E. A. T. et al. Long-term forest degradation surpasses deforestation in the 433
Brazilian Amazon. Science 369, 1378–1382 (2020). 434
19. Betts, M. G. et al. Global forest loss disproportionately erodes biodiversity in intact 435
landscapes. Nature 547, 441–444 (2017). 436
20. Update of the Zero Draft of the Post-2020 Global Biodiversity Framework. (Secretariat of 437
the Convention on Biological Diversity, 2020). 438
21. Williams, B. A. et al. Change in terrestrial human footprint drives continued loss of intact 439
ecosystems. One Earth 3, 371–382 (2020). 440
22. The IUCN Red List of Threatened Species. Version 2020-1. (IUCN, 2020). Available at: 441
https://www.iucnredlist.org. 442
23. Dinerstein, E. et al. An ecoregion-based approach to protecting half the terrestrial realm. 443
Bioscience 67, 534–545 (2017). 444
24. Ives, A. R. & Garland, T. Phylogenetic logistic regression for binary dependent variables. 445
Syst. Biol. 59, 9–26 (2010). 446
25. Agresti, A. Categorical Data Analysis. (John Wiley and Sons, 2002). 447
26. Smith, A. C., Koper, N., Francis, C. M. & Fahrig, L. Confronting collinearity: comparing 448
methods for disentangling the effects of habitat loss and fragmentation. Landsc. Ecol. 24, 449

22
1271–1285 (2009). 450
27. Wintle, B. A. et al. Global synthesis of conservation studies reveals the importance of 451
small habitat patches for biodiversity. Proc. Natl. Acad. Sci. 116, 909–914 (2019). 452
28. Tulloch, A. I. T., Barnes, M. D., Ringma, J., Fuller, R. A. & Watson, J. E. M. 453
Understanding the importance of small patches of habitat for conservation. J. Appl. Ecol. 454
53, 418–429 (2016). 455
29. Hansen, M. C. et al. The fate of tropical forest fragments. Sci. Adv. 6, eaax8574 (2020). 456
30. Prugh, L. R., Hodges, K. E., Sinclair, A. R. E. & Brashares, J. S. Effect of habitat area and 457
isolation on fragmented animal populations. Proc. Natl. Acad. Sci. 105, 20770–20775 458
(2008). 459
31. Grantham, H. S. et al. Anthropogenic modification of forests means only 40% of 460
remaining forests have high ecosystem integrity. Nat. Commun. 11, 5978 (2020). 461
32. Beyer, H. L., Venter, O., Grantham, H. S. & Watson, J. E. M. Substantial losses in 462
ecoregion intactness highlight urgency of globally coordinated action. Conserv. Lett. 13, 463
e12692 (2020). 464
33. Cote, I. M., Darling, E. S. & Brown, C. J. Interactions among ecosystem stressors and 465
their importance in conservation. Proc. R. Soc. B Biol. Sci. 283, 20152592 (2016). 466
34. Anderegg, W. R. L. et al. Climate-driven risks to the climate mitigation potential of 467
forests. Science 368, eaaz7005 (2020). 468
35. Edwards, D. P. et al. Conservation of tropical forests in the Anthropocene. Curr. Biol. 29, 469
R1008–R1020 (2019). 470
36. Maxwell, S. L. et al. Area-based conservation in the twenty-first century. Nature 586, 471
217–227 (2020). 472
23
37. Jantz, P., Goetz, S. & Laporte, N. Carbon stock corridors to mitigate climate change and 473
promote biodiversity in the tropics. Nat. Clim. Chang. 4, 138–142 (2014). 474
38. Díaz, S. et al. Set ambitious goals for biodiversity and sustainability. Science 370, 411–475
413 (2020). 476
39. Maron, M., Simmonds, J. S. & Watson, J. E. M. Bold nature retention targets are essential 477
for the global environment agenda. Nat. Ecol. Evol. 2, 1194–1195 (2018). 478
40. Bird species distribution maps of the world. Version 2018.1. BirdLife International and 479
Handbook of the Birds of the World (BirdLife International, 2018). 480
41. Roll, U. et al. The global distribution of tetrapods reveals a need for targeted reptile 481
conservation. Nat. Ecol. Evol. 1, 1677–1682 (2017). 482
42. González-del-Pliego, P. et al. Phylogenetic and trait-based prediction of extinction risk for 483
data-deficient amphibians. Curr. Biol. 29, 1557–1563 (2019). 484
43. IUCN Habitats Classification Scheme Version 3.1. (IUCN, 2012). 485
44. Sanderson, E. W. et al. The human footprint and the last of the wild. Bioscience 52, 891–486
904 (2002). 487
45. Venter, O. et al. Sixteen years of change in the global terrestrial human footprint and 488
implications for biodiversity conservation. Nat. Commun. 7, 12558 (2016). 489
46. Di Marco, M., Watson, J. E. M., Possingham, H. P. & Venter, O. Limitations and trade-490
offs in the use of species distribution maps for protected area planning. J. Appl. Ecol. 54, 491
402–411 (2017). 492
47. Upham, N. S., Esselstyn, J. A. & Jetz, W. Inferring the mammal tree: species-level sets of 493
phylogenies for questions in ecology, evolution, and conservation. PLoS Biol. 17, 494
e3000494 (2019). 495

24
48. Jetz, W., Thomas, G. H., Joy, J. B., Hartmann, K. & Mooers, A. O. The global diversity of 496
birds in space and time. Nature 491, 444–448 (2012). 497
49. Tonini, J. F. R., Beard, K. H., Ferreira, R. B., Jetz, W. & Pyron, R. A. Fully-sampled 498
phylogenies of squamates reveal evolutionary patterns in threat status. Biol. Conserv. 204, 499
23–31 (2016). 500
50. Jetz, W. & Pyron, R. A. The interplay of past diversification and evolutionary isolation 501
with present imperilment across the amphibian tree of life. Nat. Ecol. Evol. 2, 850–858 502
(2018). 503
51. Ho, L. S. T. & Ané, C. A linear-time algorithm for Gaussian and non-Gaussian trait 504
evolution models. Syst. Biol. 63, 397–408 (2014). 505
52. R Development Core Team. R: A language and environment for statistical computing. 506
(2020). 507
53. Verhoeven, K. J. F., Simonsen, K. L. & McIntyre, L. M. Implementing false discovery 508
rate control: increasing your power. Oikos 108, 643–647 (2005). 509
54. Benjamini, Y. & Hochberg, Y. Controlling the false discovery rate: a practical and 510
powerful approach to multiple testing. J. R. Stat. Soc. B 57, 289–300 (1995). 511
Acknowledgements 512
This work was funded by the NASA Biodiversity and Ecological Forecasting Program under the 513
2016 ECO4CAST solicitation through grant NNX17AG51G, the NASA Global Ecosystem 514
Dynamics Investigation (NNL15AA03 to S.J.G.), and the NASA GEO solicitation 515
(80NSSC18K0338 to P.J.). 516

25
Author contributions 517
R.P. conceived the original idea for this study with major inputs from O.V., J.E.M.W., and 518
A.J.H.; J.A.O. and R.P. developed the Python code for geospatial analyses; P.G.D.P. provided 519
amphibian range maps not available in the IUCN Red List; R.P. performed all geospatial and 520
statistical analyses and wrote the manuscript; O.V., J.E.M.W., A.J.H., S.J.G., P.J., P.B., C.S., 521
D.A., B.A.W., P.G.D.P., J.A.O., S.C.A., J.E., and A.L.S.V. provided critical editorial inputs on 522
manuscript drafts. 523
Additional information 524
Supplementary information is available for this paper and is appended below for peer-review. 525

26
Figure 1. Effects of forest cover, structural condition and integrity on the threatened status and declining
population trend of tropical rainforest mammals, birds, reptiles and amphibians. Point estimates represent
median standardized odds of species being threatened (circles) or having a declining population (squares)
generated by exponentiating standardized coefficients (log odds) of 100 phylogenetic logistic regressions
to obtain standardized odds ratios, and thereafter converting to percentage odds to aid interpretation. Each
regression was performed with one phylogenetic tree randomly drawn from 10,000 available trees for
each taxonomic group, and separate models were parameterized for rainforest endemic and non-endemic
species for each response variable. Error bars represent median 95% confidence intervals generated with
2,000 parametric bootstraps in each regression. See Supplementary Tables 1-2 for sample sizes and model
results, respectively.
Lower
extinction risk
Higher
extinction risk
27
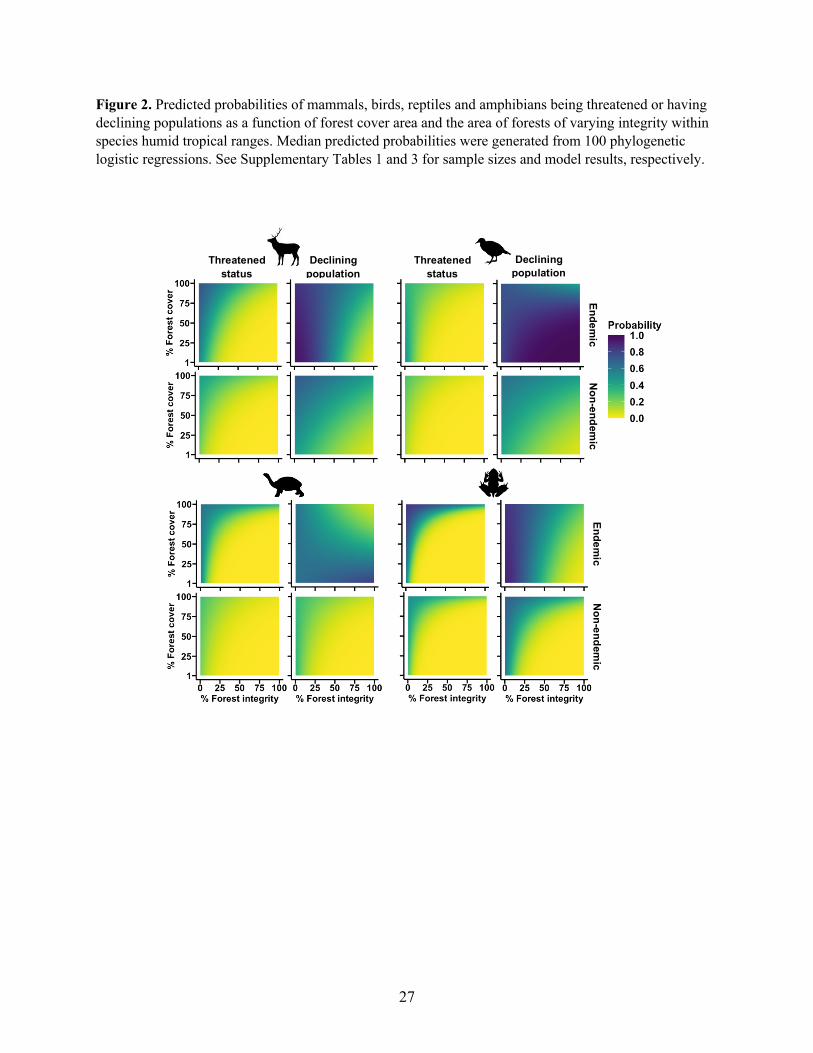
Figure 2. Predicted probabilities of mammals, birds, reptiles and amphibians being threatened or having
declining populations as a function of forest cover area and the area of forests of varying integrity within
species humid tropical ranges. Median predicted probabilities were generated from 100 phylogenetic
logistic regressions. See Supplementary Tables 1 and 3 for sample sizes and model results, respectively.
Threatened
status
Declining
population
Threatened
status
Declining
population
En
de
mic
N
on
-en
dem
ic
En
de
mic
N
on
-en
dem
ic
28
Figure 3. Predicted probabilities of mammals, birds, reptiles and amphibians being threatened or having
declining populations as a function of the area under forests of varying condition and integrity within
species humid tropical ranges. Median predicted probabilities were generated from 100 phylogenetic
logistic regressions. See Supplementary Tables 1 and 4 for sample sizes and model results, respectively.
Threatened
status
Declining
population
Threatened
status
Declining
population
En
de
mic
N
on
-en
dem
ic
En
de
mic
N
on
-en
dem
ic

29
Extended Data Figure 1. Predicted probabilities of mammals, birds, reptiles and amphibians being
threatened or having declining populations as a function of forest cover area and the area of forests of
varying condition within species humid tropical ranges. Median predicted probabilities were generated
from 100 phylogenetic logistic regressions. See Supplementary Tables 1 and 5 for sample sizes and model
results, respectively.
Threatened
status
Declining
population
Threatened
status
Declining
population
En
de
mic
N
on
-en
dem
ic
En
de
mic
N
on
-en
dem
ic

30
Extended Data Figure 2. Effects of forest cover, structural condition and integrity on the threatened
status and declining population trend of tropical rainforest mammals, birds, reptiles and amphibians after
excluding 2,751 and 2,155 species in IUCN criterion B for threatened status and declining population
response variables, respectively. Point estimates represent median standardized odds of species being
threatened (circles) or having a declining population (squares) generated by exponentiating standardized
coefficients (log odds) of 100 phylogenetic logistic regressions to obtain standardized odds ratios, and
thereafter converting to percentage odds to aid interpretation. Each regression was performed with one
phylogenetic tree randomly drawn from 10,000 available trees for each taxonomic group, and separate
models were parameterized for rainforest endemic and non-endemic species for each response variable.
Error bars represent median 95% confidence intervals generated with 2,000 parametric bootstraps in each
regression. See Supplementary Tables 6-7 for sample sizes and model results, respectively.
Lower
extinction risk
Higher
extinction risk
31
Extended Data Figure 3. Predicted probabilities of mammals, birds, reptiles and amphibians being
threatened or having declining populations as a function of forest cover area and the area of forests of
varying integrity within species humid tropical ranges. This analysis was performed after excluding 2,751
and 2,155 species in IUCN criterion B for threatened status and declining population response variables,
respectively. Median predicted probabilities were generated from 100 phylogenetic logistic regressions.
See Supplementary Tables 6 and 8 for samples sizes and model results, respectively.
Threatened
status
Declining
population
Threatened
status
Declining
population
En
de
mic
N
on
-en
dem
ic
En
de
mic
N
on
-en
dem
ic

32
Extended Data Figure 4. Predicted probabilities of mammals, birds, reptiles and amphibians being
threatened and having declining populations as a function of the area of forests of varying condition and
integrity within species humid tropical ranges. This analysis was performed after excluding 2,751 and
2,155 species in IUCN criterion B for threatened status and declining population response variables,
respectively. Median predicted probabilities were generated from 100 phylogenetic logistic regressions.
See Supplementary Tables 6 and 9 for sample sizes and model results, respectively.
Threatened
status
Declining
population
Threatened
status
Declining
population
En
de
mic
N
on
-en
dem
ic
En
de
mic
N
on
-en
dem
ic

33
Extended Data Figure 5. Predicted probabilities of mammals, birds, reptiles and amphibians being
threatened and having declining populations as a function of forest cover area and the area of forests of
varying condition within species humid tropical ranges. This analysis was performed after excluding
2,751 and 2,155 species in IUCN criterion B for threatened status and declining population response
variables, respectively. Median predicted probabilities were generated from 100 phylogenetic logistic
regressions. See Supplementary Tables 6 and 10 for sample sizes and model results, respectively.
Threatened
status
Declining
population
Threatened
status
Declining
population
En
de
mic
N
on
-en
dem
ic
En
de
mic
N
on
-en
dem
ic

34
Supplementary Table 1. Sample sizes in terms of the number of rainforest endemic and non-endemic
species included in analyses for threatened status and declining population. There were a total of 18,695
species after geospatial analyses and matching species names in the IUCN Red List with those in the
respective phylogenetic trees. Of these species, we discarded Data deficient and Unknown population
trend categories for a final total of 16,396 species in the analyses of threatened status and 12,853 species
in the analyses of declining population. We classified species in the IUCN Critically Endangered,
Endangered and Vulnerable categories as threatened and species in Near Threatened and Least Concern
categories as non-threatened. With respect to the IUCN population trend data, we classified species in the
Decreasing category as declining in population and species in the Increasing and Stable categories as not
declining in population. See Methods for details.
habitat response variable mammals birds reptiles amphibians total
endemic 971 1,588 1,307 2,586 6,452
non-endemic 2,246 5,086 2,428 2,483 12,243
total 3,217 6,674 3,735 5,069 18,695
endemic threatened status 743 1,576 988 1,951 5,258
declining population 513 1,522 397 1,676 4,108
non-endemic threatened status 2,035 5,076 2,215 1,812 11,138
declining population 1,338 4,725 1,240 1,442 8,745
total threatened status 2,778 6,652 3,203 3,763 16,396
declining population 1,851 6,247 1,637 3,118 12,853

Supplementary Table 2. Results of multiple phylogenetic logistic regression models contrasting the
effects of forest cover, structural condition and integrity on the threatened status and declining population
trend of humid tropical (a) mammals, (b) birds, (c) reptiles and (d) amphibians worldwide. Estimates
represent median standardized coefficients (log odds) from 100 phylogenetic logistic regressions. The
95% confidence intervals of estimated coefficients were generated with 2,000 parametric bootstraps in
each regression. Adj. p-value represents the False Discovery Rate (FDR)-adjusted p-value. We fit
identical models separately for endemic and non-endemic species within each taxonomic group.
Standardized coefficients generated by the models were exponentiated to obtain standardized odds ratios,
and further converted to percentage odds using the formula [e(b) – 1] ´ 100 (Fig. 1).
response
variable
predictor
variables
habitat
preference estimate 95% C.I. p-value adj. p-value
a. Mammals
thre
ate
ned
sta
tus
intercept
endemic
0.07 -0.28 – 0.41 0.62 1.00
cover 0.28 0.00 – 0.57 0.08 0.11
condition -0.10 -0.40 – 0.17 0.51 0.74
integrity -0.91 -1.11 – -0.73 < 0.001 < 0.001
intercept
non-endemic
-1.25 -1.45 – -1.07 < 0.001 < 0.001
cover 0.62 0.47 – 0.78 < 0.001 < 0.001
condition -0.35 -0.54 – -0.16 < 0.001 < 0.001
integrity -0.57 -0.73 – -0.42 < 0.001 < 0.001
dec
lin
ing p
op
ula
tion
intercept
endemic
1.48 0.81 – 1.98 < 0.001 < 0.001
cover -0.02 -0.53 – 0.50 0.88 1.00
condition -0.19 -0.69 – 0.27 0.44 0.63
integrity -0.63 -0.90 – -0.36 < 0.001 < 0.001
intercept
non-endemic
0.33 0.13 – 0.53 < 0.001 < 0.001
cover 0.43 0.27 – 0.58 < 0.001 < 0.001
condition -0.38 -0.59 – -0.18 < 0.001 < 0.001 integrity -0.20 -0.34 – -0.06 0.01 0.01
b. Birds
thre
ate
ned
sta
tus
intercept
endemic
-1.34 -1.57 – -0.47 < 0.001 < 0.001
cover 0.41 0.04 – 0.73 < 0.001 < 0.001 condition -0.48 -0.80 – -0.13 < 0.001 < 0.001
integrity -0.55 -0.75 – -0.36 < 0.001 < 0.001
intercept
non-endemic
-2.20 -2.40 – -2.00 < 0.001 < 0.001
cover 0.32 0.21 – 0.43 < 0.001 < 0.001
condition -0.17 -0.31 – -0.04 0.03 0.05
integrity -0.92 -1.08 – -0.78 < 0.001 < 0.001
dec
lin
ing p
op
ula
tion
intercept
endemic
1.12 0.89 – 1.35 < 0.001 < 0.001
cover -0.12 -0.38 – 0.12 0.28 0.49
condition -0.29 -0.53 – -0.05 0.03 0.53
integrity -0.12 -0.24 – -0.01 0.07 0.13
intercept
non-endemic
0.04 -0.05 – 0.12 0.42 0.81
cover 0.29 0.19 – 0.39 < 0.001 < 0.001
condition -0.08 -0.21 – 0.06 0.14 0.27
integrity -0.22 -0.31 – -0.14 < 0.001 < 0.001

36
Supplementary Table 2 (continued).
response
variable
predictor
variables
habitat
preference estimate 95% C.I. p-value adj. p-value
c. Reptiles th
reate
ned
sta
tus
intercept
endemic
-0.83 -1.10 – -0.56 < 0.001 < 0.001 cover 0.25 0.02 – 0.47 0.05 0.08
condition -0.12 -0.33 – 0.08 0.29 0.54
integrity -0.76 -0.95 – -0.58 < 0.001 < 0.001
intercept
non-endemic
-1.76 -1.97 – -1.57 < 0.001 < 0.001
cover 0.22 0.08 – 0.36 0.01 0.02
condition -0.19 -0.36 – -0.01 0.06 0.12
integrity -0.93 -1.15 – -0.72 < 0.001 < 0.001
dec
lin
ing p
op
ula
tion
intercept
endemic
-0.04 -0.40 – 0.33 0.81 1.00
cover 0.30 -0.04 – 0.66 0.10 0.14
condition -0.39 -0.72 – -0.07 0.03 0.04
integrity -0.63 -0.91 – -0.38 < 0.001 < 0.001
intercept
non-endemic
-1.29 -1.52 – -1.08 < 0.001 < 0.001
cover 0.04 -0.14 – 0.22 0.73 0.99
condition -0.05 -0.28 – 0.18 0.70 1.00
integrity -0.77 -1.01 – -0.55 < 0.001 < 0.001
d. Amphibians
thre
ate
ned
sta
tus
intercept
endemic
0.44 0.23 – 0.65 0.02 0.04
cover 0.51 0.34 – 0.68 < 0.001 < 0.001
condition 0.04 -0.13 – 0.21 0.61 0.98
integrity -0.94 -1.06 – -0.82 < 0.001 < 0.001
intercept
non-endemic
-0.90 -1.11 – -0.70 < 0.001 < 0.001
cover 0.42 0.29 – 0.56 < 0.001 < 0.001
condition -0.13 -0.30 – 0.03 0.16 0.30 integrity -0.88 -1.07 – -0.70 < 0.001 < 0.001
dec
lin
ing p
op
ula
tion
intercept
endemic
1.17 0.92 – 1.43 < 0.001 < 0.001 cover 0.33 0.11 – 0.56 0.01 0.01
condition -0.92 -1.15 – -0.71 < 0.001 < 0.001
integrity -0.45 -0.57 – -0.33 < 0.001 < 0.001
intercept
non-endemic
0.05 -0.17 – 0.26 0.72 1.00
cover 0.32 0.18 – 0.47 < 0.001 < 0.001
condition -0.33 -0.53 – -0.13 < 0.001 < 0.001
integrity -0.68 -0.85 – -0.52 < 0.001 < 0.001
37
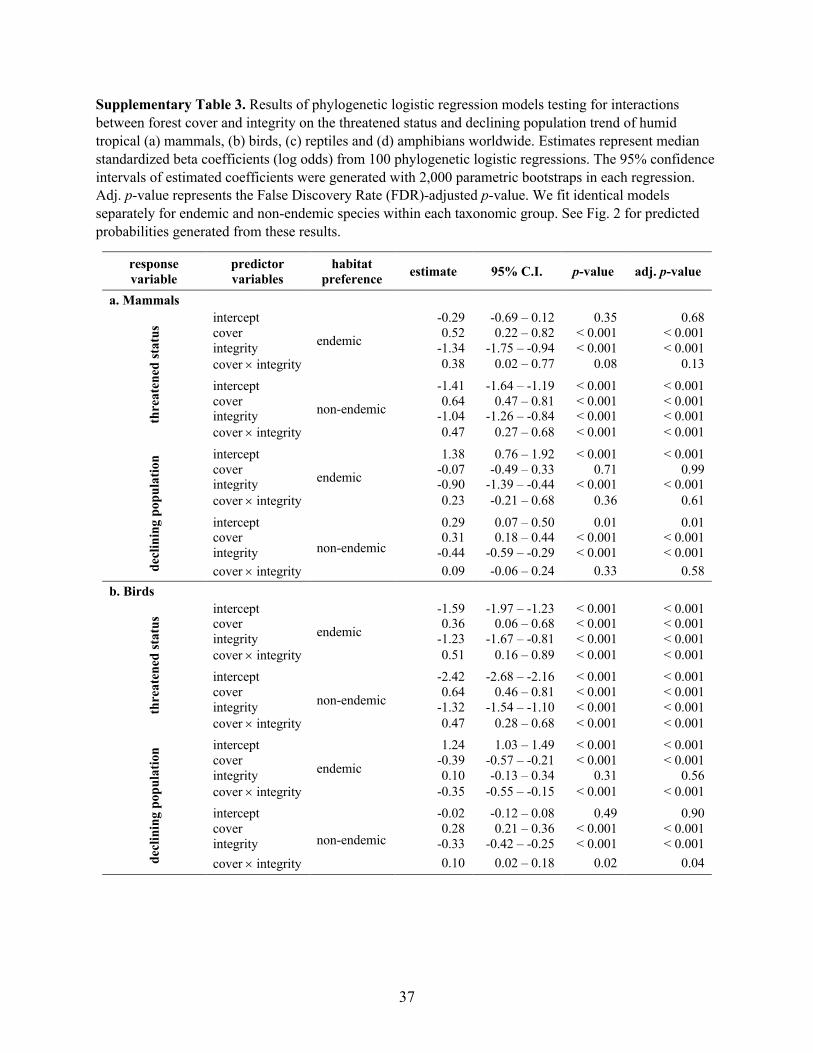
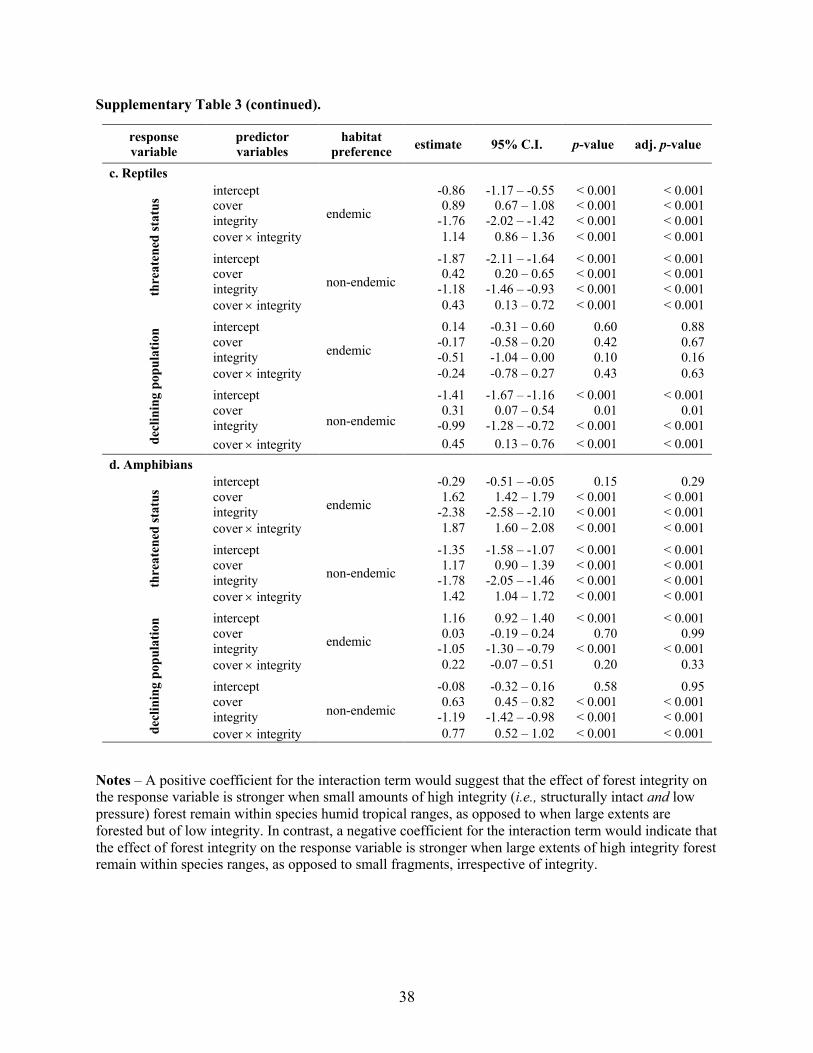
Supplementary Table 3. Results of phylogenetic logistic regression models testing for interactions
between forest cover and integrity on the threatened status and declining population trend of humid
tropical (a) mammals, (b) birds, (c) reptiles and (d) amphibians worldwide. Estimates represent median
standardized beta coefficients (log odds) from 100 phylogenetic logistic regressions. The 95% confidence
intervals of estimated coefficients were generated with 2,000 parametric bootstraps in each regression.
Adj. p-value represents the False Discovery Rate (FDR)-adjusted p-value. We fit identical models
separately for endemic and non-endemic species within each taxonomic group. See Fig. 2 for predicted
probabilities generated from these results.
response
variable
predictor
variables
habitat
preference estimate 95% C.I. p-value adj. p-value
a. Mammals
thre
ate
ned
sta
tus
intercept
endemic
-0.29 -0.69 – 0.12 0.35 0.68
cover 0.52 0.22 – 0.82 < 0.001 < 0.001
integrity -1.34 -1.75 – -0.94 < 0.001 < 0.001
cover ´ integrity 0.38 0.02 – 0.77 0.08 0.13
intercept
non-endemic
-1.41 -1.64 – -1.19 < 0.001 < 0.001
cover 0.64 0.47 – 0.81 < 0.001 < 0.001 integrity -1.04 -1.26 – -0.84 < 0.001 < 0.001
cover ´ integrity 0.47 0.27 – 0.68 < 0.001 < 0.001
dec
lin
ing p
op
ula
tion
intercept
endemic
1.38 0.76 – 1.92 < 0.001 < 0.001
cover -0.07 -0.49 – 0.33 0.71 0.99 integrity -0.90 -1.39 – -0.44 < 0.001 < 0.001
cover ´ integrity 0.23 -0.21 – 0.68 0.36 0.61
intercept
non-endemic
0.29 0.07 – 0.50 0.01 0.01 cover 0.31 0.18 – 0.44 < 0.001 < 0.001
integrity -0.44 -0.59 – -0.29 < 0.001 < 0.001
cover ´ integrity 0.09 -0.06 – 0.24 0.33 0.58
b. Birds
thre
ate
ned
sta
tus
intercept
endemic
-1.59 -1.97 – -1.23 < 0.001 < 0.001 cover 0.36 0.06 – 0.68 < 0.001 < 0.001
integrity -1.23 -1.67 – -0.81 < 0.001 < 0.001
cover ´ integrity 0.51 0.16 – 0.89 < 0.001 < 0.001
intercept
non-endemic
-2.42 -2.68 – -2.16 < 0.001 < 0.001
cover 0.64 0.46 – 0.81 < 0.001 < 0.001
integrity -1.32 -1.54 – -1.10 < 0.001 < 0.001
cover ´ integrity 0.47 0.28 – 0.68 < 0.001 < 0.001
dec
lin
ing p
op
ula
tion
intercept
endemic
1.24 1.03 – 1.49 < 0.001 < 0.001
cover -0.39 -0.57 – -0.21 < 0.001 < 0.001
integrity 0.10 -0.13 – 0.34 0.31 0.56
cover ´ integrity -0.35 -0.55 – -0.15 < 0.001 < 0.001
intercept
non-endemic
-0.02 -0.12 – 0.08 0.49 0.90
cover 0.28 0.21 – 0.36 < 0.001 < 0.001
integrity -0.33 -0.42 – -0.25 < 0.001 < 0.001
cover ´ integrity 0.10 0.02 – 0.18 0.02 0.04
38
Supplementary Table 3 (continued).
Notes – A positive coefficient for the interaction term would suggest that the effect of forest integrity on the response variable is stronger when small amounts of high integrity (i.e., structurally intact and low
pressure) forest remain within species humid tropical ranges, as opposed to when large extents are
forested but of low integrity. In contrast, a negative coefficient for the interaction term would indicate that
the effect of forest integrity on the response variable is stronger when large extents of high integrity forest remain within species ranges, as opposed to small fragments, irrespective of integrity.
response
variable
predictor
variables
habitat
preference estimate 95% C.I. p-value adj. p-value
c. Reptiles
thre
ate
ned
sta
tus
intercept
endemic
-0.86 -1.17 – -0.55 < 0.001 < 0.001 cover 0.89 0.67 – 1.08 < 0.001 < 0.001
integrity -1.76 -2.02 – -1.42 < 0.001 < 0.001
cover ´ integrity 1.14 0.86 – 1.36 < 0.001 < 0.001
intercept
non-endemic
-1.87 -2.11 – -1.64 < 0.001 < 0.001 cover 0.42 0.20 – 0.65 < 0.001 < 0.001
integrity -1.18 -1.46 – -0.93 < 0.001 < 0.001
cover ´ integrity 0.43 0.13 – 0.72 < 0.001 < 0.001
dec
lin
ing p
op
ula
tion
intercept
endemic
0.14 -0.31 – 0.60 0.60 0.88
cover -0.17 -0.58 – 0.20 0.42 0.67
integrity -0.51 -1.04 – 0.00 0.10 0.16
cover ´ integrity -0.24 -0.78 – 0.27 0.43 0.63
intercept
non-endemic
-1.41 -1.67 – -1.16 < 0.001 < 0.001
cover 0.31 0.07 – 0.54 0.01 0.01
integrity -0.99 -1.28 – -0.72 < 0.001 < 0.001
cover ´ integrity 0.45 0.13 – 0.76 < 0.001 < 0.001
d. Amphibians
thre
ate
ned
sta
tus
intercept
endemic
-0.29 -0.51 – -0.05 0.15 0.29
cover 1.62 1.42 – 1.79 < 0.001 < 0.001
integrity -2.38 -2.58 – -2.10 < 0.001 < 0.001
cover ´ integrity 1.87 1.60 – 2.08 < 0.001 < 0.001
intercept
non-endemic
-1.35 -1.58 – -1.07 < 0.001 < 0.001
cover 1.17 0.90 – 1.39 < 0.001 < 0.001
integrity -1.78 -2.05 – -1.46 < 0.001 < 0.001
cover ´ integrity 1.42 1.04 – 1.72 < 0.001 < 0.001
dec
lin
ing p
op
ula
tion
intercept
endemic
1.16 0.92 – 1.40 < 0.001 < 0.001
cover 0.03 -0.19 – 0.24 0.70 0.99
integrity -1.05 -1.30 – -0.79 < 0.001 < 0.001
cover ´ integrity 0.22 -0.07 – 0.51 0.20 0.33
intercept
non-endemic
-0.08 -0.32 – 0.16 0.58 0.95
cover 0.63 0.45 – 0.82 < 0.001 < 0.001
integrity -1.19 -1.42 – -0.98 < 0.001 < 0.001
cover ´ integrity 0.77 0.52 – 1.02 < 0.001 < 0.001

39
Supplementary Table 4. Results of phylogenetic logistic regression models testing for interactions
between rainforest structural condition and integrity on the threatened status and declining population
trend of humid tropical (a) mammals, (b) birds, (c) reptiles and (d) amphibians worldwide. Estimates
represent median standardized coefficients (log odds) from 100 phylogenetic logistic regressions. 95%
confidence intervals of estimated coefficients were generated with 2,000 parametric bootstraps in each
regression. Adj. p-value represents the False Discovery Rate (FDR)-adjusted p-value. We fit identical
models separately for endemic and non-endemic species within each taxonomic group. See Fig. 3 for
predicted probabilities generated from these results.
response
variable predictor variables
habitat
preference estimate 95% C.I. p-value adj. p-value
a. Mammals
thre
ate
ned
sta
tus
intercept
endemic
-0.15 -0.53 – 0.21 0.64 0.94
condition 0.28 0.04 – 0.54 0.06 0.08
integrity -1.20 -1.57 – -0.85 < 0.001 < 0.001
condition ´ integrity 0.18 -0.07 – 0.44 0.25 0.37
intercept
non-endemic
-1.44 -1.66 – -1.21 < 0.001 < 0.001
condition 0.38 0.21 – 0.56 < 0.001 < 0.001 integrity -1.00 -1.24 – -0.77 < 0.001 < 0.001
condition ´ integrity 0.35 0.18 – 0.51 < 0.001 < 0.001
dec
lin
ing p
op
ula
tion
intercept
endemic
1.32 0.63 – 1.84 < 0.001 < 0.001
condition -0.09 -0.45 – 0.29 0.61 1.00 integrity -0.92 -1.44 – -0.44 < 0.001 < 0.001
condition ´ integrity 0.23 -0.10 – 0.56 0.20 0.36
intercept
non-endemic
0.19 -0.03 – 0.41 0.09 0.17 condition 0.14 0.00 – 0.30 0.09 0.17
integrity -0.48 -0.67 – -0.29 < 0.001 < 0.001
condition ´ integrity 0.16 0.04 – 0.30 0.02 0.04
b. Birds
thre
ate
ned
sta
tus
intercept
endemic
-1.55 -1.89 – -1.21 < 0.001 < 0.001 condition 0.04 -0.30 – 0.36 0.24 0.46
integrity -1.02 -1.49 – -0.49 < 0.001 < 0.001
condition ´ integrity 0.37 0.04 – 0.68 < 0.001 < 0.001
intercept
non-endemic
-2.49 -2.75 – -2.22 < 0.001 < 0.001
condition 0.45 0.29 – 0.63 < 0.001 < 0.001
integrity -1.33 -1.58 – -1.12 < 0.001 < 0.001
condition ´ integrity 0.39 0.24 – 0.56 < 0.001 < 0.001
dec
lin
ing p
op
ula
tion
intercept
endemic
1.01 0.78 – 1.25 < 0.001 < 0.001
condition -0.29 -0.47 – -0.13 < 0.001 < 0.001
integrity -0.26 -0.51 – -0.01 0.14 0.28
condition ´ integrity 0.06 -0.10 – 0.23 0.60 0.97
intercept
non-endemic
-0.20 -0.30 – -0.10 < 0.001 < 0.001
condition 0.36 0.27 – 0.46 < 0.001 < 0.001
integrity -0.57 -0.69 – -0.45 < 0.001 < 0.001
condition ´ integrity 0.32 0.24 – 0.39 < 0.001 < 0.001

40
Supplementary Table 4 (continued).
Notes – A positive coefficient for the interaction term would suggest that the effect of forest integrity on the response variable is stronger when small amounts of high integrity (i.e., structurally intact and low
pressure) forest remain within species humid tropical ranges, as opposed to when large extents are
structurally intact but of low integrity (i.e. high human pressure). In contrast, a negative coefficient for the
interaction term would indicate that the effect of forest condition on the response variable is stronger when large extents of high integrity forest remain within species humid tropical ranges, as opposed to
small fragments, irrespective of integrity.
response
variable predictor variables
habitat
preference estimate 95% C.I. p-value adj. p-value
c. Reptiles
thre
ate
ned
sta
tus
intercept
endemic
-0.81 -1.10 – -0.51 < 0.001 < 0.001 condition 0.15 -0.06 – 0.36 0.18 0.33
integrity -0.97 -1.33 – -0.64 < 0.001 < 0.001
condition ´ integrity 0.21 -0.04 – 0.44 0.09 0.17
intercept
non-endemic
-1.77 -2.01 – -1.53 < 0.001 < 0.001 condition 0.19 0.01 – 0.38 0.03 0.06
integrity -1.05 -1.31 – -0.80 < 0.001 < 0.001
condition ´ integrity 0.24 0.02 – 0.47 0.02 0.04
dec
lin
ing p
op
ula
tion
intercept
endemic
0.03 -0.42 – 0.45 0.85 0.99
condition -0.17 -0.47 – 0.17 0.40 0.73
integrity -0.61 -1.16 – -0.15 0.02 0.03
condition ´ integrity -0.01 -0.35 – 0.37 0.86 1.00
intercept
non-endemic
-1.37 -1.64 – -1.12 < 0.001 < 0.001
condition 0.10 -0.11 – 0.32 0.33 0.53
integrity -0.90 -1.20 – -0.62 < 0.001 < 0.001
condition ´ integrity 0.22 -0.02 – 0.46 0.06 0.10
d. Amphibians
thre
ate
ned
sta
tus
intercept
endemic
-0.28 -0.50 – -0.04 0.10 0.18
condition 0.55 0.38 – 0.72 < 0.001 < 0.001
integrity -1.40 -1.66 – -1.15 < 0.001 < 0.001
condition ´ integrity 0.49 0.30 – 0.68 < 0.001 < 0.001
intercept
non-endemic
-1.35 -1.59 – -1.08 < 0.001 < 0.001
condition 0.77 0.57 – 0.96 < 0.001 < 0.001
integrity -1.71 -2.02 – -1.39 < 0.001 < 0.001
condition ´ integrity 0.92 0.68 – 1.15 < 0.001 < 0.001
dec
lin
ing p
op
ula
tion
intercept
endemic
1.20 0.94 – 1.48 < 0.001 < 0.001
condition -0.72 -0.89 – -0.54 < 0.001 < 0.001
integrity -0.47 -0.71 – -0.22 < 0.001 < 0.001
condition ´ integrity 0.01 -0.20 – 0.21 0.79 1.00
intercept
non-endemic
-0.07 -0.32 – 0.17 0.63 0.99
condition 0.16 -0.01 – 0.34 0.11 0.21
integrity -0.93 -1.19 – -0.69 < 0.001 < 0.001
condition ´ integrity 0.26 0.06 – 0.47 0.02 0.04

41
Supplementary Table 5. Results of phylogenetic logistic regression models testing for interactions
between forest cover and rainforest structural condition on the threatened status and declining population
trend of humid tropical (a) mammals, (b) birds, (c) reptiles and (d) amphibians worldwide. Estimates
represent median standardized coefficients (log odds) from 100 phylogenetic logistic regressions. 95%
confidence intervals of estimated coefficients were generated with 2,000 parametric bootstraps in each
regression. Adj. p-value represents the False Discovery Rate (FDR)-adjusted p-value. We fit identical
models separately for endemic and non-endemic species within each taxonomic group. See Extended
Data Fig. 1 for predicted probabilities generated from these results.
response
variable
predictor
variables
habitat
preference estimate 95% C.I. p-value adj. p-value
a. Mammals
thre
ate
ned
sta
tus
intercept
endemic
-0.57 -0.87 – -0.19 < 0.001 < 0.001
cover 0.85 0.53 – 1.19 < 0.001 < 0.001
condition -1.22 -1.63 – -0.90 < 0.001 < 0.001
cover ´ condition 0.37 0.14 – 0.55 < 0.001 < 0.001
intercept
non-endemic
-1.50 -1.70 – -1.30 < 0.001 < 0.001
cover 0.89 0.69 – 1.10 < 0.001 < 0.001 condition -0.83 -1.02 – -0.65 < 0.001 < 0.001
cover ´ condition 0.18 0.10 – 0.27 < 0.001 < 0.001
dec
lin
ing p
op
ula
tion
intercept
endemic
0.91 0.41 – 1.39 < 0.001 < 0.001
cover -0.16 -0.57 – 0.25 0.43 0.80 condition -0.80 -1.13 – -0.42 < 0.001 < 0.001
cover ´ condition 0.23 -0.10 – 0.38 0.13 0.20
intercept
non-endemic
0.29 0.06 – 0.50 0.01 0.02 cover 0.53 0.36 – 0.71 < 0.001 < 0.001
condition -0.60 -0.78 – -0.42 < 0.001 < 0.001
cover ´ condition 0.04 -0.03 – 0.13 0.33 0.58
b. Birds
thre
ate
ned
sta
tus
intercept
endemic
-1.36 -1.59 – -1.12 < 0.001 < 0.001 cover 0.64 0.21 – 1.01 < 0.001 < 0.001
condition -0.97 -1.29 – -0.63 < 0.001 < 0.001
cover ´ condition 0.06 -0.04 – 0.19 0.17 0.32
intercept
non-endemic
-2.42 -2.58 – -2.26 < 0.001 < 0.001
cover 0.89 0.71 – 1.07 < 0.001 < 0.001
condition -0.92 -1.08 – -0.76 < 0.001 < 0.001
cover ´ condition 0.09 0.03 – 0.14 < 0.001 < 0.001
dec
lin
ing p
op
ula
tion
intercept
endemic
1.20 0.96 – 1.45 < 0.001 < 0.001
cover -0.08 -0.32 – 0.17 0.40 0.77
condition -0.38 -0.60 – -0.17 < 0.001 < 0.001
cover ´ condition -0.14 -0.20 – -0.06 < 0.001 < 0.001
intercept
non-endemic
-0.07 -0.16 – 0.02 0.15 0.28
cover 0.42 0.31 – 0.53 < 0.001 < 0.001
condition -0.31 -0.41 – -0.21 < 0.001 < 0.001
cover ´ condition 0.08 0.04 – 0.13 < 0.001 < 0.001

42
Supplementary Table 5 (continued).
Notes – A positive coefficient for the interaction term would suggest that the effect of forest structural
condition on the response variable is stronger when small amounts of structurally intact forest remain
within species humid tropical ranges, as opposed to when large extents are forested but structurally
degraded. In contrast, a negative coefficient for the interaction term would indicate that the effect of forest
structural condition on the response variable is stronger when large extents of structurally intact forest
remain within species humid tropical ranges, as opposed to small fragments, irrespective of condition.
response
variable
predictor
variables
habitat
preference estimate 95% C.I. p-value adj. p-value
c. Reptiles
thre
ate
ned
sta
tus
intercept
endemic
-1.06 -1.32 – -0.78 < 0.001 < 0.001 cover 0.59 0.32 – 0.88 < 0.001 < 0.001
condition -0.87 -1.18 – -0.60 < 0.001 < 0.001
cover ´ condition 0.28 0.11 – 0.50 < 0.001 < 0.001
intercept
non-endemic
-1.78 -1.97 – -1.59 < 0.001 < 0.001 cover 0.73 0.54 – 0.92 < 0.001 < 0.001
condition -0.65 -0.83 – -0.48 < 0.001 < 0.001
cover ´ condition 0.22 0.13 – 0.31 < 0.001 < 0.001
dec
lin
ing p
op
ula
tion
intercept
endemic
0.00 -0.36 – 0.37 0.80 1.00
cover 0.32 -0.03 – 0.69 0.09 0.15
condition -0.79 -1.15 – -0.47 < 0.001 < 0.001
cover ´ condition -0.02 -0.19 – 0.25 0.81 1.00
intercept
non-endemic
-1.24 -1.46 – -1.04 < 0.001 < 0.001
cover 0.08 -0.13 – 0.29 0.43 0.78
condition -0.43 -0.64 – -0.22 < 0.001 < 0.001
cover ´ condition 0.05 -0.06 – 0.17 0.35 0.58
d. Amphibians
thre
ate
ned
sta
tus
intercept
endemic
-0.33 -0.51 – -0.14 < 0.001 < 0.001
cover 0.71 0.51 – 0.92 < 0.001 < 0.001
condition -0.74 -0.92 – -0.57 < 0.001 < 0.001
cover ´ condition 0.10 -0.01 – 0.23 0.10 0.20
intercept
non-endemic
-0.93 -1.15 – -0.70 < 0.001 < 0.001
cover 0.74 0.56 – 0.93 < 0.001 < 0.001
condition -0.59 -0.75 – -0.44 < 0.001 < 0.001
cover ´ condition 0.17 0.09 – 0.26 < 0.001 < 0.001
dec
lin
ing p
op
ula
tion
intercept
endemic
1.18 0.91 – 1.46 < 0.001 < 0.001
cover 0.22 0.01 – 0.42 0.06 0.12
condition -0.99 -1.20 – -0.80 < 0.001 < 0.001
cover ´ condition -0.22 -0.33 – -0.08 < 0.001 < 0.001
intercept
non-endemic
-0.09 -0.33 – 0.16 0.61 0.95
cover 0.62 0.45 – 0.82 < 0.001 < 0.001
condition -0.76 -0.94 – -0.59 < 0.001 < 0.001
cover ´ condition 0.18 0.08 – 0.29 < 0.001 < 0.001

43
Supplementary Table 6. Sample sizes in terms of the number of rainforest endemic and non-endemic
species included in analyses after excluding 2,751 and 2,155 species listed in IUCN criterion B for
threatened status and declining population, respectively.
habitat response variable mammals birds reptiles amphibians total
endemic threatened status 573 1,415 762 1,117 3,867
declining population 372 1,362 283 950 2,967
non-endemic threatened status 1,836 4,847 1,824 1,271 9,778
declining population 1,182 4,500 1,050 999 7,731
total threatened status 2,409 6,262 2,586 2,388 13,645
declining population 1,554 5,862 1,333 1,949 10,698
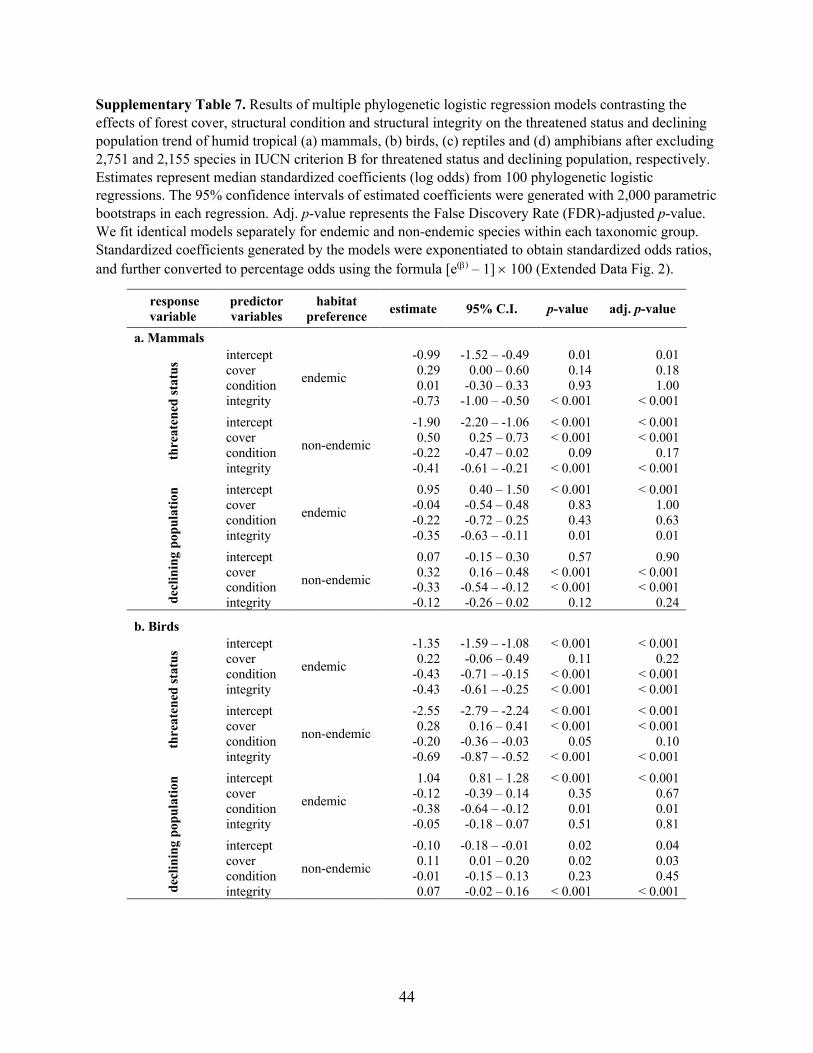
44
Supplementary Table 7. Results of multiple phylogenetic logistic regression models contrasting the
effects of forest cover, structural condition and structural integrity on the threatened status and declining
population trend of humid tropical (a) mammals, (b) birds, (c) reptiles and (d) amphibians after excluding
2,751 and 2,155 species in IUCN criterion B for threatened status and declining population, respectively.
Estimates represent median standardized coefficients (log odds) from 100 phylogenetic logistic
regressions. The 95% confidence intervals of estimated coefficients were generated with 2,000 parametric
bootstraps in each regression. Adj. p-value represents the False Discovery Rate (FDR)-adjusted p-value.
We fit identical models separately for endemic and non-endemic species within each taxonomic group.
Standardized coefficients generated by the models were exponentiated to obtain standardized odds ratios,
and further converted to percentage odds using the formula [e(b) – 1] ´ 100 (Extended Data Fig. 2).
response
variable
predictor
variables
habitat
preference estimate 95% C.I. p-value adj. p-value
a. Mammals
thre
ate
ned
sta
tus
intercept
endemic
-0.99 -1.52 – -0.49 0.01 0.01
cover 0.29 0.00 – 0.60 0.14 0.18
condition 0.01 -0.30 – 0.33 0.93 1.00
integrity -0.73 -1.00 – -0.50 < 0.001 < 0.001
intercept
non-endemic
-1.90 -2.20 – -1.06 < 0.001 < 0.001
cover 0.50 0.25 – 0.73 < 0.001 < 0.001
condition -0.22 -0.47 – 0.02 0.09 0.17
integrity -0.41 -0.61 – -0.21 < 0.001 < 0.001
dec
lin
ing p
op
ula
tion
intercept
endemic
0.95 0.40 – 1.50 < 0.001 < 0.001
cover -0.04 -0.54 – 0.48 0.83 1.00
condition -0.22 -0.72 – 0.25 0.43 0.63
integrity -0.35 -0.63 – -0.11 0.01 0.01
intercept
non-endemic
0.07 -0.15 – 0.30 0.57 0.90
cover 0.32 0.16 – 0.48 < 0.001 < 0.001 condition -0.33 -0.54 – -0.12 < 0.001 < 0.001
integrity -0.12 -0.26 – 0.02 0.12 0.24
b. Birds
thre
ate
ned
sta
tus
intercept
endemic
-1.35 -1.59 – -1.08 < 0.001 < 0.001
cover 0.22 -0.06 – 0.49 0.11 0.22
condition -0.43 -0.71 – -0.15 < 0.001 < 0.001
integrity -0.43 -0.61 – -0.25 < 0.001 < 0.001
intercept
non-endemic
-2.55 -2.79 – -2.24 < 0.001 < 0.001
cover 0.28 0.16 – 0.41 < 0.001 < 0.001
condition -0.20 -0.36 – -0.03 0.05 0.10
integrity -0.69 -0.87 – -0.52 < 0.001 < 0.001
dec
lin
ing p
op
ula
tion
intercept
endemic
1.04 0.81 – 1.28 < 0.001 < 0.001
cover -0.12 -0.39 – 0.14 0.35 0.67
condition -0.38 -0.64 – -0.12 0.01 0.01
integrity -0.05 -0.18 – 0.07 0.51 0.81
intercept
non-endemic
-0.10 -0.18 – -0.01 0.02 0.04
cover 0.11 0.01 – 0.20 0.02 0.03
condition -0.01 -0.15 – 0.13 0.23 0.45
integrity 0.07 -0.02 – 0.16 < 0.001 < 0.001

45
Supplementary Table 7 (continued).
response
variable
predictor
variables
habitat
preference estimate 95% C.I. p-value adj. p-value
c. Reptiles th
reate
ned
sta
tus
intercept
endemic
-1.79 -2.46 – -0.56 < 0.001 < 0.001 cover 0.02 -0.30 – 0.34 0.94 1.00
condition 0.06 -0.24 – 0.36 0.71 0.97
integrity -0.50 -0.82 – -0.18 < 0.001 < 0.001
intercept
non-endemic
-2.68 -3.34 – -0.82 < 0.001 < 0.001
cover 0.02 -0.18 – 0.22 0.91 1.00
condition 0.08 -0.17 – 0.37 0.59 0.79
integrity -0.50 -0.91 – -0.11 < 0.001 < 0.001
dec
lin
ing p
op
ula
tion
intercept
endemic
-0.33 -0.91 – 0.24 0.33 0.49
cover 0.30 -0.10 – 0.74 0.18 0.25
condition -0.61 -1.06 – -0.21 0.01 0.01
integrity -0.16 -0.45 – 0.13 0.24 0.37
intercept
non-endemic
-2.06 -2.41 – -1.31 < 0.001 < 0.001
cover -0.16 -0.42 – 0.09 0.24 0.41
condition -0.07 -0.41 – 0.27 0.69 1.00
integrity -0.44 -0.76 – -0.15 0.01 0.01
d. Amphibians
thre
ate
ned
sta
tus
intercept
endemic
-1.25 -1.75 – -0.85 < 0.001 < 0.001
cover 0.34 0.11 – 0.61 0.02 0.03
condition 0.20 -0.01 – 0.41 0.11 0.21
integrity -0.43 -0.60 – -0.28 < 0.001 < 0.001
intercept
non-endemic
-1.81 -2.31 – -1.25 < 0.001 < 0.001
cover 0.01 -0.14 – 0.16 0.92 1.00
condition 0.17 -0.03 – 0.40 0.21 0.36 integrity -0.37 -0.62 – -0.15 < 0.001 < 0.001
dec
lin
ing p
op
ula
tion
intercept
endemic
0.28 -0.04 – 0.59 0.28 0.52 cover 0.12 -0.12 – 0.36 0.39 0.65
condition -0.90 -1.18 – -0.63 < 0.001 < 0.001
integrity -0.26 -0.43 – -0.10 < 0.001 < 0.001
intercept
non-endemic
-0.79 -1.09 – -0.47 < 0.001 < 0.001
cover 0.08 -0.10 – 0.26 0.45 0.79
condition -0.30 -0.56 – -0.06 0.04 0.07
integrity -0.44 -0.66 – -0.23 < 0.001 < 0.001

46
Supplementary Table 8. Results of phylogenetic logistic regression models testing for interactions
between forest cover and rainforest structural integrity on the threatened status and declining population
trend of humid tropical (a) mammals, (b) birds, (c) reptiles and (d) amphibians after excluding 2,751 and
2,155 species in IUCN criterion B for Threatened status and Declining population, respectively. Estimates
represent median standardized beta coefficients (log odds) from 100 phylogenetic logistic regressions.
95% confidence intervals of estimated coefficients were generated with 2,000 parametric bootstraps in
each regression. Adj. p-value represents the False Discovery Rate (FDR)-adjusted p-value. We fit
identical models separately for endemic and non-endemic species within each taxonomic group. See
Extended Data Fig. 3 for predicted probabilities generated from these results.
response
variable
predictor
variables
habitat
preference estimate 95% C.I. p-value adj. p-value
a. Mammals
thre
ate
ned
sta
tus
intercept
endemic
-1.04 -1.57 – -0.57 0.01 0.02
cover 0.35 0.07 – 0.67 0.10 0.15 integrity -0.79 -1.20 – -0.40 < 0.001 < 0.001
cover ´ integrity 0.06 -0.32 – 0.46 0.83 1.00
intercept
non-endemic
-1.93 -2.25 – -1.44 < 0.001 < 0.001 cover 0.45 0.23 – 0.66 < 0.001 < 0.001
integrity -0.55 -0.80 – -0.32 < 0.001 < 0.001
cover ´ integrity 0.04 -0.22 – 0.30 0.52 0.98
dec
lin
ing p
op
ula
tion
intercept
endemic
0.90 0.33 – 1.47 < 0.001 < 0.001
cover -0.19 -0.58 – 0.21 0.41 0.60
integrity -0.52 -1.00 – -0.10 0.04 0.07
cover ´ integrity 0.13 -0.27 – 0.58 0.57 0.86
intercept
non-endemic
0.07 -0.16 – 0.31 0.57 0.94
cover 0.25 0.12 – 0.39 < 0.001 < 0.001
integrity -0.29 -0.44 – -0.14 < 0.001 < 0.001
cover ´ integrity 0.06 -0.09 – 0.21 0.56 1.00
b. Birds
thre
ate
ned
sta
tus
intercept
endemic
-1.62 -1.97 – -1.32 < 0.001 < 0.001
cover 0.16 -0.07 – 0.44 0.16 0.30
integrity -1.00 -1.40 – -0.66 < 0.001 < 0.001
cover ´ integrity 0.43 0.14 – 0.77 0.01 0.01
intercept
non-endemic
-2.68 -2.96 – -2.31 < 0.001 < 0.001
cover 0.46 0.28 – 0.65 < 0.001 < 0.001
integrity -1.01 -1.25 – -0.79 < 0.001 < 0.001
cover ´ integrity 0.34 0.14 – 0.55 < 0.001 < 0.001
dec
lin
ing p
op
ula
tion
intercept
endemic
1.18 0.96 – 1.42 < 0.001 < 0.001
cover -0.52 -0.70 – -0.33 < 0.001 < 0.001
integrity 0.24 -0.01 – 0.49 0.07 0.14
cover ´ integrity -0.39 -0.60 – -0.18 < 0.001 < 0.001
intercept
non-endemic
-0.12 -0.22 – -0.03 0.01 0.02
cover 0.13 0.06 – 0.22 < 0.001 < 0.001
integrity 0.07 -0.01 – 0.16 0.03 0.06
cover ´ integrity 0.04 -0.04 – 0.12 0.24 0.47

47
Supplementary Table 8 (continued).
Notes – A positive coefficient for the interaction term would suggest that the effect of forest integrity on the response variable is stronger when small amounts of high integrity (i.e., structurally intact and low
pressure) forest remain within species humid tropical ranges, as opposed to when large extents are
forested but of low integrity. In contrast, a negative coefficient for the interaction term would indicate that
the effect of forest integrity on the response variable is stronger when large extents of high integrity forest remain within species ranges, as opposed to small fragments, irrespective of integrity.
response
variable
predictor
variables
habitat
preference estimate 95% C.I. p-value adj. p-value
c. Reptiles
thre
ate
ned
sta
tus
intercept
endemic
-2.58 -3.16 – -1.40 < 0.001 < 0.001 cover 0.90 0.34 – 1.23 < 0.001 < 0.001
integrity -1.77 -2.26 – -0.79 < 0.001 < 0.001
cover ´ integrity 1.23 0.46 – 1.62 < 0.001 < 0.001
intercept
non-endemic
-2.98 -3.57 – -1.56 < 0.001 < 0.001 cover 0.49 0.11 – 0.82 < 0.001 < 0.001
integrity -0.73 -1.17 – -0.20 < 0.001 < 0.001
cover ´ integrity 0.51 0.06 – 0.91 0.01 0.01
dec
lin
ing p
op
ula
tion
intercept
endemic
0.44 -0.24 – 1.18 0.40 0.56
cover -0.61 -1.04 – -0.18 0.01 0.01
integrity 0.34 -0.18 – 0.86 0.27 0.41
cover ´ integrity -0.80 -1.36 – -0.23 0.01 0.02
intercept
non-endemic
-2.07 -2.46 – -1.27 < 0.001 < 0.001
cover -0.14 -0.43 – 0.16 0.40 0.60
integrity -0.48 -0.84 – -0.17 0.01 0.01
cover ´ integrity 0.09 -0.30 – 0.50 0.58 0.80
d. Amphibians
thre
ate
ned
sta
tus
intercept
endemic
-2.06 -2.47 – -1.48 < 0.001 < 0.001
cover 1.23 0.80 – 1.56 < 0.001 < 0.001
integrity -1.44 -1.85 – -0.90 < 0.001 < 0.001
cover ´ integrity 1.27 0.72 – 1.71 < 0.001 < 0.001
intercept
non-endemic
-2.67 -3.18 – -2.19 < 0.001 < 0.001
cover 0.44 0.09 – 0.81 0.03 0.04
integrity -0.66 -1.10 – -0.26 0.01 0.01
cover ´ integrity 0.56 0.05 – 1.06 0.03 0.06
dec
lin
ing p
op
ula
tion
intercept
endemic
0.55 0.23 – 0.88 0.01 0.02
cover -0.31 -0.54 – -0.08 0.01 0.02
integrity -0.52 -0.78 – -0.25 < 0.001 < 0.001
cover ´ integrity -0.15 -0.47 – 0.15 0.35 0.66
intercept
non-endemic
-0.77 -1.08 – -0.45 < 0.001 < 0.001
cover 0.05 -0.13 – 0.25 0.57 0.89
integrity -0.63 -0.86 – -0.42 < 0.001 < 0.001
cover ´ integrity 0.12 -0.14 – 0.40 0.35 0.56

48
Supplementary Table 9. Results of phylogenetic logistic regression models testing for interactions
between rainforest structural condition and integrity on the threatened status and declining population
trend of humid tropical (a) mammals, (b) birds, (c) reptiles and (d) amphibians after excluding 2,751 and
2,155 species in IUCN criterion B for Threatened status and Declining population, respectively. Estimates
represent median standardized beta coefficients (log odds) from 100 phylogenetic logistic regressions.
95% confidence intervals of estimated coefficients were generated with 2,000 parametric bootstraps in
each regression. Adj. p-value represents the False Discovery Rate (FDR)-adjusted p-value. We fit
identical models separately for endemic and non-endemic species within each taxonomic group. See
Extended Data Fig. 4 for predicted probabilities generated from these results.
response
variable predictor variables
habitat
preference estimate 95% C.I. p-value adj. p-value
a. Mammals
thre
ate
ned
sta
tus
intercept
endemic
-0.77 -1.31 – -0.29 0.08 0.14
condition 0.08 -0.18 – 0.34 0.68 0.92 integrity -0.44 -0.83 – -0.10 0.05 0.08
condition ´ integrity -0.24 -0.53 – 0.03 0.11 0.19
intercept
non-endemic
-2.04 -2.38 – -1.15 < 0.001 < 0.001 condition 0.37 0.14 – 0.62 < 0.001 < 0.001
integrity -0.73 -1.06 – -0.40 < 0.001 < 0.001
condition ´ integrity 0.13 -0.11 – 0.35 0.19 0.36
dec
lin
ing p
op
ula
tion
intercept
endemic
0.93 0.38 – 1.50 < 0.001 < 0.001
condition -0.23 -0.59 – 0.15 0.25 0.37
integrity -0.47 -0.95 – 0.01 0.06 0.10
condition ´ integrity 0.08 -0.23 – 0.41 0.60 0.83
intercept
non-endemic
0.10 -0.13 – 0.34 0.45 0.85
condition -0.12 -0.27 – 0.03 0.16 0.31
integrity -0.02 -0.21 – 0.17 0.38 0.74
condition ´ integrity -0.12 -0.26 – 0.02 0.10 0.20
b. Birds
thre
ate
ned
sta
tus
intercept
endemic
-1.62 -1.94 – -1.29 < 0.001 < 0.001
condition -0.01 -0.25 – 0.25 0.77 1.00
integrity -0.91 -1.31 – -0.54 < 0.001 < 0.001
condition ´ integrity 0.35 0.11 – 0.62 < 0.001 < 0.001
intercept
non-endemic
-2.76 -3.06 – -2.41 < 0.001 < 0.001
condition 0.25 0.05 – 0.44 0.01 0.01
integrity -1.00 -1.27 – -0.75 < 0.001 < 0.001
condition ´ integrity 0.25 0.07 – 0.44 < 0.001 < 0.001
dec
lin
ing p
op
ula
tion
intercept
endemic
1.02 0.80 – 1.27 < 0.001 < 0.001
condition -0.47 -0.66 – -0.28 < 0.001 < 0.001
integrity 0.02 -0.24 – 0.29 0.65 0.99
condition ´ integrity -0.04 -0.21 – 0.13 0.52 0.84
intercept
non-endemic
-0.18 -0.28 – -0.08 < 0.001 < 0.001
condition 0.27 0.16 – 0.38 < 0.001 < 0.001
integrity -0.33 -0.47 – -0.21 < 0.001 < 0.001
condition ´ integrity 0.16 0.09 – 0.25 < 0.001 < 0.001
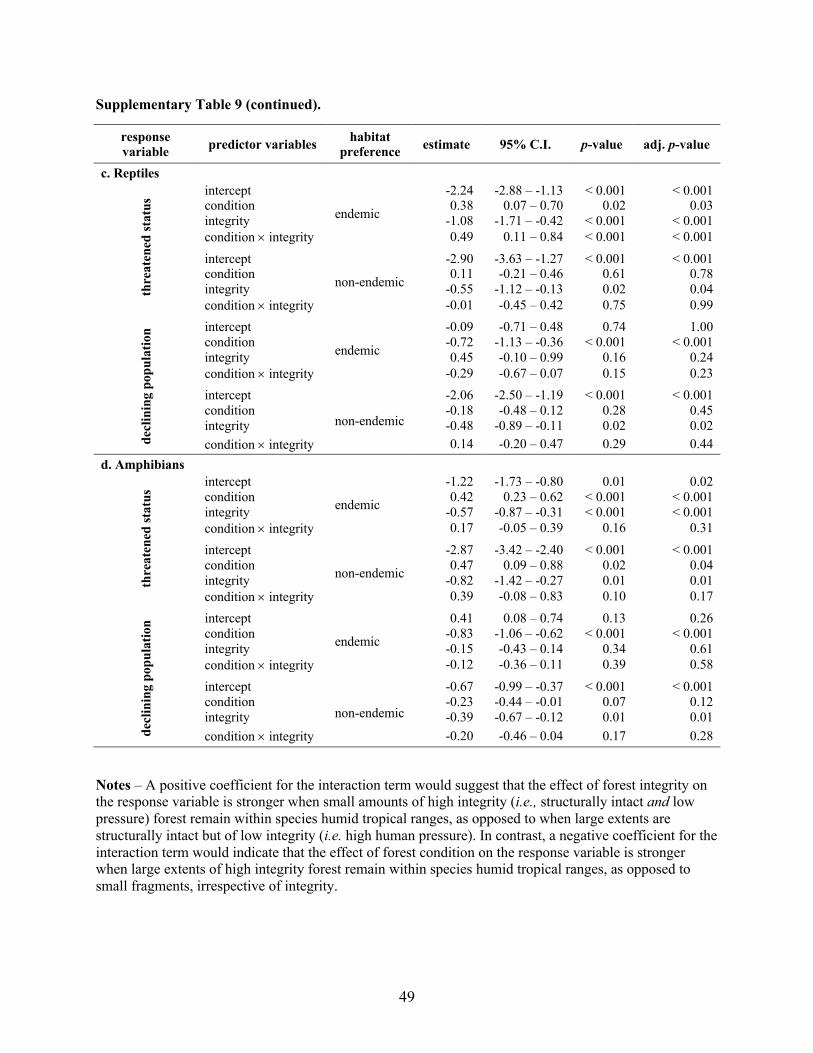
49
Supplementary Table 9 (continued).
Notes – A positive coefficient for the interaction term would suggest that the effect of forest integrity on the response variable is stronger when small amounts of high integrity (i.e., structurally intact and low
pressure) forest remain within species humid tropical ranges, as opposed to when large extents are
structurally intact but of low integrity (i.e. high human pressure). In contrast, a negative coefficient for the
interaction term would indicate that the effect of forest condition on the response variable is stronger when large extents of high integrity forest remain within species humid tropical ranges, as opposed to
small fragments, irrespective of integrity.
response
variable predictor variables
habitat
preference estimate 95% C.I. p-value adj. p-value
c. Reptiles
thre
ate
ned
sta
tus
intercept
endemic
-2.24 -2.88 – -1.13 < 0.001 < 0.001 condition 0.38 0.07 – 0.70 0.02 0.03
integrity -1.08 -1.71 – -0.42 < 0.001 < 0.001
condition ´ integrity 0.49 0.11 – 0.84 < 0.001 < 0.001
intercept
non-endemic
-2.90 -3.63 – -1.27 < 0.001 < 0.001 condition 0.11 -0.21 – 0.46 0.61 0.78
integrity -0.55 -1.12 – -0.13 0.02 0.04
condition ´ integrity -0.01 -0.45 – 0.42 0.75 0.99
dec
lin
ing p
op
ula
tion
intercept
endemic
-0.09 -0.71 – 0.48 0.74 1.00
condition -0.72 -1.13 – -0.36 < 0.001 < 0.001
integrity 0.45 -0.10 – 0.99 0.16 0.24
condition ´ integrity -0.29 -0.67 – 0.07 0.15 0.23
intercept
non-endemic
-2.06 -2.50 – -1.19 < 0.001 < 0.001
condition -0.18 -0.48 – 0.12 0.28 0.45
integrity -0.48 -0.89 – -0.11 0.02 0.02
condition ´ integrity 0.14 -0.20 – 0.47 0.29 0.44
d. Amphibians
thre
ate
ned
sta
tus
intercept
endemic
-1.22 -1.73 – -0.80 0.01 0.02
condition 0.42 0.23 – 0.62 < 0.001 < 0.001
integrity -0.57 -0.87 – -0.31 < 0.001 < 0.001
condition ´ integrity 0.17 -0.05 – 0.39 0.16 0.31
intercept
non-endemic
-2.87 -3.42 – -2.40 < 0.001 < 0.001
condition 0.47 0.09 – 0.88 0.02 0.04
integrity -0.82 -1.42 – -0.27 0.01 0.01
condition ´ integrity 0.39 -0.08 – 0.83 0.10 0.17
dec
lin
ing p
op
ula
tion
intercept
endemic
0.41 0.08 – 0.74 0.13 0.26
condition -0.83 -1.06 – -0.62 < 0.001 < 0.001
integrity -0.15 -0.43 – 0.14 0.34 0.61
condition ´ integrity -0.12 -0.36 – 0.11 0.39 0.58
intercept
non-endemic
-0.67 -0.99 – -0.37 < 0.001 < 0.001
condition -0.23 -0.44 – -0.01 0.07 0.12
integrity -0.39 -0.67 – -0.12 0.01 0.01
condition ´ integrity -0.20 -0.46 – 0.04 0.17 0.28

50
Supplementary Table 10. Results of phylogenetic logistic regression models testing for interactions
between forest cover and forest structural condition on the threatened status and declining population
trend of humid tropical (a) mammals, (b) birds, (c) reptiles and (d) amphibians after excluding 2,751 and
2,155 species in IUCN criterion B for Threatened status and Declining population, respectively. Estimates
represent median standardized beta coefficients (log odds) from 100 phylogenetic logistic regressions.
95% confidence intervals of estimated coefficients were generated with 2,000 parametric bootstraps in
each regression. Adj. p-value represents the False Discovery Rate (FDR)-adjusted p-value. We fit
identical models separately for endemic and non-endemic species within each taxonomic group. See
Extended Data Fig. 5 for predicted probabilities generated from these results.
response
variable
predictor
variables
habitat
preference estimate 95% C.I. p-value adj. p-value
a. Mammals
thre
ate
ned
sta
tus
intercept
endemic
-0.94 -1.41 – -0.48 < 0.001 < 0.001
cover 0.42 0.09 – 0.79 0.06 0.10 condition -0.66 -1.04 – -0.32 < 0.001 < 0.001
cover ´ condition 0.01 -0.24 – 0.27 0.69 0.97
intercept
non-endemic
-2.02 -2.37 – -1.04 < 0.001 < 0.001 cover 0.63 0.34 – 0.91 < 0.001 < 0.001
condition -0.57 -0.81 – -0.31 < 0.001 < 0.001
cover ´ condition 0.07 -0.05 – 0.17 0.19 0.36
dec
lin
ing p
op
ula
tion
intercept
endemic
0.99 0.44 – 1.54 < 0.001 < 0.001
cover 0.13 -0.42 – 0.64 0.61 0.83
condition -0.75 -1.33 – -0.23 0.01 0.02
cover ´ condition 0.08 -0.26 – 0.55 0.68 0.95
intercept
non-endemic
0.11 -0.13 – 0.34 0.38 0.71
cover 0.27 0.10 – 0.45 0.01 0.01
condition -0.40 -0.58 – -0.23 < 0.001 < 0.001
cover ´ condition -0.07 -0.15 – 0.02 0.11 0.21
b. Birds
thre
ate
ned
sta
tus
intercept
endemic
-1.54 -1.77 – -1.29 < 0.001 < 0.001
cover 0.31 -0.19 – 0.71 0.01 0.02
condition -0.77 -1.13 – -0.36 < 0.001 < 0.001
cover ´ condition 0.05 -0.05 – 0.19 0.29 0.50
intercept
non-endemic
-2.56 -2.81 – -2.09 < 0.001 < 0.001
cover 0.59 0.39 – 0.76 < 0.001 < 0.001
condition -0.76 -0.93 – -0.57 < 0.001 < 0.001
cover ´ condition 0.06 0.01 – 0.12 0.02 0.04
dec
lin
ing p
op
ula
tion
intercept
endemic
1.13 0.86 – 1.39 < 0.001 < 0.001
cover -0.16 -0.42 – 0.09 0.20 0.36
condition -0.33 -0.55 – -0.11 0.01 0.02
cover ´ condition -0.14 -0.21 – -0.07 < 0.001 < 0.001
intercept
non-endemic
-0.15 -0.24 – -0.06 < 0.001 < 0.001
cover 0.14 0.03 – 0.25 0.01 0.02
condition 0.12 0.02 -0.22 0.02 0.04
cover ´ condition 0.08 0.04 – 0.13 < 0.001 < 0.001

51
Supplementary Table 10 (continued).
Notes – A positive coefficient for the interaction term would suggest that the effect of forest structural condition on the response variable is stronger when small amounts of structurally intact forest remain
within species humid tropical ranges, as opposed to when large extents are forested but structurally
degraded. In contrast, a negative coefficient for the interaction term would indicate that the effect of forest
structural condition on the response variable is stronger when large extents of structurally intact forest remain within species humid tropical ranges, as opposed to small fragments, irrespective of condition.
response
variable
predictor
variables
habitat
preference estimate 95% C.I. p-value adj. p-value
c. Reptiles
thre
ate
ned
sta
tus
intercept
endemic
-2.70 -3.28 – -2.16 < 0.001 < 0.001 cover 0.41 -0.07 – 0.92 0.10 0.20
condition -0.55 -1.01 – -0.13 0.02 0.04
cover ´ condition 0.40 0.18 – 0.37 < 0.001 < 0.001
intercept
non-endemic
-2.78 -3.30 – -2.02 < 0.001 < 0.001 cover 0.43 0.13 – 0.75 0.01 0.01
condition -0.31 -0.58 – -0.06 0.04 0.06
cover ´ condition 0.09 -0.04 – 0.22 0.16 0.22
dec
lin
ing p
op
ula
tion
intercept
endemic
-0.37 -0.95 – 0.18 0.27 0.44
cover 0.32 -0.09 – 0.78 0.18 0.27
condition -0.72 -1.17 – -0.33 < 0.001 < 0.001
cover ´ condition -0.01 -0.19 – 0.29 0.86 1.00
intercept
non-endemic
-1.97 -2.32 – -1.12 < 0.001 < 0.001
cover -0.35 -0.66 – -0.06 0.03 0.05
condition -0.25 -0.56 – 0.07 0.13 0.21
cover ´ condition -0.16 -0.38 – 0.01 0.10 0.16
d. Amphibians
thre
ate
ned
sta
tus
intercept
endemic
-1.34 -1.84 – -0.97 < 0.001 < 0.001
cover 0.64 0.34 – 0.98 < 0.001 < 0.001
condition -0.37 -0.60 – -0.15 0.01 0.01
cover ´ condition 0.10 -0.08 – 0.26 0.15 0.28
intercept
non-endemic
-2.55 -3.28 – -1.89 < 0.001 < 0.001
cover 0.13 -0.13 – 0.41 0.40 0.78
condition -0.02 -0.26 – 0.26 0.61 1.00
cover ´ condition 0.11 -0.03 – 0.24 0.05 0.09
dec
lin
ing p
op
ula
tion
intercept
endemic
0.67 0.35 – 1.02 0.01 0.01
cover 0.09 -0.17 – 0.34 0.53 0.90
condition -0.94 -1.20 – -0.68 < 0.001 < 0.001
cover ´ condition -0.45 -0.69 – -0.26 < 0.001 < 0.001
intercept
non-endemic
-0.75 -1.08 – -0.40 < 0.001 < 0.001
cover 0.09 -0.12 – 0.30 0.47 0.91
condition -0.55 -0.78 – -0.34 < 0.001 < 0.001
cover ´ condition -0.03 -0.15 – 0.09 0.63 0.99

52
Supplementary Table 11. Phylogenetic signal parameter α measuring the strength of the phylogenetic
correlation. When α = 1, evolution is approximately by Brownian motion on a given phylogeny and α > 1
indicates low phylogenetic correlations among species. α parameter estimates are provided for all additive
and interaction models for all species.
habitat response variable α (95% CI)
mammals birds reptiles amphibians
response variable ~ forest cover + condition + integrity
endemic threatened status 0.02 (0.02 – 0.04) 0.37 (0.02 – 0.49) 0.03 (0.02 – 0.04) 0.01 (0.01 – 0.02)
declining population 0.04 (0.02 – 0.08) 0.06 (0.05 – 0.08) 0.03 (0.02 – 0.04) 0.02 (0.01 – 0.03)
non-endemic threatened status 0.08 (0.06 – 0.10) 0.05 (0.04 – 0.06) 0.05 (0.04 – 0.07) 0.02 (0.02 – 0.03)
declining population 0.07 (0.06 – 0.09) 0.13 (0.11 – 0.14) 0.05 (0.03 – 0.06) 0.02 (0.02 – 0.03)
response variable ~ forest cover ´ integrity
endemic threatened status 0.03 (0.02 – 0.04) 0.13 (0.05 – 0.19) 0.01 (0.01 – 0.02) 0.01 (0.01 – 0.02)
declining population 0.04 (0.02 – 0.08) 0.06 (0.05 – 0.08) 0.02 (0.01 – 0.04) 0.03 (0.02 – 0.04)
non-endemic threatened status 0.07 (0.06 – 0.09) 0.05 (0.04 – 0.06) 0.05 (0.04 – 0.06) 0.02 (0.02 – 0.03)
declining population 0.07 (0.06 – 0.09) 0.14 (0.12 – 0.15) 0.04 (0.03 – 0.06) 0.02 (0.02 – 0.03)
response variable ~ forest condition ´ integrity
endemic threatened status 0.03 (0.02 – 0.04) 0.39 (0.02 – 0.50) 0.03 (0.02 – 0.04) 0.01 (0.01 – 0.01)
declining population 0.04 (0.01 – 0.08) 0.07 (0.05 – 0.09) 0.02 (0.01 – 0.03) 0.03 (0.02 – 0.04)
non-endemic threatened status 0.06 (0.05 – 0.08) 0.04 (0.03 – 0.06) 0.05 (0.04 – 0.07) 0.02 (0.02 – 0.03)
declining population 0.07 (0.05 – 0.08) 0.16 (0.14 – 0.18) 0.04 (0.03 – 0.05) 0.02 (0.02 – 0.03)
response variable ~ forest cover ´ condition
endemic threatened status 0.05 (0.01 – 0.09) 0.44 (0.27 – 0.51) 0.04 (0.03 – 0.06) 0.03 (0.02 – 0.03)
declining population 0.03 (0.01 – 0.04) 0.06 (0.05 – 0.08) 0.03 (0.02 – 0.04) 0.02 (0.01 – 0.02)
non-endemic threatened status 0.10 (0.08 – 0.13) 0.14 (0.10 – 0.17) 0.06 (0.05 – 0.08) 0.02 (0.02 – 0.03)
declining population 0.08 (0.06 – 0.09) 0.14 (0.12 – 0.15) 0.06 (0.04 – 0.07) 0.02 (0.02 – 0.02)

53
Supplementary Table 12. Phylogenetic signal parameter α measuring the strength of the phylogenetic
correlation. When α = 1, evolution is approximately by Brownian motion on a given phylogeny and α > 1
indicates low phylogenetic correlations among species. α parameter estimates are provided for all additive
and interaction models after excluding 2,751 and 2,155 species in IUCN criterion B for Threatened status
and Declining population, respectively.
habitat response variable α (95% CI)
mammals birds reptiles amphibians
response variable ~ forest cover + condition + integrity
endemic threatened status 0.02 (0.01 – 0.03) 0.06 (0.04 – 0.09) 0.01 (0.00 – 0.02) 0.01 (0.00 – 0.01)
declining population 0.03 (0.02 – 0.05) 0.06 (0.05 – 0.08) 0.01 (0.01 – 0.03) 0.01 (0.01 – 0.02)
non-endemic threatened status 0.06 (0.02 – 0.09) 0.05 (0.04 – 0.07) 0.01 (0.00 – 0.02) 0.01 (0.00 – 0.01)
declining population 0.06 (0.05 – 0.08) 0.14 (0.12 – 0.16) 0.05 (0.01 – 0.08) 0.02 (0.01 – 0.03)
response variable ~ forest cover ´ integrity
endemic threatened status 0.02 (0.01 – 0.03) 0.06 (0.04 – 0.09) 0.01 (0.00 – 0.02) 0.01 (0.00 – 0.01)
declining population 0.03 (0.02 – 0.05) 0.06 (0.05 – 0.08) 0.01 (0.00 – 0.02) 0.02 (0.01 – 0.02)
non-endemic threatened status 0.06 (0.03 – 0.09) 0.05 (0.03 – 0.07) 0.01 (0.00 – 0.02) 0.02 (0.01 – 0.04)
declining population 0.06 (0.05 – 0.08) 0.14 (0.12 – 0.16) 0.04 (0.01 – 0.08) 0.02 (0.01 – 0.03)
response variable ~ forest condition ´ integrity
endemic threatened status 0.02 (0.01 – 0.03) 0.07 (0.05 – 0.10) 0.01 (0.00 – 0.02) 0.01 (0.00 – 0.01)
declining population 0.03 (0.01 – 0.05) 0.07 (0.06 – 0.09) 0.01 (0.00 – 0.02) 0.02 (0.01 – 0.02)
non-endemic threatened status 0.07 (0.02 – 0.10) 0.05 (0.03 – 0.06) 0.01 (0.00 – 0.02) 0.02 (0.01 – 0.04)
declining population 0.07 (0.05 – 0.08) 0.14 (0.12 – 0.15) 0.05 (0.01 – 0.08) 0.02 (0.01 – 0.02)
response variable ~ forest cover ´ condition
endemic threatened status 0.03 (0.02 – 0.05) 0.40 (0.23 – 0.49) 0.03 (0.01 – 0.08) 0.01 (0.01 – 0.01)
declining population 0.04 (0.02 – 0.06) 0.06 (0.05 – 0.07) 0.02 (0.01 – 0.03) 0.01 (0.01 – 0.02)
non-endemic threatened status 0.07 (0.02 – 0.10) 0.07 (0.04 – 0.09) 0.01 (0.01 – 0.02) 0.01 (0.01 – 0.04)
declining population 0.06 (0.05 – 0.08) 0.14 (0.12 – 0.16) 0.05 (0.01 – 0.10) 0.02 (0.01 – 0.02)

Figures
Figure 1
Effects of forest cover, structural condition and integrity on the threatened status and decliningpopulation trend of tropical rainforest mammals, birds, reptiles and amphibians. Point estimatesrepresent median standardized odds of species being threatened (circles) or having a decliningpopulation (squares) generated by exponentiating standardized coe�cients (log odds) of 100phylogenetic logistic regressions to obtain standardized odds ratios, and thereafter converting topercentage odds to aid interpretation. Each regression was performed with one phylogenetic treerandomly drawn from 10,000 available trees for each taxonomic group, and separate models wereparameterized for rainforest endemic and non-endemic species for each response variable. Error bars
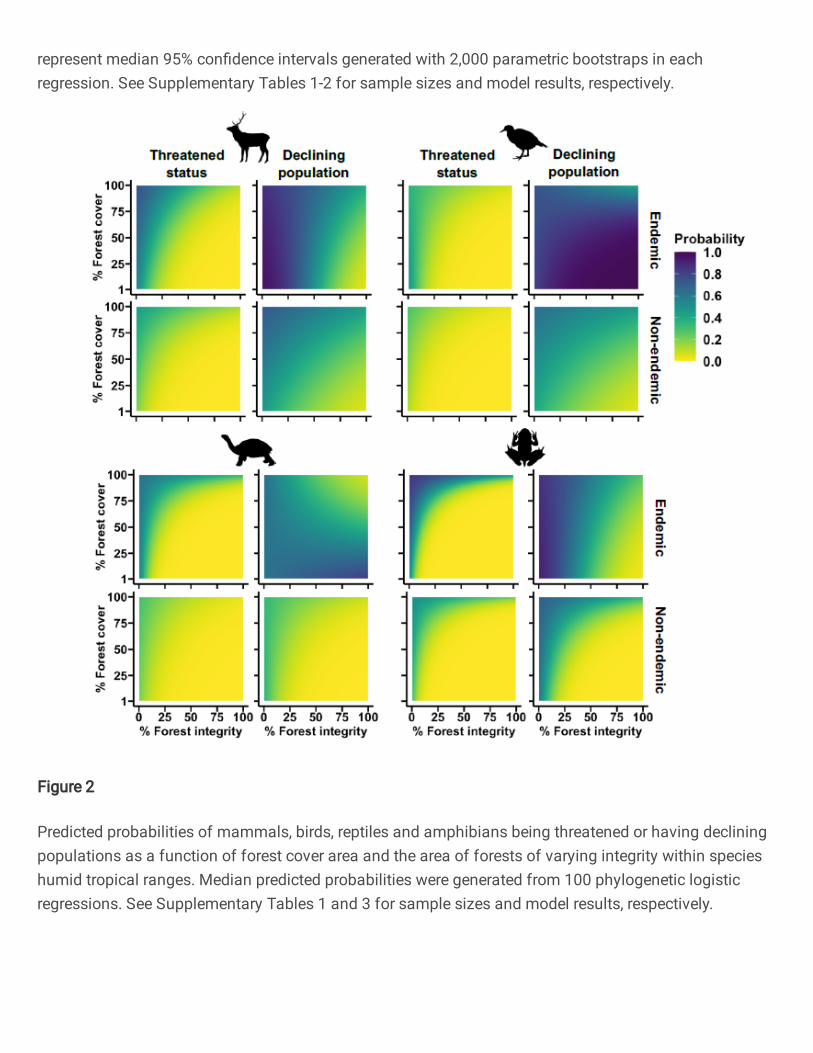
represent median 95% con�dence intervals generated with 2,000 parametric bootstraps in eachregression. See Supplementary Tables 1-2 for sample sizes and model results, respectively.
Figure 2
Predicted probabilities of mammals, birds, reptiles and amphibians being threatened or having decliningpopulations as a function of forest cover area and the area of forests of varying integrity within specieshumid tropical ranges. Median predicted probabilities were generated from 100 phylogenetic logisticregressions. See Supplementary Tables 1 and 3 for sample sizes and model results, respectively.
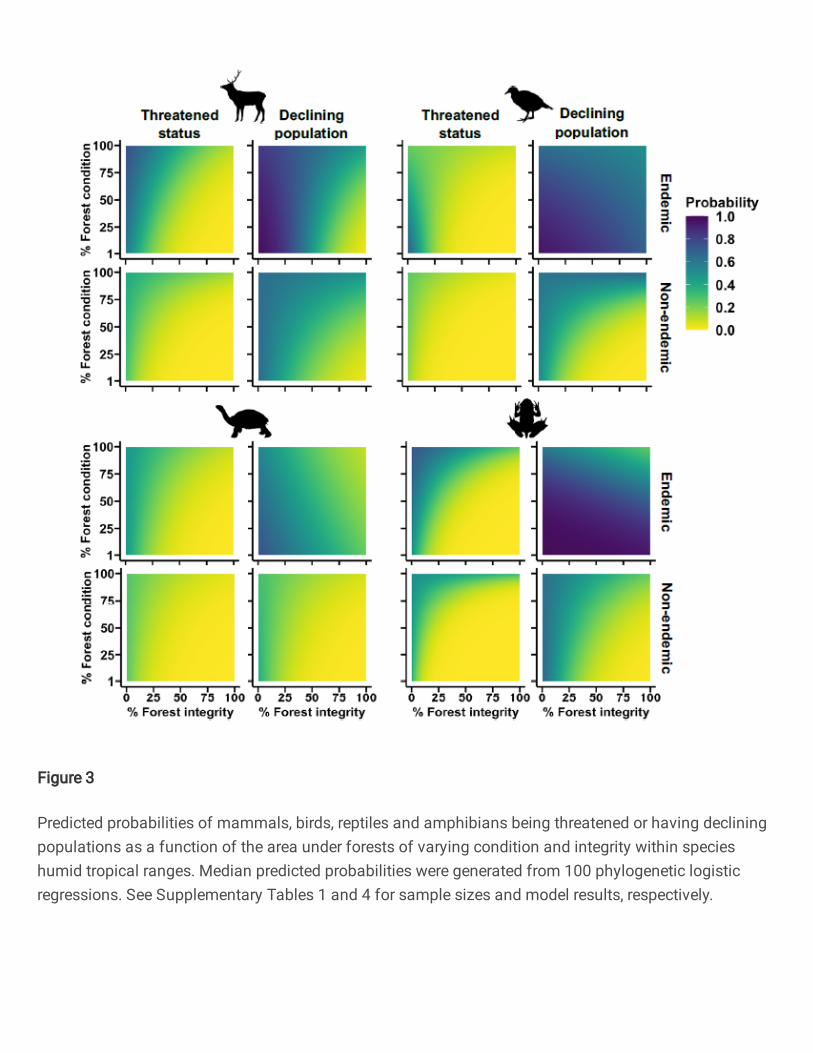
Figure 3
Predicted probabilities of mammals, birds, reptiles and amphibians being threatened or having decliningpopulations as a function of the area under forests of varying condition and integrity within specieshumid tropical ranges. Median predicted probabilities were generated from 100 phylogenetic logisticregressions. See Supplementary Tables 1 and 4 for sample sizes and model results, respectively.