Embed Size (px)
Citation preview
Sources: Eurostat, MSs notifications, DG Agri, DG Taxud, Eurostat, Comext, Comtrade, ITC, Expert groups....
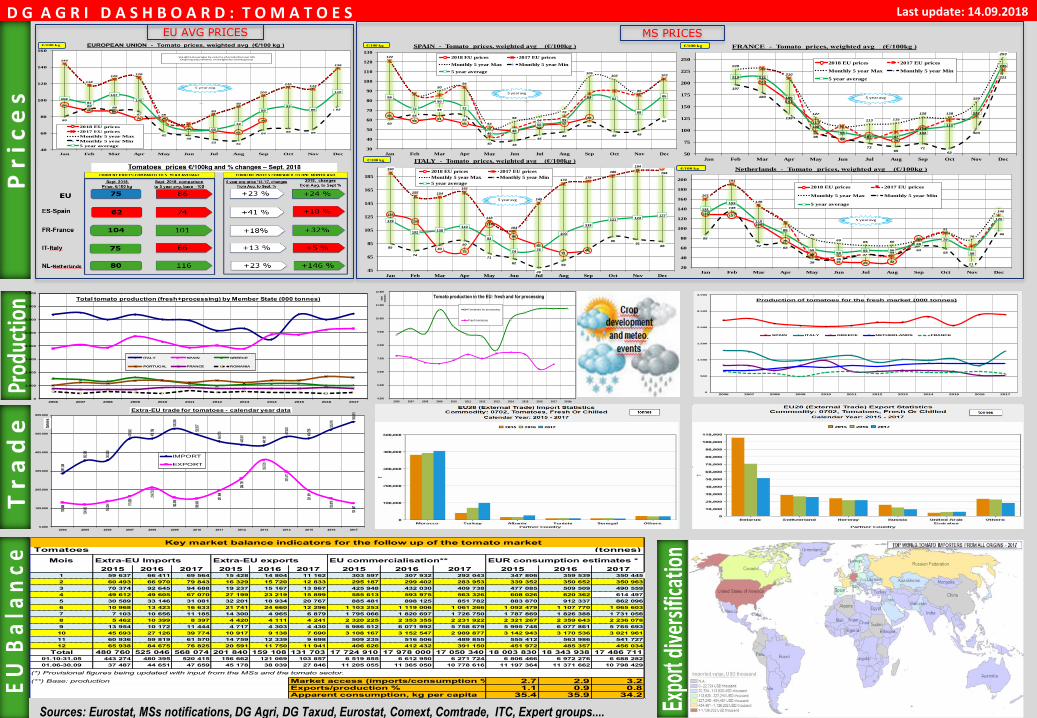
D G A G R I D A S H B O A R D : T O M A T O E S Last update: 14.09.2018
MS PRICESEU AVG PRICES
65
5961
56
5149
54
57
62
122
90
94
53
5864
72
105102
86
103
60
65
65
64
40 38
4548
58
48 49
63
84
72
80
72
4649
55
59
84 82
68
85
30
40
50
60
70
80
90
100
110
120
130
Jan Feb Mar Apr May Jun Jul Aug Sep Oct Nov Dec
SPAIN - Tomato prices, weighted avg (€/100kg )
2018 EU prices 2017 EU prices
Monthly 5 year Max Monthly 5 year Min
5 year average
€/100 kg
5 year avg
128
118
7773
114
96
82
7175
190
155 154
161
118
104
145
174178
186
194
194
85
74
83
90
71
62
49
59
9591
88
119
102105
110
93
7476
100
113
121123
127
45
65
85
105
125
145
165
185
Jan Feb Mar Apr May Jun Jul Aug Sep Oct Nov Dec
ITALY - Tomato prices, weighted avg (€/100kg )
2018 EU prices 2017 EU prices
Monthly 5 year Max Monthly 5 year Min
5 year average
€/100 kg
5 year avg
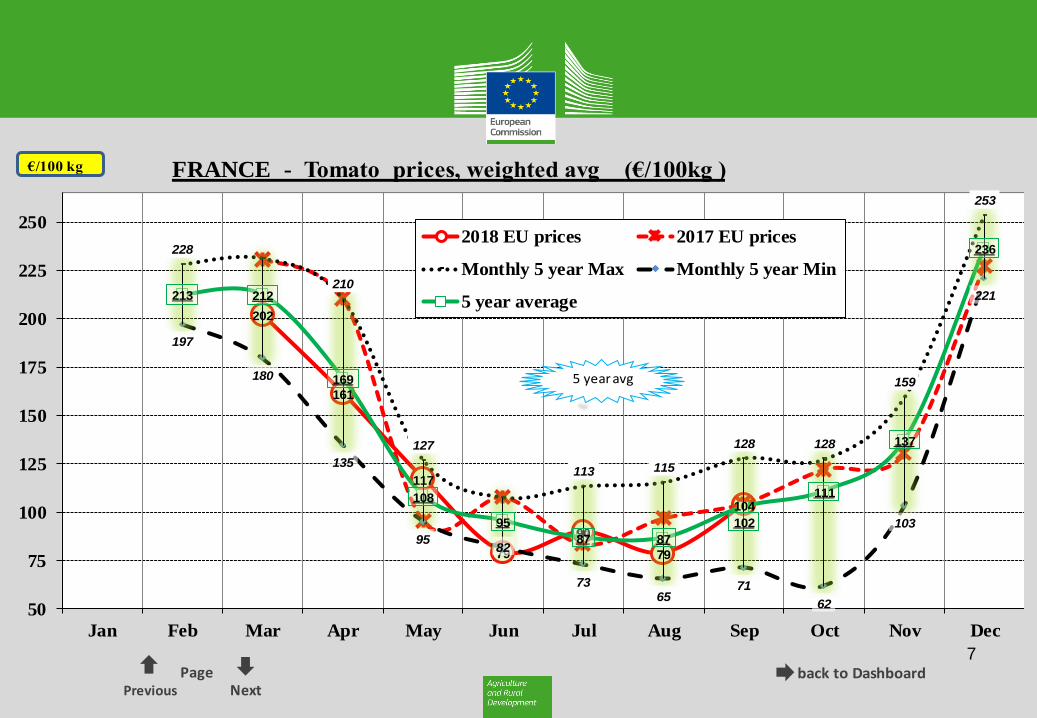
202
161
117
79
90
79
104
228
210
127
113 115
128 128
159
253
197
180
135
9582
7365
71
62
103
221213 212
169
108
95
87 87
102
111
137
236
50
75
100
125
150
175
200
225
250
Jan Feb Mar Apr May Jun Jul Aug Sep Oct Nov Dec
FRANCE - Tomato prices, weighted avg (€/100kg )
2018 EU prices 2017 EU prices
Monthly 5 year Max Monthly 5 year Min
5 year average
€/100 kg
5 year avg
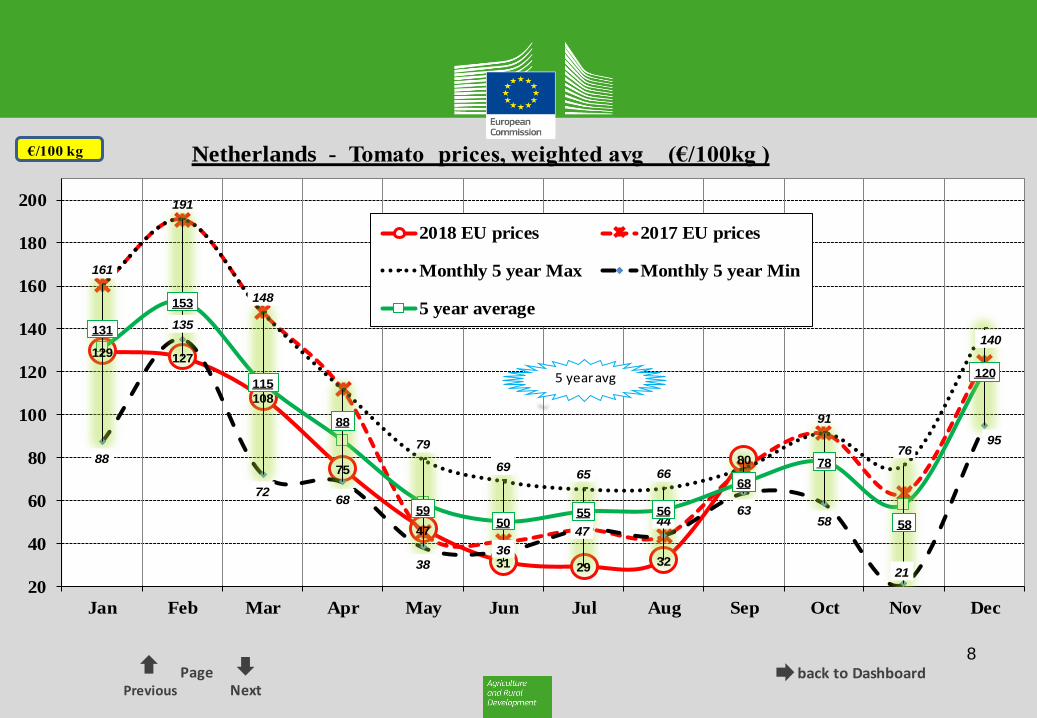
129 127
108
75
47
31 2932
80
161
191
148
79
6965 66
91
76
140
88
135
7268
3836
4744
6358
21
95
131
153
115
88
5950
55 56
68
78
58
120
20
40
60
80
100
120
140
160
180
200
Jan Feb Mar Apr May Jun Jul Aug Sep Oct Nov Dec
Netherlands - Tomato prices, weighted avg (€/100kg )
2018 EU prices 2017 EU prices
Monthly 5 year Max Monthly 5 year Min
5 year average
€/100 kg
5 year avg
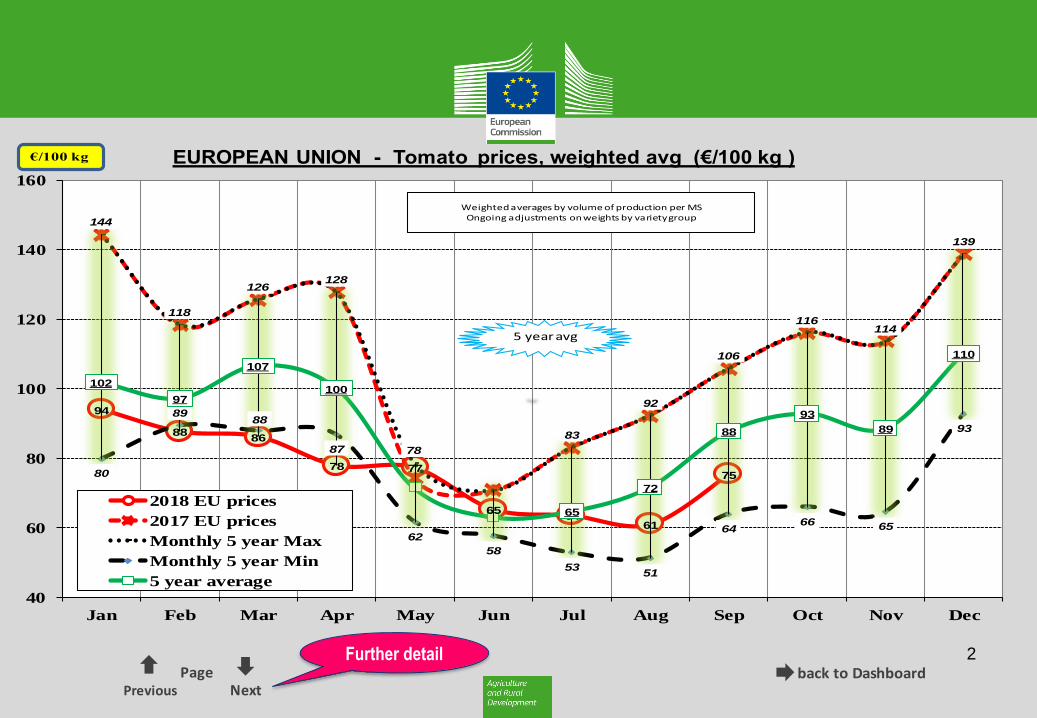
94
8886
78 77
6564
61
75
144
118
126128
78
83
92
106
116114
139
80
8988
87
62
58
5351
6466 65
93
102
97
107
100
65
72
88
93
89
110
40
60
80
100
120
140
160
Jan Feb Mar Apr May Jun Jul Aug Sep Oct Nov Dec
EUROPEAN UNION - Tomato prices, weighted avg (€/100 kg )
2018 EU prices
2017 EU prices
Monthly 5 year Max
Monthly 5 year Min
5 year average
€/100 kg
Weighted averages by volume of production per MSOngoing adjustments on weights by variety group
5 year avg
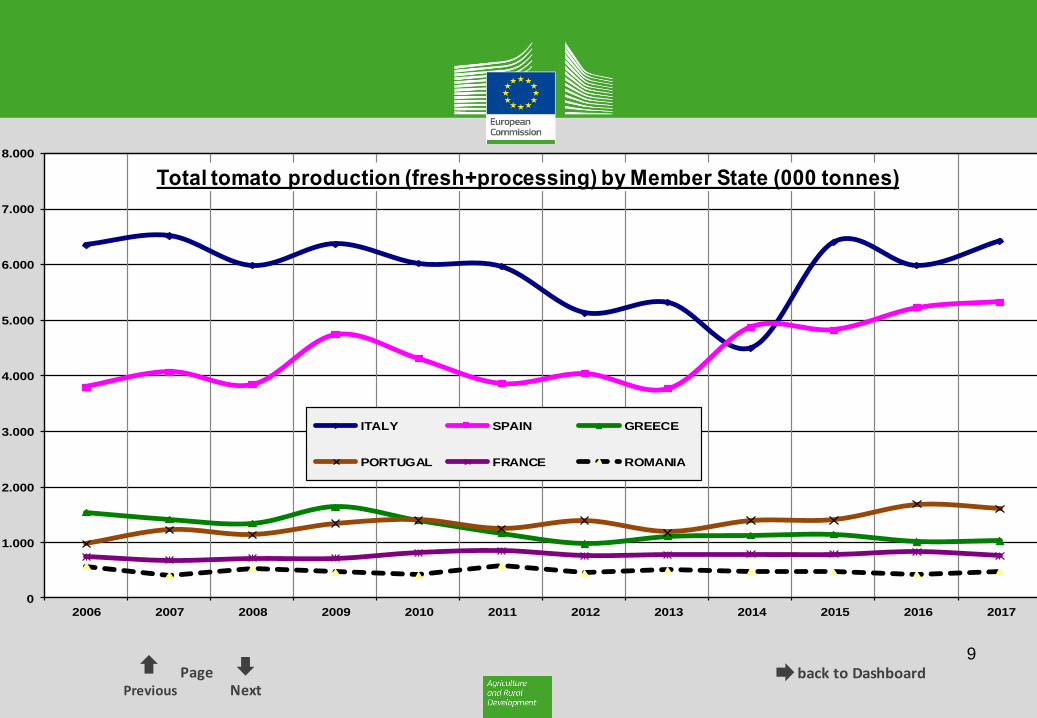
0
1.000
2.000
3.000
4.000
5.000
6.000
7.000
8.000
2006 2007 2008 2009 2010 2011 2012 2013 2014 2015 2016 2017
Total tomato production (fresh+processing) by Member State (000 tonnes)
ITALY SPAIN GREECE
PORTUGAL FRANCE ROMANIA
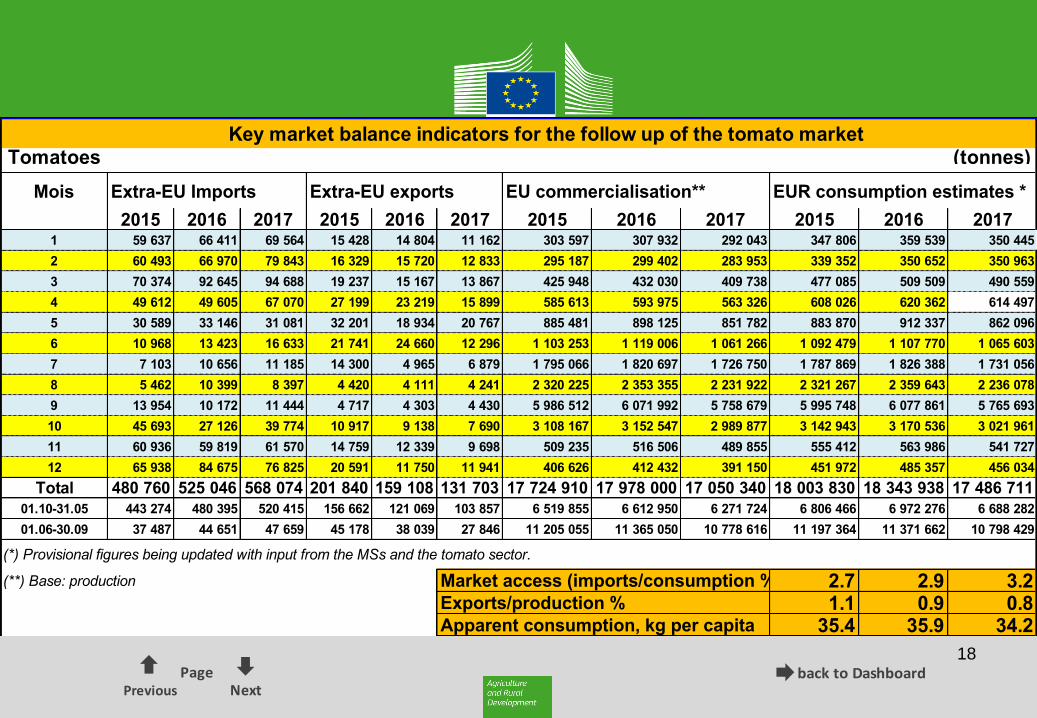
Key market balance indicators for the follow up of the tomato marketTomatoes (tonnes)
Mois Extra-EU Imports Extra-EU exports EU commercialisation** EUR consumption estimates *
2015 2016 2017 2015 2016 2017 2015 2016 2017 2015 2016 20171 59 637 66 411 69 564 15 428 14 804 11 162 303 597 307 932 292 043 347 806 359 539 350 445
2 60 493 66 970 79 843 16 329 15 720 12 833 295 187 299 402 283 953 339 352 350 652 350 963
3 70 374 92 645 94 688 19 237 15 167 13 867 425 948 432 030 409 738 477 085 509 509 490 559
4 49 612 49 605 67 070 27 199 23 219 15 899 585 613 593 975 563 326 608 026 620 362 614 497
5 30 589 33 146 31 081 32 201 18 934 20 767 885 481 898 125 851 782 883 870 912 337 862 096
6 10 968 13 423 16 633 21 741 24 660 12 296 1 103 253 1 119 006 1 061 266 1 092 479 1 107 770 1 065 603
7 7 103 10 656 11 185 14 300 4 965 6 879 1 795 066 1 820 697 1 726 750 1 787 869 1 826 388 1 731 056
8 5 462 10 399 8 397 4 420 4 111 4 241 2 320 225 2 353 355 2 231 922 2 321 267 2 359 643 2 236 078
9 13 954 10 172 11 444 4 717 4 303 4 430 5 986 512 6 071 992 5 758 679 5 995 748 6 077 861 5 765 693
10 45 693 27 126 39 774 10 917 9 138 7 690 3 108 167 3 152 547 2 989 877 3 142 943 3 170 536 3 021 961
11 60 936 59 819 61 570 14 759 12 339 9 698 509 235 516 506 489 855 555 412 563 986 541 727
12 65 938 84 675 76 825 20 591 11 750 11 941 406 626 412 432 391 150 451 972 485 357 456 034
Total 480 760 525 046 568 074 201 840 159 108 131 703 17 724 910 17 978 000 17 050 340 18 003 830 18 343 938 17 486 711
01.10-31.05 443 274 480 395 520 415 156 662 121 069 103 857 6 519 855 6 612 950 6 271 724 6 806 466 6 972 276 6 688 282
01.06-30.09 37 487 44 651 47 659 45 178 38 039 27 846 11 205 055 11 365 050 10 778 616 11 197 364 11 371 662 10 798 429
(*) Provisional figures being updated with input from the MSs and the tomato sector.
(**) Base: production Market access (imports/consumption %) 2.7 2.9 3.21.1 0.9 0.8
Apparent consumption, kg per capita 35.4 35.9 34.2Exports/production %
0
500
1.000
1.500
2.000
2.500
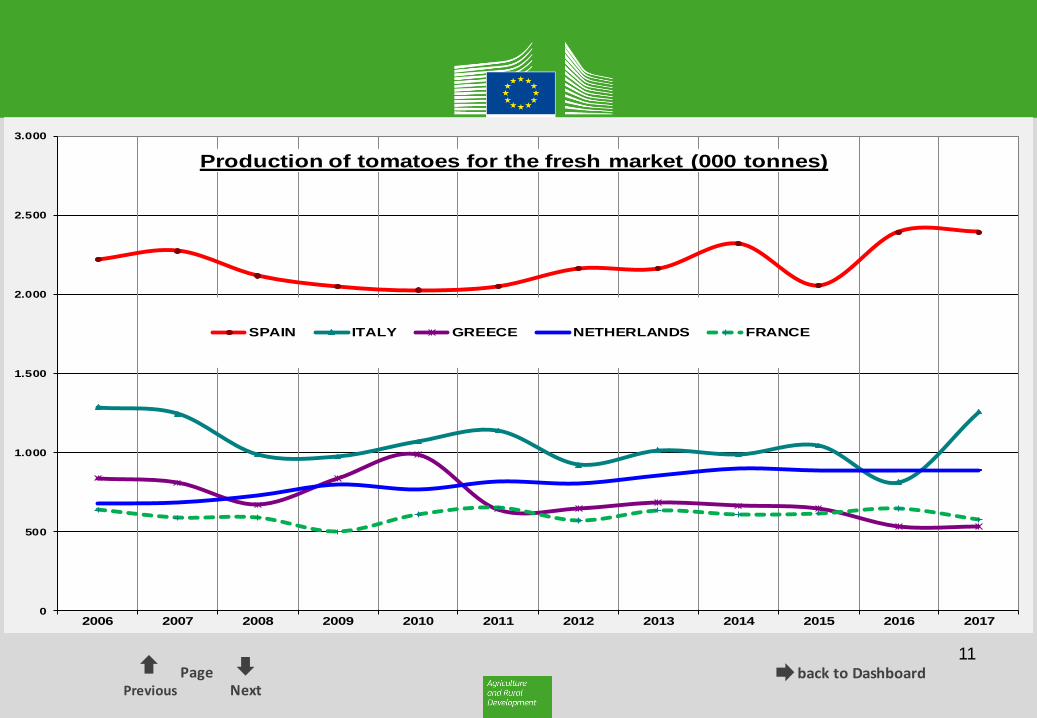
3.000
2006 2007 2008 2009 2010 2011 2012 2013 2014 2015 2016 2017
Production of tomatoes for the fresh market (000 tonnes)
SPAIN ITALY GREECE NETHERLANDS FRANCE
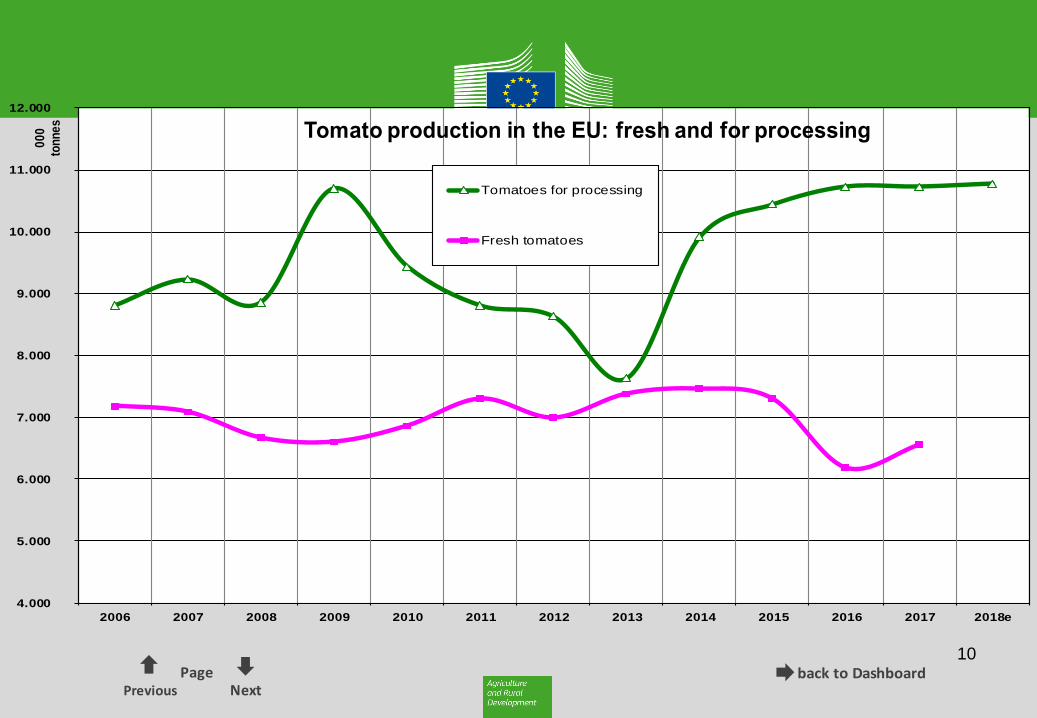
4.000
5.000
6.000
7.000
8.000
9.000
10.000
11.000
12.000
2006 2007 2008 2009 2010 2011 2012 2013 2014 2015 2016 2017 2018e
00
0
ton
ne
s
Tomato production in the EU: fresh and for processing
Tomatoes for processing
Fresh tomatoes
291.2
49
362.3
68
363.2
58
476.8
62
478.7
99
530.2
86
502.9
37
464.7
75
445.3
61
441.1
91
487.6
23
480.7
56
525.0
10
568.0
61
136.6
68
124.0
42 143.3
44 170.2
86
214.7
52
162.8
06
156.9
60
201.0
48
264.7
81
363.7
29
301.4
71
201.8
11
159.0
79
131.6
67
5.000
105.000
205.000
305.000
405.000
505.000
605.000
2004 2005 2006 2007 2008 2009 2010 2011 2012 2013 2014 2015 2016 2017
tonn
es
Extra-EU trade for tomatoes - calendar year data
IMPORT
EXPORT
2back to Dashboard
PreviousPage
Next
Further detail
94
8886
78 77
6564
61
75
144
118
126128
78
83
92
106
116114
139
80
8988
87
62
58
5351
6466 65
93
102
97
107
100
65
72
88
93
89
110
40
60
80
100
120
140
160
Jan Feb Mar Apr May Jun Jul Aug Sep Oct Nov Dec
EUROPEAN UNION - Tomato prices, weighted avg (€/100 kg )
2018 EU prices
2017 EU prices
Monthly 5 year Max
Monthly 5 year Min
5 year average
€/100 kg
Weighted averages by volume of production per MSOngoing adjustments on weights by variety group
5 year avg
back to DashboardPrevious
PageNext
3
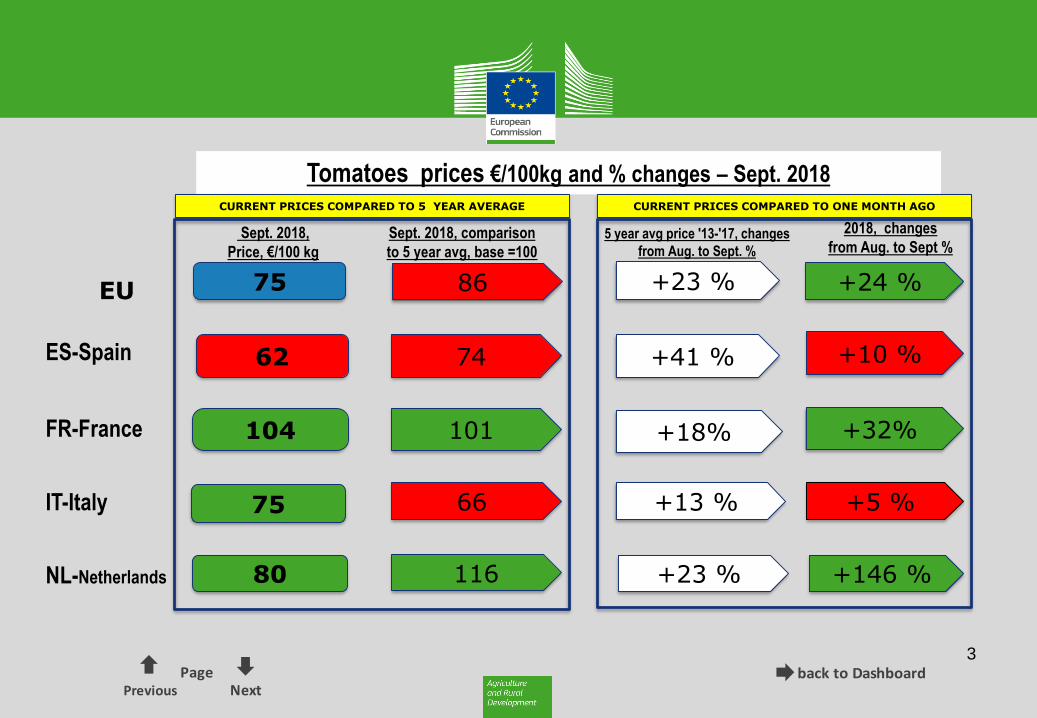
+23 %
+41 %
+18%
+13 %
75
62
104
75
86
74
101
66
EU
ES-Spain
FR-France
IT-Italy
Sept. 2018,
Price, €/100 kg
2018, changes
from Aug. to Sept %5 year avg price '13-'17, changes
from Aug. to Sept. %
Sept. 2018, comparison
to 5 year avg, base =100
Tomatoes prices €/100kg and % changes – Sept. 2018
+24 %
+10 %
+32%
+5 %
+23 %80 116NL-Netherlands +146 %
CURRENT PRICES COMPARED TO 5 YEAR AVERAGE CURRENT PRICES COMPARED TO ONE MONTH AGO
4back to Dashboard
PreviousPage
Next
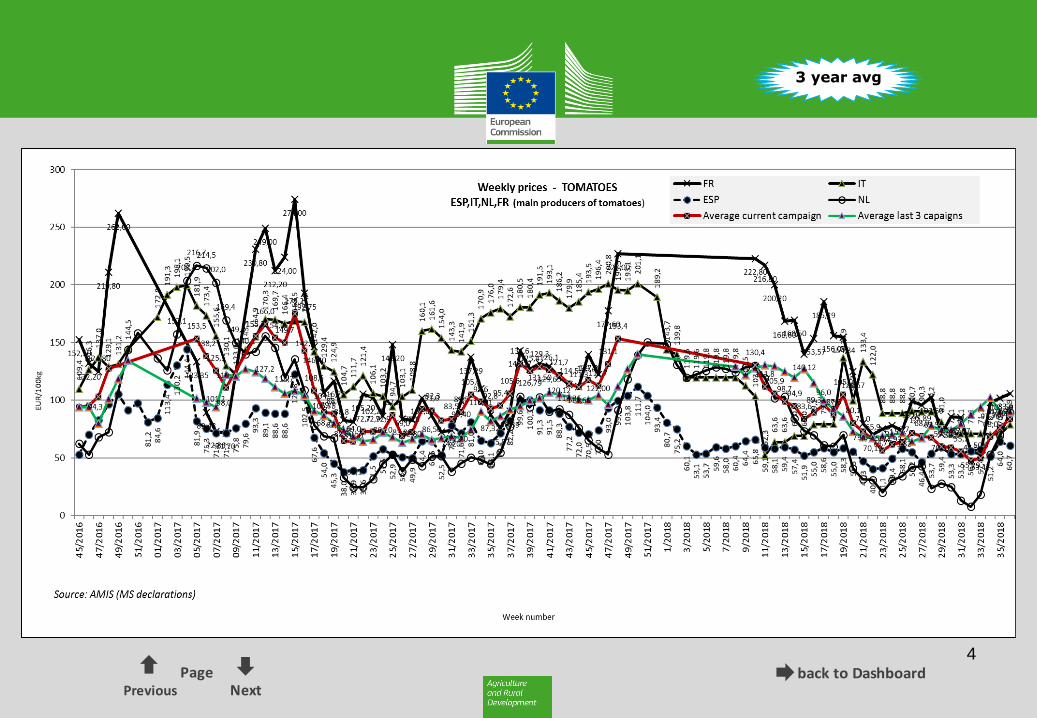
3 year avg

back to DashboardPrevious
PageNext
5
65
5961
56
5149
54
57
62
122
90
94
53
5864
72
105102
86
103
60
65
65
64
40 38
4548
58
48 49
63
84
72
80
72
4649
55
59
84 82
68
85
30
40
50
60
70
80
90
100
110
120
130
Jan Feb Mar Apr May Jun Jul Aug Sep Oct Nov Dec
SPAIN - Tomato prices, weighted avg (€/100kg )
2018 EU prices 2017 EU prices
Monthly 5 year Max Monthly 5 year Min
5 year average
€/100 kg
5 year avg
back to DashboardPrevious
PageNext
6
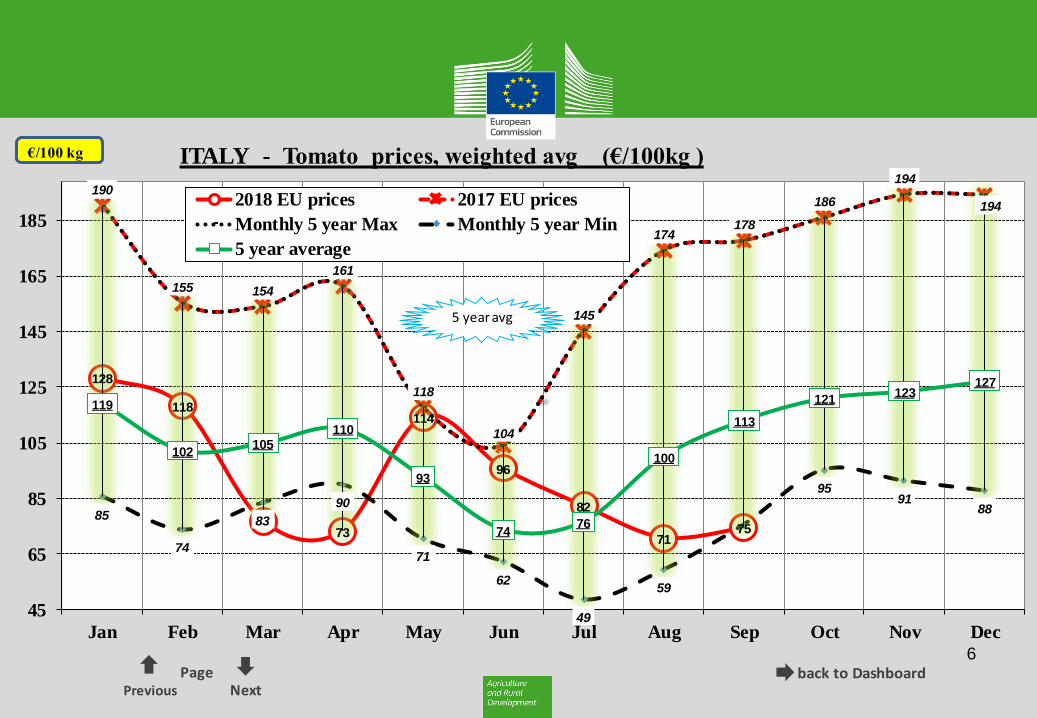
128
118
7773
114
96
82
7175
190
155 154
161
118
104
145
174178
186
194
194
85
74
83
90
71
62
49
59
9591
88
119
102105
110
93
7476
100
113
121123
127
45
65
85
105
125
145
165
185
Jan Feb Mar Apr May Jun Jul Aug Sep Oct Nov Dec
ITALY - Tomato prices, weighted avg (€/100kg )
2018 EU prices 2017 EU prices
Monthly 5 year Max Monthly 5 year Min
5 year average
€/100 kg
5 year avg
back to DashboardPrevious
PageNext
7
202
161
117
79
90
79
104
228
210
127
113 115
128 128
159
253
197
180
135
9582
7365
71
62
103
221213 212
169
108
95
87 87
102
111
137
236
50
75
100
125
150
175
200
225
250
Jan Feb Mar Apr May Jun Jul Aug Sep Oct Nov Dec
FRANCE - Tomato prices, weighted avg (€/100kg )
2018 EU prices 2017 EU prices
Monthly 5 year Max Monthly 5 year Min
5 year average
€/100 kg
5 year avg
back to DashboardPrevious
PageNext
8
129 127
108
75
47
31 2932
80
161
191
148
79
6965 66
91
76
140
88
135
7268
3836
4744
6358
21
95
131
153
115
88
5950
55 56
68
78
58
120
20
40
60
80
100
120
140
160
180
200
Jan Feb Mar Apr May Jun Jul Aug Sep Oct Nov Dec
Netherlands - Tomato prices, weighted avg (€/100kg )
2018 EU prices 2017 EU prices
Monthly 5 year Max Monthly 5 year Min
5 year average
€/100 kg
5 year avg
back to DashboardPrevious
PageNext
9
0
1.000
2.000
3.000
4.000
5.000
6.000
7.000
8.000
2006 2007 2008 2009 2010 2011 2012 2013 2014 2015 2016 2017
Total tomato production (fresh+processing) by Member State (000 tonnes)
ITALY SPAIN GREECE
PORTUGAL FRANCE ROMANIA
back to DashboardPrevious
PageNext
10
4.000
5.000
6.000
7.000
8.000
9.000
10.000
11.000
12.000
2006 2007 2008 2009 2010 2011 2012 2013 2014 2015 2016 2017 2018e
00
0
ton
ne
s
Tomato production in the EU: fresh and for processing
Tomatoes for processing
Fresh tomatoes
back to DashboardPrevious
PageNext
11
0
500
1.000
1.500
2.000
2.500
3.000
2006 2007 2008 2009 2010 2011 2012 2013 2014 2015 2016 2017
Production of tomatoes for the fresh market (000 tonnes)
SPAIN ITALY GREECE NETHERLANDS FRANCE
back to DashboardPrevious
PageNext
12

back to DashboardPrevious
PageNext
13
291.
249
362.
368
363.
258
476.
862
478.
799
530.
286
502.
937
464.
775
445.
361
441.
191
487.
623
480.
756
525.
010
568.
061
136.
668
124.
042
143.
344 17
0.28
6
214.
752
162.
806
156.
960
201.
048
264.
781
363.
729
301.
471
201.
811
159.
079
131.
667
5.000
105.000
205.000
305.000
405.000
505.000
605.000
2004 2005 2006 2007 2008 2009 2010 2011 2012 2013 2014 2015 2016 2017
tonn
es
Extra-EU trade for tomatoes - calendar year data
IMPORT
EXPORT

back to DashboardPrevious
PageNext
14
tonnes

back to DashboardPrevious
PageNext
15
back to DashboardPrevious
PageNext
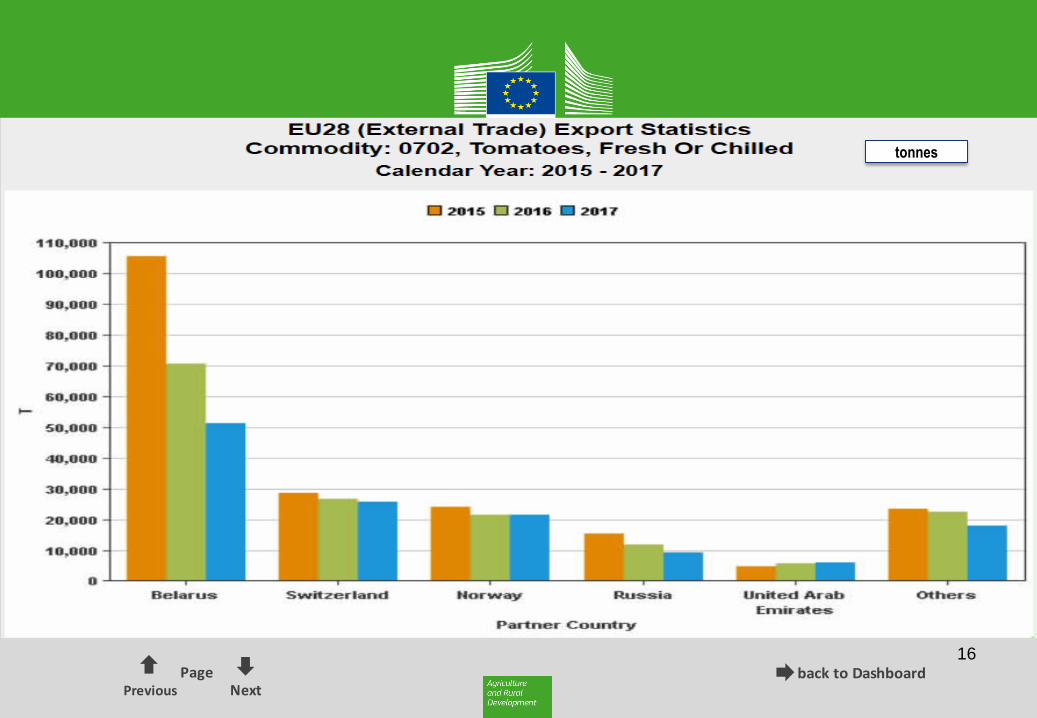
16
tonnes
back to DashboardPrevious
PageNext
17
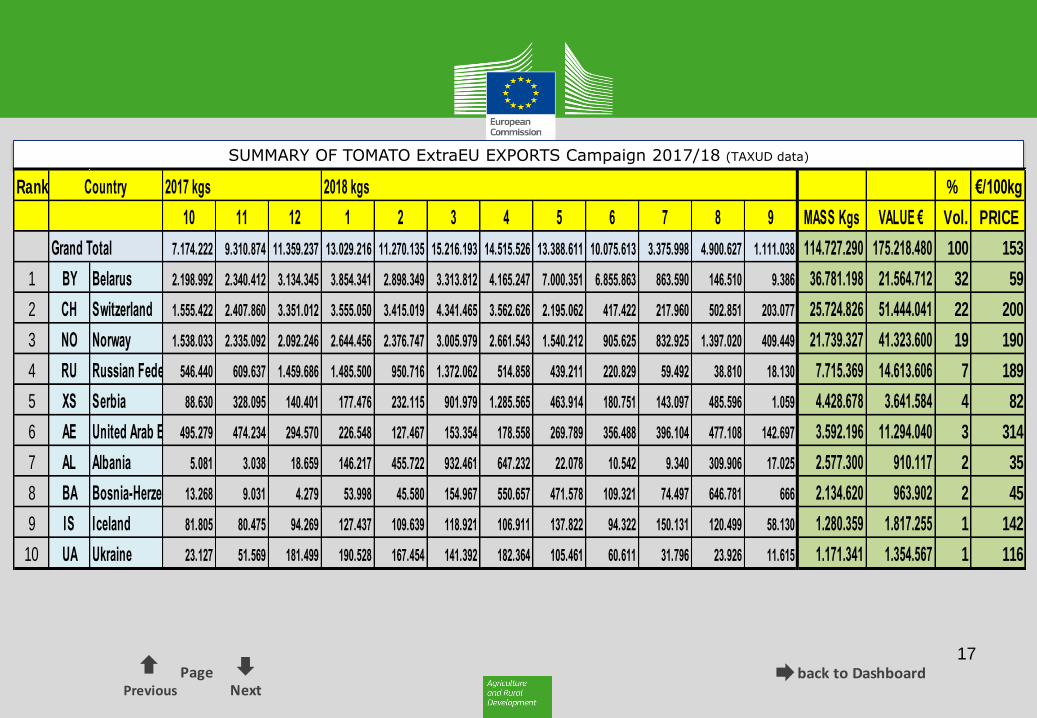
SUMMARY OF TOMATO ExtraEU EXPORTS Campaign 2017/18 (TAXUD data)
Rank 2017 kgs 2018 kgs % €/100kg
10 11 12 1 2 3 4 5 6 7 8 9 MASS Kgs VALUE € Vol. PRICE
Grand Total 7.174.222 9.310.874 11.359.237 13.029.216 11.270.135 15.216.193 14.515.526 13.388.611 10.075.613 3.375.998 4.900.627 1.111.038 114.727.290 175.218.480 100 153
1 BY Belarus 2.198.992 2.340.412 3.134.345 3.854.341 2.898.349 3.313.812 4.165.247 7.000.351 6.855.863 863.590 146.510 9.386 36.781.198 21.564.712 32 59
2 CH Switzerland 1.555.422 2.407.860 3.351.012 3.555.050 3.415.019 4.341.465 3.562.626 2.195.062 417.422 217.960 502.851 203.077 25.724.826 51.444.041 22 200
3 NO Norway 1.538.033 2.335.092 2.092.246 2.644.456 2.376.747 3.005.979 2.661.543 1.540.212 905.625 832.925 1.397.020 409.449 21.739.327 41.323.600 19 190
4 RU Russian Federation546.440 609.637 1.459.686 1.485.500 950.716 1.372.062 514.858 439.211 220.829 59.492 38.810 18.130 7.715.369 14.613.606 7 189
5 XS Serbia 88.630 328.095 140.401 177.476 232.115 901.979 1.285.565 463.914 180.751 143.097 485.596 1.059 4.428.678 3.641.584 4 82
6 AE United Arab Emirates495.279 474.234 294.570 226.548 127.467 153.354 178.558 269.789 356.488 396.104 477.108 142.697 3.592.196 11.294.040 3 314
7 AL Albania 5.081 3.038 18.659 146.217 455.722 932.461 647.232 22.078 10.542 9.340 309.906 17.025 2.577.300 910.117 2 35
8 BA Bosnia-Herzegovina13.268 9.031 4.279 53.998 45.580 154.967 550.657 471.578 109.321 74.497 646.781 666 2.134.620 963.902 2 45
9 IS Iceland 81.805 80.475 94.269 127.437 109.639 118.921 106.911 137.822 94.322 150.131 120.499 58.130 1.280.359 1.817.255 1 142
10 UA Ukraine 23.127 51.569 181.499 190.528 167.454 141.392 182.364 105.461 60.611 31.796 23.926 11.615 1.171.341 1.354.567 1 116
Country
back to DashboardPrevious
PageNext
18
Key market balance indicators for the follow up of the tomato marketTomatoes (tonnes)
Mois Extra-EU Imports Extra-EU exports EU commercialisation** EUR consumption estimates *
2015 2016 2017 2015 2016 2017 2015 2016 2017 2015 2016 20171 59 637 66 411 69 564 15 428 14 804 11 162 303 597 307 932 292 043 347 806 359 539 350 445
2 60 493 66 970 79 843 16 329 15 720 12 833 295 187 299 402 283 953 339 352 350 652 350 963
3 70 374 92 645 94 688 19 237 15 167 13 867 425 948 432 030 409 738 477 085 509 509 490 559
4 49 612 49 605 67 070 27 199 23 219 15 899 585 613 593 975 563 326 608 026 620 362 614 497
5 30 589 33 146 31 081 32 201 18 934 20 767 885 481 898 125 851 782 883 870 912 337 862 096
6 10 968 13 423 16 633 21 741 24 660 12 296 1 103 253 1 119 006 1 061 266 1 092 479 1 107 770 1 065 603
7 7 103 10 656 11 185 14 300 4 965 6 879 1 795 066 1 820 697 1 726 750 1 787 869 1 826 388 1 731 056
8 5 462 10 399 8 397 4 420 4 111 4 241 2 320 225 2 353 355 2 231 922 2 321 267 2 359 643 2 236 078
9 13 954 10 172 11 444 4 717 4 303 4 430 5 986 512 6 071 992 5 758 679 5 995 748 6 077 861 5 765 693
10 45 693 27 126 39 774 10 917 9 138 7 690 3 108 167 3 152 547 2 989 877 3 142 943 3 170 536 3 021 961
11 60 936 59 819 61 570 14 759 12 339 9 698 509 235 516 506 489 855 555 412 563 986 541 727
12 65 938 84 675 76 825 20 591 11 750 11 941 406 626 412 432 391 150 451 972 485 357 456 034
Total 480 760 525 046 568 074 201 840 159 108 131 703 17 724 910 17 978 000 17 050 340 18 003 830 18 343 938 17 486 711
01.10-31.05 443 274 480 395 520 415 156 662 121 069 103 857 6 519 855 6 612 950 6 271 724 6 806 466 6 972 276 6 688 282
01.06-30.09 37 487 44 651 47 659 45 178 38 039 27 846 11 205 055 11 365 050 10 778 616 11 197 364 11 371 662 10 798 429
(*) Provisional figures being updated with input from the MSs and the tomato sector.
(**) Base: production Market access (imports/consumption %) 2.7 2.9 3.21.1 0.9 0.8
Apparent consumption, kg per capita 35.4 35.9 34.2Exports/production %
back to DashboardPrevious
PageNext
19Further detail
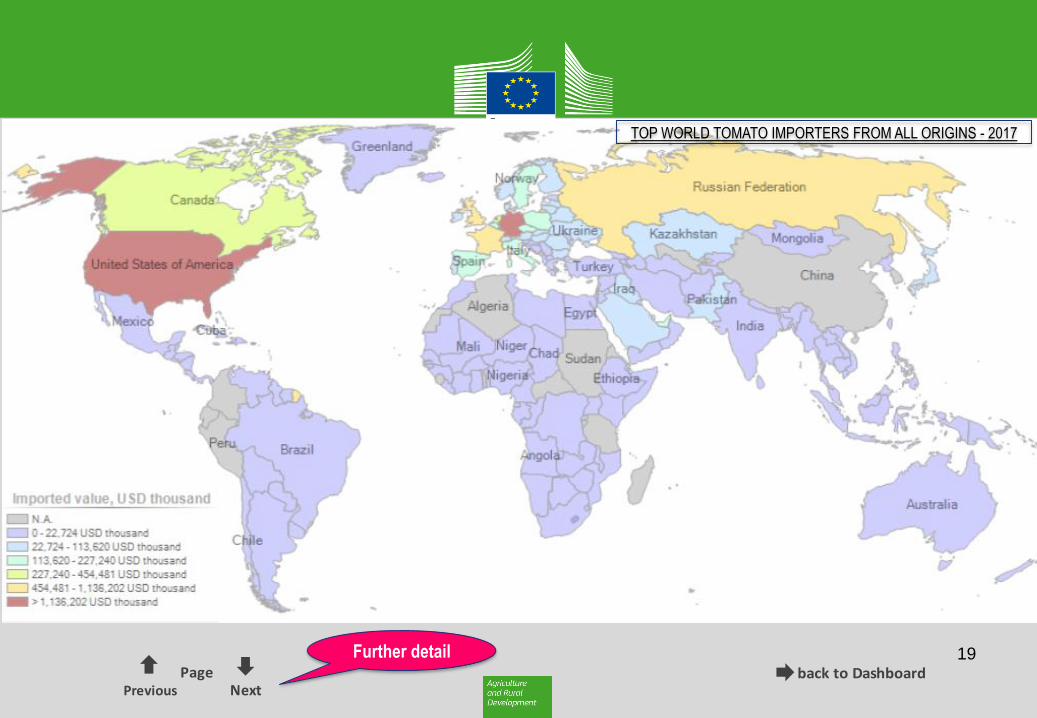
TOP WORLD TOMATO IMPORTERS FROM ALL ORIGINS - 2017
back to DashboardPrevious
PageNext
20
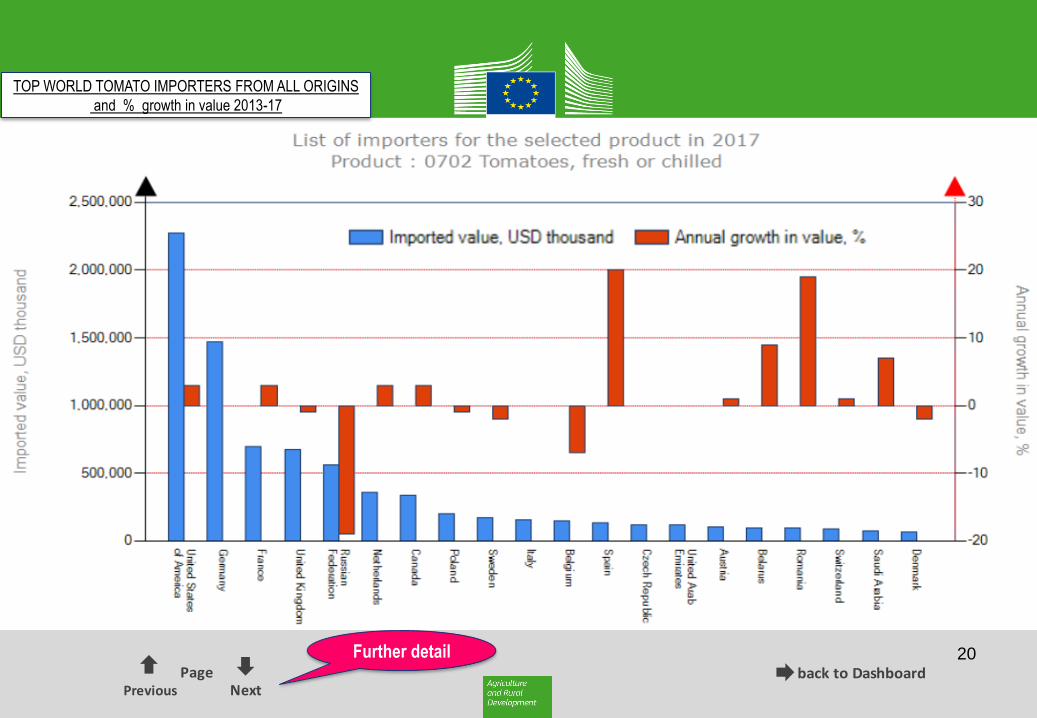
TOP WORLD TOMATO IMPORTERS FROM ALL ORIGINS
and % growth in value 2013-17
Further detail
back to DashboardPrevious
PageNext
21
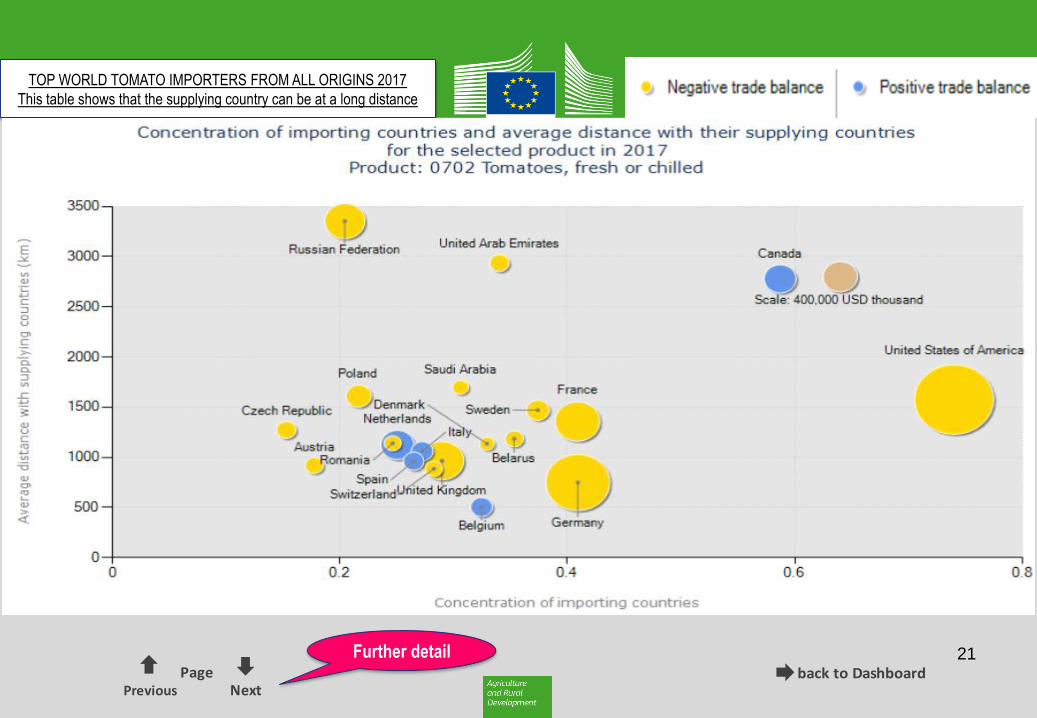
TOP WORLD TOMATO IMPORTERS FROM ALL ORIGINS 2017
This table shows that the supplying country can be at a long distance
Further detail

back to DashboardPrevious
PageNext
22
TOP WORLD TOMATO IMPORTERS FROM ALL ORIGINS
back to DashboardPrevious
PageNext
23
End