Embed Size (px)
DESCRIPTION
Extract: Mining Social Features from WLAN Traces: A Gender-Based Case Study . By Udayan Kumar Ahmed Helmy University of Florida. Presented by Ahmed Alghamdi. Outline. Introduction Motivations Challenges and Research Questions Contribution Approach - PowerPoint PPT Presentation
Citation preview
EXTRACT: MINING SOCIAL FEATURES FROM WLAN TRACES: A GENDER-BASED CASE STUDY
ByUdayan Kumar Ahmed Helmy
University of Florida
Presented byAhmed Alghamdi
2
Outline
Introduction Motivations Challenges and Research Questions Contribution Approach
Location Based Classification (LBC) Group Behavior Based Filtering (GBF) Hybrid filtering (HF) Name Based Classification (NBC)
Validation of (LBC) Temporal Consistency Validation IBF vs. GBF Cross Validation
User Behavior Analysis User Spatial Distribution Average Duration or Temporal Analysis
Device Preference Application Conclusion
3
Introduction
WLAN traces to understand mobile user characteristics and behavior
Essential to network modeling and designing This paper provide techniques to classify WLAN
users into social groups By area By users’ info
it presents general methodology with an example case study of grouping by gender with investigation of gender gaps in WLAN usage
4
Introduction
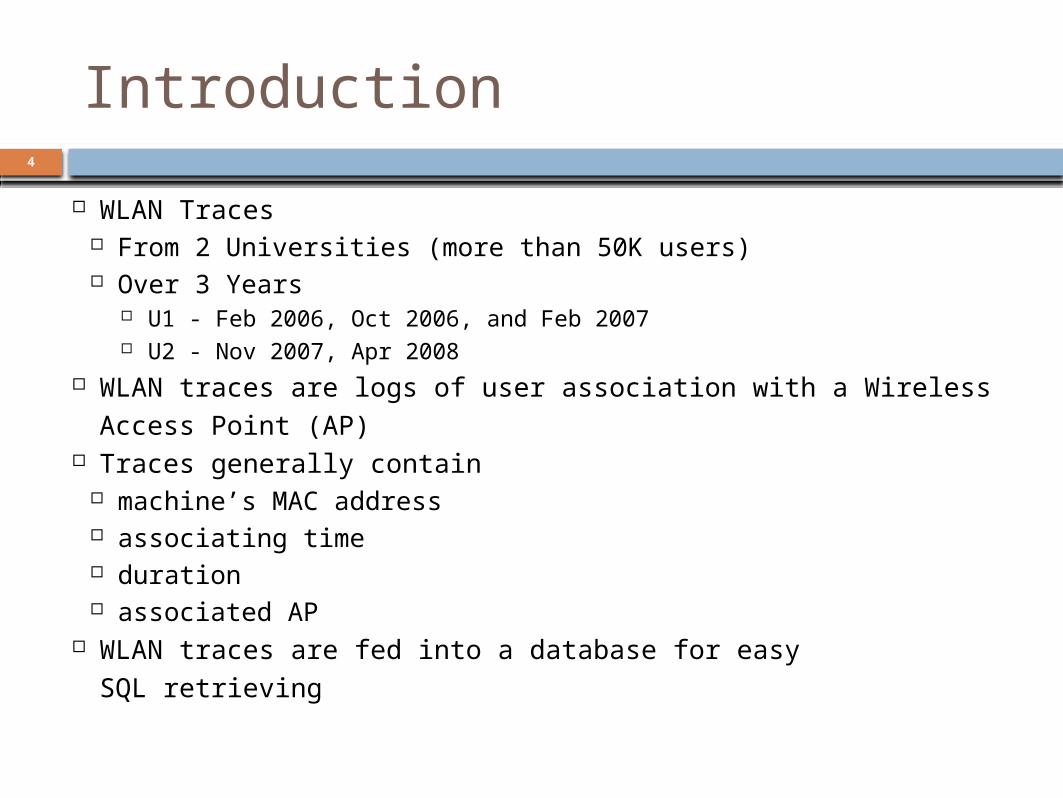
WLAN Traces From 2 Universities (more than 50K users) Over 3 Years
U1 - Feb 2006, Oct 2006, and Feb 2007 U2 - Nov 2007, Apr 2008
WLAN traces are logs of user association with a Wireless Access Point (AP) Traces generally contain
machine’s MAC address associating time duration associated AP
WLAN traces are fed into a database for easy SQL retrieving
5
Motivations
Mobile devices becomes tightly coupled to users Communication performance is bound to user
mobility and behavior In AdHoc networks, any node can act as a router It is imperative to understand the various aspects of
user behavior to design efficient protocols and effective network models
6
How can we meaningfully infer gender information from such anonymous traces?
Does gender information influence user behavior and preference in a significant and consistent manner?
what is the impact of these finding on network modeling, protocol and service design in the future?
Challenges and Research Questions
7
Class and gender inference methods based on location, usage and name filtering from extensive WLAN traces
Providing the first gender-based trace-driven analysis in mobile societies, including study of majors and device preferences
Identifying unique features in the studied grouping that suggests consistent behavior and the design of potential future applications
Contributions
8
gender classification on campus Location-based method
Based on individual and group network behavior Analysis of WLAN traces
Cross validation with ground truth using Name based method 90% Accuracy
Usage patterns of males and females are different Gender does affect user activity and vendor preference This contribution enhances the understanding of the
mobile society It is essential to provide efficient network protocols
and services in the future
Approach
9
Gender-Based Grouping Location Based Classification (LBC) Name Based Classification (NBC)
Approach
10
Sororities APs - female Fraternities APs - males CS Dept. APs - CS Students Visitors Filtering Visitor
Is a user with less number of sessions and smaller duration of sessions than the average user in that location(group behavior)
Or as user who has more sessions and larger online duration at other locations (individual behavior)
Location Based Classification (LBC)
11
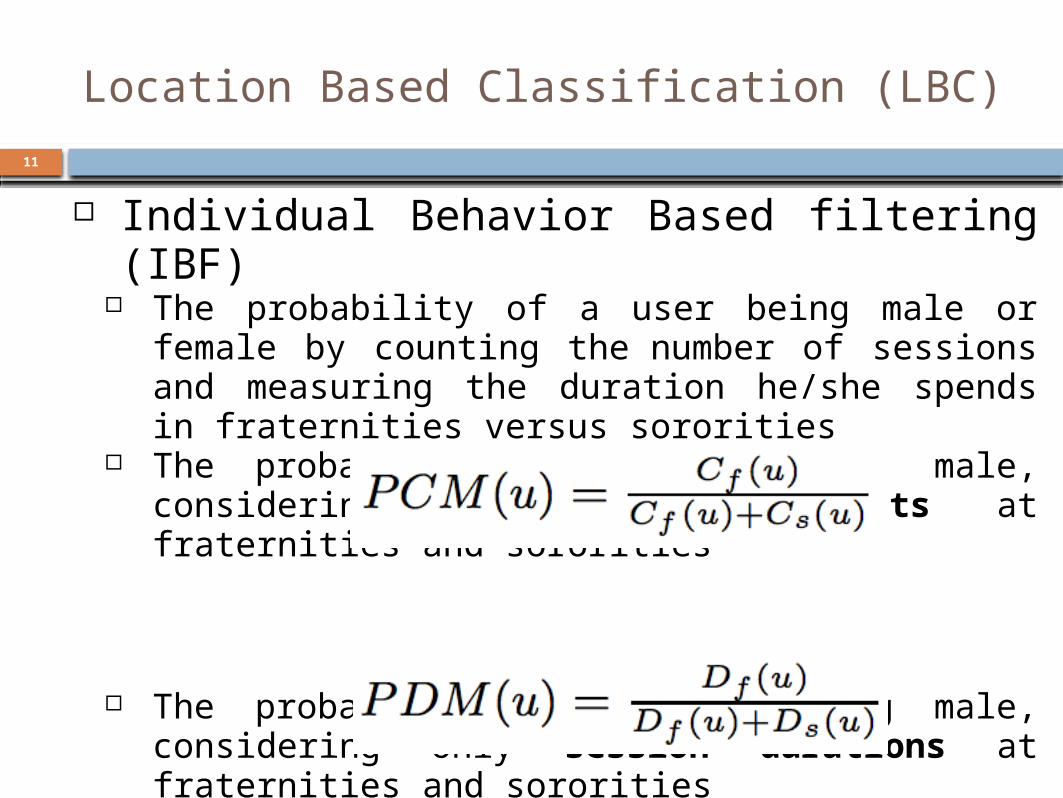
Individual Behavior Based filtering (IBF) The probability of a user being male or female by counting
the number of sessions and measuring the duration he/she spends in fraternities versus sororities
The probability of a user being male, considering only session counts at fraternities and sororities
The probability of a user being male, considering only session durations at fraternities and sororities
Location Based Classification (LBC)
12
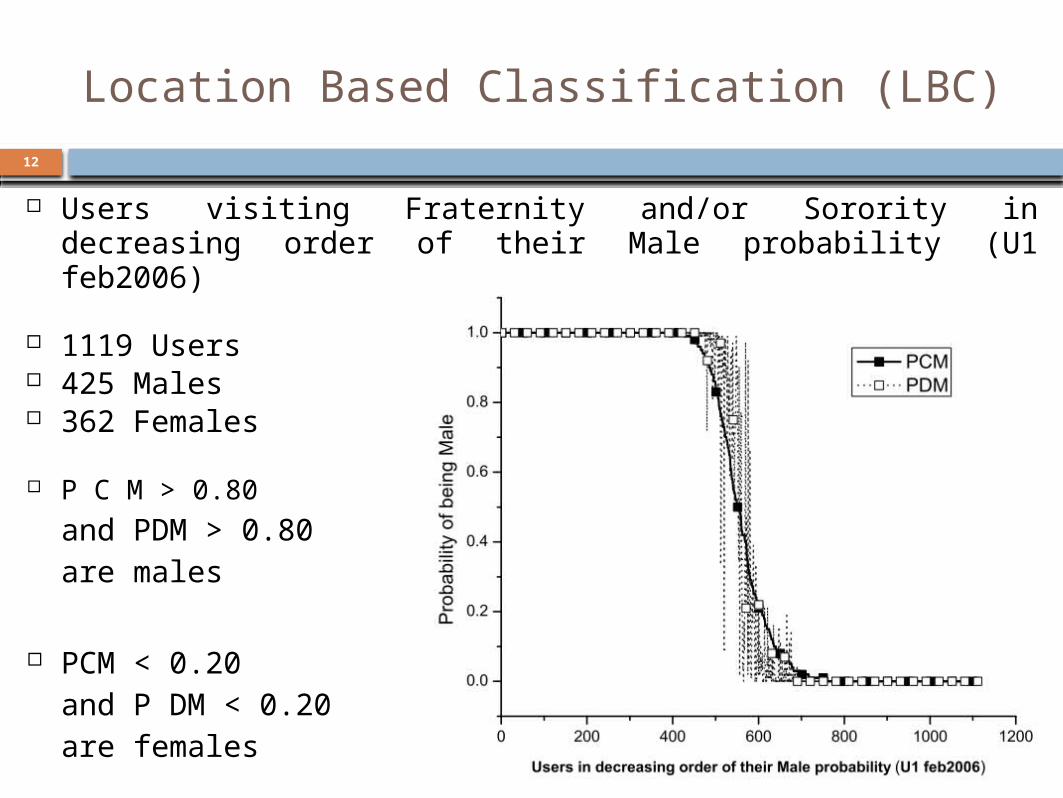
Users visiting Fraternity and/or Sorority in decreasing order of their Male probability (U1 feb2006)
1119 Users 425 Males 362 Females
P C M > 0.80and PDM > 0.80are males
PCM < 0.20and P DM < 0.20are females
Location Based Classification (LBC)
13
filter a user based on where his usage pattern lies with respect to all the users at a particular location
Find a Threshold All users satisfy threshold are male or female due to the AP
location All other users are visitors
Group Behavior Based Filtering (GBF)
14
Clustering: is dividing a set of users into several subsets such that users in each subset are most similar based on WLAN usage metrics (duration, session count, distinct login days)
Metrics for user evaluation Number of distinct days of login Session count Sum of session durations
By applying clustering technique to Sororities and Fraternity user trace from both Universities U1 and U2
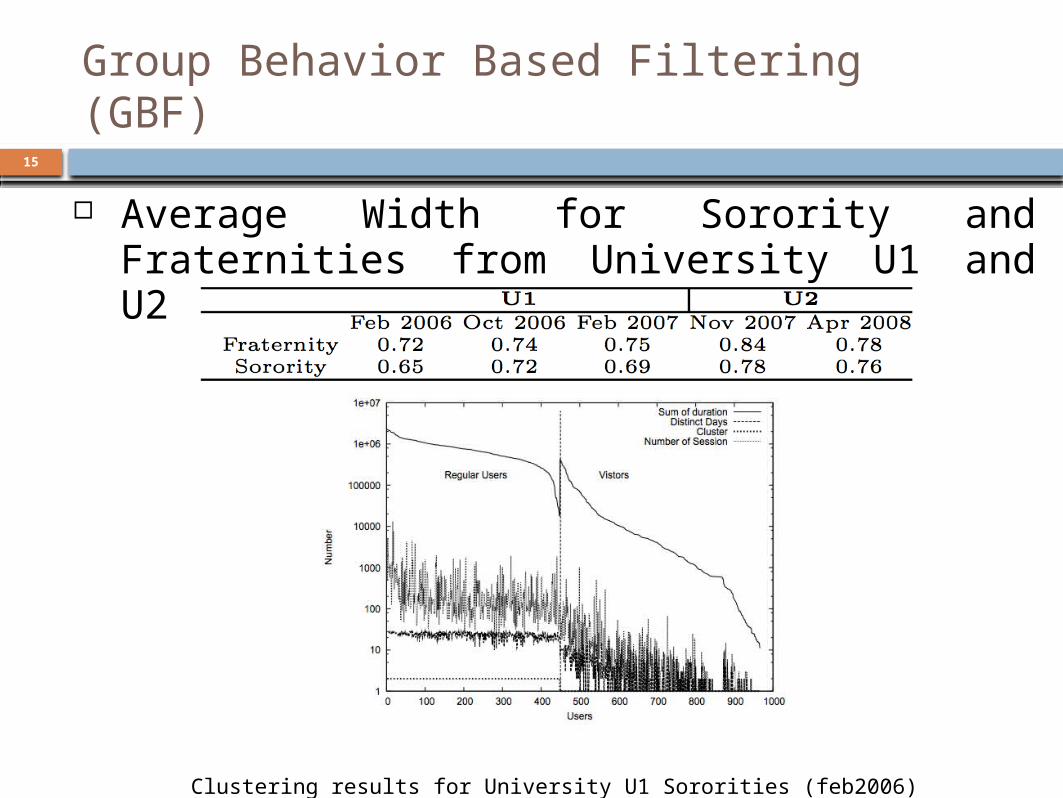
Best Cluster Size is 2 (Regular/Visitor) Maximum width is 0.84 Minimum width is 0.65
Group Behavior Based Filtering (GBF)
15
Average Width for Sorority and Fraternities from University U1 and U2
Clustering results for University U1 Sororities (feb2006)
Group Behavior Based Filtering (GBF)
16
classification validation compare the results from IBF and GBF
methods mainly select same set of users, which should be the case as both methods attempt to identify regular users
for high confidence, choose the users selected by both filtering methods
more than 90% of the users selected by GBF are common to users selected by IBF
Hybrid filtering (HF)
17
Usernames obtained on campuses that require authorization mechanism to access WLAN
Traces coming from university U2 provide us with usernames University U2 also host a directory that can be searched using these usernames
By Searching the directory first names corresponding to these usernames obtained
from the US Social Security administration, a list of top 1000 males and females first names is used and the names present in both lists (neutral names) are removed
this list is compared to the list obtained from university U2 directory
Name Based Classification (NBC)
18
11,000 out of 27,000 users classified as males or females in the trace period of Nov 2007
12,500 out of 30,000 users classified as males or females in the trace period of Apr 2008
foreign national students non-popular names
Name Based Classification (NBC)
19
Validation of LBC is needed to raise confidence in the results
Three statistical methods to validate filtering mechanisms
1. temporal consistency: this method finds out regular users in the trace set belonging to adjacent months and compares this list to see how many are common
2. IBF vs GBF: this method compares results from IBF and GBF to check the similarities in the results
3. Cross Validation: this method takes the classification achieved using NBC method and compares it with the results of LBC
Validation of (LBC)
20
Multiple one-month traces from one semester Apply IBF, GBF and HF to find out the common users in
all adjacent months before and after filtering Because users living in fraternities and sororities do not
change from one month to another in the same semester, after filtering, the percentage of common users should increase
Temporal Consistency Validation
21
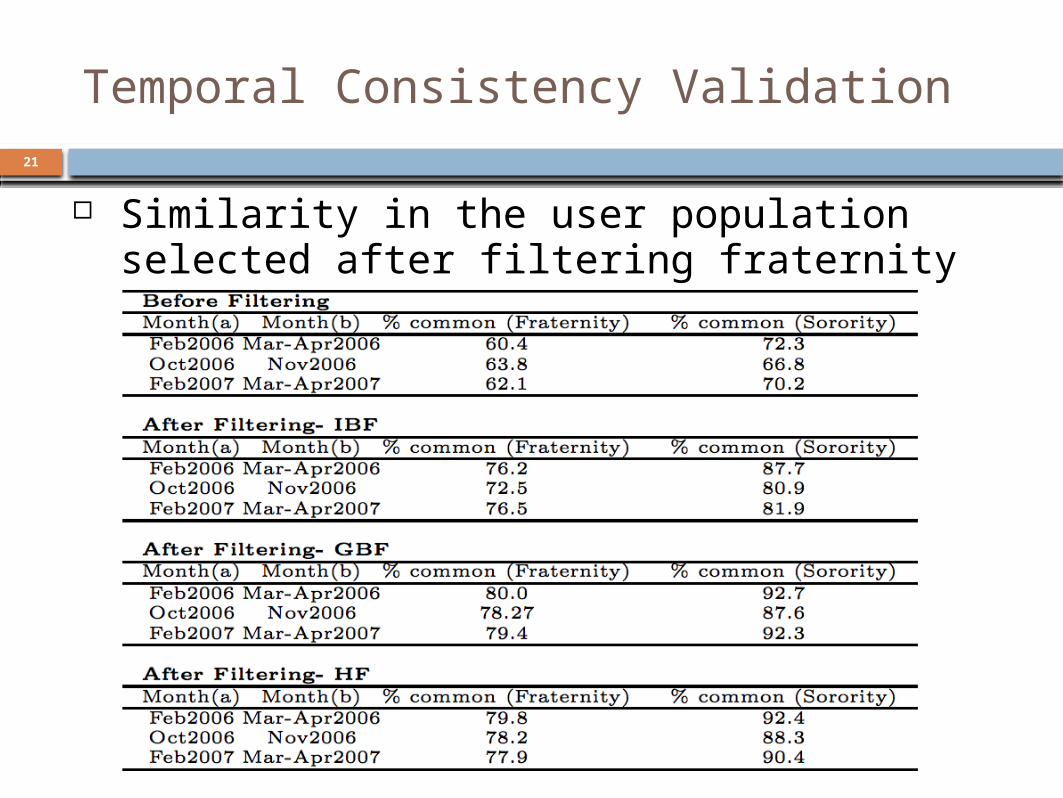
Similarity in the user population selected after filtering fraternity users for U1
Temporal Consistency Validation
22
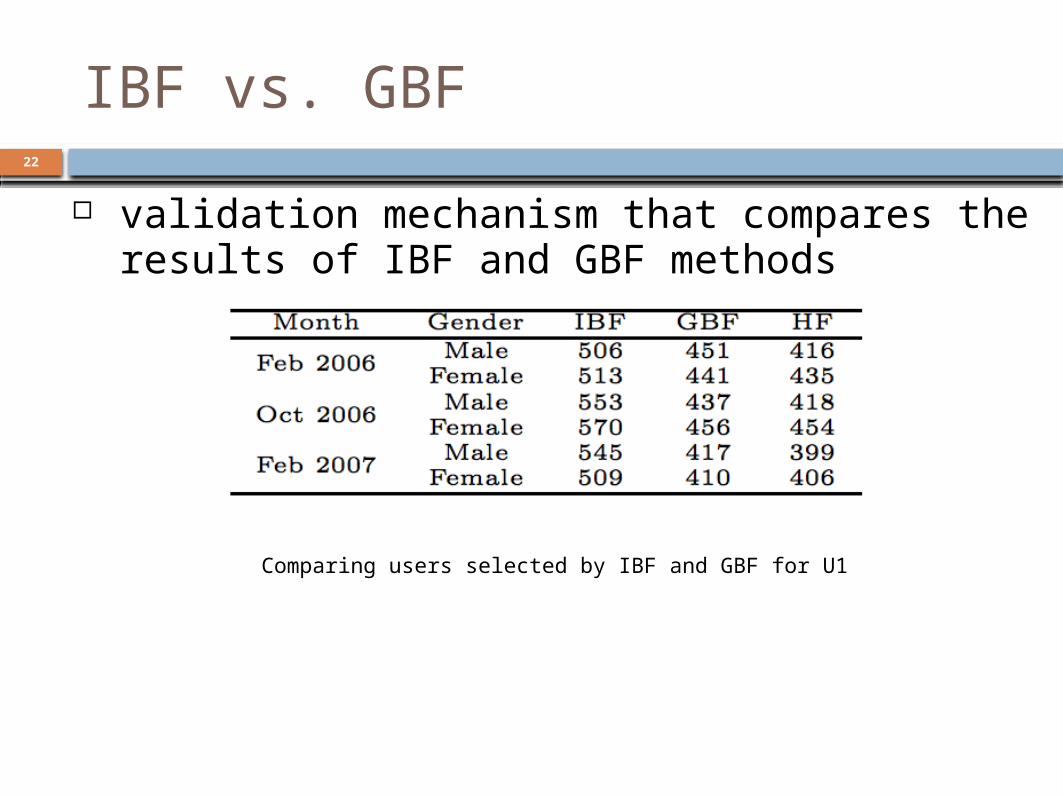
validation mechanism that compares the results of IBF and GBF methods
Comparing users selected by IBF and GBF for U1
IBF vs. GBF
23
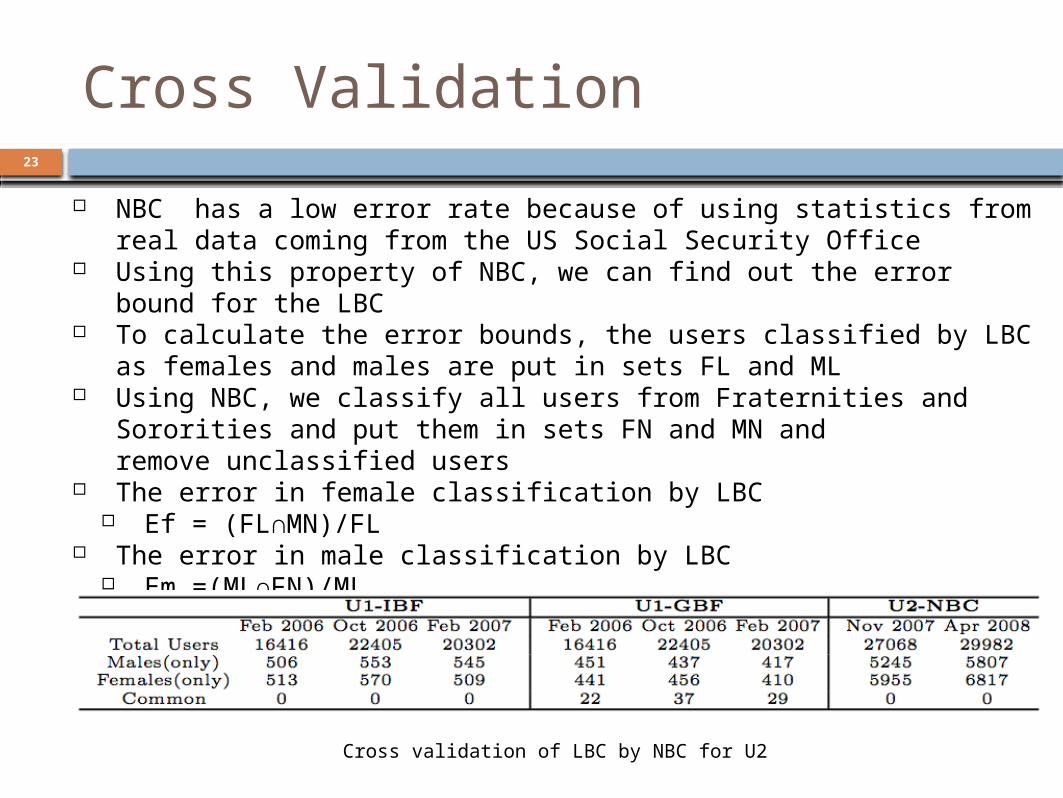
NBC has a low error rate because of using statistics from real data coming from the US Social Security Office
Using this property of NBC, we can find out the error bound for the LBC To calculate the error bounds, the users classified by LBC as females and
males are put in sets FL and ML Using NBC, we classify all users from Fraternities and Sororities and put them
in sets FN and MN and remove unclassified users The error in female classification by LBC
Ef = (FL∩MN)/FL The error in male classification by LBC
Em =(ML∩FN)/ML
Cross validation of LBC by NBC for U2
Cross Validation
24
Group classification to understand usage differences between groups
Gender based grouping Male Female Unclassified
Groups evaluated on multiple metrics depending on the application
This paper examines the existence of differences between genders, they used the metrics
spatio-temporal distribution for wireless usage vendor preference
User Behavior Analysis
25
This metrics can identify where users spend most of their time
Difference in the number of users among the genders can tell us about the building preferences of the genders
Existence of locations, which are consistently preferred by one of the two genders, highlights the existence of difference in WLAN usage by two genders
User Spatial Distribution
26
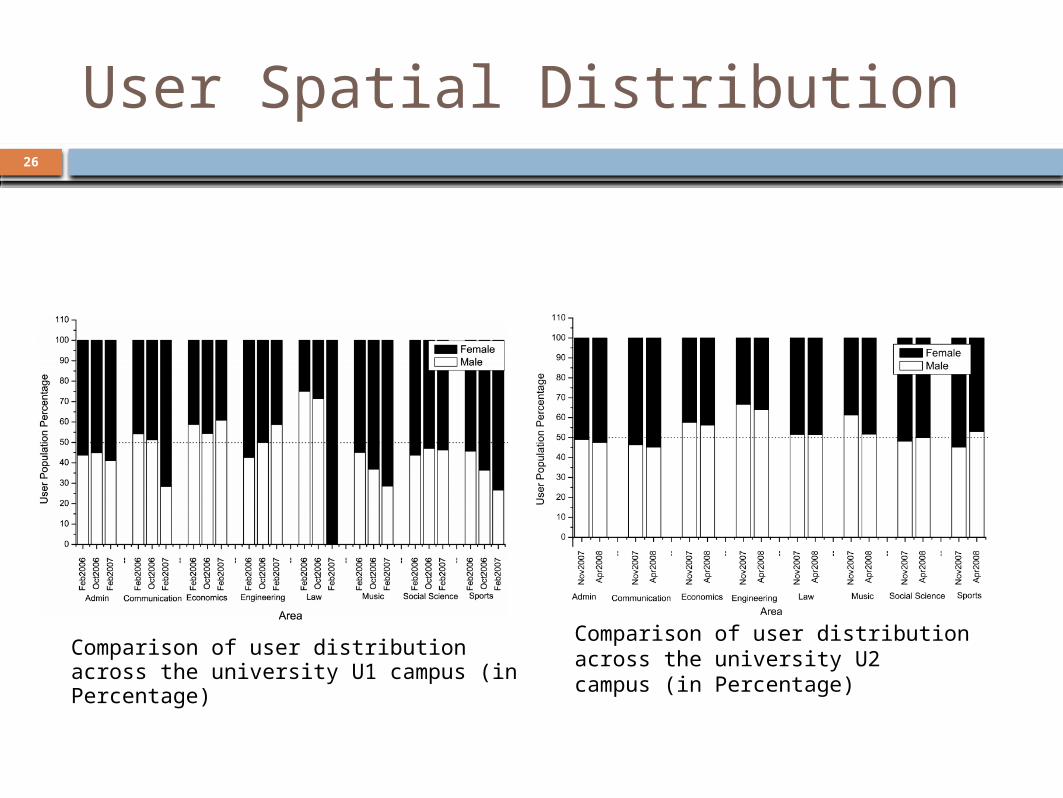
Comparison of user distribution across the university U1 campus (in Percentage)
Comparison of user distribution across the university U2 campus (in Percentage)
User Spatial Distribution
27
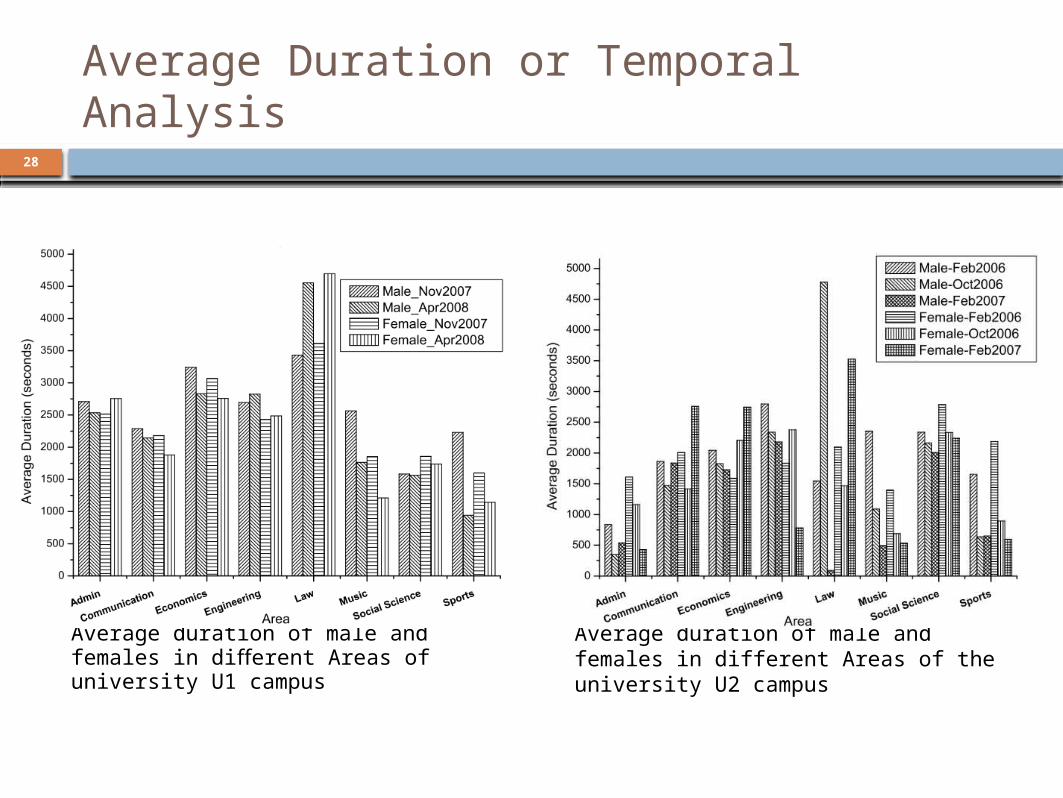
Average duration of a session for males and females gives us an understanding of the extent of WLAN usage at different areas
Average Duration or Temporal Analysis
28
Average duration of male and females in different Areas of university U1 campus
Average duration of male and females in different Areas of the university U2 campus
Average Duration or Temporal Analysis
29
Some of these differences were found to be significant and spatio-temporally consistent even across campuses; females’ wireless activity is stronger in Social Science and Sports areas, whereas males’ activity is stronger in Engineering and Music
Average Duration or Temporal Analysis
30
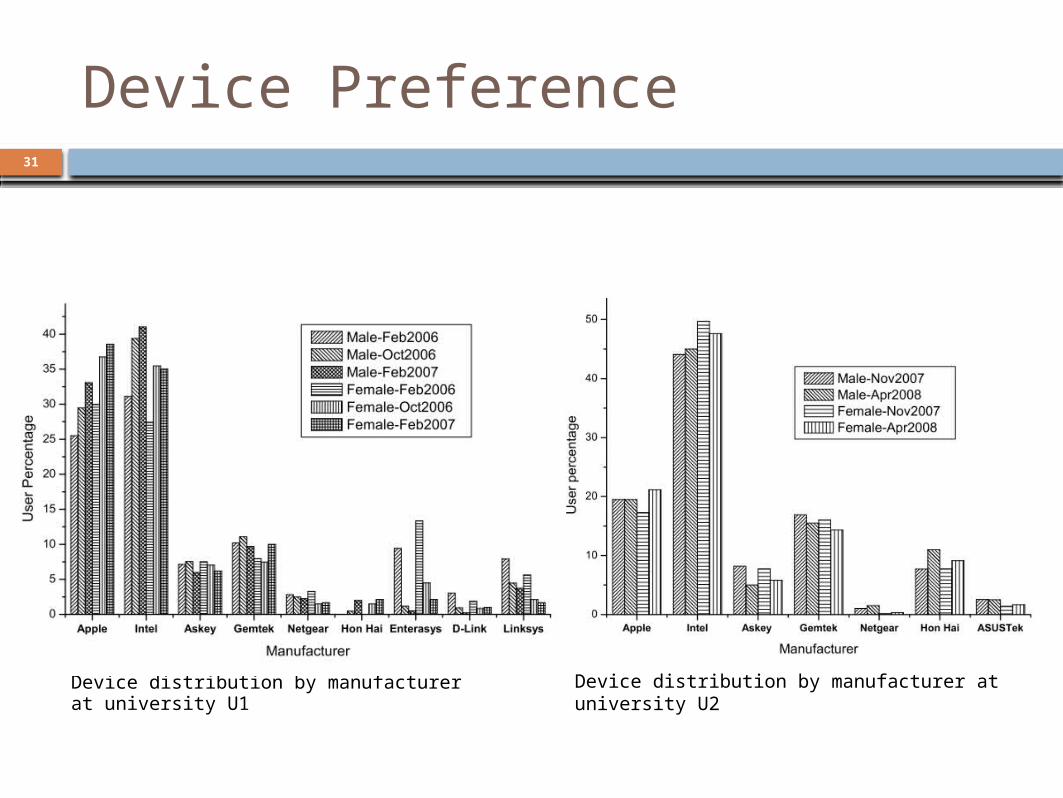
MAC address is used to find preferred vendors for the groups
To test whether gender provides a bias towards specific vendors, the Chi-Square statistical significance test is used
The Chi-Square test shows with 90% confidence that there is a bias between gender and vendor/brand
Device Preference
31
Device distribution by manufacturer at university U1 Device distribution by manufacturer at university U2
Device Preference
32
The results from these metrics ca be applied to an application to make it context sensitive
Mobility Models Mobility models are important tools to understand user
movements and create models on which protocols can be tested
Protocol Design Protocol and service design in Mobile Ad-Hoc networks can
take features of various groups to evaluate its performance Privacy
Applications
This paper proposes novel methods, which use WLAN traces to classify WLAN users in to social groups based on features such as gender and study-major among others
It presents a general framework that can be applied to traces coming from multiple sources
there is a distinct difference in WLAN usage patterns for different genders even with similar population sizes
Conclusion 33