Embed Size (px)
Citation preview

COMMENTARY – Extracting the Most Value from Canada’s Petroleum1
Extracting the Most Value from Canada’s PetroleumPhilip Cross
The appearance early in 2013 of a substantial discount for the price of Canada’s crude oil compared with international prices provoked a public debate on how to maximize the value of Canada’s oil resources. Many suggested that refining more crude oil domestically would boost its price and add value farther down the chain of petroleum production (Clarke et al. 2013). This harkens back to the decades-old controversy about the role that resource staples play in Canada’s long-term economic development and their impact on manufacturing.
The debate raises more fundamental questions, such as: Why does Canada export much more crude oil than refined petroleum products? What caused the discount in the price of crude oil? Is it best addressed by more transportation or more manufacturing? Is it worth investing in pipelines to transport crude oil to Eastern Canada? Is processing more raw natural resources in Canada a sound industrial strategy? Who would benefit from more refining in Canada – consumers or producers? And, given the existing excess capacity in the wake of the recent economic downturn, will refineries make the investments needed to process the heavier type of crude from the oil sands? These questions must be answered before firms embark on the large investments needed to expand the transportation network or upgrade refineries.
This short commentary addresses some of these basic issues. First, it explains the price discount for Canadian heavy oil. It then examines where the most value is created as oil is discovered, extracted, upgraded, transported to the refinery, refined, and delivered to the end user. It concludes by exploring the match between the crude oils that Canada produces, what Canadian refineries are capable of processing profitably, the investment being made to connect the two, and who will benefit. It finds that all industries related to petroleum in Canada are expanding, led by extraction and transportation.
The author of this document has worked independently and is solely responsible for the views presented here. The opinions are not necessarily those of the Macdonald-Laurier Institute, its Directors or Supporters.
October 2013

COMMENTARY – Extracting the Most Value from Canada’s Petroleum2
The Price Discount for Western Canadian OilThere are over 150 grades of crude oil in the world, most with slightly different prices. These price gaps reflect the different value of various oils to refiners, with lighter, sweeter grades fetching higher prices because they are less expensive to process or can more easily be converted into products that yield higher prices.
Normally, crude oil prices move in tandem, with a steady, predictable gap between the different grades of crude (see chart 1).
CHART 1 Crude oil prices, imports and exports, 2003–2013
However, starting late in 2011, an unprecedented and sustained gap began to open up between the price for Canadian imports of crude oil and the price for its exports of crude (chart 1 rebases the level of both prices to 2007=100, and then shows how the two moved over time). The cause of this gap ranged from political turmoil in Libya reducing the supply of light oil (especially for Europe) to the increasing supply of oil landlocked in North America by limited pipeline capacity. As well, more bitumen was shipped to refineries without being upgraded to synthetic crude oil. This reflected a lower price differential between synthetic crude oil and light crude oil prices after the 2008 recession.
Although supplies from Libya returned to normal in 2012, the price differential between exports and imports continued to widen, hitting a record high early in 2013. This prompted fears that the gap was being sustained by the prospect of steadily rising production of bitumen from the oil sands, which would depress its price (illustrating the principle of supply and demand). The fact that the price for light oil from the Bakken shale oil field in North Dakota also sold at a discount from world prices demonstrated that the discounts originated in the logistics of transportation, not an oversupply of bitumen.
Trapped by a lack of pipeline capacity in the interior of North America, the price gap widened between Western Canadian oil (as reflected in the price of Lloydblend in chart 2 below) and the lighter grades traded on world markets (such as Brent and West Texas Intermediate).
CHART 2 WTI, Brent, and Lloydblend prices, 2009–2013
This price differential was important for several reasons. It meant Canada received lower prices for its oil exports. If Canadian export prices had followed the path of imported oil prices after 2010, export earnings could have been as much as $18 billion higher from the first quarter of 2011 to the second quarter of 2013.1 This shortfall reduced industry profits in Canada and government tax revenues. The price differential narrowed considerably by the summer of 2013.
However, not everyone lost because of the price discount for heavy oils. Refineries in Western Canada and the US Midwest that were configured to process heavy oil or located near new shale oil fields reaped
40
60
80
100
120
140
160
180
03 04 05 06 07 08 09 10 11 12 13
index 2007=100 Exports
Crude oil prices
Imports
0
20
40
60
80
100
120
140
2009 2010 2011 2012 2013
WTI Brent Lloydblend
Crude oil prices
WTI Brent Lloydblend
$U
S P
ER
BA
RR
EL

COMMENTARY – Extracting the Most Value from Canada’s Petroleum3
a windfall from the lower price for crude, which is the main input cost for a refinery. Meanwhile, prices for their refined products (like gasoline) remained high, because these prices are set by the North American market.2
Many refineries in Eastern Canada, designed to process only lighter oil, suddenly found themselves at a competitive disadvantage as the relative price of imported light oil rose. Refineries in Ontario were less affected, because they mostly process light crude blends from domestic sources, including bitumen upgraded to synthetic crude oil in Alberta.
Oil refineries transform their crude oil input into finished products that need no further processing before the customer uses them. Finished products can be either end products (that is, consumed by the end user, such as gasoline consumed by a motorist) or inputs into other industries (such as diluent used by the pipeline industry). Statistics Canada classifies all oil sands production and all its upgrading as mining, and only includes the conventional refining process as manufacturing. Not everyone agrees. The Canadian Fuels Association, for example, classifies some of the output from upgrading as a finished product, which matches the output of refiners.
Where is the Most Value Created in Petroleum-Related Industries?There has been a long debate about how to extract the maximum value from Canada’s abundant natural resource base. One view is that exporting these staples without processing them into manufactured goods foregoes the opportunity to add more value. In this scenario, a more “advanced” country like the US takes Canadian raw materials, transforms it into finished products, and exports some of this back to Canada. This is said to be disadvantageous for us because it assumes that the value from manufacturing is greater than that from resource extraction. Put another way, higher stages of processing are assumed to be associated with higher value-added and a better terms of trade than resource production. This section looks at value-added for the different stages of extracting, transporting, and refining petroleum products.
Table 1 shows the amount of value-added by each segment of Canada’s petroleum industry compared with their gross output (that is, value-added output plus all purchases made from other industries). The industries cover all activities related to petroleum extraction and production, ranging from the construction of engineering projects and drilling3 before the crude is extracted, through the extraction and transportation to a refinery, refining, and then distribution of the refined petroleum product by wholesalers and retailers to customers. Comparing value-added to gross output measures how much each industry contributes to its overall gross output relative to the inputs it purchases from all other industries.4 In this analysis, it is not important who earns the value-added income; it could go to labour or capital.5 The data is for 2009, the latest year available for the Input/Output tables from Statistics Canada’s System of National Accounts, the source of these calculations.
TABLE 1 Value-added and gross output for oil-related industries, 2009, millions of dollars
Industry Gross output Value-added Value-added share
Services to oil and gas 14,345 6,427 44.8%
Engineering construction oil and gas 25,602 8,636 33.7%
Crude extraction 96,374 64,174 66.6%
Pipelines 3,278 2,374 72.4%
Refining 63,560 8,614 13.6%
Petroleum wholesale 5,737 3,094 53.9%
Gas stations 7,130 4,399 61.7%
Source: Statistics Canada, Input/Output Tables

COMMENTARY – Extracting the Most Value from Canada’s Petroleum4
Services to the oil and gas industry (mostly exploration and development) on their own contribute just under half of its gross output. Firms that build engineering projects for the oil and gas industry contribute one-third (33.7 percent) of their industry’s gross output (natural gas cannot be separated out from oil in most of these calculations). The value-added in crude oil extraction is 66.6 percent of gross output, and they dominate value-added in absolute terms with $64.2 billion of output.6 Pipelines contribute 72.4 percent of the gross receipts they generate, although their value-added in absolute terms is the smallest of any oil-related industry at $2.4 billion.
Refiners contribute 13.6 percent of the gross output of refining petroleum, although they have the second largest value-added in absolute terms at $8.6 billion. This reflects that the value they add is dwarfed by the value of the crude oil they buy. While the industry has high gross output, most of this value comes from the crude oil it uses as an input, not the value it adds by refining it. The industry is still critically important; without it, we would not have fuel for our autos, plastics in our homes, or chemicals for our medicines. This metric shows that the value generated by refining is low compared with that of extracting or transporting crude oil. This answers the question of why we export more crude than refined oil: crude is where the most value lies. The lower value-added in refining also means refineries cannot be too far from their markets, as there is little margin to absorb transportation costs.
When petroleum products leave the refinery, the share of value-added starts to increase rapidly as service industries take charge of its distribution. Wholesalers add just over half (53.9 percent) the value of the product they sell, while gasoline stations add 61.7 percent.7 These values exaggerate the share that actually accrues to these vendors, since they include hefty provincial and federal taxes on petroleum products. Also, service stations sell products other than gasoline, which means not all of their output is derived from gasoline receipts.
Chart 3 plots the value-added share of gross output by industry for 2009. The results are telling, with the highest share of value-added in the preparatory construction and drilling that precedes extraction, extraction, pipeline transport, and distribution of the refined product. More specifically, the curve follows a U shape as it moves from extracting crude oil to manufacturing it into refined products and then transporting it to the service industries that deliver these finished products to customers. This U shape reflects the relatively low value-added in refining compared with other parts of the production and distribution of petroleum products.
CHART 3 Value-added share by industry of gross output, 2009
The U-shaped curve of value-added in the oil supply chain has been observed for other products (in another context, it was coined the “Smiley curve” by James Fallows (2007).8 For example, the value of producing a smartphone is greatest in the stages of production before its manufacture (such as its engineering and design) or after its manufacture (marketing, finance, and the telecom contract with the consumer). Manufacturing the smartphone itself is a necessary if low value-added activity.
A naïve interpretation of these results is that if Canada’s only goal is to maximize the value of its oil wealth, the focus should be on extracting it and delivering it to customers, no matter who or where they are. Refining the oil in Canada
adds relatively lower value compared to these other activities. And unlike the extraction and distribution of oil, refining conceivably could be done elsewhere. Some might even argue that, at least in the short run and without concerns about the security of energy supplies, it would be better for Canada to extract oil and send it by pipeline to the US to be refined there, and then import the gasoline back into Canada. This would keep the
Construction 33.9
Drilling 44.8
Extraction 61.7
Pipelines 72.4
Refining 13.6
Wholesale 51.9
Retail 61.6
0
10
20
30
40
50
60
70
80
%
Value added share of gross output by industry, 2009

COMMENTARY – Extracting the Most Value from Canada’s Petroleum5
income flowing to all the industries that add the most value to petroleum, from exploration and development to pipelines, wholesalers, and retailers.
There is already evidence that Canada is relying more on imported refined petroleum products while exporting less. Chart 4 shows Canada’s international trade in refined petroleum products.
CHART 4 Refined petroleum energy products, 1989–2012
In 2002, Canada had a large surplus in trade (almost all of it with the US). Exports had levelled off after 2005, until a surge in 2012. Imports of petroleum products over the same period rose rapidly, briefly surpassing exports in 2011, before receding in 2012.
However, Canada’s refining industry remains important for the economy. Some refineries in Canada are quite competitive, and remain profitable because they have access to and can process the new, cheaper sources of crude. The ground-breaking on a refinery in Alberta, the first new refinery in North America in nearly three decades, shows that while refining has less value-added than extraction, it can still be a profitable venture. It is those refineries in Eastern Canada without access to or the
configuration to process bitumen that has not been upgraded to synthetic crude oil that are under pressure from imported petroleum products.9 Overall, Canada is still a substantial net exporter of refined petroleum products, especially gasoline, because a good portion of refineries remain highly viable and competitive.
Investment and ProfitabilityInvestment closely follows the pattern of where the most value is created in the petroleum industry. It is no surprise that billions of investment dollars are flowing into the oil patch as well as pipeline distribution. Investment in oil and gas extraction totalled $58.3 billion in 2012, by far the most of any industry in Canada, and 25 percent of all business investment in plant and equipment.10 This surge of investment, especially in Alberta, pushed up construction costs to levels that made investment in upgraders uneconomic. Exploration and drilling services invested $6.2 billion, while pipeline transportation invested $3.6 billion. This compares with capital spending of $2.8 billion for oil refineries, although that was before construction began on a new refinery in 2013. Capital spending by petroleum wholesalers and retail gas stations set new record highs, but because these industries are not capital-intensive by nature, the level of investment totalled only $0.5 billion and $1.0 billion, respectively.
The level of investment in refining is modest compared with that in other parts of the petroleum industry. However, compared with past investments by refiners, spending in 2012 reflects confidence in the long-term future of this industry. While slightly below its peak rate before the recession, investment is well above its level during the prolonged slump in the 1990s (see chart 5). It is noteworthy that investments since 2008 have been concentrated in construction rather than machinery and equipment, a sign the industry was expanding its capacity as well as reconfiguring to meet new environmental standards. Most of the new capacity being added was in Western Canada.
0
2
4
6
8
10
12
14
16
1989 1992 1995 1998 2001 2004 2007 2010
$ B
ILLI
ON
S
Refined petroleum energy products
Exports Imports
COMMENTARY – Extracting the Most Value from Canada’s Petroleum6
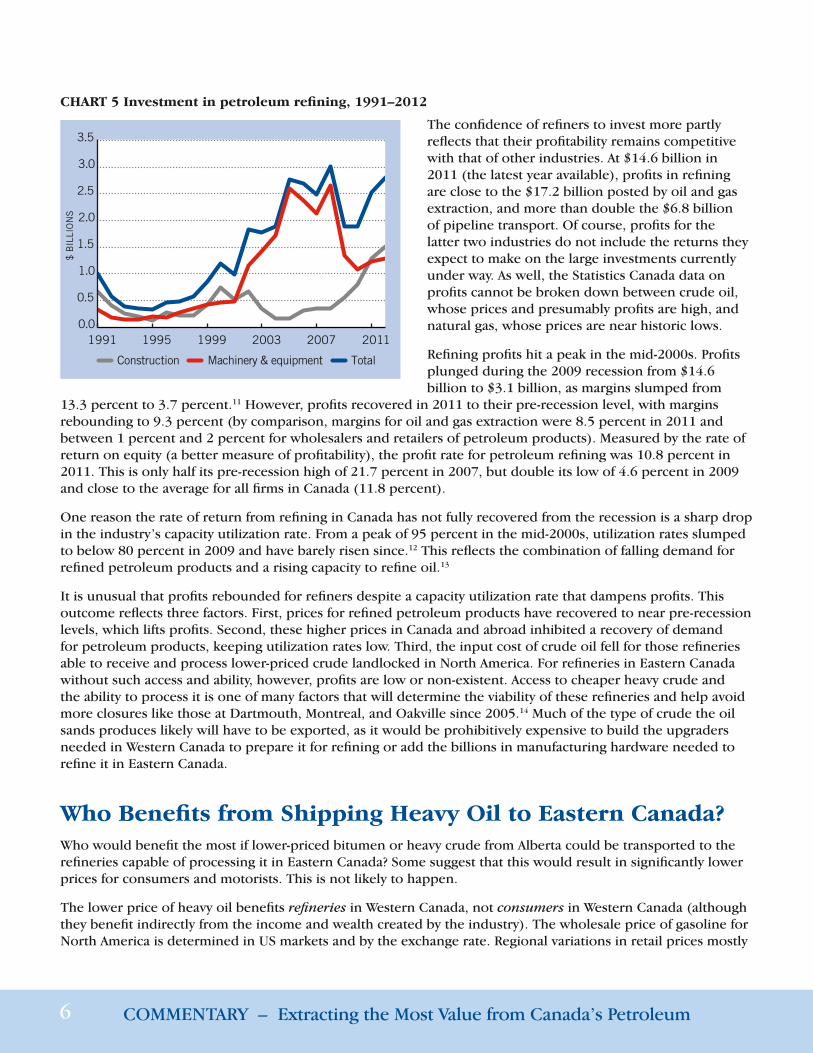
CHART 5 Investment in petroleum refining, 1991–2012
The confidence of refiners to invest more partly reflects that their profitability remains competitive with that of other industries. At $14.6 billion in 2011 (the latest year available), profits in refining are close to the $17.2 billion posted by oil and gas extraction, and more than double the $6.8 billion of pipeline transport. Of course, profits for the latter two industries do not include the returns they expect to make on the large investments currently under way. As well, the Statistics Canada data on profits cannot be broken down between crude oil, whose prices and presumably profits are high, and natural gas, whose prices are near historic lows.
Refining profits hit a peak in the mid-2000s. Profits plunged during the 2009 recession from $14.6 billion to $3.1 billion, as margins slumped from
13.3 percent to 3.7 percent.11 However, profits recovered in 2011 to their pre-recession level, with margins rebounding to 9.3 percent (by comparison, margins for oil and gas extraction were 8.5 percent in 2011 and between 1 percent and 2 percent for wholesalers and retailers of petroleum products). Measured by the rate of return on equity (a better measure of profitability), the profit rate for petroleum refining was 10.8 percent in 2011. This is only half its pre-recession high of 21.7 percent in 2007, but double its low of 4.6 percent in 2009 and close to the average for all firms in Canada (11.8 percent).
One reason the rate of return from refining in Canada has not fully recovered from the recession is a sharp drop in the industry’s capacity utilization rate. From a peak of 95 percent in the mid-2000s, utilization rates slumped to below 80 percent in 2009 and have barely risen since.12 This reflects the combination of falling demand for refined petroleum products and a rising capacity to refine oil.13
It is unusual that profits rebounded for refiners despite a capacity utilization rate that dampens profits. This outcome reflects three factors. First, prices for refined petroleum products have recovered to near pre-recession levels, which lifts profits. Second, these higher prices in Canada and abroad inhibited a recovery of demand for petroleum products, keeping utilization rates low. Third, the input cost of crude oil fell for those refineries able to receive and process lower-priced crude landlocked in North America. For refineries in Eastern Canada without such access and ability, however, profits are low or non-existent. Access to cheaper heavy crude and the ability to process it is one of many factors that will determine the viability of these refineries and help avoid more closures like those at Dartmouth, Montreal, and Oakville since 2005.14 Much of the type of crude the oil sands produces likely will have to be exported, as it would be prohibitively expensive to build the upgraders needed in Western Canada to prepare it for refining or add the billions in manufacturing hardware needed to refine it in Eastern Canada.
Who Benefits from Shipping Heavy Oil to Eastern Canada?Who would benefit the most if lower-priced bitumen or heavy crude from Alberta could be transported to the refineries capable of processing it in Eastern Canada? Some suggest that this would result in significantly lower prices for consumers and motorists. This is not likely to happen.
The lower price of heavy oil benefits refineries in Western Canada, not consumers in Western Canada (although they benefit indirectly from the income and wealth created by the industry). The wholesale price of gasoline for North America is determined in US markets and by the exchange rate. Regional variations in retail prices mostly
0.0
0.5
1.0
1.5
2.0
2.5
3.0
3.5
1991 1995 1999 2003 2007 2011
$ B
ILLI
ON
S
Construction Machinery & equipment Total

COMMENTARY – Extracting the Most Value from Canada’s Petroleum7
reflect different levels of provincial (or state) and municipal taxes. New supply via pipeline might lower prices slightly, since it is cheaper to ship oil by pipeline than by the rail and marine transport currently used to bring heavy oil to refineries outside the US Midwest. That is the only likely source of lower prices in the long term.
Refiners in Eastern Canada currently pay more for their imported crude oil but the result is lower margins for refiners, not higher prices for consumers. According to data from the authoritative Kent Group, crude oil prices make up 52.9 cents of the cost of a litre of gas in Western Canada, versus 76.6 cents in Eastern Canada (2012). This is largely offset by refinery margins, which average 31 cents in Western Canada but only 12 cents in Eastern Canada. Higher taxes in Eastern Canada, not the higher cost of crude oil inputs, largely explain why motorists there pay more for gasoline than those in Western Canada.
The goal of delivering more heavy crude oil to Eastern Canada is to maximize its price, not lower gasoline prices.15 Better transportation infrastructure connecting oil sands output with Eastern Canada would help avoid a repetition of the hefty discount for the price of heavy crude that occurred after 2011. Since most refineries in Eastern Canada cannot process bitumen that has not been upgraded, and will remain dependent on light crude (unless they are reconfigured, which is unlikely to happen), it is more likely that oil sands crude will be refined in the US, where more refineries are already equipped to process heavy oil.
ConclusionThe appearance of a discount for bitumen prices early in 2013 elicited widespread calls for processing more petroleum products in Canada. These calls were based on a widely-shared assumption among analysts that Canada should extract more value-added by manufacturing its natural resources rather than exporting raw materials.
This paper has shown the limitations of that argument for additional petroleum refining in Canada. More value lies in petroleum extraction and its transportation, not in its manufacture. This is partly because only a few countries, like Canada, are blessed with ample oil supplies. A large and growing number of countries compete in the business of refining oil. Despite this competition, some refineries in Canada remain profitable, and continue to invest in their future.
In fact, the efficiency of transporting petroleum proved to be the solution to the discount for bitumen prices. Through innovative solutions in rail and marine transport, the discount was eliminated even before major new pipeline capacity was added. Of course, the surge in North American oil output implies more pipeline capacity soon will be needed. Until then, the price discount may reappear for short periods of time.
The petroleum-related sector is a large and growing portion of Canada’s economy. While growth is fastest in high-profile industries like the oil sands and pipelines, investment is at or near record levels throughout the petroleum-based economy, from extraction to transportation to refining and wholesaling and retailing. These investments promise further growth throughout the supply chain for petroleum, and more income and wealth for all Canadians.
About the Author
Mr. Cross spent 36 years at Statistics Canada specializing in macroeconomics. He was appointed Chief Economic Analyst in 2008 and was responsible for ensuring quality and coherency of all major economic statistics. During his career, he also wrote the “Current Economic Conditions” section of the Canadian Economic Observer, which provides Statistics Canada’s view of the economy. He is a frequent commentator on the economy and interpreter of Statistics Canada reports for the media and general public. He is a Senior Fellow at the Macdonald-Laurier Institute.

COMMENTARY – Extracting the Most Value from Canada’s Petroleum8
ReferencesCanadian Fuels Association. 2013. The Economic Fundamentals of Refining. Canadian Fuels Association.Clarke, Tony, Jim Stanford, Diana Gibson and Brendan Haley. 2013. “The Bitumen Cliff ” Lessons and Challenges of Bitumen Mega-Developments.” Canadian Centre for Policy Alternatives.Fallows, James. 2007. “China Makes, the World Takes.” The Atlantic, July 1.Government of Alberta. 2013. Budget 2013. Government of Alberta. Natural Resources Canada. 2012. Fuel Focus: Understanding Gasoline Markets in Canada and Economic Drivers Influencing Prices 7 (9). Natural Resources Canada.Statistics Canada. Tables 029-0007 – 029-0012 – Capital and repair expenditures, CANSIM (database). Statistics Canada.Statistics Canada. Table 180-0003 – Financial and taxation statistics for enterprises, by North American Industry Classification System (NAICS), annual (dollars unless otherwise noted), CANSIM (database).
Statistics Canada.The Kent Group. 2012. Monthly Report of Petroleum Pricing in Canada. MJ Ervin & Associates.
Endnotes1 This was calculated by applying the higher price of imported oil to the value of oil exports. Of course, the
heavier crude Canada produces would rarely get the same price as imports of lighter crude, so the $18 billion is clearly an upper bound estimate. In its 2013 Budget, the Alberta government calculated that completely eliminating the discount for domestic oil prices would boost oil revenues by $27 billion a year.
2 For more on how the market for gasoline works, see The Economic Fundamentals of Refining by the Canadian Fuels Association (2013).
3 Construction mostly occurs at oil sands operations, while drilling is exclusive to the conventional oil industry.
4 Another way of viewing this calculation is that if imports were to replace all domestic output in each industry, this is the amount that output would fall in these industries.
5 Between 60 percent and 80 percent of the value-added in most of these oil-related industries accrues to capital. This reflects the capital-intensive nature of the business. The only exceptions are engineering construction, which remains labour-intensive, and to a lesser extent gasoline stations.
6 This is slightly higher for conventional oil and gas than for the oil sands.7 Note that in the Input/Output system, gross sales by wholesale and retail industries do not include goods
purchased for resale, in order to avoid showing such goods as intermediate inputs into the production of wholesale or retail services.
8 Fallows applied it to explain why manufacturing was outsourced to low-wage countries like China, while high value-added activities remained in the US (2007).
9 Configuring a refinery to process bitumen that has not been upgraded requires the addition of a coker. See The Economics Fundamentals of Refining, by the Canadian Fuels Association (2013).
10 The source of all the investment data in this study is Statistics Canada, Cansim Tables 029-0007 – 029-0012.11 All the profit data in this paragraph come from Statistics Canada, Cansim Table 180-0003.12 The source for the utilization rate is Natural Resources Canada (2012).13 Even gasoline, where Canada’s market had been one of the few in the industrialized world still expanding,
contracted in 2012 (one reason imports of gasoline suddenly dropped that year). 14 These closures explain why the capital stock of the refining industry fell in 2012 for the first time since 2001.
As well, business investment in petroleum refining was forecast to decline in 2013. While neither decline in itself was particularly large, they could be a harbinger of further cutbacks if the investment environment does not improve soon.
15 The same principle applies to proposed natural gas exports from BC to Asian markets. While the price of natural gas in North America is less than $4 and the price in Japan is near $15, exports will receive only a little more than the North American price, plus the cost of transporting it across the Pacific Ocean. This is because buyers in Asian countries know they do not have to pay $15 to induce BC exporters to trade; anything slightly better than the domestic price in North America will be an incentive to export.

Critically Acclaimed, Award-Winning Institute
The Macdonald-Laurier Institute fills a gap in Canada’s democratic infrastructure by focusing our work on the full range of issues that fall under Ottawa’s jurisdiction.
• “One of the Top 5 New Think Tanks in the World” for 2011 as rated by the University of Pennsylvania.
• Cited by five present and former Canadian Prime Ministers, as well as by David Cameron, the British Prime Minister.
• First book, The Canadian Century: Moving out of America’s Shadow, won the Sir Antony Fisher International Memorial Award.
• Executive Director & Founder Brian Lee Crowley named one of 100 most influential people in Ottawa in 2012.
• The Wall Street Journal, The Economist, The Globe and Mail, The National Post and many other leading national and international publications have quoted the Institute’s work.
Where You’ve Seen Us
True North in Canadian Public Policy
Former Speaker of the House of Commons Peter Milliken, former Prime Minister Joe Clark, former Prime Minister Jean Chrétien, and MLI Managing Director Brian Lee Crowley.
Ideas Change the World
Independent and non-partisan, the Macdonald-Laurier Institute is increasingly recognized as the thought leader on national issues in Canada, prodding governments, opinion leaders and the general public to accept nothing but the very best public policy solutions for the challenges Canada faces.
For more information visit: www.MacdonaldLaurier.ca
BEST THINK TANK
BOOK IN 2011, as awarded by the Atlas Economic Research
Foundation.

What Do We Do?
When you change how people think, you change what they want and how they act. That is why thought leadership is essential in every field. At MLI, we strip away the complexity that makes policy issues unintelligible and present them in a way that leads to action, to better quality policy decisions, to more effective government, and to a more focused pursuit of the national interest of all Canadians. MLI is the only non-partisan, independent national public policy think tank based in Ottawa that focuses on the full range of issues that fall under the jurisdiction of the federal government.
What Is in a Name?
The Macdonald-Laurier Institute exists not merely to burnish the splendid legacy of two towering figures in Canadian history – Sir John A. Macdonald and Sir Wilfrid Laurier – but to renew that legacy. A Tory and a Grit, an English speaker and a French speaker – these two men represent the very best of Canada’s fine political tradition. As prime minister, each championed the values that led to Canada assuming her place as one of the world’s leading democracies. We will continue to vigorously uphold these values, the cornerstones of our nation.
Working for a Better Canada
Good policy doesn’t just happen; it requires good ideas, hard work, and being in the right place at the right time. In other words, it requires MLI. We pride ourselves on independence, and accept no funding from the government for our research. If you value our work and if you believe in the possibility of a better Canada, consider making a tax-deductible donation. The Macdonald-Laurier Institute is a registered charity.
Our Issues
The Institute undertakes an impressive programme of thought leadership on public policy. Some of the issues we have tackled recently include:
• Theimpactofbanningoiltankersonthe West Coast;
• MakingCanadaafoodsuperpowerina hungry world;
• Aboriginalpeopleandthemanagement of our natural resources;
• Populationageingandpublicfinances;
• ThevulnerabilityofCanada’scriticalinfrastructure;
• Ottawa’sregulationofforeigninvestment; and
• HowtofixCanadianhealthcare.
About the Macdonald-Laurier Institute
For more information visit: www.MacdonaldLaurier.ca
CONTACT US: Macdonald-Laurier Institute 8 York Street, Suite 200 Ottawa, Ontario, Canada K1N 5S6
TELEPHONE: (613) 482-8327
CONNECT WITH US: @MLInstitute
www.facebook.com/ MacdonaldLaurierInstitute
www.youtube.com/MLInstitute