Embed Size (px)
Citation preview
Extracting wood lignin without dissolving or degrading cellulose: in-vestigations on the use of food additive-derived ionic liquids
André Pinkert∗, Dagmar F. Goeke, Kenneth N. Marsh, and Shusheng Pang
ELECTRONIC SUPPLEMENTARY INFORMATION
1 EXPERIMENTAL
1.1 Materials and Instruments
1.1.1 Materials
Acesulfame potassium (Ace K) was purchased from Ab-solute Ingredients Ltd, Auckland, New Zealand. 1-Butyl-3-methylimidazolium chloride ([BMIM]Cl), 1-ethyl-3-methylimidazolium acetate ([EMIM]Ac), dimethylsulfoxide(DMSO), 1-methylimidazole, 1-bromoethane, acetic anhy-dride and molecular sieve type 4A were purchased from Fluka.Microcrystalline cellulose (MCC) and chemicals for Karl Fis-cher titrations were obtained from Merck, and acetone wasfrom Allied Petroleum, Christchurch, New Zealand. HPLCgrade tetrahydrofuran (THF), anhydrous pyridine, toluene,methanol, 1-methylimidazole and 1-bromoethane were fromSigma Aldrich. Unless otherwise stated, all reagents wereused without further purification. Distilled acetone, DMSO,acetic anhydride, pyridine, toluene and methanol were driedwith molecular sieve prior to use. All ILs were dried at 353K for 48 h prior to both their use in cellulose dissolutionexperiments and for the measuring their physical properties.The reference ionic liquid 1-hexyl-3-methylimidazolium bis-(trifluoromethylsulfonyl) amide ([HMIM]Tf2N) was preparedaccording to literature methods,1 and it contained a final watermass fraction of 2·10-5. Water was deionised with a MilliporeElix 5 to a final resistivity of 15 MΩ·cm. MCC, with a par-ticle size of (20 to 160) µm and a degree of polymerisation(DP) of 1632, was dried at 353 K for 72 h to reduce the ini-tial water content by 90 % to a final water mass fraction of2.9·10-3. Lignin, alkali with a low sulfonate content, was pur-chased from Sigma Aldrich. Wood samples, of the speciesPinus radiata, were collected from a local sawmill in Kaiapoi,New Zealand. Samples of the species Eucalyptus nitens werekindly provided by the Forestry School of the University ofCanterbury. Vacuum drying at 353 K and 10 Pa for 24 h, andsubsequent knife milling, yielded wood sawdust with an aver-
Department of Chemical and Process Engineering, University of Canterbury,Christchurch, New Zealand. Fax: + 64 3 364 2063. Tel: + 64 3 364 2543.E-mail: [email protected].
age particle diameter of 100 µm and with a final water massfraction of 6.9 ·10-3. Hardened Microanalytix Advantec filterpaper 4A was used for the lignin extraction experiments.
1.1.2 Instruments
Fourier transform infrared (FT-IR) spectra were recorded on aPerkin–Elmer Spectrum One FT-IR spectrometer over a rangeof (4000 to 450) cm-1. A total of 20 scans at a resolutionof 4 cm-1 was taken for each sample. Liquid samples weresandwiched between two polished KBr plates, and solid sam-ples were pelleted with KBr containing a sample mass frac-tion of 0.01. Nuclear magnetic resonance (NMR) spectra wererecorded on a Varian INOVA 500 spectrometer (500 MHz and125 MHz for 1H and 13C, respectively), using the signals ofthe residual solvent protons and the solvent carbons as in-ternal references (δH 2.6 ppm and δC 39.6 ppm for DMSO-d6). Water content was determined with a Radiometer An-alytical TIM550 Volumetric Karl Fischer Titrator using KarlFischer Reagent 5. The titrant was calibrated with a 0.01 %Apura® water standard. Thermogravimetric analysis (TGA)was conducted on a SDT Q600 from TA Instruments by heat-ing (5 to 10) mg of sample in a platinum pan under a nitro-gen atmosphere (N2 flow rate 100 ml·min-1). The decompo-sition temperatures TD were determined at a fractional massloss of 0.1 at two different heating rates T1K = 1 K·min-1 andT10K = 10 K·min-1. Differential scanning calorimetry (DSC)was conducted on a Perkin Elmer DSC 8000, with (5 to 10)mg of sample contained in closed aluminium pans, at a heat-ing rate of T1K = 1 K·min-1. Electro-spray ionisation massspectra (ESI-MS) were recorded on a Bruker maXis 3G massspectrometer, and microscopy was performed with an Olym-pus PX60 microscope. Elemental analysis (EA) was carriedout by Campbell Microanalysis Laboratory, Department ofChemistry, University of Otago, Dunedin, New Zealand. Allsamples were dried prior to analysis. Wood sample analysis,according to TAPPI standards T 222om-88 and UM 250, wascarried out by Veritec, Rotorua, New Zealand. Results areexpressed in mass fraction: (i) Pinus radiata: 0.2980 acid in-soluble lignin, 0.0071 acid soluble lignin, 0.0315 extractives,
1–S10 | S1
Electronic Supplementary Material (ESI) for Green ChemistryThis journal is © The Royal Society of Chemistry 2011
and 0.6634 cellulosics; (ii) Eucalyptus nitens: 0.2754 acid in-soluble lignin, 0.0459 acid soluble lignin, 0.0056 extractives,and 0.6731 cellulosics. X-ray diffraction (XRD) experimentswere recorded on a Philips PW1729 diffractometer operatingat 50 kV and 40 mA. The diffractometer was equipped witha PW1820/00 goniometer, a PW1752/00 monochromator, aPW1710 diffractometer control unit, and a PW1711/10 pro-portional detector probe with a sealed Xe detector. Cu Kα
radiation was used for the diffraction experiments. The scanrange was (3 to 40)° of 2θ, at a step seize of 0.01° of 2θ andwith a scan rate of 1° of 2θ per minute. Gel permeation chro-matography (GPC) was carried out by the School of Chem-istry, Monash University, Melbourne, Australia, on an Agilent1200 HPLC with a Sedex 55 evaporative light scattering de-tector. The columns, Waters Ultrastyragel 100 Å, Waters Ul-trastyragel 500 Å and Agilent PLgel 10 µm were used. Cali-bration was performed on polystyrene standards. Lignin sam-ples were acetylated according to literature methods3 and dis-solved in THF prior to molecular mass analysis.
1.2 Methods
1.2.1 Physical property measurements
The studied ILs—[BMIM]Ace, [EMIM]Ace and[EMIM]Ac—were degassed at room temperature at apressure of less than 100 Pa for at least 12 h prior to mea-surement. To minimise water uptake from the environment,all samples were kept under inert gas atmosphere (N2) at alltimes. Prior to measurement, the instrument sample chamberswere cleaned with (i) purified water from a Millipore Elix 5with a final resistivity of 15 MΩ·cm, and (ii) distilled ace-tone. Subsequently, the sample chambers were flushed withambient air overnight to ensure complete solvent removal.All instrument sample chambers were then flushed with drynitrogen gas prior to sample injection. IL sample volumes of1 mL were required for each instrument.
Density Densities were measured with an Anton Paar DMA602 H vibrating tube densimeter. Prior to measurement, thedensimeter was calibrated with purified water and air over atemperature range from (278.15 to 358.15) K. For this pur-pose, the water was degassed and deionised, and its calculateddensity values were retrieved from the NIST Chemistry Web-Book.4 Ambient air with a relative humidity of 44.3 %, ata temperature of 295.05 K and a pressure of 1.013 bar, wasused for calibration, and the density values of the moist airwere calculated with consideration of its water content.5 Thecalibration was verified with the IUPAC reference ionic liq-uid [HMIM]Tf2N.6 The combined expanded (k = 2) relativeuncertainty of the density measurements was estimated to be0.3 %.
Viscosity Viscosities were measured with a cone and plateBrookfield DV-II+Pro viscometer (model LVDV-11) with aCPE-40 cone spindle. Prior to measurement, the viscome-ter was calibrated over a temperature range from (278.15to 333.15) K with reference oils (Canon S20 and S60, andParagon N10, N100 and N1000) covering a viscosity rangefrom (6 to 865) mPa·s. The calibration was verified with theIUPAC reference ionic liquid [HMIM]Tf2N.6 Only viscositiesof less than 1 Pa·s were measurable, and the resulting com-bined expanded (k = 2) relative uncertainty of the viscositymeasurements was estimated to be 3.0 %.
Electrical conductivity Electrical conductivities were mea-sured with a conductivity flow cell (LKB model 5312 A),made from borosilicate glass with two platinum black elec-trodes.7 The maximum operating temperature of the conduc-tivity cell was 348.15 K, due to restrictions imposed by itsplastic framework. The resistance R(f) of the cell was deter-mined with a Fluke PM 6306 RCL meter at a frequency f of 1kHz, and the electrical conductivity κ was calculated accord-ing to
κ =K
R
with a cell constant K of 90.1 m-1.7 Prior to measurement, theaccuracy of the instrument was checked over a temperaturerange from (278.15 to 323.15) K with the IUPAC referenceionic liquid [HMIM]Tf2N.6 The combined expanded (k = 2)relative uncertainty of the measurements was estimated to be2.0 %. Previously, Kandil et al. determined the frequency de-pendency for the IUPAC reference ionic liquid [HMIM]Tf2Nfrom (0.5 to 10) kHz, and the extrapolation from 1 kHz to in-finite frequency as f -1 gave an additional relative uncertaintyof less than 0.5 %.7
The temperature of the densimeter was measured with anindustrial grade platinum resistance thermometer of nominalresistance 100 Ω that had been calibrated against a standardplatinum thermometer of nominal resistance 25 Ω, which it-self had been calibrated on ITS-90. The temperature of theconductivity cell was measured with the 25 Ω thermometer.The uncertainty in temperature for the density measurementswere estimated to be ± 0.02 K, while the uncertainty in tem-perature for the electrical conductivity measurements was es-timated to be ± 0.01 K. The temperature of the viscometerwas determined with its built-in resistance temperature detec-tor, with a stated uncertainty of ± 1.0 K.
1.2.2 Synthesis and characterisation of ionic liquids
1.2.2.1 Synthesis Both ILs 1-butyl-3-methylimidazoliumacesulfamate ([BMIM]Ace) and 1-ethyl-3-methylimidazol-ium acesulfamate ([EMIM]Ace) were synthesised according
S2 | 1–S10
Electronic Supplementary Material (ESI) for Green ChemistryThis journal is © The Royal Society of Chemistry 2011
to the literature.8 [BMIM]Ace was prepared from a stoichio-metric ratio between Ace K and [BMIM]Cl. 25 g of Ace Kwas dissolved in 100 mL of hot water and added to 21.66 gof [BMIM]Cl. The mixture was stirred at 353 K for at least24 h. The water was removed under vacuum and 150 mL ofdry acetone was added. Insoluble potassium chloride was re-moved by filtration. Vacuum distillation was used to removethe acetone prior to IL vacuum drying at 353 K for 12 h. TheIL was redissolved in 250 mL of dry acetone and refrigeratedovernight. Residual precipitations of potassium chloride werefiltered off and acetone was removed under vacuum. The ILwas dried at 353 K and 10 Pa for 12 h. [EMIM]Ace was syn-thesised correspondingly with [EMIM]Br as starting material,which was prepared according to the literature.1 The resid-ual water content of the ILs was determined with Karl-Fischertitration, and elemental analysis was used to examine halideimpurities.
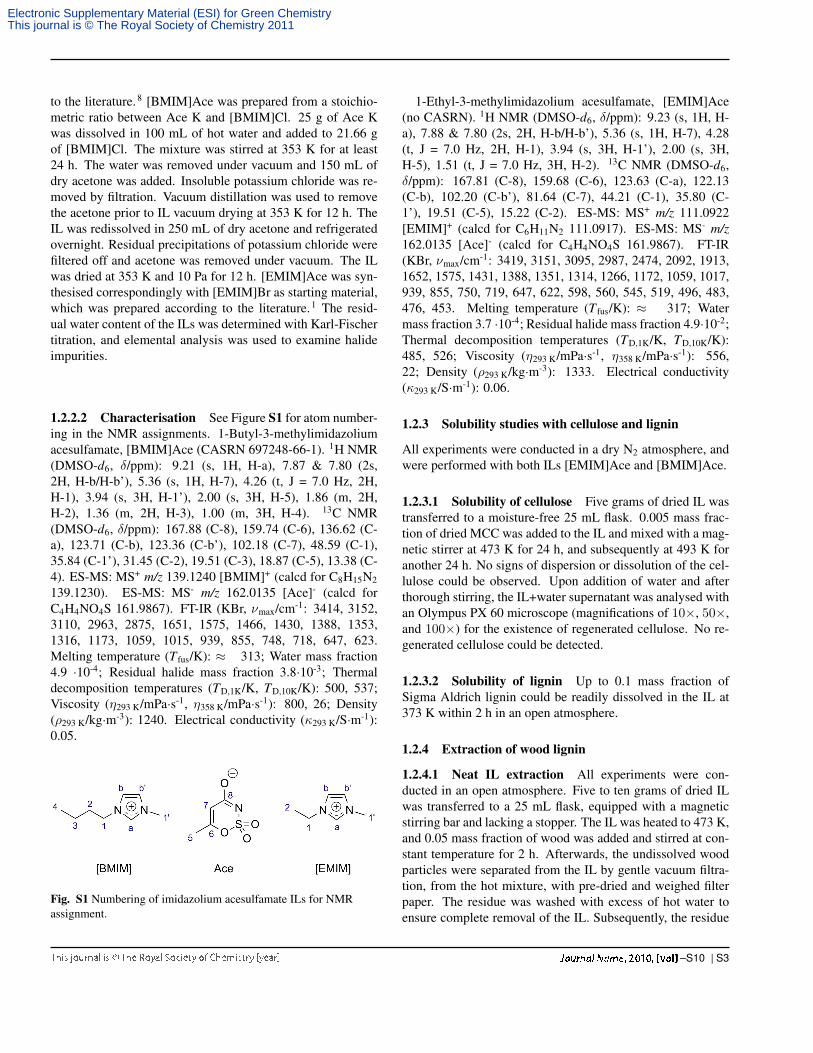
1.2.2.2 Characterisation See Figure S1 for atom number-ing in the NMR assignments. 1-Butyl-3-methylimidazoliumacesulfamate, [BMIM]Ace (CASRN 697248-66-1). 1H NMR(DMSO-d6, δ/ppm): 9.21 (s, 1H, H-a), 7.87 & 7.80 (2s,2H, H-b/H-b’), 5.36 (s, 1H, H-7), 4.26 (t, J = 7.0 Hz, 2H,H-1), 3.94 (s, 3H, H-1’), 2.00 (s, 3H, H-5), 1.86 (m, 2H,H-2), 1.36 (m, 2H, H-3), 1.00 (m, 3H, H-4). 13C NMR(DMSO-d6, δ/ppm): 167.88 (C-8), 159.74 (C-6), 136.62 (C-a), 123.71 (C-b), 123.36 (C-b’), 102.18 (C-7), 48.59 (C-1),35.84 (C-1’), 31.45 (C-2), 19.51 (C-3), 18.87 (C-5), 13.38 (C-4). ES-MS: MS+ m/z 139.1240 [BMIM]+ (calcd for C8H15N2139.1230). ES-MS: MS- m/z 162.0135 [Ace]- (calcd forC4H4NO4S 161.9867). FT-IR (KBr, νmax/cm-1: 3414, 3152,3110, 2963, 2875, 1651, 1575, 1466, 1430, 1388, 1353,1316, 1173, 1059, 1015, 939, 855, 748, 718, 647, 623.Melting temperature (T fus/K): ≈ 313; Water mass fraction4.9 ·10-4; Residual halide mass fraction 3.8·10-3; Thermaldecomposition temperatures (TD,1K/K, TD,10K/K): 500, 537;Viscosity (η293 K/mPa·s-1, η358 K/mPa·s-1): 800, 26; Density(ρ293 K/kg·m-3): 1240. Electrical conductivity (κ293 K/S·m-1):0.05.
Fig. S1 Numbering of imidazolium acesulfamate ILs for NMRassignment.
1-Ethyl-3-methylimidazolium acesulfamate, [EMIM]Ace(no CASRN). 1H NMR (DMSO-d6, δ/ppm): 9.23 (s, 1H, H-a), 7.88 & 7.80 (2s, 2H, H-b/H-b’), 5.36 (s, 1H, H-7), 4.28(t, J = 7.0 Hz, 2H, H-1), 3.94 (s, 3H, H-1’), 2.00 (s, 3H,H-5), 1.51 (t, J = 7.0 Hz, 3H, H-2). 13C NMR (DMSO-d6,δ/ppm): 167.81 (C-8), 159.68 (C-6), 123.63 (C-a), 122.13(C-b), 102.20 (C-b’), 81.64 (C-7), 44.21 (C-1), 35.80 (C-1’), 19.51 (C-5), 15.22 (C-2). ES-MS: MS+ m/z 111.0922[EMIM]+ (calcd for C6H11N2 111.0917). ES-MS: MS- m/z162.0135 [Ace]- (calcd for C4H4NO4S 161.9867). FT-IR(KBr, νmax/cm-1: 3419, 3151, 3095, 2987, 2474, 2092, 1913,1652, 1575, 1431, 1388, 1351, 1314, 1266, 1172, 1059, 1017,939, 855, 750, 719, 647, 622, 598, 560, 545, 519, 496, 483,476, 453. Melting temperature (T fus/K): ≈ 317; Watermass fraction 3.7 ·10-4; Residual halide mass fraction 4.9·10-2;Thermal decomposition temperatures (TD,1K/K, TD,10K/K):485, 526; Viscosity (η293 K/mPa·s-1, η358 K/mPa·s-1): 556,22; Density (ρ293 K/kg·m-3): 1333. Electrical conductivity(κ293 K/S·m-1): 0.06.
1.2.3 Solubility studies with cellulose and lignin
All experiments were conducted in a dry N2 atmosphere, andwere performed with both ILs [EMIM]Ace and [BMIM]Ace.
1.2.3.1 Solubility of cellulose Five grams of dried IL wastransferred to a moisture-free 25 mL flask. 0.005 mass frac-tion of dried MCC was added to the IL and mixed with a mag-netic stirrer at 473 K for 24 h, and subsequently at 493 K foranother 24 h. No signs of dispersion or dissolution of the cel-lulose could be observed. Upon addition of water and afterthorough stirring, the IL+water supernatant was analysed withan Olympus PX 60 microscope (magnifications of 10×, 50×,and 100×) for the existence of regenerated cellulose. No re-generated cellulose could be detected.
1.2.3.2 Solubility of lignin Up to 0.1 mass fraction ofSigma Aldrich lignin could be readily dissolved in the IL at373 K within 2 h in an open atmosphere.
1.2.4 Extraction of wood lignin
1.2.4.1 Neat IL extraction All experiments were con-ducted in an open atmosphere. Five to ten grams of dried ILwas transferred to a 25 mL flask, equipped with a magneticstirring bar and lacking a stopper. The IL was heated to 473 K,and 0.05 mass fraction of wood was added and stirred at con-stant temperature for 2 h. Afterwards, the undissolved woodparticles were separated from the IL by gentle vacuum filtra-tion, from the hot mixture, with pre-dried and weighed filterpaper. The residue was washed with excess of hot water toensure complete removal of the IL. Subsequently, the residue
1–S10 | S3
Electronic Supplementary Material (ESI) for Green ChemistryThis journal is © The Royal Society of Chemistry 2011
was dried to a constant mass at 353 K and 10 Pa. The waterwas removed from the filtrate by vacuum distillation. Whiteflocs precipitated from the filtrate upon the addition of 200 mLof dry acetone. The mixture was refrigerated overnight at278 K to ensure complete precipitation. The precipitate wasseparated by filtration, washed with excess of dried acetoneto ensure complete IL removal, and finally dried to a constantmass at 353 K and 10 Pa. The resulting IL+acetone mixturewas refrigerated overnight one more time to check for addi-tional precipitates, but none were observed. The acetone wasnow removed from the IL by vacuum distillation and the ILwas recovered. After drying, both the mass of the IL and itswater mass fraction were determined. Finally, the mass ofthe separated wood fractions (residue and extract) was com-pared against the mass of the initial wood sample to ensurethat no wood components, such as hemicellulose, were lost.If not mentioned otherwise, the mass of the untreated woodsample agreed within at least 0.1 mg with the combined massof both the extracted lignin and the cellulosic-rich residues.Agraphical overview of the extraction procedure is provided inFigure S2.
1.2.4.2 IL+DMSO extraction The extraction of woodlignin with a mixture of IL+DMSO was performed in the samemanner as the lignin extraction with the pure IL. The only dif-ference was the extraction solvent, now a mixture of 0.9 massfraction of [BMIM]Ace and 0.1 mass fraction of dried DMSO.
Supporting ReferencesS1. J. A. Widegren and J. W. Magee, J. Chem. Eng. Data, 2007, 52, 2331–
2338.S2. B. J. C. Duchemin.S3. M. Lawoko, G. Henriksson and G. Gellerstedt, Biomacromolecules,
2005, 6, 3467–3473.S4. NIST Chemistry WebBook, http://webbook.nist.gov/chemistry/fluid/,
(accessed Nov. 2009).S5. The Engineering ToolBox, http://www.engineeringtoolbox.com/density-
air-d_680.html, (accessed Nov. 2009).S6. K. N. Marsh, J. F. Brennecke, R. D. Chirico, M. Frenkel, A. Heintz, J. W.
Magee, C. J. Peters, L. P. N. Rebelo and K. R. Seddon, Pure Appl. Chem.,2009, 81, 781–790.
S7. M. E. Kandil, K. N. Marsh and A. R. H. Goodwin, J. Chem. Eng. Data,2007, 52, 2382–2387.
S8. S. S. Y. Tan, D. R. MacFarlane, J. Upfal, L. A. Edye, W. O. S. Doherty,A. F. Patti, J. M. Pringle and J. L. Scott, Green Chem., 2009, 11, 339–345.
S4 | 1–S10
Electronic Supplementary Material (ESI) for Green ChemistryThis journal is © The Royal Society of Chemistry 2011
2 SUPPLEMENTARY FIGURES
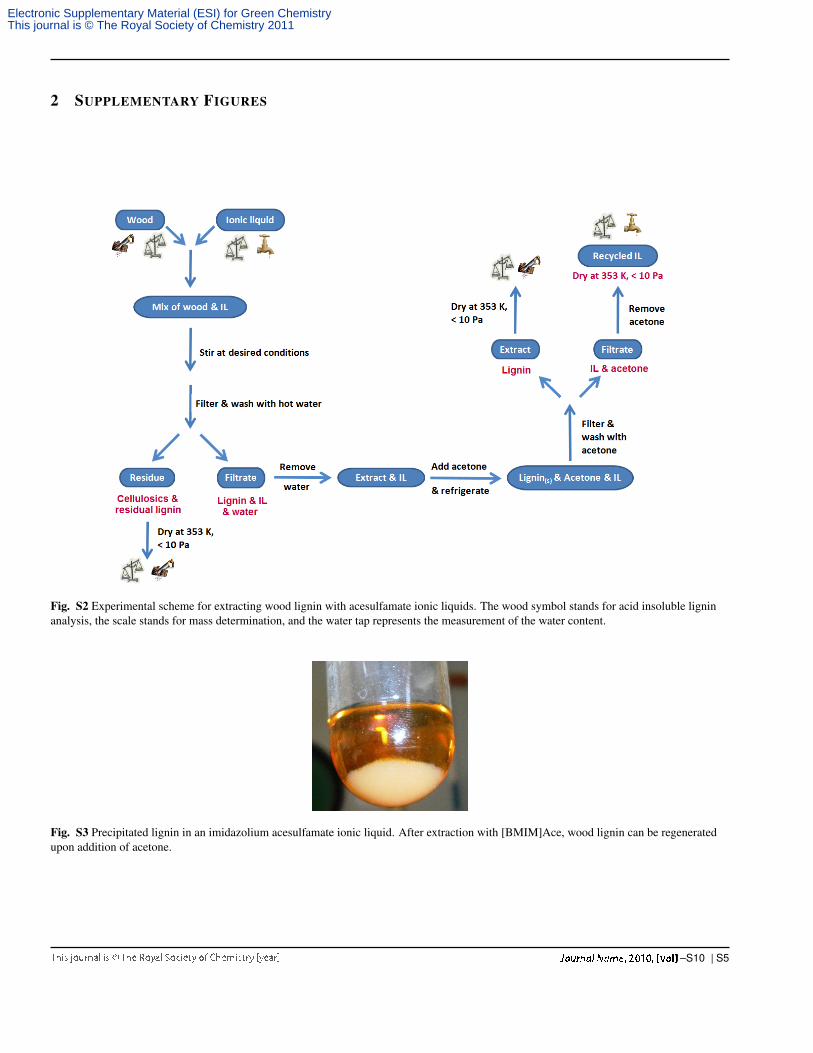
Fig. S2 Experimental scheme for extracting wood lignin with acesulfamate ionic liquids. The wood symbol stands for acid insoluble ligninanalysis, the scale stands for mass determination, and the water tap represents the measurement of the water content.
Fig. S3 Precipitated lignin in an imidazolium acesulfamate ionic liquid. After extraction with [BMIM]Ace, wood lignin can be regeneratedupon addition of acetone.
1–S10 | S5
Electronic Supplementary Material (ESI) for Green ChemistryThis journal is © The Royal Society of Chemistry 2011
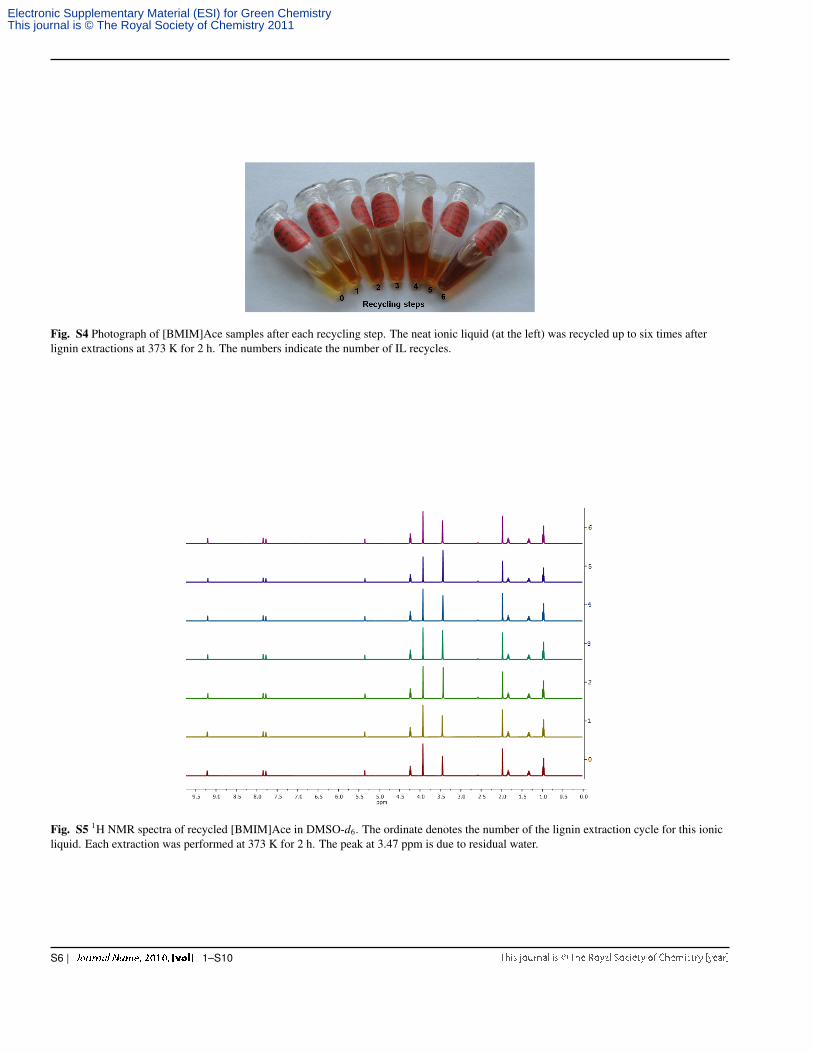
Fig. S4 Photograph of [BMIM]Ace samples after each recycling step. The neat ionic liquid (at the left) was recycled up to six times afterlignin extractions at 373 K for 2 h. The numbers indicate the number of IL recycles.
Fig. S5 1H NMR spectra of recycled [BMIM]Ace in DMSO-d6. The ordinate denotes the number of the lignin extraction cycle for this ionicliquid. Each extraction was performed at 373 K for 2 h. The peak at 3.47 ppm is due to residual water.
S6 | 1–S10
Electronic Supplementary Material (ESI) for Green ChemistryThis journal is © The Royal Society of Chemistry 2011
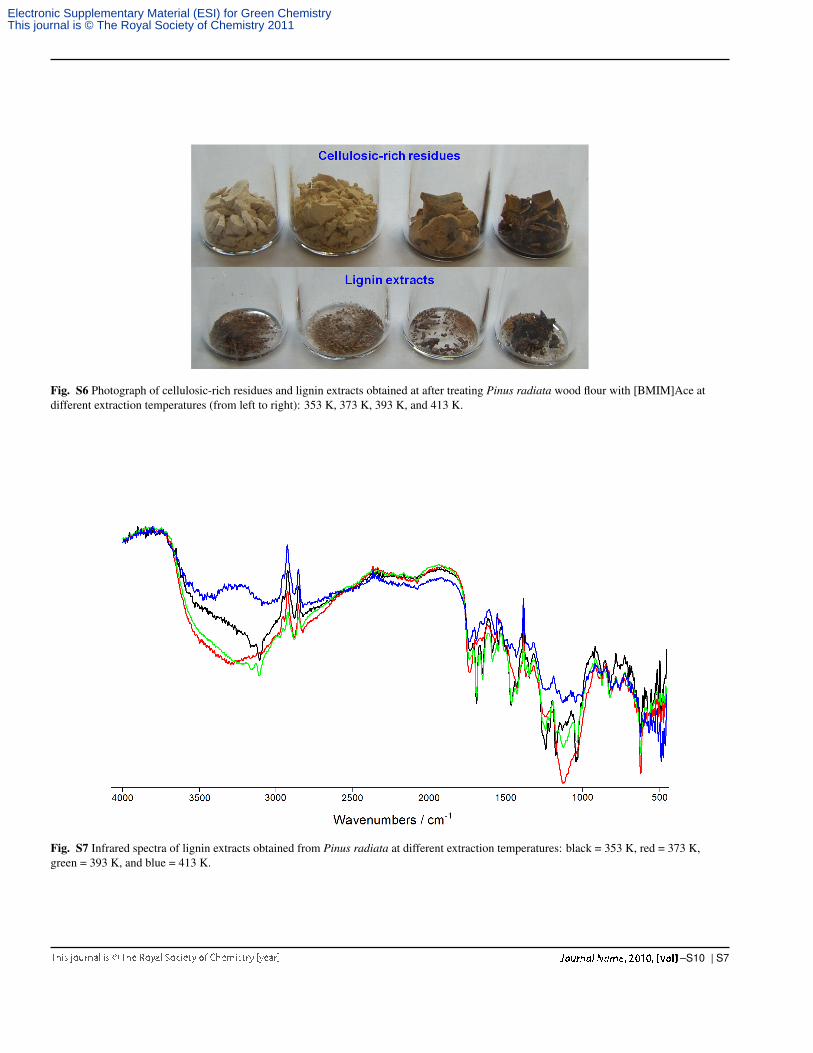
Fig. S6 Photograph of cellulosic-rich residues and lignin extracts obtained at after treating Pinus radiata wood flour with [BMIM]Ace atdifferent extraction temperatures (from left to right): 353 K, 373 K, 393 K, and 413 K.
Fig. S7 Infrared spectra of lignin extracts obtained from Pinus radiata at different extraction temperatures: black = 353 K, red = 373 K,green = 393 K, and blue = 413 K.
1–S10 | S7
Electronic Supplementary Material (ESI) for Green ChemistryThis journal is © The Royal Society of Chemistry 2011
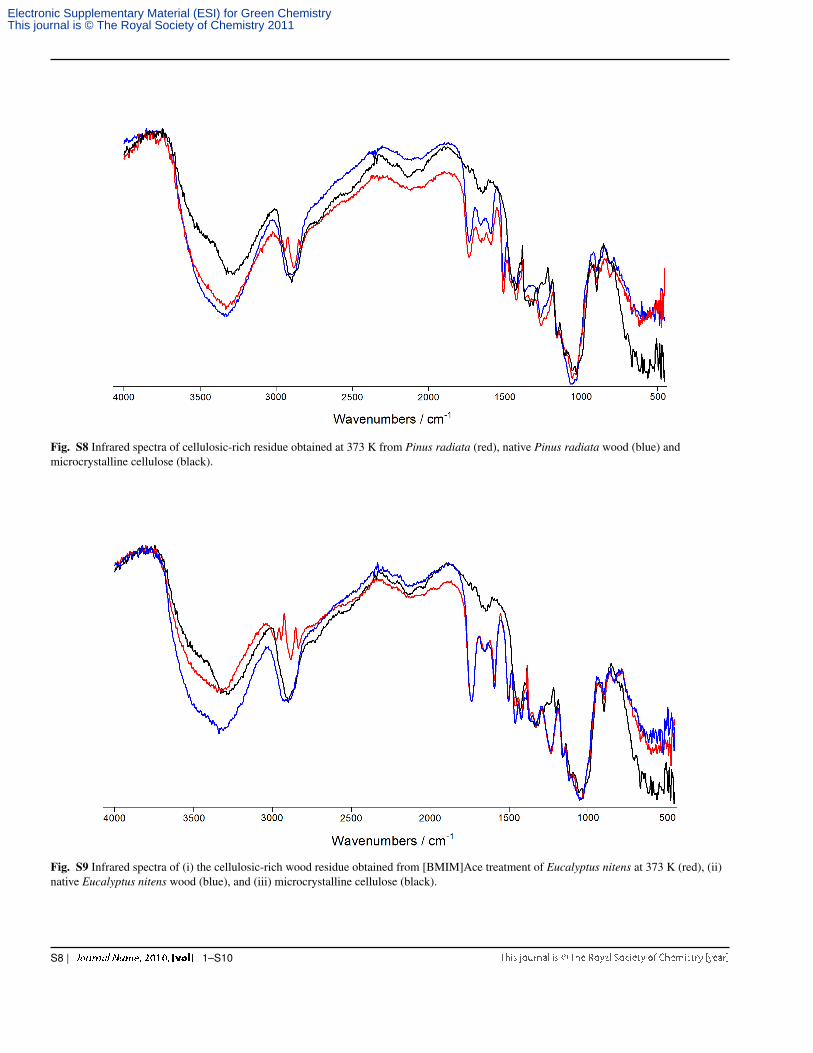
Fig. S8 Infrared spectra of cellulosic-rich residue obtained at 373 K from Pinus radiata (red), native Pinus radiata wood (blue) andmicrocrystalline cellulose (black).
Fig. S9 Infrared spectra of (i) the cellulosic-rich wood residue obtained from [BMIM]Ace treatment of Eucalyptus nitens at 373 K (red), (ii)native Eucalyptus nitens wood (blue), and (iii) microcrystalline cellulose (black).
S8 | 1–S10
Electronic Supplementary Material (ESI) for Green ChemistryThis journal is © The Royal Society of Chemistry 2011
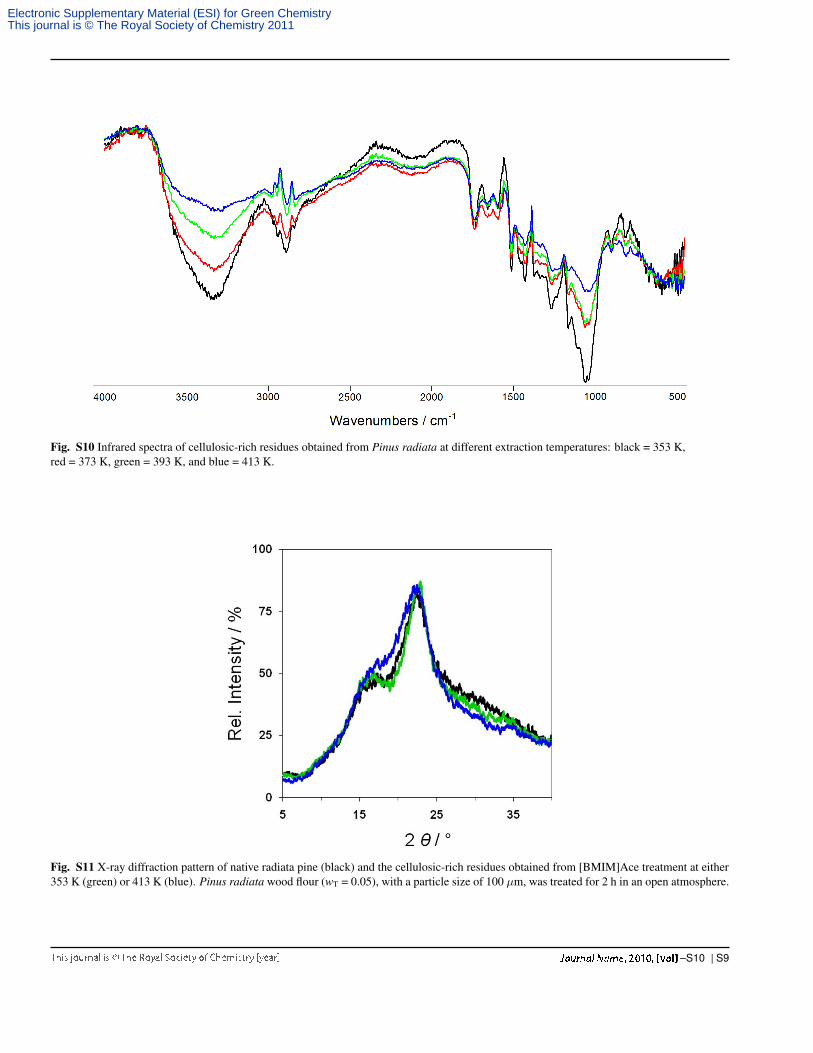
Fig. S10 Infrared spectra of cellulosic-rich residues obtained from Pinus radiata at different extraction temperatures: black = 353 K,red = 373 K, green = 393 K, and blue = 413 K.
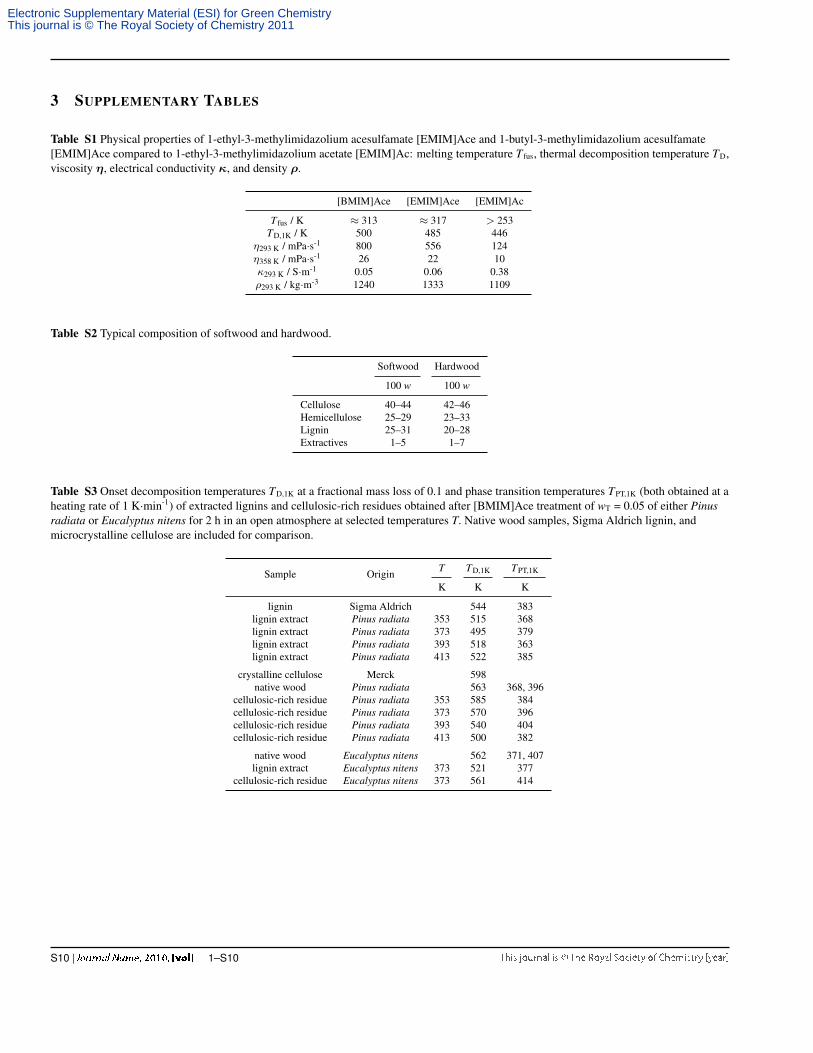
Fig. S11 X-ray diffraction pattern of native radiata pine (black) and the cellulosic-rich residues obtained from [BMIM]Ace treatment at either353 K (green) or 413 K (blue). Pinus radiata wood flour (wT = 0.05), with a particle size of 100 µm, was treated for 2 h in an open atmosphere.
1–S10 | S9
Electronic Supplementary Material (ESI) for Green ChemistryThis journal is © The Royal Society of Chemistry 2011
3 SUPPLEMENTARY TABLES
Table S1 Physical properties of 1-ethyl-3-methylimidazolium acesulfamate [EMIM]Ace and 1-butyl-3-methylimidazolium acesulfamate[EMIM]Ace compared to 1-ethyl-3-methylimidazolium acetate [EMIM]Ac: melting temperature T fus, thermal decomposition temperature TD,viscosity η, electrical conductivity κ, and density ρ.
[BMIM]Ace [EMIM]Ace [EMIM]Ac
T fus / K ≈ 313 ≈ 317 > 253TD,1K / K 500 485 446
η293 K / mPa·s-1 800 556 124η358 K / mPa·s-1 26 22 10κ293 K / S·m-1 0.05 0.06 0.38ρ293 K / kg·m-3 1240 1333 1109
Table S2 Typical composition of softwood and hardwood.
Softwood Hardwood
100 w 100 w
Cellulose 40–44 42–46Hemicellulose 25–29 23–33Lignin 25–31 20–28Extractives 1–5 1–7
Table S3 Onset decomposition temperatures TD,1K at a fractional mass loss of 0.1 and phase transition temperatures TPT,1K (both obtained at aheating rate of 1 K·min-1) of extracted lignins and cellulosic-rich residues obtained after [BMIM]Ace treatment of wT = 0.05 of either Pinusradiata or Eucalyptus nitens for 2 h in an open atmosphere at selected temperatures T. Native wood samples, Sigma Aldrich lignin, andmicrocrystalline cellulose are included for comparison.
Sample Origin T TD,1K TPT,1K
K K K
lignin Sigma Aldrich 544 383lignin extract Pinus radiata 353 515 368lignin extract Pinus radiata 373 495 379lignin extract Pinus radiata 393 518 363lignin extract Pinus radiata 413 522 385
crystalline cellulose Merck 598native wood Pinus radiata 563 368, 396
cellulosic-rich residue Pinus radiata 353 585 384cellulosic-rich residue Pinus radiata 373 570 396cellulosic-rich residue Pinus radiata 393 540 404cellulosic-rich residue Pinus radiata 413 500 382
native wood Eucalyptus nitens 562 371, 407lignin extract Eucalyptus nitens 373 521 377
cellulosic-rich residue Eucalyptus nitens 373 561 414
S10 | 1–S10
Electronic Supplementary Material (ESI) for Green ChemistryThis journal is © The Royal Society of Chemistry 2011