Embed Size (px)
Citation preview
EXTRACTION OF OLEUROPEIN FROM OLIVE
LEAVES
A Thesis Submitted to
the Graduate School
İzmir Institute of Technology
in Partial Fulfillment of the Requirements for the Degree of
MASTER OF SCIENCE
in Chemical Engineering
by
Gülin GÜMÜŞBULUT
December 2020
İZMİR

ii
ACKNOWLEDGEMENTS
First of all, I would like to express my gratefulness to my supervisor Assoc.
Prof. Dr. Aslı YÜKSEL ÖZġEN for her supports, guidance and encouragement during
my thesis study. I gained significant experience throughout study with her and her
research team.
During my thesis study, I am always grateful to my teammates YaĢar Kemal
RECEPOĞLU, Ceren ORAK, Aycan SAPMAZ, and Jackline NAMPEERA for their
help and support both in the laboratory and daily life. I would like to thank to Merve UÇ
and Melike ASLAN for always being friendly and helpful.
I would like to thank to Dr. Filiz KURUCAOVALI from Environmental
Research and Development Center at IZTECH for their support in HPLC analysis.
Finally, and most importantly, my deepest thanks to my family, Ahmet
GÜMÜġBULUT, Nurcihan GÜMÜġBULUT and Akif ġENER for their support,
motivation and encouragement during my lifetime.

iii
ABSTRACT
EXTRACTION OF OLEUROPEIN FROM OLIVE LEAVES
The aim of this study is to obtain oleuropein, which is the main phenolic
compound content of olive leaf by soxhlet extraction. Oleuropein has been known in the
health field for a long time and is found in high rates in our country. In this context, the
effect of various solvent types (ethanol, methanol, acetonitrile and water), extraction
time (4 cycles, 4 hours, 8 hours), particle size (250-500 µm and 900-2000 µm) and the
pre-treatment applied to the olive leaf on the yield of oleuropein was investigated.
The amount of oleuropein in the liquid product was determined using a High
Performance Liquid Chromatogram (HPLC). When the grain size of the raw material to
be used in extraction was reduced, higher oleuropein was obtained. The use of solvents
in an aqueous form resulted in a higher amount of oleuropein compared to pure
solvents. Increasing the extraction time caused a significant increase in the amount of
oleuropein. On the contrary, it was observed that the pretreatment applied to olive
leaves caused a decrease in the yield of oleuropein. As a result of these findings, the
highest oleuropein amount and extraction efficiency were obtained after 8 hours of
extraction period by using olive leaf with 250-500 μm grain size and 80% methanol
solution as the solvent. The highest oleuropein amount was found to be 13.35
oleuropein mg/g dry leaves and the highest extraction efficiency under these conditions
was found to be 36 %.

iv
ÖZET
OLEUROPEİNİN ZEYTİN YAPRAKLARINDAN ÖZÜTLENMESİ
Bu çalıĢmanın amacı, sağlık alanında uzun süredir bilinen ve ülkemizde yüksek
oranda bulunan zeytin yaprağının ana fenolik bileĢik içeriği olan oleuropeini sokslet
ekstraksiyonu ile elde etmektir. Bu bağlamda, çeĢitli solvent tiplerinin (etanol, metanol,
asetonitril ve su), ekstraksiyon süresinin (4 döngü, 4 saat, 8 saat), parçacık boyutunun
(250-500 µm ve 900-2000 µm) ve zeytin yaprağına uygulanan ön iĢlemin oleuropein
verimi üzerine etkileri araĢtırılmıĢtır.
Sıvı ürün içindeki oleuropein miktarı Yüksek Performanslı Sıvı Kromatogram
(HPLC) kullanılarak belirlenmiĢtir. Ekstraksiyonda kullanılacak hammaddenin parçacık
boyutu küçüldüğünde daha yüksek oleuropein eldesi gözlemlenmiĢtir. Saf solventlere
kıyasla sulu formdaki çözgenlerin kullanılması ile daha fazla miktarda oleuropein elde
edilmesini sağlamıĢtır. Ekstraksiyon süresinin arttırılması, oleuropein miktarında önemli
bir yükselmeyle sonuçlanmıĢtır. Bunun aksine zeytin yapraklarına uygulanan ön
iĢlemin, oleuropein veriminde ve miktarında düĢüĢe neden olduğu gözlemlenmiĢtir. Bu
deneyler sonucunda, en yüksek oleuropein miktarı ve ekstraksiyon verimi 250-500 μm
parçacık boyutuna sahip zeytin yaprağı ve çözücü olarak 80 % metanol çözeltisi
kullanılarak 8 saatlik ekstraksiyon süresi sonunda elde edilmiĢtir. En yüksek oleuropein
miktarı 13.35 oleuropein mg/g kuru yaprak olarak bulunmuĢ ve en yüksek ekstraksiyon
verimi bu koĢullarda 36 % olarak bulunmuĢtur.

v
TABLE OF CONTENTS
LIST OF FIGURES……………………………………………………………………viii
LIST OF TABLES………………………..……………………………………………...x
CHAPTER 1. INTRODUCTION………………………………………………………..1
1.1. The Aim and the Importance of the Study ............................................. 1
1.2. The Importance of Herbal Extracts ........................................................ 1
1.2.1. Phytochemicals (Plant Chemicals) .................................................. 2
1.2.2. Functional Foods and Nutraceuticals ............................................... 3
1.2.3. Phenolic Compounds ....................................................................... 4
1.2.4. Antioxidant Activity of Phenolic Compounds ............................... 12
1.2.4.1. Free Radicals ......................................................................... 12
1.2.4.2. Oxidative Stress .................................................................... 13
1.3. Olive Leaf and Characteristic Properties ............................................. 14
1.4. Oleuropein and its Properties ............................................................... 17
1.4.1. Oleuropein Chemistry .................................................................... 17
1.4.2. Biosynthesis of Oleuropein ............................................................ 17
1.4.3. Health Effects of Oleuropein ......................................................... 19
1.5. Extraction Techniques ......................................................................... 20
1.5.1. Liquid-Liquid Extraction ............................................................... 21
1.5.2. Solid-Liquid Extraction ................................................................. 21
1.5.2.1. Soxhlet Extraction ................................................................. 23
1.5.2.2. Ultrasound-Assisted Extraction ............................................ 24
1.5.2.3. Microwave-Assisted Extraction ............................................ 25
1.5.2.4. Pressurized Liquid Extraction ............................................... 25
1.5.3. Gas-Liquid Extraction .................................................................... 26

vi
CHAPTER 2. LITERATURE SURVEY ........................................................................ 27
2.1. Factors Affecting Oleuropein and Phenolic Levels ............................. 27
2.1.1. Environmental Conditions and Resource ...................................... 27
2.1.2. Values in Oleuropein Concentration According to Soxhlet
Extraction Method ......................................................................... 30
2.2. Total Phenolic Content ........................................................................ 32
CHAPTER 3. EXPERIMENTAL STUDY .................................................................... 33
3.1. Materials .............................................................................................. 33
3.1.1. Plant Materials and Chemicals ...................................................... 33
3.1.2. Experimental Apparatus ................................................................ 34
3.2. Experimental Procedure ....................................................................... 34
3.2.1. Pre-treatment of Olive Leaves ....................................................... 36
3.2.2. Extraction of Olive Leaves ............................................................ 36
3.3. Product Analysis .................................................................................. 39
3.3.1. HPLC Analysis of Phenolic Compounds....................................... 39
3.3.2. Total Phenolic Content (Folin Ciocalteu Method) ........................ 42
CHAPTER 4. RESULTS AND DISCUSSION .............................................................. 44
4.1. Effect of Extraction Solvent on Conversion of Olive Leaf and
Yield of Oleuropein ........................................................................... 44
4.2. Effect of Extraction Time on Conversion of Olive Leaf and
Oleuropein Yield ................................................................................ 48
4.3. Effect of Particle Size on Olive Leaf Conversion and
Oleuropein Yield ................................................................................ 51
4.4. The effect of Pre-treatment on Oleuropein Yield and
Extraction Efficiency .......................................................................... 54
4.5. Total Phenolic Content Assay (Folin Ciocalteu Method) .................... 55
CHAPTER 5. CONCLUSIONS ..................................................................................... 58

vii
REFERENCES ............................................................................................................... 59
viii
LIST OF FIGURES
Figure Page
Figure 1.1. Phytochemical groups .................................................................................... 3
Figure 1.2. Structural representation of phenol. ............................................................... 4
Figure 1.3. Structure of a flavonoid molecule .................................................................. 5
Figure 1.4. Generic structures of major classes of flavonoids. ......................................... 6
Figure 1.5. General structural of benzoic acid .................................................................. 7
Figure 1.6. General structural of cinnamic acid ................................................................ 8
Figure 1.7. Structure of chlorogenic acid ......................................................................... 9
Figure 1.8. Parent structure of lignan (coupling (B) of two C6-C3 molecule (A) .......... 10
Figure 1.9. Structure of major dietary lignans………………………………………….10
Figure 1.10. Structure of trans-resveratrol (trans-3,5,4-trihydroxystilbene) .................. 11
Figure 1.11. Structure of hydroxytyrosol. ....................................................................... 11
Figure 1.12. Typical endogenous sources of free radicals .............................................. 13
Figure 1.13. Most common exogenous sources of free radicals ..................................... 13
Figure 1.14. General molecular structure of oleuropein. Representation of the
hydroxytyrosol (red), monoterpene (green) and glucoside (black)
moieties……... ........................................................................................... 17
Figure 1.15. General representation of iridoids (A) and secoiridoids (B)
molecular structures ................................................................................... 18
Figure 1.16. Proposed biosynthetic pathway for the formation of oleuropein. .............. 18
Figure 1.17. Pharmacological properties of oleuropein .................................................. 19
Figure 1.18. Extraction steps of target compounds composed of organic material
and porous structure .................................................................................. 22
Figure 1.19. Schematic representation of plant cell tissue ............................................. 22
Figure 1.20. Soxhlet Extraction ...................................................................................... 23
Figure 2.1. Molecular structures of elenolic acid glucoside (A) and demethyl-
oleuropein (B), formed by esterase action, and aglycone forms (C and D)
and oleuropein aglycone (E) by β-glucosidase action…………...……….30

ix
Figure Page
Figure 3.1. The general diagram of experimental procedure….…………………….…35
Figure 3.2. Drying process of olive leaves in the oven ................................................... 36
Figure 3.3. The picture of soxhlet extraction unit ........................................................... 37
Figure 3.4. Schematic representation of the HPLC system ............................................ 40
Figure 3.5. HPLC chromatogram of olive leaf ............................................................... 41
Figure 3.6. Calibration Curve of Oleuropein .................................................................. 42
Figure 3.7. Calibration Curve of Gallic Acid ................................................................. 43
Figure 4.1. Effect of solvent type on the extracted amount of oleuropein per gram
of dried leaf by the Soxhlet extraction for 8h……………………….…..…45
Figure 4.2. The effect of the type of solvent used in olive leaf extraction on the
extract amount performed for 8 hours by the soxhlet extraction. .............. 47
Figure 4.3. Effect of extraction time on the extracted amount of oleuropein per gram
of dried leaf in the soxhlet method for 8h and 4h. ....................................... 49
Figure 4.4. The effect of the extraction time used in olive leaf extraction for by the
soxhlet method on the extraction yield. ....................................................... 51
Figure 4.5. Effect of partical sizes on the extracted amount of oleuropein per gram
of dried leaf in the soxhlet method for 4 cycles ........................................... 52
Figure 4.6. The effect of the particle sizes used in olive leaf extraction on extraction
yield by the soxhlet method. ........................................................................ 53
Figure 4.7. The effect of extraction time (4h, 8 h) and ethanol percentage on the
total phenolic content ................................................................................ 56
Figure 4.8. The effect of solvent type (ethanol, methanol) on the total phenolic
content .......................................................................................................... 57
x
LIST OF TABLES
Table Page
Table 1.1. Structures of common benzoic acid derivatives. ............................................. 7
Table 1.2. Structures of common hydroxycinnamic acid derivatives. .............................. 8
Table 1.3. Taxonomic classification of the olive tree ..................................................... 14
Table 1.4. Phenolic compounds found in olive leaves. .................................................. 15
Table 1.5. Structural representation of the most abundant phenolics in olive leaves. .... 16
Table 2.1. Concentration of olive phenolic compounds derived from olive oil
and olive tree materials (n.d.:notdetected)……...……..………….…………28
Table 2.2. Determination of phenolic compound by HPLC-DAD analysis in
olive leaf extract………………………………………..……...…………….29
Table 2.3. Literature examples of oleuropein concentration according to Soxhlet
extraction method. .......................................................................................... 31
Table 2.4. Gallic acid equivalents in mg of extracts from Soxhlet extraction. ............... 32
Table 2.5. Comparison of both extraction methods used in the study ............................ 32
Table 3.1. List of chemicals used in the experiment….…...…..…….…………….........33
Table 3.2. Experimental study of olive leaf soxhlet extraction……………..….............38
Table 3.3. The properties of HPLC system. ................................................................... 40
Table 4.1. Polarity and boiling point values of the solvent types……………………...45
Table 4.2. The effect of extraction time (4h and 8h) on extraction yield and
oleuropein in olive leaf extraction by soxhlet method…………………….. 48
Table 4.3. Effect of ultrasonic pre-treatment on the yield of oleuropein ........................ 55

xi
To my dear family,
1
CHAPTER 1
INTRODUCTION
1.1. The Aim and the Importance of the Study
The importance of this study is to determine and compare oleuropein and
extraction yield in a wide range of solvents in both pure and aqueous concentrations
under various parameters.
The aims of this study can be listed as follows:
To contribute to the economy of our country by obtaining extracts from the
leaves of olive trees, which have a great commercial value in our country,
To extract polyphenol oleuropein from olive leaves by soxhlet extraction with
different solvents (water, ethanol, methanol and acetonitrile) and to examine the
effects of various working parameters (extraction time, particle size and
pretreatment) on extract and oleuropein yields.
In order to optimize the recovery of phenolic components, it is also among the
aims of this thesis to examine the parameters affecting the extraction process in
extraction of plant extracts by soxhlet extraction and to contribute to research on these
issues.
1.2. The Importance of Herbal Extracts
Plant extracts are structures that have long been used in the health field and are
obtained from the fruits or leaves of plants (Vinatoru 2001). Determination of phenolic
compounds in plants is very important due to their natural drug activities (antimicrobial,
antioxidative). Biophenols also protect living things against UV rays (Balasundram,
Sundram, and Samman 2006; Rahaiee, Moini, and Hashemi 2015).
2
1.2.1. Phytochemicals (Plant Chemicals)
Plants produce various organic compounds (phytochemicals) and basic chemical
components (carbohydrates, proteins, nucleic acids, etc.). Phytochemicals produced by
plants are used for chemically developed compounds that play an active role in the
structure of plants (Shahidi et al.2019).
In another definition, the word 'phyto-', which means plants in Greek, is the
source of the word phytochemicals. For this reason, plant chemicals are also called
phytochemicals. Although it cannot be detected in most of the fruits, vegetables, and
grains that make up the structure of the plants, it is known that there are at least 5000
different plant chemicals (Liu 2004).
The health benefits of phytochemicals have been widely studied. Although they
are called non-nutritional compounds, they are used as active ingredients in foods. The
health benefits of plant chemicals can be listed as follows:
To react in chemical structure for biochemical reactions (substrates),
Ensuring that enzymes are active (cofactors) in enzymatic reactions,
Adhering to undesirable structures in the intestine and destroying them
Digesting essential nutrients such as carbohydrates, fat and protein,
To create a growth environment for beneficial bacteria in the stomach and
intestines,
Detecting harmful bacteria in the gut and reducing its effectiveness (selective
inhibitor) (Dillard and German 2000).
The role of non-nutritive plant chemicals (phytochemicals) in reducing the risk
of disease of some foods obtained from plants is quite large. These chemicals have less
potential compared to drugs. However, when consumed regularly and in the right
proportions, it can be clearly beneficial (Garcı, Toma, and Espı 2007).
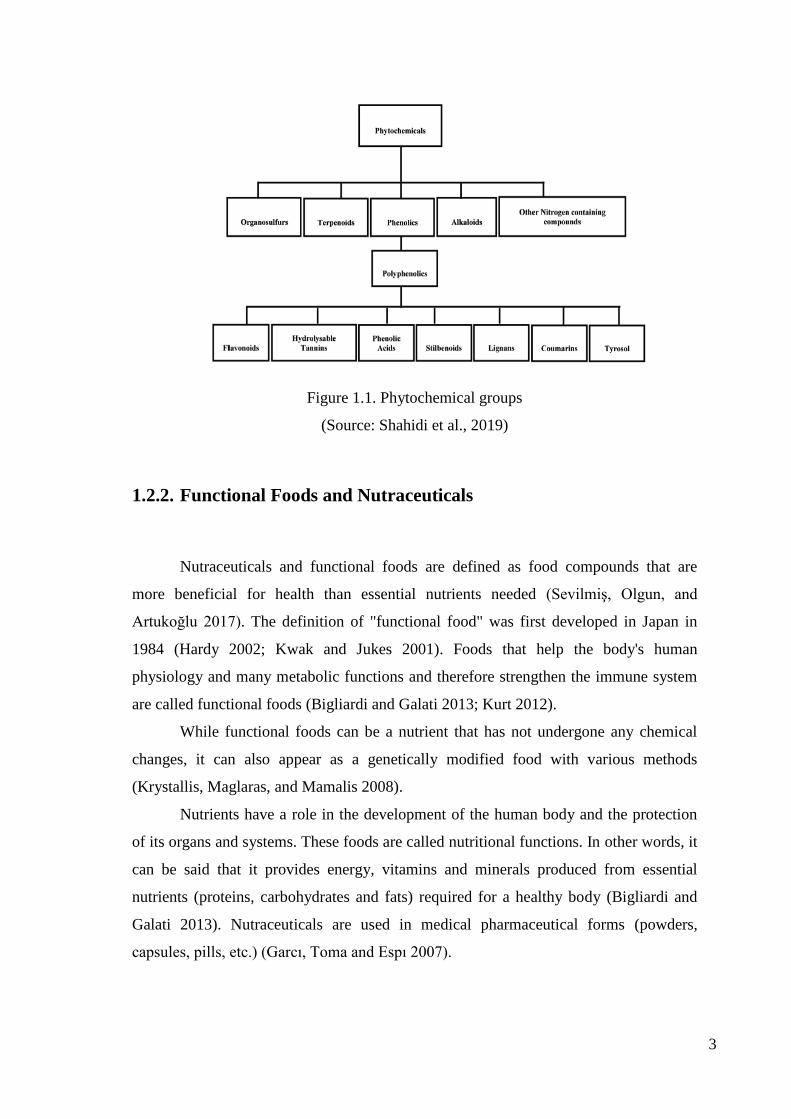
Phytochemicals, which are the main components of essential oils and found in
the flowers of plants, consist of various polyphenol groups, terpenoids, alkaloids and
compounds containing sulfur (Shahidi et al.2019). The general distribution of these
herbal products is given in Figure 1.1
3
Figure 1.1. Phytochemical groups
(Source: Shahidi et al., 2019)
1.2.2. Functional Foods and Nutraceuticals
Nutraceuticals and functional foods are defined as food compounds that are
more beneficial for health than essential nutrients needed (SevilmiĢ, Olgun, and
Artukoğlu 2017). The definition of "functional food" was first developed in Japan in
1984 (Hardy 2002; Kwak and Jukes 2001). Foods that help the body's human
physiology and many metabolic functions and therefore strengthen the immune system
are called functional foods (Bigliardi and Galati 2013; Kurt 2012).
While functional foods can be a nutrient that has not undergone any chemical
changes, it can also appear as a genetically modified food with various methods
(Krystallis, Maglaras, and Mamalis 2008).
Nutrients have a role in the development of the human body and the protection
of its organs and systems. These foods are called nutritional functions. In other words, it
can be said that it provides energy, vitamins and minerals produced from essential
nutrients (proteins, carbohydrates and fats) required for a healthy body (Bigliardi and
Galati 2013). Nutraceuticals are used in medical pharmaceutical forms (powders,
capsules, pills, etc.) (Garcı, Toma and Espı 2007).
4
1.2.3. Phenolic Compounds
There are more than 200,000 chemicals in the world that are obtained
differently from plants. These chemicals are called primary and secondary metabolites.
Primary metabolites are essential for our basic food sources. This group of metabolites
plays a role in maintaining the cell for carbohydrates, proteins, and various fatty acids.
Secondary metabolites are important to plants, although they are not directly involved in
respiratory and photosynthesis reactions. The structure and chemistry of the two main
metabolites differ from each other. Secondary metabolites are more diverse and
responsible for plant defense (Chikezie, Ibegbulem, and Mbagwu 2015). The role of
secondary metabolites is to protect the plants from UV rays and oxidants. Secondary
metabolites are classified according to their structure as follows: (1) terpenoids, (2)
alkaloids and sulfur-containing compounds with nitrogen in their structure, (3)
flavonoids called some phenolic and polyphenolic compounds. These compounds bind
to primary metabolites through many reactions (Vora and Pednekar 2017).
Phenolic compounds, one of the secondary metabolites, are abundant in plants.
Phenolic compounds play an important role in the growth, development, and
reproduction of plants by fighting against pathogens and harmful microorganisms. It is
also responsible for sensory properties such as color, bitterness, taste, and smell in
vegetables and fruits (Chikezie, Ibegbulem and Mbagwu 2015).
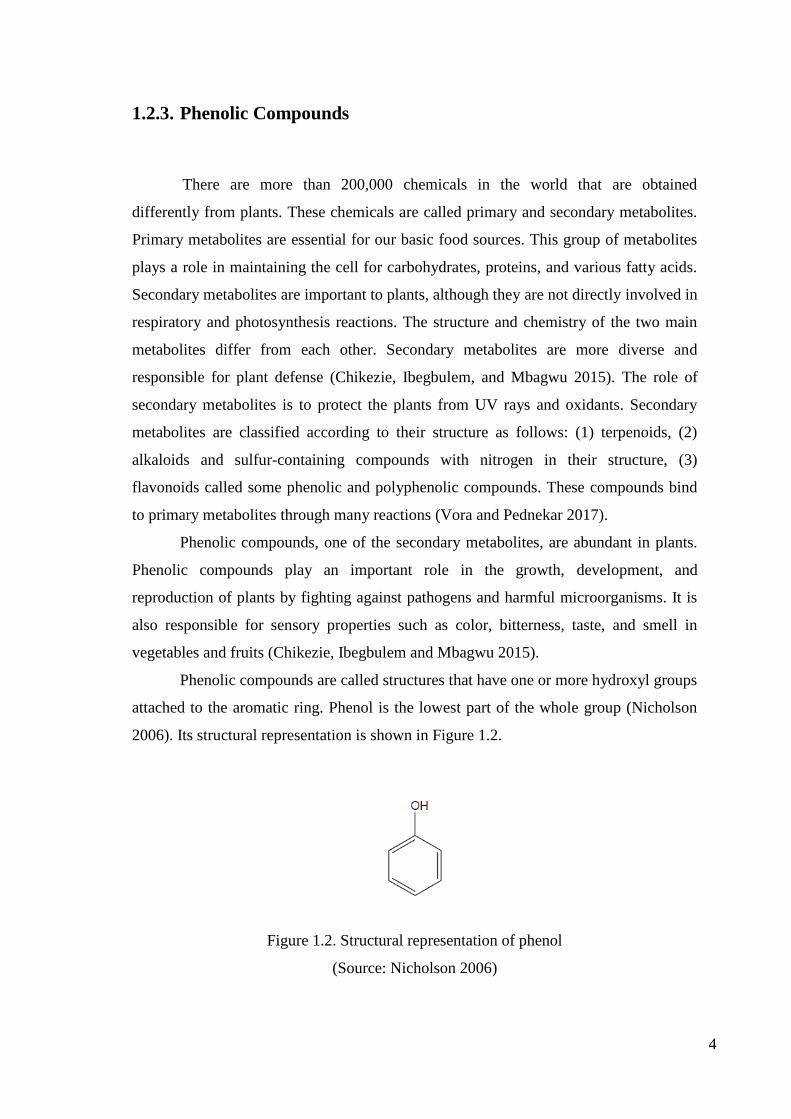
Phenolic compounds are called structures that have one or more hydroxyl groups
attached to the aromatic ring. Phenol is the lowest part of the whole group (Nicholson
2006). Its structural representation is shown in Figure 1.2.
Figure 1.2. Structural representation of phenol
(Source: Nicholson 2006)
5
The structure of phenols can range from simple molecules to complex
compounds. Those with high phenolic compound properties are in contact with one or
more phenolic groups with mono- and polysaccharides. Phenolic compounds can also
be added to the esters. They create structural diversity according to their bonding state,
so there is a wide variety of polyphenols in nature. More than 8000 polyphenol
structures are known as a result of existing research (Del et al. 2013). The most
important phenolics are examined in three parts as flavonoids, phenolic acids and
tannins (Heleno et al. 2015).
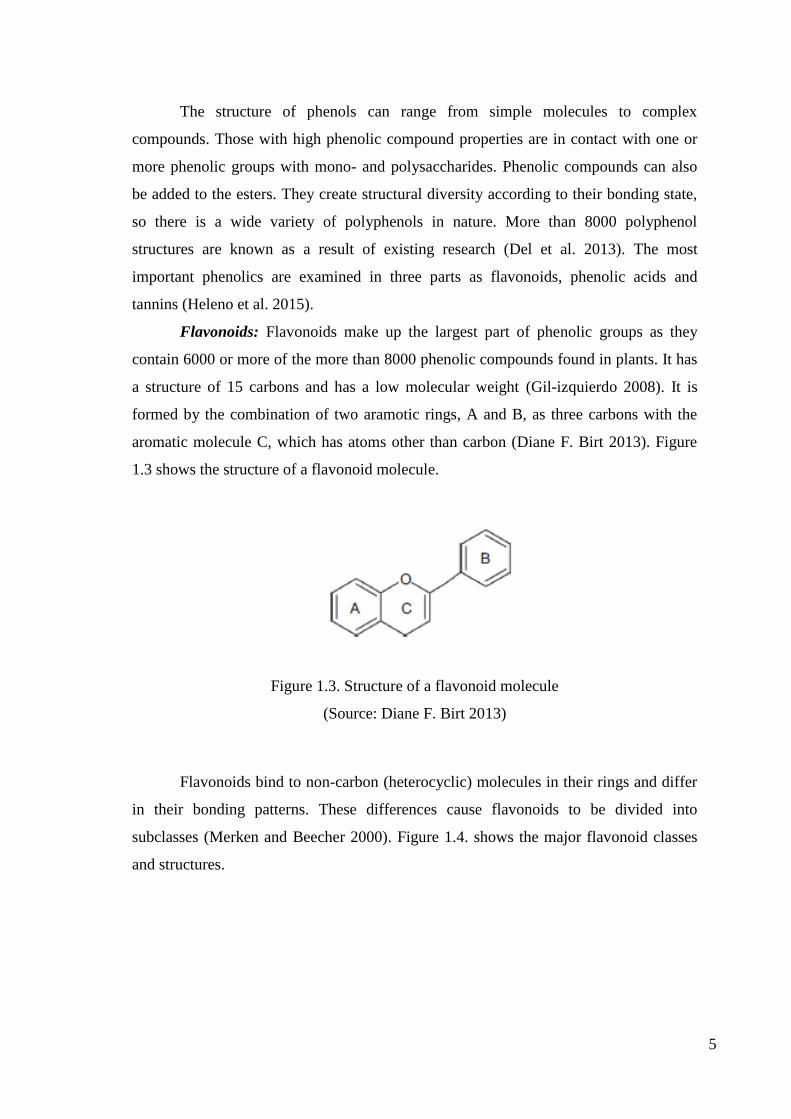
Flavonoids: Flavonoids make up the largest part of phenolic groups as they
contain 6000 or more of the more than 8000 phenolic compounds found in plants. It has
a structure of 15 carbons and has a low molecular weight (Gil-izquierdo 2008). It is
formed by the combination of two aramotic rings, A and B, as three carbons with the
aromatic molecule C, which has atoms other than carbon (Diane F. Birt 2013). Figure
1.3 shows the structure of a flavonoid molecule.
Figure 1.3. Structure of a flavonoid molecule
(Source: Diane F. Birt 2013)
Flavonoids bind to non-carbon (heterocyclic) molecules in their rings and differ
in their bonding patterns. These differences cause flavonoids to be divided into
subclasses (Merken and Beecher 2000). Figure 1.4. shows the major flavonoid classes
and structures.

6
Figure 1.4. Generic structures of major classes of flavonoids
(Source: Diane F. Birt 2013)
Flavonoids are found in plants in the form of glucose molecules (glycosides) and
aglycones. Instead of simple acidic carbohydrates, carbon atoms in its structure and
hydrogen-oxygen atoms bonded by covalent bonds are used (Harborne and Williams
2000). The effect of this phenolic compound on health is being studied. Although it is
Flavonols Flavones
Flavanones Flavan-3-Ols
Anthocyanidins Isoflavones

7
known that this effect is mostly caused by antioxidant function, it is estimated that
functions other than antioxidants cause diseases such as heart and cancer (Shahidi
2018). Flavonoids are found in alcoholic beverages, herbs, dried grains, nuts,
vegetables, and fruits (Faggio et al. 2017; Yeo and Shahidi 2017).
Phenolic Acids: Phenolic acids are found in plants, grains, seeds, and legumes.
These acids can be used instead of hydroxybenzoic and hydroxycinnamic acids (Shahidi
et al. 2019). Hydroxybenzoic acids are found in most plant species. Examples of these
acids are gallic acid, p-hydroxybenzoic acid, and vanillic acid (Robbins 2003). The
general structural representation of benzoic acid is given in Figure 1.5. Table 1.1 shows
the types of hydroxybenzoic acids.
Figure 1.5. General structural of benzoic acid
(Source: Shahidi et al. 2019)
Table 1.1. Structures of common benzoic acid derivatives
Acid R1 R2 R3
p-Hydroxybenzoic H OH H
3,4-dihydroxybenzoic H OH OH
Vanilic OCH3 OH H
Syringic OCH3 OH OCH3
Gallic OH OH OH
Protocatechuic acid H OH OH

8
Hydroxycinnamic acids have the structure of C6 – C3 and are linked together by
double bonds. They are mostly found in foodstuffs as monomers, dimers or polymers.
During food processing (sterilization, freezing or fermentation), they can obtain free
forms (Factors, Rommel, and Wrolstad 1993). Hydroxycinnamic acids are found in
nature as caffeic, ferulic, synaptic, p-coumaric and chlorogenic acids (Herrmann, Nagel,
and Herrmann 2009). The general structure of cinnamic acid is shown in Figure 1.6.
The types of hydroxycinnamic acids are given in Table 1.2.
Figure 1.6. General structural of cinnamic acid
(Source: Shahidi et al. 2019)
Table 1.2. Structures of common hydroxycinnamic acid derivatives
Acid R1 R2 R3
p-Coumaric H OH H
Caffeic H OH OH
Ferulic OCH3 OH H
Sinapic
OCH3 OH OCH3
9
Hydroxycinnamatic acids are generally found in nature in fruits (peaches,
strawberries, citrus fruits, plums, etc.). Caffeic and p-coumaric acids, which are types of
these acids, are widely found in fruits (Archivio et al. 2007). As the name suggests,
while caffeic acid is abundant in coffee, it is also found in grapes, pears, apples and
oranges (Naczk and Shahidi 2006). Coumaric acid is found mostly in strawberries,
although it can be found in other fruits. Sinapic acid is abundant in Brassica vegetables
and grains, a genus of mustard family (Mattila 2005). Ferulic acid constitutes almost all
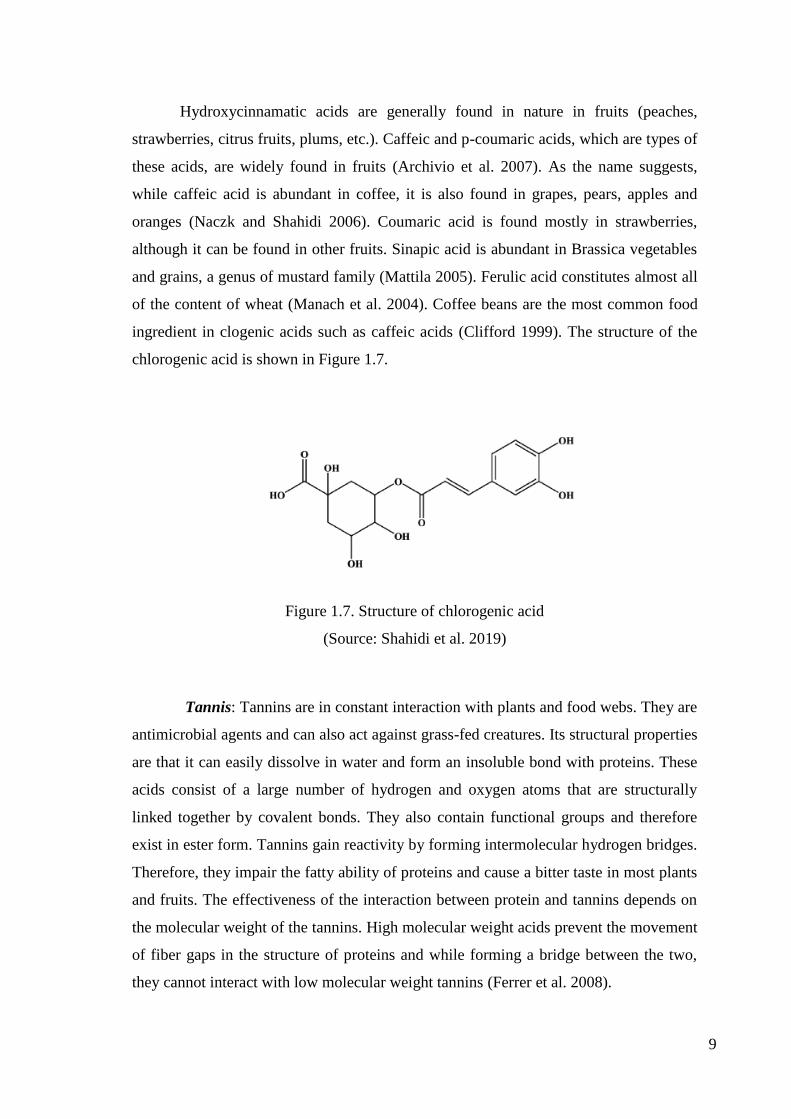
of the content of wheat (Manach et al. 2004). Coffee beans are the most common food
ingredient in clogenic acids such as caffeic acids (Clifford 1999). The structure of the
chlorogenic acid is shown in Figure 1.7.
Figure 1.7. Structure of chlorogenic acid
(Source: Shahidi et al. 2019)
Tannis: Tannins are in constant interaction with plants and food webs. They are
antimicrobial agents and can also act against grass-fed creatures. Its structural properties
are that it can easily dissolve in water and form an insoluble bond with proteins. These
acids consist of a large number of hydrogen and oxygen atoms that are structurally
linked together by covalent bonds. They also contain functional groups and therefore
exist in ester form. Tannins gain reactivity by forming intermolecular hydrogen bridges.
Therefore, they impair the fatty ability of proteins and cause a bitter taste in most plants
and fruits. The effectiveness of the interaction between protein and tannins depends on
the molecular weight of the tannins. High molecular weight acids prevent the movement
of fiber gaps in the structure of proteins and while forming a bridge between the two,
they cannot interact with low molecular weight tannins (Ferrer et al. 2008).
10
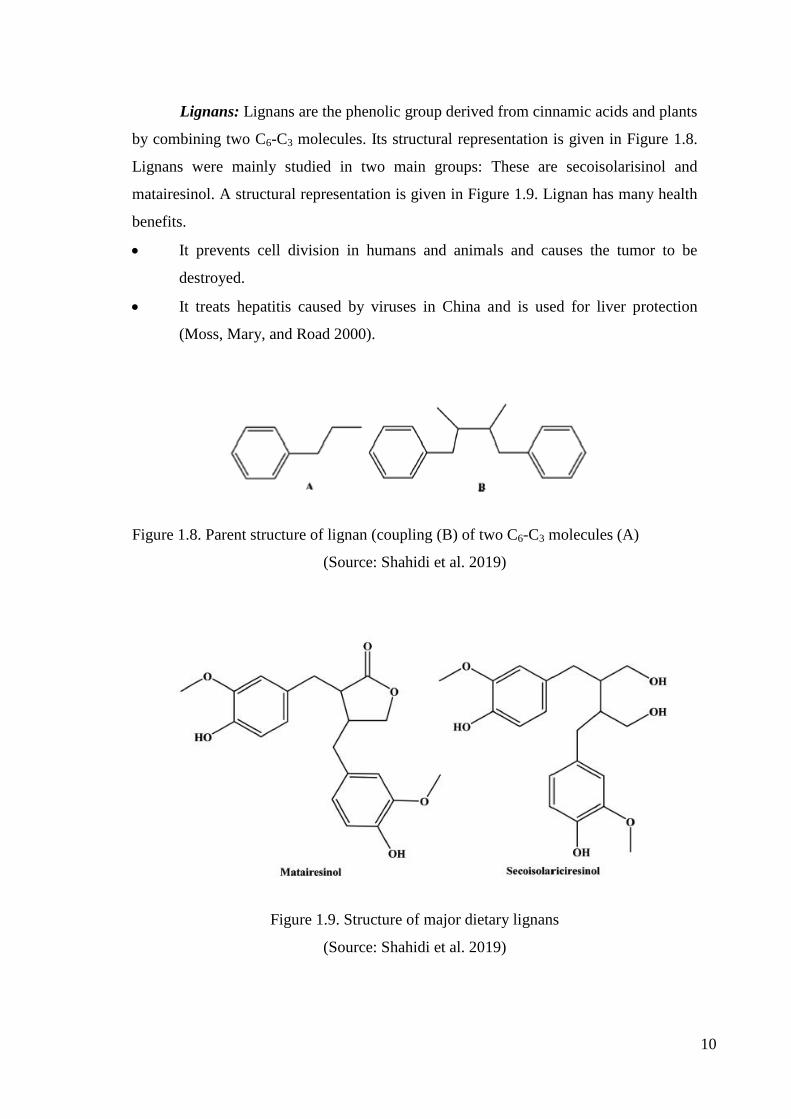
Lignans: Lignans are the phenolic group derived from cinnamic acids and plants
by combining two C6-C3 molecules. Its structural representation is given in Figure 1.8.
Lignans were mainly studied in two main groups: These are secoisolarisinol and
matairesinol. A structural representation is given in Figure 1.9. Lignan has many health
benefits.
It prevents cell division in humans and animals and causes the tumor to be
destroyed.
It treats hepatitis caused by viruses in China and is used for liver protection
(Moss, Mary, and Road 2000).
Figure 1.8. Parent structure of lignan (coupling (B) of two C6-C3 molecules (A)
(Source: Shahidi et al. 2019)
Figure 1.9. Structure of major dietary lignans
(Source: Shahidi et al. 2019)

11
Stilbenoids: Stilbenes are phenolics with a base-like carbon skeleton (C6-C2-C6)
containing 1,2-diphenylethylene as certain atom groups responsible for the
characteristic chemical reactions of the molecules they contain. The structural
representation of resveratrol (3,5,4'-trihydroxystylbene), which is a type of stilbene in
free or glycoside structures and seen in some fruits, is given in Figure 1.10
(Nichenametla et al. 2007).
Figure 1.10. Structure of trans-resveratrol (trans-3,5,4-trihydroxystilbene)
(Source: Shahidi et al. 2019)
Hydroxytyrosol: It is known as the phenolic compound (hydroxytyrosol) in
olive oil and wine has many health benefits such as reducing oxidative damage,
eliminating inflammation in the body, treating the endothelial form, stopping tumor
growth and protecting the central nervous system (Rodríguez-morató et al. 2016). The
structural representation of hydroxytyrosol is shown in Figure 1.11.
Figure 1.11. Structure of hydroxytyrosol
(Source: Shahidi et al. 2019)
12
1.2.4. Antioxidant Activity of Phenolic Compounds
1.2.4.1. Free Radicals
Free radicals can be defined as free molecules that are not attached to an
electron. Since most free radicals do not bind to electrons, they can exhibit highly
unstable properties. They can exchange electrons with molecules other than themselves.
The reason why they act as oxidant or reductant is due to this electron exchange
(Cheeseman and Slater 1993). Free radicals can be created by adding electrons to an
uncharged atom or molecule, or by stealing electrons from that atom and molecule.
Various energies are needed in this formation process. Heat, UV light and radiation are
some of them (Halliwell 2001; Ima 2004). Because they do not pair with an electron,
they tend to cling to electrons. In such cases, they go to compounds with nitrogen atoms
such as proteins and nucleic acids. At the same time, they attack regions with excess
electrons in double-bonded carbon fatty acids (Ima 2004).
Free radicals are known as reactive oxygen species (ROS) with oxygen radicals
in the center and reactive nitrogen species (RNS) with nitrogen radicals in the center
(Halliwell 2001). These types (ROS and RNS) can be distinguished according to
whether they are radical or not. Compounds that exhibit radical properties are electron
unpaired species and are free radicals in their own right. Species that do not show
radical properties perform oxidizing reactions in living organisms (Durackova 2015;
Phaniendra and Babu 2015). Free radicals fail to defend against any substance that
harms living organisms. Therefore, it is known to have a negative role in organisms
(Ková 2010). Free radical sources can be investigated inside (endogenous) or outside
(exogenous) of the cell or organism being studied. For example, the (endogenous)
sources formed inside the cell are found in mitochondria, endoplasmic reticulum and
peroxisomes where oxygen is consumed a lot (Phaniendra and Babu 2015).
Representation of endogenous sources is given in Figure 1.12.

13
Figure 1.12. Typical endogenous sources of free radicals
(Source: Preedy 2020)
Sources occurring outside of the examined tissues and cells are given in Figure
1.13.
Figure 1.13. Most common exogenous sources of free radicals
(Source: Preedy 2020)
1.2.4.2. Oxidative Stress
Oxidative stress occurs most frequently in two situations. An excess of ROS,
which is a kind of free radical, and a decrease in its antioxidant properties create
oxidative stress. This situation harms human tissues and cells physically, chemically
and psychologically and may lead to various diseases (Tian et al. 2007). Living things
have developed a good defense system in response to this negative situation. Resources
that include various defense systems such as physical and antioxidant defense try to
overcome this negative oxidative stress (Valko et al. 2007).

14
Some diseases caused by oxidative stress are given below (Agarwal and
Prabakaran 2005; Pham-huy, He, and Pham-huy 2008; Valko et al. 2007):
Cardiovascular diseases (heart diseases, hypertension etc.)
Neurological diseases (Alzheimer's disease, memory loss, parkinson etc.)
Tumor formation and cancer (lung, breast, ovarian cancer, etc.)
Chronic lung diseases
Stomach and intestinal diseases (peptic ulcer, colitis, etc.).
1.3. Olive Leaf and Characteristic Properties
The olive tree (Olea europaea L.) comes from the Oleaceae family, which
includes 900 evergreen species and 24 different genera. Trees of the same species as
Olea europaea L. are shown in Table 1.3.
Table 1.3. Taxonomic classification of the olive tree
(Source: Omaki et al. 2003)
Kingdom Plantae
Division Magnoliophyta
Class Magnoliopsida
Order Lamiales
Family Oleaceae
Genus Olea
Species E. oleaster
E. sativa
Binomial name Olea europaea
The fruit leaves and other parts of the olive tree (branches and flowers) contain
significant amounts of biophenols. Olive leaves contribute to properties such as color
and taste, depending on the variety and density of the fruit. In addition, the number of
leaves creates a difference between various tissues (Bilgin and Selin 2013; Rahmanian,
Jafari, and Wani 2015). Among olive tree products, the biophenol ratio of the leaf is

15
different from that of flowers, fruits and branches (Musa and Bertrand 2016). Known as
the symbol of power and peace, olive leaf was first used as medicine in Egypt. It has
been used in the treatment of many diseases (flu, cold, tooth and ear pain, etc.),
especially in Mediterranean cultures. Doctors recommended olive leaf tea for common
malaria in the mid-19th century (Gao et al. 2008; National 2014). Polyphenols are one
of the phytochemical groups that form the most structure of plants (Gianmaria F.
Ferrazzano et al. 2011). Polyphenols are protective against all kinds of disease-causing
organisms, so they have both physiological and morphological importance in plants and
trees (Astro 2006; Rahmanian, Jafari, and Wani 2015).
Polyphenols in olives constitute the secondary metabolites group in olives due to
their properties such as water solubility and molecular weight. The phenolic compounds
(polyphenols) found in the olive tree differ structurally. Phenolic compounds found in
the fruit and oil of olives; It consists of four main parts as flavonols, phenolic acids,
phenolic alcohols and secoiridoids (Ghanbari et al. 2012). The phenolic compounds
found in olive leaves are specified in five groups. These are oleuropeosides, flavones,
flavonols, flavan-3-ols and substituted phenols (Musa and Bertrand 2016). The names
of the phenolic groups contained in the olive leaf and examples of these groups are
shown in Table 1.4.
Table 1.4. Phenolic compounds found in olive leaves
(Source: Benavente-García et al. 2000)
Group Examples
Oleuropeosides Oleuropein, Verbascoside
Flavones
Luteolin-7-glucoside, Apigenin-7-
glucoside, Diosmetin-7- glucoside,
Luteolin, Diosmetin
Flavonols Rutin
Flavan-3-ols Catechin
Substituted Phenols Tyrosol, Hydroxytyrosol, Vanilin,
Vanillic acid, Caffeic acid
Oleuropein is the most abundant phenolic compound in olive leaves. This is
followed by the order hydroxytyrosol> luteolin> apigenin> verbascoside> floven-7-

16
glucosides (Musa and Bertrand 2016). The chemical structure of phenolics, which olive
leaves contain the most, is shown in Table 1.5.
Table 1.5. Structural representation of the most abundant phenolics in olive leaves
(Source: Benavente-García et al. 2000)
Phenolic compound
Chemical formula
Oleuropein
Hydroxytyrosol
Verbascoside
Apigenin-7-glucoside
Luteolin-7-glucoside
17
1.4. Oleuropein and its Properties
1.4.1. Oleuropein Chemistry
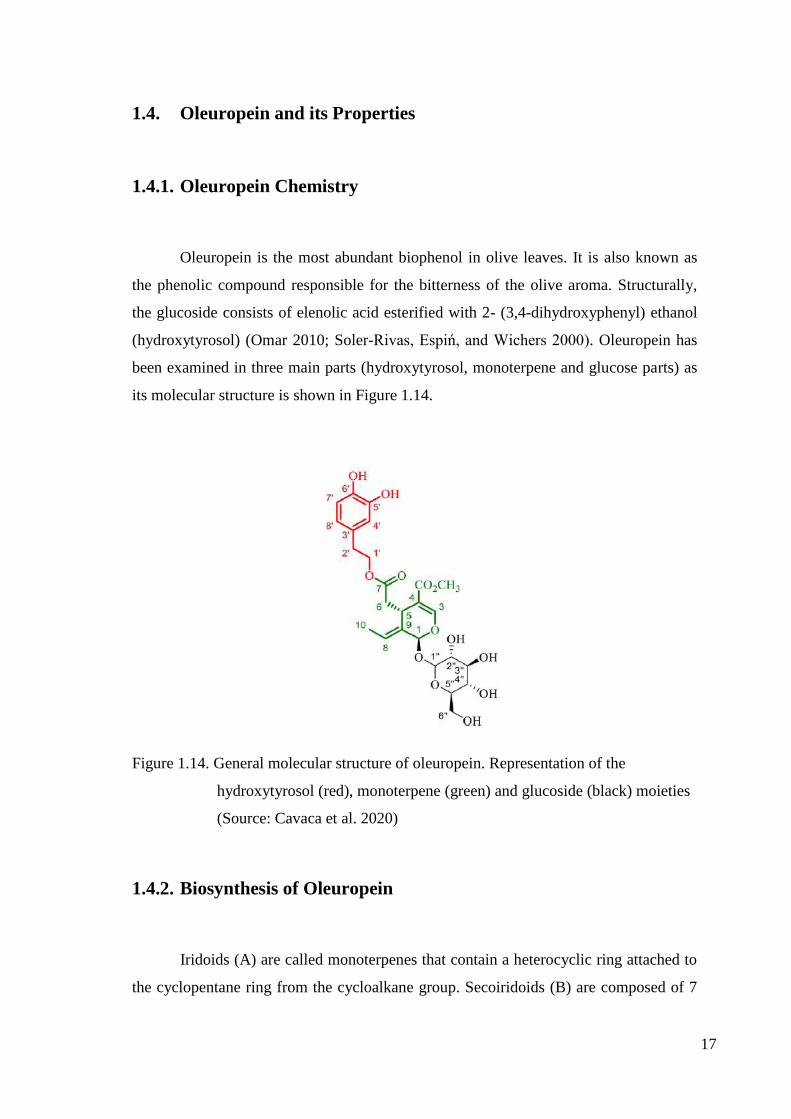
Oleuropein is the most abundant biophenol in olive leaves. It is also known as
the phenolic compound responsible for the bitterness of the olive aroma. Structurally,
the glucoside consists of elenolic acid esterified with 2- (3,4-dihydroxyphenyl) ethanol
(hydroxytyrosol) (Omar 2010; Soler-Rivas, Espiń, and Wichers 2000). Oleuropein has
been examined in three main parts (hydroxytyrosol, monoterpene and glucose parts) as
its molecular structure is shown in Figure 1.14.
Figure 1.14. General molecular structure of oleuropein. Representation of the
hydroxytyrosol (red), monoterpene (green) and glucoside (black) moieties
(Source: Cavaca et al. 2020)
1.4.2. Biosynthesis of Oleuropein
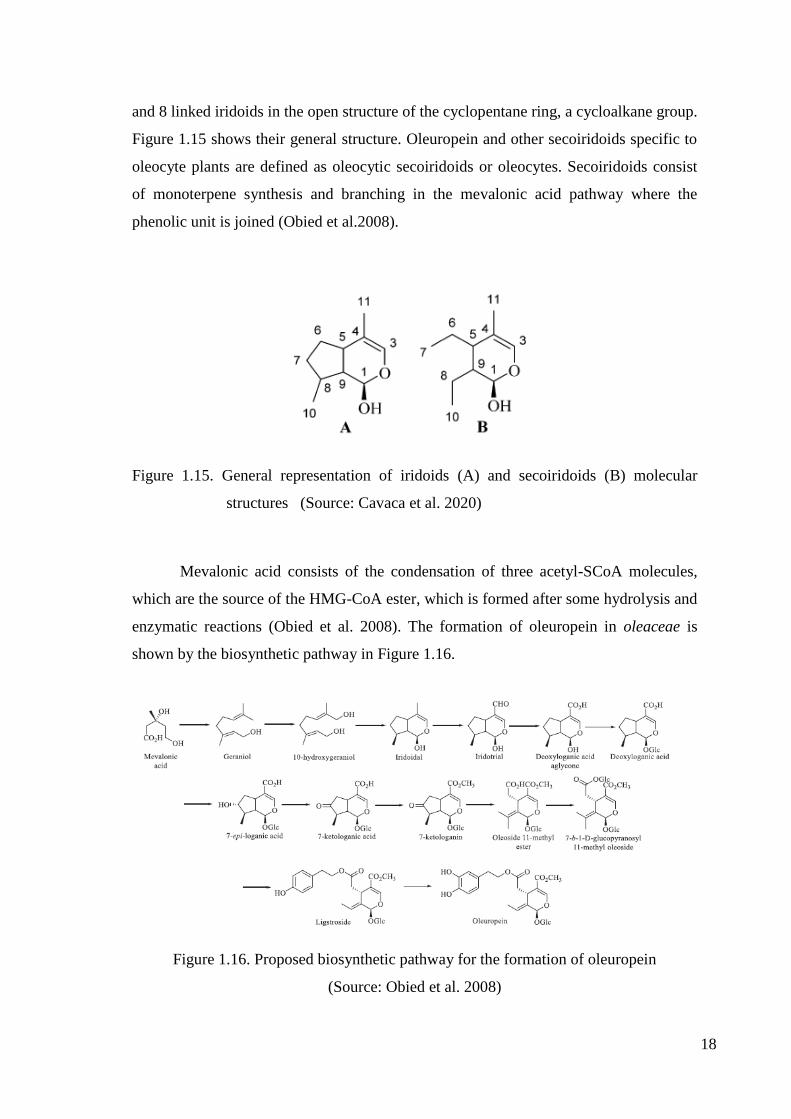
Iridoids (A) are called monoterpenes that contain a heterocyclic ring attached to
the cyclopentane ring from the cycloalkane group. Secoiridoids (B) are composed of 7
18
and 8 linked iridoids in the open structure of the cyclopentane ring, a cycloalkane group.
Figure 1.15 shows their general structure. Oleuropein and other secoiridoids specific to
oleocyte plants are defined as oleocytic secoiridoids or oleocytes. Secoiridoids consist
of monoterpene synthesis and branching in the mevalonic acid pathway where the
phenolic unit is joined (Obied et al.2008).
Figure 1.15. General representation of iridoids (A) and secoiridoids (B) molecular
structures (Source: Cavaca et al. 2020)
Mevalonic acid consists of the condensation of three acetyl-SCoA molecules,
which are the source of the HMG-CoA ester, which is formed after some hydrolysis and
enzymatic reactions (Obied et al. 2008). The formation of oleuropein in oleaceae is
shown by the biosynthetic pathway in Figure 1.16.
Figure 1.16. Proposed biosynthetic pathway for the formation of oleuropein
(Source: Obied et al. 2008)

19
1.4.3. Health Effects of Oleuropein
Oleuropein has many beneficial properties in terms of health. Some of these can
be listed as anti-inflammatory, anti-atherogenic, anti-cancer, antimicrobial and antiviral.
The reason why it has an important place in the food and medicine industry in
Mediterranean countries is that it has these pharmacological properties (Carluccio et al.
2003; Fredrickson 2000; Tripoli et al. 2005; Visioli, Bellosta, and Galli 1998; Visioli,
Poli, and Galli 2002). Figure 1.17 shows the pharmacological effects of oleuropein.
Figure 1.17. Pharmacological properties of oleuropein
(Source: Omar 2010)
Antioxidant activity: Oleuropein largely eliminates metal oxide formation
(oxidation) of low density lipoproteins (LDL) (Visioli, Bogani, and Galli 2006; Visioli,
Galli, and Galli 2002). Oleuropein can eliminate nitric oxide and contribute to the
formation of nitric oxide synthase in the cell (De, Eugenia, and Domínguez 2001). The
oxidative substance that damages proteins and enzymes in living things and produces in
vivo in injured areas is called hypochlorous acid (HOCl). Oleuropein has the ability to
destroy this acid (Visioli, Poli and Galli 2002).
Anti-inflammatory effect: Oleuropein increases nitric oxide (NO) production
in macrophages, which are part of the immune system. Therefore, the activity of the
immune system increases (Visioli, Bellosta and Galli 1998). At the same time,
oleuropein is known to increase anti-inflammatory effects by destroying both

20
lipoxygenase enzyme and leukotriene B_4 production (Puerta, Gutierrez, and Hoult
1999).
Anti-cancer effect: Oleuropein aglycone (the sugar-free part of the glycoside) is
known to be the most potent phenolic compound that reduces the activity of cells that
make up breast cancer. SKBR3 cells that increase HER2 cancerous tissues and HER2
negative MCF-7 cells are known to be approximately five times more sensitive to
oleuropein aglycone (Menendez et al. 2007). In later years, oleuropein aglycon and
ligstroside aglycon determine the cell structures that makeup breast cancer and reduce
the tympanic structures formed as a result of these structures. These two structures
(oleuropein aglycon and ligstroside aglycone) eliminate the HER2 protein that causes
cancer over time (Menendez et al. 2008).
Antimicrobial effect: Gram-negative, gram-positive, and anti-mycoplasma are
strong antimicrobial properties of oleuropein (Bisignano et al. 1999; Maria et al. 2002).
Phenolic compounds that are structurally similar to oleuropein disrupt the bacterial cell
wall and enable it to gain antibacterial properties (Caturla et al. 2005).
Antiviral effect: The effect of oleuropein against the structure of HIV-1 gp41, a
subunit of gclioprotein on the surface, by allowing HIV to enter and reproduce in
healthy cells has been of interest. Despite these structures (HIV-1 gp41), studies
continue to reduce the effect of oleuropein at the molecular level (Lee-huang et al.
2007).
1.5. Extraction Techniques
The solvent extraction technique is the oldest and most widely used separation
process in history. The solvent extraction technique is commonly known as the process
of transferring (separating) the phase containing the target compound or sample into a
liquid phase that has undergone further processing (C. Poole, Mester, Miró, and
Pedersen-bjergaard 2016). In solvent extraction, the treated phase is preferred as a
liquid, and the sample is a gas, liquid or solid material that is slightly soluble in this
phase. Samples consist of target compounds and unwanted matrix groups that are
desired to be separated or dissolved. Therefore, the purpose of solvent extraction is to
21
separate desired target compounds from these matrix structures (Alexovič et al. 2018).
1.5.1. Liquid-Liquid Extraction
Usually, familiar materials such as separating funnels and bottles are used in
liquid-liquid extractions. Different scaled volumes from the smallest liter value
(microliter) to the liter range are placed in this equipment. All equipment used has a
duty. For example, mixers are used to precipitate phases and separate them from each
other (Alexovič et al. 2018; Chang et al. 2007).
1.5.2. Solid-Liquid Extraction
With the help of solvents, solids may not be able to fully penetrate the matrix.
The uptake or separation of the desired (target) compounds depends on processes other
than solvent. For these reasons, solids are not an easy phase for solvent extraction. The
distribution of desired (target) compounds in the matrix, both the chemical and physical
properties of the target compounds, and the properties of the matrix are procedures that
affect the extraction rate (Huang, Boxin, and Prior 2005; Nilsson 2000; C. Poole,
Mester, Miró, Pedersen-Bjergaard, et al. 2016). The extraction steps of target
compounds composed of the porous structure are shown in Figure 1.18.
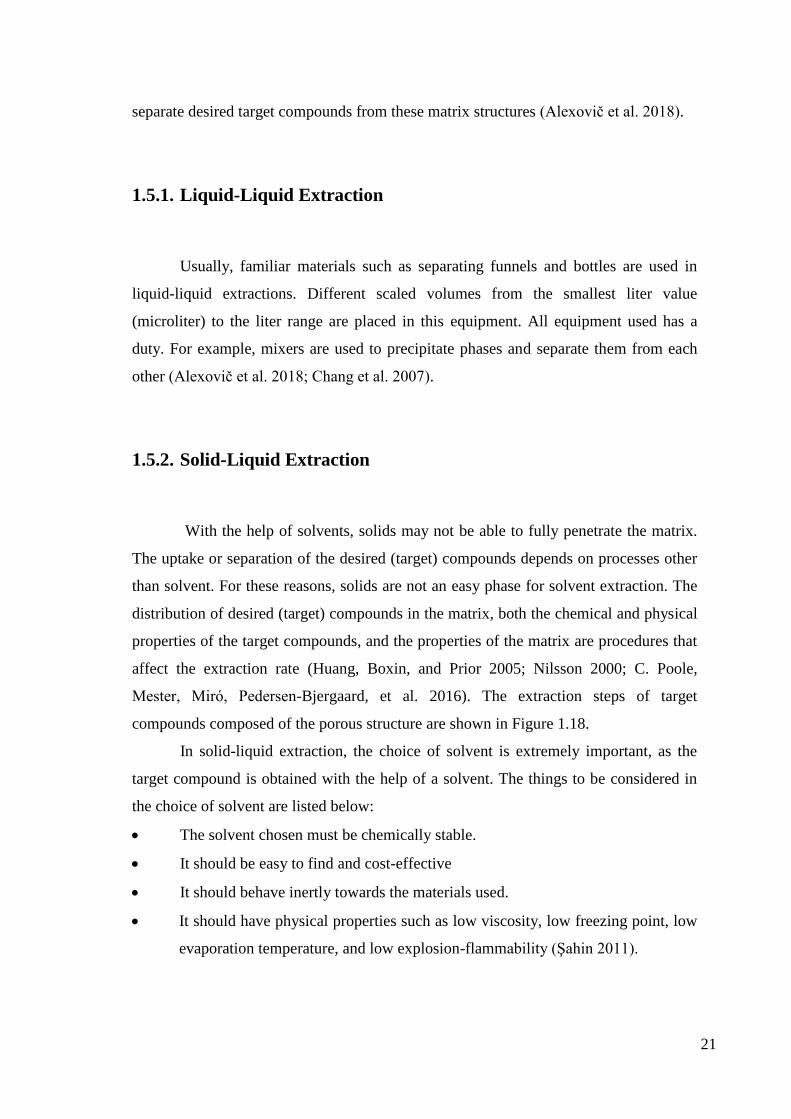
In solid-liquid extraction, the choice of solvent is extremely important, as the
target compound is obtained with the help of a solvent. The things to be considered in
the choice of solvent are listed below:
The solvent chosen must be chemically stable.
It should be easy to find and cost-effective
It should behave inertly towards the materials used.
It should have physical properties such as low viscosity, low freezing point, low
evaporation temperature, and low explosion-flammability (ġahin 2011).

22
Figure 1.18. Extraction steps of target compounds composed of organic material and
porous structure (Source: Poole 2020)
In solid-liquid extraction, the contact of the solvent with the material to be
extracted is as important as the solvent selection. The diffusion phenomenon is directly
proportional to the interface between the solid and liquid phases. Therefore, reducing
the size of solids accelerates the extraction process. The cellular structure of every solid
matter is different from each other. Vegetative tissue consists of cells surrounded by
walls. The extraction of dried plant material with the aid of a solvent basically takes
place in two stages. To help the substances (pores) found in plants to expand, it is first
contacted with the selected solvent and soaked to swell the plant tissue. Then, the
transition from enlarged pores to the solvent is achieved by diffusion (Vinatoru 2001).
The extraction process on vegetative tissue is shown in Figure 1.19.
Figure 1.19. Schematic representation of plant cell tissue
(Source: Vinatoru 2001)

23
1.5.2.1. Soxhlet Extraction
Extraction is an important method for separating phenolic compounds and
antioxidants from the plant matrix. Processes such as maceration, soxhlet, boiling, and
soaking, known as traditional methods used for a long time, are widely used in
extraction methods due to their low cost, easy working principle, and high extraction
efficiency. Soxhlet extraction, one of these traditional methods, is known and preferred
as an extraction method that provides much higher efficiency than other methods in
obtaining the desired target compounds (antioxidant and phenolic compounds) (Orkan
Dal, Duygu ġengün 2020). The Soxhlet device, defined in 1879 in history, is a highly
preferred method to compare new methods (Azmin et al. 2016; Luque de Castro and
Priego-Capote 2010). The setup of Soxhlet extraction is shown in Figure 1.20.
Figure 1.20. Soxhlet Extraction
(Source: Poole 2020)
The extraction solvent is heated by the heat source. The heated solvent
evaporates and condenses over time. The concentrated solvent is filtered over the solid
sample in the extraction thimble. The filtered solution accumulates in the thimble to a
certain level, and then the solvent returns back to the boiling flask. This process works
24
according to the siphon principle. The suitable medium for Soxhlet extraction is at room
temperature or close to the boiling point of the solvent used for different sample sizes.
Usually, it is used as a 10 g solid sample and 50-250 ml solvent (Luque de Castro and
Priego-Capote 2010).
The advantages of Soxhlet extraction can be listed as follows:
The sample used in the extraction process is in constant contact with the solvent.
The temperature of the system is always kept at the same value.
Filtration is done after extraction and there is no need for extra filtration
afterward.
As the equipment used is less costly, parallel extraction can be done at the same
time, thus increasing sample efficiency in a shorter time.
The most serious disadvantage of soxhlet extraction compared to other traditional
solid-liquid extraction techniques is the long time required for the extraction process (C.
F. Poole 2020).
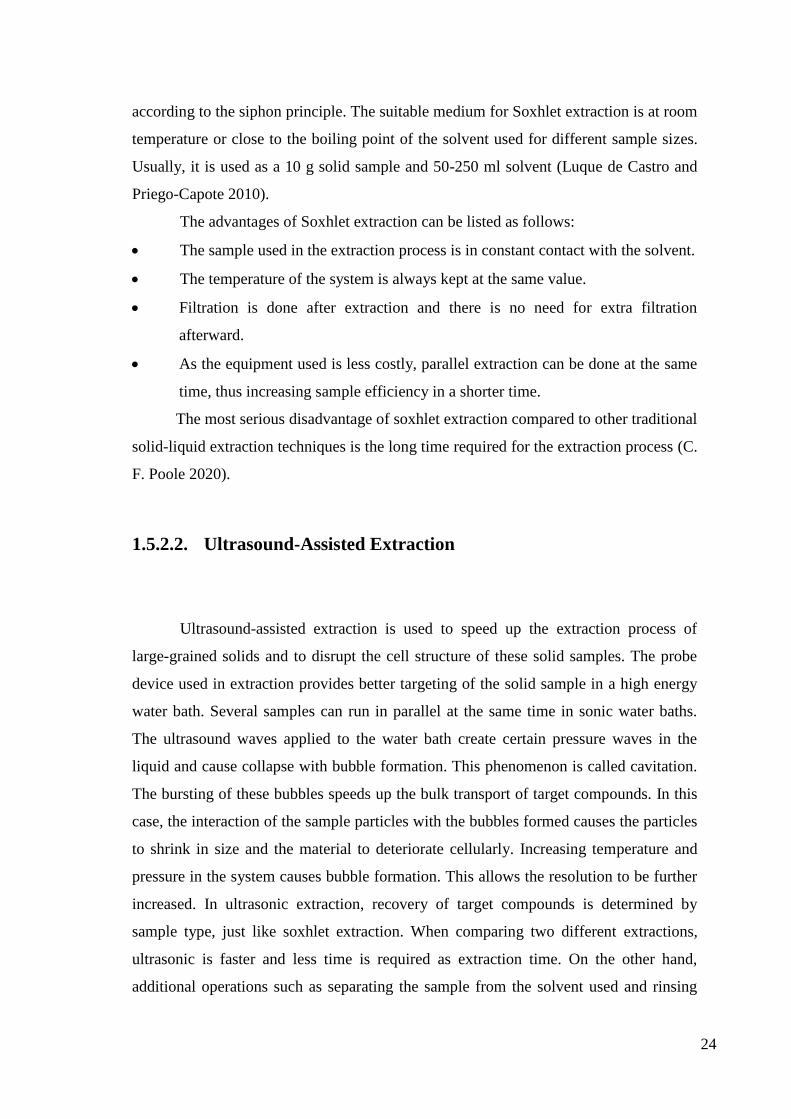
1.5.2.2. Ultrasound-Assisted Extraction
Ultrasound-assisted extraction is used to speed up the extraction process of
large-grained solids and to disrupt the cell structure of these solid samples. The probe
device used in extraction provides better targeting of the solid sample in a high energy
water bath. Several samples can run in parallel at the same time in sonic water baths.
The ultrasound waves applied to the water bath create certain pressure waves in the
liquid and cause collapse with bubble formation. This phenomenon is called cavitation.
The bursting of these bubbles speeds up the bulk transport of target compounds. In this
case, the interaction of the sample particles with the bubbles formed causes the particles
to shrink in size and the material to deteriorate cellularly. Increasing temperature and
pressure in the system causes bubble formation. This allows the resolution to be further
increased. In ultrasonic extraction, recovery of target compounds is determined by
sample type, just like soxhlet extraction. When comparing two different extractions,
ultrasonic is faster and less time is required as extraction time. On the other hand,
additional operations such as separating the sample from the solvent used and rinsing

25
are required after extraction (Picó 2013; Priego-Capote and Luque De Castro 2004).
1.5.2.3. Microwave-Assisted Extraction
In principle, microwaves are radiation that deals with the movement of ions and
the interactions of molecules. Substances of the sample and solvent used in the
microwave are directly proportional to its permeability. The energy of the microwave
oven increases with temperature (Azmin et al. 2016; Luque de Castro and Priego-
Capote 2010; Ridgway, Lalljie, and Smith 2007; Sun et al. 2012). With a low polarity
(low permeability) solvent, the desired compounds (target compounds) in the sample
can be extracted from the hot sample into the cold solvent. Two different apparatus are
used in this extraction type. One of them is closed extraction vessels that can control
temperature and pressure. The other is known as atmospheric pressure-sensitive
microwave ovens. The temperature and pressure generated in these closed extraction
vessels can be higher than the boiling point of the solvent used. Comparing the heating
method and pressure systems, high pressure is more important than high temperature. It
is an effective option for high-temperature microwave-assisted extraction. It increases
the solubility of target compounds and reduces their interaction with matrices. Thus, the
reduction of the solvent volume provides shorter and uninterrupted extraction. The
extraction process takes less time compared to Soxhlet extraction (C.F. Poole 2020).
1.5.2.4. Pressurized Liquid Extraction
In the working principle, the sample in the solid phase is placed in the steel
container. A certain level of solvent is pumped into this container. The container is
heated to the specified temperature and the solvent is transferred to another container.
The incoming solvent is washed with fresh solvent and purged with nitrogen gas. In this
extraction, the sample (target compound) and the solvent are in contact for a longer
time. For these reasons, the extraction time is important (Subedi et al. 2015).

26
1.5.3. Gas-Liquid Extraction
Gas-liquid extractions are used to separate volatile organic compounds from
gas-phase solid adsorbents that are difficult to recover. Solvent-based colliders and
bubbles participate in this extraction (Szulejko and Kim 2014). Although the colliders
do not ensure that the gas and solvent are completely mixed as they pass through the
selected solvent, the solvent creates a favorable environment for the separation of gases
and vapors of great interest for optimally reactive compounds. Although the bubbles
allow the solvent to mix well with the gas, the gas flow rates are very low (Yu et al.
2016; Zheng and Yao 2017).
27
CHAPTER 2
LITERATURE SURVEY
It has been known by many researchers that the olive tree leaf has therapeutic
properties. The most important reason for having this feature is oleuropein, the highest
phenolic compound found in the leaf. The widespread use of oleuropein in the
healthcare field has led researchers to investigate this phenolic component from all
sides. According to the researches, olives and the phenolic components in them vary
according to many different factors such as the environmental conditions in which they
are grown, the harvest season, the pre-treatments applied while extracting the extract,
and the extraction methods. Therefore, in this section, a literature review is given on the
composition of olives, the properties of oleuropein, experimental results for oleuropein
extraction, and the effects of different extraction parameters on oleuropein yield.
2.1. Factors Affecting Oleuropein and Phenolic Levels
2.1.1. Environmental Conditions and Resource
Lujan et al. (2008) studied the identification and quantification of phenolic
compounds in extracts obtained from olive tree materials (olive oil, alperujo known as
waste material in oil production, leaves, olive stones and branches). Biophenols were
extracted using different methods depending on the materials used. Liquid-liquid
extraction for oil, micro-assisted filtration for leaves, stones and branches, and
pressurized liquid filtration for alperujo were applied. According to the research, the
highest phenolic compound in olive tree materials was determined as oleuropein with a
concentration of 2% (w / w) in olive leaves. The oleuropein concentration was found to
be approximately 19000 mg / g in the leaves and 600 mg / g in the branches. For this

28
reason, olive leaves have been identified as an excellent source for oleuropein (Japón
Luján et al. 2008). The concentrations of phenolic compounds present in the materials
are shown in Table 2.1.
Table 2.1. Concentration of olive phenolic compounds derived from olive oil and olive
tree materials (n.d.: not detected) (Source: Japón Luján et al. 2008)
Sample/
biophenol
(mg/kg)
Hydroxytyrosol
Luteolin-7-
glucoside
Apigenin-7-
glucoside
Verbascoside
Oleuropein
Olive oil 3.0 ± 0.2 n.d. n.d. 0.08 ± 0.02 n.d.
Alperujo 831 ± 22 14.3 ± 2.3 6.2 ± 0.9 20.2 ± 2.8 37 ± 4
Olive
leaves
n.d. 155 ± 10 207 ± 10 1428 ± 46 19050 ± 880
Olive
branches
22.2 ± 2.0 175 ± 8 10.9 ± 0.8 1560 ± 50 673 ± 34
Olive
stones
18.1 ± 1.9 6.2 ± 0.8 0.09 ± 0.01 0.15 ± 0.03 0.06 ± 0.02
Pereira et al. (2007) studied the biophenols in the leaf using an aqueous olive
leaf extract. HPLC-DAD analysis was used for phenolic compound determination.
These compounds; Caffeic acid, rutin, oleuropein, luteolin 7-O-glucoside, apigenin 7-O-
glucoside, verbascoside, and luteolin were identified as 4'-O-glucoside. The study
revealed the highest amount of phenolic oleuropein compound in the olive leaf extract.
Oleuropein was found to be 73% of the total compounds and 1% of caffeic acid (Pereira
et al. 2007). The quantities and comparison of the seven phenolic compounds are shown
in Table 2.2.
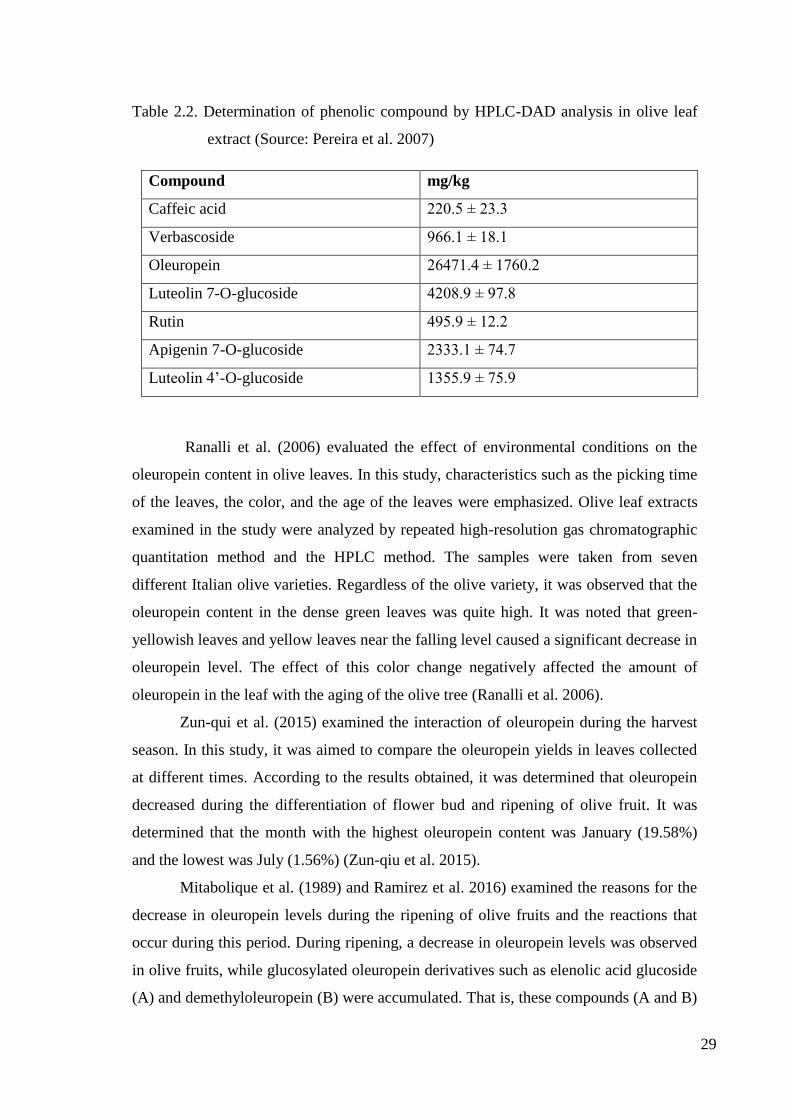
29
Table 2.2. Determination of phenolic compound by HPLC-DAD analysis in olive leaf
extract (Source: Pereira et al. 2007)
Compound mg/kg
Caffeic acid 220.5 ± 23.3
Verbascoside 966.1 ± 18.1
Oleuropein 26471.4 ± 1760.2
Luteolin 7-O-glucoside 4208.9 ± 97.8
Rutin 495.9 ± 12.2
Apigenin 7-O-glucoside 2333.1 ± 74.7
Luteolin 4‟-O-glucoside 1355.9 ± 75.9
Ranalli et al. (2006) evaluated the effect of environmental conditions on the
oleuropein content in olive leaves. In this study, characteristics such as the picking time
of the leaves, the color, and the age of the leaves were emphasized. Olive leaf extracts
examined in the study were analyzed by repeated high-resolution gas chromatographic
quantitation method and the HPLC method. The samples were taken from seven
different Italian olive varieties. Regardless of the olive variety, it was observed that the
oleuropein content in the dense green leaves was quite high. It was noted that green-
yellowish leaves and yellow leaves near the falling level caused a significant decrease in
oleuropein level. The effect of this color change negatively affected the amount of
oleuropein in the leaf with the aging of the olive tree (Ranalli et al. 2006).
Zun-qui et al. (2015) examined the interaction of oleuropein during the harvest
season. In this study, it was aimed to compare the oleuropein yields in leaves collected
at different times. According to the results obtained, it was determined that oleuropein
decreased during the differentiation of flower bud and ripening of olive fruit. It was
determined that the month with the highest oleuropein content was January (19.58%)
and the lowest was July (1.56%) (Zun-qiu et al. 2015).
Mitabolique et al. (1989) and Ramirez et al. 2016) examined the reasons for the
decrease in oleuropein levels during the ripening of olive fruits and the reactions that
occur during this period. During ripening, a decrease in oleuropein levels was observed
in olive fruits, while glucosylated oleuropein derivatives such as elenolic acid glucoside
(A) and demethyloleuropein (B) were accumulated. That is, these compounds (A and B)
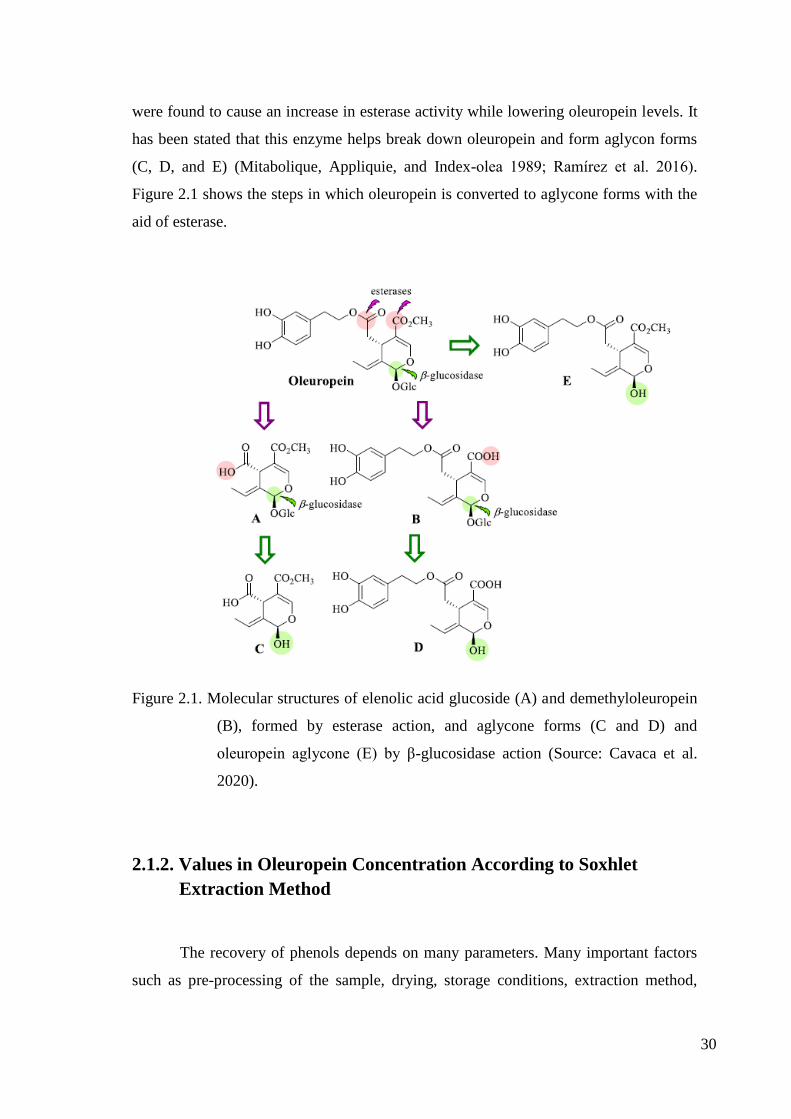
30
were found to cause an increase in esterase activity while lowering oleuropein levels. It
has been stated that this enzyme helps break down oleuropein and form aglycon forms
(C, D, and E) (Mitabolique, Appliquie, and Index-olea 1989; Ramírez et al. 2016).
Figure 2.1 shows the steps in which oleuropein is converted to aglycone forms with the
aid of esterase.
Figure 2.1. Molecular structures of elenolic acid glucoside (A) and demethyloleuropein
(B), formed by esterase action, and aglycone forms (C and D) and
oleuropein aglycone (E) by β-glucosidase action (Source: Cavaca et al.
2020).
2.1.2. Values in Oleuropein Concentration According to Soxhlet
Extraction Method
The recovery of phenols depends on many parameters. Many important factors
such as pre-processing of the sample, drying, storage conditions, extraction method,
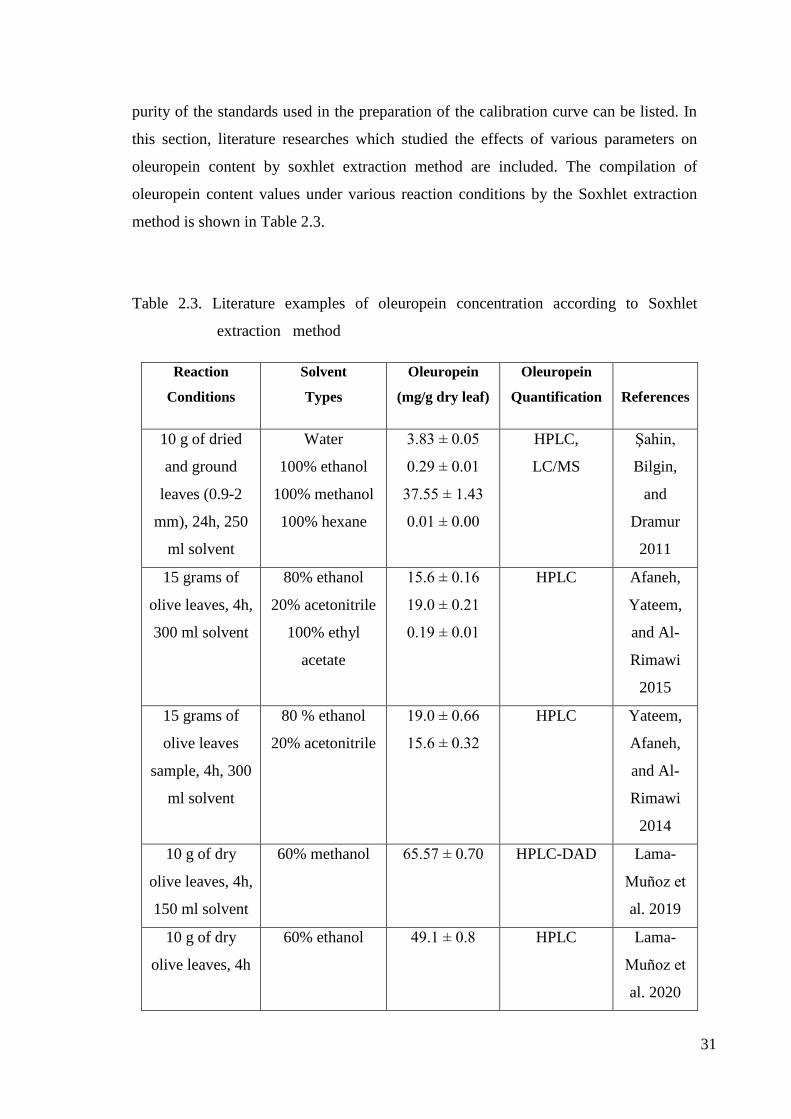
31
purity of the standards used in the preparation of the calibration curve can be listed. In
this section, literature researches which studied the effects of various parameters on
oleuropein content by soxhlet extraction method are included. The compilation of
oleuropein content values under various reaction conditions by the Soxhlet extraction
method is shown in Table 2.3.
Table 2.3. Literature examples of oleuropein concentration according to Soxhlet
extraction method
Reaction
Conditions
Solvent
Types
Oleuropein
(mg/g dry leaf)
Oleuropein
Quantification
References
10 g of dried
and ground
leaves (0.9-2
mm), 24h, 250
ml solvent
Water
100% ethanol
100% methanol
100% hexane
3.83 ± 0.05
0.29 ± 0.01
37.55 ± 1.43
0.01 ± 0.00
HPLC,
LC/MS
ġahin,
Bilgin,
and
Dramur
2011
15 grams of
olive leaves, 4h,
300 ml solvent
80% ethanol
20% acetonitrile
100% ethyl
acetate
15.6 ± 0.16
19.0 ± 0.21
0.19 ± 0.01
HPLC Afaneh,
Yateem,
and Al-
Rimawi
2015
15 grams of
olive leaves
sample, 4h, 300
ml solvent
80 % ethanol
20% acetonitrile
19.0 ± 0.66
15.6 ± 0.32
HPLC Yateem,
Afaneh,
and Al-
Rimawi
2014
10 g of dry
olive leaves, 4h,
150 ml solvent
60% methanol 65.57 ± 0.70 HPLC-DAD Lama-
Muñoz et
al. 2019
10 g of dry
olive leaves, 4h
60% ethanol 49.1 ± 0.8 HPLC Lama-
Muñoz et
al. 2020

32
2.2. Total Phenolic Content
Karakulak (2009) found the total phenolic values of olive leaf extracts obtained
by soxhlet extraction using different solvent types (pure acetone, methanol, ethanol, and
water) at 765 nm wavelength and compared them with each other. Experiments were
carried out with 20 g of dried and ground olive leaves and 200 ml of solvent for 8 hours
(Karakulak 2009). The mg gallic acid equivalents of gram dry leaves of the samples are
shown in Table 2.4.
Table 2.4. Gallic acid equivalents in mg of extracts from Soxhlet extraction
Solvent Type Total Phenolic Content
(mg GAE/g)
Acetone 30.32
Ethanol 72.19
Methanol 75.16
Water 59.08
Lama-Munoz et al. (2019) investigated the amount of phenolic compound in the
olive leaf using different extraction methods (soxhlet and ultrasound-assisted) with 60%
ethanol. The phenolic compound value of the sample made by Soxhlet extraction was
found to be higher. (Lama-Muñoz et al. 2019). The amount of phenol content of the two
extraction methods is given in Table 2.5.
Table 2.5. Comparison of both extraction methods used in the study
Response Soxhlet Extraction Ultrasound-Assisted
Extraction
TPC (mmol GAE/kg) 251.91 ± 2.13 210.25 ± 3.55
Oleuropein (mg/g) 65.57 ± 0.70 69.91 ± 1.53

33
CHAPTER 3
EXPERIMENTAL STUDY
3.1. Materials
3.1.1. Plant Materials and Chemicals
The olive leaves, which were used as a raw material source in experimental
study, were collected from the olive trees in the campus of Izmir Institute of
Technology. All chemicals used in this study were of analytical grade and were used
without any purification. The list of these chemicals are given in Table 3.1 Moreover,
de-ionized water was used to prepare all solutions and cleaning of olive leaves.
Table 3.1. List of chemicals used in the experiment
Name Producer
Oleuropein Sigma Aldrich, 98%
Methanol Merck, 99.8%
Ethanol Merck, 99.9%
Acetonitrile Merck, 99.9%
Acetic acid Merck, 99%
Folin Ciocalteu
Reagent
Merck
Sodium carbonate Sigma Aldrich, 99.5%
Gallic acid Merck, 97,5%

34
3.1.2. Experimental Apparatus
Olive leaves were dried in a vacuum oven JSR JSVO-60T. After grinding of
olive leaves, experiments were carried out by soxhlet extraction (Wisd, DH. WHM
12295) and ultrasonic extraction (WUC-D06H, WiseClean). The Soxhlet extraction set-
up consists of a 500 ml solvent container, an extractor, a condenser and a heating
system. In the ultrasonic extraction set-up consists of an ultrasonic bath which has a
capacity of 6 L and its ultrasonic frequency is 40 kHz. At the end of the extraction, the
extracted product was separated from the solvent with the aid of a Heidolph Laborota
4001 rotary evaporator. The phenolic compound (oleuropein) of olive leaf crude extract
was analyzed by HPLC Agilent Technologies 1100 Series. Thermo's Multiscan UV
spectrophotometer was used to find the total phenol content of the extract.
3.2. Experimental Procedure
In the first stage of this study, soxhlet extraction method was applied to obtain
extracts from dried and ground olive tree leaves and then, the oleuropein content of
obtained extracts were analyzed by HPLC. By using Soxhlet extraction method, the
effect of different parameters (different solvent types, different particle size, extraction
time, pre-treatment applied to ground olive leaves) over the conversion of olive leaf and
yield of oleuropein were investigated. Liquid and solid products were obtained at the
end of the extraction. The remaining solid residue was placed in a vacuum oven (Jsr
jsvo-60T) to remove moisture for 24 hours at conditions set at 50°C. The overall
conversion of olive leaf was calculated based on the initial amount of dry olive leaf
according to the following equation:
( )
( )
( )
( )

35
After extraction step, firstly, the liquid product was evaporated in the rotary
evaporator to seperate the solvent and extracted product. Then, HPLC was then used to
determine the amount of oleuropein in the remaining extract. The amount of oleuropein
in olive leaves identified by HPLC analysis was determined by the following equation:
( ⁄ )
(
) ( )
( ) ( )
Also, total phenolic content was monitored by Folin Ciocalteu Method. The
general diagram of the experimental procedure is given in Figure 3.1.
Olive Leaves
Pre-treatment
Product Analysis
HPLC, Total Phenolic Content
Rotary Evaporator
Extraction
Figure 3.1. The general diagram of experimental procedure
36
3.2.1. Pre-treatment of Olive Leaves
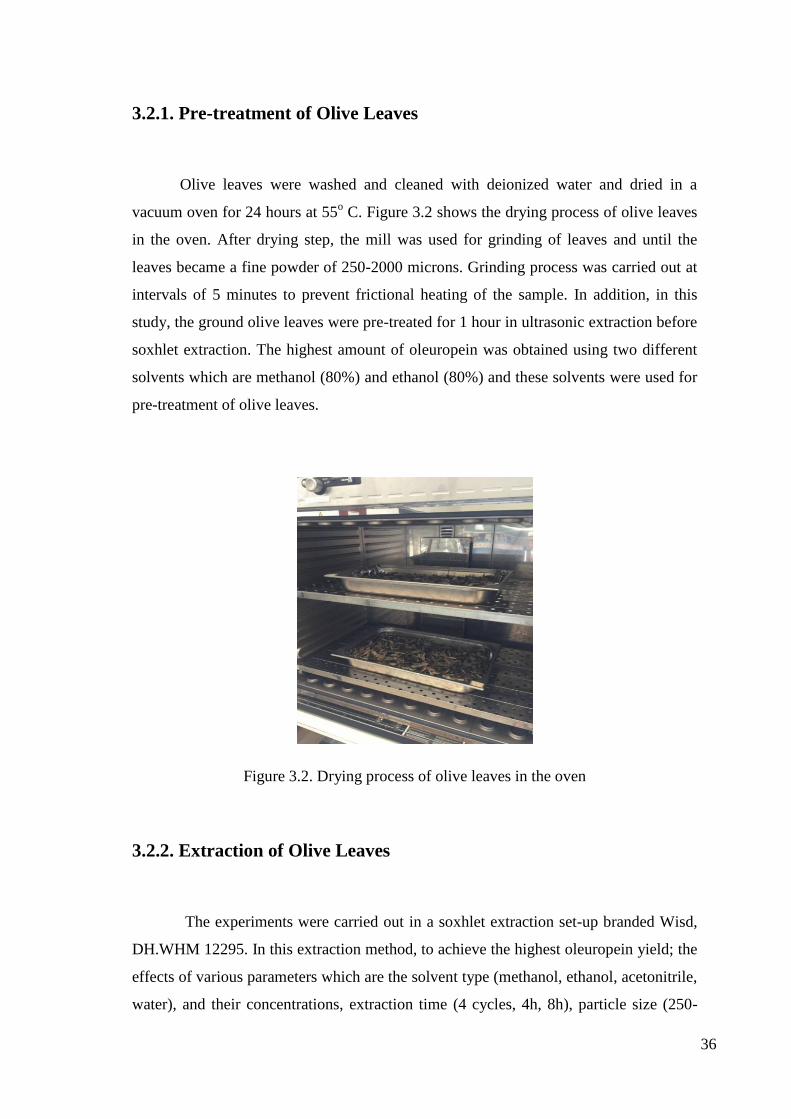
Olive leaves were washed and cleaned with deionized water and dried in a
vacuum oven for 24 hours at 55o C. Figure 3.2 shows the drying process of olive leaves
in the oven. After drying step, the mill was used for grinding of leaves and until the
leaves became a fine powder of 250-2000 microns. Grinding process was carried out at
intervals of 5 minutes to prevent frictional heating of the sample. In addition, in this
study, the ground olive leaves were pre-treated for 1 hour in ultrasonic extraction before
soxhlet extraction. The highest amount of oleuropein was obtained using two different
solvents which are methanol (80%) and ethanol (80%) and these solvents were used for
pre-treatment of olive leaves.
Figure 3.2. Drying process of olive leaves in the oven
3.2.2. Extraction of Olive Leaves
The experiments were carried out in a soxhlet extraction set-up branded Wisd,
DH.WHM 12295. In this extraction method, to achieve the highest oleuropein yield; the
effects of various parameters which are the solvent type (methanol, ethanol, acetonitrile,
water), and their concentrations, extraction time (4 cycles, 4h, 8h), particle size (250-
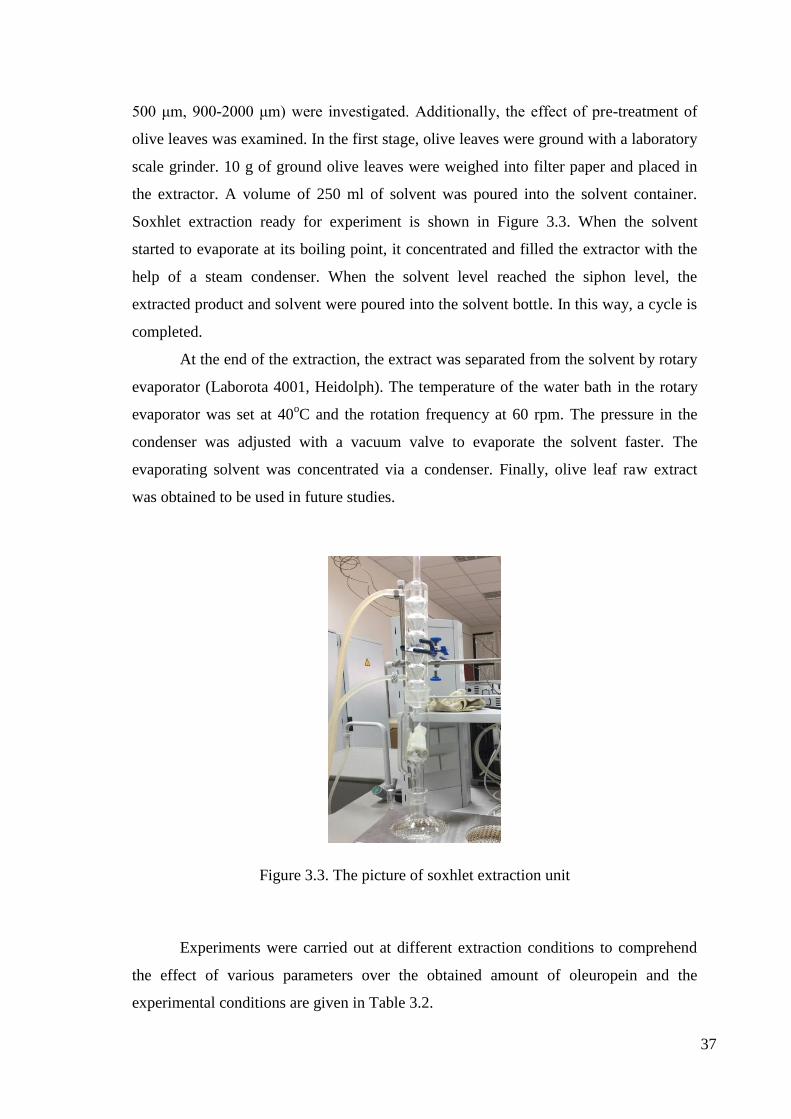
37
500 μm, 900-2000 μm) were investigated. Additionally, the effect of pre-treatment of
olive leaves was examined. In the first stage, olive leaves were ground with a laboratory
scale grinder. 10 g of ground olive leaves were weighed into filter paper and placed in
the extractor. A volume of 250 ml of solvent was poured into the solvent container.
Soxhlet extraction ready for experiment is shown in Figure 3.3. When the solvent
started to evaporate at its boiling point, it concentrated and filled the extractor with the
help of a steam condenser. When the solvent level reached the siphon level, the
extracted product and solvent were poured into the solvent bottle. In this way, a cycle is
completed.
At the end of the extraction, the extract was separated from the solvent by rotary
evaporator (Laborota 4001, Heidolph). The temperature of the water bath in the rotary
evaporator was set at 40oC and the rotation frequency at 60 rpm. The pressure in the
condenser was adjusted with a vacuum valve to evaporate the solvent faster. The
evaporating solvent was concentrated via a condenser. Finally, olive leaf raw extract
was obtained to be used in future studies.
Figure 3.3. The picture of soxhlet extraction unit
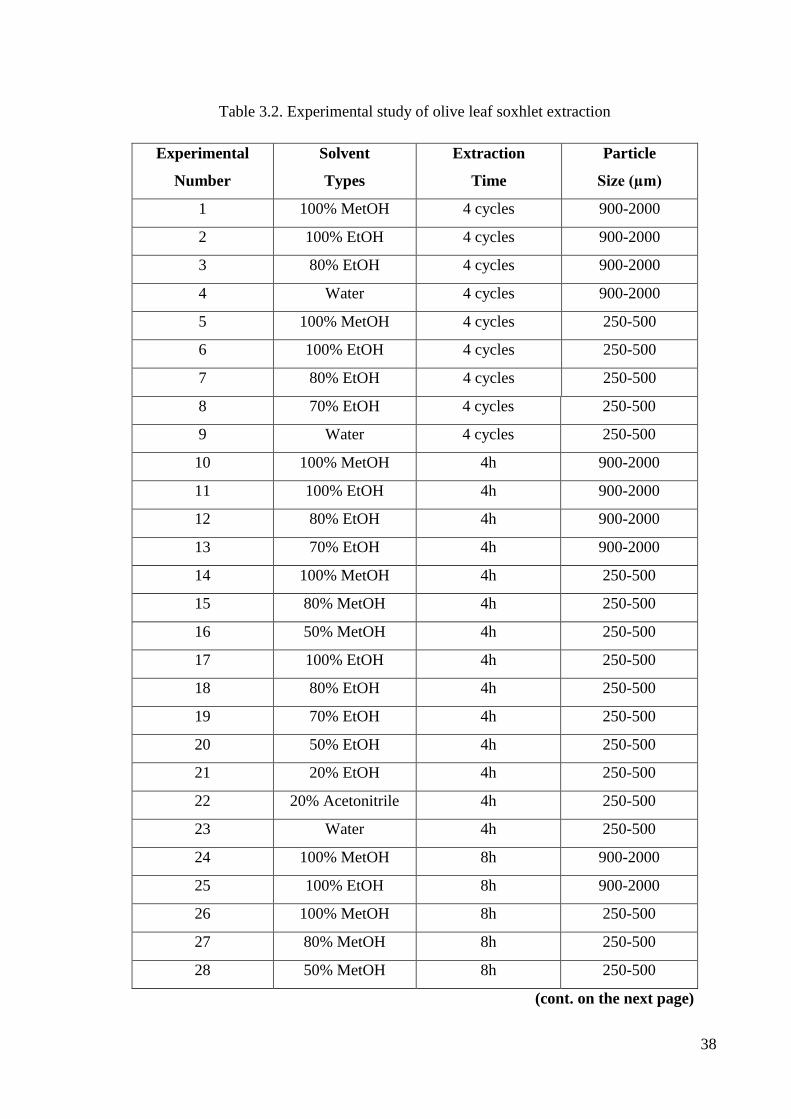
Experiments were carried out at different extraction conditions to comprehend
the effect of various parameters over the obtained amount of oleuropein and the
experimental conditions are given in Table 3.2.
38
Table 3.2. Experimental study of olive leaf soxhlet extraction
Experimental
Number
Solvent
Types
Extraction
Time
Particle
Size (µm)
1 100% MetOH 4 cycles 900-2000
2 100% EtOH 4 cycles 900-2000
3 80% EtOH 4 cycles 900-2000
4 Water 4 cycles 900-2000
5 100% MetOH 4 cycles 250-500
6 100% EtOH 4 cycles 250-500
7 80% EtOH 4 cycles 250-500
8 70% EtOH 4 cycles 250-500
9 Water 4 cycles 250-500
10 100% MetOH 4h 900-2000
11 100% EtOH 4h 900-2000
12 80% EtOH 4h 900-2000
13 70% EtOH 4h 900-2000
14 100% MetOH 4h 250-500
15 80% MetOH 4h 250-500
16 50% MetOH 4h 250-500
17 100% EtOH 4h 250-500
18 80% EtOH 4h 250-500
19 70% EtOH 4h 250-500
20 50% EtOH 4h 250-500
21 20% EtOH 4h 250-500
22 20% Acetonitrile 4h 250-500
23 Water 4h 250-500
24 100% MetOH 8h 900-2000
25 100% EtOH 8h 900-2000
26 100% MetOH 8h 250-500
27 80% MetOH 8h 250-500
28 50% MetOH 8h 250-500
(cont. on the next page)

39
Table 3.2 (cont.)
29 100% EtOH 8h 250-500
30 80% EtOH 8h 250-500
31 70% EtOH 8h 250-500
32 50% EtOH 8h 250-500
33 20% EtOH 8h 250-500
34 20% Acetonitrile 8h 250-500
35 Water 8h 250-500
Pre-treatment with ultrasonic extraction (1h, 40 kHz, 25oC)
36 80% EtOH 8h 250-500
37 80% MetOH 8h 250-500
38 80% EtOH 4h 250-500
39 80% MetOH 4h 250-500
3.3. Product Analysis
3.3.1. HPLC Analysis of Phenolic Compounds
High performance liquid chromatography (HPLC) analysis was performed to
determine the amount of oleuropein in olive leaf extract. HPLC analysis was performed
in the Environmental Development Application and Research Center at IZTECH. The
HPLC system is equipped with a C18 Inerstil column (5 µm, 250 mmx4.6 mm) and
(DAD) Agilent 1100 Series detector. The mobile phase, acetonitrile/water (20:80, v/v)
containing 0.1% acetic acid, was used at a flow rate of 1 ml/min and the temperature of
the column was set at 30o C. The features of the HPLC analysis used in this study are
shown in Table 3.3 and the schematic image of the HPLC analysis is shown in Figure
3.4.

40
Figure 3.4. Schematic representation of the HPLC system
Table 3.3. The properties of HPLC system
Property Value or Names
Column Column C18 Inertsil
Column Length 250 mm
Column Diameter 4,6 mm
Particle Size 5 µm
Mobile Phase
Mobile Phase A: acetonitrile/water
(20:80, v/v)
Mobile Phase B: 0.1% acetic acid
Flow Rate 1 mL/min
Temperature 30oC
Detector Diode Array Detector (DAD) Agilent
1100 Series
Absorbance 280 nm
The oleuropein stock solution was prepared to generate the calibration curve to
determine the amount of oleuropein in olive leaf extract. Oleuropein was dissolved in
deionized water in six different concentrations (50 ppm, 75 ppm, 100 ppm, 200 ppm,

41
500 ppm, 1000 ppm) and these solutions were analyzed by HPLC. Oleuropein amounts
were calculated using areas corresponding to each different concentration analyzed in
HPLC and a calibration curve was obtained. Thus, the amount of oleuropein extracted
in the experiments was determined using this linear calibration curve. The amount of
oleuropein in a sample determined by HPLC analysis is shown in Figure 3.5. The
calibration curve of oleuropein is given in Figure 3.6.
Figure 3.5. HPLC chromatogram of olive leaf
Oleuropein

42
Figure 3.6. Calibration Curve of Oleuropein
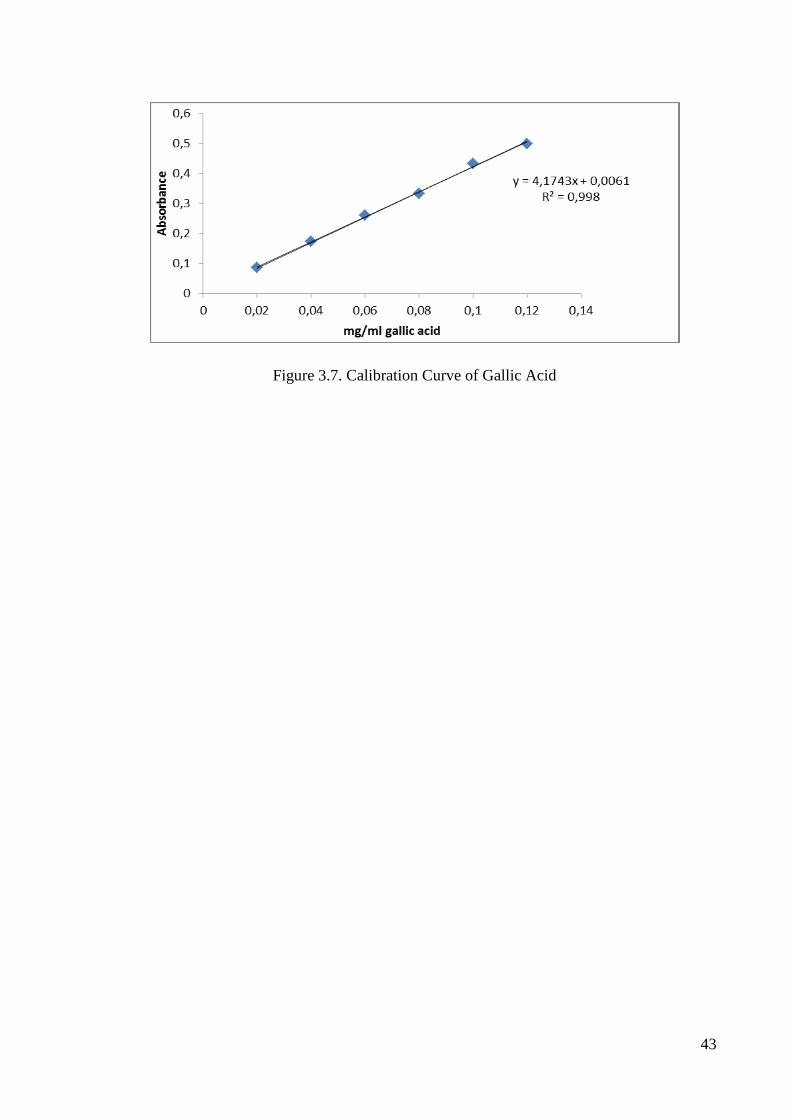
3.3.2. Total Phenolic Content (Folin Ciocalteu Method)
The total phenolic content of the liquid extract was determined using the Folin
Ciocalteu method. In this method, gallic acid stock solution was initially prepared. 50
mg of gallic acid was weighed out and diluted in 100 ml of distilled water. Standard
solutions were prepared at various concentrations (0.02-0.04-0.06-0.08-0.1 and 0.12
ppm) to obtain the calibration curve of gallic curve. Then, a gallic acid calibration curve
was formed using the standard solutions prepared based on Folin Ciocalteu Method.
The calibration curve of gallic acid is shown in Figure 3.7.
Folin Ciocalteu reagent was diluted 10-fold with distilled water and 7.5% (75
g/L) of sodium carbonate (Na2CO3) solution was prepared with distilled water. 0.5 ml of
Folin Ciocalteu reagent, 0.5 ml of liquid product and 1 ml of saturated Na2CO3 solution
were mixed and then volume adjusted to 10 ml with distilled water. After mixing, the
mixture was left in the dark at room temperature for 45 min. The absorbance was
measured at 765 nm and distilled water was used as blank sample.
y = 3,855x + 72,697
R² = 0,9986
0
500
1000
1500
2000
2500
3000
3500
4000
4500
0 200 400 600 800 1000 1200
Are
a o
f O
leu
rop
ein
Concentration of Oleuropein (ppm)
43
Figure 3.7. Calibration Curve of Gallic Acid
44
CHAPTER 4
RESULTS AND DISCUSSION
The effects of solvent types (ethanol, methanol, water, acetonitrile) and the ratio
of solvent solution, reaction time (4 cycles, 4h and 8h), partical size ranges (250-500
μm and 900-2000 μm) over the yield of oleuropein by extracting olive leaves were
investigated. Additionally, the effect of pre-treatment was also investigated.
4.1. Effect of Extraction Solvent on Conversion of Olive Leaf and Yield
of Oleuropein
Experimental results of soxhlet extraction process to investigate the effect of
solvent type on conversion and oleuropein yield are shown in Figures 4.1. and 4.2. The
experiments were carried out at the following conditions; 10 g dried olive leaf with a
particle size of 250-500 μm, in the presence of various solvents (100% ethanol, 80%
ethanol, 70% ethanol, 50% ethanol, 20% ethanol, 100% methanol, 80% methanol, 50%
methanol, 20 % acetonitrile and water) and extraction duration of 8 hours.
The selectivity of the solvent has a great importance in extracting processes to
obtain the desired compound (target compound) from the plant material. To obtain high
yield of desired compound in extraction process, the extracted compound and solvent
must show similar polar properties. Oleuropein, which is the most abundant phenolic
compound in olive leaf extract, is a polar compound so that it is necessary to choose a
solvent with high polarity in order to obtain oleuropein with high efficiency (Le Floch
et al. 1998; Lee et al. 2006). The polarity and boiling point values of the solvent types
used in the analysis are shown in Table 4.1.

45
Table 4.1. Polarity and boiling point values of the solvent types
Solvent
Type
Boiling
Point (oC)
Polarity
Value
Acetonitrile 81.6 0.460
Ethanol 78.5 0.654
Methanol 64.6 0.762
Water 100 1.000
The effect of the solvent type on the amount of oleuropein in the olive leaf
extraction performed by Soxhlet method for 8 hours is shown in Figure 4.1 and
extraction yield in Figure 4.2.
Figure 4.1. Effect of solvent type on the extracted amount of oleuropein per gram of
dried leaf by the Soxhlet extraction for 8h

46
The oleuropein content was varied between 0.48 and 13.35 mg/g dried olive
leaf. The amount of oleuropein obtained in the experiments where methanol was used as
a solvent was generally higher than other solvents. The highest oleuropein amounts
were found as 13.35 mg/g dry leaf with 80% methanol solvent, and 12.44 mg/g dry leaf
with 80% ethanol solvent, respectively. ġahin et al. (2011) aimed to examine the
oleuropein content of the solvents used in experiments with the soxhlet extraction
method. Hexane, water, ethanol, methanol and methanol/hexane (3/2:v/v) mixture were
used as solvent in extraction experiments. According to the results obtained from the
experiments, the highest oleuropein yield was obtained by using methanol solvent and
found as 37.55 mg / g dry leaves. The highest oleuropein value after methanol was
found as 18.58 mg / g dry leaves with methanol / hexane solvent. In this study, it was
determined that the oleuropein content values of ethanol, water and hexane solvents
were very close to each other and they did not show a good performance in oleuropein
yield (ġahin, Bilgin, and Dramur 2011).
Garcia-Castello et al. (2015) aimed to find the appropriate solvent type in the
study of extraction of phenolic compounds. It was stated that methanol and ethanol
were the most suitable solvents for separating phenolic compounds. It was stated that
the polarity levels of methanol and ethanol were lower compared to water. Hence, it led
to a reduction in the dielectric constant of the solvent, thus facilitating the solubility and
diffusion of the desired target compounds (phenolic compounds) in the solvent. Using
solvents in their pure form causes plant cells to dehydrate and collapse. It also causes
denaturation of proteins and phenolic compounds in the cell wall. For these reasons, the
extraction of phenolic compounds becomes difficult (Garcia-Castello et al. 2015).
As the polarity of the solvents used increases, the amount of oleuropein
generally increases. In this study, a higher oleuropein yield was obtained in experiments
where methanol was used as a solvent. This can be explained by the fact that methanol
has a higher polarity value compared to other solvents. There is a big difference in
oleuropein yield between solvents in pure form (ethanol and methanol) and their
aqueous solvents. This may be due to the higher polarity value of aqueous solvents
compared to pure solvents. Therefore, it could resolve the olive leaf better. Although
water is the most polar solvent used, it appears that it does not perform well in
extracting oleuropein. The reason for this may be that the prolonged boiling period of
the soxhlet method at high temperatures degrades the oleuropein content of the extract.

47
The absence of such a situation in methanol extracts can be explained by the fact that
the boiling point of methanol (64.7o C) is lower than that of water.
Altiok et al. (2008) aimed to evaluate the isolation of polyphenols from olive
leaves. The extraction efficiency of oleuropein and rutin was determined based on the
solvent type and concentration of ethanol. The highest oleuropein yield in the study was
provided using 70 % aqueous ethanol solution. Thereafter, a decreasing performance on
the oleuropein yield was observed in the presence of 50 % ethanol and 20 % ethanol
aqueous solution, respectively (Altiok et al. 2008). Based on the results of this study,
the best oleuropein yielding was obtained using 80 % ethanol, 70 % ethanol and 80 %
methanol.
Figure 4.2. The effect of the type of solvent used in olive leaf extraction on the extract
amount performed for 8 hours by the soxhlet extraction
As seen in Figure 4.2, the lowest extraction efficiency was found as 17.6% in
water, while the best extraction efficiency was obtained as 36% and 29.8% in 80%
methanol and 20% acetonitrile in volume, respectively. Pure ethanol and its aqueous
solutions gave almost the similar results. These values can be explained by the polarity
of the solvents. Solvents with polar properties (ethanol and methanol) are characterized
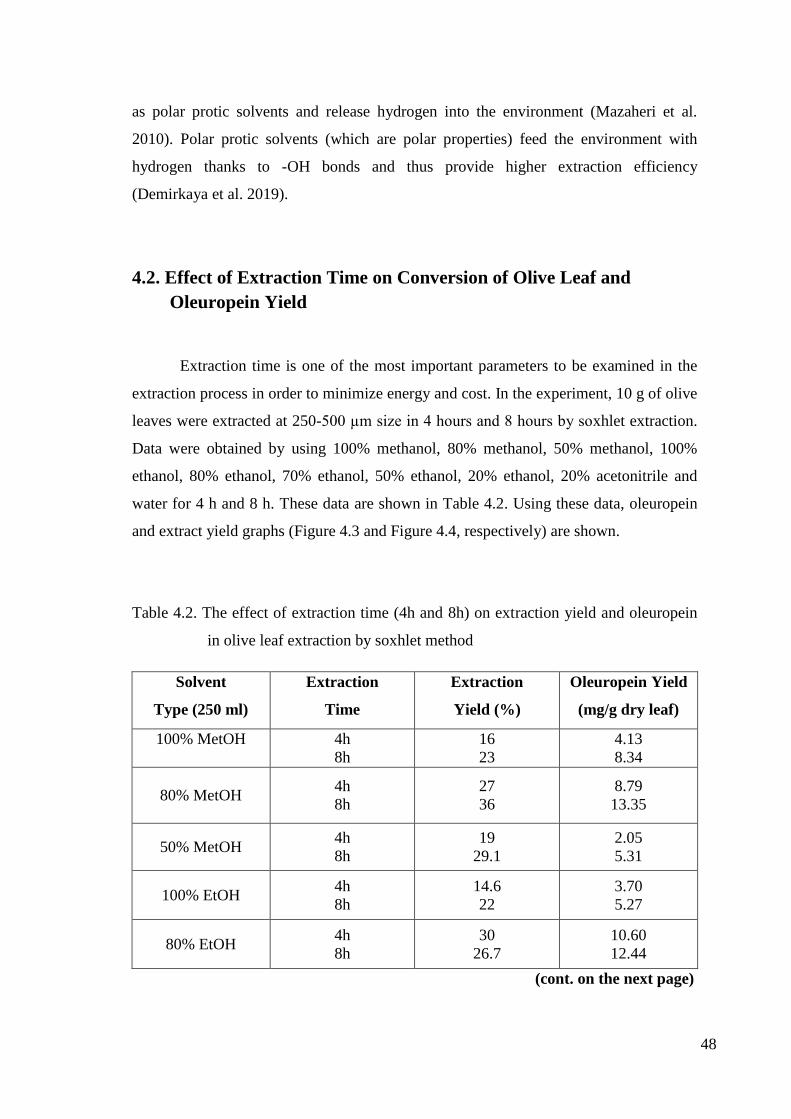
48
as polar protic solvents and release hydrogen into the environment (Mazaheri et al.
2010). Polar protic solvents (which are polar properties) feed the environment with
hydrogen thanks to -OH bonds and thus provide higher extraction efficiency
(Demirkaya et al. 2019).
4.2. Effect of Extraction Time on Conversion of Olive Leaf and
Oleuropein Yield
Extraction time is one of the most important parameters to be examined in the
extraction process in order to minimize energy and cost. In the experiment, 10 g of olive
leaves were extracted at 250-500 µm size in 4 hours and 8 hours by soxhlet extraction.
Data were obtained by using 100% methanol, 80% methanol, 50% methanol, 100%
ethanol, 80% ethanol, 70% ethanol, 50% ethanol, 20% ethanol, 20% acetonitrile and
water for 4 h and 8 h. These data are shown in Table 4.2. Using these data, oleuropein
and extract yield graphs (Figure 4.3 and Figure 4.4, respectively) are shown.
Table 4.2. The effect of extraction time (4h and 8h) on extraction yield and oleuropein
in olive leaf extraction by soxhlet method
Solvent
Type (250 ml)
Extraction
Time
Extraction
Yield (%)
Oleuropein Yield
(mg/g dry leaf)
100% MetOH
4h
8h
16
23
4.13
8.34
80% MetOH 4h
8h
27
36
8.79
13.35
50% MetOH 4h
8h
19
29.1
2.05
5.31
100% EtOH 4h
8h
14.6
22
3.70
5.27
80% EtOH 4h
8h
30
26.7
10.60
12.44
(cont. on the next page)

49
Table 4.2 (cont.)
70% EtOH 4h
8h
32.3
25.5
6.61
9.11
50% EtOH 4h
8h
26
24
3.44
7.52
20% EtOH 4h
8h
20
23
1.28
4.31
20% Acetonitrile 4h
8h
22.9
29.8
6.40
6.72
Water 4h
8h
14
17.6
0.33
0.48
The effect of extraction times on the amount of oleuropein in the extraction of
olives is shown in Figure 4.3. and the extraction yield is shown in Figure 4.4.
Figure 4.3. Effect of extraction time on the extracted amount of oleuropein per gram of
dried leaf in the soxhlet method for 8h and 4h
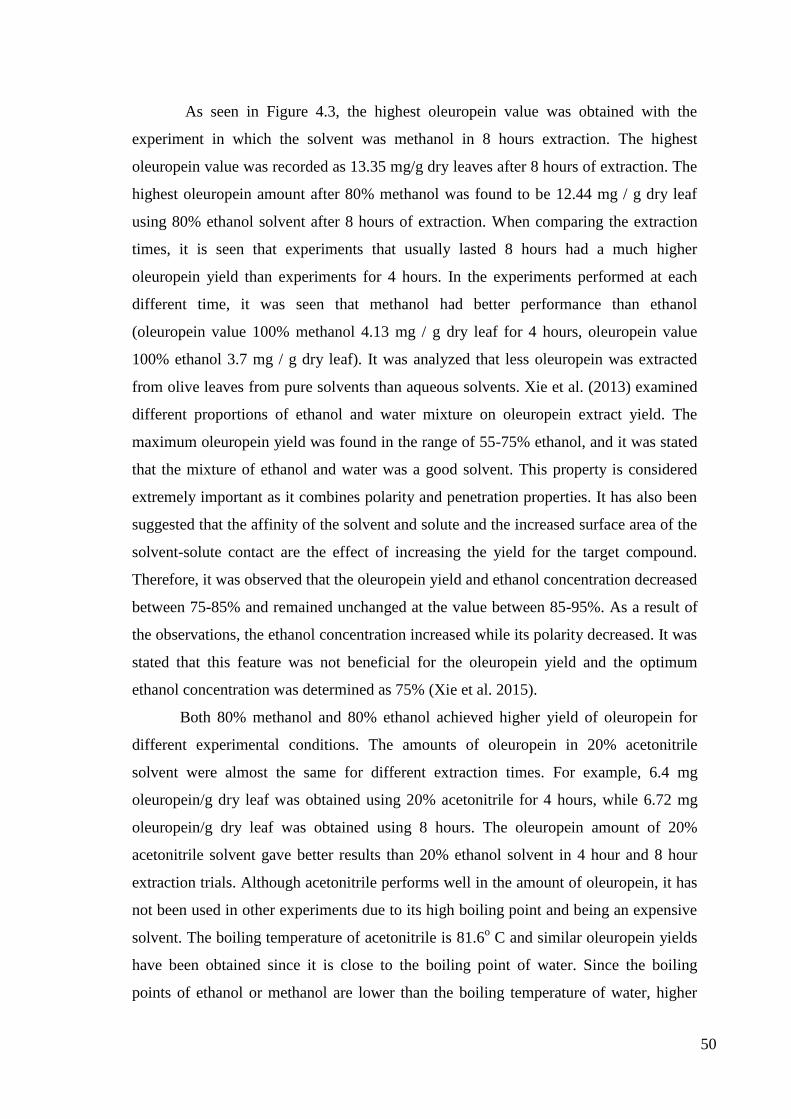
50
As seen in Figure 4.3, the highest oleuropein value was obtained with the
experiment in which the solvent was methanol in 8 hours extraction. The highest
oleuropein value was recorded as 13.35 mg/g dry leaves after 8 hours of extraction. The
highest oleuropein amount after 80% methanol was found to be 12.44 mg / g dry leaf
using 80% ethanol solvent after 8 hours of extraction. When comparing the extraction
times, it is seen that experiments that usually lasted 8 hours had a much higher
oleuropein yield than experiments for 4 hours. In the experiments performed at each
different time, it was seen that methanol had better performance than ethanol
(oleuropein value 100% methanol 4.13 mg / g dry leaf for 4 hours, oleuropein value
100% ethanol 3.7 mg / g dry leaf). It was analyzed that less oleuropein was extracted
from olive leaves from pure solvents than aqueous solvents. Xie et al. (2013) examined
different proportions of ethanol and water mixture on oleuropein extract yield. The
maximum oleuropein yield was found in the range of 55-75% ethanol, and it was stated
that the mixture of ethanol and water was a good solvent. This property is considered
extremely important as it combines polarity and penetration properties. It has also been
suggested that the affinity of the solvent and solute and the increased surface area of the
solvent-solute contact are the effect of increasing the yield for the target compound.
Therefore, it was observed that the oleuropein yield and ethanol concentration decreased
between 75-85% and remained unchanged at the value between 85-95%. As a result of
the observations, the ethanol concentration increased while its polarity decreased. It was
stated that this feature was not beneficial for the oleuropein yield and the optimum
ethanol concentration was determined as 75% (Xie et al. 2015).
Both 80% methanol and 80% ethanol achieved higher yield of oleuropein for
different experimental conditions. The amounts of oleuropein in 20% acetonitrile
solvent were almost the same for different extraction times. For example, 6.4 mg
oleuropein/g dry leaf was obtained using 20% acetonitrile for 4 hours, while 6.72 mg
oleuropein/g dry leaf was obtained using 8 hours. The oleuropein amount of 20%
acetonitrile solvent gave better results than 20% ethanol solvent in 4 hour and 8 hour
extraction trials. Although acetonitrile performs well in the amount of oleuropein, it has
not been used in other experiments due to its high boiling point and being an expensive
solvent. The boiling temperature of acetonitrile is 81.6o C and similar oleuropein yields
have been obtained since it is close to the boiling point of water. Since the boiling
points of ethanol or methanol are lower than the boiling temperature of water, higher
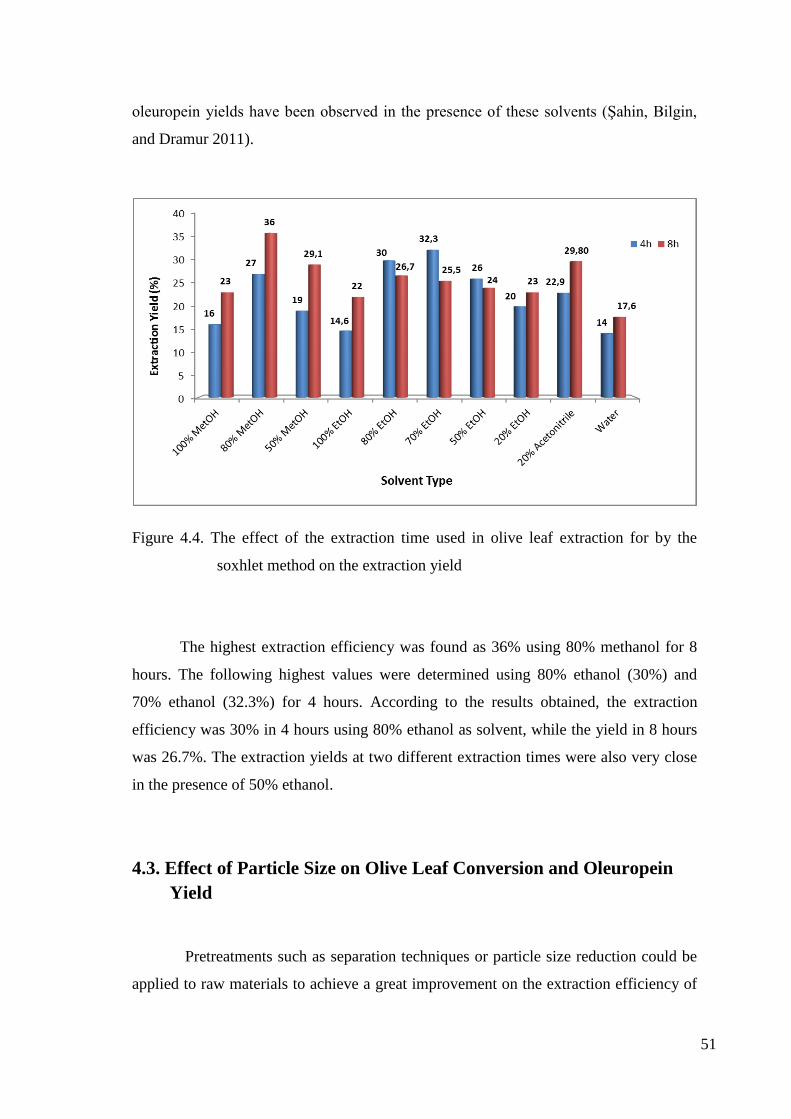
51
oleuropein yields have been observed in the presence of these solvents (ġahin, Bilgin,
and Dramur 2011).
Figure 4.4. The effect of the extraction time used in olive leaf extraction for by the
soxhlet method on the extraction yield
The highest extraction efficiency was found as 36% using 80% methanol for 8
hours. The following highest values were determined using 80% ethanol (30%) and
70% ethanol (32.3%) for 4 hours. According to the results obtained, the extraction
efficiency was 30% in 4 hours using 80% ethanol as solvent, while the yield in 8 hours
was 26.7%. The extraction yields at two different extraction times were also very close
in the presence of 50% ethanol.
4.3. Effect of Particle Size on Olive Leaf Conversion and Oleuropein
Yield
Pretreatments such as separation techniques or particle size reduction could be
applied to raw materials to achieve a great improvement on the extraction efficiency of

52
phenolic compounds (target compound) (Medina-Torres et al. 2017). Nagy (2008)
examined the effect of particle size and moisture content of chilli peppers in
supercritical fluid extraction. In the study, the application of smaller particle size in
extraction resulted in higher extraction yields. By reducing the particle size of the
sample, the mass transfer surface area was increased and the amount of soluble fraction
on these surfaces increased (Nagy 2008).
In the extraction of herbal extracts, physical processes such as drying and
grinding has a great importance. In this section, it was aimed to find oleuropein and
extraction yield values in different particle size ranges. 10 g of olive leaves were
extracted with solvents of 100% methanol, 100% ethanol, 80% ethanol and water in 4
cycles (1 cycle = 45 minutes for methanol, 40 minutes for ethanol, 75 minutes for
water) in the soxhlet extraction. The operating conditions are kept as the same in all
experiments, the particle sizes of olive leaves (250-500 µm, 900-2000 µm) were
changed to comprehend the effect of particle size over oleuropein yield. The oleuropein
and extraction yields determined as a result of soxhlet extraction of particles in different
sizes are shown in Figure 4.5 and Figure 4.6, respectively.
Figure 4.5. Effect of partical sizes on the extracted amount of oleuropein per gram of
dried leaf in the soxhlet method for 4 cycles
53
As seen in Figure 4.5, it was found that the particle size clearly affects the
oleuropein yield. The oleuropein yield in the extract obtained with the size of 250-500
µm in 80% ethanol solvent was approximately 5 times higher than that obtained using
the size of 900-2000 µm. The highest oleuropein yield was 5.4 mg/g dry leaf (80%
ethanol, 250-500 µm) whiles the lowest oleuropein yield was 0.03 mg/g dry leaf (water,
900-2000 µm). This can be explained by the fact that the surface area increases with the
reduction in size and thus the olive leaves are extracted much more easily and
efficiently.
Figure 4.6. The effect of the particle sizes used in olive leaf extraction on extraction
yield by the soxhlet method
The effect of particle size on extraction yield is shown in Figure 4.6. The highest
yield (26.7%) was found using 80% ethanol solvent and with 250-500 µm particle size
whereas the lowest yield (9.5%) was obtained using water with 900-2000 µm particle
size of olive leaves. The oleuropein yield increased as the particle size decreased and it
can be explained by the fact that the particles can be extracted more easily in solvents
by increasing the surface area. In this study, it was observed that the solvents (ethanol,
methanol and water) used for particles of 250-500 µm size were higher in extraction
efficiency.

54
4.4. The Effect of Pre-treatment on Oleuropein Yield and Extraction
Efficiency
In this section, effect of pre-treatment on the amount of oleuropein in the extract
and the extraction efficiency were investigated. In this study, the extraction parameters
leading to the highest oleuropein yield were used, taking into account previous
experiments. Particle size was chosen in the range of 250-500 µm, and 80% methanol
and 80% ethanol were chosen as the solvent. The solvents selected for pretreatment
(80% ethanol and 80% methanol) were adjusted to 100 ml volume. 10 grams of olive
leaves were placed in the prepared solvent. Treatments were carried out in an ultrasound
bath at 40 kHz to 25-30 ° C for 1 hour. After 1 hour pre-treatment with ultrasonic bath,
olive leaves were placed on filter paper and placed in soxhlet extractor. For the Soxhlet
extraction, 80% ethanol and 80% methanol were adjusted to 250 ml volume. Extraction
took place in 4 hours and 8 hours.
Irakli et al. (2018) aimed to investigate the effects of ultrasound assisted
extraction conditions (solvent type, solvent concentration, extraction time and
temperature) on the yield of oleuropein and hydroxytyrosol. Extraction times were
studied between 10 min, 30 min, 60 min, and 120 min. According to their studies, the
highest recovery of oleuropein, the main phenolic components in olive leaves, was
obtained in the first 10 minutes of extraction and its value was found to be 10.65 mg/g
dry leaf. A steady decrease in oleuropein yield was noticed when extraction times
longer than 10 minutes were applied in the experiment (Irakli, Chatzopoulou, and
Ekateriniadou 2018). Xie et al. (2013) investigated the effects of several important
factors such as the type and concentration of extraction solvent, extraction time,
extraction temperature, ultrasonic power, liquid/solid ratio and extraction pressure on
oleuropein extraction yield from olive leaves. In this experiment, olive leaves were
extracted by ultrasound assisted and low pressure extraction methods. For the extraction
time, which is one of the experimental parameters, 1, 2, 3, 4, 5, 10, and 15 minutes were
chosen. Maximum oleuropein yield was achieved after 3 minutes. Oleuropein extraction
efficiency increased up to 3 minutes, but then stabilized with increasing time. These
observations showed that oleuropein extraction was over in 3 minutes. Therefore, the 3-
minute extraction time was chosen as the optimum extraction condition (Xie et al.
2013).

55
To examine the effect of pre-treatment on oleuropein yield, the results were
compared with soxhlet extraction experiments performed under the same conditions
(250-500 µm, 80% MetOH (4 h and 8 h), and 80% EtOH (4 h and 8 h)). Comparing the
experiments with the pretreatment and the soxhlet extraction method, the decrease in the
amount of oleuropein was clearly seen. This situation can be explained by the
degradation of phenolic compounds in the olive leaf with 1 hour sonication process.
These data are given in Table 4.3. Among the pretreatment experiments, the highest
oleuropein content was found as 5.57 mg / g dry leaf using 80% MetOH for 8 hours,
while the lowest oleuropein amount was 3.17 mg / g dry leaf using 80% EtOH for 4
hours, respectively.
Table 4.3. Effect of ultrasonic pre-treatment on the yield of oleuropein
4.5. Total Phenolic Content Assay (Folin Ciocalteu Method)
Folin-Ciocalteu method is used for the determination of total phenolic in plants.
This method is one of the oldest known methods (Roginsky and Lissi 2005).
The medium must be basic for phenolic compounds or target compounds to
react with Folin-Ciocalteu Reagent (FCR). Sodium carbonate provides this basicity to
the environment. As a result of polyphenols losing an H+ in basic environment,
Solvent Type
(250 ml)
Extraction
Time
Oleuropein Yield
(mg/g dry leaf)
80% MetOH
(un-pretreatment)
4h
8h
8.79
13.35
80% MetOH
(pre-treatment)
4h
8h
4.85
5.57
80% EtOH
(un-pretreatment)
4h
8h
10.6
12.44
80% EtOH
(pre-treatment)
4h
8h
3.17
5.06

56
phenolate anion is formed. This formed anion reduces the molybdate in the structure of
FCR to its blue color. The intensity of the blue color seen in the samples is directly
proportional to the total amount of phenolic matter in the sample (Huang, Boxin, and
Prior 2005; Roginsky and Lissi 2005).
Phenolic content was analyzed at 765 nm and results represented as gallic acid
equivalents (mg GAE / ml) from which the constants were obtained from the calibration
curve previously given in Figure 3.6. (Eqn. 4.1). The effect of reaction time (4h and 8h),
size of 250-500 µm, on total phenolic content of extracted with pure and aqueous
solvents were given in Figure 4.8.
( ⁄ )
( )
The effect of pure ethanol and its aqueous solutions (80%, 70%, 50% and 20%)
and extraction times (4h, 8h) on total phenolic content were examined and results were
given in Figure 4.7.
Figure 4.7. The effect of extraction time (4h, 8 h) and ethanol percentage on the total
phenolic content

57
The highest phenolic content was observed using 80% ethanol for 8h (0.082 mg
GAE/ml). Extraction for 4 hour with pure ethanol was resulted in the lowest value for
phenolic content (0.02 mg GAE/ml). In both the oleuropein amounts and the total
phenol content experiments, pure ethanol was not found to be a suitable solvent for
extracting olive leaves. 20% ethanol appears to perform better results in terms of both
oleuropein and total phenolic content than pure ethanol. It reveals that water is
necessary to increase the diffusion of the polyphenols to be extracted from the plant
tissues, thus the extraction could take places easily and more efficiently.
Altiok et al (2008) examined the total phenolic content of olive leaves by using
pure acetone and its aqueous solutions, pure ethanol and aqueous solutions. The best
phenolic content was observed using in 90% acetone solution, while the highest value
for ethanol solutions was observed using 70% ethanol solution (Altiok et al. 2008).
Comparison of extraction with ethanol and methanol on phenolic content is
shown in Figure 4.8.
Figure 4.8. The effect of solvent type (ethanol, methanol) on the total phenolic content
The total phenolic content in terms of the effect of the solvent type and its
aqueous solutions showed parallel results to the amount of oleuropein. The highest yield
was achieved with using 80% ethanol solution and the phenolic content was found as
0.068 mg of GAE/ml.

58
CHAPTER 5
CONCLUSIONS
In this study, it was aimed to obtain oleuropein, which is the basic phenolic
compound content of olive leaf by Soxhlet extraction. Oleuropein has been known for a
long time in the health field and is a very important raw material with high availability
in our country. In this context, the effects of various parameters on the oleuropein
amount and extraction yield were investigated and these parameters were solvent type
and aqueous solutions (ethanol, acetonitrile, methanol and water), extraction time (4-8
hours), particle size (250-500 μm and 900-2000 μm) and pre-treatment of the olive leaf.
The use of solvents in an aqueous form resulted in a higher amount of
oleuropein compared to pure solvents. This is explained by the fact that water inflates
the cells of plants and facilitates diffusion. When the particle size of the raw material to
be used in extraction was reduced, a higher oleuropein yield was observed. Increasing
the extraction time and using 80% methanol as solvent resulted in a significant
improvement in oleuropein yield. In contrast, the use of pre-processed olive leaves in
the extraction process resulted in a serious decrease in oleuropein yield. According to
the experimental study, the highest oleuropein amount and extraction efficiency were
obtained in olive leaves with a grain size of 250-500 μm during 8 hours of extraction
and when using 80% methanol solution as a solvent. Under these conditions, the highest
oleuropein amount was found to be 13.35 mg / g dry leaves and the highest extraction
efficiency 36%.
Finally, this study is important in terms of investigating oleuropein, the highest
phenolic compound of olive leaf, with soxhlet extraction method with a wide variety of
solvent types and parameters. It also contributes to the valorization of olive leaves by
extraction polyphenols from it.
59
REFERENCES
Afaneh, Ibraheem, Hiba Yateem, and Fuad Al-Rimawi. ,(2015). “Effect of Olive Leaves
Drying on the Content of Oleuropein.” American Journal of Analytical Chemistry
06(03): 246–52.
Agarwal, Ashok, and Sushil A Prabakaran. (2005). “And Prevention of Oxidative Stress
in Male Reproductive Physiology.” 43(November): 963–74.
Alexovič, Michal, Yannis Dotsikas, Peter Bober, and Ján Sabo. (2018). “Achievements
in Robotic Automation of Solvent Extraction and Related Approaches for
Bioanalysis of Pharmaceuticals.” Journal of Chromatography B: Analytical
Technologies in the Biomedical and Life Sciences 1092(June): 402–21.
Archivio, Massimo D et al. (2007). “Polyphenols , Dietary Sources and
Bioavailability.” : 348–61.
Astro, C. (2006). “Discrimination and Classification of Olive Tree Varieties and
Cultivation Zones by Biophenol Contents.” : 9706–12.
Azmin, Siti Nuurul Huda Mohammad et al. (2016). “Herbal Processing and Extraction
Technologies.” Separation and Purification Reviews 45(4): 305–20.
http://dx.doi.org/10.1080/15422119.2016.1145395.
Balasundram, Nagendran, Kalyana Sundram, and Samir Samman. (2006). “Phenolic
Compounds in Plants and Agri-Industrial by-Products: Antioxidant Activity,
Occurrence, and Potential Uses.” Food Chemistry 99(1): 191–203.
Bigliardi, Barbara, and Francesco Galati. (2013). “Innovation Trends in the Food
Industry : The Case of Functional Foods.” Trends in Food Science & Technology
31(2): 118–29. http://dx.doi.org/10.1016/j.tifs.2013.03.006.
60
Bilgin, Mehmet, and S Selin. (2013). “Journal of the Taiwan Institute of Chemical
Engineers Effects of Geographical Origin and Extraction Methods on Total
Phenolic Yield of Olive Tree ( Olea Europaea ) Leaves.” 44: 8–12.
Bisignano, Giuseppe, Antonio Tomaino, Rossella L O Cascio, and Giuseppe Crisafi.
(1999). “On the In-Vitro Antimicrobial Activity of Oleuropein and
Hydroxytyrosol.” : 971–74.
Carluccio, Maria Annunziata et al. (2003). “Olive Oil and Red Wine Antioxidant
Polyphenols Inhibit Endothelial Activation: Antiatherogenic Properties of
Mediterranean Diet Phytochemicals.” Arteriosclerosis, Thrombosis, and Vascular
Biology 23(4): 622–29.
Caturla, Nuria, P Laura, Amparo Estepa, and Vicente Micol. (2005). “Differential
Effects of Oleuropein , a Biophenol from Olea Europaea , on Anionic and
Zwiterionic Phospholipid Model Membranes.” 137: 2–17.
Chang, Min S., Qin Ji, Jun Zhang, and Tawakol A. El-Shourbagy. (2007). “Historical
Review of Sample Preparation for Chromatographic Bioanalysis: Pros and Cons.”
Drug Development Research 68(3): 107–33.
Cheeseman, K H, and T F Slater. (1993). “An Introduction to Free Radical
Biochemistry.” 49(3): 481–93.
Chikezie, Paul C, Chiedozie O Ibegbulem, and Ferdinand N Mbagwu. (2015).
“Bioactive Principles from Medicinal Plants.”
Clifford, Michael N. 1999. “Review Chlorogenic Acids and Other Cinnamates – Nature
, Occurrence and Dietary Burden 1.” 372(October 1998): 362–72.
De, Rocío, M Eugenia, and Martínez Domínguez. (2001). “Effects of Virgin Olive Oil
Phenolics on Scavenging of Reactive Nitrogen Species and upon Nitrergic
Neurotransmission.” 69: 1213–22.
61
Del, Daniele et al. (2013). “Dietary (Poly)Phenolics in Human Health: Structures,
Bioavailability, and Evidence of Protective Effects Against Chronic Diseases 1.”
18(14).
Dillard, Cora J, and J Bruce German. (2000). “Review Phytochemicals : Nutraceuticals
and Human Health.” 1756(May).
Durackova, Zdenka. (2015). Free Radicals and Antioxidants for Non-Experts.
Factors, Environmental, Angelika Rommel, and Ronald E Wrolstad. (1993).
“Composition of Flavonols in Red Raspberry Juice As Influenced By.” : 1941–50.
Faggio, Caterina et al. (2017). “Flavonoids and Platelet Aggregation : A Brief Review.”
807(April): 91–101.
Ferrer, J, M B Austin, C Stewart Jr, and J P Noel. (2008). “Structure and Function of
Enzymes Involved in the Biosynthesis of Phenylpropanoids.” 46: 356–70.
Le Floch, F., M. T. Tena, A. Ríos, and M. Valcárcel. (1998). “Supercritical Fluid
Extraction of Phenol Compounds from Olive Leaves.” Talanta 46(5): 1123–30.
Fredrickson, W. R.(2000). “Method and Composition for Antiviral Therapy.”
26335138(08).
https://patentimages.storage.googleapis.com/d4/7e/8c/e590782155be55/US611784
4.pdf.
Gao, Xing-hua, Li Zhang, Huachen Wei, and Hong-duo Chen. (2008). “Efficacy and
Safety of Innovative Cosmeceuticals ☆.” : 367–74.
Garcı, Teresa, Francisco A Toma, and Juan Carlos Espı. (2007). “Nutraceuticals : Facts
and Fiction.” 68: 2986–3008.
Ghanbari, Rahele, Farooq Anwar, Khalid M Alkharfy, and Anwarul-hassan Gilani.
(2012). Valuable Nutrients and Functional Bioactives in Different Parts of Olive (
Olea Europaea L .)— A Review.

62
Gianmaria F. Ferrazzano 1,*, Ivana Amato 1 et al. (2011). “Plant Polyphenols and Their
Anti-Cariogenic Properties: A Review.” (2): 1486–1507.
Gil-izquierdo, Sophie Lafay Æ Angel. (2008). “Bioavailability of Phenolic Acids.”
(November 2007): 301–11.
Halliwell, Barry. (2001). “Free Radicals and Other Reactive Species in Disease.” : 1–7.
Harborne, Je B, and Christine A Williams. (2000). “Advances in ¯ Avonoid Research
since 1992.” 55.
Hardy, Gil. (2002). “Nutraceuticals and Functional Foods : Introduction and Meaning A
European Consensus of Scientific Concepts of Functional Foods.”
Heleno, Sandrina A et al. (2015). “Bioactivity of Phenolic Acids : Metabolites versus
Parent Compounds : A Review.” FOOD CHEMISTRY 173: 501–13.
http://dx.doi.org/10.1016/j.foodchem.2014.10.057.
Herrmann, Karl, Charles W Nagel, and Karl Herrmann. (2009). 8398 Critical Reviews
in Food Science & Nutrition Occurrence and Content of Hydroxycinnamic and
Hydroxybenzoic Acid Compounds in Foods.
Huang, Dejian, O. U. Boxin, and Ronald L. Prior. (2005). “The Chemistry behind
Antioxidant Capacity Assays.” Journal of Agricultural and Food Chemistry 53(6):
1841–56.
Ima, M Arcelo H Ermes. (2004). ROLE OF FREE RADICALS.
Irakli, Maria, Paschalina Chatzopoulou, and Loukia Ekateriniadou. (2018). “Industrial
Crops & Products Optimization of Ultrasound-Assisted Extraction of Phenolic
Compounds : Oleuropein , Phenolic Acids , Phenolic Alcohols and Fl Avonoids
from Olive Leaves and Evaluation of Its Antioxidant Activities.” Industrial Crops
& Products 124(January 2017): 382–88.
https://doi.org/10.1016/j.indcrop.2018.07.070.
63
Japón Luján, Rafael, Feliciano Priego Capote, Alberto Marinas, and María Dolores
Luque De Castro. (2008). “Liquid Chromatography/Triple Quadrupole Tandem
Mass Spectrometry with Multiple Reaction Monitoring for Optimal Selection of
Transitions to Evaluate Nutraceuticals from Olive-Tree Materials.” Rapid
Communications in Mass Spectrometry 22(6): 855–64.
Karakulak, ġafak. (2009). “Zeytin Yapraklarından Antioksidan Eldesinde Mikrodalga
ve Etüv Ile Kurutmanın Çözücü, Sıcaklık ve Zaman Parametreleri Üzerine
Etkisinin Ġncelenmesi.”
Ková, Z Ď U R A Č. (2010). “Some Current Insights into Oxidative Stress.” 8408: 459–
69.
Krystallis, Athanasios, George Maglaras, and Spyridon Mamalis. (2008). “Motivations
and Cognitive Structures of Consumers in Their Purchasing of Functional Foods.”
19: 525–38.
Kurt, Gizem. (2012). “Tüketicilerin Fonksiyonel Gıdalara Yönelik Farkındalığı ,
Kabulü ve Tutumları : Ġzmir Ġli Örneği Consumers ‟ Awareness , Acceptance and
Attitudes towards Functional Foods : A Research in Izmır City.” 3(1): 161–71.
Kwak, No-seong, and David John Jukes. (2001). “Functional Foods . Part 1 : The
Development of a Regulatory Concept.” 12: 99–107.
Lama-Muñoz, Antonio et al. (2019). “Optimization of Oleuropein and Luteolin-7-o-
Glucoside Extraction from Olive Leaves by Ultrasound-Assisted Technology.”
Energies 12(13).
“Content of Phenolic Compounds and Mannitol in Olive Leaves Extracts from Six
Spanish Cultivars: Extraction with the Soxhlet Method and Pressurized
Liquids.”.(2020). Food Chemistry 320(March).
Lee-huang, Sylvia et al. (2007). “Discovery of Small-Molecule HIV-1 Fusion and
Integrase Inhibitors Oleuropein and Hydroxytyrosol : Part I . Integrase Inhibition.”
354: 872–78.
64
Lee, Maw Rong, Chueh Yu Lin, Zu Guang Li, and Tzu Feng Tsai. (2006).
“Simultaneous Analysis of Antioxidants and Preservatives in Cosmetics by
Supercritical Fluid Extraction Combined with Liquid Chromatography-Mass
Spectrometry.” Journal of Chromatography A 1120(1–2): 244–51.
Liu, Rui Hai. (2004). “Nutrition , and Cancer Potential Synergy of Phytochemicals in
Cancer Prevention : Mechanism of Action 1.” : 3479–85.
Luque de Castro, M. D., and F. Priego-Capote. (2010). “Soxhlet Extraction: Past and
Present Panacea.” Journal of Chromatography A 1217(16): 2383–89.
http://dx.doi.org/10.1016/j.chroma.2009.11.027.
Manach, Claudine et al. (2004). “Polyphenols: Food Sources and Bioavailability 1,2.”
Maria, Pio et al. (2002). “In v Itro Antimycoplasmal Acti v Ity of Oleuropein.” 20.
Menendez, Javier A et al. (2008). “TabAnti-HER2 (ErbB-2) Oncogene Effects of
Phenolic Compounds Directly Isolated from Commercial Extra-Virgin Olive Oil
(EVOO).” 2: 1–23.
Merken, Howard M, and Gary R Beecher. (2000). “Measurement of Food Flavonoids
by High-Performance Liquid Chromatography : A Review.” 48(3).
Mitabolique, De Biochimie, De Physiologic Vkgbale Appliquie, and Word Index-olea.
(1989). “Accumulation of Oleuropein Derivatives Maturation.” 28(1): 67–69.
Moss, G P, Queen Mary, and Mile End Road. (2000). “JOINT COMMISSION ON
BIOCHEMICAL NOMENCLATURE * NOMENCLATURE OF LIGNANS AND
NEOLIGNANS Nomenclature of Lignans and Neolignans.” 72(8): 1493–1523.
Musa, Mehmet, and Özcan Bertrand. (2016). “A Review : Benefit and Bioactive
Properties of Olive ( Olea Europaea L .) Leaves.” European Food Research and
Technology.
Naczk, Marian, and Fereidoon Shahidi. (2006). “Phenolics in Cereals , Fruits and
Vegetables : Occurrence , Extraction and Analysis.” 41: 1523–42.

65
National, Spanish. (2014). “Use of Solid Residue from the Olive Industry Use of Solid
Residue from the Olive Industry.” (May).
Nichenametla, Sailendra N et al. (2007). “A Review of the Effects and Mechanisms of
Polyphenolics in Cancer A Review of the Effects and Mechanisms of
Polyphenolics.” 8398.
Nilsson, Tobias. (2000). “Pressurised Liquid Extraction of Persistent Organic Pollutants
in Environmental Analysis.” 19(7): 434–45.
Obied, Hassan K et al. (2008). “Biosynthesis and Biotransformations of Phenol-
Conjugated Oleosidic Secoiridoids from Olea Europaea L .” : 1167–79.
Omar, Syed Haris. (2010). “Oleuropein in Olive and Its Pharmacological Effects.”
Scientia Pharmaceutica 78(2): 133–54.
Orkan Dal, Duygu ġengün, Aslı Yüksel ÖzĢen. (2020). “Ultrasound Assisted Extraction
for the Recovery of Phenolic Compounds from Waste Hazelnut Shell.”
3(September): 135–46.
Pham-huy, Lien Ai, Hua He, and Chuong Pham-huy. (2008). “Free Radicals ,
Antioxidants in Disease and Health.” 4(2): 89–96.
Phaniendra, Alugoju, and Dinesh Babu. (2015). “Free Radicals : Properties , Sources ,
Targets , and Their Implication in Various Diseases.” 30(1): 11–26.
Picó, Yolanda. (2013). “Ultrasound-Assisted Extraction for Food and Environmental
Samples.” TrAC - Trends in Analytical Chemistry 43: 84–99.
Poole, Colin, Zoltan Mester, Manuel Miró, Stig Pedersen-Bjergaard, et al. (2016).
“Glossary of Terms Used in Extraction (IUPAC Recommendations 2016).” Pure
and Applied Chemistry 88(5): 517–58.

66
Poole, Colin F. (2020). Liquid-Phase Extraction.
Poole, Colin, Zoltan Mester, Manuel Miró, and Stig Pedersen-bjergaard. (2016).
“Extraction for Analytical Scale Sample Preparation ( IUPAC Technical Report ).”
88(7): 649–87.
Priego-Capote, F., and M. D. Luque De Castro. (2004). “Analytical Uses of Ultrasound
I. Sample Preparation.” TrAC - Trends in Analytical Chemistry 23(9): 644–53.
Puerta, Rocio De, Valentina Ruiz Gutierrez, and J Robin S Hoult. (1999). “Inhibition of
Leukocyte 5-Lipoxygenase by Phenolics from Virgin Olive Oil.” 57(98): 445–49.
Rahaiee, Somayeh, Sohrab Moini, and Maryam Hashemi. (2015). “Evaluation of
Antioxidant Activities of Bioactive Compounds and Various Extracts Obtained
from Saffron ( Crocus Sativus L .): A Review.” 52(April): 1881–88.
Rahmanian, Neda, Seid Mahdi Jafari, and Touseef Ahmed Wani. (2015). Trends in
Food Science & Technology Department of Food Materials and Process Design
Engineering , Faculty of Food Science. Elsevier Ltd.
http://dx.doi.org/10.1016/j.tifs.2014.12.009.
Ramírez, Eva, Manuel Brenes, Pedro García, and Eduardo Medina. (2016). “Oleuropein
Hydrolysis in Natural Green Olives: Importance of the Endogenous Enzymes.”
FOOD CHEMISTRY. http://dx.doi.org/10.1016/j.foodchem.2016.03.061.
Ranalli, Alfonso et al. (2006). “Factors Affecting the Contents of Iridoid Oleuropein in
Olive Leaves (Olea Europaea L.).” Journal of Agricultural and Food Chemistry
54(2): 434–40.
Ridgway, Kathy, Sam P.D. Lalljie, and Roger M. Smith. (2007). “Sample Preparation
Techniques for the Determination of Trace Residues and Contaminants in Foods.”
Journal of Chromatography A 1153(1–2): 36–53.
Robbins, Rebecca J. (2003). “Phenolic Acids in Foods : An Overview of Analytical

67
Methodology.” : 2866–87.
Rodríguez-morató, Jose et al. (2016). “Metabolic Disposition and Biological
Significance of Simple Phenols of Dietary Origin : Hydroxytyrosol and Tyrosol.”
2532.
Roginsky, Vitaly, and Eduardo A. Lissi. (2005). “Review of Methods to Determine
Chain-Breaking Antioxidant Activity in Food.” Food Chemistry 92(2): 235–54.
ġahin, Selin, Mehmet Bilgin, and Mehmet Umur Dramur. (2011). “Investigation of
Oleuropein Content in Olive Leaf Extract Obtained by Supercritical Fluid
Extraction and Soxhlet Methods.” Separation Science and Technology 46(11):
1829–37.
SevilmiĢ, Gözde, Akın Olgun, and Metin Artukoğlu. (2017). “Fonksiyonel Gıdalarda
Tüketici Kararlarını Etkileyen Faktörler Üzerine Bir AraĢtırma: Ġzmir Ġli Örneği.” :
351–60.
Shahidi, Fereidoon. (2018). “Bioactivities of Phenolics by Focusing on Suppression of
Chronic Diseases : A Review.” (Figure 1): 1–16.
Soler-Rivas, Cristina, Juan Carlos Espiń, and Harry J. Wichers. (2000). “Oleuropein and
Related Compounds.” Journal of the Science of Food and Agriculture 80(7):
1013–23.
Subedi, Bikram et al. (2015). “Selective Pressurized Liquid Extraction as a Sample-
Preparation Technique for Persistent Organic Pollutants and Contaminants of
Emerging Concern.” TrAC - Trends in Analytical Chemistry 68: 119–32.
http://dx.doi.org/10.1016/j.trac.2015.02.011.
Sun, Hanwen, Xusheng Ge, Yunkai Lv, and Anbang Wang. (2012). “Application of
Accelerated Solvent Extraction in the Analysis of Organic Contaminants ,
Bioactive and Nutritional Compounds in Food and Feed.” Journal of
Chromatography A 1237: 1–23. http://dx.doi.org/10.1016/j.chroma.2012.03.003.
Szulejko, Jan E., and Ki Hyun Kim. (2014). “A Review of Sampling and Pretreatment
68
Techniques for the Collection of Airborne Amines.” TrAC - Trends in Analytical
Chemistry 57: 118–34. http://dx.doi.org/10.1016/j.trac.2014.02.010.
Tian, Yuan-yuan, Bo Jiang, Li-jia An, and Yong-ming Bao. (2007). “Neuroprotective
Effect of Catalpol against MPP + -Induced Oxidative Stress in Mesencephalic
Neurons.” 568: 142–48.
Tripoli, Elisa et al. (2005). “The Phenolic Compounds of Olive Oil: Structure,
Biological Activity and Beneficial Effects on Human Health.” Nutrition Research
Reviews 18(1): 98–112.
Valko, Marian et al. (2007). “Free Radicals and Antioxidants in Normal Physiological
Functions and Human Disease.” 39: 44–84.
Visioli, Francesco, Stefano Bellosta, and Claudio Galli. (1998). “Oleuropein, the Bitter
Principle of Olives, Enhances Nitric Oxide Production by Mouse Macrophages.”
Life Sciences 62(6): 541–46.
Visioli, Francesco, Paola Bogani, and Claudio Galli. (2006). “Healthful Properties of
Olive Oil Minor Components.” : 173–90.
Visioli, Francesco, Claudio Galli, and Giovanni Galli. (2002). “Biological Activities
and Metabolic Fate of Olive Oil Phenols.” 104: 677–84.
Visioli, Francesco, Andrea Poli, and Claudio Galli. (2002). “Antioxidant and Other
Biological Activities of Phenols from Olives and Olive Oil.” Medicinal Research
Reviews 22(1): 65–75.
Vora, Jyoti D, and Ms Sneha R Pednekar. (2017). “„ Insight into the Biochemical Link
between Biodiversity and Nutraceuticals .‟” 11(3): 22–25.
Xie, Pu-jun, Li-xin Huang, Cai-hong Zhang, and Feng You. (2013). “Reduced Pressure
Extraction of Oleuropein from Olive Leaves ( Olea Europaea L .) with
Ultrasound.” Food and Bioproducts Processing (February): 1–10.
69
http://dx.doi.org/10.1016/j.fbp.2013.10.004.
Yateem, H, Palestine Afaneh, and F Al-Rimawi. (2014). “Optimum Conditions for
Oleuropein Extraction from Olive Leaves.” International Journal of Applied
Science and Technology 4(5): 153–57.
http://www.ijastnet.com/journals/Vol_4_No_5_October_2014/18.pdf.
Yeo, Judong, and Fereidoon Shahidi. (2017). “Effect of Hydrothermal Processing on
Changes of Insoluble-Bound Phenolics of Lentils.” Journal of Functional Foods.
http://dx.doi.org/10.1016/j.jff.2016.12.010.
Yu, Kuo Pin et al. (2016). “Improving the Collection Efficiency of the Liquid Impinger
for Ultrafine Particles and Viral Aerosols by Applying Granular Bed Filtration.”
Journal of Aerosol Science 101: 133–43.
Zheng, Yunhao, and Maosheng Yao. (2017). “Liquid Impinger BioSampler‟s
Performance for Size-Resolved Viable Bioaerosol Particles.” Journal of Aerosol
Science 106(January): 34–42. http://dx.doi.org/10.1016/j.jaerosci.2017.01.003.
Zun-qiu, W U et al. (2015). “Purification , Dynamic Changes and Antioxidant Activities
of Oleuropein in Olive (Olea Europaea L .) Leaves.” (Omar 2010).


![Oleuropein in Olive and its Pharmacological Effects demethyl-oleuropein, ligstroside, and oleoside represent the predominant phenolic oleosides [3], whereas verbascoside [4] is the](https://img.pdfslide.net/doc/110x75/5b1dc3157f8b9a397f8b59aa/oleuropein-in-olive-and-its-pharmacological-effects-demethyl-oleuropein-ligstroside.jpg)


![Wild versus Cultivated Olive Leaves Extracts: Antioxidant ...jcbnet.info/journals/jcb/Vol_4_No_2_December_2016/6.pdf · of malaria and associated fever [9]. Olive leaf offered a capacity](https://img.pdfslide.net/doc/110x75/5d53343b88c993f4288b776a/wild-versus-cultivated-olive-leaves-extracts-antioxidant-of-malaria-and.jpg)