Embed Size (px)
Citation preview

REHABILITATION DEVICES AND SYSTEMS
Received 19 February 2015; revised 16 June 2015 and 16 September 2015; accepted 7 November 2015.Date of publication 2 December 2015; date of current version 14 December 2015.
Digital Object Identifier 10.1109/JTEHM.2015.2504961
Extraction of Stride Events From GaitAccelerometry During Treadmill WalkingERVIN SEJDIĆ1, (Member, IEEE), KRISTIN A. LOWRY2, JENNICA BELLANCA3,
SUBASHAN PERERA4, MARK S. REDFERN3, AND JENNIFER S. BRACH51Department of Electrical and Computer Engineering, Swanson School of Engineering, University of Pittsburgh, Pittsburgh, PA 15261, USA
2Department of Physical Therapy, Des Moines University, Des Moines, IA 50312, USA3Department of Bioengineering, Swanson School of Engineering, University of Pittsburgh, Pittsburgh, PA 15261, USA
4Division of Geriatric Medicine, University of Pittsburgh, Pittsburgh, PA 15213, USA5Department of Physical Therapy, University of Pittsburgh, Pittsburgh, PA 15260, USA
CORRESPONDING AUTHOR: E. SEJDIĆ ([email protected])
This work was supported by the National Institute on Aging through the Pittsburgh Claude D. Pepper Older Americans IndependenceCenter under Grant NIA P30 AG 024827.
ABSTRACT Objective: evaluating stride events can be valuable for understanding the changes in walkingdue to aging and neurological diseases. However, creating the time series necessary for this analysis can becumbersome. In particular, finding heel contact and toe-off events which define the gait cycles accuratelyare difficult. Method: we proposed a method to extract stride cycle events from tri-axial accelerometrysignals.We validated our method via data collected from 14 healthy controls, 10 participants with Parkinson’sdisease, and 11 participants with peripheral neuropathy. All participants walked at self-selected comfortableand reduced speeds on a computer-controlled treadmill. Gait accelerometry signals were captured via atri-axial accelerometer positioned over the L3 segment of the lumbar spine. Motion capture data were alsocollected and served as the comparison method. Results: our analysis of the accelerometry data showed thatthe proposed methodology was able to accurately extract heel and toe-contact events from both feet. Weused t-tests, analysis of variance (ANOVA) and mixed models to summarize results and make comparisons.Mean gait cycle intervals were the same as those derived from motion capture, and cycle-to-cycle variabilitymeasures were within 1.5%. Subject group differences could be similarly identified using measures with thetwo methods. Conclusions: a simple tri-axial acceleromter accompanied by a signal processing algorithmcan be used to capture stride events. Clinical impact: the proposed algorithm enables the assessment of strideevents during treadmill walking, and is the first step toward the assessment of stride events using tri-axialaccelerometers in real-life settings.
INDEX TERMS Gait accelerometry signals, stride intervals, signal processing, gait.
I. INTRODUCTIONWalking is one of the most complex, yet most practiced,motor skills [1], [2]. In general, walking arises from com-plex interactions of cerebellum, the motor cortex, basal gan-glia and feedback from vestibular, visual and peripheralreceptors [3]. Nevertheless, walking consists of repeatablemovement patterns, and thus, it generally exhibits a low levelof variability [4]–[6]. Initially, it was believed that observedstride-to-stride variations are a normal random process, butover the years it has been shown that stride interval timeseries behave more like fractal processes [1], [3]. Dependingon the neurological conditions/diseases, previous research
has shown that the properties of these fractal processeschange [7], [8]. For example, stride intervals become moreuncorrelated (random) due to aging and neurological dis-eases (e.g., [9]–[11]) or to exposure to external cues [12].Lastly, stride intervals are often useful in the calculation ofother gait metrics such as harmonic ratios (e.g., [13], [14]),which quantify the smoothness of walking by assessingstep-to-step symmetry within a single stride [14].
Even though stride interval time series are a useful clinicaltool, accurately collecting such data is rather difficult andtime consuming. A common method for capturing strideinterval time series is using an optically-basedmotion capture
VOLUME 4, 2016
2168-2372 2015 IEEE. Translations and content mining are permitted for academic research only.Personal use is also permitted, but republication/redistribution requires IEEE permission.
See http://www.ieee.org/publications_standards/publications/rights/index.html for more information. 2100111

Sejdić et al.: Extraction of Stride Events From Gait Accelerometry
system (e.g., [15]–[17]), which utilizes reflective markerspositioned at various foot locations. The position signalsobtained via these reflective markers are then used to findgait parameters such as heel contact and/or toe-off. However,motion caption systems are usually very expensive, and limitthe gait analysis to laboratory settings, which do not necessar-ily reflect the dynamic nature experienced while walking innon-laboratory settings. To diminish the cost associated withmotion caption systems, researchers have often consideredsystems based on instrumented walkways (e.g., [18], [19]).These are portable sensor arrays typically several meters longthat allow researchers to extract multiple gait features simul-taneously. While useful, these instrumented walkways limitthe number of continuous stride intervals captured during atypical session to maximum of 10-15 strides. Such short timeseries limit the application of more advanced techniques inorder to potentially understand the effects of various diseaseson human gait.
Force sensitive resistors (also known as footswitches) areanothermethod used to evaluate stride-to-stride timing. Thesefootswitches are placed on the bottom of shoes or beneaththe insoles to capture voltage variations associated with heelstrikes and toe-offs (e.g., [20]–[22]). These voltage variationsare usually captured by a data logger worn by a participantaround the waist. Researchers have used a mixture of custom-made (e.g., [23]–[25]) and commercially available systems tocapture these stride intervals time series, and typical walkslasted from a few minutes (100-200 strides) up to hour longwalks (a few thousand strides). It should be pointed out thatthe cost associated with these systems is typically an orderof magnitude smaller than the cost associated with motioncapture systems and/or instrumented walkways.
The implementation of force sensitive resistors to capturestride interval time series has enabled the study of human gaitin more realistic settings and for a smaller cost. However,such systems are prone to several drawbacks. First,a minimum of four sensors are required in order to study heelstrikes and toe-offs, as sensors need to be placed on heelsand toes of each foot. Second, these sensors usually requiretethered connections to a data logger, which can interferewith typical walking patterns of participants, especially whendealing with older adults and/or participants suffering fromneurological diseases. Third, researchers and clinicians haveoften reported a low durability of these sensors (e.g., sensorswould break during data collections), which caused datalosses and the inability to properly investigate gait events.
To avoid these disadvantages associated with force sensi-tive resistors, previous contributions have investigated othersensors such as accelerometers and gyroscopes to identifygait events (e.g., [26]–[37]). For an in-depth analysis ofsome of these algorithms, please refer to [38] and [39], butoverall it has been shown that the compared algorithms cangenerally accurately extract some of the gait parameters.However, many of these contributions, require multiplesensors (accelerometers and gyroscopes), multiple sensorlocations, or complex processing techniques to achieve very
high accuracies making them difficult to implement in theclinical setting. Furthermore, many of these contributionshave investigated their proposed algorithms using only younghealthy subjects and/or have not validated their results againstthe established gait assessment systems. Finally, the remain-ing algorithms failed to identify all of the critical temporalparameters including toe off.
To avoid the aforementioned shortcomings of the variousmeasurement systems, we developed a method to acquiretime estimates for heel strikes and toe-offs for both feet usingatri-axial accelerometer worn on the pelvis. An algorithmwasdeveloped using the same principles of [40] that more com-pletely analyzes accelerations captured along vertical (V),anterior-posterior (AP) and medial-lateral (ML) axes dur-ing walking via a single accelerometer positioned over theL3 segment of the lumbar spine (e.g., [39], [41]). In this paper,we describe this algorithm, and validate its accuracy againstthe stride interval time series extracted via a motion capturesystem for healthy and neurotically diseased elderly subjects.Our results show that the typical gait parameters studied inthe literature can be accurately extracted from stride intervaltime series obtained by using the proposed algorithm.
II. METHODOLOGYThe data used in the current study were collected from35 adults who were 65 years of age or older; 14 healthycontrols (HC), 10 with Parkinson’s disease (PD) and 11 withperipheral neuropathy (PN). HC participants (4 males,6 females) were 73.9 ± 5.70 years old with their preferredspeed equal to 1.07 ± 0.15 m/s. PD participants (7 males,3 females) were 66.0 ± 9.70 years old with theirgroup averaged preferred treadmill walking speed equalto 1.02 ± 0.18 m/s. PN participants (5 males, 6 females)were 81.0±5.00 years old with their preferred speed equal to1.07± 0.09 m/s. Details on characteristics of the participantshave previously been described in [41], which used the samedata and considered the utilization of various accelerometrycharacteristics to differentiate amongst the three groups.Briefly, all individuals were independently ambulatory andable to continuously walk for at least 3 minutes. Primaryexclusion criteria for all subjects weremusculoskeletal or car-diopulmonary conditions that would interfere with walking.Healthy subjects with any neurological disorders wereexcluded. Primary inclusion criteria were intact vibra-tory sense for HCs and persons with PD (biothesiometerreading ≤ 20), abnormal vibratory sense for persons withPN (biothesiometer reading ≤ 40), and a minimum of 1 yeardisease duration for individuals with PD. Individuals withPD were recruited from the university’s Movement Disor-der Registry, and older adults (including those with PN)were recruited from the university’s Claude Pepper CenterRegistry. The diagnosis of idiopathic PD was made by aneurologist using UK PD Society Brain bank criteria [42].Participants with PD were required to have had a ModifiedHoehn and Yahr score between 2-3 (mild-moderate disease).Out 10 PDparticipants, five participants had aHoehn andYahr
2100111 VOLUME 4, 2016
Sejdić et al.: Extraction of Stride Events From Gait Accelerometry
score of 2, four participants had a Hoehn and Yahr scoreof 2.5. and one participant had a Hoehn and Yahr scoreof 3. All participants with PD were on a stable dosingschedule of anti-parkinson medications for at least 3 monthsprior to testing, and they were tested in their best ON state.In addition to the exclusionary criteria stated in themanuscript, participants were excluded if there were evidenceof global cognitive impairment (Folstein MMSE ≤ 24). Thestudy protocol was reviewed and approved by the university’sIRB, and informed consent was received from all subjects.
Walking trials were performed on a large custom computer-controlled treadmill (1.2 m wide by 2 m long) with asafety harness system. A 3-D optical motion capture system(Natural Point, Inc) collected heel and toe trajectory data.A tri-axial accelerometer (MMA7260Q, Freescale Semicon-ductor) secured over the L3 segment of the lumbar spinemeasured linear accelerations of the body (vertical (V),anterior-posterior (AP) and medial-lateral (ML)), which wererecorded using an analog-digital converter. All data wererecorded with the same data collection computer in orderto properly synchronize the optical and acceleration data.Participants wore their own walking shoes (no sandals, clogs,heels were permitted). The experimenters were experiencedphysical therapists and biomechanists well-versed in palpa-tion and marker placement. In general, all participants woremesh or soft-sided athletic shoes which allowed palpationof bony landmarks through the shoes. The accelerometerwas secured onto thin elastic belt, fastened at the front ofthe subjects waist. A larger neoprene lumbar support sleevewas then secured over the accelerometer. Sensor placementwas frequently checked/monitored throughout data collection(between all walking conditions, after standing up after anyrest breaks). Trunk accelerations and the motion capture sys-tem signals were sampled at 100 Hz. Trajectory data from2 shoe markers (midpoint of proximal interphalangeal ofthe first digit, and the posterior superior aspect of calca-neous along the midline) were used to extract gait cycle timepoints [43].
Treadmill familiarization and preferred speed was assessedprior to the start of the protocol, before marker placement.The safety harness was used and participants started offholding on to the treadmill handrail. While holding on weslowly increased treadmill speed (in by 0.05 to 0.10 m/s)until a comfortable walking speed was reported. The subjectthen established a comfortable walking speed without handsupport, similar to [1]. Mindful that we were working witholder adults and individuals susceptible to fatigue (PDs),once we re-established comfortable walking speed withouthand support the familiarization protocol was terminated.In general, this process took 5-10 minutes.
Each walking trial began with a ramp up period, wherethe subject’s walking speed was slowly increased until theirpreviously established preferred pace was reached. Subjectscompleted a 3 minute walking trial at their preferred pace,rested, then completed a 3 minute walking trial at a slowerspeed (10% reduction from the preferred treadmill speed).
Across groups, the average usual treadmill speed was1.06 ± 0.014 m/s with a range of 0.74 − 1.30 m/s.Average reduced treadmill speed was 0.95 ± 0.03 m/s witha range of 0.66 − 1.12 m/s. The total range of examinedspeedswas 0.66−1.3m/s, which is wide and representative ofpersons with limited to independent community ambulationability [44]; thus the algorithm has potential to be used acrossa range of gait speeds and clinical populations.
III. SEGMENTATION OF GAIT ACCELEROMETRY SIGNALSIn this section, we first introduce the algorithm for extractionof heel strikes and toe-offs from gait accelerometry signals.Secondly, we describe our approach to validate the accuracyof the proposed algorithm.
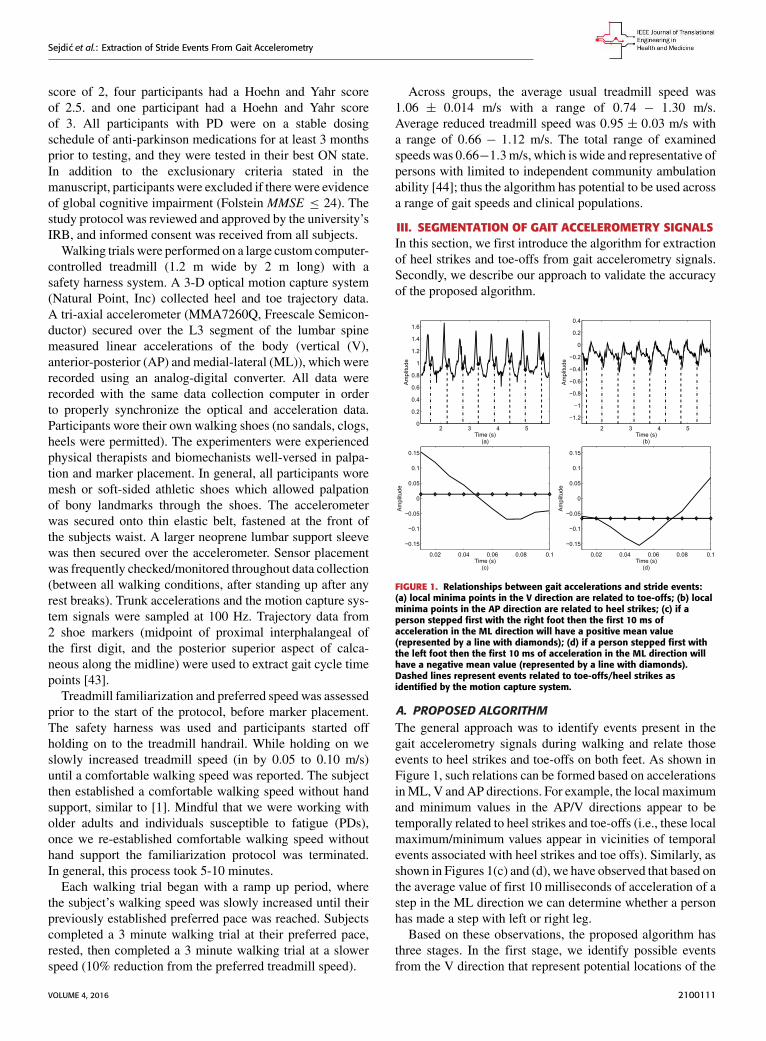
FIGURE 1. Relationships between gait accelerations and stride events:(a) local minima points in the V direction are related to toe-offs; (b) localminima points in the AP direction are related to heel strikes; (c) if aperson stepped first with the right foot then the first 10 ms ofacceleration in the ML direction will have a positive mean value(represented by a line with diamonds); (d) if a person stepped first withthe left foot then the first 10 ms of acceleration in the ML direction willhave a negative mean value (represented by a line with diamonds).Dashed lines represent events related to toe-offs/heel strikes asidentified by the motion capture system.
A. PROPOSED ALGORITHMThe general approach was to identify events present in thegait accelerometry signals during walking and relate thoseevents to heel strikes and toe-offs on both feet. As shown inFigure 1, such relations can be formed based on accelerationsinML, V andAP directions. For example, the local maximumand minimum values in the AP/V directions appear to betemporally related to heel strikes and toe-offs (i.e., these localmaximum/minimum values appear in vicinities of temporalevents associated with heel strikes and toe offs). Similarly, asshown in Figures 1(c) and (d), we have observed that based onthe average value of first 10 milliseconds of acceleration of astep in the ML direction we can determine whether a personhas made a step with left or right leg.
Based on these observations, the proposed algorithm hasthree stages. In the first stage, we identify possible eventsfrom the V direction that represent potential locations of the
VOLUME 4, 2016 2100111

Sejdić et al.: Extraction of Stride Events From Gait Accelerometry
gait events. The algorithm initially identifies possible eventsfrom the V signal; including the heel strikes and toe-offs.In the second stage, potential events are processed to identifythe true toe-off events for both feet. Lastly, the third stageworks towards the accurate estimation of heel strikes fromboth feet based on the initial estimates of the gait events.
In the detailed description of the algorithm, {x(n), y(n),z(n) ∈ RN
} will denote samples of gait accelerometrysignals in the ML, V and AP directions, respectively.N represents the length of these vectors representingsamples of gait accelerometry signals, and these sampleswere acquired using a sample frequency fs. The proposedalgorithm is not sensitive to the selection of a samplingfrequency, as long as the sampling frequency is greater thantwice the Nyquist frequency for gait accelerometry signals(around 10-20 Hz in typical cases) [39], [41]. Hence, thechoice of the sampling frequency in here (100 Hz) did notplay a significant role.
1) STAGE 1 - IDENTIFY EVENTS OF INTERESTThe goal of Stage 1 is to identify events of interest, that is,local maximum values in the V and AP directions. To achievethis goal, we adopt the following steps:
1) Remove any artifact related to the gravity by removingthe mean from the acquired signals:
x1(n) = x(n)− µx (1)
y1(n) = y(n)− µy (2)
z1(n) = z(n)− µz (3)
where µx , µy and µz represent the calculated meanvalues for these signals.
2) Remove impulse-like artifacts unrelated to gait viamedian filtering:
x2(n) = 3{x1(n),m} (4)
y2(n) = 3{y1(n),m} (5)
z2(n) = 3{z1(n),m} (6)
where3{·,m} represents an mth order median filteringoperation. In this paper, a fifth order filter is utilized.
3) Normalize the filtered signals to unity amplitudes:
x3(n) = x2(n)/max |x2(n)| (7)
y3(n) = y2(n)/max |y2(n)| (8)
z3(n) = z2(n)/max |z2(n)| (9)
Signal normalization was carried out to reduce theinter-individual variability within groups.
4) Determine α1(k) ∈ RK representing k local maximavalues present in y3(n) under the constraint that suc-cessive local maxima have to be at least 0.35 secondsapart and K ≤ N , where 0.35 seconds represents aconservative estimate of half of the stance phase duringa single stride. Figure 2 depicts that higher peaks arefollowed by smaller peaks. Here, we seek to identifystronger peaks in order to yield less false positives.
FIGURE 2. A sample signal in the V direction: (a) a raw accelerationsignal; (b) the signal after removing its mean component; (c) the signalafter being processed by a median filter; (d) the signal after theamplitude normalization. The amplitude of signals in (a)-(c) is in m/s2.
5) Determine β1(k) ∈ RK representing the time indices nfrom y3(n) of k local maxima values.
6) Form a set 5 representing k values for whichα1(k) > 0. The cardinality of the set will be equal toP ≤ K . Based on the set 5, form new vectors:
α2(p) = α1(k) for k ∈ 5 (10)
β2(p) = β1(k) for k ∈ 5 (11)
where p = 1, ..,P.Figure 2 depicts the effects of various signal operations on
a sample signal from the V direction.
2) STAGE 2 - DETERMINING TOE-OFFSThe purpose of Stage 2 is to accurately determine thetoe-offs based on refining β2(p) values via a closer exami-nation of local minima values in y3(n). The following stepsneed to be taken:
1) Form P sequences based on y3(n), where thesesequences are defined as:
y(p)3 (q) = y3(n) for n ∈ β2(p), .., β2(p)+ ς (12)
where p = 1, . . . ,P and ς represents a time offset.In this paper, we used ς = 0.15 seconds (that is,15 samples), as the double support phase of a stridelasts for about 15% of a stride duration [45]. Therefore,our q values are given by Q = {q : 1 ≤ q ≤ 15}.
In other words, y(p)3 (q) represent Q points around thepth maximum found in the Stage 1.
2) For each sequence y(p)3 (q), determine t representing alocation of the minimum value for the sequence. Then,update β2(p) to reflect the true location of toe-offsaccording to the following rule:
β3(p) = β2(p)+ t (13)
with 0 ≤ t ≤ ς .
2100111 VOLUME 4, 2016

Sejdić et al.: Extraction of Stride Events From Gait Accelerometry
3) Calculate
µ̂x =1L
L∑l=1
x3(l) (14)
where L = 10 is used in this paper.4) Based on β3(p) and µ̂x , form sequences φ(r) and ω(r)
representing the time indices of right and left toe-offs,respectively. This can be accomplished via the follow-ing rule:
Case I If µ̂x > 0, then
φ(r) = β3(p) for p = 2, 4, . . . ,P (15)
ω(r) = β3(p) for p = 1, 3, . . . ,P (16)
Case II If µ̂x < 0, then
φ(r) = β3(p) for p = 1, 3, . . . ,P (17)
ω(r) = β3(p) for p = 2, 4, . . . ,P (18)
where r = 1, . . . ,R and R < P for both cases.
Figure 3 depicts a sample signal, and the outcome of theStage 2 processing.
FIGURE 3. Estimating toe-offs: (a) an initial estimate of toe-off eventsfrom the V direction; (b) refining the timing of toe-off events; (c) toe-offevents identified from acceleration signals for the right foot; (d) toe-offevents identified from acceleration signals for the left foot.
3) STAGE 3 - DETERMINING HEEL STRIKESThe purpose of Stage 3 is to accurately determine the heelstrikes based on refining β2(p) values via the first derivativeof z3(n). Figure 4 summarizes the steps of this stage.To accomplish this task, the following steps are needed:
1) Determine w(n) representing the absolute value of thefirst order derivative of z3(n):
w(n) =
∣∣∣∣ ddnz3(n)∣∣∣∣ (19)
FIGURE 4. Estimating heel strikes: (a) an initial estimate of heel strikeevents from the AP direction; (b) refining the timing of heel strike events;(c) heel strike events identified from acceleration signals for the rightfoot; (d) heel strike events identified from acceleration signals for theleft foot.
2) Form P sequences based on w(n), where thesesequences are defined as:
w(p)(u) = w(n) for n ∈ α2(p)− κ, .., α2(p) (20)
where p = 1, . . . ,P and κ represents a time offset.Here, we used κ = 15 samples (that is, 150 ms) whichgave us u values are given by U = {u : 1 ≤ u ≤ 15}.In other words, w(p)(u) represents P points around alocal extremum point.
3) For each sequence w(p)(u), determine i representing alocation of the minimum value for the sequence. Then,update α2(p) to reflect the true location of heel strikesaccording to the following rule:
α3(p) = α2(p)− i (21)
with 0 ≤ i ≤ κ .4) Based on α3(p) and µ̂x from eqn. (14), form sequences
ψ(d) and υ(d) representing the time indices of rightand left heel strikes, respectively. This can be accom-plished via the following rule:
Case I If µ̂x > 0, then
ψ(d) = α3(p) for p = 1, 3, . . . ,P (22)
υ(d) = α3(p) for p = 2, 4, . . . ,P (23)
Case II If µ̂x < 0, then
ψ(d) = α3(p) for p = 2, 4, . . . ,P (24)
υ(d) = α3(p) for p = 1, 3, . . . ,P (25)
where d = 1, . . . ,D and D < P for both cases.These three stages will produce time series (φ(r), ω(r),
ψ(d), υ(d)) representing time indices of right and lefttoe-offs and heel strikes. To obtain a stride interval timeseries, one would need to take the first difference of the
VOLUME 4, 2016 2100111

Sejdić et al.: Extraction of Stride Events From Gait Accelerometry
obtained time series points and normalize the obtained dif-ferences by the sampling frequency used to acquire gaitaccelerometry signals.
B. ALGORITHM EVALUATIONTo evaluate the accuracy of the proposed algorithm, weextracted features from the stride intervals obtained usingthe proposed algorithm. The extracted features are then com-pared to the same features extracted from the stride intervaltime series obtained from reflective markers using the pro-cedure outlined in [43], which has a mean maximal error of11.9 milliseconds. In particular, we calculated mean strideintervals, coefficients of variations (CoV) (e.g., [5], [46]),but other typical stride features such right and left stances,single and double support times and swing percentages werecalculated as well. Also, using these stride time series,harmonic ratios (HR) (e.g., [2], [13], [14], [47], [48]) werecalculated based on the acceleration signals. These quantitieswere calculated in all three anatomical directions consid-ered in this paper from low pass filtered acceleration dataover each stride. The filter was a second-order, zero-phaseButterworth filter with a cutoff frequency of 30 Hz. First,we calculated the discrete Fourier transform of the segmenteddata as follows (e.g., [43], [49]):
astride =N−1∑n=0
Cn sin(nωot + φn) (26)
where the Cn is the harmonic coefficient, ωo is the stride fre-quency, andφn is the phase. The first 20 harmonic coefficientsare then summed and used to calculate the harmonic ratio,which is defined as:
HRAP and V =
⟨∑20n=2,4,6,... Cn∑19n=1,3,5,... Cn
⟩(27)
HRML =
⟨∑19n=1,3,5,... Cn∑20n=2,4,6,... Cn
⟩(28)
where 〈∑Cn/
∑Cn〉 denotes the average ratio over all
strides. This metric allows us to quantify the step to stepasymmetry in the acceleration at the L3/L4, which has beenused as a proxy center of mass.
To test statistical significance of our results, we firstexamined whether there were any differences between fea-tures extracted by the algorithm and motion capture method.We conducted a series of paired samples t-tests to comparetrue and estimated differences under each walking conditionin each of the participant groups based on disease/gender.Second, we examined whether the said differences, if any,were different between gender/disease groups using one-and two-way analyses of variance. Finally, we examinedwhether any finding obtained by comparing different par-ticipant groups/conditions would be different if one usedestimated features instead of true features. To this end, wefitted a series of linear mixedmodels with each of the featuresas the dependent variable; type of value (true/estimated),participant group/condition and their interaction as fixedeffects of interest; and a participant random effect to accountfor multiple measurements from the same set of participants.We constructed appropriate means contrasts to estimatebetween-group/condition differences under true and esti-mated measurements separately, and make comparisonsbetween them. We used SAS R©version 9.3 (SAS Institute,Inc., Cary, North Carolina) for all statistical analyses.
IV. RESULTSMean stride time intervals estimated from the accelerometrydata were similar to those calculated from the motion capturesystem as shown in Table 1, with the differences between thetwo methods ranging between −0.5 and 2 ms (p > 0.73).An ANOVA on the differences between the values showedno significant effects of gait speed, group, foot, heel/toeor any interactions. It should be also pointed out that theaverage value of a mean absolute difference between the true(motion capture) and estimated (algorithm) values was less0.01 seconds, which is smaller than the temporal resolutionof the used instruments. As expected, the mean stride timesthemselves were significantly affected by speed (p < 0.001),with the averages for the normal and reduced speeds acrosssubjects being 1.11 (s.d. 0.08) and 1.18 (s.d. 0.09) seconds,respectively. There were no effects of group, foot, heel/toe orany interactions on the stride times.
Stride time interval variability, as measured by CoVfor each subject, was about 1.5% different between the
TABLE 1. Motion capture and accelerometry average stride intervals (seconds) as calculated from various points in the gait cycle. † denotes statisticaldifferences between motion capture and accelerometry values within groups. LH = left heel strike; RH = right heel strike; LT = left toe off;RT = right toe off; E at the end of the variable name denotes estimated value from accelerometry signals.
2100111 VOLUME 4, 2016

Sejdić et al.: Extraction of Stride Events From Gait Accelerometry
TABLE 2. Motion capture and Aaccelerometry stride interval coefficient of variation (percent) as calculated from various points in the gait cycle for thethree subject groups (HC, PN, PD). † denotes statistical differences between motion capture and accelerometry values within groups LH = left heel strike;RH = right heel strike; LT = left toe off; RT = right toe off; E at the end of the variable name denotes estimated value from accelerometry signals.
two methods, with the CoV from the accelerometry databeing overall greater that the CoV from the motion data asshown in Table 2. However, these numbers still representtypical ranges for CoV values of stride time interval series.The ANOVA investigating the impact of the independentvariables showed that speed (p = 0.001) and the interactionof speed and heel strike (or toe-off) events (p = 0.02) hada small (< 0.3%) but significant impact on the differencesbetween the results obtained with the motion capture systemand the proposed method.When using heel contact, there wasno significant impact of gait speed on the difference betweenthe two methods. When using the toe, speed did have animpact (p = 0.001 for within toe analysis) on the differences.Thus, the accelerometry method resulted in CoVs that werehigher than the motion capture data; and when using the heelcontact results to define the cycles speed had no effect onthe differences between the accelerometry method and themotion data method.
Additionally, we examined other typical stride features asshown in Table 3. Our statistical analysis has shown that anygroup and sex differences are not affected by the use of theproposed algorithm (p > 0.24).Harmonic Ratio (HR) estimations from the accelerometry
data were calculated using the two methods (accelerometry
and motion) to define the gait cycles (see Table 4). Forthe HR in the ML direction, the HR was smaller for theaccelerometry-defined gait cycles compared to the motion-defined cycles. Group (p = 0.04) and speed (p = 0.02) hada small, but significant influence on the differences betweenthe two methods. For the vertical HR, there was again a biaswith the accelerometry defined cycles resulting in smallerHRs. Speed influenced the HR for both cycle defining meth-ods with reduced speed having a greater HR than normalspeed. The HR in the AP direction showed similar resultsas the vertical HRs, with the acceleration defined gait cycleshaving greater HRs than the motion defined gait cycles andlower HRs for reduced speed. On average, the magnitudesof HRs estimated with the proposed algorithm were lowerby 5%-10% than the magnitudes of HRs estimated with themotion capture system.
The ability of the HR measures to distinguish betweengroups were similar using the two methods to define gaitcycles. For the anteroposterior HRs, a significant differenceacross groups was found for both the acceleration-definedgait cycles and the motion-defined gait cycles (p < 0.05).For the vertical HRs, group was not found to be significantin either case (p > 0.05). For the mediolateral HR, theacceleration based gait cycles did have a significant group
TABLE 3. Typical stride parameters. The variables are expressed in seconds unless a variable is defined as a percentage. RS = right stance;LS = left stance; DSRL = double support (right-left); DSRL = double support (left-right); SSR = right single support; SSL = left single support;SPR = right swing percentage; SPL = left swing percentage. E at the end of the variable name denotes estimated value from accelerometry signals.
VOLUME 4, 2016 2100111

Sejdić et al.: Extraction of Stride Events From Gait Accelerometry
TABLE 4. Harmonic ratios. † denotes statistical differences between the true and estimated values within the group. E at the end of the variable namedenotes estimated value from accelerometry signals.
effect (p = 0.04), while the motion based gait cyclesdid not attain statistical significance (p = 0.08). For allHR directions, speed was found to significantly impact theHR when using the acceleration or the motion defined cycles.Similarly, a combination of groups and speed did not sig-nificantly impact the HR when using the acceleration or themotion defined cycles.
V. DISCUSSIONHigh agreement between the stride interval time seriesobtained with the proposed algorithm and the stride intervaltime series obtained with the motion capture system can beachieved. Thus, accelerometers can be used to accuratelyestimate gait cycles from treadmill walking to be used inthe analysis of various subject populations. The algorithmextracts heel contact and toe-off from the right and left footdirectly from the accelerometry signals themselves and doesnot require other additional sensors such as foot switches oroptical motion capture.
There were some small, but statistically significant differ-ences in the time series when comparing the two methods.Stride interval variability (as measured by the CoV) wasoverall higher when the heel contact and toe-off eventswere defined by the acceleration signals. Higher CoV valueswere due to occasional misidentification of heel-strike/toe-off events, but these higher values of stride variabilityare still within the previously reported ranges for thesegroups [4]–[6]. In addition, the higher CoV values were asmall bias of between 1 and 1.5% but behaved similarly atdifferent speeds. When the defined time series were used tocalculate the HRs, there was also a small bias between the twomethods, but both methods resulted in harmonic ratios withinthe reported ranges for similar groups [13], [47], [48]. Giventhe similar behaviors in CoV and HR found in the results,we believe that the proposed method can be very useful inthe field to define gait cycles directly from the accererometrysignals. Finding subject group differences in HR were foundto be generally the same for the two methods as well. Therewas a small difference in the mediolateral HR results, butgiven the relatively small patient subject sample size, thisdifference is not considered practically significant.
The proposed algorithm is robust from two main points ofview. First, the reduced speed did not affect the gait eventdetection with the proposed algorithm, as reduced speedsusually introduce greater values for the average stride intervaland the stride interval variability [50]. The proposed algo-rithm maintained its accuracy for both considered speeds.Second, the algorithm accurately extracted stride intervalsfrom gait accelerometry signals in all three considered groups(i.e., HC, PN and PD). The considered groups typically havevery different walking patterns [39], [41], but the proposedalgorithm maintained any between-group differences.
Having an ability to extract stride interval time serieswithout the utilization of footswitches and/or motion capturesystem also enables us to possibly move the gait assess-ment outside well-controlled conditions (e.g., a laboratorysetting). This research is the first step in such a direction.Cumbersomeness of the current acquisition techniques isavoided in this case, as we can use a single sensor wornaround a waist to acquire needed time series. Similarly, theproposed algorithm enables us to calculate certain gait char-acteristics such as harmonic ratios [48] in real-life settingsas well. Calculation of these characteristics usually requiredacquisition of stride interval time series and gait accelerom-etry signals simultaneously. However, the aforementionedcumbersomeness of the equipment often limited researchersand clinicians in their intents to investigate these gait charac-teristics outside laboratory settings. The proposed algorithmprovides us with an opportunity to simply avoid additionalsensors and acquire only gait accelerometry signals from theL3 region.
This study used treadmill walking to validate our methodof stride cycle events, but the method should be applica-ble in overground walking as well. Treadmill walking hasbeen shown to decrease stance phase and double supporttime generally as a consequence of increased cadence (from110ms to 80ms for double support) [51]. However, the over-all characteristics of the acceleration signal are consistentand the characteristic maximums and minimums still exist.Therefore, any changes in stance and double support wouldmerely affect the timing thresholds (i.e., ς values) inStage 2 of the algorithm similar to varying cadence in the
2100111 VOLUME 4, 2016

Sejdić et al.: Extraction of Stride Events From Gait Accelerometry
normal population. In fact, the reductions in stance anddouble support phase would make the threshold choices moreconservative and the algorithm more effective.
Additionally, treadmill walking allows for collection ofa large amount of continuous strides. Previous research(e.g. [52]) indicates that more than 50 strides are required toreliablymeasure parameters such as variability during normalwalking, and even more are necessary during complex taskssuch as dual-task walking, or when performing somethingother than preferred walking, such as the slow condition inthis current study.While we could have collected both motioncapture data and direct accelerations during overgroundwalk-ing, due to lab space constraints the strides would either havebeen non-continuous, or participants would have needed towalk an oval path and thus performing turns. Turning is adifferent motor task than straight path walking and wouldhave introduced a major confound into the data. In order toachieve the same amount of clean, normal walking data, bothoptions would require the subject to walk for an overall longertime period which may induce fatigue. Fatigue is also knownto cause changes in gait characteristics [53]. To avoid theseother caveats, we chose to compare groups on the treadmill asopposed to looking at non-continuous or turning conditions.
Treadmill walking has the benefit of allowing for thecollection of a large amount of continuous strides whileavoiding turning or other path alterations. However, thereare differences from overground walking. Because the tread-mill acts as an external pacer, treadmill walking can reducestride time variability, particularly in clinical groups such asParkinsons disease who benefit from external pacing/cueing.Walking slower than ones preferred pace has been shown toincrease variability [13], [54], [55], thus we chose a reducedspeed condition to induce variability for the dual purposesof simulating more natural overground variability and to addcomplexity to test the algorithm.
Determining the timings of toe-offs and heel strike is akey feature of the proposed algorithm that was validatedagainst a motion capture system. The algorithm shouldbe able to detect such events for overground walking inreal-life conditions (e.g., walking on a sidewalk) as well.However, real-life conditions can impose additional chal-lenges (e.g., stopping on a red light) which are difficultto reproduce in laboratory settings and change the overallnature of the acceleration signal. Further investigation shouldbe made into starting, stopping and turning events to seeif the relevant data can be parsed, or require additionalmodifications.
In comparison to previous contributions (e.g., [26]–[32],[34], [36], [37], [39]), the proposed algorithm can accuratelydetermine the timings of heel contact and toe off events witha single accelerometer. Furthermore, we validated our algo-rithm using a motion capture system. Lastly, we examinedthe performance of the proposed algorithm in healthy olderadults and older subjects with neurological disorders includ-ing peripheral neuropathy and Parkinsons disease, whereassome of the previous contributions only examined healthy
young subjects, which tend to have less obstructed gait thanolder adults.
A major limitation of the current study is that themotion capture system only allows data collection in a well-controlled environment. Future investigations should inves-tigate the validity of the proposed algorithm in real-worldconditions with the understanding that the motion capturedata will not be accessible in such conditions. Hence,future studies will probably need to rely on footswitches forcomparisons.
VI. CONCLUSIONAn algorithm for extraction of stride cycle events from gaitaccelerometry signals is described.We validated the proposedalgorithm against time series obtained via the motion cap-ture system using data from 35 older adults while walkingon a treadmill. Our results demonstrated that the proposedalgorithm can accurately extract heel and toe events fromgait accelerometry signals. Thus, the proposed algorithm canbe utilized to acquire stride cycle events from inexpensiveaccelerometers while avoiding the limitations and costs of thecurrent acquisition methods.
REFERENCES[1] K. Jordan, J. H. Challis, and K. M. Newell, ‘‘Walking speed influences on
gait cycle variability,’’Gait Posture, vol. 26, no. 1, pp. 128–134, Jun. 2007.[2] J. S. Brach et al., ‘‘Validation of a measure of smoothness of walking,’’
J. Gerontol. A, Biol. Sci. Med. Sci., vol. 66, no. 1, pp. 136–141, Jan. 2011.[3] K. Jordan, J. H. Challis, and K. M. Newell, ‘‘Long range correlations in
the stride interval of running,’’ Gait Posture, vol. 24, no. 1, pp. 120–125,Aug. 2006.
[4] M. D. Chang, S. Shaikh, and T. Chau, ‘‘Effect of treadmill walking onthe stride interval dynamics of human gait,’’ Gait Posture, vol. 30, no. 4,pp. 431–435, Nov. 2009.
[5] J. A. Fairley, E. Sejdić, and T. Chau, ‘‘The effect of treadmill walking onthe stride interval dynamics of children,’’ Human Movement Sci., vol. 29,no. 6, pp. 987–998, Dec. 2010.
[6] E. Sejdić, Y. Fu, A. Pak, J. A. Fairley, and T. Chau, ‘‘The effects of rhythmicsensory cues on the temporal dynamics of human gait,’’ PLoS ONE, vol. 7,no. 8, pp. e43104-1–e43104-7, Aug. 2012.
[7] N. Iyengar, C. K. Peng, R. Morin, A. L. Goldberger, and L. A. Lipsitz,‘‘Age-related alterations in the fractal scaling of cardiac interbeat intervaldynamics,’’ Amer. J. Physiol.-Regulatory, Integr. Comparative Physiol.,vol. 271, no. 4, pp. R1078–R1084, Oct. 1996.
[8] E. Sejdić and L. A. Lipsitz, ‘‘Necessity of noise in physiology andmedicine,’’ Comput. Methods Programs Biomed., vol. 111, no. 2,pp. 459–470, Aug. 2013.
[9] J. S. Brach, S. Perera, S. Studenski, and A. B. Newman, ‘‘The reliabil-ity and validity of measures of gait variability in community-dwellingolder adults,’’ Arch. Phys. Med. Rehabil., vol. 89, no. 12, pp. 2293–2296,Dec. 2008.
[10] J. S. Brach, J. E. Berlin, J. M. VanSwearingen, A. B. Newman, andS. A. Studenski, ‘‘Too much or too little step width variability is associatedwith a fall history in older persons who walk at or near normal gait speed,’’J. Neuroeng. Rehabil., vol. 2, p. 21, Jul. 2005.
[11] J. S. Brach, J. M. Van Swearingen, S. Perera, D. M. Wert, andS. A. Studenski, ‘‘Motor learning versus standard walking exercise inolder adults with subclinical gait dysfunction: A randomized clinical trial,’’J. Amer. Geriatrics Soc., vol. 61, no. 11, pp. 1879–1886, 2013.
[12] D. H. Gates and J. B. Dingwell, ‘‘Peripheral neuropathy does not alter thefractal dynamics of stride intervals of gait,’’ J. Appl. Physiol., vol. 102,no. 3, pp. 965–971, Mar. 2007.
[13] K. A. Lowry, N. Lokenvitz, and A. L. Smiley-Oyen, ‘‘Age- and speed-related differences in harmonic ratios during walking,’’ Gait Posture,vol. 35, no. 2, pp. 272–276, Feb. 2012.
VOLUME 4, 2016 2100111

Sejdić et al.: Extraction of Stride Events From Gait Accelerometry
[14] J. L. Bellanca, K. A. Lowry, J. M. Van Swearingen, J. S. Brach, andM. S. Redfern, ‘‘Harmonic ratios: A quantification of step to step sym-metry,’’ J. Biomech., vol. 46, no. 4, pp. 828–831, Feb. 2013.
[15] C. M. O’Connor, S. K. Thorpe, M. J. O’Malley, and C. L. Vaughan,‘‘Automatic detection of gait events using kinematic data,’’ Gait Posture,vol. 25, no. 3, pp. 469–474, Mar. 2007.
[16] L. Nolan and D. C. Kerrigan, ‘‘Keep on your toes: Gait initiation from toe-standing,’’ J. Biomech., vol. 36, no. 3, pp. 393–401, Mar. 2003.
[17] M. H. Schwartz, A. Rozumalski, and J. P. Trost, ‘‘The effect of walkingspeed on the gait of typically developing children,’’ J. Biomech., vol. 41,no. 8, pp. 1639–1650, 2008.
[18] J. S. Brach, R. Berthold, R. Craik, J. M. Van Swearingen, andA. B. Newman, ‘‘Gait variability in community-dwelling older adults,’’J. Amer. Geriatrics Soc., vol. 49, no. 12, pp. 1646–1650, Dec. 2001.
[19] J. S. Brach, S. A. Studenski, S. Perera, J. M. Van Swearingen, andA. B. Newman, ‘‘Gait variability and the risk of incident mobility disabilityin community-dwelling older adults,’’ J. Gerontol. A, Biol. Sci. Med. Sci.,vol. 62, no. 9, pp. 983–988, 2007.
[20] P. M. Mills, R. S. Barrett, and S. Morrison, ‘‘Agreement betweenfootswitch and ground reaction force techniques for identifying gait events:Inter-session repeatability and the effect of walking speed,’’ Gait Posture,vol. 26, no. 2, pp. 323–326, 2007.
[21] J. Rueterbories, E. G. Spaich, B. Larsen, and O. K. Andersen, ‘‘Methodsfor gait event detection and analysis in ambulatory systems,’’ Med. Eng.Phys., vol. 32, no. 6, pp. 545–552, Jul. 2010.
[22] O. Beauchet, C. Annweiler, S. Celle, R. Bartha, J.-C. Barthélémy, andF. Roche, ‘‘Higher gait variability is associatedwith decreased parietal graymatter volume among healthy older adults,’’ Brain Topogr., vol. 27, no. 2,pp. 293–295, Mar. 2014.
[23] S. J. M. Bamberg, A. Y. Benbasat, D. M. Scarborough, D. E. Krebs,and J. A. Paradiso, ‘‘Gait analysis using a shoe-integrated wireless sensorsystem,’’ IEEE Trans. Inf. Technol. Biomed., vol. 12, no. 4, pp. 413–423,Jul. 2008.
[24] I. P. I. Pappas, T. Keller, S. Mangold, M. R. Popovic, V. Dietz, andM. Morari, ‘‘A reliable gyroscope-based gait-phase detection sensorembedded in a shoe insole,’’ IEEE Sensors J., vol. 4, no. 2, pp. 268–274,Apr. 2004.
[25] O. Beauchet, F. R. Herrmann, R. Grandjean, V. Dubost, and G. Allali,‘‘Concurrent validity of SMTEC footswitches system for the measurementof temporal gait parameters,’’ Gait Posture, vol. 27, no. 1, pp. 156–159,Jan. 2008.
[26] B. Auvinet et al., ‘‘Reference data for normal subjects obtained withan accelerometric device,’’ Gait Posture, vol. 16, no. 2, pp. 124–134,Oct. 2002.
[27] W. Zijlstra, ‘‘Assessment of spatio-temporal parameters during uncon-strained walking,’’ Eur. J. Appl. Physiol., vol. 92, nos. 1–2, pp. 39–44,Jul. 2004.
[28] K. Aminian et al., ‘‘Evaluation of an ambulatory system for gait analysisin hip osteoarthritis and after total hip replacement,’’ Gait Posture, vol. 20,no. 1, pp. 102–107, Aug. 2004.
[29] C. Mizuike, S. Ohgia, and S. Morita, ‘‘Analysis of stroke patient walkingdynamics using a tri-axial accelerometer,’’ Gait Posture, vol. 30, no. 1,pp. 60–64, Jul. 2009.
[30] A. Hartmann, S. Luzi, K. Murer, R. A. de Bie, and E. D. de Bruin, ‘‘Con-current validity of a trunk tri-axial accelerometer system for gait analysisin older adults,’’ Gait Posture, vol. 29, no. 3, pp. 444–448, Apr. 2009.
[31] M. Hanlon and R. Anderson, ‘‘Real-time gait event detection using wear-able sensors,’’ Gait Posture, vol. 30, no. 4, pp. 523–527, Nov. 2009.
[32] R. C. González, A. M. López, J. Rodriguez-Uría, D. Álvarez, andJ. C. Alvarez, ‘‘Real-time gait event detection for normal subjects fromlower trunk accelerations,’’ Gait Posture, vol. 31, no. 3, pp. 322–325,Mar. 2010.
[33] S. H. Shin andC.G. Park, ‘‘Adaptive step length estimation algorithm usingoptimal parameters and movement status awareness,’’ Med. Eng. Phys.,vol. 33, no. 9, pp. 1064–1071, Nov. 2011.
[34] A. Köse, A. Cereatti, and U. D. Croce, ‘‘Bilateral step length estima-tion using a single inertial measurement unit attached to the pelvis,’’J. Neuroeng. Rehabil., vol. 9, p. 9, Feb. 2012.
[35] J. McCamley, M. Donati, E. Grimpampi, and C. Mazzà, ‘‘An enhancedestimate of initial contact and final contact instants of time using lowertrunk inertial sensor data,’’ Gait Posture, vol. 36, no. 2, pp. 316–318,Jun. 2012.
[36] B. Mariani, S. Rochat, C. J. Büla, and K. Aminian, ‘‘Heel and toeclearance estimation for gait analysis using wireless inertial sensors,’’IEEE Trans. Biomed. Eng., vol. 59, no. 11, pp. 3162–3168,Nov. 2012.
[37] M. S. H. Aung et al., ‘‘Automated detection of instantaneous gaitevents using time frequency analysis and manifold embedding,’’ IEEETrans. Neural Syst. Rehabil. Eng., vol. 21, no. 6, pp. 908–916,Nov. 2013.
[38] D. Trojaniello, A. Cereatti, and U. D. Croce, ‘‘Accuracy, sensi-tivity and robustness of five different methods for the estimationof gait temporal parameters using a single inertial sensor mountedon the lower trunk,’’ Gait Posture, vol. 40, no. 4, pp. 487–492,Sep. 2014.
[39] J. J. Kavanagh and H. B. Menz, ‘‘Accelerometry: A technique for quan-tifying movement patterns during walking,’’ Gait Posture, vol. 28, no. 1,pp. 1–15, Jul. 2008.
[40] W. Zijlstra and A. L. Hof, ‘‘Assessment of spatio-temporal gait parametersfrom trunk accelerations during human walking,’’ Gait Posture, vol. 18,no. 2, pp. 1–10, Oct. 2003.
[41] E. Sejdić, K. A. Lowry, J. Bellanca, M. S. Redfern, and J. S. Brach,‘‘A comprehensive assessment of gait accelerometry signals in time, fre-quency and time-frequency domains,’’ IEEE Trans. Neural Syst. Rehabil.Eng., vol. 22, no. 3, pp. 603–612, May 2014.
[42] A. J. Hughes, S. E. Daniel, L. Kilford, and A. J. Lees, ‘‘Accuracy of clinicaldiagnosis of idiopathic Parkinson’s disease: A clinico-pathological studyof 100 cases,’’ J. Neurol., Neurosurgery, Psychiatry, vol. 55, pp. 181–184,Mar. 1992.
[43] N. Fusco and A. Cretual, ‘‘Instantaneous treadmill speed determinationusing subject’s kinematic data,’’ Gait Posture, vol. 28, no. 4, pp. 663–667,Nov. 2008.
[44] M. G. Bowden, C. K. Balasubramanian, A. L. Behrman, and S. A. Kautz,‘‘Validation of a speed-based classification system using quantitative mea-sures of walking performance poststroke,’’ Neurorehabil. Neural Repair,vol. 22, no. 6, pp. 672–675, Nov./Dec. 2008.
[45] B. R. Umberger, ‘‘Stance and swing phase costs in humanwalking,’’ J. Roy.Soc. Interface, vol. 7, no. 50, pp. 1329–1340, Sep. 2010.
[46] M. D. Chang, E. Sejdić, V. Wright, and T. Chau, ‘‘Measures of dynamicstability: Detecting differences between walking overground and on acompliant surface,’’ Human Movement Sci., vol. 29, no. 6, pp. 977–986,Dec. 2010.
[47] T. Doi, S. Hirata, R. Ono, K. Tsutsumimoto, S. Misu, and H. Ando,‘‘The harmonic ratio of trunk acceleration predicts falling among olderpeople: Results of a 1-year prospective study,’’ J. NeuroEng. Rehabil.,vol. 10, no. 1, p. 7, Jan. 2013.
[48] K. A. Lowry, A. L. Smiley-Oyen, A. J. Carrel, and J. P. Kerr, ‘‘Walking sta-bility using harmonic ratios in Parkinson’s disease,’’Movement Disorders,vol. 24, no. 2, pp. 261–267, Jan. 2009.
[49] H. B. Menz, S. R. Lord, and R. C. Fitzpatrick, ‘‘Acceleration patterns ofthe head and pelvis when walking on level and irregular surfaces,’’ GaitPosture, vol. 18, no. 1, pp. 35–46, Aug. 2003.
[50] O. Beauchet et al., ‘‘Walking speed-related changes in stride time vari-ability: Effects of decreased speed,’’ J. NeuroEng. Rehabil., vol. 6, p. 32,Aug. 2009.
[51] H. Stolze et al., ‘‘Gait analysis during treadmill and overgroundlocomotion in children and adults,’’ Electroencephalogr. Clin.Neurophysiol./Electromyogr. Motor Control, vol. 105, no. 6, pp. 490–497,Dec. 1997.
[52] J. H. Hollman, K. B. Childs, M. L. McNeil, A. C. Mueller, C. M. Quilter,and J. W. Youdas, ‘‘Number of strides required for reliable measurementsof pace, rhythm and variability parameters of gait during normal and dualtask walking in older individuals,’’ Gait Posture, vol. 32, no. 1, pp. 23–28,May 2010.
[53] J. L. Helbostad, S. Leirfall, R. Moe-Nilssen, and O. Sletvold, ‘‘Physicalfatigue affects gait characteristics in older persons,’’ J. Gerontol. A, Biol.Sci. Med. Sci., vol. 62, no. 9, pp. 1010–1015, Sep. 2007.
[54] H. G. Kang and J. B. Dingwell, ‘‘Separating the effects of age and walkingspeed on gait variability,’’ Gait Posture, vol. 27, no. 4, pp. 572–577,May 2008.
[55] M. Yamasaki, T. Sasaki, and M. Torii, ‘‘Sex difference in thepattern of lower limb movement during treadmill walking,’’ Eur.J. Appl. Physiol. Occupational Physiol., vol. 62, no. 2, pp. 99–103,Mar. 1991.
2100111 VOLUME 4, 2016

Sejdić et al.: Extraction of Stride Events From Gait Accelerometry
ERVIN SEJDIĆ (S’00–M’08) received theB.E.Sc. and Ph.D. degrees in electrical engi-neering from the University of Western Ontario,London, ON, Canada, in 2002 and 2008,respectively.
He was a Post-Doctoral Fellow with HollandBloorview Kids Rehabilitation Hospital/University of Toronto and a Research Fellow inmedicine with the Beth Israel Deaconess MedicalCenter/Harvard Medical School. He is currently
an Assistant Professor with the Department of Electrical and ComputerEngineering (Swanson School of Engineering), the Department of Bioengi-neering (Swanson School of Engineering), the Department of BiomedicalInformatics (School of Medicine), and the Intelligent Systems Program(Kenneth P. Dietrich School of Arts and Sciences) at the University ofPittsburgh, Pittsburgh, PA, USA. His research interests include biomedicaland theoretical signal processing, swallowing difficulties, gait and bal-ance, assistive technologies, rehabilitation engineering, anticipatory medicaldevices, and advanced information systems in medicine.
Dr. SEJDIĆ received prestigious research scholarships from the NaturalSciences and Engineering Research Council of Canada in 2003 and 2005.He also received the Melvin First Young Investigator’s Award from theInstitute for Aging Research at Hebrew Senior Life in Boston, MA.
KRISTIN A. LOWRY received the B.S. degree inphysical therapy and the M.S degree in kinesiol-ogy from the University of Pittsburgh, Pittsburgh,PA, USA, in 1987 and 2002, respectively, andthe Ph.D. degree in kinesiology from Iowa StateUniversity, Ames, IA, USA in 2010. She joinedthe Physical Therapy Department, Des MoinesUniversity, in 2013, as a Faculty Member, after herpost-doctoral training in the School of Medicine,Division of Geriatrics, at the University of
Pittsburgh. Her primary research interest is the measurement and retrainingof walking skill. Specifically, her work focuses on investigating the controlvariables and tasks that best capture walking skill, and the development andcomparison of gait rehabilitation interventions for older adults with mobilitydisability and persons with Parkinsons disease.
JENNICA BELLANCA received the B.S. degree inbioengineering from the University of Pittsburgh,in 2009, and the master’s degrees in bioengineer-ing and mechanical engineering from the Univer-sity of Pittsburgh, in 2011. She currently worksas a part of the technology integration team atthe Office of Mine Safety and Health Research,National Institute for Occupational Safety andHealth. Her current projects include hazard recog-nition in stone stand and gravel operations, and the
effect of attentional demands on task performance.
SUBASHAN PERERA received the Ph.D. degreein statistics from Kansas State University, in 2000.He was a Biostatistician with the Theo and AlfredLandon Center on Aging and an Assistant Profes-sor with the Department of Preventive Medicineand Public Health, University of Kansas MedicalCenter, and moved to Pittsburgh in 2004. He isa Biostatistician with collaborative research inter-ests in aging. His past research collaborations inaging were in areas of stroke, physical perfor-
mance measures in the elderly, long-term care, bone health, and back pain.He currently serves as the Co-Director and Senior Statistician of the DataManagement and Analysis Core with the Pittsburgh Claude D. Pepper OlderAmericans Independence Center. He has authored over 151 manuscripts inhealth science and statistical literature.
MARK S. REDFERN received the Ph.D. degree inbioengineering from the University of Michigan,in 1988. He is currently the William KeplerWhiteford Professor with the Department ofBioengineering, University of Pittsburgh, withappointments in the Department of Physical Ther-apy, Department of Rehabilitation Science andTechnology and the Department of Otolaryngol-ogy. He conducts research in the areas of humanpostural control, ergonomics, and injury preven-
tion. He has over 120 peer-reviewed publications, 12 book chapters, and over200 proceedings and meeting abstracts.
JENNIFER S. BRACH received the B.S. degreein physical therapy from East Carolina Univer-sity, in 1992, the M.S. degree in physical therapyfrom the University of Pittsburgh, in 1994, and thePh.D. degree in epidemiology from the GraduateSchool of Public Health, University of Pittsburgh,in 2000. She was a Post-Doctoral Scholar of AgingResearch with the Department of Epidemiologyand the Division of Geriatric Medicine with theUniversity of Pittsburgh. She is currently an Asso-
ciate Professor with the Department of Physical Therapy, University ofPittsburgh, Pittsburgh, PA. Her research interests include examining thecontributors and consequences of abnormal gait in older adults and devel-oping and testing taskspecific motor learning exercise programs to improvewalking in older adults. She was the first nonphysician recipient of theprestigious Paul B. Beeson Career Development Award in Aging from theNational Institute on Aging, the American Federation for Aging Research,The Atlantic Philanthropies, and The John A. Hartford Foundation. She wasalso a recipient of the American Geriatric Society New Investigator Awardin 2005.
VOLUME 4, 2016 2100111


![STRIDE-based Threat Modeling for Cyber-Physical Systems · STRIDE-based threat modeling can be performed in two possible ways [22]: (i) STRIDE-per-element and (ii) STRIDE-per-interaction](https://img.pdfslide.net/doc/110x75/5ec0069865be937c564c10b3/stride-based-threat-modeling-for-cyber-physical-systems-stride-based-threat-modeling.jpg)


![EKF Estimation of Stride Width from Individual IMU-based ... · determining individual stride metrics (e.g. stride time, stride speed, foot clearance, stride length, etc.)[9][1],](https://img.pdfslide.net/doc/110x75/5ec0069b65be937c564c10bb/ekf-estimation-of-stride-width-from-individual-imu-based-determining-individual.jpg)