Embed Size (px)
Citation preview

Final
Extractive Industry and Sustainable Regional
Development
REPORT
Western Australian Regional Development Council
June 2010

Syme Marmion & Co June 2010 Extractive Industries & Sustainable Regional Development Final Report Version Control
Disclaimer
Syme Marmion & Co reports and advice are either of a general nature, or for specific circumstances. Syme Marmion & Co is not liable for any loss or damage incurred by any person relying on such reports or advice, except where they are created by Syme Marmion & Co expressly for that person.
Nothing in these terms shall be taken as excluding, limiting or modifying any term, condition or warranty implied by any applicable act of parliament that cannot be so affected. To the extent that such a term, condition or warranty is implied, the liability of Syme Marmion & Co for breach of that term, condition or warranty is, where permitted, limited at the option of Syme Marmion & Co, to:
• the supplying of the relevant goods or services again; or • The payment of the cost of having the relevant goods or services supplied again.
Version Control
Document History and Status
Issue Status
Issued To Qty Date Reviewed Approved
1 Issued to Steering Committee electronic 2010 PS JS
File Name: P0857 Extractive Industries
Author: Syme Marmion & Co
Client: Western Australian Regional Development Council
Name of Document: 0857 Extractive Industries – Background Report
Document Version: Final Report
Project Number: P0857

__________________________________________
Syme Marmion & Co June 2010 Extractive Industries & Sustainable Regional Development Final Report Executive Summary
Extractive Industry and Sustainable Regional Development Introduction This study into the relationship between community sustainability and the extractive industries has been prepared for the Regional Development Council at an interesting point in Western Australia’s resource development. The growth of the Western Australian resources industry from 1998 to 2008 barely paused with the impact of the global financial crisis and in 2010 demand for oil, gas and minerals is again growing. Importantly, the demand is supported by projections for increased production that is catalysing growth in the State’s Northwest and Midwest. The report is in three parts: Executive Summary, Report and Appendices. The Report describes the diversity of the extractive industries in Western Australia by looking at:
• Western Australia’s historic approach to mining and community development, • The response to changes in technology and lifestyle expectations of the workforce • Current investment policy frameworks (both public and private) • Issues of significance for Government at local, State and Federal levels. • Best Practice in terms of sustainable development and community investment through:
o the adoption of internationally recognised mechanisms for benchmarking the quality and efficiency of such investment by companies
o the commitment of companies in the extractive industries to corporate social responsibility principles and investment in community development
o current community capacity to identify and respond to local needs The Appendices provide:
• A geographic and demographic context locating mining and communities in Western Australia • Examples of international practice and local best practice • A discussion of community sustainability in the Western Australian context • A spreadsheet detailing available information relating to the value and extent of corporate social
programmes by major companies in Western Australia’s extractive industries Please note that the regions referred to throughout the Report are as defined by the State Government’s Regional Development Commission boundaries. Executive Summary The building of sustainable communities in the regional and remote areas alongside the extractive industries, in Western Australia is complex requiring capacity to deliver physical infrastructure able to withstand the rigours of the climate and social infrastructure at a standard commensurate with suburban Perth. To achieve this outcome, government at all levels, the extractive industry sector and the community itself, need to focus and co ordinate their collective commitment to planning and investment around the following key elements:
• Scale, or a critical mass of population in at least one location in a region, able to drive demand for economic and cultural growth
• Well planned communities suited to the local climate with high quality public open spaces • Regular, affordable transport options to the capital city and other regional centres • A good communications network that overcomes many disadvantages of distance • Well maintained service infrastructure supplying power, water, waste management and roads • Education, career and employment opportunities that enable families to remain resident long term • The design of appropriate housing options, affordable within the local economic context

__________________________________________
Syme Marmion & Co June 2010 Extractive Industries & Sustainable Regional Development Final Report Executive Summary
• Public facilities and range of community services including childcare and support for seniors • Health and social services, particularly maternity and emergency services • Policies underpinning strong support for local small business growth and economic diversity
In Western Australia, regional cities are supported by multiple industry sectors together with an ancillary small business base; by contrast, regional towns are often dominated by one industry, or major employer, and have limited community services, education and employment options. Although historically, some single focus towns in WA have proved resilient, those within reach of a regional centre or a major industrial hub stand a better chance of remaining sustainable. The cities and towns currently experiencing real growth based on mining activity, as opposed to short term increases in population related to construction, either have most elements of sustainability already or are working with extractive industry partners to increase capacity1. Due to lifestyle or location, these cities and towns are becoming the population centres supplying the extractive industries and, they are no longer exclusively in remote areas. Fly in/fly out (FIFO) programmes now enable people to work in remote places but live in well serviced suburbs, a factor that has been a major driver of urban growth on the coastal strip south of Perth and likely to be replicated in the Mid West where economic studies for the City of Geraldton Greenough confirm that, following amalgamation, it now has a similar community profile to suburban Perth. The current population of 37,500 is able to sustain a full range of community infrastructure and services with housing approvals rising strongly in the December 2009 quarter. FIFO programmes have proved to be an effective way to accommodate the increase in demand for workers in the Pilbara and now supply a large proportion of the projected 40% increase in construction workers by 2014. Personnel numbers are calculated to reduce after that date as the operational workforces are smaller, but the option to commute will remain popular with many long term employees and their families, due to :
• The cost (relative to Perth) of buying or building a house in the North West • A mining economic mono culture with a wages and conditions structure that makes it the “employer of
choice” in that communnity which tends to restrict small business development and reduce employment opportunities for partners of mine workers
• Poor delivery and continuity of community development programmes exacerbated by short term contracts in the public service and private sector
• Education and training opportunities that do not compare with Perth • Lack of maternity services and labour wards in the North West • Low levels of public infrastructure, community services and amenities, particularly childcare
The Chamber of Minerals and Energy (CMEWA) stated at the end of 2009 that it welcomes the development in the Pilbara of “modern higher density centres which are supported by facilities and services we take for granted in metropolitan areas”, but this will not be easy to achieve. Naturally, the established towns in the North West have expectations of growth, but a wide ranging feasibility study undertaken by those with specialist expertise of the development of remote area towns will be important to assess the potential of each contender. There hare already signs that this is starting to happen as, for instance, the signing of a Memorandum of Understanding2 in 2009 between WA and the federal Regional Development Australia initiative3 recognising the imperative for detailed forward planning and setting up a forum for co operation between State and Federal agencies. This has been followed by the launch of four new regional planning committees for the North West by the WA Planning Commisison. Both these committees will need, as a priority, to address the following:
• The lack of well credentialled regional planning studies 1 Karratha 2020, Hedland Today and Newman Tomorrow Strategic Plans plus the Pilbara Plan
2 www.minister.infrastructure.gov.au/mm/.../mm028_2009.htm
3 www.rda.gov.au/about_the_rda_network

__________________________________________
Syme Marmion & Co June 2010 Extractive Industries & Sustainable Regional Development Final Report Executive Summary
• High construction costs for urban infrastructure due to location, climate and harsh conditions • Additional costs imposed by building to cyclone standards • Transportation costs for construction materials • Physical geography – topography and soil conditions – that affect the cost and provision of power,
water and waste management services as well as potential for local supplies of fruit and vegetables A System of Quantified Contributions to Community for WA A key requirement of this study is to determine how sustainability can be improved in affected regional and remote community and, in particular, ways in which contribution levels in the extractive industries may be regulated and increased, possibly through the application of a formula or quantum levied on extractive industry companies. While consultation for this study confirms that, while the industry as a whole is not opposed to reform of current arrangements with State and Federal Government, they feel it is important to to acknowledge, promote and encourage the current atmosphere in which discretionary corporate contributions are the “custom and practice”, and to consult widely in order that the current complex situation is well understood. Changes seen as an hypothecated tax, earmarked for a particular purpose, are not viewed favourably and initiatives which are other than the current accepted “formula” taxes such as Company Tax, Income Tax, GST etc will need careful construction. In the course of this study we have become aware that the industry comprises an enormous number of variables making the development of an effective formula for contributions difficult, extremely complex and impossible to sustain. From the industry point of view, conditions change rapidly as global price fluctuations, weather and geological conditions affect operations and, there is a long lead time before production commences during which time the company will have made a significant capital outlay for no return. Consultation with industry and community stakeholders confirmed that every community has different needs making a. “One size fits all” approach unworkable. They point out that:
• The background of the extractive industries in WA, particularly the company towns, has resulted in complex, long term relationships with local authorities set up following “normalisation”
• Money may not always be the most beneficial form of contribution • Current CSR programmes are tailored for each community or sector of interest and include local
government and the non government sector • The growth of volunteering and the “matched giving” programmes developed by most of the larger
international companies demonstrates an increase in personal as well as corporate responsibility for community sustainability.
• The background of disadvantage in indigenous populations is being addressed in a number of ways including apprenticeship schemes and industry supported tertiary training courses that result in a job
• They wish to retain their ability to offer corporate sponsorship at their discretion, some of which may not be directed at the local community but at the state and national levels
Apart from the legislative requirements of installing a new formula, or quantum, for contribution by the extractive industries, this response indicates that such an approach would not be supported. However, research does indicate the need for a system of contributions in which all players, not just those who do so voluntarily, are required to pay a fair share of local community costs in their area of operations. This presents a strong case for the payment of local government rates by all commercial operations in whatever industry, making full use of an established mechanism designed to ensure that everyone contributes to the costs of maintaining, improving and sustaining infrastructure and services in their community. Where an extractive industry company had been required to pay correctly assessed local rates, we were informed that this action

__________________________________________
Syme Marmion & Co June 2010 Extractive Industries & Sustainable Regional Development Final Report Executive Summary
had not reduced their level of corporate support and discretionary contributions to the local community or affected ‘in kind’ co operation with the Shire. Consultation with the industry provided us with information relating to extent and value of contributions made by companies with whom we spoke or who publish relevant data on their websites (see Appendix E). And, while is clear that corporate social responsibility (CSR) is a core operational policy and an integral element of project development, assessment and operation for major companies, it is not a regular or funded aspect of most smaller miners who will have fluctuating levels of contribution dependant on individual interests, profit margins and operating costs. The spreadsheet shows that many of the larger CSR programmes have a broad focus, well beyond the local community, supporting state and national bodies over a wide range of activities. In these cases, the actual direct benefit to a community close to its mining operations is unlikely to have the same level of effect on local sustainability as payment of Shire rates. The Shire of Leonora, whose actions have highlighted the potential for proper rating set out in the Local Government Act 1995, further reported that the additional income thay have raised has necessarily resulted in a reduction in Financial Assistance Grants (FAGs) from the Grants Commission, but that this is outweighed by increased capacity and therefore, improved sustainability. They have gained financial flexibility and a better understanding of their position in negotiations with extractive industry companies. Local Government Rates In response to the State Agreement Act Rating Clause Study 2009, the State Government declared that rates exemptions will not be part of future State Agreements and commenced a process to remove rates exemptions where a variation to an existing State Agreement is negotiated. The widespread misunderstanding that mining companies are exempt from rates, or that the only applicable rate is the minimum rate on unimproved land (UV), has acted to limit the income of some Shires. This has been clarified by amendments to the Local Government Act 1. State Agreements Major extractive industry projects which are the subject of a State Agreement have been, in many cases, exempt from payment of local rates. The WA State Government will now implement a policy that excludes rates concession clauses from future State Agreements and removes the clause from current State Agreements on a case-by-case basis, that is, when a need to vary the the original agreement arises.4 2. Differential Rates The Local Government Act 1995, provides for the imposition of a differential rate within a local authority area in compliance of its statutory obligations. In 2007 the Shire of Leonora successfully approached the Minister seeking approval to impose a differential rate on unimproved land held by mining leases (miing tenements) as opposed to that held for pastoral use. 3. Spot Rating – Capital Improvements and GRV Capital improvements, including accommodation camps, buildings and production facilities, on mining leases can also be spot rated, in order to obtain a gross rental value (GRV) rate. The advice from Landgate – Property and Valuation is that where a market valuation is unobtainable due to the remote location, it may be substituted using an “assessed value”, set at 5% of the capital value of land and fixed improvements.
4 Letter to WALGA from Colin Barnett, Premier and Minister for State Development 16th December 2009

__________________________________________
Syme Marmion & Co June 2010 Extractive Industries & Sustainable Regional Development Final Report Executive Summary
Benchmarking Systems In researching mechanisms for a quantifiable system of community contribution for the extractive industries, we noted that the voluntary commitment to community development by the sector is high. The majority of international extractive industry companies subscribe to the International Council on Minerals and Mining (ICMM) principles of sustainable development, published in Australia by the Minerals Council of Australia.5 These companies refer to corporate social responsibility (CSR) as “the social license to operate” and believe that support given to the community also helps the company to achieve its goals. It is seen as a way to demonstrate corporate values and an integral component to strategy and the corporate business model6. To meaure the impact of their CSR programmes, similar evaluation programmes, performance indicators and benchmarks are used that also measure corporate governmance and risk management. These figures are published annually as international industry indices by accredited providers7, to give an overall comparative picture of company performance, including community sustainability. If applied to the extractive industries in WA, an extension of this system has the potential to set and track community investment standards for all public companies in the sector through a process of disclosure8. Corporate Social Responsibility and Community Sustainability (CSR) The scale and variety of CSR progammes varies according to a company’s size, experience, guiding principles and community circumstances. While the commitment by large international extractive industry companies to the principles of social responsibility is not in doubt, this level of commitment may not permeate down to all the smaller mining entities. Industry Approaches to Corporate Social Responsibility Policy We found differences in approach to CSR in the extractive industries usually related to the scale of the company. Companies with a global profile understand corporate social responsibility as an integral element of their corporate plan, contributing on both national and local levels. They are likely to include:
• Support and training for indigenous applicants and remote communities in mining areas • Sponsorship of national cultural institutions and major sporting events, WA State initiatives and local
community activities of all kinds • Initiatives that contribute to the well being of employees and their families, which may include locations
from which a significant number of FIFO empoyees have been recruited • Philanthropic foundations set up to exist in perpetuity for the benefit of an affected community • In kind initiatives such as the grading of gravel roads, provision of infrastructure or materials, including
participation by the local extractive industry workforce during company time • Matched giving programs that support voluntary contributions of time or funds raised by employees • Partnerships with local government to improve capacity, strategic planning and service provision that
benefits the local extractive industry workforce and the local community These companies are subscribers to the international benchmarking indices mentioned above, reporting on a range of issues annually, including community development and sustainability. They commission social impact
5 Enduring Value: The Australian Minerals Industry Framework for Sustainable Development.
6 Corporate Community Investment in Australia 2007, Prime Ministers Community Business Partnership, Business Council of Australia and Centre for Corporate Public
Affairs p. viii 7 http://thehub.ethics.org.au
8 Corporate Community Investment in Australia 2007, Prime Ministers Community Business Partnership, Business Council of Australia and Centre for Corporate Public
Affairs

__________________________________________
Syme Marmion & Co June 2010 Extractive Industries & Sustainable Regional Development Final Report Executive Summary
analysis before a new project commences and may share this information with local government, partnering with them on projects, as part of their CSR programme. Consultation with corporate affairs staff of overseas groupings coming into the West Australian extractive industry sector demonstrated that these joint venture partners are well aware of Australian industry “custom and practice”. Their approach is expected to be consistent with “best practice” CSR unless significant changes occur in their operating conditions. Most, in this category pay some local rates under the more recent State Agreements; but expressed concern and a need for information regarding potential removal of rates concession clauses from State Agreements on a case by case basis. Companies with a national profile, and those associated with a locally resident workforce, may have a narrower CSR focus with greater emphasis on in kind contributions or support for particular community groups. This is distributed in a variety of ways: through one off support for key projects, charitable foundations, annual grants, sponsorship of local sport and cultural events and volunteer programmes. The medium sized and junior miners operating in the remote areas of WA are the hardest to quantify in terms of contributions to community. This group is arguably operating with the greatest levels of exposure to the fluctuating global price for their commodity and is focused on returning value to shareholders. Many, particularly those mining in remote areas, claim to have little or no relationship with the local Shire, but the fact remains that they are operating a commercial venture within Shire boundaries and can therefore be expected to contribute at a rate commensurate with other local businesses. The imposition of a differential rate (UV) for mining leases and spot rate (GRV) on capital improvements will enable a fair contribution to the community. This is seen to be separate from other community support, including practical ‘in kind’ contributions to Shire maintenance and roads. Such work has a real value and, as payment of local Shire rates becomes the norm in the extractive industries, may be negotiated in some instances, perhaps even assessed against annual rate payments. Regional Networks Regional planning is the most important forward planning tool in preparation for sustainable communities in the Northwest extractive industry regions. The scale of the region and scarce supply of basic community infrastructure mean that urban populations will coalesce around hubs where such services are available. If successful, these regional centres will eventually be capable of competing with cities in the South West and Geraldton Greenough in the Midwest as bases for extractive industry workers on FIFO contracts. As part of such development, improvements in road infrastructure and transport options will benefit smaller communities, bringing them within reach of community and essential services and contributing to their sustainability. Selecting the regional centres must be the responsibility of specialist planning and take into account the existing locations of:
• Major population centres with a professional local administrative structure • Ports with industrial infrastructure including rail access and multi user access • Places with a strong tourism profile as a result of heritage or natural environment • Infrastructure providing power generation, water supplies and other essential services • Transport and routing intersections that will promote efficient supply and resource sharing

__________________________________________
Syme Marmion & Co June 2010 Extractive Industries & Sustainable Regional Development Final Report Executive Summary
RECOMMENDATIONS
1. Rate regimes should be routinely applied by the local authority to all premises, land and
businesses within their jurisdiction. This includes the development of differential rates on unimproved land and the spot rating of capital improvements to existing and future extractive industry leases with particular regard to alterations and variations to State Agreements on a case by case basis.
• Clarification by the Minister of the responsiblilty of local government to set up and apply a
rating regime that ensures that everyone in the local authority area pays a fair rate. • The understanding by local government of their rights and responsiblities to use the powers
they have under the Local Government Act 1995 as amended in 2009 • The inclusion of the Grants Commission as the assessor of comparable rating levels between
local authorities and the impact of new revenue raised on Commission grants • Retention of a flexible approach that enables local councils to negotiate directly with industrial
and extractive industry companies using the applicable UV and GRV rates assessments as the basis for discussions regarding rate rebates or “in kind” contributions to the community
• Where a local government is disadvantaged by the presence of a State Agreement or new contract for a major project exempting the holder from payment of rates other than UV on land leased, the State Government should be obligated to negotiate an equable arrangement with the local government in restitution for the loss of revenue from rates
2. Creation of a specialist planning group led by State Government but including expertise from
all sectors of government and the private sectors. This group must include a real knowledge of living in and planning for development in remote areas. Responsibilities would include:
• Development of planning criteria to identify the key towns and regional hubs with potential to become the regional supply and residential centres
• Assessment of opportunities and constraints on the construction of essential infrastructure for high density cities in remote regions
• Development of a strategy to plan co operatively with all stakeholders in order to deliver high quality, functional new communities and population growth in the North West of WA
• Set standards for community and social impact analysis to ensure all stakeholders, including State and Federal Government agencies plan appropriately for community infrastructure, facilities and services in identified towns and regional hubs.
• Clarify State Government policy on FIFO workforces and examine the options for FIFO bases closer to the extractive industry regions where the potential exists for an attractive urban lifestyle
3. Improvement of agency co ordination and co operation within State Government
• The appointment of personnel with on the ground experience of living and working in the extractive industry regions to a broad co ordinating role for regional planning initiatives, including the community development social services and the sourcing of social impact studies and information obtained by both public and private sector research
• Review of the potential for the Regional Development Commissions to take on the regional information co ordination role and a liaison role within State Government with regard to the need for increased resources, particularly in regions of strong activity such as the North West

__________________________________________
Syme Marmion & Co June 2010 Extractive Industries & Sustainable Regional Development Final Report Executive Summary
• Invite presentations by local government, regional development commissions and the extractive industries to a regular regional planning and development forums
4. Development of a funded Regional Community Sustainability Policy
• Increase State Government capacity to provide triennial funding for staffing, programming and maintenance of community facilities
• Develop Local Government capacity to prepare strategic plans on an annual basis and to present them at the regional planning forums
• Develop a relationship with an accredited provider to prepare benchmark criteria and implement al reporting structure to track CSR contributions by the extractive industry companies in WA
• At the proposed regional development forum ensure provision for discussion of community development initiatives and the activities of non government agencies
• Require the extractive industries to implement and police a community Code of Conduct for contractors and employees, particularly for the current construction workforces
• Review the amendments to the Local Government Act 1995 and consider the potential impact of such change on rural communities, particularly the Grants Commission FAGs.
5. Develop a Corporate Social Responsibility Tool and Benchmarking Framework
• Work with State and local government, and the CMEWA, to develop suitable benchmarks and a regular CSR reporting framework for extractive industry companies in WA
• Require extractive industry companies operating in WA to sign up to the accredited framework and index.
• Resource the Regional Development Commissions in extractive industry regions to provide support to extractive industry companies seeking to comply with the benchmark reporting framework
6. Consult with the ABS to develop additional social measurements that can more accurately
reflect community life in towns with a high exposure to the extractive industries and FIFO
• Collection of data from real estate agencies that will confirm the actual rental costs per household as opposed to on a per capita basis
• Collection of data that includes caravans and other additional accommodation within family home boundaries to give a true indication of the numbers of people residing there

__________________________________________
Syme Marmion & Co June 2010 Extractive Industries & Sustainable Regional Development Final Report Contents
TABLE OF CONTENTS 1. Introduction 16 1.1 Definition ............................................................................................................................................17 1.2 Aims and Objectives of the Study ...................................................................................................17 1.3 Key Outcomes....................................................................................................................................17 1.3.1 Response to the Brief 18 1.3.2 Background Report 18 1.4 Stakeholder Engagement .................................................................................................................18 1.5 Background to the Study..................................................................................................................19 1.6 Common Positions and Recurring Industry Themes ....................................................................19 2. Mining in Western Australia 21 2.1 The West Australian Mining Industry: A Condensed Overview from Settlement to 2000 .........21 2.2 The Diversity of Extractive Industry Activity in Western Australia ..............................................23 2.2.1 The Company Town 24 2.2.2 Mining Dependent Regional Communities 24 2.2.3 The Impact of Construction Camps 25 2.2.4 Fly in Fly Out 25 3. Changes in Economic Viability and Lifestyle Expectations 26 3.1 FIFO.....................................................................................................................................................26 3.2 Technology.........................................................................................................................................27 3.3 Gender Balance and Accommodation ............................................................................................28 3.4 The Adoption of Mine Closure Best Practice .................................................................................28 3.4.1 The Department of Resources, Energy and Tourism 28 3.4.2 Environment Australia 28 4. Documenting the Policy Framework 30 4.1 Common Aims ...................................................................................................................................30 4.2 Australian Government Policy Framework.....................................................................................30 4.2.1 Commonwealth Department of Resources, Energy and Tourism 31 4.2.2 Regional Development Australia 31 4.2.3 Spotlight Series 32 4.3 Royalties.............................................................................................................................................33 4.3.1 Minerals 33 4.3.2 Oil and Gas 33 4.3.3 WA State Royalty payments and the GST 34 4.4 WA State Government Policy ...........................................................................................................34 4.4.1 State Agreements 34 4.4.2 Royalties for Regions 35 4.4.3 Country Local Government Fund 35 4.4.4 Regional Community Services Fund 35 4.4.5 The Regional Infrastructure and Headworks Fund 36 4.4.6 Regional Grants Scheme 36 4.4.7 The Western Australian Regional Development Council - Strategic Priorities 2008 36 4.4.9 Local Government Reform Process 37 4.4.10 WA State and Local Government Fly in Fly out Policies 37 4.5 Private Sector Policy: Corporate Social Responsibility (CSR).....................................................38 4.5.1 Enduring Value: The Australian Minerals Framework for Sustainable Development 38 4.5.2 The Chamber of Minerals and Energy WA 39 4.6 Investment Trusts and Community Funds .....................................................................................40 4.6.1 Public Sector Investment Funds 40 4.6.2 The Western Australian Community Foundation (WACF) 40 4.6.3 Wagerup Sustainability Fund 41

__________________________________________
Syme Marmion & Co June 2010 Extractive Industries & Sustainable Regional Development Final Report Contents
4.6.4 The Rio Tinto WA Future Fund 41 5. The Way Forward: Systems of Self Reliance and Responsibility 42 5.1 The Payment of Local Government Rates ......................................................................................42 5.1.1 Differential Rates 43 5.1.2 Spot Rates (GRV) 43 5.1.3 The Effect on Corporate Social Responsibility Practices 43 5.1.4 Grants Commission 44 5.2 Benchmarking and Corporate Social Responsibility Policy.........................................................44 5.2.1 Benchmarking Frameworks 44 5.2.2 Reporting Systems 45 5.2.3 Corporate Responsibility Index 45 5.2.4 London Benchmarking Group 47 5.2.5 The Australian Centre for Corporate Social Responsibility 47 5.2.6 Relevance to the Extractive Industries in Western Australia 48 6. Documenting the Extractive Industries Commitment 49 6.1 Tier 1: BHP Billiton, Rio Tinto, Woodside .......................................................................................49 6.1.1 BHP Billiton 50 6.1.2 BHP Billiton Iron Ore 52 6.1.4 Woodside 55 6.1.5 Tier 1: Scope of Corporate Social Responsibility Contributions 55 6.2 Tier 2: Fortescue Metals Group, Wesfarmers Premier Coal, Griffin Coal and Iluka ...................56 6.2.1 The Collie Coalfield: Premier Coal and Griffin Coal 56 6.2.2 Fortescue Metals Group 56 6.2.3 Iluka 57 6.3 Tier 3: International Miners, Multi National Consortia and JV ......................................................57 6.3.1 Newmont Mining 57 6.3.2 CiticPacific 58 6.4 Tier 4: Medium and Small Mining Companies ................................................................................59 6.4.1 Saracen Gold 59 6.4.2 St Barbara Mines 59 6.4.3 Minara Resources 59 7. Current Community Capacity 61 7.1 The Historic Mining Communities ...................................................................................................61 7.1.1 Planning for Mine Closure 61 7.2 Defining Sustainability in Regional WA Communities ..................................................................62 7.3 Building Community Capacity – Local Government......................................................................62 7.3.1 Local Government Amalgamation and Regional Groupings 63 7.3.2 The Effect of Scale 63 7.3.3 Potential for Tripartite Partnerships 63 7.3.4 Application of Differential Rates on Unimproved Land 64 7.3.4 Changes to State Agreements 65 7.4 Identifying Regional Hubs - The Need for Criteria .........................................................................66 7.5 Co ordination Role of State Government........................................................................................67 7.5.1 Regional Development Commissions 68 7.5.2 Regional Co ordination Initiative Stakeholders 68 8. Significant Issues Affecting Communities 69 8.1 Physical Factors ................................................................................................................................69 8.2 Cultural Indicators: Social Factors..................................................................................................69 8.2.1 In Kind Contributions and the Volunteer 70 8.2.3 Aboriginal Engagement – Training and Employment 70 8.2.4 Delivery of Health, Education and other basic services 71 8.2.5 Aged Care 71 8.3 Economic Factors..............................................................................................................................72

__________________________________________
Syme Marmion & Co June 2010 Extractive Industries & Sustainable Regional Development Final Report Contents
9. Planning for Socially Sustainable Communities 73 9.1 Social and Cultural Aspects of Sustainability ................................................................................74 9.1.1 Key Themes of Cultural Sustainability 74 9.1.1 Cultural Planning 74 10. Sustainability: A Community Analysis 77 10.1 A Comparison of Sustainability by Towns* ....................................................................................77 10.2 Criteria for Ranking Communities ...................................................................................................78 10.3 Characteristics of a Sustainable Community .................................................................................81 11. Attraction and Retention of Population 82 11.1 Labour Projection for Regional Area in WA ...................................................................................84 11.1.1 Pilbara Projections 84 11.1.2 Mid West Projections 84 11.1.3 Goldfields-Esperance Projections 84 11.1.4 Perth/Peel Projections 84 11.1.5 Kimberley Projections 84 11.1.6 Gascoyne Projections 85 11.1.7 Wheatbelt Projections 85 11.1.8 South West/Great Southern Projections 85 12. A Case Study Review 86 12.1 The World Bank and the International Finance Corporation ........................................................86 12.2 The World Bank and the International Council on Mining and Metals.........................................87 12.2.1 Adopt a strategic approach 87 12.2.2 Consultation and Participation 87 12.2.3 Working in Partnership 87 12.2.4 Strengthening Capacity 87 12.3 West Australian Community Foundation........................................................................................87 12.4 International Examples .....................................................................................................................88 12.4.1 Teck Cominco Ltd 89 12.4.2 Sullivan Mine, Canada 89 12.4.3 Red Dog Mine, Alaska 89 12.4.4 Antamina, Peru 90 12.4.5 Saskatchewan, Canada 90 12.4.6 Cameco 90 12.4.7 Yanacoda Mine, Peru 91 12.4.8 Cadia Valley Operation, New South Wales 91 12.5 International Trust Funds .................................................................................................................91 12.5.1 The Alaska Permanent Fund 92 12.5.2 The Alberta Heritage Savings Trust Fund 92 Appendix A – Regional Development Commission Area Maps 95 Appendix B – Demographic and Household Characteristics 102 Demographic & Household Characteristics ..............................................................................................102 Hard and Soft Infrastructure 104 Appendix C – Economic & Employment Characteristics 109 Economic & Employment Characteristics .................................................................................................109 Appendix D Infrastructure Benchmarks 114 Infrastructure Benchmarks..........................................................................................................................114 Appendix E Summary of Contributions Table 116

__________________________________________
Syme Marmion & Co June 2010 Extractive Industries & Sustainable Regional Development Final Report 15
Extractive Industry and Sustainable Regional Development
REPORT
Aerial photograph of the Otter Juan Coronet Mine 1, Kalgoorlie by Edward Burtynsky

__________________________________________
Syme Marmion & Co June 2010 Extractive Industries & Sustainable Regional Development Final Report 16
1. Introduction
"As the principal supplier of vital natural resources to wider Asia, our diverse inventory of mineral, petroleum and agricultural products place us at the centre of the economic transformation taking place in the ‘Asian century'." 9 The extractive industries sector is a major component of both State and Commonwealth economies. The value of mine production more than doubled in 5 years from $55 billion in 2002-03 to an estimated $113 billion in 2007-0810 (ABARE 2007). And it is poised to grow even more with China predicted to require more iron ore in the next four years than Western Australia has produced in its entire history. However, the impact, both positive and negative, of this growth is disproportionately distributed across the country in the resource rich States of Queensland and Western Australia. “In the 6 months to April 2007, two thirds of completed major mining projects and three quarters of capital investment nationally were in these States. In this period:
• More than half of the advanced projects and nearly 90% of the capital expenditure on metal mining projects were in Western Australia.
• 70% of advanced energy projects and over 85% of capital expenditure on these projects was in Western Australia and Queensland” (ABARE 2007)11
Although the influence of the extractive industries affects the national economy and global markets, the focus of this study is close to home affecting the long term sustainability of regional cities, rural towns and remote communities in the State’s mining regions. The current growth in the resources industry requires a review of regional strategic planning and, in May 2009, the WA State Government responded to this imperative with the establishment of four new regional planning committees in the North West by the WA Planning Commission Most major extractive industry companies operating in Western Australia formally acknowledge that they have a responsibility for the impact of their operations on local communities. This view is guided by ten principles for sustainable development adopted by the International Council on Minerals and Metals (ICMM) in 2003, through which the industry commits to deliver value to shareholders and to the communities in its sphere of influence. The Minerals Council of Australia, in the introduction to its operational manual, “Enduring Value, the Australian Minerals Industry Framework for Sustainable Development”, talks about “a social license to operate as a complement to the regulatory license issued by government.”12 The majority of Western Australia’s mining output is controlled by a small, highly experienced, group of international companies who subscribe to these principles. Understanding that the business case for corporate support and contributions to communities is also a key driver, they have put policies and programmes in place that address issues of sustainability, employment, education and training, community health and safety, the natural environment and economic development that may serve as an example to the industry as a whole. This study investigates the potential for improving community sustainability in regions affected by the extractive industries sector through a more quantifiable system of contributions to community as well as other alterations to the way in which business in conducted at the local level.
9 Michael Chaney, speaking at the ‘In the Zone Conference” University of Western Australia, Perth October 2009
10 Fiona Haslam McKenzie, David Brereton, Christine Birdsall Jones, Rhonda Phillips and Steven Rowley, 2008 “A Review of the contextual issues regarding housing
market dynamics in resource boom towns”
11 Fiona Haslam McKenzie, David Brereton, Christine Birdsall Jones, Rhonda Phillips and Steven Rowley, 2008 “A Review of the contextual issues regarding housing
market dynamics in resource boom towns
12 Minerals Council of Australia 2004 “Enduring Value, The Australian Minerals Industry Framework for Sustainable Development”
__________________________________________
Syme Marmion & Co June 2010 Extractive Industries & Sustainable Regional Development Final Report 17
1.1 Definition
The Brundtland Commission defines sustainable development as being where development meets the needs of the present without compromising the ability of future generations to meet their own needs. To extrapolate, this means that investment by the mining industry should be financially profitable, technically appropriate, environmentally sound and socially responsible.
1.2 Aims and Objectives of the Study
The Western Australian Regional Development Council (WARDC) has funded this study to investigate ways to benchmark contributions to sustainable community development made by companies in the extractive industries at both local and regional level. The broad aim of the study is:
• To determine the extent to which a mine or resource industry operation may contribute to the sustainable development of the communities that they affect; and
• To assess the capacity of local government to identify and prioritize sustainability issues, and negotiate effectively for facilities and programmes that contribute to community sustainability
The central objectives have been:
• To research the capacity of local government and community administrators to identify what is needed for the community to become more sustainable, prosperous and self supporting;
• To understand the opportunities and constraints faced by mining companies when they commence negotiations with a local government or community
• To identify a benchmarking system that can measure the performance of extractive industry companies undertake corporate social responsibility programmes
• To develop recommendations for increasing the capacity of communities affected by the extractive industries to identify and prioritize their core community needs
• To increase awareness at state government level of the need for co coordinated planning that is informed by regional bodies and local government.
The study:
• Provides a comprehensive statistical picture of mining activity in Western Australia • Discusses the capacity of local government authorities in the extractive industry regions, including the
capacity of local government in the affected regions to identify and negotiate appropriate contributions from the extractive industries
• Researched the question of an appropriate quantum or investment formula for corporate contributions to affected communities that is separate from royalty payments, and
• Indicates a recommended approach to benchmarking of corporate social responsibility contributions and/or measurement of community sustainability initiatives
1.3 Key Outcomes
While an investigation into whether it is possible, or desirable, to establish a regulatory framework for community contributions by the extractive industries in WA has been central to this study, it has also examined the current approach to sustainability in remote areas and the capacity of local government to plan for growth. At a time of unprecedented industry expansion, it has been timely to look at the future of communities in the Northwest in particular, the potential for strategic partnerships between government at all levels and the extractive industries as well as the need for regional planning initiatives able to assess the potential for

__________________________________________
Syme Marmion & Co June 2010 Extractive Industries & Sustainable Regional Development Final Report 18
contemporary high quality residential communities in remote Western Australia. Government initiatives in the course of this study, including the establishment of four new regional planning committees by the WADC and the “fast tracking” of current development projects, together with the signing of a Memorandum of Understanding with the Federal Government to improve co ordination and reduce overlapping responsibilities, demonstrates that this report supports and informs current government concerns. Syme Marmion & Co has been commissioned to undertake Stage 1 of this study which is presented in two parts: 1.3.1 Response to the Brief
• Document the public and private policy positions that may be attracting or impeding investment by the extractive industry companies in the area of sustainable regional and community development
• Map the current situation and major corporate, government and community organisations involved • Outline the current capacity of local government to identify and prioritise community needs and the
ways in which the extractive industry companies are already addressing this problem • Envision pathways for future investment by current and new stakeholders entering the industry, with
reference to State and Federal Government initiatives including Royalties for Regions, forthcoming alterations to local government, and possible future public/private sector partnerships
• Present brief case studies and best practice strategies from Australian and global organizations together with an overview of selected private sector policies and programmes already in use
• Identify State Government legislation and state resource agreements that may need to be amended 1.3.2 Background Report
• Describes the geographic, demographic and investment context by mapping the locations of mineral extraction operations in WA in the context of regional communities that host or support the mining and the handling, transportation and processing of minerals (including oil and gas).
• Document the economic, social and cultural drivers that enable regional cities, towns and communities to sustain their population and quality of life by mapping the status of health, educational and related services, consulting local government on the vitality of service clubs and sporting bodies and therefore the satisfaction of the residents with their lifestyles.
• Provide a background paper on community development and the issue of sustainability
1.4 Stakeholder Engagement Consultation has been undertaken with key personnel in major extractive industry companies operating a CSR policy together with stakeholders in selected regional centres, including local government and community representation. Regular reporting has been maintained with the Regional Development Council (WARDC), primarily through the Goldfields Esperance, Pilbara and Midwest Development Commissions. We have conducted interviews with the following:

__________________________________________
Syme Marmion & Co June 2010 Extractive Industries & Sustainable Regional Development Final Report 19
Rio Tinto Woodside Energy BHP Billiton – Newman and Port Hedland Alcoa Chevron Griffin Coal Iluka Wesfarmers Premier Coal Fortescue Metals Group CiticPacific Mining KCMG Kalgoorlie Newmont Mining Saracen Gold Ngarluma Yindjibarndi Foundation Yaandina
Pilbara Chamber of Commerce and Industry Karratha Chamber of Commerce and Industry Indigenous Business Network, Port Hedland City of Kalgoorlie Boulder City of Geraldton Greenough City of Port Hedland Shire of Leonora Chamber of Minerals and Energy WA Landgate WALGA Pilbara Regional Council Dampier Port Authority Jan Ford Real Estate Port Hedland Well Women’s Centre Port Hedland Pilbara Development Commission Midwest Development Commission Goldfields Esperance Development Commission
1.5 Background to the Study Some basic statistics that led to the commissioning of this study by the WARDC, including population changes and labour demand generated by the minerals and energy sector for each development commission are:
• In 2008, the mining and petroleum sectors contributed 89% ($74.65 billion) towards the total Western Australian merchandise exports, while the Western Australian proportion of the national figure was 41%. This is expected to increase further in the next few years with Australia exporting to China more iron ore than it has produced in total
• For the 2007-08 financial year the Western Australian gross state product was $146,444 million, of which the mining component was 29%.
• The total output of the minerals and energy sector in Western Australia for 2008 was over $70,000 million while the national output for this sector was approximately $115,000 million.
• Royalty income for Western Australia in 2009 – 2010 is expected to be $2,577 million with iron ore expected to account for over 80% of that income.
• At the time of the 2006 census, 5% of the working population of Western Australia worked directly in the mining industry and 9% was involved in the construction industry, with associated involvement in major project development.
1.6 Common Positions and Recurring Industry Themes Themes to emerge from desktop research and stakeholder consultation are as follows:
• In contrast with many other countries in which multinational companies with mining interests operate, Australian enjoys a high degree of civil society, education and democracy. www.commdev.org
• Until recently, the needs of indigenous people in the mining regions have been primarily dealt with through individual State Agreements and private “in confidence” negotiations between the miner and affected indigenous groups. These confidential arrangements do not form part of this study although training and employment programs funded through corporate social responsibility (CSR) policies do.
• The large national and international mining companies operating in Western Australia are committed to corporate social responsibility (CSR) principles and most have active programmes. www.icmm.com/our-work/sustainable-development-framework

__________________________________________
Syme Marmion & Co June 2010 Extractive Industries & Sustainable Regional Development Final Report 20
• The nature of mining, as a transient, high risk and often marginal activity, is not well understood by the public and perhaps, not communicated well enough by mining companies to local communities
• Statistical information and growth projections are not always in line with the actual situation or time frames for development in regions experiencing rapid growth and may not therefore provide accurate information on which to base forward planning for infrastructure, facilities and community services
• The capacity of small townships and rural local government to undertake strategic planning, or other measures that will help development a good relationship with a mining company, or access public funds, is necessarily limited by available staff, resources, skills and funding.
• There is a need to increase the capacity of local government to understand and evaluate the needs of its community.
• Short term regional placements, in public, private and non government sectors, contribute to gaps in regional expertise and service delivery.
• The establishment of a representative regional development body would be well received by local government and the private sector.

__________________________________________
Syme Marmion & Co June 2010 Extractive Industries & Sustainable Regional Development Final Report 21
2. Mining in Western Australia
2.1 The West Australian Mining Industry: A Condensed Overview from Settlement to 2000
Collie Coal Mine, The First Shaft, c. 1880s. [1175B/2]
Mining in Western Australia has come a long way since the first shafts were sunk in the 1880’s, to find coal. By 1894, the discovery of significant deposits of gold had caused rapid growth in mining and the Department of Mines was created, sending Mining Registrars and Mining Wardens to the various mineral fields including Cue, Kalgoorlie, Ravensthorpe, Marble Bar, Northampton, Southern Cross and Yalgoo. The Department of Industrial Development was created in 1937 to coordinate major resource development projects within the State and improve utilisation of the State's natural resources (including mineral resources). This department was responsible for agreements between the State of WA and each individual mining company concerning the development of projects13 that, apart from the survey work mentioned above, has been conducted almost entirely by the private sector. The relationship between the industry and the WA State Government generally has been simple, through the granting of mining leases and collection of royalties. The first substantial flow of oil in Australia was in 1953 from the Rough Range No. 1 well in the northwest of WA but did not lead to a commercial operation. Exploration of this resource was not pursued with urgency until the oil price shocks in the 1970’s changed the economics of the industry. At this point, expenditure on petroleum exploration increased rapidly, from $49 million in 1976 to $948 million in 1982. Meanwhile, growth in ore mining slowed due to rising costs although gold mining was sustained by the floating of the gold price in 1968, rises in the late 1970’s coinciding with the increase in the oil price and the development of new equipment and methods for recovering low grade gold and retreatment of old tailings that enabled 24 new gold mines to open and production to triple by 1985. The rest of the industry, responding to increased global demand for iron ore adopted the new equipment and together with major changes to work practices, lifted its efficiency and production to become the current industry model. The three major factors key to development of the extractive industries in Australia are:
13 www.sro.wa.gov.au

__________________________________________
Syme Marmion & Co June 2010 Extractive Industries & Sustainable Regional Development Final Report 22
• The use of aircraft to carry out systematic large scale accurate geological surveying by the Bureau of Mineral Resources in 1946
• The country’s political stability, which led to an influx in the early 1960s of major overseas mining companies bringing in exploration funds, new expertise and ideas
• The Commonwealth Petroleum Search Subsidy Act, 1957 which helped overseas companies as well as local ones to explore onshore and offshore sedimentary basins in Australia and led to the discovery of most of today’s crude oil reserves.
The 1990s was a period of consolidation with a focus on movement towards ‘globalisation’ and diversification. From a corporate perspective, the Australian mining industry grew beyond being a large national sector into a world player with more than 40 fly-in/fly-out mining operations. Western Australia became the nation’s leader in petroleum production in 1996 and by 2000 petroleum supplied 50% of our energy needs, a figure that is expected to rise to 60% by 2010 with the major increase in natural gas.14
www.abareconomics.com/.../energy_08/ME08_Oct.jpg
14 Adapted from:
“The Australian Mining Industry: From Settlement to 2000” (Oct, 2000) Bill McKay, Ian Lambert and Shige Miyazaki from the Australian Geological Survey Organisation1
(AGSO)
http://www.abs.gov.au/ausstats/[email protected]/

__________________________________________
Syme Marmion & Co June 2010 Extractive Industries & Sustainable Regional Development Final Report 23
2.2 The Diversity of Extractive Industry Activity in Western Australia The map on the previous page, produced by Abare Economics, demonstrates the diversity of minerals extracted and the spread of locations demonstrates the breadth of the mining spectrum in Australia WA has some of the largest open cut mines in the world with high quality ore bodies requiring simple extraction, shallow sand mining operations for ilmanite, rutile and other metals that extends across the landscape in parts of South West WA and deep shafts requiring skilled underground operations. The Super Pit in Kalgoorlie is set to be surpassed as the largest “hole in the ground by the resurgent Boddington mine that reopened in early 2010. The massive scale of iron ore mining in the Pilbara, epitomised by the Mt Whaleback mine at Newman and the rail infrastructure stretching to Port Hedland, is set to be paralleled by the new magnetite mines in the Mid West and NW and dwarfed by multi billion dollar oil and gas projects off the coast of the NW of WA, announced in 2009 and 2010, since the map above was produced.
While there have been big changes in mining the extractive industry’s exposure to risk remains, together with the way in which it affects local communities. Development associated with mining forges a dependant relationship with the local community that makes them unsustainable. Towns like Marble Bar, Ravensthorpe and Newman are all reliant on the fortunes of adjacent mines. The construction of company towns like Newman, located next to the giant Mt Whaleback mine created a community where families moved to a remote town for perhaps their entire working life and even today, it is hard to predict that a town with such a single industry focus can survive once the ore bodies in the region are exhausted. Changes in the industry have meant that these towns are mostly ‘normalised’ with a local authority and most houses privately owned. Rents are high, reflecting demand and the high rates of pay at the mine. Like other similar towns such as Port Hedland and Kalgoorlie Boulder, Newman has become a hub for contractors and services used by mines operating in the broader region. In order to meet the expectations of contemporary families, the ex company towns remain dependant on the extractive industries to provide, or assist with the provision of community facilities and services regarded as part of WA’s standard of living. The original companies are usually still the major employer and continue to support the community as part of their corporate platform of investment and in the knowledge that rate exemption clauses in most of their State Agreements restrict the ability of the local authority to levy rates. To date, only the City of Kalgoorlie-Boulder has emerged from the natural growth of the extractive industries, amalgamating to achieve the population, scale and diversity with sufficient resilience to weather the ups and downs of the economic cycle.
Top: Mt Whaleback, Newman WA Below: The Comet Mine, Marble Bar
Signpost at the derelict town of Kookynie, which once had a population of over 7,000 people

__________________________________________
Syme Marmion & Co June 2010 Extractive Industries & Sustainable Regional Development Final Report 24
2.2.1 The Company Town
Newman, in the Pilbara, epitomises the mining company town of the 1960’s Work practices were highly unionised, the company owned everything and everyone took part in a DIY community activities. Volunteering was expected making Newman largely a self sufficient community. In the 1970’s the Shire of East Pilbara “purchased” Newman from BHP for $1.00. The new authority placed a value on homes and invited residents to purchase them. Subsequent increase in demand for iron ore coupled with a National Competition Policy has changed work practices introducing work rosters and a 24 hour shift system. Many employees have become contractors or sub contractors, working longer hours but for much higher rewards. Newman
has changed and housing values have skyrocketed. BHP, still the major employer in town, has partnered with the Shire of East Pilbara to produce a strategic plan for the future, Newman Tomorrow and with the YMCA to develop a much needed child care centre.
2.2.2 Mining Dependent Regional Communities
In the South West of WA the communities of Boddington and Ravensthorpe have both weathered the rapid changes in local fortunes associated with mining. In Boddington, demand for gold has resulted in the reopening and expansion of the gold mine, now set to surpass the Super Pit in Kalgoorlie. The proximity of the mine to the town site and the ‘buy local’ policies of the management mean that the community is looking forward to a sustainable future in which agriculture and other business ventures will be sufficiently developed to support the community when the mine closes. Gold, copper and nickel have been mined in Ravensthorpe, an equally close knit farming community, since 1898 and, more recently, the Galaxy Mine has opened up an important source of lithium, but the start up and subsequent closure of the A$2.4 billion BHP Billiton Ravensthorpe Nickel mine, processing and packaging plant shook community confidence. The good news is that the mine will be re opened by First Quantum Minerals Ltd, a Canadian miner, who intends to operate it for its expected life of 32 years. The Ravensthorpe experience reinforces the finding of this study, stressing the importance of planning, social impact studies and expert local knowledge in determining the risk factors
as well as the potential for sustainable development of a small rural community close to a mine. In the context of Ravensthorpe it raises two questions:
• Whether it is wise to invest in communities under a certain size or better to support a greater range of services and facilities in the regional hub
• That a comprehensive risk management study including social impact studies is mandatory for approval for a mine to commence operations

__________________________________________
Syme Marmion & Co June 2010 Extractive Industries & Sustainable Regional Development Final Report 25
2.2.3 The Impact of Construction Camps
Public perception in the North West sees the company with its name on the project as responsible for the social and environmental impact of construction camps and worker behaviour. Remarks made to us during consultation indicated that the impact of construction workers on community infrastructure is an area requiring discussion between local government and the extractive industries, particularly given that new camps now in planning for the Pilbara will be much larger than any built so far and probably remain in place until 2014. Although the extractive industry companies point to the self sufficiency of their camps and the significant differences between the shorter term construction workforce and the smaller, operational workforce that will follow, they must still take responsibility for the inevitable incidents that will occur and put protocols in place. In a contrary view put forward in response to a survey of small communities in the Goldfields, respondents claimed that the self sufficiency of the camps is a negative one for small communities who need the economic boost of the mine and its workforce. They argue that it is important that employees and contractors participate as much as possible in the life of the community and policies that favour local employment, services and suppliers are essential to sustainability of the towns. “A business owner in Mount Magnet claimed that ‘75 per cent of the mines around Mt Magnet are now fly in/fly out, meaning that there are decreasing numbers of people living in the town, therefore many services have closed”’.15 “Most of the businesses surveyed received less than 20% of their trade from the mining industry. In Cue, mining contributed to less than 5% of their trade. The type of trade is selective with most goods and services purchased out of town. The grocery shop makes $40 per day with the sale of newspapers to the mine.” 16 2.2.4 Fly in Fly Out
Originally developed to supply the rapid increase in the workforce resulting from shift work and continuous operation, FIFO progammes have contributed to the growth and prosperity of regional cities and towns in WA far away from the extractive industry regions such as Mandurah and Busselton. The need for workers to commute by air has benefited local government, regional airports and increased internal air services in Western Australia. Further expansion of recruitment interstate has established new interstate routes within Australia. By extension, FIFO is creating a truly mobile workforce in which workers (and particularly those with specific skills) are able to transfer from one workplace to another easily within the country and overseas. The Chamber of Minerals and Energy WA (CMEWA) believe FIFO workforces have also contributed to the industry in other ways, enabling the development of some mines in remote and unpopulated locations that would otherwise have been uneconomical and contributing to a smaller environmental footprint. Certainly the pre fabricated nature of the accommodation makes it easier, faster and cheaper to remove than a permanently constructed town site. And, for long term extractive industry operations FIFO has become a fixture, boosted by the focus on occupational health and safety that now prefers workers do not drive, or drive further than 50 kms, at the end of their 12 hour shift.
15 Matthew Tonts and Chris Lockhart , March 2003 University of WA P36 Community Health and Wellbeing in the Murchison 16 Ditto

__________________________________________
Syme Marmion & Co June 2010 Extractive Industries & Sustainable Regional Development Final Report 26
3. Changes in Economic Viability and Lifestyle Expectations
With the benefit of hindsight it is possible to see what great changes in the scale of the extractive industries and the expectations of communities have occurred over the last 35 years. The pace of exploration and production has increased enormously with Western Australia part of an enormous global business. Advances in technology, travel, and communications have enabled minerals deposits to be mined profitably in remote areas and difficult terrain. Changes in society have altered the perception of mining as a career, enabled new skills to be developed and the industry has brought affluence to many people and towns in Western Australia.
3.1 FIFO
Fly In fly out programmes are now a permanent feature of the extractive industry workforce. Although the resources companies state they believe it is important to develop regional towns they also acknowledge that FIFO provides flexibility for the industry and choice for workers. Skilled employees with long service are valuable assets repaying their extensive training with leadership and experience. Retaining these employees, particularly when their family wishes to relocate is important, and FIFO provides that option, enabling the company to:
• Increase competitiveness by reducing their staff turnover, training and HR costs • Addressing specific skills shortages, and • Meeting the lifestyle expectations of workers and families “According to Storey (2001, p137), in the 1990’s the gold industry rapidly adopted FIFO. Many short term mines, with reserves of 3-5 years, became viable with the introduction of long distance commuting. Even the larger mines used FIFO considering it to be more efficient that the operation of mining towns.” 17
CMEWA provide no specific data on the aggregate dollar value of mining operations in Western Australia reliant on FIFO. However, analysis of the mining operations of publicly listed companies in WA has shown that 46.6% of companies use FIFO. It can therefore be estimated that $12.6 billion per year of mining operation in WA are reliant on FIFO18 and that:
• 47% of all mining employees are employed on a FIFO basis, including 4.7% utilising drive in/drive out arrangements.
• 37.5% of directly employed personnel are FIFO. • 77.7% of contractor personnel are FIFO. • Projected demand for 27,000 FIFO workers in 2012 (approximately 72% of the total workforce)
compared to a residential workforce requirement of 11,000 in the same period (based on a survey from July 2008).
• By 2014, the demand for additional FIFO workers is forecast to have reduced to ~18,500 above 2007 numbers.
• Approximately 82% of the FIFO workforce is sourced from the Perth/Peel region, 10% from interstate and 6% international. The remainder is sourced from the Mid West and Great Southern/South West regions.
17 Matthew Tonts and Chris Lockhart 2003 UWA Community Health and Wellbeing in the Murchison Region 18 CWEWA 2005 Fly in/Fly out: A Sustainability Perspective
__________________________________________
Syme Marmion & Co June 2010 Extractive Industries & Sustainable Regional Development Final Report 27
Fly in/fly out programmes have definite positives for the extractive industry companies, but there are differing views on the benefits of FIFO for families, workers and the sustainability of regional and remote communities. On the positive side:
• Many, if not most, mine workers believe FIFO is an attractive option as it offers them the ‘best of both worlds’, a highly paid mining job and the opportunity for their family, to enjoy a quality lifestyle in a desirable location with the best services
• Potential eligibility for taxation benefits applying to Northwest and offshore locations. • There is anecdotal evidence of family friendly rosters actually increasing the time employees spend
with family and friends. • Research into psychological stress in families of FIFO workers found that children did not
experience significantly higher levels of anxiety and family dysfunction than non-FIFO children • It is popular with young people as a way to build capital quickly in order to purchase a home19
Local government in the regions has not generally supported FIFO and they view it as likely to have a negative impact on the community sustainability and the local economy. A differing view, supported by the CMEWA, is that FIFO enables the development of resources that would be uneconomic in the event that a residential workforce was required, and the spin off from these operations generates economic benefits to the region that would otherwise be lost. In regional aviation, for example, FIFO has increased services for local residents as result of the economies of scale and reliability of demand. Similarly, drive in/drive out (DIDO) has resulted in an improvement to local roads in some Shires. In terms of environmental impact, FIFO operations may be less environmentally disruptive than building a new town with extensive infrastructure, schools, social and health facilities. A FIFO workers’ camp will occupy a smaller footprint than a residential town However, the industry also needs to maintain a core of locally resident skilled employees as a rapid response team and, to attract and retain such personnel, must be able to offer living conditions and an environment comparable to larger cities in the South of WA are available. The Chamber of Minerals and Energy 2005 Report, Fly in/Fly out: A Sustainability Perspective states: “While FIFO is a critical component of resources sector operations, it is clear that the best outcome for regional communities will be achieved by finding a balance between residential operations as the predominant form of employment, with FIFO being utilised where warranted by isolation factors and/or labour shortages.20
3.2 Technology
Changes in technology have also contributed to the increase in FIFO workforces. The complex IT, computer and electronic instruments that are an integral component of every major resource project will require regular inspection, adjustment, and calibration. The specialist nature of this type of work means that it is cost effective to fly in a skilled professional as required or to employ a full time employee who shuttles between the company work places on a regular routine.
19 Chamber of Minerals and Energy 2005 Report, Fly in/Fly out: A Sustainability Perspective 20 Chamber of Minerals and Energy 2005 Report, Fly in Fly out: A Sustainability Perspective

__________________________________________
Syme Marmion & Co June 2010 Extractive Industries & Sustainable Regional Development Final Report 28
3.3 Gender Balance and Accommodation
A further change in the modern extractive industry workforce is the inclusion of women. This is due to several factors including the scale of mining equipment and use of sophisticated electronic systems which means that strength is no longer needed to drive and control them. In addition there are many more female graduates in engineering and other fields such as IT. Recognition by extractive industry companies of the value of long serving and skilled employees, together with the changes in gender balance, has contributed towards a far higher level of comfort and amenity in on site accommodation camps. The inclusion of women in the extractive industry workforce has also resulted in a need for good childcare services as couples who have chosen to relocate to Port Hedland, Newman or Karratha may both have jobs requiring shift work. The lack of adequate childcare facilities topped recent community surveys in these towns and has been addressed by BHP and Woodside, who have each taken a similar approach by providing land and buildings for a community facility, but partnering with a not for profit provider to run and manage it.
3.4 The Adoption of Mine Closure Best Practice
The question of mine closure becomes increasingly important as the industry ramps up. The economic study group ABARE is already warning that natural resources are, by their nature, finite and one day will be exhausted. Companies like KGMC who operate the Super Pit on the edge of Kalgoorlie Boulder are now close to the time when they will no longer operate the huge mine. To prepare for this, they are working with the community to develop initiatives that can assist employees retrain, start up new enterprises and consider suggestions for the future use of the mine and its remediation. Their regular community consultation sessions and shop front premises explain the engineering, geology and scale of operations informing the community and helping them to understanding why certain ideas or suggestions are not feasible. 3.4.1 The Department of Resources, Energy and Tourism
The Department of Resources, Energy and Tourism has published a series of handbooks including one entitled “Mine Closure and Completion” as part of their Leading Practice Sustainable Development Program.21 The book stresses the importance of the following elements
• Forward planning • A risk management plan that applies from mine concept to mine closure • A progressive rehabilitation plan and system for implementation. • Attention to detail, planning of processes which prepare the mine and community for closure • The need for engagement with communities and regulators in establishing and implementing
closure of a mine. 3.4.2 Environment Australia
Environment Australia has produced a set of guidelines for best practice in mine closure and decommissioning that start by stating that stakeholder engagement is a fundamental principle for effective mine decommissioning. They prioritise the following principles:
21 www.ret.gov.au

__________________________________________
Syme Marmion & Co June 2010 Extractive Industries & Sustainable Regional Development Final Report 29
• Identification of stakeholders and other affected by closure of the mine. Facilitate the involvement of key stakeholders (especially local communities) in setting priorities for mine rehabilitation
• An effective consultation process thoughout the life of the mine • A communications strategy that reflects the needs of stakeholder groups and interested parties. • Provide a basis for estimating rehabilitation costs prior to final closure so that sufficient financial and
material resources can be set aside • Manage the potential impact of mine closure on local communities, but recognise that • Mine closure should be considered as a part of the mine life cycle from the beginning • Prepare a plan to identify technical, economical and social problems associated with mine closure • Undertake regular and critical reviews of exit plans to reflect the dynamic nature of mining • Estimate the real cost of closing a mine, including potential support for the local communities • Set aside adequate funds to protect the community from liabilities following closure of the mine. • Ensure accountability for resourcing and implementing the closure plan is clearly identified; • Assess and provide for on-going management and monitoring requirements after closure • Prepare a business plan including a schedule of actions, responsibilities, resources, and timeframes
as the basis for implementing a closure plan; and • Put a broad, easily understood regulatory framework in place for the closure process; • Develop completion criteria specific to the mine being closed, reflecting its unique set of
environmental, social and economic circumstances; • Agree on indicators to estimate successful rehabilitation of a site • Identify a responsible authority to make the final decision on accepting closure; • Keep records of the history of a closed site to facilitate future land use planning. • Optimise rehabilitation work by undertaking it during the productive phase of mining operations
rather than deferring it all to the end of the project; • Test rehabilitation designs and/or processes in a site specific fashion and allow external scrutiny • Reduce double-handling of waste materials and topsoil; • Facilitate direct involvement of operations personnel in mine rehabilitation • Ease the economic impact on local communities reliant on mine operations.

__________________________________________
Syme Marmion & Co June 2010 Extractive Industries & Sustainable Regional Development Final Report 30
4. Documenting the Policy Framework The policy framework governing the extractive industries and their relationship with communities in Western Australia has developed over more than a century, responding to the growth of mining and the place that it occupies in the both State and Federal economies. The result is a complex relationship between the extractive industries, the Commonwealth, the State of Western Australia and local government. The changes proposed by the Commonwealth to the way in which the public health system is funded in WA and other States, together with the, now superceded, Resources Super Profits Tax has promoted broad public discussion on what constitutes a fair balance of taxation within our federated national structure and the level of benefit that should accrue to the people of Western Australia. This discussion includes a WA State Government review of mining royalties and the removal of rates exemptions in State Agreements on a case by case basis. This complements 2009 amendments to the Local Government Act, confirming the ability of rural Shires to use current legislation to increase their annual rate revenues and, in doing so, become less dependent on mining companies or annual government grants to maintain and/or build their communities for the future.
4.1 Common Aims
The Commonwealth Government, State Government and the extractive industry share several aims for sustainable community development in the affected regions. Royalties for Regions echoes commitments made by the Federal Government’s new Regional Development Australia that are, in turn, aligned with the principles of sustainable development adopted by the International Council of Metals and Minerals (ICMM).22. This common background can be best utilised in partnerships collectively addressing problems faced by current growth and industry development of remote areas. Planning for a regional residential hub in a remote location and harsh climate which is also attractive and functional as a place to live is a tough challenge that needs a collaborative approach with shared information and aims. .
4.2 Australian Government Policy Framework
The Federal Government Regulation Taskforce in 2006 reported a number of regulatory burdens causing delays the Upstream Petroleum (oil and gas) industry. As a result the Productivity Commission was asked to undertake a series of studies that has identified current regulatory requirements as “overly complex, often overlapping and duplicative”. In releasing the Report in May 2009, Commissioner Philip Weickhardt observed that "there is widespread agreement among both government and industry that cutting the time taken to approve major projects by 50% is achievable and desirable but it will require the elimination of many of the current duplicative processes between the Australian and State and Territory Governments.23. Applied to the extractive industry in Western Australia, these observations encapsulate similar issues relating to industry expansion and the development of supporting infrastructure. Recent alterations to the Commonwealth regional policy framework have focused on Western Australia’s infrastructure and community needs in the North West of the State and, using OECD research, a policy of integrated regional development planning has been adopted to capitalise on the underutilised potential by:
• Investing in infrastructure • Investing in people and providing jobs • Promoting innovative regions • Enabling higher education institutions to help foster regional innovation
22 Australian Minerals Industry Framework for Sustainable Development, “Enduring Value”, published by the Minerals Council of Australia
23 http://www.blakedawson.com/Templates/Publications/x_article_content_page.aspx?id=55127

__________________________________________
Syme Marmion & Co June 2010 Extractive Industries & Sustainable Regional Development Final Report 31
4.2.1 Commonwealth Department of Resources, Energy and Tourism
Recommendations made by the Commonwealth Department of Resources Energy and Tourism in their report ‘Leading Practice Sustainable Development Program for the Mining Industry’ conclude that the approach and content of a mining operation’s contribution to community development is likely to more successful if it is determined by local conditions such as the nature and scale of the operation, available government resources and local people’s specific needs and priorities. “Mining companies should work in support of local community priorities and existing programs rather than having predetermined projects or approaches to offer local communities”. They suggest that it may be more suitable for community development to be managed by a third party, or through a foundation or trust. That mining companies should focus on their own areas of expertise, find where these intersect with community needs and contribute skills contained within their organisation, leaving areas where they do not have expertise to others who do. This view has been adopted by several extractive industry companies, either wholly or in part, who have partnered with the Wester Australian Community Foundation (WACF) to form community foundations. A key platform of the WACF is the development of leadership skills in the community through the allocation of funds each year. Such an approach is encouraged as it assists community capacity to help themselves. The Department further recommends that mining companies contribute to community development by acting as a catalyst for economic and social development fostering dynamic linkages between communities and external support agencies and by working in partnership with state/territory and local governments. 4.2.2 Regional Development Australia
Regional Development Australia (RDA), is the new Federal regional network set up in 2009. Eight Regional Development Committees plus an advisory body for Perth have replaced the 54 community based Area Consultative Committees (ACC) located across regional Australia. In Western Australian, the RDA boundaries are the same as the 9 WA Regional Development Commission areas, but with Gascoyne and the Mid West merged. The RDA committees will share up to two members with the existing WA Regional Development Commissions improving collaboration and information exchange between Federal and State Governments, bringing together all levels of government in order to enhance the growth and development of regional Australia. Other committee members will be voluntary, but appointed by the Federal Government and with broad local experience in areas such as health, education and business. The RDA’s role is to:
• Provide advice to all levels of government about regional issues • Provide information to regional communities on federal government initiatives and programs • Help to co ordinate regional planning and regional development initiatives • Establish links and co operative alliances as appropriate by working closely with regional communities,
other regional development organisations including the WA Regional Development Commissions, neighbouring RDA committees and local government to promote regional development
The signing of a Memorandum of Understanding (MOU) between the Commonwealth and Western Australian Governments on 25th August 2009 signalled the start of a movement towards better integrated arrangements for regional engagement and economic development between the Australian Government (through the Regional Development Australia network) and the Regional Development Commissions. The MOU set out 10 principles of collaboration:
• Integrated Agreements

__________________________________________
Syme Marmion & Co June 2010 Extractive Industries & Sustainable Regional Development Final Report 32
• Commitment to Collaboration • Common Boundaries • Acknowledge the Differences • Tripartite Arrangement • Sharing of Information • Purpose and Role of RDA and RDC • Cross Membership • Joint Funding • Co Location
The first project is a partnership between the Department of Local Government and Regional Development and the Australian Bureau of Statistics to produce a series of statistical frameworks that can serve as a practical regional strategic management and planning tool for each of the 8 regions. The pilot study is “Spotlight on the Pilbara Region” compiled in collaboration with the Pilbara Regional Development Commission. 4.2.3 Spotlight Series
The ABS data uses community indicators that have been benchmarked in order that progress can be measured and data updated. Consultation for the pilot “Spotlight” in the Pilbara highlighted areas for which surveyed information did not exist, and a valuable insight into the pressures on development in the region looking at:
• Social – Community Education and Training, Health, Law and Order, Recreation and Arts • Economic - Business, Infrastructure, Housing, Tourism, Transport • Environment – Environmental Impacts, Environmental Health
4.2.4 Planning WA24
In September 2009, the Minister for Planning launched a reform paper entitled “Planning Makes It Happen”. It sets out 11 strategic priorities for planning reform, including:
• Major project facilitation through the establishment of a lead agency governance framework comprising the Departments of State Development, Planning, Mines and Petroleum, Transport, and Regional Development and Lands
• Improving urban land supply and infrastructure coordination through the Infrastructure Coordinating Committee of the Western Australian Planning Commission (the WAPC);
• Establishing regional planning committees;
The State Government has made major project development, especially in the resource sectors, a high priority. The reform measures include:
• Establishment of an industry advisory group on approvals processes; • Transfer of the Office of Development Approvals Coordination to the Department of State
Development; • Establishment of a lead agency governance framework which comprises:
o Department of State Development, responsible for major resource and infrastructure projects. o Department of Planning, responsible for urban and regional land development control.
24 http://www.planning.wa.gov.au/Plans+and+policies/Publications/1991.aspx Planning makes it happen.pdf

__________________________________________
Syme Marmion & Co June 2010 Extractive Industries & Sustainable Regional Development Final Report 33
o Department of Mines and Petroleum, for major minerals and energy resource projects o Department of Transport responsible for integrated transport planning and project delivery. o - Department of Regional Development and Lands administering the Royalty for Regions Fund.
These lead agencies work cooperatively to streamline and fast track the development and approvals processes. The WAPC has resolved to establish regional planning committees for the Kimberley, Pilbara, Mid West and Gascoyne regions of the State. The role of these Committees is to provide a greater strategic focus on the needs of each region in the first instance through leadership and direction for land use planning for long term development.
4.3 Royalties
A royalty is defined as a payment made to Government to compensate the Australian community for the extraction of a non renewable resource from a national asset.25 In the year 2007/2008 WA royalty receipts amounted to $2,296 billion. In 2009\2010 they are expected to be $2,577 million. 4.3.1 Minerals
In Western Australia all minerals existing in their natural form are owned by the State Government, held on behalf of the Western Australian community. A royalty, generally calculated on an ad valorum basis,26 is paid to the State Government for the use and loss of an asset. They are part of State revenue to be spent through the same framework that governs all State Government expenditure, including regional policies and regional development policies. There is no inherent reason why these royalty revenues should be spent in any particular region. Under the WA Mining Act 1978 royalties are payable on all minerals, defined as a naturally occurring substance including evaporites such as limestone, rock, gravel, sand and clay with the exception of some varieties on private land. 4.3.2 Oil and Gas
Petroleum also attracts a royalty but is governed under other State and/or Commonwealth legislation depending on the location of the project. Mining royalties are paid through the Department of Industry and Resources (DOIR) with mining tenement holders required to submit a quarterly royalty return. Petroleum royalties are collected by the WA State Government if they are onshore, with royalties from offshore projects shared by the State and Commonwealth Governments in accordance with individual project agreements and legislation. Most royalties are designed to return to the community about 10% of the wellhead or minehead value for the resource. Certain deductions are allowed including the post wellhead processing, storing and transport of petroleum and post minehead transportation of minerals. Royalty rates for minerals attempt to recognize and reflect the value of the varying processing costs incurred - 7.5% for bulk materials, 5% for mineral concentrates and 2.4% for minerals in a metallic form. A royalty rent applies to petroleum produced on Barrow Island and a petroleum resource rent tax applies to petroleum produced in Commonwealth waters.
25 WA Royalties Explained Nov 2008 Goldfields Esperance Development Commission
26 Mining Act 1978

__________________________________________
Syme Marmion & Co June 2010 Extractive Industries & Sustainable Regional Development Final Report 34
4.3.3 WA State Royalty payments and the GST
At present, the WA State Government effectively retains only about 40% of the royalty collected, the rest being distributed as part of the Federal Grant Commission principle of “horizontal fiscal equalization”, a process which sees Western Australia receive a smaller share of other national revenue (the GST) due to its strong royalty income base. Most recently, the Federal Treasury Secretary, Ken Henry, reported that the 2010 Tax Review intends to “overcome the essential weakness of the existing royalty schemes” making clear its preference for a federal tax scheme in the form of a resources rent tax, as levied on petroleum since 1986, as opposed to an ad valorem royalty on mineral product. This view was initially supported by the Minerals Council who welcomed a simpler, national system of taxation that would be based on profit rather than revenue but is now strongly opposed to taxation structure proposed which is seen as unworkable.
4.4 WA State Government Policy
The current WA State Government is examining ways in which it can simplify the existing resource rental and taxation regimes to reflect contemporary practices in the extractive industries and to balance the allocation of revenue to the State Government with that due to the Commonwealth Government. In December 2009 it adopted the findings of the State Agreement Act Rating Clause Study and amended the Local Government Act 199527. 4.4.1 State Agreements
State Agreements are contracts between the Government of Western Australia and proponents of major resources projects that are ratified by an Act of the State Parliament. They specify the rights, obligations, terms and conditions for development of a project and establish a framework for ongoing relations and co-operation between the State and the project proponent.28 These agreements have been used by the State for over 50 years to define major developments including mineral, petroleum, related downstream processing projects and associated infrastructure investments. It has traditionally been understood that, since these long term projects are often located in relatively remote areas of the State, significant infrastructure development is often essential in order to gain access to the location, house the workforce and construct the mine and plant required. Where this is the case, the State has usually awarded an exemption to local rates as one clause of the agreement and stated that the necessary development is to be undertaken by the mining company. In recent years, changes to the Agreements include a reduction in the rating exemptions awarded and a significant increase in the level and complexity of clauses relating to corporate social responsibility issues, including:
• Training and guaranteed employment for indigenous and non-indigenous persons • Local procurement policies for goods and services; and • A regionally based workforce
From 2010, rating exemptions will no longer be part of the Stat Agreements and those currently in place will be reviewed on a case by case basis as the opportunity arises.
27 Local Government Act 1995 Section 6.29 and Section 6.33
28 State Agreements 2009 Department of State Development WA

__________________________________________
Syme Marmion & Co June 2010 Extractive Industries & Sustainable Regional Development Final Report 35
4.4.2 Royalties for Regions
The role and focus of regional government in Western Australia, including the re positioning of the Department of Local Government and Regional Development as the Department of Regional Development and Lands and the Department of Local Government, altered with the election of the Barnett Government in 2008. The Liberal National Coalition committed to a broad platform of regional development with the introduction of Royalties to Regions. 29 The new initiative has been welcomed by regional local government, and the extractive industry sector, as a timely and much needed focus on regional development. Royalties for Regions has the potential to address many of the infrastructure and growth issues that were pointed out to us during consultations, but does not yet offer the level of detail necessary for it to be used by local government work effectively at the programme level. Originally set at 25% of the States’ mining and onshore petroleum royalties, but reduced to 21% in May 2009 as a result of the global financial crisis, funding of equivalent value will be returned to the State’s regional areas each year as an investment in projects, infrastructure and community services. In addition to regular Budget programs, in 2010 it will provide an additional $619million for regional communities through:
• The Country Local Government Fund • The Regional Community Services Fund, and • The Regional Infrastructure and Headworks Fund (including the Regional Grants Scheme administered
by the Regional Development Commissions with support from the Department of Regional Development and Lands.
The funds are intended:
• To increase capacity for local strategic planning and decision-making • To retain and build the benefits of regional communities • To promote relevant and accessible local services • To assist communities to plan for the sustainable economic and social future • To enable communities to expand social and economic opportunities, and • To assist regional communities to prosper through increased employment opportunities, business and
industry developments, and improved local services30 4.4.3 Country Local Government Fund
The Country Local Government Fund will receive funding of $500 million over 5 years in direct assistance to assist country local governments build, maintain and renew community infrastructure. Local governments in the 9 regions defined by the Regional Development Commissions Act 1993 are eligible. The fund will:
• Address infrastructure requirements • Improve asset management and capacity building • Encourage standardized asset management practices and improved regional governance in local
government. 4.4.4 Regional Community Services Fund
The Regional Community Services Fund is designed to improve access to services in the regions. It supports services enhancing the quality of life for residents. The Regional Community Services Fund aims to: 29 Royalties for Regions 2009 Department of Regional Development and Lands WA
30 Goldfields Esperance Development Commission

__________________________________________
Syme Marmion & Co June 2010 Extractive Industries & Sustainable Regional Development Final Report 36
• Assist regional communities achieve improved access to a range of community services • Assist regional communities overcome disadvantages caused by remoteness • Attract and retain essential regional government employees.
4.4.5 The Regional Infrastructure and Headworks Fund
The Regional Infrastructure and Headworks Fund supports large-scale, strategic regional infrastructure projects that are trans regional in nature and of strategic importance to Western Australia. The fund aims to support investment in regional WA and help leverage investment from other sources for projects that contribute to the development of regional infrastructure. It also supports planning for regional infrastructure at the regional level and encourages regional communities to develop infrastructure projects that benefit local organisations and communities. As well as funding individual strategic projects, the Fund includes an annual allocation for the Regional Grants Scheme. Private and public organisations may apply to the Scheme for funds to improve and develop infrastructure and services in the regions. 4.4.6 Regional Grants Scheme
Launched in February 2009, the $40 million Regional Grants Scheme administered by the WA Regional Development Commissions, will fund 320 projects in its first round (2008/2009). Set up to provide assistance to infrastructure, service and the broad development of the community projects, the Scheme aims to support more resilient communities and contribute to vibrant regional areas.31 4.4.7 The Western Australian Regional Development Council - Strategic Priorities 2008
The Regional Development Council is the peak advisory body to the West Australian Government on all regional development issues. The Council consists of the chairpersons of the nine Regional Development Commissions, two local government representatives and an independent chairperson. The functions of the Council are to promote development in the regions, develop policy proposals on regional issues, assist commissions and relevant government agencies to work closely on regional issues and to report back to State Government on matters referred to it.32 The following are the current strategic policy priorities:
1. Attraction and Retention of Population It is important to ensure that suitably qualified and skilled people are attracted to work in regional areas and that the community conditions and employment rewards encourage them to stay. To achieve this, the Regional Development Council is planning:
o An impact assessment framework of FIFO employment o Looking at the attraction and retention of public sector employees o Advocacy for education initiatives training, career and professional development o Assessment of critical skills sets o Incentive programmes for regional placements
2. Planning and Infrastructure Through State and local government programmes such as the Regional Grants Scheme, the RDC intends to increase research into regional issues, particularly partnerships that deliver substantial community benefits for Aboriginal people. Other initiatives to be pursued include:
31 Royalties for Regions – Regional Grants Scheme 2009 Department of Regional Development and Lands WA
32 Regional Development Council 2009 Department of Regional Development and Lands

__________________________________________
Syme Marmion & Co June 2010 Extractive Industries & Sustainable Regional Development Final Report 37
o High level regional planning committees. o Decentralised planning through delegated powers o Planning for small towns o Affordable housing in regional WA
3. Indigenous Development The RDC wishes to improve the economic participation of indigenous communities through increased employment. If substantial improvement in the availability of essential services is achieved it will lead to increased economic development and improve education, health and police services in remote communities. Amongst other initiatives, the Commissions wish to support:
o Adoption of regional and local solutions rather than State wide measures. o Knowledge, skills, leadership and governance capacity building. o Identification of critical blockages in services to indigenous communities
4. Local Government and Royalties for Regions policy Local government in the regions is at the forefront of community response to the prevailing economic, social and cultural conditions. Traditionally, Local Government revenue is derived from rates, grants, such as Financial Assistance Grants (FAGs) and, more recently, the GST. This income has permitted small rural Shires to maintain a “status quo” for their communities, but not to move forward, to attract new investment or to renew ageing infrastructure. Many extractive industry operations are exempt from rates on unimproved land as a condition of their State Agreement and the mine is increasingly likely to be a self contained FIFO or DIDO operation that will not contribute much income to the local economy.
4.4.9 Local Government Reform Process
In 2009, local government in Western Australia was invited by the Minister for Local Government to participate in the Local Government Reform process that aims for a reduction in the number of local authorities in WA. The funded sustainability evaluation programme is complete and pinpoints the need for change to enable small communities to survive while promoting growth in those with a viable future. The reform process has indentified strengths and weaknesses in capacity alerting Shires of the need to assess options for their future. 4.4.10 WA State and Local Government Fly in Fly out Policies
The WA State Government does not formally influence the way in which extractive industry workforces are engaged or deployed apart from any conditions which may be in an individual State Agreement. Several local authorities, notably the City of Geraldton Greenough, the Shires of Ashburton, Roebourne and Town of Port Hedland initially developed positions on Fly in Fly out practices and Transient Workforce Accommodation (TWA). However, the current expansion of extractive industry infrastructure and pace of development has caused these policies to be reviewed and several new accommodation camps are under construction.
1. Shire of Ashburton In 2008 the Shire of Ashburton considered FIFO to lead to a loss of economic and social value to the Shire and the regional area. Their Local Planning Policy states that transient worker accommodation has the potential to impact adversely on the economic and social wellbeing of Shire communities in two ways:
• The scale and the extent of the accommodation can result in a significant demand being placed on physical and community infrastructure. Furthermore, it can distort local and regional commercial activity

__________________________________________
Syme Marmion & Co June 2010 Extractive Industries & Sustainable Regional Development Final Report 38
• Detailed design considerations may impact on the amenity of the areas immediately surrounding the area.
2. Shire of Roebourne The key objectives of the Shire of Roebourne Transient Workforce Accommodation Policy are:
• To provide a functional living environment for transient workers associated with industrial development
• To ensure a high level of amenity for transient workers and residents both during and after the construction of the Transient Workforce Accommodation Facility.
• To recognise that Transient Workforce Accommodation facilities will take varying forms depending upon individual occupancy, transportation and catering arrangements.
• To ensure that development within land zoned for Transient Workforce Accommodation is designed for Transient Workforce Accommodation.
• To minimise the impact of the influx of workers associated with the construction of resource projects on the existing community.
• To ensure occupancy of Transient Workforce Accommodation facilities and Fly In Camps are limited to workers or working couples.
• To recognise that, due to their limited life span, Fly In Camps need not provide the same level of amenity to workers as the permanent Transient Workforce Accommodation facilities.
3. Town of Port Hedland Minutes of council meeting in February 2009 state that residentially based workforces are preferred because FIFO is seen as:
• Damaging to the provision of community services and facilities • Detrimental to the establishment and continued operation of small businesses • Likely to promote an unsustainable demographic framework for the Town
The TOPH is currently negotiating the construction of a large new accommodation village on Council land adjacent to the airport.
4.5 Private Sector Policy: Corporate Social Responsibility (CSR)
In Western Australia, major companies involved in the extractive industries have sophisticated programmes of corporate investment known as CSR. These focus for these initiatives ranges from support for state and national cultural and sport activities to science and the environment, health and the well being of the workforce and local residents. It is not regulated in any way, but is taken very seriously by the major companies who see it as a key principle of sustainable development. Contributions to remote and rural communities, of whatever kind, are usually negotiated directly with local government and vary considerably in scope, value and longevity. They appear to be governed by:
• An outline Community Development Plan or commitment in the State Agreement for that company • The International Council on Minerals and Mining (ICMM) 10 principles of sustainable development • The local government’s Strategic Plan (if one exists) • Company funded social impact assessments • Employee interests
The Australian arm of the ICMM, the Minerals Council of Australia, has published an operational manual for members entitled Enduring Value: The Australian Minerals Industry Framework for Sustainable Development. An International Standard, ISO 26000, is currently in draft form. 4.5.1 Enduring Value: The Australian Minerals Framework for Sustainable Development
Enduring Value, the Australian Minerals Framework for Sustainable Development states in its introduction:

__________________________________________
Syme Marmion & Co June 2010 Extractive Industries & Sustainable Regional Development Final Report 39
“The future of the Australian minerals industry is inseparable from the global pursuit of sustainable development. Through the integration of economic progress, responsible social development and effective environmental management, the industry is committed to contributing to the sustainable growth and prosperity of current and future generations.”
The manual, developed in response to the ICMM’s principles, acknowledges the fact that the extractive industry has a responsibility to help the development of strong and sustainable communities. It supports what is described as the “social license to operate” complementing the regulatory license issued by Government. The ten principles of sustainable development guiding the framework are:
• Implement and maintain ethical business practices and sound systems of corporate governance • Integrate sustainable development considerations within the corporate decision making process • Uphold fundamental human rights and respect cultures, customs and values in dealing with employees
and others who are affected by our activities • Implement risk management strategies based on valid data and sound science • Seek continual improvement of out health and safety performance • Seek continual improvement of our environmental performance • Contribute to conservation of bio diversity and integrated approaches to land use planning • Facilitate and encourage responsible product design, use, re use, recycling and disposal of our
products • Contribute to the social, economic and institutional development of the communities in which we
operate • Implement transparent and effective engagement, communication and independently verified reporting
arrangements with our stakeholders The information in “Enduring Value” is practical and operational, gathered from the experiences of individuals and companies engaged in mining and resource industries, backed up by case studies and web based tools for mine managers (www.minerals.org.au) 4.5.2 The Chamber of Minerals and Energy WA
The peak representative body in Western Australia is the Chamber of Minerals and Energy WA (CMEWA), one of several resource industry professional bodies in Australia that interact with government and co ordinate the development of policy positions on behalf of members. It is the industry’s advocate and communicator, providing a forum in which members can work together to promote the sector’s interests. The membership contributes to the decision making process via five regional councils. CMEWA hosts industry forums, among them the Pilbara Industry Community Council, the Resources Industry Training Council and the Goldfields Education and Mining Industry Alliance.
1. The Pilbara Industry’s Community Council (PICC) PICC was established in 2006 as a collaborative industry forum. Members of the Council are BHP Billiton Iron Ore, Chevron Australia, Fortescue Metals Group, North West Shelf venture, Rio Tinto Iron Ore and Woodside. The Council has two aims:
• The development of a shared vision and strategy to increase indigenous participation in
employment and reduce gaps in education and training, health, and housing; and • The development of a shared vision and strategy for Pilbara towns.

__________________________________________
Syme Marmion & Co June 2010 Extractive Industries & Sustainable Regional Development Final Report 40
2. The Resources Industry Training Council (RITC) RITC was established by CMEWA in partnership with the Australian Petroleum Production & Exploration Association (APPEA), and funded by the WA Department of Education and Training to:
• Provide accurate industry intelligence regarding skills and vocational training requirements. • Support development and implementation of quality, nationally recognised, training packages
3. The Goldfields Education & Mining Industry Alliance (GEMIA) GEMIA is a community partnership of industry professionals, educators, and careers advisers to:
• Enrich school science curriculum delivery • Promote career opportunities in the mining sector
4. The Australian Technical College-Pilbara ATC-Pilbara develops regional and Indigenous training opportunities through a school-based apprenticeship program. It has established an Indigenous Apprenticeships Partnership, enabling local Indigenous people to gain greater access to employment.
4.6 Investment Trusts and Community Funds
The life of a mine is finite, and although some mining operations last long enough to for the affected community to develop the range of jobs, service industries and lifestyles that will enable it to support itself into the future, most do not. In the following paragraphs we have outlined four investment funds, two from Western Australia and two from overseas that seek to provide funding in perpetuity for the community. The overseas examples are state wide initiatives of government while the examples from WA, Alcoa and Rio Tinto, are corporate initiatives. While the Rio Futures Fund, stands alone, the Alcoa Wagerup Fund is managed by the Western Australian Community Foundation along with a further 39 community funds. 4.6.1 Public Sector Investment Funds
Apart from the relatively new Western Australian Infrastructure Fund, WA does not have a public investment fund set up in perpetuity to benefit all Western Australians. Please refer to Case Studies in the Appendix. 4.6.2 The Western Australian Community Foundation (WACF)
The WACF33 was set up in 2004 with an initial $100,000.00 from State Government and contributions from 4 “cornerstone” private sector institutions. It operates as an independent umbrella organisation for endowed funds. Set up as a not for profit organisation to provide best practice administration and accountable funds management, it enables small community and private funds to start up and grow through shared administrative costs and a shared investment portfolio. By 2009, there were more than 40 separate funds of varying sizes under its stewardship but all with the common aim of assisting the fund recipients in perpetuity. The operational model is flexible, able to work with many types of communities and groups including inner city groups wishing to develop youth activities, businesses wanting to take a more strategic approach to corporate giving, resource industry companies wishing to leave a legacy for the local community and family trusts. Three feasibility studies conducted in WA by the Foundation for Regional & Rural Renewal (FRRR) helped shape and define the way in which the WACF engages with communities. FRRR identified that the costs involved with establishing and maintaining a number of separate community foundations were considerable, with an investment of approximately $64,000 required to establish each community foundation and ongoing costs likely to exceed approximately $50,000 per annum (FRRR, Community Foundations Kit, 2003).
33 Western Australian Community Foundation www.wacf.org.au

__________________________________________
Syme Marmion & Co June 2010 Extractive Industries & Sustainable Regional Development Final Report 41
The studies led to the development of a model that enables each donor to create their own fund within an existing structure, so sharing the administrative burden and cost of managing a foundation. Essentially, the WACF serves as Trustee, provides the necessary financial and legal frameworks, receives funds raised and arranges for their investment as part of a corpus of funds, and directs the income back to the recipient community for distribution The WACF is unusual in that it sees the building of local capacity and social capital as central to its philosophy alongside a strategic, flexible and conservative approach to community investment. As a result, the WACF undertakes community capacity building initiatives at a local level, as well as business planning, consultation and community engagement programmes. It has been engaged by the RAC, Rio Tinto and BHP, among others, to undertake social impact assessment, communications and events management. 4.6.3 Wagerup Sustainability Fund
Alcoa has long been aware of the value of a company Foundation as a vehicle for corporate giving and community development. In addition to the programmes offered to employees world wide through the Alcoa Foundation, The Wagerup Sustainability Fund has been established to benefit people living near the Wagerup refinery and will exist in perpetuity for the good of this community. The fund supports community organisations, initiatives, processes and activities that contribute to the Shires of Waroona and Harvey tot:
• Deliver long term sustainable outcomes for the region surrounding the Wagerup refinery, with a focus on the communities in and around Waroona and Harvey;
• Foster leadership, knowledge, enterprise and innovation • Support and preserve the environment • Build stronger communities.
Funding is allocated at the discretion of the Western Australian Community Foundation in consultation with local community advisory committees. Alcoa has made an initial contribution of $400,000 to the Fund and will continue to make annual contributions linked to refinery production for 20 years. The initial contribution to the Fund has been invested, as will any future contributions with the goal of building an endowment that generates interest in perpetuity. The WACF serves as Trustee and oversees all governance, financial, legal and compliance matters including grant-making requirements. Community members can apply to join the local advisory committees representing the communities of Waroona and Harvey. 4.6.4 The Rio Tinto WA Future Fund
The Future Fund was established by Rio Tinto in 2001 to invest in Western Australia, concentrating on a small number of large, state-wide partnerships in the environment, health, education and culture. Applications are considered for innovative projects of State-wide significance that are:
• Suited to funding from more than one partner • Outcome focused and suited to performance measures • Able to promote skills development and build community capacity • Able to work in partnership with Rio Tinto and its WA businesses
Applications need to demonstrate new and viable solutions to problems and long term sustainability. Since it was established, the Future Fund has entered into 34 partnership agreements with a range of Western Australian organisations and the $12 million committed by the Fund during this time has been leveraged into more than $32 million worth of community projects.

__________________________________________
Syme Marmion & Co June 2010 Extractive Industries & Sustainable Regional Development Final Report 42
5. The Way Forward: Systems of Self Reliance and Responsibility
The study has been able to establish the key relationships and the operational methodology of major extractive industry companies and Government at all levels. The threads of discussion and debate that have run through stakeholder consultation or research underline the complexity and diversity of the resource sector. Extraction projects range from immense to almost one man bands and community development initiatives from highly sophisticated corporate programmes to practical assistance with maintenance functions in the local community. A requirement of this study has been to research the potential for a formula to determine appropriate levels of corporate contribution to communities. To work well, such a formula needs to be simple, clearly understood by everyone and easy to apply, and, while the development of a new and complex system has been ruled out as complex, costly and difficult to apply, it is good news to discover that the system of local government rates in Wester Australia is just such as vehicle. The ability of a local government to levy rates from everyone who occupies and makes use of land within their administrative area is a basic and fair way to ensure that individuals and businesses pay their way in the community. It has been denied to many rural and remote Shires in the extractive industry regions in locations where a major miner has signed up to a State Agreement. Until recently, the majority of these contracts granted an exemption to the payment of rates on leased land, with the exception of residential blocks within a town site, or of only a minimum, unimproved rate (UV). This situation has created impoverished Shire administrations and a culture of dependency on the patronage of the mining company.
5.1 The Payment of Local Government Rates Completion of the State Agreement Act Rating Clause Study at the end of 2009 has resulted in implementation by the WA State Government of a policy to exclude rates concession clauses from future State Agreements and, to remove the clause from current State Agreements on a case-by-case basis34. The policy is now included in amendments to the Local Government Act 199535. While perhaps an appropriate solution in the 1960’s and 70’s, the exemption from payment of rates in return for the construction of company towns to house employees, is no longer relevant. With few exceptions, these towns are now “normalised” with an elected Shire council and although now able to levy rates for services to business and housholds in the town, in still unable to do so from the major employer, still operating under the terms of their State Agreement. Several of the companies still responsible for the operation and upkeep of some infrastructure, operation and maintenance in these towns believe that the community is better off under this scenario, chiefly for reasons to do with distance, tired infrastructure, capacity and cost of operation. But, understandably, most local government councillors see this as a restriction on their ability to manage the community that elected them and would prefer to act independently even though they appreciate they may never attain the population necessary to become entirely self supporting. The application of a rates based formula is the only consistent basis on which a workable formula for contributions to communities can be developed. Payment of local rates can be argued as an established, fair and transparent way to require everyone to pay their share in a local government area, a viable and effective alternative to an industry specific system that would require constant adaptation to changing outputs, the preparation of new legislation and a new system of compliance.
34 Letter to WALGA from Colin Barnett, Premier and Minister for State Development 16th December 2009 (Appendix )
35 Local Government Act 1995 Section 6.29 and Section 6.33

__________________________________________
Syme Marmion & Co June 2010 Extractive Industries & Sustainable Regional Development Final Report 43
Although difficult to resolve in Shires where State Agreements are still active, those where land leased to the extractive industry is not subject to a State Agreement, have begun to follow the example of the Shire of Leonora. This Council researched the funding avenues available under current legislation after noting that that since 1st July, 1999 pastoral property rentals, on average, had increased by about 120% and rentals on mining leases by about 20%. They realized that they have a legal requirement to apply rating regimes to the full extent possible under the law and their example is supported by the the WA Local Government Association which is encouraging rural Shires in affected to:
• Identify in their budget papers the separate categories of pastoral and mining in the unimproved value environment so as to recognise the different methodologies used in obtaining valuations
• Establish the conditions for differential rating as set out in the Local Government Act 1995 and in compliance with their statutory obligations including making application for approval by the Minister
• Clarify their ability to set differential rates that reflect the burden on local facilities and resources36 • Ensure a flexible approach and retain the ability to negotiate directly with major industrial and
extractive industry companies using the UV and applicable GRV as their basis37 • Lobby for removal of local rates exemptions within State Agreements on a case by case basis
5.1.1 Differential Rates
The Shire of Leonora established that there was provision in the Local Government Act 1995 that allowed local governments to impose differential rates within their boundaries where they have complied with statutory obligations. 38 Differential rating is designed to give local government more flexibility in rating matters and can be applied to properties in either the unimproved (UV) or gross rental value (GRV) categories. It is a discretionary mechanism enabling local government to achieve a more equitable rate burden on properties in its district and better reflect the capacity to pay. It may be applied to property according to its zoning, its predominant use, whether it is vacant, any other characteristics or combination of characteristics as prescribed in the regulations. 5.1.2 Spot Rates (GRV)
Advice from Landgate – Property and Valuation states that GRV or gross rental value, applicable where capital improvements have been made, can be calculated using an “assessed value” at the rate of 5% of the capital value of land and fixed improvement where a rental value cannot be established. The ability of local government to apply for approval to request assessment of a spot rate on a mining camp and its infrastructure or other fixed plant (machinery is exempt) will create a consistent approach to business in the Shire. It puts all commercial activities on an equal footing and does not affect the Shires’ options to negotiate with the relevant companies for a contribution to community activities. In fact, having an assessed value to apply may help by providing a base rate for negotiations. 5.1.3 The Effect on Corporate Social Responsibility Practices
Because the payment of local government rates is a mechanism that we are all accustomed to, anecdotal evidence from the Shire of Leonora, who have put this regime in place, does not record any reduction in corporate contributions or community support from any of these companies. The mining companies in the
36 The Shire of Menzies Minutes of Ordinary Meeting of Council, Friday 15th May 2008 p14 Item 14.1 and
The Shire of Leonora Minutes of Ordinary Meeting of Council, 15th April 2008, pp 5-8 Item 9.1(B) Differential Rating
37 Landgate – Property and Valuations. Advice received states that applications for “spot rated” GRV at remote, but developed locations such as processing plants can be
applied for through the Department of Local Government and is rated on assessed value of the capital value of the land and fixed improvements
38 The Shire of Leonora Minutes of Ordinary Meeting of Council, Ist, May 2007

__________________________________________
Syme Marmion & Co June 2010 Extractive Industries & Sustainable Regional Development Final Report 44
region have continued to support local events, such as the Leonora Golden Gift, and to act in concert with councils regarding roads, grading and other everyday matters as they have always done.
5.1.4 Grants Commission
Although the determination to be self reliant has resulted in a reduction in Financial Assistance Grants to the Shire of Leonora from the Grants Commission, it has enabled their annual revenue to rise to a level where Council is adequately financed and able to plan for the future with expenditure no longer constrained by funding categories such as rural road maintenance. Their experience confirms the views of State Government and the WA Local Government Association that the ability of the local government to take charge of its affairs and to control its financial future is important to the sustainability of a Shire and its constituent communities. It is important to note that local authorities who are recipients of funding from the Grants Commission must inform them of additional revenue or contributions received from corporate donors. It is also incumbent on the Grants Commission to ensure that funding is granted in response to real need and not simply where a local authority has not exercised its rights to raise revenue to the fullest extent available.
5.2 Benchmarking and Corporate Social Responsibility Policy While terms like 'corporate social responsibility' and 'responsible investment' may sound altruistic, they
all boil down to sustainable business practices. The kind of business practices Australia needs right
now."
Senator the Hon Nick Sherry, Minister for Superannuation and Corporate Law
One of the key elements of most accredited benchmarking systems used by extractive industry companies is corporate social responsibility. Corporate social responsibility (CSR) is a form of corporate self-regulation integrated into a business model. A company CSR policy is designed as a self-regulating mechanism, monitoring company performance in areas such as ethical standards, the environment, consumers, employees and communities. Businesses voluntarily contributing to a community through the provision of economic, social and cultural support are deliberately making a statement about their relationship with that community and calculate the effect of this measure as for any other input. 5.2.1 Benchmarking Frameworks
In October 2006, the corporate social responsibility Global Reporting Initiative launched G3, a third generation set of sustainability reporting guidelines that have effectively become the global standard39. The GRI-G3 guidelines state:
“The information in a report should cover topics and indicators that reflect the organization’s significant economic, environmental, and social impacts, or those that would substantively influence the assessments and decisions of stakeholders.”
At the Sustainable Design Forum held in 2007, Richard MacLean and Kathee Rebernek40 commented in their paper that there was a steady increase in corporate responsibility reporting among global companies and a building awareness that sustainable strategies can deliver value and competitive benefits. However, they pointed out that most users of the reporting system are large companies and that this reflects both the higher
39 www.globalreporting.org
40 Closing the Credibility Gap: The Challenges of Corporate Responsibility Reporting, Richard MacLean and Kathee Rebernek published online at
www.interscience.wiley.com 2007

__________________________________________
Syme Marmion & Co June 2010 Extractive Industries & Sustainable Regional Development Final Report 45
public expectations to which those companies are subject and the large environmental and social impacts of their operations. Among the top 100 corporations in 19 countries, approximately 50% of those in the utility, oil and gas, chemicals, mining and forestry products produce annual reports with pharmaceuticals, chemicals and forestry products sectors having the highest rate of reporting. Our research indicates that, since 2006, there has been a large increase in the numbers of corporations committing to corporate responsibility reporting although it is still true to say that the majority of participants are large public companies. The Commonwealth Government has also begun to subscribe to an accredited benchmarking system to measure performance in some departments. 5.2.2 Reporting Systems
Top quality reporting requires a strategic approach linking business strategy with internal measurement systems covering environmental, social and governance policies (ESG). A robust ESG metric system that includes social concerns relevant to the company as well as waste, energy use and other essential elements of good management practice will provide the basis for:
• Externally informed internal analysis of stakeholder concerns and their potential impact on the company’s business strategy
• Good verifiable data tracking performance • Establishing the merits and benefits of corporate social responsibility programmes
International research has highlighted three systems, currently in use as benchmarking frameworks by companies in the UK, Australia and New Zealand. There are other ratings systems, namely DJSI and Reputex, but the examples below provide the most appropriate formats for measurement of community sustainability and corporate social responsibility contributions. The Corporate Responsibility Index (CRI), the London Benchmarking System (LBG) and the Australian Centre for Corporate Social Responsibility (ACCSR), have been selected for the following reasons:
• The systematic and planned approach that makes it easy for a company to investigate the potential benefits and tailor a programme to suit their policy
• The ability to compare performance of companies within similar industry sectors • The already established use by Federal Government of the London Benchmarking System and, • The already established use of the Corporate Responsibility Index by major extractive industry
companies in Australia. 5.2.3 Corporate Responsibility Index
The Corporate Responsibility Index41 (CRI) is a business management tool that allows companies to measure their progress in the area including corporate social responsibility. Managed by St James Ethics Centre in partnership with the Sydney Morning Herald, The Age and Ernst & Young, the Index has been running in Australia for 5 years. Originally developed in the UK in 2001 through the not for profit organization, Business in the Community, that represents over 700 UK businesses, the CRI was developed in response to a survey of members and uses indices designed by over 80 leading businesses. The Australian CRI operates on a national basis with the option for companies with a global profile to link into the international performance index published by Business in the Community.
41 www.corporate-responsibility.com.au

__________________________________________
Syme Marmion & Co June 2010 Extractive Industries & Sustainable Regional Development Final Report 46
Participation in the Index is entirely voluntary, companies may opt in and out on an annual basis. One attraction for many companies is the private benchmarking option that allows them to develop and test a programme of measurement criteria, tailored to their custom and practice, before moving to public reporting at a later date. The CRI is therefore not only a tool for assisting companies to calculate the appropriate level of corporate contribution, but to establish how best to do it and how to measure the quality of the outcome. The St James Ethics Centre claims that there is a growing understanding by participating companies that, in taking corporate responsibility on board, they will achieve superior company performance over time. The areas most likely to benefit are cited as:
• A better understanding of company performance • Improved environmental performance and community profile • Greater business efficiency and management performance • Better exposure to new capital in changing consumer and investment markets • A stronger internal structure that builds staff capacity • Added attraction and retention of staff • Engaged board members with pride in the company they direct • Enhanced brand reputation and goodwill
In 2007 the Director of the St James Ethics Centre commended the Index’s participants for their corporate transparency and leadership in placing their company’s performance under public gaze and it seems that, increasingly, many international companies understand the value in being “seen” to operate on an ethical basis. The following comment from Niall Fitzgerald, former CEO of Unilever was echoed in our meetings with many of the large corporations with CSR departmental units, principally BHP Billiton, Rio Tinto, Woodside, Alcoa, The Griffin Group, Wesfarmers Premier Coal, Chevron and Fortescue Metals Group.
“Corporate social responsibility is a hard edged business decision. Not because it is a nice thing to do or because people are forcing us to do it …because it is good for our business.”
The Corporate Responsibility Index enables companies to assess the extent to which corporate strategy is integrated or translated into responsible practice throughout the organizations. It covers the management of 4 key areas:
• Community • Environment • Marketplace and • Workplace, plus • A range of social and environmental performance and/or impact zones
It therefore takes a holistic approach to corporate responsibility rather than separating out the areas of community, environment and issues such as occupational health and safety as is common in the extractive industries. To obtain a result that can be measured against others using the Index, each of these sections is assigned a weighting and an eventual score that can be fairly equated with other company results. Feedback from companies to St James Ethics Centre indicates that most participants have found it extremely useful, particularly in identifying ways in which the integration of a CSR policy offers opportunities to add value to the business. Among the described benefits are:
• A measurement tool that assists the development and implementation of responsible practice

__________________________________________
Syme Marmion & Co June 2010 Extractive Industries & Sustainable Regional Development Final Report 47
• Provides a means to build corporate responsibility issues into the business strategy • Encourages the internal co ordination of an organization as the CSR issues cut across many strategic
programmes • Provides a useful GAP analysis as, through confidential feedback, areas of strong and/or weak
performance are identified • Creates a benchmark that allows companies to compare their performance within and across sectors • Provides a communication tool with external stakeholders as well as within the company structure
In Australia, as in the UK, the CRI is a self assessment process signed off at CEO or Board level. Pricewaterhouse Coopers are currently the firm tasked with the validation process with the 2009 fee structure set as:
• Public Index $13,000.00 + GST • Private Benchmark $18,000 +GST
The fees include participation in CRI workshops and in house company presentations, guidance notes and a framework tor the development of a company specific programme, a validation service providing a breakdown and analysis of results and a confidential report on comparative performance with others. The CRI Leaders network includes ANZ, BHP Billiton, Energy Australia, Toyota Australia and Westpac Banking Corporation. Australian members also include Rio Tinto, Woodside, Unilever, Xstrata, Ergon Energy, Boral, Caltex Australia, Sensis and the Visy Group. 5.2.4 London Benchmarking Group
The London Benchmarking Group42 is an internationally recognized system for measuring and reporting corporate community investment (CCI). Again initiated in the UK, this system is used by approximately 200 companies worldwide to assess and value their community contributions. In 2008, 33 companies in Australia subscribed to LBG, managed in Australia by a division of Haystac Public Affairs Group, Positive Outcomes43. The LBG system was developed prior to most CSR ratings systems and its framework used as a template by the Corporate Responsibility Index and other rating systems. This has the benefit of not requiring duplicate systems for collecting and collating data. The LBG framework incorporates a means to track outputs, both community and business benefits, and to assess the leverage gained. It assigns a dollar value to inputs and is validated as part of the annual data collection process. Haystac Positive Outcomes numbers several Australian Federal Government agencies among its LBG clients, including the Australian Electoral Commission, the Department of Immigration and Citizenship, the Australian Sports Commission and the Australian Federal Police. 5.2.5 The Australian Centre for Corporate Social Responsibility44
ACCSR helps organisations create lasting value through responsible business strategies and productive stakeholder relationships. It aims to integrate corporate social responsibility principles and stakeholder approaches into mainstream organisation strategy as the key to creating lasting value for both organizations and stakeholders. It is a partner with La Trobe University Graduate School of Management, an Organisational Stakeholder of the Global Reporting Initiative and a signatory to the United Nations Global Compact. ACCSR is 42www.lbg-australia.com
43 www.haystacpositive.com
44 www.accsr.com.au

__________________________________________
Syme Marmion & Co June 2010 Extractive Industries & Sustainable Regional Development Final Report 48
certified by the Global Reporting Initiative to provide training in sustainability reporting in Australia and New Zealand. ACCSR describes itself as a highly specialised independent management consulting and training firm that combines a professional service approach with a commitment to driving higher performance standards. Services include:
• CSR framework and strategy development • CSR capability benchmarking and development • Stakeholder engagement and strategy development • Business case development • Merger and acquisition integration • Workshops
5.2.6 Relevance to the Extractive Industries in Western Australia
In 2008, the CRI reported that Corporate Strategy was again the reporting sector with the strongest performance demonstrating that most companies place corporate responsibility, including social and environmental issues, at the core of their business strategy. Under half of these companies have a nominated board member of senior executive with responsibility for each of the CRI core components – Community, Environment, Human Rights, Marketplace and Workplace although over half have a process that both integrates and upholds corporate responsibility principles throughout the organization. Importantly for this study, only 26% of companies are reported as including environmental and social assessment as a standard element of strategic decision making when considering investment, downsizing, restructuring, or taking on new partners and suppliers. Improving the environmental and social components of reporting as well as lifting the rate of participation by companies in the extractive industries may be of benefit to the State Government as well as the regional and remote Shires with significant exposure to the extractive industries. A requirement for participation in a Western Australian benchmark index for extractive industry performance has the potential to track industry activity on a number of fronts from indigenous training and employment to environmental issues and corporate social responsibility provisions. Run independently of government, an extractive industry index could publish a regular response to agreed criteria with companies using the same programme to measure additional areas of company performance for internal use. Across State Government agencies, an extractive industry performance index will provide an overview of contributions and compliance with State legislation in areas such as the environment and remediation, as well as other less defined areas, such as social impact studies and contributions to community, that may prove useful to determining the planning and likely support for additional community services.
__________________________________________
Syme Marmion & Co June 2010 Extractive Industries & Sustainable Regional Development Final Report 49
6. Documenting the Extractive Industries Commitment As a central part of the study, we conducted interviews with a range of companies, non government bodies and local government to document the commitment to and investment in regional communities in Western Australia. We found that only a few companies are responsible for an overwhelming proportion of the minerals, oil and gas produced each year in Australia. They have multiple sites and often a complex set of infrastructure including a port or rail line. They employ the majority of the extractive industry workforce in Western Australia and have a great depth of operational experience in both Australia and overseas. Certainly it is fair to say that those headquartered in Australia - BHP Billiton, Rio Tinto and Woodside - have developed long term relationships with local governments close to their operations as well as with State and Federal Governments. It goes without saying that each of the companies interviewed takes corporate social responsibility extremely seriously and has developed corporate social responsibility (CSR) policies in line with their company philosophy and that shared with other global miners through the ICMM. Our research showed that companies in the extractive industries may be categorized into four groupings that approximate their commitment and/or their ability to invest in communities. They are: Tier 1 Major international extractive industry companies headquartered in Australia Tier 2 Medium to large extractive industry companies headquartered in Australia and international companies
headquartered outside Australia Tier 3 Global consortia of international companies with Australian based extractive industry investments Tier 4 Medium to small Australian mining companies The spreadsheet in Appendix E sets out the level of annual contributions made by these companies. As expected, the information is readily available from companies in Tier 1 and almost completely unavailable from those in Tier 4. Overall, we believe that, while it is important to acknowledge and support the voluntary CSR contributions made by companies in the extractive industries, advocating that this principle this is replicated by newcomers to resource extraction operations in WA, it is not an acceptable substitute for the regular payment of an assessed contribution to the maintenance and upkeep of community infrastructure. Our research found firstly, that where extractive industry companies are required to do this in the form of rates, it has not adversely affected their CSR programme or their relationship with local government and secondly, that such a system ensures that all extractive industry companies contribute to the practical, physical sustainability of the community in which they are located, however remote or seemingly self sufficient.
6.1 Tier 1: BHP Billiton, Rio Tinto, Woodside
Although the commitment to “a social license to operate” is voluntary, it is deeply embedded in the corporate principles that govern these companies. The companies recognise the importance of looking after the natural and social environments in which they operate and understand the economic value of a workforce that repays the company’s investment in their training with loyalty and long service. Each of these companies is distinguished by the fact that they have built, owned and managed company towns in Australia and is therefore fully conversant with the requirements and commitments to families and the workforce that is needed. Although the company towns are almost all completely normalized, there is still a great sense of company attachment in the communities. Still major employers in the area, Karratha is definitely a Rio Tinto and Woodside town, Port Hedland and Newman are BHP Billiton towns with South Hedland more associated with both Rio Tinto and a mining company currently placed in Category 2, Fortescue Metals Group.

__________________________________________
Syme Marmion & Co June 2010 Extractive Industries & Sustainable Regional Development Final Report 50
6.1.1 BHP Billiton
We found that although BHP Billiton was the only company to actually publish a figure for their worldwide annual contribution to community investment, at 1% of total earnings before tax, this company was in a category with two other extractive industry giants, Rio Tinto and Woodside. In addition to a more generalized corporate philanthropy centred on State institutions and activities in the State capital, each of them has conducted detailed research to identify pressing issues for regional towns where a significant proportion of their workforce lives, and have formulated their community investment programmes accordingly. In addition these three companies have developed strong and active partnerships with local government, helping them to prepare accurate, practical strategic plans that have created opportunities for increased State and Federal Government funding. Woodside has been instrumental in the preparation and publication of Karratha 2020 Vision and Community Plan for the Shire of Roebourne45, BHP Billiton with the development of the Town of Port Hedland Strategic Plan46 and Rio Tinto with baseline surveys of Dampier, Karratha, Roebourne, Wickham, Tom Price, Pannawonica and Paraburdoo. In July 2008 BHP Billiton and The Town of Port Hedland made a joint submission to the Australian Government Standing Committee on Infrastructure, Transport, Regional Development and Local Government in respect of an inquiry into a new regional development funding program.
45 http://www.roebourne.wa.gov.au/Assets/Documents/Karratha2020Report.pdf
46 http://www.porthedland.wa.gov.au, Plan for the Future 2008-2013

__________________________________________
Syme Marmion & Co June 2010 Extractive Industries & Sustainable Regional Development Final Report 51

__________________________________________
Syme Marmion & Co June 2010 Extractive Industries & Sustainable Regional Development Final Report 52
In addition to assisting local government to survey the community and identify strategic issues in a planned framework that can be placed before State and Federal Government, these large extractive industry companies are addressing local issues of capacity in direct and practical ways, using assets that they already hold and adding value to them. The standout example in this area of community investment is childcare in the Pilbara region where BHP Billiton have partnered with the not for profit sector company, YMCA Perth, to develop the Pilbara Childcare Strategy. Two centres, in Port Hedland and Newman, are being constructed in an initiative valued by the company at $20 million. BHP will construct and equip the premises, invest in staff training and provide accommodation for childcare workers at the new centre. It will also support training and provide grants to existing childcare businesses. And finally, following 15 years of successful operation, it will hand over the building to the YMCA. Woodside have partnered with the State and Federal Governments to build an Early Learning Childcare centre in Karratha at a local primary school. This initiative will create an additional 120 long day care places when it opens in 2010. Consultation has also begun for a similar project in South Hedland. Both BHP Billiton and Woodside stated that they do not wish to run or manage childcare centres, but that they recognise the importance of childcare to their employees and, in Woodside’s case, had calculated that the cost of providing each place outweighed the loss of a highly trained employee and contributed to a reduction in staff turnover. Both Rio Tinto and BHP Billiton have matched giving programmes in which employees are encouraged to volunteer within their community and mechanisms to support employee fundraising for charities.47 Statistics for 2008 are given below for BHP Billiton.
6.1.2 BHP Billiton Iron Ore
The BHP Billiton programme of community investment is also based on research and community consultation underpinning the sustainability of regional towns. It reflects the value expressed in the company charter, Code of Business Conduct and Sustainable Development Policy among others. The desire to leave a “legacy” was expressed on more than one occasion during interviews with representatives of BHP Billiton Iron Ore. In 2008, BHP Billiton partnered the Town of Port Hedland to develop “Hedland Future Today” an initiative aimed at developing Port Hedland into a major, sustainable regional centre. The programme is aimed at partnership funding with all tiers of Government and extractive industry leaders with a stake in both Port Hedland and South Hedland also sponsored by BHP Billiton to the tune of $8 million per year for 5 years. It has partnered a similar visioning document for Newman that has been incorporated into the Shire of East Pilbara strategic planning document. 47 BHP Matched giving programme details at http://www.bhpbilliton.com.au/bbContentRepository/docs//200933164980/bhpBillitonIronOreSustainabilityReport2008.pdf

__________________________________________
Syme Marmion & Co June 2010 Extractive Industries & Sustainable Regional Development Final Report 53
BHP Billiton has been instrumental in the preparation of a vision document for Newman, Newman Tomorrow which has informed the Shire of East Pilbara’s Strategic Plan. The figure opposite describes the level of collaboration and co ordination needed between all tiers of government, the community and corporate bodies to obtain truly sustainable community outcomes.

__________________________________________
Syme Marmion & Co June 2010 Extractive Industries & Sustainable Regional Development Final Report 54
6.1.3 Rio Tinto Rio Tinto has 25% of its global assets located in Western Australia and has been working towards a unified
community investment strategy since 2006. They focus on creating strategic alliances that are in line with their business needs and those of society in general, but particularly those which invest back into the communities surrounding their mines. In 2007, Rio Tinto community contributions totaled close to $36 million, including $12.3 million for community investment funding, $20 million in direct payments related to native title and the $3.5 million cost of managing these funds. This does not include the town infrastructure, utilities and maintenance costs of running the notionally normalized towns of Dampier, Wickham, Tom Price, Paraburdoo and Pannawonica in which Rio Tinto still own 2516 houses, the provision of 124 houses allocated to medical staff, government employees and community workers, their apprenticeship and trainee programmes or expenditure from the Rio Tinto Aboriginal Foundation.48The Rio Tinto WA Future Fund “manages strategic partnerships to deliver long term, State wide
48 Our Contribution to Western Australia Rio Tinto Community Investment Review 2007

__________________________________________
Syme Marmion & Co June 2010 Extractive Industries & Sustainable Regional Development Final Report 55
projects”. In 2007 this amounted to $1.7 million being distributed to 11 community organizations. The diverse range of projects funded includes Conservation Volunteers Australia, in which 22 key projects benefitted from 767 volunteer/days, the Rio Tinto Child Health Partnership with the Telethon Institute for Child Health Research and other partners, the Scitech Roadshow, and homework centres run by the Polly Farmer Foundation in the Gascoyne, Kimberley and Pilbara. 6.1.4 Woodside
In 2008 Woodside committed more than $10 million to fund a range of community initiatives supporting the arts, environment, education, sports and indigenous programmes. To identify many of these initiatives, Woodside runs a straightforward community grants programme through an annual grant round lodged in Karratha and Perth that parallels many other cultural grant application processes. In addition to their commitment to Karratha 2020 strategic plan and vision with the Shire of Roebourne, Woodside has continued to build partnerships that will result in improved services and infrastructure for Karratha, committing to spend $1 million per year for 5 years on health services and to the building of additional housing for construction workers. To ameliorate the contention over their use of the site on the Burrup Peninsula, Woodside supports rock art research, local art and language programmes and funds a rock art scholarship. A focus for Woodside’s community investment commitment is the attraction/retention rate for the residential workforce in Karratha. When that rate was found to have increased by a factor of 6, the company carried out an investigation into why. They found 4 key reasons:
• The expansion of global markets created opportunities overseas for staff • Many people had ‘done’ 20 years in Karratha and felt it time to move on • The town was tired, it had originally been built with a 25 year life expectancy under the terms of the
Woodside State Agreement for the NW Shelf and little investment had been made since • Woodside’s culture may have become too cost focused
6.1.5 Tier 1: Scope of Corporate Social Responsibility Contributions
The three companies identified in Tier1 can be regarded as the industry leaders. They are the benchmark for others to follow, driven by a commitment to their own company values and internationally adopted principles of sustainable operation shared with their peers. Each one has a slightly different approach and corporate process through which it invests in community. However the diversity of contribution reaches out to include people in all walks of life and many parts of the State. While they are all focused on investing in communities where they gain recognition, support and value for money in the form of loyal employees, they cannot and should not be penalised for this. Where Woodside has a group of FIFO workers, as for instance in Busselton, it can be expected to invest in that community as well as in Karratha and, where BHP Billiton has had to retrench a group of workers such as Ravensthorpe it will retain an interest in assisting that community to adjust following the closure of the mine. Discussions with officers engaged in community investment for each of these companies has led us to believe that the level of contributions will continue to reflect the serious commitment of the extractive industries to their communities. They are actively developing partnerships with non government organisations, local government and community groups that will enable them to address a deficiency in the community without becoming involved in the day to day management. Their increasingly strong relationships with local governments in the

__________________________________________
Syme Marmion & Co June 2010 Extractive Industries & Sustainable Regional Development Final Report 56
remote extractive industry regions has the ability to dramatically improve the capacity of local government and, to make a valuable contribution to regional planning and proposals for population growth. These are the companies who will be most concerned about the implications of changes to existing State Agreements that will modify or remove the local rates exemption clauses on a case by case basis as they require amendment or variation. They will wish to ensure that they are able to hand over those responsibilities for communities that they still hold.
6.2 Tier 2: Fortescue Metals Group, Wesfarmers Premier Coal, Griffin Coal and Iluka
The major Australian companies placed in this second category are equally committed to the principles of corporate social responsibility (CSR) and focus on maintaining a sense of community, particularly where many employees are residents of communities close to their mining operations. Their sense that, “what is good for the community is also good for us”, came through strongly. 6.2.1 The Collie Coalfield: Premier Coal and Griffin Coal
The town of Collie, a stable community in the South West of WA, has been the hub for coal mining for over 50 years. Both Wesfarmer’s Premier Coal and The Griffin Group have been conducting mining operations there for generations, and will probably continue to do so although The Griffin Group is currently battling to survive. There is a strong sense of community in Collie where pleasant local conditions have resulted in high attraction/retention rates. Premier Coal told us that over 80% of their workforce lived “in town” and that over 50% of them were employees with greater than 20 year service records. Given this stability, the major employers in the town are conscious of their status as local benefactors and support the Shire of Collie as well as the annual community calendar of arts and cultural events. CSR is seen as essentially about maintaining the quality of life for the people of Collie and the new suburbs of Bunbury. Premier Coal has developed a strong relationship with the South West Development Commission and, through them with the WA State Government Departments of Sport and Recreation, Conservation and the Environment. This relationship has resulted from a desire to do more than simply remediate exhausted open cut pits. One is now recycled for as a regional Motorplex, used for regular racing and driver training, and the other has been renamed Lake Kepwari, a recreational boating lake. Large infrastructure projects such as this mean that Premier Coal’s annual contribution to the community fluctuates from year to year, but they consistently provide close to $500,000 per annum in cash and kind, including support in work time for employees who are involved with volunteer organisations and community groups The Griffin Group employ one full time employee in Collie to run their major community investment, the Griffin Festival, as well as administer the annual community grants funding round, judged by community members. 6.2.2 Fortescue Metals Group
Fortescue Metals has chosen to base its community development unit in South Hedland Shopping Centre, at the heart of the community that houses many of its workers. While FMG is relatively new to the extractive industry, having been operational for 4 years, and does not yet have the solid base of the extractive industry majors in Category 1 or the length of time on site of Griffin Coal and Premier Coal, they have developed a particular approach to community development. FMG has invested in professional community development expertise and made it known in Hedland and Newman that they will help where they can. Their policy of “We’ll do it with you, but not for you” means that they are becoming popular volunteers at a range of North West events and in South Hedland where they have based their Community office. The policy of “in kind” contributions is extended to employees who volunteer in company time. As one example, employees with an
__________________________________________
Syme Marmion & Co June 2010 Extractive Industries & Sustainable Regional Development Final Report 57
interest in motor racing and accident/emergency training regularly attend local motor racing events as emergency response teams and, in another, they offer support to FESA in cases where additional fire crews are required. Fortescue have a policy of logging this employee time and in kind contributions allowing them to value their annual direct community investment in the Newman Rode event this year at $64,000.00 It is well known that FMG have placed a lot of value and energy into their indigenous training and employment scheme, VTec, but this is run separately from the community investment programme. However, the community development officer’s experience in human resources management has been able to make a contribution to the quality of life in on site worker accommodation and to support for trainees’ families. 6.2.3 Iluka
Iluka is a mineral sands mining operation that has been operating in the South West and Mid West of WA for a number of years. Their community development and sponsorship programmes have been winding back in the last few years, partly due to the declining prospects for mineral sands in the South West, but also because they have not felt that their policy of support for community sporting events in the South West, such as the Busselton Jetty Swim, has been entirely successful. Iluka receives a lot of negative response from the community and they struggle with community antipathy for many of their projects. The location of the mineral sands on farming land and bush in the South West of WA to bulldoze the topsoil before extracting the shallow layer of minerals sands beneath. Carting the sand to the processing plant and then returning it to site, creates dust and increases heavy truck activity on rural roads. Iluka is then required to rehabilitate large expanses of land and to return it to normal use. Although Iluka does not need a large workforce to operate, the need to lay off some workers at the processing plant near Capel was not well received locally. Iluka is finding it hard to communicate to the community that mining is a finite process although it is well known that the natural life of many projects in the South West are coming to an end. When this happens, they intend to retain the processing plant at Capel, but bring in minerals sands for processing from farther afield. Iluka’s management wishes to leave a company “legacy” for the South West and has partnered with the Shire of Capel to underwrite the new Shire library. There was no formal process we have been able to identify for selecting this project which appears to have been selected as a result of personal relationships between the company and the local Council.
6.3 Tier 3: International Miners, Multi National Consortia and JV
As the extractive industries have grown, Australia, with its stable political framework and rich resources has attracted companies from all over the world to invest as and where they can. Many have experience of working in third world countries and others bring expertise, access to export markets and funding for exploration.
6.3.1 Newmont Mining
Newmont is a global company based in the US with a medium size presence in Australia. It is a joint owner with Barrick Gold of the Superpit in Kalgoorlie and has recently re opened the Boddington Gold Mine. It is a signatory to Enduring Value, the Australian Minerals Council initiative on sustainable development and the first gold company listed on the Dow Jones Sustainability Index World.

__________________________________________
Syme Marmion & Co June 2010 Extractive Industries & Sustainable Regional Development Final Report 58
The Boddington Mine recently poured its first gold for many years, from gold seams and mineral ores estimated to have a 20 year life span. The mine is already contributing to the sustainability of the local community as an important addition to the local agricultural economy as well as to its long term growth. In addition to its location in the SW of WA, already a prime drawcard for “mining industry families”, Boddington is close enough to Perth and Bunbury for it to be popular place to work, reducing the need for FIFO. Rents in the town are approximately $200 per month more expensive than in similar sized country towns in the South West, even the holiday town of Margaret River. Newmont have adopted a Buy Local, Hire Local policy and operate their key CSR programmes through the Boddington Gold Community Environment Committee, established in 2006 as part of Newmont's commitment to keeping the community informed on key environmental matters related to the mine. Committee members engage with local stakeholders, develop partnerships and work with Newmont's environmental staff and the Traditional Owners on developing and implementing an exit plan and future land use plan for the site. The committee also identifies and works on key environmental projects, and in 2008, focused World Environment Day activities on vulnerable fauna, including Carnaby's Black Cockatoo. It has continued this support extending activities in 2009 to support for the Hotham River Boardwalk development and the improvement of information and rest areas along the Bibbulmun Track. 6.3.2 CiticPacific
CiticPacific’s remote Cape Preston magnetite ore mine site is under construction. The Chinese backed company has taken care to find out what the expectations are in WA regarding the social license to operate and sees its community contributions and connections to the Shire of Roebourne and the community of Karratha, in two distinct stages. The current construction phase is likely to continue until 2011 or early 2012 with the main activity centred within the self contained construction camp and a purely FIFO workforce. During this period CPM is carrying out the commitment in its State Agreement to source 70% of goods and service from Australia over the life of the project by encouraging local business to become involved as suppliers through the Karratha Chamber of Commerce and Industry and the State Government Project Connect website. In addition CPM has launched a periodical newsletter, Magnitude, become a major sponsor of the Cossack Art Award and is supporting community projects in Roebourne with indigenous groups. The company would prefer that the difference between the operations workforce (long term FIFO with some DIDO from Karratha) and the construction workforce (short term FIFO) to be better recognised by the community. The construction workforce is much larger; the camp can contain approximately 2,000 workers who are contracted for specific elements of the construction process and may only be on site for one roster period (3 weeks) and, their job completed, never return. However, once the operations workforce takes over the camp and production commences, the camp will have a lower occupancy rate and employees, or those on long term contract, will be encouraged to develop connections with the Karratha community and participate in local events given that it is still a relatively long way from Cape Preston to Karratha. CiticPacific feel that they do not have a lot of impact on Karratha itself, but that they do need to develop and maintain a relationship with the Shire of Roebourne. They already spend a significant sum of money each year in payment of airport fees and various development applications relating to the project. They look after the camp ground at the mouth of the Fortescue River in an informal arrangement with the Shire. The huge magnetite deposit and level of investment in mine infrastructure ensures that they will be in Western Australia for the long term with construction of a freight rail line and port at Cape Preston. Their State Agreement does require them to pay Shire rates on elements of their lease and they are keen to resolve any issues that may arise from the recent amendments to the Local Government Act 1995 as well as to understand the implications of any variations required to the Agreement in the future.
__________________________________________
Syme Marmion & Co June 2010 Extractive Industries & Sustainable Regional Development Final Report 59
6.4 Tier 4: Medium and Small Mining Companies
These companies, not surprisingly, make up the greatest number of mining companies but contribute a small proportion of total mineral production by weight although the value of the minerals tends to be higher per unit (gold or lithium for instance). These mines tend to have shorter lifespans, the risk is usually higher and the operating budgets much smaller. Technology and modern machinery together with the development of FIFO have made it possible to live and work in previously inaccessible territory or on claims that were previously regarded as uneconomic. The workforce is generally housed in temporary accommodation onsite and unlikely to spend time in local communities. Local government needs to approach these mining companies and develop relationships that can lead to real economic and even employment benefits for the community as opposed to the simple sponsorship of a local event, however welcome that may be. Opportunities may include service contracts such as cleaning, laundry and catering or the maintenance of vehicles and equipment. Recent amendments to the Local Government Act 1995 have made it more obvious to local government in these remote areas that mining companies are not exempt from payment of Shire rates. It is important that these companies are required to pay the basic rate on unimproved land (UV) and that Shires investigate the application of a differential rate to take into account the impact of the miner on Shire infrastructure such as roads, fresh water supplies and waste disposal sites. In addition, the ability to approach the Minister for approval to spot rate (GRV) capital improvements at mine sites (excluding machinery) should re define the relationship between the local government and the mine and place it on an equal footing with other businesses in the Shire. 6.4.1 Saracen Gold
Saracen Mineral Holdings Limited has become an Australian mid-tier gold producer with production beginning at the Carosue Dam gold project in early 2010. Carosue was acquired from St Barbara and is a FIFO operation requiring minimal refurbishment to get it into production. Gold will be produced at an initial rate of 120,000oz pa from within the South Laverton region of Western Australia with the first, initial stage expecting to be mined over 2 to 5 years.
Like others in this tier, Saracen does not have a State Agreement and is therefore subject to payment of the local government rates on unimproved land (UV). In this case, with the approval of the Minister, the Shire of Menzies is able to apply a differential rate for mining leases. The Shire is also at liberty to request approval for a spot rate (GRV) at the company’s mine sites.
6.4.2 St Barbara Mines
St Barbara, together with the local Minara Community Foundation and BHP Billiton Nickel West, is a major sponsor of the annual Leonora Golden Gift weekend. The company also sponsors the Leonora Foundation Day and providing funding for the development of a purpose built learning centre at the local kindergarten and the Songroom initiative at the Leonora District School, designed to stimulate creativity, enhance learning and self-esteem. Consultation with key stakeholders in the area has expanded in line with growing mining activities at Southern Cross where, together a tree planting/rehabilitation programme at one of the Company’s projects was carried out with the local school. 6.4.3 Minara Resources
Minara Resources has a community relations strategy with long term relationships fostered over many years. The company considers these as vital to the operational and financial success of the company. It therefore established the Minara Community Foundation in 2007 under the umbrella of the Western Australian Community Foundation (WACF) to benefit Aboriginal people in the Northern Goldfields region and others people affected by mining operations at Murrin Murrin as the core strategy of its CSR policy.

__________________________________________
Syme Marmion & Co June 2010 Extractive Industries & Sustainable Regional Development Final Report 60
Minara Resources made an initial contribution of $1 million with a further $250,000 per year for five years. The capital has been invested and the annual contribution plus a portion of the return on the investment will be made available each year as grants for use by the community. The Foundation supports projects that provide economic, social, cultural and heritage benefits. It is used to assist in funding essential communication and transport services, and programs and initiatives for future generations. Grants are assessed by a local committee made up of members of the Northern Goldfields community, industry and Minara Resources. A total of 18 applications were received in 2008 for the Foundation's inaugural annual commitment, with nine projects totalling $249,100 approved for funding. Significant commitments included:
• $55,000 to the Karlkurla Language & Culture Aboriginal Corporation's Language Maintenance program • $68,000 to the Menzies Aboriginal Corporation for replacement of a vehicle • $50,000 to the Shire of Leonora, in support of the Leonora Golden Gift community and sporting
carnival

__________________________________________
Syme Marmion & Co June 2010 Extractive Industries & Sustainable Regional Development Final Report 61
7. Current Community Capacity In the context of Western Australia, the Bruntland Commission’s definition of sustainable development needs to be paralleled and supported by a local overview of community sustainability.
7.1 The Historic Mining Communities
Many of the State’s towns and rural communities, particularly those in areas where mining is the dominant industry, are not only unlikely to enjoy an increase in their population, infrastructure and economic base in the future but may, like many of the mining communities of the 19th century “Gold Rush”, be eventually abandoned once the local ore bodies are exhausted. Traditionally tough and resilient, these communities are peopled by independent and resourceful individuals who have a strong social and cultural attachment to their lifestyle. For them, community sustainability is maintenance of the status quo. Loosely, these may be determined as:
• Maintaining current levels of access such as roads and air strips • Retaining current levels of health care and education • Retaining or improving access to appropriate employment, education, training and healthcare • Maintaining and remediation of the local natural environment • Affordable high speed access to communication technology • Support for voluntary and NGO aged care services in the community
In spite of the resources led boom in Western Australia, regional community growth continues to be slow, chiefly due to a lack of skilled personnel in regional areas able to stimulate growth. The attempt to fast track the emergence of a new residential community at Ravensthorpe is perhaps a good example where expert knowledge and regional planning rather than a pure focus on community consultation might have resulted in a more sustainable outcome for the community. When the nickel price collapsed in 2008, the mine closed and, in a reminder of the risks inherent in the resource sectors, 1800 people were made redundant and the future of many newly established small businesses placed in doubt. The sale of the mine to Canadian interests and its re opening is a welcome reprieve for the community but who will hopefully continue current efforts to diversify their economy into tourism and agriculture. 7.1.1 Planning for Mine Closure
The experience of Ravensthorpe raises the subject of planning for mine closure and the capacity of the community to survive the impact of such major change. In May 2009 the Curtin University’s Centre for Stronger Communities conducted a rapid appraisal of the mine closure. They found that the mine, in its short existence, had added a younger element to the local population, reversing population decline and boosting the local economy. There is a new understanding of the importance of a diverse economic framework in which mining is one component, and that the community is much better skilled as a result of the mine. Many people have stayed in the area drawn to its lifestyle qualities, and this is a net benefit to the Shire. With the mine under new ownership it will be a key objective of local government to work on planning an exit strategy and to resource economic development in Ravensthorpe Shire. Such economic development needs to be carried out in partnership with the regional centre of Esperance, creating strong links to ensure that the residents of Hopetoun have access to opportunities, facilities and services that may not be available in a rural Shire.

__________________________________________
Syme Marmion & Co June 2010 Extractive Industries & Sustainable Regional Development Final Report 62
7.2 Defining Sustainability in Regional WA Communities
The range of rural and remote communities in the extractive industry regions, particularly those in the North West, and the different futures that they are currently facing is illustrated by comparing an historic mining township like Cue with Kununurra, a relatively new town that sprang up in response to the damming of Lake Argyle. Cue is a typical Australian country town, a dry, inland heritage gem that is in decline, losing over 20% of its population between 1997 and 2006. In the same period, Kununurra, with a much more contemporary suburban layout on the shores of the diversion dam for Lake Argyle, has grown by between 10% and 20%.
Currently appearing to be struggling, in a region where smaller mining operations proliferate, the Shire of Cue is able to increase the sustainability of its community in two ways. Firstly, by seeking approval from the Minister to apply a differential rate for unimproved land on mining leases and to have capital improvements on mine sites assessed for a ‘spot rate” using the calculated gross rental value (GRV). And, secondly, by considering the potential benefits from amalgamation with neighbouring shires as encouraged by the Local Government Reform process. The holders of mining leases in the Shire, who mostly use FIFO workers accommodated on site, claim that they have little to do with the local community. However, there is inevitably some level of impact on Shire infrastructure and no reason that the miners should not pay a similar contribution to other commercial enterprises in the Shire in the form of assessed local government rates. From studies conducted by Murdoch University it seems that these two initiatives, if coupled with a drive to promote a “Buy Local” program will provide the residents of Cue and similar Shires with sufficient income to enable them to maintain the status quo and retain a self sufficient lifestyle regarded as quintessentially Australian. Kununurra is however, thriving due to its much more diversified economy and more fertile, verdant location. It is a growing destination for tourists as it is close to several national parks and popular with travellers driving around Australia. It is supported by its proximity to the Argyle Diamond Mine and as the regional hub for the Ord River Irrigation Scheme, now entering Stage 2 development. The town’s infrastructure has, for some years, lagged behind its capacity but received substantial Federal Government funding in 2009 for new and expanded schools, hospitals, transient accommodation, social housing and airport facilities. With ample water and good transport links across the North West, Kununurra is likely to experience strong population growth as Stage 2 of the Irrigation Scheme creates the potential for a fresh food supply hub in the region.
7.3 Building Community Capacity – Local Government
While some local governments, such as the Town of Port Hedland and the Shires of Roebourne, Ashburton and East Pilbara, have been in a position to build corporate partnerships that contribute to better long term economic and social outcomes for their communities, others who do not have big company connections are struggling to survive. In the Mid West several local governments are considering the option to amalgamate as a mechanism for survival, increasing the capacity of local government through scale. In the Goldfields
On the left, the old mining dependent town of Cue On the right, the modern layout of Kununurra, close
to Lake Argyle and the Ord River Irrigation Scheme

__________________________________________
Syme Marmion & Co June 2010 Extractive Industries & Sustainable Regional Development Final Report 63
Esperance region the historic mining communities of Meekatharra, Cue and Menzies continue to shrink, although the Shire of Menzies has begun to follow the lead taken by the Shire of Leonora in seeking approval to levy a differential rate on mining leases (UV), raising them 10% per annum against 4% for other sectors. 7.3.1 Local Government Amalgamation and Regional Groupings
A recurrent theme of the consultation process was a perceived lack capacity in small, regional local authorities to plan for the future. In towns such as Karratha and Port Hedland the major extractive industry companies have formed partnerships with the local government to support the strategic planning necessary to achieve a sustainable future for communities in the region. BHP Billiton, Woodside and Rio Tinto assisted and supported community surveys, needs analysis and consultation leading to Strategic Plans that have been informed by social impact analysis conducted by the companies. This step is understood at the local level as a key driver of their success in attracting funding under the State Government Royalties for Regions programme further success at the Federal level through the Regional Development Australia programme. The four local authorities in the Pilbara, the Shires of Roebourne, Ashburton, East Pilbara and the Town of Port Hedland have also recognised that they have shared interests better addressed as a regional group. They have formed the Pilbara Regional Council, (PRC) and merged their Strategic Plans into a regional document, The Pilbara Plan. In the Mid West, the Batavia Regional Organisation of Councils (BROC) is collaborating on a regional strategic waste management project and potential impact of climate change. Further amalgamations are in development in the wake of the successful merger between the City of Geraldton and the Shire of Greenough. 7.3.2 The Effect of Scale
The increase in capacity as a result of increased administrative scale can be substantial. The City of Geraldton-Greenough has a better resourced local government with added capacity able to centralise planning, record keeping and service delivery. Following the expected second round of amalgamations, the local government area will be comparable with the Shire of Roebourne and the Town of Port Hedland but with a significantly larger population. Whether or not the Shire of Chapman Valley is a part of this process or not, the City of Geraldton-Greenough will have a large role to play as the regional service and administration hub for the Oakajee Port and Rail facility and developments including Extension Hill and Karara Mining, the joint venture formed by Gindalbie Metals and China’s AnSteel Group. As one of Western Australia’s three largest regional cities, Geraldton-Greenough is at the forefront of a growing economic extractive industry profile to add to its long standing agriculture and fishing industries. Current strong population growth in the residential sector as families relocate to take up the many employment opportunities also means that the City is increasingly positioned to lead regional planning initiatives in the Mid West. This level of capacity is shared with cities and towns in the South West of WA, Mandurah, Bunbury and Busselton who find their status as “home ports” to FIFO workers is driving development and providing access to corporate support from the extractive industries. However, the increase in population has not yet been matched by the development of new employment opportunities in the South West to provide jobs for a workforce that will “come home” one day. While the focus is currently on the development of industry in the Mid West and North West, these regional population centres also need to plan for the future by creating opportunities for business enterprise and growth. 7.3.3 Potential for Tripartite Partnerships
The current expansion of the extractive industries in Western Australia presents the opportunity to look at the potential for three way partnerships as tools to increase sustainability. The Oil, Gas and Mining Sustainable
__________________________________________
Syme Marmion & Co June 2010 Extractive Industries & Sustainable Regional Development Final Report 64
Development Fund (CommDev)49 working with the World Bank, promotes partnerships between companies, communities, government and the non government sector in its portfolio of guidance companies seeking to comply with the sustainable development principles of the ICMM through utilising the strengths of each participant, reducing duplication and pooling resources to tackle larger problems. An example of this type of partnership in WA is a pro active relationship between Premier Coal and the South West Regional Development Commission that has led to development of two new regional sport and leisure venues, the Motorplex and Lake Kepwari, as positive and practical outcomes from the environmental remediation of exhausted mine sites. The potential for similar arrangements in the North West could be enormous, particularly where a “Buy Local” type of development policy exists. We met with non government and community groups, such as the Ngarluma Yindjibarndi Foundation in Roebourne, keen to develop new businesses including commercial laundries, catering services, vehicle and machinery servicing centres, prefabricated house construction and regional logistics centres as well as to build on their relationship with Woodside50. In Perth, we consulted the Western Australian Community Foundation (WACF)51, set up by State Government and four cornerstone private sector partners including Alcoa, in 2007 as an independent “umbrella” administration for endowed funds. 7.3.4 Application of Differential Rates on Unimproved Land
In 2007 the Shire of Leonora, faced with a declining population and insufficient revenue to carry out essential services researched the potential to apply a differential rate to unimproved land leased for mining purposes. The following is an extract from Council’s minutes of 1st May 2007. “The Land Administration Act 1997 brought about several changes with respect to pastoral leases. One of these was that the Valuer General was required to determine market ground rents from 1st July 1999. The revaluation of pastoral rents for 1st July, 1999 was undertaken in consultation with valuers, undertaking the project with stakeholders, including the Pastoralists and Graziers Association of WA Inc, pastoralists, the Department of Agriculture and the Pastoral Lands Board. The Act provides that rents of pastoral leases must be determined by the Valuer General as at 1st July each five years after 1999. This means that a re-valuation occurred in 2004, the next being 2009. The Land Administration Act 1997 provides that the annual rent payable for a pastoral lease is the amount, as determined by the Valuer General, of a ground rent that the land might reasonably be expected to realise. Pastoral lease rents are, by definition, ground rents for the rangeland only and exclude all improvements as these are the property of the lessee. The factors taken into account in the assessment of ground rents are:
• The quality of the land systems comprising the lease • The location of the lease • A drought prone factor. (in some cases) • An allowance for difficulty in obtaining water • A sheep and cattle differential
The rental value is based on a different rent for each class of rangeland (where "class" is pastoral potential carrying capacity), multiplied through by the area of each class on the station. This value is then adjusted for other factors as set out above.
49 CommDev.org
50 www.woodside.comau/NR/rdonlyres/.../)/IndigenousDIalogueweb.pdf
51 www.wacf.org

__________________________________________
Syme Marmion & Co June 2010 Extractive Industries & Sustainable Regional Development Final Report 65
Factors relevant to the 2004 review may have included:
• The value of cattle and sheep stations • Other permitted uses (non-pastoral) • Environmental and conservation issues • Outcomes of rangeland resource review surveys
Under the Local Government Act 199552 there are a number of discretionary mechanisms available to local government that with potential to achieve more equitable distribution of rates on properties and better reflect the capacity to pay. Differential rating, described above, is designed to give local government more flexibility in setting a value for property according to its zoning, its predominant use, whether it is vacant or any other characteristics or a combination of characteristics as prescribed in the regulations. Since 1st July, 1999 pastoral property rentals, on average, have increased by about 120%. On the other hand mining tenement rentals have increased by about 20%. Rating data confirms that most local governments are reasonably consistent in their approach to the rating of pastoral leases, with the mining impost generally higher and across a wider range of rates in the dollar. In 2009/2010 Budget documents Shire (of Leonora) rates were listed as:
• GRV Rate in the $: 7.53 cents • UV Rate in the $: 11.02 cents • UV Pastoral Rate in the $: 7.02 cents • Minimum Rate GRV $220.00 per assessment, previously advertised on 23/4/09 at $210.00 per
assessment • Minimum Rate UV $220.00 per assessment, previously advertised on 23/4/09 at $210.00 per
assessment • Minimum rate for a Mining Tenement that crosses adjoining Shire boundaries $110.00 per assessment
The Shire received a Letter of Ministerial Approval to impose a minimum rate charge on more than 50% of total properties.” Consideration has been given in the past by State Government to replacing "unimproved value" with new categories such as "pastoral value" and "mining value". It was decided that:
• This would impact on a large number of pieces of legislation • It would be a very costly exercise • Existing legislation, including the differential rating provisions, was seen as being able to
accommodate these and future changes.
Local governments in Western Australia are consistent and reasonably equitable in their approach to the rating of pastoral leases with the 1999 and 2004 reviews of ground rents by the Valuer General resulting in some significant changes in relativities between leases, a process that will have continued with the 2009 review. 7.3.4 Changes to State Agreements
The WA State Government announced in late 2009 that exemptions from payment of local rates will no longer be a feature of State Agreements with current exemptions to be reviewed on a case by case basis as those State Agreements require variation or amendment. Recent signatories such as Fortescue Metals Group, Chevron and CiticPacific reported to us that they pay Shire rates on industrial property, railway lines and
52 Local Government Act 1995 Section 6.33 and Section 6.36

__________________________________________
Syme Marmion & Co June 2010 Extractive Industries & Sustainable Regional Development Final Report 66
industry infrastructure sites on the Australian mainland. This change has the potential to benefit both local government and the extractive industries as:
• Companies still providing essential services to communities ostensibly ‘normalised” will be able to divest themselves of this responsibility knowing that the local government will have the revenue to take on the operation and maintenance of plant, and return their focus to the core business of mining.
• Local government better able to manage their community and apply for available infrastructure funding.
7.4 Identifying Regional Hubs - The Need for Criteria
It is at the regional level that long term planning for communities in the State’s extractive industry regions must come together. The scale of the regions and scarcity of basic elements of community infrastructure, such as power and water, are likely to mean that urban populations will coalesce around a hub where these services are available and major infrastructure investments in utilities and services can be shared. (See Appendix D Infrastructure Benchmarks) Inevitably such serviced hubs will grow at the expense of others. However, smaller communities will still benefit from regional improvements in road infrastructure and transport options that will bring them within reach of previously unavailable services such as a regional hospital with a maternity ward or aged care facilities. Selecting which towns will grow is always contentious but the application of basic criteria can mean that, in many cases, they self select themselves as the:
• Major population centres • Ports with industrial infrastructure including rail access and multi user access • Local commercial, service and administrative centres • Places with a strong tourism profile as a result of heritage or natural environment
Further criteria are likely to relate to lifestyle, locations that match the preference of Western Australians to live close to the coast. Cities and towns such as Broome, Port Hedland, Karratha, Geraldton, Bunbury, Albany and Esperance all fit this profile. Inland, Kalgoorlie Boulder (pop 32,000) is well located as the regional service hub for the Goldfields as well as having a strong tourism profile as is Kununurra, which received considerable Federal funding for infrastructure in 2009 as part of the $195 million East Kimberley Development Package and will continue to grow as the service centre for the Ord River Irrigation Scheme Part 2. Other candidates include the ex company towns of Newman and Tom Price, although their isolated locations and good air connections to Perth (Newman has up to six flights a day) mean that residents currently tend to use metropolitan Perth services in preference to regional services in the Pilbara. It is inevitable that choices will need to be made and therefore essential to establish robust and well considered criteria including:
• Location of the existing community as a pleasant place to live with potential to house a population of over 30,000. Preferably within reach of a safe part of the coast and defensible in terms of adverse weather conditions and natural events
• Potential to supply a city of 30,000 with services including fuel, power, water and waste management • Availability/cost of land for residential development, commercial and industrial use • Audit of current transport infrastructure and connections to major mining and extractive industry
projects, export access and internal transport links • Location as a regional centre for major public facilities such as secondary and tertiary education,
teaching hospital with a maternity ward and operating theatre • The natural diversity of the economic base and potential for new sectors to develop • Capacity for local government to expand to meet community needs

__________________________________________
Syme Marmion & Co June 2010 Extractive Industries & Sustainable Regional Development Final Report 67
The map and adjacent table on the next page give an indication of the geographic spread of towns and cities best fitting the above criteria. But consideration should also be given to a number of other conditions including:
• Remote location • Harsh climate with climatic extremes • Requirement for accommodated workforces as opposed to a daily workforce • Cost of infrastructure establishment • Suitable space
All of these will require testing in the context of a regional planning scenario to assess the future of each town to support development to city scale against others which may be better suited as smaller logistical hubs, export platforms and maintenance centres.
7.5 Co ordination Role of State Government
Frustration was expressed by many stakeholders interviewed at the lack of an effective regional planning mechanism integrating the roles of State Government agencies. There was a view that planning has been Perth centric for many years and lacks a practical knowledge of the difficulties faced in developing projects in remote areas, including the difficulties that will be faced by Government agencies as the push for larger and higher density residential cities in the North West gathers momentum.
ABS Population figures 2006 Esperance 9,354 Albany 25,000 Bunbury 54,480 Geraldton 27,420 Karratha 11,720 Port Hedland 11,556 Broome 11,546 Kalgoorlie Boulder 28,241 Kununurra 3,748 Note: With the amalgamation of Geraldton/Greenough the City had a population of 35,000 in 2009

__________________________________________
Syme Marmion & Co June 2010 Extractive Industries & Sustainable Regional Development Final Report 68
Local government, small business interests and major corporations we spoke to said that dealing with State Government was complex and fractured, requiring repetitious applications and presentations to multiple departments and agencies. While the large extractive industry companies have the capacity to undertake such procedures, smaller companies and local government find it onerous, time consuming and costly. Lacking the staff and resources to lobby State Government in Perth, they feel unable to communicate their problems adequately or to discuss potential for effective and integrated solutions with professionals from a range of departments. The extractive industry companies and local government both felt that gearing consultation towards sharing information would improve the understanding of problems (including cost) of service delivery in difficult locations and could contribute to better provision of infrastructure, public facilities and community services. Certainly there is evidence of a slow disengagement with some areas of social services in places like Roebourne and cost shifting to the non government sector where organisations like Yaandina have become dependent on grant applications for funding. Models capable of providing this co ordinating role are.
• Extension of Regional Development Commissions’ role using their established local networks. • A co ordinating role within the Department of Regional Development and Lands as a natural entry
point for those seeking assistance from State Government • A regional planning role for large local governments, such as Geraldton Greenough, who have the
capacity to co ordinate with agencies such as the Department of Planning and Infrastructure. • A regional co coordinating unit in Perth to which all parties can contribute information and form
project specific partnerships tasked to generate practical results on a case by case basis 7.5.1 Regional Development Commissions
Regional Development Commissions have developed regional and local networks that can be used to identify and present issues of community sustainability to State Government. Particularly in the extractive industry growth regions of the Pilbara, Kimberley, Mid West and Goldfields Esperance, the addition of a community development professional to the RDC staff would add capacity and co ordinate information obtained from local government and the private sector as well as the development of performance measurement benchmarks recommended in this report for contributions by the extractive industries. 7.5.2 Regional Co ordination Initiative Stakeholders
Regional Development Commissions, already tasked to represent the State on the new federal Regional Development Australia committees are appropriate members of any regional co ordination initiative along with other agencies such as the Port authorities. The Dampier Port Authority reported that the lack of regular access to State Government and its relevant agencies caused the opening of a Perth office. Initial findings indicate that having a regular presence in the Perth CBD has made a significant difference to the way in which they are able to make their case to Government. The Pilbara Regional Council has also announced its intention to open a Perth office, strengthening the case for a streamlined entry system to Government, co ordinated by the Department of Regional Development and Lands with access as required to: Department of Planning and Infrastructure Department of Corrective Services Landcorp The Police Service Department of Industry and Resources Department of Treasury and Finance Department of Indigenous Affairs Department of Community Development Department of Health Department of Corporate Affairs Department of Education and Training Department of Housing Department of Sport and Recreation Department of Environment and Conservation
__________________________________________
Syme Marmion & Co June 2010 Extractive Industries & Sustainable Regional Development Final Report 69
8. Significant Issues Affecting Communities
For the purposes of this report, the issues affecting communities have been categorised into physical requirements, social factors and the degree to people living and working in those communities can galvanise support through their own efforts. This division takes into account the basic fact that no community will exist for long without access to adequate supplies of power and water, and that physical existence is possible in unpleasant social or cultural conditions, but such a community is unlikely to thrive or grow. While the physical requirements of everyday life, including access to public utilities, contribute to our comfort it is quality of life that sustains a community through periods of adversity. The 2010 Commonwealth Report on Major Cities in Australia53 has collated some interesting findings relating to the consumption of essentials such as water and power in cities across Australia:
• Water restrictions in major cities saw water consumption fall by 7% between 2000 and 2005. Households account for 11% of water used in 2004 to 2005
• Residential energy use accounted for 7% of total energy consumption in 2007/2008 but grew at 2.2% relative to other sectors in the same period. Around 38% of energy used in the home is for heating and cooling
• Transport emissions are one of the strongest sources of emissions growth in Australian projected to increase 22.6% to 2020 (+- 1.58% pa). Around 60% of energy consumed as transportation is for people, predominantly in cars (Sandu & Petchey 2009)
• Climate change is affecting rainfall patterns in the South West of WA • Total waste generation has increased, in spite of recycling, at a rate higher than that of population
growth. In 2006 WA generated the most waste per capita at 2490 Kgs (ABS 2006b) and recycled the lowest, at 33%
• Around 97% of energy used in Australia in 2007 to 2008 was sourced from non renewable sources (ABS 2010) including coal, petroleum products and natural gas
8.1 Physical Factors There are a number of physical elements that directly affect the optimal functioning of a community including:
• Sufficient public infrastructure and essential services • Sufficient operational funding to support the use and maintenance of the existing facilities • Capacity within local government to run and promote the facilities • Staff training and development programmes • A well designed town centre with comfortable and popular public spaces • An adequate supply of affordable residential and commercial land • Broadly available communications infrastructure at acceptable speeds • Good conditions for key professionals - doctors and nurses, teachers and police
8.2 Cultural Indicators: Social Factors The desktop search conducted for this study revealed numerous academic attempts to categorise and measure social indicators of successful communities, resilient cultures and community development. As one example, McMillan and Chavis54 in their 1986 study, identify four things that they believe constitute a “sense of community”. These are a) membership, b) influence, c) integration and fulfilment of needs, and d) shared emotional connection. While there can be relatively little argument on these intangibles, the ways in which they can be realized in a community are more interesting.
53 www.infrastructureaustralia.gov.au/files/MCU_SOAC.pdf
54 Sense of community: A definition and theory McMillan and Chavis 1986

__________________________________________
Syme Marmion & Co June 2010 Extractive Industries & Sustainable Regional Development Final Report 70
8.2.1 In Kind Contributions and the Volunteer
The provision of ‘in kind’ services is a surprisingly efficient way to add community resilience and self sufficiency. The Fortescue Metals Group motto “we’ll do it with you, not for you” resonates in regional and remote areas where population is scarce, the local government is poorly resourced and the equipment required for a task may not be available to the general public. Where a local employer or large scale infrastructure project is able to redirect personnel, equipment and services to benefit the local community, for instance, the upkeep of roads in rural roads, it is helping both itself and the local authority. In this instance, the in kind contribution is worth more than a straight financial contribution. Many of rural towns rely on community volunteers to run the fire brigade, meals on wheels, aged care and child care and, until the Health Department made it much more difficult for them to do so in the 1990s, catering for social events was famously conducted through local sports clubs and the CWA. Changes to operational procedures at the Mt Whaleback mine in Newman played havoc with the town’s volunteer structure. The town’s sports teams, junior coaching clinics, emergency services and aged care services struggled to survive the transition from “company town” to a town of contract workers on long shifts and weekend work rotations. The arms length, but still ‘in kind’ contribution of the mining company via its employees’ time had created a vibrant community lifestyle that made Newman a good place to live in spite of its isolation. More recently, the large extractive industry companies have rediscovered the value of the volunteer, encouraging and subsidising their employees’ participation in a wide range of projects through matched giving programmes and sponsorship. 8.2.3 Aboriginal Engagement – Training and Employment
State Agreements in WA have usually required the signatory to enter into a private negotiation intended to benefit, or compensate, indigenous groups in their area. Foundations and other vehicles set up to handle these funds are used by indigenous groups for the welfare and future of their communities particularly education and training for young people. FMG’s VTec programme for instance, ties graduation from training to a guaranteed job. The major companies understand that indigenous people are the natural residential workforce with a sense of care and responsibility for the remote areas of the North West and have taken real steps to work with Aboriginal communities, seeking to promote education and skills, boost self esteem and lift living standards. Most mining entities in the Goldfields Esperance and Pilbara regions that are committed to the principles of CSR now have a specific programme tailored for indigenous workers. The bigger companies have led the way, creating training and apprenticeship programs that can compensate for an often fractured and incomplete secondary education. These programmes are usually co ordinated with initiatives of WA tertiary training providers, local government and industry organisations such as the CMEWA. For example:
• The Pilbara Industry Community Council (PICC) • The Resources Industry Training Council (RITC), • The Goldfields Education & Mining Industry Alliance (GEMIA) • The Australian Technical College-Pilbara (ATC)
The long term outcome of these initiatives will not be visible for some years, but it is already creating a generation of young Aboriginal men with skills and greater confidence in their ability to provide for their families.

__________________________________________
Syme Marmion & Co June 2010 Extractive Industries & Sustainable Regional Development Final Report 71
8.2.4 Delivery of Health, Education and other basic services
Many regional communities experience difficulties in attracting and retaining the services of doctors, nurses and teachers and often only for a specified contract term after which most return to the city. This regular change reduces continuity and can affect service delivery. It makes it hard for a relationship with the community to develop to a point of trust where real advances can be made. Where the local government is able to assist with good accommodation and conditions for staff and their families it is more likely to result in longer placements and more choice. Australia has always excelled in the provision of educational opportunities through programmes like “School of the Air” and with the advent of the internet, distance education has taken the next step with the provision of tertiary education and training delivered remotely. Technology is an important service delivery tool in health as well, with programmes available that assist treatment of a range of medical problems by a local nurse or GP. Used in conjunction with an audiovisual computer link they offer the opportunity to consult with a specialist far away in a major city, allowing diagnosis at a much higher level without the patient having to travel away from home. 55 Several extractive industry companies support the Flying Doctor Service (RFDS) or contribute funds to maintain or upgrade landing strips, but there are emerging opportunities with potential to benefit both mine sites and communities equally: the design, production and deployment of computer enabled transportable medical modules that can be operated by trained nursing staff. Many parents have concerns about the quality of the education that their children will receive at secondary level or the attention that they will give their schoolwork. This may be related to the school, but it may also be related to the long travel times to and from school on a daily basis and the fact that education may not be valued by some or all of their peers. It is also a problem for some indigenous communities whose gifted children may need sponsorship to attend schools in a regional centre, or even in the capital city. The National Association for Rural Student Accommodation56 is a membership organisation with 28 members in Western Australia. It supplies information about residential colleges and rural student hostels providing a boarding service to primary and secondary school students. These facilities work in partnership with schools in regional centres and cities to support isolated families, enabling the children of indigenous and non-indigenous Australians to gain access to a quality education without requiring their families to relocate. 8.2.5 Aged Care
The WA State Government’s Home and Community Care (HACC) programme provides services for seniors and people with disabilities who are able to remain in their homes in most rural and regional towns across the State. Very few of these towns provide centre based care and, except for the South West of the State there are almost no nursing home facilities outside large regional centres. The exceptions that prove the rule are small towns like Roebourne, Newman and Marble Bar where the level of community support ensures that elderly people can be cared for locally by a mix of professional and voluntary carers. Yaandina, in Roebourne, is a community service organisation that operates as an incorporated association to manage local social services since receiving a grant from the Commonwealth Department of Health and Family in 1971. Professional staffing levels are difficult to maintain and the Frail Aged hostel struggled to meet new standards, accreditations, assessments, and inspections required by the Aged Care Services legislation brought in a few years ago. They have now achieved accreditation on the maximum three year 55 www.ukeha.co.uk and www.healthbeyond.org.au
56 www.narsa.com.au

__________________________________________
Syme Marmion & Co June 2010 Extractive Industries & Sustainable Regional Development Final Report 72
cycles, but with no allowances for indigenous services and the need to rely on grant applications to supplement operational funding have meant that Yaandina has looked to the private sector for assistance. New links to mining companies have begun to develop with major capital grants from government now linked to donated blocks of land and assistance from the Woodside Foundation. Existing facilities have been purchased from the state and Yaandina forged links with a foundation focused on community capacity building. However, some other partnership ideas have been resisted by the community and some government development agencies have been unable to partner within their mandates.
8.3 Economic Factors
The local economy is at the heart of every community. Where there is leadership from the local authority and elected Council members there is likely to be a more vital sense of activity and practical solutions found to problems that might stifle enterprise in other places, and the ability to do this greatly assisted by access to information. The importance of the internet to rural communities cannot be overestimated as speedy, affordable communications reduces the vast distances in WA and ensures that people can remain “up to date”, and businesses can be both competitive and efficiently run. The internet is also a large part of the solution to banking in the regions. The Bendigo Bank filled a large hole for many with its community bank model, creating success stories for towns where the community has been able to invest in its own future. However, it will only work where the population is able to support it in their day to day enterprise. In other examples in towns, for instance Wickepin in the Wheatbelt, the local grocery store has become the “de facto” bank, holding wages, paying bills and supplying small change to individuals and businesses in the town. To starting up in small business in the regions is particularly hard. Where there is a well off population close to an extractive industry project, rents will be extremely high and staff hard to hire at normal wage levels. In other smaller places, business is dependent on tourism, seasonal work or on the particular industry that it services. We were often told that the demand for small business services such as Laundromats, fast food and cafes, building and maintenance services is strong in the major mining towns, but that they needed some support to become established in the face of the high costs. If there is a real desire to make the industry dependent mining towns home to a large residential population the case for a funded initiative to support them is strong. In contrast, the art centres of indigenous communities across the Goldfields, Pilbara and Kimberley, particularly Warmun (Turkey Creek), and Fitzroy Crossing have built on the success that they have had in the art galleries of the capital cities and seized on the growing numbers of tourists coming past their “door”. The overland tourism (the Grey Nomads) provides customers for a retail outlet on their doorstep and expands their private customer base. It also gives young artists a starting point and creates opportunities for other in areas such as guided tours, caravan parks, trailer storage and introducing people to indigenous culture. Each region needs to play to its strengths and, in the far South West, a collective initiative has resulted in the growth of a wildflower business in Wellstead, while the small rural of Balingup has had great success with its community owned and run Balingup Small Farms Field Day.

__________________________________________
Syme Marmion & Co June 2010 Extractive Industries & Sustainable Regional Development Final Report 73
9. Planning for Socially Sustainable Communities
To provide context and guidance for policy recommendations, the meaning of ‘community’ and the elements that may affect sustainability require some discussion. The definitions of community are multiple; Wikipedia shows over 94 discrete definitions of the term. To paraphrase from them “community” exists as a form of social capital where the collective value of social networks, formed to share all manner of things, can be measured in terms of “liveability” and felt by those residing in that community as a “sense of community”. The phrase “resilient communities”, also used in this context refers to those that can survive change with their core identity intact; and “sustainable communities”, which is more dependent on the context. Overall it seems that the success of a community is relative to the level of confidence exhibited by the group. The desire to be in control of their collective destiny is central to many communities, and those that have a strong sense of identity and connection tend to be the most resilient in the face of change. Social capital, the extent of community engagement and participation, is the basic measuring stick of community resilience. Where it is high, the community will be more independent, self determining and better able to survive adversity, using the networks of friendship to care for one another. Even where local administration may be in disarray, people respond in a proactive manner to problems such as flood, fire or the closure of the main workplace. Historically, community resilience has been a factor of time and patience, but with modern communication able to create instant networks and pressure groups, that is no longer the case. The elusive sense of community that makes one place attractive and another soulless has everything and nothing to do with its sustainability. The Brundtland Commission’s definition of sustainable development quoted at the beginning of this report “meeting the needs of the present without compromising the ability of future generations to meet their own needs”57 is very general and, more often than not, understood to refer to tangible needs. However, the Australian Minerals Industry Framework puts it in context by adding: “in the mining and metals sector, this means that investments in minerals projects should be financially profitable, technically appropriate, environmentally sound and socially responsible”58. It gives weight to the need for community development and the growth of social capital to lift sustainability factors. As an illustration, a FIFO accommodation camp, designed and constructed to have a minimal impact on the environment, can be described as sustainable: particularly if it uses renewable energy sources, recycled water treatment systems, has excellent catering, insulated living quarters and good communications but, it may not be an intrinsically “happy” place to be because that factor is dependent on relationships between the people who form the camp community and not the quality of the facilities. The camp may be physically sustainable but not socially so, and therefore unlikely to survive as a community without the continual drive of economic factors. A key definition for WA to aspire to is that supplied by the Natural Resources Forum where a sustainable mining community is defined as “one that could realize a net benefit from the introduction of mining that lasts through the closure of the mine and beyond”. In support of this outcome, the UK Department for Environment, Food and Rural Affairs’ list of the basics for community sustainability is a good rule of thumb. Communities should be:
• Active, inclusive and safe - Fair, tolerant and cohesive with a strong local culture and other shared community activities.
• Well run - with effective and inclusive participation, representation and leadership. • Environmentally sensitive - providing places for people to live that are considerate of the environment.
57 Our Common Future, Brundtland 1987
58 Enduring Values, Australian Minerals Industry Framework 2005

__________________________________________
Syme Marmion & Co June 2010 Extractive Industries & Sustainable Regional Development Final Report 74
• Well designed and built - featuring a quality built and natural environment. • Well connected - with good transport services and communication linking people to jobs, schools, health
and other services. • Thriving - with a flourishing and diverse local economy. • Well served - with public, private, community and voluntary services that are appropriate to people's
needs and accessible to all. • Fair for everyone - including those in other communities, now and in the future.
9.1 Social and Cultural Aspects of Sustainability
Planning for sustainability must identify at what point a community can be regarded as having a practical chance of survival, unsupported by a benefactor. This begs the question of how sustainability can be measured and, if so what criteria or benchmarks can be set. The population required for an economy to generate sufficient activity to support itself is currently estimated at around 30,000. Below that figure, it is more likely that a community may start to decline its chief economic driver is removed. The physical factors, such as jobs, facilities, affordable land, have already been discussed in detail but we have not yet addressed the social factors that contribute to successful communities and their ability to cope with change including the cultural factors contributing to a robust identity. The World Commission on Culture and Development observes that “…cultural patterns play an irreplaceable role in defining individual and group identity and provide a shared ‘language’ through which the members of a society can communicate on existential issues which are beyond the reach of everyday speech.” 9.1.1 Key Themes of Cultural Sustainability
The Creative City Network of Canada lists key themes of cultural sustainability as:
• The culture of sustainability – adaptive changes in behaviour and consumption patterns resulting in a more sustainability-conscious lifestyle
• Globalization - culture needs to be protected from globalization and market forces, as this force acts to reduce individual cultural identity, traditions, and language to dominant global ideals and culture
• Heritage conservation • Sense of place • Guardianship of indigenous knowledge and traditional practices • Community cultural development – where residents are encouraged to take an active role in running
their community including their own community resources and identity. Increasing the level of contact between artists, cultural groups, and community residents results in a stronger community identity and a sense of ownership by the people who live there
• Arts, education, and youth - The arts offer an opportunity to engage in collective, collaborative activities, enabling young people to be more involved and active in public life and political processes. It can also contribute to a more informed and optimistic outlook
• Sustainable planning and design for safe, functioning communities • Community social planning including cultural policy
9.1.1 Cultural Planning
Australia has emerged as a strong supporter of cultural planning. The Institute for Cultural Policy Studies at Griffith University59 in Queensland leads at the academic level with the Australia Council and most States 59 www.griffith.edu.au

__________________________________________
Syme Marmion & Co June 2010 Extractive Industries & Sustainable Regional Development Final Report 75
funding cultural policy initiatives that, in WA are most active at local government level. Academic and writer Deborah Mills60 identifies the objective of cultural planning as being to: “Elevate the status of culture within the realm of local government activity so that it could take its place alongside other strategic plans developed by councils for land use, transport, social and economic development. In some instances it was seen as part of an integrated local area planning process which would equip councils to effectively plan for the needs of their communities in integrated and holistic ways.” The WA State Government and the WA Local Government Association (WALGA) have both developed policies to encourage the integrated planning of public space and amenities, including a Percent for Art Scheme applied to public works. However, community cultural engagement at the local level remains limited to a predominantly arts agenda, restricting the broader understanding of culture as a core element of community identity and sustainability. Deborah Mills argues that: “……. culture has remained marginalized because it has been viewed as something to add to the list of topics that an integrated planning process must address, rather than something which could inform the whole planning process itself.” …… “It has remained a thing apart, with its own budget, staffing and operations. Cultural planning is seen as planning for culture or at least arts resources management.” Arts and cultural development professionals have a tendency to focus on the role they can play in fostering cultural objectives rather than understanding there is a significant role for them in furthering the economic and social health of communities. Creating a sense of pride and ownership in a community through art and design is important, but when that agenda contributes significantly to community lifestyle it attracts new residents and new initiatives that will raise the local economic profile and add to long term sustainability. When the cultural planning framework addresses the broader social agenda it challenges planners to create better communities. Successful arts led initiatives in the US have tackled issues such as isolation, domestic violence, community health, discrimination, literacy and even storm water management and waste disposal.
In his monograph61, Jon Hawkes argues for an addition to current public policy planning based on the “triple bottom line” of economic, social and environmental sustainability. He sees culture as the fourth dimension necessary for progress: “towards a society that authentically embodies the values of its citizens” with the community having “a shared expression of, and commitment to, a sense of meaning and purpose” - in other words, social capital. He is of the view that sustainable development is open to numerous interpretations and describes community development and activity as the ‘glue’ binding a community together. Or, in Deborah Mills words:
60 Cultural Planning: Policy task, not tool Artlink April 2003
61 The Fourth Pillar of Sustainability: Culture’s Essential Role in Public Planning
Public art project in the US raises the awareness of the role garbage collectors play in their community

__________________________________________
Syme Marmion & Co June 2010 Extractive Industries & Sustainable Regional Development Final Report 76
“Liveability and quality of life may have something to do with urban amenity, but attachment and a sense of belonging may have more to do with an icon (a tree, a landmark, a person), or shared and collective memory or just the ’feel of the place’.” And “If the stated objectives of government’s involvement in planning are to be achieved – sustainability, regional distinctiveness, capacity building and so on – then planning processes must uncover cultural resonance and meaning and engage citizens in these processes.” It is universally understood in Australia that physical and economic infrastructures of communities are incomplete without a social and civil infrastructure, but the importance of cultural policy, planning and programs as a factor of community sustainability and resilience has not quite reached the same level of acceptance. A study by Jeannotte (2003) concludes that there are: “collective benefits from investments in cultural capital and that these benefits make a significant contribution to social cohesion”. There is also evidence that greater community cooperation and trust are associated with participation in arts and cultural activities. The Comedia organisation in the United Kingdom has, through case study research, found evidence that such activities have a positive effect on social cohesion, encourage partnerships, promote intercultural understanding and promote neighbourhood security thereby helping to empower communities by building organizational capacity and transforming negative perceptions of local authorities and agencies. The Social Impact of the Arts project in the US found strong correlations between neighbourhoods that were economically and ethnically diverse and the number of arts groups in those neighbourhoods. It also found that the Philadelphia neighbourhoods experiencing economic revitalization between 1980 and 1990 were those that were both economically and ethnically diverse with a large number of arts and culture organizations.

__________________________________________
Syme Marmion & Co June 2010 Extractive Industries & Sustainable Regional Development Final Report 77
10. Sustainability: A Community Analysis
The following Western Australian communities have been analysed in terms of their demographics and infrastructure to gain an understanding of characteristics shared by communities of similar size and economic base. This provides a picture of what constitutes sustainability in a certain community model. All the towns listed have some exposure to the extractive industries, either directly through mining or indirectly as a residential community or point of export but those in bold are seen as having potential as regional hubs of activity.
Albany Dampier Kununurra Pannawonica Allanson Dardanup Laverton Paraburdoo Binningup Derby Leeman Pemberton Boddington Dongara Leinster Peppermint Grove Boyanup Donnybrook Leonora Pinjarra Boyup Brook Drummond Cove Mandurah Port Hedland Bridgetown Dwellingup Manjimup Ravensthorpe Broome Eneabba Marble Bar Roebourne Brunswick Junction Esperance Meekatharra Serpentine Bunbury Fitzroy Crossing Mingenew Three Springs Burekup Geraldton-Greenough Morawa Tom Price Busselton Greenbushes Mount Magnet Waroona Byford Halls Creek Mullewa Wickham Capel Harvey Mundijong Wiluna Carnamah Hopetoun Nannup Wyndham Collie Jarrahdale Newman Yarloop Cookernup Kalgoorlie-Boulder Norseman Coolgardie Kambalda West Northampton Cue Karratha Onslow
The Urban Centres (UCLs), small towns and communities as defined by the Australian Bureau of Statistics (ABS), listed above
have been used for the analysis
The ABS defines an Urban Centre (UC/L) as a population cluster of 1,000 or more people and a Locality as a population cluster of between 200 and 999 people. People living in Urban Centres are classified as urban for statistical purposes while those in Localities are classified as rural (i.e. non-urban).
10.1 A Comparison of Sustainability by Towns*
*Given that mining is understood as an unsustainable factor in the life of the town
The tables on the following pages rate regional cities and towns according to specific characteristics as a percentage of the total population. These characteristics are:
• Population over 60 • Difference in percentage of over 60s when compared with Perth • Where the population resides compared with where it works • Difference in percentage of that workforce residing in the town compared with Perth • Percentage of resident population in the workforce • The level of population movement • The percentage of the resident population working in areas other than mining •
It is immediately noticeable that the top half of the table is dominated by towns from the South West and Peel. Bunbury and Busselton top the ratings with Collie, Broome, Mandurah and Esperance at numbers 4, 5, 6 and 7.

__________________________________________
Syme Marmion & Co June 2010 Extractive Industries & Sustainable Regional Development Final Report 78
All are cities and towns with strongly diversified employment profiles and, with the exception of Collie, coastal with the attendant lifestyle attractions. The small, mining dependant towns have clustered at the bottom of the ratings; the Pilbara takes up the bottom 6 places with Wickham, Paraburdoo, Onslow, Pannawonica, Marble Bar and Roebourne. In the middle, the rural communities of Jarrahdale, North Dandalup, Boddington and Serpentine have rated together, just above another group of small communities from the Mid West - Carnamah, Three Springs, Mingenew and Mullewa. With the exception of Boddington, experiencing growth associated with the re opening of the gold mine and Ravensthorpe, whose roller coaster engagement with the extractive industries is settling down following sale of the nickel mine and processing plant to Canadian interests, the residents of these small towns have a rural lifestyle in common. The landscape around Carnamah may be very different from Serpentine, but the emphasis is still on agribusiness. It will be noted that population is a factor of sustainability. Of the towns and cities with populations of over 12,000, all except the City of Kalgoorlie Boulder are in the top 10. Those towns having a population of between 10,000 and 12,000 are Broome, in the top 10, and Karratha and Port Hedland, who are both in the bottom quarter of the table. The mining industry rating has pulled Kalgoorlie Boulder down in the table, and conversely, the non mining industry factor has pulled Broome up.
10.2 Criteria for Ranking Communities
To obtain this data the following criteria were used to gain a population profile from which some basic conclusions may be drawn about the type of infrastructure that is most suited to a location and what contribution it can make to social capital invested in that community:
• The State and Federal Governments use population size as a major factor in determining the provision of key facilities such as schools and hospitals, (Appendix D contains a list of community facilities and the populations required for the provision of various facilities.) However, the data we have prepared shows that demographics are also an element to consider when allocating funds and infrastructure to a region. For instance, the elderly, who are disproportionate users of health care, tend to reside in the South West. The only town in the Northwest (Pilbara and Kimberley UCLs combined) with 10% or more residents over 64 was Marble Bar with 14%, compared with a regional average of 4.5%. In the Mid West, Northampton was significantly higher than other urban centres with 21% but the average for the region decreased to 11%. In the South West the average rose to 23% and in Peel it was 11.6%.
• Gender ranking showed that all the towns in the study regions of Goldfields Esperance, the Pilbara and
Kimberley, except Esperance (48%), Laverton (49%), Halls Creek (47%) and Derby (50%) had a male population of over 50% whereas it was a lot more balanced in the Mid West and in the South West, only Burekup (56%) and Pemberton (53%) had male populations over 51%.
• And the age of the population may also determine which facilities will have the greatest effect on the
sustainability of a community. The pattern of youth in the North West (Pilbara and Kimberley combined) is again reinforced with the median age of 32 only exceeded in Wyndham (34), Dampier (35), Marble Bar (34) and Onslow (37). In the Mid West and Goldfields Esperance, there are only 5 towns with the lower average of 32 or under and in the South West and Peel, Yarloop has the lowest median age of 33 with an average over the two regions of 38.

__________________________________________
Syme Marmion & Co June 2010 Extractive Industries & Sustainable Regional Development Final Report 79
UCL Name Population
% Age 0-14
% Age 15-64
% Age Over 64
% Population
Male
Median age of
persons
Median individual income
($/week)
Median family
income ($/week)
Median household
income ($/week)
Median housing
loan repayment ($/month)
Median rent
($/week) Carnamah 357 27% 59% 14% 48% 36 $460 $1,027 $741 $415 $80 Cue 271 24% 68% 9% 50% 36 $355 $843 $737 $339 $70 Dongara 2346 20% 61% 19% 52% 42 $404 $1,049 $790 $1,083 $135 Drummond Cove 759 26% 67% 7% 51% 36 $567 $1,316 $1,196 $1,153 $220 Eneabba 202 15% 80% 5% 61% 39 $792 $1,100 $1,024 $433 $55 Geraldton 27420 23% 64% 12% 49% 35 $453 $1,108 $926 $997 $140 Leeman 399 20% 70% 10% 57% 39 $392 $1,224 $941 $1,138 $134 Meekatharra 798 29% 65% 7% 49% 32 $425 $1,011 $995 $367 $60 Mingenew 285 24% 62% 14% 54% 39 $414 $924 $710 $433 $65 Morawa 597 26% 61% 13% 52% 33 $343 $959 $764 $433 $80 Mount Magnet 424 25% 70% 5% 52% 35 $531 $1,366 $1,008 $499 $78 Mullewa 425 27% 62% 11% 49% 32 $483 $1,072 $953 $510 $90 Northampton 812 23% 57% 21% 47% 44 $290 $659 $546 $867 $106 Three Springs 395 23% 62% 16% 51% 39 $492 $1,093 $924 $576 $90 Wiluna 202 27% 68% 5% 56% 30 $512 $1,216 $1,163 $700 $30
UCL Name Population
% Age 0-14
% Age 15-64
% Age Over 64
% Population
Male
Median age of
persons
Median individual income
($/week)
Median family
income ($/week)
Median household
income ($/week)
Median housing
loan repayment ($/month)
Median rent
($/week) Broome 11546 23% 73% 4% 52% 32 $628 $1,349 $1,184 $1,733 $163 Derby 3093 27% 66% 7% 50% 31 $462 $1,140 $1,043 $946 $100 Fitzroy Crossing 928 27% 67% 7% 51% 30 $259 $642 $870 $600 $50 Halls Creek 1209 27% 67% 6% 47% 28 $272 $677 $612 $735 $50 Kununurra 3748 24% 72% 4% 51% 31 $653 $1,355 $1,206 $1,300 $103 Wyndham 667 22% 71% 7% 54% 34 $442 $1,133 $1,154 $468 $60
UCL Name Population
% Age 0-14
% Age 15-64
% Age Over 64
% Population
Male
Median age of
persons
Median individual income
($/week)
Median family
income ($/week)
Median household
income ($/week)
Median housing
loan repayment ($/month)
Median rent
($/week) Dampier 1372 22% 75% 3% 58% 35 $1,194 $2,547 $2,479 $1,200 $200 Karratha 11725 26% 72% 1% 54% 30 $940 $2,309 $2,078 $1,701 $115 Marble Bar 192 22% 64% 14% 55% 34 $542 $1,100 $1,033 $278 $72 Newman 4247 28% 71% 1% 54% 30 $1,095 $2,459 $2,274 $360 $72 Onslow 576 20% 71% 9% 53% 37 $428 $1,133 $961 $870 $90 Pannawonica 685 28% 71% 1% 57% 32 $1,383 $2,738 $2,631 $0 $27 Paraburdoo 1605 31% 68% 1% 56% 30 $1,245 $2,506 $2,344 $239 $30 Port Hedland 11556 24% 73% 3% 54% 31 $862 $2,109 $1,890 $1,083 $114 Roebourne 858 25% 68% 7% 51% 32 $293 $1,007 $1,005 $650 $100 Tom Price 2720 30% 70% 1% 55% 29 $1,181 $2,576 $2,507 $250 $54 Wickham 1823 29% 69% 1% 53% 28 $792 $2,193 $1,975 $867 $28

__________________________________________
Syme Marmion & Co June 2010 Extractive Industries & Sustainable Regional Development Final Report 80
UCL Name Population
% Age 0-14
% Age 15-64
% Age Over 64
% Population
Male
Median age of
persons
Median individual income
($/week)
Median family
income ($/week)
Median household
income ($/week)
Median housing
loan repayment ($/month)
Median rent
($/week) Coolgardie 803 23% 68% 8% 53% 38 $386 $1,064 $818 $650 $100 Esperance 9534 24% 63% 13% 49% 36 $454 $1,083 $889 $1,000 $137 Hopetoun 585 19% 68% 14% 54% 40 $456 $1,262 $1,019 $1,083 $250 Kalgoorlie-Boulder 28241 25% 70% 5% 52% 31 $684 $1,728 $1,518 $1,200 $165 Kambalda West 2704 31% 67% 2% 54% 28 $828 $1,868 $1,744 $725 $150 Laverton 311 21% 70% 9% 48% 37 $480 $1,011 $987 $650 $60 Leinster 731 30% 70% 0% 55% 29 $1,153 $2,054 $1,939 $1,600 $0 Leonora 398 22% 73% 5% 53% 35 $606 $1,243 $1,029 $675 $90 Norseman 857 23% 67% 9% 54% 35 $461 $1,115 $866 $433 $71 Ravensthorpe 437 24% 69% 7% 53% 31 $619 $1,475 $1,190 $817 $95
UCL Name Population
% Age 0-14
% Age 15-64
% Age Over 64
% Population
Male
Median age of
persons
Median individual income
($/week)
Median family
income ($/week)
Median household
income ($/week)
Median housing
loan repayment ($/month)
Median rent
($/week) Allanson 610 28% 69% 3% 51% 35 $484 $1,621 $1,475 $1,083 $140 Binningup 951 24% 65% 11% 50% 36 $506 $1,205 $1,121 $1,200 $170 Boyanup 614 19% 71% 10% 50% 42 $439 $1,073 $900 $953 $150 Boyup Brook 533 19% 56% 25% 46% 46 $356 $806 $633 $520 $100 Bridgetown 2323 21% 63% 16% 47% 44 $388 $953 $736 $915 $140 Brunswick Junction 799 25% 61% 14% 50% 37 $363 $933 $845 $797 $130 Bunbury 54480 22% 67% 12% 50% 36 $491 $1,232 $1,082 $1,184 $180 Burekup 251 31% 63% 6% 56% 36 $476 $1,087 $1,066 $1,083 $165 Busselton 15384 21% 60% 19% 48% 39 $429 $1,052 $849 $1,161 $180 Capel 1462 26% 61% 13% 48% 36 $394 $1,037 $886 $1,033 $160 Collie 7086 23% 63% 14% 50% 37 $373 $1,095 $871 $850 $125 Cookernup 296 21% 65% 15% 51% 38 $353 $899 $704 $1,040 $138 Dardanup 370 28% 61% 11% 49% 35 $513 $1,240 $1,117 $975 $168 Donnybrook 1933 22% 62% 16% 49% 39 $383 $1,007 $744 $963 $140 Greenbushes 341 18% 67% 14% 49% 42 $349 $875 $591 $650 $100 Harvey 2606 19% 63% 18% 50% 39 $349 $1,019 $807 $880 $130 Manjimup 4238 25% 60% 15% 49% 36 $397 $981 $790 $800 $115 Nannup 501 23% 60% 17% 50% 43 $387 $966 $625 $867 $100 Pemberton 756 20% 66% 13% 53% 37 $438 $1,062 $784 $758 $100 Peppermint Grove 375 20% 72% 8% 51% 41 $574 $1,193 $1,131 $1,294 $185 Yarloop 547 26% 63% 11% 51% 33 $327 $656 $608 $700 $130
UCL Name Population
% Age 0-14
% Age 15-64
% Age Over 64
% Population
Male
Median age of
persons
Median individual income
($/week)
Median family
income ($/week)
Median household
income ($/week)
Median housing
loan repayment ($/month)
Median rent
($/week) Boddington 925 25% 65% 10% 50% 37 $433 $1,175 $1,035 $867 $123 Byford 2273 23% 67% 10% 51% 36 $470 $1,316 $1,232 $1,240 $180 Dwellingup 346 25% 66% 9% 49% 37 $384 $962 $808 $953 $140 Jarrahdale 600 28% 66% 7% 49% 36 $491 $1,133 $1,041 $1,222 $130 Mandurah 67812 20% 61% 19% 49% 41 $395 $1,076 $883 $1,300 $175 Mundijong 876 27% 62% 11% 51% 34 $430 $1,057 $964 $1,083 $170 North Dandalup 341 25% 68% 7% 50% 36 $383 $1,116 $1,060 $1,100 $120 Pinjarra 3280 21% 61% 18% 50% 41 $342 $947 $727 $1,000 $125 Serpentine 763 30% 62% 7% 49% 34 $470 $1,221 $1,166 $1,300 $195 Waroona 1863 21% 60% 18% 48% 39 $368 $1,053 $810 $990 $130

__________________________________________
Syme Marmion & Co June 2010 Extractive Industries & Sustainable Regional Development Final Report 81
10.3 Characteristics of a Sustainable Community The analysis tells us that the characteristics of those communities rated as most sustainable are:
• A certain level of infrastructure • Economic stability and a diverse local economy • Low economic risk: exposure to industries with a long life span and a broad industry base • A high level of community cohesion and social networks • An identifiable lifestyle connecting residents emotionally to their physical location
We can also state that it is not proximity to a mining operation per se that defines a community’s sustainability but the stability and longevity of the community and the mining resource. Mining towns rating highly in the analysis are those with long term, reliable and cost effective mining operations such as Collie, Kambalda West, Kalgoorlie Boulder and Boddington. Collie and Boddington have significant supporting economies in the agriculture sector, and all of these can be said to be popular as tourism destinations. Where a community with exposure to mining activity, can achieve and maintain a diverse economic base it contributes directly to its social, cultural and economic health, boosting the capacity of smaller, neighbouring communities who gain access to employment and better facilities. Economic diversity resulting from increased wealth created by the stable influence of a long term extractive industry operation, can affect a whole region through improved roads and transport options, communications and greater choice. The development of ancillary or complementary industries, such as those that process mineral ores, refine oils, compress gasses or produce power are usually both capital intensive and risk averse. This type of parallel development, where the diversity lies in new enterprise rather than direct expansion of an industry focus, requires a larger, regional approach to economic growth and the ways in which development may affect long term prospects and sustainability of local towns and communities. This rationale lies at the core of the success of remote, mining dependent, towns such as Newman and the amalgamated City of Kalgoorlie Boulder. They have become the regional hub for mining operations while remaining anchored by key mines with a long lifespan, Mt Whaleback and the Big Pit respectively. The stability of the industry, many mines but a single economic focus, has enabled the general economy to diversify and a complementary tourism industry that has grown up around an enduring West Australian story. While there are other similarly iconic mining towns such as Marble Bar and Cue, the sheer distance separating them from a strong urban centre, the short life span of most ore bodies and boom/bust cycle of the industry has worked against community sustainability and continuity of population. Modern mining means quick and efficient mineral extraction with minimal impact on the local community, but also with no positive contribution to its future.

__________________________________________
Syme Marmion & Co June 2010 Extractive Industries & Sustainable Regional Development Final Report 82
11. Attraction and Retention of Population
In June 2009 the Chamber of Minerals and Energy WA produced future growth projections for population growth and labour force demand using survey results from July 2008. The chart below demonstrates the expected recovery of the extractive industries even in a severe constrained growth scenario against that projected from surveyed growth. Overall economic figures for WA at the end of 2008/2009 year are showing that the global slow down in demand has been less severe than forecast and that the industry is returning to peak production at a rate faster than anticipated. 62
Currently, in Western Australia as a whole, 74,883 people are directly employed in the WA mining industry63; with the addition of indirect employment that figure rises to over 215,000. The impact of the mining boom is demonstrated by the fact that between 2001/02 and 2007/08 the resources sector added 90,570 jobs across the WA economy64. Approximately 27,000 new workers will be required in the mining industry by 2014 with the highest growth expected to be in the Mid West, Goldfields/Esperance and the Pilbara. These three regions will gain over 80% of the additional mining employment forecast for the State. However, most of the consequent population growth will be in the Perth/Peel and the South West regions where the majority of FIFO workers (82% in 2012) are projected to be sourced. The following figures show the average annual population increases for WA, in real terms, over three time frames to 2008. Extrapolating from the tables, population growth accelerated in Peel, the Southwest, the Kimberley and Goldfields Esperance between 2006 and 2008. It is important to note:
62 Nicole Roocke CMEWA June 2009 Overview of the Resources Sector Unearthing People for the Future Conference 63 Nicole Roocke CMEWA June 2009 Overview of the Resources Sector Unearthing People for the Future Conference 64 Nicole Roocke CMEWA June 2009 Overview of the Resources Sector Unearthing People for the Future Conference and National Institute of Labour Studies

__________________________________________
Syme Marmion & Co June 2010 Extractive Industries & Sustainable Regional Development Final Report 83
• That the rise in population shown for the Wheatbelt is actually attributable to the Shires of Gingin and Chittering, close to Perth, and therefore related to lifestyle changes and capital city overspill
• That the actual rise in population over the two years 2006 to 2008 for Peel and the Southwest has been in the order of 4,500 people in each region whereas the increase for the Kimberley and Goldfields Esperance has been approximately 1,000 to 1,200.
• That the greatest increase in population, approximately 10,000, has been in the Perth metropolitan region with the next two areas of greatest increase, Peel and the Southwest, not quite reaching 5,000 new residents each
-5,000-
5,00010,00015,00020,00025,00030,00035,00040,00045,000
Gasco
yne
Goldfie
lds-E
spera
nce
Great S
outhe
rn
Kimbe
rley
Mid Wes
tPee
l
Pilbarr
a
South
West
Wheatb
elt
Region
al W
APert
h
1996-2008 2001-2008 2006-2008
Above: Annual average population increase in each of the nine regions, regional WA as a total and the Perth metropolitan area
from 1996-2008, 2001 to 2008 and 2006 to 2008 Below: Figure showing the average annual population increase in the nine regions over the same time periods
Average Annual Population Increase
-1,000
-
1,000
2,000
3,000
4,000
5,000
Gasco
yne
Goldfie
lds-E
spera
nce
Great S
outhe
rn
Kimbe
rley
Mid Wes
tPee
l
Pilbarr
a
South
West
Wheatb
elt
1996-2008 2001-2008 2006-2008
The current average worker industry distributions - WA’s workforce participation rate of 62.5% with 5.8% of the state’s workforce employed in mining – provides for an additional 10,000 workers. Given the trends shown here, for the mining industry to meet the forecast requirement for an additional 27,000 direct mining industry employees by 2014 from population increases projected for the State, it will be necessary to source new workers from the capital city, other occupations or outside WA.

__________________________________________
Syme Marmion & Co June 2010 Extractive Industries & Sustainable Regional Development Final Report 84
11.1 Labour Projection for Regional Area in WA
Even the constrained economic scenarios developed following the global financial crisis show that there will be strong, sustained growth in Western Australia’s resources sector in the next 5 years. The Federal Treasurer has stated he believes that Australia’s terms of trade will be 35% above the 50 year trend in 2012 -2013.65 Labour requirements are generally expected to be well above population growth trends in the mining regions, with the requirement for labour highest in the construction phase and moderating once they are fully operational. This requirement for labour over the long term population growth projections indicates a continuing need for FIFO models of employment in the extractive industries. 11.1.1 Pilbara Projections
• Expected increase in resident population of up to 17,000 (~40%) by 2014 due to the projected growth in the minerals and energy sector.
• Minerals and energy sector labour demand is expected to peak at 22,000 in 2012 falling to 13,500 in 2014 relative to 2007 levels.
• The majority of the increase in direct minerals and energy sector labour demand is expected to be FIFO, with an additional 10,000 FIFO positions established in the Pilbara by 2014.
• Direct survey data suggests the industry will be primarily sourcing the construction workforce through contractors, as opposed to direct employment by the company.
11.1.2 Mid West Projections
• Total projected additional population in the Mid West driven by the minerals and energy sector (direct, indirect and family) is forecast to increase by 8,000 by 2014.
• Direct employment in the minerals and energy sector forecast to grow by 5,800 by 2014, 70% of which are expected to be FIFO jobs, primarily sourced from the Perth-Peel region.
11.1.3 Goldfields-Esperance Projections
• An expected increase in resident population driven by the minerals and energy sector of 2,950 by 2014, with a peak of around 5,300 in 2011.
• Direct labour demand to grow by 5,000 in 2012 and 3,000 in 2014 relative to 2007 levels. • 29% of the total additional direct workforce forecast to in the minerals and energy sector in 2014 is
expected to be resident, with the remainder being FIFO. • All of the additional labour is forecast to be contracted rather than directly employed.
11.1.4 Perth/Peel Projections
• Major growth to continue in Perth and the Peel region with an increase in the number of FIFO workers sourced from these fastest growing residential areas.
• It is likely that an additional 17,000 FIFO jobs will be available by 2014 which will underpin development in and around the metropolitan region
11.1.5 Kimberley Projections
• Nil forecast growth in labour demand until 2012 when a number of construction projects are expected to commence. From 2012 to 2014, expected growth of 2,600 additional workers will be required over 2007 levels with the overwhelming majority of these planned to be FIFO.
65 David Uren The Australian Business “Federal resource rent to replace royalties” 24th August 2009

__________________________________________
Syme Marmion & Co June 2010 Extractive Industries & Sustainable Regional Development Final Report 85
• Demand will drop significantly once construction projects are completed and only operational workforces are required.
11.1.6 Gascoyne Projections
• Labour demand driven by the minerals and energy sector forecast to peak in 2010 with an additional 600 workers required over 2007 levels, primarily driven by oil and gas projects.
11.1.7 Wheatbelt Projections
• Minimal forecast minerals and energy sector direct labour demand for 2008-2014, following an initial fall in 2009.
• In 2010, the incremental labour demand of 54 (over 2007 employment) is expected to be residential. 11.1.8 South West/Great Southern Projections
• Modest forecast minerals and energy sector labour demand for 2008-2011, followed by a decline in labour demand.
• The entire additional workforce is expected to be residential on a contract basis.

__________________________________________
Syme Marmion & Co June 2010 Extractive Industries & Sustainable Regional Development Final Report 86
12. A Case Study Review
12.1 The World Bank and the International Finance Corporation
Case studies published by the World Bank and the International Finance Corporation evaluating sustainable mining practices identify best practice as where:
• Local communities provided many of the goods and services needed by the mining companies. • The mining company played an active role in adding to the quality of goods and services provided • The mining company supported training programmes leading to employment • Skills developed were transferable to other industries. • Companies and communities took a long-term view, including post closure, determining a clearer
vision of what types of training and programs could provide sustainable benefits. • Infrastructure serves multiple uses, not just those associated with the mine.
Companies need a ‘‘social license’’ to operate, and a trilateral dialogue with open communication is key to achieving this. Extractive industry companies must understand the importance of corporate ethics and active participation by all stakeholders, usually the community, the company, and the government. The relationship that the company is about to establish should be guided by a long-term vision, even if the mine will have a relatively short life. The assistance provided to develop long term initiatives will build real capacity able to stand the community in good stead after the mine closes.
A successful community development processes builds social capital – but it needs management and funding. Funds assigned by a company to finance community development programs should provide for a firm foundation on which the recipient community can develop the capability to manage and run it successfully themselves. It is important to develop the capacity to operate a program and only seed fund programmes to the point where they can become self supporting and/or apply for funding from a government source. As it seems likely that there will be economies of scale in the delivery of social services and the building of human and social capital in communities, a regional approach, pooling available public and private resources, may work better in cases with a number of medium size mine operators. Central Governments Need to Become More Involved Central government needs to become more involved in community development work and its role in the trilateral dialogue with the local communities and the mining companies is essential. Only the participation of central government will ensure the adequate coordination of local plans with the national programs, thus multiplying their beneficial impact. No One Size Fits All, and Communities Have the Last Word Each mine has its own characteristics that preclude a one-size-fits-all prescription. The location of a mine will determine its ability to sustain a local residential community of any size and, for the many smaller mines in remote areas, a regional approach to training, employment initiatives and other community development initiatives may be better. Similarly, while the infrastructure that a large mining operation brings to a region can be its most important contribution to the local community, in regions with little possibility of significant industrial development because of climatic or geographic conditions, fly-in, fly-out mining may be the preferred choice to limit impact on the remote environment.
__________________________________________
Syme Marmion & Co June 2010 Extractive Industries & Sustainable Regional Development Final Report 87
12.2 The World Bank and the International Council on Mining and Metals
The World Bank conducted a study on sustainable community development together with the International Council on Mining and Metals (ICMM). The Oil, Gas and Mining Sustainable Development Fund66, have developed advice for mining companies to assist with the assessment, planning, relationship building, management and evaluation of community development activities throughout the mining cycle. They are: 12.2.1 Adopt a strategic approach
Community development activities in remote regions where the extractive industries tend to operate are most effective when aligned with existing strategic objectives. Ad hoc arrangements tend not to last, often because of short term contracts, personnel changes and the cessation of a personal relationship that provided impetus and insight. A strategic approach enables communities to feel included as part of the process of mine development and forging a relationship with the community. A company, or government agency seeking to assist the community to put together a sustainable enterprise, needs to focus investment efforts on the community’s core skills, building them into a commodity that can contribute to the sustainability of that community and to new opportunities that may arise in the future. 12.2.2 Consultation and Participation
A consultative and participatory approach to community development builds trust and understanding, particularly an understanding of the local consequences of decisions. Determining the level of interest by local consultation is an important starting point for community engagement. The consultation must be appropriate to the stakeholder groups and information delivered in a way than can be shared with the wider community. 12.2.3 Working in Partnership
Forming partnerships with stakeholder groups is an effective way to implement community development projects. From the community perspective, it may provide access to infrastructure that would not be available if solely reliant on community or government resources. ‘Trisector’ partnerships involve a voluntary collaboration to promote sustainable development, based on the efficient reallocation of complementary resources across business, government and community. 12.2.4 Strengthening Capacity
For stakeholders and the wider community to be able to fully articulate and represent their interests and to manage their interactions with other stakeholders constructively it is important that processes are in place to strengthen this capacity. Local entrepreneurs and businesses can participate in and benefit from new business opportunities created by mining operations, meet required supply, quality and operating standards of the buyer, and operate their own businesses profitably and responsibly.
12.3 West Australian Community Foundation
The WA Community Foundation arose from research into US and Canadian models of community funds connected to long term mining operations. Translating the concept to Australia, the Australian Tax Office (ATO) recommended a Foundation structure, to make best use of the rigorous governance frameworks in Australia that would provide a strong, trustworthy vehicle for funds management The WACF was set up in 2004 with initial funding from LotteriesWA, Anglicare, Alcoa and Wesfarmers, subsequently topped up by the WA State Government with each Regional Development Commission receiving 66 www.commdev.org

__________________________________________
Syme Marmion & Co June 2010 Extractive Industries & Sustainable Regional Development Final Report 88
$100,000.00 to explore setting up a regional fund. The WACF now manages more than 40 trusts with a value of over $6 million. Under the Trust structure the ATO actually make the grants once the request/application has been received from the voluntary Local Advisory Committee and assessed by the WACF Grants Co ordinator for compliance with the terms of the relevant fund. Development of the WACF model was provided by the Western Australian Regional Initiative Fund (WARIS) and with advice from the ATO on ITEC and DGR67 status. Research identified that over 50% of discretionary energy available to any community initiated fund is spent in administration and governance, severely reducing fundraising capacity resulting in the creation of an umbrella Trust able to share a single governance structure between investors with a wide range of interests. There are three different models of outcome and input that define the active use of each foundation. These are:
• To build and maintain a corpus to benefit the medium and long term life of the Trust beneficiaries. This primarily reinvests the annual income in order to provide for needs in the future
• Fundraising, led by the Local Advisory Committee, to increase the corpus and (significantly) to develop community ownership and participation in the Foundation and therefore their community vision
• A shorter term methodology in which the community’s needs, once identified, are provided for through a Trust mechanism. These funds would probably be held in cash and drawn down as projects are initiated/constructed etc. This mechanism might also attract matching funds from other sources which could be added into the Trust or administered in parallel by others
Each fund has a voluntary Local Area Committee charged with canvassing community needs and translating them into grant programmes or discretionary areas worthy of support. Its success lies in the fact that it is straightforward and practical, seen by clients as preferable to the scenario where “company hands over cheque”. For companies with a strong volunteering programme like Alcoa, and for communities with the capacity to broker their own solutions it works well. And for medium and smaller companies unable to set up a dedicated CSR programme in also works effectively, allowing them to focus on the core business of mining while making a significant contribution. Some companies who have made this type of arrangement have representation on the Foundation’s local advisory committee, for example, Verve Energy in Collie and Minara Resources in the Northern Goldfields. These companies have set aside a sum of money to kick start the foundation and choose to work alongside the community to build the fund and/or distribute the annual income, others may choose to remain at arm’s length from the operation of the fund or to continue to contribute to it on either an annual or an occasional basis. The strong emphasis on governance has made the WACF attractive to a number of institutions and not for profit groups as well as corporations. Partly, this is due to the culture of accountability and transparency, but also because the WACF engages with recipient communities, helping them to recognise their own needs and to make good decisions for the community. They find that once a community has developed the capacity to help itself, it inevitably begins to attract interest from other programmes of community assistance, such as landcare agencies and environmental foundations.
12.4 International Examples
The following examples are selected from a global desktop research of mining companies that have a demonstrated track record of sustainable community development through programs aimed at improving economic diversity, cooperation with indigenous populations and preparations for mine closure.
67 Tax exempt status for philanthropic donations www.ato.gov.au

__________________________________________
Syme Marmion & Co June 2010 Extractive Industries & Sustainable Regional Development Final Report 89
12.4.1 Teck Cominco Ltd
The first two examples are from mining operations run by Teck Cominco Limited, a Canadian based mining company that operates mining, smelting and refining in Canada, the US and Peru. The company adopted its Charter of Corporate Responsibility and the Code of Business, Environmental and Health and Safety Practices in 2003. In line with their commitment to sustainable development they have also adopted an EHS Management System. As part of these practice codes they commit to:
• Fostering open and honest dialogue with all their stakeholders, respect the rights, interests and aspirations of local indigenous people and seek out and listen to those in the community who are affected by their operations;
• Supporting local communities and their development by seeking locally-sourced goods and services and employing local people; and respect the rights, interests and aspirations of local indigenous people; and
• Include closure and reclamation plans as a critical component of all development projects. Undertake progressive reclamation at operating mines and reclaim dormant sites to ensure long-term protection of the environment.
12.4.2 Sullivan Mine, Canada
For a period of 90 years the mine was the main source of employment in the company town of Kimberley. When Teck Cominco announced an indefinite closure of the mine in 1990, the company put in place a number of processes to engage the community in planning for the future and provided financial, technical and infrastructure support for community initiatives. A key finding of this process was that the company had a paternalistic attitude to the town and did not have a good understanding of the economic and social impact of the mine on the community. Community consultation revealed the need to diversify the economy and for the community to take more responsibility for its future. Community sustainability indicators were set up to track contributions to the community and measure long-term impact on the local labour force, diversification of the local economy, investments in local infrastructure restoration activities, and the impact of the mine closure package on local education, health and safety, civic leadership and community engagement. The package included a new housing subdivision with parks, recreational areas and a golf course that can contribute to the transition of the town of Kimberley from a mining town to a tourism destination.
12.4.3 Red Dog Mine, Alaska
The Red Dog Mine in Alaska is located within the Northwest Arctic Native Association’s (NANA) region where the majority of the population are indigenous Inupiat Eskimos. In 1982 an agreement was made between Teck Cominco and NANA to develop the zinc deposit, provide employment and protect the subsistence lifestyle of the people in the region. A financial contribution of $1.5 million was paid to NANA on signing of the agreement with an additional annual payment of $1.0 million until the mine reached production. Subsequently, NANA receives 4.5% of the net smelter return and, once capital investment is recouped, it will receive a 25% share of profits increasing by 5% every 5 years until NANA and Teck Cominco share the profits equally. In 2002, NANA shareholders made up approximately 60% of the total workforce with annual wages exceeding $15 million. In 2004 an ISO conformant Environmental Management System was implemented by NANA shareholders and staff at the Red Dog mine were the first mine in Alaska to be certified under ISO. The company has a training and employment program for NANA shareholders including university scholarship programs, trades apprenticeships and mentoring. As hunting and fishing are economic, cultural and social

__________________________________________
Syme Marmion & Co June 2010 Extractive Industries & Sustainable Regional Development Final Report 90
necessities for the indigenous population, a “subsistence committee” consisting of NANA shareholders is empowered to shut down the transportation road between the mine and the port during caribou migration and also establishes the date for the start of the shipping season based on the whale migration patterns. 12.4.4 Antamina, Peru
Operated by Compañia Minera Antamina, Antamina mine is located high in the Andes. Programs supporting long term sustainable development are promoted and implemented by the Ancash Association, an independent company at arm’s length from the mine owners. The association promotes primarily local initiatives in the areas of health, education and long term economic activities agreed by community consensus. It is supported by a community relations team that deals with consultation processes, purchasing of land and conflict resolution, employment training policies and practices, and the local purchasing of goods and services. 12.4.5 Saskatchewan, Canada
The Saskatchewan mine in northern Canada provides an example of successful tripartite relationships and indigenous employment. This mine operation turned around from a position of very little input from the local, overwhelmingly indigenous community to one in which it is the leading force for dynamic community development. A previous attempt by the State to exploit uranium brought workers in from outside the region and resulted in an unacceptable increase in crime and alcoholism. Subsequently, the Bayda Commission, established to address these problems, made several recommendations:
• Consultations should move from a bipartite to a tripartite form, incorporating local government as well as the provincial and federal governments.
• Socio-economic and cultural impacts should be incorporated into the decision making process, rather than focusing solely on the environment.
• The northern areas should share in the fiscal revenues generated by uranium mining. In general, the Commission set foundations for uranium development in northern Saskatchewan citing, as the basis for negotiations:
• Best efforts (rather than targets) to deliver social and economic benefits; • Cooperative tripartite negotiations; • Increased monitoring of environmental and occupational health and safety performances; • Community-based consultation procedures; and • Recognition of social spending as a legitimate royalty deduction for companies.
12.4.6 Cameco
Formed from a merger of provincial and federally owned companies, Cameco has emerged as a leader in employment planning and development in northern Saskatchewan with close to 50% indigenous employment in 1996. It has worked with the communities and various levels of government to dramatically increase benefits to residents of northern Saskatchewan while fulfilling stringent environmental regulations. Northern and native employees of Cameco’s northern mines are represented in all skill levels with less than 10% employed in the lower skilled support areas. This high level of native involvement, the result of a 10 year training programme, has been important in changing attitudes towards the benefits of uranium mining. FIFO in this region of Canada has generated a somewhat different outcome compared to Australia. In northern Saskatchewan this form of commuting utilises traditional communities, avoiding the need to relocate for employment and constructing new urban centres in the region. This has had a twofold effect, benefitting the

__________________________________________
Syme Marmion & Co June 2010 Extractive Industries & Sustainable Regional Development Final Report 91
existing local economy as wages are spent locally and, secondly, boosting leadership skills in the local communities that have improved local government service provision.68 12.4.7 Yanacoda Mine, Peru
The importance of communication with surrounding communities, alerting them to potential risks and hazards associated with the mine, is illustrated by the aftermath of a mercury spill at Yanacocha mine in Peru. Mercury spilled in transport from the mine to the coast along a 42 km stretch of road lined with small villages was, infortunately collected by the villagers hoping to extract gold, silver and uranium from it. The mining company followed up fast to clean up the spill and no long-term effects are expected from the incident, but it would have been far safer to have briefed the local communities about the dangers of mercury and engaged with the villages in some way so they felt a benefit from the mine flow to their communities.69 12.4.8 Cadia Valley Operation, New South Wales
The case of Cadia Valley Operation (CVO) in NSW illustrates how a mining company can contribute to community development by building partnerships and strengthening stakeholder capacity. It also illustrates the success of a program supported by the interest and participation of a local community. In a long-held view, the community believed that CVO had upset local community activities, including Landcare initiatives, by purchasing 8000 Ha of pastoral land and removing access. To address this issue, and promote revegetation programs in the area, CVO launched the Free Farm Trees program in 2003. The program was administered through the Landcare groups providing 50 free native seedlings to active members. It reinvigorated Landcare groups in the region and, with time, triggered interest in establishing a new group. CVO used its resources to gauge community support for the new group and provided a secretary to the group for one year to assist with establishment of the Flyers Creek Landcare Group. The group, formed in January 2005, has since attracted funding from Australian Government Envirofund to support their program.
12.5 International Trust Funds
The international examples below, from the USA and Canada, have been set up to ensure that residents of Alaska and Alberta who are not actively engaged in the mining industry benefit from the minerals resources that are extracted from their land. In Western Australia, the legislative framework is different, with the Commonwealth Government owning the rights to all subterranean mineral deposits. The royalty payments that Western Australia collects are from minerals and onshore petroleum extraction. Offshore oil and gas fields are subject to different, Federal, taxation frameworks and these funds only directly benefit Western Australian in the form of a Western Australian Infrastructure Fund which receives $100 million per annum from the Pluto and potential Gorgon LNG projects.
At present, WA keeps approximately 40% of the royalty funds collected, and receives less funding from the Commonwealth Goods and Services Tax due to the “horizontal fiscal equalisation” principle applied by the Commonwealth Grants Commission. The royalty funds fluctuate with the value of the minerals sold on the global markets and are used to fund public sector infrastructure, often to support future mining initiatives, minerals processing and associated industries.
68 http://www.idrc.ca/fr/ev-28037-201-1-DO_TOPIC.html
69 Marcello M Veiga, Malcolm Scobie, Mary Louise McAllister, University of British Columbia Mining with Communities p 6

__________________________________________
Syme Marmion & Co June 2010 Extractive Industries & Sustainable Regional Development Final Report 92
Apart from the relatively new Western Australian Infrastructure Fund, Western Australia does not have an equivalent to these in the form of a public investment Fund set up in perpetuity to benefit all Western Australians.
12.5.1 The Alaska Permanent Fund
A fund, tapping the enormous wealth of the Alaskan oil and gas fields, holds financial assets and real estate "in trust" for the citizens of Alaska. The Fund seeks to earn a return of 4% per year with investments of below-average risk. 50% of royalty revenues from oil and gas (25% prior to 1980) are paid into the fund with periodic additional appropriations from the State legislature including 18% of State of Alaska oil revenues since the construction of the trans-Alaska pipeline in the 1970s. The Permanent Fund consists of two parts: principal and income. Between 1976 and 2001, the principal grew in value to about US$25 billion and cumulative net income exceeded US$ 20 billion. The principal cannot be spent unless a majority of all voters approve such spending in a statewide referendum. The principal is invested in a variety of assets (only about 1% of the principal is invested in Alaskan assets). State legislature determines how Fund income is used each year. To date, the income has been used to:
• To pay individual dividends. In 2000, each Alaskan received a dividend check for US$1964. • To inflation-proof the Fund by using income to top up the principal where inflation would otherwise
reduce the real value of the principal. • To increase the size of the principal. Since 1976, 42% of the principal has been paid out to
individuals as dividends, with the remaining 58% being re-invested in the principal The Fund is managed by the Alaska Permanent Fund Corporation which has an independent Board of Trustees consisting of four public members, the Alaska Commissioner of Revenue, and a cabinet minister 12.5.2 The Alberta Heritage Savings Trust Fund
The Canadian State of Alberta established a fund in 1976 to act as a source of revenue to strengthen and diversify the economy of the province. Created by an act of the provincial parliament the Fund received 15% to 30% of provincial revenues from non-renewable resources (primarily oil and gas) between 1976 and 1987. The Fund stopped receiving funds after 1987 (corresponding to a period in which the provincial government's budget went into deficit). Between 1976 and 1997, the Heritage Fund operated more like an economic development fund than a trust fund or endowment. It was not well understood by the public felt the business of government was not to be running a “development bank”. Managed by the Alberta Treasury, the fund made debt and equity investments in the Alberta economy, primary provincial Crown corporations and other government investments; loans to other provincial governments at below-market interest rates; investments in projects providing long-term benefits to Alberta, especially medical research facilities, education, agriculture, transportation, and telecommunications and investments in Canadian stocks and money market securities. Restructured in 1997, the Heritage Fund now resembles the Alaska Permanent Fund with assets transferred into a new endowment invested in primarily fixed income securities and equities. Income will be used to inflation proof the endowment and any excess will go into the provincial general fund.

__________________________________________
Syme Marmion & Co June 2010 Extractive Industries & Sustainable Regional Development Final Report 93
12.5.3 The Government Pension Fund (Global) Norway
Known as the Petroleum Fund of Norway until 2006, this fund receives its income from taxation and licensing of the Norwegian petroleum industry as well as dividends from the State company (Statoil). It is now the 4th largest pension in the world fund and the largest in Europe investing widely in global share markets. It is legally prevented from spending more than 4% of the fund in Norway in any given year and complies with an ethical investment strategy.

__________________________________________
Syme Marmion & Co June 2010 Extractive Industries & Sustainable Regional Development Final Report 94
APPENDICES

__________________________________________
Syme Marmion & Co June 2010 Extractive Industries & Sustainable Regional Development Final Report 95
Appendix A – Regional Development Commission Area Maps

__________________________________________
Syme Marmion & Co June 2010 Extractive Industries & Sustainable Regional Development Final Report 96

________________________________________________________________
Syme Marmion & Co June 2010 Extractive Industries & Sustainable Regional Development Final Report 97
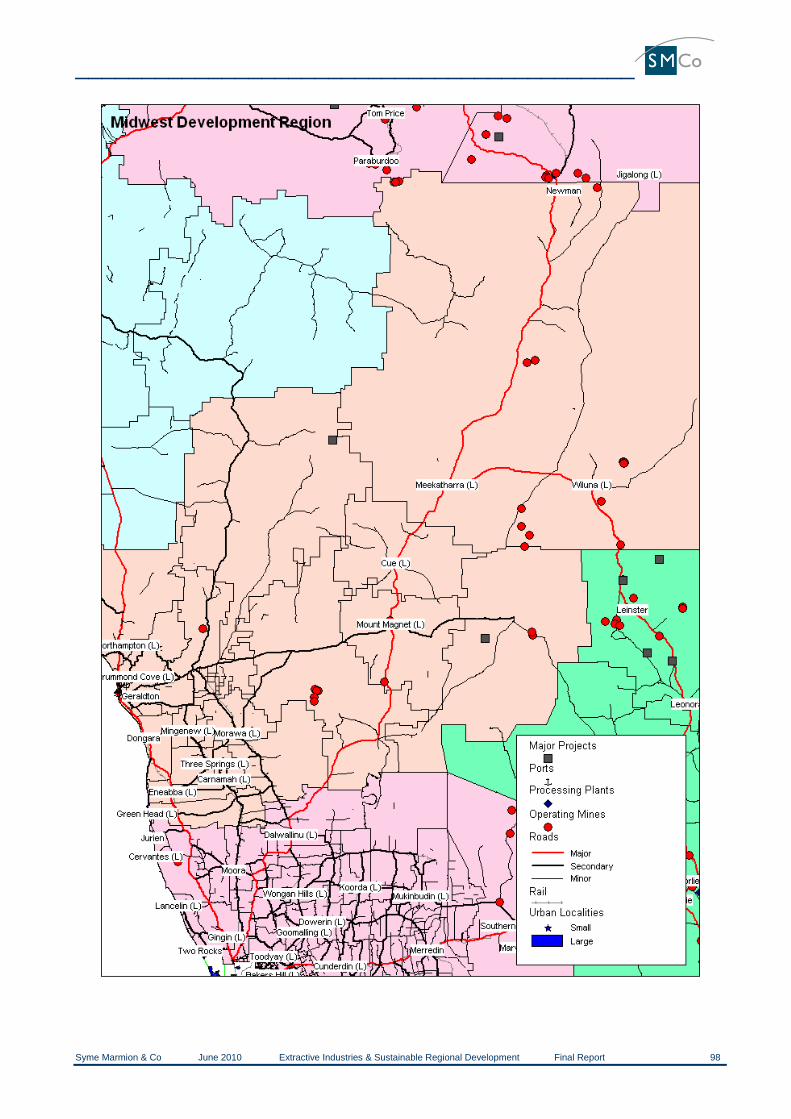
__________________________________________
Syme Marmion & Co June 2010 Extractive Industries & Sustainable Regional Development Final Report 98

__________________________________________
Syme Marmion & Co June 2010 Extractive Industries & Sustainable Regional Development Final Report 99

__________________________________________
Syme Marmion & Co June 2010 Extractive Industries & Sustainable Regional Development Final Report 100

__________________________________________
Syme Marmion & Co June 2010 Extractive Industries & Sustainable Regional Development Final Report 101

__________________________________________
Syme Marmion & Co June 2010 Extractive Industries & Sustainable Regional Development Final Report 102
Appendix B – Demographic and Household Characteristics
Demographic & Household Characteristics
Appendix B provides information on:
• Community population • Age distribution • Proportion of males • Median age • Median individual, family and household income • Median housing loan repayment • Median rent • Average household size
The communities mentioned in Chapter 10 are characterised by higher than average: income; population aged less than 64 years of age; and proportion of males. The majority of residents in these towns also pay lower than average rent and housing loan repayments as well as having a lower than average median age.

__________________________________________
Syme Marmion & Co June 2010 Extractive Industries & Sustainable Regional Development Final Report 103
Population
Large (>=5,000) Medium
(>999 & <4,999) Small (<=999) M
ixed
Eco
nom
y (P
ropo
rtio
n of
wor
kfor
ce e
mpl
oyed
in m
inin
g <2
0%)
• Bunbury • Busselton • Collie • Broome • Mandurah • Geraldton • Esperance
• Manjimup • Bridgetown • Byford • Harvey • Pinjarra • Donnybrook • Derby • Capel • Waroona • Halls Creek • Kununurra • Dongara
• Leonora • Allanson • Boddington • Cue • Hopetoun • Three Springs • Wyndham • North Dandalup • Mullewa • Carnamah • Laverton • Meekatharra • Dwellingup • Northampton • Jarrahdale • Drummond Cove • Peppermint • Grove • Serpentine • Boyanup • Wiluna • Roebourne • Cookernup • Ravensthorpe • Marble Bar • Dardanup • Burekup • Yarloop • Mundijong • Brunswick • Junction • Binningup • Nannup • Morawa • Boyup Brook • Fitzroy Crossing • Mingenew • Pemberton
Econ
omic
Bas
e
Min
ing
Bas
ed E
cono
my
(Pro
port
ion
of w
orkf
orce
em
ploy
ed in
min
ing
>=20
%)
• Kalgoorlie –
Boulder • Karratha • Port Hedland
• Kambalda West • Newman • Tom Price • Dampier • Wickham • Paraburdoo
• Pannawonica • Leinster • Eneabba • Greenbushes • Norseman • Leeman • Mount Magnet • Coolgardie • Onslow
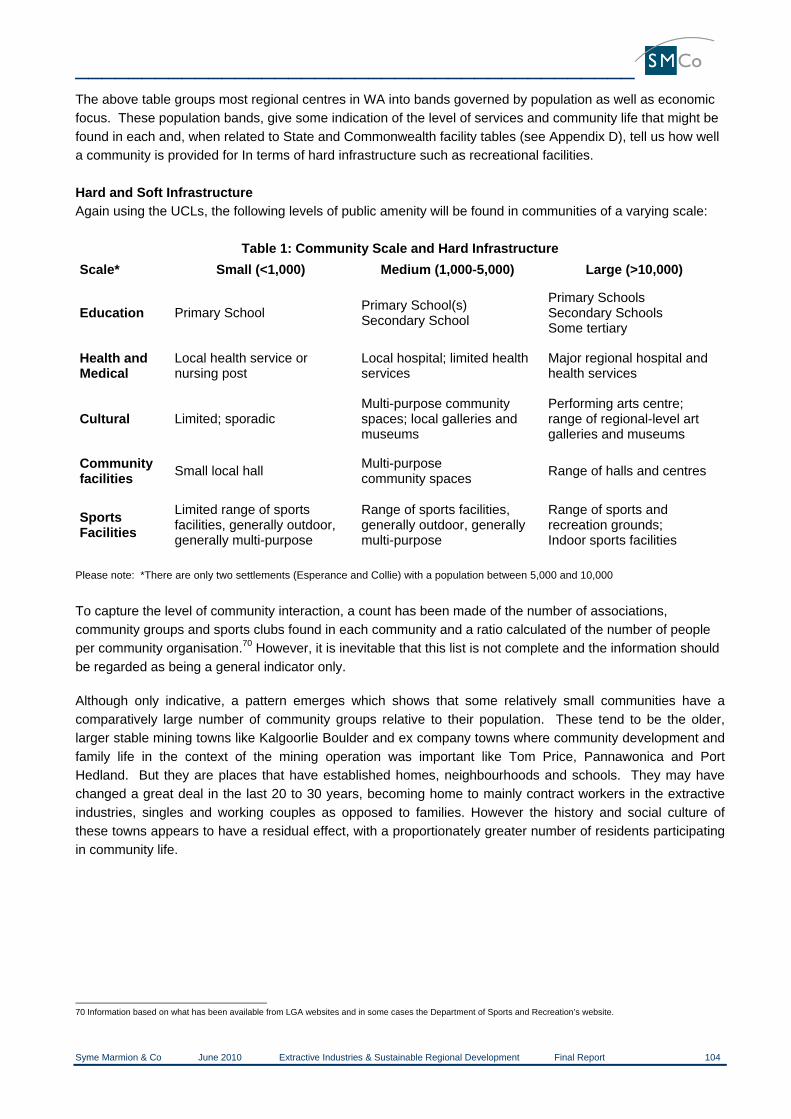
__________________________________________
Syme Marmion & Co June 2010 Extractive Industries & Sustainable Regional Development Final Report 104
The above table groups most regional centres in WA into bands governed by population as well as economic focus. These population bands, give some indication of the level of services and community life that might be found in each and, when related to State and Commonwealth facility tables (see Appendix D), tell us how well a community is provided for In terms of hard infrastructure such as recreational facilities. Hard and Soft Infrastructure Again using the UCLs, the following levels of public amenity will be found in communities of a varying scale:
Table 1: Community Scale and Hard Infrastructure Scale* Small (<1,000) Medium (1,000-5,000) Large (>10,000)
Education Primary School Primary School(s) Secondary School
Primary Schools Secondary Schools Some tertiary
Health and Medical
Local health service or nursing post
Local hospital; limited health services
Major regional hospital and health services
Cultural Limited; sporadic Multi-purpose community spaces; local galleries and museums
Performing arts centre; range of regional-level art galleries and museums
Community facilities Small local hall Multi-purpose
community spaces Range of halls and centres
Sports Facilities
Limited range of sports facilities, generally outdoor, generally multi-purpose
Range of sports facilities, generally outdoor, generally multi-purpose
Range of sports and recreation grounds; Indoor sports facilities
Please note: *There are only two settlements (Esperance and Collie) with a population between 5,000 and 10,000
To capture the level of community interaction, a count has been made of the number of associations, community groups and sports clubs found in each community and a ratio calculated of the number of people per community organisation.70 However, it is inevitable that this list is not complete and the information should be regarded as being a general indicator only. Although only indicative, a pattern emerges which shows that some relatively small communities have a comparatively large number of community groups relative to their population. These tend to be the older, larger stable mining towns like Kalgoorlie Boulder and ex company towns where community development and family life in the context of the mining operation was important like Tom Price, Pannawonica and Port Hedland. But they are places that have established homes, neighbourhoods and schools. They may have changed a great deal in the last 20 to 30 years, becoming home to mainly contract workers in the extractive industries, singles and working couples as opposed to families. However the history and social culture of these towns appears to have a residual effect, with a proportionately greater number of residents participating in community life.
70 Information based on what has been available from LGA websites and in some cases the Department of Sports and Recreation’s website.

__________________________________________
Syme Marmion & Co June 2010 Extractive Industries & Sustainable Regional Development Final Report 105
Community Groups: Persons per Community Group Large Medium Small
Mix
ed
Geraldton
422
Derby Dongara Bridgetown
386 156
40
Boddington Boyup Brook Greenbushes Carnamah Mingenew Morawa Three Springs Hopetoun Ravensthorpe
26 12 34 19 18 27 17 83 26
Min
ing
Kalgoorlie- Boulder Karratha Port Hedland
807 104 889
Paraburdoo Tom Price Wickham Dampier
179 340
76 80
Pannawonica Greenbushes Eneabba Coolgardie Kambalda West Leeman
342
34 103
42 123
66
The factors currently used to determine the level of public amenities and publicly funded facilities apply to a given community are numerical, included as an addendum to this study, Appendix D. These set out clearly the population and growth demographics that trigger the procurement of amenities by both State and Federal governments.

________________________________________________________________
Syme Marmion & Co June 2010 Extractive Industries & Sustainable Regional Development Final Report 106
UCL UCL Name Population
% Age 0-14
% Age 15-64
% Age Over 64
% Population
Male
Median age of
persons
Median individual income
($/week)
Median family
income ($/week)
Median household
income ($/week)
Median housing
loan repayment ($/month)
Median rent
($/week)
Average household
size 500400 Allanson 610 28% 69% 3% 51% 35 $484 $1,621 $1,475 $1,083 $140 1.1 501200 Binningup 951 24% 65% 11% 50% 36 $506 $1,205 $1,121 $1,200 $170 1.1 501400 Boddington 925 25% 65% 10% 50% 37 $433 $1,175 $1,035 $867 $123 1.1 501600 Boyanup 614 19% 71% 10% 50% 42 $439 $1,073 $900 $953 $150 1.1 501800 Boyup Brook 533 19% 56% 25% 46% 46 $356 $806 $633 $520 $100 1.1 502000 Bridgetown 2,323 21% 63% 16% 47% 44 $388 $953 $736 $915 $140 1 502400 Broome 11,546 23% 73% 4% 52% 32 $628 $1,349 $1,184 $1,733 $163 1.1
502800 Brunswick Junction 799 25% 61% 14% 50% 37 $363 $933 $845 $797 $130 1.1
503000 Bunbury 54,480 22% 67% 12% 50% 36 $491 $1,232 $1,082 $1,184 $180 1 503100 Burekup 251 31% 63% 6% 56% 36 $476 $1,087 $1,066 $1,083 $165 1.1 503200 Busselton 15,384 21% 60% 19% 48% 39 $429 $1,052 $849 $1,161 $180 1 503400 Byford 2,273 23% 67% 10% 51% 36 $470 $1,316 $1,232 $1,240 $180 1.1 503600 Capel 1,462 26% 61% 13% 48% 36 $394 $1,037 $886 $1,033 $160 1.1 503800 Carnamah 357 27% 59% 14% 48% 36 $460 $1,027 $741 $415 $80 1.1 504600 Collie 7,086 23% 63% 14% 50% 37 $373 $1,095 $871 $850 $125 1.1 504700 Cookernup 296 21% 65% 15% 51% 38 $353 $899 $704 $1,040 $138 1.1 504800 Coolgardie 803 23% 68% 8% 53% 38 $386 $1,064 $818 $650 $100 1.1 505600 Cue 271 24% 68% 9% 50% 36 $355 $843 $737 $339 $70 1.2 506200 Dampier 1,372 22% 75% 3% 58% 35 $1,194 $2,547 $2,479 $1,200 $200 1.1 506220 Dardanup 370 28% 61% 11% 49% 35 $513 $1,240 $1,117 $975 $168 1.1 507000 Derby 3,093 27% 66% 7% 50% 31 $462 $1,140 $1,043 $946 $100 1.2 507200 Dongara 2,346 20% 61% 19% 52% 42 $404 $1,049 $790 $1,083 $135 1.1 507400 Donnybrook 1,933 22% 62% 16% 49% 39 $383 $1,007 $744 $963 $140 1.1
507740 Drummond Cove 759 26% 67% 7% 51% 36 $567 $1,316 $1,196 $1,153 $220 1
508200 Dwellingup 346 25% 66% 9% 49% 37 $384 $962 $808 $953 $140 1.1 508600 Eneabba 202 15% 80% 5% 61% 39 $792 $1,100 $1,024 $433 $55 1 508800 Esperance 9,534 24% 63% 13% 49% 36 $454 $1,083 $889 $1,000 $137 1.1
509200 Fitzroy Crossing 928 27% 67% 7% 51% 30 $259 $642 $870 $600 $50 1.3
509400 Geraldton 27,420 23% 64% 12% 49% 35 $453 $1,108 $926 $997 $140 1.1 510600 Greenbushes 341 18% 67% 14% 49% 42 $349 $875 $591 $650 $100 1.1 511000 Halls Creek 1,209 27% 67% 6% 47% 28 $272 $677 $612 $735 $50 1.5 511200 Harvey 2,606 19% 63% 18% 50% 39 $349 $1,019 $807 $880 $130 1.1

________________________________________________________________
Syme Marmion & Co June 2010 Extractive Industries & Sustainable Regional Development Final Report 107
UCL UCL Name Population
% Age 0-14
% Age 15-64
% Age Over 64
% Population
Male
Median age of
persons
Median individual income
($/week)
Median family
income ($/week)
Median household
income ($/week)
Median housing
loan repayment ($/month)
Median rent
($/week)
Average household
size 511400 Hopetoun 585 19% 68% 14% 54% 40 $456 $1,262 $1,019 $1,083 $250 1.1 511600 Jarrahdale 600 28% 66% 7% 49% 36 $491 $1,133 $1,041 $1,222 $130 1.1
512400 Kalgoorlie-Boulder 28,241 25% 70% 5% 52% 31 $684 $1,728 $1,518 $1,200 $165 1.1
512640 Kambalda West 2,704 31% 67% 2% 54% 28 $828 $1,868 $1,744 $725 $150 1.1
512800 Karratha 11,725 26% 72% 1% 54% 30 $940 $2,309 $2,078 $1,701 $115 1.1 514200 Kununurra 3,748 24% 72% 4% 51% 31 $653 $1,355 $1,206 $1,300 $103 1.2 515200 Laverton 311 21% 70% 9% 48% 37 $480 $1,011 $987 $650 $60 1.1 515600 Leeman 399 20% 70% 10% 57% 39 $392 $1,224 $941 $1,138 $134 1.1 515800 Leinster 731 30% 70% 0% 55% 29 $1,153 $2,054 $1,939 $1,600 $0 1.1 516000 Leonora 398 22% 73% 5% 53% 35 $606 $1,243 $1,029 $675 $90 1.1 516800 Mandurah 67,812 20% 61% 19% 49% 41 $395 $1,076 $883 $1,300 $175 1 517000 Manjimup 4,238 25% 60% 15% 49% 36 $397 $981 $790 $800 $115 1.1 517200 Marble Bar 192 22% 64% 14% 55% 34 $542 $1,100 $1,033 $278 $72 1.2 517600 Meekatharra 798 29% 65% 7% 49% 32 $425 $1,011 $995 $367 $60 1.2 518000 Mingenew 285 24% 62% 14% 54% 39 $414 $924 $710 $433 $65 1.1 518400 Morawa 597 26% 61% 13% 52% 33 $343 $959 $764 $433 $80 1.1
519000 Mount Magnet 424 25% 70% 5% 52% 35 $531 $1,366 $1,008 $499 $78 1.1
519600 Mullewa 425 27% 62% 11% 49% 32 $483 $1,072 $953 $510 $90 1.2 520000 Mundijong 876 27% 62% 11% 51% 34 $430 $1,057 $964 $1,083 $170 1.1 520200 Nannup 501 23% 60% 17% 50% 43 $387 $966 $625 $867 $100 1.1 520800 Newman 4,247 28% 71% 1% 54% 30 $1,095 $2,459 $2,274 $360 $72 1.1 521000 Norseman 857 23% 67% 9% 54% 35 $461 $1,115 $866 $433 $71 1.1
521100 North Dandalup 341 25% 68% 7% 50% 36 $383 $1,116 $1,060 $1,100 $120 1.1
521600 Northampton 812 23% 57% 21% 47% 44 $290 $659 $546 $867 $106 1.1 521800 Onslow 576 20% 71% 9% 53% 37 $428 $1,133 $961 $870 $90 1.1 522000 Pannawonica 685 28% 71% 1% 57% 32 $1,383 $2,738 $2,631 $0 $27 1.1 522200 Paraburdoo 1,605 31% 68% 1% 56% 30 $1,245 $2,506 $2,344 $239 $30 1.1 522600 Pemberton 756 20% 66% 13% 53% 37 $438 $1,062 $784 $758 $100 1.1
522700 Peppermint Grove 375 20% 72% 8% 51% 41 $574 $1,193 $1,131 $1,294 $185 1
523400 Pinjarra 3,280 21% 61% 18% 50% 41 $342 $947 $727 $1,000 $125 1.1

________________________________________________________________
Syme Marmion & Co June 2010 Extractive Industries & Sustainable Regional Development Final Report 108
UCL UCL Name Population
% Age 0-14
% Age 15-64
% Age Over 64
% Population
Male
Median age of
persons
Median individual income
($/week)
Median family
income ($/week)
Median household
income ($/week)
Median housing
loan repayment ($/month)
Median rent
($/week)
Average household
size 523600 Port Hedland 11,556 24% 73% 3% 54% 31 $862 $2,109 $1,890 $1,083 $114 1.1 524400 Ravensthorpe 437 24% 69% 7% 53% 31 $619 $1,475 $1,190 $817 $95 1.2 524800 Roebourne 858 25% 68% 7% 51% 32 $293 $1,007 $1,005 $650 $100 1.5 525140 Serpentine 763 30% 62% 7% 49% 34 $470 $1,221 $1,166 $1,300 $195 1.1
526200 Three Springs 395 23% 62% 16% 51% 39 $492 $1,093 $924 $576 $90 1.1
526400 Tom Price 2,720 30% 70% 1% 55% 29 $1,181 $2,576 $2,507 $250 $54 1.1 528000 Waroona 1,863 21% 60% 18% 48% 39 $368 $1,053 $810 $990 $130 1.1 528400 Wickham 1,823 29% 69% 1% 53% 28 $792 $2,193 $1,975 $867 $28 1.1 528800 Wiluna 202 27% 68% 5% 56% 30 $512 $1,216 $1,163 $700 $30 1.3 529800 Wyndham 667 22% 71% 7% 54% 34 $442 $1,133 $1,154 $468 $60 1.3 530200 Yarloop 547 26% 63% 11% 51% 33 $327 $656 $608 $700 $130 1.1

__________________________________________
Syme Marmion & Co June 2010 Extractive Industries & Sustainable Regional Development Final Report 109
Appendix C – Economic & Employment Characteristics
Economic & Employment Characteristics
Appendix C provides information on the industry of employment for the various communities. Included are:
• Total employed • Primary Industry • Mining • Manufacturing • Utilities • Construction • Wholesale & retail trade • Accommodation & food services • Transport / postal & warehousing • Information media & telecommunications • Financial & insurance services • Real Estate • Professional / scientific • Administrative • Public administration & safety • Education & training • Health care & social assistance • Arts & recreation • Other
Gender Dampier, Eneabba, Kambalda West, Leinster, Newman, Pannawonica, Paraburdoo, Tom Price and Wickham stand out as having a relatively large proportion (35% or more) of their workforce employed in mining.

________________________________________________________________
Syme Marmion & Co June 2010 Extractive Industries & Sustainable Regional Development Final Report 110
UCL UCL Name To
tal E
mpl
oyed
Prim
ary
Indu
stry
Min
ing
Man
ufac
turin
g
Util
ities
Con
stru
ctio
n
Who
lesa
le /
reta
il tra
de
Acc
omm
odat
ion
& fo
od
serv
ices
Tran
spor
t\ po
stal
&
war
ehou
sing
Info
rmat
ion
med
ia &
te
leco
mm
unic
atio
ns
Fina
ncia
l & in
sura
nce
serv
ices
Rea
l Est
ate
Pro
fess
iona
l\ sc
ient
ific
Adm
inis
trativ
e
Pub
lic a
dmin
istra
tion
& s
afet
y To
tal
Edu
catio
n &
trai
ning
To
tal
Hea
lth c
are
& s
ocia
l ass
ista
nce
Tota
l
Arts
& re
crea
tion
Oth
er
500400 Allanson 263 2% 17% 21% 4% 3% 7% 5% 3% 1% 1% 1% 2% 4% 3% 10% 13% 0% 4%
501200 Binningup 369 7% 3% 23% 0% 15% 11% 5% 3% 0% 2% 3% 5% 2% 5% 8% 7% 0% 3%
501400 Boddington 384 7% 17% 22% 0% 9% 7% 6% 3% 0% 1% 0% 2% 2% 8% 8% 8% 1% 2%
501600 Boyanup 280 8% 6% 9% 2% 14% 17% 4% 5% 0% 0% 2% 0% 2% 8% 12% 6% 1% 5%
501800 Boyup Brook 190 23% 0% 6% 3% 8% 15% 7% 3% 0% 0% 0% 4% 2% 12% 8% 8% 0% 2%
502000 Bridgetown 984 5% 6% 8% 2% 8% 15% 9% 4% 0% 1% 2% 4% 2% 8% 11% 12% 1% 4%
502400 Broome 5208 4% 2% 4% 1% 10% 14% 12% 7% 2% 1% 2% 3% 4% 9% 9% 11% 1% 4%
502800
Brunswick Junction 310 4% 4% 17% 1% 13% 15% 6% 10% 2% 0% 2% 2% 5% 5% 6% 6% 1% 2%
503000 Bunbury 25,195 1% 4% 14% 2% 14% 17% 6% 4% 1% 2% 2% 4% 3% 5% 7% 10% 1% 5%
503100 Burekup 109 4% 5% 16% 0% 12% 11% 0% 6% 0% 0% 3% 6% 0% 8% 9% 15% 0% 6%
503200 Busselton 6,554 4% 3% 7% 1% 15% 18% 11% 3% 1% 3% 2% 4% 4% 5% 6% 10% 1% 4%
503400 Byford 1,107 1% 4% 14% 1% 15% 15% 5% 7% 1% 2% 2% 4% 2% 5% 6% 9% 1% 5%
503600 Capel 577 5% 11% 14% 0% 15% 16% 4% 2% 0% 1% 3% 2% 3% 7% 5% 10% 1% 3%
503800 Carnamah 160 9% 9% 6% 0% 6% 26% 2% 4% 0% 0% 0% 6% 0% 12% 12% 6% 0% 4%
504600 Collie 2,619 2% 18% 11% 6% 8% 13% 7% 2% 1% 1% 1% 2% 2% 5% 8% 10% 0% 3%
504700 Cookernup 108 6% 6% 27% 4% 4% 14% 3% 3% 0% 0% 3% 3% 0% 0% 9% 8% 3% 9%
504800 Coolgardie 271 0% 24% 4% 3% 6% 14% 5% 6% 2% 0% 0% 1% 4% 9% 10% 10% 0% 2%
505600 Cue 97 3% 16% 0% 0% 7% 14% 3% 8% 0% 0% 0% 0% 0% 21% 15% 7% 0% 4%

________________________________________________________________
Syme Marmion & Co June 2010 Extractive Industries & Sustainable Regional Development Final Report 111
UCL UCL Name To
tal E
mpl
oyed
Prim
ary
Indu
stry
Min
ing
Man
ufac
turin
g
Util
ities
Con
stru
ctio
n
Who
lesa
le /
reta
il tra
de
Acc
omm
odat
ion
& fo
od
serv
ices
Tran
spor
t\ po
stal
&
war
ehou
sing
Info
rmat
ion
med
ia &
te
leco
mm
unic
atio
ns
Fina
ncia
l & in
sura
nce
serv
ices
Rea
l Est
ate
Pro
fess
iona
l\ sc
ient
ific
Adm
inis
trativ
e
Pub
lic a
dmin
istra
tion
& s
afet
y To
tal
Edu
catio
n &
trai
ning
To
tal
Hea
lth c
are
& s
ocia
l ass
ista
nce
Tota
l
Arts
& re
crea
tion
Oth
er
506200 Dampier 801 0% 35% 2% 1% 12% 7% 7% 11% 0% 1% 2% 2% 4% 5% 5% 3% 1% 2%
506220 Dardanup 174 6% 5% 18% 0% 15% 16% 4% 3% 0% 2% 0% 3% 4% 7% 9% 4% 0% 3%
507000 Derby 1,212 2% 3% 3% 2% 7% 10% 4% 5% 0% 1% 2% 2% 5% 11% 11% 26% 1% 4%
507200 Dongara 862 13% 10% 8% 1% 13% 13% 10% 4% 0% 1% 2% 2% 3% 5% 6% 6% 0% 4%
507400 Donnybrook 791 13% 5% 10% 1% 8% 16% 6% 5% 1% 0% 2% 2% 3% 6% 8% 10% 1% 3%
507740
Drummond Cove 331 2% 7% 4% 1% 15% 21% 4% 3% 0% 3% 3% 5% 2% 5% 11% 10% 0% 3%
508200 Dwellingup 146 8% 8% 8% 0% 7% 12% 15% 4% 0% 0% 0% 3% 2% 12% 11% 8% 2% 0%
508600 Eneabba 103 0% 39% 0% 0% 30% 9% 16% 0% 0% 0% 0% 0% 0% 0% 7% 0% 0% 0%
508800 Esperance 4,157 8% 3% 6% 1% 8% 19% 8% 8% 1% 2% 2% 3% 2% 6% 9% 9% 1% 5%
509200
Fitzroy Crossing 413 2% 0% 0% 0% 3% 8% 6% 3% 1% 0% 1% 1% 3% 22% 11% 25% 1% 10%
509400 Geraldton 11,302 3% 5% 6% 1% 10% 18% 6% 6% 1% 2% 2% 3% 3% 7% 10% 11% 1% 5%
510600 Greenbushes 115 5% 34% 28% 0% 3% 6% 9% 0% 0% 0% 0% 5% 3% 0% 3% 0% 0% 3%
511000 Halls Creek 310 2% 3% 1% 0% 5% 9% 5% 3% 0% 0% 0% 0% 3% 30% 15% 23% 0% 2%
511200 Harvey 1,030 8% 3% 31% 1% 6% 10% 5% 3% 0% 1% 1% 1% 2% 6% 8% 9% 1% 3%
511400 Hopetoun 274 6% 14% 7% 3% 27% 9% 8% 4% 0% 1% 4% 1% 3% 4% 4% 4% 0% 2%
511600 Jarrahdale 250 3% 8% 14% 2% 10% 13% 4% 7% 2% 0% 1% 7% 0% 9% 7% 8% 1% 4%
512400
Kalgoorlie-Boulder 13,477 0% 22% 8% 1% 7% 14% 6% 6% 1% 1% 2% 3% 3% 5% 7% 8% 1% 5%
512640
Kambalda West 1,211 0% 45% 8% 0% 5% 9% 3% 3% 0% 1% 1% 1% 2% 2% 6% 9% 0% 3%
512800 Karratha 5,806 0% 20% 6% 2% 15% 12% 5% 6% 1% 1% 3% 3% 4% 7% 8% 5% 0% 3%

________________________________________________________________
Syme Marmion & Co June 2010 Extractive Industries & Sustainable Regional Development Final Report 112
UCL UCL Name To
tal E
mpl
oyed
Prim
ary
Indu
stry
Min
ing
Man
ufac
turin
g
Util
ities
Con
stru
ctio
n
Who
lesa
le /
reta
il tra
de
Acc
omm
odat
ion
& fo
od
serv
ices
Tran
spor
t\ po
stal
&
war
ehou
sing
Info
rmat
ion
med
ia &
te
leco
mm
unic
atio
ns
Fina
ncia
l & in
sura
nce
serv
ices
Rea
l Est
ate
Pro
fess
iona
l\ sc
ient
ific
Adm
inis
trativ
e
Pub
lic a
dmin
istra
tion
& s
afet
y To
tal
Edu
catio
n &
trai
ning
To
tal
Hea
lth c
are
& s
ocia
l ass
ista
nce
Tota
l
Arts
& re
crea
tion
Oth
er
514200 Kununurra 1,718 5% 9% 5% 2% 7% 12% 7% 6% 1% 1% 2% 2% 4% 12% 9% 10% 1% 4%
515200 Laverton 149 0% 9% 2% 0% 8% 5% 7% 5% 3% 5% 0% 0% 3% 25% 8% 12% 0% 7%
515600 Leeman 170 10% 29% 0% 0% 14% 9% 8% 4% 2% 0% 0% 0% 4% 9% 5% 4% 0% 4%
515800 Leinster 394 0% 43% 12% 1% 9% 7% 6% 4% 0% 1% 2% 0% 3% 1% 4% 4% 0% 3%
516000 Leonora 215 1% 18% 4% 1% 12% 7% 6% 5% 2% 0% 0% 8% 3% 14% 8% 5% 1% 4%
516800 Mandurah 25,460 1% 5% 13% 1% 14% 16% 6% 3% 1% 2% 3% 4% 3% 5% 7% 9% 1% 4%
517000 Manjimup 1,767 12% 1% 11% 1% 6% 19% 5% 6% 0% 1% 1% 2% 2% 9% 9% 9% 1% 4%
517200 Marble Bar 62 15% 5% 0% 0% 21% 6% 8% 0% 0% 0% 0% 0% 0% 24% 16% 5% 0% 0%
517600 Meekatharra 209 0% 9% 0% 0% 6% 7% 6% 3% 0% 0% 0% 0% 6% 16% 22% 20% 0% 6%
518000 Mingenew 108 25% 0% 0% 0% 7% 14% 0% 7% 0% 0% 0% 4% 0% 19% 12% 3% 0% 8%
518400 Morawa 220 12% 2% 2% 0% 8% 13% 6% 8% 0% 2% 0% 0% 2% 9% 24% 12% 0% 1%
519000 Mount Magnet 158 3% 27% 0% 2% 4% 12% 4% 4% 0% 0% 2% 6% 3% 12% 13% 4% 0% 3%
519600 Mullewa 159 16% 9% 0% 2% 2% 11% 5% 3% 0% 0% 0% 0% 6% 14% 19% 11% 0% 3%
520000 Mundijong 378 3% 4% 14% 2% 13% 15% 2% 9% 1% 2% 1% 4% 3% 6% 5% 8% 2% 5%
520200 Nannup 192 3% 3% 28% 0% 10% 11% 8% 5% 0% 0% 2% 4% 0% 11% 7% 5% 0% 3%
520800 Newman 2,134 0% 45% 3% 1% 8% 8% 7% 3% 1% 1% 1% 1% 3% 4% 7% 5% 0% 3%
521000 Norseman 335 0% 33% 2% 0% 2% 13% 9% 5% 0% 0% 0% 1% 2% 10% 10% 11% 0% 1%
521100
North Dandalup 135 10% 9% 11% 0% 19% 16% 5% 3% 0% 0% 0% 0% 4% 2% 9% 3% 3% 5%
521600 Northampton 253 15% 8% 4% 0% 7% 12% 6% 6% 0% 1% 0% 2% 2% 7% 7% 14% 1% 8%

________________________________________________________________
Syme Marmion & Co June 2010 Extractive Industries & Sustainable Regional Development Final Report 113
UCL UCL Name To
tal E
mpl
oyed
Prim
ary
Indu
stry
Min
ing
Man
ufac
turin
g
Util
ities
Con
stru
ctio
n
Who
lesa
le /
reta
il tra
de
Acc
omm
odat
ion
& fo
od
serv
ices
Tran
spor
t\ po
stal
&
war
ehou
sing
Info
rmat
ion
med
ia &
te
leco
mm
unic
atio
ns
Fina
ncia
l & in
sura
nce
serv
ices
Rea
l Est
ate
Pro
fess
iona
l\ sc
ient
ific
Adm
inis
trativ
e
Pub
lic a
dmin
istra
tion
& s
afet
y To
tal
Edu
catio
n &
trai
ning
To
tal
Hea
lth c
are
& s
ocia
l ass
ista
nce
Tota
l
Arts
& re
crea
tion
Oth
er
521800 Onslow 252 3% 23% 2% 1% 12% 9% 9% 7% 0% 0% 2% 2% 3% 10% 8% 9% 0% 2%
522000 Pannawonica 355 0% 65% 0% 0% 2% 6% 8% 2% 0% 1% 0% 2% 3% 3% 5% 3% 0% 0%
522200 Paraburdoo 836 0% 62% 1% 0% 4% 6% 4% 2% 0% 0% 1% 1% 6% 3% 4% 4% 0% 2%
522600 Pemberton 354 11% 0% 22% 0% 4% 9% 16% 5% 0% 1% 0% 1% 1% 9% 11% 8% 2% 1%
522700
Peppermint Grove 184 5% 7% 3% 2% 15% 10% 4% 3% 0% 0% 3% 9% 5% 2% 10% 16% 0% 5%
523400 Pinjarra 1,145 2% 8% 17% 1% 12% 14% 9% 3% 1% 1% 3% 2% 4% 4% 7% 8% 2% 4%
523600 Port Hedland 4,795 0% 20% 6% 1% 13% 11% 5% 6% 0% 1% 3% 3% 4% 6% 7% 10% 1% 3%
524400 Ravensthorpe 218 10% 5% 6% 0% 21% 12% 5% 4% 1% 0% 2% 2% 0% 11% 10% 10% 0% 1%
524800 Roebourne 194 0% 6% 6% 0% 14% 8% 6% 2% 0% 0% 0% 4% 3% 14% 8% 26% 2% 4%
525140 Serpentine 311 3% 6% 16% 4% 14% 12% 3% 6% 1% 4% 0% 2% 0% 8% 7% 8% 2% 5%
526200 Three Springs 175 26% 11% 2% 6% 5% 13% 5% 3% 0% 5% 0% 0% 0% 10% 5% 10% 0% 0%
526400 Tom Price 1,420 0% 50% 2% 0% 5% 8% 4% 2% 0% 1% 2% 2% 5% 3% 8% 6% 0% 2%
528000 Waroona 742 3% 8% 20% 2% 15% 12% 5% 5% 0% 1% 2% 2% 3% 5% 6% 6% 0% 4%
528400 Wickham 822 0% 50% 2% 0% 3% 9% 4% 3% 0% 0% 0% 2% 5% 7% 7% 7% 1% 1%
528800 Wiluna 70 9% 6% 0% 0% 7% 10% 9% 4% 0% 0% 0% 0% 0% 24% 21% 10% 0% 0%
529800 Wyndham 205 4% 9% 0% 0% 4% 8% 4% 13% 0% 0% 0% 1% 2% 12% 15% 16% 0% 11%
530200 Yarloop 162 9% 4% 40% 0% 9% 14% 3% 2% 0% 0% 0% 0% 0% 4% 0% 10% 0% 4%

___________________________________________
Syme Marmion & Co June 2010 Extractive Industries & Sustainable Regional Development Final Report 114
Appendix D Infrastructure Benchmarks
Infrastructure Benchmarks A common way to establish what facilities should be provided to a given community within a local government
area is to look at the ratio of facilities per head of population. The ratio provides a crude estimate of facility
levels regarded as adequate for average community needs and therefore can act as a useful projected needs
estimate. However, there are always cases that need special consideration based on their demographics,
location and/or cultural and social indicators. Some commonly use infrastructure benchmarks are set out below
as a guide.
Common Infrastructure Benchmarks
Facility Ratio Source
RECREATION Sporting Fields 1.7 - 2.0 ha per 1,000 people NSW/Qld standard for LGA Aquatic Centre 1: 120,000 people Benchmark used by a number of
LGAs in WA 1: 15,000 people District Playing
Fields/Sporting Reserves (4-6 ovals)
Based on high school catchment of 15,000 people
Benchmark used by a number of LGAs in WA
Active Public open space/ovals
1:3,5000 Benchmark used by a number of LGAs in WA
Local parks and playgrounds
1:2,000 Benchmark used by a number of LGAs in WA
Sports Change rooms 1:5,000 Benchmark used by a number of LGAs in WA
Public toilets 1 per local centre/park Benchmark used by a number of LGAs in WA
District Indoor Recreation Centre
1: 30,000-60,000 people Benchmark used by a number of LGAs in WA
Golf Course 1: 30,000 people Benchmark used by a number of LGAs in WA
Wheeled Sports Facilities 1: 8,500 people Based on wheeled sports provision levels within the City of Wanneroo
Youth Sports (skate park/beach facilities
1:5 – 10,000 people (depending on demography)
Benchmark used by a number of LGAs in WA
Tennis courts 1:1,000 Benchmark used by a number of LGAs in WA
Netball courts 1:1,000 Benchmark used by a number of LGAs in WA
Basketball courts 1:1,000 Benchmark used by a number of LGAs in WA
Soccer field 1:1,000 NSW Department Sport and Recreation
Cricket wicket 1:3,000 Benchmark used by a number of LGAs in WA
SOCIAL/CULTURAL District Community Centre 1: 20,000 people Benchmark used by a number of
LGAs in WA Local Community Centre 1: 10,000-15,000 people Benchmark used by a number of
LGAs in WA
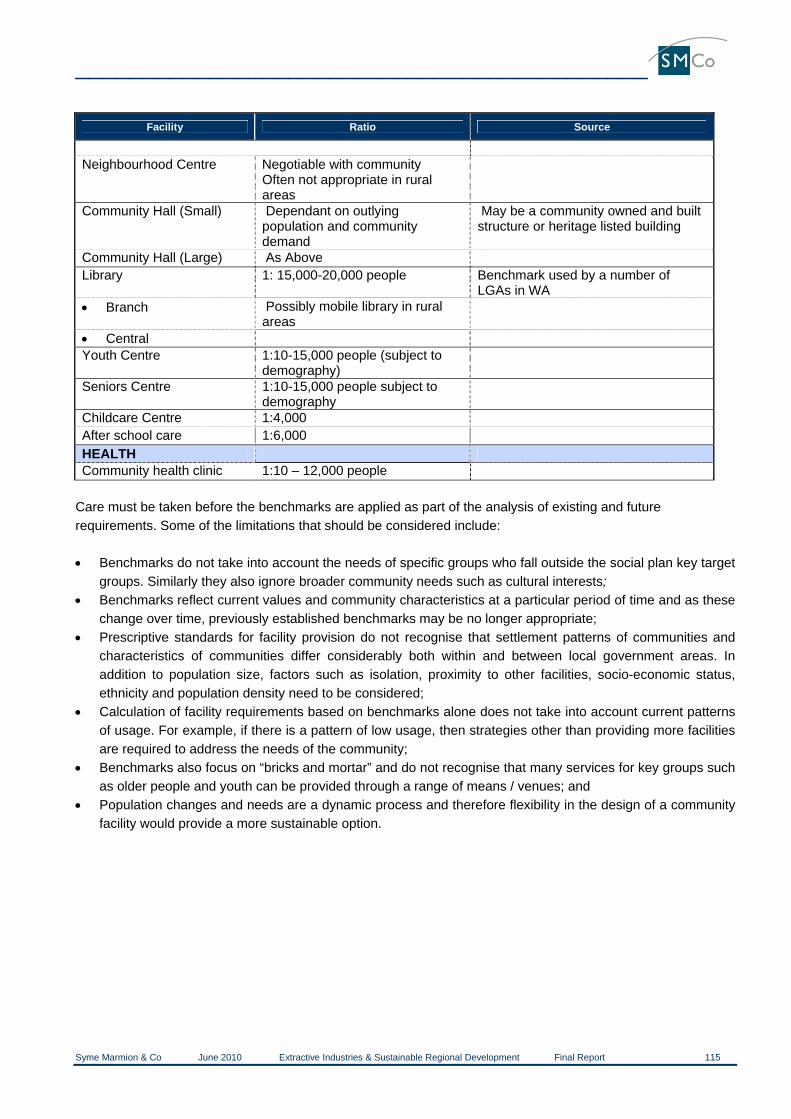
___________________________________________
Syme Marmion & Co June 2010 Extractive Industries & Sustainable Regional Development Final Report 115
Facility Ratio Source
Neighbourhood Centre Negotiable with community
Often not appropriate in rural areas
Community Hall (Small) Dependant on outlying population and community demand
May be a community owned and built structure or heritage listed building
Community Hall (Large) As Above Library
1: 15,000-20,000 people Benchmark used by a number of LGAs in WA
• Branch Possibly mobile library in rural areas
• Central Youth Centre 1:10-15,000 people (subject to
demography)
Seniors Centre 1:10-15,000 people subject to demography
Childcare Centre 1:4,000 After school care 1:6,000 HEALTH Community health clinic 1:10 – 12,000 people
Care must be taken before the benchmarks are applied as part of the analysis of existing and future requirements. Some of the limitations that should be considered include: • Benchmarks do not take into account the needs of specific groups who fall outside the social plan key target
groups. Similarly they also ignore broader community needs such as cultural interests; • Benchmarks reflect current values and community characteristics at a particular period of time and as these
change over time, previously established benchmarks may be no longer appropriate; • Prescriptive standards for facility provision do not recognise that settlement patterns of communities and
characteristics of communities differ considerably both within and between local government areas. In addition to population size, factors such as isolation, proximity to other facilities, socio-economic status, ethnicity and population density need to be considered;
• Calculation of facility requirements based on benchmarks alone does not take into account current patterns of usage. For example, if there is a pattern of low usage, then strategies other than providing more facilities are required to address the needs of the community;
• Benchmarks also focus on “bricks and mortar” and do not recognise that many services for key groups such as older people and youth can be provided through a range of means / venues; and
• Population changes and needs are a dynamic process and therefore flexibility in the design of a community facility would provide a more sustainable option.

___________________________________________
Syme Marmion & Co June 2010 Extractive Industries & Sustainable Regional Development Final Report 116
Appendix E Summary of Contributions Table

___________________________________________________________________
Syme Marmion & Co June 2010 Extractive Industries & Sustainable Regional Development Final Report 117
Company Name and programme Year Total Annual Contribution in Western Australia
Direct Investment into communities
Partnerships with any level of government
Partnerships with NGOs etc
Includes Native Title payments
Indigenous Training programmes
Management costs
Endowment Value
Distribution from Community Fund
ALCOA 2009 Yes Yes Wagerup Sustainability Fund 2008 $9,000 $5,300,000 $346,924 Alcoa Foundation 2009 $863,054 Alcoa Inc 2009 $4,426,314 Action Program 2009 $224,650 Bravo matched giving 2009 $272,411 WA Museum Clontarf Foundation Greening Australia WA Museum Frogwatch Perth International Arts Festival Sculpture by the Sea Alcoa Art Gifts BHPBILLITON 2009 $60,000,000 $24,000,000 Yes $18,000,000 Yes WA Ballet UWA Business School Revive Our Wetlands 2000/2009 $5,000,000 Worsley Alumina Community Investment Fund BHP Billiton Nickel West 2010 $5,000,000 shared
WACF $500,000 New tba
BHP Iron Ore 2009 $20,000,000 Newman Sustainability Partnership $6,400,000 Growing A Greener Port Hedland Police Community Project Operation Safeguard
World Vision 2010 $5,000,000 Cash for Trash 2010 Yes Yes Shooting Goals 2010 Yes Yes FORM Spinifex Hill Artists 2010 Yes Yes FORM Canning Stock Route project

___________________________________________________________________
Syme Marmion & Co June 2010 Extractive Industries & Sustainable Regional Development Final Report 118
Kitemaking workshops 2010 Jigalong Waste Management Program
2010 Yes Yes Yes
NAIDOC Week Port Hedland 2009 Matched Giving Program 2008/09 $500,000 Quarterly community investment program
2008/09 $460,000
Pilbara Childcare Strategy 2009 $20,000,000 Martumili Artist Programme RLSS - Remote Pool project RLSS - Don't Drink and Drown Newman Specialist Mining Program Newman Rec Centre 2010 $750,000 Community Bicycle Program 2010 Scitech Lab on Legs Education Scholarship Program Kicking Goals Glory in the Pilbara New Bus for Port Hedland $120,000 RFDS on the Road program CITICPACIFIC SINO IRON Yes Yes Cossack Art Awards Clontarf Foundation Yinja Barndi Art Group Roebourne Yaandina Family Centre Roebourne Roebourne DHS Constable Care Child Safety Foundation
Karratha Community House Mayuga Majik Basketball team Pilbara and Karratha Care Red Cross Toodyay Bush Fire Appeal
RFDS Service on the Road

___________________________________________________________________
Syme Marmion & Co June 2010 Extractive Industries & Sustainable Regional Development Final Report 119
Shire of Roebourne Youth programme
W Pilbara Police vehicle safety signage program
CHEVRON 2009 Social Impact
assessment underway
Community Spirit Grants Program $45,000 Yaandina Yes RFDS Indigenous Community Volunteers Onslow
University of WA Curtin University Beyond the Beaker Science in Schools
Caltex Starlight Foundation Australian Chamber Orchestra AFL NRL Chevron Energy Technology 2005 New technology centre in Perth FORTESCUE METALS GROUP 2009 Yes Vtec program 2006 n/a In kind community support $64,000 Yes Yes Summit 300 2006 GRIFFIN COAL 2008 $300,000 $245,000 Yes Yes Griffin Festival Annual Community Grants Time in Lieu for voluntary work

___________________________________________________________________
Syme Marmion & Co June 2010 Extractive Industries & Sustainable Regional Development Final Report 120
ILUKA 2008 $180,000 Yes Capel Library 2008 Busselton Jetty Swim Conservation Volunteers Capel Wetlands
MAGELLAN METALS 2010 $286,108 Yes $286,108 Magellan Community Fund in Esperance
2009/2010 $576,000
Esperance Goldfields SLS 2009/2010 $60,000 Restore Hope Foundation 2010 $50,000 MINARA RESOURCES 2010 $508,000 $242,600 Minara Community Foundation 2008/2010 $508,000 shared
WACF $2,000,000
Leonora Golden Gift 2008/2010 $150,000 Karlkurla Language Group 2008/2009 $70,000 Getting On Your Feet 2008 $40,000 Burnna Yurrul 2009 Vibe Alive 2009 $5,000 Leonora Bush Mission 2009 $8,000 Menzies Aboriginal Corporation 2008 $68,000 Laverton Kiddies Corner Playgroup 2010 $7,500 Tjuma Pulka Aboriginal Media Radio station
2010 $37,400
Nurra Kurramunoo Aboriginal Corporation
2010 $75,000
NEWMONT/ANGLO GOLD ASHANTI
2008 $2,291,000 $1,193,000 Yes Yes
Boddington Gold Mine 2006/2010 $200,000 Yes Yes Housing Bibbulmun Track 2006/2012 $200,000 Expansion of child care services Yes Yes Crossman Fire Brigade 24 Hr Nursing Service funded

___________________________________________________________________
Syme Marmion & Co June 2010 Extractive Industries & Sustainable Regional Development Final Report 121
Dwellingup Revival Live Local Program Buy Local Program Community Assistance Program 2006/2009 $100,000 RIO TINTO 2009 $41,700,000 $15,800,000 Yes $20,600,000 Yes $5,300,000 $2,600,000 Pannawonica upgrade 2010 $300,000,000 RFDS Life Flight Jet 2008/2011 $5,000,000 Employees in the Community 2008 $275,000 Pilbara Community Partnerships 2008 $1,780,000 State Library of WA Black Swan Theatre Company Vincentcare Scitech Better Beginnings Rio Tinto Future Fund 2008 $2,600,000 Kings Park 2008/2015 $8,700,000 Conservation Volunteers 2008/3013 $2,500,000 DADAA 2008 $100,000 Rio Tinto Iron Ore 2008 $15,000,000 $16,500,000 $2,900,000 Cossack Art Award 2008 $39,531 Barking Gecko Theatre Co 2008 $49,284 WA Sustainable Energy Association Exploration $16,000 $300,000 Argyle Diamonds 2008 $6,800,000 $603,000 $3,800,000 $2,200,000 Gelganyem Trust Yes Luzenac (Three Springs) 2008 $30,000 Dampier Salt 2008 $128,000 $50,000 $100,000 ST BARBARA Yes Yes Leonora Gift Songroom Initiative

___________________________________________________________________
Syme Marmion & Co June 2010 Extractive Industries & Sustainable Regional Development Final Report 122
VERVE ENERGY Verve Energy Collie 2008 $30,000 Nil Verve Energy Kwinana 2008 $30,000 Nil WESFARMERS RESOURCES 2009 $1,070,000 Partner with Life Education 2009 $75,000 WA Ballet Premier Coal 2009 $480,000 $190,204 Yes $$150,000 Yes Lake Kepwari 2005/2009 $2,200,000 Ngaang Boodja Council for fish farm 2008/2011 $300,000 Motorplex $600,000 Time in Lieu for voluntary community work
Centre for Excellence for Sustainable Mine Lakes
2006/2010 $63,000,000
WOODSIDE 2008 $10,000,000 $250,000 $3,700,000 Yes Yes Cultural Heritage 2009 Yes Yes Early Learning Centre Karratha 2009 $3,700,000 Yes Yes Conservation Volunteers 2009 $140,000 Yes Yes Woodside voluntary donations 2009 $126,000 PICC Health Yes Shire of Roebourne K2020 2008 Yes WA Ballet WA Aboriginal Dance Company PIAF Live @ Woodside Mission Australia Yes Smith Family Yes Yes Ngala Yes WA Ballet WA Museum 5 Mile Nursery Yes Yes Roebourne Breakfast Programme Yes Roebourne Pathways Yes

___________________________________________________________________
Syme Marmion & Co June 2010 Extractive Industries & Sustainable Regional Development Final Report 123
Gumala Mirnuwarni Yes Film and television Institute Scitech Art Gallery of WA Yes Leeuwin Yes Petroleum Club of WA Yes WA Youth Awards Earthwatch Marine Discovery West National Youth Science Programme Yaandina Yes Notes: The figures set out above demonstrate the variety of ways and directions in which contributions to community are made by major extractive industry companies. As anticipated, there is very little information available from medium and small mining companies who, facing higher risks and with less depth in both resource and economic terms, remain focused on returning value to their shareholders. The contributions range from very large to quite small sums and from support for flagship Australian and Western Australian cultural agencies such as the WA Ballet to support for local primary school programmes. There is no common, accepted way in which these sums are presented and therefore it is not possible to carry out any accurate comparisons. This reinforces the desirability of developing common criteria and benchmarks that will enable overall contributions to be presented in a comparable format while allowing companies to retain the option to support, sponsor and invest in communities, activities and funds as they wish. It is also important to note that this spreadsheet does not take into account any philanthropic activity by the companies or their directors and employees. We are aware that additional support is given to charities, donations are made and acquisitions (such as the Alcoa Art Collection) distributed as community gifts and bequests.