Embed Size (px)
Citation preview

Extrapolating psycholinguistic variables 1
Running head: Extrapolating psycholinguistic variables
How useful are corpus-based methods for extrapolating psycholinguistic variables?
Paweł Mandera1*, Emmanuel Keuleers1, and Marc Brysbaert1
Department of Experimental Psychology, Ghent University, Belgium
Keywords: human ratings, semantic models, machine learning
*Corresponding Author
Paweł Mandera
Ghent University, Department of Experimental Psychology
Henri Dunantlaan 2, room 150.025
9000 Ghent, Belgium
E-mail: [email protected]
Tel: +32 9 264 94 30

Extrapolating psycholinguistic variables 2
Abstract
Subjective ratings for age of acquisition, concreteness, affective valence, and many other
variables are an important element of psycholinguistic research. However, even for well-studied
languages, ratings usually cover just a small part of the vocabulary. A possible solution involves
using corpora to build a semantic similarity space and to apply machine learning techniques to
extrapolate existing ratings to previously unrated words. We conduct a systematic comparison of
two extrapolation techniques: k-nearest neighbours, and random forest, in combination with
semantic spaces built using Latent Semantic Analysis, topic model, a HAL-like model and a
skip-gram model. A variant of the k-nearest neighbours method used with skip-gram word
vectors gives the most accurate predictions but the random forest method has an advantage of
being able to easily incorporate additional predictors. We evaluate the usefulness of the methods
by exploring how much of the human performance in a Lexical Decision Task (LDT) can be
explained by extrapolated ratings for age-of-acquisition and how precisely we can assign words
to discrete categories based on extrapolated ratings. We find that at least some of the
extrapolation methods may introduce artefacts to the data and produce results that could lead to
different conclusions that would be reached based on the human ratings. From a practical point
of view the usefulness of ratings extrapolated with the described methods may be limited.

Extrapolating psycholinguistic variables 3
Human ratings for variables such as age of acquisition (AoA), imageability, concreteness
or affective ratings are an indispensable element of psycholinguistic research. They are also
notoriously difficult to collect. Even though it is now possible to obtain measurements for tens of
thousands of words more efficiently by using crowdsourcing platforms (Brysbaert, Warriner &
Kuperman, 2013; Kuperman, Stadthagen-Gonzalez, & Brysbaert, 2012; Warriner, Kuperman &
Brysbaert, 2013), collecting human ratings for all words in all languages for all variables is a
daunting task.
Potentially, this problem could be alleviated by supplementing traditionally collected
ratings with extrapolated ratings. However, to make this possible, we need to identify methods
for extrapolating rating data and find sources of information on which the predictions could be
based. Some psycholinguistic variables have evident predictors. For instance, the strong
correlation of word frequency with AoA (for a review see Brysbaert & Ghyselinck, 2006) makes
word frequency one clear candidate predictor for this variable. However, frequency does not
predict AoA completely and as for other variables such as imageability, concreteness or affective
ratings it appears that predictors should also include semantic word properties. For instance, it
would be much easier to predict the valence rating for the word 'birthday' if we knew ratings for
the words 'cake' and 'party', assuming that the three words are semantically closely related. Even
in the case of AoA, an inspection of available ratings suggests that semantics may bring
substantial information to the prediction of this variable because, at least to some extent, words
related to similar topics are more likely to be acquired around the same age. For example, words
related to family or food are often acquired early while words related to violent crime and
disease are acquired later.
Extrapolating psycholinguistic variables 4
The idea of using semantic information to extrapolate ratings is not new. Sources of such
information, e.g. WordNets, databases in which lexemes are grouped into sets of synonyms and
linked based on semantic and lexical relations, or co-occurence models derived from text corpora
have already been used to accomplish this task. For instance, Bestgen (2002) and Bestgen &
Vincze (2012) proposed an extrapolation method based on semantic similarity of a target word to
a number of rated words in a Latent Semantic Space (LSA; Landauer & Dumais, 1997), taking
their averaged rating as an extrapolated rating of the target word. The authors based their
analyses on the ANEW norms (Bradley & Lang, 1999) for valence, arousal and dominance as
well as on concreteness and imagery ratings collected by Gilhooly and Logie (1980). Their
method turned out to produce high correlations for this set of norms. Along the same lines, Feng,
Cai, Crossley and McNamara (2011) proposed that semantic information obtained from WordNet
(Miller, Beckwith, Fellbaum, Gross, & Miller, 1990) and from Latent Semantic Analysis (LSA)
can be used together with data about other lexical properties as to train a regression model and
to predict human ratings of concreteness for 3521 nouns from the MRC database (Coltheart,
1981). In a similar fashion, word co-ocurrence information derived from a text corpus with
HiDEx (Shaoul & Westbury, 2006; Shaoul & Westbury, 2010) was used to estimate imageability
(Westbury, Shaoul, Hollis, Smithson, Briesemeister, Hofmann, & Jacobs, 2013) and subjective
familiarity (Westbury, 2013) ratings. In addition, Recchia and Louwerse (2014) used Google
Ngrams to train a HAL-like model and used them to predict affective ratings. They obtained
even higher correlations between the original ratings and the reconstructed ratings when a linear
model was used to combine the extrapolated ratings based on the semantic space with those
based on other psycholinguistic variables.

Extrapolating psycholinguistic variables 5
Current study
Although the results of previous studies show that word similarities derived from textual
materials are an important source of information for extrapolating psycholinguistic ratings,
details of the extrapolation procedures in these studies were too heterogeneous to allow for direct
comparison of their efficiency; they used different sets of predictors, information derived from
different corpora, different kinds of models and different validation procedures. In addition
ratings are also often used by researchers to split variables into groups rather than used as fully
continuous variables. Therefore measuring the correlation with original ratings may be
insufficient to fully evaluate the usefulness of the proposed methods for practical research
purposes. Moreover, because correlations consider only standardized variables, they do not tell
us anything about whether the extrapolation procedure preserves the scale that was used for
measuring the original ratings and how close the extrapolated ratings are to the original ratings if
the original scale were used. Finally, we have to ensure that the extrapolated variables are not
contaminated by artefacts that may arise when the extrapolation methods are applied.
In the current paper we systematically evaluate and compare different extrapolation
methods. We use very large datasets of subjective ratings for English words, which allow us to
evaluate how well extrapolation techniques work for tens of thousands of words. We investigate
the quality of the predictions made by two different methods (k-nearest neighbours and a random
forest) on the basis of four different models from which word similarities can be extracted: LSA,
a method based on the hyperspace analogue to language (HAL; Lund & Burgess, 1996), a topic
model (Blei, 2003), and a recent skip-gram approach (Mikolov, Chen, Corrado, & Dean, 2013).
Extrapolating psycholinguistic variables 6
In addition to considering the correlations between the original and extrapolated ratings,
we evaluate how useful the extrapolated ratings are for explaining human performance in a
behavioural task. In order to evaluate whether the extrapolated variables can be used as a
replacement of the original variables we need to ensure that they have the same properties as the
original ratings. We also evaluate the performance ofratings extrapolated with different methods
compared to the original ratings when dichotomization and binning procedures are applied.
Unlike word association norms or WordNets, all predictors used in our analyses can be
automatically derived from a text corpus. Such a choice of predictors is optimal if the primary
goal of the applied methods is to make it possible to obtain predictions of ratings for different
variables for words in many languages in which resources such as association norms or
WordNets may not exist yet. Our primary analyses are also based on extrapolations with
relatively small training sets to better simulate a situation in which only a limited set of rated
words is available in a given language.
Representing Similarity Between Words
LSA, topic models, HAL and the skip-gram model are methods that make use of patterns
of word co-occurrence in textual materials to reconstruct some of the semantic structure of a
language. They are typically trained on large text corpora and, although the details of the training
procedures are fundamentally different, their results can be interpreted as vector representations
of words in a continuous multidimensional space.
LSA (Landauer & Dumais, 1997) starts with a matrix with n rows representing words and
k columns representing documents. A number in each cell of the matrix represents the count of
occurrences of a particular word in a particular document. In the next step, Singular Value

Extrapolating psycholinguistic variables 7
Decomposition (SVD), a matrix decomposition technique from linear algebra, is applied to the
matrix, reducing its dimensionality to a much smaller number m. If we think of each word as a
point in a multidimensional space, the goal of applying this technique is to reduce the
representation of a word from a point in a k-dimensional space to a point in an m-dimensional
space while preserving most of the similarity structure between words. In other words, by
applying this mathematical method one obtains a more compact representation than the full word
by document matrix. A limitation of this method is that after the transformation the obtained
dimensions do not correspond to interpretable topics.
Topic models are a set of probabilistic methods to discover thematic structure in a
collection of documents. Latent Dirichlet Allocation (LDA; Blei, 2003) is perhaps the most
popular method based on this approach. For LDA each document in a text corpus is a mixture of
topics which, in turn, represent probability distributions over words. LDA assumes that a text
corpus is a product of a generative process, according to which each word in a document is
generated by sampling a topic from a probability distribution over topics and then by sampling a
word from the probability distribution of the words in the selected topic. In order to reverse this
process and infer a probability distributions from a text corpus one can apply methods such as
Gibbs sampling (Geman & Geman, 1984) or variational inference (Jordan, Ghahramani,
Jaakkola, & Saul, 1999). Describing the details of these methods is beyond the scope of this
paper. What is important for our goals is that, based on LDA, one can obtain probability
distributions of topics for each document, and a probability distribution of words for each of the
topics. In each topic a group of semantically related words obtains high probabilities. For
instance, the method may discover a topic in which words such as birthday, happy, cake, party,

Extrapolating psycholinguistic variables 8
day, gift, surprise, and love have high probabilities but semantically unrelated words have low
probabilities. A second topic may include gun, shoot, kill, bullet, shot, fire, weapon with high
probabilities and so on. Although the default interpretation of LDA is expressed in probabilistic
terms, it can also have a geometric interpretation (Steyvers & Griffiths, 2007), which is similar to
that described in the case of LSA. The important difference between LSA and topic models is
that the probability distributions produced by the latter method can be interpreted as
corresponding to meaningful thematic groups. Because one of the results produced by the topic
model is an assignment of all words in a text corpus to individual topics, in the current study we
used vectors with the number of such assignments, normalized with word frequency, as a topic
model representation of words.
Yet another approach to reconstructing semantic space from word co-occurrence is taken
by the HAL model (Lund & Burgess, 1996). In this approach the co-occurrences are collected by
moving a window through the corpus. The window includes a certain number of words and the
number of times each pair of words co-occurs in a window is counted. By default no
dimensionality reduction technique is applied to the co-occurrence matrix, so resulting word
vectors store many more values than in the case of LSA or topic models. This can be a problem if
the resulting matrix is used as a basis for further processing. In this paper we use a HAL-like
model in which co-occurrence counts are weighted with a positive pointwise mutual information
(ppmi; e.g. Recchia & Jones, 2009) scheme. In this approach the raw co-occurrence counts are
substituted by a measure rooted in information theory, which can be computed according to the
following formula:

Extrapolating psycholinguistic variables 9
Where p(x,y) can be calculated as the ratio between number of co-occurrences of two
words divided by the total number of words in the corpus, while p(x) and p(y) are thefrequencies
of each of the two words divided by the total number of words in the corpus. In the next step all
negative values are removed from the matrix (Manning & Schütze, 1999).
It is important to note the difference between the bag-of-words approach used in LSA and
topic models, and the approach taken by HAL: The former methods consider global, document
level co-occurrence patterns whereas HAL is based on local word co-occurrences within a
relatively narrow window.
The fourth approach to modelling semantics that we will consider was recently developed
by Mikolov et al. (2013), who proposed that word vectors can be efficiently computed by using
skip-grams combined with a simple two-layer neural network. In this approach, a network is
trained by presenting words from a corpus and trying to predict each of the words in a small
window surrounding that word. The network uses a stochastic gradient descent computed using a
back-propagation rule (Rumelhart, Hinton & Williams, 1986) to learn from errors that it makes
in its predictions and by adjusting weights in the network accordingly. When the training is
finished, the weights of the connections in such a network are extracted and used as vector
representations of words. Because similar words tend to occur in similar contexts, they tend to
have similar vectors. Baroni, Dinu and Kruszewski (2014) evaluated different types of models in
a comprehensive set of tasks and found that models using methods which are based on predicting
the context, as it is the case for the skip-gram model, rather than on counting word co-

Extrapolating psycholinguistic variables 10
occurrences tend to produce word vectors that better capture word similarities. Moreover,
prediction-based approaches turned out to be more robust to different parameter choices.
Similarly to HAL, the skip-gram method is based on word co-occurrences in a narrow
window rather than bag-of-words as it is the case for LSA and topic models. An interesting
contrast between bag of words models and models based on narrow windows is that the former
are usually considered to be better at modelling thematic information and to outperform window
based methods in tasks such as predicting human associations while window based methods
seem to be better at modelling taxonomical relations, synonymy or grammatical relationships
(Sahlgren, 2006).
Since all four discussed semantic space models represent words as multidimensional
vectors we can use them to extrapolate ratings in a very similar way.
Extrapolation Methods
In this section, we describe the different extrapolation methods used in the current study.
Specific parameter settings are reported in the methods section.
K-nearest neighbours. Bestgen and Vincze (2012) proposed that, DIC-LSA, a variant of
the k-nearest neighbours method (Fix & Hodges, 1951) can be used to extrapolate human ratings.
According to this approach, for each word in the test set we identify the set of the most similar
words (as measured with cosine distance) in the training set and assign the mean rating of these
words to the target word as the extrapolated rating. The number of words which are considered in
the averaging is a parameter of the model. For instance, according to the skip-gram model
trained on our corpus, the five most similar words to gun are pistol, rifle, weapon, revolver and
shoot with corresponding arousal scores of 5.79, 6.14, 6.27, 6.29 and 6.00 in a set of norms
Extrapolating psycholinguistic variables 11
published by Warriner, Kuperman & Brysbaert (2013). Assuming that the number of considered
neighbours would be set to 5 and that all these words would be found in the training set, the
model would predict that the arousal value for gun should be equal to the mean of the arousal
values for these words (6.09).
Bestgen and Vincze (2012) investigated the optimal neighbourhood size that should be
considered when predicting ratings and found that the accuracy of the method increased with
neighbourhood size up to a value of 30.
Random forest. Random forest (Breiman, 2001) is a general purpose machine learning
technique based on an ensemble of randomized decision trees. It builds a set of decision trees
where each tree is based on a slightly different sample of the full dataset, reducing the risk of
over-fitting the model. Each decision tree is created by recursively splitting the dataset into
smaller and smaller subsets in a way that maximizes information about the predicted variable.
For instance, the method could potentially decide that a split at a certain value of a particular
predictor (for instance, a topic with high probability of words such as birthday, happy, cake,
party, day, gift, surprise, love ) allows to divide the full dataset into two subset with more
homogeneous valence in each of the two subsets than in the case of other splits. It would then try
to further break each of the two subsets into smaller and smaller subsets, finally creating a
decision tree, where at each step the decision about which branch to follow is made based on the
value of a particular predictor. Then, in order to make a global prediction, the predictions of the
individual trees contained in the model are averaged (in the case of a regression problem) or
votes for different classifications are counted (in the case of a classification problem). The
method has been shown to give accurate predictions in many different applications. Since the

Extrapolating psycholinguistic variables 12
default parameter settings for random forests work well in a wide range of applications, the
method can be considered as effectively non-parametric. The method is also resistant to over-
fitting, even if a very large number of predictors is included in the model, making it well-suited
for our purpose. It allows to use the values assigned to each word on all the individual
dimensions of a word vector as separate predictors. Moreover, this set of predictors can be
extended to include additional variables (both continuous and categorical). The drawback of the
random forest method is that it makes it difficult to examine the exact relationship between the
predictors and a predicted value1.
Method
Materials
Ratings. To train and test the extrapolation methods we used large sets of norms for
multiple variables: AoA ratings for 30,121 words (Kuperman, Stadthagen-Gonzalez, &
Brysbaert, 2012), concreteness ratings for 37,058 words (Brysbaert, Warriner & Kuperman,
2013) and affective ratings (arousal, dominance, valence) for 13,915 words (Warriner et al.,
2013).
The reliability of the ratings can be considered the upper-bound for the performance of
the extrapolation procedures. The split-half reliabilities, as reported in the respective publication ,
were equal to 0.915 for AoA (Kuperman et al., 2012), 0.914 for valence, 0.689 for arousal and
0.770 for dominance (Warriner et al., 2013). Concreteness ratings correlated 0.92 with the ratings
in the MRC database suggest a high reliability for the dataset as well (Brysbaert et al., 2013).
1 For random forest the function which describes the relationship does not have to be linear or even continuous.

Extrapolating psycholinguistic variables 13
Text corpus. Because subtitle corpora were shown to be particularly adequate for
conducting psycholinguistic research (e.g. Brysbaert & New, 2009; Keuleers, Brysbaert, & New,
2010) and because subtitle corpora can be easily collected for many languages for which we may
want to extrapolate ratings, the semantic spaces and word frequencies that were used in the
current study were based on an English subtitle corpus including about 385 million words. To
compile the corpus we downloaded 204,408 documents containing film and television subtitles
flagged as English by the contributors of http://opensubtitles.org and removed all subtitle-
specific text formatting before further processing. In order to remove documents containing large
fragments of text in languages other than English we calculated preliminary word frequencies
and excluded all documents in case of which 30 most frequent words did not cover at least 10%
of the total number of tokens in that document. Because many documents are available in
multiple versions, it was necessary to remove duplicates from the corpus. To do so, we used a
custom method based on clustering documents with similar thematic structure derived from a
topic model trained on all the files if any pair of files within a cluster had an overlap of at least
10 % unique word trigrams, we removed one of the files from the corpus. The resulting dataset
contained 69,382 documents.2
Based on that corpus we calculated word frequencies for all word forms. We also
lemmatized the corpus with the Stanford tagger (Toutanova & Manning, 2000; Toutanova, Klein,
Manning, & Singer 2003). Because the resulting set of part of speech tags was too complex for
our purposes we used a simplified set of tags (see Supplementary Materials).
2 We later compared the result of this procedure with a standard MinHash approach to removing near-duplicates
(Broder, 1997). The resulting sets of files overlapped in 98.5%.

Extrapolating psycholinguistic variables 14
General Approach
To systematically study the performance of the different prediction methods using word
vectors obtained from models implementing different approaches to distributional semantics, we
ran ten iterations of the following cross-validation procedure for each of the variables:
1. We split the whole set of rated words into a test set and a training set. The results
reported first are based on a split of the full datasets into training and test sets with 25%
of the data in the training set and 75% of the data in the test set. Later in the paper, we
will also examine the influence of the size of the training set on the prediction accuracy.
2. Using the data from each of the word vector models, we trained a k-nearest
neighbours and a random forest model using data in the training set and then extrapolated
the ratings for the words in the test set. The only exception was the HAL-like model for
which, because the large number of dimensions made the problem too computationally
demanding for the random forest, we were able to train only the k-nearest neighbours
model. As a baseline, we also trained three linear models with the following sets of
predictors: (1) log10 of word frequency as the only predictor, (2) log10 of word
frequency, word length (number of letters) and a measure of orthographic neighbourhood
density (OLD20; Balota et al., 2007) and (3) a model including the same predictors as in
the second model plus a measure of semantic neighbourhood density (Inverse N Count;
Shaoul & Westbury, 2006, Shaoul & Westbury, 2010). The baseline linear models did not
include information obtained from the semantic spaces.
3. We evaluated the performance of the method by correlating the predicted ratings
with the original ratings in the test set.

Extrapolating psycholinguistic variables 15
We decided to use this approach as it clearly indicates the predictive accuracy of the
models and allows us to draw conclusions that avoid the risk of being based on over-fitting. The
results of the ten iterations can be compared to baseline models, based on identical sets of words
in the training and test sets.
Semantic spaces
Because the norms that were used to train and validate the extrapolation procedure were
mostly ratings of lemmas, we also used a lemmatized text corpus (with base forms in place of
inflected forms) to train the semantic models.
Following a common practice, in the case of bag of words models (LSA and a topic
model) we removed very frequent and very rare words from the corpus before training. The
lemmas in the high-frequency stop-list included about 500 common English words. As in the
procedure applied by Bestgen & Vincze (2012), words occurring in the corpus less than 10 times
were removed as well.
When creating the LSA model, prior to submitting the document-term matrix to SVD, we
applied a term-frequency times inverse document-frequency transformation, which is a common
weighting scheme used in information retrieval (e.g. Manning, Raghavan, & Schütze, 2008).
To preserve the same dimensionality for all the methods involving some form of
dimensionality reduction, we used 600 eigenvectors corresponding to the highest singular values
in the LSA model, 600 topics in the LDA topic model and a 600 dimensional skip-gram model.

Extrapolating psycholinguistic variables 16
The LDA topic model was trained in 1000 iterations with parameter alpha set to 50.0 and
parameter beta to 0.01. The vectors corresponding to the words were normalized by dividing
each value by the total frequency of the word.
A custom implementation was used to calculate HAL-like word vectors. We used a
symmetric, flat window including 5 words wide on each side; then we applied a positive
pointwise mutual information transformation to the resulting co-occurrence matrix; finally all
words with frequency lower than 5 were removed from the corpus before training.
We trained a skip-gram model using a set of fairly standard settings: a window of 5 words
and a starting learning rate of 0.025. The downsampling parameter was set to 1e-3 and
hierarchical softmax was used when training the model. As in the case of the HAL model all
words with a frequency lower than 5 were discarded when training the model.
Only words which were simultaneously included in all three word vector models,in the
rating sets and in the norms for orthographic (Balota et al., 2007) and semantic density measures
(Shaoul & Westbury, 2010) were used during the extrapolation procedure. This resulted in
datasets containing 20,265 words for AoA, 20,994 for concreteness and 12,531 words for
affective ratings.
Extrapolation methods
To predict ratings using the k-nearest neighbours model, for each word in the test set we
identified the30 most similar (measured with cosine distance) words in the training set. This
parameter (k=30) was set to a value found by Bestgen and Vincze (2013) to be optimal in their
extrapolations. The mean rating of these words was assigned to the target word as an
extrapolated rating.
Extrapolating psycholinguistic variables 17
The random forest model was trained with 100 estimators. Taking advantage of the
flexibility of this method with respect to number of predictors used, we also trained random
forest models with additional predictors: log10 of word frequency and dominant part of speech.
In the case of semantic vectors, the score obtained on each of the dimensions was used as a
separate predictor.
Results
General Results
To measure the prediction accuracy of the different models, we first examined the
correlations between the reconstructed and the original ratings (see Table 1), averaged across the
ten iterations.

Extrapolating psycholinguistic variables 18
Table 1.
Correlations between the original ratings and the ratings extrapolated with different models
trained on 25% of the full dataset (average of ten iterations).
MethodWord
vectors
Additional
predictors
Variable
AoA Conc Arousal Domin Valence
LM wf .621 .165 .054 .157 .174
wf, len, old20 .635 .370 .143 .164 .178
wf, len, old20, inc .641 .371 .183 .195 .210
KNN
lsa .540 .525 .299 .342 .412
tm .545 .647 .358 .370 .443
hal .737 .758 .440 .568 .661
sg .715 .796 .478 .595 .694
Random
forest
lsa .711 .609 .317 .395 .448
tm .695 .672 .374 .421 .500
sg .688 .723 .406 .543 .615
lsa
wf
.730 .611 .315 .395 .454
tm .733 .681 .376 .422 .507
sg .730 .724 .407 .544 .618
lsa
wf + pos
.731 .711 .318 .397 .453
tm .734 .746 .379 .422 .507
sg .730 .781 .406 .543 .616

Extrapolating psycholinguistic variables 19
Note: LM = linear model, KNN = k-nearest neighbours, wf = log10 of word frequency, lsa =
Latent Semantic Analysis, tm = topic model, sg = skip-gram. Due to the large number of
observations differences in correlations as small as .015 are statistically significant.
The baseline models with different combinations of predictors that did not include word
vectors managed to predict the ratings to a limited extent compared to the models using semantic
spaces. The ratings predicted by the model including only word frequencies correlated 0.621
with original AoA ratings but predictions of the simplest baseline model were much less
successful for other variables, and did not reach the level of 0.2 correlation for any other
variable. Including information about orthographic properties of a word (length and
neighbourhood density) more than doubled the correlation between the extrapolated and the
original ratings for concreteness but affected accuracy of the extrapolation for the other variables
to a much lesser extent. Adding a measure of semantic neighbourhood density increased the
correlations most strongly for the affective ratings, but the accuracy of the extrapolation for these
variables remained very low.
For all variables we obtained higher correlations with the original ratings when the
extrapolation methods took into account semantic information from the word vectors.
For all variables, the correlations obtained with the k-nearest neighbours outperformed
those based on the random forest models. When the k-nearest neighbours method was used, HAL
and skip-gram gave higher correlations than LSA and topic models. The highest correlation

Extrapolating psycholinguistic variables 20
obtained was 0.737 for AoA (k-nearest neighbours with HAL word vectors), 0.796 for
concreteness, 0.478 for arousal, 0.599 for dominance and 0.695 for valence (k-nearest
neighbours with the skip-gram word vectors).
In the case of AoA and concreteness, the ratings extrapolated with random forest were
close to those extrapolated with the k-nearest neighbours when word frequency and POS
information were included as additional predictors. Extrapolation of AoA with random forest
improved most when word frequency was added to the model based on word vectors only. For
concreteness including POS information increased the correlations most. For all affective ratings
including word frequency or POS among the random forest predictors had little effect on the
accuracy of the predictions.
Usefulness Of Extrapolated AoA Ratings
Variance explained in lexical decision task reaction times
Because the lexical decision task (LDT) is one of the most popular tasks in
psycholinguistics, we looked at how much of the variance in RTs collected in the British Lexicon
Project (BLP; Keuleers, Lacey, Rastle, & Brysbaert, 2011) and in the English Lexicon Project
(ELP; Balota et al. 2007) is accounted for by reconstructed ratings in comparison to the variance
explained by the original human ratings for these variables.
In our analysis we jointly entered extrapolated ratings from the test sets of all
extrapolation iterations for words that were also included in the BLP and ELP . The resulting
dataset included 10,471 unique words AoA (about 7.5 extrapolations per word), 10,828 unique
words for concreteness (about 7.26 extrapolations per word) and 7,507 unique words for the

Extrapolating psycholinguistic variables 21
affective variables (about 7.5 extrapolations per word). First, we created a baseline to which
models including extrapolated ratings should be compared by fitting a model containing only
log10 of word frequency as a predictor to the reaction times. Second, we created a model
containing both log10 of word frequency and the original ratings as predictors.
Next, we fitted regression models including log10 of word frequency and the ratings
predicted with different methods. The results of these analyses are shown in Table 2.

Extrapolating psycholinguistic variables 22
Table 2.
Percentage of variance explained by linear models with different sets of predictors.
MethodWord
vectors
Additional
predictors
Additional variance explained [%]
AoA Conc Arousal Dominance Valence
BLP ELP BLP ELP BLP ELP BLP ELP BLP ELP
(baseline model) 47.97 43.05 48.12 42.01 45.40 37.97 45.18 37.72 45.15 38.18
(baseline + original ratings) 3.21 3.37 0.38 0.35 0.00 0.11 0.34 0.43 0.28 0.32
LM
wf 0.00 0.00 0.00 0.00 0.00 0.00 0.00 0.00 0.00 0.00
wf, len, old20 0.11 0.93 0.03 0.04 0.28 1.45 0.38 0.42 0.28 1.13
wf, len, old20,
inc0.01 0.17 0.07 0.01 0.89 2.18 1.02 1.39 0.37 0.33
KNN
lsa 0.01 0.01 0.10 0.14 0.14 0.15 0.22 0.20 0.33 0.29
tm 0.28 0.32 0.14 0.28 0.24 0.41 0.43 0.46 0.55 0.63
hal 1.20 1.02 0.14 0.15 0.48 0.63 0.73 0.59 0.67 0.48
sg 0.40 0.26 0.25 0.31 0.31 0.52 0.28 0.27 0.32 0.32
Random
forest
lsa 1.05 0.96 0.00 0.07 0.06 0.10 0.70 0.48 0.65 0.42
tm 1.38 1.49 0.01 0.07 0.10 0.23 0.65 0.68 0.48 0.48
sg 0.39 0.26 0.07 0.12 0.16 0.31 0.14 0.13 0.19 0.21
lsa wf 0.74 0.67 0.00 0.07 0.04 0.10 0.68 0.45 0.59 0.43
tm 1.13 1.20 0.01 0.07 0.08 0.20 0.60 0.68 0.36 0.36

Extrapolating psycholinguistic variables 23
sg 0.81 0.59 0.07 0.13 0.14 0.31 0.14 0.15 0.19 0.22
lsa
wf, pos
0.74 0.66 0.01 0.04 0.05 0.10 0.68 0.42 0.60 0.43
tm 1.16 1.19 0.00 0.04 0.08 0.20 0.61 0.67 0.35 0.35
sg 0.82 0.58 0.04 0.13 0.16 0.31 0.11 0.13 0.17 0.21
Note. The first row shows how much of the variance in reaction times taken from British Lexicon Project (BLP) and English Lexicon
Project (ELP) is explained by a linear model with word frequency as the only predictor. The following rows show additional variance
explained when original and extrapolated ratings for AoA, conreteness (Conc) and affective ratings were added to the model. Column
1 specifies the extrapolation method, column 2 shows the type of word vectors used with the method (tm = topic model, sg = skip-
gram), column 3 lists the additional predictors used when extrapolating the variable (wf = log10 of word frequency, len = number of
letters, inc = Inverse N Count, pos = Part of Speech).

Extrapolating psycholinguistic variables 24
In general, we observed a consistent pattern for the different methods across ELP and
BLP. However, the pattern of variance explained by the extrapolated ratings did not strictly
follow the pattern of absolute correlations between the extrapolated and the original ratings. As
could be expected, log10 of word frequency explained a large fraction (over 42%) of the total
variance in RTs. When the original AoA ratings were included in the model the percentage of
variance accounted for increased by 3.21% for BLP and 3.37% for ELP. When we added the
original concreteness ratings to the model, the percentage of explained variance increased by
0.38% for BLP and 0.35% for ELP. The effects of adding the affective variables were small and
did not exceed 0.5% in any case.
In the case of concreteness, the extrapolated ratings which had the highest correlation
with original ratings were the ones that also explained most of the variance in RTs (0.25% above
the baseline model for BLP and 0.31% for ELP). For AoA a different pattern emerged. For this
variable the ratings extrapolated with a random forest combined with topic models without
including any additional predictors gave the largest improvement compared to the baseline
model (1.38% for BLP and 1.49% for ELP). Interestingly, this was not the extrapolation method
that correlated most strongly with the original ratings and, although the ratings extrapolated with
the k-nearest neighbours combined with HAL -like word vectors also predicted a large fraction of
the variance (1.20% for BLP and 1.02% for ELP), in general the pattern of explained variance in
RTs did not strictly follow the pattern observed in absolute correlations with the original ratings.
For example, although ratings extrapolated with skip-gram word vectors and k-nearest
neighbours correlated more strongly with the original ratings than those based on random forest

Extrapolating psycholinguistic variables 25
and topic models, the former explained 3.5 times less variance in RTs for BLP and 5.7 times less
for ELP than the latter.
Surprisingly, for the affective ratings we found that many of the extrapolated variables
explained more additional variance in the RTs than the original ratings when added to the linear
model including word frequencies. Moreover, predicted ratings that had some of the weakest
correlations with the original ratings seemed to explain the largest fraction of the variance in the
RTs. For arousal, the linear model including information about word frequency, length,
orthographic and semantic neighbourhood density ratings that correlated only 0.183 with the
original ratings but, when these ratings were used to predict RTs, they improved explained
variance by 0.89% for BLP and 2.18% for ELP, while the original arousal ratings made hardly
any difference in the explained variance. For dominance, the same model gave predictions that
correlated 0.195 with the original ratings but improved the explained variance by 1.02% for BLP
and 1.39% for ELP, while the original ratings explained only 0.34% additional variance for BLP
and 0.43% for ELP. In the case of valence, variance in RTs taken from BLP was best accounted
for by the ratings extrapolated with the k-nearest neighbours and word vectors obtained with
HAL-like method (0.67 extra explained variance) and variance in RTs taken from ELP was best
explained by the ratings extrapolated with the linear model including only word frequency, word
length and OLD20 as predictors (1.13 of additional explained variance). At the same time, the
original ratings for valence explained only 0.28 extra variance for BLP and 0.32 for ELP.
Improvements of the explained variance above the level explained by the original affective
ratings were strongest in the case of the simple linear models but the k-nearest neighbours and

Extrapolating psycholinguistic variables 26
random forest methods also produced ratings which explained more variance in lexical decision
RTs than the original ratings.
In order to explain the surprising effects regarding explained variance in lexical decision
RTs we conducted an additional analysis in which we investigated whether the extrapolation
procedures could introduce artefacts to the data that could easily be identified with effects of
some of the well-known psycholinguistic variables. In order to do that we looked at the
correlation structure of the original and reconstructed ratings with variables known to influence
performance in psycholinguistic tasks: length, OLD20, word frequency, semantic neighbourhood
density (Inverse N Count) and ratings for all the variables that we were extrapolating in the
current study. We reasoned that, in order to represent the same theoretical construct, the
extrapolated ratings should not only correlate with the original variables as strongly as possible
but also have similar correlations with other variables as the original ratings. When looking at
effects as small as the effects of affective variables on lexical decision RTs, even small artefacts
could distort the conclusion that would be reached based on a particular analysis. We indeed
observed that the extrapolated ratings had a different correlation structure than the original
ratings.
As could be expected based on the patterns of explained variance in lexical decision RTs,
the most striking discrepancies in correlation structure were observed for the affective variables.
For arousal, the extrapolated ratings that explained the largest fraction of the variance in RTs
(linear model with log10 of word frequency, length and orthographic and semantic
neighbourhood density measures) correlated 0.5 with OLD20 and 0.51 with word length. These
correlations were much higher than the correlation of 0.1 for both OLD20 and length in the case

Extrapolating psycholinguistic variables 27
of original ratings. We observed a similar pattern when we looked at the dominance ratings
extrapolated with this method. In this case although the differences in correlations were smaller:
-0.18 for length (-0.04 for the original ratings) and -0.34 for OLD20 (-0.07 for the original
ratings), the difference for correlations with word frequencies (0.78 for the extrapolated ratings
and 0.16 for the original ratings) and Inverse N Count (-0.91 for the extrapolated ratings and
-0.18 for the original ratings) were very high. In the case of valence, the ratings extrapolated with
a model that explained the largest fraction of the variance in RTs from ELP (linear model with
log10 of word frequency, length and OLD20 as predictors) had much higher correlations than the
original ratings with log10 of word frequencies (0.97, 0.17 in the original ratings), Inverse N
Count (-0.58, -0.20 in the original ratings) and AoA ratings (-0.50, -0.22 in the original ratings).
Although such discrepancies were strongest for ratings extrapolated with the linear models, we
observed similar tendencies in the ratings extrapolated using semantic vectors. For instance, for
the valence ratings extrapolated using k-nearest neighbours and HAL-like word vectors, the
correlation with length was -0.15 (-0.02 for the original ratings), with OLD20 -0.16 (-0.03 for the
original ratings), with word frequency 0.35 (0.17 for the original ratings), with Inverse N Count
-0.32 (-0.20 for the original ratings) and with AoA -0.33 (-0.22 for the original ratings).
Although these results suggest that some artefacts are present in the extrapolated ratings
it is possible that there are further confounds that can not be easily identified with one of the
variables that we considered in our analysis of the correlation structure. Because of that, we
decided to conduct one more analysis: we decorrelated the extrapolated ratings with the original
ratings by fitting linear models in which we predicted the extrapolated ratings based on the
original ratings and considered residuals of such a model as a representation of what the ratings

Extrapolating psycholinguistic variables 28
capture in addition to the variance that they share with the original ratings. Next, we checked
whether the residuals of the extrapolated ratings can still predict a meaningful amount of
variance in behavioural data when they are added to a linear model in which we entered BLP RTs
as a dependent variable and word frequency as an independent variable. If that would be the
case, it would indicate that variance that is present in the extrapolated ratings but that cannot be
identified with the original ratings can be predictive of behavioural variables. In such a case, if
the extrapolated ratings would be used in a hypothetical analysis, we could reach conclusions
other that we would reach based on the original ratings because of such a confound.
For all variables we found that the residuals of the extrapolated ratings still explain a
meaningful amount of variance above what can be explained by word frequencies alone. This
was the case not only for the ratings extrapolated using the linear models but also for some of the
ratings which were extrapolated using semantic spaces. For instance, the residuals of the ratings
extrapolated with the k-nearest neighbours method and HAL-like word vectors explained 0.21%
additional variance in RTs in the case of AoA, 0.56% for arousal, 0.32% for dominance, and
0.30% for valence and the ratings extrapolated with random forest and topic model word vectors
explained 0.16% extra variance in the case of concreteness, 0.10% in the case of arousal, 0.36%
in the case of dominance and 0.24% in the case of valence.
Categorization of the extrapolated variables
In psycholinguistic research variables that can be measured on a continuous scale are
often dichotomized or binned. Therefore we compared how binning based on extrapolated AoA
ratings compared to binning using the original ratings. To conduct this analysis we again used the
full set of words extrapolated in all ten iterations. In order to obtain a benchmark for the

Extrapolating psycholinguistic variables 29
performance of the extrapolation procedures we used two random splits of the data collected by
Kuperman et al. (2013).3
Applying a dichotomization or binning procedure to the ratings is equivalent to
reformulating the evaluation from a regression problem where the variables are considered on a
continuous scale to a classification problem where the outcomes take discrete values. We decided
to test the quality of the classification based on extrapolated ratings by using two procedures:
1) Dichotomization of the set of words by splitting it at different points across the entire
range of the original ratings. This is equivalent to asking how precise our predictions would be if
we used extrapolated ratings to predict which words were already acquired before a certain age.
In order to answer this question we split the full dataset in bins corresponding to each year of life
(from 1 to 24). All words with an original AoA rating below that age were considered as positive
cases (already acquired words) and the remaining words as negative cases (words which were
not yet acquired). All the words that should have been acquired at that age according to the
extrapolated ratings were considered to be classified as already acquired words and all remaining
words as words which were not yet acquired.
2) Splitting the full dataset into bins corresponding to deciles of AoA, which is equivalent
to asking how precisely we can predict that a given set of words will be the next 10% of words
acquired after a given percentage of words was already acquired. For example, evaluating how
precisely we can predict words in the third decile corresponds to the precision of making a
3 We used a dataset obtained from the authors of the original study (Kuperman et al., 2012). The dataset did not
correspond perfectly to the one on which the published ratings were based and which was used to train the
models but had a very high correlation (r = 0.96) with that dataset. 705 words which were not included in the
dataset were excluded from the analysis.

Extrapolating psycholinguistic variables 30
prediction about a set of words which will be acquired after 20% of all words were already
acquired but before the remaining 70% of words. In order to conduct this analysis we binned the
words based on the deciles in the original set of AoA ratings and, separately, in the extrapolated
ratings. Next, we evaluated the classification performance for each of the bins. All words
acquired in that bin according to the original ratings were considered as positive cases and all
remaining words as negative cases. All words included in a corresponding bin of the extrapolated
ratings were considered to be positive cases and the remaining words were considered to be
negative cases.
The two evaluation procedures can be seen as binary classification problems. The overall
result of the classification can be represented in a 2x2 matrix which includes: true positives
(correctly classified positive cases; TP), true negatives (correctly classified negative cases; TN),
false positives (negative cases incorrectly labelled as positive; FP) and false negatives (positive
cases incorrectly labelled as negative; FN). Based on these classification results we calculated a
set of metrics which are commonly used to measure performance of classification methods:
Accuracy. Represents a fraction of correctly classified positive and negative examples.
Note that this metric is insufficient if there is a difference in the size of TP and TN
classes. For example, if only 5% of the cases in the original dataset would be the positive cases a
method that labels all cases as negative, irrespective of the input, would achieve 95% accuracy.
To correct for this possibility we calculated a set of additional metrics.

Extrapolating psycholinguistic variables 31
Sensitivity and precision. Precision represents the fraction of cases which were
classified as positive and are also positive in the original dataset.
Sensitivity represents the fraction of all positive cases in the original dataset which were
correctly classified as positive.
F1-score. F1-score (Rijsbergen, 1979) is a harmonic mean of precision and sensitivity. It
simultaneously takes into account both how many of the relevant cases were correctly identified
by the method and how many non-relevant cases were mistakenly labelled as positive.
Figure 1 shows the metrics calculated for the first classification procedure in which the
dataset was split in two groups at different points of the range of the original ratings. As can be
seen on the figure, the closer to the boundaries of the range, the higher the accuracy. This likely
reflects the fact that, when all words are taken into account, it is easier to make accurate
predictions close to the boundaries of a scale. As such it can be considered an artefact of different
prior probabilities for different classes. For precision we can observe that ratings extrapolated
with k-nearest neighbours and with the random forest method stay at a rather high level for most
half-splits across the entire range of the AoA ratings. At the same time, sensitivity starts at a very
low level and rapidly increases until the age of 15. This pattern of sensitivity and precision

Extrapolating psycholinguistic variables 32
metrics likely reflects the distortion of the scale which happens when the extrapolation
procedures are applied. For example, when applying the k-nearest neighbours method, on
average words are shifted towards the mean age. As a result the extrapolation method has a
tendency to overestimate AoA for early acquired words. Because of that, the precision is high:
Few words which are not yet acquired according to the original ratings are classified as already
acquired. At the same time the method fails to identify words which are acquired at an early age
according to the original ratings. The F1-score shows the overall performance of the
extrapolation methods with different splits. Because it involves a product of precision and
sensitivity this metric stays at a low level due to low sensitivity despite high precision. This
pattern can be contrasted with the high precision and sensitivity across the entire range for the
two sets of ratings calculated based on half-splits of the full ratings dataset. This result shows
that the usefulness of extrapolated ratings may be limited when accurate identification of early
acquired as opposed to late acquired words is necessary unless the split is made at a relatively
high age.

Extrapolating psycholinguistic variables 33
Figure 1. Performance metrics representing the quality of the classification when splits into two
groups were made at different age of acquisition values. Each row represents a different
performance metric. The leftmost column shows the metrics calculated for the ratings based on
two splits of the human ratings dataset. The remaining columns show the classification
performance metrics for the different extrapolation methods. The different lines in the figure
represent different sets of predictors which were used to make the extrapolation. The
extrapolations in which the random forest method was used with additional predictors were
removed from the plot because they followed very similar patterns as the extrapolations shown.

Extrapolating psycholinguistic variables 34
As shown in Figure 2, splitting the dataset by AoA decile produced a much more regular
pattern across all the metrics. Because binning into different deciles depends on ranks of words
and not on the absolute AoA values assigned to different words, this classification procedure is
not affected by the distorted scale. All metrics show that the quality of binning is better for the
extreme deciles. Most probably, this is caused by the fact that the extreme deciles contain all the
words with potentially unbounded range at one of the sides which increases the accuracy by
allowing methods to assign a word to the correct bin even if the prediction is inaccurate in terms
of an absolute value. All metrics stayed at a rather low value for most of the non-extreme deciles.
This result shows that the extrapolation methods may not be accurate enough to be used for
assigning words to classes spanning a limited range.

Extrapolating psycholinguistic variables 35
Figure 2. Values for different performance metrics representing quality of the classification into
individual bins.
Training Set Size And Prediction Accuracy
In addition to the analyses reported so far, we investigated how prediction accuracy
depends on the size of the training set. We ran ten iterations of the extrapolation procedures, with
splits of 10%, 25%, 50%, 75% and 90% of the data in the training set and, respectively, the
remaining 90%, 75%, 50%, 25% and 10% in the test set.
Extrapolating psycholinguistic variables 36
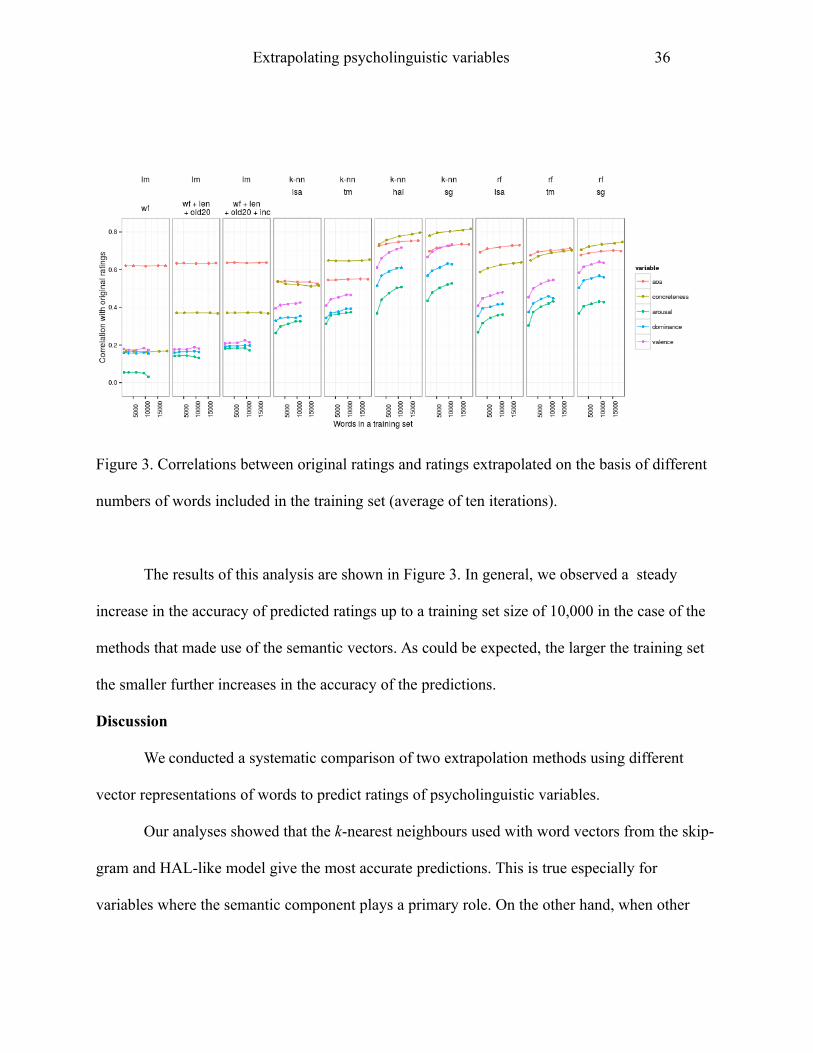
Figure 3. Correlations between original ratings and ratings extrapolated on the basis of different
numbers of words included in the training set (average of ten iterations).
The results of this analysis are shown in Figure 3. In general, we observed a steady
increase in the accuracy of predicted ratings up to a training set size of 10,000 in the case of the
methods that made use of the semantic vectors. As could be expected, the larger the training set
the smaller further increases in the accuracy of the predictions.
Discussion
We conducted a systematic comparison of two extrapolation methods using different
vector representations of words to predict ratings of psycholinguistic variables.
Our analyses showed that the k-nearest neighbours used with word vectors from the skip-
gram and HAL-like model give the most accurate predictions. This is true especially for
variables where the semantic component plays a primary role. On the other hand, when other

Extrapolating psycholinguistic variables 37
predictors can bring important information to the model, the random forest method is the most
convenient to use. Because both k-nearest neighbours and random forests have their own
strengths, it would be interesting to find a way to create a hybrid technique which is able to make
use of the strengths of each of the methods.
At the same time, we have shown that the usefulness of ratings extrapolated with
currently available methods may be limited. In particular, the result of our analysis in which we
predicted lexical decision RTs using the extrapolated ratings gave some surprising results. It also
seems problematic to rely on extrapolated ratings when dichotomizing or binning words.
Although we conducted the analysis, in which we categorized otherwise continuous data only for
AoA, it may be expected that the result would be even worse for other variables such as affective
ratings, since AoA was the variable for which the extrapolation methods produced relatively high
correlations with the original ratings.
Our analyses clearly show that reporting the correlation between the original and the
extrapolated variables is not sufficient to evaluate their usefulness. Even if extrapolated ratings
share a large fraction of the variance with the original ratings there is still a part of the variance
that does not reflect the original ratings, and we cannot assume that that this variance is just
random, unsystematic noise. In contrast to the half-splits of human data, in which case we can
safely assume that in both splits the uncorrelated part of the variance have similar statistical
structure, we cannot make such an assumption in the case of comparing the product of statistical
models (extrapolated ratings) with human ratings.

Extrapolating psycholinguistic variables 38
It is easy to understand how the artefacts can arise in the case of extrapolations based on
linear models. Due to the nature of this method the predictions are always proportional to the
values of the predictors. As a result, the predictors can 'leak' into the extrapolated variables.
For instance, let's consider a hypothetical case where we would train a linear model which would
predict ratings as a combination of word frequency and OLD20 with respective coefficients of
0.5 and 0.4. In this case, if we extrapolated ratings for two words that have equal frequency, the
word with higher OLD20 would always obtain a higher rating. Because the predictions are
usually imperfect, there is always some error in the predictions and, because the variance that
does not reflect the original ratings is not just random noise, but rather is strongly correlated with
OLD20, the error would be also correlated with OLD20. Although it is more difficult to explain
how such effects can arise in the case of the k-nearest neighbours methods and the random forest
methods, it has already been demonstrated that some properties of the semantic space may be
associated with well-known psycholinguistic variables. For example, it has been shown that
some of the semantic neighbourhood density measures can strongly correlate with word
frequencies even if the frequencies are not explicitly encoded in the semantic space (Shaoul &
Westbury, 2006). Similarly, implicit properties of the semantic spaces can lead to introducing
artefacts to the extrapolated ratings.
Of course, the higher the correlation of extrapolated ratings with the original ratings the
less room for artefacts; we indeed observed that the artefacts were generally smaller in the case
of extrapolated ratings which correlated more strongly with the original ratings. At the same
time, it seems important that in the case of extrapolated ratings we are not looking at the original
phenomenon but rather at the output of a statistical model. In such case it may be impossible to

Extrapolating psycholinguistic variables 39
disentangle patterns in the data that arise due to properties of the phenomenon from those that
arise due to properties of the model itself. This aspect of the extrapolated ratings can make it
problematic to use them interchangeably with the human ratings or draw strong conclusions
based on such ratings.
Despite these limitations, the extrapolated variables still seem to have some important
applications. For instance, the extent to which different extrapolation methods with different
predictors are successful in predicting ratings can potentially inform us about the
psycholinguistic variables. For instance, the fact that co-occurrence similarity between words
explains a non-trivial part of variance in AoA ratings could suggest that semantically related
words are acquired around the same age. The same logic can be applied to the other variables,
although, as was already reported by Bestgen & Vincze (2012), co-occurence models often
model antonyms as close neighbours in a vector space. It would be interesting to look at how this
problem can affect extrapolation of different variables. For example, love and hate are obviously
on the opposite sides of the valence continuum, so modelling them as close semantic neighbours
may be a problem for extrapolating valence, but this problem should affect to a smaller extent
variables such as AoA or concreteness, as there is no reason why there would be a strong
tendency to acquire antonymous words at very different age or why one of the words in the
antonym pair would be more concrete than the other.
In addition, the accuracy of extrapolation procedures using different word vector
representations can be informative about the word vector representations themselves. Although
we used models based on statistical distributions of words in a language as approximate
representations of semantics, different models may capture its different aspects. For instance,

Extrapolating psycholinguistic variables 40
apparently in our study the word vectors based on narrow windows (HAL-like model and skip-
gram model) performed better than the bag-of-words models and perhaps such vectors allow to
model semantic similarity in a way that better corresponds to that reflected in psycholinguistic
variables. It also seems plausible that the high correlations obtained using the skip-gram model
can be simply explained by it being better at estimating word similarities (Baroni et al., 2014).
We have shown that increasing the size of the training set gives diminishing
improvements to prediction accuracy as the training set gets larger. This means that, at least to
some extent, extrapolation of variables can be already applied even if the sets of seed ratings
currently available are relatively small. On the other hand, together with rather disappointing
results of the evaluation of the practical usefulness of extrapolated variables, it shows that further
developments are necessary to allow for radically improved accuracy of the extrapolation
procedures.
Because in the current study we used large sets of ratings, our results should generalize
well across the entire lexicon. Despite that, the fact that the extrapolation methods as well as
word vector representations require parameters to be specified during training may hamper the
generalizability of our conclusions. Because the methods are computationally demanding, it
seems implausible to try to cover the entire parameter space of all the methods. At the same time,
there is no guarantee that what is found with one parameter setting would be true for another
parameter settings. Especially there is no guarantee that we did not choose a more optimal set of
parameters for one method than for the other methods. The result also depends on the corpus that
was used to train the models and the way in which it was preprocessed. There is a possibility that
the subtitle corpus we used may be suboptimal for the purposes of distributional semantics,

Extrapolating psycholinguistic variables 41
which may have reduced the performance of the extrapolation methods. Indeed, some of the
correlations reported in the literature (e.g. Recchia & Louwerse, 2014) were higher than the ones
we found. However it is difficult to make direct comparisons across studies as the sets of ratings,
their sizes, proportions of the training and test sets, and approaches to cross-validation vary
across studies. Moreover, the differences in the correlations reported across studies are not large
enough to expect that using a different corpus would lead to qualitatively different conclusions
than the ones we reached here. Also there is no reason to believe that the overall pattern of
relative efficacy between the different methods of extrapolation and the techniques of
constructing word vectors would be different. Nevertheless, it would be interesting to look at the
corpus effects in future studies of this type.
An interesting problem to address in future research is how we can optimize our data
collection process to collect ratings, so that they become maximally informative for the
extrapolation methods. If an optimal set of seed words would increase the accuracy of the
extrapolation methods, it would be good to know this.
Finally, given recent developments in computational linguistics, it would be interesting to
explore the possibilities of cross-language extrapolation of psycholinguistic variables. It was
recently shown that it is possible to learn a linear mapping between vector spaces of two
languages (Mikolov, Le, & Sutskever, 2013). This means that, in addition to word properties in a
given language, we could use information from other languages when extrapolating ratings (e.g.,
use sets of ratings that were already collected for English to predict ratings for other languages).

Extrapolating psycholinguistic variables 42
Acknowledgement
This research was made possible by an Odysseus grant from the Government of Flanders.

Extrapolating psycholinguistic variables 43
Supplementary Materials
• Mappings between original Stanford tagset and a simplified tagset

Extrapolating psycholinguistic variables 44
References
Balota, D. A., Yap, M. J., Hutchison, K. A., Cortese, M. J., Kessler, B., Loftis, B., … Treiman, R.
(2007). The English lexicon project. Behavior Research Methods, 39(3), 445–459.
Baroni, M., Dinu, G., & Kruszewski, G. (2014). Don’t count, predict! A systematic comparison
of context-counting vs. context-predicting semantic vectors. In Proceedings of the 52nd
Annual Meeting of the Association for Computational Linguistics (Vol. 1). Retrieved
from http://clic.cimec.unitn.it/marco/publications/acl2014/baroni-etal-countpredict-
acl2014.pdf
Bestgen, Y. (2002). Détermination de la valence affective de termes dans de grands corpus de
textes [Determination of the emotional valence of terms in large corpora]. In: Y.
Toussaint, & C. Nedellec (eds) Actes du Colloque International sur la Fouille de Texte
CIFT '02, 81-94. INRIA, Nancy, France.
Bestgen, Y., & Vincze, N. (2012). Checking and bootstrapping lexical norms by means of word
similarity indexes. Behavior Research Methods, 44(4), 998–1006. doi:10.3758/s13428-
012-0195-z
Blei, D. M., Ng, A. Y., & Jordan, M. I. (2003). Latent dirichlet allocation. The Journal of
Machine Learning Research, 3, 993–1022.
Bradley, M., & Lang, P. (1999). Affective norms for English words (ANEW): Stimuli, instruction
manual, and affective ratings.
Breiman, L. (2001). Random forests. Machine Learning, 45(1), 5–32.
Extrapolating psycholinguistic variables 45
Broder, A. Z. (1997). On the resemblance and containment of documents. In Compression and
Complexity of Sequences 1997. Proceedings (pp. 21–29). IEEE. Retrieved from
http://ieeexplore.ieee.org/xpls/abs_all.jsp?arnumber=666900
Brysbaert, M., Buchmeier, M., Conrad, M., Jacobs, A. M., Bölte, J., & Böhl, A. (2011). The word
frequency effect: A review of recent developments and implications for the choice of
frequency estimates in German. Experimental Psychology, 58, 412–424.
Brysbaert, M., & Ghyselinck, M. (2006). The effect of age of acquisition: Partly frequency
related, partly frequency independent. Visual Cognition, 13, 992–1011.
doi:10.1080/13506280544000165
Brysbaert, M., & New, B. (2009). Moving beyond Kučera and Francis: A critical evaluation of
current word frequency norms and the introduction of a new and improved word
frequency measure for American English. Behavior Research Methods, 41(4), 977–990.
doi:10.3758/BRM.41.4.977
Brysbaert, M., Warriner, A. B., & Kuperman, V. (2013). Concreteness ratings for 40 thousand
generally known English word lemmas. Behavior Research Methods.
doi:10.3758/s13428-013-0403-5
Coltheart, M. (1981). The MRC psycholinguistic database. The Quarterly Journal of
Experimental Psychology Section A, 33(4), 497–505. doi:10.1080/14640748108400805
Feng, S., Cai, Z., Crossley, S., & McNamara, D. S. (2011). Simulating Human Ratings on Word
Concreteness. In Twenty-Fourth International FLAIRS Conference. Retrieved from
http://www.aaai.org/ocs/index.php/FLAIRS/FLAIRS11/paper/viewPDFInterstitial/2644/3
035

Extrapolating psycholinguistic variables 46
Fix, E., & Hodges, J. (1951). Discriminatory analysis, nonparametric discrimination:
Consistency properties. US Air Force School of Aviation Medicine, Technical Report 4(3),
477.
Geman, S., & Geman, D. (1984). Stochastic Relaxation, Gibbs Distributions, and the Bayesian
Restoration of Images. IEEE Trans. Pattern Anal. Mach. Intell., 6(6), 721–741.
doi:10.1109/TPAMI.1984.4767596
Gilhooly, K. J., & Logie, R. H. (1980). Age-of-acquisition, imagery, concreteness, familiarity,
and ambiguity measures for 1,944 words. Behavior Research Methods &
Instrumentation, 12(4), 395–427. doi:10.3758/BF03201693
Jordan, M. I., Ghahramani, Z., Jaakkola, T. S., & Saul, L. K. (1999). An introduction to
variational methods for graphical models. Machine Learning, 37(2), 183–233.
Keuleers, E., Brysbaert, M., & New, B. (2010). SUBTLEX-NL: A new measure for Dutch word
frequency based on film subtitles. Behavior Research Methods, 42(3), 643–650.
doi:10.3758/BRM.42.3.643
Keuleers, E., Lacey, P., Rastle, K., & Brysbaert, M. (2011). The British Lexicon Project: Lexical
decision data for 28,730 monosyllabic and disyllabic English words. Behavior Research
Methods, 44(1), 287–304. doi:10.3758/s13428-011-0118-4
Kuperman, V., Stadthagen-Gonzalez, H., & Brysbaert, M. (2012). Age-of-acquisition ratings for
30,000 English words. Behavior Research Methods, 44(4), 978–990.
doi:10.3758/s13428-012-0210-4
Extrapolating psycholinguistic variables 47
Landauer, T. K., & Dumais, S. T. (1997). A solution to Plato’s problem: The latent semantic
analysis theory of acquisition, induction, and representation of knowledge. Psychological
Review; Psychological Review, 104(2), 211.
Lund, K., & Burgess, C. (1996). Producing high-dimensional semantic spaces from lexical co-
occurrence. Behavior Research Methods, Instruments, & Computers, 28(2), 203–208.
Manning, C. D., Raghavan, P., & Schütze, H. (2008). Introduction to information retrieval. New
York: Cambridge University Press.
Manning, C. D., & Schütze, H. (1999). Foundations of statistical natural language processing.
Cambridge, MA: MIT Press.
Mikolov, T., Chen, K., Corrado, G., & Dean, J. (2013). Efficient Estimation of Word
Representations in Vector Space. arXiv:1301.3781 [cs]. Retrieved from
http://arxiv.org/abs/1301.3781
Mikolov, T., Le, Q. V., & Sutskever, I. (2013). Exploiting Similarities among Languages for
Machine Translation. arXiv:1309.4168 [cs]. Retrieved from
http://arxiv.org/abs/1309.4168
Miller, G. A., Beckwith, R., Fellbaum, C., Gross, D., & Miller, K. (1990). WordNet: An on-line
lexical database. International Journal of Lexicography, 3, 235–244.
Recchia, G., & Jones, M. N. (2009). More data trumps smarter algorithms: Comparing pointwise
mutual information with latent semantic analysis. Behavior Research Methods, 41(3),
647–656. doi:10.3758/BRM.41.3.647

Extrapolating psycholinguistic variables 48
Recchia, G., & Louwerse, M. M. (2014). Reproducing affective norms with lexical co-
occurrence statistics: Predicting valence, arousal, and dominance. The Quarterly Journal
of Experimental Psychology, 1–41. doi:10.1080/17470218.2014.941296
Rijsbergen, C. J. V. (1979). Information retrieval. Butterworths.
Rumelhart, D. E., Hinton, G. E., & Williams, R. J. (1986). Learning representations by back-
propagating errors. Nature, 323(6088), 533–536. doi:10.1038/323533a0
Sahlgren, M. (2006). The Word-Space Model: using distributional analysis to represent
syntagmatic and paradigmatic relations between words in high-dimensional vector
spaces. Department of Linguistics, Stockholm University : National Graduate School of
Language Technology, Gothenburg University ; Swedish Institute of Computer Science
Useware Laboratory, Stockholm; Göteborg; Kista.
Shaoul, C., & Westbury, C. (2006). Word frequency effects in high-dimensional co-occurrence
models: A new approach. Behavior Research Methods, 38(2), 190–195.
doi:10.3758/BF03192768
Shaoul, C., & Westbury, C. (2010). Exploring lexical co-occurrence space using HiDEx.
Behavior Research Methods, 42(2), 393–413. doi:10.3758/BRM.42.2.393
Steyvers, M., & Griffiths, T. (2007). Probabilistic topic models. Handbook of Latent Semantic
Analysis, 427(7), 424–440.
Toutanova, K., Klein, D., Manning, C. D., & Singer, Y. (2003). Feature-rich part-of-speech
tagging with a cyclic dependency network. In Proceedings of the 2003 Conference of the
North American Chapter of the Association for Computational Linguistics on Human

Extrapolating psycholinguistic variables 49
Language Technology-Volume 1 (pp. 173–180). Association for Computational
Linguistics.
Toutanova, K., & Manning, C. D. (2000). Enriching the knowledge sources used in a maximum
entropy part-of-speech tagger. In Proceedings of the 2000 Joint SIGDAT conference on
Empirical methods in natural language processing and very large corpora: held in
conjunction with the 38th Annual Meeting of the Association for Computational
Linguistics-Volume 13 (pp. 63–70). Association for Computational Linguistics.
Warriner, A. B., Kuperman, V., & Brysbaert, M. (2013). Norms of valence, arousal, and
dominance for 13,915 English lemmas. Behavior Research Methods.
doi:10.3758/s13428-012-0314-x
Westbury, C. (2013). You Can’t Drink a Word: Lexical and Individual Emotionality Affect
Subjective Familiarity Judgments. Journal of Psycholinguistic Research.
doi:10.1007/s10936-013-9266-2
Westbury, C. F., Shaoul, C., Hollis, G., Smithson, L., Briesemeister, B. B., Hofmann, M. J., &
Jacobs, A. M. (2013). Now you see it, now you don’t: on emotion, context, and the
algorithmic prediction of human imageability judgments. Frontiers in Psychology, 4.
doi:10.3389/fpsyg.2013.00991