Embed Size (px)
Citation preview
Extreme Weather and Climate Readiness: Toolkit for State and Territorial Health Departments
A Project of the Climate Change Collaborative June 2014
i
Purpose of this Toolkit Recognizing that the changing climate is a significant threat to the health of our communities, the Association of State and Territorial Health Officials (ASTHO) has created this toolkit to help state and territorial health agencies enhance their climate readiness, program by program. The toolkit offers practical steps for integrating climate readiness into seven public health topic areas: air quality, water safety, vector-borne and zoonotic disease, food safety, chemical safety, healthy sustainable communities and injury prevention, and natural disaster emergency preparedness. Worksheets have been provided throughout the toolkit to assist readers in performing Climate Readiness Assessments in each topic area. Copyright 2014. All Rights Reserved The development of this resource was supported by Cooperative Agreement 5U38HM000454 from the Centers for Disease Control and Prevention. Its contents are solely the responsibility of the authors and do not necessarily represent the official views of the Centers for Disease Control and Prevention. This report is available online at: http://www.astho.org
Suggested format for citing this publication: Association of State and Territorial Health Officials Climate Change Collaborative. Extreme Weather and Climate Readiness: Toolkit for State Health Departments. Arlington, VA; 2013:126. Available at: http://www.astho.org.
ii
Acknowledgements
LEAD AUTHOR
Adele Houghton, Biositu, LLC
REVIEWERS
Henry “Andy” Anderson, Wisconsin Division of Public Health Norman Anderson, Maine Center for Disease Control and Prevention Bryon Backenson, New York State Department of Health Kathy Clancy, New York Department of Health Kathy Dervin, California Department of Public Health Julia Gold, Rhode Island Department of Health Jennifer Goodnight, ASTHO Larry Hill, Virginia Department of Health H. Bruce "Jeff" Jeffries, Georgia Department of Public Health Anne Kjemtrup, California Department of Public Health Abraham Kulungara, ASTHO Meenoo Mishra, ASTHO Jeffrey Phillips, Wisconsin Department of Health Services Margaret M. Round, Massachusetts Department of Public Health Mina Shehee, North Carolina Department of Health and Human Services Surili Sutaria, Association of Public Health Laboratories Jim Vannoy, Idaho Department of Health and Welfare Charles Warzecha, Wisconsin Department of Health Services Michael Wichman, The University of Iowa
SPECIAL THANKS TO THE STATES WHO PILOTED THE DRAFT TOOLKIT:
California Georgia Maine Massachusetts Wisconsin
iii
Table of Contents
Acknowledgements ……………………………………………... ii Introduction ……………………………………………………….. 1 Health Equity & Climate Change ………………… 3 Climate Readiness Frameworks ………………….. 4 How to Use this Toolkit ……………………………... 6
Integrating Climate Readiness by Topic Area …………. 7 1. Air Quality …………………………………………… 9 2. Water Safety ………………………………………… 20 3. Vector-borne & Zoonotic Disease ……………. 32 4. Food Safety ………………………………………….. 44 5. Chemical Safety ……………………………………. 55 6. Healthy Sustainable Communities & Injury Prevention …………………………………. 66 7. Natural Disaster Emergency Preparedness .. 78
Climate Readiness Assessment Resources …………….. 92 References ………………………………………………………... 96
ASTHO Extreme Weather and Climate Readiness: Toolkit for State and Territorial Health Departments 1
Introduction
“Weather and climate have always had a key influence on human health. This influence on our lives will
increase with climate change.” Chris Portier, Ph.D. Former Director of the CDC National Center for Environmental Health and Agency for Toxic Substances and Disease Registry1
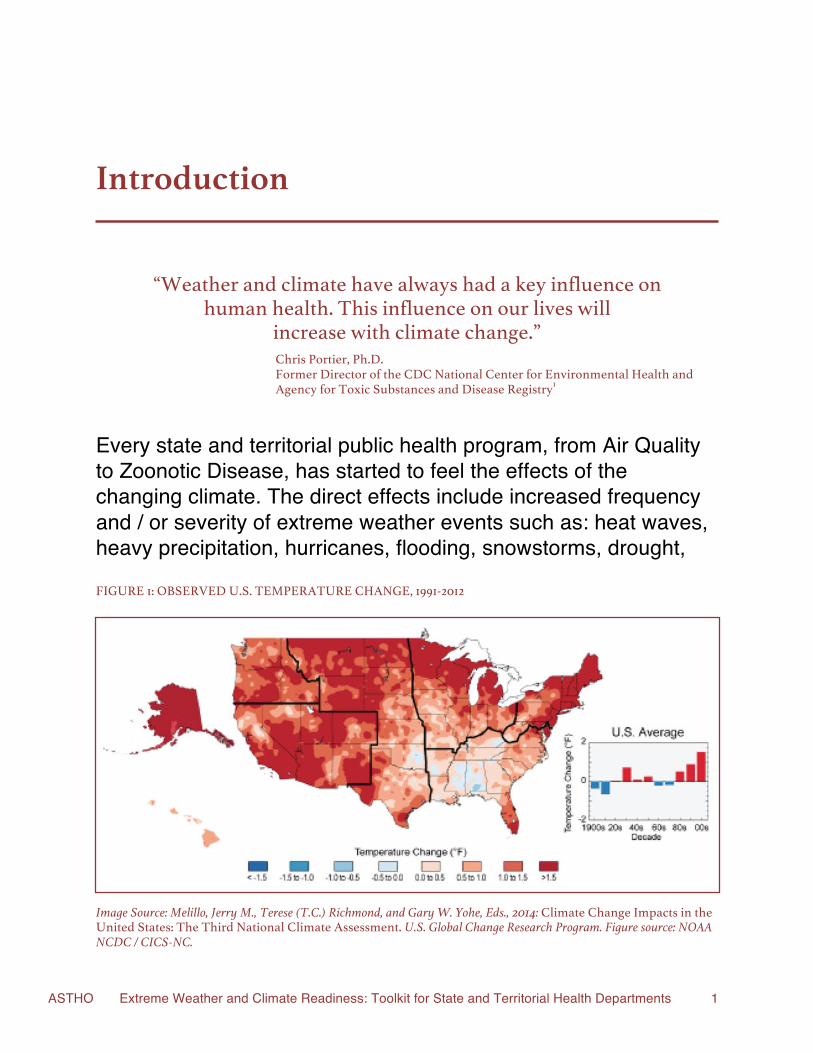
Every state and territorial public health program, from Air Quality to Zoonotic Disease, has started to feel the effects of the changing climate. The direct effects include increased frequency and / or severity of extreme weather events such as: heat waves, heavy precipitation, hurricanes, flooding, snowstorms, drought,
FIGURE 1: OBSERVED U.S. TEMPERATURE CHANGE, 1991-2012
Image Source: Melillo, Jerry M., Terese (T.C.) Richmond, and Gary W. Yohe, Eds., 2014: Climate Change Impacts in the United States: The Third National Climate Assessment. U.S. Global Change Research Program. Figure source: NOAA NCDC / CICS-NC.
ASTHO Extreme Weather and Climate Readiness: Toolkit for State and Territorial Health Departments 2
and wildfires. Indirect effects include increased risk of vector-borne and zoonotic diseases, population displacement, and threats to food security. ASTHO has taken several steps to support actions preparing the state and territorial public health infrastructure to address climate-related challenges.
§ In 2007, ASTHO supported Commissioner Susan Cooper (TN) during her presentation on Climate Change to the U.S Senate Committee on Environment and Public Works. (Resource: Commissioner Cooper’s statement.)
§ In 2008, ASTHO formed the Climate Change Collaborative: a multi-disciplinary team of experts who provide guidance regarding the most effective ways for ASTHO to support and build climate and health capacity within state and territorial health agencies. (Resource: Notes from the most recent Climate Change Collaborate in-person meetings.)
§ In 2008, ASTHO hosted a webinar series examining several aspects of public health impacts of climate change, including heat stress, water, and vectors. (Resource: Webinar presentations.)
§ In 2009 and 2012, ASTHO administered climate change needs assessment surveys designed to capture climate change perspectives and capacities within state and territorial health agencies. (Resource: Summary reports of both assessments.)
§ In 2011, ASTHO released the Climate Change Threatens Public Health Position Statement outlining the health effects of climate change and potential public health responses, including: understanding and preparedness, education and outreach, and assessment and policy. (Resource: Position statement.)
§ ASTHO, in conjunction with the Centers for Disease Control and Prevention (CDC) / National Center for Environmental Health (NCEH), has funded three rounds of capacity building grants. To date, this program has funded 12 projects in a total of 8 states. (Resource: Grantee webpage.)
§ ASTHO has also co-sponsored two rounds of climate and health webinar series in conjunction with CDC, American Public Health Association (APHA), Society for Public Health Education (SOPHE), and National Association of County and City Health Officials (NACCHO). The webinars highlighted best practices at the state and local levels and guidance on how public health tools can be used to enhance the capacity of state and local health departments in addressing climate change. (Resource: Webinar archives.)
§ In 2013, ASTHO hosted a two-part webinar series about using CDC's Building Resilience Against Climate Effects (BRACE) Framework to prepare for the health effects of climate change. This framework supports health departments in incorporating advanced climate models into health department planning and response activities. (Resource: Webinar archives.)
ASTHO Extreme Weather and Climate Readiness: Toolkit for State and Territorial Health Departments 3
This toolkit, a product of the Climate Change Collaborative, applies the framework laid out by the ASTHO climate change position statement to address the capacity gaps identified in the ASTHO climate change needs assessment surveys. Recognizing that the organization of health agencies changes from one state / territory to the next, the toolkit outlines a comprehensive approach to integrating climate readiness into all policies and programs. It is divided into seven thematic content areas, all of which are likely to address elements of multiple departments, and, possibly, programs in multiple agencies. Key program areas — such as chronic disease and health equity — that are relevant to most or all public health activities are cross-referenced throughout the toolkit. This organization reflects the need for public health agencies to bring an interdisciplinary approach to addressing the health effects of extreme weather and climate change. Such an approach can protect lives, reduce costs, improve effectiveness, and build valuable relationships both internally and with external partners.
Health Equity and Climate Change ASTHO has identified “promoting health equity” as a crosscutting goal of the organization, in alignment with the World Health Organization’s (WHO) position that “the objective of good health is…twofold: the best attainable average level — goodness — and the smallest feasible differences among individuals and groups — fairness.”2 Health inequities exist among groups based on gender, sexual orientation, race, ethnicity, education, income, disability, and geographic location. In addition, the burden of health inequities constitutes a huge financial and social cost to our nation in terms of the quality and quantity of life. The social determinants of health are the conditions in which people are born, grow, live, work, and age. These circumstances are in turn shaped by a wider set of forces: economics, social policies, and politics.3 Health and the ability to adapt to climate change are largely determined by these factors.4 Older adults, children, and low-income communities are disproportionately vulnerable to the health effects of climate change, such as heat stress, increased costs of energy and food, and increased cardiovascular and respiratory disease.5 Environmental justice issues are critical to understand in relation to climate change and health inequities. According to the U.S. Environmental Protection Agency (U.S. EPA), “environmental justice is the fair treatment and meaningful involvement of all people regardless of race, color, national origin, or income with respect to the development, implementation, and enforcement of environmental laws, regulations, and policies.”6 Climate change policy should take health inequities and environmental injustices into account and incorporate social determinants into the planning and implementation of climate change programs and policy to contribute to the elimination of health disparities and achievement of health equity.7
ASTHO Extreme Weather and Climate Readiness: Toolkit for State and Territorial Health Departments 4
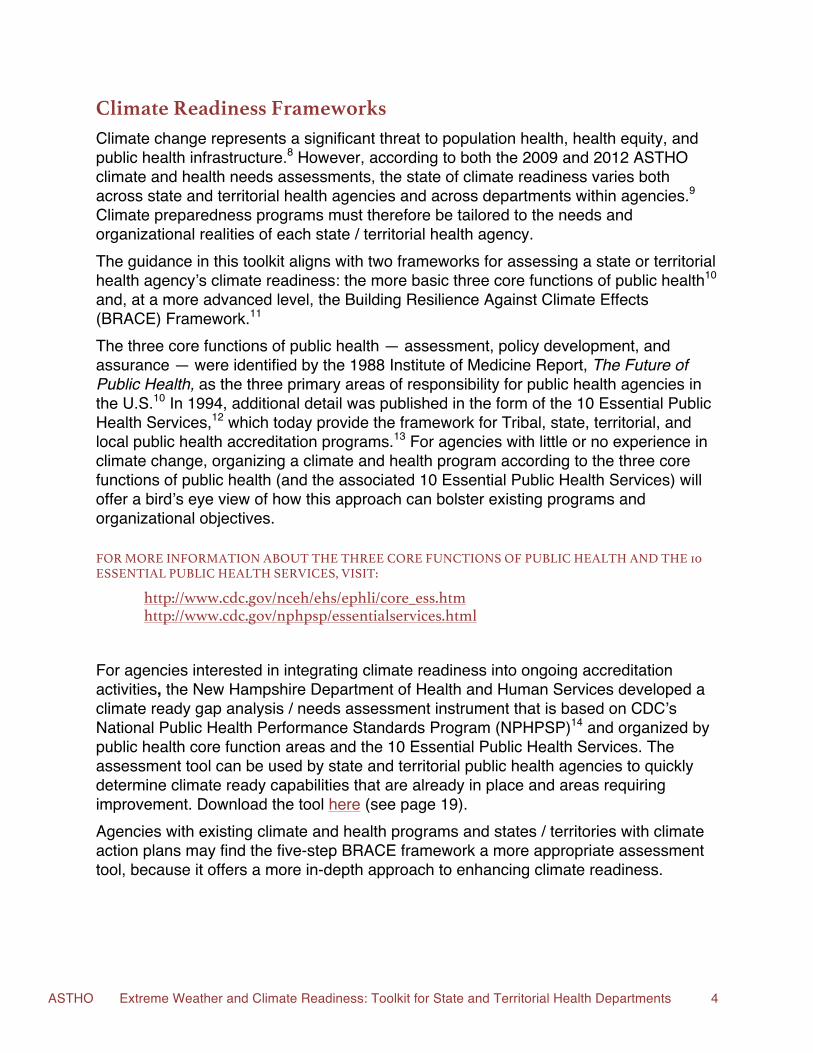
Climate Readiness Frameworks Climate change represents a significant threat to population health, health equity, and public health infrastructure.8 However, according to both the 2009 and 2012 ASTHO climate and health needs assessments, the state of climate readiness varies both across state and territorial health agencies and across departments within agencies.9 Climate preparedness programs must therefore be tailored to the needs and organizational realities of each state / territorial health agency. The guidance in this toolkit aligns with two frameworks for assessing a state or territorial health agency’s climate readiness: the more basic three core functions of public health10 and, at a more advanced level, the Building Resilience Against Climate Effects (BRACE) Framework.11 The three core functions of public health — assessment, policy development, and assurance — were identified by the 1988 Institute of Medicine Report, The Future of Public Health, as the three primary areas of responsibility for public health agencies in the U.S.10 In 1994, additional detail was published in the form of the 10 Essential Public Health Services,12 which today provide the framework for Tribal, state, territorial, and local public health accreditation programs.13 For agencies with little or no experience in climate change, organizing a climate and health program according to the three core functions of public health (and the associated 10 Essential Public Health Services) will offer a bird’s eye view of how this approach can bolster existing programs and organizational objectives.
FOR MORE INFORMATION ABOUT THE THREE CORE FUNCTIONS OF PUBLIC HEALTH AND THE 10 ESSENTIAL PUBLIC HEALTH SERVICES, VISIT:
http://www.cdc.gov/nceh/ehs/ephli/core_ess.htm http://www.cdc.gov/nphpsp/essentialservices.html
For agencies interested in integrating climate readiness into ongoing accreditation activities, the New Hampshire Department of Health and Human Services developed a climate ready gap analysis / needs assessment instrument that is based on CDC’s National Public Health Performance Standards Program (NPHPSP)14 and organized by public health core function areas and the 10 Essential Public Health Services. The assessment tool can be used by state and territorial public health agencies to quickly determine climate ready capabilities that are already in place and areas requiring improvement. Download the tool here (see page 19). Agencies with existing climate and health programs and states / territories with climate action plans may find the five-step BRACE framework a more appropriate assessment tool, because it offers a more in-depth approach to enhancing climate readiness.
ASTHO Extreme Weather and Climate Readiness: Toolkit for State and Territorial Health Departments 5
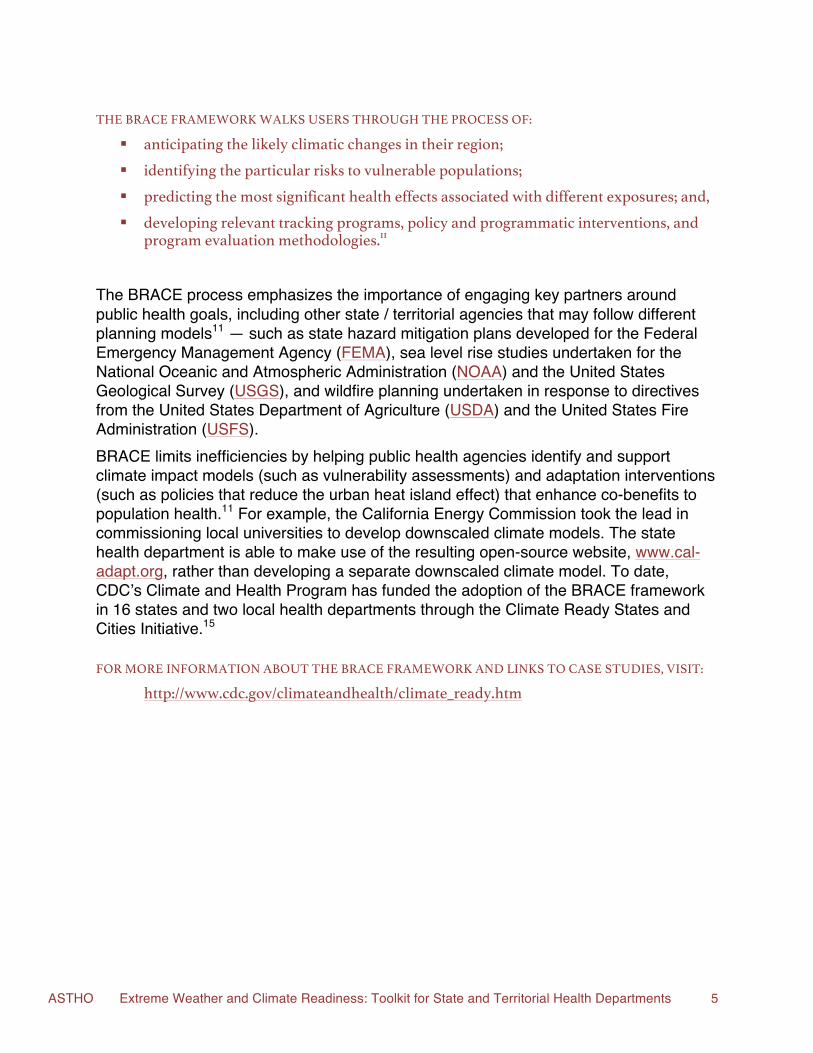
THE BRACE FRAMEWORK WALKS USERS THROUGH THE PROCESS OF:
§ anticipating the likely climatic changes in their region; § identifying the particular risks to vulnerable populations; § predicting the most significant health effects associated with different exposures; and, § developing relevant tracking programs, policy and programmatic interventions, and
program evaluation methodologies.11
The BRACE process emphasizes the importance of engaging key partners around public health goals, including other state / territorial agencies that may follow different planning models11 — such as state hazard mitigation plans developed for the Federal Emergency Management Agency (FEMA), sea level rise studies undertaken for the National Oceanic and Atmospheric Administration (NOAA) and the United States Geological Survey (USGS), and wildfire planning undertaken in response to directives from the United States Department of Agriculture (USDA) and the United States Fire Administration (USFS). BRACE limits inefficiencies by helping public health agencies identify and support climate impact models (such as vulnerability assessments) and adaptation interventions (such as policies that reduce the urban heat island effect) that enhance co-benefits to population health.11 For example, the California Energy Commission took the lead in commissioning local universities to develop downscaled climate models. The state health department is able to make use of the resulting open-source website, www.cal-adapt.org, rather than developing a separate downscaled climate model. To date, CDC’s Climate and Health Program has funded the adoption of the BRACE framework in 16 states and two local health departments through the Climate Ready States and Cities Initiative.15
FOR MORE INFORMATION ABOUT THE BRACE FRAMEWORK AND LINKS TO CASE STUDIES, VISIT:
http://www.cdc.gov/climateandhealth/climate_ready.htm
ASTHO Extreme Weather and Climate Readiness: Toolkit for State and Territorial Health Departments 6
How to Use this Toolkit This toolkit has been designed to serve dual purposes.
1. BUILDING AWARENESS & CAPACITY: The toolkit provides background information on how to build climate readiness into state and territorial health agencies. This information can be used to build awareness within your agency about how the changing climate is impacting both community health and the public health infrastructure designed to protect it. The toolkit may be distributed in its entirety or section-by-section to relevant departments and programs.
2. ASSESSING CLIMATE READINESS: For states and territories that are interested in integrating extreme weather and climate change into their planning process or have already launched a climate readiness initiative, the toolkit provides activities that are designed to align with the agency’s existing assessment framework, whether organized around the three core functions of public health and the Ten Essential Public Health Services12 or the BRACE Framework,11 which is being implemented by the recipients of CDC’s Climate Ready States and Cities Initiative grant program. Climate readiness is a collaborative endeavor. The effects of extreme weather and climate change cut across geographic scale, political jurisdiction, and agency scope. While health agencies bring an important perspective to climate readiness policies and initiatives, they often do not lead the process. The activities accompanying this toolkit will therefore likely require input from other departments. States / territories like Massachusetts16 that have convened a multi-agency adaptation workgroup may choose to complete the activities as part of that body’s work. In other states / territories, the activities can be used to start a conversation with partner agencies about opportunities for future collaboration on climate readiness efforts.
ASTHO Extreme Weather and Climate Readiness: Toolkit for State and Territorial Health Departments 7
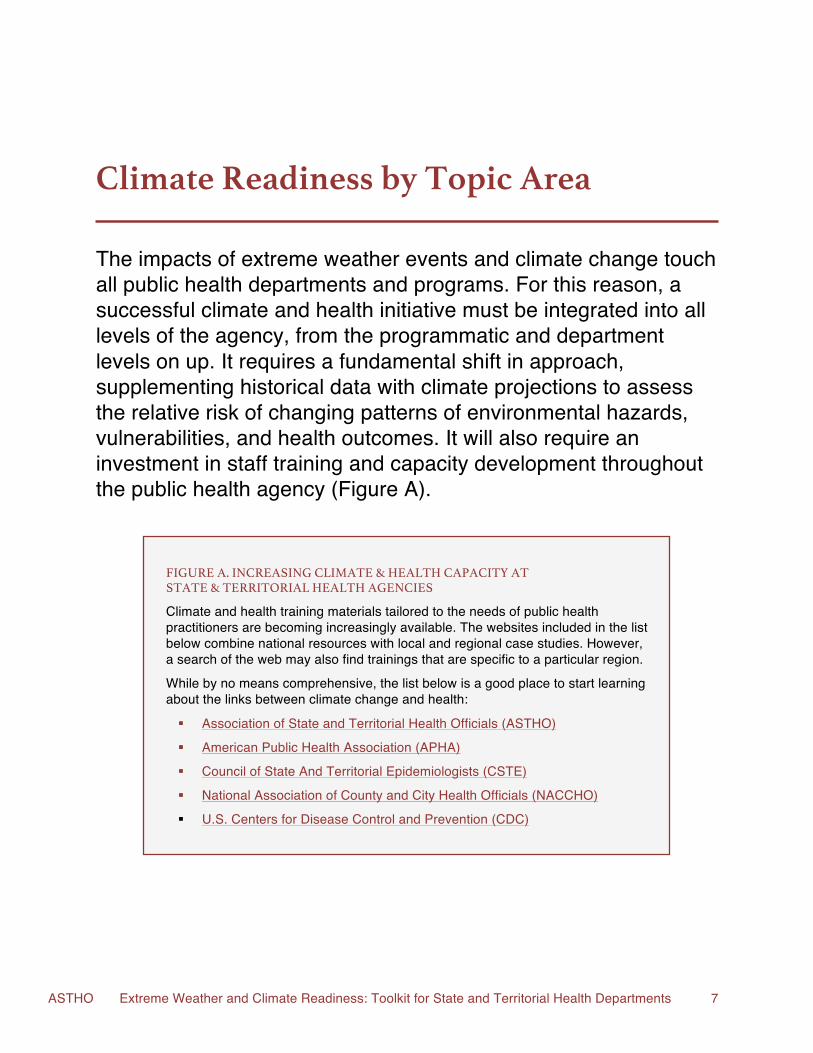
Climate Readiness by Topic Area The impacts of extreme weather events and climate change touch all public health departments and programs. For this reason, a successful climate and health initiative must be integrated into all levels of the agency, from the programmatic and department levels on up. It requires a fundamental shift in approach, supplementing historical data with climate projections to assess the relative risk of changing patterns of environmental hazards, vulnerabilities, and health outcomes. It will also require an investment in staff training and capacity development throughout the public health agency (Figure A).
FIGURE A. INCREASING CLIMATE & HEALTH CAPACITY AT STATE & TERRITORIAL HEALTH AGENCIES
Climate and health training materials tailored to the needs of public health practitioners are becoming increasingly available. The websites included in the list below combine national resources with local and regional case studies. However, a search of the web may also find trainings that are specific to a particular region.
While by no means comprehensive, the list below is a good place to start learning about the links between climate change and health:
§ Association of State and Territorial Health Officials (ASTHO)
§ American Public Health Association (APHA)
§ Council of State And Territorial Epidemiologists (CSTE)
§ National Association of County and City Health Officials (NACCHO)
§ U.S. Centers for Disease Control and Prevention (CDC)
ASTHO Extreme Weather and Climate Readiness: Toolkit for State and Territorial Health Departments 8
THE FOLLOWING SECTIONS OFFER TOOLS AND INSIGHT INTO ENHANCING CLIMATE READINESS IN SEVEN TOPIC AREAS, ALL OF WHICH COMBINE CORE PUBLIC HEALTH SERVICES WITH KEY PARTNERS BOTH WITHIN AND EXTERNAL TO THE STATE OR TERRITORIAL HEALTH AGENCY:
1. Air Quality 2. Water Safety 3. Vector-borne & Zoonotic Disease 4. Food Safety
EACH SECTION IS DIVIDED INTO FOUR PARTS:
1. an overview of the effects of extreme weather and climate change on the public health infrastructure;
2. opportunities for integrating climate readiness into existing programs; 3. tracking climate readiness; and, 4. a review of the evidence that a climate readiness approach can offer co-benefits to
health, financial wellbeing, and the environment.
5. Chemical Safety 6. Healthy Sustainable Communities
& Injury Prevention 7. Natural Disaster Emergency
Preparedness
ASTHO Extreme Weather and Climate Readiness: Toolkit for State and Territorial Health Departments 9
1. Air Quality
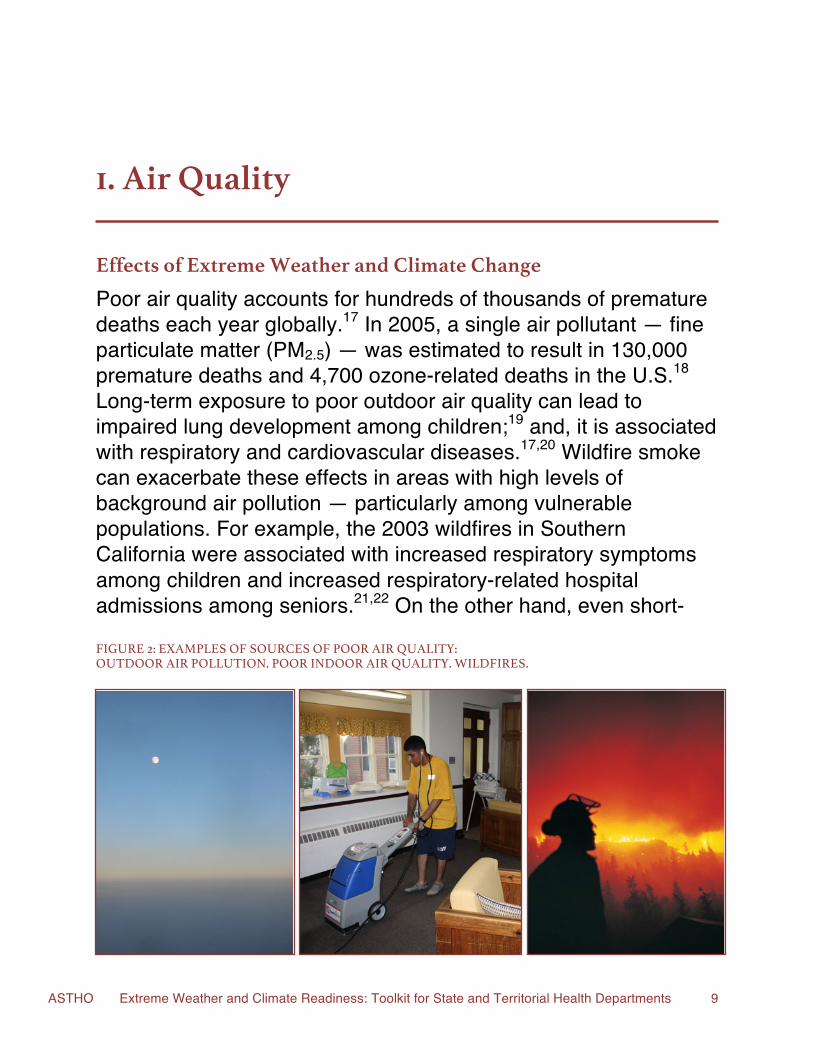
Effects of Extreme Weather and Climate Change Poor air quality accounts for hundreds of thousands of premature deaths each year globally.17 In 2005, a single air pollutant — fine particulate matter (PM2.5) — was estimated to result in 130,000 premature deaths and 4,700 ozone-related deaths in the U.S.18 Long-term exposure to poor outdoor air quality can lead to impaired lung development among children;19 and, it is associated with respiratory and cardiovascular diseases.17,20 Wildfire smoke can exacerbate these effects in areas with high levels of background air pollution — particularly among vulnerable populations. For example, the 2003 wildfires in Southern California were associated with increased respiratory symptoms among children and increased respiratory-related hospital admissions among seniors.21,22 On the other hand, even short-
FIGURE 2: EXAMPLES OF SOURCES OF POOR AIR QUALITY: OUTDOOR AIR POLLUTION. POOR INDOOR AIR QUALITY. WILDFIRES.
ASTHO Extreme Weather and Climate Readiness: Toolkit for State and Territorial Health Departments 10
term reductions in traffic congestion can have the opposite effect on health outcomes. For example, asthma-related visits to Atlanta emergency departments temporarily fell while an alternative transportation plan was enacted during the 1996 Olympic Games.23 Outdoor air pollution is caused by a combination of stationary (or, point-source) emissions (such as coal-fired power plants) and mobile source emissions (such as cars and trucks).24 Wildfires also contribute to compromised air quality.25,26 Their smoke can contain a variety of toxicants, including carbon monoxide (CO), nitrogen oxides, ozone (O3) precursors such as volatile organic compounds (VOCs), and particulate matter (PM).27 The Clean Air Act requires the U.S. Environmental Protection Agency (U.S. EPA) to regulate six “criteria” outdoor air pollutants that are found widely across the country and are particularly harmful to human health: CO, lead (Pb), nitrogen dioxide (NO2), O3, fine and course particulate matter (PM2.5 and PM10), and sulfur dioxide (SO2).28 It also regulates sources of hazardous air pollutants by enforcing technology-based emission standards.29 The economic burden to areas where the concentration of criteria air pollutants exceeds the thresholds set by the National Ambient Air Quality Standards (NAAQS) (also called “nonattainment” areas) can be substantial. For example, in California, where over 90% of the population is located in nonattainment areas, poor air quality contributes to an estimated 8,800 deaths and $71 billion in health care costs annually.30 According to the U.S. EPA, the concentration of air pollutants inside buildings can reach 2-5 times the concentration of pollution in outdoor air.31 This is a particularly troubling statistic, because people in the U.S. spend, on average, more than 90% of each day indoors.32 Poor indoor air quality can be caused by a number of factors, including: temperature; humidity; outdoor air pollutants (introduced to the indoor environment through doors, windows, and the heating and air conditioning system); building materials that emit VOCs such as formaldehyde; dust; mold; pesticides; and, cleaning chemicals.33 According the Institute of Medicine (IOM) report, Climate Change, the Indoor Environment, and Health (2011),33 many of these determinants are likely to be exacerbated by climate change (Table 1-A). For example, as outdoor air pollution increases, higher concentrations of contaminants will be introduced into the indoor environment.33 Furthermore, in an attempt to reduce the demand that mechanical systems place on the electrical grid, many building codes have reduced minimum required ventilation rates, thereby potentially increasing the concentration of pollutants in the indoor air.33 Building operations can also unintentionally exacerbate extreme weather events. For example, increased use of air conditioning during heat events:
§ increases the temperature of the micro-climate around the building (thereby increasing exposure to high temperatures); and,
§ increases demand on the electricity source — possibly leading to a brownout or blackout and, consequently, a temporary loss of access to air conditioning.33
ASTHO Extreme Weather and Climate Readiness: Toolkit for State and Territorial Health Departments 11
Mold growth can also compromise indoor air quality after extreme weather events that are accompanied by flooding or extended utility disruptions. And, utility outages can lead to an additional environmental hazard: indoor exposure to carbon monoxide from combustion-fired generators.33 The changing climate will exacerbate the health effects of poor air quality in a variety of ways (Table 1-A). A growing body of evidence points to increased morbidity and mortality when high temperatures, increased pollen levels, and elevated outdoor air pollution levels coincide.17,34,35 Furthermore, allergy-inducing plants such as ragweed have been shown to increase in biomass and pollen production both when exposed to higher concentrations of air pollution and when exposed to higher ambient temperatures.36–41 Additionally, the frequency of wildfires, which increased dramatically in the Western U.S. during the last quarter of the 20th century,42 is projected to continue to increase in response to changing precipitation patterns and lengthened summers.43 Finally, climate change-related impacts to indoor air quality are estimated to result in $10 billion - $60 billion (discounted and adjusted) annually in productivity losses, health care costs, and premature mortality nationwide.44
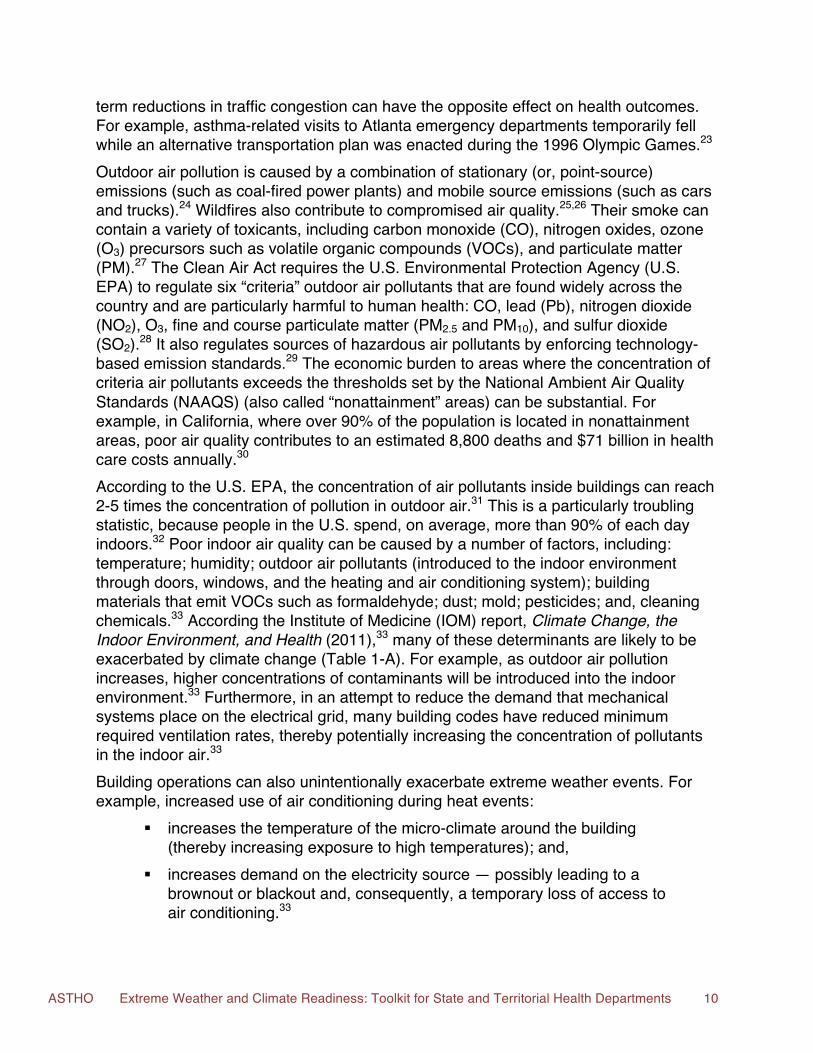
TABLE 1-A. EXAMPLES OF IMMEDIATE AND LONG-TERM EFFECTS OF EXTREME WEATHER AND CLIMATE CHANGE ON AIR QUALITY
Immediate Effects from Exposure to Extreme Weather Events
Long-term Effects of the Changing Climate
§ Multiple exposures (e.g., urban heat island, pollen, pollution) leading to more severe negative health outcomes among vulnerable populations.
§ Disruptions in utilities leading to temporary improvements or deterioration in outdoor air quality.
§ Building structure flooding leading to mold growth.
§ Exposure to carbon monoxide during power outages due to increased use of on-site generators.
§ Increased exposure in urban areas to climate-related environmental hazards due to impaired outdoor air quality.
§ Long-term exposure to increased outdoor air pollution leading to respiratory diseases and premature mortality.
§ Increased incidence of impaired indoor environmental quality due to modern buildings’ exclusive reliance on mechanical heating and air conditioning systems.
ASTHO Extreme Weather and Climate Readiness: Toolkit for State and Territorial Health Departments 12
SPOTLIGHT ON PRACTICE ACTIVITY 1: Climate Impacts
Tip for Finding Helpful Resources: Use your state or territory’s climate assessment and / or action plan to identify priority climate risks and their impact on air quality. If state- / territory-specific resources are not available, use the list of resources under "Step 1: Forecast Climate Impacts; Assess Vulnerabilities" in the Climate Readiness Assessment Resources section of this document.
1.a. What are the immediate and long-term effects of extreme weather and climate
change on air quality in your state or territory?
Step 1. Identify the top 1-3 climate risks to your state or territory. Step 2. Identify how these climate risks will impact outdoor air quality and indoor air quality. View the
narrative in this section of the toolkit and Table 1-A for examples of potential impacts.
Step 3. List the agency or department that addresses each air quality impact identified under Step 2. Step 4. List the existing programs designed to reduce the impacts identified under Step 2. Step 5. Based on your responses to Steps 1-4, place an asterisk next to the climate risk that would be most
appropriate to prioritize for the remainder of this assessment. (Note: If two or more climate risks are equally important to address simultaneously, simply repeat the remainder of activities in this assessment for the additional risks.)
Climate Risk 1:
Impacts Department / Agency Programs Outdoor Air
Quality
Indoor Air
Quality
Climate Risk 2:
Impacts Department / Agency Programs Outdoor Air
Quality
Indoor Air
Quality
ASTHO Extreme Weather and Climate Readiness: Toolkit for State and Territorial Health Departments 13
Climate Risk 3:
Impacts Department / Agency Programs Outdoor Air
Quality
Indoor Air
Quality
1.b. What are the potential negative health outcomes associated with the impacts of climate change on air quality?
Step 1. List the climate risk identified with an asterisk in Activity 1.a. Step 2. In the left-hand column of the table below, list three impacts associated with this climate risk
(as identified in Activity 1.a.).
Step 3. List the potential negative health outcomes associated with these impacts. Step 4. List the populations that are particularly vulnerable to these impacts. Step 5. List the existing public health tracking / surveillance programs, policies, and interventions designed to
reduce the negative health outcomes identified under Step 3.
Step 6. List the co-benefits of the public health programs to the air quality programs outlined in Activity 1.a. Climate Risk: Health
Effects Vulnerable Populations Programs Co-Benefits to Air Quality
Programs
Impact 1: Impact 2: Impact 3:
ASTHO Extreme Weather and Climate Readiness: Toolkit for State and Territorial Health Departments 14
Integrating Climate Planning into Existing Programs In order to effectively target the populations most at risk of negative health outcomes during extreme weather and climatic events, Extreme Heat, Asthma, Pollen, and Air Quality programs must coordinate closely with each other and with other associated state / territorial and local initiatives, such as: Healthy Homes programs, Emergency Preparedness programs, and programs addressing chronic cardiovascular and respiratory diseases. Primary prevention interventions in one area (such as air quality) should be designed to maximize co-benefits to health associated with related topics (such as heat and asthma) and minimize co-harms in an equitable manner. For example, Florida’s Energy and Climate Change Action Plan calls for incorporating projections of future public health risks associated with the interaction of background air pollution with heat waves.45 Maryland has directed the state health department and emergency management agency to coordinate air quality alert systems with preparedness planning. This effort includes: developing air quality vulnerability maps; researching the relationship between temperature, impervious surface, and air quality; and, prioritizing the installation of green infrastructure in highly vulnerable areas.46 A cross-disciplinary approach promises the dual benefits of increasing program cost effectiveness (by eliminating duplication of effort) and decreasing the risk of negative population health outcomes associated with simultaneous exposure to compromised air quality, extreme heat events, and allergens. In many jurisdictions, it may be possible to achieve these goals by making minor modifications to existing programs — rather than attempting to overhaul or combine programs.
EXAMPLES OF OPPORTUNITIES TO INTEGRATE CLIMATE READINESS INTO EXISTING PROGRAMS:
§ Combine historical data on the number of ozone action days and the location of counties that are most vulnerable to extreme heat events with downscaled climate models to target counties for combined air quality, heat island reduction, and allergen reduction interventions.
§ Locate cooling centers in areas with a high concentration of respiratory disease and vulnerability to heat.
§ Add climate ready public health communication messages to ozone action day, extreme heat, and high pollen count alerts.
§ Coordinate outdoor air quality, pollen count, and extreme heat tracking programs both to target the most vulnerable populations for assistance and to issue joint alerts to the general public.
§ Incorporate climate ready indoor air quality communications into educational materials for Healthy Homes, Weatherization, and Hazard Mitigation programs.
ASTHO Extreme Weather and Climate Readiness: Toolkit for State and Territorial Health Departments 15
SPOTLIGHT ON PRACTICE ACTIVITY 2: Integrating Climate Planning into Existing Programs
Tip for Finding Helpful Resources: Use your state or territory's climate assessment and / or action plan to identify priority climate risks and their impact on air quality. If state- / territory-specific resources are not available, use the list of resources under "Step 1: Forecast Climate Impacts; Assess Vulnerabilities" in the Climate Readiness Assessment Resources section of this document.
What opportunities are available to integrate climate readiness into public health
and air quality programs?
Step 1. List the climate risk identified with an asterisk in Activity 1.a. Step 2. List the three impacts associated with the climate risk that you expanded in Activity 1.b. Step 3. Reviewing your answers to Activities 1.a and 1.b, identify programs that, if coordinated, could
enhance your state or territory's ability to prepare for the effects of climate change on air quality.
Step 4. Identify ways in which these programs are currently coordinating with each other and opportunities for enhanced coordination in the future.
Step 5. Explain how a coordinated / integrated program would bring value to all partnering agencies and how it would enhance climate readiness.
Climate Risk:
Air Quality Program(s)
Public Health Program(s)
Other Program(s) (Lead agency)
Current Coordination / Integration
Opportunities
Benefits of Coordination / Integration
Impact 1: Impact 2: Impact 3:
ASTHO Extreme Weather and Climate Readiness: Toolkit for State and Territorial Health Departments 16
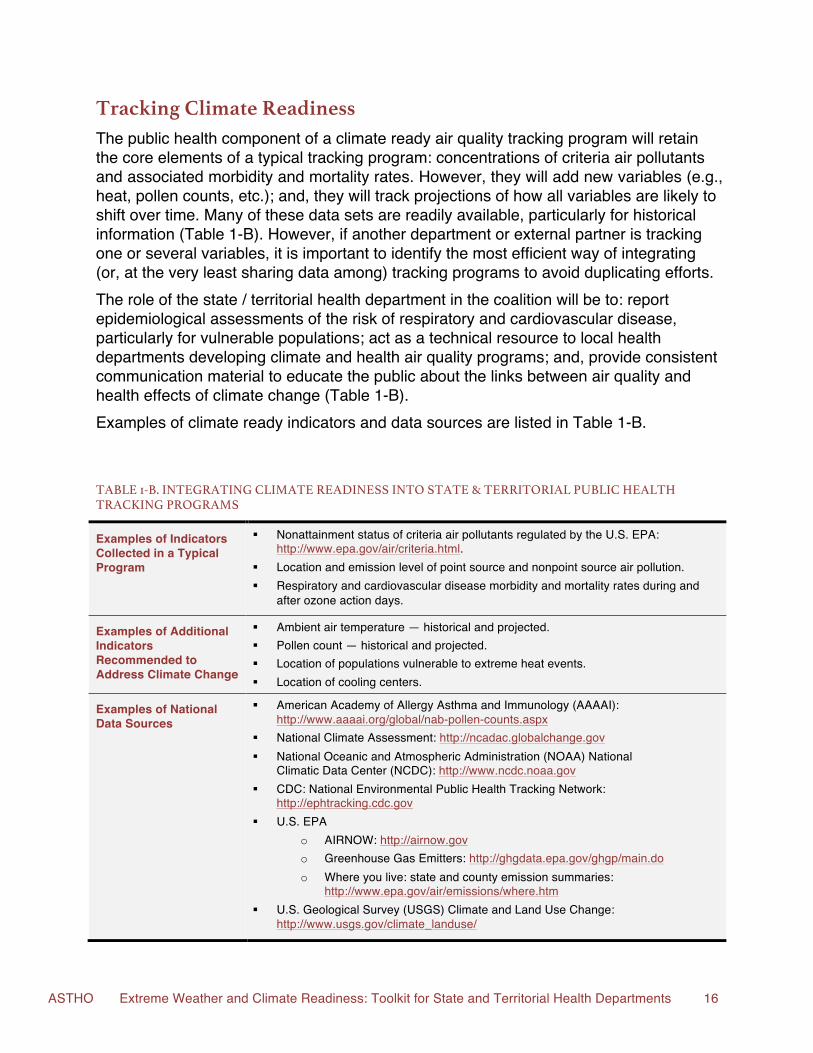
Tracking Climate Readiness The public health component of a climate ready air quality tracking program will retain the core elements of a typical tracking program: concentrations of criteria air pollutants and associated morbidity and mortality rates. However, they will add new variables (e.g., heat, pollen counts, etc.); and, they will track projections of how all variables are likely to shift over time. Many of these data sets are readily available, particularly for historical information (Table 1-B). However, if another department or external partner is tracking one or several variables, it is important to identify the most efficient way of integrating (or, at the very least sharing data among) tracking programs to avoid duplicating efforts. The role of the state / territorial health department in the coalition will be to: report epidemiological assessments of the risk of respiratory and cardiovascular disease, particularly for vulnerable populations; act as a technical resource to local health departments developing climate and health air quality programs; and, provide consistent communication material to educate the public about the links between air quality and health effects of climate change (Table 1-B). Examples of climate ready indicators and data sources are listed in Table 1-B.
TABLE 1-B. INTEGRATING CLIMATE READINESS INTO STATE & TERRITORIAL PUBLIC HEALTH TRACKING PROGRAMS
Examples of Indicators Collected in a Typical Program
§ Nonattainment status of criteria air pollutants regulated by the U.S. EPA: http://www.epa.gov/air/criteria.html.
§ Location and emission level of point source and nonpoint source air pollution. § Respiratory and cardiovascular disease morbidity and mortality rates during and
after ozone action days.
Examples of Additional Indicators Recommended to Address Climate Change
§ Ambient air temperature — historical and projected. § Pollen count — historical and projected. § Location of populations vulnerable to extreme heat events. § Location of cooling centers.
Examples of National Data Sources
§ American Academy of Allergy Asthma and Immunology (AAAAI): http://www.aaaai.org/global/nab-pollen-counts.aspx
§ National Climate Assessment: http://ncadac.globalchange.gov § National Oceanic and Atmospheric Administration (NOAA) National
Climatic Data Center (NCDC): http://www.ncdc.noaa.gov § CDC: National Environmental Public Health Tracking Network:
http://ephtracking.cdc.gov § U.S. EPA
o AIRNOW: http://airnow.gov o Greenhouse Gas Emitters: http://ghgdata.epa.gov/ghgp/main.do o Where you live: state and county emission summaries:
http://www.epa.gov/air/emissions/where.htm § U.S. Geological Survey (USGS) Climate and Land Use Change:
http://www.usgs.gov/climate_landuse/
ASTHO Extreme Weather and Climate Readiness: Toolkit for State and Territorial Health Departments 17
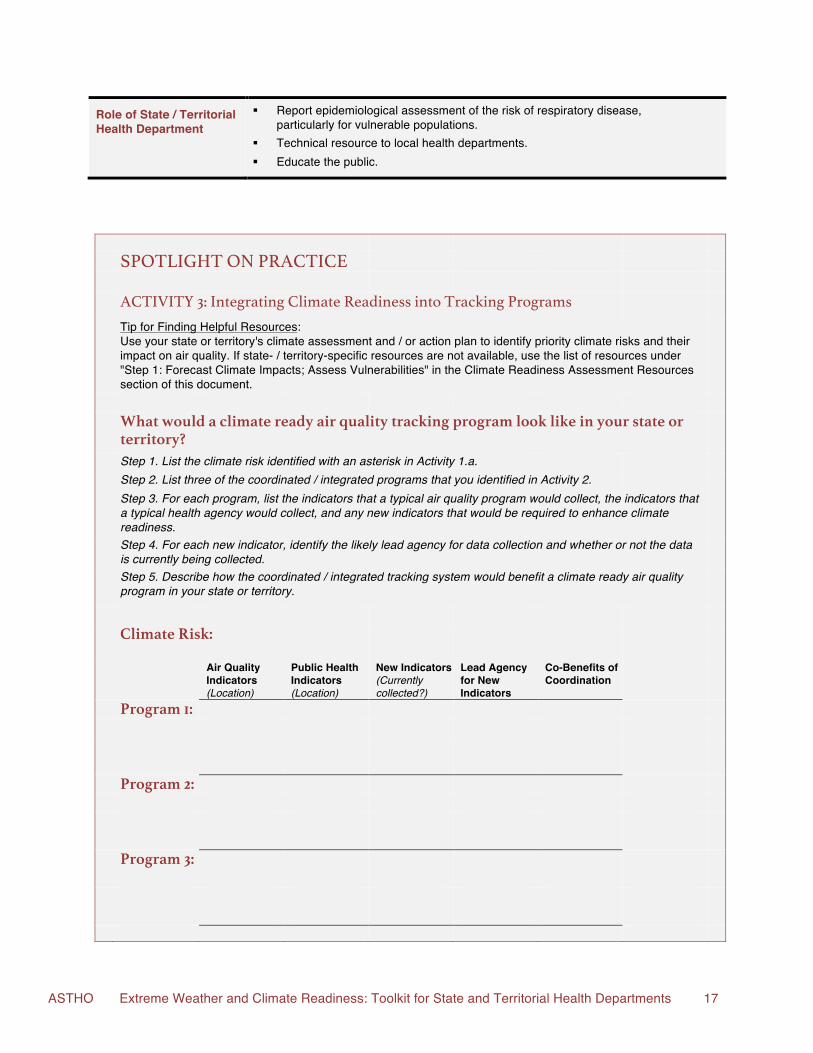
Role of State / Territorial Health Department
§ Report epidemiological assessment of the risk of respiratory disease, particularly for vulnerable populations.
§ Technical resource to local health departments. § Educate the public.
SPOTLIGHT ON PRACTICE ACTIVITY 3: Integrating Climate Readiness into Tracking Programs
Tip for Finding Helpful Resources: Use your state or territory's climate assessment and / or action plan to identify priority climate risks and their impact on air quality. If state- / territory-specific resources are not available, use the list of resources under "Step 1: Forecast Climate Impacts; Assess Vulnerabilities" in the Climate Readiness Assessment Resources section of this document.
What would a climate ready air quality tracking program look like in your state or
territory?
Step 1. List the climate risk identified with an asterisk in Activity 1.a. Step 2. List three of the coordinated / integrated programs that you identified in Activity 2. Step 3. For each program, list the indicators that a typical air quality program would collect, the indicators that
a typical health agency would collect, and any new indicators that would be required to enhance climate readiness.
Step 4. For each new indicator, identify the likely lead agency for data collection and whether or not the data is currently being collected.
Step 5. Describe how the coordinated / integrated tracking system would benefit a climate ready air quality program in your state or territory.
Climate Risk:
Air Quality Indicators (Location)
Public Health Indicators (Location)
New Indicators (Currently collected?)
Lead Agency for New Indicators
Co-Benefits of Coordination
Program 1: Program 2: Program 3:
ASTHO Extreme Weather and Climate Readiness: Toolkit for State and Territorial Health Departments 18
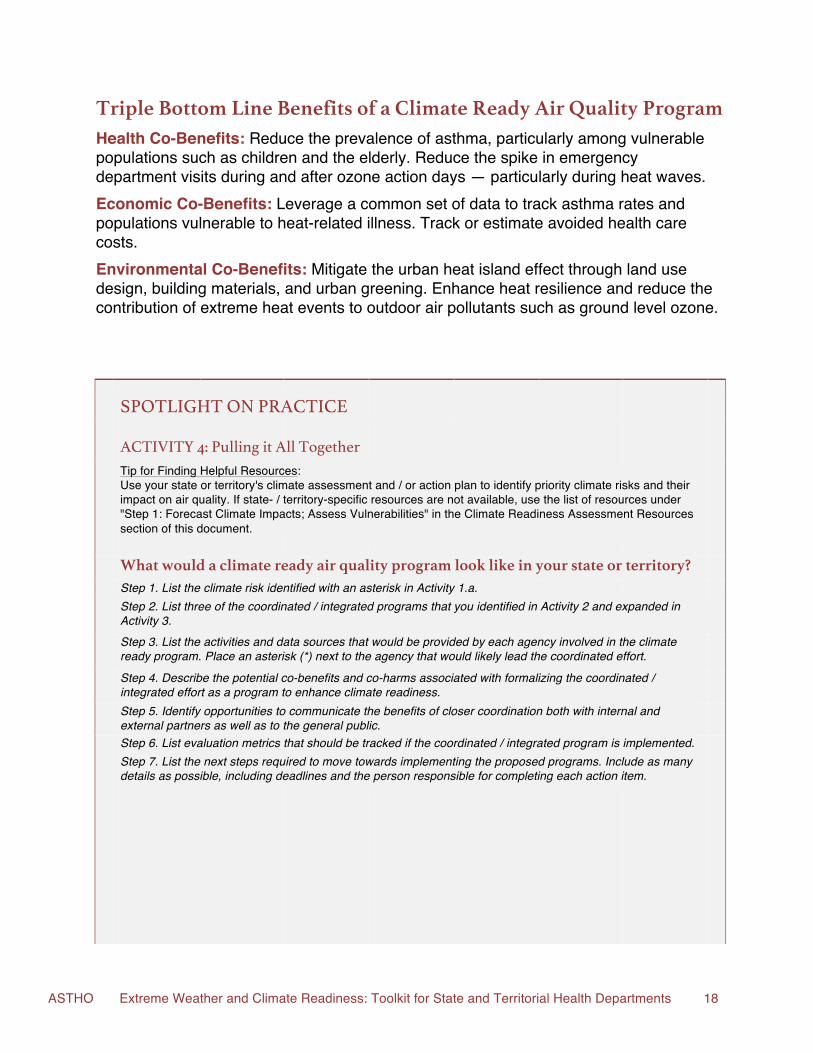
Triple Bottom Line Benefits of a Climate Ready Air Quality Program Health Co-Benefits: Reduce the prevalence of asthma, particularly among vulnerable populations such as children and the elderly. Reduce the spike in emergency department visits during and after ozone action days — particularly during heat waves. Economic Co-Benefits: Leverage a common set of data to track asthma rates and populations vulnerable to heat-related illness. Track or estimate avoided health care costs. Environmental Co-Benefits: Mitigate the urban heat island effect through land use design, building materials, and urban greening. Enhance heat resilience and reduce the contribution of extreme heat events to outdoor air pollutants such as ground level ozone. SPOTLIGHT ON PRACTICE ACTIVITY 4: Pulling it All Together
Tip for Finding Helpful Resources: Use your state or territory's climate assessment and / or action plan to identify priority climate risks and their impact on air quality. If state- / territory-specific resources are not available, use the list of resources under "Step 1: Forecast Climate Impacts; Assess Vulnerabilities" in the Climate Readiness Assessment Resources section of this document.
What would a climate ready air quality program look like in your state or territory?
Step 1. List the climate risk identified with an asterisk in Activity 1.a. Step 2. List three of the coordinated / integrated programs that you identified in Activity 2 and expanded in
Activity 3.
Step 3. List the activities and data sources that would be provided by each agency involved in the climate ready program. Place an asterisk (*) next to the agency that would likely lead the coordinated effort.
Step 4. Describe the potential co-benefits and co-harms associated with formalizing the coordinated / integrated effort as a program to enhance climate readiness.
Step 5. Identify opportunities to communicate the benefits of closer coordination both with internal and external partners as well as to the general public.
Step 6. List evaluation metrics that should be tracked if the coordinated / integrated program is implemented. Step 7. List the next steps required to move towards implementing the proposed programs. Include as many
details as possible, including deadlines and the person responsible for completing each action item.
ASTHO Extreme Weather and Climate Readiness: Toolkit for State and Territorial Health Departments 19
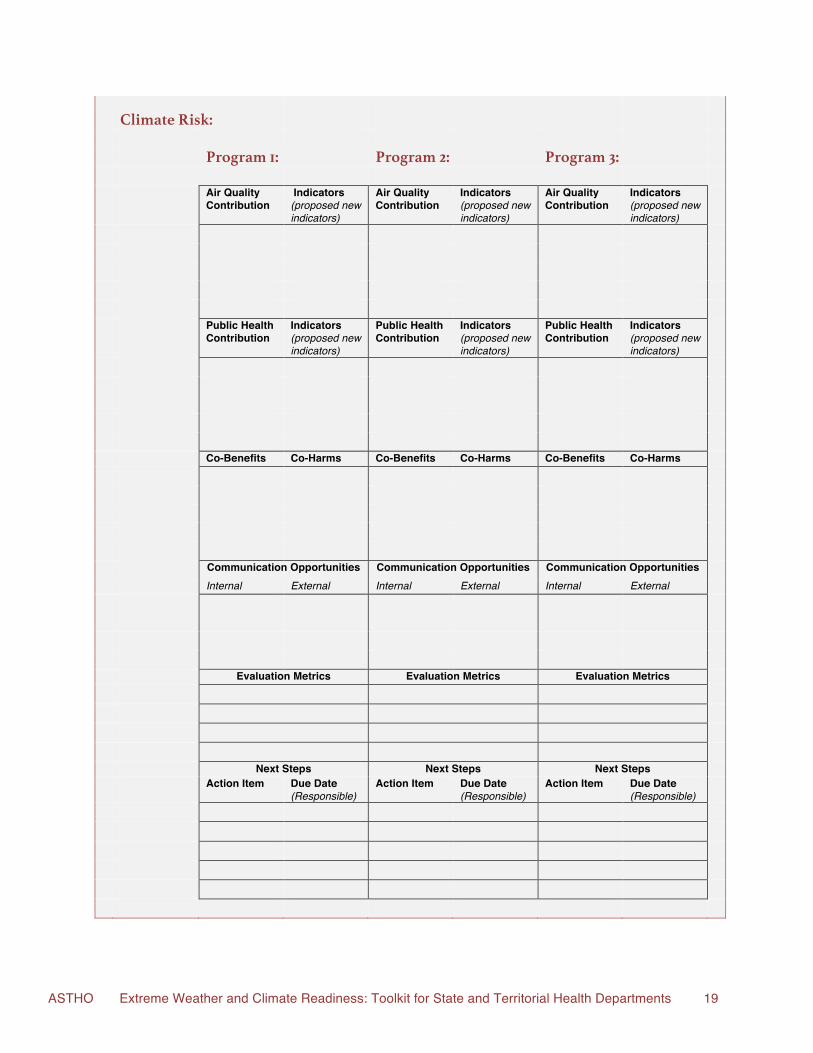
Climate Risk: Program 1: Program 2: Program 3: Air Quality
Contribution Indicators (proposed new indicators)
Air Quality Contribution
Indicators (proposed new indicators)
Air Quality Contribution
Indicators (proposed new indicators)
Public Health
Contribution Indicators (proposed new indicators)
Public Health Contribution
Indicators (proposed new indicators)
Public Health Contribution
Indicators (proposed new indicators)
Co-Benefits Co-Harms Co-Benefits Co-Harms Co-Benefits Co-Harms Communication Opportunities Communication Opportunities Communication Opportunities Internal External Internal External Internal External Evaluation Metrics Evaluation Metrics Evaluation Metrics Next Steps Next Steps Next Steps Action Item Due Date
(Responsible) Action Item Due Date
(Responsible) Action Item Due Date
(Responsible)
ASTHO Extreme Weather and Climate Readiness: Toolkit for State and Territorial Health Departments 20
2. Water Safety
Effects of Extreme Weather and Climate Change Tens of thousands of cases of waterborne disease are reported each year in the U.S.,47 with the actual incidence of disease estimated to be much higher.48 A recent study of large health care claims and hospital discharge data attributed more than 40,000 hospitalizations at a total cost of $970 million per year to five primarily waterborne diseases: giardiasis, cryptosporidiosis, Legionnaires’ disease, otitis externa, and non-tuberculous mycobacterial infection.49 Population exposure to waterborne pathogens can occur through a number of pathways, including: contaminated drinking water, combined sewer overflow (CSO) events, and wastewater discharge from facilities that either lose power or are flooded.50,51 Outbreaks are of particular concern during and after extreme weather events, with over 50% of waterborne disease outbreaks
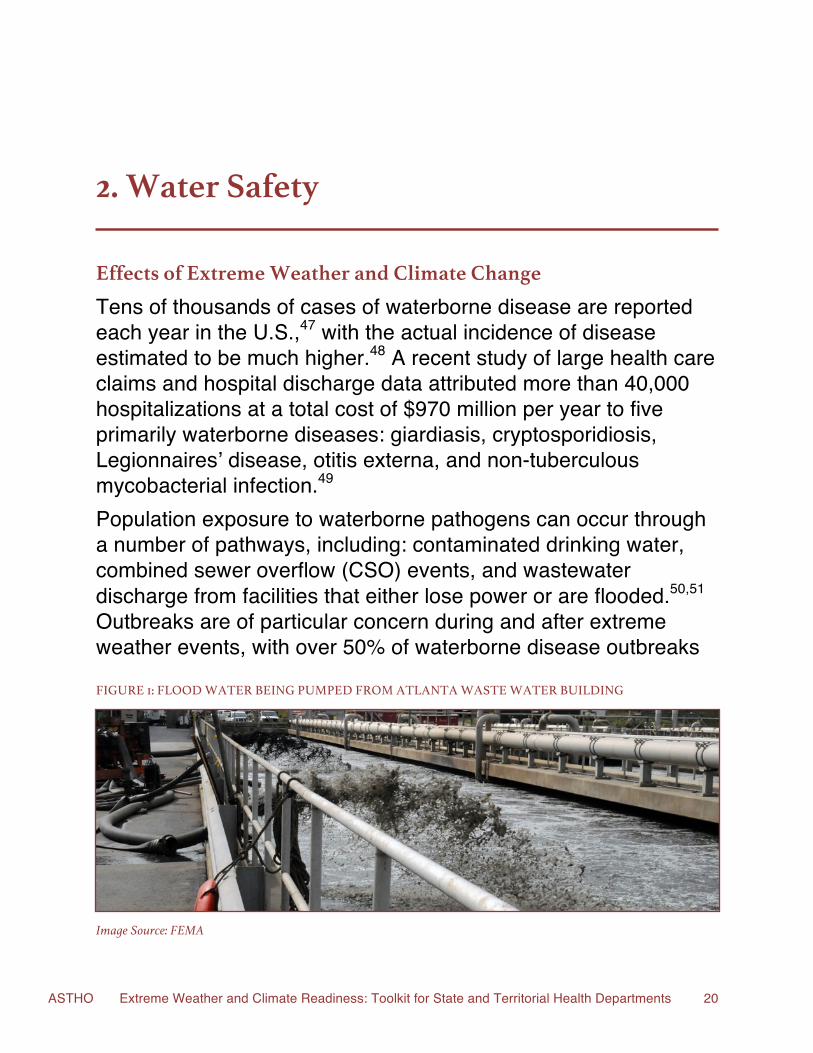
FIGURE 1: FLOOD WATER BEING PUMPED FROM ATLANTA WASTE WATER BUILDING
Image Source: FEMA
ASTHO Extreme Weather and Climate Readiness: Toolkit for State and Territorial Health Departments 21
recorded in the U.S. from 1948 to 1994 occurring immediately after heavy precipitation events.52 At the other end of the spectrum, water scarcity caused by droughts can result in increased concentrations of contaminants in both drinking and recreational water sources.53 In coastal regions, draw down of ground water can result in increased risk of salt water intrusion contaminating the groundwater supply.43 These contaminants can then pollute stormwater runoff if a drought is immediately followed by a flooding event.53 Exposure to contaminated recreational water can also lead to outbreaks of waterborne disease. According to the U.S. Centers for Disease Control and Prevention (CDC), 134 outbreaks associated with exposure to recreational water were reported in 2007-2008, resulting in close to 14,000 cases.47 As water temperatures have risen over the past 80 years due to climate change, one of the most significant threats to safe recreational water — harmful algal blooms (HABs) — have increased in frequency, duration, and geographic range.54 Human exposure to HABs — which release nerve and liver toxins into marine and freshwater environments — can occur through drinking water contamination, recreational water exposure, consumption of contaminated shellfish, and exposure to aerosolized HAB toxins.55 In some areas, tracking water safety concerns such as HABs has already shifted from a rare event to a routine public health service. For example, HABs have been added to the list of reportable environmental events in several states, including Iowa and Kansas. And, the U.S. National Oceanic and Atmospheric Administration (NOAA) manages a HAB Operational Forecast System for the Gulf of Mexico. Compromised recreational water quality represents a significant economic burden nationally. From 1987-1993, medical costs associated with HABs alone averaged $22 million per year and annual costs to commercial fisheries averaged more than $18 million.56 Compromised water quality in Lake Michigan has been estimated to cost up to $37,030 per day in lost tourism dollars at a single beach.57 On the other hand, a 20% reduction in fecal content in the Great Lakes is predicted to boost waterfront residential property value by $1 billion in aggregate (net present value).58 Maintaining safe drinking and recreational water supplies is a public health priority that is particularly sensitive to climatic variability and change. Water safety programs have already been strained due to the disruptions to centralized water and wastewater plants associated with increasingly frequent and severe extreme weather events (Table 2-A). And, these challenges are projected to continue as the climate changes. A 1992 U.S. Environmental Protection Agency (U.S. EPA) study estimated that the national cost of addressing water quality impairment caused by climate change would fall in the range of $15 billion to $60 billion — exceeding the cost of addressing the nation’s challenges in meeting its water quantity needs.59 Municipalities with combined sanitary and storm sewer systems or aging water infrastructure are particularly vulnerable to waterborne disease outbreaks caused by CSOs during flooding events. For example, the levels of Escherichia coli (an indicator of fecal matter) in the water discharged into Lake Michigan from downtown Milwaukee, WI, has been observed to reach 10 times the limit set by the U.S. EPA after heavy precipitation events.51 In 2008, the U.S. EPA estimated that it would cost the state $412
ASTHO Extreme Weather and Climate Readiness: Toolkit for State and Territorial Health Departments 22
million to eliminate CSOs altogether and an additional $2.9 billion to repair and replace broken pipes.60 Sea level rise is placing coastal communities at increasing risk of permanent damage to water and wastewater infrastructure (Table 2-A). As far back as the 1980’s, the Massachusetts Water Resources Authority (MWRA) used the most current climate models available to determine the elevation above sea level for construction of the Deer Island Wastewater Treatment Plant in Boston, MA. Based on this evaluation, the entire plant was raised 1.9 feet above the initial design elevation to allow it to accommodate rising sea levels over its 50 - 60 year designed service life.61 Installations like the Deer Island Wastewater Treatment Plant may eventually be forced to relocate entirely to avoid the ongoing expense of protecting water and wastewater infrastructure from coastal storms, erosion, and sea level rise. These upgrades will place a heavy economic burden on utilities and their clients. A 2009 report by the National Association of Clean Water Agencies and the Association of Metropolitan Water Agencies estimated that adapting the nation’s water and wastewater infrastructure to the likely effects of climate change by 2050 will cost a total of $448 billion to $944 billion.62 These challenges will increase in the future, as the changing climate results in warmer annual temperatures and shifting precipitation patterns (Table 2-A). As fresh water becomes more difficult to access from traditional sources, water safety programs will act as key stakeholders in the design and implementation of new water safety regulations and inspection protocols.
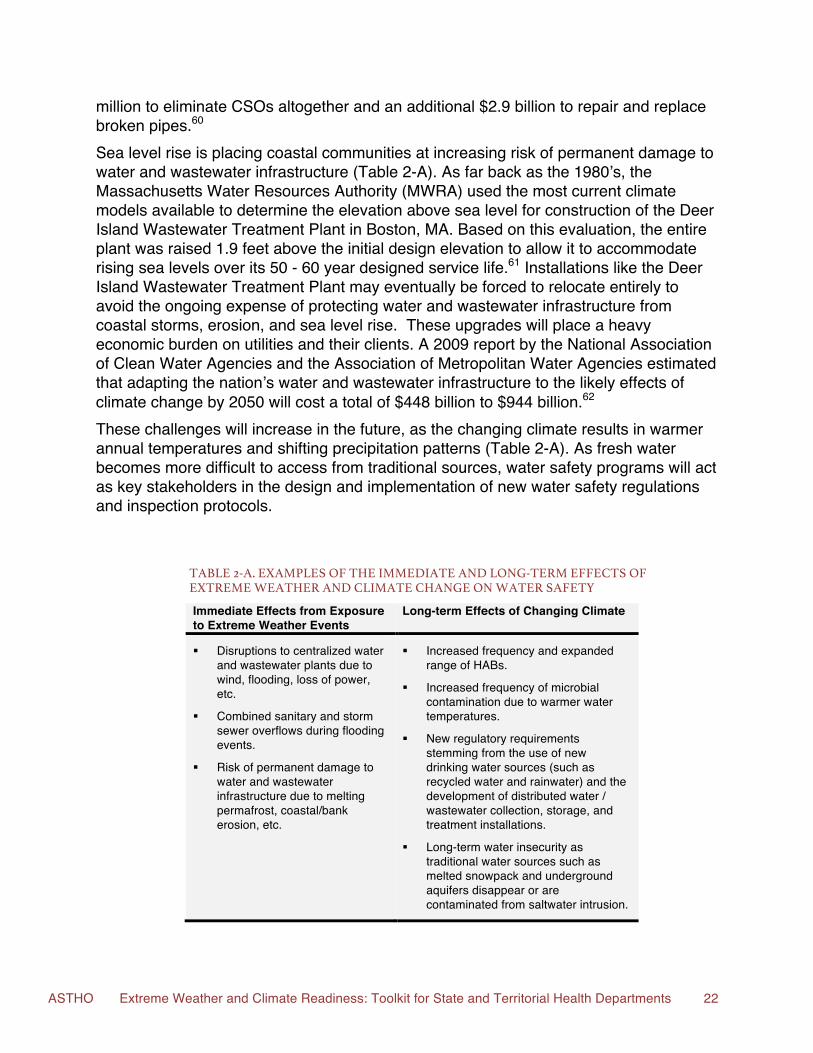
TABLE 2-A. EXAMPLES OF THE IMMEDIATE AND LONG-TERM EFFECTS OF EXTREME WEATHER AND CLIMATE CHANGE ON WATER SAFETY
Immediate Effects from Exposure to Extreme Weather Events
Long-term Effects of Changing Climate
§ Disruptions to centralized water and wastewater plants due to wind, flooding, loss of power, etc.
§ Combined sanitary and storm sewer overflows during flooding events.
§ Risk of permanent damage to water and wastewater infrastructure due to melting permafrost, coastal/bank erosion, etc.
§ Increased frequency and expanded range of HABs.
§ Increased frequency of microbial contamination due to warmer water temperatures.
§ New regulatory requirements stemming from the use of new drinking water sources (such as recycled water and rainwater) and the development of distributed water / wastewater collection, storage, and treatment installations.
§ Long-term water insecurity as traditional water sources such as melted snowpack and underground aquifers disappear or are contaminated from saltwater intrusion.
ASTHO Extreme Weather and Climate Readiness: Toolkit for State and Territorial Health Departments 23
SPOTLIGHT ON PRACTICE ACTIVITY 1: Climate Impacts
Tip for Finding Helpful Resources: Use your state or territory's climate assessment and / or action plan to identify priority climate risks and their impact on water safety. If state- / territory-specific resources are not available, use the list of resources under "Step 1: Forecast Climate Impacts; Assess Vulnerabilities" in the Climate Readiness Assessment Resources section of this document.
1.a. What are the immediate and long-term effects of extreme weather and climate
change on water safety in your state or territory?
Step 1. Identify the top 1-3 climate risks to your state or territory. Step 2. Identify how these climate risks will impact water safety. View the narrative in this section of the
toolkit and Table 2-A for examples of potential impacts.
Step 3. List the agency or department that addresses each water safety impact identified under Step 2. Step 4. List the existing programs designed to reduce the impacts identified under Step 2. Step 5. Based on your responses to Steps 1-4, place an asterisk next to the climate risk that would be most
appropriate to prioritize for the remainder of this assessment. (Note: If two or more climate risks are equally important to address simultaneously, simply repeat the remainder of activities in this assessment for the additional risks.)
Climate Risk 1:
Impacts Department / Agency Programs
Climate Risk 2:
Impacts Department / Agency Programs
ASTHO Extreme Weather and Climate Readiness: Toolkit for State and Territorial Health Departments 24
Climate Risk 3:
Impacts Department / Agency Programs
1.b. What are the potential negative health outcomes associated with the impacts of climate change on water safety?
Step 1. List the climate risk identified with an asterisk in Activity 1.a. Step 2. In the left-hand column of the table below, list three impacts associated with this climate risk
(as identified in Activity 1.a.).
Step 3. List the potential negative health outcomes associated with these impacts. Step 4. List the populations that are particularly vulnerable to these impacts. Step 5. List the existing public health tracking / surveillance programs, policies, and interventions designed
to reduce the negative health outcomes identified under Step 3.
Step 6. List the co-benefits of the public health programs to the water safety programs outlined in Activity 1.a. Climate Risk: Health Effects Vulnerable Populations Programs Co-Benefits to
Water Safety Programs
Impact 1: Impact 2: Impact 3:
ASTHO Extreme Weather and Climate Readiness: Toolkit for State and Territorial Health Departments 25
Integrating Climate Planning into Existing Programs Climate ready state and territorial water safety programs must prepare both for an intensification of familiar challenges and for outbreaks of unfamiliar pathogens. For example, the unprecedented outbreak of Cryptococcus gattii on Vancouver Island in 1999 resulted in over 100 cases of human illness.63 The successful colonization in the waters off of Washington State and British Columbia of this fungus, which previously had been observed only in tropical and subtropical climates, may be associated with the trend in the Pacific Northwest of increasingly warm and dry summers.63 However, if public health agencies are sufficiently prepared for the threats posed by climate change, even these new environmental hazards can be folded into existing water safety programs. Climate readiness can also be integrated into infrastructure projects aimed at modernizing the nation’s water and wastewater system, which is due for repair in many states and territories. According to the 2011 Drinking Water Infrastructure Needs Survey and Assessment carried out by the U.S. EPA, a $384.2 billion investment will be required by 2030 to ensure that public water systems in the U.S. are capable of continuing to provide safe drinking water to their customers.64 The survey identified 164 climate readiness projects from 44 responding water systems (representing fewer than 1.5% of respondents). Over half of the identified projects were reported by water systems in a single state: North Carolina.64 For example, the vulnerability assessment of coastal resources and structures in North Carolina’s interagency climate readiness plan highlights the use of the U.S. EPA’s Climate Resilience Awareness and Assessment Tool (CREAT) to evaluate climate risks to local water and wastewater infrastructure in the state. Furthermore, the North Carolina Coastal Resources Commission is in the process of developing a policy to address the negative impacts of sea level rise to the state.65 Massachusetts is also encouraging an integrated approach to enhancing the climate readiness of its water and wastewater infrastructure. The commonwealth is awarding low-interest loans to fund water infrastructure improvement projects that incorporate efficiency strategies and on-site renewable energy installations. In some municipalities, where up to 30% of current electricity demand is attributable to centralized water treatment processes, the new facilities will significantly reduce demand on the grid. On-site renewable energy generation offers the added benefit of increased water security by potentially allowing portions of the facilities to continue operating when the central electrical grid is down. The program was designed to enhance equity by forgiving a portion of the loan principal for 39 projects located in Environmental Justice communities.66
EXAMPLES OF OPPORTUNITIES TO INTEGRATE CLIMATE READINESS INTO EXISTING PROGRAMS:
§ Separating sanitary and storm sewer systems and/or increasing the percentage of developed land protected from flooding using low impact stormwater control measures such as: vegetated roofs, bioswales, and rain gardens.
§ Encouraging water conservation at all scales of use.
ASTHO Extreme Weather and Climate Readiness: Toolkit for State and Territorial Health Departments 26
§ Modernizing water and wastewater regulations to encourage landowners and larger developments (such as neighborhood associations) to capture, store, and reuse on-site water sources, such as: rainwater, grey water, and black water.
§ Incorporating on-site water treatment, storage, and wastewater purification into the design of emergency shelters.
§ Reducing community water and wastewater systems’ reliance on the central electricity grid by investing in more energy efficient water purification and supply systems and on-site or local renewable power sources.
SPOTLIGHT ON PRACTICE ACTIVITY 2: Integrating Climate Planning into Existing Programs
Tip for Finding Helpful Resources: Use your state or territory's climate assessment and / or action plan to identify priority climate risks and their impact on water safety. If state- / territory-specific resources are not available, use the list of resources under "Step 1: Forecast Climate Impacts; Assess Vulnerabilities" in the Climate Readiness Assessment Resources section of this document.
What opportunities are available to integrate climate readiness into public health
and water safety programs?
Step 1. List the climate risk identified with an asterisk in Activity 1.a. Step 2. List the three impacts associated with the climate risk that you expanded in Activity 1.b. Step 3. Reviewing your answers to Activities 1.a and 1.b, identify programs that, if coordinated, could
enhance your state or territory's ability to prepare for the effects of climate change on water safety.
Step 4. Identify ways in which these programs are currently coordinating with each other and opportunities for enhanced coordination in the future.
Step 5. Explain how a coordinated / integrated program would bring value to all partnering agencies and how it would enhance climate readiness.
Climate Risk:
Water Safety Program(s)
Public Health Program(s)
Other Program(s) (Lead agency)
Current Coordination/ Integration
Opportunities
Benefits of Coordination/ Integration
Impact 1: Impact 2: Impact 3:
ASTHO Extreme Weather and Climate Readiness: Toolkit for State and Territorial Health Departments 27
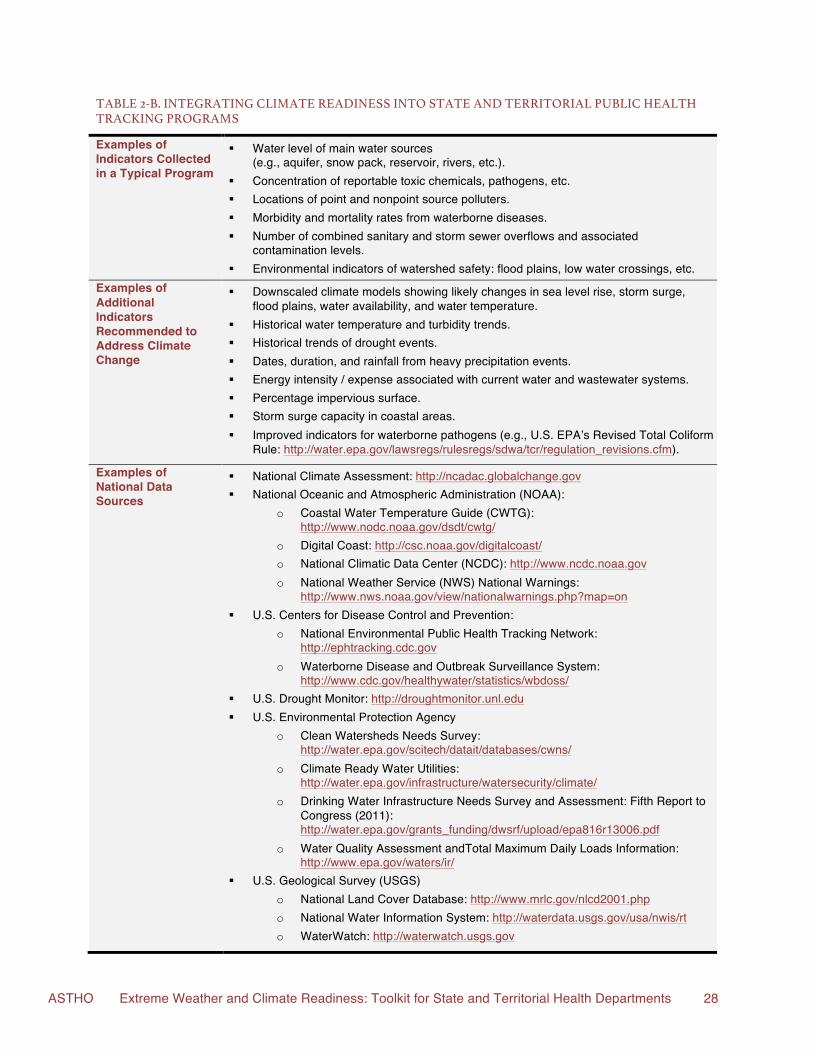
Tracking Climate Readiness Water safety programs vary widely from state to state and county to county. In some cases, they are located entirely outside of the health department. In other cases, they are a division of the health department or shared among several agencies. As a result, data sources may be housed in a variety of locations, some internal and some external to the health department. Typical data collected for water safety tracking include: water levels in aquifers or surface water sources (or snow pack levels in states that rely on mountain sources), concentration of reportable impurities (particularly downstream of known point and nonpoint source polluters), morbidity and mortality rates from waterborne diseases, drought levels, pollution caused by CSOs, and environmental indicators of watershed safety (Table 2-B). To establish a more complete picture of the environmental context within which the state / territory’s current water system operates, a climate ready water safety tracking program will add indicators such as: historical water temperature and turbidity, heavy precipitation events, and storm surge capacity. After establishing a baseline of current conditions, a downscaled climate model should be overlaid onto the historical data, so that planners can assess scenarios of likely future trends (Table 2-B). For example, coastal cities must plan for sea level rise, more intense storm surges, and saltwater infiltration into coastal wells and aquifers.43 The energy intensity and expense associated with current water and wastewater systems will play an important role in risk assessments and cost-benefit analyses of the most effective ways to build climate resilience into existing systems. Finally, new indicators must be developed to better track existing and emerging water safety concerns (Table 2-B). For example, the Revised Total Coliform Rule, which goes into effect in 2016, tightens the focus of water quality tests performed by Public Water Systems (PWS) from total coliform bacteria counts to only E. coli bacteria counts; because, high E. coli counts indicate a definite threat to public health, whereas many other coliform bacteria are harmless.67 The role of the state / territorial health department in the coalition will be to: report epidemiological assessments of the risk of waterborne disease, particularly for vulnerable populations; act as a technical resource to local health departments developing climate and health water quality programs; and, provide consistent communication material to educate the public about the links between water and health effects of climate change (Table 2-B). Examples of climate ready indicators and data sources are listed in Table 2-B.
ASTHO Extreme Weather and Climate Readiness: Toolkit for State and Territorial Health Departments 28
TABLE 2-B. INTEGRATING CLIMATE READINESS INTO STATE AND TERRITORIAL PUBLIC HEALTH TRACKING PROGRAMS
Examples of Indicators Collected in a Typical Program
§ Water level of main water sources (e.g., aquifer, snow pack, reservoir, rivers, etc.).
§ Concentration of reportable toxic chemicals, pathogens, etc. § Locations of point and nonpoint source polluters. § Morbidity and mortality rates from waterborne diseases. § Number of combined sanitary and storm sewer overflows and associated
contamination levels. § Environmental indicators of watershed safety: flood plains, low water crossings, etc.
Examples of Additional Indicators Recommended to Address Climate Change
§ Downscaled climate models showing likely changes in sea level rise, storm surge, flood plains, water availability, and water temperature.
§ Historical water temperature and turbidity trends. § Historical trends of drought events. § Dates, duration, and rainfall from heavy precipitation events. § Energy intensity / expense associated with current water and wastewater systems. § Percentage impervious surface. § Storm surge capacity in coastal areas. § Improved indicators for waterborne pathogens (e.g., U.S. EPA’s Revised Total Coliform
Rule: http://water.epa.gov/lawsregs/rulesregs/sdwa/tcr/regulation_revisions.cfm).
Examples of National Data Sources
§ National Climate Assessment: http://ncadac.globalchange.gov § National Oceanic and Atmospheric Administration (NOAA):
o Coastal Water Temperature Guide (CWTG): http://www.nodc.noaa.gov/dsdt/cwtg/
o Digital Coast: http://csc.noaa.gov/digitalcoast/ o National Climatic Data Center (NCDC): http://www.ncdc.noaa.gov o National Weather Service (NWS) National Warnings:
http://www.nws.noaa.gov/view/nationalwarnings.php?map=on § U.S. Centers for Disease Control and Prevention:
o National Environmental Public Health Tracking Network: http://ephtracking.cdc.gov
o Waterborne Disease and Outbreak Surveillance System: http://www.cdc.gov/healthywater/statistics/wbdoss/
§ U.S. Drought Monitor: http://droughtmonitor.unl.edu § U.S. Environmental Protection Agency
o Clean Watersheds Needs Survey: http://water.epa.gov/scitech/datait/databases/cwns/
o Climate Ready Water Utilities: http://water.epa.gov/infrastructure/watersecurity/climate/
o Drinking Water Infrastructure Needs Survey and Assessment: Fifth Report to Congress (2011): http://water.epa.gov/grants_funding/dwsrf/upload/epa816r13006.pdf
o Water Quality Assessment and Total Maximum Daily Loads Information: http://www.epa.gov/waters/ir/
§ U.S. Geological Survey (USGS) o National Land Cover Database: http://www.mrlc.gov/nlcd2001.php o National Water Information System: http://waterdata.usgs.gov/usa/nwis/rt o WaterWatch: http://waterwatch.usgs.gov
ASTHO Extreme Weather and Climate Readiness: Toolkit for State and Territorial Health Departments 29
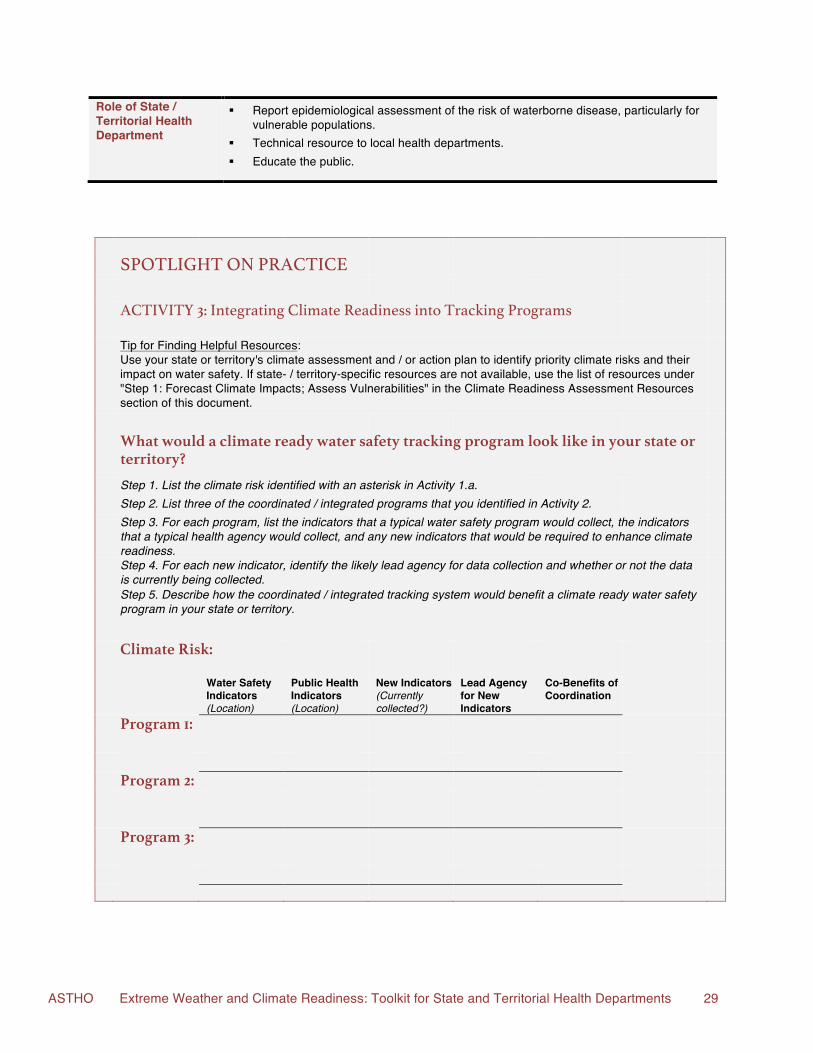
Role of State / Territorial Health Department
§ Report epidemiological assessment of the risk of waterborne disease, particularly for vulnerable populations.
§ Technical resource to local health departments. § Educate the public.
SPOTLIGHT ON PRACTICE
ACTIVITY 3: Integrating Climate Readiness into Tracking Programs
Tip for Finding Helpful Resources: Use your state or territory's climate assessment and / or action plan to identify priority climate risks and their impact on water safety. If state- / territory-specific resources are not available, use the list of resources under "Step 1: Forecast Climate Impacts; Assess Vulnerabilities" in the Climate Readiness Assessment Resources section of this document.
What would a climate ready water safety tracking program look like in your state or
territory?
Step 1. List the climate risk identified with an asterisk in Activity 1.a. Step 2. List three of the coordinated / integrated programs that you identified in Activity 2. Step 3. For each program, list the indicators that a typical water safety program would collect, the indicators
that a typical health agency would collect, and any new indicators that would be required to enhance climate readiness.
Step 4. For each new indicator, identify the likely lead agency for data collection and whether or not the data is currently being collected.
Step 5. Describe how the coordinated / integrated tracking system would benefit a climate ready water safety program in your state or territory.
Climate Risk:
Water Safety Indicators (Location)
Public Health Indicators (Location)
New Indicators (Currently collected?)
Lead Agency for New Indicators
Co-Benefits of Coordination
Program 1: Program 2: Program 3:
ASTHO Extreme Weather and Climate Readiness: Toolkit for State and Territorial Health Departments 30
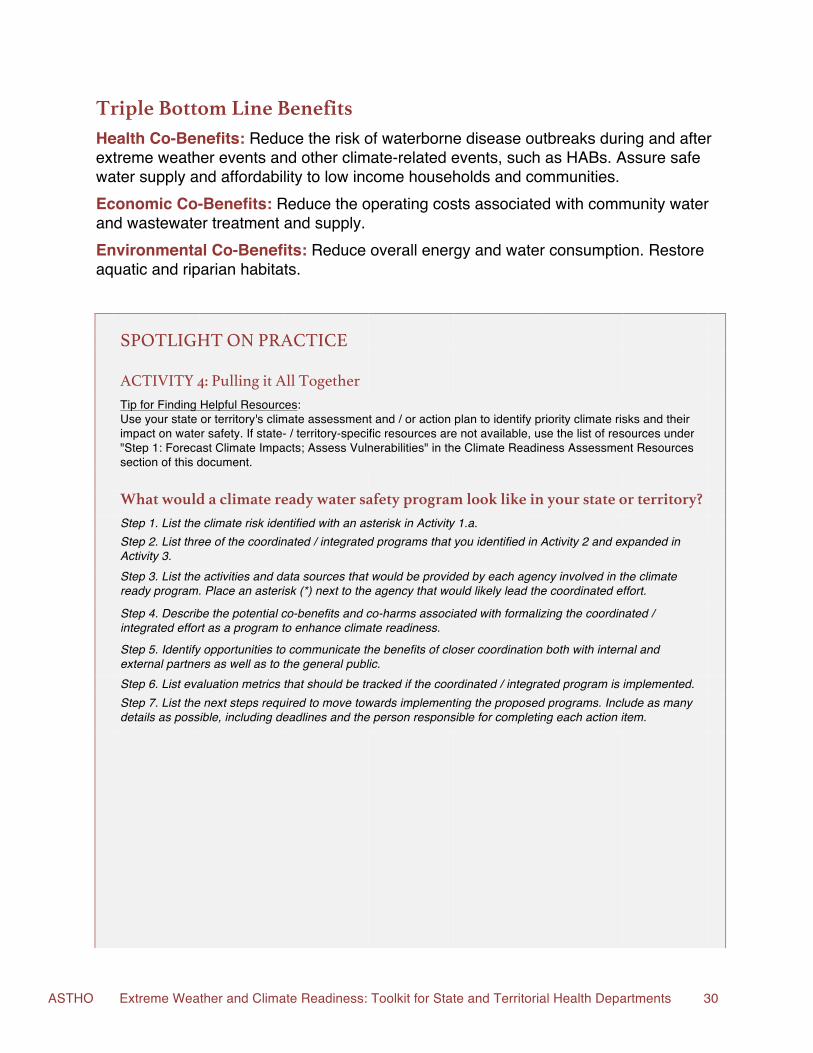
Triple Bottom Line Benefits Health Co-Benefits: Reduce the risk of waterborne disease outbreaks during and after extreme weather events and other climate-related events, such as HABs. Assure safe water supply and affordability to low income households and communities. Economic Co-Benefits: Reduce the operating costs associated with community water and wastewater treatment and supply. Environmental Co-Benefits: Reduce overall energy and water consumption. Restore aquatic and riparian habitats. SPOTLIGHT ON PRACTICE ACTIVITY 4: Pulling it All Together
Tip for Finding Helpful Resources: Use your state or territory's climate assessment and / or action plan to identify priority climate risks and their impact on water safety. If state- / territory-specific resources are not available, use the list of resources under "Step 1: Forecast Climate Impacts; Assess Vulnerabilities" in the Climate Readiness Assessment Resources section of this document.
What would a climate ready water safety program look like in your state or territory?
Step 1. List the climate risk identified with an asterisk in Activity 1.a. Step 2. List three of the coordinated / integrated programs that you identified in Activity 2 and expanded in
Activity 3.
Step 3. List the activities and data sources that would be provided by each agency involved in the climate ready program. Place an asterisk (*) next to the agency that would likely lead the coordinated effort.
Step 4. Describe the potential co-benefits and co-harms associated with formalizing the coordinated / integrated effort as a program to enhance climate readiness.
Step 5. Identify opportunities to communicate the benefits of closer coordination both with internal and external partners as well as to the general public.
Step 6. List evaluation metrics that should be tracked if the coordinated / integrated program is implemented. Step 7. List the next steps required to move towards implementing the proposed programs. Include as many
details as possible, including deadlines and the person responsible for completing each action item.
ASTHO Extreme Weather and Climate Readiness: Toolkit for State and Territorial Health Departments 31
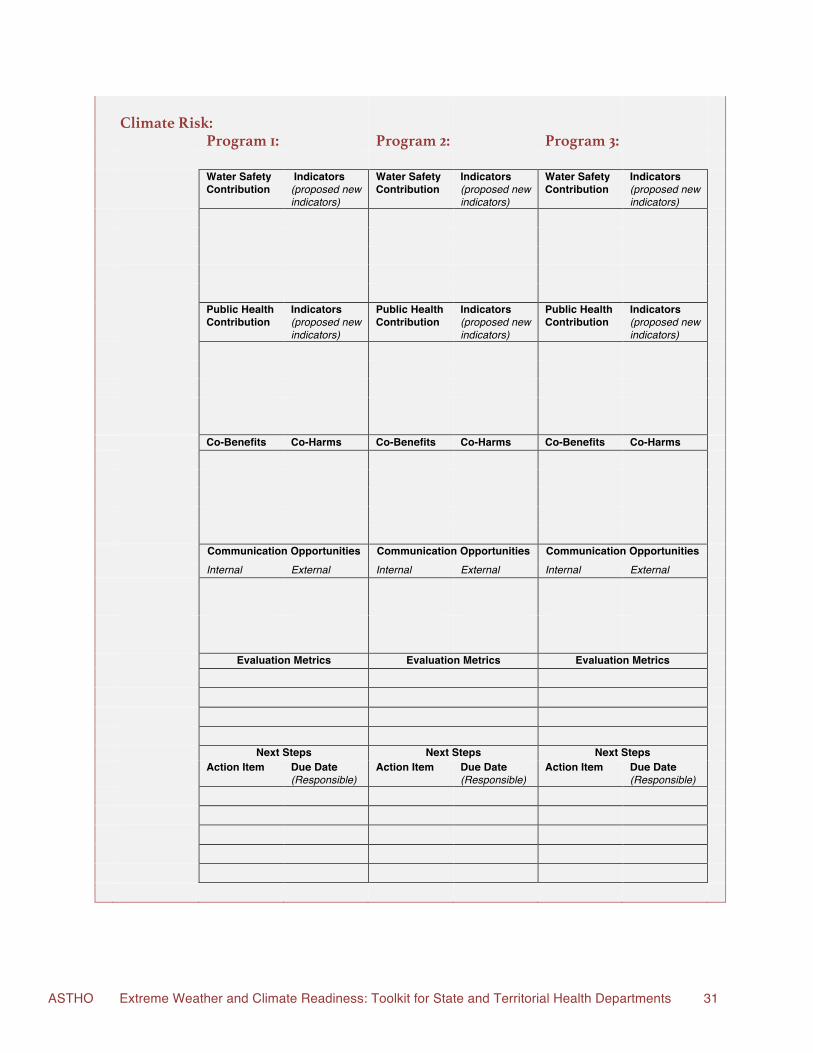
Climate Risk:
Program 1: Program 2: Program 3: Water Safety
Contribution Indicators (proposed new indicators)
Water Safety Contribution
Indicators (proposed new indicators)
Water Safety Contribution
Indicators (proposed new indicators)
Public Health
Contribution Indicators (proposed new indicators)
Public Health Contribution
Indicators (proposed new indicators)
Public Health Contribution
Indicators (proposed new indicators)
Co-Benefits Co-Harms Co-Benefits Co-Harms Co-Benefits Co-Harms Communication Opportunities Communication Opportunities Communication Opportunities Internal External Internal External Internal External Evaluation Metrics Evaluation Metrics Evaluation Metrics Next Steps Next Steps Next Steps Action Item Due Date
(Responsible) Action Item Due Date
(Responsible) Action Item Due Date
(Responsible)
ASTHO Extreme Weather and Climate Readiness: Toolkit for State and Territorial Health Departments 32
3. Vector-borne & Zoonotic Disease
Effects of Extreme Weather and Climate Change Zoonotic diseases are infectious diseases that are transmitted from animals to humans.68 These diseases are of particular interest to state and territorial public health departments, because they represent the majority of outbreaks caused by emerging diseases — representing over 60% of the 335 new infectious diseases reported worldwide between 1940 and 2004.69 Vector-borne diseases are often defined as zoonotic diseases transmitted to a human host via an invertebrate vector (such as a mosquito, tick, or flea).70 While the pathogen may pass a period of its lifecycle inside the vector, the vector’s main role is to act as a conveyance pathway for infecting a human host.70 Some of the most deadly diseases in human history have been vector-borne
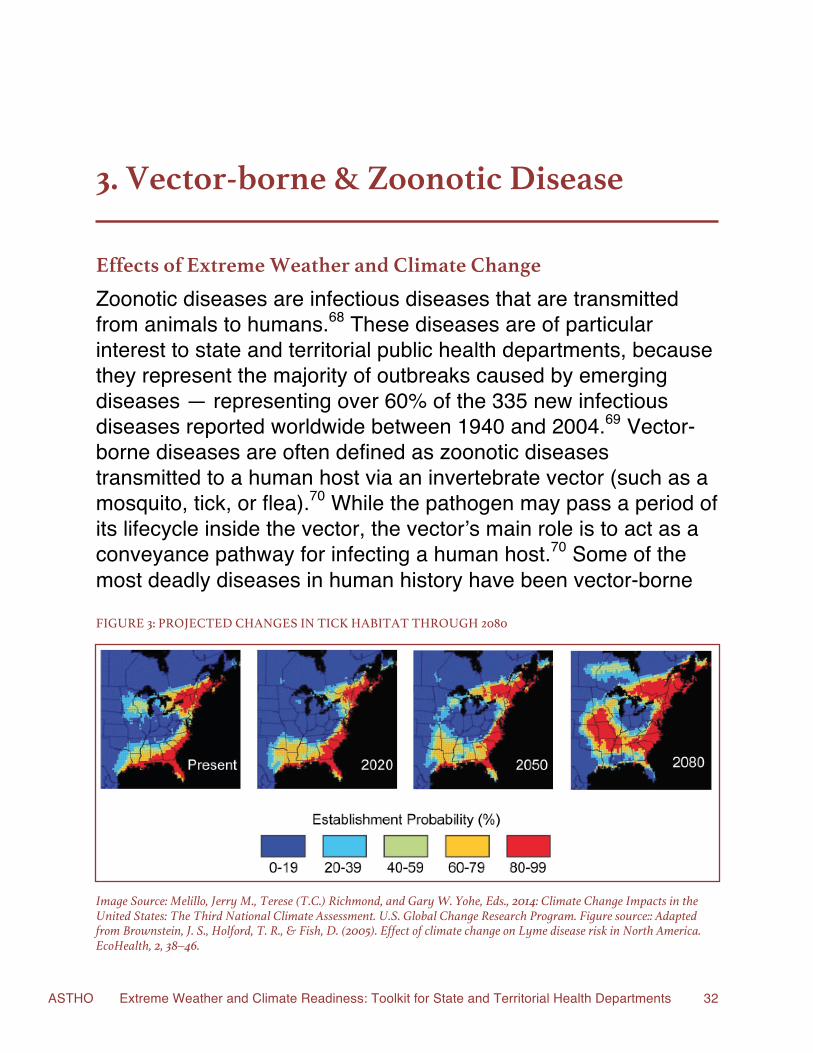
FIGURE 3: PROJECTED CHANGES IN TICK HABITAT THROUGH 2080
Image Source: Melillo, Jerry M., Terese (T.C.) Richmond, and Gary W. Yohe, Eds., 2014: Climate Change Impacts in the United States: The Third National Climate Assessment. U.S. Global Change Research Program. Figure source:: Adapted from Brownstein, J. S., Holford, T. R., & Fish, D. (2005). Effect of climate change on Lyme disease risk in North America. EcoHealth, 2, 38–46.
ASTHO Extreme Weather and Climate Readiness: Toolkit for State and Territorial Health Departments 33
diseases, including: plague, malaria, and typhus. These diseases are famously difficult to eradicate, because of the difficulties associated with rendering the vector harmless or eliminating it altogether.70 Vector-borne and zoonotic diseases are highly sensitive to both long-term climatic shifts and local, small scale shifts in weather patterns and the built environment.71 For example, the rapid spread of West Nile Virus across the U.S. from 2001 - 200572 has been associated with fluctuations in temperature, humidity, and heavy precipitation.73 This is particularly true at the high and low temperature extremes for transmission74 (Table 3-A). Increasing annual temperatures have contributed to vector populations such as mosquitoes and ticks shifting or expanding their range to more temperate zones.71 Additional factors that can influence both the geographic range of vector populations and the distribution of the diseases they carry include land use characteristics, vector-control interventions, socioeconomic and cultural factors (such as installing screens on windows and spending time indoors), and access to healthcare.71 And, although the onset of mosquito season is projected to be delayed in some areas due to increasing drought conditions, its overall length is projected to increase — a trend which has already been observed in regions where some mosquito-borne diseases are endemic.70,74,75 Mosquito-borne diseases such as dengue are particularly susceptible to the changing temperature and precipitation patterns caused by climate change (Table 3-A). Warmer annual temperatures enable the Aedes aegypti mosquito (the primary vector for dengue) to survive winter temperatures, appear earlier in the spring and remain active later into the fall. Also, relatively small increases in temperature (such as 1oC) speed both larval development rates and the rate at which the virus reaches infectious levels within the mosquito reservoir. Furthermore, heavy precipitation events representative of shifting climatic patterns trigger eggs to hatch. As a result, Aedes aegypti mosquitoes have begun to appear earlier in the season and are able to reproduce more quickly and transmit more dengue virus to human hosts than would have been possible in the past.79–82 In some regions, the warming climate may have contributed to the reemergence of domestic cases of vector-borne diseases that were eradicated decades ago. For example, cases of locally acquired dengue fever were reported in Florida in 2009 for the first time since it was eradicated from the Americas the 1940’s.76,77 From 2000 - 2007, dengue’s economic burden in the Americas is estimated to have reached an average of $2.1 billion per year, exceeding the burden of all other viral infections in the region.78 However, cases were not distributed equally across the continent, with the U.S. and Canada representing only 0.03% of the total cases during that period of time. If the disease continues to spread, it could result in a significant burden to state and territorial economies. The average cost per U.S. case (including both direct medical costs and indirect costs associated with productivity losses) is estimated to reach $17,803 — substantially higher than both the next highest country, Bermuda ($7,411), and Canada ($4,878).78
ASTHO Extreme Weather and Climate Readiness: Toolkit for State and Territorial Health Departments 34
It is important to note that vector-control measures and lifestyle factors can help reduce the risk of acquiring mosquito-borne diseases such as dengue by reducing human-mosquito contact.71 Environmental and socioeconomic context can also influence exposure to vector-borne and zoonotic diseases. For example, Reiter et. al. (2003) found that economic factors (such as the ability to purchase an air conditioner) were largely responsible for the disparity between the high prevalence of dengue in Nuevo Laredo, Mexico, in 1999 in comparison with its sister city Laredo on the Texas side of the international border.83 Population expansion into natural areas brings humans and wildlife together with increasing frequency, contributing to zoonotic disease transmission such as has occurred in the eastern United States where home construction into re-forested areas has contributed to Lyme disease becoming an important peri-domestic disease risk.84 The combination of habitat fragmentation caused by suburban land use practices and climate-related environmental changes such as sea level rise may also increase the risk of vector-borne and zoonotic disease outbreaks in the U.S.85 (Table 3-A). This is a worrying trend given that roughly 70% of emerging zoonotic diseases are transferred to human hosts from wildlife rather than from domesticated animals.69
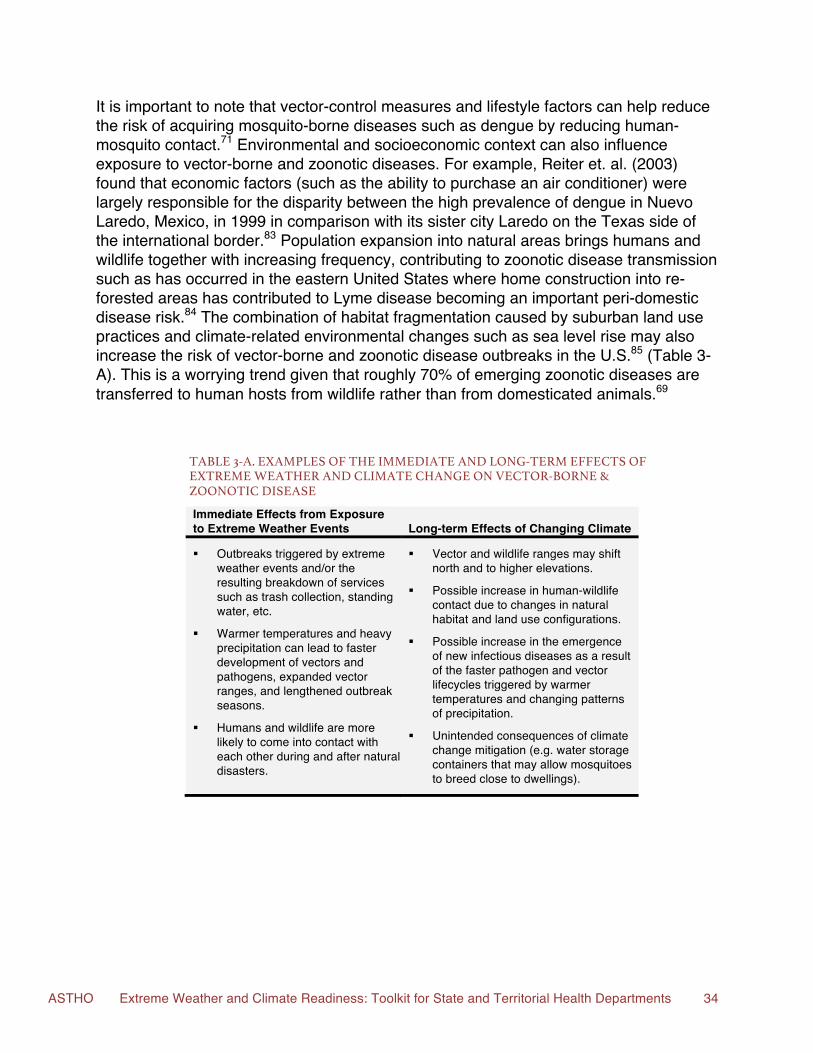
TABLE 3-A. EXAMPLES OF THE IMMEDIATE AND LONG-TERM EFFECTS OF EXTREME WEATHER AND CLIMATE CHANGE ON VECTOR-BORNE & ZOONOTIC DISEASE
Immediate Effects from Exposure to Extreme Weather Events Long-term Effects of Changing Climate
§ Outbreaks triggered by extreme weather events and/or the resulting breakdown of services such as trash collection, standing water, etc.
§ Warmer temperatures and heavy precipitation can lead to faster development of vectors and pathogens, expanded vector ranges, and lengthened outbreak seasons.
§ Humans and wildlife are more likely to come into contact with each other during and after natural disasters.
§ Vector and wildlife ranges may shift north and to higher elevations.
§ Possible increase in human-wildlife contact due to changes in natural habitat and land use configurations.
§ Possible increase in the emergence of new infectious diseases as a result of the faster pathogen and vector lifecycles triggered by warmer temperatures and changing patterns of precipitation.
§ Unintended consequences of climate change mitigation (e.g. water storage containers that may allow mosquitoes to breed close to dwellings).
ASTHO Extreme Weather and Climate Readiness: Toolkit for State and Territorial Health Departments 35
SPOTLIGHT ON PRACTICE ACTIVITY 1: Climate Impacts
Tip for Finding Helpful Resources: Use your state or territory's climate assessment and / or action plan to identify priority climate risks and their impact on vector-borne and zoonotic diseases. If state- / territory-specific resources are not available, use the list of resources under "Step 1: Forecast Climate Impacts; Assess Vulnerabilities" in the Climate Readiness Assessment Resources section of this document.
1.a. What are the immediate and long-term effects of extreme weather and climate
change on vector-borne and zoonotic diseases in your state or territory?
Step 1. Identify the top 1-3 climate risks to your state or territory. Step 2. Identify how these climate risks will impact vector-borne and zoonotic diseases. View the narrative in
this section of the toolkit and Table 3-A for examples of potential impacts.
Step 3. List the agency or department that addresses each vector-borne and zoonotic disease impact identified under Step 2.
Step 4. List the existing programs designed to reduce the impacts identified under Step 2. Step 5. Based on your responses to Steps 1-4, place an asterisk next to the climate risk that would be most
appropriate to prioritize for the remainder of this assessment. (Note: If two or more climate risks are equally important to address simultaneously, simply repeat the remainder of activities in this assessment for the additional risks.)
Climate Risk 1:
Impacts Department / Agency Programs
Climate Risk 2:
Impacts Department / Agency Programs
ASTHO Extreme Weather and Climate Readiness: Toolkit for State and Territorial Health Departments 36
Climate Risk 3:
Impacts Department / Agency Programs 1.b. What are the potential negative health outcomes associated with the impacts of
climate change on vector-borne and zoonotic diseases?
Step 1. List the climate risk identified with an asterisk in Activity 1.a.
Step 2. In the left-hand column of the table below, list three impacts associated with this climate risk (as identified in Activity 1.a.).
Step 3. List the potential negative health outcomes associated with these impacts. Step 4. List the populations that are particularly vulnerable to these impacts. Step 5. List the existing public health tracking / surveillance programs, policies, and interventions outside of
the vector-borne / zoonotic disease program that are designed to reduce the negative health outcomes identified under Step 3.
Step 6. List the co-benefits of these programs to the vector-borne and zoonotic disease programs outlined in Activity 1.a.
Climate Risk: Health
Effects Vulnerable Populations Programs Co-Benefits to Vector-borne &
Zoonotic Disease Programs
Impact 1: Impact 2: Impact 3:
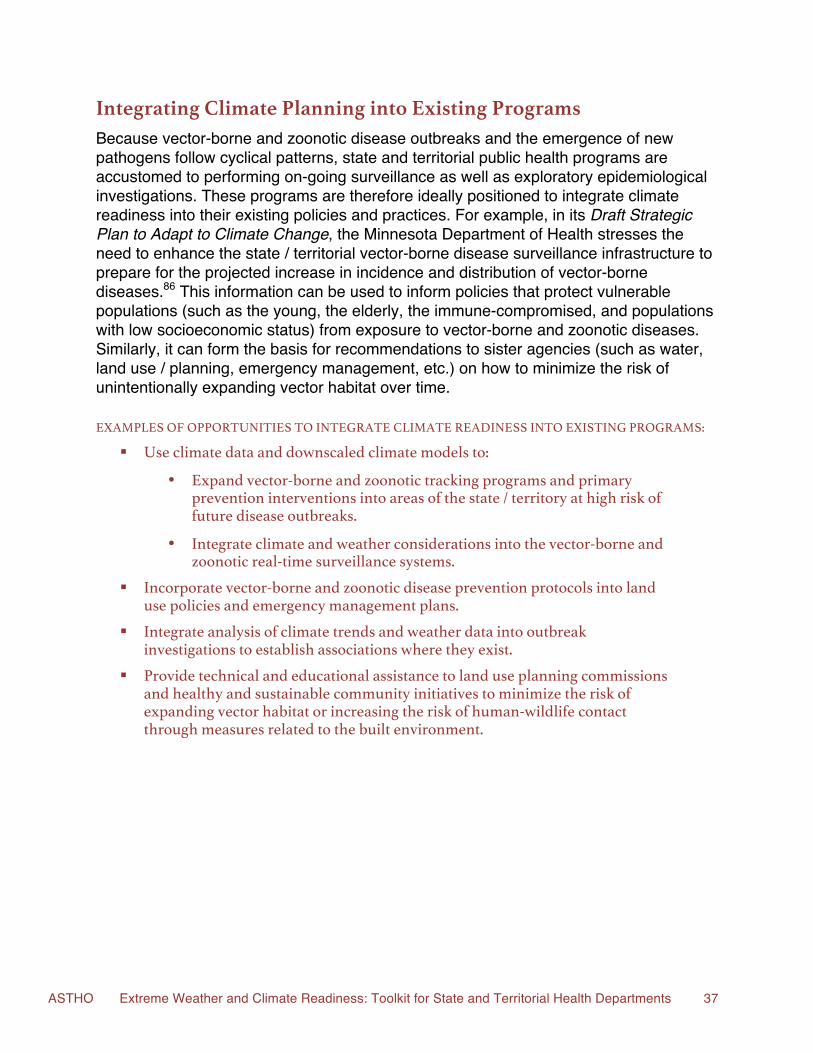
ASTHO Extreme Weather and Climate Readiness: Toolkit for State and Territorial Health Departments 37
Integrating Climate Planning into Existing Programs Because vector-borne and zoonotic disease outbreaks and the emergence of new pathogens follow cyclical patterns, state and territorial public health programs are accustomed to performing on-going surveillance as well as exploratory epidemiological investigations. These programs are therefore ideally positioned to integrate climate readiness into their existing policies and practices. For example, in its Draft Strategic Plan to Adapt to Climate Change, the Minnesota Department of Health stresses the need to enhance the state / territorial vector-borne disease surveillance infrastructure to prepare for the projected increase in incidence and distribution of vector-borne diseases.86 This information can be used to inform policies that protect vulnerable populations (such as the young, the elderly, the immune-compromised, and populations with low socioeconomic status) from exposure to vector-borne and zoonotic diseases. Similarly, it can form the basis for recommendations to sister agencies (such as water, land use / planning, emergency management, etc.) on how to minimize the risk of unintentionally expanding vector habitat over time.
EXAMPLES OF OPPORTUNITIES TO INTEGRATE CLIMATE READINESS INTO EXISTING PROGRAMS:
§ Use climate data and downscaled climate models to:
• Expand vector-borne and zoonotic tracking programs and primary prevention interventions into areas of the state / territory at high risk of future disease outbreaks.
• Integrate climate and weather considerations into the vector-borne and zoonotic real-time surveillance systems.
§ Incorporate vector-borne and zoonotic disease prevention protocols into land use policies and emergency management plans.
§ Integrate analysis of climate trends and weather data into outbreak investigations to establish associations where they exist.
§ Provide technical and educational assistance to land use planning commissions and healthy and sustainable community initiatives to minimize the risk of expanding vector habitat or increasing the risk of human-wildlife contact through measures related to the built environment.
ASTHO Extreme Weather and Climate Readiness: Toolkit for State and Territorial Health Departments 38
SPOTLIGHT ON PRACTICE ACTIVITY 2: Integrating Climate Planning into Existing Programs
Tip for Finding Helpful Resources: Use your state or territory's climate assessment and / or action plan to identify priority climate risks and their impact on vector-borne and zoonotic diseases. If state- / territory-specific resources are not available, use the list of resources under "Step 1: Forecast Climate Impacts; Assess Vulnerabilities" in the Climate Readiness Assessment Resources section of this document.
What opportunities are available to integrate climate readiness into vector-borne /
zoonotic disease programs?
Step 1. List the climate risk identified with an asterisk in Activity 1.a. Step 2. List the three impacts associated with the climate risk that you expanded in Activity 1.b. Step 3. Reviewing your answers to Activities 1.a and 1.b, identify programs that, if coordinated, could
enhance your state or territory's ability to prepare for the effects of climate change on vector-borne and zoonotic diseases.
Step 4. Identify ways in which these programs are currently coordinating with each other and opportunities for enhanced coordination in the future.
Step 5. Explain how a coordinated / integrated program would bring value to all partnering agencies and how it would enhance climate readiness.
Climate Risk:
Vector-borne / Zoonotic Program(s)
Partner Agency Program(s)
Other Program(s) (Lead agency)
Current Coordination / Integration
Opportunities
Benefits of Coordination / Integration
Impact 1: Impact 2: Impact 3:
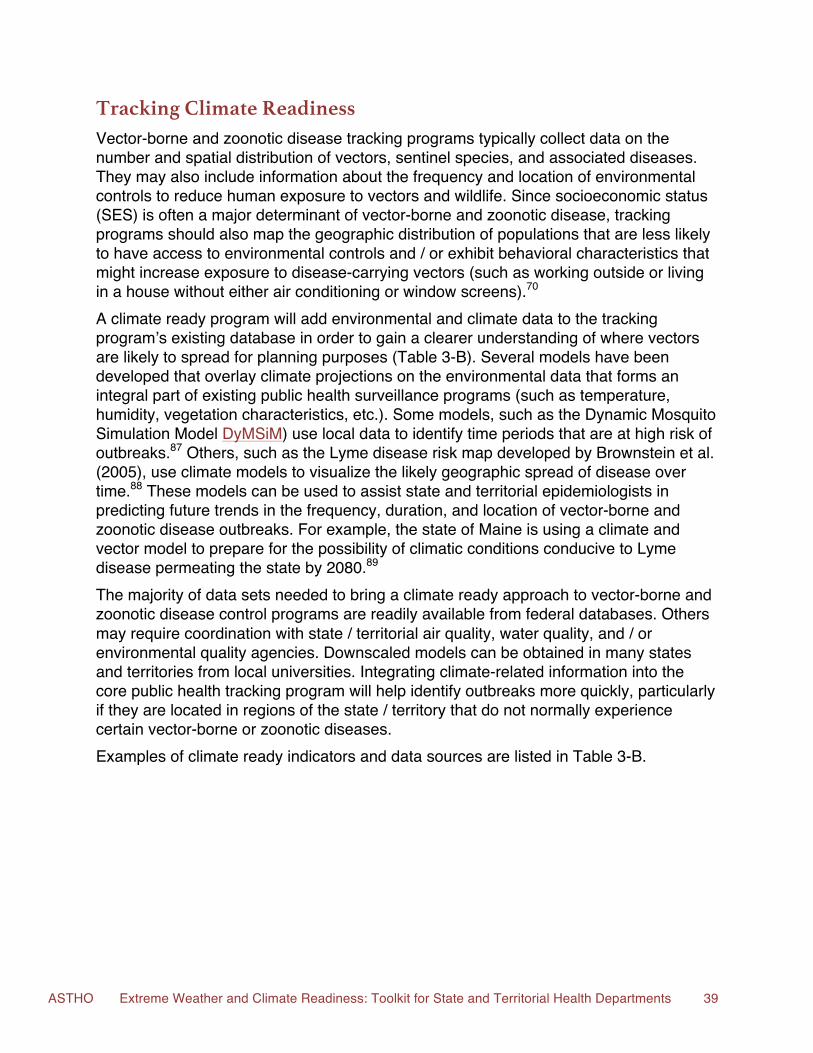
ASTHO Extreme Weather and Climate Readiness: Toolkit for State and Territorial Health Departments 39
Tracking Climate Readiness Vector-borne and zoonotic disease tracking programs typically collect data on the number and spatial distribution of vectors, sentinel species, and associated diseases. They may also include information about the frequency and location of environmental controls to reduce human exposure to vectors and wildlife. Since socioeconomic status (SES) is often a major determinant of vector-borne and zoonotic disease, tracking programs should also map the geographic distribution of populations that are less likely to have access to environmental controls and / or exhibit behavioral characteristics that might increase exposure to disease-carrying vectors (such as working outside or living in a house without either air conditioning or window screens).70 A climate ready program will add environmental and climate data to the tracking program’s existing database in order to gain a clearer understanding of where vectors are likely to spread for planning purposes (Table 3-B). Several models have been developed that overlay climate projections on the environmental data that forms an integral part of existing public health surveillance programs (such as temperature, humidity, vegetation characteristics, etc.). Some models, such as the Dynamic Mosquito Simulation Model DyMSiM) use local data to identify time periods that are at high risk of outbreaks.87 Others, such as the Lyme disease risk map developed by Brownstein et al. (2005), use climate models to visualize the likely geographic spread of disease over time.88 These models can be used to assist state and territorial epidemiologists in predicting future trends in the frequency, duration, and location of vector-borne and zoonotic disease outbreaks. For example, the state of Maine is using a climate and vector model to prepare for the possibility of climatic conditions conducive to Lyme disease permeating the state by 2080.89 The majority of data sets needed to bring a climate ready approach to vector-borne and zoonotic disease control programs are readily available from federal databases. Others may require coordination with state / territorial air quality, water quality, and / or environmental quality agencies. Downscaled models can be obtained in many states and territories from local universities. Integrating climate-related information into the core public health tracking program will help identify outbreaks more quickly, particularly if they are located in regions of the state / territory that do not normally experience certain vector-borne or zoonotic diseases. Examples of climate ready indicators and data sources are listed in Table 3-B.
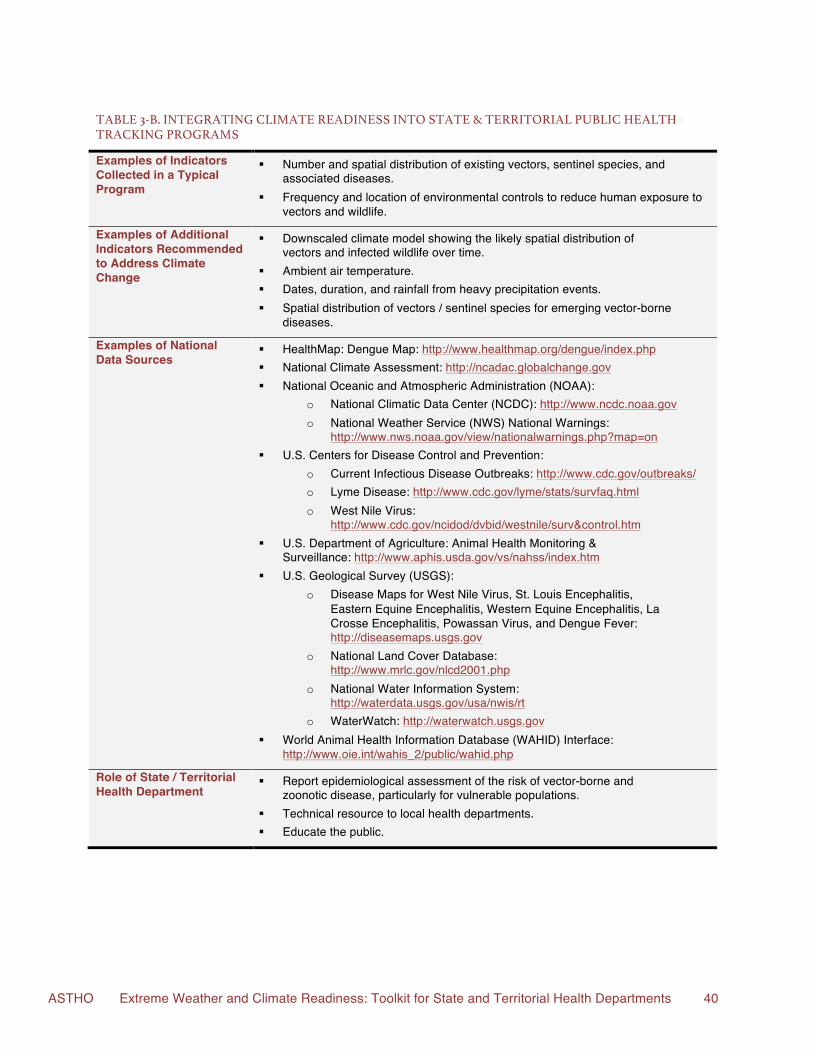
ASTHO Extreme Weather and Climate Readiness: Toolkit for State and Territorial Health Departments 40
TABLE 3-B. INTEGRATING CLIMATE READINESS !INTO STATE & TERRITORIAL PUBLIC HEALTH TRACKING PROGRAMS
Examples of Indicators Collected in a Typical Program
§ Number and spatial distribution of existing vectors, sentinel species, and associated diseases.
§ Frequency and location of environmental controls to reduce human exposure to vectors and wildlife.
Examples of Additional Indicators Recommended to Address Climate Change
§ Downscaled climate model showing the likely spatial distribution of vectors and infected wildlife over time.
§ Ambient air temperature. § Dates, duration, and rainfall from heavy precipitation events. § Spatial distribution of vectors / sentinel species for emerging vector-borne
diseases.
Examples of National Data Sources
§ HealthMap: Dengue Map: http://www.healthmap.org/dengue/index.php § National Climate Assessment: http://ncadac.globalchange.gov § National Oceanic and Atmospheric Administration (NOAA):
o National Climatic Data Center (NCDC): http://www.ncdc.noaa.gov o National Weather Service (NWS) National Warnings:
http://www.nws.noaa.gov/view/nationalwarnings.php?map=on § U.S. Centers for Disease Control and Prevention:
o Current Infectious Disease Outbreaks: http://www.cdc.gov/outbreaks/ o Lyme Disease: http://www.cdc.gov/lyme/stats/survfaq.html o West Nile Virus:
http://www.cdc.gov/ncidod/dvbid/westnile/surv&control.htm § U.S. Department of Agriculture: Animal Health Monitoring &
Surveillance: http://www.aphis.usda.gov/vs/nahss/index.htm § U.S. Geological Survey (USGS):
o Disease Maps for West Nile Virus, St. Louis Encephalitis, Eastern Equine Encephalitis, Western Equine Encephalitis, La Crosse Encephalitis, Powassan Virus, and Dengue Fever: http://diseasemaps.usgs.gov
o National Land Cover Database: http://www.mrlc.gov/nlcd2001.php
o National Water Information System: http://waterdata.usgs.gov/usa/nwis/rt
o WaterWatch: http://waterwatch.usgs.gov § World Animal Health Information Database (WAHID) Interface:
http://www.oie.int/wahis_2/public/wahid.php
Role of State / Territorial Health Department
§ Report epidemiological assessment of the risk of vector-borne and zoonotic disease, particularly for vulnerable populations.
§ Technical resource to local health departments. § Educate the public.
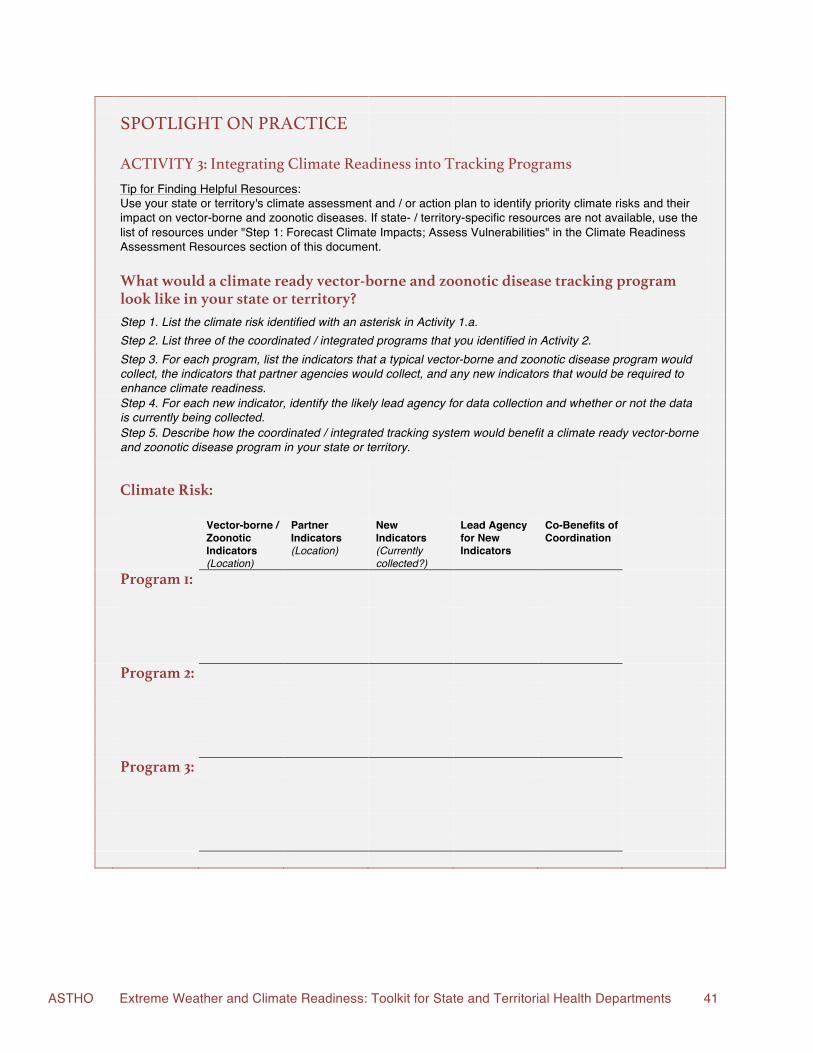
ASTHO Extreme Weather and Climate Readiness: Toolkit for State and Territorial Health Departments 41
SPOTLIGHT ON PRACTICE ACTIVITY 3: Integrating Climate Readiness into Tracking Programs
Tip for Finding Helpful Resources: Use your state or territory's climate assessment and / or action plan to identify priority climate risks and their impact on vector-borne and zoonotic diseases. If state- / territory-specific resources are not available, use the list of resources under "Step 1: Forecast Climate Impacts; Assess Vulnerabilities" in the Climate Readiness Assessment Resources section of this document.
What would a climate ready vector-borne and zoonotic disease tracking program
look like in your state or territory?
Step 1. List the climate risk identified with an asterisk in Activity 1.a. Step 2. List three of the coordinated / integrated programs that you identified in Activity 2. Step 3. For each program, list the indicators that a typical vector-borne and zoonotic disease program would
collect, the indicators that partner agencies would collect, and any new indicators that would be required to enhance climate readiness.
Step 4. For each new indicator, identify the likely lead agency for data collection and whether or not the data is currently being collected.
Step 5. Describe how the coordinated / integrated tracking system would benefit a climate ready vector-borne and zoonotic disease program in your state or territory.
Climate Risk: Vector-borne /
Zoonotic Indicators (Location)
Partner Indicators (Location)
New Indicators (Currently collected?)
Lead Agency for New Indicators
Co-Benefits of Coordination
Program 1: Program 2: Program 3:
ASTHO Extreme Weather and Climate Readiness: Toolkit for State and Territorial Health Departments 42
Triple Bottom Line Benefits Health Co-Benefits: Reduce vector-borne and zoonotic disease morbidity and mortality through better tracking and public health prevention interventions. Economic Co-Benefits: Maximize use of vector-borne and zoonotic disease prevention funding by targeting interventions to areas of the state / territory at high risk of emerging incidence of disease and by identifying outbreaks more quickly. Environmental Co-Benefits: Reduce the use of chemical vector control applications by targeting primary prevention interventions to high-risk areas. Influence land use planning and design decisions to reduce the prevalence of vectors and the likelihood of contact between human populations and wildlife. SPOTLIGHT ON PRACTICE ACTIVITY 4: Pulling it All Together
Tip for Finding Helpful Resources: Use your state or territory's climate assessment and / or action plan to identify priority climate risks and their impact on vector-borne and zoonotic diseases. If state- / territory-specific resources are not available, use the list of resources under "Step 1: Forecast Climate Impacts; Assess Vulnerabilities" in the Climate Readiness Assessment Resources section of this document.
What would a climate ready vector-borne and zoonotic disease program look like in
your state or territory?
Step 1. List the climate risk identified with an asterisk in Activity 1.a. Step 2. List three of the coordinated / integrated programs that you identified in Activity 2 and expanded in
Activity 3.
Step 3. List the activities and data sources that would be provided by each agency involved in the climate ready program. Place an asterisk (*) next to the agency that would likely lead the coordinated effort.
Step 4. Describe the potential co-benefits and co-harms associated with formalizing the coordinated / integrated effort as a program to enhance climate readiness.
Step 5. Identify opportunities to communicate the benefits of closer coordination both with internal and external partners as well as to the general public.
Step 6. List evaluation metrics that should be tracked if the coordinated / integrated program is implemented. Step 7. List the next steps required to move towards implementing the proposed programs. Include as many
details as possible, including deadlines and the person responsible for completing each action item.
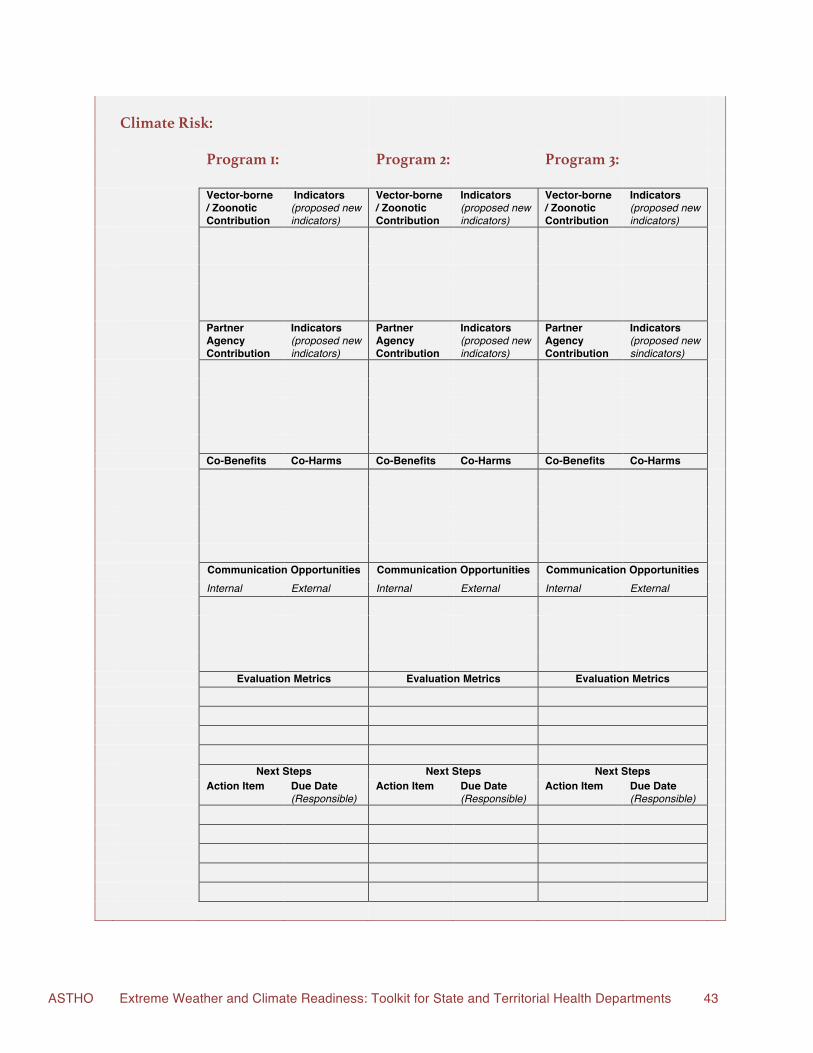
ASTHO Extreme Weather and Climate Readiness: Toolkit for State and Territorial Health Departments 43
Climate Risk:
Program 1: Program 2: Program 3: Vector-borne
/ Zoonotic Contribution
Indicators (proposed new indicators)
Vector-borne / Zoonotic Contribution
Indicators (proposed new indicators)
Vector-borne / Zoonotic Contribution
Indicators (proposed new indicators)
Partner
Agency Contribution
Indicators (proposed new indicators)
Partner Agency Contribution
Indicators (proposed new indicators)
Partner Agency Contribution
Indicators (proposed new sindicators)
Co-Benefits Co-Harms Co-Benefits Co-Harms Co-Benefits Co-Harms Communication Opportunities Communication Opportunities Communication Opportunities Internal External Internal External Internal External Evaluation Metrics Evaluation Metrics Evaluation Metrics Next Steps Next Steps Next Steps Action Item Due Date
(Responsible) Action Item Due Date
(Responsible) Action Item Due Date
(Responsible)
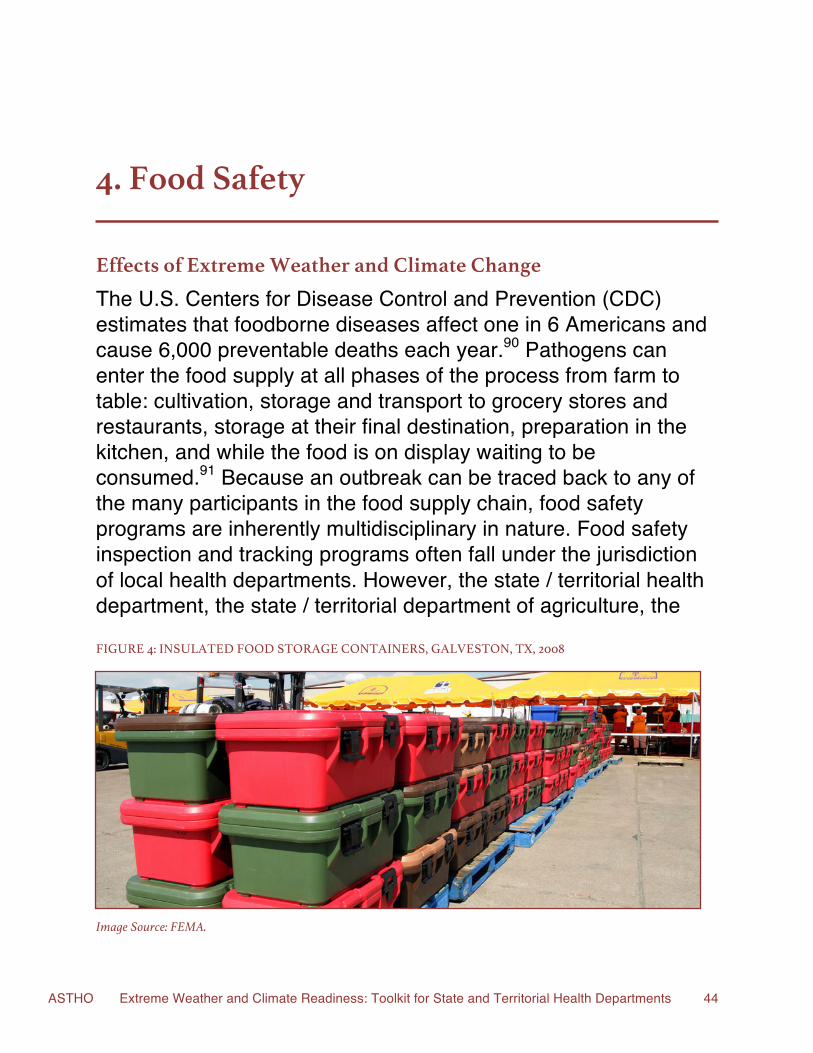
ASTHO Extreme Weather and Climate Readiness: Toolkit for State and Territorial Health Departments 44
4. Food Safety
Effects of Extreme Weather and Climate Change The U.S. Centers for Disease Control and Prevention (CDC) estimates that foodborne diseases affect one in 6 Americans and cause 6,000 preventable deaths each year.90 Pathogens can enter the food supply at all phases of the process from farm to table: cultivation, storage and transport to grocery stores and restaurants, storage at their final destination, preparation in the kitchen, and while the food is on display waiting to be consumed.91 Because an outbreak can be traced back to any of the many participants in the food supply chain, food safety programs are inherently multidisciplinary in nature. Food safety inspection and tracking programs often fall under the jurisdiction of local health departments. However, the state / territorial health department, the state / territorial department of agriculture, the
FIGURE 4: INSULATED FOOD STORAGE CONTAINERS, GALVESTON, TX, 2008
Image Source: FEMA.
ASTHO Extreme Weather and Climate Readiness: Toolkit for State and Territorial Health Departments 45
U.S. Department of Agriculture (USDA), the U.S. Food and Drug Administration (FDA), and the U.S. Centers for Disease Control and Prevention (CDC) can also participate in outbreak investigations if they expand to multiple counties or states / territories.92 As temperatures rise and states and territories face new and more severe extreme weather events that may cause flooding and disruption to power and transportation routes, the ability of food producers, manufacturers, suppliers, and retail establishments to provide a reliable supply of safe food at reasonable costs may be compromised93 (Table 4-A). With low socioeconomic status (SES) populations already less likely to have ready access to supermarkets and healthful foods,94 the challenges posed by climate change only add to their existing difficulties. Climate change is also likely to increase the difficulty of maintaining strong food safety measures in emergency shelters during and after extreme weather events (Table 4-A). Food often reaches shelters after passing through several intermediate destinations, each of which must maintain proper handling and storage procedures in unpredictable circumstances. Food service workers may not have been trained in safe handling procedures. And, populations at high risk of infection (such as children and the elderly) are often over-represented among shelter populations.95 For example, the Feeding America 2010 study found that 38% of clients receiving emergency food assistance in 2009 were children and 8% were elderly.96 Over time, the effects of climate change — such as increases temperatures, reduction in total annual rainfall, loss of top soil due to erosion during droughts and floods, and migration of pests to new terrains — will likely reduce soil productivity, requiring farmers to depend more heavily on pesticides and fertilizers to avoid crop failure93,97 (Table 4-A). Many of these chemicals are petroleum-based and/or contribute to non-point source water pollution.98 Warming temperatures may also result in agricultural operations in temperate regions expanding refrigeration capacity in order to maintain safe storage temperatures (Table 4-A). It has been estimated that the length of time a food product can remain safely in chilled storage is halved with every 2-3 oC rise in temperature.99 Rising temperatures have already begun to impact the ability of food industries that depend on cool temperatures to produce products that are safe for human consumption. For example, rising temperatures along the coasts of the U.S. resulted in a three-fold increase in seafood-related Vibrio cases from 1996-2010.100
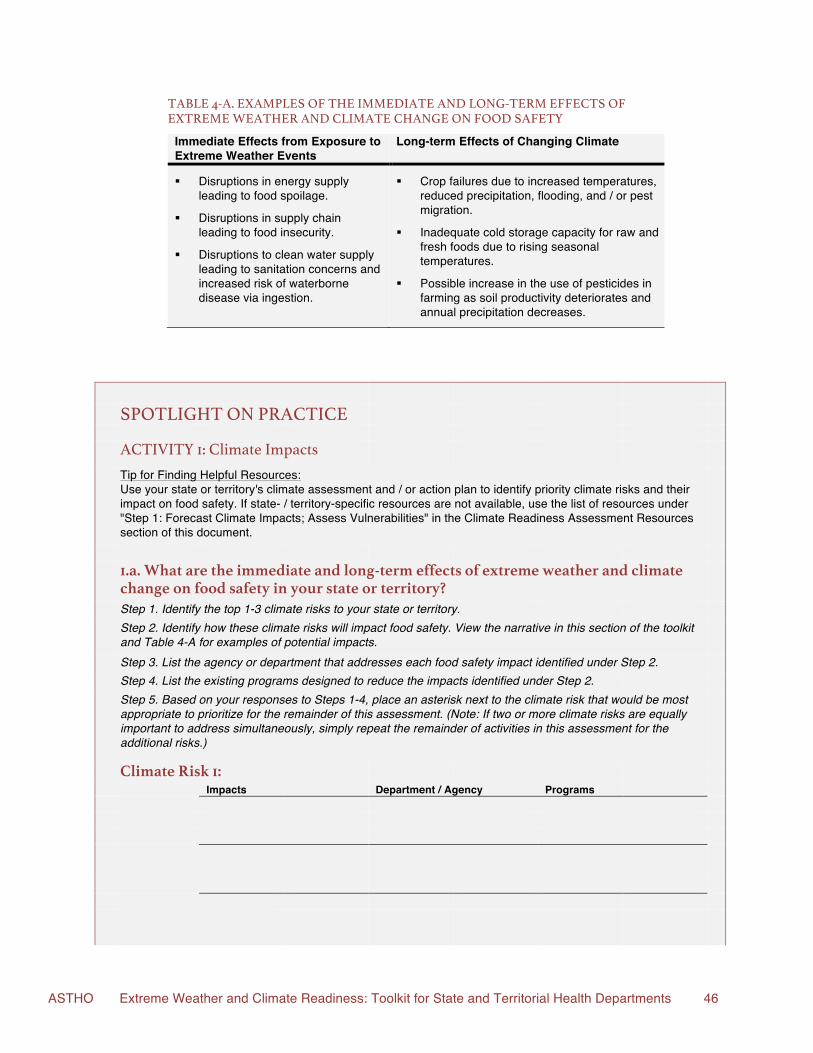
ASTHO Extreme Weather and Climate Readiness: Toolkit for State and Territorial Health Departments 46
TABLE 4-A. EXAMPLES OF THE IMMEDIATE AND LONG-TERM EFFECTS OF EXTREME WEATHER AND CLIMATE CHANGE ON FOOD SAFETY
Immediate Effects from Exposure to Extreme Weather Events
Long-term Effects of Changing Climate
§ Disruptions in energy supply leading to food spoilage.
§ Disruptions in supply chain leading to food insecurity.
§ Disruptions to clean water supply leading to sanitation concerns and increased risk of waterborne disease via ingestion.
§ Crop failures due to increased temperatures, reduced precipitation, flooding, and / or pest migration.
§ Inadequate cold storage capacity for raw and fresh foods due to rising seasonal temperatures.
§ Possible increase in the use of pesticides in farming as soil productivity deteriorates and annual precipitation decreases.
SPOTLIGHT ON PRACTICE ACTIVITY 1: Climate Impacts
Tip for Finding Helpful Resources: Use your state or territory's climate assessment and / or action plan to identify priority climate risks and their impact on food safety. If state- / territory-specific resources are not available, use the list of resources under "Step 1: Forecast Climate Impacts; Assess Vulnerabilities" in the Climate Readiness Assessment Resources section of this document.
1.a. What are the immediate and long-term effects of extreme weather and climate
change on food safety in your state or territory?
Step 1. Identify the top 1-3 climate risks to your state or territory. Step 2. Identify how these climate risks will impact food safety. View the narrative in this section of the toolkit
and Table 4-A for examples of potential impacts.
Step 3. List the agency or department that addresses each food safety impact identified under Step 2. Step 4. List the existing programs designed to reduce the impacts identified under Step 2. Step 5. Based on your responses to Steps 1-4, place an asterisk next to the climate risk that would be most
appropriate to prioritize for the remainder of this assessment. (Note: If two or more climate risks are equally important to address simultaneously, simply repeat the remainder of activities in this assessment for the additional risks.)
Climate Risk 1: Impacts Department / Agency Programs
ASTHO Extreme Weather and Climate Readiness: Toolkit for State and Territorial Health Departments 47
Climate Risk 2:
Impacts Department / Agency Programs Climate Risk 3: Impacts Department / Agency Programs
1.b. What are the potential negative health outcomes associated with the impacts of climate change on food safety?
Step 1. List the climate risk identified with an asterisk in Activity 1.a. Step 2. In the left-hand column of the table below, list three impacts associated with this climate risk
(as identified in Activity 1.a.).
Step 3. List the potential negative health outcomes associated with these impacts. Step 4. List the populations that are particularly vulnerable to these impacts. Step 5. List the existing public health tracking / surveillance programs, policies, and interventions outside of
the food safety program designed to reduce the negative health outcomes identified under Step 3.
Step 6. List the co-benefits of the public health programs to the food safety programs outlined in Activity 1.a. Climate Risk: Health Effects Vulnerable Populations Programs Co-Benefits to
Food Safety Programs
Impact 1: Impact 2: Impact 3:
ASTHO Extreme Weather and Climate Readiness: Toolkit for State and Territorial Health Departments 48
Integrating Climate Planning into Existing Programs The mix of challenges caused by climate change to the entire food industry will require increased collaboration between state / territorial and local food safety programs and outside partners, such as USDA, FDA, the U.S. Department of Homeland Security and Emergency Management (DHS), and local public works departments. Social equity programs will also play a key role, because their clients are: the most likely to be food insecure prior to a climatic event, the most likely to suffer from chronic diseases that increase their vulnerability to negative health outcomes during and after events, and the most likely to be located in neighborhoods with vulnerable infrastructure. There are also numerous opportunities to integrate climate readiness into existing programs incrementally. For example, the state of California — which generates more than half of the produce consumed each year in the U.S. — has convened a multi-disciplinary adaptation consortium on specialty agricultural crops to identify the ways in which climate change threatens existing crop production and to propose strategies for enhancing resilience.101 Likewise, in Oregon, where the CDC’s Climate Ready States and Cities Initiative is being administered in close coordination with local county health departments,102 community gardens are being promoted as a mechanism to enhance food security during and after extreme weather events.103
EXAMPLES OF OPPORTUNITIES TO INTEGRATE CLIMATE READINESS INTO EXISTING PROGRAMS:
§ Use climate data and downscaled climate models to target agricultural products at high risk of temperature- and / or precipitation-related contamination for increased regulatory scrutiny.
§ Modernize regulations to increase access to safe, healthy, local foods. § Add energy and water efficiency metrics to template food inspection forms.
And, link the local food inspection program with the local sustainable business program.
§ Coordinate with community gardens and farmers markets to supply food — particularly to vulnerable populations — during major supply chain disruptions.
§ Require or encourage refrigerated food storage facilities to implement energy efficiency strategies and / or on-site renewable power technologies.
§ Modernize regulations to encourage the safe cultivation and storage of agricultural products.
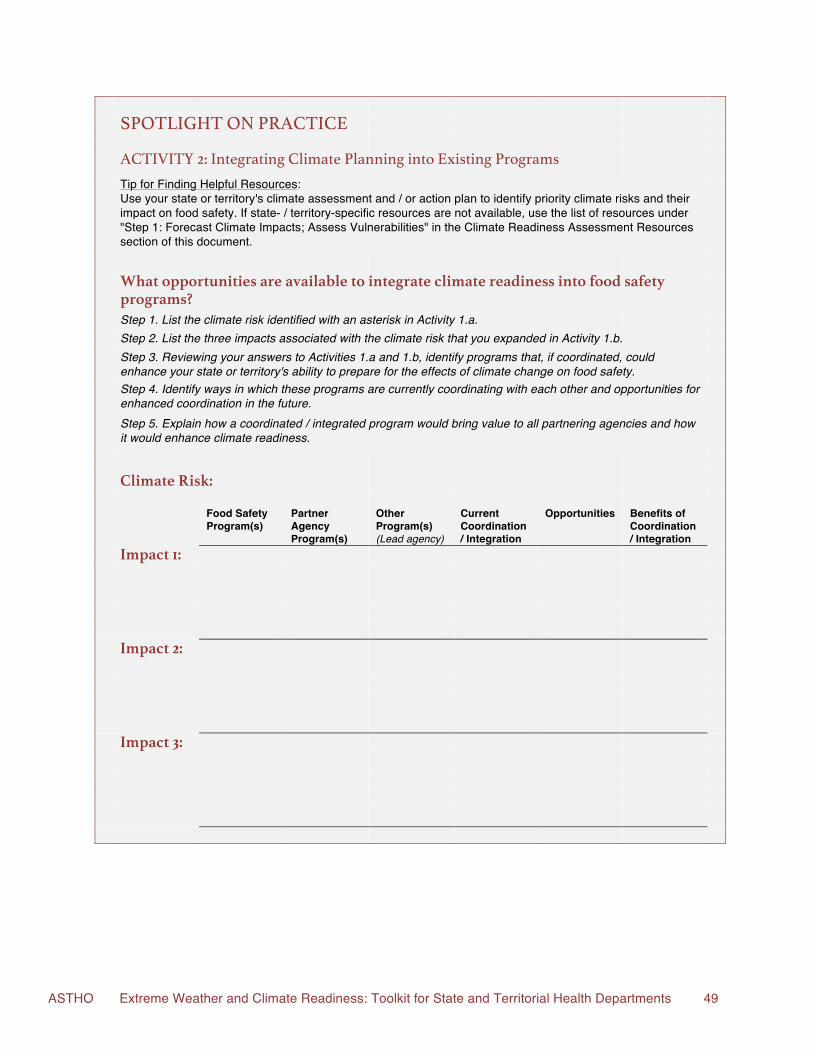
ASTHO Extreme Weather and Climate Readiness: Toolkit for State and Territorial Health Departments 49
SPOTLIGHT ON PRACTICE ACTIVITY 2: Integrating Climate Planning into Existing Programs
Tip for Finding Helpful Resources: Use your state or territory's climate assessment and / or action plan to identify priority climate risks and their impact on food safety. If state- / territory-specific resources are not available, use the list of resources under "Step 1: Forecast Climate Impacts; Assess Vulnerabilities" in the Climate Readiness Assessment Resources section of this document.
What opportunities are available to integrate climate readiness into food safety
programs?
Step 1. List the climate risk identified with an asterisk in Activity 1.a. Step 2. List the three impacts associated with the climate risk that you expanded in Activity 1.b. Step 3. Reviewing your answers to Activities 1.a and 1.b, identify programs that, if coordinated, could
enhance your state or territory's ability to prepare for the effects of climate change on food safety.
Step 4. Identify ways in which these programs are currently coordinating with each other and opportunities for enhanced coordination in the future.
Step 5. Explain how a coordinated / integrated program would bring value to all partnering agencies and how it would enhance climate readiness.
Climate Risk:
Food Safety Program(s)
Partner Agency Program(s)
Other Program(s) (Lead agency)
Current Coordination / Integration
Opportunities
Benefits of Coordination / Integration
Impact 1: Impact 2: Impact 3:
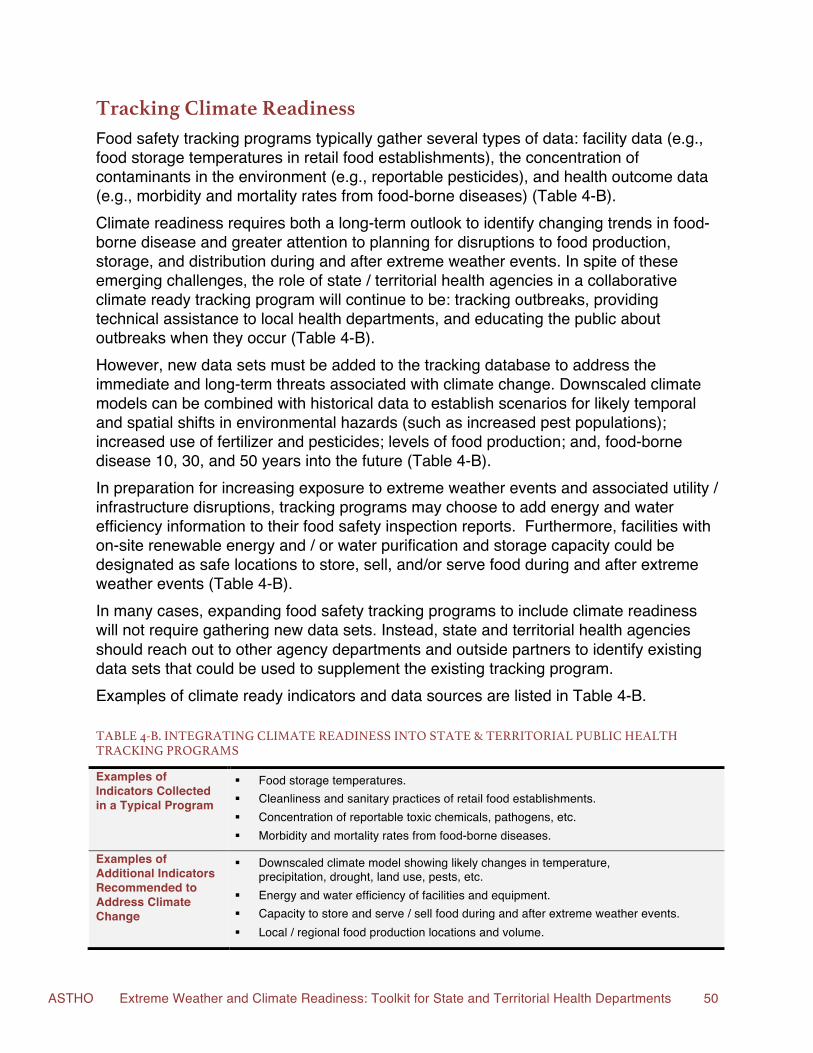
ASTHO Extreme Weather and Climate Readiness: Toolkit for State and Territorial Health Departments 50
Tracking Climate Readiness Food safety tracking programs typically gather several types of data: facility data (e.g., food storage temperatures in retail food establishments), the concentration of contaminants in the environment (e.g., reportable pesticides), and health outcome data (e.g., morbidity and mortality rates from food-borne diseases) (Table 4-B). Climate readiness requires both a long-term outlook to identify changing trends in food-borne disease and greater attention to planning for disruptions to food production, storage, and distribution during and after extreme weather events. In spite of these emerging challenges, the role of state / territorial health agencies in a collaborative climate ready tracking program will continue to be: tracking outbreaks, providing technical assistance to local health departments, and educating the public about outbreaks when they occur (Table 4-B). However, new data sets must be added to the tracking database to address the immediate and long-term threats associated with climate change. Downscaled climate models can be combined with historical data to establish scenarios for likely temporal and spatial shifts in environmental hazards (such as increased pest populations); increased use of fertilizer and pesticides; levels of food production; and, food-borne disease 10, 30, and 50 years into the future (Table 4-B). In preparation for increasing exposure to extreme weather events and associated utility / infrastructure disruptions, tracking programs may choose to add energy and water efficiency information to their food safety inspection reports. Furthermore, facilities with on-site renewable energy and / or water purification and storage capacity could be designated as safe locations to store, sell, and/or serve food during and after extreme weather events (Table 4-B). In many cases, expanding food safety tracking programs to include climate readiness will not require gathering new data sets. Instead, state and territorial health agencies should reach out to other agency departments and outside partners to identify existing data sets that could be used to supplement the existing tracking program. Examples of climate ready indicators and data sources are listed in Table 4-B.
TABLE 4-B. INTEGRATING CLIMATE READINESS !INTO STATE & TERRITORIAL PUBLIC HEALTH TRACKING PROGRAMS
Examples of Indicators Collected in a Typical Program
§ Food storage temperatures. § Cleanliness and sanitary practices of retail food establishments. § Concentration of reportable toxic chemicals, pathogens, etc. § Morbidity and mortality rates from food-borne diseases.
Examples of Additional Indicators Recommended to Address Climate Change
§ Downscaled climate model showing likely changes in temperature, precipitation, drought, land use, pests, etc.
§ Energy and water efficiency of facilities and equipment. § Capacity to store and serve / sell food during and after extreme weather events. § Local / regional food production locations and volume.
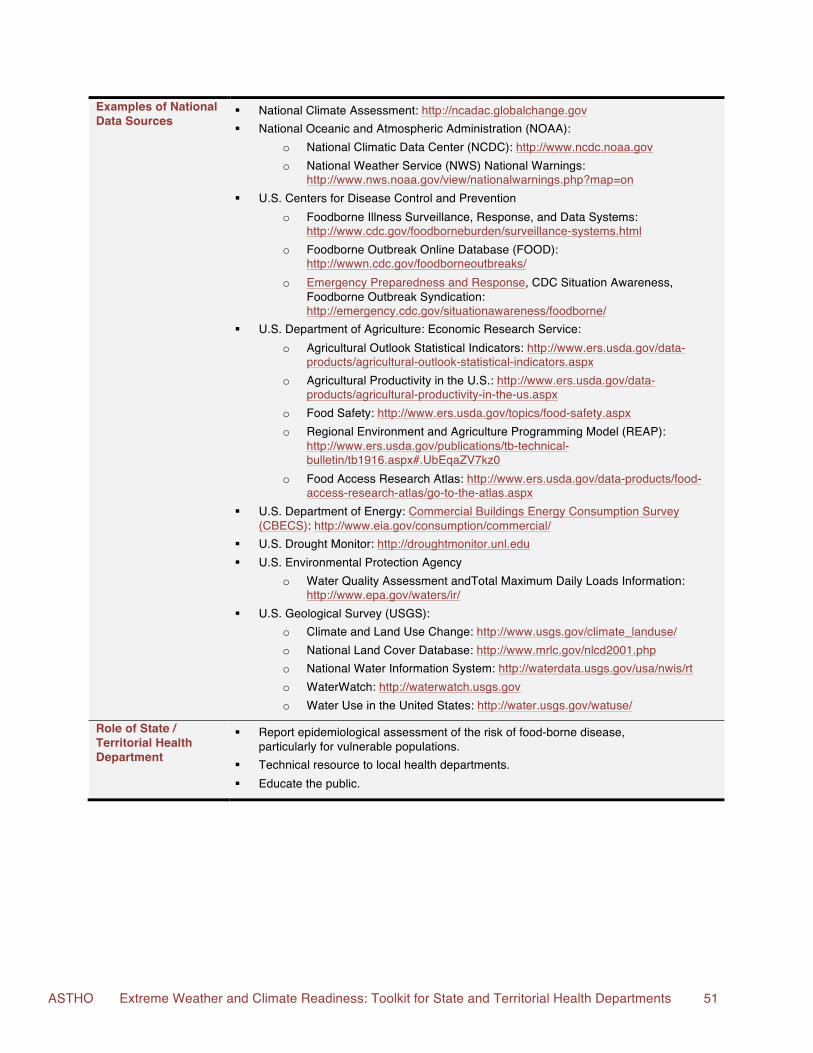
ASTHO Extreme Weather and Climate Readiness: Toolkit for State and Territorial Health Departments 51
Examples of National Data Sources
§ National Climate Assessment: http://ncadac.globalchange.gov § National Oceanic and Atmospheric Administration (NOAA):
o National Climatic Data Center (NCDC): http://www.ncdc.noaa.gov o National Weather Service (NWS) National Warnings:
http://www.nws.noaa.gov/view/nationalwarnings.php?map=on § U.S. Centers for Disease Control and Prevention
o Foodborne Illness Surveillance, Response, and Data Systems: http://www.cdc.gov/foodborneburden/surveillance-systems.html
o Foodborne Outbreak Online Database (FOOD): http://wwwn.cdc.gov/foodborneoutbreaks/
o Emergency Preparedness and Response, CDC Situation Awareness, Foodborne Outbreak Syndication: http://emergency.cdc.gov/situationawareness/foodborne/
§ U.S. Department of Agriculture: Economic Research Service: o Agricultural Outlook Statistical Indicators: http://www.ers.usda.gov/data-
products/agricultural-outlook-statistical-indicators.aspx o Agricultural Productivity in the U.S.: http://www.ers.usda.gov/data-
products/agricultural-productivity-in-the-us.aspx o Food Safety: http://www.ers.usda.gov/topics/food-safety.aspx o Regional Environment and Agriculture Programming Model (REAP):
http://www.ers.usda.gov/publications/tb-technical-bulletin/tb1916.aspx#.UbEqaZV7kz0
o Food Access Research Atlas: http://www.ers.usda.gov/data-products/food-access-research-atlas/go-to-the-atlas.aspx
§ U.S. Department of Energy: Commercial Buildings Energy Consumption Survey (CBECS): http://www.eia.gov/consumption/commercial/
§ U.S. Drought Monitor: http://droughtmonitor.unl.edu § U.S. Environmental Protection Agency
o Water Quality Assessment and Total Maximum Daily Loads Information: http://www.epa.gov/waters/ir/
§ U.S. Geological Survey (USGS): o Climate and Land Use Change: http://www.usgs.gov/climate_landuse/ o National Land Cover Database: http://www.mrlc.gov/nlcd2001.php o National Water Information System: http://waterdata.usgs.gov/usa/nwis/rt o WaterWatch: http://waterwatch.usgs.gov o Water Use in the United States: http://water.usgs.gov/watuse/
Role of State / Territorial Health Department
§ Report epidemiological assessment of the risk of food-borne disease, particularly for vulnerable populations.
§ Technical resource to local health departments. § Educate the public.
ASTHO Extreme Weather and Climate Readiness: Toolkit for State and Territorial Health Departments 52
SPOTLIGHT ON PRACTICE ACTIVITY 3: Integrating Climate Readiness into Tracking Programs
Tip for Finding Helpful Resources: Use your state or territory's climate assessment and / or action plan to identify priority climate risks and their impact on food safety. If state- / territory-specific resources are not available, use the list of resources under "Step 1: Forecast Climate Impacts; Assess Vulnerabilities" in the Climate Readiness Assessment Resources section of this document.
What would a climate ready food safety tracking program look like in your state or
territory?
Step 1. List the climate risk identified with an asterisk in Activity 1.a. Step 2. List three of the coordinated / integrated programs that you identified in Activity 2. Step 3. For each program, list the indicators that a typical food safety program would collect, the indicators
that a typical partner agency would collect, and any new indicators that would be required to enhance climate readiness.
Step 4. For each new indicator, identify the likely lead agency for data collection and whether or not the data is currently being collected.
Step 5. Describe how the coordinated / integrated tracking system would benefit a climate ready food safety program in your state.
Climate Risk: Food Safety
Indicators (Location)
Partner Agency Indicators (Location)
New Indicators (Currently collected?)
Lead Agency for New Indicators
Co-Benefits of Coordination
Program 1: Program 2: Program 3:
ASTHO Extreme Weather and Climate Readiness: Toolkit for State and Territorial Health Departments 53
Triple Bottom Line Benefits of a Climate Ready Food Safety Program Health Co-Benefits: Reduce the number of foodborne illnesses during and after extreme weather events. Economic Co-Benefits: Prevent the spoilage and destruction of foodstuffs due to recalls, spoilage, and transportation disruptions. Environmental Co-Benefits: Reduce energy demand and associated carbon emissions in food processing, storage, transportation, and retail establishments. Enhance soil productivity to reduce the need for fertilizers and pesticides that can cause nonpoint source water pollution. SPOTLIGHT ON PRACTICE ACTIVITY 4: Pulling it All Together
Tip for Finding Helpful Resources: Use your state or territory's climate assessment and / or action plan to identify priority climate risks and their impact on food safety. If state- / territory-specific resources are not available, use the list of resources under "Step 1: Forecast Climate Impacts; Assess Vulnerabilities" in the Climate Readiness Assessment Resources section of this document.
What would a climate ready food safety program look like in your state or territory? Step 1. List the climate risk identified with an asterisk in Activity 1.a. Step 2. List three of the coordinated / integrated programs that you identified in Activity 2 and expanded in
Activity 3.
Step 3. List the activities and data sources that would be provided by each agency involved in the climate ready program. Place an asterisk (*) next to the agency that would likely lead the coordinated effort.
Step 4. Describe the potential co-benefits and co-harms associated with formalizing the coordinated / integrated effort as a program to enhance climate readiness.
Step 5. Identify opportunities to communicate the benefits of closer coordination both with internal and external partners as well as to the general public.
Step 6. List evaluation metrics that should be tracked if the coordinated / integrated program is implemented. Step 7. List the next steps required to move towards implementing the proposed programs. Include as many
details as possible, including deadlines and the person responsible for completing each action item.
ASTHO Extreme Weather and Climate Readiness: Toolkit for State and Territorial Health Departments 54
Climate Risk:
Program 1: Program 2: Program 3: Food Safety
Contribution Indicators (proposed new indicators)
Food Safety Contribution
Indicators (proposed new indicators)
Food Safety Contribution
Indicators (proposed new indicators)
Partner
Agency Contribution
Indicators (proposed new indicators)
Partner Agency Contribution
Indicators (proposed new indicators)
Partner Agency Contribution
Indicators (proposed new indicators)
Co-Benefits Co-Harms Co-Benefits Co-Harms Co-Benefits Co-Harms Communication Opportunities Communication Opportunities Communication Opportunities Internal External Internal External Internal External Evaluation Metrics Evaluation Metrics Evaluation Metrics Next Steps Next Steps Next Steps Action Item Due Date
(Responsible) Action Item Due Date
(Responsible) Action Item Due Date
(Responsible)
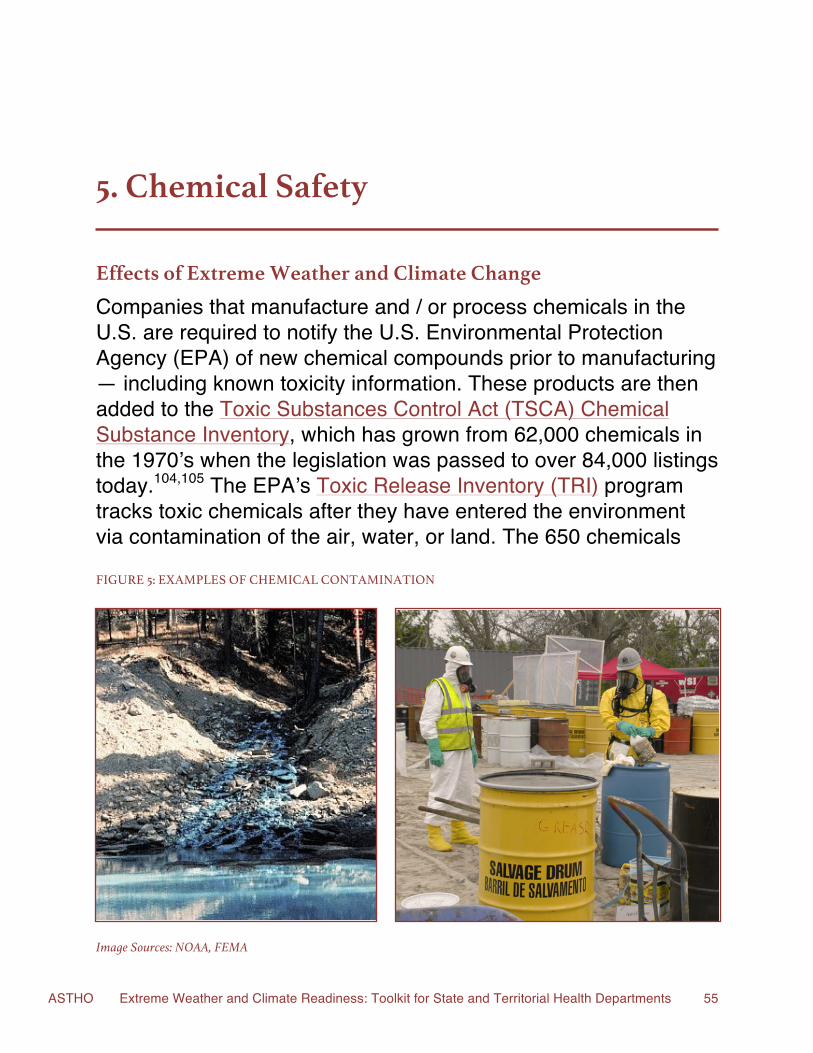
ASTHO Extreme Weather and Climate Readiness: Toolkit for State and Territorial Health Departments 55
5. Chemical Safety
Effects of Extreme Weather and Climate Change Companies that manufacture and / or process chemicals in the U.S. are required to notify the U.S. Environmental Protection Agency (EPA) of new chemical compounds prior to manufacturing — including known toxicity information. These products are then added to the Toxic Substances Control Act (TSCA) Chemical Substance Inventory, which has grown from 62,000 chemicals in the 1970’s when the legislation was passed to over 84,000 listings today.104,105 The EPA’s Toxic Release Inventory (TRI) program tracks toxic chemicals after they have entered the environment via contamination of the air, water, or land. The 650 chemicals
FIGURE 5: EXAMPLES OF CHEMICAL CONTAMINATION
Image Sources: NOAA, FEMA
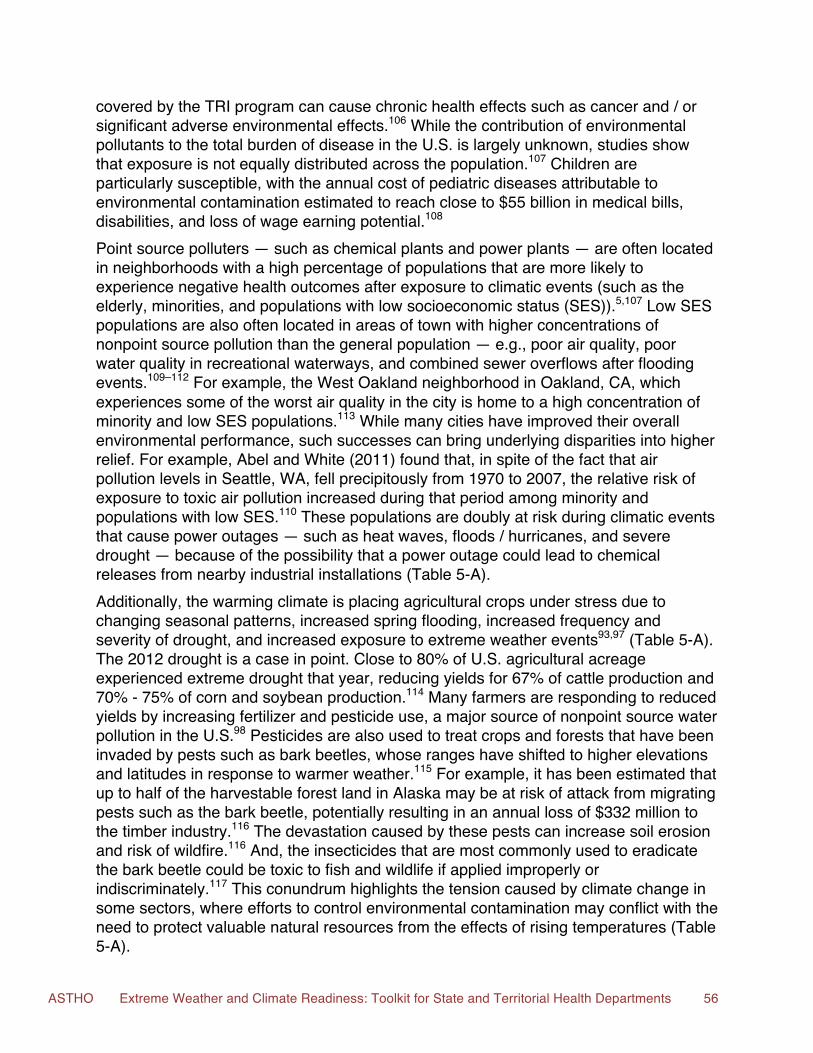
ASTHO Extreme Weather and Climate Readiness: Toolkit for State and Territorial Health Departments 56
covered by the TRI program can cause chronic health effects such as cancer and / or significant adverse environmental effects.106 While the contribution of environmental pollutants to the total burden of disease in the U.S. is largely unknown, studies show that exposure is not equally distributed across the population.107 Children are particularly susceptible, with the annual cost of pediatric diseases attributable to environmental contamination estimated to reach close to $55 billion in medical bills, disabilities, and loss of wage earning potential.108 Point source polluters — such as chemical plants and power plants — are often located in neighborhoods with a high percentage of populations that are more likely to experience negative health outcomes after exposure to climatic events (such as the elderly, minorities, and populations with low socioeconomic status (SES)).5,107 Low SES populations are also often located in areas of town with higher concentrations of nonpoint source pollution than the general population — e.g., poor air quality, poor water quality in recreational waterways, and combined sewer overflows after flooding events.109–112 For example, the West Oakland neighborhood in Oakland, CA, which experiences some of the worst air quality in the city is home to a high concentration of minority and low SES populations.113 While many cities have improved their overall environmental performance, such successes can bring underlying disparities into higher relief. For example, Abel and White (2011) found that, in spite of the fact that air pollution levels in Seattle, WA, fell precipitously from 1970 to 2007, the relative risk of exposure to toxic air pollution increased during that period among minority and populations with low SES.110 These populations are doubly at risk during climatic events that cause power outages — such as heat waves, floods / hurricanes, and severe drought — because of the possibility that a power outage could lead to chemical releases from nearby industrial installations (Table 5-A). Additionally, the warming climate is placing agricultural crops under stress due to changing seasonal patterns, increased spring flooding, increased frequency and severity of drought, and increased exposure to extreme weather events93,97 (Table 5-A). The 2012 drought is a case in point. Close to 80% of U.S. agricultural acreage experienced extreme drought that year, reducing yields for 67% of cattle production and 70% - 75% of corn and soybean production.114 Many farmers are responding to reduced yields by increasing fertilizer and pesticide use, a major source of nonpoint source water pollution in the U.S.98 Pesticides are also used to treat crops and forests that have been invaded by pests such as bark beetles, whose ranges have shifted to higher elevations and latitudes in response to warmer weather.115 For example, it has been estimated that up to half of the harvestable forest land in Alaska may be at risk of attack from migrating pests such as the bark beetle, potentially resulting in an annual loss of $332 million to the timber industry.116 The devastation caused by these pests can increase soil erosion and risk of wildfire.116 And, the insecticides that are most commonly used to eradicate the bark beetle could be toxic to fish and wildlife if applied improperly or indiscriminately.117 This conundrum highlights the tension caused by climate change in some sectors, where efforts to control environmental contamination may conflict with the need to protect valuable natural resources from the effects of rising temperatures (Table 5-A).
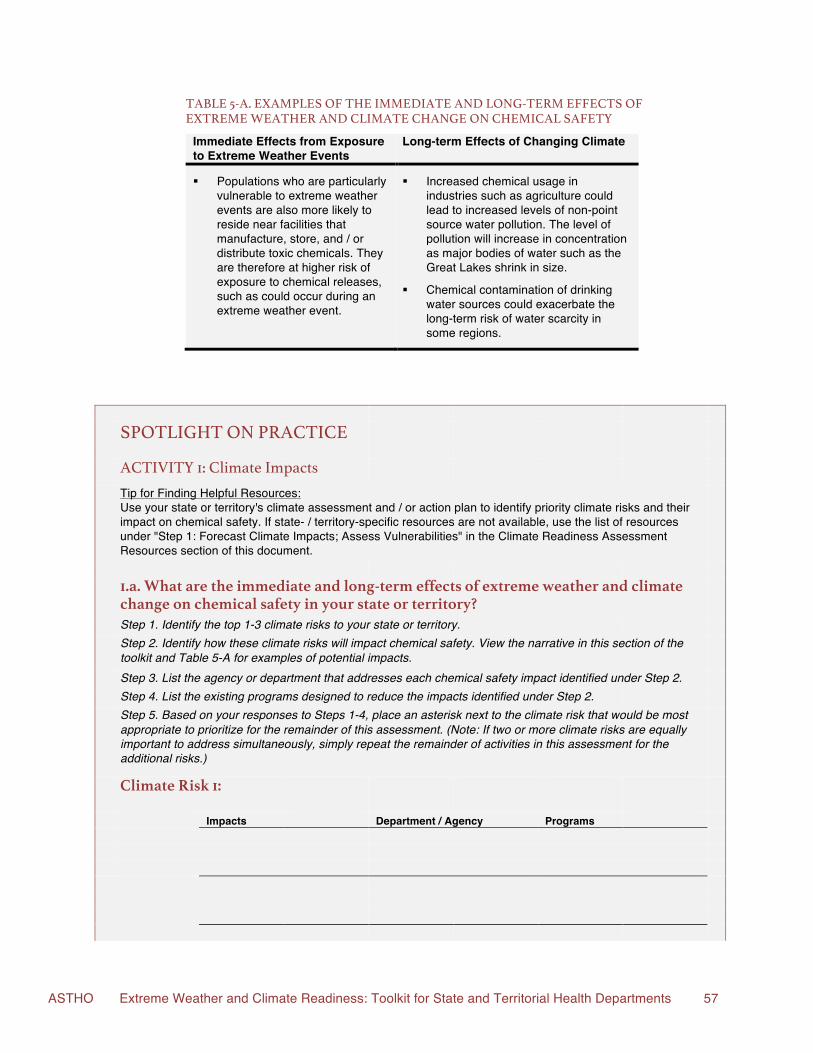
ASTHO Extreme Weather and Climate Readiness: Toolkit for State and Territorial Health Departments 57
TABLE 5-A. EXAMPLES OF THE IMMEDIATE AND LONG-TERM EFFECTS OF EXTREME WEATHER AND CLIMATE CHANGE ON CHEMICAL SAFETY
Immediate Effects from Exposure to Extreme Weather Events
Long-term Effects of Changing Climate
§ Populations who are particularly vulnerable to extreme weather events are also more likely to reside near facilities that manufacture, store, and / or distribute toxic chemicals. They are therefore at higher risk of exposure to chemical releases, such as could occur during an extreme weather event.
§ Increased chemical usage in industries such as agriculture could lead to increased levels of non-point source water pollution. The level of pollution will increase in concentration as major bodies of water such as the Great Lakes shrink in size.
§ Chemical contamination of drinking water sources could exacerbate the long-term risk of water scarcity in some regions.
SPOTLIGHT ON PRACTICE ACTIVITY 1: Climate Impacts
Tip for Finding Helpful Resources: Use your state or territory's climate assessment and / or action plan to identify priority climate risks and their impact on chemical safety. If state- / territory-specific resources are not available, use the list of resources under "Step 1: Forecast Climate Impacts; Assess Vulnerabilities" in the Climate Readiness Assessment Resources section of this document.
1.a. What are the immediate and long-term effects of extreme weather and climate
change on chemical safety in your state or territory?
Step 1. Identify the top 1-3 climate risks to your state or territory. Step 2. Identify how these climate risks will impact chemical safety. View the narrative in this section of the
toolkit and Table 5-A for examples of potential impacts.
Step 3. List the agency or department that addresses each chemical safety impact identified under Step 2. Step 4. List the existing programs designed to reduce the impacts identified under Step 2. Step 5. Based on your responses to Steps 1-4, place an asterisk next to the climate risk that would be most
appropriate to prioritize for the remainder of this assessment. (Note: If two or more climate risks are equally important to address simultaneously, simply repeat the remainder of activities in this assessment for the additional risks.)
Climate Risk 1:
Impacts Department / Agency Programs
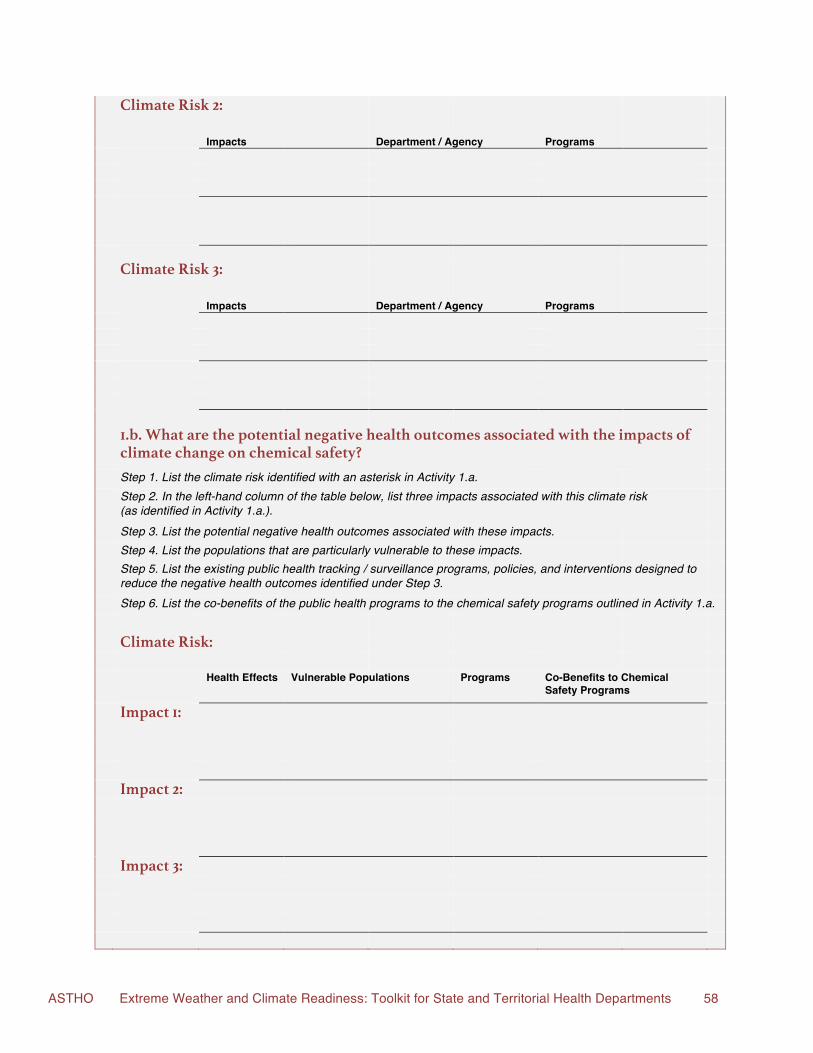
ASTHO Extreme Weather and Climate Readiness: Toolkit for State and Territorial Health Departments 58
Climate Risk 2:
Impacts Department / Agency Programs Climate Risk 3:
Impacts Department / Agency Programs 1.b. What are the potential negative health outcomes associated with the impacts of
climate change on chemical safety?
Step 1. List the climate risk identified with an asterisk in Activity 1.a. Step 2. In the left-hand column of the table below, list three impacts associated with this climate risk
(as identified in Activity 1.a.).
Step 3. List the potential negative health outcomes associated with these impacts. Step 4. List the populations that are particularly vulnerable to these impacts. Step 5. List the existing public health tracking / surveillance programs, policies, and interventions designed to
reduce the negative health outcomes identified under Step 3.
Step 6. List the co-benefits of the public health programs to the chemical safety programs outlined in Activity 1.a. Climate Risk: Health Effects Vulnerable Populations Programs Co-Benefits to Chemical
Safety Programs
Impact 1: Impact 2: Impact 3:
ASTHO Extreme Weather and Climate Readiness: Toolkit for State and Territorial Health Departments 59
Integrating Climate Planning into Existing Programs Bringing a climate ready approach to chemical safety programs requires a two-pronged approach. First, populations should be identified that are both at risk of exposure to chemical spills and more likely to experience negative health outcomes associated with extreme weather events. These groups should be prioritized for evacuation during events. And, their homes and businesses should be prioritized for decontamination during the reconstruction period. The University of California, Berkeley developed a methodology of this approach for the California Energy Commission. The final product combines environmental exposure indicators with a cumulative environmental hazard inequality index to identify populations with particularly high vulnerability to the health impacts of climate change.118 Over the long-term, community resilience interventions should target areas where these populations live and work to reduce their vulnerability to both hazards. Regarding nonpoint source chemical pollution, particularly of water bodies, chemical safety programs should work with the EPA, the U.S. Department of Agriculture (USDA), state and territorial water safety programs, and external partners to reduce the quantity of agricultural chemicals in stormwater runoff. For example, an assessment of the likely effects of climate change on annual precipitation in the Lake Champlain region resulted in a reevaluation of the Total Maximum Daily Load (TMDL) of phosphorous allowed in contributing watersheds.119 This change will affect watersheds in two states (Vermont and New York) and may result in the EPA incorporating climate change projections into all nonpoint source pollution assessments.
EXAMPLES OF OPPORTUNITIES TO INTEGRATE CLIMATE READINESS INTO EXISTING PROGRAMS:
§ Performing climate change vulnerability assessments incorporating risk of exposure caused directly by extreme weather events and / or as a result of prolonged power outages.
§ Targeting chemical prevention regulations to reduce the risk of exposure to populations whose vulnerability to adverse outcomes will be exacerbated during and after extreme weather events.
§ Work with EPA, USDA, and state and territorial water safety programs to reduce chemical use leading to nonpoint source water pollution.
ASTHO Extreme Weather and Climate Readiness: Toolkit for State and Territorial Health Departments 60
SPOTLIGHT ON PRACTICE ACTIVITY 2: Integrating Climate Planning into Existing Programs
Tip for Finding Helpful Resources: Use your state or territory's climate assessment and / or action plan to identify priority climate risks and their impact on chemical safety. If state- / territory-specific resources are not available, use the list of resources under "Step 1: Forecast Climate Impacts; Assess Vulnerabilities" in the Climate Readiness Assessment Resources section of this document.
What opportunities are available to integrate climate readiness into public health
and chemical safety programs?
Step 1. List the climate risk identified with an asterisk in Activity 1.a. Step 2. List the three impacts associated with the climate risk that you expanded in Activity 1.b. Step 3. Reviewing your answers to Activities 1.a and 1.b, identify programs that, if coordinated, could
enhance your state or territory's ability to prepare for the effects of climate change on chemical safety.
Step 4. Identify ways in which these programs are currently coordinating with each other and opportunities for enhanced coordination in the future.
Step 5. Explain how a coordinated / integrated program would bring value to all partnering agencies and how it would enhance climate readiness.
Climate Risk:
Chemical Safety Program(s)
Public Health Program(s)
Other Program(s) (Lead agency)
Current Coordination / Integration
Opportunities
Benefits of Coordination / Integration
Impact 1: Impact 2: Impact 3:
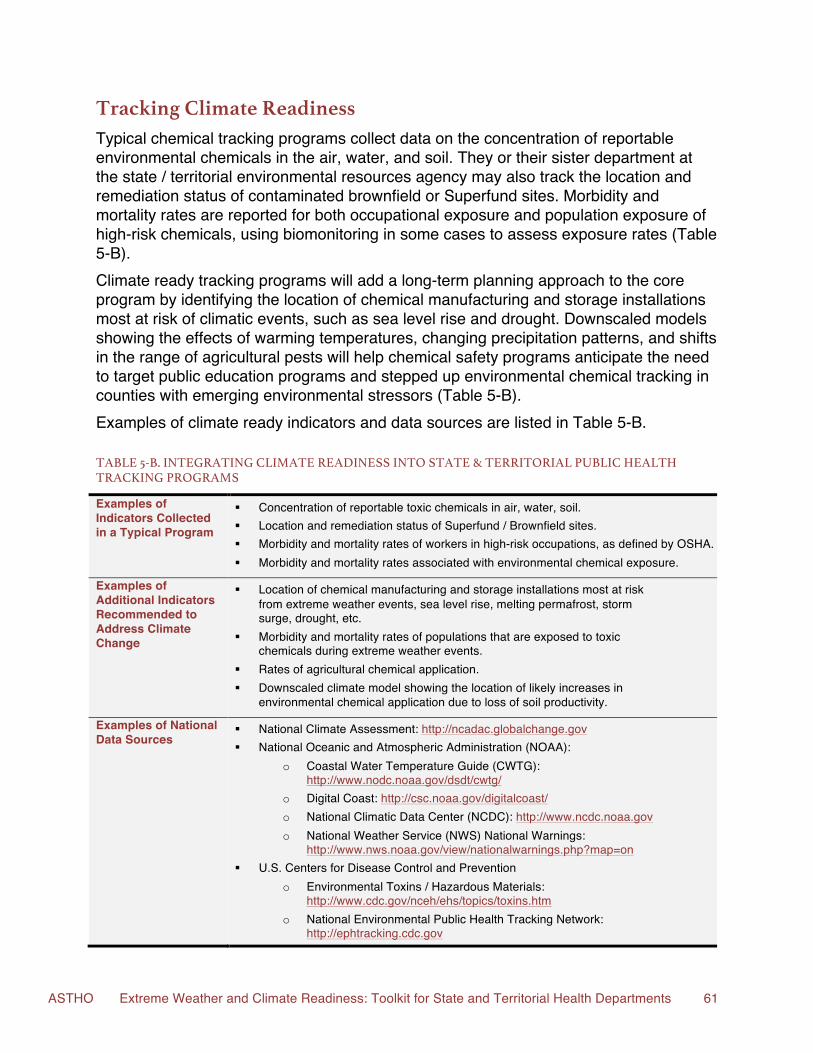
ASTHO Extreme Weather and Climate Readiness: Toolkit for State and Territorial Health Departments 61
Tracking Climate Readiness Typical chemical tracking programs collect data on the concentration of reportable environmental chemicals in the air, water, and soil. They or their sister department at the state / territorial environmental resources agency may also track the location and remediation status of contaminated brownfield or Superfund sites. Morbidity and mortality rates are reported for both occupational exposure and population exposure of high-risk chemicals, using biomonitoring in some cases to assess exposure rates (Table 5-B). Climate ready tracking programs will add a long-term planning approach to the core program by identifying the location of chemical manufacturing and storage installations most at risk of climatic events, such as sea level rise and drought. Downscaled models showing the effects of warming temperatures, changing precipitation patterns, and shifts in the range of agricultural pests will help chemical safety programs anticipate the need to target public education programs and stepped up environmental chemical tracking in counties with emerging environmental stressors (Table 5-B). Examples of climate ready indicators and data sources are listed in Table 5-B.
TABLE 5-B. INTEGRATING CLIMATE READINESS !INTO STATE & TERRITORIAL PUBLIC HEALTH TRACKING PROGRAMS
Examples of Indicators Collected in a Typical Program
§ Concentration of reportable toxic chemicals in air, water, soil. § Location and remediation status of Superfund / Brownfield sites. § Morbidity and mortality rates of workers in high-risk occupations, as defined by OSHA. § Morbidity and mortality rates associated with environmental chemical exposure.
Examples of Additional Indicators Recommended to Address Climate Change
§ Location of chemical manufacturing and storage installations most at risk from extreme weather events, sea level rise, melting permafrost, storm surge, drought, etc.
§ Morbidity and mortality rates of populations that are exposed to toxic chemicals during extreme weather events.
§ Rates of agricultural chemical application. § Downscaled climate model showing the location of likely increases in
environmental chemical application due to loss of soil productivity.
Examples of National Data Sources
§ National Climate Assessment: http://ncadac.globalchange.gov § National Oceanic and Atmospheric Administration (NOAA):
o Coastal Water Temperature Guide (CWTG): http://www.nodc.noaa.gov/dsdt/cwtg/
o Digital Coast: http://csc.noaa.gov/digitalcoast/ o National Climatic Data Center (NCDC): http://www.ncdc.noaa.gov o National Weather Service (NWS) National Warnings:
http://www.nws.noaa.gov/view/nationalwarnings.php?map=on § U.S. Centers for Disease Control and Prevention
o Environmental Toxins / Hazardous Materials: http://www.cdc.gov/nceh/ehs/topics/toxins.htm
o National Environmental Public Health Tracking Network: http://ephtracking.cdc.gov
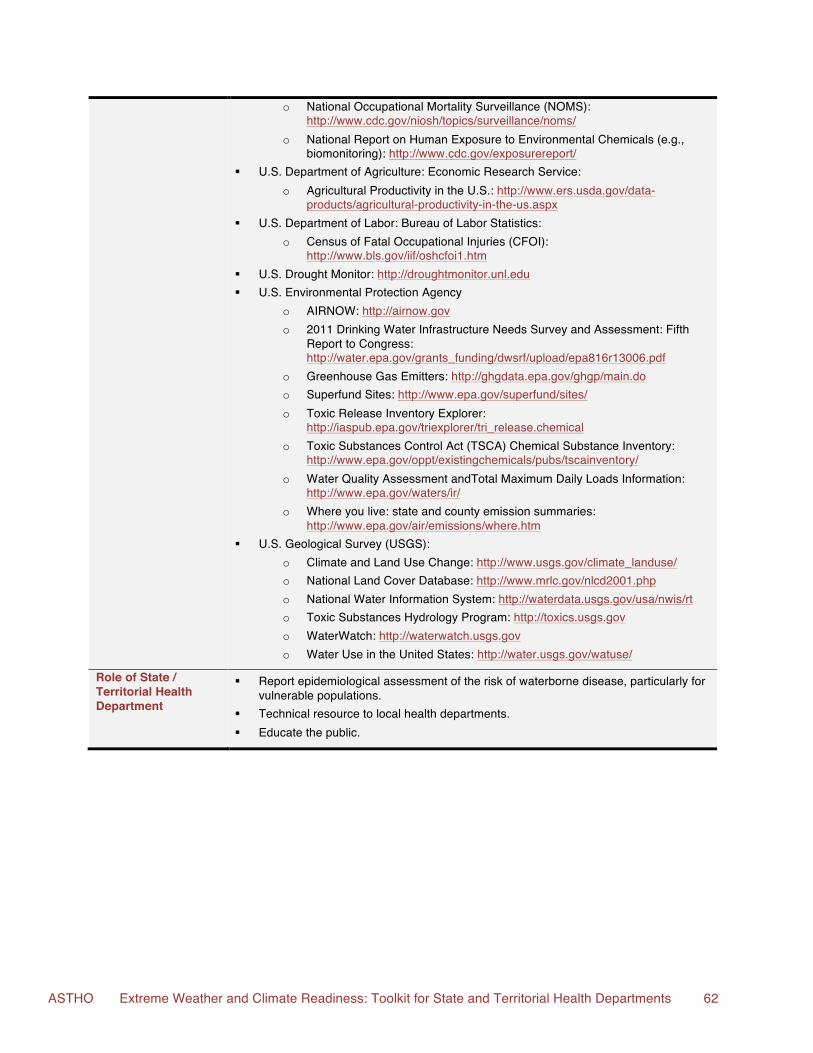
ASTHO Extreme Weather and Climate Readiness: Toolkit for State and Territorial Health Departments 62
o National Occupational Mortality Surveillance (NOMS): http://www.cdc.gov/niosh/topics/surveillance/noms/
o National Report on Human Exposure to Environmental Chemicals (e.g., biomonitoring): http://www.cdc.gov/exposurereport/
§ U.S. Department of Agriculture: Economic Research Service: o Agricultural Productivity in the U.S.: http://www.ers.usda.gov/data-
products/agricultural-productivity-in-the-us.aspx § U.S. Department of Labor: Bureau of Labor Statistics:
o Census of Fatal Occupational Injuries (CFOI): http://www.bls.gov/iif/oshcfoi1.htm
§ U.S. Drought Monitor: http://droughtmonitor.unl.edu § U.S. Environmental Protection Agency
o AIRNOW: http://airnow.gov o 2011 Drinking Water Infrastructure Needs Survey and Assessment: Fifth
Report to Congress: http://water.epa.gov/grants_funding/dwsrf/upload/epa816r13006.pdf
o Greenhouse Gas Emitters: http://ghgdata.epa.gov/ghgp/main.do o Superfund Sites: http://www.epa.gov/superfund/sites/ o Toxic Release Inventory Explorer:
http://iaspub.epa.gov/triexplorer/tri_release.chemical o Toxic Substances Control Act (TSCA) Chemical Substance Inventory:
http://www.epa.gov/oppt/existingchemicals/pubs/tscainventory/ o Water Quality Assessment and Total Maximum Daily Loads Information:
http://www.epa.gov/waters/ir/ o Where you live: state and county emission summaries:
http://www.epa.gov/air/emissions/where.htm § U.S. Geological Survey (USGS):
o Climate and Land Use Change: http://www.usgs.gov/climate_landuse/ o National Land Cover Database: http://www.mrlc.gov/nlcd2001.php o National Water Information System: http://waterdata.usgs.gov/usa/nwis/rt o Toxic Substances Hydrology Program: http://toxics.usgs.gov o WaterWatch: http://waterwatch.usgs.gov o Water Use in the United States: http://water.usgs.gov/watuse/
Role of State / Territorial Health Department
§ Report epidemiological assessment of the risk of waterborne disease, particularly for vulnerable populations.
§ Technical resource to local health departments. § Educate the public.
ASTHO Extreme Weather and Climate Readiness: Toolkit for State and Territorial Health Departments 63
SPOTLIGHT ON PRACTICE ACTIVITY 3: Integrating Climate Readiness into Tracking Programs
Tip for Finding Helpful Resources: Use your state or territory's climate assessment and / or action plan to identify priority climate risks and their impact on chemical safety. If state- / territory-specific resources are not available, use the list of resources under "Step 1: Forecast Climate Impacts; Assess Vulnerabilities" in the Climate Readiness Assessment Resources section of this document.
What would a climate ready chemical safety tracking program look like in your
state or territory?
Step 1. List the climate risk identified with an asterisk in Activity 1.a. Step 2. List three of the coordinated / integrated programs that you identified in Activity 2. Step 3. For each program, list the indicators that a typical chemical safety program would collect, the
indicators that a typical health agency would collect, and any new indicators that would be required to enhance climate readiness.
Step 4. For each new indicator, identify the likely lead agency for data collection and whether or not the data is currently being collected.
Step 5. Describe how the coordinated / integrated tracking system would benefit a climate ready chemical safety program in your state or territory.
Climate Risk: Chemical
Safety Indicators (Location)
Public Health Indicators (Location)
New Indicators (Currently collected?)
Lead Agency for New Indicators
Co-Benefits of Coordination
Program 1: Program 2: Program 3:
ASTHO Extreme Weather and Climate Readiness: Toolkit for State and Territorial Health Departments 64
Triple Bottom Line Benefits Health Co-Benefits: Reduce adverse outcomes from chemical exposure during and after extreme weather events. Reduce the negative health outcomes associated with long-term, low level environmental exposure to toxic chemicals in the air, water, and soil. Economic Co-Benefits: Reduce the risk of clean ups and lawsuits resulting from chemical spills. Substantial savings through decreased medical costs. Environmental Co-Benefits: Increase the long-term resilience of the nation’s environmental resources. SPOTLIGHT ON PRACTICE ACTIVITY 4: Pulling it All Together
Tip for Finding Helpful Resources: Use your state or territory's climate assessment and / or action plan to identify priority climate risks and their impact on chemical safety. If state- / territory-specific resources are not available, use the list of resources under "Step 1: Forecast Climate Impacts; Assess Vulnerabilities" in the Climate Readiness Assessment Resources section of this document.
What would a climate ready chemical safety program look like in your state or
territory?
Step 1. List the climate risk identified with an asterisk in Activity 1.a. Step 2. List three of the coordinated / integrated programs that you identified in Activity 2 and expanded in
Activity 3.
Step 3. List the activities and data sources that would be provided by each agency involved in the climate ready program. Place an asterisk (*) next to the agency that would likely lead the coordinated effort.
Step 4. Describe the potential co-benefits and co-harms associated with formalizing the coordinated / integrated effort as a program to enhance climate readiness.
Step 5. Identify opportunities to communicate the benefits of closer coordination both with internal and external partners as well as to the general public.
Step 6. List evaluation metrics that should be tracked if the coordinated / integrated program is implemented. Step 7. List the next steps required to move towards implementing the proposed programs. Include as many
details as possible, including deadlines and the person responsible for completing each action item.
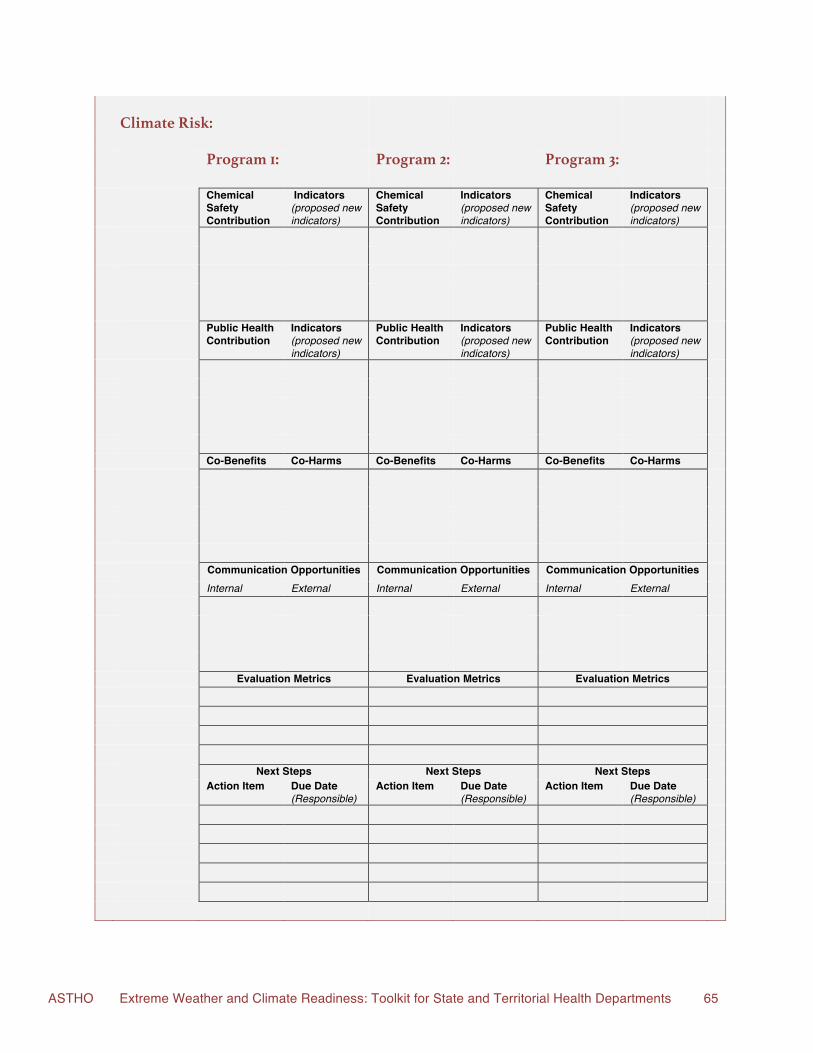
ASTHO Extreme Weather and Climate Readiness: Toolkit for State and Territorial Health Departments 65
Climate Risk:
Program 1: Program 2: Program 3: Chemical
Safety Contribution
Indicators (proposed new indicators)
Chemical Safety Contribution
Indicators (proposed new indicators)
Chemical Safety Contribution
Indicators (proposed new indicators)
Public Health
Contribution Indicators (proposed new indicators)
Public Health Contribution
Indicators (proposed new indicators)
Public Health Contribution
Indicators (proposed new indicators)
Co-Benefits Co-Harms Co-Benefits Co-Harms Co-Benefits Co-Harms Communication Opportunities Communication Opportunities Communication Opportunities Internal External Internal External Internal External Evaluation Metrics Evaluation Metrics Evaluation Metrics Next Steps Next Steps Next Steps Action Item Due Date
(Responsible) Action Item Due Date
(Responsible) Action Item Due Date
(Responsible)
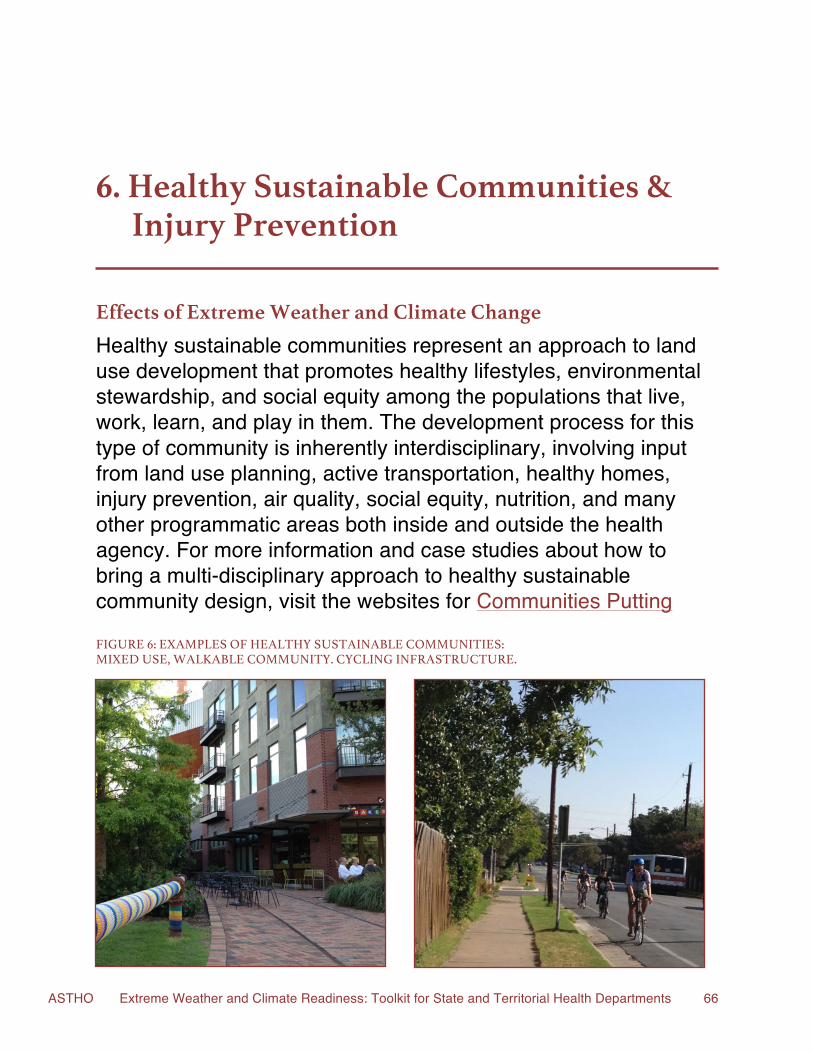
ASTHO Extreme Weather and Climate Readiness: Toolkit for State and Territorial Health Departments 66
6. Healthy Sustainable Communities &
Injury Prevention
Effects of Extreme Weather and Climate Change Healthy sustainable communities represent an approach to land use development that promotes healthy lifestyles, environmental stewardship, and social equity among the populations that live, work, learn, and play in them. The development process for this type of community is inherently interdisciplinary, involving input from land use planning, active transportation, healthy homes, injury prevention, air quality, social equity, nutrition, and many other programmatic areas both inside and outside the health agency. For more information and case studies about how to bring a multi-disciplinary approach to healthy sustainable community design, visit the websites for Communities Putting
FIGURE 6: EXAMPLES OF HEALTHY SUSTAINABLE COMMUNITIES: MIXED USE, WALKABLE COMMUNITY. CYCLING INFRASTRUCTURE.
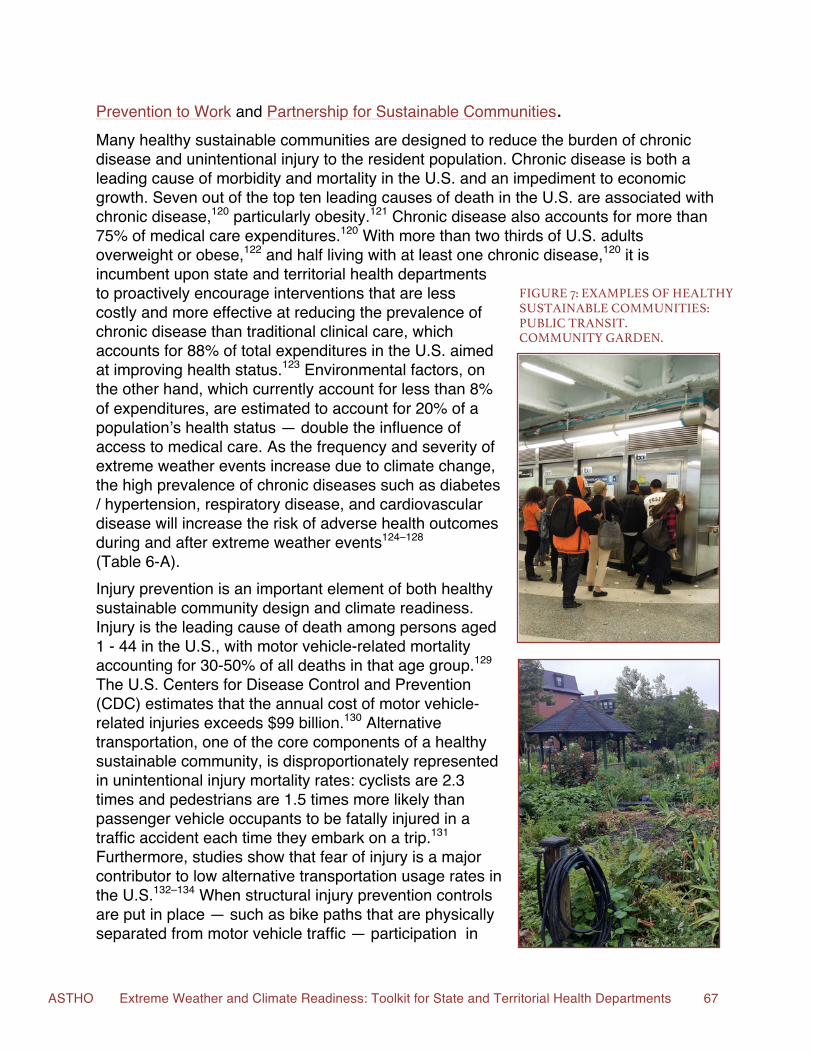
ASTHO Extreme Weather and Climate Readiness: Toolkit for State and Territorial Health Departments 67
Prevention to Work and Partnership for Sustainable Communities. Many healthy sustainable communities are designed to reduce the burden of chronic disease and unintentional injury to the resident population. Chronic disease is both a leading cause of morbidity and mortality in the U.S. and an impediment to economic growth. Seven out of the top ten leading causes of death in the U.S. are associated with chronic disease,120 particularly obesity.121 Chronic disease also accounts for more than 75% of medical care expenditures.120 With more than two thirds of U.S. adults overweight or obese,122 and half living with at least one chronic disease,120 it is incumbent upon state and territorial health departments to proactively encourage interventions that are less costly and more effective at reducing the prevalence of chronic disease than traditional clinical care, which accounts for 88% of total expenditures in the U.S. aimed at improving health status.123 Environmental factors, on the other hand, which currently account for less than 8% of expenditures, are estimated to account for 20% of a population’s health status — double the influence of access to medical care. As the frequency and severity of extreme weather events increase due to climate change, the high prevalence of chronic diseases such as diabetes / hypertension, respiratory disease, and cardiovascular disease will increase the risk of adverse health outcomes during and after extreme weather events124–128 (Table 6-A). Injury prevention is an important element of both healthy sustainable community design and climate readiness. Injury is the leading cause of death among persons aged 1 - 44 in the U.S., with motor vehicle-related mortality accounting for 30-50% of all deaths in that age group.129 The U.S. Centers for Disease Control and Prevention (CDC) estimates that the annual cost of motor vehicle-related injuries exceeds $99 billion.130 Alternative transportation, one of the core components of a healthy sustainable community, is disproportionately represented in unintentional injury mortality rates: cyclists are 2.3 times and pedestrians are 1.5 times more likely than passenger vehicle occupants to be fatally injured in a traffic accident each time they embark on a trip.131 Furthermore, studies show that fear of injury is a major contributor to low alternative transportation usage rates in the U.S.132–134 When structural injury prevention controls are put in place — such as bike paths that are physically separated from motor vehicle traffic — participation in
FIGURE 7: EXAMPLES OF HEALTHY SUSTAINABLE COMMUNITIES: PUBLIC TRANSIT. COMMUNITY GARDEN.
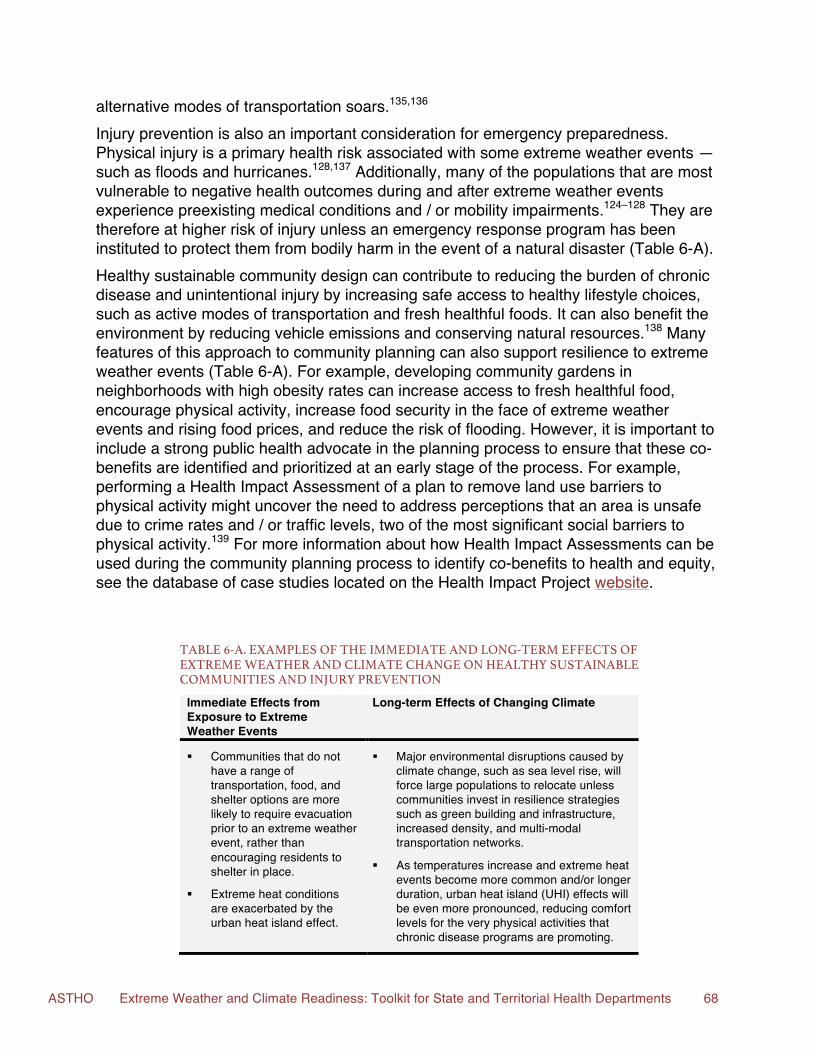
ASTHO Extreme Weather and Climate Readiness: Toolkit for State and Territorial Health Departments 68
alternative modes of transportation soars.135,136 Injury prevention is also an important consideration for emergency preparedness. Physical injury is a primary health risk associated with some extreme weather events —such as floods and hurricanes.128,137 Additionally, many of the populations that are most vulnerable to negative health outcomes during and after extreme weather events experience preexisting medical conditions and / or mobility impairments.124–128 They are therefore at higher risk of injury unless an emergency response program has been instituted to protect them from bodily harm in the event of a natural disaster (Table 6-A). Healthy sustainable community design can contribute to reducing the burden of chronic disease and unintentional injury by increasing safe access to healthy lifestyle choices, such as active modes of transportation and fresh healthful foods. It can also benefit the environment by reducing vehicle emissions and conserving natural resources.138 Many features of this approach to community planning can also support resilience to extreme weather events (Table 6-A). For example, developing community gardens in neighborhoods with high obesity rates can increase access to fresh healthful food, encourage physical activity, increase food security in the face of extreme weather events and rising food prices, and reduce the risk of flooding. However, it is important to include a strong public health advocate in the planning process to ensure that these co-benefits are identified and prioritized at an early stage of the process. For example, performing a Health Impact Assessment of a plan to remove land use barriers to physical activity might uncover the need to address perceptions that an area is unsafe due to crime rates and / or traffic levels, two of the most significant social barriers to physical activity.139 For more information about how Health Impact Assessments can be used during the community planning process to identify co-benefits to health and equity, see the database of case studies located on the Health Impact Project website.
TABLE 6-A. EXAMPLES OF THE IMMEDIATE AND LONG-TERM EFFECTS OF EXTREME WEATHER AND CLIMATE CHANGE ON HEALTHY SUSTAINABLE COMMUNITIES AND INJURY PREVENTION
Immediate Effects from Exposure to Extreme Weather Events
Long-term Effects of Changing Climate
§ Communities that do not have a range of transportation, food, and shelter options are more likely to require evacuation prior to an extreme weather event, rather than encouraging residents to shelter in place.
§ Extreme heat conditions are exacerbated by the urban heat island effect.
§ Major environmental disruptions caused by climate change, such as sea level rise, will force large populations to relocate unless communities invest in resilience strategies such as green building and infrastructure, increased density, and multi-modal transportation networks.
§ As temperatures increase and extreme heat events become more common and/or longer duration, urban heat island (UHI) effects will be even more pronounced, reducing comfort levels for the very physical activities that chronic disease programs are promoting.
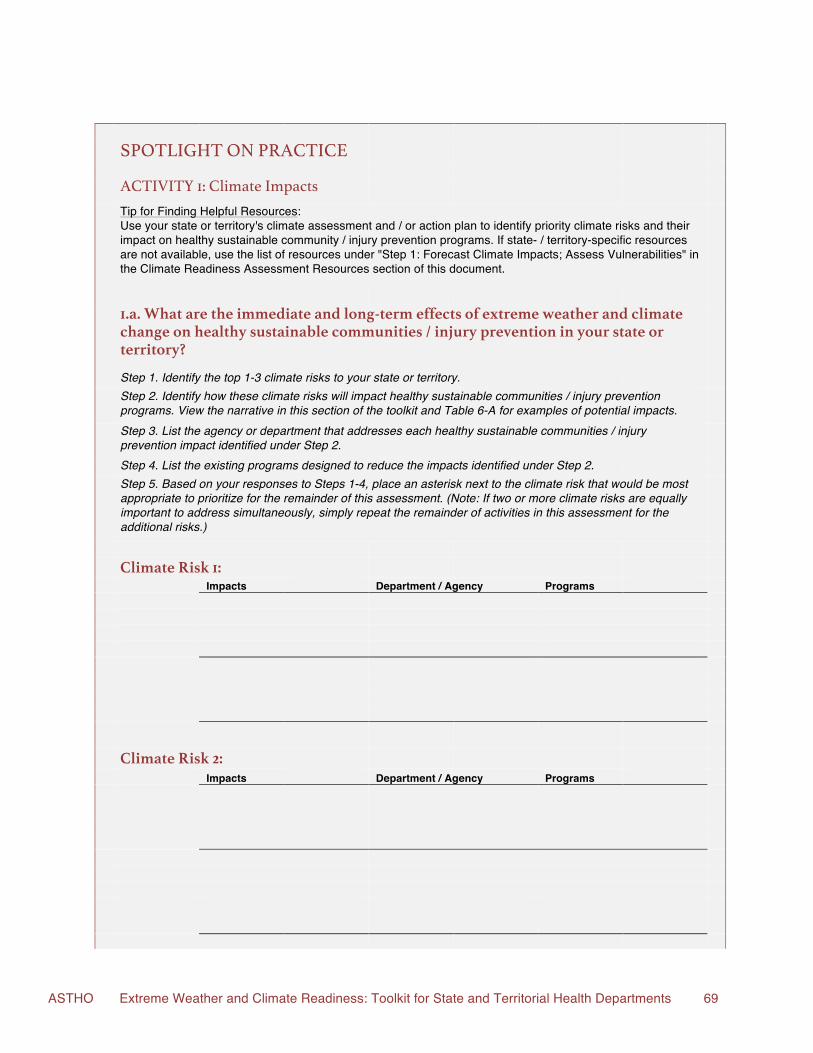
ASTHO Extreme Weather and Climate Readiness: Toolkit for State and Territorial Health Departments 69
SPOTLIGHT ON PRACTICE ACTIVITY 1: Climate Impacts
Tip for Finding Helpful Resources: Use your state or territory's climate assessment and / or action plan to identify priority climate risks and their impact on healthy sustainable community / injury prevention programs. If state- / territory-specific resources are not available, use the list of resources under "Step 1: Forecast Climate Impacts; Assess Vulnerabilities" in the Climate Readiness Assessment Resources section of this document.
1.a. What are the immediate and long-term effects of extreme weather and climate
change on healthy sustainable communities / injury prevention in your state or territory?
Step 1. Identify the top 1-3 climate risks to your state or territory.
Step 2. Identify how these climate risks will impact healthy sustainable communities / injury prevention programs. View the narrative in this section of the toolkit and Table 6-A for examples of potential impacts.
Step 3. List the agency or department that addresses each healthy sustainable communities / injury prevention impact identified under Step 2.
Step 4. List the existing programs designed to reduce the impacts identified under Step 2.
Step 5. Based on your responses to Steps 1-4, place an asterisk next to the climate risk that would be most appropriate to prioritize for the remainder of this assessment. (Note: If two or more climate risks are equally important to address simultaneously, simply repeat the remainder of activities in this assessment for the additional risks.)
Climate Risk 1: Impacts Department / Agency Programs
Climate Risk 2: Impacts Department / Agency Programs
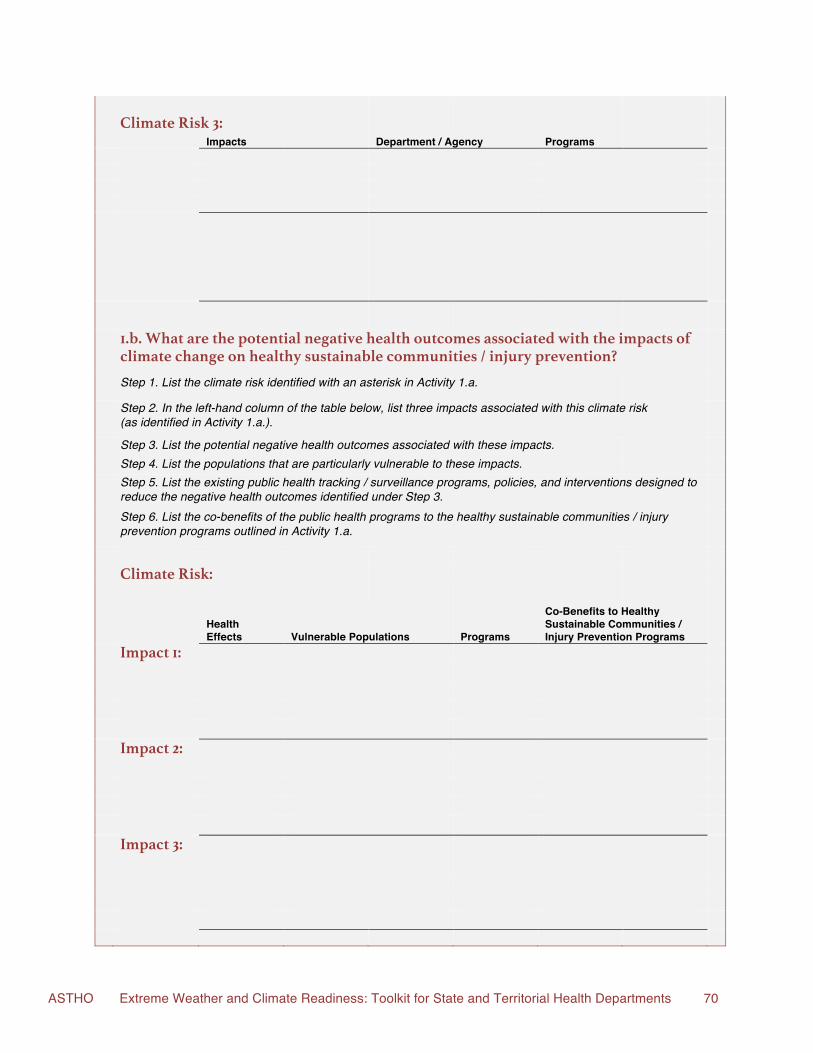
ASTHO Extreme Weather and Climate Readiness: Toolkit for State and Territorial Health Departments 70
Climate Risk 3:
Impacts Department / Agency Programs
1.b. What are the potential negative health outcomes associated with the impacts of climate change on healthy sustainable communities / injury prevention?
Step 1. List the climate risk identified with an asterisk in Activity 1.a.
Step 2. In the left-hand column of the table below, list three impacts associated with this climate risk (as identified in Activity 1.a.).
Step 3. List the potential negative health outcomes associated with these impacts. Step 4. List the populations that are particularly vulnerable to these impacts.
Step 5. List the existing public health tracking / surveillance programs, policies, and interventions designed to reduce the negative health outcomes identified under Step 3.
Step 6. List the co-benefits of the public health programs to the healthy sustainable communities / injury prevention programs outlined in Activity 1.a.
Climate Risk:
Health Effects Vulnerable Populations Programs
Co-Benefits to Healthy Sustainable Communities / Injury Prevention Programs
Impact 1: Impact 2: Impact 3:
ASTHO Extreme Weather and Climate Readiness: Toolkit for State and Territorial Health Departments 71
Integrating Climate Planning into Existing Programs Healthy sustainable community policies often fall within the scope of local jurisdictions or metropolitan planning organizations. As a result, the state / territorial health department generally develops guidelines, sets goals, or acts as a technical resource and / or a convener for projects at the regional scale. The synergies between climate readiness, healthy sustainable communities, social equity, and injury prevention programs are many and various. In many cases, therefore, tailoring an existing program to incorporate extreme weather and climate preparedness may simply involve two steps: 1) overlaying a downscaled climate model on existing programs; and, 2) incorporating climate and health communication into public education efforts. For example, the Michigan Department of Community Health has used Health Impact Assessments as a tool to encourage local jurisdictions to incorporate climate change into healthy sustainable community planning initiatives.140 Similarly, the State of California Extreme Heat Adaptation Interim Guidance Document recommends incorporating climate readiness strategies such as passive cooling and energy efficiency into community planning and zoning requirements, particularly in neighborhoods with highly vulnerable populations.141
EXAMPLES OF OPPORTUNITIES TO INTEGRATE CLIMATE READINESS INTO EXISTING PROGRAMS:
§ Incorporate preexisting conditions that could increase vulnerability to climate change-related extreme weather events into community health assessments and comprehensive plans.
§ In collaboration with the hazard mitigation / emergency management planning process, incorporate emergency evacuation routes and multiple transportation options into active transportation designs.
§ Integrate remediation of urban heat islands into healthy sustainable community design and active transportation initiatives.
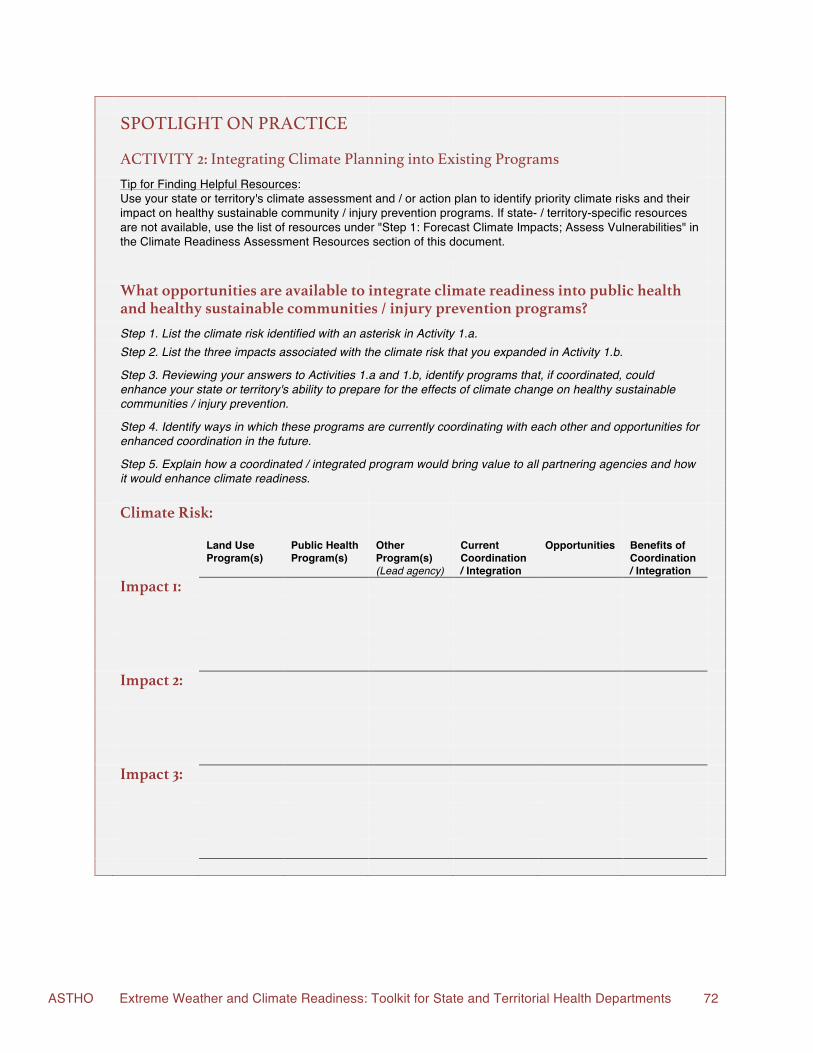
ASTHO Extreme Weather and Climate Readiness: Toolkit for State and Territorial Health Departments 72
SPOTLIGHT ON PRACTICE ACTIVITY 2: Integrating Climate Planning into Existing Programs
Tip for Finding Helpful Resources: Use your state or territory's climate assessment and / or action plan to identify priority climate risks and their impact on healthy sustainable community / injury prevention programs. If state- / territory-specific resources are not available, use the list of resources under "Step 1: Forecast Climate Impacts; Assess Vulnerabilities" in the Climate Readiness Assessment Resources section of this document.
What opportunities are available to integrate climate readiness into public health
and healthy sustainable communities / injury prevention programs?
Step 1. List the climate risk identified with an asterisk in Activity 1.a. Step 2. List the three impacts associated with the climate risk that you expanded in Activity 1.b.
Step 3. Reviewing your answers to Activities 1.a and 1.b, identify programs that, if coordinated, could enhance your state or territory's ability to prepare for the effects of climate change on healthy sustainable communities / injury prevention.
Step 4. Identify ways in which these programs are currently coordinating with each other and opportunities for enhanced coordination in the future.
Step 5. Explain how a coordinated / integrated program would bring value to all partnering agencies and how it would enhance climate readiness.
Climate Risk:
Land Use Program(s)
Public Health Program(s)
Other Program(s) (Lead agency)
Current Coordination / Integration
Opportunities
Benefits of Coordination / Integration
Impact 1: Impact 2: Impact 3:
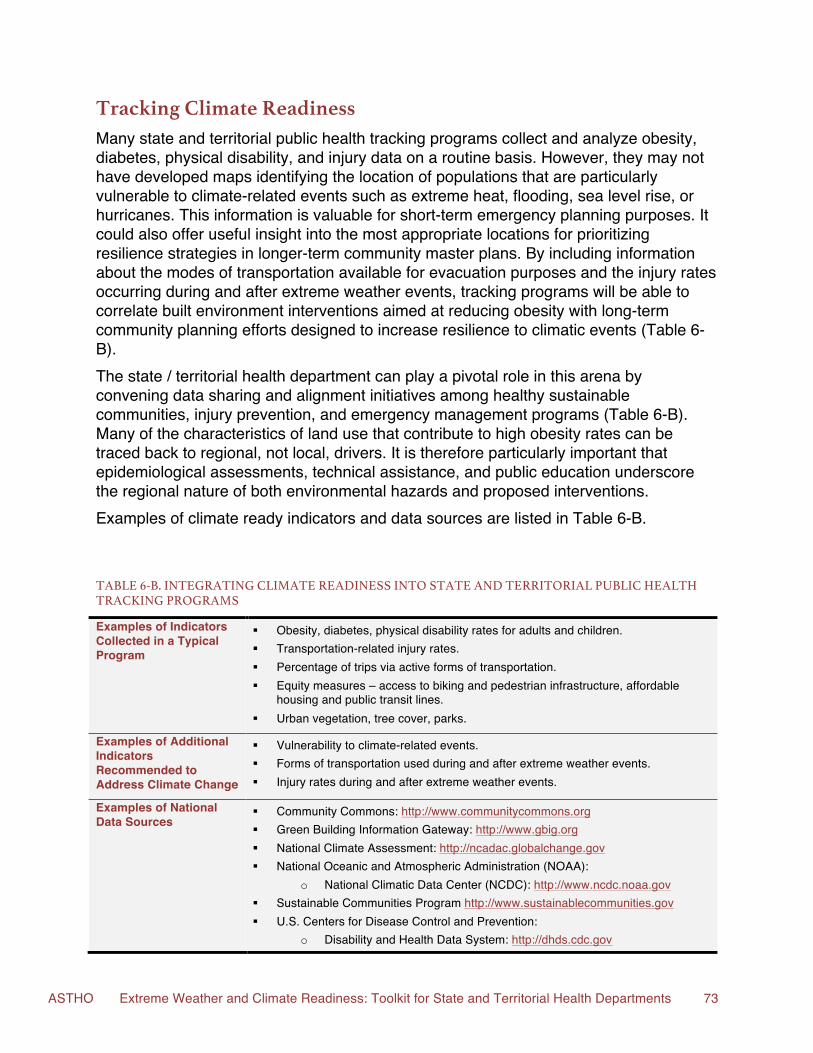
ASTHO Extreme Weather and Climate Readiness: Toolkit for State and Territorial Health Departments 73
Tracking Climate Readiness Many state and territorial public health tracking programs collect and analyze obesity, diabetes, physical disability, and injury data on a routine basis. However, they may not have developed maps identifying the location of populations that are particularly vulnerable to climate-related events such as extreme heat, flooding, sea level rise, or hurricanes. This information is valuable for short-term emergency planning purposes. It could also offer useful insight into the most appropriate locations for prioritizing resilience strategies in longer-term community master plans. By including information about the modes of transportation available for evacuation purposes and the injury rates occurring during and after extreme weather events, tracking programs will be able to correlate built environment interventions aimed at reducing obesity with long-term community planning efforts designed to increase resilience to climatic events (Table 6-B). The state / territorial health department can play a pivotal role in this arena by convening data sharing and alignment initiatives among healthy sustainable communities, injury prevention, and emergency management programs (Table 6-B). Many of the characteristics of land use that contribute to high obesity rates can be traced back to regional, not local, drivers. It is therefore particularly important that epidemiological assessments, technical assistance, and public education underscore the regional nature of both environmental hazards and proposed interventions. Examples of climate ready indicators and data sources are listed in Table 6-B.
TABLE 6-B. INTEGRATING CLIMATE READINESS INTO STATE AND TERRITORIAL PUBLIC HEALTH TRACKING PROGRAMS
Examples of Indicators Collected in a Typical Program
§ Obesity, diabetes, physical disability rates for adults and children. § Transportation-related injury rates. § Percentage of trips via active forms of transportation. § Equity measures – access to biking and pedestrian infrastructure, affordable
housing and public transit lines. § Urban vegetation, tree cover, parks.
Examples of Additional Indicators Recommended to Address Climate Change
§ Vulnerability to climate-related events. § Forms of transportation used during and after extreme weather events. § Injury rates during and after extreme weather events.
Examples of National Data Sources
§ Community Commons: http://www.communitycommons.org § Green Building Information Gateway: http://www.gbig.org § National Climate Assessment: http://ncadac.globalchange.gov § National Oceanic and Atmospheric Administration (NOAA):
o National Climatic Data Center (NCDC): http://www.ncdc.noaa.gov § Sustainable Communities Program http://www.sustainablecommunities.gov § U.S. Centers for Disease Control and Prevention:
o Disability and Health Data System: http://dhds.cdc.gov
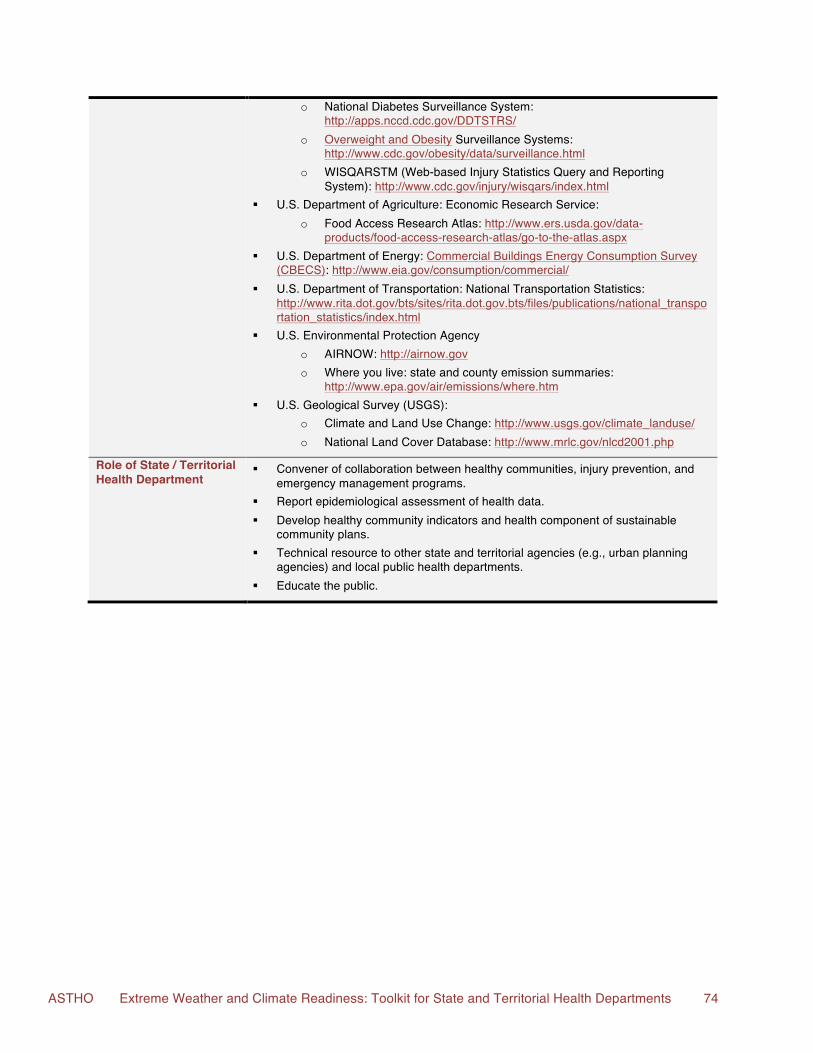
ASTHO Extreme Weather and Climate Readiness: Toolkit for State and Territorial Health Departments 74
o National Diabetes Surveillance System: http://apps.nccd.cdc.gov/DDTSTRS/
o Overweight and Obesity Surveillance Systems: http://www.cdc.gov/obesity/data/surveillance.html
o WISQARSTM (Web-based Injury Statistics Query and Reporting System): http://www.cdc.gov/injury/wisqars/index.html
§ U.S. Department of Agriculture: Economic Research Service: o Food Access Research Atlas: http://www.ers.usda.gov/data-
products/food-access-research-atlas/go-to-the-atlas.aspx § U.S. Department of Energy: Commercial Buildings Energy Consumption Survey
(CBECS): http://www.eia.gov/consumption/commercial/ § U.S. Department of Transportation: National Transportation Statistics:
http://www.rita.dot.gov/bts/sites/rita.dot.gov.bts/files/publications/national_transportation_statistics/index.html
§ U.S. Environmental Protection Agency o AIRNOW: http://airnow.gov o Where you live: state and county emission summaries:
http://www.epa.gov/air/emissions/where.htm § U.S. Geological Survey (USGS):
o Climate and Land Use Change: http://www.usgs.gov/climate_landuse/ o National Land Cover Database: http://www.mrlc.gov/nlcd2001.php
Role of State / Territorial Health Department
§ Convener of collaboration between healthy communities, injury prevention, and emergency management programs.
§ Report epidemiological assessment of health data. § Develop healthy community indicators and health component of sustainable
community plans. § Technical resource to other state and territorial agencies (e.g., urban planning
agencies) and local public health departments. § Educate the public.
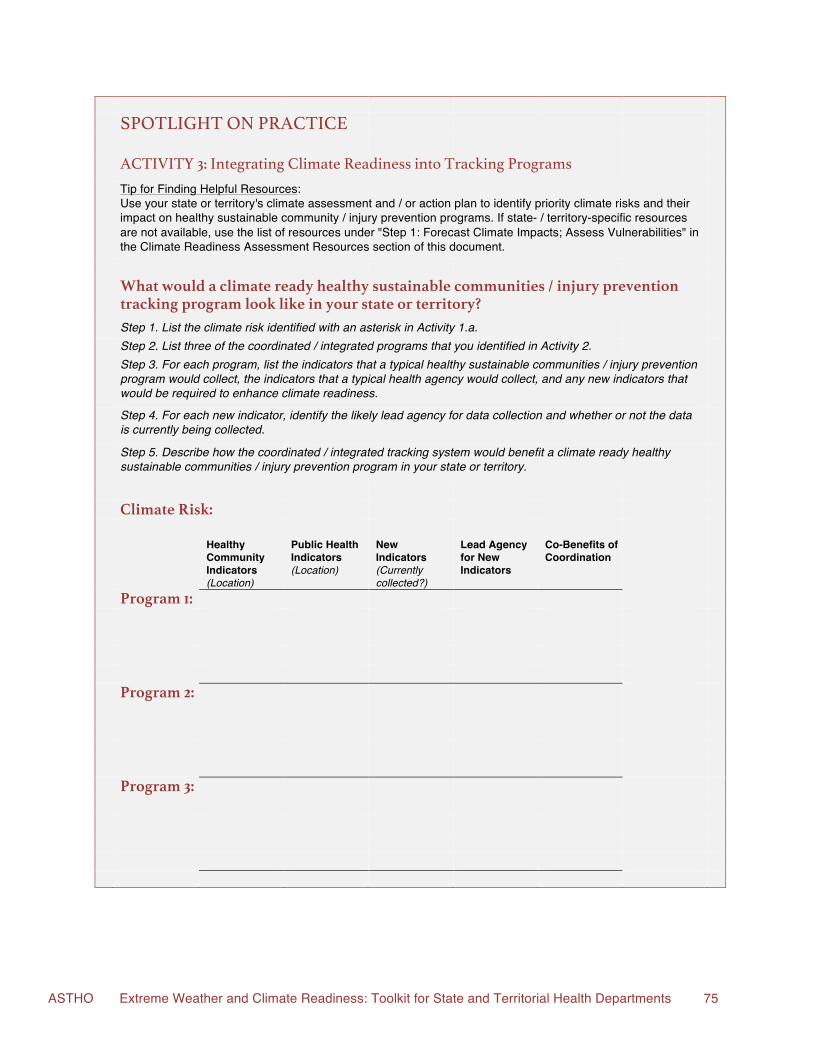
ASTHO Extreme Weather and Climate Readiness: Toolkit for State and Territorial Health Departments 75
SPOTLIGHT ON PRACTICE ACTIVITY 3: Integrating Climate Readiness into Tracking Programs
Tip for Finding Helpful Resources: Use your state or territory's climate assessment and / or action plan to identify priority climate risks and their impact on healthy sustainable community / injury prevention programs. If state- / territory-specific resources are not available, use the list of resources under "Step 1: Forecast Climate Impacts; Assess Vulnerabilities" in the Climate Readiness Assessment Resources section of this document.
What would a climate ready healthy sustainable communities / injury prevention
tracking program look like in your state or territory?
Step 1. List the climate risk identified with an asterisk in Activity 1.a. Step 2. List three of the coordinated / integrated programs that you identified in Activity 2.
Step 3. For each program, list the indicators that a typical healthy sustainable communities / injury prevention program would collect, the indicators that a typical health agency would collect, and any new indicators that would be required to enhance climate readiness.
Step 4. For each new indicator, identify the likely lead agency for data collection and whether or not the data is currently being collected.
Step 5. Describe how the coordinated / integrated tracking system would benefit a climate ready healthy sustainable communities / injury prevention program in your state or territory.
Climate Risk: Healthy
Community Indicators (Location)
Public Health Indicators (Location)
New Indicators (Currently collected?)
Lead Agency for New Indicators
Co-Benefits of Coordination
Program 1: Program 2: Program 3:
ASTHO Extreme Weather and Climate Readiness: Toolkit for State and Territorial Health Departments 76
Triple Bottom Line Benefits Health Co-Benefits: Reduce exposure of populations with preexisting conditions to environmental conditions that could exacerbate their disease during and after an extreme weather event. Economic Co-Benefits: Leverage healthy community funding to increase population resilience to extreme weather and climate change events. Environmental Co-Benefits: Reduce habitat fragmentation in urban areas by increasing vegetation. Increase the opportunity for stormwater runoff to recharge aquifers by increasing the percentage of permeable surfaces in urban areas. SPOTLIGHT ON PRACTICE ACTIVITY 4: Pulling it All Together
Tip for Finding Helpful Resources: Use your state or territory's climate assessment and / or action plan to identify priority climate risks and their impact on healthy sustainable community / injury prevention programs. If state- / territory-specific resources are not available, use the list of resources under "Step 1: Forecast Climate Impacts; Assess Vulnerabilities" in the Climate Readiness Assessment Resources section of this document.
What would a climate ready healthy sustainable communities / injury prevention
program look like in your state or territory?
Step 1. List the climate risk identified with an asterisk in Activity 1.a.
Step 2. List three of the coordinated / integrated programs that you identified in Activity 2 and expanded in Activity 3.
Step 3. List the activities and data sources that would be provided by each agency involved in the climate ready program. Place an asterisk (*) next to the agency that would likely lead the coordinated effort.
Step 4. Describe the potential co-benefits and co-harms associated with formalizing the coordinated / integrated effort as a program to enhance climate readiness.
Step 5. Identify opportunities to communicate the benefits of closer coordination both with internal and external partners as well as to the general public.
Step 6. List evaluation metrics that should be tracked if the coordinated / integrated program is implemented.
Step 7. List the next steps required to move towards implementing the proposed programs. Include as many details as possible, including deadlines and the person responsible for completing each action item.
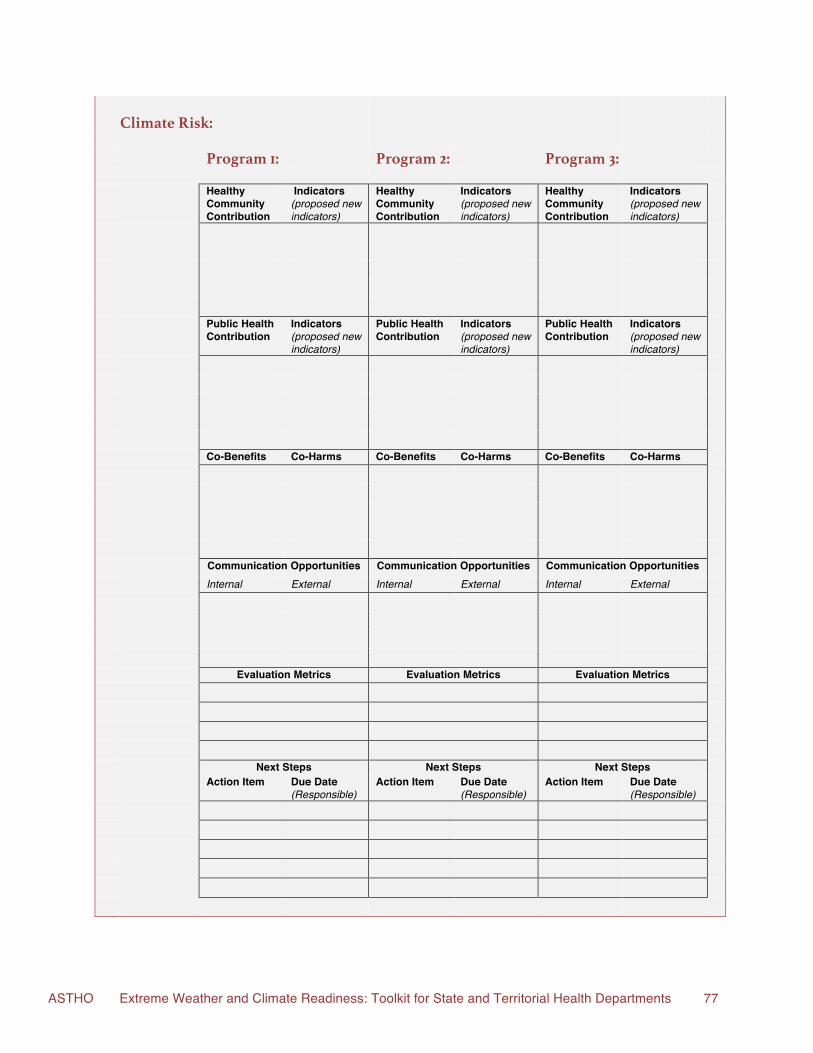
ASTHO Extreme Weather and Climate Readiness: Toolkit for State and Territorial Health Departments 77
Climate Risk:
Program 1: Program 2: Program 3: Healthy
Community Contribution
Indicators (proposed new indicators)
Healthy Community Contribution
Indicators (proposed new indicators)
Healthy Community Contribution
Indicators (proposed new indicators)
Public Health
Contribution Indicators (proposed new indicators)
Public Health Contribution
Indicators (proposed new indicators)
Public Health Contribution
Indicators (proposed new indicators)
Co-Benefits Co-Harms Co-Benefits Co-Harms Co-Benefits Co-Harms Communication Opportunities Communication Opportunities Communication Opportunities Internal External Internal External Internal External Evaluation Metrics Evaluation Metrics Evaluation Metrics Next Steps Next Steps Next Steps Action Item Due Date
(Responsible) Action Item Due Date
(Responsible) Action Item Due Date
(Responsible)
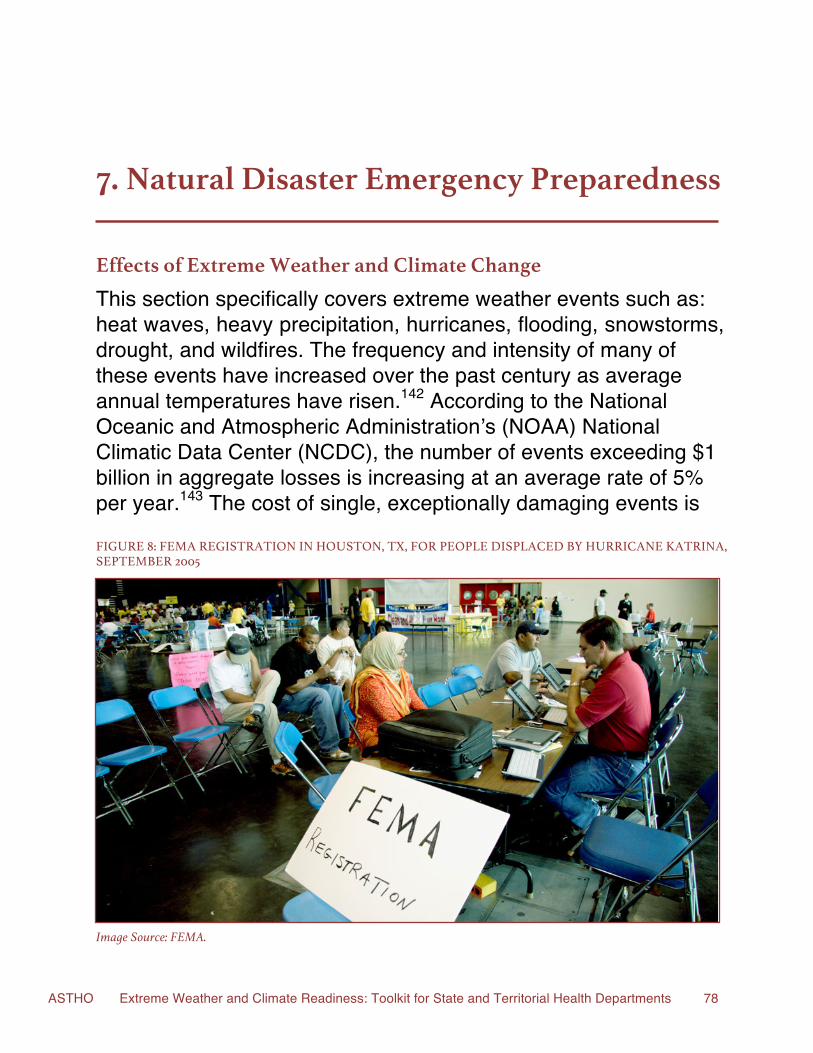
ASTHO Extreme Weather and Climate Readiness: Toolkit for State and Territorial Health Departments 78
7. Natural Disaster Emergency Preparedness
Effects of Extreme Weather and Climate Change This section specifically covers extreme weather events such as: heat waves, heavy precipitation, hurricanes, flooding, snowstorms, drought, and wildfires. The frequency and intensity of many of these events have increased over the past century as average annual temperatures have risen.142 According to the National Oceanic and Atmospheric Administration’s (NOAA) National Climatic Data Center (NCDC), the number of events exceeding $1 billion in aggregate losses is increasing at an average rate of 5% per year.143 The cost of single, exceptionally damaging events is
FIGURE 8: FEMA REGISTRATION IN HOUSTON, TX, FOR PEOPLE DISPLACED BY HURRICANE KATRINA, SEPTEMBER 2005
Image Source: FEMA.
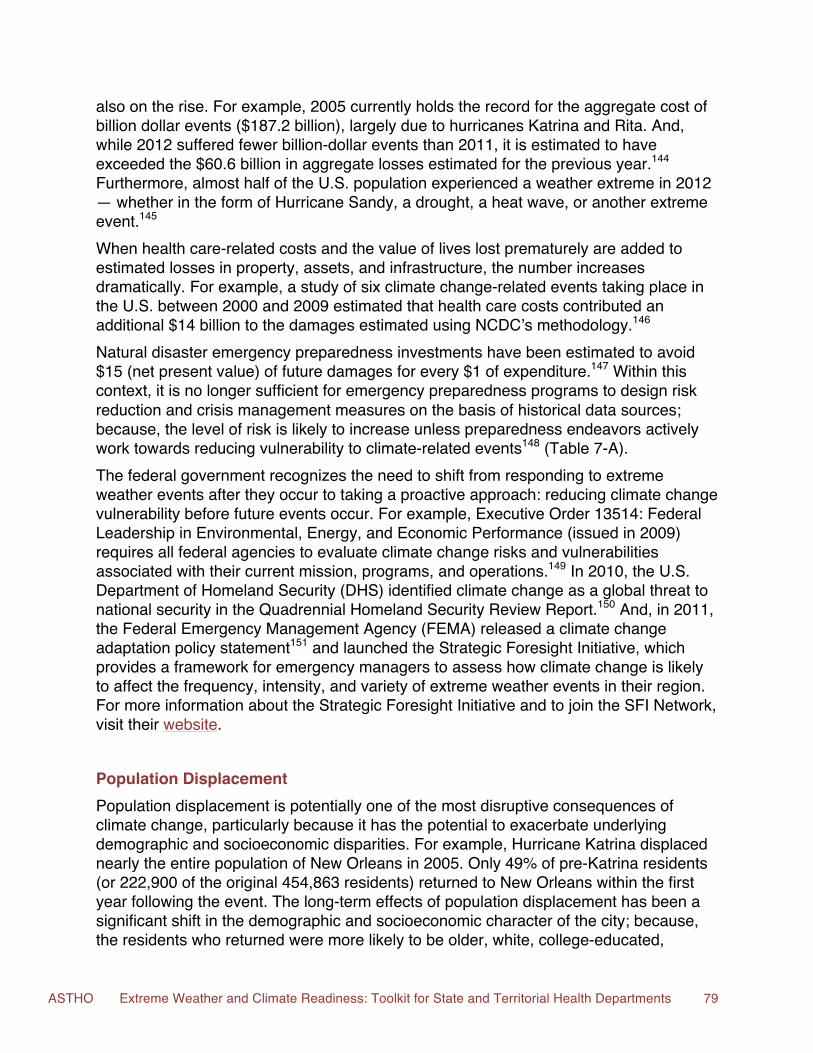
ASTHO Extreme Weather and Climate Readiness: Toolkit for State and Territorial Health Departments 79
also on the rise. For example, 2005 currently holds the record for the aggregate cost of billion dollar events ($187.2 billion), largely due to hurricanes Katrina and Rita. And, while 2012 suffered fewer billion-dollar events than 2011, it is estimated to have exceeded the $60.6 billion in aggregate losses estimated for the previous year.144 Furthermore, almost half of the U.S. population experienced a weather extreme in 2012 — whether in the form of Hurricane Sandy, a drought, a heat wave, or another extreme event.145 When health care-related costs and the value of lives lost prematurely are added to estimated losses in property, assets, and infrastructure, the number increases dramatically. For example, a study of six climate change-related events taking place in the U.S. between 2000 and 2009 estimated that health care costs contributed an additional $14 billion to the damages estimated using NCDC’s methodology.146 Natural disaster emergency preparedness investments have been estimated to avoid $15 (net present value) of future damages for every $1 of expenditure.147 Within this context, it is no longer sufficient for emergency preparedness programs to design risk reduction and crisis management measures on the basis of historical data sources; because, the level of risk is likely to increase unless preparedness endeavors actively work towards reducing vulnerability to climate-related events148 (Table 7-A). The federal government recognizes the need to shift from responding to extreme weather events after they occur to taking a proactive approach: reducing climate change vulnerability before future events occur. For example, Executive Order 13514: Federal Leadership in Environmental, Energy, and Economic Performance (issued in 2009) requires all federal agencies to evaluate climate change risks and vulnerabilities associated with their current mission, programs, and operations.149 In 2010, the U.S. Department of Homeland Security (DHS) identified climate change as a global threat to national security in the Quadrennial Homeland Security Review Report.150 And, in 2011, the Federal Emergency Management Agency (FEMA) released a climate change adaptation policy statement151 and launched the Strategic Foresight Initiative, which provides a framework for emergency managers to assess how climate change is likely to affect the frequency, intensity, and variety of extreme weather events in their region. For more information about the Strategic Foresight Initiative and to join the SFI Network, visit their website. Population Displacement Population displacement is potentially one of the most disruptive consequences of climate change, particularly because it has the potential to exacerbate underlying demographic and socioeconomic disparities. For example, Hurricane Katrina displaced nearly the entire population of New Orleans in 2005. Only 49% of pre-Katrina residents (or 222,900 of the original 454,863 residents) returned to New Orleans within the first year following the event. The long-term effects of population displacement has been a significant shift in the demographic and socioeconomic character of the city; because, the residents who returned were more likely to be older, white, college-educated,
ASTHO Extreme Weather and Climate Readiness: Toolkit for State and Territorial Health Departments 80
employed or retired, and able to return to a habitable house than the average pre-Katrina population.152 The pre-Katrina residents who did not return were disproportionately drawn from populations that have been shown by the scientific literature to be more vulnerable to the negative effects of climate change-related events: low income, minority populations living in neighborhoods that were at higher risk of flooding.5 These populations were also more likely to be unemployed or underemployed and lacking health insurance. Furthermore, many suffered from pre-existing medical conditions.153 Historically, emergency management and their supporting agencies have responded to short-term surges in emergency medical needs during and immediately following extreme weather events. However, the long-term and sometimes permanent strain placed on the public health and medical services of states sheltering evacuees in the wake of hurricanes Katrina and Rita154 demonstrated the need to incorporate plans for supporting permanent population surges in states and territories that receive evacuees from climate change-related extreme weather events. State and territorial health agencies are ideally positioned to track current and likely future demographic shifts related to extreme weather events and climate change, so that resources and services are available to the most vulnerable populations — whether they evacuate temporarily or engage in a permanent move (Table 7-A). Mental Health The need to provide mental health services to both the affected populations and first responders is an emerging priority for emergency management and their supporting agencies. Research on the aftermath of Hurricanes Katrina, Rita, and Sandy has shown that the economic, social, and physical challenges endured by the residents of the affected areas during the event and its immediate aftermath led to post-traumatic stress, particularly among displaced populations. Families whose evacuation evolved into a permanent relocation found it particularly challenging to recover from the stress of disassociation from their previous surroundings and social networks.124,155–157 Climate ready natural disaster emergency response plans should therefore provide for long-term mental health care services for populations affected by catastrophic extreme weather events (Table 7-A).
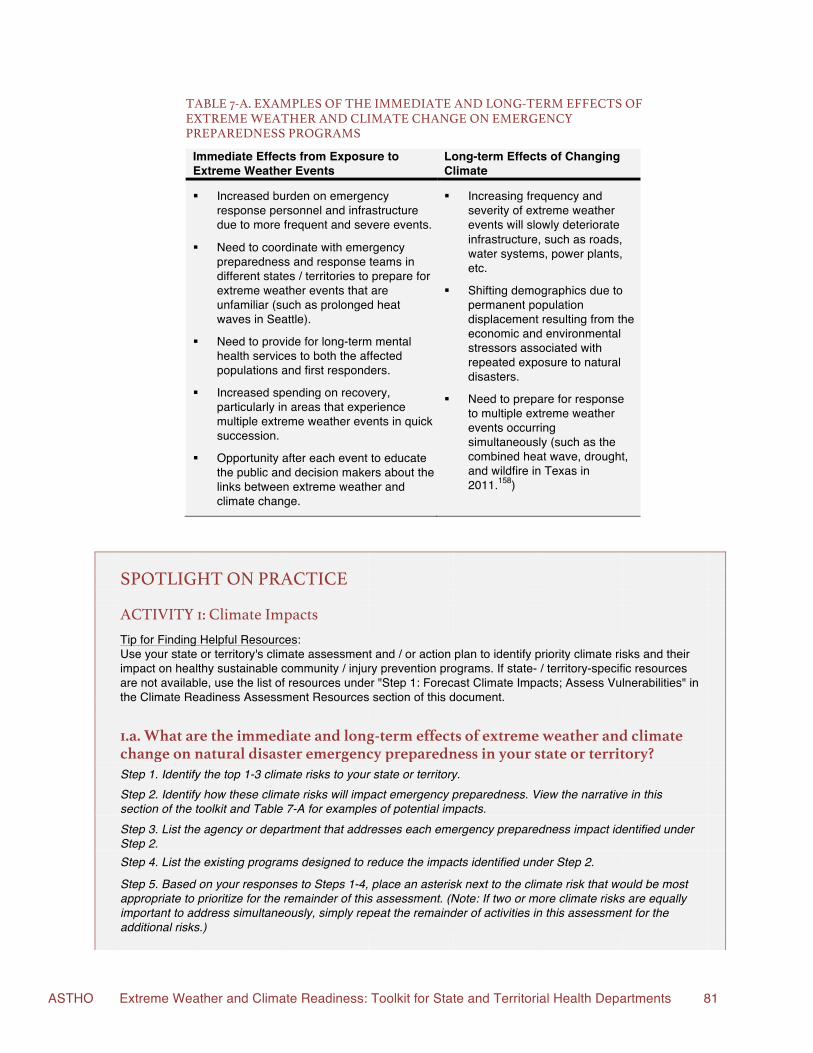
ASTHO Extreme Weather and Climate Readiness: Toolkit for State and Territorial Health Departments 81
TABLE 7-A. EXAMPLES OF THE IMMEDIATE AND LONG-TERM EFFECTS OF EXTREME WEATHER AND CLIMATE CHANGE ON EMERGENCY PREPAREDNESS PROGRAMS
Immediate Effects from Exposure to Extreme Weather Events
Long-term Effects of Changing Climate
§ Increased burden on emergency response personnel and infrastructure due to more frequent and severe events.
§ Need to coordinate with emergency preparedness and response teams in different states / territories to prepare for extreme weather events that are unfamiliar (such as prolonged heat waves in Seattle).
§ Need to provide for long-term mental health services to both the affected populations and first responders.
§ Increased spending on recovery, particularly in areas that experience multiple extreme weather events in quick succession.
§ Opportunity after each event to educate the public and decision makers about the links between extreme weather and climate change.
§ Increasing frequency and severity of extreme weather events will slowly deteriorate infrastructure, such as roads, water systems, power plants, etc.
§ Shifting demographics due to permanent population displacement resulting from the economic and environmental stressors associated with repeated exposure to natural disasters.
§ Need to prepare for response to multiple extreme weather events occurring simultaneously (such as the combined heat wave, drought, and wildfire in Texas in 2011.158)
SPOTLIGHT ON PRACTICE ACTIVITY 1: Climate Impacts
Tip for Finding Helpful Resources: Use your state or territory's climate assessment and / or action plan to identify priority climate risks and their impact on healthy sustainable community / injury prevention programs. If state- / territory-specific resources are not available, use the list of resources under "Step 1: Forecast Climate Impacts; Assess Vulnerabilities" in the Climate Readiness Assessment Resources section of this document.
1.a. What are the immediate and long-term effects of extreme weather and climate
change on natural disaster emergency preparedness in your state or territory?
Step 1. Identify the top 1-3 climate risks to your state or territory.
Step 2. Identify how these climate risks will impact emergency preparedness. View the narrative in this section of the toolkit and Table 7-A for examples of potential impacts.
Step 3. List the agency or department that addresses each emergency preparedness impact identified under Step 2.
Step 4. List the existing programs designed to reduce the impacts identified under Step 2.
Step 5. Based on your responses to Steps 1-4, place an asterisk next to the climate risk that would be most appropriate to prioritize for the remainder of this assessment. (Note: If two or more climate risks are equally important to address simultaneously, simply repeat the remainder of activities in this assessment for the additional risks.)
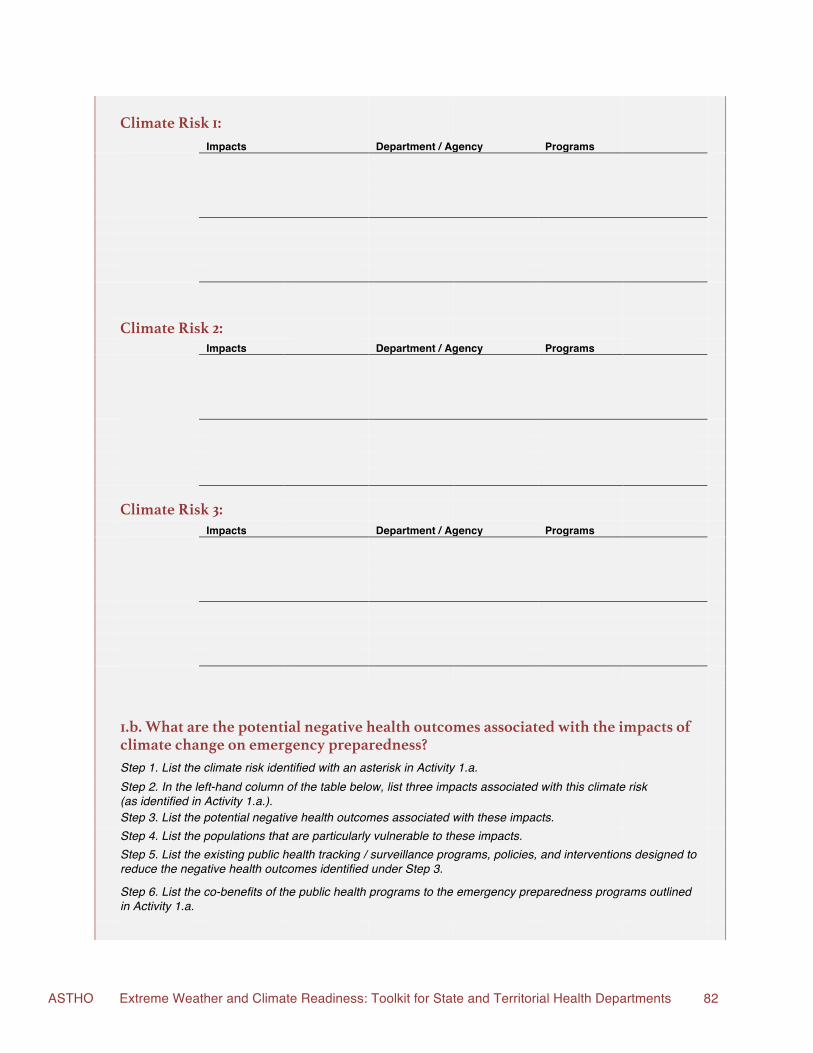
ASTHO Extreme Weather and Climate Readiness: Toolkit for State and Territorial Health Departments 82
Climate Risk 1:
Impacts Department / Agency Programs
Climate Risk 2:
Impacts Department / Agency Programs Climate Risk 3: Impacts Department / Agency Programs
1.b. What are the potential negative health outcomes associated with the impacts of climate change on emergency preparedness?
Step 1. List the climate risk identified with an asterisk in Activity 1.a.
Step 2. In the left-hand column of the table below, list three impacts associated with this climate risk (as identified in Activity 1.a.).
Step 3. List the potential negative health outcomes associated with these impacts. Step 4. List the populations that are particularly vulnerable to these impacts.
Step 5. List the existing public health tracking / surveillance programs, policies, and interventions designed to reduce the negative health outcomes identified under Step 3.
Step 6. List the co-benefits of the public health programs to the emergency preparedness programs outlined in Activity 1.a.
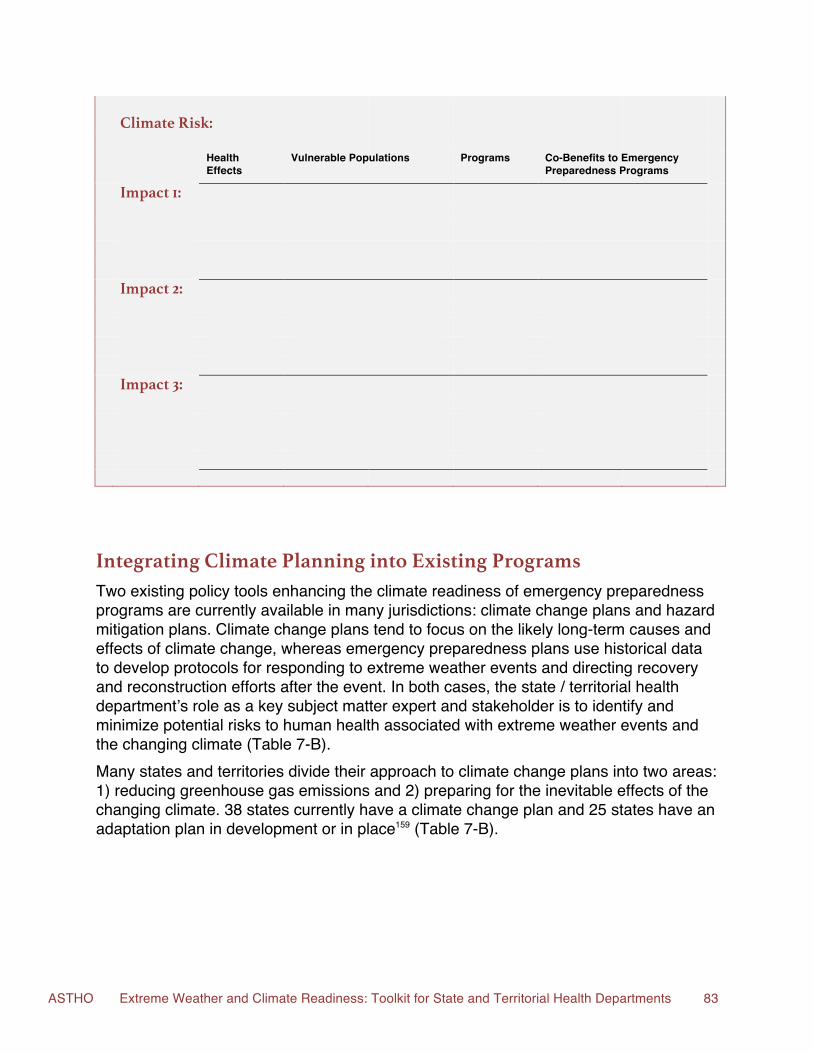
ASTHO Extreme Weather and Climate Readiness: Toolkit for State and Territorial Health Departments 83
Climate Risk:
Health
Effects Vulnerable Populations Programs Co-Benefits to Emergency
Preparedness Programs
Impact 1: Impact 2: Impact 3:
Integrating Climate Planning into Existing Programs Two existing policy tools enhancing the climate readiness of emergency preparedness programs are currently available in many jurisdictions: climate change plans and hazard mitigation plans. Climate change plans tend to focus on the likely long-term causes and effects of climate change, whereas emergency preparedness plans use historical data to develop protocols for responding to extreme weather events and directing recovery and reconstruction efforts after the event. In both cases, the state / territorial health department’s role as a key subject matter expert and stakeholder is to identify and minimize potential risks to human health associated with extreme weather events and the changing climate (Table 7-B). Many states and territories divide their approach to climate change plans into two areas: 1) reducing greenhouse gas emissions and 2) preparing for the inevitable effects of the changing climate. 38 states currently have a climate change plan and 25 states have an adaptation plan in development or in place159 (Table 7-B).
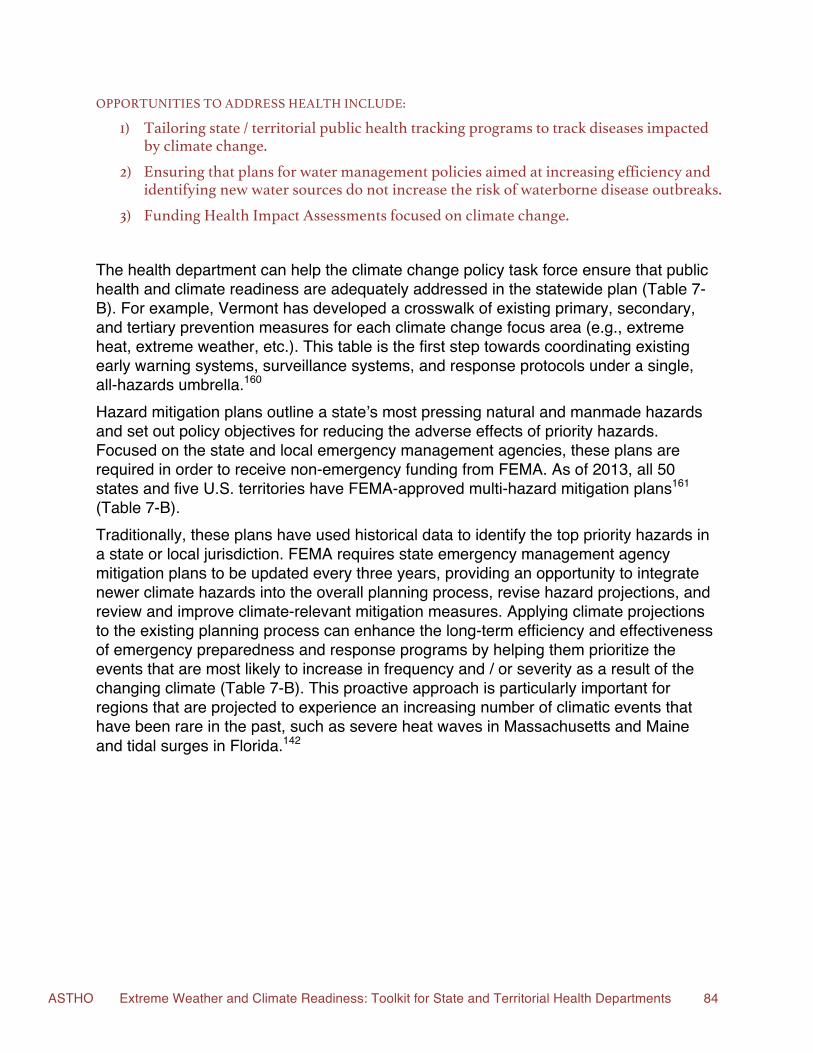
ASTHO Extreme Weather and Climate Readiness: Toolkit for State and Territorial Health Departments 84
OPPORTUNITIES TO ADDRESS HEALTH INCLUDE:
1) Tailoring state / territorial public health tracking programs to track diseases impacted by climate change.
2) Ensuring that plans for water management policies aimed at increasing efficiency and identifying new water sources do not increase the risk of waterborne disease outbreaks.
3) Funding Health Impact Assessments focused on climate change.
The health department can help the climate change policy task force ensure that public health and climate readiness are adequately addressed in the statewide plan (Table 7-B). For example, Vermont has developed a crosswalk of existing primary, secondary, and tertiary prevention measures for each climate change focus area (e.g., extreme heat, extreme weather, etc.). This table is the first step towards coordinating existing early warning systems, surveillance systems, and response protocols under a single, all-hazards umbrella.160 Hazard mitigation plans outline a state’s most pressing natural and manmade hazards and set out policy objectives for reducing the adverse effects of priority hazards. Focused on the state and local emergency management agencies, these plans are required in order to receive non-emergency funding from FEMA. As of 2013, all 50 states and five U.S. territories have FEMA-approved multi-hazard mitigation plans161 (Table 7-B). Traditionally, these plans have used historical data to identify the top priority hazards in a state or local jurisdiction. FEMA requires state emergency management agency mitigation plans to be updated every three years, providing an opportunity to integrate newer climate hazards into the overall planning process, revise hazard projections, and review and improve climate-relevant mitigation measures. Applying climate projections to the existing planning process can enhance the long-term efficiency and effectiveness of emergency preparedness and response programs by helping them prioritize the events that are most likely to increase in frequency and / or severity as a result of the changing climate (Table 7-B). This proactive approach is particularly important for regions that are projected to experience an increasing number of climatic events that have been rare in the past, such as severe heat waves in Massachusetts and Maine and tidal surges in Florida.142
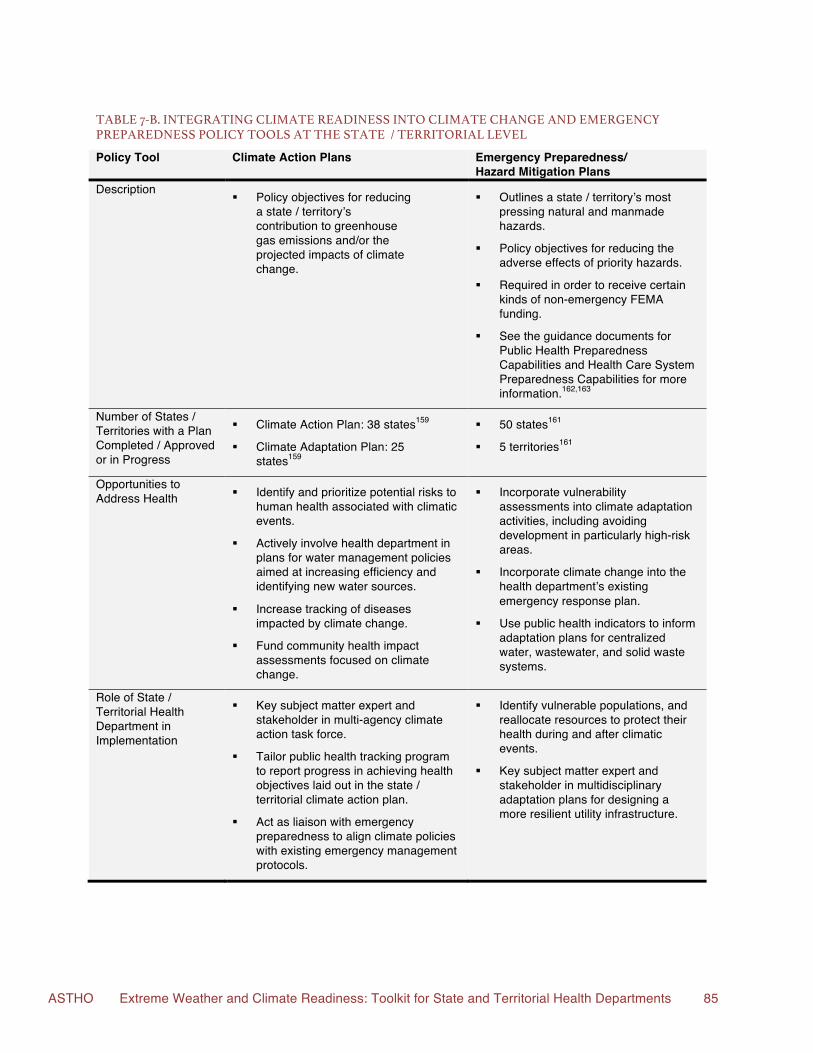
ASTHO Extreme Weather and Climate Readiness: Toolkit for State and Territorial Health Departments 85
TABLE 7-B. INTEGRATING CLIMATE READINESS INTO CLIMATE CHANGE AND EMERGENCY PREPAREDNESS POLICY TOOLS AT THE STATE / TERRITORIAL LEVEL
Policy Tool
Climate Action Plans
Emergency Preparedness/ Hazard Mitigation Plans
Description § Policy objectives for reducing
a state / territory’s contribution to greenhouse gas emissions and/or the projected impacts of climate change.
§ Outlines a state / territory’s most pressing natural and manmade hazards.
§ Policy objectives for reducing the adverse effects of priority hazards.
§ Required in order to receive certain kinds of non-emergency FEMA funding.
§ See the guidance documents for Public Health Preparedness Capabilities and Health Care System Preparedness Capabilities for more information.162,163
Number of States / Territories with a Plan Completed / Approved or in Progress
§ Climate Action Plan: 38 states159
§ Climate Adaptation Plan: 25 states159
§ 50 states161
§ 5 territories161
Opportunities to Address Health § Identify and prioritize potential risks to
human health associated with climatic events.
§ Actively involve health department in plans for water management policies aimed at increasing efficiency and identifying new water sources.
§ Increase tracking of diseases impacted by climate change.
§ Fund community health impact assessments focused on climate change.
§ Incorporate vulnerability assessments into climate adaptation activities, including avoiding development in particularly high-risk areas.
§ Incorporate climate change into the health department’s existing emergency response plan.
§ Use public health indicators to inform adaptation plans for centralized water, wastewater, and solid waste systems.
Role of State / Territorial Health Department in Implementation
§ Key subject matter expert and stakeholder in multi-agency climate action task force.
§ Tailor public health tracking program to report progress in achieving health objectives laid out in the state / territorial climate action plan.
§ Act as liaison with emergency preparedness to align climate policies with existing emergency management protocols.
§ Identify vulnerable populations, and reallocate resources to protect their health during and after climatic events.
§ Key subject matter expert and stakeholder in multidisciplinary adaptation plans for designing a more resilient utility infrastructure.
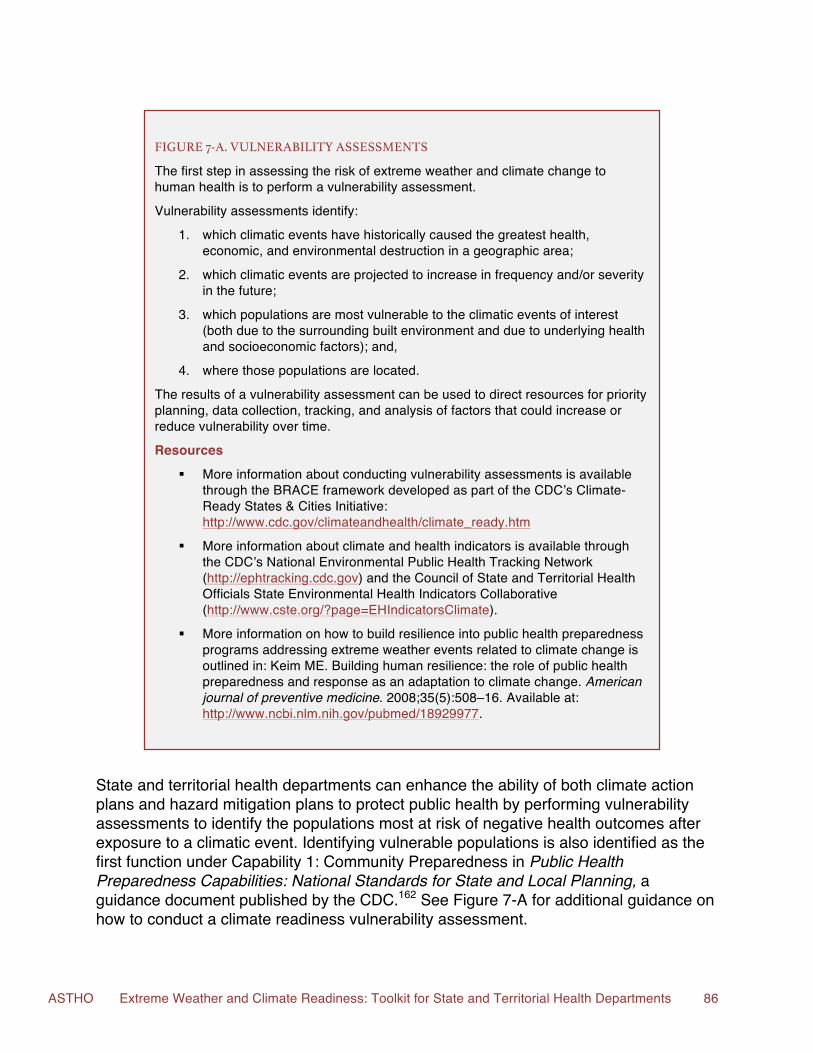
ASTHO Extreme Weather and Climate Readiness: Toolkit for State and Territorial Health Departments 86
State and territorial health departments can enhance the ability of both climate action plans and hazard mitigation plans to protect public health by performing vulnerability assessments to identify the populations most at risk of negative health outcomes after exposure to a climatic event. Identifying vulnerable populations is also identified as the first function under Capability 1: Community Preparedness in Public Health Preparedness Capabilities: National Standards for State and Local Planning, a guidance document published by the CDC.162 See Figure 7-A for additional guidance on how to conduct a climate readiness vulnerability assessment.
FIGURE 7-A. VULNERABILITY ASSESSMENTS
The first step in assessing the risk of extreme weather and climate change to human health is to perform a vulnerability assessment.
Vulnerability assessments identify:
1. which climatic events have historically caused the greatest health, economic, and environmental destruction in a geographic area;
2. which climatic events are projected to increase in frequency and/or severity in the future;
3. which populations are most vulnerable to the climatic events of interest (both due to the surrounding built environment and due to underlying health and socioeconomic factors); and,
4. where those populations are located.
The results of a vulnerability assessment can be used to direct resources for priority planning, data collection, tracking, and analysis of factors that could increase or reduce vulnerability over time.
Resources
§ More information about conducting vulnerability assessments is available through the BRACE framework developed as part of the CDC’s Climate-Ready States & Cities Initiative: http://www.cdc.gov/climateandhealth/climate_ready.htm
§ More information about climate and health indicators is available through the CDC’s National Environmental Public Health Tracking Network (http://ephtracking.cdc.gov) and the Council of State and Territorial Health Officials State Environmental Health Indicators Collaborative (http://www.cste.org/?page=EHIndicatorsClimate).
§ More information on how to build resilience into public health preparedness programs addressing extreme weather events related to climate change is outlined in: Keim ME. Building human resilience: the role of public health preparedness and response as an adaptation to climate change. American journal of preventive medicine. 2008;35(5):508–16. Available at: http://www.ncbi.nlm.nih.gov/pubmed/18929977.
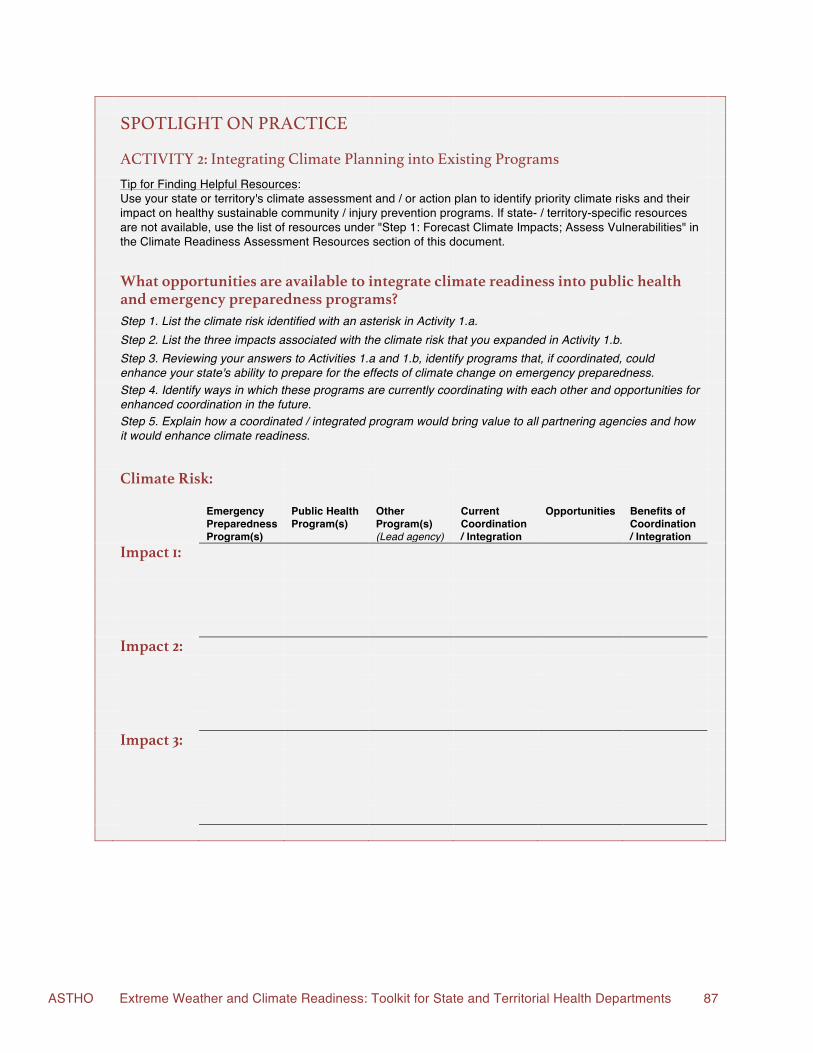
ASTHO Extreme Weather and Climate Readiness: Toolkit for State and Territorial Health Departments 87
SPOTLIGHT ON PRACTICE ACTIVITY 2: Integrating Climate Planning into Existing Programs
Tip for Finding Helpful Resources: Use your state or territory's climate assessment and / or action plan to identify priority climate risks and their impact on healthy sustainable community / injury prevention programs. If state- / territory-specific resources are not available, use the list of resources under "Step 1: Forecast Climate Impacts; Assess Vulnerabilities" in the Climate Readiness Assessment Resources section of this document.
What opportunities are available to integrate climate readiness into public health
and emergency preparedness programs?
Step 1. List the climate risk identified with an asterisk in Activity 1.a. Step 2. List the three impacts associated with the climate risk that you expanded in Activity 1.b.
Step 3. Reviewing your answers to Activities 1.a and 1.b, identify programs that, if coordinated, could enhance your state's ability to prepare for the effects of climate change on emergency preparedness.
Step 4. Identify ways in which these programs are currently coordinating with each other and opportunities for enhanced coordination in the future.
Step 5. Explain how a coordinated / integrated program would bring value to all partnering agencies and how it would enhance climate readiness.
Climate Risk:
Emergency Preparedness Program(s)
Public Health Program(s)
Other Program(s) (Lead agency)
Current Coordination / Integration
Opportunities
Benefits of Coordination / Integration
Impact 1: Impact 2: Impact 3:
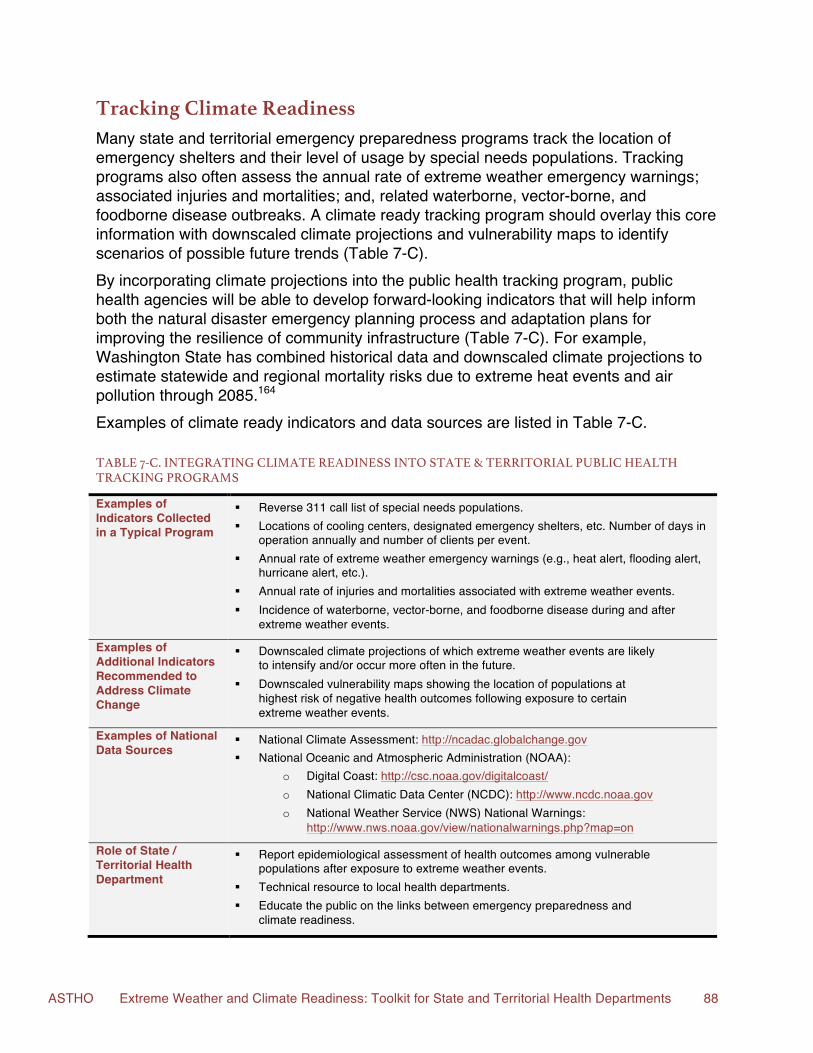
ASTHO Extreme Weather and Climate Readiness: Toolkit for State and Territorial Health Departments 88
Tracking Climate Readiness Many state and territorial emergency preparedness programs track the location of emergency shelters and their level of usage by special needs populations. Tracking programs also often assess the annual rate of extreme weather emergency warnings; associated injuries and mortalities; and, related waterborne, vector-borne, and foodborne disease outbreaks. A climate ready tracking program should overlay this core information with downscaled climate projections and vulnerability maps to identify scenarios of possible future trends (Table 7-C). By incorporating climate projections into the public health tracking program, public health agencies will be able to develop forward-looking indicators that will help inform both the natural disaster emergency planning process and adaptation plans for improving the resilience of community infrastructure (Table 7-C). For example, Washington State has combined historical data and downscaled climate projections to estimate statewide and regional mortality risks due to extreme heat events and air pollution through 2085.164 Examples of climate ready indicators and data sources are listed in Table 7-C.
TABLE 7-C. INTEGRATING CLIMATE READINESS INTO STATE & TERRITORIAL PUBLIC HEALTH TRACKING PROGRAMS
Examples of Indicators Collected in a Typical Program
§ Reverse 311 call list of special needs populations. § Locations of cooling centers, designated emergency shelters, etc. Number of days in
operation annually and number of clients per event. § Annual rate of extreme weather emergency warnings (e.g., heat alert, flooding alert,
hurricane alert, etc.). § Annual rate of injuries and mortalities associated with extreme weather events. § Incidence of waterborne, vector-borne, and foodborne disease during and after
extreme weather events.
Examples of Additional Indicators Recommended to Address Climate Change
§ Downscaled climate projections of which extreme weather events are likely to intensify and/or occur more often in the future.
§ Downscaled vulnerability maps showing the location of populations at highest risk of negative health outcomes following exposure to certain extreme weather events.
Examples of National Data Sources
§ National Climate Assessment: http://ncadac.globalchange.gov § National Oceanic and Atmospheric Administration (NOAA):
o Digital Coast: http://csc.noaa.gov/digitalcoast/ o National Climatic Data Center (NCDC): http://www.ncdc.noaa.gov o National Weather Service (NWS) National Warnings:
http://www.nws.noaa.gov/view/nationalwarnings.php?map=on
Role of State / Territorial Health Department
§ Report epidemiological assessment of health outcomes among vulnerable populations after exposure to extreme weather events.
§ Technical resource to local health departments. § Educate the public on the links between emergency preparedness and
climate readiness.
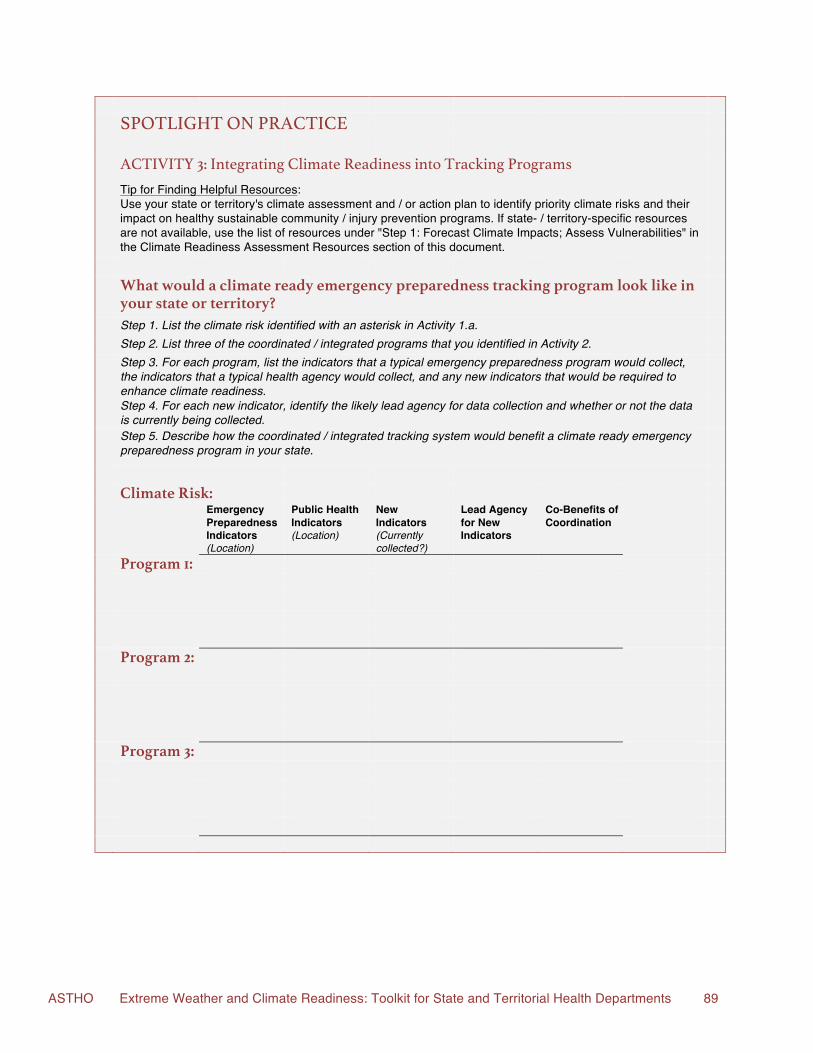
ASTHO Extreme Weather and Climate Readiness: Toolkit for State and Territorial Health Departments 89
SPOTLIGHT ON PRACTICE ACTIVITY 3: Integrating Climate Readiness into Tracking Programs
Tip for Finding Helpful Resources: Use your state or territory's climate assessment and / or action plan to identify priority climate risks and their impact on healthy sustainable community / injury prevention programs. If state- / territory-specific resources are not available, use the list of resources under "Step 1: Forecast Climate Impacts; Assess Vulnerabilities" in the Climate Readiness Assessment Resources section of this document.
What would a climate ready emergency preparedness tracking program look like in
your state or territory?
Step 1. List the climate risk identified with an asterisk in Activity 1.a. Step 2. List three of the coordinated / integrated programs that you identified in Activity 2.
Step 3. For each program, list the indicators that a typical emergency preparedness program would collect, the indicators that a typical health agency would collect, and any new indicators that would be required to enhance climate readiness.
Step 4. For each new indicator, identify the likely lead agency for data collection and whether or not the data is currently being collected.
Step 5. Describe how the coordinated / integrated tracking system would benefit a climate ready emergency preparedness program in your state.
Climate Risk: Emergency
Preparedness Indicators (Location)
Public Health Indicators (Location)
New Indicators (Currently collected?)
Lead Agency for New Indicators
Co-Benefits of Coordination
Program 1: Program 2: Program 3:
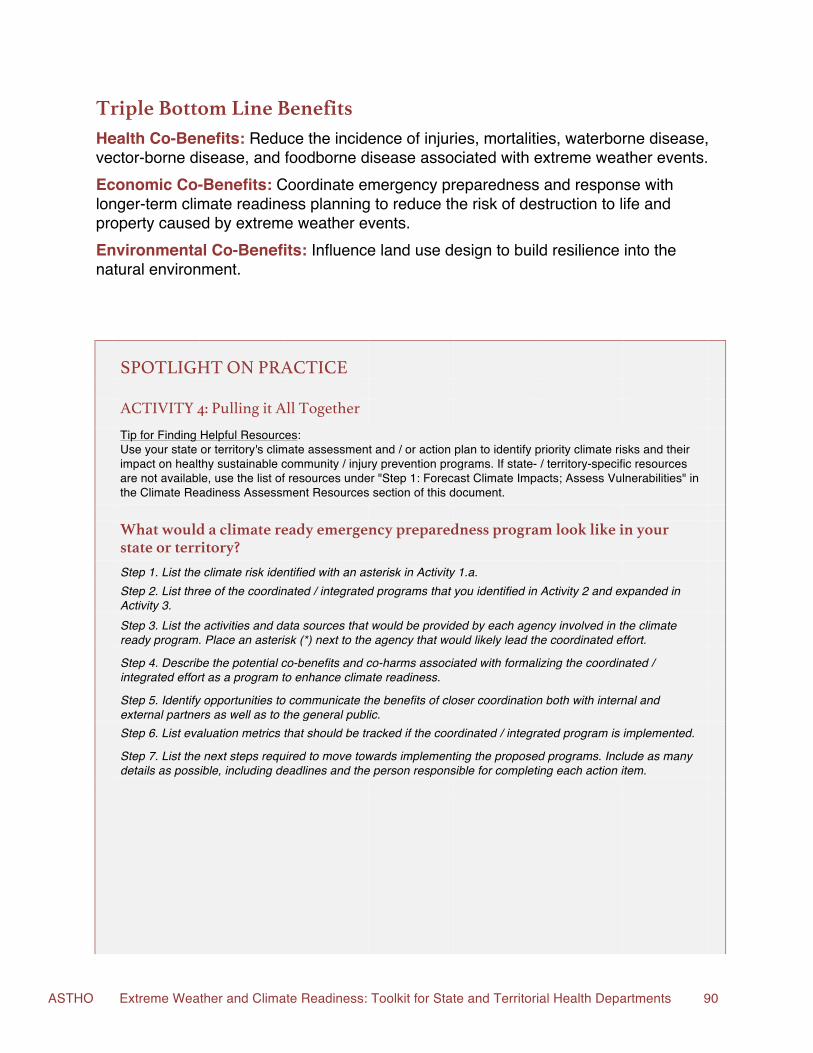
ASTHO Extreme Weather and Climate Readiness: Toolkit for State and Territorial Health Departments 90
Triple Bottom Line Benefits Health Co-Benefits: Reduce the incidence of injuries, mortalities, waterborne disease, vector-borne disease, and foodborne disease associated with extreme weather events. Economic Co-Benefits: Coordinate emergency preparedness and response with longer-term climate readiness planning to reduce the risk of destruction to life and property caused by extreme weather events. Environmental Co-Benefits: Influence land use design to build resilience into the natural environment. SPOTLIGHT ON PRACTICE ACTIVITY 4: Pulling it All Together
Tip for Finding Helpful Resources: Use your state or territory's climate assessment and / or action plan to identify priority climate risks and their impact on healthy sustainable community / injury prevention programs. If state- / territory-specific resources are not available, use the list of resources under "Step 1: Forecast Climate Impacts; Assess Vulnerabilities" in the Climate Readiness Assessment Resources section of this document.
What would a climate ready emergency preparedness program look like in your
state or territory?
Step 1. List the climate risk identified with an asterisk in Activity 1.a.
Step 2. List three of the coordinated / integrated programs that you identified in Activity 2 and expanded in Activity 3.
Step 3. List the activities and data sources that would be provided by each agency involved in the climate ready program. Place an asterisk (*) next to the agency that would likely lead the coordinated effort.
Step 4. Describe the potential co-benefits and co-harms associated with formalizing the coordinated / integrated effort as a program to enhance climate readiness.
Step 5. Identify opportunities to communicate the benefits of closer coordination both with internal and external partners as well as to the general public.
Step 6. List evaluation metrics that should be tracked if the coordinated / integrated program is implemented.
Step 7. List the next steps required to move towards implementing the proposed programs. Include as many details as possible, including deadlines and the person responsible for completing each action item.
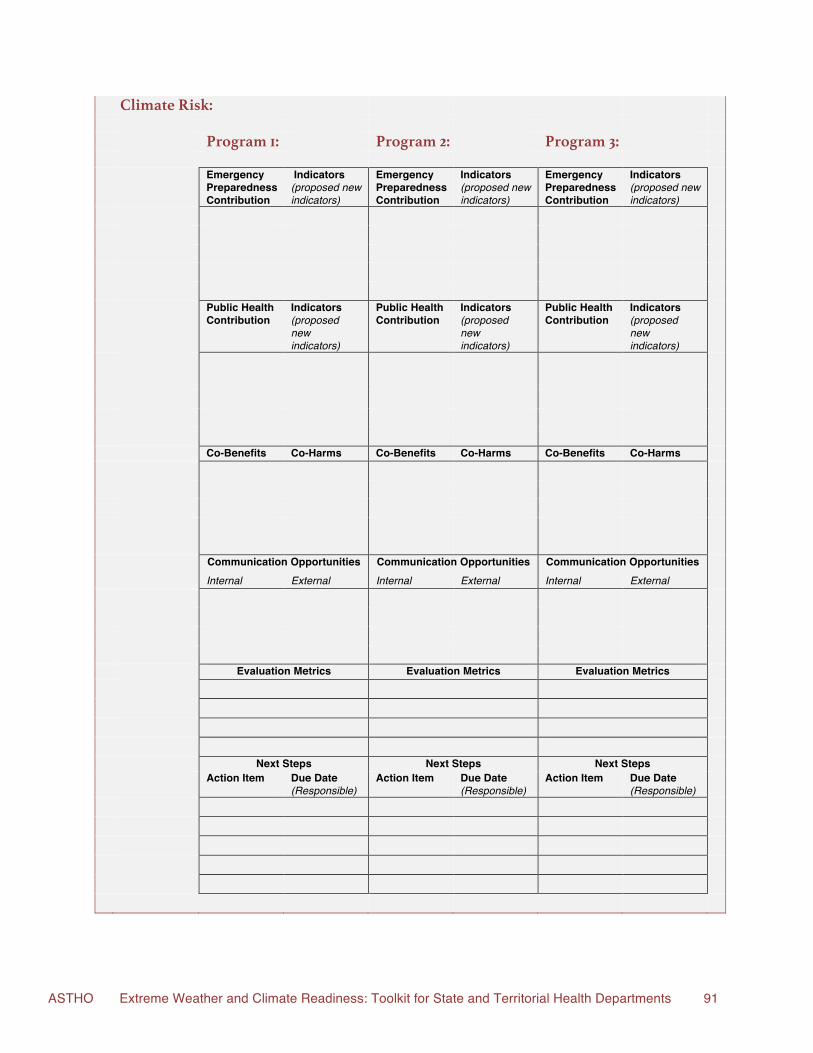
ASTHO Extreme Weather and Climate Readiness: Toolkit for State and Territorial Health Departments 91
Climate Risk: Program 1: Program 2: Program 3: Emergency
Preparedness Contribution
Indicators (proposed new indicators)
Emergency Preparedness Contribution
Indicators (proposed new indicators)
Emergency Preparedness Contribution
Indicators (proposed new indicators)
Public Health
Contribution Indicators (proposed new indicators)
Public Health Contribution
Indicators (proposed new indicators)
Public Health Contribution
Indicators (proposed new indicators)
Co-Benefits Co-Harms Co-Benefits Co-Harms Co-Benefits Co-Harms Communication Opportunities Communication Opportunities Communication Opportunities Internal External Internal External Internal External Evaluation Metrics Evaluation Metrics Evaluation Metrics Next Steps Next Steps Next Steps Action Item Due Date
(Responsible) Action Item Due Date
(Responsible) Action Item Due Date
(Responsible)
ASTHO Extreme Weather and Climate Readiness: Toolkit for State and Territorial Health Departments 92
Climate Readiness Assessment Resources CDC's Building Resilience Against Climate Effects (BRACE) Framework:
§ http://www.cdc.gov/climateandhealth/BRACE.htm Core Functions of Public Health and 10 Essential Services (Useful for assessing and organizing climate-ready interventions and adaptations):
§ http://www.cdc.gov/nceh/ehs/ephli/core_ess.htm § http://www.cdc.gov/nphpsp/essentialservices.html
CORE FUNCTIONS BRACE Framework Resources
Assessment Step 1: Forecast Climate Impacts; Assess Vulnerabilities
Climate Change Indicators in the United States: Published by U.S. Environmental Protection Agency. Available through NACCHO Climate Change Toolkit.
Climate Change and Public Health: Impact Assessment for the NYC Metropolitan Region: See section IV. “Climate-Related Public Health Stressors” for an example of how to use existing published information to establish the localized health effects of climatic events.
Climate Change Threatens Health: Online tool to identify rates of exposure to climate-related hazards at the state and local level. Published by the National Resources Defense Council.
Florida Department of Health Public Health Hazards Vulnerability Assessment Application Users Manual: Example of an online tool to assist public health hazard and vulnerability analyses.
Metadata Access Tool for Climate and Health (MATCH): Online tool for accessing metadata of government-held datasets on climate, health, and the environment.
National Climate Assessment: Chapter 9, Human Health outlines the elements of vulnerability. The assessment provides historical data and climate projections at both the national and regional levels.
National Environmental Public Health Tracking Network: Published by U.S. Centers for Disease Control and Prevention. Includes a section on climate change indicators.
Pay Now, Pay Later: State-by-state assessment of the costs of climate change. Developed by the American Security Project.
Public Health Impacts of Climate Change in California: Community Vulnerability Assessments and Adaptation Strategies: Includes an overview of climate-related hazards and vulnerable populations.
ASTHO Extreme Weather and Climate Readiness: Toolkit for State and Territorial Health Departments 93
State Environmental Public Health Indicators for Climate Change: Developed by the Council of State and Territorial Epidemiologists (CSTE) State Environmental Health Indicators Collaborative (SEHIC).
Training Course for Public Health Professionals on Protecting our Health from Climate Change: Online course through World Health Organization. Module 2 includes information on developing risk assessments for the health impacts of climate change.
Step 2: Project Disease Burden
Climate Change, Mortality, and Adaptation: Evidence from Annual Fluctuations in Weather in the U.S.: Article outlining methodology for predicting age-adjusted mortality attributable to climate change.
Healthy People 2100: Modeling Population Health Impacts of Climate Change: Article outlining methodology for developing a model that quantifies climate-health associations while taking uncertainties and mitigating factors into consideration.
Future Health Impacts from Climate Change in Rhode Island: Evidence from Climate Models: Statewide climate projections for heat and humidity, heat variability, pollen and allergens, and disease-carrying vectors.
Public Health Impacts of Climate Change in Washington State: Projected Mortality Risks Due to Heat Events and Air Pollution: Chapter of the state’s 2009 Climate Change Impact Assessment. Quantifies the historical relationship between extreme heat and mortality as well as predicting future excess mortality attributable to climate change.
Approaches for Estimating Effects of Climate Change on Heat-Related Deaths: Challenges and Opportunities. Article outlines three approaches to address the challenges of projecting future health consequences of climate change.
Estimating Changes in Mortality Due to Climate Change: Article outlines a method for using either observed or projected changes in extreme temperatures to estimate changes in mortality rates attributable to climate change. (Note: This article is not open access)
Training Course for Public Health Professionals on Protecting our Health from Climate Change: Online course through World Health Organization. Module 4 includes information on exposure response relationships associated with climate and health.
How much disease would climate change cause?: Assessment from the World Health Organization quantifying the regional burden of disease attributable to climate change.
Step 3: Assess Public Health Interventions
12 Steps to Operationalize Climate Change in a Local Health Department: Developed by NACCHO Climate Change Workgroup. Available through NACCHO Climate Change Toolkit.
Climate Change Policy HIA Training for Health Professionals: Online training, toolkit, and resources to support health professionals engaged in assessing how climate change policies are likely to affect population health.
Community Health Assessments (CHA): Incorporate climate readiness initiatives into this systematic methodology for evaluating the health of a specific population.
Health Impact Assessments (HIA): A tool for evaluating the likely co-benefits and co-harms associated with a policy, plan, or intervention.
Health Impact Assessment of California Climate Change “cap-and-trade” Regulation: Assessment of how the greenhouse gas reduction regulation in California is likely to affect population health.
Health Impact Assessment of Global Climate Change: Expanding on Comparative Risk Assessment Approaches for Policy Making: Global perspective on the co-benefits and co-harms to population health of both the effects of climate change and policies designed to slow its progress.
ASTHO Extreme Weather and Climate Readiness: Toolkit for State and Territorial Health Departments 94
Incorporating Health and Climate Change into the Minnesota Environmental Assessment Worksheet: Assessment of the roles human health and climate change could play in the Minnesota Environmental Assessment Workshop.
New Hampshire State Public Health Assessment Instrument Modified to Address Climate Change: The assessment tool, based on CDC’s National Public Health Performance Standards Program (NPHPSP), can be used by state and territorial public health agencies to quickly determine what climate ready capabilities are already in place and what areas require improvement. (See page 4.)
Oregon HIA of Climate Smart Communities Scenarios: Assessment of how greenhouse gas reduction policies aimed at small cars and trucks are likely to affect population health in Oregon.
Public Health and Climate Change: A Guide for Increasing the Capacity of Local Public Health Departments: This guidebook outlines a framework for initiating and integrating climate planning within public health departments and agencies. While its target audience is county, regional, and Tribal health departments, the strategies and activities presented in the guidebook can be easily adapted to larger scale initiatives. The guidebook is designed to enhance efforts to both reduce greenhouse gas emissions and prepare for the health impacts of climate change.
Public Health Impacts of Climate Change in California: Community Vulnerability Assessments and Adaptation Strategies: Includes a review of prevention, adaptation, and mitigation strategies as well as short-term and long-term recommendations.
UCLA Health Impact Assessment Screening/Scoping Checklist of Health Determinants: For use during the screening and scoping phases of a Health Impact Assessment.
Policy Development Step 4: Develop and Implement Climate and Health Adaptation Plan
Cal-Adapt: Web-based, local and regional climate change adaptation planning tool.
California Adaptation Planning Guide: Step-by-step guide for developing local and regional adaptation plans.
Center for Climate and Energy Solutions: Map of climate action plans by state.
The Center for Climate Strategies: Nonpartisan nonprofit that compiles a database of state and local climate policies, among other resources. Instructions for Implementing Federal Agency Climate Change Adaptation Planning: Guidance issued by the White House on the steps required to comply with Executive Order 13514, Federal Leadership in Environmental, Energy, and Economic Performance. Many of the steps are transferrable to the state and local levels.
Local Policy Scan on Climate Change Adaptation: Outlines strategies for incorporating public health priorities into climate adaptation plans. Includes eight local case studies.
Michigan Climate and Health Adaptation Plan, 2010-2015 Strategic Plan: Outlines the process of developing a coordinated strategy to address the health effects of climate change throughout the state.
Preparing California for Extreme Heat: Guidance and Recommendations: Bases policy recommendations on current projections for increased temperature and extreme heat events as well as the health effects of exposure to extreme heat.
U.S. Conference of Mayors Climate Protection Agreement: List of cities that have committed to reducing community greenhouse gas emissions.
U.S. Department of Health and Human Services Climate Change Adaptation Plan: Identifies the challenges posed by climate change to HHS’s mission, program, and operations. Outlines the actions the agency will undertake under the plan and how it will evaluate its implementation.
U.S. EPA State and Local Climate and Energy Program: Map of states and communities that have instituted climate change action plans.
ASTHO Extreme Weather and Climate Readiness: Toolkit for State and Territorial Health Departments 95
Assurance Step 5: Evaluate Impact; Improve Quality of Activities
Making Adaptation Count: World Resources Institute step-by-step guidance on how to monitor and evaluate climate adaptation efforts.
Monitoring and Evaluation for Adaptation: OECD publication assessing M&E frameworks from 106 adaptation projects. Includes examples from the Logical Framework approach to evaluation.
Monitoring and Evaluation for Climate Change Adaptation and Resilience: Report compiling a wide range of tools, frameworks, and approaches for evaluating the impact of climate change adaptation policies and interventions.
Program Evaluation: U.S. Centers for Disease Control and Prevention website. Framework and resources supporting program evaluation in public health, including information about how to develop a logic model.
ASTHO Extreme Weather and Climate Readiness: Toolkit for State and Territorial Health Departments 96
References
1. Kelly C. Putting climate change and human health science into practice. Environ Factor.5–7. Available at: http://www.niehs.nih.gov/news/newsletter/2013/3/spotlight-climate/.
2. World Health Organization. The World Health Report 2000 - Health systems: improving performance. Geneva, Switzerland: World Health Organization; 2000:215. Available at: http://www.who.int/whr/2000/en/.
3. World Health Organization. A Conceptual Framework for Action on the Social Determinants of Health.; 2007:77.
4. Huang C, Vaneckova P, Wang X, Fitzgerald G, Guo Y, Tong S. Constraints and barriers to public health adaptation to climate change: a review of the literature. Am J Prev Med. 2011;40(2):183–90.
5. Balbus JM, Malina C. Identifying vulnerable subpopulations for climate change health effects in the United States. J Occup Environ Med. 2009;51(1):33–7.
6. U.S. Environmental Protection Agency Office of Environmental Justice. Environmental Justice. 2013. Available at: http://www.epa.gov/environmentaljustice/.
7. Walpole SC, Rasanathan K, Campbell-Lendrum D. Natural and unnatural synergies: climate change policy and health equity. Bull World Health Organ. 2009;87:799–801.
8. Association of State and Territorial Health Officials. Position Statement on Climate Change and Public Health. Available at: http://www.astho.org/Policy-and-Position-Statements/Position-Statement-on-Climate-Change-and-Public-Health/.
9. Association of State and Territorial Health Officials. State and Territorial Health Agency Needs for a Changing Climate: A Summary and Analysis of ASTHO’s 2009 and 2012 Climate Health Needs Assessments. Arlington, VA;14. Available at: http://astho.org/Programs/Environmental-Health/Natural-Environment/Climate-Change/2012-Climate-and-Health-Survey-Report/.
ASTHO Extreme Weather and Climate Readiness: Toolkit for State and Territorial Health Departments 97
10. Institute of Medicine Committee for the Study of the Future of Public Health. The Future of Public Health. Washington, D.C.: National Academy Press; 1988:240. Available at: http://www.nap.edu/catalog/1091.html.
11. U.S. Centers for Disease Control and Prevention National Center for Environmental Health. CDC’s Building Resilience Against Climate Effects (BRACE) Framework. 2012. Available at: http://www.cdc.gov/climateandhealth/BRACE.htm.
12. U.S. Centers for Disease Control and Prevention. 10 Essential Public Health Services. 2010. Available at: http://www.cdc.gov/od/ocphp/nphpsp/essentialphservices.htm.
13. Public Health Accreditation Board. Standards and Measures Version 1.0. Alexandria, VA; 2011:255. Available at: http://www.phaboard.org/wp-content/uploads/PHAB-Standards-and-Measures-Version-1.0.pdf.
14. U.S. Centers for Disease Control and Prevention. National Public Health Performance Standards Program. 2012. Available at: http://www.cdc.gov/nphpsp/.
15. U.S. Centers for Disease Control and Prevention. Climate-Ready States and Cities Initiative. 2014. Available at: http://www.cdc.gov/climateandhealth/climate_ready.htm.
16. Massachusetts Department of Energy and Environmental Affairs. Massachusetts Global Warming Solutions Act: Implementation Subcommittees. 2013. Available at: http://www.mass.gov/eea/air-water-climate-change/climate-change/massachusetts-global-warming-solutions-act/implementation-subcommittees.html.
17. Curtis L, Rea W, Smith-Willis P, Fenyves E, Pan Y. Adverse health effects of outdoor air pollutants. Environ Int. 2006;32(6):815–30.
18. Fann N, Lamson AD, Anenberg SC, Wesson K, Risley D, Hubbell BJ. Estimating the national public health burden associated with exposure to ambient PM2.5 and ozone. Risk Anal. 2012;32(1):81–95.
19. Gauderman WJ, Avol E, Gilliland F, et al. The effect of air pollution on lung development from 10 to 18 years of age. N Engl J Med. 2004;351(11):1057–1068.
20. Brunekreef B, Holgate ST. Air pollution and health. Lancet. 2002;360:1233–1242.
21. Delfino RJ, Brummel S, Wu J, et al. The relationship of respiratory and cardiovascular hospital admissions to the southern California wildfires of 2003. Occup Environ Med. 2009;66(3):189–97.
22. Künzli N, Avol E, Wu J, et al. Health effects of the 2003 Southern California wildfires on children. Am J Respir Crit Care Med. 2006;174(11):1221–8.
ASTHO Extreme Weather and Climate Readiness: Toolkit for State and Territorial Health Departments 98
23. Friedman MS, Powell KE, Hutwagner L, Graham LM, Teague WG. Impact of Changes in Transportation and Commuting Behaviors During the 1996 Summer Olympic Games in Atlanta on Air Quality and Childhood Asthma. J Am Med Assoc. 2001;285(7):897–905. Available at: http://jama.ama-assn.org/cgi/content/abstract/285/7/897.
24. U.S. Environmental Protection Agency. Improving Air Quality in Your Community - Basic Information. 2011. Available at: http://www.epa.gov/airquality/community/basicinfo.html.
25. Jaffe D, Hafner W, Chand D, Westerling A, Spracklen D. Interannual variations in PM2.5 due to wildfires in the Western United States. Environ Sci Technol. 2008;42(8):2812–8. Available at: http://www.ncbi.nlm.nih.gov/pubmed/18497128.
26. Jaffe D, Chand D, Hafner W, Westerling A, Spracklen D. Influence of fires on O3 concentrations in the western U.S. Environ Sci Technol. 2008;42(16):5885–91. Available at: http://www.ncbi.nlm.nih.gov/pubmed/18767640.
27. Akagi SK, Yokelson RJ, Wiedinmyer C, et al. Emission factors for open and domestic biomass burning for use in atmospheric models. Atmos Chem Phys. 2011;11(9):4039–4072.
28. U.S. Environmental Protection Agency. National Ambient Air Quality Standards (NAAQS). 2012. Available at: http://www.epa.gov/air/criteria.html.
29. U.S. Environmental Protection Agency Office of Compliance. National Emission Standards for Hazardous Air Pollutants Compliance Monitoring. Available at: http://www.epa.gov/compliance/monitoring/programs/caa/neshaps.html.
30. Franco G, Cayan DR, Luers AL. Our Changing Climate: Assessing the Risks to California, A Summary Report.; 2006:16.
31. U.S. Environmental Protection Agency. Basic Information: Air and Radiation. 2012. Available at: http://www.epa.gov/air/basic.html. Accessed May 28, 2013.
32. Klepeis NE, Nelson WC, Ott WR, et al. The National Human Activity Pattern Survey (NHAPS): a resource for assessing exposure to environmental pollutants. J Expo Anal Environ Epidemiol. 2001;11(3):231–52.
33. Institute of Medicine. Climate Change, the Indoor Environment, and Health. Washington, D.C.: The National Academies Press; 2011:287.
34. Jariwala SP, Kurada S, Moday H, et al. Association between tree pollen counts and asthma ED visits in a high-density urban center. J Asthma. 2011;48(5):442–8.
ASTHO Extreme Weather and Climate Readiness: Toolkit for State and Territorial Health Departments 99
35. Erbas B, Akram M, Dharmage SC, et al. The role of seasonal grass pollen on childhood asthma emergency department presentations. Clin Exp Allergy. 2012;42(5):799–805.
36. Ziska LH, Gebhard DE, Frenz D a., Faulkner S, Singer BD, Straka JG. Cities as harbingers of climate change: Common ragweed, urbanization, and public health. J Allergy Clin Immunol. 2003;111(2):290–295.
37. Barnes CS, Alexis NE, Bernstein JA, et al. Climate change and our environment: the effect on respiratory and allergic disease. J Allergy Clin Immunol. 2013;1(2):137–141.
38. Reid CE, Gamble JL. Aeroallergens, allergic disease, and climate change: impacts and adaptation. Ecohealth. 2009;6(3):458–70.
39. D’Amato G, Cecchi L. Effects of climate change on environmental factors in respiratory allergic diseases. Clin Exp Allergy. 2008;38(8):1264–74.
40. Ziska LH, Caulfield FA. Rising CO2 and pollen production of common ragweed (Ambrosia artemisiifolia), a known allergy-inducing species: implications for public health. Aust J Plant Physiol. 2000;27:893–898.
41. Rogers C a., Wayne PM, Macklin EA, et al. Interaction of the Onset of Spring and Elevated Atmospheric CO2 on Ragweed (Ambrosia artemisiifolia L.) Pollen Production. Environ Health Perspect. 2006;114(6):865–869.
42. Westerling AL, Hidalgo HG, Cayan DR, Swetnam TW. Warming and earlier spring increase western U.S. forest wildfire activity. Science (80- ). 2006;313(5789):940–3.
43. National Climate Assessment and Development Advisory Committee. Third National Climate Assessment Report: Draft for Public Comment. Washington, D.C.; 2013:1146.
44. Mudarri D. Public Health Consequences and Cost of Climate Change Impacts on Indoor Environments. Arlington, VA; 2010:79.
45. Center for Climate Strategies. Florida’s Energy and Climate Change Action Plan.; 2008:608.
46. Boicourt K, Johnson ZP, eds. Comprehensive Strategy for Reducing Maryland’s Vulnerability to Climate Change, Phase II: Building societal, economic, and ecological resilience. Report of the Maryland Commission on Climate Change, ADaptation and Response and Scientific and Technical Wor. Cambridge, MD and
ASTHO Extreme Weather and Climate Readiness: Toolkit for State and Territorial Health Departments 100
Annapolis, MD: University of Maryland Center for Environmental Science and Maryland Department of Natural Resources; 2010:80.
47. Brunkard JM, Ailes E, Roberts VA, et al. Surveillance for Waterborne Disease Outbreaks Associated with Drinking Water: United States, 2007-2008. Morb Mortal Wkly Rep. 2011;60(12):38–75. Available at: http://www.cdc.gov/mmwr/preview/mmwrhtml/ss6012a1.htm.
48. U.S. Centers for Disease Control and Prevention. National Estimate of Waterborne Disease Associated with Public Drinking Water. 2012. Available at: http://www.cdc.gov/healthywater/statistics/surveillance/national_estimate_waterborne_disease.html.
49. Collier S a, Stockman LJ, Hicks L a, Garrison LE, Zhou FJ, Beach MJ. Direct healthcare costs of selected diseases primarily or partially transmitted by water. Epidemiol Infect. 2012;140(11):2003–13.
50. Rose JB, Epstein PR, Lipp EK, Sherman BH, Bernard SM, Patz J a. Climate variability and change in the United States: potential impacts on water- and foodborne diseases caused by microbiologic agents. Environ Health Perspect. 2001;109 Suppl (May):211–21. Available at: http://www.pubmedcentral.nih.gov/articlerender.fcgi?artid=1240668&tool=pmcentrez&rendertype=abstract.
51. Patz J a, Vavrus SJ, Uejio CK, McLellan SL. Climate change and waterborne disease risk in the Great Lakes region of the U.S. Am J Prev Med. 2008;35(5):451–8.
52. Curriero FC, Patz J a, Rose JB, Lele S. The association between extreme precipitation and waterborne disease outbreaks in the United States, 1948-1994. Am J Public Health. 2001;91(8):1194–9. Available at: http://www.pubmedcentral.nih.gov/articlerender.fcgi?artid=1446745&tool=pmcentrez&rendertype=abstract.
53. Charron D, Thomas M, Waltner-Toews D, et al. Vulnerability of waterborne diseases to climate change in Canada: a review. J Toxicol Environ Health A. 2004;67(20-22):1667–77.
54. Moore SK, Trainer VL, Mantua NJ, et al. Impacts of climate variability and future climate change on harmful algal blooms and human health. Environ Health. 2008;7 Suppl 2:S4.
55. Erdner DL, Dyble J, Parsons ML, et al. Centers for Oceans and Human Health: a unified approach to the challenge of harmful algal blooms. Environ Health. 2008;7 Suppl 2:S2.
ASTHO Extreme Weather and Climate Readiness: Toolkit for State and Territorial Health Departments 101
56. Anderson DM, Hoagland P, Kaoru Y, White AW. Estimated Annual Economic Impacts from Harmful Algal Blooms (HABs) in the United States. Woods Hole, MA; 2000:96. Available at: http://www.whoi.edu/fileserver.do?id=24159&pt=10&p=19132.
57. Rabinovici SJM, Bernknopf RL, Wein AM, Coursey DL, Whitman RL, Michigan L. Economic and health risk trade-offs of swim closures at a Lake Michigan beach. Environ Sci Technol. 2004;38(10):2737–2745.
58. Austin JC, Anderson S, Courant PN, Litan RE. America’s North Coast: A Benefit-Cost Analysis of a Program to Protect and Restore the Great Lakes. Ann Arbor, MI; 2007:86.
59. Titus JG. The Costs of Climate Change to the United States. In: Majumdar SK, Kalkstein LS, Yarnal B, Miller EW, Rosenfeld LM, eds. Global Climate Change: Implications, Challenges and Mitigation Measures. Easton, PA: The Pennsylvania Academy of Science; 1992:21.
60. U.S. Environmental Protection Agency. Wisconsin Clean Watersheds Needs Survey 2008.; 2008:1–2.
61. Executive Office of Energy and Environmental Affairs. Massachusetts Climate Change Adaptation Report. Boston, MA; 2011:128.
62. National Association of Clean Water Agencies, Association of Metropolitan Water Agencies. Confronting Climate Change: An Early Analysis of Water and Wastewater Adaptation Costs.; 2009:104.
63. Kidd SE, Chow Y, Mak S, et al. Characterization of environmental sources of the human and animal pathogen Cryptococcus gattii in British Columbia, Canada, and the Pacific Northwest of the United States. Appl Environ Microbiol. 2007;73(5):1433–43.
64. U.S. Environmental Protection Agency Office of Water. 2011 Drinking Water Infrastructure Needs Survey and Assessment: Fifth Report to Congress. Washington, D.C.; 2013:86.
65. North Carolina Interagency Leadership Team. Climate Ready North Carolina: Building a Resilient Future.; 2012:152.
66. Massachusetts Department of Environmental Protection. Patrick-Murray Administration Awards More than $512 Million in Loans to Fund Wastewater and Drinking Water Infrastructure Projects.http://www.mass.gov/eea/agencies/massdep/news/releases/loans-of-512-m-to-fund-state-projects.html. Published May 2, 2013. Accessed July 18, 2013.
ASTHO Extreme Weather and Climate Readiness: Toolkit for State and Territorial Health Departments 102
67. U.S. Environmental Protection Agency Office of Water. Total Coliform Rule Revisions. 2013. Available at: http://water.epa.gov/lawsregs/rulesregs/sdwa/tcr/regulation_revisions.cfm.
68. U.S. Centers for Disease Control and Prevention. Zoonotic Disease: When Humans and Animals Intersect. 2014. Available at: http://www.cdc.gov/24-7/cdcfastfacts/zoonotic.html.
69. Jones KE, Patel NG, Levy M a, et al. Global trends in emerging infectious diseases. Nature. 2008;451(7181):990–3.
70. Institute of Medicine. Vector-borne diseases: understanding the environmental, human health, and ecological connections. Washington, D.C.: The National Academies Press; 2008:351. Available at: http://www.nap.edu/catalog/11950.html.
71. U.S. Global Change Research Program. Climate Change Impacts in the United States: The Third National Climate Assessment. (Melillo JM, Richmond T (T. C., Yohe GW, eds.). Washington, D.C.: U.S. Government Printing Office; 2014:841.
72. U.S. Centers for Disease Control and Prevention. West Nile Virus: Statistics and Maps. 2013. Available at: http://www.cdc.gov/westnile/statsMaps/index.html.
73. Soverow JE, Wellenius G a, Fisman DN, Mittleman M a. Infectious disease in a warming world: how weather influenced West Nile virus in the United States (2001-2005). Environ Health Perspect. 2009;117(7):1049–52.
74. Githeko AK, Lindsay SW, Confalonieri UE, Patz JA. Climate change and vector-borne diseases: a regional analysis. Bull World Health Organ. 2000;78(9):1136–1147. Available at: http://www.who.int/bulletin/archives/78(9)1136.pdf.
75. Morin CW, Comrie AC. Regional and seasonal response of a West Nile virus vector to climate change. Proc Natl Acad Sci U S A. 2013;110(39):15620–5.
76. Trout A, Baracco G, Rodriguez M, et al. Locally Acquired Dengue — Key West, Florida, 2009–2010. Morb Mortal Wkly Rep. 2010;59(19):577–581. Available at: http://www.medscape.com/viewarticle/722515.
77. Radke EG, Gregory CJ, Kintziger KW, et al. Dengue Outbreak in Key West, Florida, USA, 2009. Emerg Infect Dis. 2012;18(1):135–137.
78. Shepard DS, Coudeville L, Halasa Y a, Zambrano B, Dayan GH. Economic impact of dengue illness in the Americas. Am J Trop Med Hyg. 2011;84(2):200–7.
ASTHO Extreme Weather and Climate Readiness: Toolkit for State and Territorial Health Departments 103
79. Van Kleef E, Bambrick H, Hales S. The geographic distribution of dengue fever and the potential influence of global climate change. TropIKA.net. 2009;(December):1–22.
80. Johansson M a, Dominici F, Glass GE. Local and global effects of climate on dengue transmission in Puerto Rico. PLoS Negl Trop Dis. 2009;3(2):e382.
81. Hopp MJ, Foley JA. Global-scale relationships between climate and the dengue fever vector, aedes aegypti. Clim Change. 2001;48:441–463.
82. Weaver SC, Reisen WK. Present and Future Arboviral Threat. Antiviral Res. 2010;85(2):1–36.
83. Reiter P, Lathrop S, Bunning M, et al. Texas lifestyle limits transmission of dengue virus. Emerg Infect Dis. 2003;9(1):86–9. Available at: http://www.pubmedcentral.nih.gov/articlerender.fcgi?artid=2873752&tool=pmcentrez&rendertype=abstract.
84. Chomel BB, Belotto A, Meslin F-X. Wildlife, Exotic Pets, and Emerging Zoonoses. Emerg Infect Dis. 2007;13(1):6–11.
85. Patz J a., Daszak P, Tabor GM, et al. Unhealthy Landscapes: Policy Recommendations on Land Use Change and Infectious Disease Emergence. Environ Health Perspect. 2004;112(10):1092–1098.
86. Minnesota Department of Health. Draft Minnesota Department of Health Strategic Plan to Adapt to Climate Change.; 2010:22.
87. Morin CW, Comrie AC. Modeled response of the West Nile virus vector Culex quinquefasciatus to changing climate using the dynamic mosquito simulation model. Int J Biometeorol. 2010;54(5):517–29.
88. Brownstein JS, Holford TR, Fish D. Effect of climate change on Lyme disease risk in North America. Ecohealth. 2005;2(1):38–46.
89. Jacobson GL, Fernandez IJ, Mayewski PA, Schmitt C V, eds. Maine’s Climate Future: An Initial Assessment. Orono, ME: University of Maine; 2009:74. Available at: http://www.climatechange.umain.edu/mainesclimatefuture/.
90. U.S. Centers for Disease Control and Prevention. Food Safety: A CDC Winnable Battle. Atlanta, GA; 2012:2. Available at: http://www.cdc.gov/winnablebattles/foodsafety/pdf/foodsafety_wb_at_a_glance.pdf.
ASTHO Extreme Weather and Climate Readiness: Toolkit for State and Territorial Health Departments 104
91. Roberts T, Jensen H, Unnevehr L, eds. Tracking Foodborne Pathogens from Farm to Table: Data Needs to Evaluate Control Options. Washington, D.C.: U.S. Department of Agriculture, Economic Research Service, Food and Consumer Economics Division; 1995:184.
92. U.S. Centers for Disease Control and Prevention. Foodborne Outbreak Investigations - Key Players in Foodborne Outbreak Response. 2011. Available at: http://www.cdc.gov/outbreaknet/investigations/key_players.html.
93. Vermeulen SJ, Campbell BM, Ingram JSI. Climate Change and Food Systems. Annu Rev Environ Resour. 2012;37(1):195–222. doi:10.1146/annurev-environ-020411-130608.
94. Larson NI, Story MT, Nelson MC. Neighborhood environments: disparities in access to healthy foods in the U.S. Am J Prev Med. 2009;36(1):74–81.
95. Finch C, Daniel E. Food safety knowledge and behavior of emergency food relief organization workers: effects of food safety training intervention. J Environ Health. 2005;67(9):30–4, 58; quiz 63–4. Available at: http://www.ncbi.nlm.nih.gov/pubmed/15957320.
96. Mabli J, Cohen R, Potter F, Zhao Z. Feeding America: National Report. Princeton, NJ; 2010:430.
97. Battisti DS, Naylor RL. Historical warnings of future food insecurity with unprecedented seasonal heat. Science (80- ). 2009;323:240–244.
98. Brown TC, Froemke P. Nationwide Assessment of Nonpoint Source Threats to Water Quality. Bioscience. 2012;62(2):136–146.
99. James SJ, James C. The food cold-chain and climate change. Food Res Int. 2010;43(7):1944–1956.
100. Newton A, Kendall M, Vugia DJ, Henao OL, Mahon BE. Increasing rates of vibriosis in the United States, 1996-2010: review of surveillance data from 2 systems. Clin Infect Dis. 2012;54 Suppl 5(Suppl 5):S391–5.
101. California Department of Food and Agriculture. Climate Change Adaptation Consortium. Available at: http://www.cdfa.ca.gov/environmentalstewardship/ClimateChangeAdaptConsortium.html.
102. Oregon Health Authority. Climate and Health. Available at: http://public.health.oregon.gov/HealthyEnvironments/climatechange/Pages/ClimateandHealth.aspx#counties.
ASTHO Extreme Weather and Climate Readiness: Toolkit for State and Territorial Health Departments 105
103. Pittman E. Sustainable Practices Create Disaster Resiliency in Portland, Ore. Emerg Manag. 2012. Available at: http://www.emergencymgmt.com/disaster/Sustainable-Practices-Disaster-Resiliency-Portland.html.
104. U.S. Environmental Protection Agency. TSCA Chemical Substance Inventory - Basic Information. 2013. Available at: http://www.epa.gov/oppt/existingchemicals/pubs/tscainventory/basic.html.
105. Vogel S a, Roberts J a. Why the toxic substances control act needs an overhaul, and how to strengthen oversight of chemicals in the interim. Health Aff (Millwood). 2011;30(5):898–905.
106. U.S. Environmental Protection Agency. Learn about the Toxics Release Inventory. Available at: http://www2.epa.gov/toxics-release-inventory-tri-program/learn-about-toxics-release-inventory.
107. Brulle RJ, Pellow DN. Environmental justice: human health and environmental inequalities. Annu Rev Public Health. 2006;27(102):103–24.
108. Landrigan PJ, Schechter CB, Lipton JM, Fahs MC, Schwartz J. Environmental pollutants and disease in American children: estimates of morbidity, mortality, and costs for lead poisoning, asthma, cancer, and developmental disabilities. Environ Health Perspect. 2002;110(7):721–728. Available at: http://ehpnet1.niehs.nih.gov/docs/2002/110p721-728landrigan/abstract.html.
109. Yu H, Stuart AL. Spatiotemporal Distributions of Ambient Oxides of Nitrogen, with Implications for Exposure Inequality and Urban Design. J Air Waste Manage Assoc. 2013;(June 2013):130522143911002.
110. Abel TD, White J. Skewed riskscapes and gentrified inequities: environmental exposure disparities in Seattle, Washington. Am J Public Health. 2011;101 Suppl :S246–54.
111. Berkowitz JD. Into the Mystic: Combined Sewer Overflows (CSOs) and Community Demographics in the Mystic River Watershed: An Environmental Equity Analysis. 2008;(August):158. Available at: http://www.amazon.com/Combined-overflows-community-demographics-Watershed/dp/1244944823.
112. U.S. Environmental Protection Office of Water. Report to Congress: Impacts and Control of CSOs and SSOs. Washington, D.C.; 2004. Available at: http://cfpub.epa.gov/npdes/cso/cpolicy_report2004.cfm.
ASTHO Extreme Weather and Climate Readiness: Toolkit for State and Territorial Health Departments 106
113. Gehlert H. Struggling to Breathe. Issue. 2012;20:28. Available at: http://www.acphd.org/media/276895/bmsg_issue20.pdf.
114. U.S. Department of Agriculture Economic Research Service. U.S. Drought 2012: Farm and Food Impacts. Available at: http://www.ers.usda.gov/topics/in-the-news/us-drought-2012-farm-and-food-impacts.aspx#.UebNRBZ7m3B.
115. Bentz BJ, Régnière J, Hansen M, Hayes JL, Hicke JA. Climate change and bark beetles of the western United States and Canada: direct and indirect effects. BioSense. 2010;60(8):602–613.
116. Center for Integrative Environmental Research. The U.S. Economic Impacts of Climate Change and the Costs of Inaction. College Park, MD; 2007:52. Available at: http://www.cier.umd.edu/climateadaptation.
117. Berman M, Juday GP, Burnside R. Climate Change and Alaska’s Forests: People, Problems, and Policies. In: Weller G, Anderson PA, eds. Assessing the Consequences of Climate Change for Alaska and the Bering Sea Region: Proceedings of a Workshop at the University of Alaska Fairbanks, 29-30 October 1998. Fairbanks, AK: University of Alaska Fairbanks; 1998:21–42.
118. Jerrett M, Su JG, Reid CE, et al. Mapping Climate Change Exposures, Vulnerabilities, and Adaptation to Public Health Risks in the San Francisco Bay and Fresno Regions.; 2012:104.
119. Kershner JM. Incorporating Climate Change into TMDL Decisions for Lake Champlain [Case study on a project of the Conservation Law Foundation]. Product of EcoAdapt’s State of Adaptation Program. CAKE Clim Adapt Knowl Exch. 2012. Available at: http://www.cakex.org/case-studies/incorporating-climate-change-tmdl-decisions-lake-champlain.
120. U.S. Centers for Disease Control and Prevention National Center for Chronic Disease Prevention and Health Promotion. Chronic Diseases: The power to prevent, the call to control, at a glance. Atlanta, GA; 2009:4. Available at: http://www.cdc.gov/chronicdisease/resources/publications/aag/pdf/chronic.pdf.
121. U.S. Centers for Disease Control and Prevention. Leading Causes of Death, 1900-1998. Atlanta, GA; 1998:67. Available at: http://www.cdc.gov/nchs/data/dvs/lead1900_98.pdf.
122. National Center for Health Statistics. Health, United States, 2011: With Special Feature on Socioeconomic Status and Health. Hyattsvill, MD; 2012:583. Available at: http://www.cdc.gov/nchs/data/hus/hus11.pdf.
ASTHO Extreme Weather and Climate Readiness: Toolkit for State and Territorial Health Departments 107
123. Bipartisan Policy Center. Lots to Lose: How America’s Health and Obesity Crisis Threatens our Economic Future. Washington, D.C.; 110. Available at: www.bipartisanpolicy.org.
124. Curtis A, Mills JW, Leitner M. Katrina and vulnerability: the geography of stress. J Health Care Poor Underserved. 2007;18(2):315–30.
125. Reid CE, O’Neill MS, Gronlund C, et al. Mapping community determinants of heat vulnerability. Environ Health Perspect. 2009;117(11):1730–1736.
126. Braga ALF, Zanobetti A, Schwartz J. The Effect of Weather on Respiratory and Cardiovascular Deaths in 12 U.S. Cities. Environ Health Perspect. 2002;110(9):859–863. Available at: http://ehpnet1.niehs.nih.gov/docs/2002/110p859-863braga/abstract.html.
127. Luber G, McGeehin M. Climate Change and Extreme Heat Events. Am J Prev Med. 2008;35(5):429–435.
128. Frumkin H, Hess J, Luber G, Malilay J, McGeehin M. Climate Change: The Public Health Response. Am J Public Health. 2008;98(3):435–445.
129. U.S. Centers for Disease Control and Prevention. WISQARS Leading Causes of Death Reports, National and Regional, 1999-2010. 2013. Available at: http://webappa.cdc.gov/sasweb/ncipc/leadcaus10_us.html.
130. Naumann RB, Dellinger AM, Zaloshnja E, Lawrence B a, Miller TR. Incidence and total lifetime costs of motor vehicle-related fatal and nonfatal injury by road user type, United States, 2005. Traffic Inj Prev. 2010;11(4):353–60.
131. Beck LF, Dellinger AM, O’Neil ME. Motor vehicle crash injury rates by mode of travel, United States: using exposure-based methods to quantify differences. Am J Epidemiol. 2007;166(2):212–8.
132. Jacobsen PL, Racioppi F, Rutter H. Who owns the roads? How motorised traffic discourages walking and bicycling. Inj Prev. 2009;15(6):369–73.
133. Jacobsen PL, Rutter H. Cycling Safety. In: Pucher J, Buehler R, eds. City Cycling. Cambridge, MA: MIT Press; 2012:393. Available at: http://books.google.com/books?hl=en&lr=&id=226mCyz9JaEC&pgis=1.
134. Lee C, Ory MG, Yoon J, Forjuoh SN. Neighborhood walking among overweight and obese adults: age variations in barriers and motivators. J Community Health. 2013;38(1):12–22.
ASTHO Extreme Weather and Climate Readiness: Toolkit for State and Territorial Health Departments 108
135. Pucher J, Dill J, Handy S. Infrastructure, programs, and policies to increase bicycling: an international review. Prev Med (Baltim). 2010;50 Suppl 1:S106–25.
136. Winters M, Davidson G, Kao D, Teschke K. Motivators and deterrents of bicycling: comparing influences on decisions to ride. Transportation (Amst). 2010;38(1):153–168. doi:10.1007/s11116-010-9284-y.
137. Bernstein L, Bosch P, Canziani O, et al. Climate Change 2007: Synthesis Report, An Assessment of the Intergovernmental Panel on Climate Change.; 2007:52. Available at: http://www.ipcc.ch/pdf/assessment-report/ar4/syr/ar4_syr.pdf.
138. Younger M, Morrow-Almeida HR, Vindigni SM, Dannenberg AL. The built environment, climate change, and health: opportunities for co-benefits. Am J Prev Med. 2008;35(5):517–526. Available at: http://download.journals.elsevierhealth.com/pdfs/journals/0749-3797/PIIS074937970800682X.pdf.
139. McNeill LH, Kreuter MW, Subramanian S V. Social environment and physical activity: a review of concepts and evidence. Soc Sci Med. 2006;63(4):1011–22.
140. Michigan Department of Community Health. Preparing for the Public Health Impacts of Climate Change. Available at: http://www.michigan.gov/mdch/0,1607,7-132-54783_54784_55975---,00.html.
141. Heat Adaptation Workgroup of the California Climate Action Team Public Health Workgroup. State of California Extreme Heat Adaptation Interim Guidance Document: Draft for Public Comment.; 2012:24.
142. National Climate Assessment Development Advisory Committee. Federal Advisory Committee Draft Climate Assessment Report Released for Public Review. 2013. Available at: http://ncadac.globalchange.gov/.
143. Smith AB, Katz RW. US billion-dollar weather and climate disasters: data sources, trends, accuracy and biases. Nat Hazards. 2013;67(2):387–410.
144. National Oceanic and Atmospheric Administration National Climatic Data Center. Billion-Dollar Weather/Climate Disasters. Available at: http://www.ncdc.noaa.gov/billions/overview.
145. NOAA National Climatic Data Center. State of the Climate: National Overview for Annual 2012. 2012. Available at: http://www.ncdc.noaa.gov/sotc/national/2012/13.
146. Knowlton K, Rotkin-Ellman M, Geballe L, Max W, Solomon GM. Six climate change-related events in the United States accounted for about $14 billion in lost lives and health costs. Health Aff (Millwood). 2011;30(11):2167–76.
ASTHO Extreme Weather and Climate Readiness: Toolkit for State and Territorial Health Departments 109
147. Healy A, Malhotra N. Myopic Voters and Natural Disaster Policy. Am Polit Sci Rev. 2009;103(03):387.
148. Keim ME. Building human resilience: the role of public health preparedness and response as an adaptation to climate change. Am J Prev Med. 2008;35(5):508–16.
149. Executive Order 13514 of October 5, 2009: Federal Leadership in Environmental, Energy, and Economic Performance. United States of America: Presidential Documents; 2009:52117–52127. Available at: http://www.gpo.gov/fdsys/pkg/FR-2009-10-08/pdf/E9-24518.pdf.
150. U.S. Department of Homeland Security. Quadrennial homeland security review report: a strategic framework for a secure homeland. Washington, D.C.; 2010:108.
151. Federal Emergency Management Agency. FEMA Climate Change Adaptation Policy Statement.; 2011.
152. Sastry N. Displaced New Orleans Residents in the Aftermath of Hurricane Katrina: Results from a Pilot Survey. Organ Environ. 2009;22(4):395–409.
153. Greenough PG, Lappi MD, Hsu EB, et al. Burden of disease and health status among Hurricane Katrina-displaced persons in shelters: a population-based cluster sample. Ann Emerg Med. 2008;51(4):426–32.
154. Rosenbaum S. US health policy in the aftermath of Hurricane Katrina. JAMA. 2006;295(4):437–40.
155. Lein L, Ronald A, Beausoleil J, Bell H, Connell C, Hill T. Katrina Evacuees in Austin, Texas: Analysis of Needs Assessment Data. Austin, TX; 2006:54. Available at: http://www.utexas.edu/research/cswr/katrina/Documents/City of Aus Final Report.pdf.
156. Abramson D, Garfield R. On the Edge: Children and Families Displaced by Hurricanes Katrina and Rita Face a Looming Medical and Mental Health Crisis. New York; 2006:34. Available at: http://www.ncdp.mailman.columbia.edu/files/LCAFH.pdf.
157. Coker AL, Hanks JS, Eggleston KS, et al. Social and mental health needs assessment of Katrina evacuees. Disaster Manag Response. 2006;4(3):88–94.
158. Blunden J, Arndt DS, eds. State of the Climate in 2011. Bull Am Meteorol Soc. 2012;93(7):S1–S264.
ASTHO Extreme Weather and Climate Readiness: Toolkit for State and Territorial Health Departments 110
159. Center for Climate and Energy Solutions. U.S. Climate Policy Maps. 2013. Available at: http://www.c2es.org/us-states-regions/policy-maps.
160. Karlsson L. Vermont Climate Change Health Effects Adaptation. Vermont Dep Heal Clim Chang Adapt White Pap Ser. 2011;(May):1–10. Available at: http://www.anr.state.vt.us/anr/climatechange/Pubs/VTCCAdaptHealthEffects.pdf.
161. Federal Emergency Management Agency. Multi-Hazard Mitigation Plan Status. Available at: http://www.fema.gov/multi-hazard-mitigation-plan-status.
162. U.S. Centers for Disease Control and Prevention Office of Public Health Preparedness and Response. Public Health Preparedness Capabilities: National Standards for State and Local Planning. Atlanta, GA; 2011:153. Available at: http://www.cdc.gov/phpr/capabilities.
163. U.S. Department of Health and Human Services Office of the Assistant Secretary for Preparedness and Response. Healthcare Preparedness Capabilities: National Guidance for Healthcare System Preparedness. Washington, D.C.; 2012:73. Available at: http://www.phe.gov/preparedness/planning/hpp/reports/documents/capabilities.pdf.
164. Jackson JE, Yost MG, Karr C, et al. Public Health Impacts. In: The Washington Climate Change Impacts Assessment: Evaluating Washington’s Future in a Changing Climate. Climate Impacts Group, University of Washington; 2009:345–371.