Embed Size (px)
Citation preview
Extreme Weather Events ‐ Rainfall
R. KrishnanCentre for Climate Change Research
Indian Institute of Tropical Meteorology, Pune
Media briefing on climate change for South Asia
Centre for Science and Environment (CSE)India Habitat Centre, New Delhi
18‐19 September 2013

Difference between natural climate variability and anthropogenic climate change
Extremes are likely to riseExtremes are likely to rise
Frequency of occurrence (y axis) of local temperature anomalies (relative to 1951 – 1980 mean) divided by local standard deviation (x axis) obtained by counting grid boxes with anomalies in each 0.05 interval. Area under each curve is unity – Hansen et al. 2012 PNAS
Distribution of temperature anomalies for northern summer (JJA): Global

Trend: Hot Days Trend: Cold Days
TX90P TX10P
Trends in frequency of hot days (TX90p) and cold days (TX10p) for the period 1970‐2003. Positive trends are shown by red cross (x) and negative trends by blue circles (o). Bigger crosses (X) and circles (O) are statistically significant trends
Revadekar et al. 2010, Natural Hazards
Hansen et al. (2012) PNAS
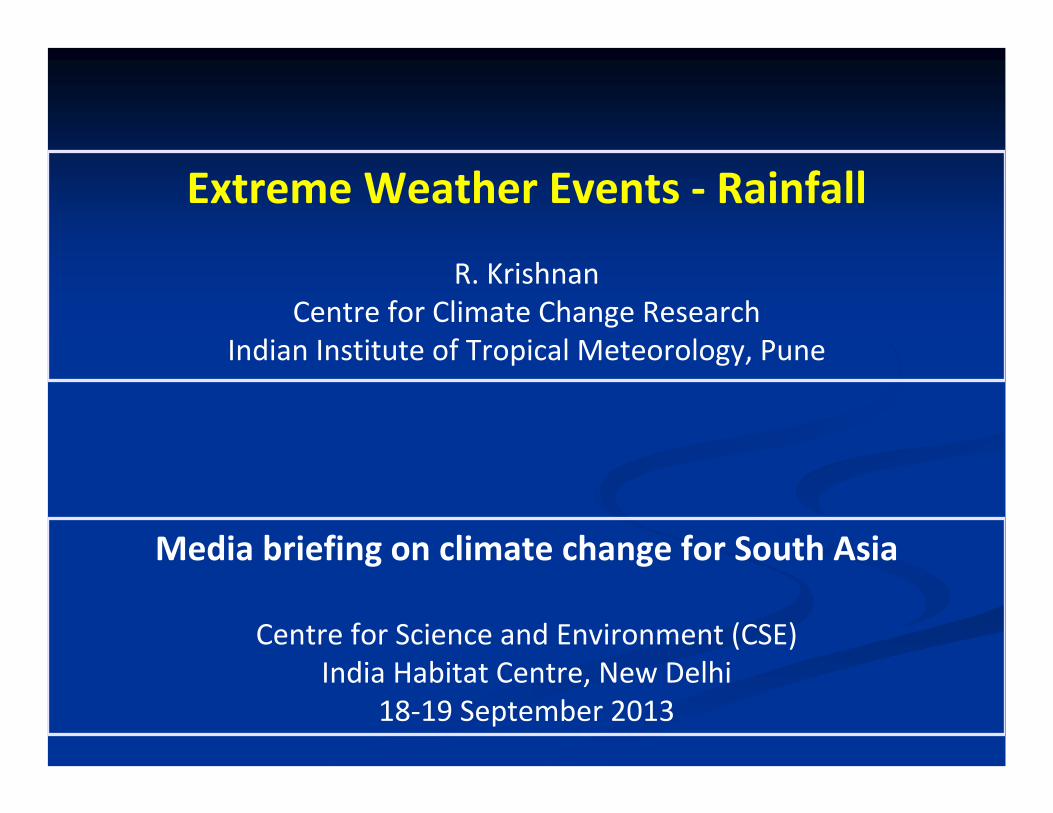
Scientific challenges in modeling extreme precipitation events
•Relatively infrequent and inherently unpredictable
•Require large ensembles to simulate the statistics
•Assess the impact of external drivers on their statistics
•Depend on dynamical processes that require relatively high resolution to represent them
•High resolution is essential to represent processes properly on all ranges of possible statistical outcomes, especially climate extremes and their impacts
•Multi‐model ensemble simulations necessary for reliable regional climate projections, and to Quantify and reduce uncertainties in regional climate projections
Reliable assessment of regional climate change
Regional climate change projections over South Asia
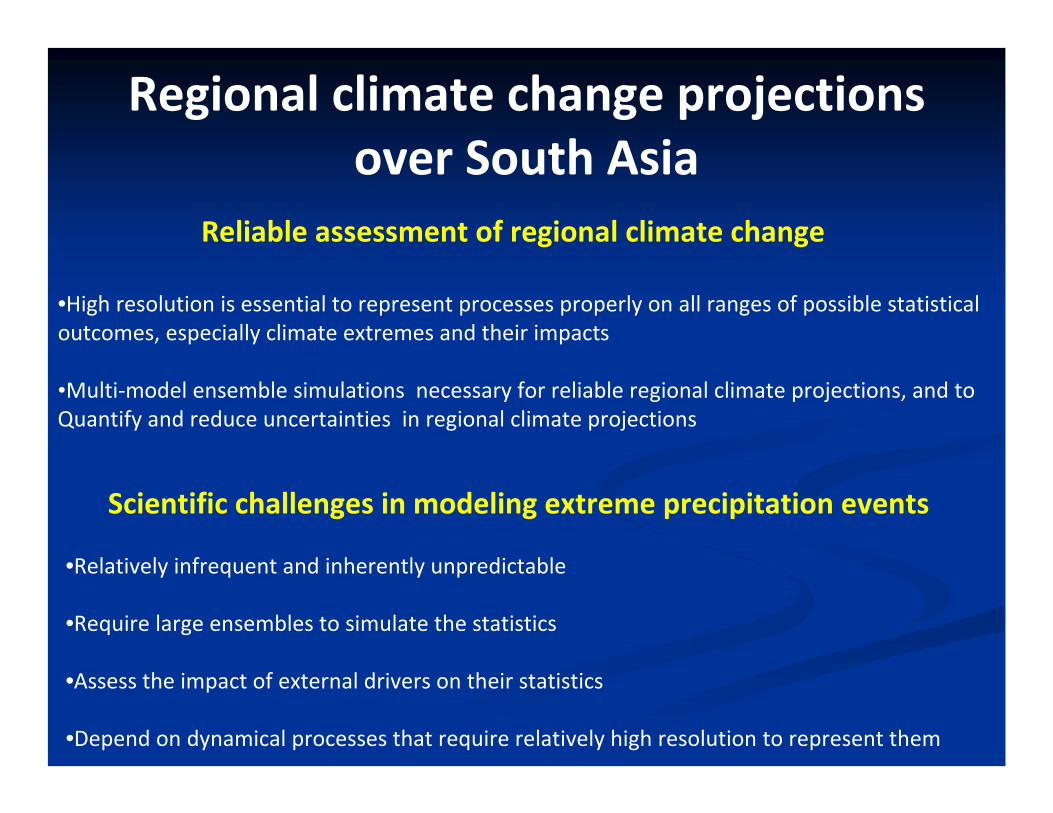
Influence of external drivers on extreme monsoons Example: Indian monsoon droughts have often co-occurred with El Nino events
(Source: http://www.tropmet.res.in)
El Nino teleconnections

Andrew Turner and Annamalai, 2012 Nature Climate Change
CMIP3 models

CMIP5 model-based time series of temperature and precipitation anomalies (historical and projections) from 1861 – 2099 relative to the 1961 – 1990 baseline for the RCP scenarios . Shaded areas represent the range of changes projected by the 18 models for each year. The model ensemble averages for each RCP is shown with thick lines. The observed temperature and precipitation trend from CRU is shown by the green line and the solid black line. ‘Historical’ refers to model ensemble values for historical simulations.
Multi-model climate change projections for India under representative concentration Pathways - Rajiv Chaturvedi et al. (2012) Current Science

Goswami et al., Science, 2006
Increasing Trend of Extreme Rain Events over India in a Warming Environment
Time series of count over Central India
Low and Moderate events
Heavy events (>100 mm)
Very Heavy events (>150 mm)

CMIP5 model ensemble-based grid-wise distribution of temperature & rainfall change under different RCP scenarios for India for 2080s (2070 – 2099) relative to the pre-industrial period (1861 – 1900)
Chaturvedi et al. 2012
Projected change in the frequency of extreme rainfall days for future decades relative to the 1861 – 1870 baseline based on the MIROC-ESM model for RCP4.5 scenario
Limitations of coarse resolution climate models in capturing high intensity ( > 100 mm / day) rainfall events over the Indian monsoon region and their change
CMIP5 models
Latitude Latitude
Cha
nges
of 5
0-ye
ar re
turn
leve
ls (%
)
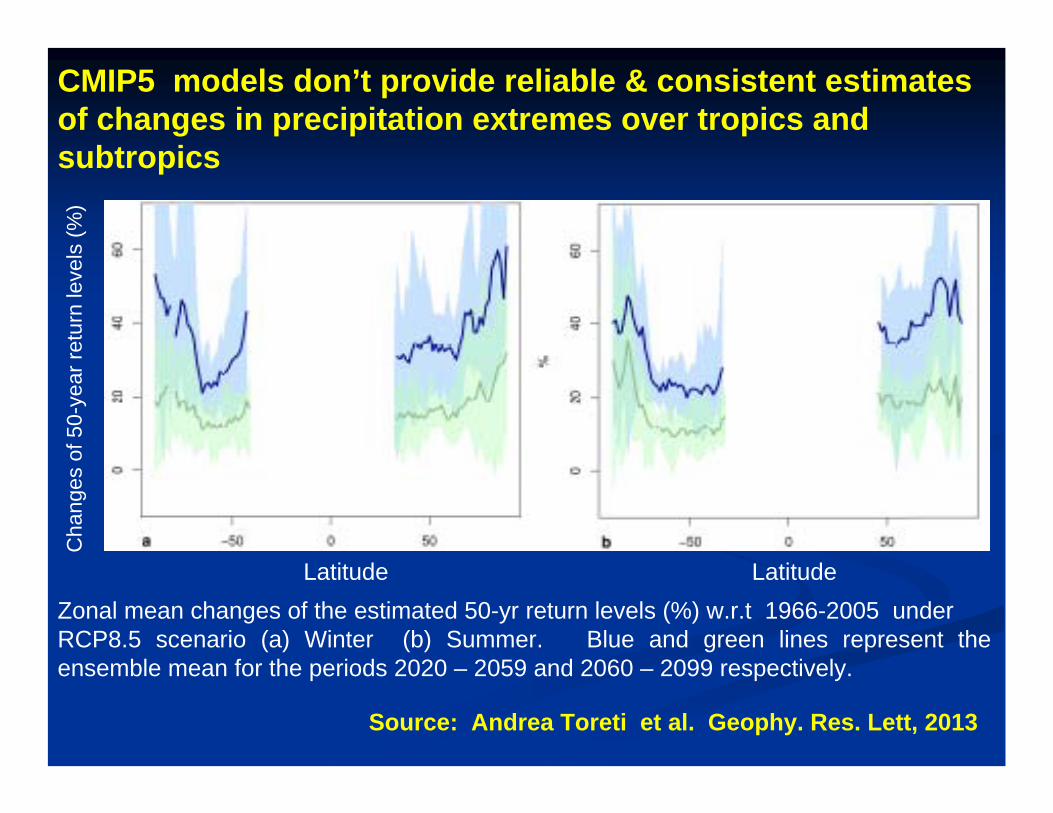
Zonal mean changes of the estimated 50-yr return levels (%) w.r.t 1966-2005 under RCP8.5 scenario (a) Winter (b) Summer. Blue and green lines represent the ensemble mean for the periods 2020 – 2059 and 2060 – 2099 respectively.
Source: Andrea Toreti et al. Geophy. Res. Lett, 2013
CMIP5 models don’t provide reliable & consistent estimates of changes in precipitation extremes over tropics and subtropics

Regional climate processes: Links between regional and large‐scale variability
http: airs.jpl.nasa.gov
Pakistan Floods 2010: Extent of Pakistan floods detected by AIRS satellite. The Atmospheric Infrared Sounder, AIRS, in conjunction with the Advanced Microwave Sounding Unit, AMSU, senses emitted infrared and microwave radiation from Earth to provide a three‐dimensional look at Earth's weather and climate
Climatology
2010
•Westward shift of sub‐tropical High (Mujumdar et al. 2012)
•Westward displacement of storms and departure of synoptic scale circulation (Houze et al. 2011)
•Influence of midlatitude circulation, European blocking and interaction with tropical storms (Hong et al. 2011, Saeed et al.2011)
•Extended range prediction (~ 15 days lead) (Webster et al. 2011)
Source: Milind Mujumdar
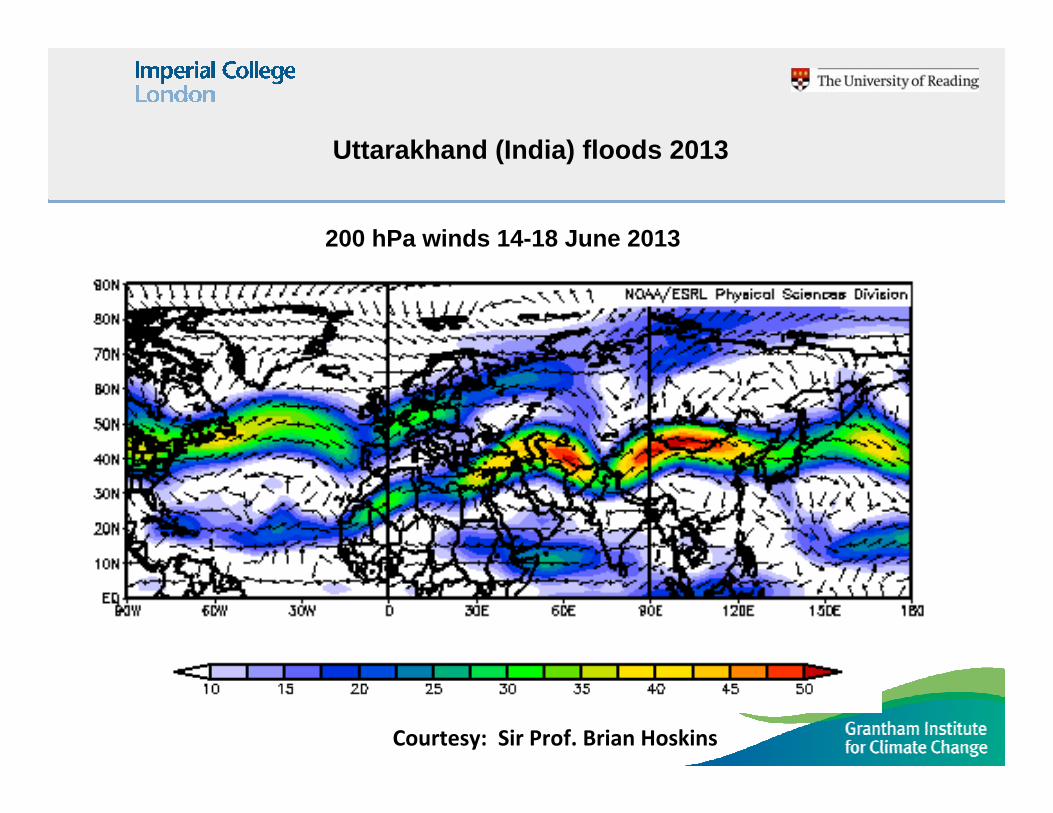
Uttarakhand (India) floods 2013
200 hPa winds 14-18 June 2013
Courtesy: Sir Prof. Brian Hoskins

Evolution of Uttarakhand heavy rainfall event (June 2013)Interactions between southward intruding mid-latitude troughs and monsoon lows
L
16 June 2013
L
17 June 2013
15 June 201314 June 2013
Courtesy: Ramesh Vellore

Rainfall over the southern slopes of the Himalayas & adjoining plains during monsoon breaks
(Dhar, Soman and Mulye, 1984) Composite during breaks (Ramesh et al. 2013 Under review)
Rainfall Rainfall anomaly
Anomalous northward shift of monsoon trough
Ramesh et al. 2013

Monsoon break simulation by WRF high‐resolution (10 km) model ‐ Courtesy: Ramesh Vellore
Precipitable water
Rainfall
SLP and 850 hPa winds
Day 0 Day 1
Day 1Day 0
500 hPa Geopotential height and winds

Flood Inundated Areas in part of Assam State: 8 June 2012 ‐ Analysis of Radarsat SAR data
Flood Hazard Zonation Map of Brahmaputra and Barak Rivers in Assam State –Based on analysis of satellite data during 1998 –2005 floods
Courtesy: National Remote Sensing Centre, India

World Climate Research Programme (WCRP)

Impacts of changing climate are pre‐dominant at regional scales !

•Better understand regional climate processes and improve climate models
•Produce reliable high‐resolution regional climate change scenarios globally, thereby contributing to the IPCC AR5 and to the climate community beyond the AR5
•Evaluate regional climate model performance through a set of experiments aiming at producing regional climate projections
•Quantify and understand the uncertainties in regional climate projections
•Link climate modeling better with regional impact, adaptation and vulnerability assessment
•Integrate the regional downscaling activities, facilitate cross‐fertilization of scientific expertise and engage the community of regional scientists for further capacity building in the region
CORDEX communities across the globe

South Asia
WCRP CORDEX South AsiaCo‐ordinated Regional Downscaling Experiment – CORDEX South Asia
(CORDEX South Asia – led by CCCR, IITM)

Evaulation / Baseline run with ERA – Interim boundary conditions (1989 – 2008)
Historical run (1950 – 2005)
Future projection : 2005 - 2100 (eg., RCP 4.5, 6.0, 8.5 Scenario)
CORDEX: Model Experiments
LMDZ model (~ 35 km ) CCCR (IITM), IPSL
RegCM model (~ 50 km) CCCR (IITM)
HadRM3P model (~ 50 km) CCCR (IITM), Hadley Centre
WRF model (~ 50 km) - CCCR (IITM), BCCR and TERI
MRI model (~ 20 km) global model (MRI, Japan)
RCA model (~ 50 km) Rossby Centre, Sweden
COSMO-CLM (~ 50 km) University of Frankfurt, Germany
CCAM model ( ~ 50 km) CSIRO, Australia
Participating Modeling Groups
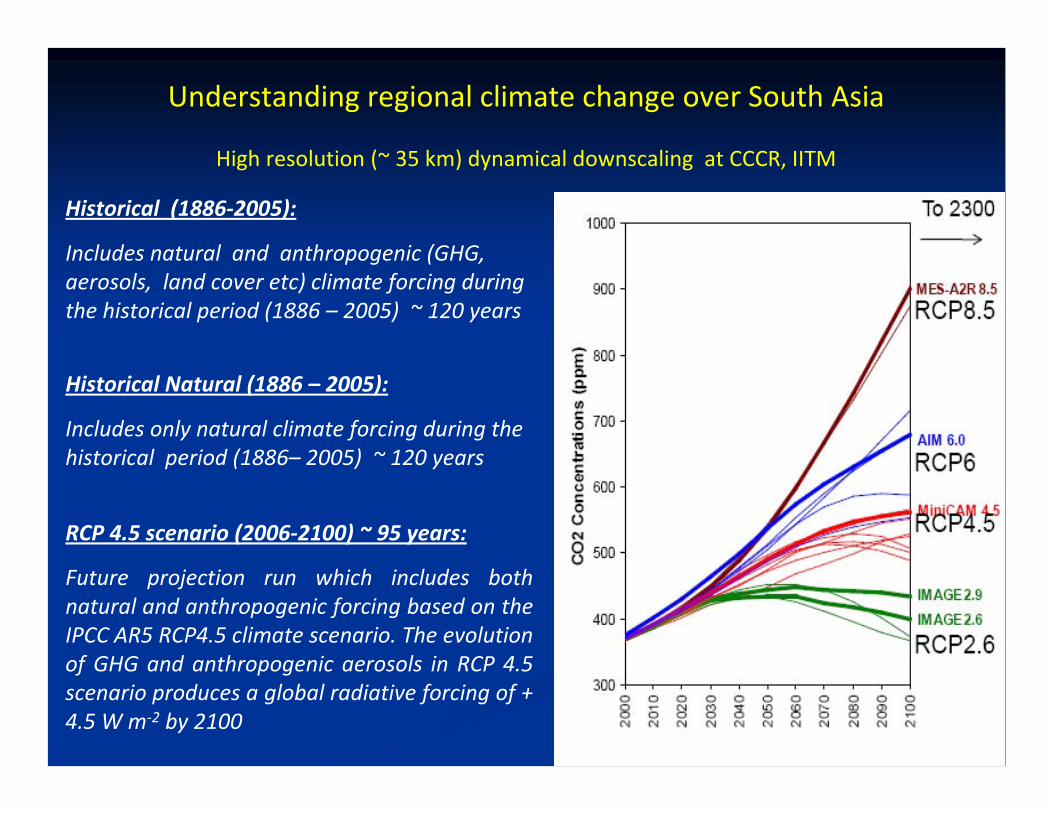
Historical (1886‐2005):
Includes natural and anthropogenic (GHG, aerosols, land cover etc) climate forcing during the historical period (1886 – 2005) ~ 120 years
Historical Natural (1886 – 2005):
Includes only natural climate forcing during the historical period (1886– 2005) ~ 120 years
RCP 4.5 scenario (2006‐2100) ~ 95 years:
Future projection run which includes both natural and anthropogenic forcing based on the IPCC AR5 RCP4.5 climate scenario. The evolution of GHG and anthropogenic aerosols in RCP 4.5 scenario produces a global radiative forcing of + 4.5 W m‐2 by 2100
Understanding regional climate change over South Asia
High resolution (~ 35 km) dynamical downscaling at CCCR, IITM

Source: Sabin, CCCR, IITM
LMDZ grid setup for CORDEX South Asia (shaded region has grid‐size < 35 km)

PRITHVI (High Performance Computing System) , IITM, Pune
Configuration of PRITHVI, HPC at IITM:
IBM P6 575 nodes totaling 117 numbers including the 2 nodes for GPFS quorum and one Login node. Each node is populated with 32 cores of IBM P 6 CPU running at 4.7 G Hz. Total of 3744 cores with Peak Performance of 70 Tflops.
High end Servers P570’s, P550’s, 20 Visual Workstations.
Interconnectivity using Infiniband Switches and Ethernet switches for Management purposes
Total of 3 Peta Bytes of Storage including Online, Near‐line and Archival Storage
GPFS, Tivoli and other Management Softwares

Zoom
No Zoom
Zoom
No Zoom
Zoom No Zoom
Monsoon rainfall (JJAS)
Mean annual cycles of rainfall (mm day ‐1) and surface temperature (oC) over the Indian landmass from the zoom and no‐zoom runs

RCP4.5
RCP4.5
1011121314151617
1 8 8 6 1 9 0 6 1 9 2 6 1 9 4 6 1 9 6 6 1 9 8 6 2 0 0 6 2 0 2 6 2 0 4 6 2 0 6 6 2 0 8 6
Surface Air Temperature Temp
Temp‐Natural RCP4.5
Global Mean
2 2
2 3
2 4
2 5
2 6
2 7
1 8 8 6 1 9 0 6 1 9 2 6 1 9 4 6 1 9 6 6 1 9 8 6 2 0 0 6 2 0 2 6 2 0 4 6 2 0 6 6 2 0 8 6
Global Tropics (30oS – 30oN)
RCP4.5Temp
Temp‐Natural
2 2
2 4
2 6
2 8
3 0
3 2
South Asian Monsoon (70oE– 90oE; 10oN– 25oN)
Temp
Temp‐Natural
RCP4.5
Source: Sabin, CCCR, IITM

0
2
4
6
8
10
12
1886 1906 1926 1946 1966 1986 2006 2026 2046 2066 2086
Precip
Precip‐Natural
South Asian Monsoon Region (70oE– 90oE; 10oN– 25oN)
RCP4.5
2.7
2.8
2.9
3
3.1
3.2
1886 1906 1926 1946 1966 1986 2006 2026 2046 2066 2086
Global Tropics (30oS – 30oN) RCP4.5
Precip
Precip‐Natural
Annual mean precipitation
JJAS precipitation
Source: Sabin, CCCR, IITM

> 100 mm/day over MT region
Source: Sabin, CCCR, IITM
Goswami et al., Science, 2006

APHRODITE LMDZ SMHI COSMO‐CLM
Patterns of rainfall variability over Himalayas from multiple models
Source: Priya, CCCR

Courtesy: Sandip Ingle, Milind Mujumdar, CCCR
Announcement of CORDEX South Asia dataset dissemination: 12 Sept 2013

CCCR Data Portal http://cccr.tropmet.res.in:8080/
CORDEX South Asia multi-model dataCentre for Climate Change Research (CCCR)Indian Institute of Tropical Meteorology, Pune

SummarySummary•Reliable projections of regional climate change , changes in extremes and their impacts ‐Scientifically challenging
•CORDEX South Asia: A framework for addressing regional climate and monsoonal issuesunder changing climate
•CORDEX South Asia multi‐model high‐resolution simulations at IITM and Partner Institutions ‐ Evaluation run, Historical runs and future scenarios eg. RCP4.5.
•Multi‐model Analysis: Evaluation of model performance, Quantify uncertainties in regional climate projections
•Develop synergistic linkage between climate downscaling and VIA user communities in Asia through direct user engagement
•Archival and dissemination of CORDEX South Asia multi‐model outputs ‐ CCCR, IITM
•Development of regional capacity ‐ CORDEX training workshops in South Asia, East Asia and South East Asia in 2013, 2014 and 2015
•Framework for developing an ESG node at CCCR, IITM for CORDEX South Asia