Embed Size (px)
Citation preview

Global IPO trends: Q3 2017Global IPOs on course for the busiest year since 2007

ContentsGlobal IPO market 3Americas 7Asia-Pacific 11Europe, Middle East, India and Africa 21Appendix 30About this reportEY Global IPO Trends report is released every quarter and looks at the IPO markets, trends and outlook for the Americas, Asia-Pacific, Japan and EMEIA regions.
The report provides insights, facts and figures on the 2017 IPO market year-to-date and analyzes the implications for companies planning to go public in the short and medium term.
You will find this report at the EY Global IPO Center, where you can also subscribe for future editions.
All values are US$ unless otherwise noted.
Global IPO market 3AmericasAmericas 7AsiaAsia-Pacific 11Europe, Middle East, India and Africa 21
Global IPO Trends: Q3 2017 | Page 3Global IPO Trends: Q3 2017 | Page 3
Global IPO marketAll set for a bumper 2017“At the nine-month point of the year, the global IPO market has continued to build strong momentum. Given the strengthening IPO sentiment with relative low volatility and valuations at high levels, we expect a year-end rally in the fourth quarter, traditionally the busiest IPO quarter of the year. Final numbers for 2017 could fall in the range of 1,600 to 1,700 IPOs and US$190b to US$200b in capital raised and this would mark 2017 as the best year for global IPO performance since 2007.”Dr. Martin SteinbachEY Global and EMEIA IPO Leader
Global IPO Trends: Q3 2017 | Page 4All values are US$ unless otherwise noted. | Q3 2017 and Q3 17 refer to the third quarter of 2017 and cover priced IPOs from 1 July to 15 September 2017 plus expected IPOs by the end of September. YTD 2017 refers to the first nine months of 2017 and covers priced IPOs from 1 January to 15 September 2017 plus expected IPOs by the end of September.
Markets Highlights from the markets► 2017 is proving much better than 2016 for IPOs globally, IPO
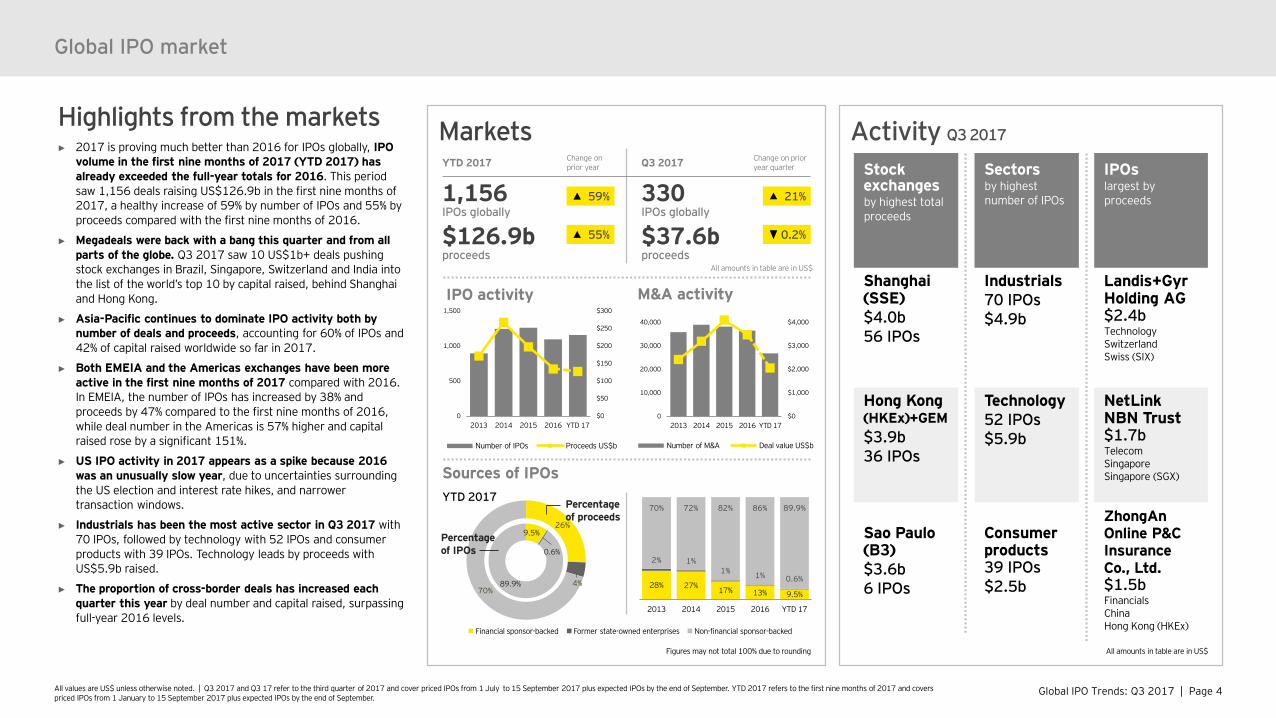
volume in the first nine months of 2017 (YTD 2017) has already exceeded the full-year totals for 2016. This period saw 1,156 deals raising US$126.9b in the first nine months of 2017, a healthy increase of 59% by number of IPOs and 55% by proceeds compared with the first nine months of 2016.
► Megadeals were back with a bang this quarter and from all parts of the globe. Q3 2017 saw 10 US$1b+ deals pushing stock exchanges in Brazil, Singapore, Switzerland and India into the list of the world’s top 10 by capital raised, behind Shanghai and Hong Kong.
► Asia-Pacific continues to dominate IPO activity both by number of deals and proceeds, accounting for 60% of IPOs and 42% of capital raised worldwide so far in 2017.
► Both EMEIA and the Americas exchanges have been more active in the first nine months of 2017 compared with 2016. In EMEIA, the number of IPOs has increased by 38% and proceeds by 47% compared to the first nine months of 2016, while deal number in the Americas is 57% higher and capital raised rose by a significant 151%.
► US IPO activity in 2017 appears as a spike because 2016 was an unusually slow year, due to uncertainties surrounding the US election and interest rate hikes, and narrower transaction windows.
► Industrials has been the most active sector in Q3 2017 with 70 IPOs, followed by technology with 52 IPOs and consumer products with 39 IPOs. Technology leads by proceeds with US$5.9b raised.
► The proportion of cross-border deals has increased each quarter this year by deal number and capital raised, surpassing full-year 2016 levels.
Global IPO market
Activity Q3 2017
Stock exchangesby highest total proceeds
Shanghai (SSE)$4.0b56 IPOs
Hong Kong (HKEx)+GEM$3.9b36 IPOs
Sao Paulo (B3)$3.6b6 IPOs
IPOslargest by proceeds
Landis+Gyr Holding AG$2.4bTechnologySwitzerlandSwiss (SIX)
NetLinkNBN Trust$1.7bTelecomSingaporeSingapore (SGX)
ZhongAnOnline P&C Insurance Co., Ltd.$1.5bFinancials ChinaHong Kong (HKEx)
Sectorsby highest number of IPOs
Industrials70 IPOs$4.9b
Technology52 IPOs$5.9b
Consumer products39 IPOs$2.5b
Sources of IPOsYTD 2017
All amounts in table are in US$
26%
4%70%
Percentage of proceeds
9.5%
0.6%
89.9%
Percentage of IPOs
Financial sponsor-backed Former state-owned enterprises Non-financial sponsor-backed
$0
$1,000
$2,000
$3,000
$4,000
0
10,000
20,000
30,000
40,000
2013 2014 2015 2016 YTD 17
M&A activity
Number of M&A Deal value US$b
28% 27% 17% 13% 9.5%
2% 1%1% 1% 0.6%
70% 72% 82% 86% 89.9%
2013 2014 2015 2016 YTD 17
$0
$50
$100
$150
$200
$250
$300
0
500
1,000
1,500
2013 2014 2015 2016 YTD 17
IPO activity
Number of IPOs Proceeds US$b
Figures may not total 100% due to rounding
YTD 2017 Change on prior year Q3 2017 Change on prior
year quarter
1,156IPOs globally
330IPOs globally
$126.9bproceeds
$37.6bproceeds
All amounts in table are in US$
21%
0.2%
59%
55%
Global IPO Trends: Q3 2017 | Page 5All values are US$ unless otherwise noted. | Q3 2017 and Q3 17 refer to the third quarter of 2017 and cover priced IPOs from 1 July to 15 September 2017 plus expected IPOs by the end of September. YTD 2017 refers to the first nine months of 2017 and covers priced IPOs from 1 January to 15 September 2017 plus expected IPOs by the end of September.
Regional performance and trends
31%
25%
16%
12%
12%
27%
30%
31%
29%
28%
42%
45%
53%
59%
60%
2013
2014
2015
2016
YTD 17
Regional share by number of IPOs
46%
38%
19%
17%
28%
20%
31%
36%
28%
29%
34%
31%
45%
54%
43%
2013
2014
2015
2016
YTD 17
Regional share by proceeds
Global IPO market
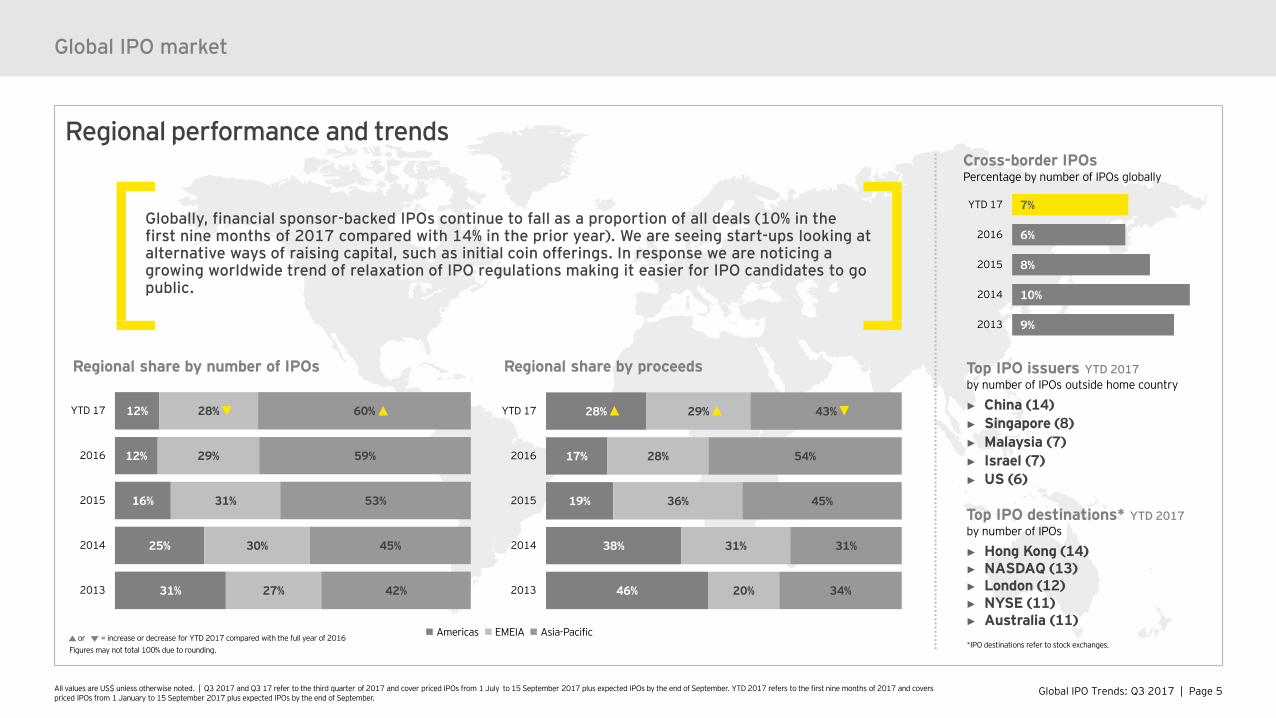
Globally, financial sponsor-backed IPOs continue to fall as a proportion of all deals (10% in the first nine months of 2017 compared with 14% in the prior year). We are seeing start-ups looking at alternative ways of raising capital, such as initial coin offerings. In response we are noticing a growing worldwide trend of relaxation of IPO regulations making it easier for IPO candidates to go public.
Americas EMEIA Asia-Pacific
Top IPO issuers YTD 2017by number of IPOs outside home country
► China (14)► Singapore (8)► Malaysia (7)► Israel (7)► US (6)
Top IPO destinations* YTD 2017by number of IPOs
► Hong Kong (14)► NASDAQ (13)► London (12)► NYSE (11)► Australia (11)
or = increase or decrease for YTD 2017 compared with the full year of 2016Figures may not total 100% due to rounding.
9%
10%
8%
6%
7%
2013
2014
2015
2016
YTD 17
Cross-border IPOs Percentage by number of IPOs globally
*IPO destinations refer to stock exchanges.
Global IPO Trends: Q3 2017 | Page 6All values are US$ unless otherwise noted. | Q3 2017 and Q3 17 refer to the third quarter of 2017 and cover priced IPOs from 1 July to 15 September 2017 plus expected IPOs by the end of September. YTD 2017 refers to the first nine months of 2017 and covers priced IPOs from 1 January to 15 September 2017 plus expected IPOs by the end of September.
Outlook► Global IPO activity for 2017 is on course to be the
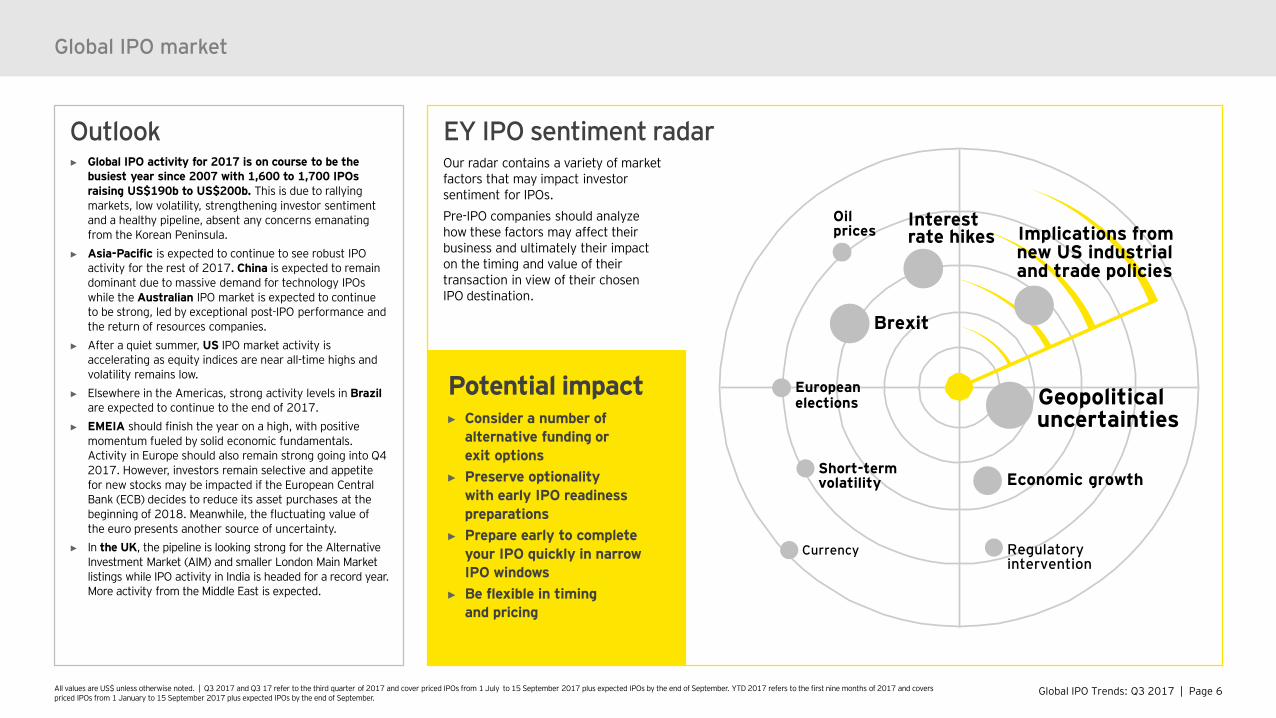
busiest year since 2007 with 1,600 to 1,700 IPOs raising US$190b to US$200b. This is due to rallying markets, low volatility, strengthening investor sentiment and a healthy pipeline, absent any concerns emanating from the Korean Peninsula.
► Asia-Pacific is expected to continue to see robust IPO activity for the rest of 2017. China is expected to remain dominant due to massive demand for technology IPOs while the Australian IPO market is expected to continue to be strong, led by exceptional post-IPO performance and the return of resources companies.
► After a quiet summer, US IPO market activity is accelerating as equity indices are near all-time highs and volatility remains low.
► Elsewhere in the Americas, strong activity levels in Brazil are expected to continue to the end of 2017.
► EMEIA should finish the year on a high, with positive momentum fueled by solid economic fundamentals. Activity in Europe should also remain strong going into Q4 2017. However, investors remain selective and appetite for new stocks may be impacted if the European Central Bank (ECB) decides to reduce its asset purchases at the beginning of 2018. Meanwhile, the fluctuating value of the euro presents another source of uncertainty.
► In the UK, the pipeline is looking strong for the Alternative Investment Market (AIM) and smaller London Main Market listings while IPO activity in India is headed for a record year. More activity from the Middle East is expected.
EY IPO sentiment radarOur radar contains a variety of market factors that may impact investor sentiment for IPOs.Pre-IPO companies should analyze how these factors may affect their business and ultimately their impact on the timing and value of their transaction in view of their chosen IPO destination.
Global IPO market
Brexit
Europeanelections Geopolitical
uncertainties
Oil prices
Short-term volatility
Interest rate hikes
Currency
Implications from new US industrial and trade policies
Economic growth
Regulatory intervention
Potential impact► Consider a number of
alternative funding or exit options
► Preserve optionality with early IPO readiness preparations
► Prepare early to complete your IPO quickly in narrow IPO windows
► Be flexible in timing and pricing
Global IPO Trends: Q3 2017 | Page 7Global IPO Trends: Q3 2017 | Page 7
AmericasPositive momentum continues“Uptick in Americas IPO activity in the first half of 2017 continues this quarter, as South America gains momentum with Brazilian and Mexican exchanges featured on the global top 10 deals. IPO pipeline continues to build with the number of deals and proceeds in the first nine months of 2017 already topping all of 2016.”Jackie KelleyEY Americas IPO Markets Leader
Global IPO Trends: Q3 2017 | Page 8All values are US$ unless otherwise noted. | Q3 2017 and Q3 17 refer to the third quarter of 2017 and cover priced IPOs from 1 July to 15 September 2017 plus expected IPOs by the end of September. YTD 2017 refers to the first nine months of 2017 and covers priced IPOs from 1 January to 15 September 2017 plus expected IPOs by the end of September.
Brazil‘s B3 YTD 2017
US‘s NASDAQ and NYSE YTD 2017
Canada‘s Toronto Stock Exchange and TSX Venture Exchange YTD 2017
Mexico‘s Mexican Stock Exchange YTD 2017
Activity Q3 2017
Markets YTD 2017
AmericasAmericas
Change on prior year
146 IPOs
$35.9b proceeds
$115.9m median deal size
57%
151%
50%
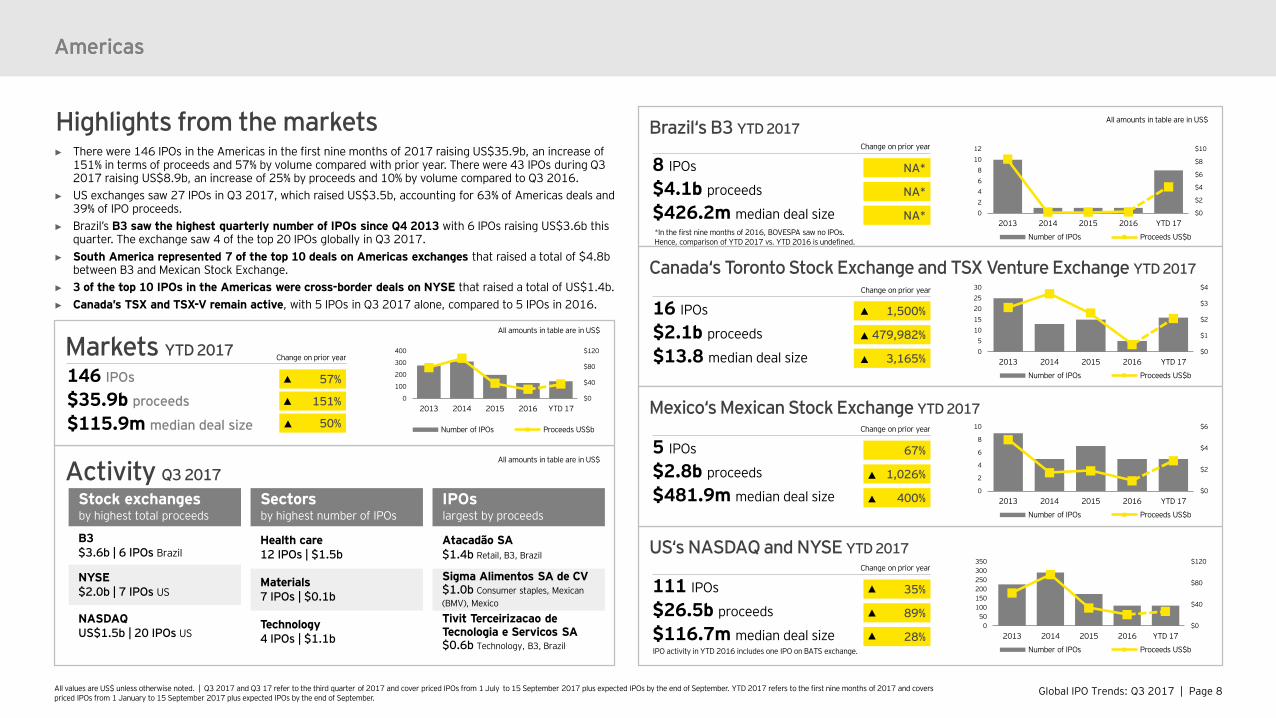
Highlights from the markets► There were 146 IPOs in the Americas in the first nine months of 2017 raising US$35.9b, an increase of
151% in terms of proceeds and 57% by volume compared with prior year. There were 43 IPOs during Q3 2017 raising US$8.9b, an increase of 25% by proceeds and 10% by volume compared to Q3 2016.
► US exchanges saw 27 IPOs in Q3 2017, which raised US$3.5b, accounting for 63% of Americas deals and 39% of IPO proceeds.
► Brazil’s B3 saw the highest quarterly number of IPOs since Q4 2013 with 6 IPOs raising US$3.6b this quarter. The exchange saw 4 of the top 20 IPOs globally in Q3 2017.
► South America represented 7 of the top 10 deals on Americas exchanges that raised a total of $4.8b between B3 and Mexican Stock Exchange.
► 3 of the top 10 IPOs in the Americas were cross-border deals on NYSE that raised a total of US$1.4b. ► Canada’s TSX and TSX-V remain active, with 5 IPOs in Q3 2017 alone, compared to 5 IPOs in 2016.
Change on prior year
16 IPOs
$2.1b proceeds
$13.8 median deal size
Change on prior year
5 IPOs
$2.8b proceeds
$481.9m median deal size
Change on prior year
8 IPOs
$4.1b proceeds
$426.2m median deal size
Change on prior year
111 IPOs
$26.5b proceeds
$116.7m median deal size
35%
89%
28%
All amounts in table are in US$
Stock exchanges by highest total proceeds
B3$3.6b | 6 IPOs Brazil
NYSE$2.0b | 7 IPOs US
NASDAQUS$1.5b | 20 IPOs US
Sectors by highest number of IPOs
Health care12 IPOs | $1.5b
Materials7 IPOs | $0.1b
Technology4 IPOs | $1.1b
IPOslargest by proceeds
Atacadão SA$1.4b Retail, B3, Brazil
Sigma Alimentos SA de CV$1.0b Consumer staples, Mexican (BMV), Mexico
Tivit Terceirizacao de Tecnologia e Servicos SA$0.6b Technology, B3, Brazil
All amounts in table are in US$
NA*
NA*
NA*
1,500%
479,982%
3,165%
67%
1,026%
400%
All amounts in table are in US$
*In the first nine months of 2016, BOVESPA saw no IPOs. Hence, comparison of YTD 2017 vs. YTD 2016 is undefined.
$0
$40
$80
$120
0
100
200
300
400
2013 2014 2015 2016 YTD 17
Number of IPOs Proceeds US$b
$0
$40
$80
$120
050
100150200250300350
2013 2014 2015 2016 YTD 17
Number of IPOs Proceeds US$b
$0
$2
$4
$6
$8
$10
02468
1012
2013 2014 2015 2016 YTD 17
Number of IPOs Proceeds US$b
$0
$1
$2
$3
$4
05
1015202530
2013 2014 2015 2016 YTD 17
Number of IPOs Proceeds US$b
$0
$2
$4
$6
0
2
4
6
8
10
2013 2014 2015 2016 YTD 17
Number of IPOs Proceeds US$b
IPO activity in YTD 2016 includes one IPO on BATS exchange.
Global IPO Trends: Q3 2017 | Page 9Global IPO Trends: Q3 2017 | Page 9
Americas — US IPO market insightHealthy pipeline builds over a quiet summer“US market activity has accelerated in September setting the stage for continued strength through year-end. With equity indices near all-time highs and constrained volatility, the pipeline continues to build across sectors, led by health care and technology. We see companies ramping up their public company readiness activities in anticipation of filings in Q4 2017 or early 2018.”Jackie KelleyEY Americas IPO Markets Leader
Global IPO Trends: Q3 2017 | Page 10All values are US$ unless otherwise noted. | Q3 2017 and Q3 17 refer to the third quarter of 2017 and cover priced IPOs from 1 July to 15 September 2017 plus expected IPOs by the end of September. YTD 2017 refers to the first nine months of 2017 and covers priced IPOs from 1 January to 15 September 2017 plus expected IPOs by the end of September.
TrendsYTD 2017
Change on prior year
Median deal size $116.7mMedian post-IPO market cap $450.9m
Americas — US IPO market insight
Activity Q3 2017
Performance YTD 2017
IPO pricing and performance
US markets
First-day average return
Share price development since IPO
+14.2% +10.5%
Equity indices
DJIA+12.4%US
S&P 500+11.5%US
Volatility indexCBOE VIX®
-25.6% | 10.44 index levelYTD
Sectorsby highest number of IPOs
Health care10 IPOs | $0.9b
Energy3 IPOs | $0.8b
Technology3 IPOs | $0.5b
Real estate3 IPOs | $0.5b
Industrials2 IPOs | $0.5b
IPOslargest by proceeds
Venator Materials plc$522m Energy, NYSE, UK
BEST Inc.$450m Industrials, NYSE, China
Despegar.com, Corp.$382m Technology, NYSE, Argentina
TPG RE Finance Trust Inc.$220m Real estate, NYSE, US
Oasis Midstream Partners LP $181m Energy, NYSE, US
All amounts in table are in US$
All amounts in table are in US$
New public IPO registration filings
Q3 2017
35 IPOsQ3 2016
39 IPOs
28%
28%
Cross-border IPOs: top IPO issuers YTD 2017
All amounts in table are in US$
24IPOs
China 9 IPOs ($1.1b)
Europe 6 IPOs ($1.3b)
Canada 3 IPOs ($492m)
Brazil 2 IPOs ($792m)
Israel 2 IPOs ($81m)
Argentina 1 IPO ($382m)
Australia 1 IPO ($6m)
Markets YTD 2017
All amounts in table are in US$
Q3 2017
NASDAQ$1.5b20 IPOs
NYSE$2.0b7 IPOs
Change on prior year
111 IPOs
$26.5b proceeds
40% of IPOs are financial sponsor-backed
35%
89%
32%
+ or – indicates change since 31 December 2016
– indicates a decrease in volatility as of 14 September 2017 compared to 30 December 2016 for year-to-date (YTD).
+ or – indicates change compared to offer price at IPO
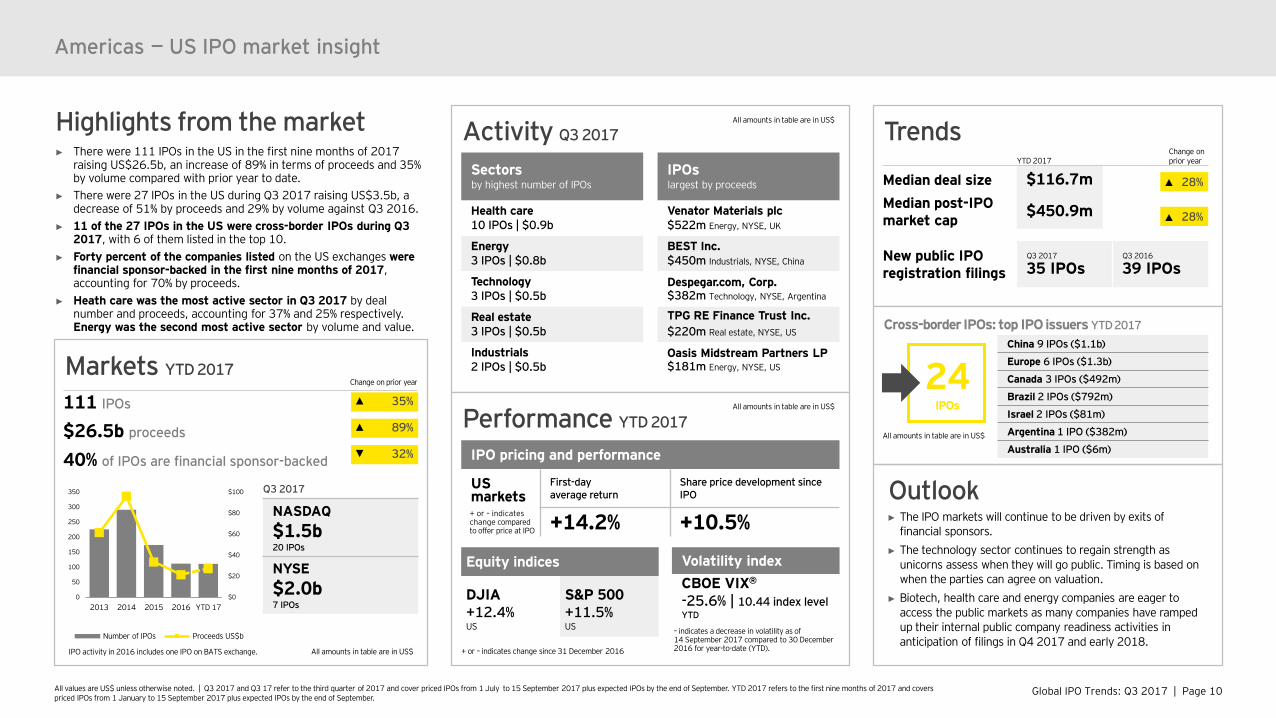
Highlights from the market► There were 111 IPOs in the US in the first nine months of 2017
raising US$26.5b, an increase of 89% in terms of proceeds and 35% by volume compared with prior year to date.
► There were 27 IPOs in the US during Q3 2017 raising US$3.5b, a decrease of 51% by proceeds and 29% by volume against Q3 2016.
► 11 of the 27 IPOs in the US were cross-border IPOs during Q3 2017, with 6 of them listed in the top 10.
► Forty percent of the companies listed on the US exchanges were financial sponsor-backed in the first nine months of 2017, accounting for 70% by proceeds.
► Heath care was the most active sector in Q3 2017 by deal number and proceeds, accounting for 37% and 25% respectively. Energy was the second most active sector by volume and value.
$0
$20
$40
$60
$80
$100
0
50
100
150
200
250
300
350
2013 2014 2015 2016 YTD 17
Number of IPOs Proceeds US$b
Outlook► The IPO markets will continue to be driven by exits of
financial sponsors. ► The technology sector continues to regain strength as
unicorns assess when they will go public. Timing is based on when the parties can agree on valuation.
► Biotech, health care and energy companies are eager to access the public markets as many companies have ramped up their internal public company readiness activities in anticipation of filings in Q4 2017 and early 2018.
IPO activity in 2016 includes one IPO on BATS exchange.
Global IPO Trends: Q3 2017 | Page 11Global IPO Trends: Q3 2017 | Page 11
Asia-PacificAsia-Pacific tightens grip on global IPO market, ahead of peak season“Asia-Pacific continued its dominance on the global IPO market in the third quarter and the outlook for the fourth quarter, historically the year’s busiest for new listings, is even more upbeat. Hong Kong remains the preferred hub for cross-border listings in Asia-Pacific while other exchanges in the region are underpinned by their strong domestic listings. In the longer term, solid economic fundamentals, plus government action to support markets and economies in countries like China, Singapore, Australia and Japan, should keep listings strong. However, tensions in the Korean Peninsula could create bumps in the IPO road ahead.”Ringo ChoiEY Asia-Pacific IPO Leader
Global IPO Trends: Q3 2017 | Page 12All values are US$ unless otherwise noted. | Q3 2017 and Q3 17 refer to the third quarter of 2017 and cover priced IPOs from 1 July to 15 September 2017 plus expected IPOs by the end of September. YTD 2017 refers to the first nine months of 2017 and covers priced IPOs from 1 January to 15 September 2017 plus expected IPOs by the end of September.
Markets Activity Q3 2017
Asia-Pacific
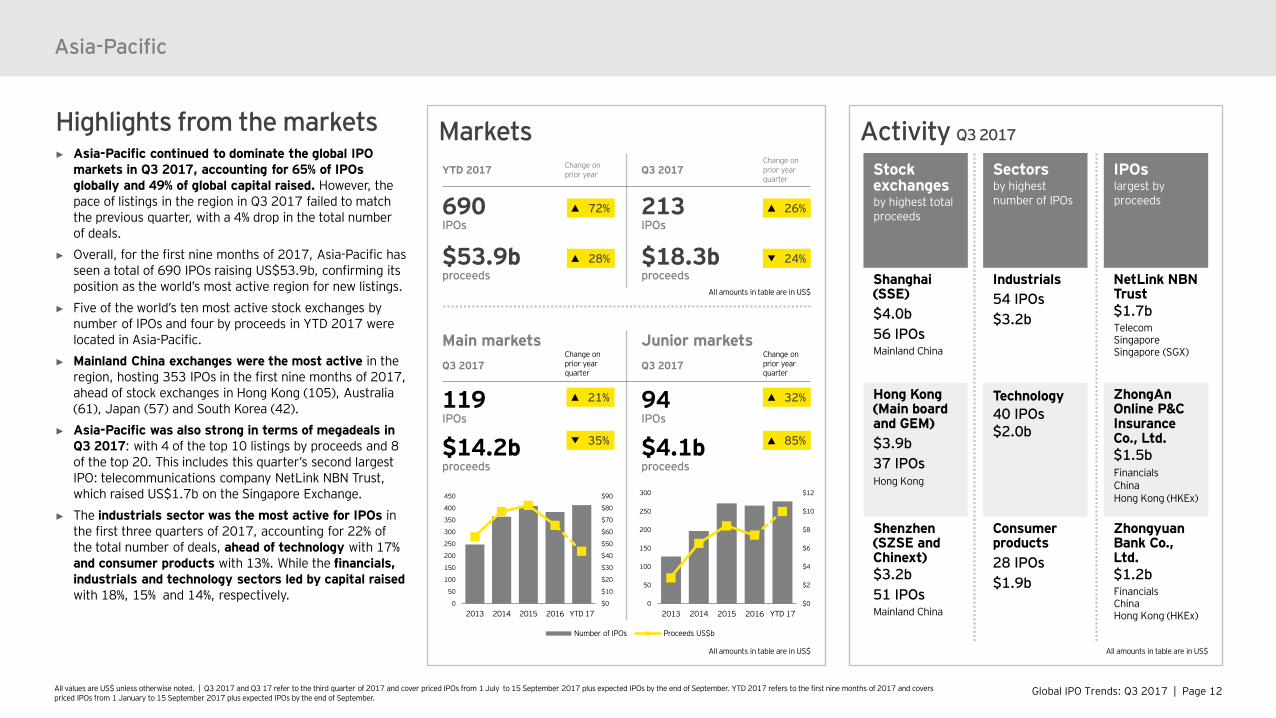
Highlights from the markets► Asia-Pacific continued to dominate the global IPO
markets in Q3 2017, accounting for 65% of IPOs globally and 49% of global capital raised. However, the pace of listings in the region in Q3 2017 failed to match the previous quarter, with a 4% drop in the total number of deals.
► Overall, for the first nine months of 2017, Asia-Pacific has seen a total of 690 IPOs raising US$53.9b, confirming its position as the world’s most active region for new listings.
► Five of the world’s ten most active stock exchanges by number of IPOs and four by proceeds in YTD 2017 were located in Asia-Pacific.
► Mainland China exchanges were the most active in the region, hosting 353 IPOs in the first nine months of 2017, ahead of stock exchanges in Hong Kong (105), Australia (61), Japan (57) and South Korea (42).
► Asia-Pacific was also strong in terms of megadeals in Q3 2017: with 4 of the top 10 listings by proceeds and 8 of the top 20. This includes this quarter’s second largest IPO: telecommunications company NetLink NBN Trust, which raised US$1.7b on the Singapore Exchange.
► The industrials sector was the most active for IPOs in the first three quarters of 2017, accounting for 22% of the total number of deals, ahead of technology with 17% and consumer products with 13%. While the financials, industrials and technology sectors led by capital raised with 18%, 15% and 14%, respectively.
Stock exchangesby highest total proceeds
Shanghai (SSE)$4.0b56 IPOsMainland China
Hong Kong (Main board and GEM)$3.9b37 IPOsHong Kong
Shenzhen (SZSE and Chinext)$3.2b51 IPOsMainland China
Sectorsby highest number of IPOs
Industrials54 IPOs$3.2b
Technology40 IPOs $2.0b
Consumer products28 IPOs$1.9b
IPOslargest by proceeds
NetLink NBN Trust$1.7bTelecomSingaporeSingapore (SGX)
ZhongAnOnline P&C Insurance Co., Ltd.$1.5bFinancialsChinaHong Kong (HKEx)
ZhongyuanBank Co., Ltd.$1.2bFinancialsChinaHong Kong (HKEx)
Main markets Junior marketsQ3 2017
Change onprior year quarter
Q3 2017Change on prior year quarter
119IPOs
94IPOs
$14.2bproceeds
$4.1bproceeds
21% 32%
85%
All amounts in table are in US$ All amounts in table are in US$
$0
$2
$4
$6
$8
$10
$12
0
50
100
150
200
250
300
2013 2014 2015 2016 YTD 17
Number of IPOs Proceeds US$b
$0
$10
$20
$30
$40
$50
$60
$70
$80
$90
0
50
100
150
200
250
300
350
400
450
2013 2014 2015 2016 YTD 17
YTD 2017 Change on prior year Q3 2017
Change on prior year quarter
690IPOs
213IPOs
$53.9bproceeds
$18.3bproceeds
24%28%
26%72%
All amounts in table are in US$
35%
Global IPO Trends: Q3 2017 | Page 13All values are US$ unless otherwise noted. | Q3 2017 and Q3 17 refer to the third quarter of 2017 and cover priced IPOs from 1 July to 15 September 2017 plus expected IPOs by the end of September. YTD 2017 refers to the first nine months of 2017 and covers priced IPOs from 1 January to 15 September 2017 plus expected IPOs by the end of September.
Trends
Sources of IPOs
YTD 2017 7.3%0.4%
92.3%
Percentage of proceeds
4.1%0.3%
95.6%
Percentageof IPOs
Asia-Pacific
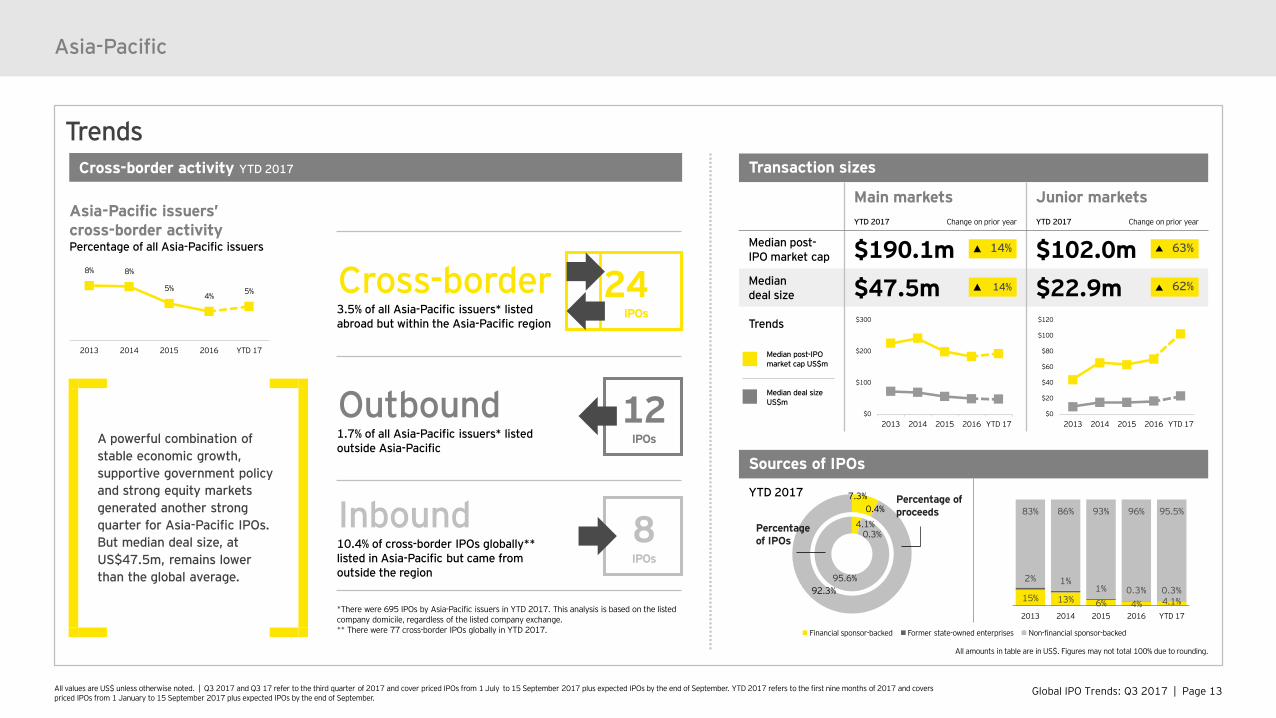
Cross-border 3.5% of all Asia-Pacific issuers* listed abroad but within the Asia-Pacific region
Outbound1.7% of all Asia-Pacific issuers* listed outside Asia-Pacific
Inbound10.4% of cross-border IPOs globally** listed in Asia-Pacific but came from outside the region
*There were 695 IPOs by Asia-Pacific issuers in YTD 2017. This analysis is based on the listed company domicile, regardless of the listed company exchange.** There were 77 cross-border IPOs globally in YTD 2017.
Cross-border activity YTD 2017
Asia-Pacific issuers’ cross-border activityPercentage of all Asia-Pacific issuers
A powerful combination of stable economic growth, supportive government policy and strong equity markets generated another strong quarter for Asia-Pacific IPOs. But median deal size, at US$47.5m, remains lower than the global average.
8IPOs
12IPOs
Transaction sizes
Main markets Junior marketsYTD 2017 Change on prior year YTD 2017 Change on prior year
Median post-IPO market cap $190.1m $102.0mMedian deal size $47.5m $22.9mTrends
63%14%
62%14%
All amounts in table are in US$. Figures may not total 100% due to rounding.
Financial sponsor-backed Former state-owned enterprises Non-financial sponsor-backed
24IPOs
15% 13% 6% 4% 4.1%
2% 1%1% 0.3% 0.3%
83% 86% 93% 96% 95.5%
2013 2014 2015 2016 YTD 17
8% 8%
5%4% 5%
2013 2014 2015 2016 YTD 17
$0
$100
$200
$300
2013 2014 2015 2016 YTD 17$0
$20
$40
$60
$80
$100
$120
2013 2014 2015 2016 YTD 17
Median post-IPO market cap US$m
Median deal size US$m
Global IPO Trends: Q3 2017 | Page 14All values are US$ unless otherwise noted. | Q3 2017 and Q3 17 refer to the third quarter of 2017 and cover priced IPOs from 1 July to 15 September 2017 plus expected IPOs by the end of September. YTD 2017 refers to the first nine months of 2017 and covers priced IPOs from 1 January to 15 September 2017 plus expected IPOs by the end of September.
Asia-Pacific
PerformanceEquity indices YTD 2017
Hang Seng+26.3%Hong Kong
Nikkei 225+3.6%Japan
ASX 200+1.3%Australia
Shanghai Composite+8.6%Mainland China
FTSE Straits Times+11.8%Singapore
KOSPI+17.3%South Korea
IPO pricing and performance YTD 2017
First-day average return
Share price development since IPO
Main markets +25.2% +86.5%
Junior markets +41.0% +176.1%
Volatility index
Hang Seng Volatility14.69 index level
-13.0%YTD
+4.9%Q2 2017
+ or – indicates change since 31 December 2016+ or – indicates change compared to offer price at IPO
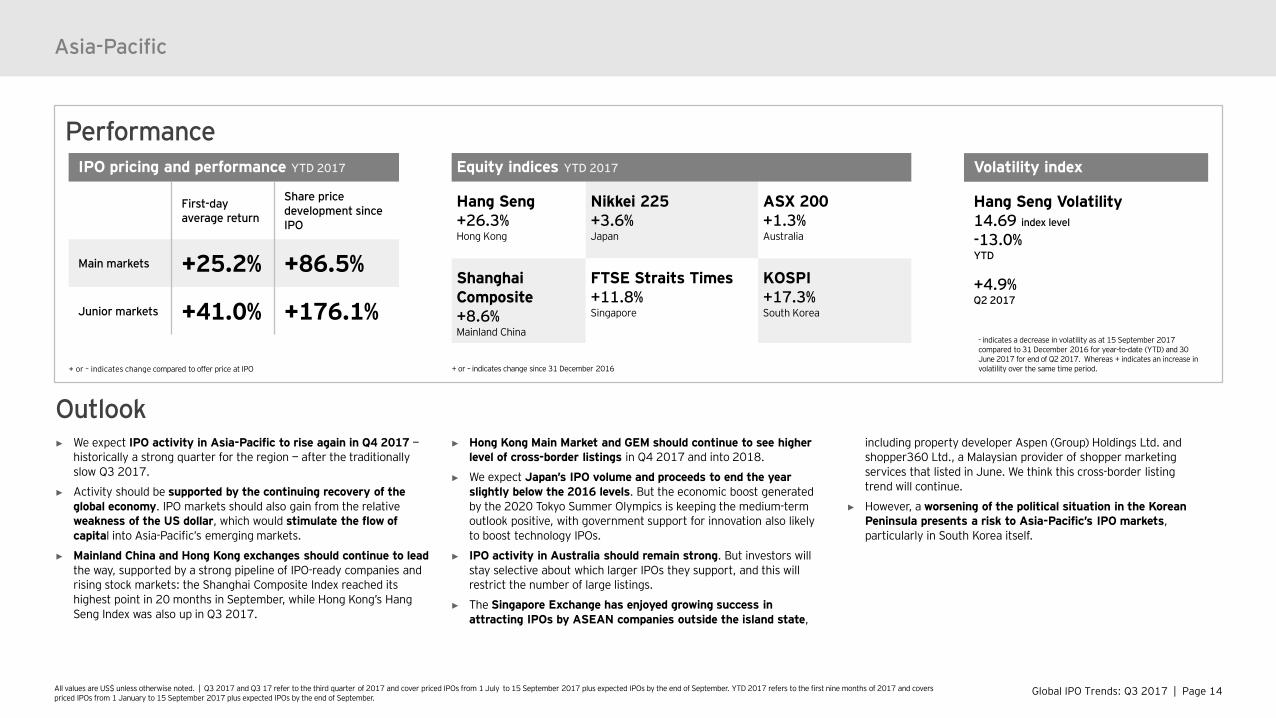
► We expect IPO activity in Asia-Pacific to rise again in Q4 2017 —historically a strong quarter for the region — after the traditionally slow Q3 2017.
► Activity should be supported by the continuing recovery of the global economy. IPO markets should also gain from the relative weakness of the US dollar, which would stimulate the flow of capital into Asia-Pacific’s emerging markets.
► Mainland China and Hong Kong exchanges should continue to lead the way, supported by a strong pipeline of IPO-ready companies and rising stock markets: the Shanghai Composite Index reached its highest point in 20 months in September, while Hong Kong’s Hang Seng Index was also up in Q3 2017.
► Hong Kong Main Market and GEM should continue to see higher level of cross-border listings in Q4 2017 and into 2018.
► We expect Japan’s IPO volume and proceeds to end the year slightly below the 2016 levels. But the economic boost generated by the 2020 Tokyo Summer Olympics is keeping the medium-term outlook positive, with government support for innovation also likely to boost technology IPOs.
► IPO activity in Australia should remain strong. But investors will stay selective about which larger IPOs they support, and this will restrict the number of large listings.
► The Singapore Exchange has enjoyed growing success in attracting IPOs by ASEAN companies outside the island state,
including property developer Aspen (Group) Holdings Ltd. and shopper360 Ltd., a Malaysian provider of shopper marketing services that listed in June. We think this cross-border listing trend will continue.
► However, a worsening of the political situation in the Korean Peninsula presents a risk to Asia-Pacific’s IPO markets, particularly in South Korea itself.
Outlook
- indicates a decrease in volatility as at 15 September 2017 compared to 31 December 2016 for year-to-date (YTD) and 30 June 2017 for end of Q2 2017. Whereas + indicates an increase in volatility over the same time period.
Global IPO Trends: Q3 2017 | Page 15Global IPO Trends: Q3 2017 | Page 15
Asia-Pacific — Greater China market insight Greater China exchanges see solid IPO activity, buoyed by reform“Greater China delivered another strong quarter for listings in Q3 2017, sustained by stock market strength and positive post-IPO performance. This is set to continue with the quality of Greater China markets supported for the long-term by important initiatives. These included a milestone in Hong Kong, where HKEx closed its consultation on a third trading platform, the New Board — one of a number of reforms that could cement its role as one of the world’s leading financial hubs. In Mainland China, the IPO market will continue to find support from the government, which is determined to reduce the backlog of companies waiting to list.” Terence HoEY Greater China IPO Leader
Global IPO Trends: Q3 2017 | Page 16All values are US$ unless otherwise noted. | Q3 2017 and Q3 17 refer to the third quarter of 2017 and cover priced IPOs from 1 July to 15 September 2017 plus expected IPOs by the end of September. YTD 2017 refers to the first nine months of 2017 and covers priced IPOs from 1 January to 15 September 2017 plus expected IPOs by the end of September.
Markets
Asia-Pacific — Greater China market insight
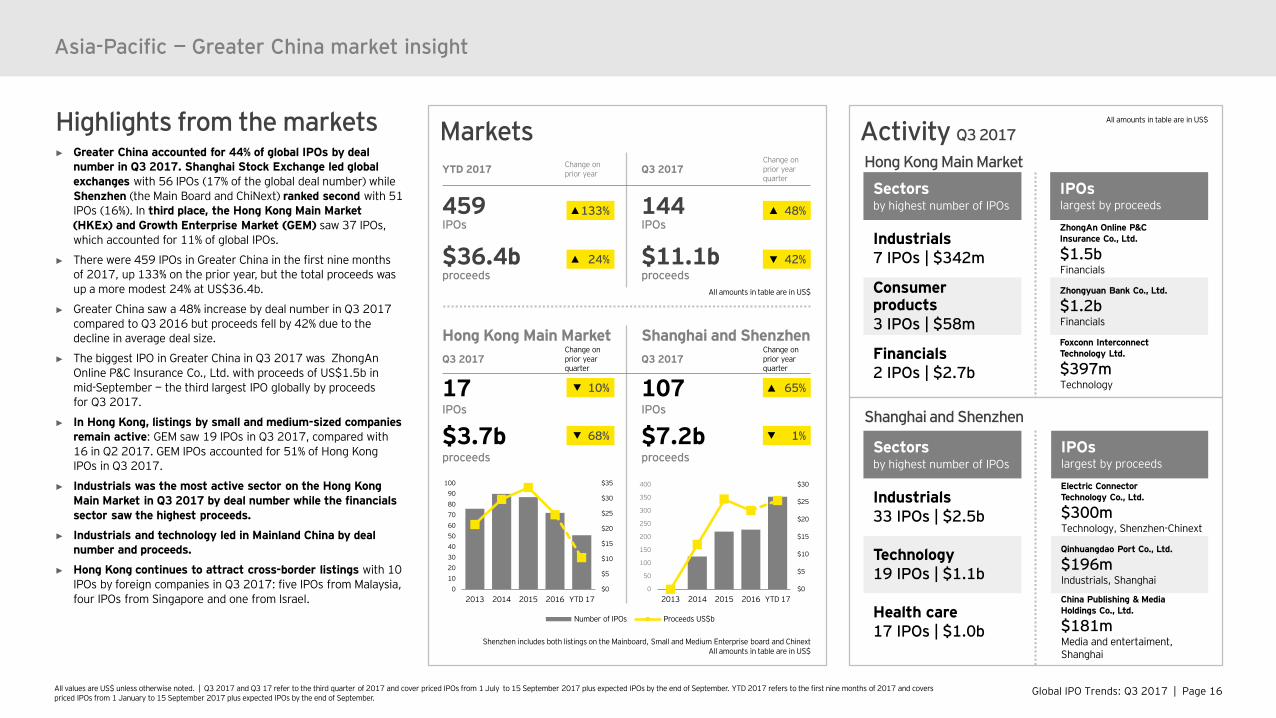
Highlights from the markets► Greater China accounted for 44% of global IPOs by deal
number in Q3 2017. Shanghai Stock Exchange led global exchanges with 56 IPOs (17% of the global deal number) while Shenzhen (the Main Board and ChiNext) ranked second with 51 IPOs (16%). In third place, the Hong Kong Main Market (HKEx) and Growth Enterprise Market (GEM) saw 37 IPOs, which accounted for 11% of global IPOs.
► There were 459 IPOs in Greater China in the first nine months of 2017, up 133% on the prior year, but the total proceeds was up a more modest 24% at US$36.4b.
► Greater China saw a 48% increase by deal number in Q3 2017 compared to Q3 2016 but proceeds fell by 42% due to the decline in average deal size.
► The biggest IPO in Greater China in Q3 2017 was ZhongAnOnline P&C Insurance Co., Ltd. with proceeds of US$1.5b in mid-September — the third largest IPO globally by proceeds for Q3 2017.
► In Hong Kong, listings by small and medium-sized companies remain active: GEM saw 19 IPOs in Q3 2017, compared with 16 in Q2 2017. GEM IPOs accounted for 51% of Hong Kong IPOs in Q3 2017.
► Industrials was the most active sector on the Hong Kong Main Market in Q3 2017 by deal number while the financials sector saw the highest proceeds.
► Industrials and technology led in Mainland China by deal number and proceeds.
► Hong Kong continues to attract cross-border listings with 10 IPOs by foreign companies in Q3 2017: five IPOs from Malaysia, four IPOs from Singapore and one from Israel.
Activity Q3 2017
Hong Kong Main Market
Sectors by highest number of IPOs
Industrials7 IPOs | $342m
Consumer products3 IPOs | $58m
Financials2 IPOs | $2.7b
IPOslargest by proceeds
ZhongAn Online P&C Insurance Co., Ltd.
$1.5bFinancials
Zhongyuan Bank Co., Ltd.
$1.2bFinancials
Foxconn Interconnect Technology Ltd.
$397mTechnology
Shanghai and Shenzhen
Sectors by highest number of IPOs
Industrials33 IPOs | $2.5b
Technology19 IPOs | $1.1b
Health care17 IPOs | $1.0b
IPOslargest by proceeds
Electric Connector Technology Co., Ltd.
$300mTechnology, Shenzhen-Chinext
Qinhuangdao Port Co., Ltd.
$196mIndustrials, Shanghai
China Publishing & Media Holdings Co., Ltd.
$181mMedia and entertaiment, Shanghai
All amounts in table are in US$
Hong Kong Main Market Shanghai and ShenzhenQ3 2017
Change on prior year quarter
Q3 2017Change on prior year quarter
17IPOs
107IPOs
$3.7bproceeds
$7.2bproceeds
65%
Shenzhen includes both listings on the Mainboard, Small and Medium Enterprise board and ChinextAll amounts in table are in US$
All amounts in table are in US$
$0
$5
$10
$15
$20
$25
$30
0
50
100
150
200
250
300
350
400
2013 2014 2015 2016 YTD 17
Number of IPOs Proceeds US$b
$0
$5
$10
$15
$20
$25
$30
$35
0102030405060708090
100
2013 2014 2015 2016 YTD 17
YTD 2017 Change on prior year Q3 2017
Change on prior yearquarter
459IPOs
144IPOs
$36.4bproceeds
$11.1bproceeds
133%
24%
48%
42%
68%
10%
1%

Global IPO Trends: Q3 2017 | Page 17All values are US$ unless otherwise noted. | Q3 2017 and Q3 17 refer to the third quarter of 2017 and cover priced IPOs from 1 July to 15 September 2017 plus expected IPOs by the end of September. YTD 2017 refers to the first nine months of 2017 and covers priced IPOs from 1 January to 15 September 2017 plus expected IPOs by the end of September.
Trends
Sources of IPOs
YTD 2017 2.0% 0.4%
97.6%
Percentage of proceeds
Asia-Pacific — Greater China market insight
Cross-border activity YTD 2017
Greater China issuers’ cross-border activityPercentage of all China issuers
YTD 2017
Leaving Greater China
Outbound3.3% of Greater China issuers* listed abroad
Coming to Greater China
Inbound 21% of cross-border IPOs globally** were listed on HKEx and Taiwan
*There were 459 IPOs by Greater China issuers in YTD 2017. This analysis is based on the listed company domicile, regardless of the listed company exchange.** There were 77 cross-border IPOs globally in YTD 2017.
16IPOs
15IPOs
To which destination? YTD 2017
1 IPO to UK exchange
5 IPOs to Asia-Pacific exchanges
9 IPOs to US exchanges
Transaction sizes
Hong Kong Main Market Shanghai and ShenzhenYTD 2017 Change on prior year YTD 2017 Change on prior year
Median post-IPO market cap $113.3m $213.5mMedian deal size $33.8m $50.8mTrends
6%32%
0.7%0.2%
99.1%
Percentage of IPOs
All amounts in table are in US$. Figures may not total 100% due to rounding.
IPOs performed well in Greater China in Q3 2017. On the mainland, all IPOs in Q3 2017 rose by the maximum allowed 44% on their first day of trading. In Hong Kong, the proportion of oversubscribed IPOs on the Main Board reached 85%, compared to just 65% in Q3 2016.
Financial sponsor-backed Former state-owned enterprises Non-financial sponsor-backed
7% 9% 5% 1% 0.7%
4% 1% 1% 0.2%
89% 90% 94% 99% 99.1%
2013 2014 2015 2016 YTD 17
15%
10%
4% 6%3%
2013 2014 2015 2016 YTD 17
$0
$100
$200
$300
$400
$500
2013 2014 2015 2016 YTD 17$0
$50
$100
$150
$200
$250
$300
$350
2013 2014 2015 2016 YTD 17
Median post-IPO market cap US$m
Median deal size US$m
13% 1%
Global IPO Trends: Q3 2017 | Page 18All values are US$ unless otherwise noted. | Q3 2017 and Q3 17 refer to the third quarter of 2017 and cover priced IPOs from 1 July to 15 September 2017 plus expected IPOs by the end of September. YTD 2017 refers to the first nine months of 2017 and covers priced IPOs from 1 January to 15 September 2017 plus expected IPOs by the end of September.
Outlook
Asia-Pacific — Greater China market insight
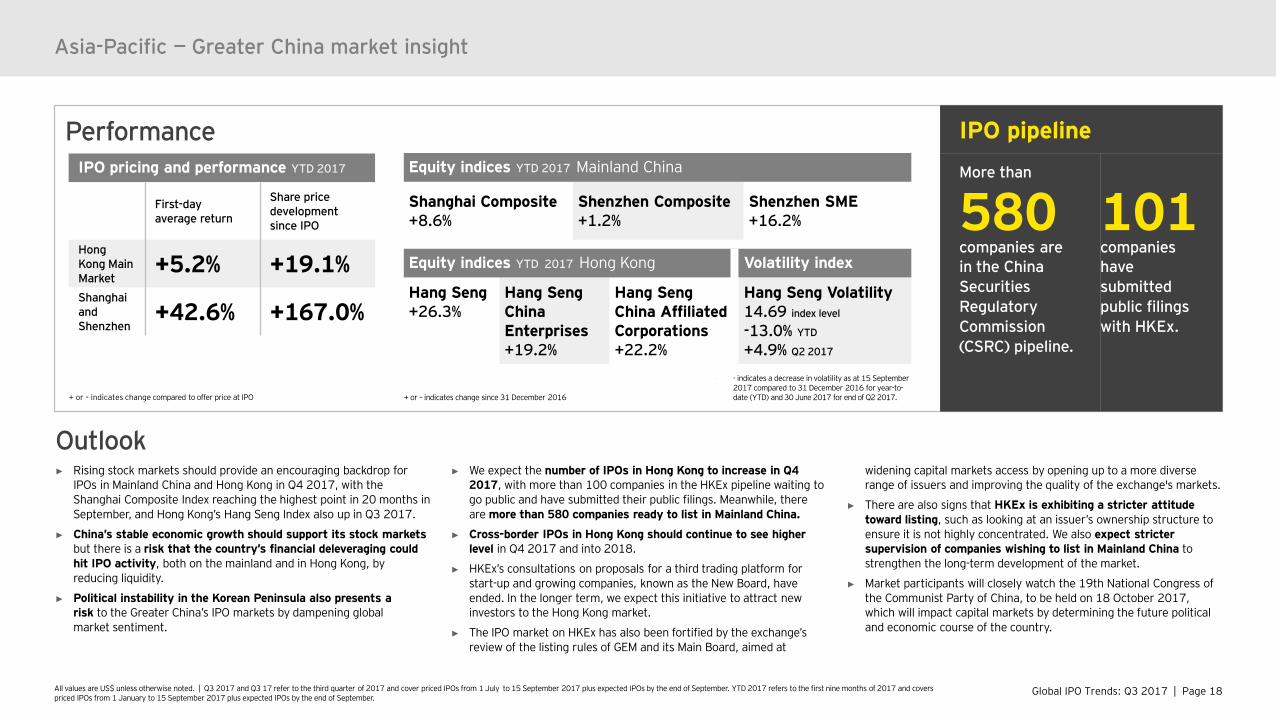
PerformanceEquity indices YTD 2017 Mainland China
Shanghai Composite+8.6%
Shenzhen Composite+1.2%
Shenzhen SME+16.2%
IPO pricing and performance YTD 2017
First-day average return
Share price development since IPO
Hong Kong Main Market
+5.2% +19.1%Shanghai and Shenzhen
+42.6% +167.0%
Equity indices YTD 2017 Hong Kong Volatility index
Hang Seng +26.3%
Hang Seng China Enterprises+19.2%
Hang Seng China Affiliated Corporations+22.2%
Hang Seng Volatility14.69 index level
-13.0% YTD
+4.9% Q2 2017
IPO pipelineMore than
580companies arein the China Securities Regulatory Commission (CSRC) pipeline.
More than
101companieshave submitted public filings with HKEx.
+ or – indicates change compared to offer price at IPO + or – indicates change since 31 December 2016
► Rising stock markets should provide an encouraging backdrop for IPOs in Mainland China and Hong Kong in Q4 2017, with the Shanghai Composite Index reaching the highest point in 20 months in September, and Hong Kong’s Hang Seng Index also up in Q3 2017.
► China’s stable economic growth should support its stock markets but there is a risk that the country’s financial deleveraging could hit IPO activity, both on the mainland and in Hong Kong, by reducing liquidity.
► Political instability in the Korean Peninsula also presents a risk to the Greater China’s IPO markets by dampening global market sentiment.
► We expect the number of IPOs in Hong Kong to increase in Q4 2017, with more than 100 companies in the HKEx pipeline waiting to go public and have submitted their public filings. Meanwhile, there are more than 580 companies ready to list in Mainland China.
► Cross-border IPOs in Hong Kong should continue to see higher level in Q4 2017 and into 2018.
► HKEx’s consultations on proposals for a third trading platform for start-up and growing companies, known as the New Board, have ended. In the longer term, we expect this initiative to attract new investors to the Hong Kong market.
► The IPO market on HKEx has also been fortified by the exchange’s review of the listing rules of GEM and its Main Board, aimed at
widening capital markets access by opening up to a more diverse range of issuers and improving the quality of the exchange's markets.
► There are also signs that HKEx is exhibiting a stricter attitude toward listing, such as looking at an issuer’s ownership structure to ensure it is not highly concentrated. We also expect stricter supervision of companies wishing to list in Mainland China to strengthen the long-term development of the market.
► Market participants will closely watch the 19th National Congress of the Communist Party of China, to be held on 18 October 2017, which will impact capital markets by determining the future political and economic course of the country.
- - indicates a decrease in volatility as at 15 September 2017 compared to 31 December 2016 for year-to-date (YTD) and 30 June 2017 for end of Q2 2017.
Global IPO Trends: Q3 2017 | Page 19Global IPO Trends: Q3 2017 | Page 19
Asia-Pacific — Japan market insight Strategic initiatives set to support healthy pipeline“Despite the current geopolitical volatility, Japanese investor sentiment remains positive, with IPO appetite buoyed to some extent by the lead up to the 2020 Tokyo Olympics. Deal volume and proceeds for the full year are expected to be slightly higher than 2016 levels. The medium-term outlook for IPOs is positive, especially in the technology sector where the Japanese Government has prioritized support for investment in innovation to help drive economic growth.” Shinichiro SuzukiEY Japan IPO Leader
Global IPO Trends: Q3 2017 | Page 20All values are US$ unless otherwise noted. | Q3 2017 and Q3 17 refer to the third quarter of 2017 and cover priced IPOs from 1 July to 15 September 2017 plus expected IPOs by the end of September. YTD 2017 refers to the first nine months of 2017 and covers priced IPOs from 1 January to 15 September 2017 plus expected IPOs by the end of September.
Markets
Tokyo Main Market JASDAQ and MOTHERSQ3 2017
Change on prior year quarter
Q3 2017Change on prior yearquarter
2IPOs
15IPOs
$636.7mproceeds
$205.4mproceeds
$318.4mmedian deal size
$10.9mmedian deal size
Activity Q3 2017
Asia-Pacific — Japan market insight
Sectorsby highest number of IPOs
Technology8 IPOs$124m
Consumer products4 IPOs$54m
Real estate2 IPO$485m
IPOslargest by proceeds
Mitsubishi Estate Logistics REIT Investment Corp.$472mReal estateMain Market
Nishimoto Co., Ltd.$165mRetail Main Market
PKSHA Technology Inc.$39mTechnologyTokyo MOTHERS
Equity index
Nikkei 225+3.6%Japan
Tokyo Main MarketIPO pricing and performance
First-day average return
-0.7%Share price development since IPO
+8.9%
All amounts in table are in US$. + or – indicates change since 31 December 2016All amounts in table are in US$
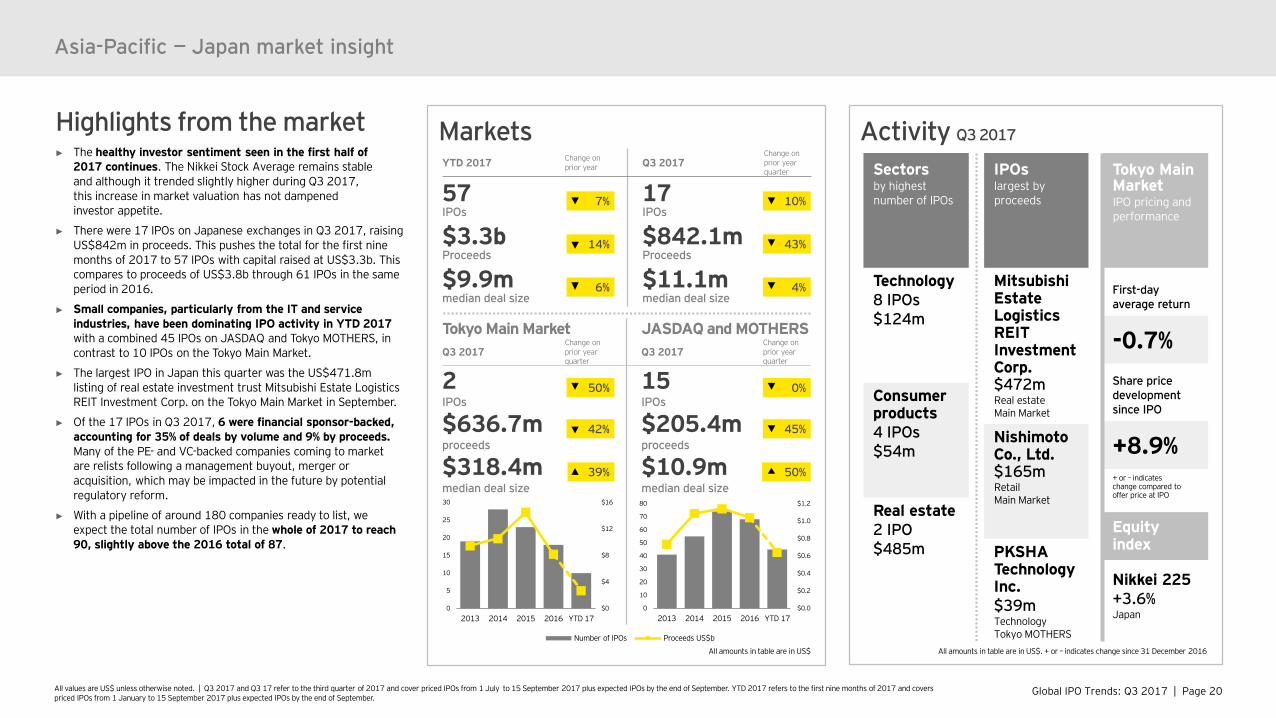
Highlights from the market► The healthy investor sentiment seen in the first half of
2017 continues. The Nikkei Stock Average remains stable and although it trended slightly higher during Q3 2017, this increase in market valuation has not dampened investor appetite.
► There were 17 IPOs on Japanese exchanges in Q3 2017, raising US$842m in proceeds. This pushes the total for the first nine months of 2017 to 57 IPOs with capital raised at US$3.3b. This compares to proceeds of US$3.8b through 61 IPOs in the same period in 2016.
► Small companies, particularly from the IT and service industries, have been dominating IPO activity in YTD 2017with a combined 45 IPOs on JASDAQ and Tokyo MOTHERS, in contrast to 10 IPOs on the Tokyo Main Market.
► The largest IPO in Japan this quarter was the US$471.8m listing of real estate investment trust Mitsubishi Estate Logistics REIT Investment Corp. on the Tokyo Main Market in September.
► Of the 17 IPOs in Q3 2017, 6 were financial sponsor-backed, accounting for 35% of deals by volume and 9% by proceeds.Many of the PE- and VC-backed companies coming to market are relists following a management buyout, merger or acquisition, which may be impacted in the future by potential regulatory reform.
► With a pipeline of around 180 companies ready to list, we expect the total number of IPOs in the whole of 2017 to reach 90, slightly above the 2016 total of 87.
+ or – indicates change compared to offer price at IPO
$0.0
$0.2
$0.4
$0.6
$0.8
$1.0
$1.2
0
10
20
30
40
50
60
70
80
2013 2014 2015 2016 YTD 17
Number of IPOs Proceeds US$b
$0
$4
$8
$12
$16
0
5
10
15
20
25
30
2013 2014 2015 2016 YTD 17
42%
39%
45%
50%
YTD 2017 Change on prior year Q3 2017
Change on prior yearquarter
57IPOs
17IPOs
$3.3bProceeds
$842.1mProceeds
$9.9mmedian deal size
$11.1mmedian deal size
7%
14%
10%
43%
4%6%
50% 0%
Global IPO Trends: Q3 2017 | Page 21Global IPO Trends: Q3 2017 | Page 21
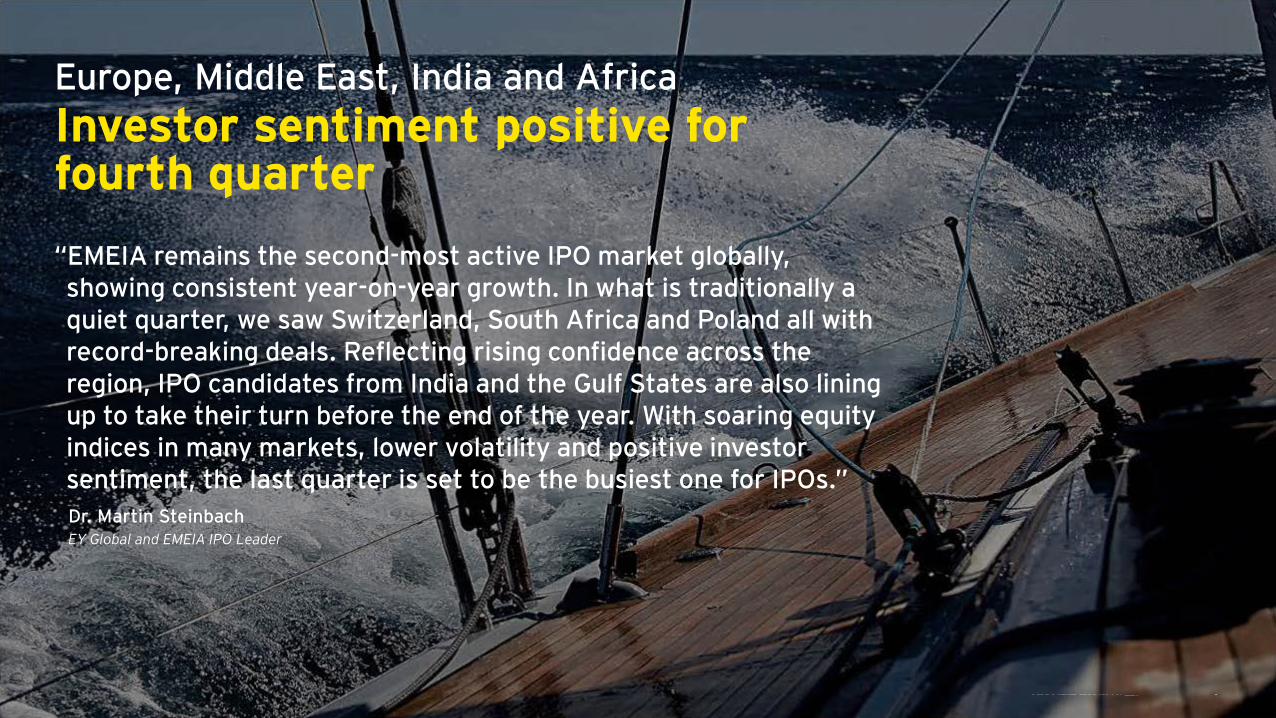
Europe, Middle East, India and AfricaInvestor sentiment positive for fourth quarter“EMEIA remains the second-most active IPO market globally, showing consistent year-on-year growth. In what is traditionally a quiet quarter, we saw Switzerland, South Africa and Poland all with record-breaking deals. Reflecting rising confidence across the region, IPO candidates from India and the Gulf States are also lining up to take their turn before the end of the year. With soaring equity indices in many markets, lower volatility and positive investor sentiment, the last quarter is set to be the busiest one for IPOs.”Dr. Martin SteinbachEY Global and EMEIA IPO Leader
Global IPO Trends: Q3 2017 | Page 22All values are US$ unless otherwise noted. | Q3 2017 and Q3 17 refer to the third quarter of 2017 and cover priced IPOs from 1 July to 15 September 2017 plus expected IPOs by the end of September. YTD 2017 refers to the first nine months of 2017 and covers priced IPOs from 1 January to 15 September 2017 plus expected IPOs by the end of September.
Europe, Middle East, India and Africa
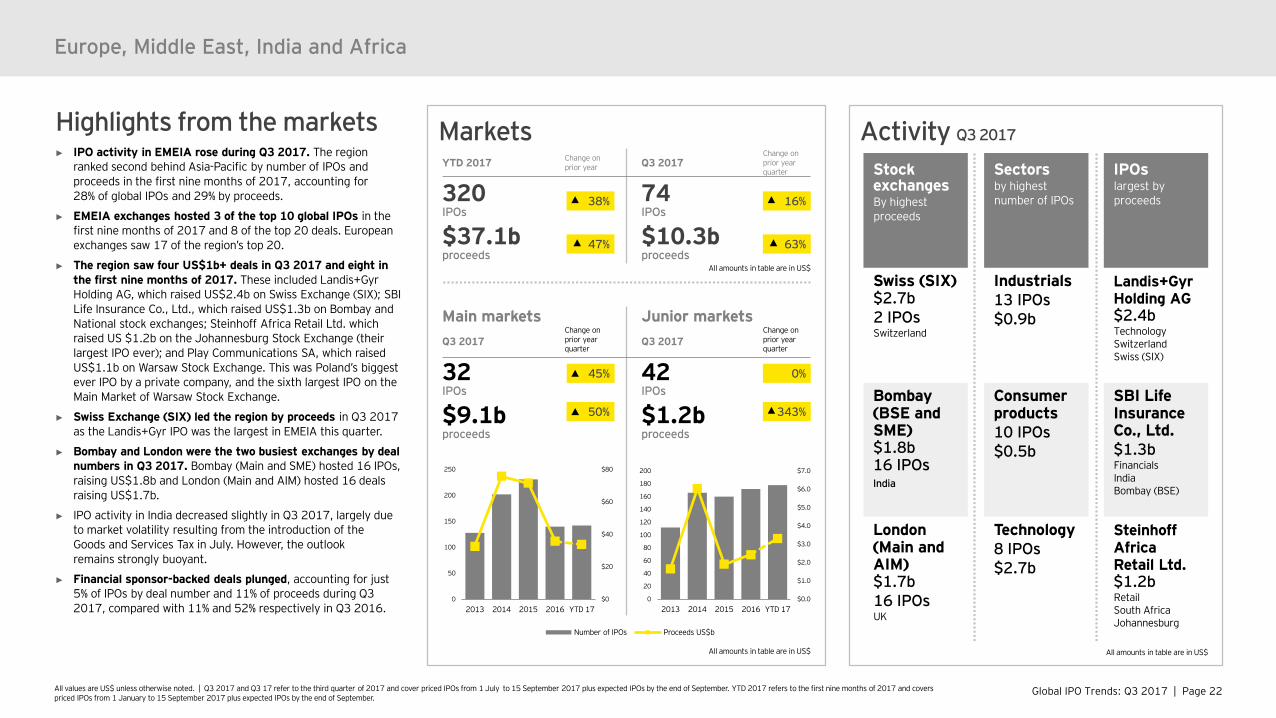
Highlights from the markets► IPO activity in EMEIA rose during Q3 2017. The region
ranked second behind Asia-Pacific by number of IPOs and proceeds in the first nine months of 2017, accounting for 28% of global IPOs and 29% by proceeds.
► EMEIA exchanges hosted 3 of the top 10 global IPOs in the first nine months of 2017 and 8 of the top 20 deals. European exchanges saw 17 of the region’s top 20.
► The region saw four US$1b+ deals in Q3 2017 and eight in the first nine months of 2017. These included Landis+GyrHolding AG, which raised US$2.4b on Swiss Exchange (SIX); SBI Life Insurance Co., Ltd., which raised US$1.3b on Bombay and National stock exchanges; Steinhoff Africa Retail Ltd. which raised US $1.2b on the Johannesburg Stock Exchange (their largest IPO ever); and Play Communications SA, which raised US$1.1b on Warsaw Stock Exchange. This was Poland’s biggest ever IPO by a private company, and the sixth largest IPO on the Main Market of Warsaw Stock Exchange.
► Swiss Exchange (SIX) led the region by proceeds in Q3 2017 as the Landis+Gyr IPO was the largest in EMEIA this quarter.
► Bombay and London were the two busiest exchanges by deal numbers in Q3 2017. Bombay (Main and SME) hosted 16 IPOs, raising US$1.8b and London (Main and AIM) hosted 16 deals raising US$1.7b.
► IPO activity in India decreased slightly in Q3 2017, largely due to market volatility resulting from the introduction of the Goods and Services Tax in July. However, the outlook remains strongly buoyant.
► Financial sponsor-backed deals plunged, accounting for just 5% of IPOs by deal number and 11% of proceeds during Q3 2017, compared with 11% and 52% respectively in Q3 2016.
Activity Q3 2017
Stock exchangesBy highest proceeds
Swiss (SIX)$2.7b2 IPOsSwitzerland
Bombay (BSE and SME)$1.8b16 IPOsIndia
London (Main and AIM)$1.7b16 IPOsUK
IPOslargest byproceeds
Landis+Gyr Holding AG$2.4bTechnologySwitzerlandSwiss (SIX)
SBI Life Insurance Co., Ltd.$1.3bFinancialsIndiaBombay (BSE)
Steinhoff Africa Retail Ltd.$1.2bRetailSouth AfricaJohannesburg
Sectorsby highestnumber of IPOs
Industrials13 IPOs$0.9b
Consumer products10 IPOs$0.5b
Technology8 IPOs$2.7b
All amounts in table are in US$
Markets
Main markets Junior marketsQ3 2017
Change on prior year quarter
Q3 2017Change on prior year quarter
32IPOs
42IPOs
$9.1bproceeds
$1.2bproceeds
343%
All amounts in table are in US$
0%
50%
All amounts in table are in US$
$0.0
$1.0
$2.0
$3.0
$4.0
$5.0
$6.0
$7.0
0
20
40
60
80
100
120
140
160
180
200
2013 2014 2015 2016 YTD 17
Number of IPOs Proceeds US$b
$0
$20
$40
$60
$80
0
50
100
150
200
250
2013 2014 2015 2016 YTD 17
45%
YTD 2017 Change on prior year Q3 2017
Change on prior year quarter
320IPOs
74IPOs
$37.1bproceeds
$10.3bproceeds
38%
47%
16%
63%
Global IPO Trends: Q3 2017 | Page 23All values are US$ unless otherwise noted. | Q3 2017 and Q3 17 refer to the third quarter of 2017 and cover priced IPOs from 1 July to 15 September 2017 plus expected IPOs by the end of September. YTD 2017 refers to the first nine months of 2017 and covers priced IPOs from 1 January to 15 September 2017 plus expected IPOs by the end of September.
Trends
Sources of IPOs
YTD 2017
YTD 2017
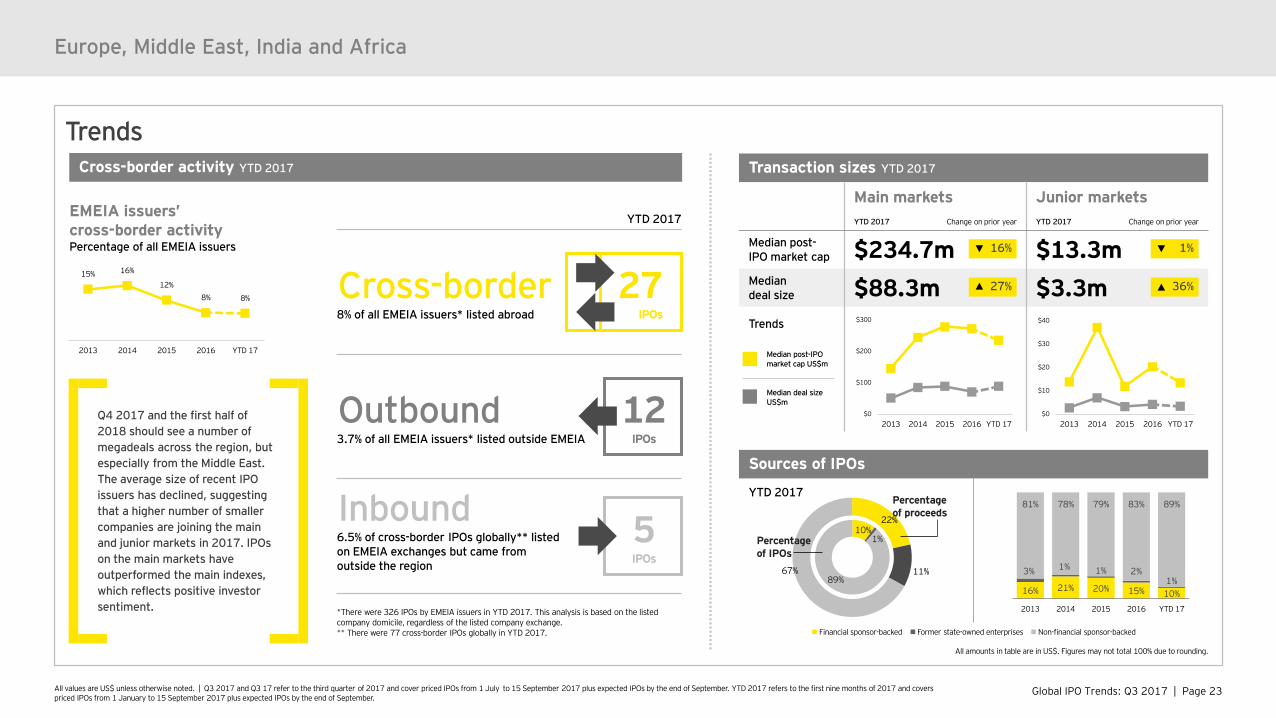
Cross-border 8% of all EMEIA issuers* listed abroad
Outbound3.7% of all EMEIA issuers* listed outside EMEIA
Inbound6.5% of cross-border IPOs globally** listedon EMEIA exchanges but came fromoutside the region
*There were 326 IPOs by EMEIA issuers in YTD 2017. This analysis is based on the listed company domicile, regardless of the listed company exchange.** There were 77 cross-border IPOs globally in YTD 2017.
Europe, Middle East, India and Africa
Cross-border activity YTD 2017
EMEIA issuers’ cross-border activityPercentage of all EMEIA issuers
Q4 2017 and the first half of 2018 should see a number of megadeals across the region, but especially from the Middle East. The average size of recent IPO issuers has declined, suggesting that a higher number of smaller companies are joining the main and junior markets in 2017. IPOs on the main markets have outperformed the main indexes, which reflects positive investor sentiment.
5IPOs
12IPOs
Transaction sizes YTD 2017
Main markets Junior marketsYTD 2017 Change on prior year YTD 2017 Change on prior year
Median post-IPO market cap $234.7m $13.3mMedian deal size $88.3m $3.3mTrends
16%
All amounts in table are in US$. Figures may not total 100% due to rounding.
22%
11%67%
Percentage of proceeds
10%1%
89%
Percentageof IPOs
27IPOs
Financial sponsor-backed Former state-owned enterprises Non-financial sponsor-backed
27%
16% 21% 20% 15% 10%
3% 1% 1% 2%1%
81% 78% 79% 83% 89%
2013 2014 2015 2016 YTD 17
15% 16%
12%8% 8%
2013 2014 2015 2016 YTD 17
$0
$100
$200
$300
2013 2014 2015 2016 YTD 17$0
$10
$20
$30
$40
2013 2014 2015 2016 YTD 17
Median post-IPO market cap US$m
Median deal size US$m
1%
36%
Global IPO Trends: Q3 2017 | Page 24All values are US$ unless otherwise noted. | Q3 2017 and Q3 17 refer to the third quarter of 2017 and cover priced IPOs from 1 July to 15 September 2017 plus expected IPOs by the end of September. YTD 2017 refers to the first nine months of 2017 and covers priced IPOs from 1 January to 15 September 2017 plus expected IPOs by the end of September.
Europe, Middle East, India and Africa
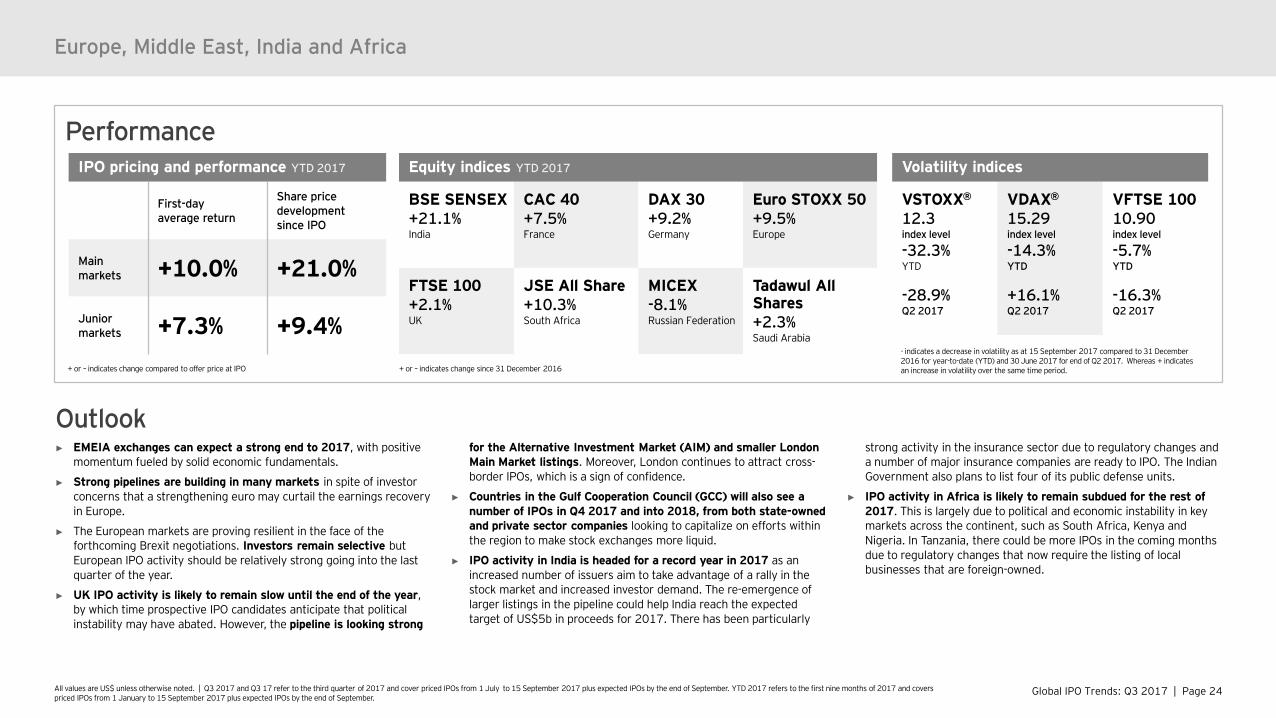
PerformanceEquity indices YTD 2017
BSE SENSEX+21.1%India
CAC 40+7.5%France
DAX 30+9.2%Germany
Euro STOXX 50+9.5%Europe
FTSE 100+2.1%UK
JSE All Share+10.3%South Africa
MICEX-8.1%Russian Federation
Tadawul All Shares+2.3%Saudi Arabia
IPO pricing and performance YTD 2017
First-day average return
Share price development since IPO
Main markets +10.0% +21.0%
Junior markets +7.3% +9.4%
Volatility indices
VSTOXX®
12.3 index level
-32.3%YTD
-28.9%Q2 2017
VDAX®
15.29 index level
-14.3%YTD
+16.1%Q2 2017
VFTSE 100 10.90 index level
-5.7%YTD
-16.3%Q2 2017
+ or – indicates change since 31 December 2016
- - indicates a decrease in volatility as at 15 September 2017 compared to 31 December 2016 for year-to-date (YTD) and 30 June 2017 for end of Q2 2017. Whereas + indicates an increase in volatility over the same time period.+ or – indicates change compared to offer price at IPO
► EMEIA exchanges can expect a strong end to 2017, with positive momentum fueled by solid economic fundamentals.
► Strong pipelines are building in many markets in spite of investor concerns that a strengthening euro may curtail the earnings recovery in Europe.
► The European markets are proving resilient in the face of the forthcoming Brexit negotiations. Investors remain selective but European IPO activity should be relatively strong going into the last quarter of the year.
► UK IPO activity is likely to remain slow until the end of the year, by which time prospective IPO candidates anticipate that political instability may have abated. However, the pipeline is looking strong
for the Alternative Investment Market (AIM) and smaller London Main Market listings. Moreover, London continues to attract cross-border IPOs, which is a sign of confidence.
► Countries in the Gulf Cooperation Council (GCC) will also see a number of IPOs in Q4 2017 and into 2018, from both state-owned and private sector companies looking to capitalize on efforts within the region to make stock exchanges more liquid.
► IPO activity in India is headed for a record year in 2017 as an increased number of issuers aim to take advantage of a rally in the stock market and increased investor demand. The re-emergence of larger listings in the pipeline could help India reach the expected target of US$5b in proceeds for 2017. There has been particularly
strong activity in the insurance sector due to regulatory changes and a number of major insurance companies are ready to IPO. The Indian Government also plans to list four of its public defense units.
► IPO activity in Africa is likely to remain subdued for the rest of 2017. This is largely due to political and economic instability in key markets across the continent, such as South Africa, Kenya and Nigeria. In Tanzania, there could be more IPOs in the coming months due to regulatory changes that now require the listing of local businesses that are foreign-owned.
Outlook
Global IPO Trends: Q3 2017 | Page 25All values are US$ unless otherwise noted. | Q3 2017 and Q3 17 refer to the third quarter of 2017 and cover priced IPOs from 1 July to 15 September 2017 plus expected IPOs by the end of September. YTD 2017 refers to the first nine months of 2017 and covers priced IPOs from 1 January to 15 September 2017 plus expected IPOs by the end of September.
Markets Activity Q3 2017
Performance YTD 2017
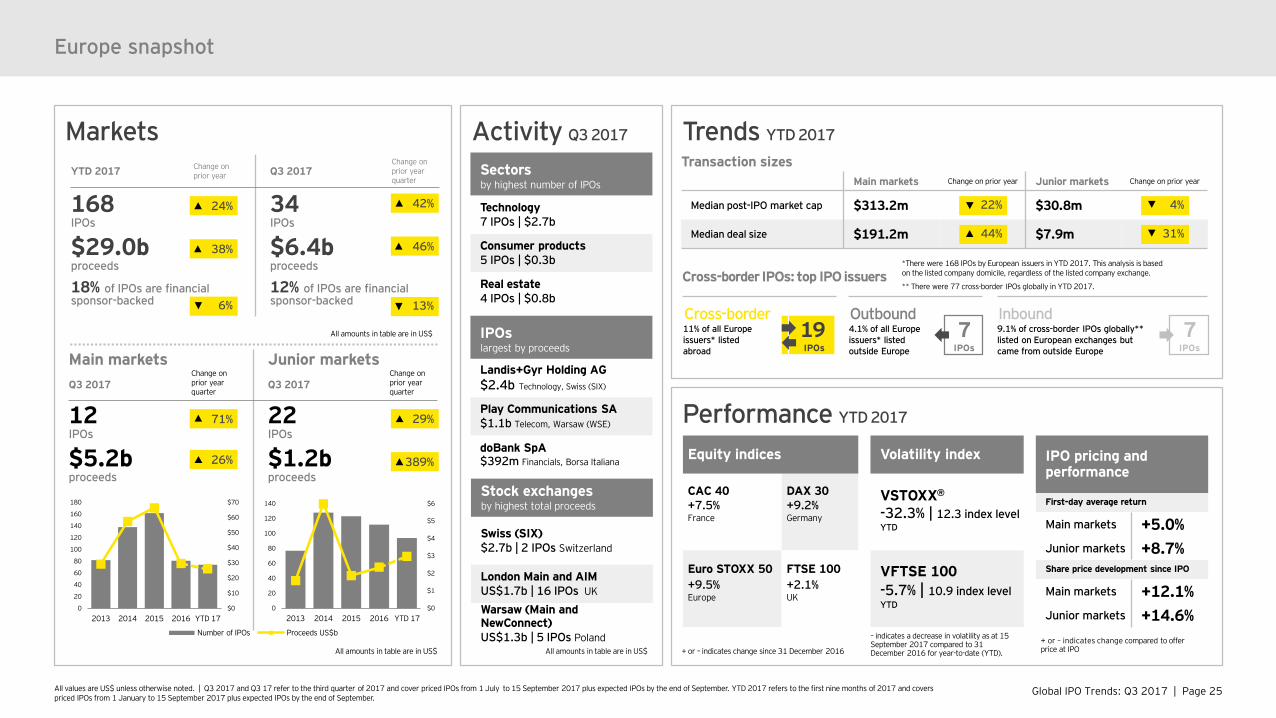
Europe snapshot
Main markets Junior marketsQ3 2017
Change on prior year quarter
Q3 2017Change on prior year quarter
12IPOs
22IPOs
$5.2bproceeds
$1.2bproceeds
All amounts in table are in US$
26%
All amounts in table are in US$
71% 29%
YTD 2017 Change on prior year Q3 2017
Change on prior year quarter
168IPOs
34IPOs
$29.0bproceeds
$6.4bproceeds
18% of IPOs are financial sponsor-backed
12% of IPOs are financial sponsor-backed
24%
38%
42%
46%
389% IPO pricing and performance
First-day average return
Main markets +5.0%Junior markets +8.7%Share price development since IPO
Main markets +12.1%Junior markets +14.6%
Equity indices
CAC 40+7.5%France
DAX 30+9.2%Germany
Euro STOXX 50+9.5%Europe
FTSE 100+2.1%UK
Volatility index
VSTOXX®
-32.3% | 12.3 index levelYTD
VFTSE 100 -5.7% | 10.9 index levelYTD
Sectorsby highest number of IPOs
Technology7 IPOs | $2.7b
Consumer products5 IPOs | $0.3b
Real estate4 IPOs | $0.8b
All amounts in table are in US$ + or – indicates change since 31 December 2016
– indicates a decrease in volatility as at 15 September 2017 compared to 31 December 2016 for year-to-date (YTD).
+ or – indicates change compared to offer price at IPO
6% 13%
IPOslargest by proceeds
Landis+Gyr Holding AG$2.4b Technology, Swiss (SIX)
Play Communications SA$1.1b Telecom, Warsaw (WSE)
doBank SpA$392m Financials, Borsa Italiana
Stock exchanges by highest total proceeds
Swiss (SIX)$2.7b | 2 IPOs Switzerland
London Main and AIMUS$1.7b | 16 IPOs UK
Warsaw (Main and NewConnect) US$1.3b | 5 IPOs Poland
Trends YTD 2017
Transaction sizesMain markets Change on prior year Junior markets Change on prior year
Median post-IPO market cap $313.2m $30.8m
Median deal size $191.2m $7.9m
22%
44%
4%
31%
$0
$1
$2
$3
$4
$5
$6
0
20
40
60
80
100
120
140
2013 2014 2015 2016 YTD 17
Number of IPOs Proceeds US$b
$0
$10
$20
$30
$40
$50
$60
$70
0
20
40
60
80
100
120
140
160
180
2013 2014 2015 2016 YTD 17
Cross-border IPOs: top IPO issuers
Cross-border 11% of all Europe issuers* listed abroad
19IPOs
Outbound4.1% of all Europe issuers* listed outside Europe
7IPOs
Inbound9.1% of cross-border IPOs globally** listed on European exchanges but came from outside Europe
7IPOs
*There were 168 IPOs by European issuers in YTD 2017. This analysis is based on the listed company domicile, regardless of the listed company exchange.
** There were 77 cross-border IPOs globally in YTD 2017.

Global IPO Trends: Q3 2017 | Page 26Global IPO Trends: Q3 2017 | Page 26
EMEIA — UK IPO market insightSteady IPO activity signals a cautious return of confidence“The third quarter was very active with the financial services sector looking to take advantage of the regulatory stability currently available. There was also an increase in cross-border listings, indicating that the UK market’s attractiveness as a listing venue globally is on the rise. However, until we see the return of strong local main market listings, the UK IPO market’s full recovery is not assured.”Scott McCubbinEY UK and Ireland IPO Leader
Global IPO Trends: Q3 2017 | Page 27All values are US$ unless otherwise noted. | Q3 2017 and Q3 17 refer to the third quarter of 2017 and cover priced IPOs from 1 July to 15 September 2017 plus expected IPOs by the end of September. YTD 2017 refers to the first nine months of 2017 and covers priced IPOs from 1 January to 15 September 2017 plus expected IPOs by the end of September.
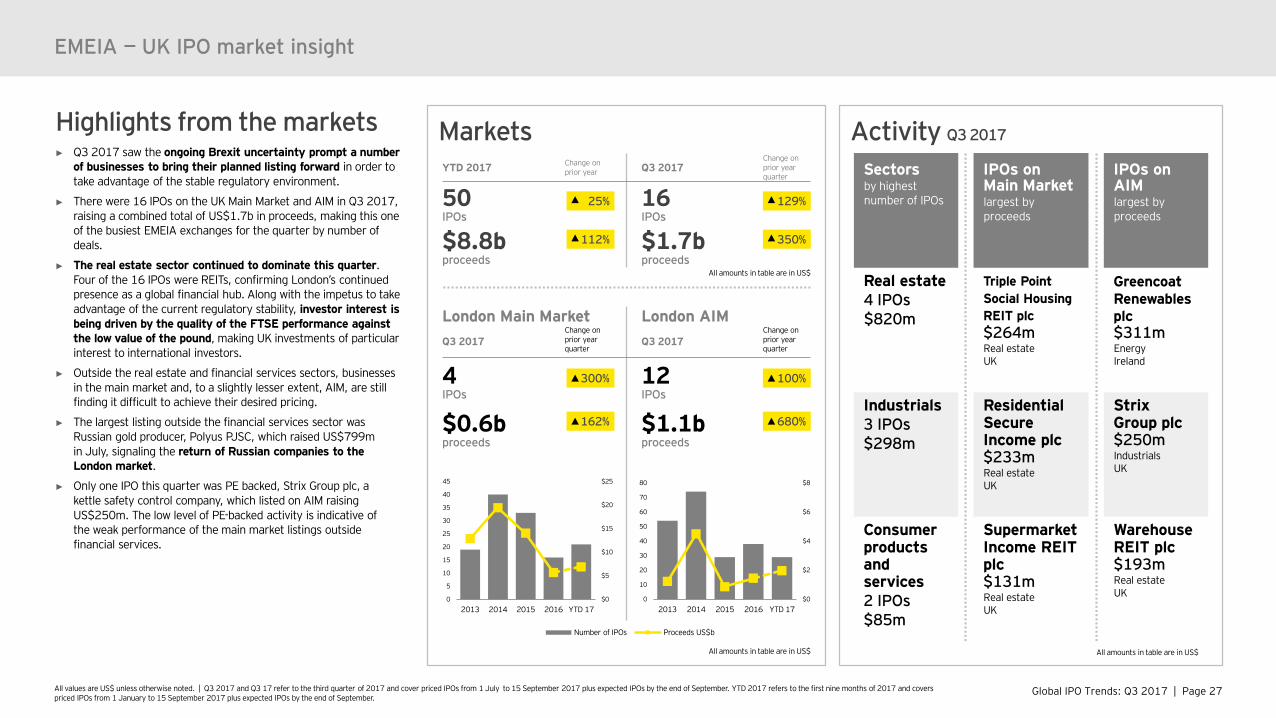
EMEIA — UK IPO market insight
Highlights from the markets► Q3 2017 saw the ongoing Brexit uncertainty prompt a number
of businesses to bring their planned listing forward in order to take advantage of the stable regulatory environment.
► There were 16 IPOs on the UK Main Market and AIM in Q3 2017, raising a combined total of US$1.7b in proceeds, making this one of the busiest EMEIA exchanges for the quarter by number of deals.
► The real estate sector continued to dominate this quarter. Four of the 16 IPOs were REITs, confirming London’s continued presence as a global financial hub. Along with the impetus to take advantage of the current regulatory stability, investor interest is being driven by the quality of the FTSE performance against the low value of the pound, making UK investments of particular interest to international investors.
► Outside the real estate and financial services sectors, businesses in the main market and, to a slightly lesser extent, AIM, are still finding it difficult to achieve their desired pricing.
► The largest listing outside the financial services sector was Russian gold producer, Polyus PJSC, which raised US$799m in July, signaling the return of Russian companies to the London market.
► Only one IPO this quarter was PE backed, Strix Group plc, a kettle safety control company, which listed on AIM raising US$250m. The low level of PE-backed activity is indicative of the weak performance of the main market listings outside financial services.
Activity Q3 2017
Sectorsby highest number of IPOs
Real estate 4 IPOs$820m
Industrials3 IPOs$298m
Consumer products and services2 IPOs$85m
IPOs on AIMlargest by proceeds
Greencoat Renewables plc$311mEnergyIreland
Strix Group plc$250mIndustrialsUK
Warehouse REIT plc$193mReal estateUK
IPOs on Main Marketlargest by proceeds
Triple Point Social Housing REIT plc$264mReal estateUK
Residential Secure Income plc$233mReal estateUK
Supermarket Income REIT plc$131mReal estateUK
All amounts in table are in US$
Markets
London Main Market London AIMQ3 2017
Change on prior yearquarter
Q3 2017Change on prior year quarter
4IPOs
12IPOs
$0.6bproceeds
$1.1bproceeds
All amounts in table are in US$
All amounts in table are in US$
$0
$2
$4
$6
$8
0
10
20
30
40
50
60
70
80
2013 2014 2015 2016 YTD 17
Number of IPOs Proceeds US$b
$0
$5
$10
$15
$20
$25
0
5
10
15
20
25
30
35
40
45
2013 2014 2015 2016 YTD 17
YTD 2017 Change on prior year Q3 2017
Change on prior yearquarter
50IPOs
16IPOs
$8.8bproceeds
$1.7bproceeds
25%
112%
129%
350%
162%
300%
680%
100%
Global IPO Trends: Q3 2017 | Page 28All values are US$ unless otherwise noted. | Q3 2017 and Q3 17 refer to the third quarter of 2017 and cover priced IPOs from 1 July to 15 September 2017 plus expected IPOs by the end of September. YTD 2017 refers to the first nine months of 2017 and covers priced IPOs from 1 January to 15 September 2017 plus expected IPOs by the end of September.
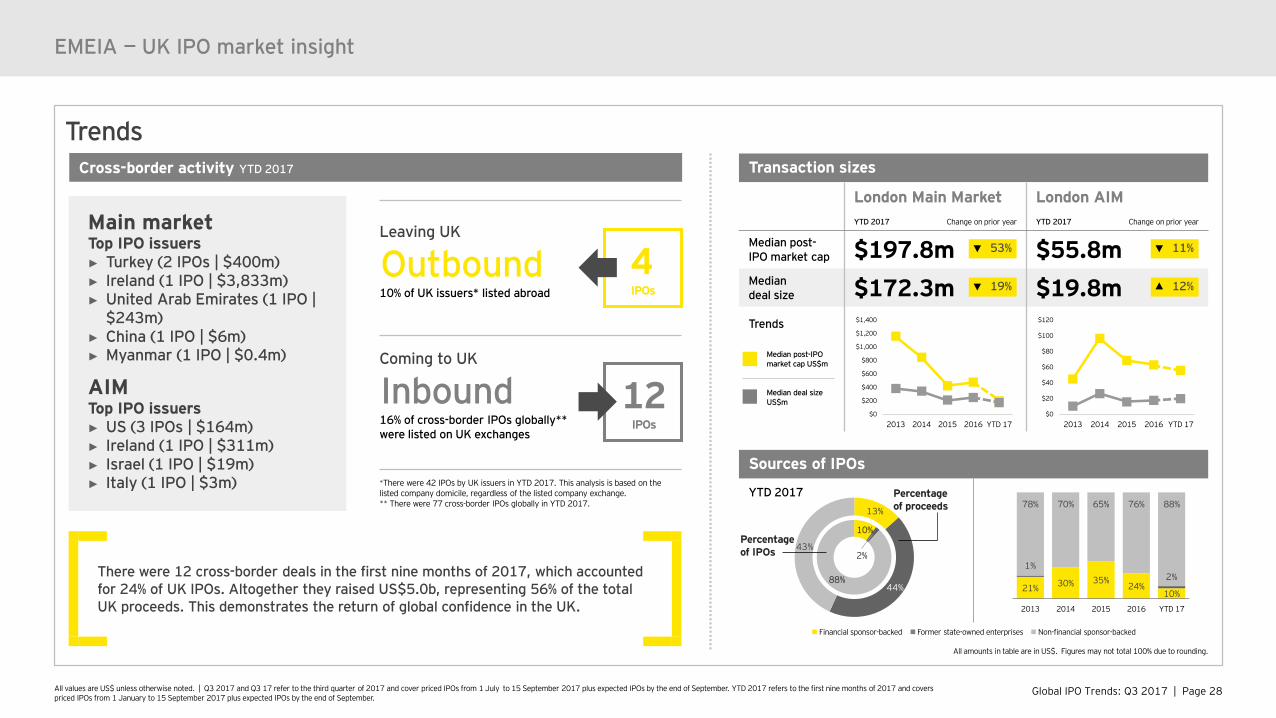
Trends
Sources of IPOs
YTD 201713%
44%
43%
Percentage of proceeds
10%
2%
88%
Percentage of IPOs
EMEIA — UK IPO market insight
Leaving UK
Outbound10% of UK issuers* listed abroad
Coming to UK
Inbound 16% of cross-border IPOs globally**were listed on UK exchanges
*There were 42 IPOs by UK issuers in YTD 2017. This analysis is based on the listed company domicile, regardless of the listed company exchange.** There were 77 cross-border IPOs globally in YTD 2017.
Cross-border activity YTD 2017
Main marketTop IPO issuers► Turkey (2 IPOs | $400m)► Ireland (1 IPO | $3,833m)► United Arab Emirates (1 IPO |
$243m)► China (1 IPO | $6m)► Myanmar (1 IPO | $0.4m)
AIMTop IPO issuers► US (3 IPOs | $164m)► Ireland (1 IPO | $311m)► Israel (1 IPO | $19m)► Italy (1 IPO | $3m)
12IPOs
4IPOs
Transaction sizes
London Main Market London AIMYTD 2017 Change on prior year YTD 2017 Change on prior year
Median post-IPO market cap $197.8m $55.8mMedian deal size $172.3m $19.8mTrends
11%
Median post-IPO market cap US$m
Median deal size US$m
All amounts in table are in US$. Figures may not total 100% due to rounding.
53%
19% 12%
Financial sponsor-backed Former state-owned enterprises Non-financial sponsor-backed
There were 12 cross-border deals in the first nine months of 2017, which accounted for 24% of UK IPOs. Altogether they raised US$5.0b, representing 56% of the total UK proceeds. This demonstrates the return of global confidence in the UK.
21% 30% 35%24%
10%
1%2%
78% 70% 65% 76% 88%
2013 2014 2015 2016 YTD 17
$0
$200
$400
$600
$800
$1,000
$1,200
$1,400
2013 2014 2015 2016 YTD 17$0
$20
$40
$60
$80
$100
$120
2013 2014 2015 2016 YTD 17
Global IPO Trends: Q3 2017 | Page 29All values are US$ unless otherwise noted. | Q3 2017 and Q3 17 refer to the third quarter of 2017 and cover priced IPOs from 1 July to 15 September 2017 plus expected IPOs by the end of September. YTD 2017 refers to the first nine months of 2017 and covers priced IPOs from 1 January to 15 September 2017 plus expected IPOs by the end of September.
EMEIA — UK IPO market insight
PerformanceEquity indices YTD 2017
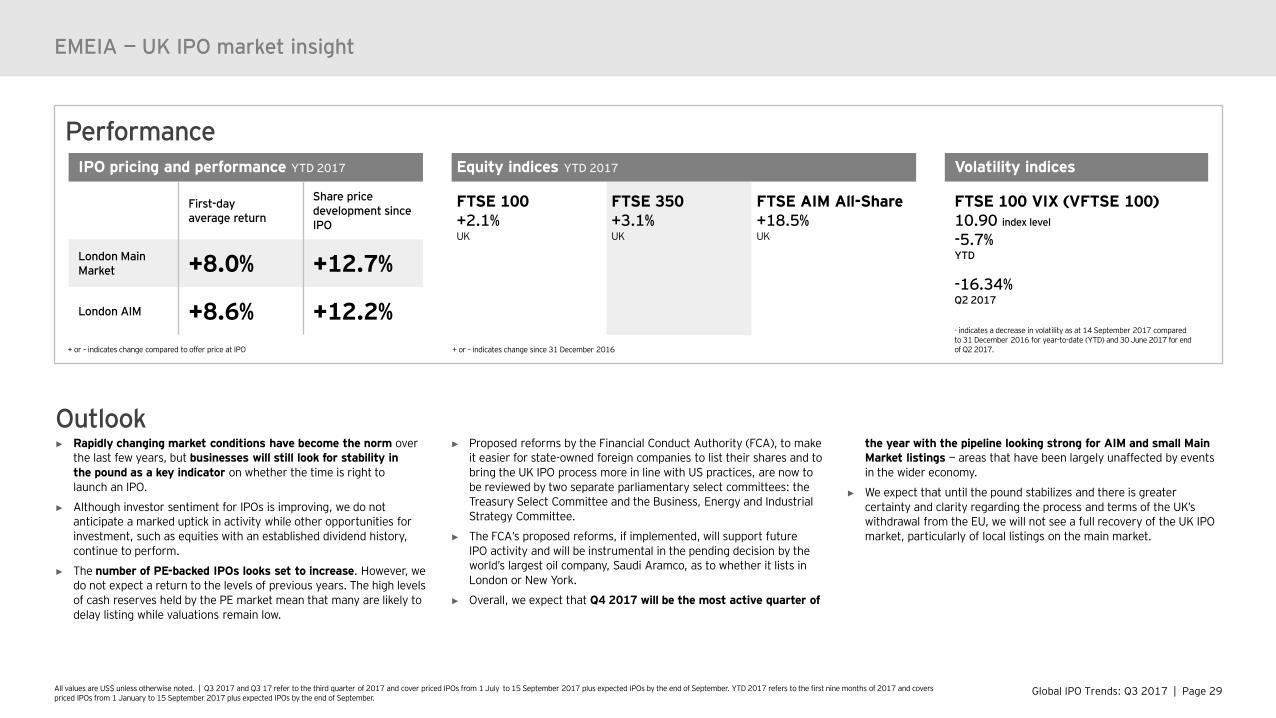
FTSE 100+2.1%UK
FTSE 350+3.1%UK
FTSE AIM All-Share+18.5%UK
IPO pricing and performance YTD 2017
First-day average return
Share price development since IPO
London Main Market +8.0% +12.7%
London AIM +8.6% +12.2%
Volatility indices
FTSE 100 VIX (VFTSE 100)10.90 index level
-5.7%YTD
-16.34%Q2 2017
+ or – indicates change since 31 December 2016+ or – indicates change compared to offer price at IPO
- indicates a decrease in volatility as at 14 September 2017 compared to 31 December 2016 for year-to-date (YTD) and 30 June 2017 for end of Q2 2017.
► Rapidly changing market conditions have become the norm over the last few years, but businesses will still look for stability in the pound as a key indicator on whether the time is right to launch an IPO.
► Although investor sentiment for IPOs is improving, we do not anticipate a marked uptick in activity while other opportunities for investment, such as equities with an established dividend history, continue to perform.
► The number of PE-backed IPOs looks set to increase. However, we do not expect a return to the levels of previous years. The high levels of cash reserves held by the PE market mean that many are likely to delay listing while valuations remain low.
► Proposed reforms by the Financial Conduct Authority (FCA), to make it easier for state-owned foreign companies to list their shares and to bring the UK IPO process more in line with US practices, are now to be reviewed by two separate parliamentary select committees: the Treasury Select Committee and the Business, Energy and Industrial Strategy Committee.
► The FCA’s proposed reforms, if implemented, will support future IPO activity and will be instrumental in the pending decision by the world’s largest oil company, Saudi Aramco, as to whether it lists in London or New York.
► Overall, we expect that Q4 2017 will be the most active quarter of
the year with the pipeline looking strong for AIM and small Main Market listings — areas that have been largely unaffected by events in the wider economy.
► We expect that until the pound stabilizes and there is greater certainty and clarity regarding the process and terms of the UK’s withdrawal from the EU, we will not see a full recovery of the UK IPO market, particularly of local listings on the main market.
Outlook

AppendixAreas and regional IPO markets facts and figures
Definitions
Global IPO Trends: Q3 2017 | Page 31**Data based on domicile of the exchange, regardless of the listed company domicile. Euronext includes Euronext (Amsterdam, Paris, Brussels and Lisbon); Shenzhen (SZSE) includes the Main Board, SME Board and ChiNext.
Appendix
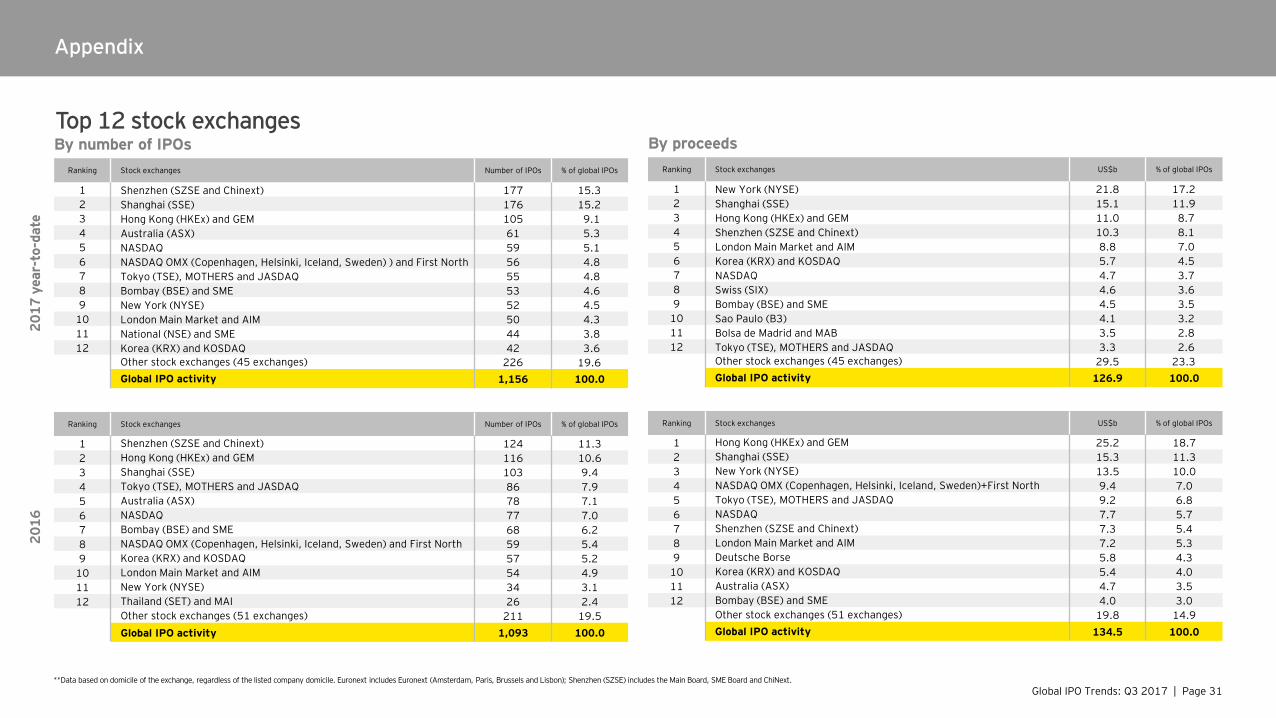
Top 12 stock exchangesBy number of IPOs
2017
yea
r-to
-dat
e
Ranking Stock exchanges Number of IPOs % of global IPOs
1 Shenzhen (SZSE and Chinext) 177 15.3 2 Shanghai (SSE) 176 15.2 3 Hong Kong (HKEx) and GEM 105 9.1 4 Australia (ASX) 61 5.3 5 NASDAQ 59 5.1 6 NASDAQ OMX (Copenhagen, Helsinki, Iceland, Sweden) ) and First North 56 4.8 7 Tokyo (TSE), MOTHERS and JASDAQ 55 4.8 8 Bombay (BSE) and SME 53 4.6 9 New York (NYSE) 52 4.5
10 London Main Market and AIM 50 4.3 11 National (NSE) and SME 44 3.8 12 Korea (KRX) and KOSDAQ 42 3.6
Other stock exchanges (45 exchanges) 226 19.6 Global IPO activity 1,156 100.0
2016
Ranking Stock exchanges Number of IPOs % of global IPOs
1 Shenzhen (SZSE and Chinext) 124 11.32 Hong Kong (HKEx) and GEM 116 10.63 Shanghai (SSE) 103 9.44 Tokyo (TSE), MOTHERS and JASDAQ 86 7.95 Australia (ASX) 78 7.16 NASDAQ 77 7.07 Bombay (BSE) and SME 68 6.28 NASDAQ OMX (Copenhagen, Helsinki, Iceland, Sweden) and First North 59 5.49 Korea (KRX) and KOSDAQ 57 5.2
10 London Main Market and AIM 54 4.911 New York (NYSE) 34 3.112 Thailand (SET) and MAI 26 2.4
Other stock exchanges (51 exchanges) 211 19.5Global IPO activity 1,093 100.0
By proceedsRanking Stock exchanges US$b % of global IPOs
1 New York (NYSE) 21.8 17.2 2 Shanghai (SSE) 15.1 11.9 3 Hong Kong (HKEx) and GEM 11.0 8.7 4 Shenzhen (SZSE and Chinext) 10.3 8.1 5 London Main Market and AIM 8.8 7.0 6 Korea (KRX) and KOSDAQ 5.7 4.5 7 NASDAQ 4.7 3.7 8 Swiss (SIX) 4.6 3.6 9 Bombay (BSE) and SME 4.5 3.5
10 Sao Paulo (B3) 4.1 3.2 11 Bolsa de Madrid and MAB 3.5 2.8 12 Tokyo (TSE), MOTHERS and JASDAQ 3.3 2.6
Other stock exchanges (45 exchanges) 29.5 23.3 Global IPO activity 126.9 100.0
Ranking Stock exchanges US$b % of global IPOs
1 Hong Kong (HKEx) and GEM 25.2 18.72 Shanghai (SSE) 15.3 11.33 New York (NYSE) 13.5 10.04 NASDAQ OMX (Copenhagen, Helsinki, Iceland, Sweden)+First North 9.4 7.05 Tokyo (TSE), MOTHERS and JASDAQ 9.2 6.86 NASDAQ 7.7 5.77 Shenzhen (SZSE and Chinext) 7.3 5.48 London Main Market and AIM 7.2 5.39 Deutsche Borse 5.8 4.3
10 Korea (KRX) and KOSDAQ 5.4 4.011 Australia (ASX) 4.7 3.512 Bombay (BSE) and SME 4.0 3.0
Other stock exchanges (51 exchanges) 19.8 14.9Global IPO activity 134.5 100.0
Global IPO Trends: Q3 2017 | Page 32**Data based on domicile of the exchange, regardless of the listed company domicile. Euronext includes Euronext (Amsterdam, Paris, Brussels and Lisbon); Shenzhen (SZSE) includes the Main Board, SME Board and ChiNext.
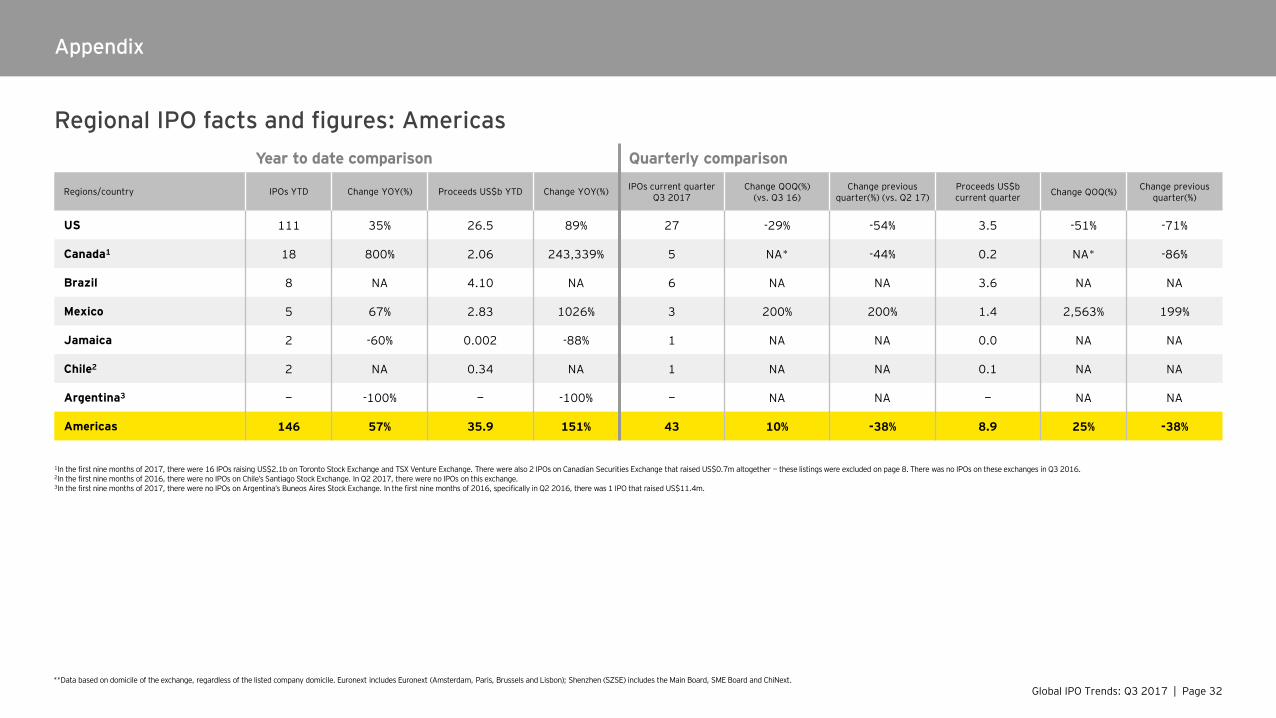
Regional IPO facts and figures: AmericasYear to date comparison Quarterly comparison
Regions/country IPOs YTD Change YOY(%) Proceeds US$b YTD Change YOY(%) IPOs current quarter Q3 2017
Change QOQ(%) (vs. Q3 16)
Change previous quarter(%) (vs. Q2 17)
Proceeds US$bcurrent quarter Change QOQ(%) Change previous
quarter(%)
US 111 35% 26.5 89% 27 -29% -54% 3.5 -51% -71%
Canada1 18 800% 2.06 243,339% 5 NA* -44% 0.2 NA* -86%
Brazil 8 NA 4.10 NA 6 NA NA 3.6 NA NA
Mexico 5 67% 2.83 1026% 3 200% 200% 1.4 2,563% 199%
Jamaica 2 -60% 0.002 -88% 1 NA NA 0.0 NA NA
Chile2 2 NA 0.34 NA 1 NA NA 0.1 NA NA
Argentina3 — -100% — -100% — NA NA — NA NA
Americas 146 57% 35.9 151% 43 10% -38% 8.9 25% -38%
1In the first nine months of 2017, there were 16 IPOs raising US$2.1b on Toronto Stock Exchange and TSX Venture Exchange. There were also 2 IPOs on Canadian Securities Exchange that raised US$0.7m altogether — these listings were excluded on page 8. There was no IPOs on these exchanges in Q3 2016.2In the first nine months of 2016, there were no IPOs on Chile’s Santiago Stock Exchange. In Q2 2017, there were no IPOs on this exchange. 3In the first nine months of 2017, there were no IPOs on Argentina’s Buneos Aires Stock Exchange. In the first nine months of 2016, specifically in Q2 2016, there was 1 IPO that raised US$11.4m.
Appendix
Global IPO Trends: Q3 2017 | Page 33**Data based on domicile of the exchange, regardless of the listed company domicile. Euronext includes Euronext (Amsterdam, Paris, Brussels and Lisbon); Shenzhen (SZSE) includes the Main Board, SME Board and ChiNext.
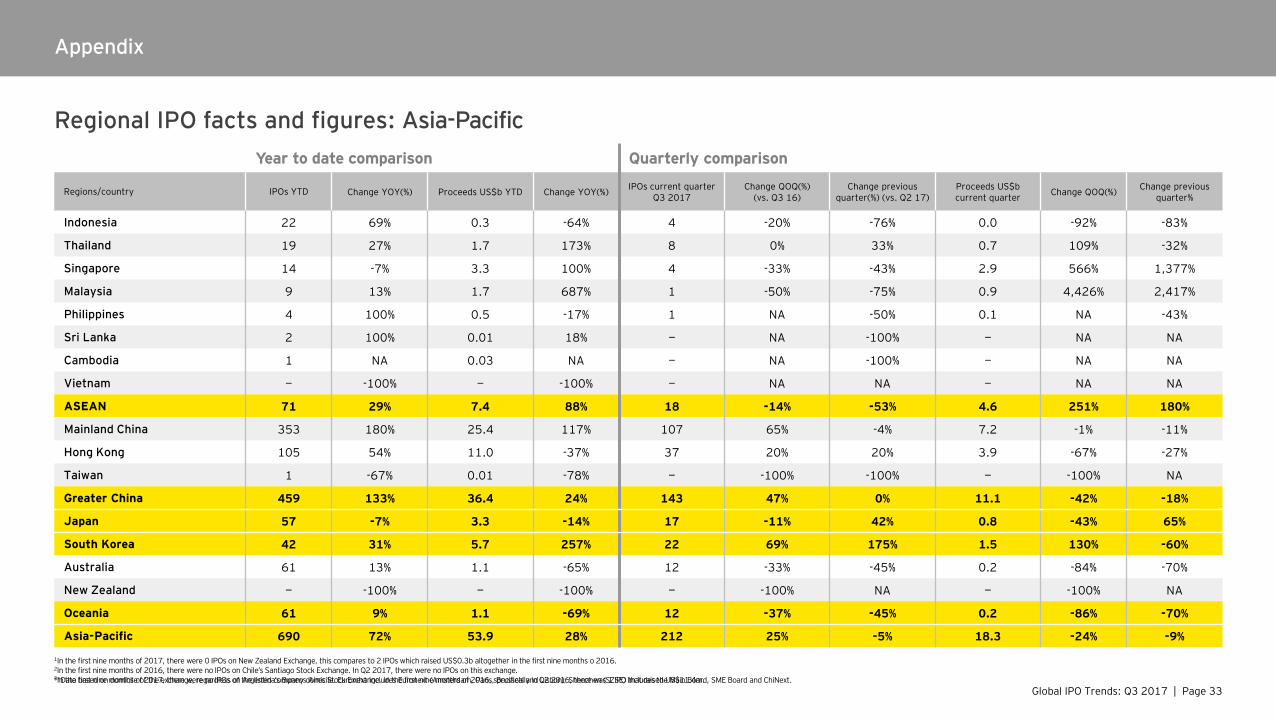
Regional IPO facts and figures: Asia-PacificYear to date comparison Quarterly comparison
Regions/country IPOs YTD Change YOY(%) Proceeds US$b YTD Change YOY(%) IPOs current quarter Q3 2017
Change QOQ(%) (vs. Q3 16)
Change previous quarter(%) (vs. Q2 17)
Proceeds US$bcurrent quarter Change QOQ(%) Change previous
quarter%
Indonesia 22 69% 0.3 -64% 4 -20% -76% 0.0 -92% -83%
Thailand 19 27% 1.7 173% 8 0% 33% 0.7 109% -32%
Singapore 14 -7% 3.3 100% 4 -33% -43% 2.9 566% 1,377%
Malaysia 9 13% 1.7 687% 1 -50% -75% 0.9 4,426% 2,417%
Philippines 4 100% 0.5 -17% 1 NA -50% 0.1 NA -43%
Sri Lanka 2 100% 0.01 18% — NA -100% — NA NA
Cambodia 1 NA 0.03 NA — NA -100% — NA NA
Vietnam — -100% — -100% — NA NA — NA NA
ASEAN 71 29% 7.4 88% 18 -14% -53% 4.6 251% 180%
Mainland China 353 180% 25.4 117% 107 65% -4% 7.2 -1% -11%
Hong Kong 105 54% 11.0 -37% 37 20% 20% 3.9 -67% -27%
Taiwan 1 -67% 0.01 -78% — -100% -100% — -100% NA
Greater China 459 133% 36.4 24% 143 47% 0% 11.1 -42% -18%
Japan 57 -7% 3.3 -14% 17 -11% 42% 0.8 -43% 65%
South Korea 42 31% 5.7 257% 22 69% 175% 1.5 130% -60%
Australia 61 13% 1.1 -65% 12 -33% -45% 0.2 -84% -70%
New Zealand — -100% — -100% — -100% NA — -100% NA
Oceania 61 9% 1.1 -69% 12 -37% -45% 0.2 -86% -70%
Asia-Pacific 690 72% 53.9 28% 212 25% -5% 18.3 -24% -9%
Appendix
1In the first nine months of 2017, there were 0 IPOs on New Zealand Exchange, this compares to 2 IPOs which raised US$0.3b altogether in the first nine months o 2016. 2In the first nine months of 2016, there were no IPOs on Chile’s Santiago Stock Exchange. In Q2 2017, there were no IPOs on this exchange. 3In the first nine months of 2017, there were no IPOs on Argentina’s Buneos Aires Stock Exchange. In the first nine months of 2016, specifically in Q2 2016, there was 1 IPO that raised US$11.4m.
Global IPO Trends: Q3 2017 | Page 34**Data based on domicile of the exchange, regardless of the listed company domicile. Euronext includes Euronext (Amsterdam, Paris, Brussels and Lisbon); Shenzhen (SZSE) includes the Main Board, SME Board and ChiNext.
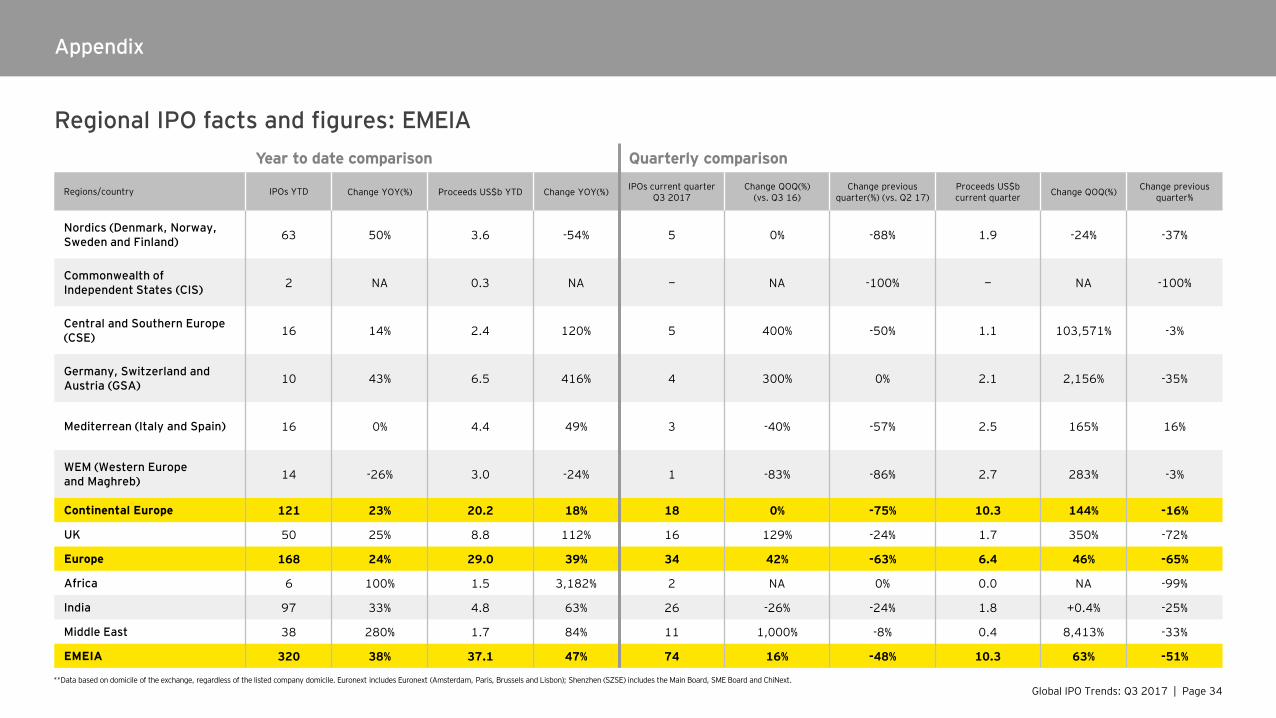
Regional IPO facts and figures: EMEIAYear to date comparison Quarterly comparison
Regions/country IPOs YTD Change YOY(%) Proceeds US$b YTD Change YOY(%) IPOs current quarter Q3 2017
Change QOQ(%) (vs. Q3 16)
Change previous quarter(%) (vs. Q2 17)
Proceeds US$bcurrent quarter Change QOQ(%) Change previous
quarter%
Nordics (Denmark, Norway, Sweden and Finland) 63 50% 3.6 -54% 5 0% -88% 1.9 -24% -37%
Commonwealth of Independent States (CIS) 2 NA 0.3 NA — NA -100% — NA -100%
Central and Southern Europe (CSE) 16 14% 2.4 120% 5 400% -50% 1.1 103,571% -3%
Germany, Switzerland and Austria (GSA) 10 43% 6.5 416% 4 300% 0% 2.1 2,156% -35%
Mediterrean (Italy and Spain) 16 0% 4.4 49% 3 -40% -57% 2.5 165% 16%
WEM (Western Europe and Maghreb) 14 -26% 3.0 -24% 1 -83% -86% 2.7 283% -3%
Continental Europe 121 23% 20.2 18% 18 0% -75% 10.3 144% -16%
UK 50 25% 8.8 112% 16 129% -24% 1.7 350% -72%
Europe 168 24% 29.0 39% 34 42% -63% 6.4 46% -65%
Africa 6 100% 1.5 3,182% 2 NA 0% 0.0 NA -99%
India 97 33% 4.8 63% 26 -26% -24% 1.8 +0.4% -25%
Middle East 38 280% 1.7 84% 11 1,000% -8% 0.4 8,413% -33%
EMEIA 320 38% 37.1 47% 74 16% -48% 10.3 63% -51%
Appendix
Global IPO Trends: Q3 2017 | Page 35**Data based on domicile of the exchange, regardless of the listed company domicile. Euronext includes Euronext (Amsterdam, Paris, Brussels and Lisbon); Shenzhen (SZSE) includes the Main Board, SME Board and ChiNext.
Appendix
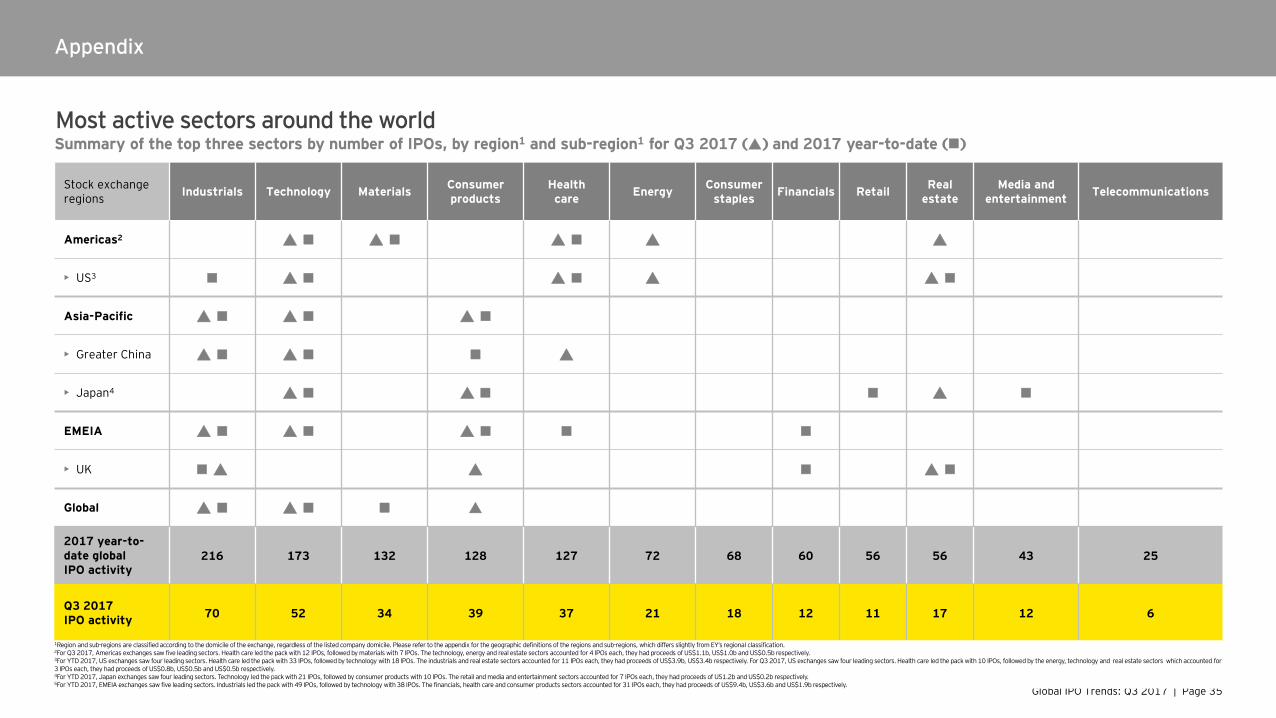
Most active sectors around the worldSummary of the top three sectors by number of IPOs, by region1 and sub-region1 for Q3 2017 () and 2017 year-to-date ()
Stock exchange regions Industrials Technology Materials Consumer
productsHealth care Energy Consumer
staples Financials Retail Real estate
Media and entertainment Telecommunications
Americas2
• US3
Asia-Pacific
• Greater China
• Japan4
EMEIA
• UK
Global
2017 year-to-date global IPO activity
216 173 132 128 127 72 68 60 56 56 43 25
Q3 2017 IPO activity 70 52 34 39 37 21 18 12 11 17 12 6
1Region and sub-regions are classified according to the domicile of the exchange, regardless of the listed company domicile. Please refer to the appendix for the geographic definitions of the regions and sub-regions, which differs slightly from EY’s regional classification.2For Q3 2017, Americas exchanges saw five leading sectors. Health care led the pack with 12 IPOs, followed by materials with 7 IPOs. The technology, energy and real estate sectors accounted for 4 IPOs each, they had proceeds of US$1.1b, US$1.0b and US$0.5b respectively.3For YTD 2017, US exchanges saw four leading sectors. Health care led the pack with 33 IPOs, followed by technology with 18 IPOs. The industrials and real estate sectors accounted for 11 IPOs each, they had proceeds of US$3.9b, US$3.4b respectively. For Q3 2017, US exchanges saw four leading sectors. Health care led the pack with 10 IPOs, followed by the energy, technology and real estate sectors which accounted for 3 IPOs each, they had proceeds of US$0.8b, US$0.5b and US$0.5b respectively.4For YTD 2017, Japan exchanges saw four leading sectors. Technology led the pack with 21 IPOs, followed by consumer products with 10 IPOs. The retail and media and entertainment sectors accounted for 7 IPOs each, they had proceeds of US1.2b and US$0.2b respectively.5For YTD 2017, EMEIA exchanges saw five leading sectors. Industrials led the pack with 49 IPOs, followed by technology with 38 IPOs. The financials, health care and consumer products sectors accounted for 31 IPOs each, they had proceeds of US$9.4b, US$3.6b and US$1.9b respectively.
Global IPO Trends: Q3 2017 | Page 36
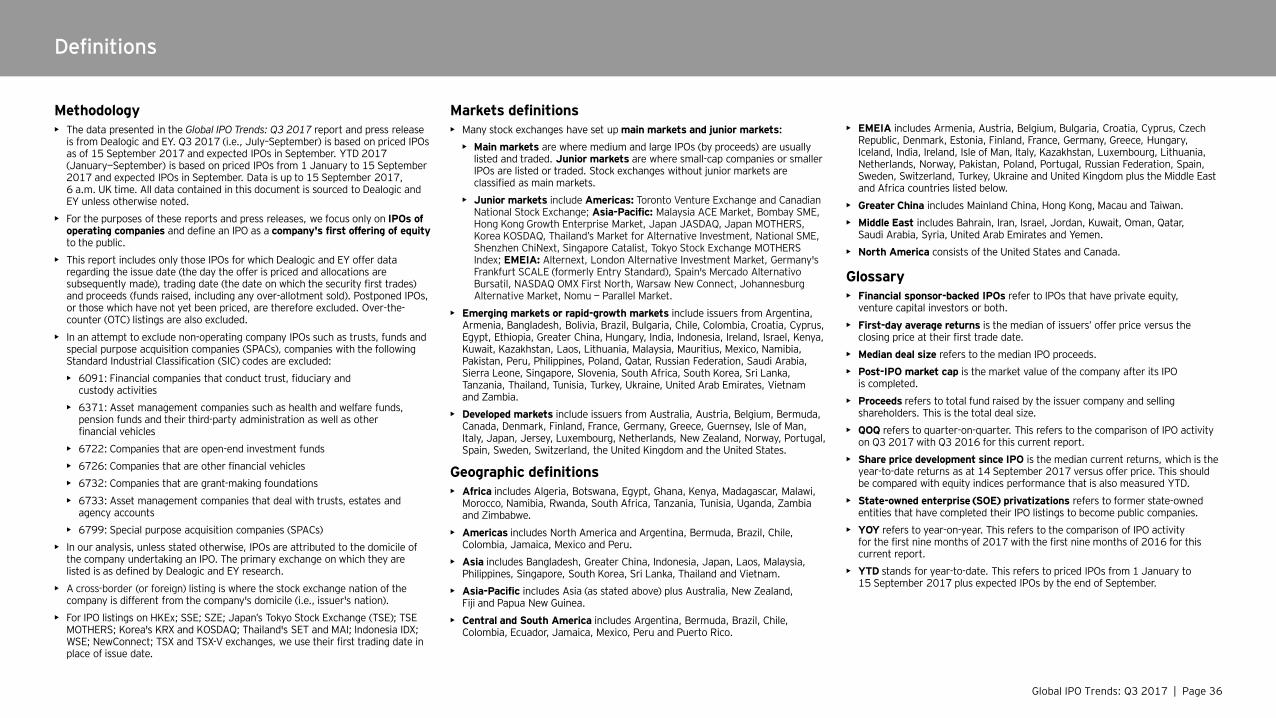
Definitions
Methodology• The data presented in the Global IPO Trends: Q3 2017 report and press release
is from Dealogic and EY. Q3 2017 (i.e., July–September) is based on priced IPOs as of 15 September 2017 and expected IPOs in September. YTD 2017 (January—September) is based on priced IPOs from 1 January to 15 September 2017 and expected IPOs in September. Data is up to 15 September 2017, 6 a.m. UK time. All data contained in this document is sourced to Dealogic and EY unless otherwise noted.
• For the purposes of these reports and press releases, we focus only on IPOs of operating companies and define an IPO as a company's first offering of equity to the public.
• This report includes only those IPOs for which Dealogic and EY offer data regarding the issue date (the day the offer is priced and allocations are subsequently made), trading date (the date on which the security first trades) and proceeds (funds raised, including any over-allotment sold). Postponed IPOs, or those which have not yet been priced, are therefore excluded. Over-the-counter (OTC) listings are also excluded.
• In an attempt to exclude non-operating company IPOs such as trusts, funds and special purpose acquisition companies (SPACs), companies with the following Standard Industrial Classification (SIC) codes are excluded:• 6091: Financial companies that conduct trust, fiduciary and
custody activities• 6371: Asset management companies such as health and welfare funds,
pension funds and their third-party administration as well as other financial vehicles
• 6722: Companies that are open-end investment funds• 6726: Companies that are other financial vehicles• 6732: Companies that are grant-making foundations• 6733: Asset management companies that deal with trusts, estates and
agency accounts• 6799: Special purpose acquisition companies (SPACs)
• In our analysis, unless stated otherwise, IPOs are attributed to the domicile of the company undertaking an IPO. The primary exchange on which they are listed is as defined by Dealogic and EY research.
• A cross-border (or foreign) listing is where the stock exchange nation of the company is different from the company's domicile (i.e., issuer's nation).
• For IPO listings on HKEx; SSE; SZE; Japan’s Tokyo Stock Exchange (TSE); TSE MOTHERS; Korea's KRX and KOSDAQ; Thailand's SET and MAI; Indonesia IDX; WSE; NewConnect; TSX and TSX-V exchanges, we use their first trading date in place of issue date.
Markets definitions• Many stock exchanges have set up main markets and junior markets:
• Main markets are where medium and large IPOs (by proceeds) are usually listed and traded. Junior markets are where small-cap companies or smaller IPOs are listed or traded. Stock exchanges without junior markets are classified as main markets.
• Junior markets include Americas: Toronto Venture Exchange and Canadian National Stock Exchange; Asia-Pacific: Malaysia ACE Market, Bombay SME, Hong Kong Growth Enterprise Market, Japan JASDAQ, Japan MOTHERS, Korea KOSDAQ, Thailand’s Market for Alternative Investment, National SME, Shenzhen ChiNext, Singapore Catalist, Tokyo Stock Exchange MOTHERS Index; EMEIA: Alternext, London Alternative Investment Market, Germany's Frankfurt SCALE (formerly Entry Standard), Spain's Mercado Alternativo Bursatil, NASDAQ OMX First North, Warsaw New Connect, Johannesburg Alternative Market, Nomu — Parallel Market.
• Emerging markets or rapid-growth markets include issuers from Argentina, Armenia, Bangladesh, Bolivia, Brazil, Bulgaria, Chile, Colombia, Croatia, Cyprus, Egypt, Ethiopia, Greater China, Hungary, India, Indonesia, Ireland, Israel, Kenya, Kuwait, Kazakhstan, Laos, Lithuania, Malaysia, Mauritius, Mexico, Namibia, Pakistan, Peru, Philippines, Poland, Qatar, Russian Federation, Saudi Arabia, Sierra Leone, Singapore, Slovenia, South Africa, South Korea, Sri Lanka, Tanzania, Thailand, Tunisia, Turkey, Ukraine, United Arab Emirates, Vietnam and Zambia.
• Developed markets include issuers from Australia, Austria, Belgium, Bermuda, Canada, Denmark, Finland, France, Germany, Greece, Guernsey, Isle of Man, Italy, Japan, Jersey, Luxembourg, Netherlands, New Zealand, Norway, Portugal, Spain, Sweden, Switzerland, the United Kingdom and the United States.
Geographic definitions• Africa includes Algeria, Botswana, Egypt, Ghana, Kenya, Madagascar, Malawi,
Morocco, Namibia, Rwanda, South Africa, Tanzania, Tunisia, Uganda, Zambia and Zimbabwe.
• Americas includes North America and Argentina, Bermuda, Brazil, Chile, Colombia, Jamaica, Mexico and Peru.
• Asia includes Bangladesh, Greater China, Indonesia, Japan, Laos, Malaysia, Philippines, Singapore, South Korea, Sri Lanka, Thailand and Vietnam.
• Asia-Pacific includes Asia (as stated above) plus Australia, New Zealand, Fiji and Papua New Guinea.
• Central and South America includes Argentina, Bermuda, Brazil, Chile, Colombia, Ecuador, Jamaica, Mexico, Peru and Puerto Rico.
• EMEIA includes Armenia, Austria, Belgium, Bulgaria, Croatia, Cyprus, Czech Republic, Denmark, Estonia, Finland, France, Germany, Greece, Hungary, Iceland, India, Ireland, Isle of Man, Italy, Kazakhstan, Luxembourg, Lithuania, Netherlands, Norway, Pakistan, Poland, Portugal, Russian Federation, Spain, Sweden, Switzerland, Turkey, Ukraine and United Kingdom plus the Middle East and Africa countries listed below.
• Greater China includes Mainland China, Hong Kong, Macau and Taiwan.• Middle East includes Bahrain, Iran, Israel, Jordan, Kuwait, Oman, Qatar,
Saudi Arabia, Syria, United Arab Emirates and Yemen.• North America consists of the United States and Canada.
Glossary• Financial sponsor-backed IPOs refer to IPOs that have private equity,
venture capital investors or both.• First-day average returns is the median of issuers’ offer price versus the
closing price at their first trade date.• Median deal size refers to the median IPO proceeds.• Post-IPO market cap is the market value of the company after its IPO
is completed.• Proceeds refers to total fund raised by the issuer company and selling
shareholders. This is the total deal size.• QOQ refers to quarter-on-quarter. This refers to the comparison of IPO activity
on Q3 2017 with Q3 2016 for this current report.• Share price development since IPO is the median current returns, which is the
year-to-date returns as at 14 September 2017 versus offer price. This should be compared with equity indices performance that is also measured YTD.
• State-owned enterprise (SOE) privatizations refers to former state-owned entities that have completed their IPO listings to become public companies.
• YOY refers to year-on-year. This refers to the comparison of IPO activity for the first nine months of 2017 with the first nine months of 2016 for this current report.
• YTD stands for year-to-date. This refers to priced IPOs from 1 January to 15 September 2017 plus expected IPOs by the end of September.
EY | Assurance | Tax | Transactions | AdvisoryAbout EY EY is a global leader in assurance, tax, transaction and advisory services. The insights and quality services we deliver help build trust and confidence in the capital markets and in economies the world over. We develop outstanding leaders who team to deliver on our promises to all of our stakeholders. In so doing, we play a critical role in building a better working world for our people, for our clients and for our communities.
EY refers to the global organization, and may refer to one or more, of the member firms of Ernst & Young Global Limited, each of which is a separate legal entity. Ernst & Young Global Limited, a UK company limited by guarantee, does not provide services to clients. For more information about our organization, please visit ey.com.
About EY’s Growth Markets NetworkEY’s worldwide Growth Markets Network is dedicated to serving the changing needs of high-growth companies. For more than 30 years, we’ve helped many of the world’s most dynamic and ambitious companies grow into market leaders. Whether working with international, mid-cap companies or early stage, venture backed businesses, our professionals draw upon their extensive experience, insight and global resources to help your business succeed. ey.com/growthmarkets
About EY’s Initial Public Offering ServicesEY is a leader in helping companies go public worldwide. With decades of experience, our global network is dedicated to serving market leaders and helping businesses evaluate the pros and cons of an initial public offering (IPO). We demystify the process by offering IPO readiness assessments, IPO preparation, project management and execution services, all of which help prepare you for life in the public spotlight. Our Global IPO Center of Excellence is a virtual hub, which provides access to our IPO knowledge, tools, thought leadership and contacts from around the world in one easy-to-use source.ey.com/ipocenter
© 2017 EYGM Limited. All Rights Reserved.
1709-2409384
EYG no. 05460-173Gbl
ED NoneThis material has been prepared for general information purposes only and is not intended to be relied upon as accounting, tax or other professional advice. Please refer to your advisors for specific advice.
ContactsDr. Martin SteinbachEY Global and EMEIA IPO [email protected]
Jackie KelleyEY Americas IPO Markets [email protected]
Ringo ChoiEY Asia-Pacific IPO [email protected]
Terence HoEY Greater China IPO [email protected]
Shinichiro SuzukiEY Japan IPO [email protected]
Scott McCubbinEY UK and Ireland IPO [email protected]
Find out more about future IPO prospectsFor more information on global IPO performance by quarter and year, and how the IPO market looks set to develop for the next 12 months, visit the EY Global IPO website:ey.com/ipocenter
ey.com/ipocenter