Embed Size (px)
Citation preview
152 Los Alamos Science Number 28 2003
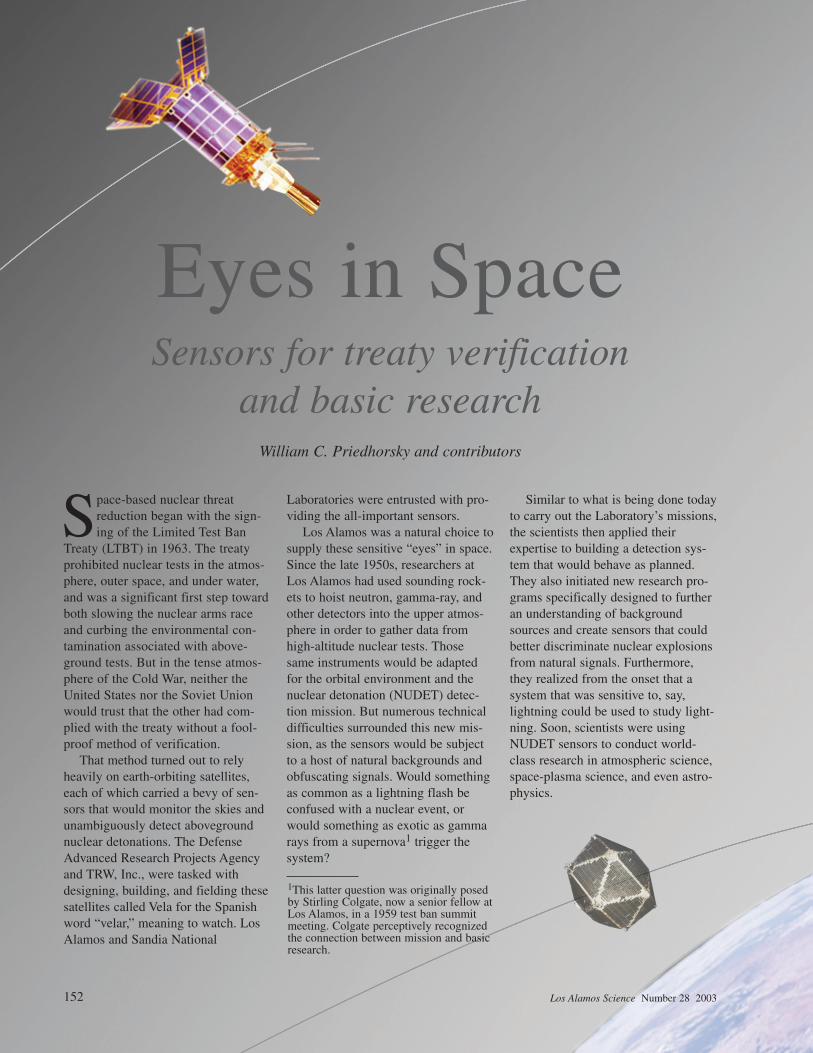
Space-based nuclear threatreduction began with the sign-ing of the Limited Test Ban
Treaty (LTBT) in 1963. The treatyprohibited nuclear tests in the atmos-phere, outer space, and under water,and was a significant first step towardboth slowing the nuclear arms raceand curbing the environmental con-tamination associated with above-ground tests. But in the tense atmos-phere of the Cold War, neither theUnited States nor the Soviet Unionwould trust that the other had com-plied with the treaty without a fool-proof method of verification.
That method turned out to relyheavily on earth-orbiting satellites,each of which carried a bevy of sen-sors that would monitor the skies andunambiguously detect abovegroundnuclear detonations. The DefenseAdvanced Research Projects Agencyand TRW, Inc., were tasked withdesigning, building, and fielding thesesatellites called Vela for the Spanishword “velar,” meaning to watch. LosAlamos and Sandia National
Laboratories were entrusted with pro-viding the all-important sensors.
Los Alamos was a natural choice tosupply these sensitive “eyes” in space.Since the late 1950s, researchers atLos Alamos had used sounding rock-ets to hoist neutron, gamma-ray, andother detectors into the upper atmos-phere in order to gather data fromhigh-altitude nuclear tests. Thosesame instruments would be adaptedfor the orbital environment and thenuclear detonation (NUDET) detec-tion mission. But numerous technicaldifficulties surrounded this new mis-sion, as the sensors would be subjectto a host of natural backgrounds andobfuscating signals. Would somethingas common as a lightning flash beconfused with a nuclear event, orwould something as exotic as gammarays from a supernova1 trigger thesystem?
Similar to what is being done todayto carry out the Laboratory’s missions,the scientists then applied theirexpertise to building a detection sys-tem that would behave as planned.They also initiated new research pro-grams specifically designed to furtheran understanding of backgroundsources and create sensors that couldbetter discriminate nuclear explosionsfrom natural signals. Furthermore,they realized from the onset that asystem that was sensitive to, say,lightning could be used to study light-ning. Soon, scientists were usingNUDET sensors to conduct world-class research in atmospheric science,space-plasma science, and even astro-physics.
Eyes in Space Sensors for treaty verification
and basic research
1This latter question was originally posedby Stirling Colgate, now a senior fellow atLos Alamos, in a 1959 test ban summitmeeting. Colgate perceptively recognizedthe connection between mission and basicresearch.
William C. Priedhorsky and contributors
Number 28 2003 Los Alamos Science 153
Los Alamos detectors have sincejourneyed over the poles of the sun,probed two comets, and flown to sev-eral planets to gather data for basicresearch. In turn, these highly visiblespace missions aid our nation’s threatreduction efforts. Consider, for exam-ple, the recent discovery of water onMars, discussed in more detail in thesidebar “Geochemical Studies of theMoon and Planets” on page 166.Scientists announced this find afteranalyzing the neutrons coming fromthe Red Planet. Because they are gen-erated by cosmic rays bombarding theMartian surface, the neutrons have aknown energy spectrum, whichbecomes slightly distorted if they col-lide with water molecules. Thosespectral distortions were “seen” by thehighly advanced neutron spectrometeron the orbiting Mars Odyssey satel-lite. While the discovery of water onMars justly fuels the public’s imagina-tion and promotes basic research, italso reminds other nations of theUnited States’ remarkable capabilitiesin neutron detection, in case anynation needs reminding.
NUDET detection for treaty verifi-cation and situational awarenessremains a Los Alamos mission. Theradiation detection system on the AirForce’s Defense Support Program(DSP) satellites and the GlobalPositioning System (GPS) satellites—the same satellites that give ushand-held navigation—are being usedfor NUDET detection. The last DSPsatellite will be launched in 2003 or2004, after which the next generationof GPS satellites, and perhaps anothersystem, will carry on the mission.
The end of the Cold War, however,changed the world. We needed toassess the capabilities of aspiring
nuclear states long before any bombwas detonated and to address prob-lems of nuclear materials control andinternational terrorism. This broaderconcept of nuclear threat reductionrequired new sensing capabilities: newsmall satellites for space observations,new sensors to monitor effluentstreams from factories and powerplants, portable sensors for materialstrafficking, and sensors that couldoperate in cyberspace to detect subtlepatterns and connections in largemasses of data. Like the NUDET sys-tems, these advanced technologiesdouble as research tools and have ledto more discoveries of our planet, thesolar system, and the cosmos.
Space-Based Nuclear EventDetection
Remote detection of nuclear explo-sions is accomplished with sensorsthat measure the different forms ofenergy coming from the weapon.Neutrons, gamma rays, and x-rays areemitted promptly within about 2 mil-liseconds of the detonation. Thoseradiations then interact with their sur-roundings to produce secondary radia-tions, including visible light and elec-tromagnetic pulses (EMPs), in the partof the radio-frequency (rf) band belowa few hundred megahertz. Delayedgamma rays and neutrons also come
from the nuclear debris. Both theprompt and delayed radiations can bedetected by satellite-borne sensors:bhangmeters2 for detection of opticalsignals, very high frequency (VHF)radio receivers for measurement of theEMP, plus neutron, gamma-ray, andx-ray detectors.
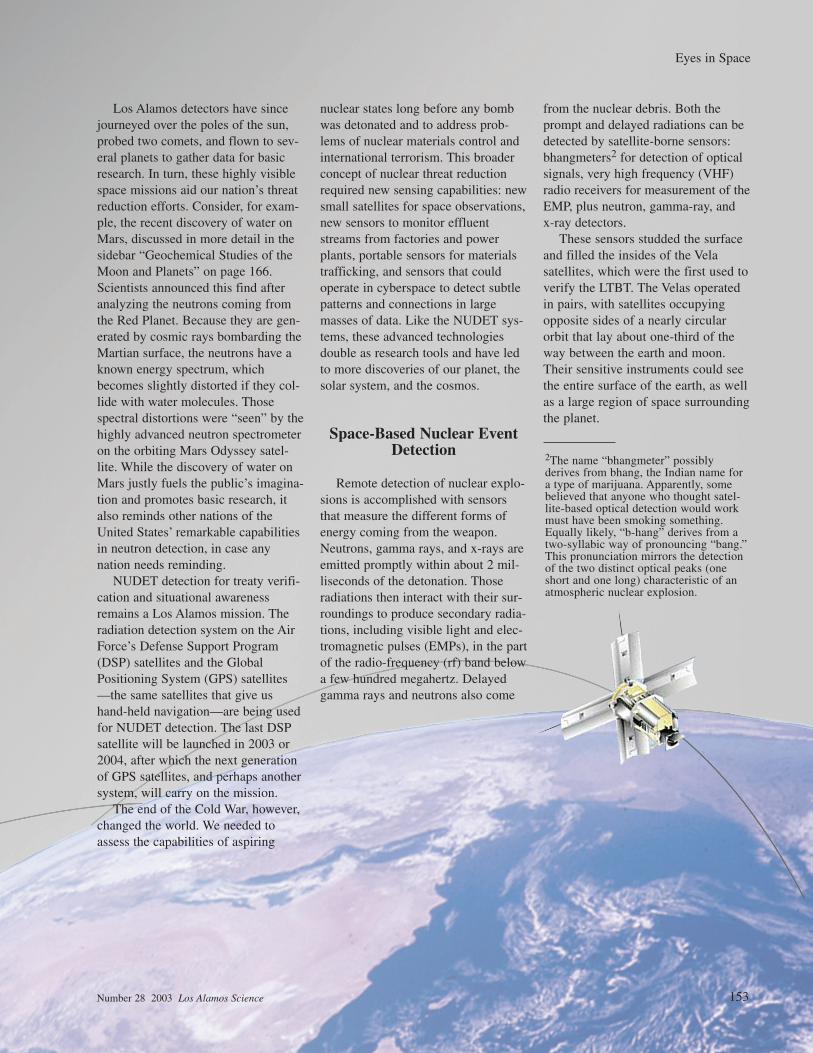
These sensors studded the surfaceand filled the insides of the Velasatellites, which were the first used toverify the LTBT. The Velas operatedin pairs, with satellites occupyingopposite sides of a nearly circularorbit that lay about one-third of theway between the earth and moon.Their sensitive instruments could seethe entire surface of the earth, as wellas a large region of space surroundingthe planet.
2The name “bhangmeter” possiblyderives from bhang, the Indian name fora type of marijuana. Apparently, somebelieved that anyone who thought satel-lite-based optical detection would workmust have been smoking something.Equally likely, “b-hang” derives from atwo-syllabic way of pronouncing “bang.”This pronunciation mirrors the detectionof the two distinct optical peaks (oneshort and one long) characteristic of anatmospheric nuclear explosion.
Eyes in Space
All told, six pairs of Vela satelliteswere launched between 1963 and1969. The initial pair (Vela 1 and 2)carried only x-ray, neutron, andgamma-ray detectors. These wouldsee any events that occurred high inthe atmosphere (above about 30 kilo-meters) and also in space (seeFigure 1). Even a detonation on thefar side of the moon would be detect-ed because the nuclear blast wouldexpel a gamma-ray-emitting cloud ofdebris that would quickly be seen.
These first detectors were used as
much for system shakedown as fortreaty verification. Far from beingempty, the space between the sun andthe earth is filled with charged parti-cles that boil from the sun’s surfaceand stream through the solar system atsupersonic speeds (the solar wind).Interactions between the solar windand the earth’s magnetic field create atenuous and highly variable plasma,known as the magnetosphere, whichsurrounds the earth. The Velas’ orbitwould carry them through the magne-tosphere, but in 1963, little was
known about that plasma region orabout the effects of that region on sen-sitive instruments. (The Velas werealso subject to hostile cosmic radia-tion, which comes from outside thesolar system. Thus, many skepticsgave the instruments no more thantwo weeks to live. But most instru-ments lasted well beyond their designlifetime of six months; some, for aslong as a decade.)
Adopting a bootstrap approach,scientists used the data from the firstVela satellites to design new types of
154 Los Alamos Science Number 28 2003
Eyes in Space
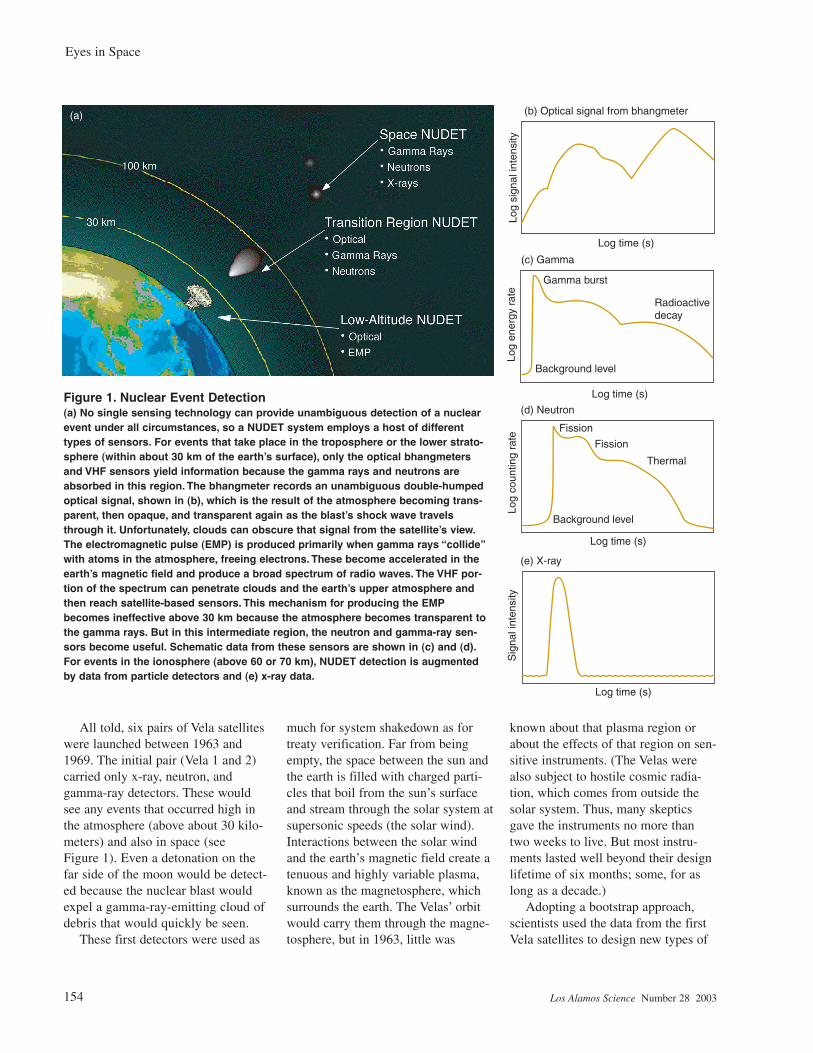
Figure 1. Nuclear Event Detection (a) No single sensing technology can provide unambiguous detection of a nuclearevent under all circumstances, so a NUDET system employs a host of differenttypes of sensors. For events that take place in the troposphere or the lower strato-sphere (within about 30 km of the earth’s surface), only the optical bhangmetersand VHF sensors yield information because the gamma rays and neutrons areabsorbed in this region. The bhangmeter records an unambiguous double-humpedoptical signal, shown in (b), which is the result of the atmosphere becoming trans-parent, then opaque, and transparent again as the blast’s shock wave travelsthrough it. Unfortunately, clouds can obscure that signal from the satellite’s view.The electromagnetic pulse (EMP) is produced primarily when gamma rays “collide”with atoms in the atmosphere, freeing electrons. These become accelerated in theearth’s magnetic field and produce a broad spectrum of radio waves. The VHF por-tion of the spectrum can penetrate clouds and the earth’s upper atmosphere andthen reach satellite-based sensors. This mechanism for producing the EMPbecomes ineffective above 30 km because the atmosphere becomes transparent tothe gamma rays. But in this intermediate region, the neutron and gamma-ray sen-sors become useful. Schematic data from these sensors are shown in (c) and (d).For events in the ionosphere (above 60 or 70 km), NUDET detection is augmentedby data from particle detectors and (e) x-ray data.
(b) Optical signal from bhangmeter
Log
sign
al in
tens
ity
Log time (s)
(c) Gamma
Gamma burst
Background level
Radioactivedecay
Log
ener
gy r
ate
Log time (s)
(d) Neutron
Fission
Fission
Thermal
Background level
Log time (s)
Log
coun
ting
rate
Sig
nal i
nten
sity
(e) X-ray
Log time (s)
(a)
sensors that would monitor the plasmabackground and track particle fluxesthat could cause false signals in theother detectors. These plasma andenergetic-particle sensors, plus bhang-meters and VHF sensors that couldidentify explosions that took place inthe lower atmosphere (refer toFigure 1), were fielded along with theother detectors on the Vela 3 through6 satellites. The last three pairs ofsatellites (officially known asAdvanced Velas) carried improvedNUDET systems, plus sensors thatmonitored solar activity, terrestriallightning, and celestial x-rays andgamma rays.
As a series, the Velas workedsuperbly and were widely consideredto have seen every abovegroundnuclear explosion that was within theirfield of view. They established thebenchmark for surveillance capability,but their legacy was also one of scien-tific discoveries. As discussed later inthis article, much of our early data onthe solar wind was obtained by theVelas’ particle detectors, whereas theirgamma-ray detectors were the first toobserve cosmic gamma-ray bursts, anentirely unknown phenomenon thatopened a new doorway into theobservable universe.
Starting in the 1970s, the Air ForceDSP satellites began carrying NUDETsystems, which were continuallyupgraded for sensitivity, dynamicrange, and background rejection. Butthe basic instruments remained thesame as those on Vela, even thoughextending system capabilities into theextreme ultraviolet (soft x-ray) and rfbands had always been a goal. By thelate 1980s, we had concepts for newsensors to operate in those extendedfrequency bands.
Unfortunately, these new devicespresented us with a problem. Whilewe could verify their operation in thelaboratory, in space they would besubject to large and poorly understoodbackgrounds. We needed to test them
The Little Satellite That Could
Diane Roussel-Dupré
The two years 1985 and 1986 were bad ones for the U.S. space program.Three major launches failed, and on January 28, 1986, the space shuttleChallenger exploded in full view of the entire world. These calamitous failuresstopped all U.S. space launches formore than a year and left the spacecommunity cautious and conservative.
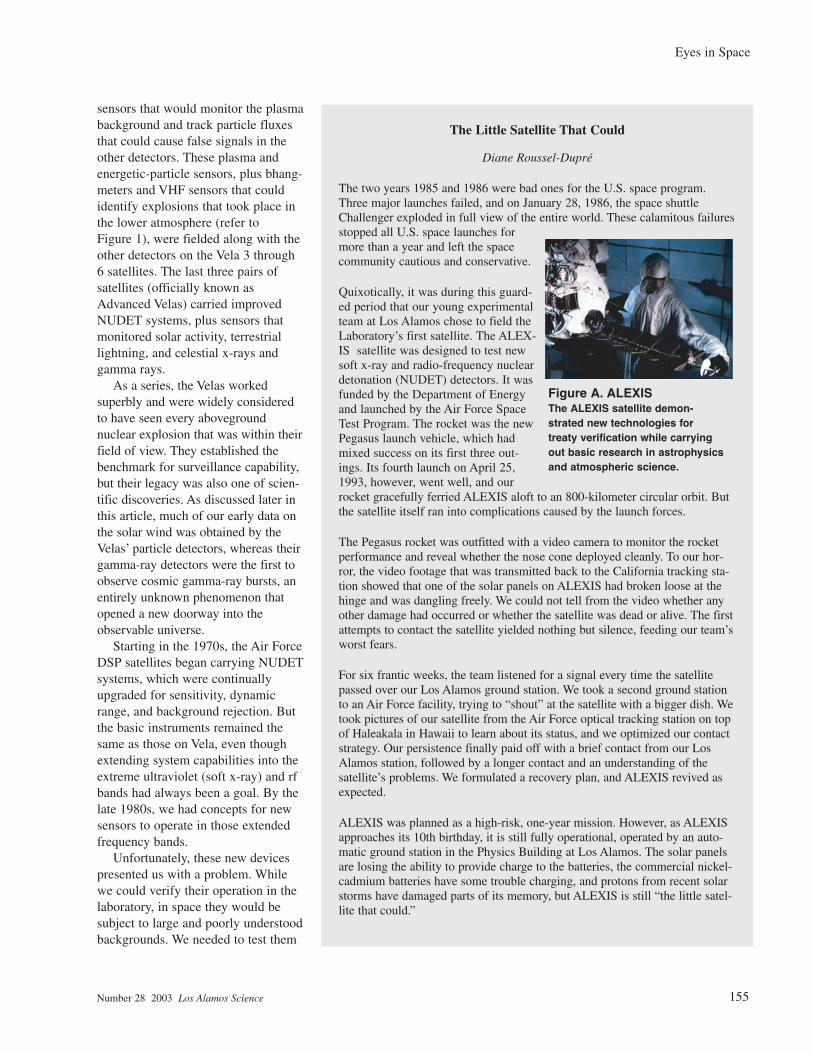
Quixotically, it was during this guard-ed period that our young experimentalteam at Los Alamos chose to field theLaboratory’s first satellite. The ALEX-IS satellite was designed to test newsoft x-ray and radio-frequency nucleardetonation (NUDET) detectors. It wasfunded by the Department of Energyand launched by the Air Force SpaceTest Program. The rocket was the newPegasus launch vehicle, which hadmixed success on its first three out-ings. Its fourth launch on April 25,1993, however, went well, and ourrocket gracefully ferried ALEXIS aloft to an 800-kilometer circular orbit. Butthe satellite itself ran into complications caused by the launch forces.
The Pegasus rocket was outfitted with a video camera to monitor the rocketperformance and reveal whether the nose cone deployed cleanly. To our hor-ror, the video footage that was transmitted back to the California tracking sta-tion showed that one of the solar panels on ALEXIS had broken loose at thehinge and was dangling freely. We could not tell from the video whether anyother damage had occurred or whether the satellite was dead or alive. The firstattempts to contact the satellite yielded nothing but silence, feeding our team’sworst fears.
For six frantic weeks, the team listened for a signal every time the satellitepassed over our Los Alamos ground station. We took a second ground stationto an Air Force facility, trying to “shout” at the satellite with a bigger dish. Wetook pictures of our satellite from the Air Force optical tracking station on topof Haleakala in Hawaii to learn about its status, and we optimized our contactstrategy. Our persistence finally paid off with a brief contact from our LosAlamos station, followed by a longer contact and an understanding of thesatellite’s problems. We formulated a recovery plan, and ALEXIS revived asexpected.
ALEXIS was planned as a high-risk, one-year mission. However, as ALEXISapproaches its 10th birthday, it is still fully operational, operated by an auto-matic ground station in the Physics Building at Los Alamos. The solar panelsare losing the ability to provide charge to the batteries, the commercial nickel-cadmium batteries have some trouble charging, and protons from recent solarstorms have damaged parts of its memory, but ALEXIS is still “the little satel-lite that could.”
Number 28 2003 Los Alamos Science 155
Eyes in Space
Figure A. ALEXISThe ALEXIS satellite demon-strated new technologies fortreaty verification while carryingout basic research in astrophysicsand atmospheric science.
in space, but unproved instrumentscould not be deployed on a commer-cial or military satellite—the cost offailure was too high.
Unable to fly these sensors onsomeone else’s satellite, we chose tofly them on our own. We assembled asmall, dedicated team to design andbuild Los Alamos’ first satellite andcalled in Sandia National Laboratoriesand AeroAstro, Inc., a start-up smallsatellite company, to help. NamedALEXIS (for array of low-energy x-ray imaging sensors), our satellite waslaunched in 1993. The first of the“faster, cheaper, better” satellites, itssophisticated design included a noveluplink/downlink protocol, similar tothe file transfer protocol used on theInternet, which allowed us to havevery simple, inexpensive antennae on
the spacecraft and on the ground andto run the satellite almostautonomously. ALEXIS was the firstsatellite for which the weight and vol-ume of the scientific payload wasgreater than the nonpayload (batteries,solar panels, structural components,and others) remainder of the space-craft, and was one of the first to usecomputer memory instead of a taperecorder for data storage. After asomewhat shaky start—recounted inthe box “The Little Satellite ThatCould” on page 155—it performedbeautifully.
ALEXIS carried a set of soft x-rayimaging telescopes and an rf receiver,called Blackbeard, that was intendedto help us understand lightningevents. Lightning is a common back-ground for our VHF sensors because
the intense electrical discharge pro-duces a burst of rf noise that canmimic the nuclear EMP. The flip sideis that our VHF/EMP sensors areexcellent lightning detectors that canbe used for basic research.Blackbeard, for example, enhancedour understanding of how the iono-sphere modifies lightning-induced rfpulses that pass through it and, in thecourse of its operation, discoveredTIPPs (for transionospheric pulsepairs), or doublets of brief, transientrf events that form in energetic thun-derstorms at 8 to 10 kilometers abovethe earth’s surface.
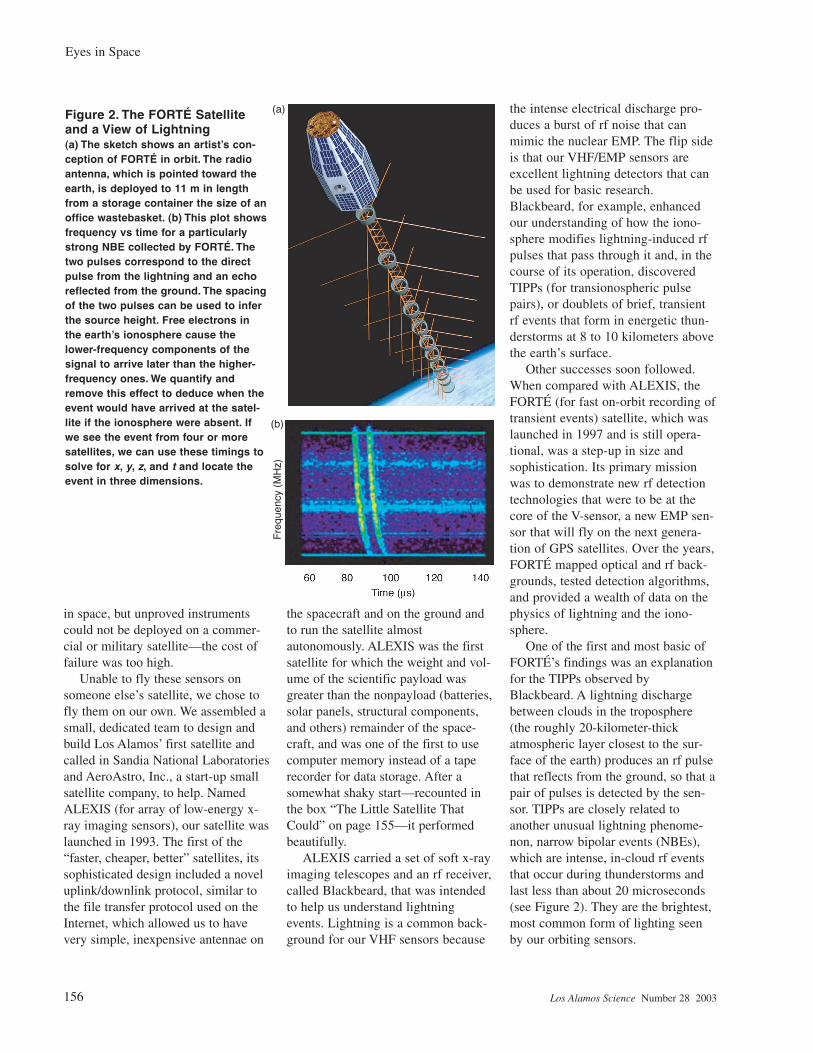
Other successes soon followed.When compared with ALEXIS, theFORTÉ (for fast on-orbit recording oftransient events) satellite, which waslaunched in 1997 and is still opera-tional, was a step-up in size andsophistication. Its primary missionwas to demonstrate new rf detectiontechnologies that were to be at thecore of the V-sensor, a new EMP sen-sor that will fly on the next genera-tion of GPS satellites. Over the years,FORTÉ mapped optical and rf back-grounds, tested detection algorithms,and provided a wealth of data on thephysics of lightning and the iono-sphere.
One of the first and most basic ofFORTÉ’s findings was an explanationfor the TIPPs observed byBlackbeard. A lightning dischargebetween clouds in the troposphere(the roughly 20-kilometer-thickatmospheric layer closest to the sur-face of the earth) produces an rf pulsethat reflects from the ground, so that apair of pulses is detected by the sen-sor. TIPPs are closely related toanother unusual lightning phenome-non, narrow bipolar events (NBEs),which are intense, in-cloud rf eventsthat occur during thunderstorms andlast less than about 20 microseconds(see Figure 2). They are the brightest,most common form of lighting seenby our orbiting sensors.
156 Los Alamos Science Number 28 2003
Eyes in Space
Figure 2. The FORTÉ Satelliteand a View of Lightning (a) The sketch shows an artist’s con-ception of FORTÉ in orbit. The radioantenna, which is pointed toward theearth, is deployed to 11 m in lengthfrom a storage container the size of anoffice wastebasket. (b) This plot showsfrequency vs time for a particularlystrong NBE collected by FORTÉ. Thetwo pulses correspond to the directpulse from the lightning and an echoreflected from the ground. The spacingof the two pulses can be used to inferthe source height. Free electrons inthe earth’s ionosphere cause thelower-frequency components of thesignal to arrive later than the higher-frequency ones. We quantify andremove this effect to deduce when theevent would have arrived at the satel-lite if the ionosphere were absent. Ifwe see the event from four or moresatellites, we can use these timings tosolve for x, y, z, and t and locate theevent in three dimensions.
Fre
quen
cy (
MH
z)
(a)
(b)
As it turns out, the occurrence rateand source height of NBEs are excel-lent statistical indicators of the deepconvective strength of the parentstorm. Deep convection, or convec-tion between the lower and upper tro-posphere, is the driving mechanismfor several forms of severe weatheron the earth and is a primary meansby which energy—in the form oflatent heat—drives the large-scaleatmospheric circulation. It is also theprimary means by which the atmos-phere injects water into the strato-sphere, where it profoundly influ-ences the radiative and chemical bal-ance of the atmosphere. Once the newV-sensor is in orbit, we will be ableto use its data to map atmosphericdeep convective processes in a near-real-time, global manner, particularlyover oceanic regions where weatherradar coverage is limited. Such mapswill be used to support commercialand military aviation.
Advanced Systems. Although weare still advancing the science ofnuclear event detection, the alarmingrise of nuclear-capable states in thewaning years of the twentieth centurycalled for an expanded mission. Weneeded to develop surveillance sys-tems that could be used for detectingand characterizing facilities that mightbe producing weapons of massdestruction. But gleaning informationabout an unknown facility is far moredifficult than gleaning the specifics ofa nuclear blast. The latter presents awell-defined signature of gammas,neutrons, and electromagnetic radia-tions, whereas the former oftentimespresents a patchwork of subtle signalsthat make sense only after detailedanalysis. In general, a modern surveil-lance system will take images at sev-eral wavelengths, or spectral bands.Unfortunately, interpreting and piec-ing together the spectral informationis often hindered by uncertainties in
the spectral calibration and by aninability to fully compensate foratmospheric effects.
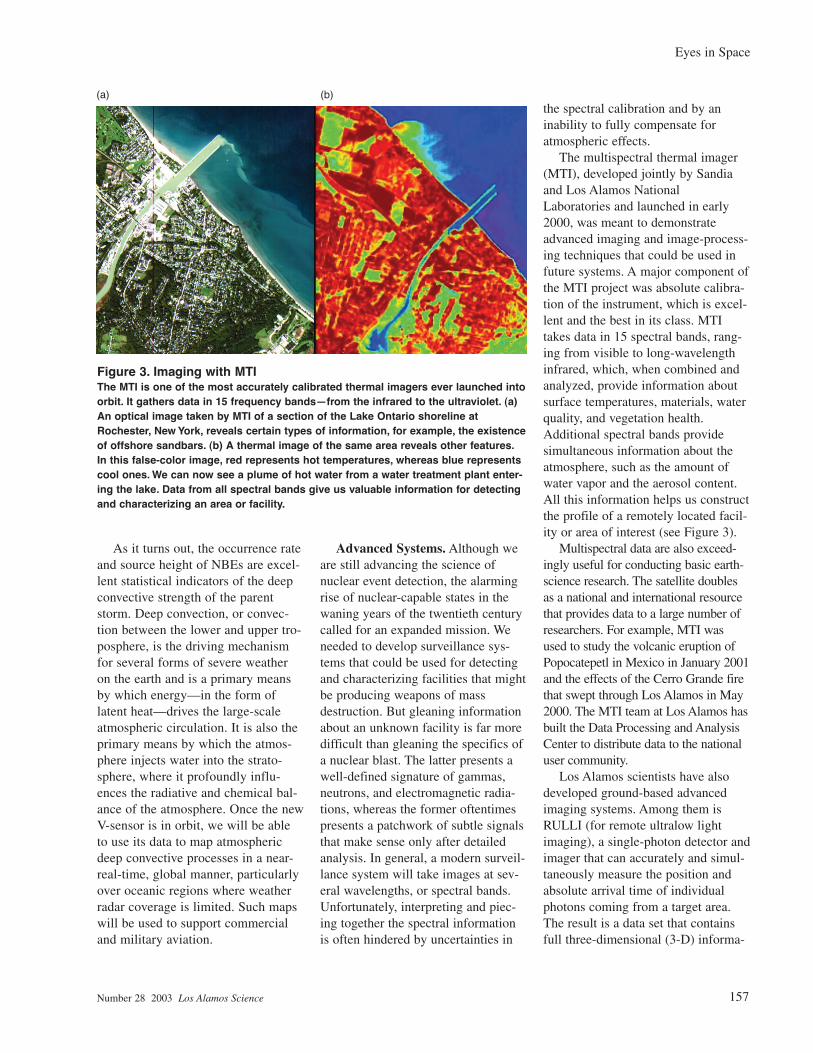
The multispectral thermal imager(MTI), developed jointly by Sandiaand Los Alamos NationalLaboratories and launched in early2000, was meant to demonstrateadvanced imaging and image-process-ing techniques that could be used infuture systems. A major component ofthe MTI project was absolute calibra-tion of the instrument, which is excel-lent and the best in its class. MTItakes data in 15 spectral bands, rang-ing from visible to long-wavelengthinfrared, which, when combined andanalyzed, provide information aboutsurface temperatures, materials, waterquality, and vegetation health.Additional spectral bands providesimultaneous information about theatmosphere, such as the amount ofwater vapor and the aerosol content.All this information helps us constructthe profile of a remotely located facil-ity or area of interest (see Figure 3).
Multispectral data are also exceed-ingly useful for conducting basic earth-science research. The satellite doublesas a national and international resourcethat provides data to a large number ofresearchers. For example, MTI wasused to study the volcanic eruption ofPopocatepetl in Mexico in January 2001and the effects of the Cerro Grande firethat swept through Los Alamos in May2000. The MTI team at Los Alamos hasbuilt the Data Processing and AnalysisCenter to distribute data to the nationaluser community.
Los Alamos scientists have alsodeveloped ground-based advancedimaging systems. Among them isRULLI (for remote ultralow lightimaging), a single-photon detector andimager that can accurately and simul-taneously measure the position andabsolute arrival time of individualphotons coming from a target area.The result is a data set that containsfull three-dimensional (3-D) informa-
Number 28 2003 Los Alamos Science 157
Eyes in Space
Figure 3. Imaging with MTIThe MTI is one of the most accurately calibrated thermal imagers ever launched intoorbit. It gathers data in 15 frequency bands—from the infrared to the ultraviolet. (a)An optical image taken by MTI of a section of the Lake Ontario shoreline atRochester, New York, reveals certain types of information, for example, the existenceof offshore sandbars. (b) A thermal image of the same area reveals other features.In this false-color image, red represents hot temperatures, whereas blue representscool ones. We can now see a plume of hot water from a water treatment plant enter-ing the lake. Data from all spectral bands give us valuable information for detectingand characterizing an area or facility.
(a) (b)
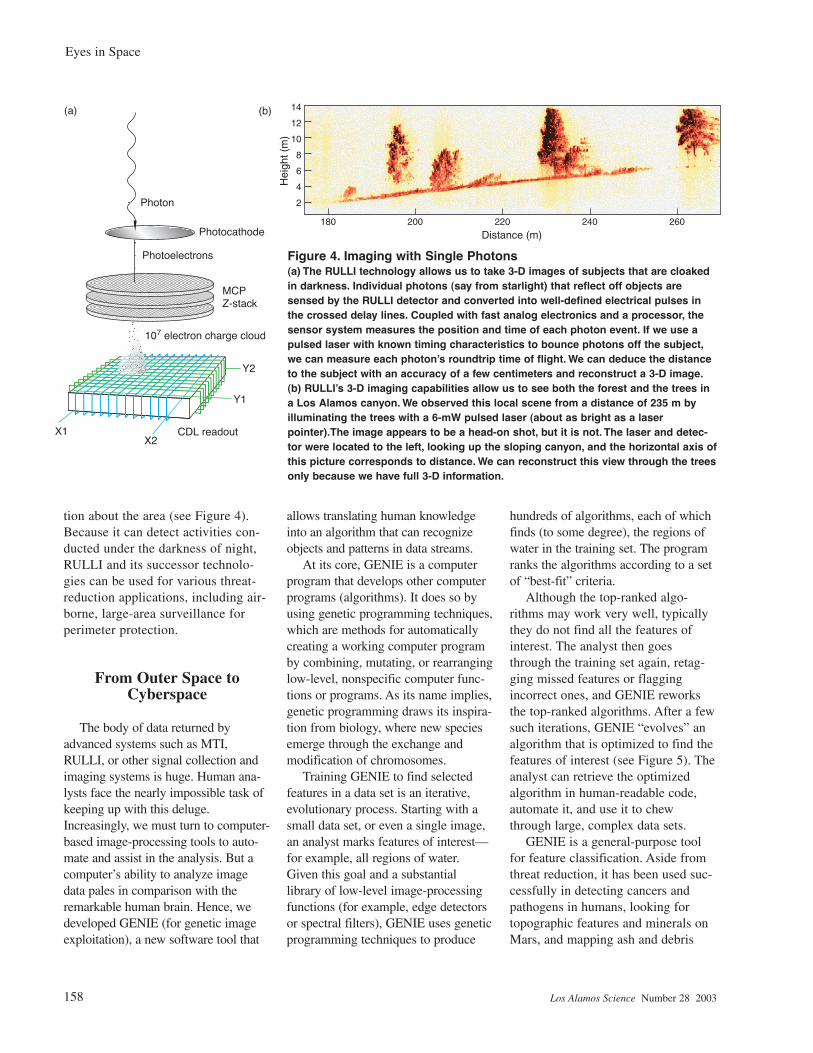
tion about the area (see Figure 4).Because it can detect activities con-ducted under the darkness of night,RULLI and its successor technolo-gies can be used for various threat-reduction applications, including air-borne, large-area surveillance forperimeter protection.
From Outer Space toCyberspace
The body of data returned byadvanced systems such as MTI,RULLI, or other signal collection andimaging systems is huge. Human ana-lysts face the nearly impossible task ofkeeping up with this deluge.Increasingly, we must turn to computer-based image-processing tools to auto-mate and assist in the analysis. But acomputer’s ability to analyze imagedata pales in comparison with theremarkable human brain. Hence, wedeveloped GENIE (for genetic imageexploitation), a new software tool that
allows translating human knowledgeinto an algorithm that can recognizeobjects and patterns in data streams.
At its core, GENIE is a computerprogram that develops other computerprograms (algorithms). It does so byusing genetic programming techniques,which are methods for automaticallycreating a working computer programby combining, mutating, or rearranginglow-level, nonspecific computer func-tions or programs. As its name implies,genetic programming draws its inspira-tion from biology, where new speciesemerge through the exchange andmodification of chromosomes.
Training GENIE to find selectedfeatures in a data set is an iterative,evolutionary process. Starting with asmall data set, or even a single image,an analyst marks features of interest—for example, all regions of water.Given this goal and a substantiallibrary of low-level image-processingfunctions (for example, edge detectorsor spectral filters), GENIE uses geneticprogramming techniques to produce
hundreds of algorithms, each of whichfinds (to some degree), the regions ofwater in the training set. The programranks the algorithms according to a setof “best-fit” criteria.
Although the top-ranked algo-rithms may work very well, typicallythey do not find all the features ofinterest. The analyst then goesthrough the training set again, retag-ging missed features or flaggingincorrect ones, and GENIE reworksthe top-ranked algorithms. After a fewsuch iterations, GENIE “evolves” analgorithm that is optimized to find thefeatures of interest (see Figure 5). Theanalyst can retrieve the optimizedalgorithm in human-readable code,automate it, and use it to chewthrough large, complex data sets.
GENIE is a general-purpose toolfor feature classification. Aside fromthreat reduction, it has been used suc-cessfully in detecting cancers andpathogens in humans, looking fortopographic features and minerals onMars, and mapping ash and debris
158 Los Alamos Science Number 28 2003
Eyes in Space
14
12
10
8
6
4
2
180 200 220
Distance (m)
Hei
ght (
m)
240 260
Figure 4. Imaging with Single Photons(a) The RULLI technology allows us to take 3-D images of subjects that are cloakedin darkness. Individual photons (say from starlight) that reflect off objects aresensed by the RULLI detector and converted into well-defined electrical pulses inthe crossed delay lines. Coupled with fast analog electronics and a processor, thesensor system measures the position and time of each photon event. If we use apulsed laser with known timing characteristics to bounce photons off the subject,we can measure each photon’s roundtrip time of flight. We can deduce the distanceto the subject with an accuracy of a few centimeters and reconstruct a 3-D image.(b) RULLI’s 3-D imaging capabilities allow us to see both the forest and the trees ina Los Alamos canyon. We observed this local scene from a distance of 235 m byilluminating the trees with a 6-mW pulsed laser (about as bright as a laserpointer).The image appears to be a head-on shot, but it is not. The laser and detec-tor were located to the left, looking up the sloping canyon, and the horizontal axis ofthis picture corresponds to distance. We can reconstruct this view through the treesonly because we have full 3-D information.
X1X2
Y1
Y2
Photon
Photocathode
Photoelectrons
MCPZ-stack
107 electron charge cloud
CDL readout
(a) (b)
from the World Trade Center after theNew York City terrorist attack.
Whereas GENIE enables us to cre-ate optimized software, meeting thedemands of our expanding threat-reduction mission means optimizinghardware as well. We need to couplea sensor directly to a processor andhave the system shoulder much of thereal-time data analysis. Unfortunately,in trying to build such a system, wequickly run into size and powerrestrictions. A general-purpose pro-cessing board wastes valuable pro-cessing power and real estate becauseit provides capabilities that are extra-neous to our purposes. Our data prob-lems are so supersized that we needevery hardware gate to be dedicatedto solving our task. Field-programma-ble gate arrays (FPGAs) deliver thiscapability.
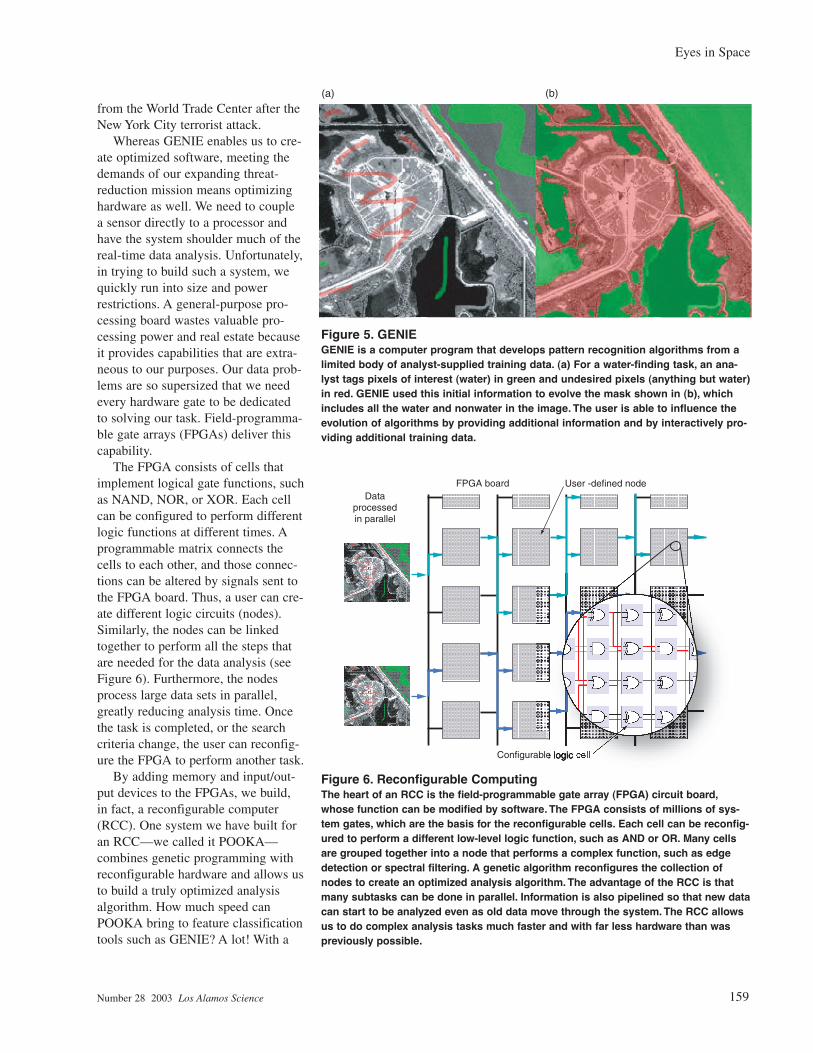
The FPGA consists of cells thatimplement logical gate functions, suchas NAND, NOR, or XOR. Each cellcan be configured to perform differentlogic functions at different times. Aprogrammable matrix connects thecells to each other, and those connec-tions can be altered by signals sent tothe FPGA board. Thus, a user can cre-ate different logic circuits (nodes).Similarly, the nodes can be linkedtogether to perform all the steps thatare needed for the data analysis (seeFigure 6). Furthermore, the nodesprocess large data sets in parallel,greatly reducing analysis time. Oncethe task is completed, or the searchcriteria change, the user can reconfig-ure the FPGA to perform another task.
By adding memory and input/out-put devices to the FPGAs, we build,in fact, a reconfigurable computer(RCC). One system we have built foran RCC—we called it POOKA—combines genetic programming withreconfigurable hardware and allows usto build a truly optimized analysisalgorithm. How much speed canPOOKA bring to feature classificationtools such as GENIE? A lot! With a
Number 28 2003 Los Alamos Science 159
Eyes in Space
Figure 5. GENIEGENIE is a computer program that develops pattern recognition algorithms from alimited body of analyst-supplied training data. (a) For a water-finding task, an ana-lyst tags pixels of interest (water) in green and undesired pixels (anything but water)in red. GENIE used this initial information to evolve the mask shown in (b), whichincludes all the water and nonwater in the image. The user is able to influence theevolution of algorithms by providing additional information and by interactively pro-viding additional training data.
Configurable
Dataprocessedin parallel
User -defined nodeFPGA board
Figure 6. Reconfigurable ComputingThe heart of an RCC is the field-programmable gate array (FPGA) circuit board,whose function can be modified by software. The FPGA consists of millions of sys-tem gates, which are the basis for the reconfigurable cells. Each cell can be reconfig-ured to perform a different low-level logic function, such as AND or OR. Many cellsare grouped together into a node that performs a complex function, such as edgedetection or spectral filtering. A genetic algorithm reconfigures the collection ofnodes to create an optimized analysis algorithm. The advantage of the RCC is thatmany subtasks can be done in parallel. Information is also pipelined so that new datacan start to be analyzed even as old data move through the system. The RCC allowsus to do complex analysis tasks much faster and with far less hardware than waspreviously possible.
(a) (b)
small data set, new algorithms can beobtained 100 times faster on POOKAthan on a conventional computer.Once the system is trained, the opti-mized algorithm applied to a new dataset runs 20 times faster. POOKA is sofast that we are able to search in realtime for features in video datastreams, for example, from a surveil-lance camera on an unmanned aerialvehicle. Thus, we can train the algo-rithm to recognize not just spatial orspectral features but also features thatvary between video frames.
The ability to couple a processor toa sensor and optimize the processor toperform specific tasks has allowed usto do multispectral analysis in realtime. This achievement has revolu-tionized our surveillance capabilitiesand has also opened up amazingopportunities for basic research. (Seethe box “Gotcha! You Blinked!” onthe opposite page 161.)
Fundamental Space Scienceand Astrophysics
In 1973, a Los Alamos teamannounced that the gamma-ray detec-tors aboard the fifth and sixth pairs ofVela satellites had detected 16 veryintense “bursts” of celestial gammarays, each lasting about a minute butconsisting of a number of quick,sharp pulses. The astounding featureof the bursts was their unbelievablebrightness—often brighter than therest of the gamma-ray universe com-bined! The discovery of bursts imme-diately raised two scientific ques-tions: What astrophysical sourcescould emit such rapid, potent spikesof energy, and where were thosesources located? Because the intensi-ty of light falls off inversely as thesquare of the distance, the questionswere related. Cosmic sources locatedmillions, or even billions, of light-years away would have to emit ordersof magnitude more energy compared
with a source located within or nearour galaxy.
Theoreticians and experimentalistsat Los Alamos were extremely activein trying to shed light on the phe-nomenon. Collaborating with otherinstitutions, Los Alamos researchersfielded increasingly sensitive gamma-ray detectors aboard the PioneerVenus Orbiter (launched in 1978),the third International Sun-EarthExplorer spacecraft (ISEE-3, alsolaunched in 1978), and the Gingaspacecraft, which was launched in1987. But because of their small size,those instruments were insensitive toall but the largest bursts. In addition,the instruments had limited spatialresolution, so data had to be com-bined with that from other spacecraftto allow accurately locating the burstin the sky. Unfortunately, the initialdata analysis often took weeks tocomplete, far too long to permit fol-low-up studies by higher-resolutionx-ray and optical telescopes. Formany years, those deficiencies limited the amount of informationavailable to the gamma-ray burstcommunity.
Things began to change in 1991,after NASA launched the ComptonGamma-Ray Observatory. The satel-lite viewed the entire sky with anarray of relatively large detectors andrecorded hundreds of gamma-raybursts. The data clearly showed thatbursts came from all parts of the sky,without any preference for the planeof the Milky Way or for regionsaround the Andromeda Galaxy. Thelikely explanation was that sourceswere uniformly distributed throughoutthe universe. That view was solidifiedby the Italian-built BeppoSax satellite,launched in 1996. Data from the satel-lite could be analyzed fast enough(within 5 to 8 hours) that ground per-sonnel could direct onboard x-rayinstruments to observe the source.BeppoSax was the first to detect an x-ray “afterglow” following a gamma-ray burst. The x-ray data allowedresearchers to extract redshifts andhence deduce a distance scale. Mostphysicists now agree that the burstscome from sources located billions oflight-years away.
Scientists are still searching for acomplete picture of how bursts are pro-
160 Los Alamos Science Number 28 2003
Eyes in Space
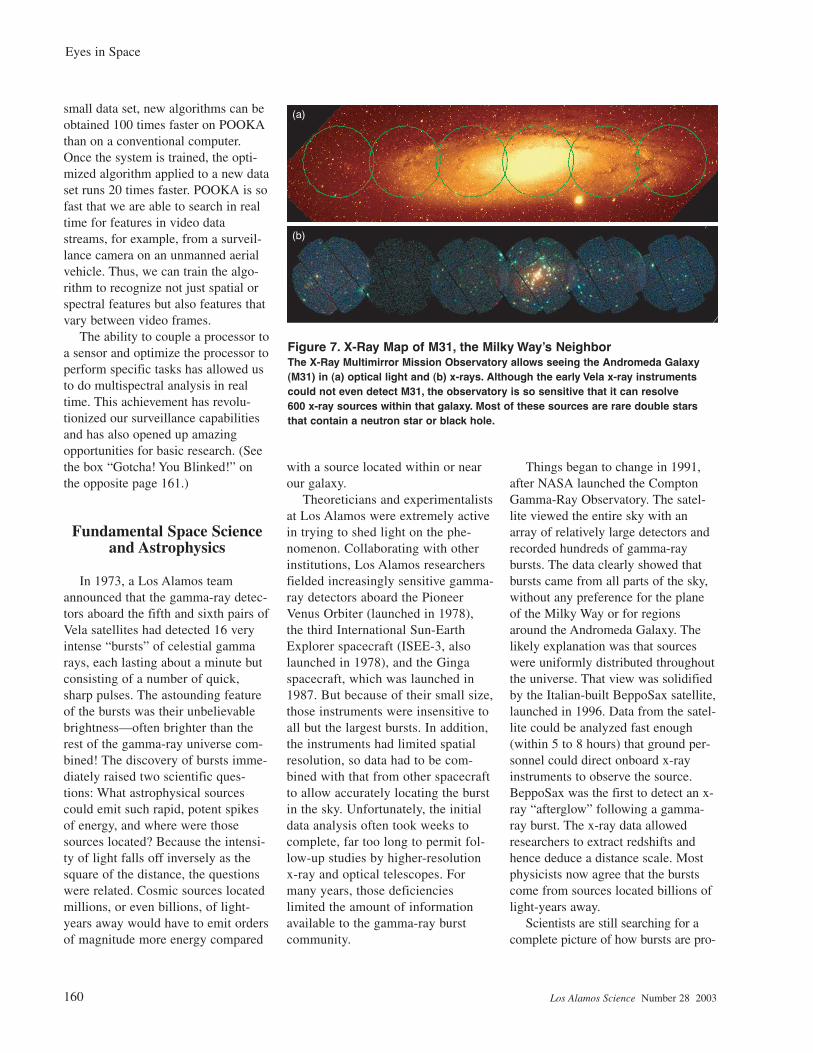
Figure 7. X-Ray Map of M31, the Milky Way’s NeighborThe X-Ray Multimirror Mission Observatory allows seeing the Andromeda Galaxy(M31) in (a) optical light and (b) x-rays. Although the early Vela x-ray instrumentscould not even detect M31, the observatory is so sensitive that it can resolve600 x-ray sources within that galaxy. Most of these sources are rare double starsthat contain a neutron star or black hole.
(a)
(b)
duced and are relying on data from thelatest generation of spacecraft. TheHETE-2 (for High-Energy TransientExplorer) satellite, for example,launched in 2000 with Los Alamosinstrumentation and software, process-es burst data within tens of seconds. Afast trigger on the gamma-ray detectorsquickly relays to observers worldwideevent information, which elicits fastresponses from ground-based robotictelescopes (such as the RAPTOR sys-tem discussed in the box “Gotcha! YouBlinked!”on this page). Spectral infor-mation can be gathered during the cru-cial first minutes of the event, whilethe burst is still happening. InDecember 2003, NASA will launch theSwift satellite. With its enormous burstalert telescope and Los Alamos trigger-ing and imaging software, Swift willhave an even greater opportunity tolocate and observe hundreds of burstsper year.
Gamma-ray bursts are but one areaof fundamental space research thatwas advanced by Los Alamos instru-ments. Another is in the field of x-rayastronomy. This work started with asimple x-ray telescope that flew onthe Vela satellite. Although modest insize and limited in performance, thattelescope proved to be exceedinglyuseful because it operated for morethan 10 years. It allowed us to dolong-term studies of x-ray binaries(peculiar double stars containing ablack hole or neutron star) and activegalactic nuclei (supermassive blackholes at the center of galaxies). Thattelescope was the forebear of the opti-cal-ultraviolet monitor telescope thatwe helped develop for the giant X-RayMultimirror Mission Observatory, asatellite launched by the EuropeanSpace Agency in 1999. The observato-ry has studied the x-ray source popu-lation in the Andromeda Galaxy, theMilky Way’s nearest large neighbor(see Figure 7).
Closer to home, research on thenear-space environment has been
Gotcha! You Blinked!
W. Thomas Vestrand
We take for granted that the stars in the night sky are stable from night tonight and year to year. But also populating the heavens are short-lived opticaltransients such as the bright optical flash of January 23, 1999, that lastedabout 90 seconds and reached an apparent magnitude in brightness of 9.Estimated to have originated at a distance of 10 billion light-years, it was themost luminous optical object ever measured by humankind. Unfortunately,witnessing similar events is frustratingly difficult. The flashes are generallynot preceded by other events and are often over by the time we can train atelescope to the right spot.
The solution is to adapttechnology that is used tofulfill our threat reductionmission and couple opticalsensors to real-time proces-sors. This procedure hasallowed us to develop thefirst of a new generation of“smart” telescopes that canlocate, in real time, celestialoptical transients that comeand go in less than a minute.
Our sky-monitoring system,RAPTOR (for rapid tele-scopes for optical response),is best understood as ananalogue of human vision.The human eye has awide-field, low-resolutionimager (rod cells of the retina), as well as a narrow-field, high-resolutionimager (cone cells of the fovea). Both eyes send image information to a pow-erful real-time processor, the brain, running “software” for the detection ofinteresting targets. When a target is identified, both eyes are rapidly turned toplace the target on the central fovea imager for detailed “follow-up” observa-tions with color vision and higher spatial resolution. Because we have twoeyes viewing the same scene, we can eliminate such image faults as“floaters” and extract distance information about objects in the scene.Similarly, RAPTOR employs two primary telescope arrays that are separatedby a distance of 38 kilometers to provide stereoscopic imaging (seeFigure A). Each telescope array has a wide-field imager and a central, nar-row-field fovea imager. Both arrays are coupled to a real-time data analysissystem that can identify transients in seconds. Instructions are then relayed topoint the high-resolution fovea telescopes at the transient.
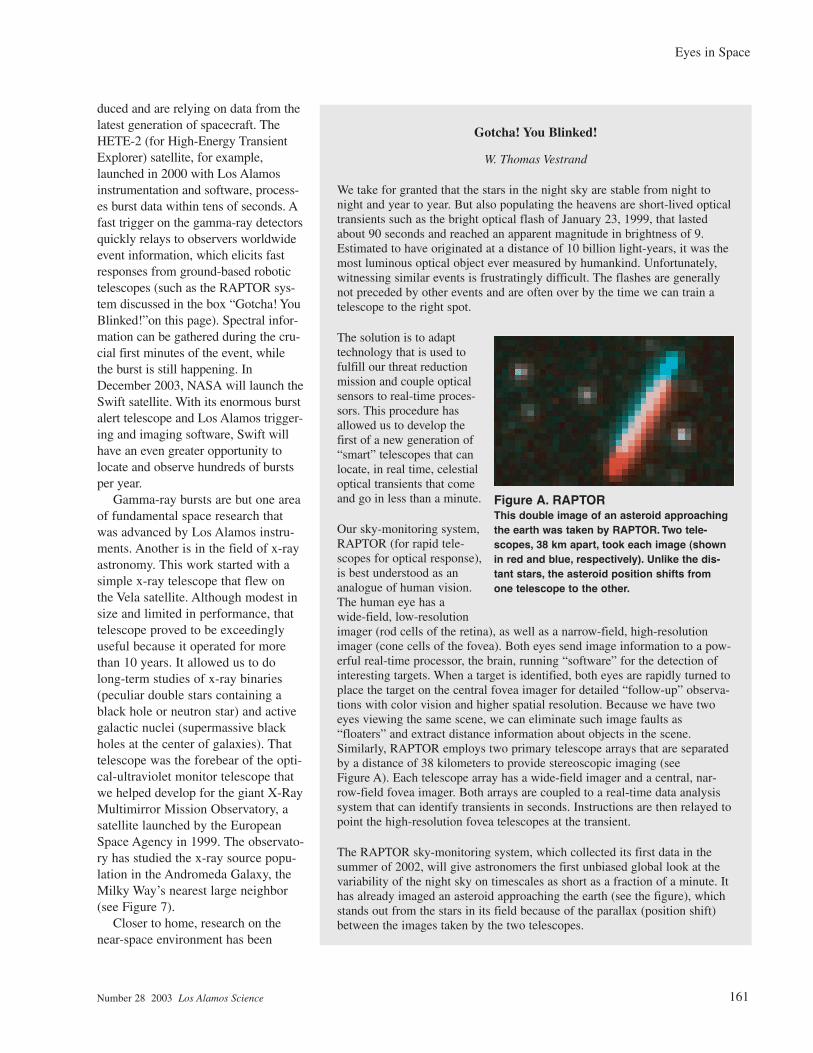
The RAPTOR sky-monitoring system, which collected its first data in thesummer of 2002, will give astronomers the first unbiased global look at thevariability of the night sky on timescales as short as a fraction of a minute. Ithas already imaged an asteroid approaching the earth (see the figure), whichstands out from the stars in its field because of the parallax (position shift)between the images taken by the two telescopes.
Figure A. RAPTORThis double image of an asteroid approachingthe earth was taken by RAPTOR. Two tele-scopes, 38 km apart, took each image (shownin red and blue, respectively). Unlike the dis-tant stars, the asteroid position shifts fromone telescope to the other.
Number 28 2003 Los Alamos Science 161
Eyes in Space
162 Los Alamos Science Number 28 2003
Eyes in Space
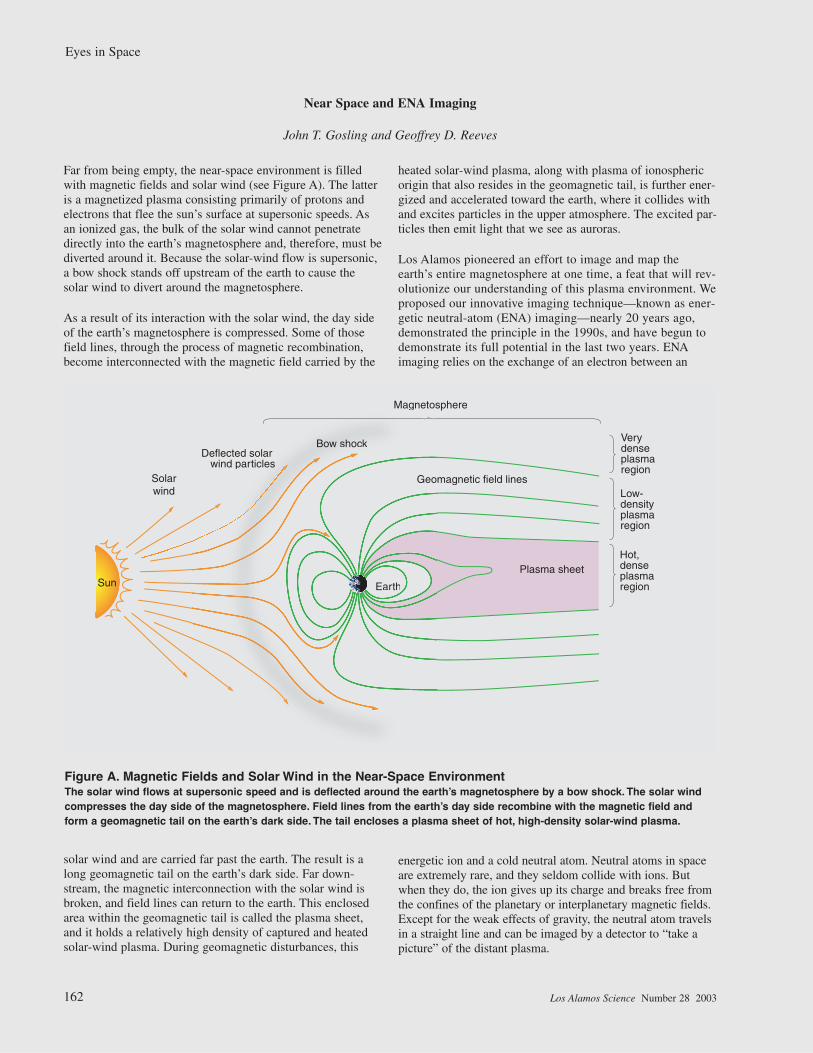
Far from being empty, the near-space environment is filledwith magnetic fields and solar wind (see Figure A). The latteris a magnetized plasma consisting primarily of protons andelectrons that flee the sun’s surface at supersonic speeds. Asan ionized gas, the bulk of the solar wind cannot penetratedirectly into the earth’s magnetosphere and, therefore, must bediverted around it. Because the solar-wind flow is supersonic,a bow shock stands off upstream of the earth to cause thesolar wind to divert around the magnetosphere.
As a result of its interaction with the solar wind, the day sideof the earth’s magnetosphere is compressed. Some of thosefield lines, through the process of magnetic recombination,become interconnected with the magnetic field carried by the
solar wind and are carried far past the earth. The result is along geomagnetic tail on the earth’s dark side. Far down-stream, the magnetic interconnection with the solar wind isbroken, and field lines can return to the earth. This enclosedarea within the geomagnetic tail is called the plasma sheet,and it holds a relatively high density of captured and heatedsolar-wind plasma. During geomagnetic disturbances, this
heated solar-wind plasma, along with plasma of ionosphericorigin that also resides in the geomagnetic tail, is further ener-gized and accelerated toward the earth, where it collides withand excites particles in the upper atmosphere. The excited par-ticles then emit light that we see as auroras.
Los Alamos pioneered an effort to image and map theearth’s entire magnetosphere at one time, a feat that will rev-olutionize our understanding of this plasma environment. Weproposed our innovative imaging technique—known as ener-getic neutral-atom (ENA) imaging—nearly 20 years ago,demonstrated the principle in the 1990s, and have begun todemonstrate its full potential in the last two years. ENAimaging relies on the exchange of an electron between an
energetic ion and a cold neutral atom. Neutral atoms in spaceare extremely rare, and they seldom collide with ions. Butwhen they do, the ion gives up its charge and breaks free fromthe confines of the planetary or interplanetary magnetic fields.Except for the weak effects of gravity, the neutral atom travelsin a straight line and can be imaged by a detector to “take apicture” of the distant plasma.
Near Space and ENA Imaging
John T. Gosling and Geoffrey D. Reeves
Plasma sheet
sphereMagnetos
Bow shock
Sun Earth
Solarwind
Deflected solarwind particles
magnetic field linesGeo
Verydense plasmaregion
Low-density plasmaregion
Hot,dense plasmaregion
Figure A. Magnetic Fields and Solar Wind in the Near-Space EnvironmentThe solar wind flows at supersonic speed and is deflected around the earth’s magnetosphere by a bow shock. The solar windcompresses the day side of the magnetosphere. Field lines from the earth’s day side recombine with the magnetic field andform a geomagnetic tail on the earth’s dark side. The tail encloses a plasma sheet of hot, high-density solar-wind plasma.
extremely productive and has led to anumber of fundamental discoveriesabout the sun’s extended atmosphere,the solar wind, and the interaction ofthat atmosphere with the earth’s mag-netic field. Measurements by instru-ments on the Vela satellites revealedsome of the complexity of the earth’smagnetosphere and led directly to ourdiscovery of the earth’s plasma sheet,a region of concentrated plasma thatextends far downstream on the nightside of Earth (see the box to the left).Other measurements by Los Alamosinstruments on Vela led to the discov-ery that the sun often impulsivelyejects into interplanetary space largeamounts of material, which have cometo be known as “coronal mass ejec-tions.” Los Alamos work in the early1990s revealed that these ejections,and not solar flares, are the primecause of major solar-wind disturbancesand large geomagnetic storms.
The considerable success of theearly Vela measurements promptedNASA to use Los Alamos plasma sen-sors on a series of satellites launchedin the early 1970s. That was the begin-ning of a long and fruitful collabora-tion between our two institutions tostudy the near-space environment, acollaboration that continues to thepresent. Our instruments have sampledall the different regions of the earth’smagnetosphere and have explored thesolar wind in considerable detail.Figure 8 shows the solar-wind speedas a function of solar latitude. The datawere obtained by Los Alamos instru-mentation on the Ulysses spacecraft, ajoint endeavor between NASA and theEuropean Space Agency. Ulysses waslaunched toward Jupiter from thespace shuttle Discovery inOctober 1990. The giant planet’s grav-itational field deflected the craft out ofthe ecliptic and into a 5.5-year-longorbit over the poles of the sun. It is thefirst-ever polar orbit of the sun by amanmade object.
Ulysses is now nearing completion
Number 28 2003 Los Alamos Science 163
Eyes in Space
2500
4
3
2
1
0
2000
1500
1000
500
0125° FOV
19.9 keV
19.9 keV
XSM (R
E)
Diff
eren
tial E
NA
flux
(cm
2 s
sr k
eV00
)-1
105
0-5
-10
-10-5
05
10
Jio
n106 (c
m2 s
sr k
eV)-1
Y SM (R E)
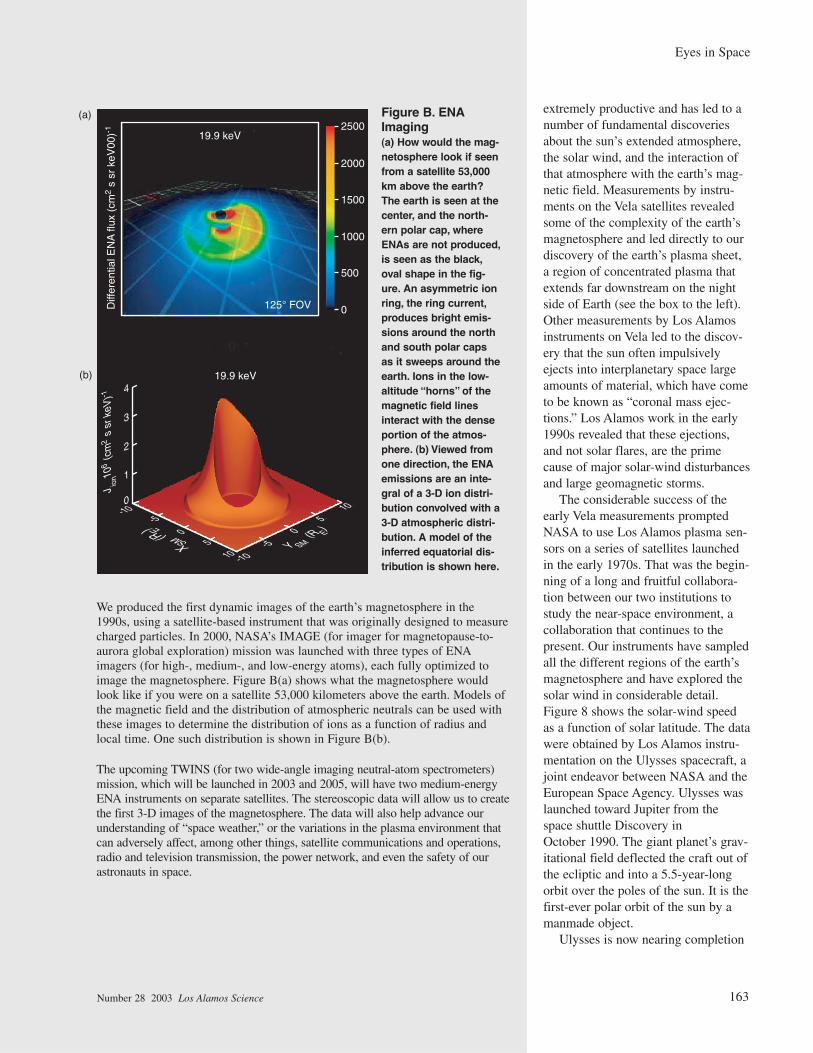
Figure B. ENAImaging(a) How would the mag-netosphere look if seenfrom a satellite 53,000km above the earth?The earth is seen at thecenter, and the north-ern polar cap, whereENAs are not produced,is seen as the black,oval shape in the fig-ure. An asymmetric ionring, the ring current,produces bright emis-sions around the northand south polar capsas it sweeps around theearth. Ions in the low-altitude “horns” of themagnetic field linesinteract with the denseportion of the atmos-phere. (b) Viewed fromone direction, the ENAemissions are an inte-gral of a 3-D ion distri-bution convolved with a3-D atmospheric distri-bution. A model of theinferred equatorial dis-tribution is shown here.
We produced the first dynamic images of the earth’s magnetosphere in the1990s, using a satellite-based instrument that was originally designed to measurecharged particles. In 2000, NASA’s IMAGE (for imager for magnetopause-to-aurora global exploration) mission was launched with three types of ENAimagers (for high-, medium-, and low-energy atoms), each fully optimized toimage the magnetosphere. Figure B(a) shows what the magnetosphere wouldlook like if you were on a satellite 53,000 kilometers above the earth. Models ofthe magnetic field and the distribution of atmospheric neutrals can be used withthese images to determine the distribution of ions as a function of radius andlocal time. One such distribution is shown in Figure B(b).
The upcoming TWINS (for two wide-angle imaging neutral-atom spectrometers)mission, which will be launched in 2003 and 2005, will have two medium-energyENA instruments on separate satellites. The stereoscopic data will allow us to createthe first 3-D images of the magnetosphere. The data will also help advance ourunderstanding of “space weather,” or the variations in the plasma environment thatcan adversely affect, among other things, satellite communications and operations,radio and television transmission, the power network, and even the safety of ourastronauts in space.
(a)
(b)
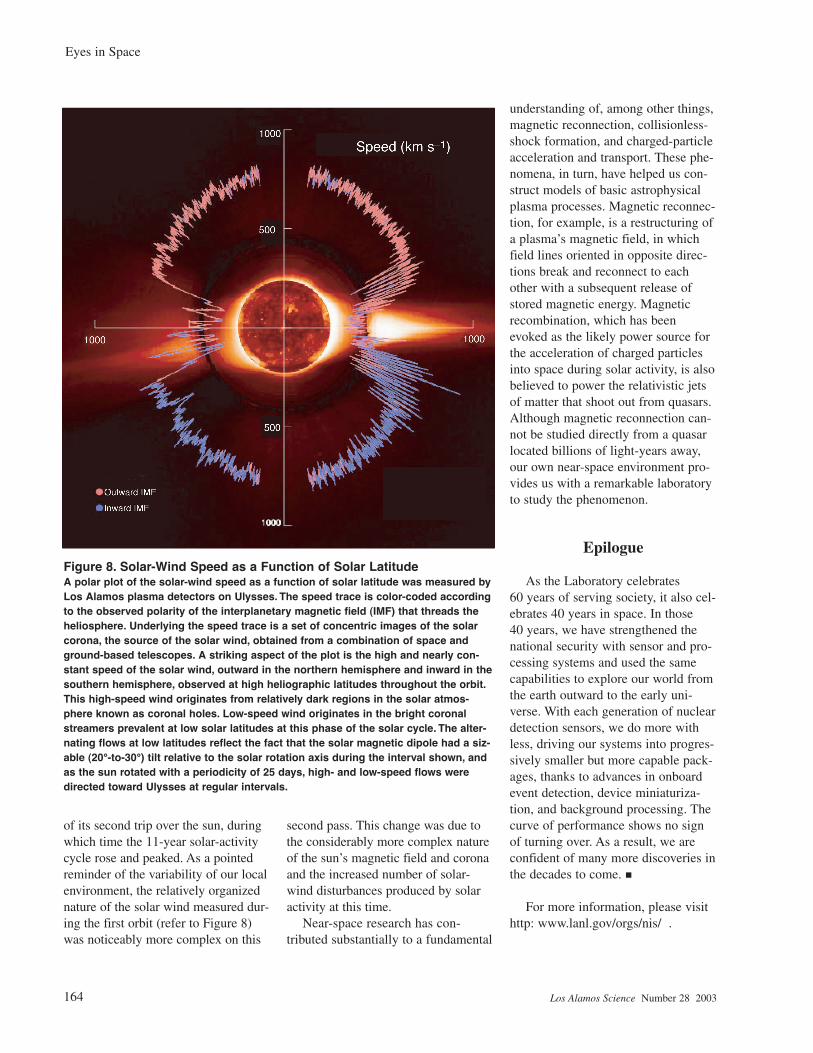
of its second trip over the sun, duringwhich time the 11-year solar-activitycycle rose and peaked. As a pointedreminder of the variability of our localenvironment, the relatively organizednature of the solar wind measured dur-ing the first orbit (refer to Figure 8)was noticeably more complex on this
second pass. This change was due tothe considerably more complex natureof the sun’s magnetic field and coronaand the increased number of solar-wind disturbances produced by solaractivity at this time.
Near-space research has con-tributed substantially to a fundamental
understanding of, among other things,magnetic reconnection, collisionless-shock formation, and charged-particleacceleration and transport. These phe-nomena, in turn, have helped us con-struct models of basic astrophysicalplasma processes. Magnetic reconnec-tion, for example, is a restructuring ofa plasma’s magnetic field, in whichfield lines oriented in opposite direc-tions break and reconnect to eachother with a subsequent release ofstored magnetic energy. Magneticrecombination, which has beenevoked as the likely power source forthe acceleration of charged particlesinto space during solar activity, is alsobelieved to power the relativistic jetsof matter that shoot out from quasars.Although magnetic reconnection can-not be studied directly from a quasarlocated billions of light-years away,our own near-space environment pro-vides us with a remarkable laboratoryto study the phenomenon.
Epilogue
As the Laboratory celebrates60 years of serving society, it also cel-ebrates 40 years in space. In those40 years, we have strengthened thenational security with sensor and pro-cessing systems and used the samecapabilities to explore our world fromthe earth outward to the early uni-verse. With each generation of nucleardetection sensors, we do more withless, driving our systems into progres-sively smaller but more capable pack-ages, thanks to advances in onboardevent detection, device miniaturiza-tion, and background processing. Thecurve of performance shows no signof turning over. As a result, we areconfident of many more discoveries inthe decades to come. �
For more information, please visithttp: www.lanl.gov/orgs/nis/ .
164 Los Alamos Science Number 28 2003
Eyes in Space
Figure 8. Solar-Wind Speed as a Function of Solar LatitudeA polar plot of the solar-wind speed as a function of solar latitude was measured byLos Alamos plasma detectors on Ulysses. The speed trace is color-coded accordingto the observed polarity of the interplanetary magnetic field (IMF) that threads theheliosphere. Underlying the speed trace is a set of concentric images of the solarcorona, the source of the solar wind, obtained from a combination of space andground-based telescopes. A striking aspect of the plot is the high and nearly con-stant speed of the solar wind, outward in the northern hemisphere and inward in thesouthern hemisphere, observed at high heliographic latitudes throughout the orbit.This high-speed wind originates from relatively dark regions in the solar atmos-phere known as coronal holes. Low-speed wind originates in the bright coronalstreamers prevalent at low solar latitudes at this phase of the solar cycle. The alter-nating flows at low latitudes reflect the fact that the solar magnetic dipole had a siz-able (20°-to-30°) tilt relative to the solar rotation axis during the interval shown, andas the sun rotated with a periodicity of 25 days, high- and low-speed flows weredirected toward Ulysses at regular intervals.
Number 28 2003 Los Alamos Science 165
Eyes in Space
Richard Belian, currently a Laboratory con-sultant (retired from Los Alamos), was a co-
investigator on the teamthat conceived and builtthe cosmic x-ray detector(XC) flown on the lasttwo pairs of VELA satel-lites. The XC was the firstviable scientific x-rayinstrument ever to beflown on a satellite. Itmade several important
discoveries in cosmic x-rays, including the firstever report of a cosmic x-ray burst.
Steven Brumby is co-inventor of the LosAlamos GENIE machine learning/image analy-
sis system, and has beenworking on a range ofspace missions to Earth,Mars, and the outer plan-ets. Steven received hisPh.D. in theoretical particlephysics in 1997 from theUniversity of Melbourne,Australia, and is a techni-cal staff member in the
Space and Remote Sensing Sciences Group.
Cheng Ho is a technical staff member of theSpace and Remote Sensing Sciences Group in
the Nonproliferation andInternational SecurityDivision and projectleader for the RemoteUltra-Low Light Imaging(RULLI) Single-PhotonSensor Project
Edward Fenimore has been a technical staffmember at Los Alamos since 1978. At present,
he is in the Space andRemote Sensing SciencesGroup, where he is work-ing on the high-energytransient experiment(HETE), on the Swiftsatellites, and on theoreti-cal studies of gamma-raybursts.
Maya Gokhale is deputy leader of the SpaceData Systems Group and project leader of
Deployable AdaptiveProcessing Systems(DAPS), which sponsoredthe Pixel-BasedMultispectral ImageClassification (referred toas POOKA) Project.
Jack Gosling is a Laboratory fellow in theNonproliferation and International Security
Division, where he workson various topics in spaceplasma physics and hasauthored more than 350scientific papers.
Stephen Knox is project leader in theNonproliferation andInternational SecurityDivision’s Research andDevelopment Program.
David Lawrence is a technical staff memberon the Space PhysicsTeam in the Space andAtmospheric SciencesGroup at Los AlamosNational Laboratory
Geoffrey Reeves is leader of the Space andAtmospheric Science Group in the
Nonproliferation andInternational SecurityDivision. He has spentmuch time studying theacceleration and transportof energetic particles inthe earth’s magnetosphereand their effects on spacesystems.
Diane Roussel-Dupré is manager for the proj-ect Cibola Flight Experiment Software Radio
Space Demonstration. Inthe past, she was theflight operations managerfor the ALEXIS and theFORTÉ satellites.
David Suszcynsky is a technical staff memberand project leader in the Space and
Atmospheric SciencesGroup of theNonproliferation andInternational SecurityDivision.
Tom Vestrand is the project leader for theRAPTOR (rapid telescopes for optical
response) and ROTSE(robotic optical transientsearch experiment)Programs at Los AlamosNational Laboratory.
William (Bill) Priedhorsky received hisbachelor’s in physics from Whitman College
and his Ph.D. in physicsfrom the CaliforniaInstitute of Technology.After finishing graduatework, he joined LosAlamos NationalLaboratory, where he hasdeveloped sensors fornonproliferation andtreaty verification. Bill’s
current research includes muon radiographyand high-energy astrophysics. He is the chiefscientist for the Nonproliferation andInternational Security Division.
Jay Schecker came to Los Alamos NationalLaboratory in 1990 as a postdoctoral fellow in
nuclear physics. He hasbeen a science writer withLos Alamos Science since1995.