Embed Size (px)
Citation preview
Air Force Institute of Technology Air Force Institute of Technology
AFIT Scholar AFIT Scholar
Theses and Dissertations Student Graduate Works
9-9-2009
F-16 Ventral Fin Buffet Alleviation Using Piezoelectric Actuators F-16 Ventral Fin Buffet Alleviation Using Piezoelectric Actuators
Joseph S. Browning
Follow this and additional works at: https://scholar.afit.edu/etd
Part of the Aerospace Engineering Commons
Recommended Citation Recommended Citation Browning, Joseph S., "F-16 Ventral Fin Buffet Alleviation Using Piezoelectric Actuators" (2009). Theses and Dissertations. 2409. https://scholar.afit.edu/etd/2409
This Thesis is brought to you for free and open access by the Student Graduate Works at AFIT Scholar. It has been accepted for inclusion in Theses and Dissertations by an authorized administrator of AFIT Scholar. For more information, please contact [email protected].

F-16 Ventral Fin Buffet Alleviation
Using Piezoelectric Actuators
THESIS
Joseph S. Browning, Captain, USAF
AFIT/GAE/ENY/09-S01
DEPARTMENT OF THE AIR FORCEAIR UNIVERSITY
AIR FORCE INSTITUTE OF TECHNOLOGY
Wright-Patterson Air Force Base, Ohio
APPROVED FOR PUBLIC RELEASE; DISTRIBUTION UNLIMITED.

Research sponsored in part by the United States Air Force Test Pilot School, EdwardsAir Force Base, California. The United States Government is authorized to reproduceand distribute reprints notwithstanding any copyright notation thereon. The viewsexpressed in this thesis are those of the author and do not reflect the official policy orposition of the United States Air Force, Department of Defense, or the United StatesGovernment.
AFIT/GAE/ENY/09-S01
F-16 Ventral Fin Buffet Alleviation
Using Piezoelectric Actuators
THESIS
Presented to the Faculty
Department of Aeronautics and Astronautics
Graduate School of Engineering and Management
Air Force Institute of Technology
Air University
Air Education and Training Command
In Partial Fulfillment of the Requirements for the
Degree of Master of Science in Aeronautical Engineering
Joseph S. Browning, B.S.M.E.
Captain, USAF
September 2009
APPROVED FOR PUBLIC RELEASE; DISTRIBUTION UNLIMITED.
AFIT/GAE/ENY/09-S01
F-16 Ventral Fin Buffet Alleviation
Using Piezoelectric Actuators
Joseph S. Browning, B.S.M.E.
Captain, USAF
Approved:
Dr. Robert A. Canfield, (Chairman) date
Dr. Richard G. Cobb, (Co-Chairmen) date
LtCol. Christopher M. Shearer, PhD.(Member)
date
AFIT/GAE/ENY/09-S01
Abstract
Buffet-induced vibrations can have a disastrous impact on aircraft structures.
Early attempts at combating buffet vibrations included passive methods such as struc-
tural enhancements and leading edge fences used to minimize the strength of vortices.
Active methods, however, have shown greater promise, including active airflow con-
trol, control surface modulation, and control systems employing piezoelectric actua-
tors, the later drawing much attention in recent years. Piezoelectric actuators, when
mounted to the surface of the affected structure, impart directional strain reducing
the negative effects associated with harmful vibration. The Block-15 F-16 ventral fin
represents an aircraft structure prone to failure when subjected to the buffet field from
the wake of a Low Altitude Navigation and Targeting Infrared for Night (LANTIRN)
pod. However, ventral fin failures pose relatively little risk to the pilot or the aircraft
within the nominal F-16 flight envelope, highlighting its potential as a platform for
further investigation into the effectiveness of piezoelectric actuators. This research
takes advantage of the susceptibility to buffet vibration of the Block 15 ventral fin
as the subject of an effort to design an active control system to alleviate vibrations
using piezoelectric actuators and sensors and to demonstrate its capability during
flight test. The research was sponsored by the United States Air Force (USAF) Test
Pilot School (TPS).
The development of an active control system began with the specification of
piezoelectric actuators and sensors to be used in a collocated design to alleviate the
vibrations of the first two modes of the ventral fin. A switching amplifier was de-
signed and custom built to drive the actuators during all phases of testing. For the
piezoelectric actuators to be effective, they needed to be located within the regions of
highest strain energy and aligned with the principal strain vectors in those regions,
the direction of principle strain was experimentally determined to ensure the proper
iv

orientation of the piezoelectric hardware on the ventral fin’s surface. Two control tech-
niques were used in this research: positive position feedback and Linear Quadratic
Gaussian compensator. Both algorithms were developed and optimized during labo-
ratory simulations and bench testing with system hardware where as much as 15 dB
peak magnitude reduction was achieved in the ventral fin mode 1, 2, and 3 response.
The positive position feedback algorithms were implemented during aircraft ground
and flight testing at the USAF TPS, Edwards Air Force Base, California. Ground
testing showed as much as 14 dB and 8 dB peak magnitude reduction in the mode
2 and mode 3 response, respectively. As much as 4 dB peak magnitude reduction
was recorded in the mode 2 response during flight testing proving the potential of
piezoelectric actuators in a buffet alleviation system. Still, there exists many design
considerations, such as piezoelectric actuator and sensor configuration, that could
lead to system improvement.
v
Acknowledgements
This thesis has been the most demanding academic endeavor I have ever undertaken.
Taking the initial concept of this research to flight test in only 18 months could not
have been done with the support of many people. I would like to thank Dr. Bob
Canfield who first intrigued me with this thesis and guided me to its completion, Dr
Richard Cobb for his invaluable expertise in vibration control and tireless support
through many grueling hours in the lab, and Mr Sean Miller of AFIT without whose
resourcefulness and dedication the amplifier assembly would not have been built and
the ground and flight testing would not have been realized. I would also like to thank
Mr. Thomas Daue of the Smart Material Corp. for his guidance in the design of
piezoelectric actuators and sensors and Maj Seo Yow Teo, Capt Chris Seager, Capt
Lane Haubelt, and Capt Chris Buckely, the ACTIVE FIN flight test team at the
USAF Test Pilot School, whose dedication saw the successful completion of the flight
test portion of this research.
To My Parents
Thank you very much for your continual love and encouragement during the 15 months
I was at AFIT and throughout the challenging year at TPS. Without you, I simply
would not be who and where I am today.
Joseph S. Browning
vi

Table of ContentsPage
Abstract . . . . . . . . . . . . . . . . . . . . . . . . . . . . . . . . . . . . . iv
Acknowledgements . . . . . . . . . . . . . . . . . . . . . . . . . . . . . . . vi
List of Figures . . . . . . . . . . . . . . . . . . . . . . . . . . . . . . . . . ix
List of Tables . . . . . . . . . . . . . . . . . . . . . . . . . . . . . . . . . . xii
List of Symbols . . . . . . . . . . . . . . . . . . . . . . . . . . . . . . . . . xiii
List of Abbreviations . . . . . . . . . . . . . . . . . . . . . . . . . . . . . . xiv
I. Introduction . . . . . . . . . . . . . . . . . . . . . . . . . . . . . 11.1 Problem/Scope . . . . . . . . . . . . . . . . . . . . . . . 5
1.2 Approach/Methodology . . . . . . . . . . . . . . . . . . 6
II. Literature Review . . . . . . . . . . . . . . . . . . . . . . . . . . 82.1 History of the Buffet-Induced Vibration Problem . . . . 8
2.2 Piezoelectricity and its Application to Buffet Alleviation 10
2.3 Control Methodologies in Buffet Alleviation . . . . . . . 16
2.3.1 Sensor Selection and Location . . . . . . . . . . 182.3.2 Control Methods . . . . . . . . . . . . . . . . . 22
2.4 Drive Amplifier . . . . . . . . . . . . . . . . . . . . . . . 24
III. Theoretical Background . . . . . . . . . . . . . . . . . . . . . . . 27
3.1 Piezoelectric Actuator Placement, Sizing, and Orientation 27
3.1.1 Experimental Determination of Principle StrainVectors . . . . . . . . . . . . . . . . . . . . . . . 28
3.2 Piezoelectric Sensor Placement and Orientation . . . . . 323.3 System Model Identification . . . . . . . . . . . . . . . . 33
3.4 Control Algorithm Development . . . . . . . . . . . . . . 35
3.4.1 Positive Position Feedback . . . . . . . . . . . . 363.4.2 Linear Quadratic Gaussian . . . . . . . . . . . . 39
3.4.3 Closed-Loop Stability . . . . . . . . . . . . . . . 44
3.5 Implementation of Control Algorithms in Software . . . 45
vii

Page
IV. Methodolgy . . . . . . . . . . . . . . . . . . . . . . . . . . . . . . 49
4.1 Piezoelectric Actuator and Sensor Design . . . . . . . . 49
4.1.1 Mode Selection . . . . . . . . . . . . . . . . . . 494.1.2 Actuator Design . . . . . . . . . . . . . . . . . . 50
4.2 Natural Frequency and Mode Shape Verification . . . . . 53
4.3 Experimental Determination of the Principle Strain Vectors 54
4.4 Piezoelectric Actuators and Sensors Installation . . . . . 564.5 Drive Amplifier Design . . . . . . . . . . . . . . . . . . . 57
4.6 Transfer Function Model Realization . . . . . . . . . . . 624.7 Closed-Loop Control Development and Optimization . . 65
4.7.1 Positive Position Feedback . . . . . . . . . . . . 664.7.2 Linear Quadratic Gaussian . . . . . . . . . . . . 67
4.7.3 Digital Implementation . . . . . . . . . . . . . . 68
4.8 Aircraft Installation and Ground Testing . . . . . . . . . 69
4.9 ACTIVE FIN Flight Testing . . . . . . . . . . . . . . . . 72
V. Results and Analysis . . . . . . . . . . . . . . . . . . . . . . . . . 76
5.1 Laboratory Simulations and Bench Testing . . . . . . . . 76
5.1.1 Positive Position Feedback . . . . . . . . . . . . 765.1.2 Linear Quadratic Gaussian . . . . . . . . . . . . 78
5.2 Aircraft Ground Testing . . . . . . . . . . . . . . . . . . 84
5.3 ACTIVE FIN Flight Testing . . . . . . . . . . . . . . . . 86
VI. Summary and Conclusions . . . . . . . . . . . . . . . . . . . . . . 94
6.1 Summary . . . . . . . . . . . . . . . . . . . . . . . . . . 94
6.2 Recommendations . . . . . . . . . . . . . . . . . . . . . 97
Bibliography . . . . . . . . . . . . . . . . . . . . . . . . . . . . . . . . . . 100
Vita . . . . . . . . . . . . . . . . . . . . . . . . . . . . . . . . . . . . . . . 105
viii

List of FiguresFigure Page
1.1. LANTIRN Pod and Ventral Fin Locations [courtesy USAF] . . 2
1.2. Ventral Fin Failure Example [courtesy USAF] . . . . . . . . . 3
2.1. Comparison of Isotropic and Orthotropic Actuators [6] . . . . 12
2.2. Modal Modification and Addition Techniques [1] . . . . . . . . 16
2.3. Major Components of the F/A-18 BLA System [38] . . . . . . 19
2.4. Affect of Pole-Zero Flipping on System Stability [40] . . . . . . 20
2.5. Basic Design of a Piezo Switching Amplifier [10] . . . . . . . . 26
3.1. Mode 1 (78 Hz) Strain Energy Plot and Recommended Patch
Location [7] . . . . . . . . . . . . . . . . . . . . . . . . . . . . 28
3.2. Mode 2 (96 Hz) Strain Energy Plot and Recommended Patch
Location [7] . . . . . . . . . . . . . . . . . . . . . . . . . . . . 29
3.3. Mode 1 (78 Hz) Principle Strain Vector Orientation and Recom-
mended Patch Location [7] . . . . . . . . . . . . . . . . . . . . 29
3.4. Mode 2 (96 Hz) Principle Strain Vector Orientation and Recom-
mended Patch Location [7] . . . . . . . . . . . . . . . . . . . . 30
3.5. Curvature Example . . . . . . . . . . . . . . . . . . . . . . . . 31
3.6. Strain Rosette from Laser Vibrometer Scan Grid Points . . . . 31
3.7. Simple Block Diagram . . . . . . . . . . . . . . . . . . . . . . 35
3.8. Bode Plot for PPF of Various Damping Ratios . . . . . . . . . 39
3.9. LQG Control Block Diagram [5] . . . . . . . . . . . . . . . . . 40
3.10. Stability Margins from a Nichols Chart /citeogata. . . . . . . 45
3.11. Compact RIO Control Unit Hardware Components . . . . . . 47
3.12. Compact RIO Control Unit Block Diagram . . . . . . . . . . . 47
4.1. Mode 4 (233 Hz) Strain Energy Plot and Suggested Patch Loca-
tion [7] . . . . . . . . . . . . . . . . . . . . . . . . . . . . . . . 51
4.2. Piezoelectric Actuator, Design 1 . . . . . . . . . . . . . . . . . 51
ix
Figure Page
4.3. Piezoelectric Actuator, Design 2 (with embedded sensor) . . . 51
4.4. Piezoelectric Actuator Orientation on the Ventral Fin. . . . . 53
4.5. Laser Vibrometer Scan Pattern . . . . . . . . . . . . . . . . . 56
4.6. Principle Strain Vector Fields . . . . . . . . . . . . . . . . . . 56
4.7. Piezoelectric Patch Installation Using Surface Vacuum Bagging 57
4.8. Piezoelectric Patches Installed on the Ventral Fin, AFIT Labo-
ratory . . . . . . . . . . . . . . . . . . . . . . . . . . . . . . . 58
4.9. Piezoelectric Drive Amplifier Schematic (Simplified) . . . . . . 60
4.10. Piezoelectric Drive Amplifier Transfer Function . . . . . . . . 60
4.11. Bit-Selectable Adjustable Attenuation Circuit . . . . . . . . . 61
4.12. Amplifier Assembly . . . . . . . . . . . . . . . . . . . . . . . . 62
4.13. System Block Diagram . . . . . . . . . . . . . . . . . . . . . . 63
4.14. Open-Loop Block Diagram . . . . . . . . . . . . . . . . . . . . 63
4.15. Forward Array Open-Loop Frequency Response, AFIT Labora-
tory . . . . . . . . . . . . . . . . . . . . . . . . . . . . . . . . 64
4.16. Aft Array Open-Loop Frequency Response, AFIT Laboratory 64
4.17. Experimental and ERA Model Transfer Function Comparison,
Aft Array . . . . . . . . . . . . . . . . . . . . . . . . . . . . . 65
4.18. Bench Test Setup for Closed-Loop Performance, AFIT Labora-
tory . . . . . . . . . . . . . . . . . . . . . . . . . . . . . . . . 66
4.19. Full-State vs. Reduced-State LQG Compensator . . . . . . . . 69
4.20. Instrumented Ventral Fin Installed on the Test Aircraft, Edwards
AFB . . . . . . . . . . . . . . . . . . . . . . . . . . . . . . . . 70
4.21. System Hardware Installed in the Ammo Bay of the Test Aircraft,
Edwards AFB . . . . . . . . . . . . . . . . . . . . . . . . . . . 71
4.22. OQO Handheld PC Mounted in Rear Cockpit, Edwards AFB . 71
4.23. Test Aircraft System Diagram . . . . . . . . . . . . . . . . . . 72
4.24. ACTIVE FIN Test Point Matrix [4] . . . . . . . . . . . . . . . 73
4.25. Flight Test Configuration, Edwards AFB . . . . . . . . . . . . 75
x
Figure Page
5.1. PPF Bench Test Results . . . . . . . . . . . . . . . . . . . . . 79
5.2. LQG Bench Test Results . . . . . . . . . . . . . . . . . . . . . 79
5.3. Forward Array PPF Design . . . . . . . . . . . . . . . . . . . 80
5.4. Aft Array PPF Design . . . . . . . . . . . . . . . . . . . . . . 80
5.5. Forward Array LQG Design . . . . . . . . . . . . . . . . . . . 81
5.6. Aft Array LQG Design . . . . . . . . . . . . . . . . . . . . . . 81
5.7. Forward Array Frequency Response, Ground Testing . . . . . 84
5.8. Aft Array Frequency Response, Ground Testing . . . . . . . . 85
5.9. Forward Array Closed-Loop Response, Ground Testing . . . . 85
5.10. Aft Array Closed-Loop Response, Ground Testing . . . . . . . 86
5.11. Sensor Voltage Level Comparison . . . . . . . . . . . . . . . . 88
5.12. Flight Test Frequency Response, 10,000 feet Pressure Altitude,
0.90 Mach [4] . . . . . . . . . . . . . . . . . . . . . . . . . . . 89
5.13. Flight Test Mode 2 Peak Magnitude Response, 10,000 feet Pres-
sure Altitude, Transonic [4] . . . . . . . . . . . . . . . . . . . . 89
5.14. Flight Test Frequency Response, Powered Approach Configura-
tion, 15,000 feet Pressure Altitude [4] . . . . . . . . . . . . . . 90
5.15. Sensor and Amplifier Output Voltage, Flight Test, 15,000 feet,
0.30 Mach, 1g Level Flight, Powered Approach . . . . . . . . . 92
5.16. Sensor and Amplifier Output Voltage, Flight Test, 7,500 feet,
0.95 Mach, 1g Level Flight . . . . . . . . . . . . . . . . . . . . 92
5.17. Amplifier Output Simulation Using Flight Test Sensor Input
(7,500 feet, 0.95 Mach, 1g Level Flight) and Amplifier Transfer
Function Model (Figure 4.10) . . . . . . . . . . . . . . . . . . 93
xi

List of TablesTable Page
4.1. Block 15 F-16 Ventral Fin Historical Modal Frequencies [7] . . 50
4.2. Piezoelectric Actuator/Sensor Specifications1 . . . . . . . . . . 52
4.3. Ventral Fin Test Article Natural Frequency Comparison . . . . 54
4.4. Ventral Fin Mode Shapes . . . . . . . . . . . . . . . . . . . . . 55
4.5. Piezoelectric Sensor Output Configuration . . . . . . . . . . . 61
4.6. Frequency Spectrum Estimation Parameters . . . . . . . . . . 75
5.1. Positive Position Feedback Laboratory Optimization . . . . . . 82
5.2. Linear Quadratic Gaussian Laboratory Optimization . . . . . 83
5.3. Ventral Fin Natural Frequency Comparison [4] . . . . . . . . . 87
6.1. Summary of Test Results . . . . . . . . . . . . . . . . . . . . . 96
xii

List of SymbolsSymbol Page
d33 Transverse Piezoelectric Charge Constant . . . . . . . . . 27
ε1 Principle Strain . . . . . . . . . . . . . . . . . . . . . . . . 31
θ Principle Strain Direction . . . . . . . . . . . . . . . . . . 32
Q Charge . . . . . . . . . . . . . . . . . . . . . . . . . . . . 32
T Stress . . . . . . . . . . . . . . . . . . . . . . . . . . . . . 32
C Capacitance . . . . . . . . . . . . . . . . . . . . . . . . . . 32
ε33 Dielectric Permittivity . . . . . . . . . . . . . . . . . . . . 32
E Young’s Modulus . . . . . . . . . . . . . . . . . . . . . . . 32
R Radius of Curvature . . . . . . . . . . . . . . . . . . . . . 32
H Hankel Matrix . . . . . . . . . . . . . . . . . . . . . . . . 34
P (s) Plant Transfer Function . . . . . . . . . . . . . . . . . . . 35
G(s) Compensator Transfer Function . . . . . . . . . . . . . . . 35
ωn Natural Frequency . . . . . . . . . . . . . . . . . . . . . . 36
ωc Compensator Frequency . . . . . . . . . . . . . . . . . . . 36
ζn Damping Ratio . . . . . . . . . . . . . . . . . . . . . . . . 36
ζc Compensator Damping Ratio . . . . . . . . . . . . . . . . 36
g Scalar Gain . . . . . . . . . . . . . . . . . . . . . . . . . . 36
φ Phase Angle . . . . . . . . . . . . . . . . . . . . . . . . . . 37
K Feedback Gain Matrix . . . . . . . . . . . . . . . . . . . . 41
Q State Weighting Matrix . . . . . . . . . . . . . . . . . . . 41
R Control Penalty Matrix . . . . . . . . . . . . . . . . . . . 41
P Matrix of Proportionality . . . . . . . . . . . . . . . . . . 42
v Voltage . . . . . . . . . . . . . . . . . . . . . . . . . . . . 50
qn State Weighting Constant . . . . . . . . . . . . . . . . . . 68
r Control Penalty Constant . . . . . . . . . . . . . . . . . . 68
xiii

List of AbbreviationsAbbreviation Page
USAF United States Air Force . . . . . . . . . . . . . . . . . . . iv
TPS Test Pilot School . . . . . . . . . . . . . . . . . . . . . . . iv
LANTIRN Low Altitude Navigation and Targeting Infared for Night . 2
USAF United States Air Force . . . . . . . . . . . . . . . . . . . 3
BLA Buffet Load Alleviation . . . . . . . . . . . . . . . . . . . 4
ACROBAT Actively Controlled Response of Buffet-Affected Tails . . . 4
ASE Aero-servoelastic . . . . . . . . . . . . . . . . . . . . . . . 4
TPS Test Pilot School . . . . . . . . . . . . . . . . . . . . . . . 7
PZT Lead Zirconate Titanate . . . . . . . . . . . . . . . . . . . 12
PVDF Polyvinylidene Fluoride . . . . . . . . . . . . . . . . . . . 12
MFC Macro-Fiber Composite . . . . . . . . . . . . . . . . . . . 14
mm millimeter . . . . . . . . . . . . . . . . . . . . . . . . . . . 15
Hz Hertz . . . . . . . . . . . . . . . . . . . . . . . . . . . . . 15
SISO Single-Input Single-Output . . . . . . . . . . . . . . . . . 16
LQG Linear Quadratic Gaussian . . . . . . . . . . . . . . . . . 22
dB Decibel . . . . . . . . . . . . . . . . . . . . . . . . . . . . 23
PSD Power Spectral Density . . . . . . . . . . . . . . . . . . . 23
PPF Positive Position Feedback . . . . . . . . . . . . . . . . . . 23
IGBT Isolated Gate Bipolar Transistors . . . . . . . . . . . . . . 25
mA milliamps . . . . . . . . . . . . . . . . . . . . . . . . . . . 25
uF micro-Farad . . . . . . . . . . . . . . . . . . . . . . . . . . 26
FEM Finite Element Model . . . . . . . . . . . . . . . . . . . . 27
ERA Eigensystem Realization Algorithm . . . . . . . . . . . . . 33
RMS Root Mean Square . . . . . . . . . . . . . . . . . . . . . . 35
LQR Linear Quadratic Regulator . . . . . . . . . . . . . . . . . 39
xiv

Abbreviation Page
cRIO Compact Reconfigurable Input-Output . . . . . . . . . . . 46
A/D Analog-to-Digital . . . . . . . . . . . . . . . . . . . . . . . 46
D/A Digital-to-Analog . . . . . . . . . . . . . . . . . . . . . . . 46
FPGA Field Programmable Gate Array . . . . . . . . . . . . . . 48
PWM Pulse Width Modulation . . . . . . . . . . . . . . . . . . . 58
kHz Kilohertz . . . . . . . . . . . . . . . . . . . . . . . . . . . 58
EMI Electromagnetic Interference . . . . . . . . . . . . . . . . . 58
G Load Factor . . . . . . . . . . . . . . . . . . . . . . . . . . 58
AFB Air Force Base . . . . . . . . . . . . . . . . . . . . . . . . 69
DAS Data Acquisition System . . . . . . . . . . . . . . . . . . . 70
OQO Hand-held personal computer model name . . . . . . . . . 70
AOA Angle of Attack . . . . . . . . . . . . . . . . . . . . . . . . 73
PA Powered-Approach (landing gear down at approach speed) 87
KCAS Knots Calibrated Airspeed . . . . . . . . . . . . . . . . . . 88
xv
F-16 Ventral Fin Buffet Alleviation
Using Piezoelectric Actuators
I. Introduction
Active control of structural vibrations, a well explored topic in recent years,
has seen application with flexible spacecraft structures [21], helicopter airframes [12],
and even downhill skis [15] with some success. However, the challenge of suppressing
structural vibrations in modern high performance aircraft has proven difficult for some
time. The capability of modern fighter aircraft to sustain flight at high speeds, high
angles of attack, and/or moderate angles of side slip often results in unsteady, vortical
flow around parts of the aircraft’s body. In most cases, this flow contains significant
levels of energy over a frequency bandwidth common with structural vibration modes
of wings, fins, and other surfaces [6]. The resulting unsteady pressures developed
on these surfaces is referred to as buffet. Early fatigue and the generation of cracks
result from prolonged exposure to buffeting. In order to sustain operational readiness
of affected aircraft, resources must be spent analyzing, repairing, maintaining, and in
some cases redesigning structures susceptible to buffet damage.
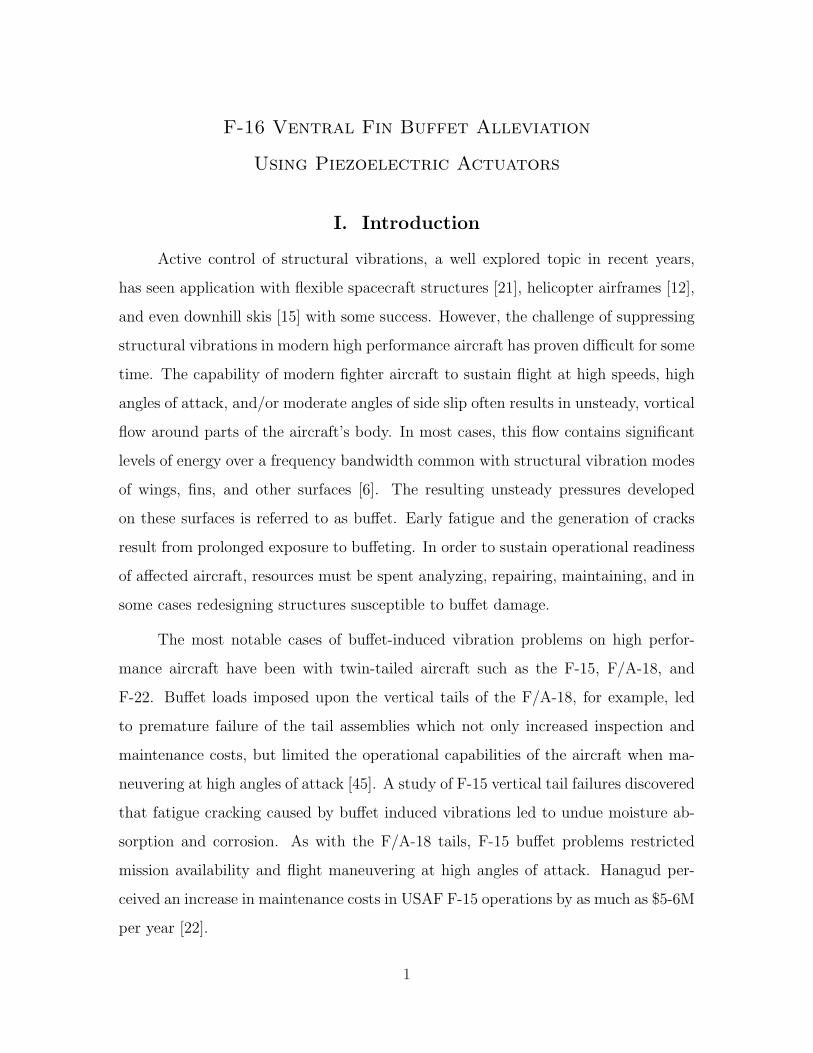
The most notable cases of buffet-induced vibration problems on high perfor-
mance aircraft have been with twin-tailed aircraft such as the F-15, F/A-18, and
F-22. Buffet loads imposed upon the vertical tails of the F/A-18, for example, led
to premature failure of the tail assemblies which not only increased inspection and
maintenance costs, but limited the operational capabilities of the aircraft when ma-
neuvering at high angles of attack [45]. A study of F-15 vertical tail failures discovered
that fatigue cracking caused by buffet induced vibrations led to undue moisture ab-
sorption and corrosion. As with the F/A-18 tails, F-15 buffet problems restricted
mission availability and flight maneuvering at high angles of attack. Hanagud per-
ceived an increase in maintenance costs in USAF F-15 operations by as much as $5-6M
per year [22].
1
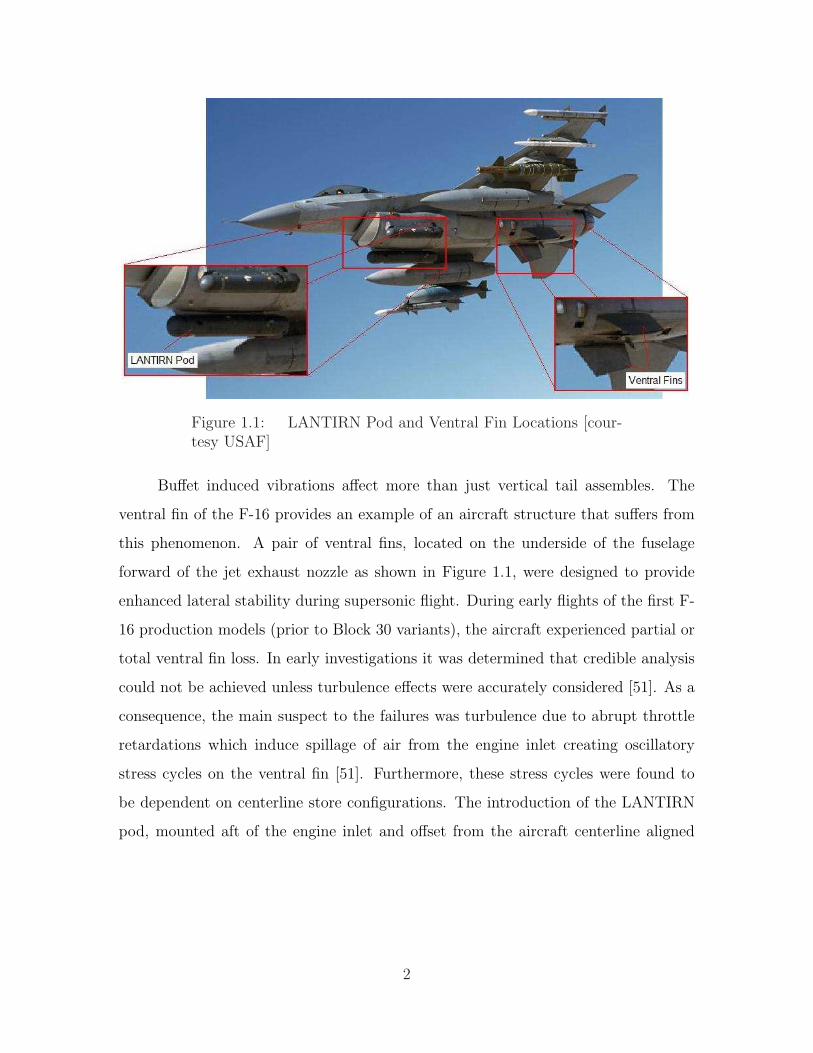
Figure 1.1: LANTIRN Pod and Ventral Fin Locations [cour-tesy USAF]
Buffet induced vibrations affect more than just vertical tail assembles. The
ventral fin of the F-16 provides an example of an aircraft structure that suffers from
this phenomenon. A pair of ventral fins, located on the underside of the fuselage
forward of the jet exhaust nozzle as shown in Figure 1.1, were designed to provide
enhanced lateral stability during supersonic flight. During early flights of the first F-
16 production models (prior to Block 30 variants), the aircraft experienced partial or
total ventral fin loss. In early investigations it was determined that credible analysis
could not be achieved unless turbulence effects were accurately considered [51]. As a
consequence, the main suspect to the failures was turbulence due to abrupt throttle
retardations which induce spillage of air from the engine inlet creating oscillatory
stress cycles on the ventral fin [51]. Furthermore, these stress cycles were found to
be dependent on centerline store configurations. The introduction of the LANTIRN
pod, mounted aft of the engine inlet and offset from the aircraft centerline aligned
2
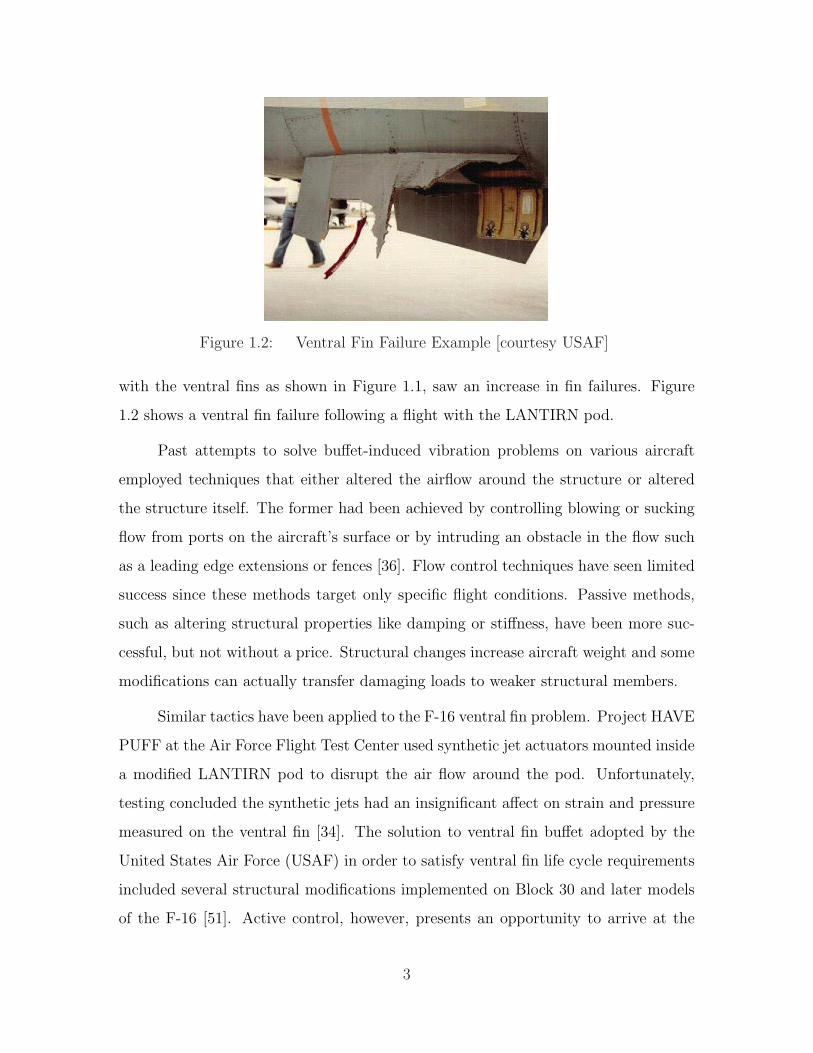
Figure 1.2: Ventral Fin Failure Example [courtesy USAF]
with the ventral fins as shown in Figure 1.1, saw an increase in fin failures. Figure
1.2 shows a ventral fin failure following a flight with the LANTIRN pod.
Past attempts to solve buffet-induced vibration problems on various aircraft
employed techniques that either altered the airflow around the structure or altered
the structure itself. The former had been achieved by controlling blowing or sucking
flow from ports on the aircraft’s surface or by intruding an obstacle in the flow such
as a leading edge extensions or fences [36]. Flow control techniques have seen limited
success since these methods target only specific flight conditions. Passive methods,
such as altering structural properties like damping or stiffness, have been more suc-
cessful, but not without a price. Structural changes increase aircraft weight and some
modifications can actually transfer damaging loads to weaker structural members.
Similar tactics have been applied to the F-16 ventral fin problem. Project HAVE
PUFF at the Air Force Flight Test Center used synthetic jet actuators mounted inside
a modified LANTIRN pod to disrupt the air flow around the pod. Unfortunately,
testing concluded the synthetic jets had an insignificant affect on strain and pressure
measured on the ventral fin [34]. The solution to ventral fin buffet adopted by the
United States Air Force (USAF) in order to satisfy ventral fin life cycle requirements
included several structural modifications implemented on Block 30 and later models
of the F-16 [51]. Active control, however, presents an opportunity to arrive at the
3
same result by a potentially lighter and more efficient means. In fact, recent and
ongoing research have explored various active control methods to help alleviate buffet
vibrations on many different aircraft. Piezoelectric actuators, in particular, have
shown great promise in the active control of buffet vibrations [22, 36,45].
Significant research, accomplished by the multinational F/A-18 Buffet Load Al-
leviation (BLA) program, investigated multiple techniques in alleviating buffet loads
on the aircraft’s vertical tails including the use of piezoelectric actuators. Lazarus,
Saarmaa, and Agnes [29] developed an analytical model using distributed, layered
piezoelectric actuators bonded to the F/A-18 vertical tail that indicated a 50% re-
duction in the root-mean-square strain at the root of the tail during simulated flight
conditions. Moses investigated active control on a 1/6-scale F/A-18 model in a wind
tunnel as part of the Actively Controlled Response Of Buffet-Affected Tails (ACRO-
BAT) program and found a reduction of root-mean-square values of tail root strain
by as much as 19% [35].
Despite the promise of piezoelectric actuators, the active control of buffet vibra-
tions using piezoelectric actuators has not been tested on actual aircraft structures
beyond the wind tunnel. At the time of print, the only flight-demonstrated effort to
employ piezoelectrics for the suppression of vibrations on an aircraft structure was
that of the Air Force Research Laboratory in the suppression of acoustic vibrations
on a skin panel of the B-1 aircraft [18]. The F-16 ventral fin presents an excellent
test structure for research of active control in actual flight conditions. Fortunately,
ventral fin damage does not affect flight safety for subsonic flight. In fact, during past
cases, the pilot had no indication of fin failure during nominal flight conditions.
Captain Shawn Morgenstern began research [7] for the application of piezoelec-
tric actuators to actively control buffet vibrations on the F-16 ventral fin in 2006.
Using finite element and aero-servoelastic (ASE) analysis, Morgenstern arrived at
design recommendations for piezoelectric actuators based on strain energy density
and principle strain vectors for an optimized model. He used the ZAERO [54] ASE
4
software module and flight test data [34] to analyze the first six modes of vibration
and highlighted the first, second, and fourth modes as the most critical to ventral fin
failure. What remained was the implementation of Morgenstern’s design recommen-
dations and the development of a suitable autonomous control system to determine
the effectiveness of piezoelectric actuators to alleviate buffet induced vibrations on
the ventral fin
1.1 Problem/Scope
The research problem presented in this thesis was the development of an au-
tonomous active control system using collocated piezoelectric actuators and sensors
to alleviate the buffet response of the first and second vibration modes of an F-16
Block 15 ventral fin during ground and flight tests. It is important to note that this
research is not to mitigate the failure of Block 15 ventral fins, but takes advantage of
the susceptibility of Block 15 ventral fins to aerodynamic buffet in order to evaluate
the effectiveness of closed-loop control of piezoelectric actuators.
The scope of this research included (a) the specification of piezoelectric actua-
tors and sensors as elements in the active control system, (b) an investigation of the
techniques used to define the frequency response of the ventral fin and its transla-
tion to the state-space, (c) the development of a closed-loop control algorithm using
collocated piezoelectric actuators and sensors, and (d) the integration of the con-
trol system, including controller hardware, custom designed switching amplifiers, and
user interfaces, onto an F-16 aircraft for flight evaluation. The two control algo-
rithms explored were positive position feedback and Linear Quadratic Gaussian com-
pensator designs. These algorithms were implemented in independent single-input
single-output modal control schemes. In order to demonstrate the system in flight,
an appropriate power amplifier capable of driving the capacitive load of piezoelectric
actuators at high voltage was designed and built. Other hardware components used
in the flight demonstration, such as the cockpit user interface and digital controller,
were specified and purchased commercial-off-the-shelf.
5
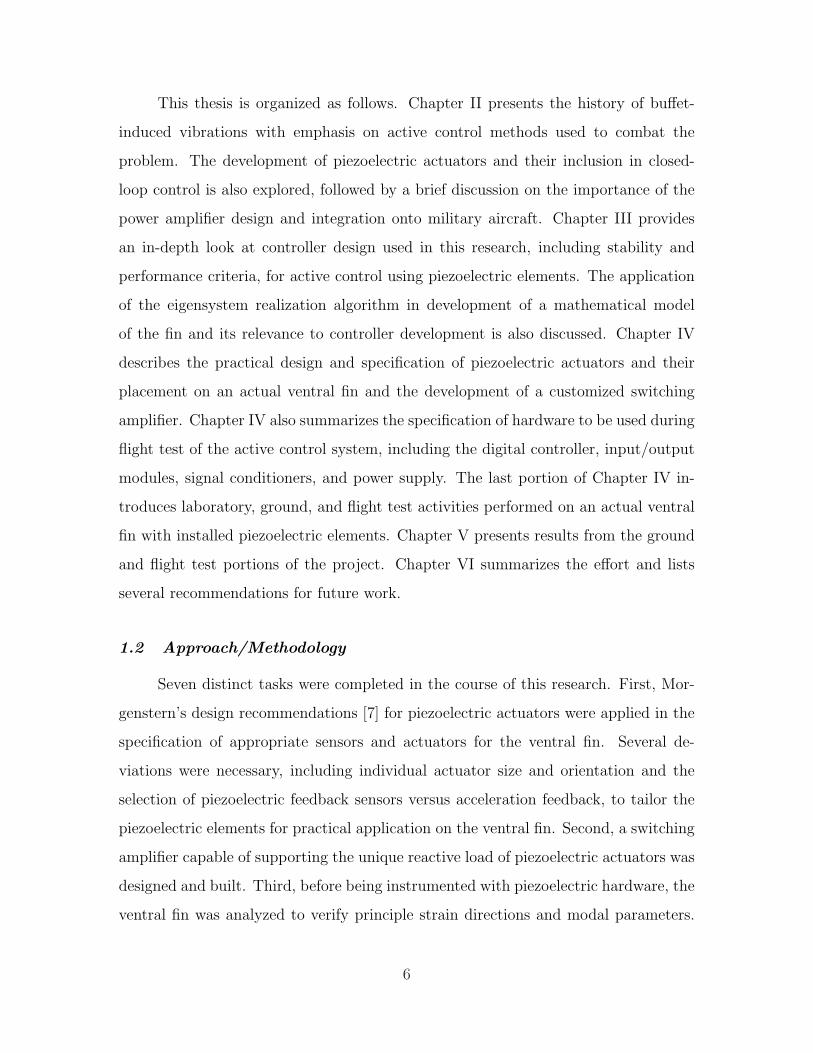
This thesis is organized as follows. Chapter II presents the history of buffet-
induced vibrations with emphasis on active control methods used to combat the
problem. The development of piezoelectric actuators and their inclusion in closed-
loop control is also explored, followed by a brief discussion on the importance of the
power amplifier design and integration onto military aircraft. Chapter III provides
an in-depth look at controller design used in this research, including stability and
performance criteria, for active control using piezoelectric elements. The application
of the eigensystem realization algorithm in development of a mathematical model
of the fin and its relevance to controller development is also discussed. Chapter IV
describes the practical design and specification of piezoelectric actuators and their
placement on an actual ventral fin and the development of a customized switching
amplifier. Chapter IV also summarizes the specification of hardware to be used during
flight test of the active control system, including the digital controller, input/output
modules, signal conditioners, and power supply. The last portion of Chapter IV in-
troduces laboratory, ground, and flight test activities performed on an actual ventral
fin with installed piezoelectric elements. Chapter V presents results from the ground
and flight test portions of the project. Chapter VI summarizes the effort and lists
several recommendations for future work.
1.2 Approach/Methodology
Seven distinct tasks were completed in the course of this research. First, Mor-
genstern’s design recommendations [7] for piezoelectric actuators were applied in the
specification of appropriate sensors and actuators for the ventral fin. Several de-
viations were necessary, including individual actuator size and orientation and the
selection of piezoelectric feedback sensors versus acceleration feedback, to tailor the
piezoelectric elements for practical application on the ventral fin. Second, a switching
amplifier capable of supporting the unique reactive load of piezoelectric actuators was
designed and built. Third, before being instrumented with piezoelectric hardware, the
ventral fin was analyzed to verify principle strain directions and modal parameters.
6

Fourth, a National Instruments Inc. digital controller was programmed using the
LabVIEWTM
software package to implement control algorithms, cockpit user inter-
faces, and data recording functions for ground and flight test activities. Fifth, the
entire control system, including controller hardware, switching amplifier, and ventral
fin instrumented with all piezoelectric hardware was tested in the laboratory to ver-
ify total control system performance and stability. Finally, the control system was
installed on a F-16, ground and flight tested, and critiqued by the USAF Test Pilot
School (TPS), Class 08B.
7
II. Literature Review
The harmful impact of the aeroelastic phenomenon known as buffet on military air-
craft is well documented [7, 14, 22, 35, 51]. Technology and techniques employed to
prevent it have been equally extensive [1, 6, 29, 34, 36, 38, 45]. The following review
discusses the history of the buffet problem of military aircraft and presents the appli-
cability of piezoelectrics for an active control solution. An introduction to piezoelec-
tric actuator development and research towards buffet vibration control is provided.
Active control system design considerations, including control algorithm techniques
and power amplifier design given the unique environment of military aircraft, are also
explored.
2.1 History of the Buffet-Induced Vibration Problem
In order to carry out various missions, military aircraft are forced to operate in
harsh environments within large flight envelopes. High performance fighter aircraft,
in particular, operate regularly in multi-role missions that require high-g and high
speed maneuverability. Moreover, today’s militaries are often forced to use aging
aircraft in growing roles relying on structural or aerodynamic modifications to meet
new mission requirements. Operating in extreme conditions at such high performance
with multiple modifications produces an ideal environment for the damaging effect
of the aerodynamic problem known as buffet [14]. Buffet “occurs when turbulent
airflow interacts with an aerodynamic structure, exciting the vibrational modes of
that structure” [7]. Severe buffet often results in large amplitude vibrations that can
severely damage the structure or limit its useful life.
The most notable cases of aerodynamic buffet in military aircraft is that which
plague the vertical tails of high performance twin tailed aircraft such as the F-15,
F/A-18 and F-22. The F-15 vertical tails have undergone three major redesigns in an
effort to prevent fatigue cracking that was discovered only a year after its operational
debut. Each design change was aimed at modifying stiffness properties of the tail.
However, cracking continued because the structural modifications inevitably trans-
8
ferred damaging loads to weaker areas, depending on excitation frequencies [22]. Not
until 1988, in an effort led by the Georgia Institute of Technology at the request of the
USAF, was buffet finally understood as the likely cause of the fatigue cracking. Most
severe at high angles of attack, tail buffet occurred when unsteady pressures associ-
ated with separated flow from the leading edge of the wings excited vibrational modes
of the vertical tail assembly. Not only had these problems increased maintenance costs
by requiring frequent inspections and repair, but they led to other problems such as
internal corrosion and the limitation of the flight maneuver envelope.
Harmful buffet induced vibrations are not limited to vertical tails, but can affect
antennas, skin panels and fins. The F-16 ventral fin, as shown in Figure 1.1, is an
excellent example. Early F-16 models saw damage including total or partial loss of the
ventral fin without pilot awareness. The problems were initially linked to inlet spillage
turbulence during rapid decelerations [51]. Fortunately, damage to the fin was not a
safety-of-flight concern as the fin was designed to enhance lateral stability during high
speed flight, but continued failures elevated maintenance costs and affected mission
availability. More failures occurred with the introduction of the LANTIRN pod, which
is mounted aft of the engine inlet directly upstream from the ventral fin. Research
conducted by the National Aerospace Laboratory in the Netherlands [51] pointed
toward unsteady, separated flow downstream of the LANTIRN pod as a likely cause
of elevated buffet loading in the fin. Several redesigns of the fin, centered around
stiffness modifications, were attempted before a final design was accepted for Block-
40 and later F-16 models.
Structural changes, in many cases, can lead to increased weight and cost, both a
premium for high performance military aircraft. Although the redesigned ventral fins
were able to meet life cycle requirements, other passive or active buffet alleviation
techniques could provide a more efficient solution. For example, passive attempts
for controlling buffet on the F/A-18, such as leading edge blowing/sucking or wing
and fuselage fences, targeted vortex control as a way of influencing unsteady air flow
around the vertical tails at high angles of attack. Leading edge fences used on the
9

F/A-18 were found to reduce the steady and unsteady pressures on the vertical tails
where buffet problems occurred [35]. Still, these techniques provided limited success
because they were only effective in specific flight conditions [36]. Also, there were
concerns of detrimental effects to aircraft performance.
The use of smart materials in active control systems has shown great potential
in buffet vibration problems. In 1995, a 1/6 scale F/A-18 model was tested in the
Transonic Dynamics Tunnel at the NASA Langley Research Center as part of the
ACROBAT program to assess the use of various active control systems in reducing
vertical tail buffet [35]. The techniques explored included active rudder control, an
actuated tip-vane, and piezoelectric ceramic wafer actuators attached to the tail’s
surface in areas of maximum strain density. The piezoelectric actuators, controlled
by frequency domain compensation methods using strain gauges and accelerometers as
feedback sensors, accounted for a 60% reduction in peak power spectral density values
of the root bending moment of the wind tunnel model. In addition, the piezoelectric
actuators maintained effectiveness during all tested flight conditions. Although the
active rudder techniques appeared equally effective at low angles of attack, the rudder
lost effectiveness as flow separated from the aircraft at higher angles of attack [36].
Since the tests of the ACROBAT program, piezoelectrics received much atten-
tion as a solution to buffet vibrations. The next section addresses the development
of piezoelectric actuators and their application to buffet alleviation problems.
2.2 Piezoelectricity and its Application to Buffet Alleviation
Piezoelectricity, meaning pressure electricity, was first termed after the research
of Pierre and Jaques Curie in 1880 who discovered that a weight placed on a crystal
produced a charge proportional to the weight [40]. The Curies had, in fact, discovered
the direct piezoelectric effect: the generation of an electric charge by a piezoelectric
material when subjected to a mechanical strain. Subsequently, the Curies also dis-
covered the reciprocal piezoelectric effect: when subjected to an electric charge, a
piezoelectric material generates proportional strain. The presence of the direct and
10
reciprocal effects gives way to the ability of piezoelectric materials to function in many
applications where the sensing or actuation of strain is desired [16].
There remain several other characteristics of piezoelectric materials pertinent
to this research. First, dealing with the reciprocal piezoelectric effect, the elastic
deformation in piezoelectric materials, whether they contract or elongate, depends on
the sign and magnitude of the applied electric field. Second, the piezoelectric effect
maintains a linear relationship between its electrical and mechanical properties [25].
For example, a piezoelectric sensor produces electric charges that are proportional to
the change in deformation as long as the frequencies of deformations remain within
the bandwidth of the sensor. Third, a piezoelectric material generally enjoys the
advantage of a relatively short time constant, meaning it can respond to an applied
electric field with little time delay. Finally, in order for the piezoelectric effect to
occur, the material must be anisotropic and electrically poled [13], which means an
electric field must be maintained throughout the material. This polarization, as well
as the development of stress and strain within the material, is used to classify the
response properties of piezoelectric materials and is denoted by the piezoelectric strain
coefficient, dmn, more commonly called the charge constant. The subscripts of the
charge constant describe the application of the electric field and the corresponding
strain or deflection within the material. In a d31 actuator, for example, the electric field
is applied along the 1-axis where deflection occurs along the 3-axis. A visualization
of the two piezoelectric actuation mechanisms is shown in Figure 2.1.
Since the Curies’ discovery, piezoelectricity has aided advances in sonar tech-
nology, communication, crystal filters, high-frequency speakers, microphones, and ac-
celerometers just to name a few [40]. Not until recently have research efforts extended
piezoelectricity to the field of smart structures. The term ‘smart structures’ describes
the integration of sensors and actuators, along with communication channels, proces-
sors, and other necessary components, into structural elements to obtain a state of
desired static or dynamic control [13]. It is important to make the delineation between
smart structures and smart materials, though the definitions may not be clear in the
11
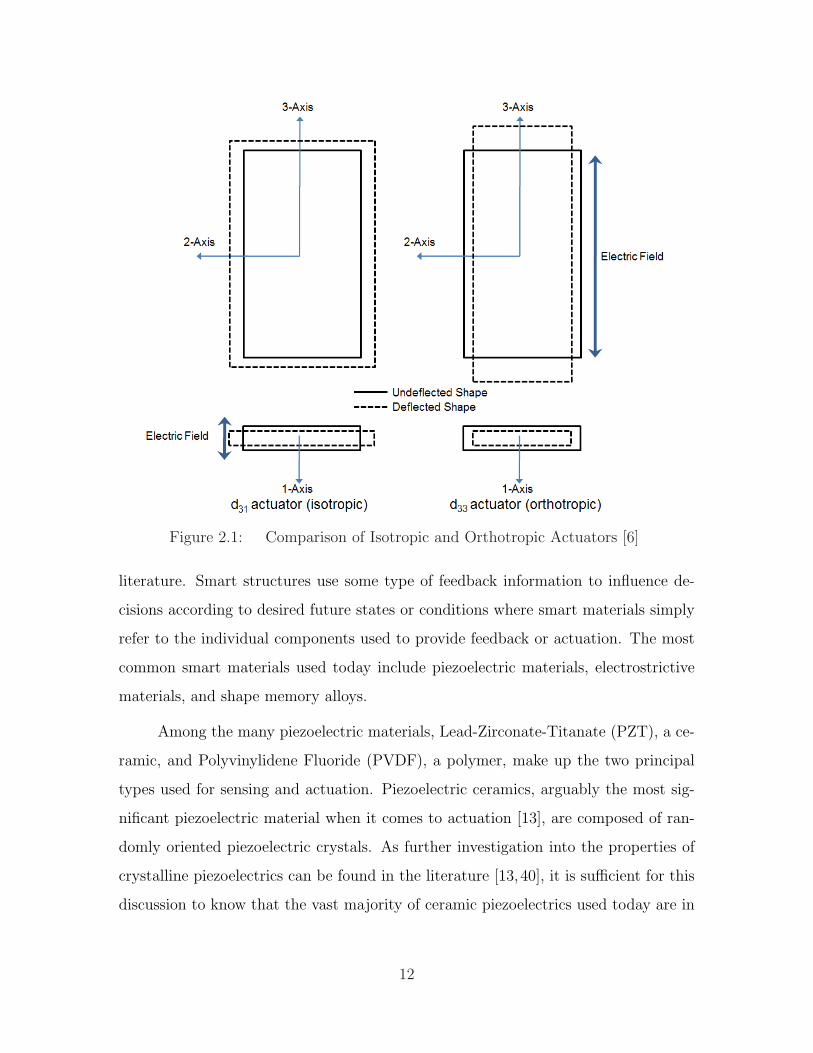
Figure 2.1: Comparison of Isotropic and Orthotropic Actuators [6]
literature. Smart structures use some type of feedback information to influence de-
cisions according to desired future states or conditions where smart materials simply
refer to the individual components used to provide feedback or actuation. The most
common smart materials used today include piezoelectric materials, electrostrictive
materials, and shape memory alloys.
Among the many piezoelectric materials, Lead-Zirconate-Titanate (PZT), a ce-
ramic, and Polyvinylidene Fluoride (PVDF), a polymer, make up the two principal
types used for sensing and actuation. Piezoelectric ceramics, arguably the most sig-
nificant piezoelectric material when it comes to actuation [13], are composed of ran-
domly oriented piezoelectric crystals. As further investigation into the properties of
crystalline piezoelectrics can be found in the literature [13,40], it is sufficient for this
discussion to know that the vast majority of ceramic piezoelectrics used today are in
12
the PZT family chiefly because PZTs exhibit high piezoelectric activity and can be
molded in a variety of arrangements tailored to specific applications.
Efforts to characterize or control aerodynamic vibrations with piezoelectric ma-
terials surfaced in the 1990s and included research in structural health monitoring [8],
acoustic vibration control [18], and the alleviation of buffet-induced vibrations as-
sociated with high performance twin-tailed aircraft [22, 35]. Early on, PZT ceramic
wafers were the most common piezoelectric actuator associated with vibration sup-
pression [22]. However, PZT wafers presented several limitations when used with
aircraft structures. First, their brittle nature led to disbondment or fracture in the
presence of large-amplitude vibrations. Second, their rigid construction complicated
installation on curved surfaces like those of modern aircraft. Finally, single PZT wafers
typically employed the transverse d31 charge constant. In order to obtain sufficient
control authority for most structural applications, large quantities of PZT ceramic
wafers were arranged in stack configurations and oriented to collectively employ the
stronger longitudinal d33 charge constant. Depending on design, these stacks could
be bulky complicating installation within aircraft structures.
Nevertheless, in 1995, an effort at tail buffet alleviation on the F-15 led by
Hanagud et al. [22] used piezoceramic stack actuators in an acceleration feedback
control system with good results. During wind tunnel experiments using a scale
model, the root-mean-square of vertical tail tip accelerations were reduced by as
much as 30%. As mentioned previously, the ACROBAT program in 1995, an effort to
control buffet induced vibrations on a wind tunnel model of the F/A-18 vertical tail,
used piezoelectric ceramic wafers and arrived at as much as 60% reduction in peak
power spectral density values of the tail root bending moment [35]. Piezoceramic
wafers were also ground tested on a full scale F/A-18 vertical tail in 1997. The wafer
actuators were effective at suppressing the vibration response of the vertical tail but
several problems were identified, including insufficient control authority, which became
apparent when conditions approached the maximum expected buffet load [20].
13
Piezoceramic composite actuators, like the macro-fiber composite (MFC) devel-
oped by the NASA Langley Research Center, presented a solution to the limitations
of ceramic wafers. The following is an excerpt from the commercial brochure of
Smart-Material Corporation which manufactures MFCs based on the NASA design.
The MFC is an innovative actuator that offers high performance andflexibility in a cost-competitive device. The MFC consists of rectangularpiezoceramic rods sandwiched between layers of adhesive and electrodedpolyimide film. This film contains interdigitated electrodes that transferthe applied voltage directly to and from the ribbon shaped rods. This as-sembly enables in-plane poling, actuation, and sensing in a sealed, durable,ready-to-use package. When embedded in a surface or attached to flex-ible structures, the MFC provides distributed solid-state deflection andvibration control or strain measurements [47].
Made possible by its interdigitated electrodes, MFCs employ the stronger longitudinal
d33 charge constant enabling greater electromechanical coupling than traditional PZT
wafers. Burnham et.al. [6], who studied the use of piezoceramic composite actuators
on the F/A-18 vertical tail, reported that actuators with interdigitated electrodes
using the d33 charge constant outperformed those using the d31 constant by a factor
of three for the same piezoelectric material. In addition, Burnham compared various
piezoelectric actuators in production during the year 2000 and concluded that the
MFC design produced by NASA exhibited the lowest ratio of required voltage to
limit voltage, a favorable quality when accounting for high voltage sources required
to drive piezoelectric actuators.
Macro-fiber composites also enjoy the advantage of flexibility over traditional
PZT wafers. The use of piezo-fibers instead of wafers allow for greater damage re-
sistance and simplified installation, especially on curved surfaces. The combination
of the d33 charge constant and greater flexibility provides for larger forces and free
displacements. For these reasons, also reflected in Morgenstern’s design recommenda-
tions [7], only piezoelectric actuators of the MFC design using the d33 charge constant
were considered in this research.
14

The most recent research for buffet-alleviation techniques using piezoelectric
materials involved piezoceramic composite actuators with interdigitated electrodes.
Moses, et.al. [43], as part of the Evaluation of New Actuators in a Buffet Loads
Environment (ENABLE) program, investigated the performance of two interdigitated
electrode actuators using the d33 charge constant, the MFC designed by NASA and the
Active Fiber Composite actuator designed by the Continuum Control Corporation.
The actuators were evaluated on the vertical tails of a 1/6 scale model F/A-18 in
the Transonic Dynamics Tunnel at NASA Langley and “performed similarly and
superbly in reducing structural responses caused by buffet” [43]. In 2000, Burnham
et al. [6] showed that a 1.5 mm thick multilayered directional actuator having the
same properties as the MFC outperformed other actuator designs in a finite element
analysis. In 2003, after NASA modified manufacturing processes to enable affordable
and repeatable construction of MFC actuators, the F/A-18 BLA program moved again
to a full-scale ground test of an active control system, this time using the MFC design
instead of piezoceramic wafers. The MFC actuators were attached to the surface of
a full-scale vertical tail in an area of maximum strain density and used to control
the first-torsion mode (45 Hz). Various control algorithms were evaluated during
different load cases. Although not effective for all control algorithms evaluated, the
MFC actuators showed encouraging levels of vibration suppression and an estimated
increase in fatigue life at critical locations from 7,500 hours to 12,540 hours [38].
As shown in this discussion, the use of smart materials in an active control
system can reduce the damaging effects of buffet vibration on military aircraft and
extend the useful life of affected structures. The capability of MFC actuators, in
particular, is promising, but success in past testing has often depended on total system
performance to include control algorithms and power supplies. The following section
provides design methodologies common in active structural control as well as pitfalls
of power supply design.
15
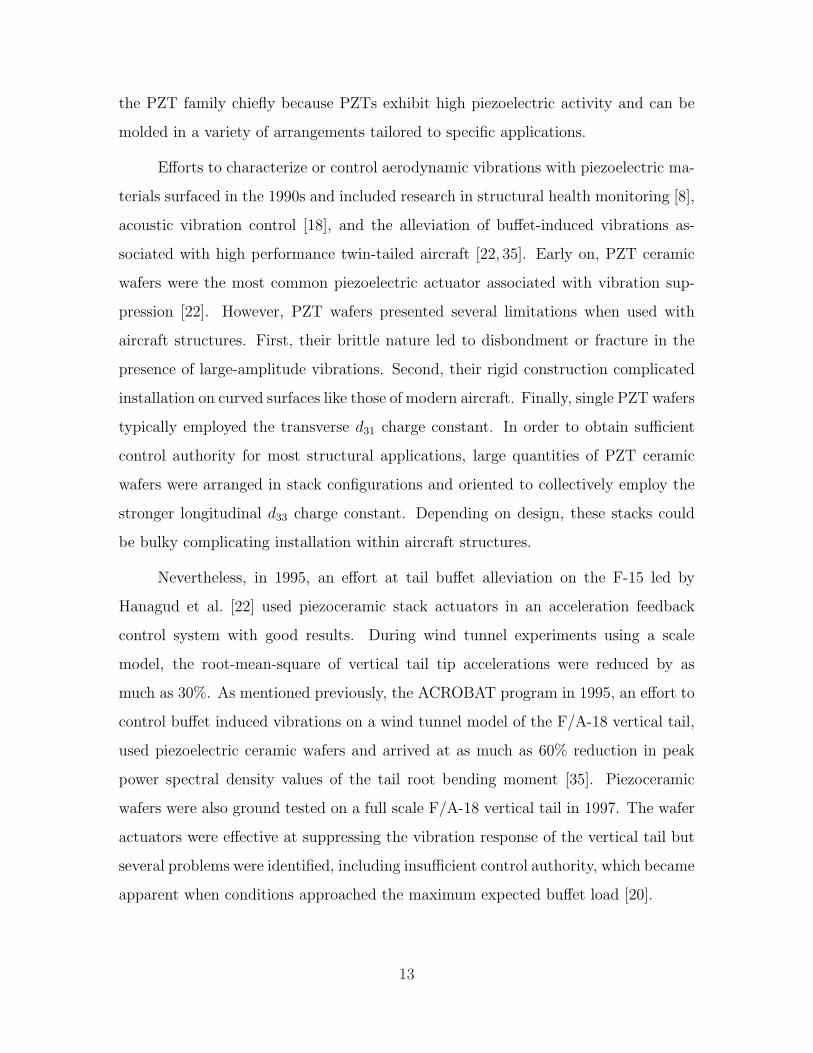
Figure 2.2: Modal Modification and Addition Techniques [1]
2.3 Control Methodologies in Buffet Alleviation
Traditional solutions to vibration control can be categorized by the intended
modal response of the actively controlled system: that which directly change the
modal properties of the system and that which introduce additional vibration modes to
the system [1]. Figure 2.2 depicts the effect of these methods to a generic single-input
single-output (SISO) frequency response function. Softening or stiffening acts to move
the natural frequency of a system, which can be advantageous when trying to avoid
specific narrow band inputs. For example, the unsteady airflow which causes buffet
on the F/A-18 vertical tails is known to occur within a narrow-band of frequencies.
Vertical tail stiffening could be tailored to move the tail’s natural frequencies away
from this narrow-band disturbance. If the natural frequency of the structure falls
outside of the buffet disturbance, buffet would have much less of a damaging impact on
the vertical tail. Modal addition essentially works the same as stiffening or softening
except that, instead of moving an existing mode, a new mode is added before or after
an existing mode, causing a shift in the existing mode away from a narrow band
input. Modal damping can be used with either technique to lower the response of a
16

system at a particular frequency and may actually shift the natural frequency slightly.
Damping is advantageous if the extent of the input is unknown or if its bandwidth is
sufficiently wide making the previously mentioned techniques ineffective.
Passive attempts to alleviate buffet vibration on the ventral fin of the F-16
mentioned in the previous section included measures that increased the stiffness of
the fin. Initially, modifications were made to strengthen areas prone to failure, such as
the the attach bolts and the area surrounding the forward attach point. Although not
the intent of the modifications, it was known that a stiffness change to an attach point
or to that of the surrounding structure impacted modal frequenices [51]. Comparing
Block-15 ground vibration data to Block-30 and Block-40 NASTRAN simulation data
shows negligible change to mode 1 and 2 frequencies. Noticeable change occurs,
however, with higher frequency modes, the largest reported being a 12 Hz change in
Mode 6 between Block-15 and Block 40 designs [51].
Since the report of ventral fin failure analysis [51] did not account for the band-
width of the buffet disturbance, it is unclear if the stiffness modifications were able
to move any of the fin’s modal frequencies outside of the damaging range of buffet
vibrations. Morgenstern concluded, using an aeroelastic flutter analysis, that modes
1, 2 and 4 were the most critically influenced by buffet vibrations [7]. The stiffness
modifications to the ventral fin did not move these modal frequencies more than a few
Hertz; therefore, it can be assumed that the stiffness modifications did not move the
modal frequencies beyond the buffet disturbance band. Damping, therefore, remains
a viable option in affecting the frequency response of the fin.
Influencing the damping of a structure using piezoelectric actuators can be rel-
atively straightforward. For example, the strain of the structure can be fed into a
controller that applies a voltage to a piezoelectric actuator according to the sensed
strain. The response of the actuator to an applied voltage is mechanical strain which
can be designed to be equal and opposite to the detected strain, thus minimizing
net vibration. There exist numerous control development methods that can accom-
17

plish this effect, such as strain rate feedback, acceleration feedback, positive position
feedback, and other robust control techniques. However, the success of an active
control system not only depends on the effectiveness of the control algorithm but on
sensor/actuator selection and location.
2.3.1 Sensor Selection and Location. As previously stated, this research
used Morgenstern’s [7] macro-fiber composite actuator design recommendations. Mor-
genstern, however, did not specify a particular sensor for feedback control. Many sen-
sors are available for vibration control including accelerometers, strain gauges, and
piezoelectric sensors. Sensor selection, in many ways, drives control algorithm devel-
opment. In the absence of additional performance feedback, control system sensors
are often used to measure success. For example, many active control systems that
employ acceleration feedback control use acceleration levels at the location of the
sensor as a way to measure the effectiveness of the control system. Sensor placement
can also greatly influence stability characteristics of the closed-loop system. Goh
and Caughey [21] showed that the presence of observation spillover, a consequence of
the interaction of sensor dynamics and uncontrolled or unmodeled modes within the
bandwidth of the controller, had destabilizing effects, especially when controlling low
frequency modes. They argued that careful selection and placement of sensors can
help alleviate these effects.
The majority of past attempts at controlling buffet vibrations used acceleration
feedback control. Hanagud [22] and Pototzky [38], researching buffet alleviation on
the F-15 and F/A-18 vertical tails, respectively, positioned accelerometers at the
tip of the tails near the leading edge to provide feedback. Placing accelerometers
near the free end of a cantilevered beam or plate is common because displacement
is greatest at the free end, enabling greater detectability of most vibration modes.
Both Moses [35, 43] and a team from the National Research Council of Canada [9],
in developing controllers for the F/A-18 vertical tail, evaluated two different types of
feedback sensors in several control systems, some using accelerometers mounted at the
18
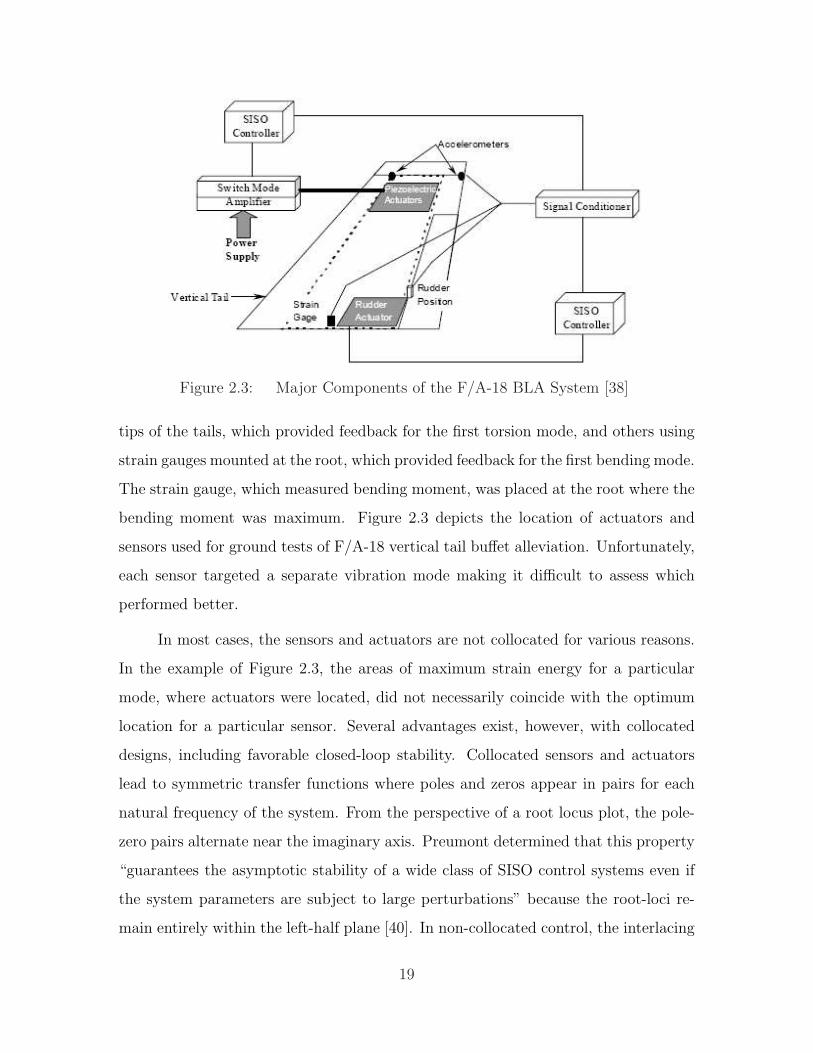
Figure 2.3: Major Components of the F/A-18 BLA System [38]
tips of the tails, which provided feedback for the first torsion mode, and others using
strain gauges mounted at the root, which provided feedback for the first bending mode.
The strain gauge, which measured bending moment, was placed at the root where the
bending moment was maximum. Figure 2.3 depicts the location of actuators and
sensors used for ground tests of F/A-18 vertical tail buffet alleviation. Unfortunately,
each sensor targeted a separate vibration mode making it difficult to assess which
performed better.
In most cases, the sensors and actuators are not collocated for various reasons.
In the example of Figure 2.3, the areas of maximum strain energy for a particular
mode, where actuators were located, did not necessarily coincide with the optimum
location for a particular sensor. Several advantages exist, however, with collocated
designs, including favorable closed-loop stability. Collocated sensors and actuators
lead to symmetric transfer functions where poles and zeros appear in pairs for each
natural frequency of the system. From the perspective of a root locus plot, the pole-
zero pairs alternate near the imaginary axis. Preumont determined that this property
“guarantees the asymptotic stability of a wide class of SISO control systems even if
the system parameters are subject to large perturbations” because the root-loci re-
main entirely within the left-half plane [40]. In non-collocated control, the interlacing
19
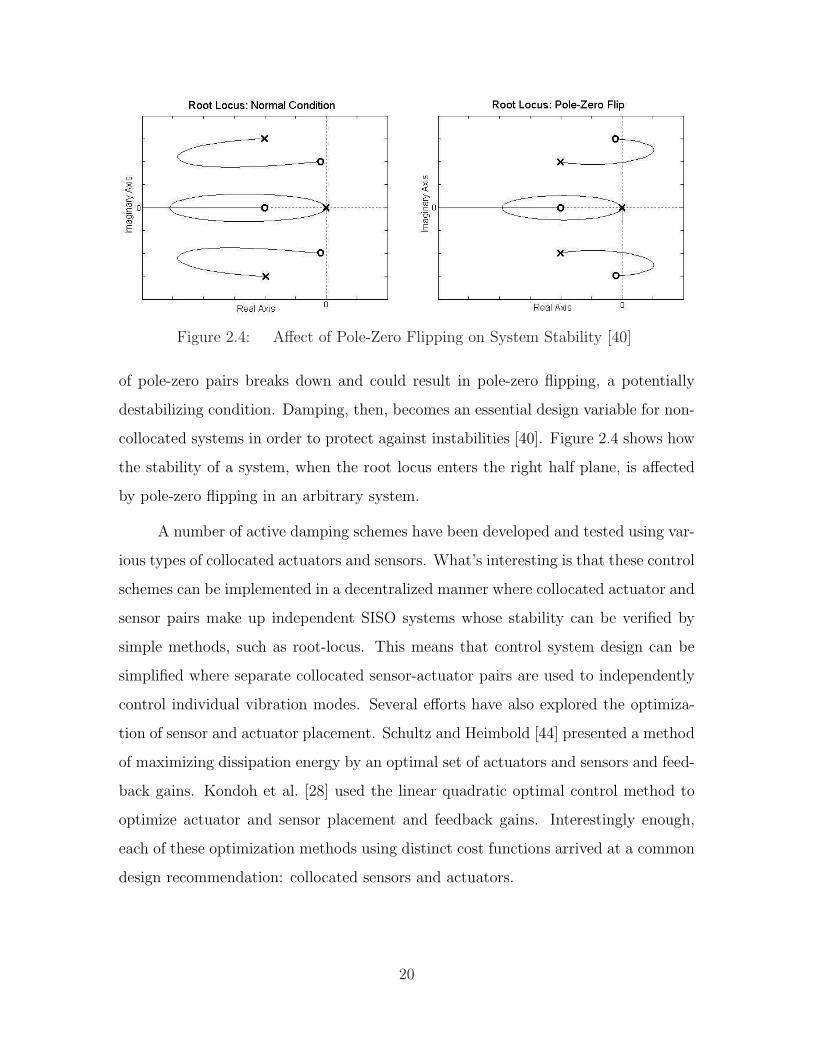
Figure 2.4: Affect of Pole-Zero Flipping on System Stability [40]
of pole-zero pairs breaks down and could result in pole-zero flipping, a potentially
destabilizing condition. Damping, then, becomes an essential design variable for non-
collocated systems in order to protect against instabilities [40]. Figure 2.4 shows how
the stability of a system, when the root locus enters the right half plane, is affected
by pole-zero flipping in an arbitrary system.
A number of active damping schemes have been developed and tested using var-
ious types of collocated actuators and sensors. What’s interesting is that these control
schemes can be implemented in a decentralized manner where collocated actuator and
sensor pairs make up independent SISO systems whose stability can be verified by
simple methods, such as root-locus. This means that control system design can be
simplified where separate collocated sensor-actuator pairs are used to independently
control individual vibration modes. Several efforts have also explored the optimiza-
tion of sensor and actuator placement. Schultz and Heimbold [44] presented a method
of maximizing dissipation energy by an optimal set of actuators and sensors and feed-
back gains. Kondoh et al. [28] used the linear quadratic optimal control method to
optimize actuator and sensor placement and feedback gains. Interestingly enough,
each of these optimization methods using distinct cost functions arrived at a common
design recommendation: collocated sensors and actuators.
20
The benefits of collocated control are clear. Most research advocating for collo-
cated control of piezoelectric actuators also modeled feedback sensors as piezoelectric
materials. Although specifically designed for actuation, piezoelectric actuators such
as the MFC have been shown to possess excellent strain sensing capability. Piezo-
electric sensors are essentially strain rate sensors outputting charges proportional to
displacements. Sodano et.al. [48] studied the use of MFCs for the specific use as a
sensor in various applications. His results revealed that, compared to conventional
peizo film (PVDF) or piezoceramic sensors, MFCs worked exceptionally well as a
sensor in a modal-testing system, a structural health monitoring system, a feedback
control system, and as a self-sensing actuator where a single MFC component acted
simultaneously as a sensor and actuator.
Recent studies of self-sensing piezoelectric actuators have uncovered several ad-
vantages, the most obvious being true collocated control. A self-sensing actuator can
also eliminate the closed-loop control problems arising from capacitative coupling be-
tween separate piezoelectric sensor and actuator elements [16]. Still, the separation of
sensing and control signals shared in a common piezoelectric device, which often calls
for the real-time estimation of the equivalent capacitance of the piezoelectric device,
requires significant effort. Pourboghrat et al. [39] developed adaptive filters for the
self-sensing piezoelectric actuator to eliminate the applied voltage to the actuator from
the sensor signal and demonstrated its effectiveness on a cantilevered beam. Dosch
et al. [16] developed a bridge circuit to enable measurement of strain or strain rate
of a self-sensing piezoelectric actuator allowing for the implementation of a variety of
control algorithms. Despite the advancements in self-sensing piezoelectric actuators,
the application of the adaptive filters like that of Pourboghrat el al. and Dosch et al.
are outside the scope of this research. Therefore, a near collocated approach where
piezoelectric sensors are embedded within piezoelectric actuators will be explored as
discussed in Section III.
21

2.3.2 Control Methods. There are many control methods available to vi-
bration control problems including classical methods like pole placement and output
feedback. Modern robust techniques, such as time domains specifications like Linear
Quadratic Gaussian (LQG), H2, and H∞ control, are commonly considered mostly due
to stability guarantees associated with robust methods. As mentioned before, previous
efforts to alleviate buffet vibrations employed acceleration feedback control; however,
different techniques were used to arrive at suitable control algorithms. Hanagud et
al. [22] used the H2 optimal control method for F-15 tail buffet alleviation during
full scale ground tests. Hanagud’s acceleration feedback controller resulted from “the
minimization of the H2 norm of the closed-loop impulse response, which [was] also
the minimization of the closed-loop covariance of the displacement in the presence of
unit white noise disturbance” [22]. Hanagud’s approach simplified the design in that
damping was the only design variable necessary to define the controller.
Buffet alleviation efforts on F/A-18 vertical tails saw many different control
approaches. Moses [35, 43] employed frequency domain compensation techniques in
SISO control designs that used feedback from either accelerometers or strain gauges.
The resulting control algorithms resembled low pass or band pass filters with peaks
near the targeted natural frequency in order to concentrate control energy at those
frequencies. In an additional effort on the F/A-18 buffet problem, Pototozky [38]
and a team from the National Research Council of Canada [9] used the LQG opti-
mal control method, which is a special formulation of the H2 technique, to design
acceleration feedback controllers. The LQG regulator has been popular in vibration
control problems in that it balances performance and control effort while accounting
for process and measurement noise.
The H∞ method represents another robust control technique that has seen use
in vibration problems. Falangas et al. [18] used H∞ in designing an acceleration
feedback control system using piezoelectric actuators in alleviating acoustic vibrations
on a panel aft of the main engines of the B-1 bomber. The H∞ method is similar to
the H2 method, except that the H∞ formulation minimizes the H∞ norm, or the worst
22
case energy transfer from plant input to output. The H∞ method rejects bounded
energy disturbances, tracks signals minimizing worst case errors, and accounts for a
robust controller design. To implement an H∞ controller, Falangas first arrived at
a reduced order model of the surface panel careful to include all vibrations modes
near those to be actively controlled, because the H∞ method guarantees stability for
all modes included in the design model. For example, Falangas wished to control
the first symmetric mode at 430 Hz, but included modes at 570, 630, and 740 Hz
because of their proximity to the first mode, and to the cross-over frequency of the
accelerometer input. Next, Falangas applied an H∞ synthesis model to arrive at a
controller that stabilized the aircraft panel dynamic model. Shaping filters were also
used to ensure low and high frequency disturbances did not interfere with the control
algorithm. As much as a 13 dB reduction in acceleration power spectral density (PSD)
measurements were recorded during a flight test of Falangas’ control algorithm [18].
Despite the control methodology used, the goal of most vibration control algo-
rithms is to directly control energy at or near the system’s natural frequencies, or
vibration modes, of interest. Thus, peaks appear in the controller’s transfer func-
tion at points where the designer wishes to direct controller energy. An interesting
technique following this concept surfaced in 1985, termed positive position feedback
(PPF), when Goh and Caughey [21] studied stability problems caused by finite actu-
ator dynamics in the collocated control of large space structures using piezoelectric
actuators and sensors. Because they represent highly distributed parameter systems
requiring high-order models, controlling vibration in large space structures presented
a difficult problem. Goh and Caughey found that, when dealing with very high order
models, optimal control methods were often plagued by observation spillover which
tends to destabilize uncontrolled or unmodelled modes, specifically those at higher
frequency. Direct velocity feedback was known to be unconditionally stable in the
absence of actuator dynamics [21]; however, actuator dynamics cannot always be ne-
glected. In light of this, Goh and Caughey worked to prove that PPF algorithms
using collocated control were not destabilized by finite actuator dynamics. In fact,
23
they noted the most important advantage of PPF was that “unconditional global
stability conditions [could] be derived analytically and easily satisfied” [21].
Overall, many control methods have been successfully implemented in vibration
control problems. The control designer is forced to balance performance and stability
requirements in order to meet system objectives. In modern robust techniques, the
selection of design coefficients is often a trial and error affair until the desired response
is achieved. Still, these concerns do not represent all a designer must consider when
developing an active control system, especially when using piezoelectric actuators.
Power amplifier design had largely been neglected until the realization in the early
1990’s that traditional linear power amplifiers were impractical for integration in real-
world applications such as aircraft and small vehicles where space and weight are a
premium. The next section discusses research surrounding switching amplifiers and
their application toward piezoelectric control.
2.4 Drive Amplifier
Since piezoelectric actuators first saw use in vibration control, most research
focused on the development of the actuators and their application potential. Few
actually considered the wider problem of the control system as a whole, specifically
efficient power supplies and drive amplifiers. Because the impendence of piezoelectric
actuators is primarily reactive, their load imposed on a circuit regenerates a significant
amount of power to the driving amplifier. The reactive impedance also implies that the
driving amplifier must be able to handle significantly higher voltages and circulating
currents than suggested by the real power requirements of the actuator [32]. Overall,
a clear understanding of the electromechanical behavior of the piezoelectric actuator,
as studied by Brennan & McGowan [3] and Warkentin & Crawley [53], is essential in
the design of power amplifiers that drive them.
From the beginning, linear amplifiers were widely used to drive piezoelectric
actuators due to their excellent frequency response to inputs signals, minimal ripple
voltage noise, and favorable linearity. However, the size and weight of linear amplifiers
24

increase as voltage levels increase. Also, linear amplifiers cannot efficiently handle
the bi-directional power flow found in driving large piezoelectric actuators, because
piezoelectric devices consume almost zero real power but cause a large amount of
reactive power to circulate between the source and the load [32]. This circulating
reactive power is manifested as power losses in linear amplifiers and is dissipated as
heat. Leo [30] found that the energy dissipated in a linear amplifier is a function
of supply voltage to the actuators and drive-frequency. As supply voltage and drive
frequency increase, so does dissipated energy.
The switching amplifier, like that patented by Joseph P. Savicki from AT&T Bell
Laboratories [52], provided a novel design for driving capacitive loads. The switching
amplifier recovers a substantial amount of stored energy during the discharge of a
capacitative load as recycled power, which, when routed to series-connected capaci-
tors, can be reused during subsequent load discharge cycles without causing circuit
noise [52]. Switching amplifiers can follow many different topologies such as the half-
bridge or full-bridge circuits or variations of multi-level topologies. Many use pulse
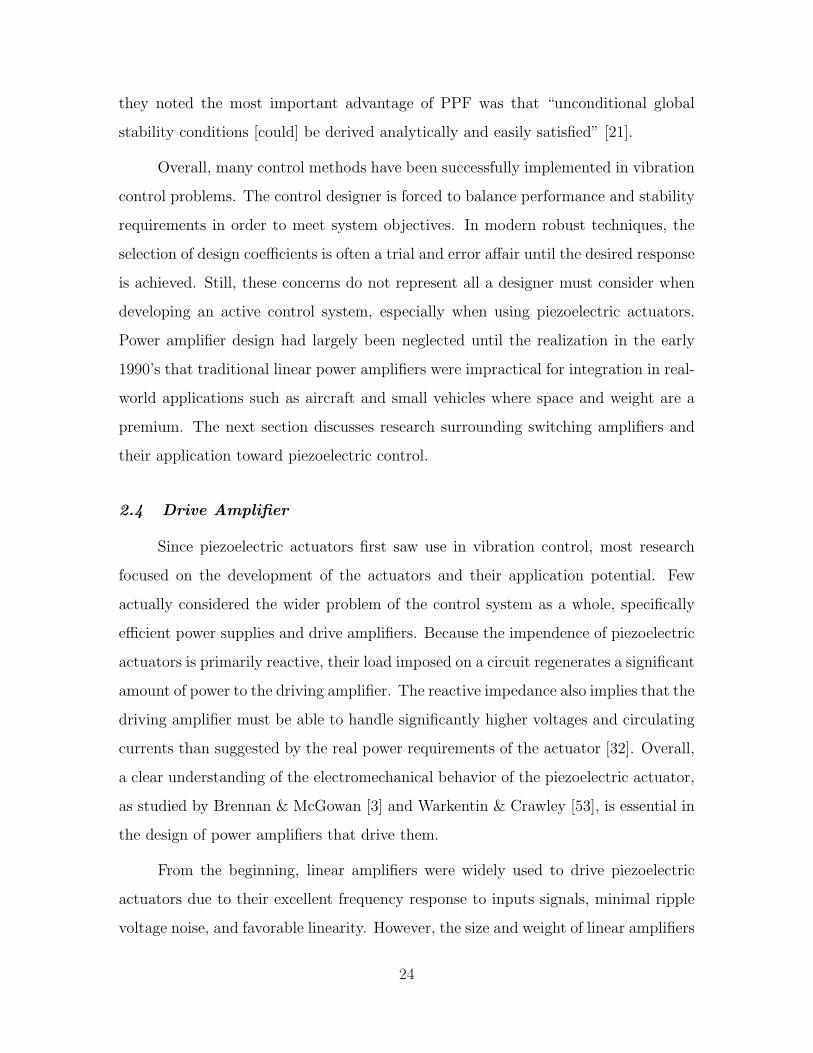
width modulated (PWM) drive signals to control circuit switching. The majority of
switching amplifiers designed to drive piezoelectrics placed inductors in series with
the piezoelectric load, as shown in Figure 2.5. Doing so enables the control of current
rate instead of the current into the load. “When a switching amplifier is used to
control the average voltage across the inductor, and hence current rate, very little
power is dissipated in the drive amplifier” [10]. Further study of switch-mode am-
plifier topologies and design considerations can be found in the literature [10, 32,33].
Switching amplifier technology has been successfully applied to vibration control
applications using piezoelectric actuators. Clingman and Gamble of Boeing Phantom
Works designed a switching amplifier used to drive piezo-fiber composite actuators
imbedded in a 1/6 scale CH-47 helicopter blade [10]. The multi-level amplifier, used
to switch solid state Isolated Gate Bipolar Transistors (IGBT) according to a PWM
drive signal, was tested at 4000 volts peak-to-peak, 750 mA with good results. Data
25
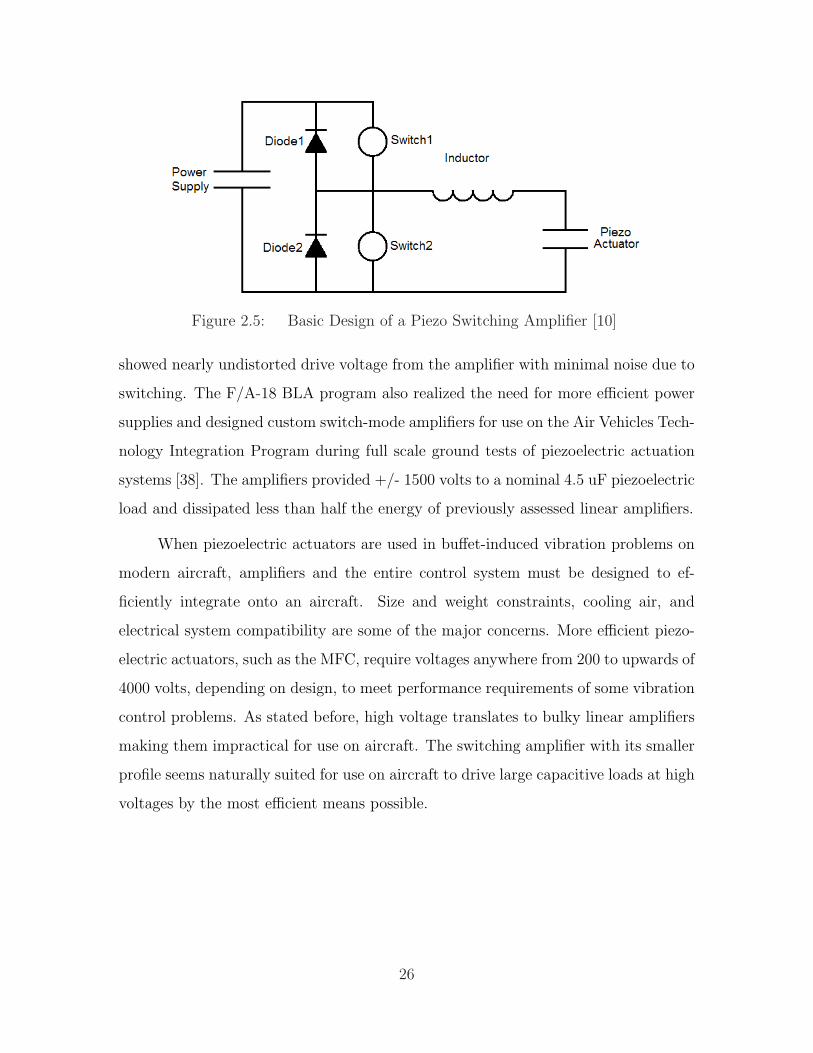
Figure 2.5: Basic Design of a Piezo Switching Amplifier [10]
showed nearly undistorted drive voltage from the amplifier with minimal noise due to
switching. The F/A-18 BLA program also realized the need for more efficient power
supplies and designed custom switch-mode amplifiers for use on the Air Vehicles Tech-
nology Integration Program during full scale ground tests of piezoelectric actuation
systems [38]. The amplifiers provided +/- 1500 volts to a nominal 4.5 uF piezoelectric
load and dissipated less than half the energy of previously assessed linear amplifiers.
When piezoelectric actuators are used in buffet-induced vibration problems on
modern aircraft, amplifiers and the entire control system must be designed to ef-
ficiently integrate onto an aircraft. Size and weight constraints, cooling air, and
electrical system compatibility are some of the major concerns. More efficient piezo-
electric actuators, such as the MFC, require voltages anywhere from 200 to upwards of
4000 volts, depending on design, to meet performance requirements of some vibration
control problems. As stated before, high voltage translates to bulky linear amplifiers
making them impractical for use on aircraft. The switching amplifier with its smaller
profile seems naturally suited for use on aircraft to drive large capacitive loads at high
voltages by the most efficient means possible.
26

III. Theoretical Background
This chapter presents a summary of the theoretical framework necessary in the de-
velopment of elements required to realize a flight test of an F-16 ventral fin buffet
alleviation system. These elements include the optimum placement of piezoelectric ac-
tuators and sensors, the experimental determination of principle strain vectors of the
ventral fin, the frequency response estimation of the ventral fin, the development of
appropriate closed-loop control algorithms, the development of an appropriate piezo-
electric drive amplifier, and the implementation of the control algorithms in hardware.
3.1 Piezoelectric Actuator Placement, Sizing, and Orientation
The correct placement, sizing, and orientation of piezoelectric actuators is cru-
cial to the success of a buffet alleviation system. The basic concept behind the func-
tion of the actuators is the cancelation of moments produced by outside forces [29].
In terms of this research, aerodynamic buffet causes moments which create stress in
the ventral fin. MFC piezoelectric actuators, as described in Chapter II, using the
transverse charge constant (d33), impart strain in response to an electric charge in the
direction of their actuation fibers. When mounted to a surface like the ventral fin,
piezoelectric actuators can counteract the strain caused by aerodynamic buffet. As
a result, it is preferred to locate the actuators in areas of elevated strain associated
with a particular mode of vibration, since each mode has a unique mode shape and
strain energy distribution.
Morgenstern [7] arrived at the same conclusion in his investigation into the
effectiveness of piezoelectric actuators for the F-16 ventral fin. Morgenstern tuned and
optimized a finite element model (FEM) to match published modal parameters for a
Block 15 ventral fin and analyzed the results to determine strain energy profiles for
the first five modes of vibration. He determined the three most critical modes for fin
failure, modes 1, 2 and 4, through an evaluation of historical flight test data detailing
the relative dominance of each mode and the amount of aeroelastic damping observed
in flutter analysis. Morgenstern incorporated piezoelectric models for the critical
27
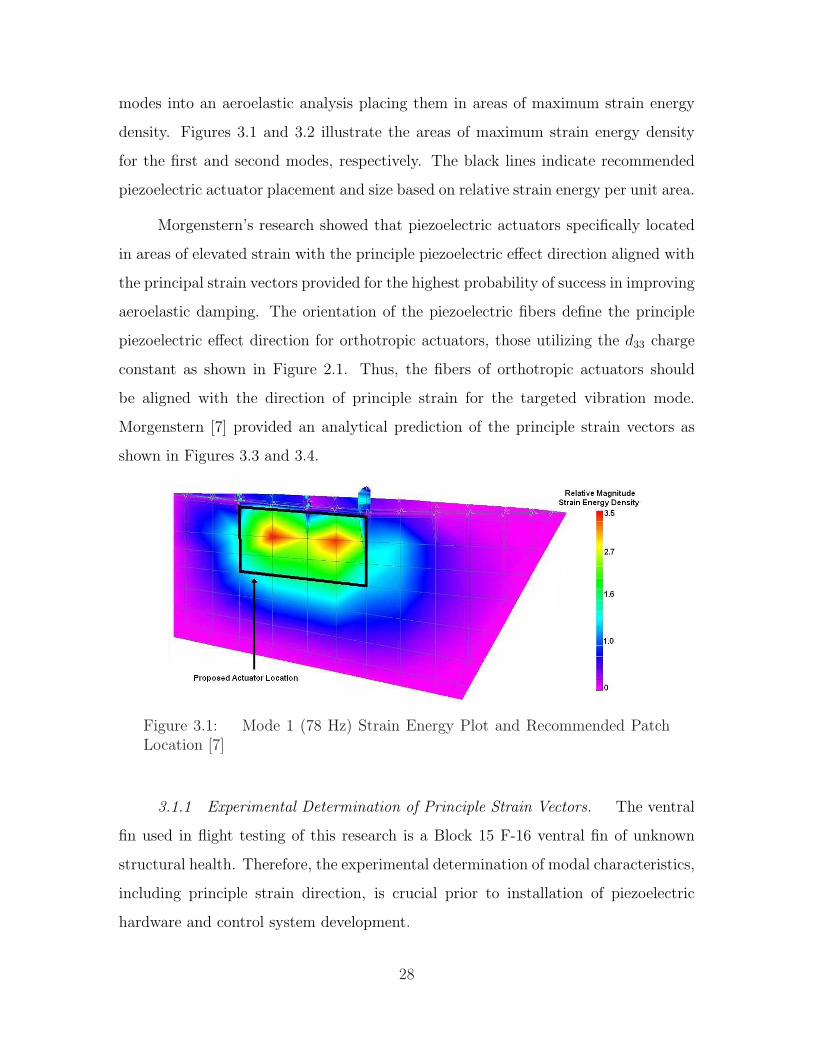
modes into an aeroelastic analysis placing them in areas of maximum strain energy
density. Figures 3.1 and 3.2 illustrate the areas of maximum strain energy density
for the first and second modes, respectively. The black lines indicate recommended
piezoelectric actuator placement and size based on relative strain energy per unit area.
Morgenstern’s research showed that piezoelectric actuators specifically located
in areas of elevated strain with the principle piezoelectric effect direction aligned with
the principal strain vectors provided for the highest probability of success in improving
aeroelastic damping. The orientation of the piezoelectric fibers define the principle
piezoelectric effect direction for orthotropic actuators, those utilizing the d33 charge
constant as shown in Figure 2.1. Thus, the fibers of orthotropic actuators should
be aligned with the direction of principle strain for the targeted vibration mode.
Morgenstern [7] provided an analytical prediction of the principle strain vectors as
shown in Figures 3.3 and 3.4.
Figure 3.1: Mode 1 (78 Hz) Strain Energy Plot and Recommended PatchLocation [7]
3.1.1 Experimental Determination of Principle Strain Vectors. The ventral
fin used in flight testing of this research is a Block 15 F-16 ventral fin of unknown
structural health. Therefore, the experimental determination of modal characteristics,
including principle strain direction, is crucial prior to installation of piezoelectric
hardware and control system development.
28
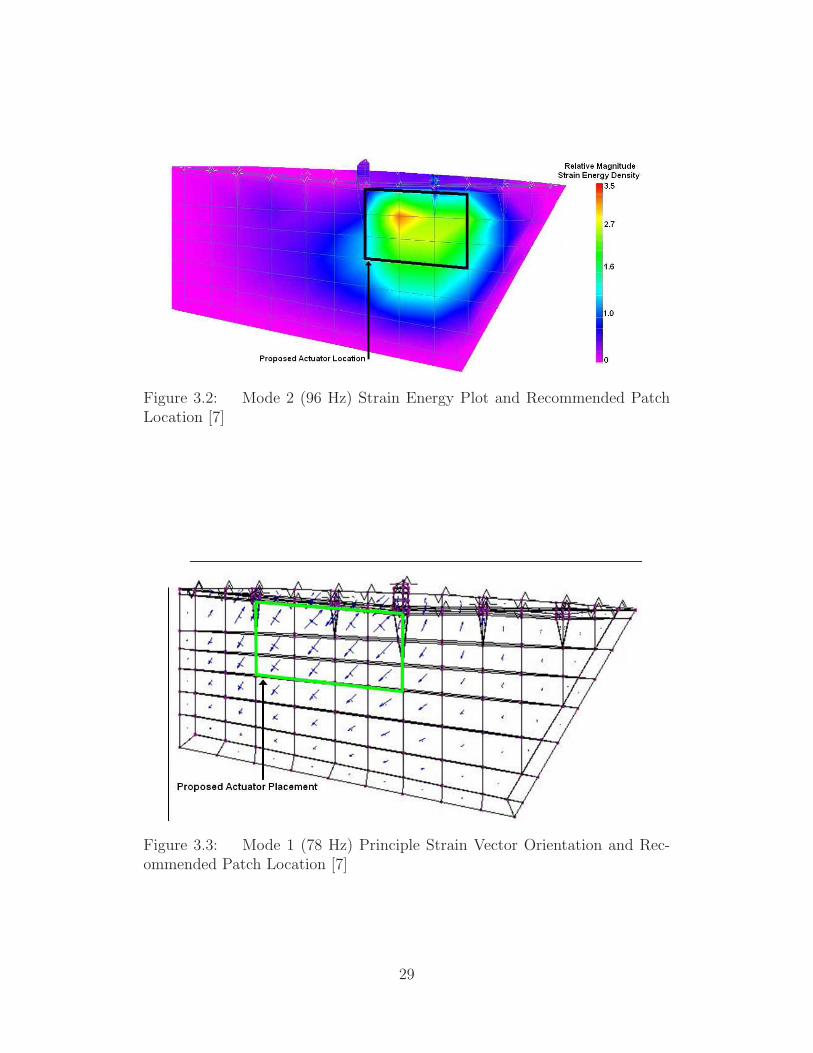
Figure 3.2: Mode 2 (96 Hz) Strain Energy Plot and Recommended PatchLocation [7]
Figure 3.3: Mode 1 (78 Hz) Principle Strain Vector Orientation and Rec-ommended Patch Location [7]
29
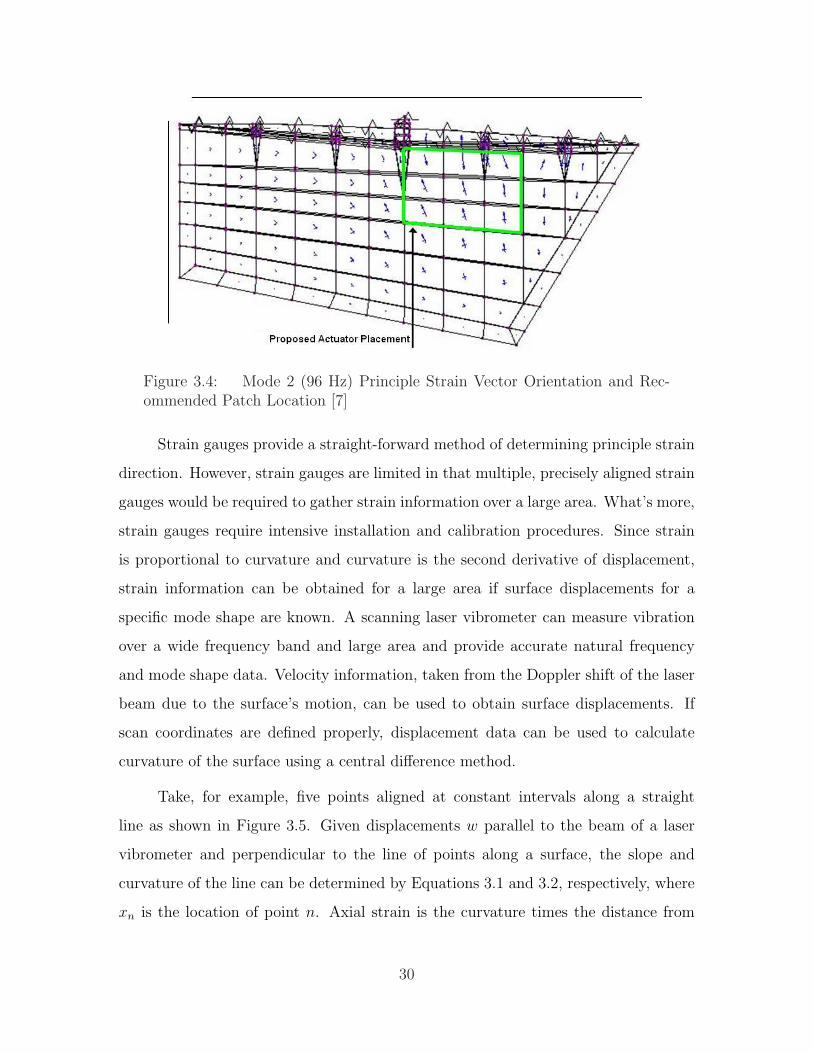
Figure 3.4: Mode 2 (96 Hz) Principle Strain Vector Orientation and Rec-ommended Patch Location [7]
Strain gauges provide a straight-forward method of determining principle strain
direction. However, strain gauges are limited in that multiple, precisely aligned strain
gauges would be required to gather strain information over a large area. What’s more,
strain gauges require intensive installation and calibration procedures. Since strain
is proportional to curvature and curvature is the second derivative of displacement,
strain information can be obtained for a large area if surface displacements for a
specific mode shape are known. A scanning laser vibrometer can measure vibration
over a wide frequency band and large area and provide accurate natural frequency
and mode shape data. Velocity information, taken from the Doppler shift of the laser
beam due to the surface’s motion, can be used to obtain surface displacements. If
scan coordinates are defined properly, displacement data can be used to calculate
curvature of the surface using a central difference method.
Take, for example, five points aligned at constant intervals along a straight
line as shown in Figure 3.5. Given displacements w parallel to the beam of a laser
vibrometer and perpendicular to the line of points along a surface, the slope and
curvature of the line can be determined by Equations 3.1 and 3.2, respectively, where
xn is the location of point n. Axial strain is the curvature times the distance from
30
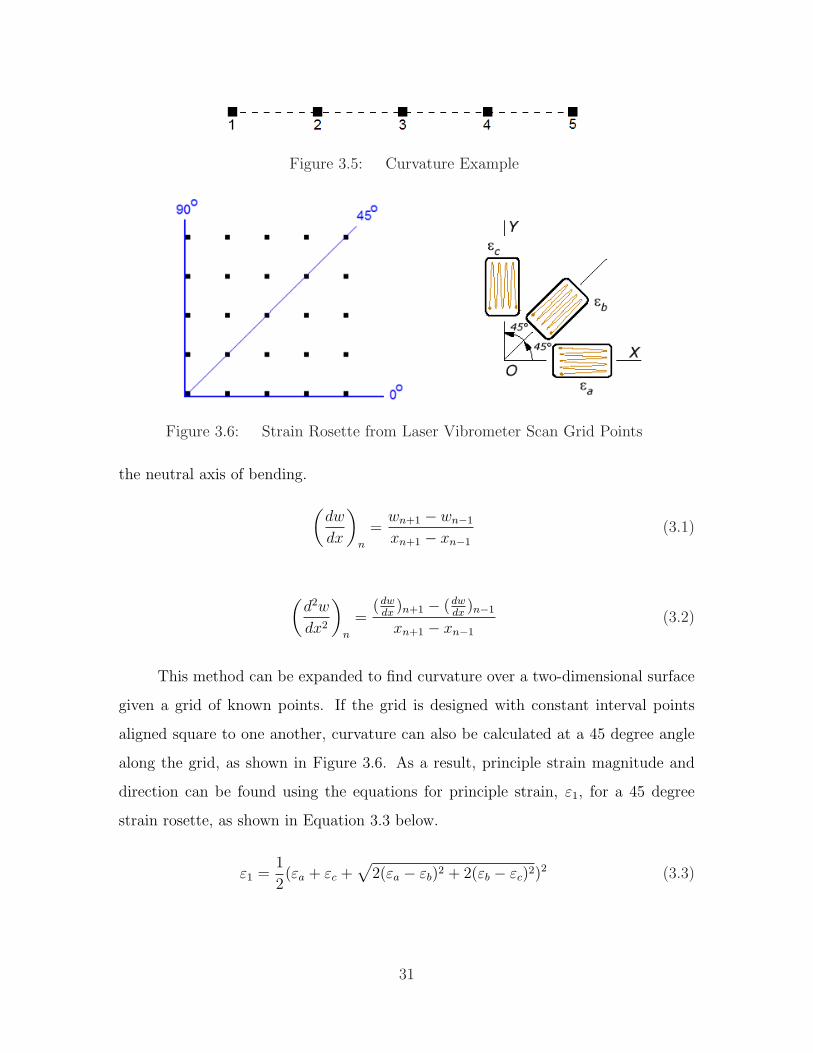
Figure 3.5: Curvature Example
Figure 3.6: Strain Rosette from Laser Vibrometer Scan Grid Points
the neutral axis of bending.
(dw
dx
)
n
=wn+1 − wn−1
xn+1 − xn−1
(3.1)
(d2w
dx2
)
n
=(dw
dx)n+1 − (dw
dx)n−1
xn+1 − xn−1
(3.2)
This method can be expanded to find curvature over a two-dimensional surface
given a grid of known points. If the grid is designed with constant interval points
aligned square to one another, curvature can also be calculated at a 45 degree angle
along the grid, as shown in Figure 3.6. As a result, principle strain magnitude and
direction can be found using the equations for principle strain, ε1, for a 45 degree
strain rosette, as shown in Equation 3.3 below.
ε1 =1
2(εa + εc +
√2(εa − εb)2 + 2(εb − εc)2)2 (3.3)
31

where εa, εb, and εc are measured strain along the 0o, 45o, and 90o directions of the
grid. Principle strain direction, θ, is given in Equation 3.4 measured from the 0o
reference axis.
tan2θ =εa − εc
2εb − εa − εc
(3.4)
3.2 Piezoelectric Sensor Placement and Orientation
The advantages of collocated sensor and actuator designs for feedback con-
trol were discussed in Chapter II. Areas of elevated strain energy do not necessarily
coincide with the optimal location for an acceleration feedback sensor, ruling out
accelerometers for this collocated design. Conversely, a piezoelectric sensor, which
employs the reverse piezoelectric effect, is best suited for feedback control in a collo-
cated piezoelectric actuator design. As verification, Chandrasekaran and Linder [31]
provide us with a relationship between piezoelectric sensor output voltage vo, charge
Q, and stress T :
vo =Q
C− d33
ε33
Td (3.5)
where C is capacitance, d33 is the transverse piezoelectric charge constant, ε33 is the
dielectric permittivity, and d is the thickness of the piezoelectric material. Equation
3.5 shows that the voltage across the sensor is a result of the direct capacitive effect
and mechanical stress. Stress in a plate can be shown as
T = Ey
R (3.6)
where E is Young’s Modulus, y is half the plate’s thickness, and R is the radius of
curvature of the plate. Assuming small distortion in the plate, the radius of curvature
is
1
R =∂2w
∂x2(3.7)
32

Equations 3.5, 3.6, and 3.7 show that sensor output voltage is proportional to cur-
vature. Therefore, piezoelectric sensors placed in areas of maximum curvature, or
strain, will provide the largest voltage signal for feedback control. Given that piezo-
electric sensors are constructed in the same manner as actuators, it follows that the
main piezoelectric fiber direction should be oriented with the principle strain vectors
as described in the previous section.
3.3 System Model Identification
Mathematical models that adequately describe a system’s response are necessary
in the design of closed-loop control algorithms for that system. FEM analysis has long
been the accepted method for constructing analytical models in the structures field.
However, in terms of a vibration control system and in light of the actual Block
15 ventral fin’s age and unknown structural health, a realization from experimental
results would provide a more accurate model for control algorithm development. The
eigensystem realization algorithm (ERA) offers an efficient means to experimentally
determine a system model.
The eigensystem realization algorithm was first proposed by Juang and Pappa
[26] for modal parameter identification and model reduction of linear dynamical sys-
tems from test data. A detailed description of the ERA algorithm can be found in
the literature [26,27], but it can be summarized as a reduced system model based on
the singular value decomposition of the block Hankel matrix. Take for example the
linear, discrete time system represented by
x(k + 1) = A[n×n]x(k) + B[n×p]u(k)
y(k) = C[q×n]x(k) + D[q×p]u(k) (3.8)
where x is an n-dimensional state vector, u is a p-dimensional input vector, and y is
a q-dimensional output vector with k as the discrete time sample. Matrices A, B, C,
and D define the system model where matrix A represents the dynamics of the system
33

including its mass, stiffness, and damping properties. The time domain description
of the free pulse response of the system in Equation 3.8 are known as the Markov
parameters given by
Y (k) = CA(k−1)B (3.9)
The ERA builds the block Hankel matrix H in terms of the Markov parameters,
shown as
H(k − 1) = [Y (k)...Y (k + nc)...Y (k + nr)...Y (k + nr + nc)] (3.10)
where r and c are arbitrary integers satisfying the inequalities rq ≥ n and cp ≥ n [11].
The block matrix of Equation 3.10, which acts to minimize the distortion caused by
measurement noise, is then factored using single value decomposition at k = 1 into
H(0) = PDQT (3.11)
where the matrices P and Q are orthonormal and D is diagonal containing the singu-
lar values. The number of states in Equation 3.11 can be truncated to obtain optimal
signal-to-noise characteristics of the system model [27]. Juang and Pappa [27] provide
an optimization method for computing the appropriate singular value cutoff for this
truncation using the covariance of the measurement noise. The result is a reduced-
order dimension-n realization formulated as
Ak = D−1/2n P T
n H(k)QnD−1/2n
B = D1/2n QT
n [Ip, 0]
C = [Iq, 0]PnD1/2n
D = Y (0)
(3.12)
where [I, 0] is the identity matrix of stated dimension appended with a zero matrix.
34
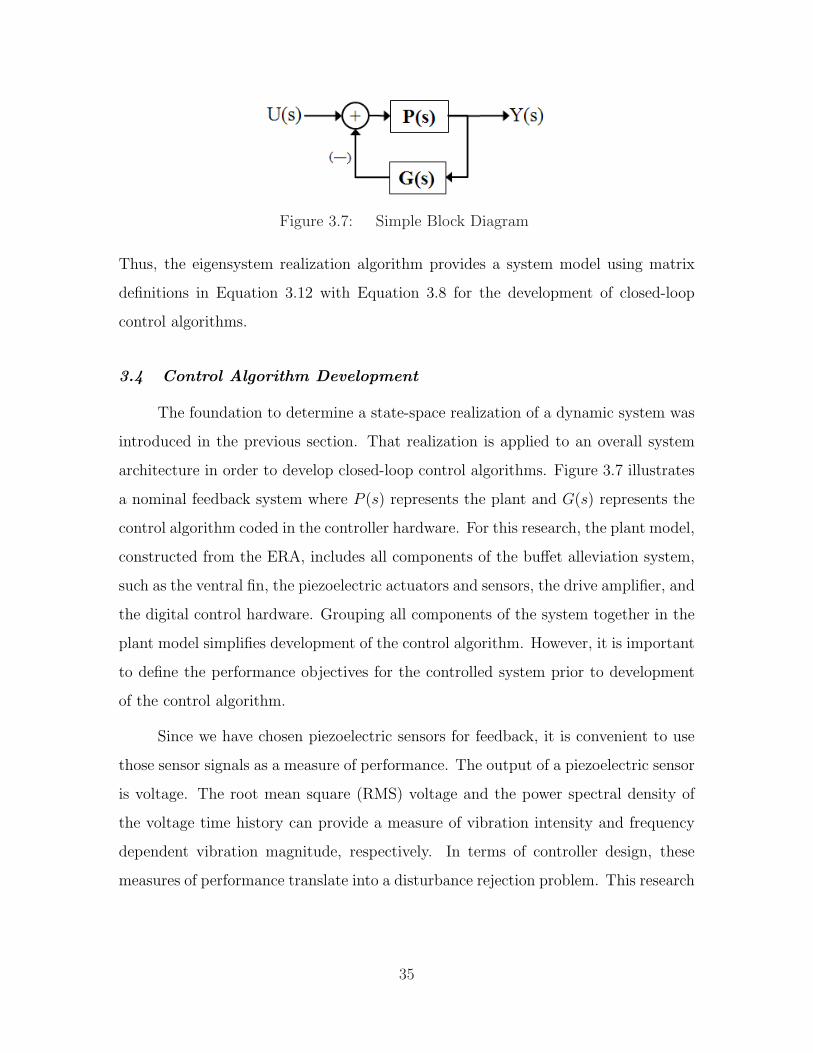
Figure 3.7: Simple Block Diagram
Thus, the eigensystem realization algorithm provides a system model using matrix
definitions in Equation 3.12 with Equation 3.8 for the development of closed-loop
control algorithms.
3.4 Control Algorithm Development
The foundation to determine a state-space realization of a dynamic system was
introduced in the previous section. That realization is applied to an overall system
architecture in order to develop closed-loop control algorithms. Figure 3.7 illustrates
a nominal feedback system where P (s) represents the plant and G(s) represents the
control algorithm coded in the controller hardware. For this research, the plant model,
constructed from the ERA, includes all components of the buffet alleviation system,
such as the ventral fin, the piezoelectric actuators and sensors, the drive amplifier, and
the digital control hardware. Grouping all components of the system together in the
plant model simplifies development of the control algorithm. However, it is important
to define the performance objectives for the controlled system prior to development
of the control algorithm.
Since we have chosen piezoelectric sensors for feedback, it is convenient to use
those sensor signals as a measure of performance. The output of a piezoelectric sensor
is voltage. The root mean square (RMS) voltage and the power spectral density of
the voltage time history can provide a measure of vibration intensity and frequency
dependent vibration magnitude, respectively. In terms of controller design, these
measures of performance translate into a disturbance rejection problem. This research
35

focuses on two control techniques well suited for this type of problem: positive position
feedback and the Linear Quadratic Gaussian compensator.
3.4.1 Positive Position Feedback. As presented in Chapter II, positive posi-
tion feedback (PPF) was first introduced by Goh and Caughey [21] in 1985 who desired
a second-order dynamic feedback technique that did not require an analytical model
of the system or plant to be controlled. Because PPF filters are essentially a second-
order compensator, they possess roll-off at high frequency, making them resistant to
spillover and residual mode excitation. What’s more, closed-loop stability depends
only on the structure’s natural frequencies which can be easily measured. Inman [24]
describes the PPF formulation and its stability characteristics by beginning with a
single degree-of-freedom system (Equation 3.13) and a second-order compensator of
the same form (Equation 3.14).
x + 2ζnωnx + ω2nx = bu (3.13)
u =g
bω2
cη
η + 2ζcωcη + ω2cη = gω2
c (3.14)
where x is the structural modal coordinate, η is the compensator coordinate, ωn and
ωc are the structural and compensator natural frequencies, respectively, ζn and ζc are
the structural and compensator damping ratios, respectively, b is the input coefficient
and g is the scalar gain (g > 0). Combining the two equations into matrix form,
assuming zero outside force, yields
x
η
+
2ζnωn 0
0 sζcωc
x
η
+
ω2
n −gω2c
−gω2c ω2
c
x
η
=
0
0
(3.15)
K =
ω2
n −gω2c
−gω2c ω2
c
36

where K is the stiffness matrix. An inspection of the stiffness matrix reveals that
the two coordinates x and η are coupled, meaning that an increase in compensator
damping adds damping to the structure. Also, by definition, if the symmetric stiffness
matrix is positive definite, that is, if its determinant is greater than zero, the closed-
loop system is stable. This is possible when
g2ω2c < ω2
n (3.16)
showing that closed-loop stability of the PPF controlled system depends only on the
natural frequency of the structure. Thus, the design of the PPF controller resides in
the selection of g and wc that satisfy Equation 3.16 and the selection of ζc that adds
sufficient damping to the structural mode [24]. The question remains, however, how
to make the appropriate choices for the characteristics of the PPF compensator.
Song et.al. [49] provide an excellent analysis of how compensator frequency and
damping ratio should be selected. Using the same single degree-of-freedom example
from before, the steady state output of the PPF compensator from Equation 3.14,
assuming closed-loop stability, is
η(t) = βe[i(ωct−φ)] (3.17)
where β is the magnitude and φ is the phase of the output. The phase angle φ is
given as
φ = arctan
[2ζc(ωn/ωc)
1− (ω2n/ω
2c )
](3.18)
Three conditions arise in the relation between compensator and structural natural
frequency. When the compensator frequency is much lower than the structural fre-
quency, φ approaches zero. When the compensator and structural frequencies match,
φ approaches π/2. When the compensator frequency is much greater than the struc-
tural frequency, φ approaches π. Each of these cases have different effects on the
37

structural dynamics of Equation 3.13, as shown below.
Case 1: Active Flexibility:
Case 2: Active Damping:
Case 3: Active Stiffness:
φ → 0, x + 2ζnωnx + (ω2n − gβω2
n)x = 0
φ → π/2, x + (2ζnωn + gβωn)x + ω2nx = 0
φ → π, x + 2ζnωnx + (ω2n + gβω2
n)x = 0
In Case 1 and 3, the structural stiffness term was decreased and increased, respec-
tively, whereas in Case 2, the structural damping was increased. Thus, the compen-
sator frequency should closely match the structural frequency in order to meet the
PPF design goal of achieving maximum damping. However, any structural frequency
below ωc will experience an increase in flexibility, as shown in Case 1. Structural
modes higher than ωc, as long as they are well separated from ωc, will be less ef-
fected due to the magnitude roll-off characteristic of a second-order filter at higher
frequencies.
Damping ratio selection is less intuitive. Let’s start with the transfer function
of the nominal PPF controller.
η(s)
X(s)=
gω2c
s2 + 2ζcωcs + ω2c
(3.19)
Figure 3.8 shows the Bode plot of Equation 3.19 with ωc = 1 rad/sec and varying
damping ratios ζc. A larger damping ratio results in a less steep magnitude and
phase response at the target frequency, effectively increasing the region of active
damping and thereby increasing the robustness of the compensator [49]. However, as
the magnitude response ‘flattens,’ the compensator becomes less effective at the target
frequency. As stated before, higher damping values lead to an increase in flexibility
for modes of lower frequency than ωc. Therefore, damping ratio selection becomes a
tradeoff between compensator robustness, low frequency mode flexibility, and target
mode damping effectiveness. The above technique will be implemented as described
in Chapter IV.
38
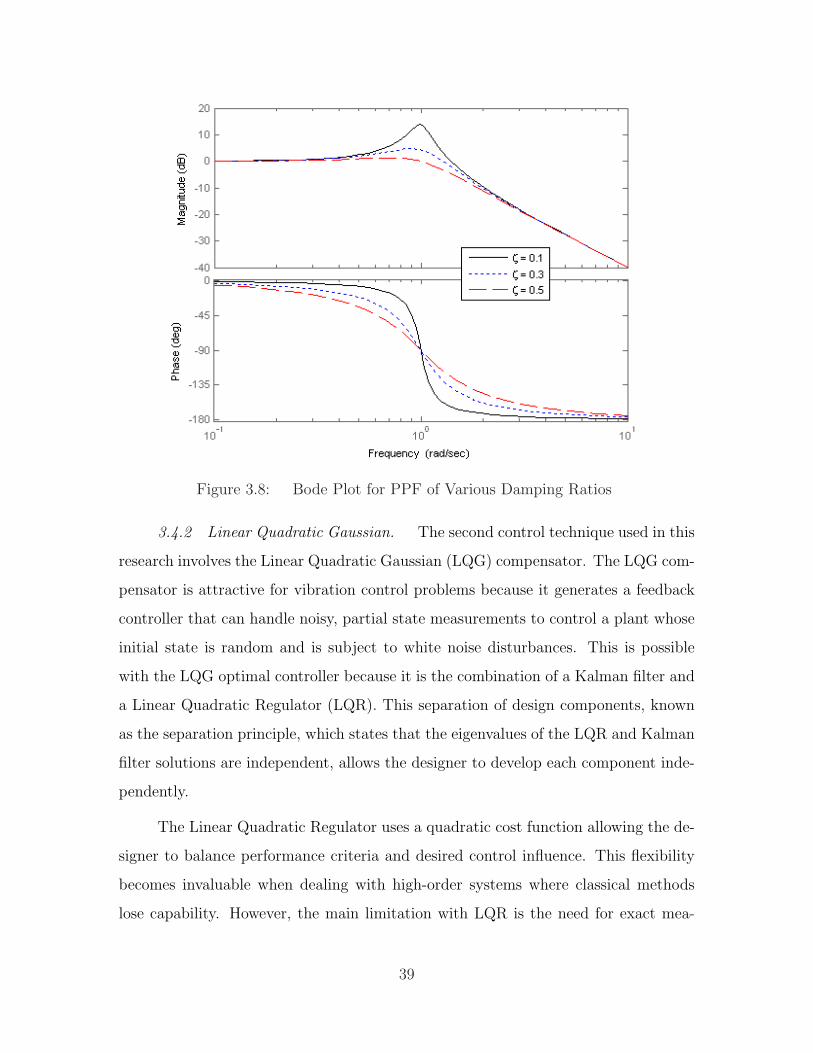
Figure 3.8: Bode Plot for PPF of Various Damping Ratios
3.4.2 Linear Quadratic Gaussian. The second control technique used in this
research involves the Linear Quadratic Gaussian (LQG) compensator. The LQG com-
pensator is attractive for vibration control problems because it generates a feedback
controller that can handle noisy, partial state measurements to control a plant whose
initial state is random and is subject to white noise disturbances. This is possible
with the LQG optimal controller because it is the combination of a Kalman filter and
a Linear Quadratic Regulator (LQR). This separation of design components, known
as the separation principle, which states that the eigenvalues of the LQR and Kalman
filter solutions are independent, allows the designer to develop each component inde-
pendently.
The Linear Quadratic Regulator uses a quadratic cost function allowing the de-
signer to balance performance criteria and desired control influence. This flexibility
becomes invaluable when dealing with high-order systems where classical methods
lose capability. However, the main limitation with LQR is the need for exact mea-
39
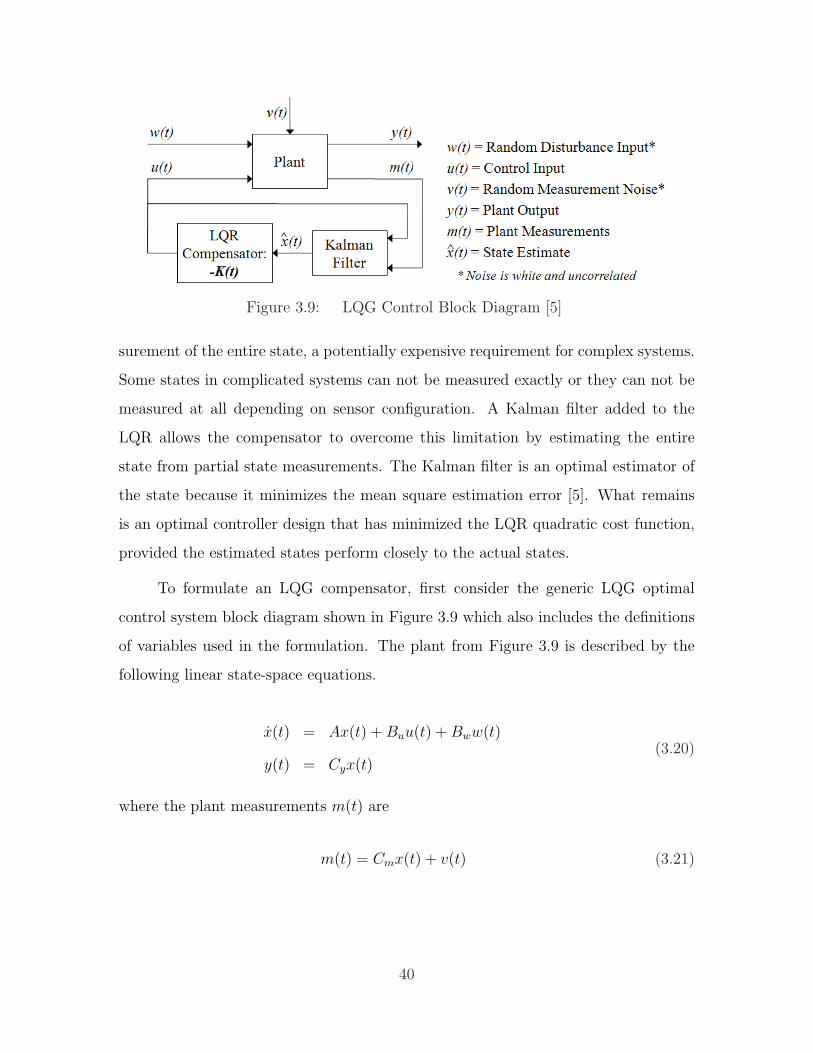
Figure 3.9: LQG Control Block Diagram [5]
surement of the entire state, a potentially expensive requirement for complex systems.
Some states in complicated systems can not be measured exactly or they can not be
measured at all depending on sensor configuration. A Kalman filter added to the
LQR allows the compensator to overcome this limitation by estimating the entire
state from partial state measurements. The Kalman filter is an optimal estimator of
the state because it minimizes the mean square estimation error [5]. What remains
is an optimal controller design that has minimized the LQR quadratic cost function,
provided the estimated states perform closely to the actual states.
To formulate an LQG compensator, first consider the generic LQG optimal
control system block diagram shown in Figure 3.9 which also includes the definitions
of variables used in the formulation. The plant from Figure 3.9 is described by the
following linear state-space equations.
x(t) = Ax(t) + Buu(t) + Bww(t)
y(t) = Cyx(t)(3.20)
where the plant measurements m(t) are
m(t) = Cmx(t) + v(t) (3.21)
40

According to Burl [5], the LQG optimal control is obtained from the LQR
feedback gain matrix K operating on the state estimate x(t), discussed in the next
section, generated by the Kalman filter.
u(t) = −K(t)x(t) (3.22)
As stated previously, we can divide the formulation of the LQG controller into two
parts due to the separation principle: the Linear Quadratic Regulator and the Kalman
filter.
3.4.2.1 The Quadratic Cost Function. The goal of any optimal control
system is to drive the desired output (or output errors, depending on design criteria)
to zero while using the least amount of control input. The LQR compensator accounts
for this relationship with the quadratic cost function, J(x(t), u(t)), written here in
terms of the state and control coordinates.
J(x(t), u(t)) =1
2xT (tf )Hx(tf ) +
1
2
∫ tf
0
(xT (t)Qx(t) + uT (t)Ru(t)
)dt (3.23)
where H is positive semi-definite and sets the importance of the final condition of
the states, Q is positive semi-definite and sets the importance of each state, and R
is positive definite and sets the penalty of excess control input u(t). If the system
under control is assumed to be time-invariant, the LQR and Kalman gains approach
a constant value as the final time, tf , is increased. If the time intervals are long, the
design can be simplified with the use of constant state feedback gains, simplifying the
cost function to
J(x(t), u(t)) =1
2
∫ ∞
0
(xT (t)Qx(t) + uT (t)Ru(t)
)dt (3.24)
Thus, the designer needs only to define Q and R. For example, if the designer is
more concerned with the first two states of the system, the values in Q that affect
41

those two states would be defined with higher magnitudes than the values affecting
the remaining states. The same is done for R in reference to control inputs. Note
that LQR and Kalman discussions that follow assume time-invariant, steady-state.
3.4.2.2 The Linear Quadratic Regulator. For the time invariant, con-
stant gain LQG compensator, the LQR feedback gain matrix is defined as
u(t) = −Kx(t) = −R−1BTu Px(t) (3.25)
Matrices R and Bu are known; what’s left to define is P , the matrix of proportionality
between the costate and state. Burl [5] presents two methods of determining P . The
first method deals with determining the state-transition matrix for the Hamiltonian
system which can be a very tedious process. Because we are concerned with the
steady-state solution, a more elegant method is found in the solution of the algebraic
Riccati equation, a nonlinear matrix equation shown below.
0 = −PA− AT P −Q + PBuR−1BT
u P (3.26)
Many software applications, such as MATLABTM
, are often used to solve for the LQR
gain matrix. By defining the system in Equation 3.20 and the weighting matrices
Q and R, these software applications solve the Ricatti equation, assuming a time
invariant system, and calculate the LQR gain matrix while satisfying the quadratic
cost function, Equation 3.24.
3.4.2.3 The Kalman Filter. As shown in Figure 3.9, the Kalman filter
provides an estimate of the state of the plant, x(t), which is driven by the control
input u(t) and plant noise w(t) and whose measurements m(t) are influenced by
measurement noise v(t). The Kalman filter equation in state model form is
˙x(t) = [A− LCm]x(t) + Buu(t) + Lm(t) (3.27)
42

where L is the Kalman filter gain matrix. The filter gain matrix can be found using
the same methods described for the LQR gain matrix because the filter gain matrix
is defined similarly as
L = ΣeCTmS−1
v (3.28)
The matrix Σe is the solution to steady-state Riccati equation shown below.
0 = ΣeAT + AΣe + BwSwBT
w − ΣeCTmS−1
v CmΣe (3.29)
Svδ(τ) = E[v(t)vT (t + τ)]
Swδ(τ) = E[w(t)wT (t + τ)]
where Sv is the spectral density of the measurement white noise, v(t), Sw is the
spectral density of the disturbance input noise, w(t), and E is the expected value
operator [5].
Again, computer software is often used to apply the Kalman filter to a control
design where the designer defines the system matrices, A, Bu and Cm and assumes a
time-invariant system and white noise disturbances to obtain the filter gain matrix.
In most software applications, such as MATLABTM
, the designer can specify the noise
covariance data, represented by Sv and Sw above, to tailor the estimator behavior.
3.4.2.4 The Linear Quadratic Gaussian Compensator. The Linear
Quadratic Regulator and the Kalman filter can then be combined, assuming that the
model in Equation 3.20 is the true model of the plant, to form the Linear Quadratic
Gaussian optimal controller that minimizes the cost function in Equation 3.24 and
accounts for process noise shown in Figure 3.9. The resulting system of equations in
steady-state form, now incorporating the estimated states from the Kalman filter, are
ˆx(t) = [A− LCm −BuK]x(t) + Lm(t) (3.30)
u(t) = −K(t)x(t) (3.31)
43
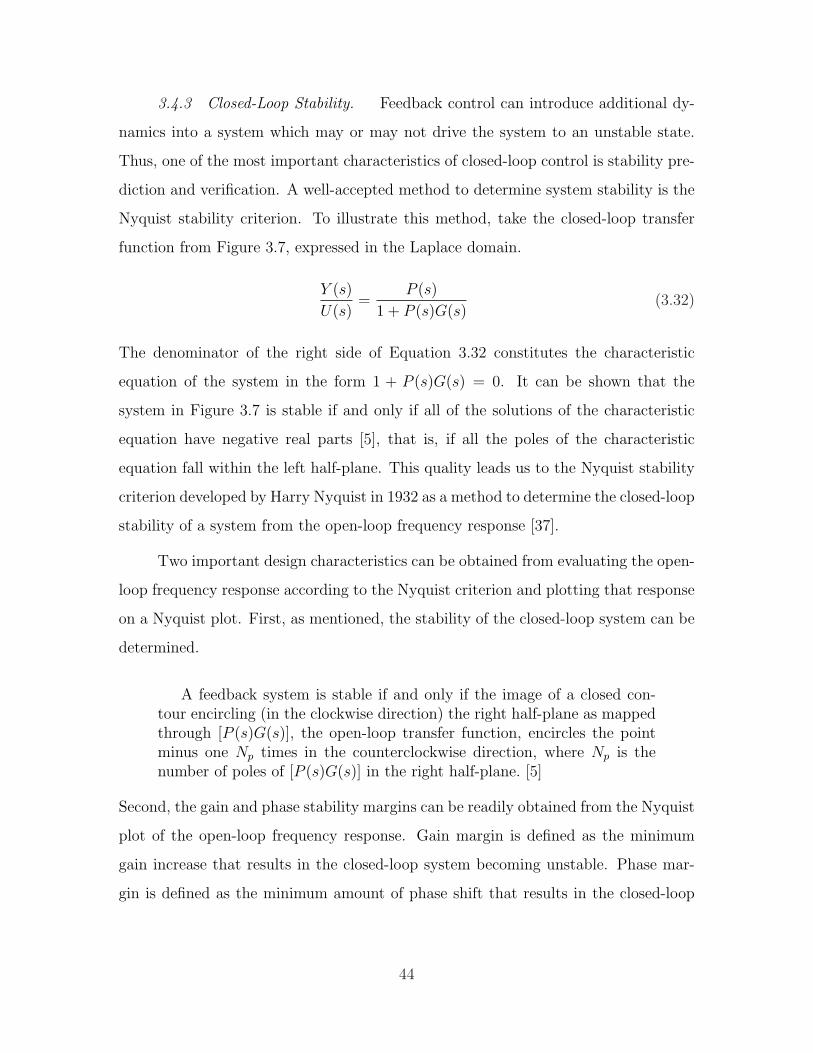
3.4.3 Closed-Loop Stability. Feedback control can introduce additional dy-
namics into a system which may or may not drive the system to an unstable state.
Thus, one of the most important characteristics of closed-loop control is stability pre-
diction and verification. A well-accepted method to determine system stability is the
Nyquist stability criterion. To illustrate this method, take the closed-loop transfer
function from Figure 3.7, expressed in the Laplace domain.
Y (s)
U(s)=
P (s)
1 + P (s)G(s)(3.32)
The denominator of the right side of Equation 3.32 constitutes the characteristic
equation of the system in the form 1 + P (s)G(s) = 0. It can be shown that the
system in Figure 3.7 is stable if and only if all of the solutions of the characteristic
equation have negative real parts [5], that is, if all the poles of the characteristic
equation fall within the left half-plane. This quality leads us to the Nyquist stability
criterion developed by Harry Nyquist in 1932 as a method to determine the closed-loop
stability of a system from the open-loop frequency response [37].
Two important design characteristics can be obtained from evaluating the open-
loop frequency response according to the Nyquist criterion and plotting that response
on a Nyquist plot. First, as mentioned, the stability of the closed-loop system can be
determined.
A feedback system is stable if and only if the image of a closed con-tour encircling (in the clockwise direction) the right half-plane as mappedthrough [P (s)G(s)], the open-loop transfer function, encircles the pointminus one Np times in the counterclockwise direction, where Np is thenumber of poles of [P (s)G(s)] in the right half-plane. [5]
Second, the gain and phase stability margins can be readily obtained from the Nyquist
plot of the open-loop frequency response. Gain margin is defined as the minimum
gain increase that results in the closed-loop system becoming unstable. Phase mar-
gin is defined as the minimum amount of phase shift that results in the closed-loop
44
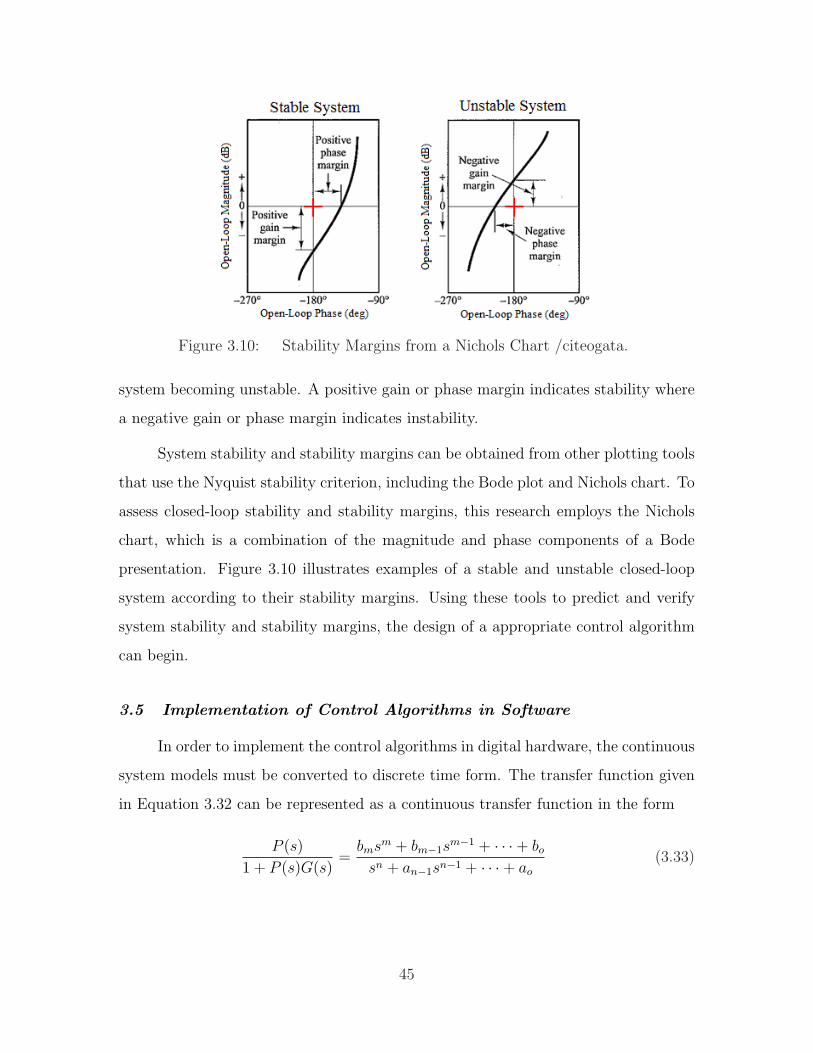
Figure 3.10: Stability Margins from a Nichols Chart /citeogata.
system becoming unstable. A positive gain or phase margin indicates stability where
a negative gain or phase margin indicates instability.
System stability and stability margins can be obtained from other plotting tools
that use the Nyquist stability criterion, including the Bode plot and Nichols chart. To
assess closed-loop stability and stability margins, this research employs the Nichols
chart, which is a combination of the magnitude and phase components of a Bode
presentation. Figure 3.10 illustrates examples of a stable and unstable closed-loop
system according to their stability margins. Using these tools to predict and verify
system stability and stability margins, the design of a appropriate control algorithm
can begin.
3.5 Implementation of Control Algorithms in Software
In order to implement the control algorithms in digital hardware, the continuous
system models must be converted to discrete time form. The transfer function given
in Equation 3.32 can be represented as a continuous transfer function in the form
P (s)
1 + P (s)G(s)=
bmsm + bm−1sm−1 + · · ·+ bo
sn + an−1sn−1 + · · ·+ ao
(3.33)
45

which can be discretized using the impulse response function and a convolution sum-
mation. However, this type of discrete time simulation carries the burden of lengthy
input histories and heavy computational burden from the convolution summation.
The finite difference equation provides a more efficient alternative. For digital sim-
ulation, Reid [41] presents a convenient formulation of an approximate difference
equation for the continuous time model of Equation 3.33 that, when solved for the
output yT (k), takes the form
yT (k) = − aTn−1yT (k − 1)− aTn−2yT (k − 2)− · · · − aT0yT (k − n)
+ bTmuT (k − 1) + bTm−1uT (k − 2) · · ·+ bT0uT (k −m) (3.34)
The coefficients [aTn−1 , · · · , aT0 ] and [bTm , · · · , bT0 ] are similar to those in Equation
3.33 except they are dependent on the sample time T . To solve for the current output
yT (k), Equation 3.34 requires the past n values of the output (yT (k−n)) and the past
n values of the input (uT (k − n)), assuming that the original continuous time model
was not improper (m ≤ n).
Implementing Equation 3.34 in digital software is fairly simple. The sample
time T refers to the sample rate of the digital controller and the coefficients aTn and
bTn can be obtained from existing software applications, such as MATLABTM
, once
the compensator in Equation 3.33 and the sample time are defined.
The National Instruments Inc. Compact Reconfigurable Input-Output (cRIO)
digital controller using the LabVIEWTM
software package was chosen to implement
digital feedback control algorithms and to serve as an interface to the piezoelectric
drive electronics. Figure 3.11 shows the actual hardware components of the cRIO
control unit. As shown in Figure 3.12, the controller analog-to-digital (A/D) input
module receives piezoelectric sensor signals from the amplifier after signal condition-
ing. The signal is then routed through the field programmable gate array and com-
puter module (if required) before the digital-to-analog (D/A) output module sends
the feedback signal to the amplifier to drive the actuators.
46
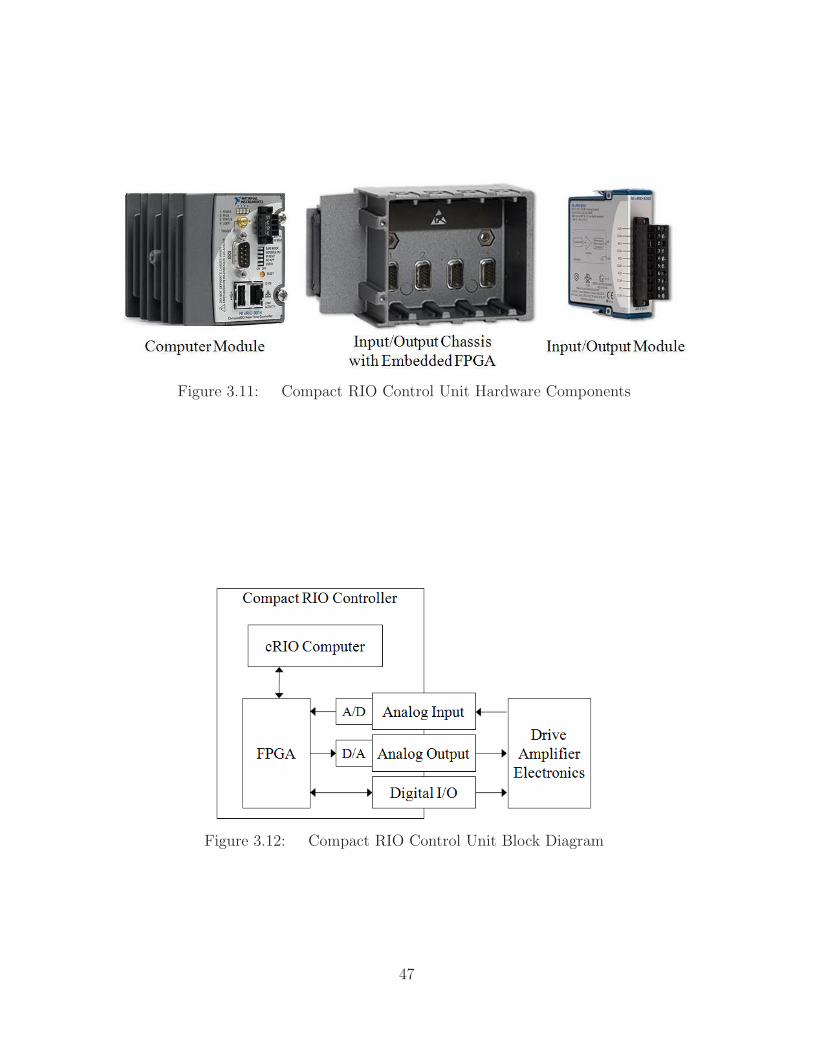
Figure 3.11: Compact RIO Control Unit Hardware Components
Figure 3.12: Compact RIO Control Unit Block Diagram
47

The cRIO controller utilizes a field programmable gate array (FPGA) to inter-
face between the input and output modules and the computer module responsible for
the operation of the digital control unit. The FPGA can be programmed directly
to handle various types of operations; for example, the control algorithm itself can
be programmed directly onto the FGPA, enabling faster sample rates and fixed-step
computation times and ensuring deterministic control of the plant. The control tech-
niques described above can be realized in a transfer function as small as second-order,
like the PPF algorithm, or as a more complicated algorithm, like an LQG compen-
sator. Regardless of the number of states in the compensator, the digital controller
must be able to maintain the desired data rate. The FPGA offers a vehicle to achieve
this goal.
48
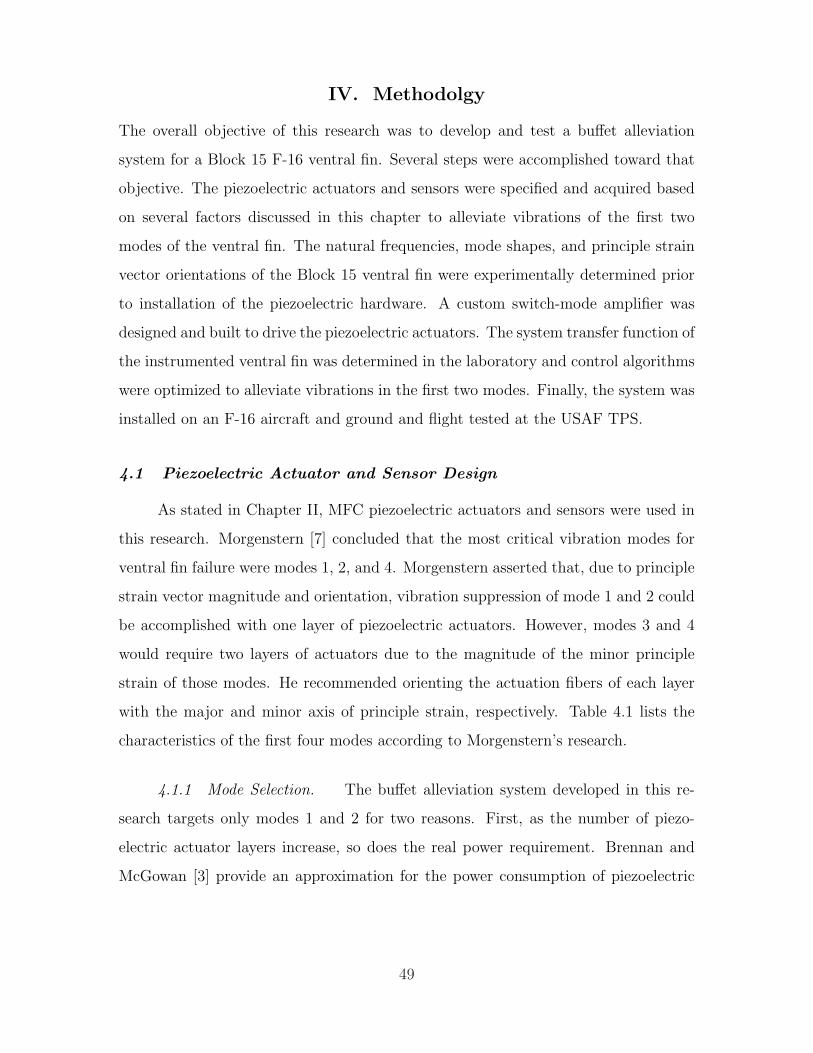
IV. Methodolgy
The overall objective of this research was to develop and test a buffet alleviation
system for a Block 15 F-16 ventral fin. Several steps were accomplished toward that
objective. The piezoelectric actuators and sensors were specified and acquired based
on several factors discussed in this chapter to alleviate vibrations of the first two
modes of the ventral fin. The natural frequencies, mode shapes, and principle strain
vector orientations of the Block 15 ventral fin were experimentally determined prior
to installation of the piezoelectric hardware. A custom switch-mode amplifier was
designed and built to drive the piezoelectric actuators. The system transfer function of
the instrumented ventral fin was determined in the laboratory and control algorithms
were optimized to alleviate vibrations in the first two modes. Finally, the system was
installed on an F-16 aircraft and ground and flight tested at the USAF TPS.
4.1 Piezoelectric Actuator and Sensor Design
As stated in Chapter II, MFC piezoelectric actuators and sensors were used in
this research. Morgenstern [7] concluded that the most critical vibration modes for
ventral fin failure were modes 1, 2, and 4. Morgenstern asserted that, due to principle
strain vector magnitude and orientation, vibration suppression of mode 1 and 2 could
be accomplished with one layer of piezoelectric actuators. However, modes 3 and 4
would require two layers of actuators due to the magnitude of the minor principle
strain of those modes. He recommended orienting the actuation fibers of each layer
with the major and minor axis of principle strain, respectively. Table 4.1 lists the
characteristics of the first four modes according to Morgenstern’s research.
4.1.1 Mode Selection. The buffet alleviation system developed in this re-
search targets only modes 1 and 2 for two reasons. First, as the number of piezo-
electric actuator layers increase, so does the real power requirement. Brennan and
McGowan [3] provide an approximation for the power consumption of piezoelectric
49
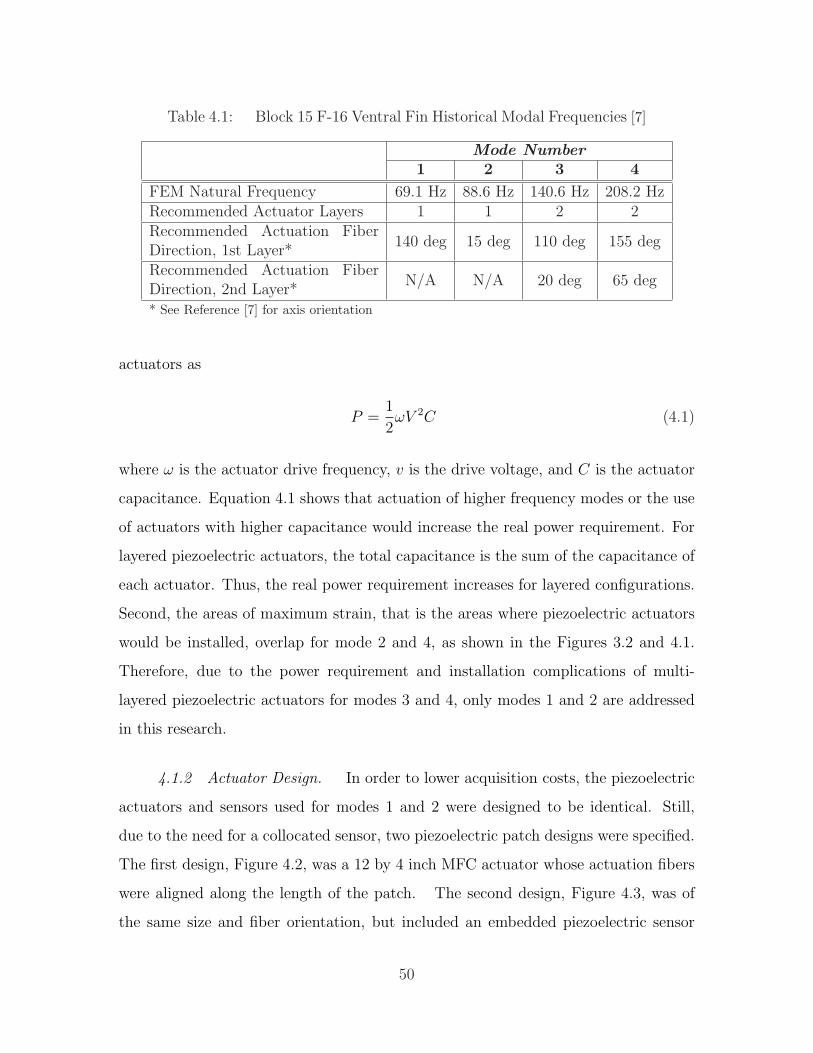
Table 4.1: Block 15 F-16 Ventral Fin Historical Modal Frequencies [7]
Mode Number1 2 3 4
FEM Natural Frequency 69.1 Hz 88.6 Hz 140.6 Hz 208.2 HzRecommended Actuator Layers 1 1 2 2Recommended Actuation FiberDirection, 1st Layer*
140 deg 15 deg 110 deg 155 deg
Recommended Actuation FiberDirection, 2nd Layer*
N/A N/A 20 deg 65 deg
* See Reference [7] for axis orientation
actuators as
P =1
2ωV 2C (4.1)
where ω is the actuator drive frequency, v is the drive voltage, and C is the actuator
capacitance. Equation 4.1 shows that actuation of higher frequency modes or the use
of actuators with higher capacitance would increase the real power requirement. For
layered piezoelectric actuators, the total capacitance is the sum of the capacitance of
each actuator. Thus, the real power requirement increases for layered configurations.
Second, the areas of maximum strain, that is the areas where piezoelectric actuators
would be installed, overlap for mode 2 and 4, as shown in the Figures 3.2 and 4.1.
Therefore, due to the power requirement and installation complications of multi-
layered piezoelectric actuators for modes 3 and 4, only modes 1 and 2 are addressed
in this research.
4.1.2 Actuator Design. In order to lower acquisition costs, the piezoelectric
actuators and sensors used for modes 1 and 2 were designed to be identical. Still,
due to the need for a collocated sensor, two piezoelectric patch designs were specified.
The first design, Figure 4.2, was a 12 by 4 inch MFC actuator whose actuation fibers
were aligned along the length of the patch. The second design, Figure 4.3, was of
the same size and fiber orientation, but included an embedded piezoelectric sensor
50
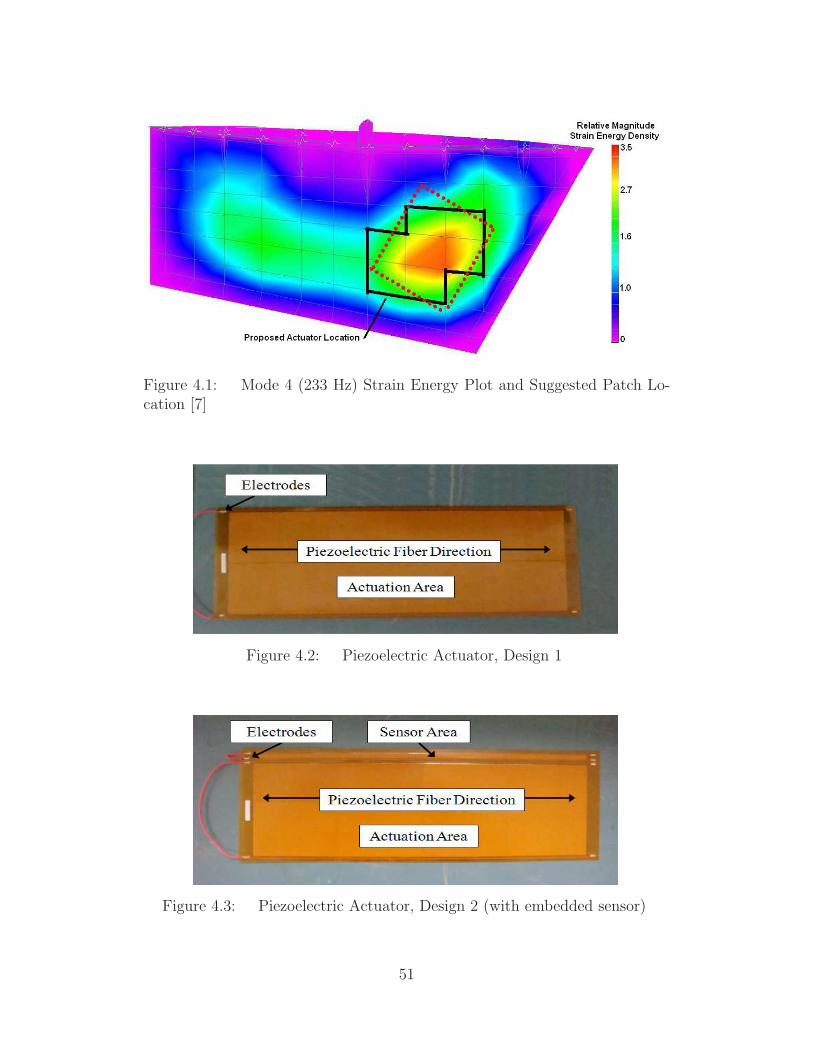
Figure 4.1: Mode 4 (233 Hz) Strain Energy Plot and Suggested Patch Lo-cation [7]
Figure 4.2: Piezoelectric Actuator, Design 1
Figure 4.3: Piezoelectric Actuator, Design 2 (with embedded sensor)
51
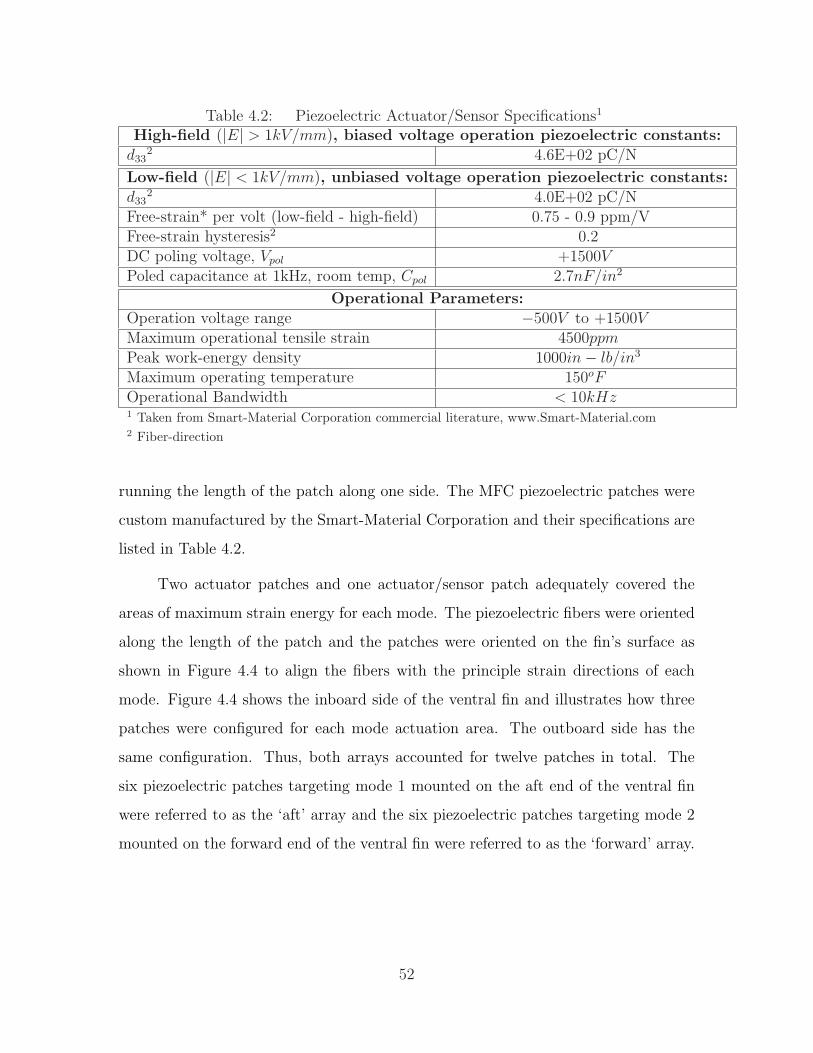
Table 4.2: Piezoelectric Actuator/Sensor Specifications1
High-field (|E| > 1kV/mm), biased voltage operation piezoelectric constants:d33
2 4.6E+02 pC/N
Low-field (|E| < 1kV/mm), unbiased voltage operation piezoelectric constants:d33
2 4.0E+02 pC/NFree-strain* per volt (low-field - high-field) 0.75 - 0.9 ppm/VFree-strain hysteresis2 0.2DC poling voltage, Vpol +1500VPoled capacitance at 1kHz, room temp, Cpol 2.7nF/in2
Operational Parameters:Operation voltage range −500V to +1500VMaximum operational tensile strain 4500ppmPeak work-energy density 1000in− lb/in3
Maximum operating temperature 150oFOperational Bandwidth < 10kHz1 Taken from Smart-Material Corporation commercial literature, www.Smart-Material.com2 Fiber-direction
running the length of the patch along one side. The MFC piezoelectric patches were
custom manufactured by the Smart-Material Corporation and their specifications are
listed in Table 4.2.
Two actuator patches and one actuator/sensor patch adequately covered the
areas of maximum strain energy for each mode. The piezoelectric fibers were oriented
along the length of the patch and the patches were oriented on the fin’s surface as
shown in Figure 4.4 to align the fibers with the principle strain directions of each
mode. Figure 4.4 shows the inboard side of the ventral fin and illustrates how three
patches were configured for each mode actuation area. The outboard side has the
same configuration. Thus, both arrays accounted for twelve patches in total. The
six piezoelectric patches targeting mode 1 mounted on the aft end of the ventral fin
were referred to as the ‘aft’ array and the six piezoelectric patches targeting mode 2
mounted on the forward end of the ventral fin were referred to as the ‘forward’ array.
52
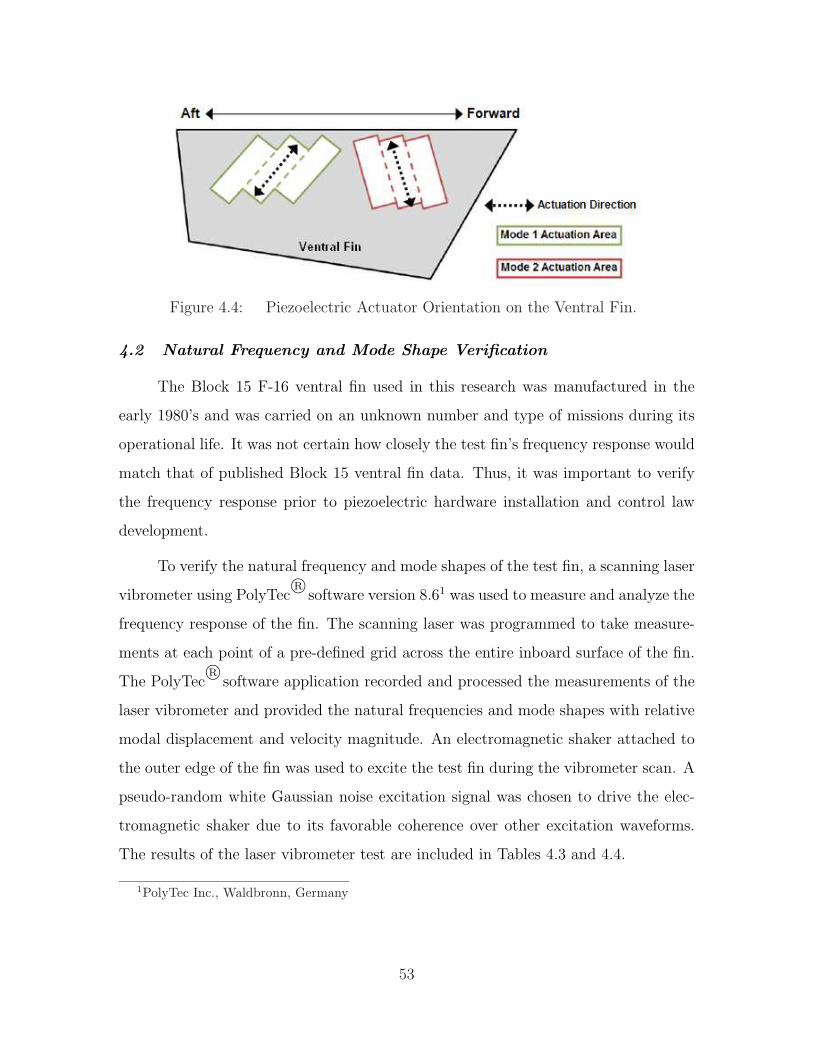
Figure 4.4: Piezoelectric Actuator Orientation on the Ventral Fin.
4.2 Natural Frequency and Mode Shape Verification
The Block 15 F-16 ventral fin used in this research was manufactured in the
early 1980’s and was carried on an unknown number and type of missions during its
operational life. It was not certain how closely the test fin’s frequency response would
match that of published Block 15 ventral fin data. Thus, it was important to verify
the frequency response prior to piezoelectric hardware installation and control law
development.
To verify the natural frequency and mode shapes of the test fin, a scanning laser
vibrometer using PolyTecR©
software version 8.61 was used to measure and analyze the
frequency response of the fin. The scanning laser was programmed to take measure-
ments at each point of a pre-defined grid across the entire inboard surface of the fin.
The PolyTecR©
software application recorded and processed the measurements of the
laser vibrometer and provided the natural frequencies and mode shapes with relative
modal displacement and velocity magnitude. An electromagnetic shaker attached to
the outer edge of the fin was used to excite the test fin during the vibrometer scan. A
pseudo-random white Gaussian noise excitation signal was chosen to drive the elec-
tromagnetic shaker due to its favorable coherence over other excitation waveforms.
The results of the laser vibrometer test are included in Tables 4.3 and 4.4.
1PolyTec Inc., Waldbronn, Germany
53
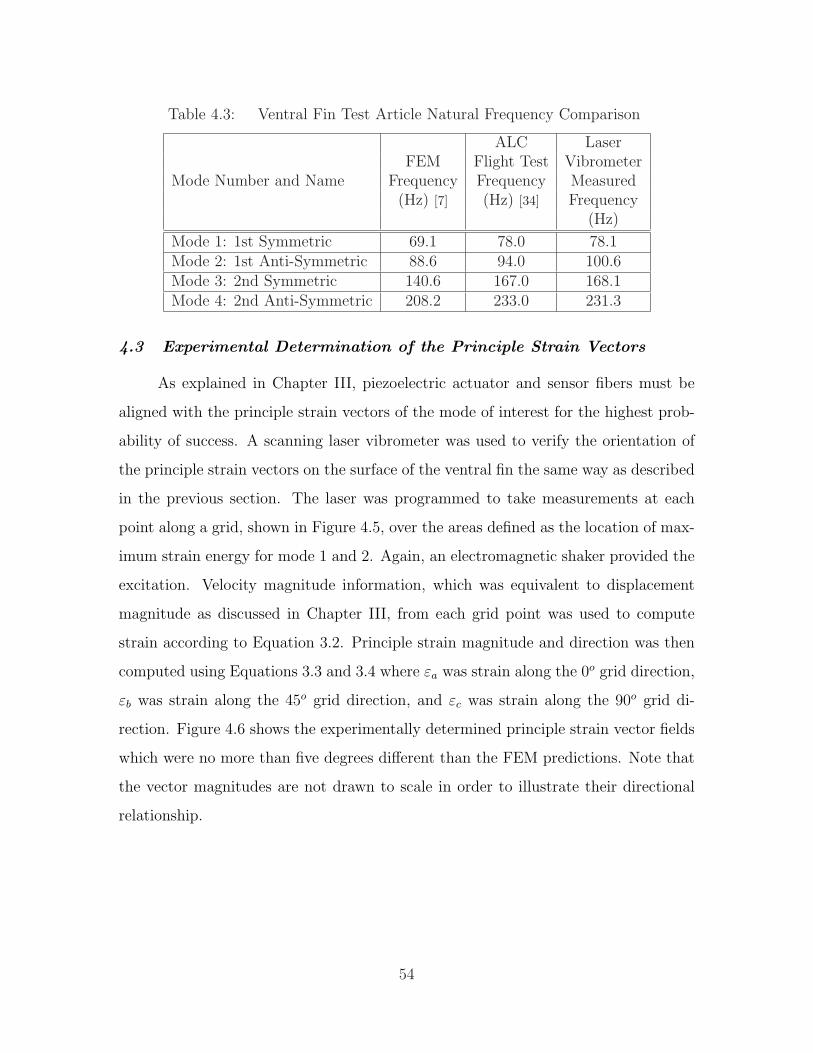
Table 4.3: Ventral Fin Test Article Natural Frequency Comparison
ALC LaserFEM Flight Test Vibrometer
Mode Number and Name Frequency Frequency Measured(Hz) [7] (Hz) [34] Frequency
(Hz)
Mode 1: 1st Symmetric 69.1 78.0 78.1Mode 2: 1st Anti-Symmetric 88.6 94.0 100.6Mode 3: 2nd Symmetric 140.6 167.0 168.1Mode 4: 2nd Anti-Symmetric 208.2 233.0 231.3
4.3 Experimental Determination of the Principle Strain Vectors
As explained in Chapter III, piezoelectric actuator and sensor fibers must be
aligned with the principle strain vectors of the mode of interest for the highest prob-
ability of success. A scanning laser vibrometer was used to verify the orientation of
the principle strain vectors on the surface of the ventral fin the same way as described
in the previous section. The laser was programmed to take measurements at each
point along a grid, shown in Figure 4.5, over the areas defined as the location of max-
imum strain energy for mode 1 and 2. Again, an electromagnetic shaker provided the
excitation. Velocity magnitude information, which was equivalent to displacement
magnitude as discussed in Chapter III, from each grid point was used to compute
strain according to Equation 3.2. Principle strain magnitude and direction was then
computed using Equations 3.3 and 3.4 where εa was strain along the 0o grid direction,
εb was strain along the 45o grid direction, and εc was strain along the 90o grid di-
rection. Figure 4.6 shows the experimentally determined principle strain vector fields
which were no more than five degrees different than the FEM predictions. Note that
the vector magnitudes are not drawn to scale in order to illustrate their directional
relationship.
54
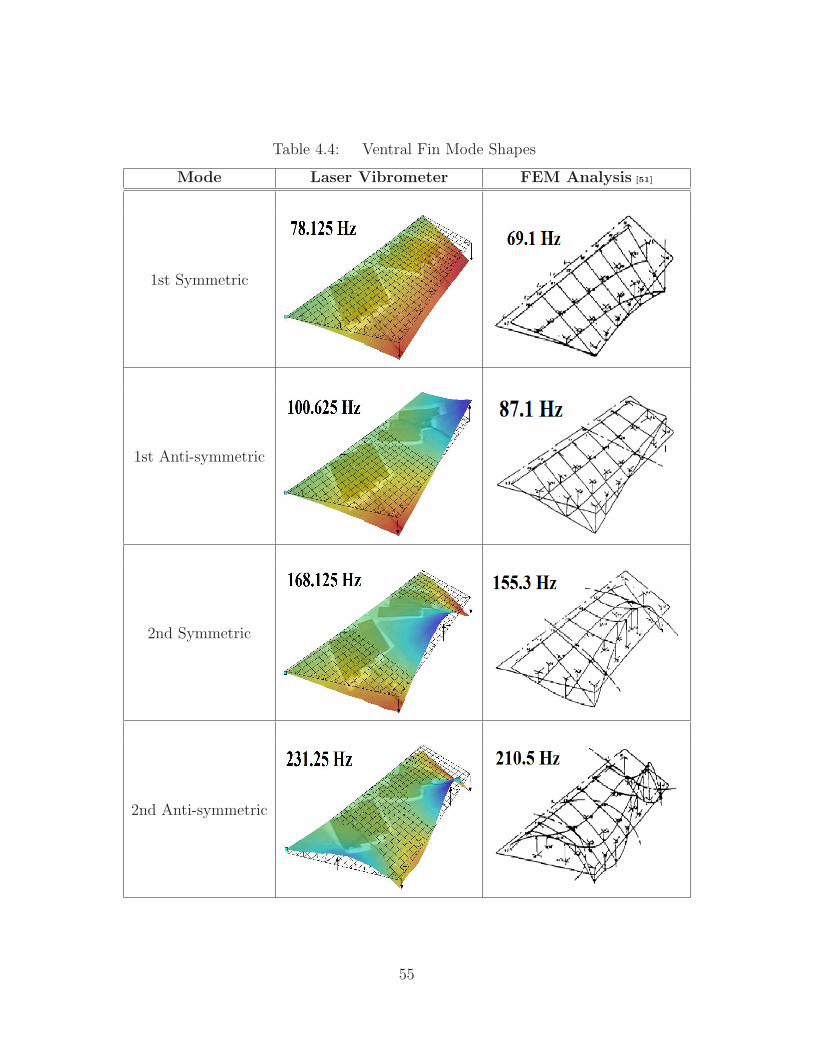
Table 4.4: Ventral Fin Mode Shapes
Mode Laser Vibrometer FEM Analysis [51]
1st Symmetric
1st Anti-symmetric
2nd Symmetric
2nd Anti-symmetric
55
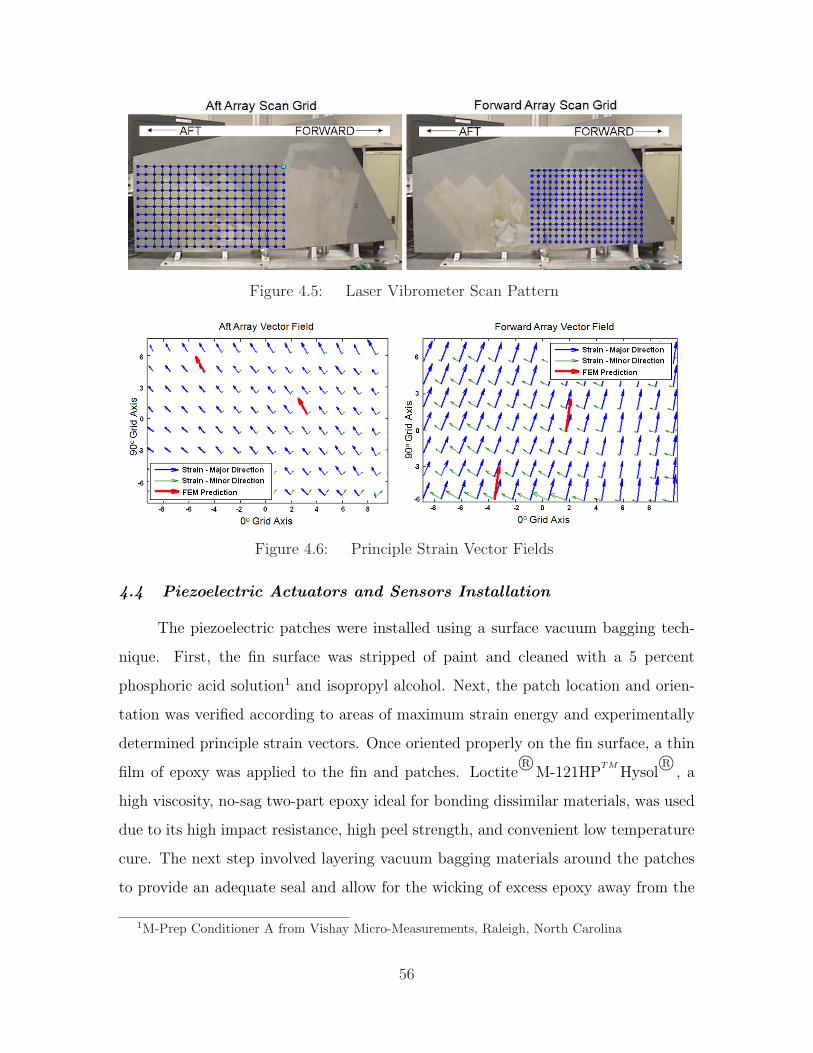
Figure 4.5: Laser Vibrometer Scan Pattern
Figure 4.6: Principle Strain Vector Fields
4.4 Piezoelectric Actuators and Sensors Installation
The piezoelectric patches were installed using a surface vacuum bagging tech-
nique. First, the fin surface was stripped of paint and cleaned with a 5 percent
phosphoric acid solution1 and isopropyl alcohol. Next, the patch location and orien-
tation was verified according to areas of maximum strain energy and experimentally
determined principle strain vectors. Once oriented properly on the fin surface, a thin
film of epoxy was applied to the fin and patches. LoctiteR©
M-121HPTM
HysolR©
, a
high viscosity, no-sag two-part epoxy ideal for bonding dissimilar materials, was used
due to its high impact resistance, high peel strength, and convenient low temperature
cure. The next step involved layering vacuum bagging materials around the patches
to provide an adequate seal and allow for the wicking of excess epoxy away from the
1M-Prep Conditioner A from Vishay Micro-Measurements, Raleigh, North Carolina
56
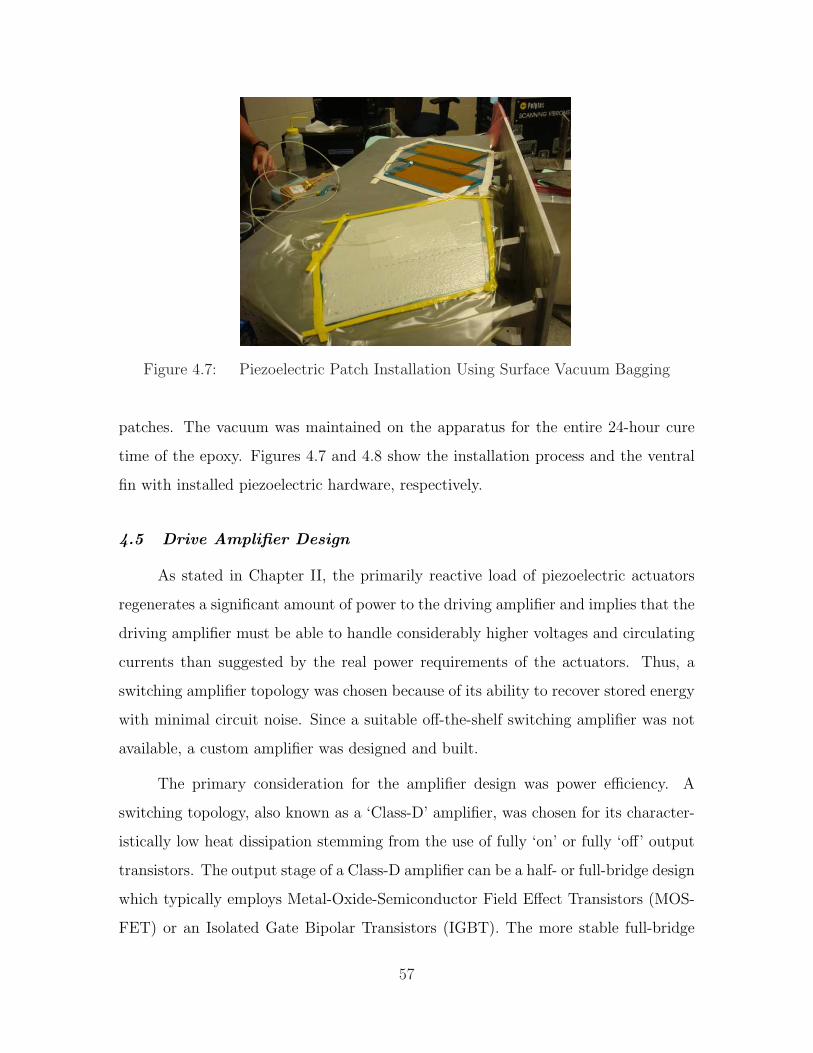
Figure 4.7: Piezoelectric Patch Installation Using Surface Vacuum Bagging
patches. The vacuum was maintained on the apparatus for the entire 24-hour cure
time of the epoxy. Figures 4.7 and 4.8 show the installation process and the ventral
fin with installed piezoelectric hardware, respectively.
4.5 Drive Amplifier Design
As stated in Chapter II, the primarily reactive load of piezoelectric actuators
regenerates a significant amount of power to the driving amplifier and implies that the
driving amplifier must be able to handle considerably higher voltages and circulating
currents than suggested by the real power requirements of the actuators. Thus, a
switching amplifier topology was chosen because of its ability to recover stored energy
with minimal circuit noise. Since a suitable off-the-shelf switching amplifier was not
available, a custom amplifier was designed and built.
The primary consideration for the amplifier design was power efficiency. A
switching topology, also known as a ‘Class-D’ amplifier, was chosen for its character-
istically low heat dissipation stemming from the use of fully ‘on’ or fully ‘off’ output
transistors. The output stage of a Class-D amplifier can be a half- or full-bridge design
which typically employs Metal-Oxide-Semiconductor Field Effect Transistors (MOS-
FET) or an Isolated Gate Bipolar Transistors (IGBT). The more stable full-bridge
57
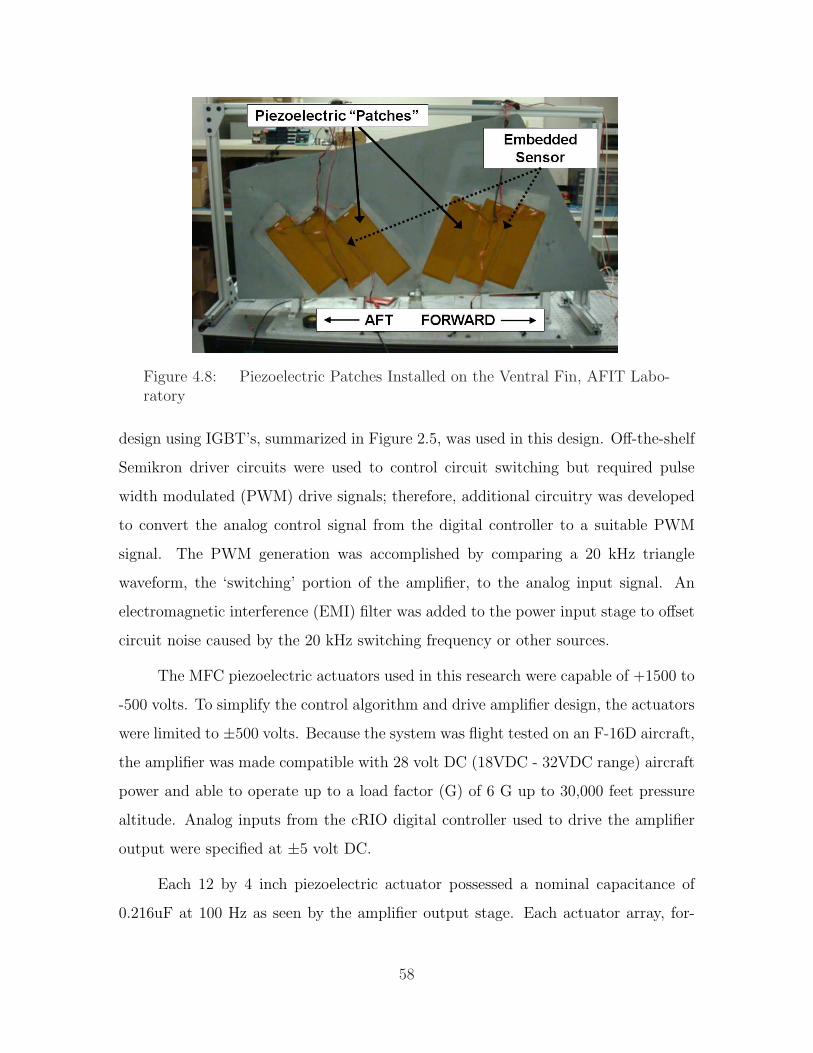
Figure 4.8: Piezoelectric Patches Installed on the Ventral Fin, AFIT Labo-ratory
design using IGBT’s, summarized in Figure 2.5, was used in this design. Off-the-shelf
Semikron driver circuits were used to control circuit switching but required pulse
width modulated (PWM) drive signals; therefore, additional circuitry was developed
to convert the analog control signal from the digital controller to a suitable PWM
signal. The PWM generation was accomplished by comparing a 20 kHz triangle
waveform, the ‘switching’ portion of the amplifier, to the analog input signal. An
electromagnetic interference (EMI) filter was added to the power input stage to offset
circuit noise caused by the 20 kHz switching frequency or other sources.
The MFC piezoelectric actuators used in this research were capable of +1500 to
-500 volts. To simplify the control algorithm and drive amplifier design, the actuators
were limited to ±500 volts. Because the system was flight tested on an F-16D aircraft,
the amplifier was made compatible with 28 volt DC (18VDC - 32VDC range) aircraft
power and able to operate up to a load factor (G) of 6 G up to 30,000 feet pressure
altitude. Analog inputs from the cRIO digital controller used to drive the amplifier
output were specified at ±5 volt DC.
Each 12 by 4 inch piezoelectric actuator possessed a nominal capacitance of
0.216uF at 100 Hz as seen by the amplifier output stage. Each actuator array, for-
58

ward and aft, were comprised of six total actuators wired in parallel resulting in an
estimated 1.3 uF capacitance. DC bus ‘fill’ capacitors rated at ten times the piezo-
electric load were used to complete the circuit. The amplifier was rated at twice the
aircraft DC bus voltage to enhance system robustness. The entire amplifier assembly
included two individual switching amplifier circuits allowing for independent control of
each piezoelectric array on the ventral fin. The block diagram for the entire amplifier
is shown in Figure 4.9. The frequency response for one channel shown in Figure 4.10
illustrates the 400 Hz bandwidth and natural resonance at 300 Hz in each amplifier.
Of the four piezoelectric sensors installed on the ventral fin, only two were used
for feedback control. The remaining two were used for data collection and analysis.
Nevertheless, each sensor signal input to the amplifier assembly were conditioned by
anti-alias filters comprised of analog butterworth filters prior to being output to the
digital controller and outside data recording hardware. Due to phase lag problems
encountered with the digital control input/output modules, the cutoff frequency for
the butterworth filters was set at 7.0 kHz to enhance phase properties of the drive
amplifier near the frequencies of interest (50-200 Hz). An adjustable attenuation
circuit was also designed to enable the selection of a range of feedback gains for the
piezoelectric sensor signals prior to output from the amplifier assembly to the digital
controller. These levels could be adjusted to ensure the sensor signal was kept at
maximum sensitive during testing. Table 4.5 lists the specifications for each sensor
signal output from the amplifier assembly and Figure 4.11 illustrates the adjustable
attenuation circuit design. Note that an additional attenuation was added to the
circuit following initial flight testing as discussed in Chapter V. The attenuation values
listed in Table 4.5 and Figure 4.11 include the modification. The amplifier electronics
also incorporated bit selectable system operation commands that controlled the power
state of the high voltage convertors and PWM driver circuits. The completed amplifier
assembly is shown in Figure 4.12.
59
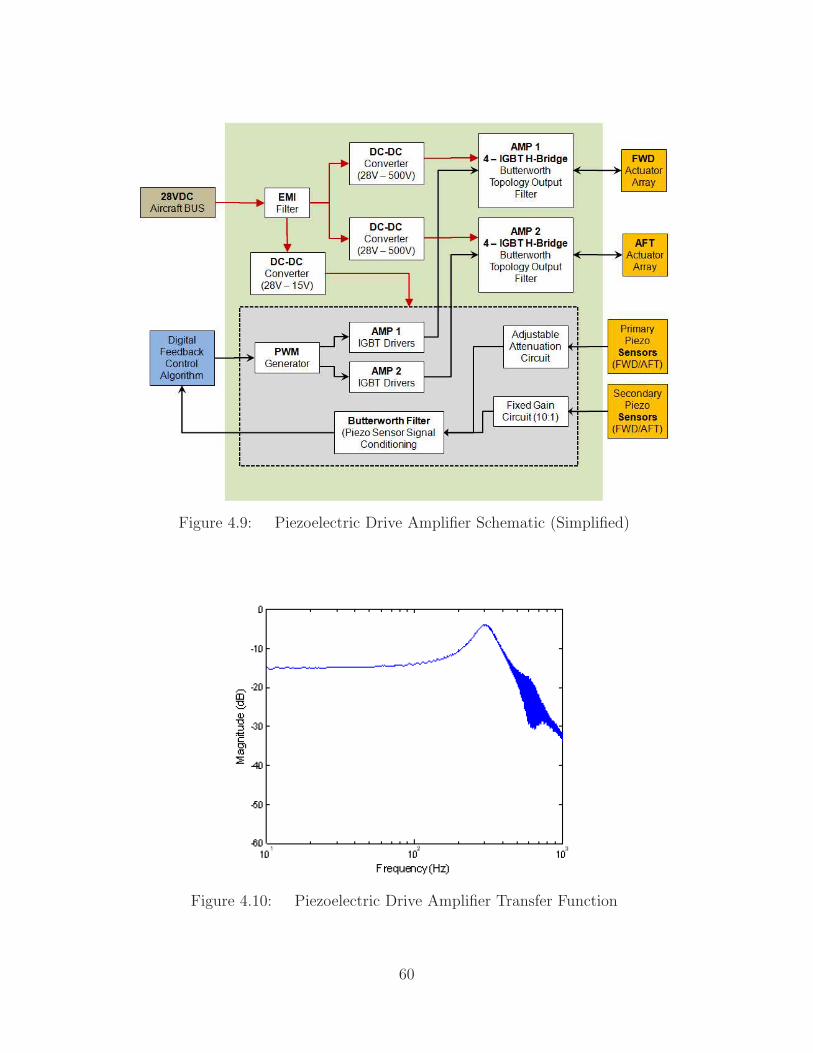
Figure 4.9: Piezoelectric Drive Amplifier Schematic (Simplified)
Figure 4.10: Piezoelectric Drive Amplifier Transfer Function
60
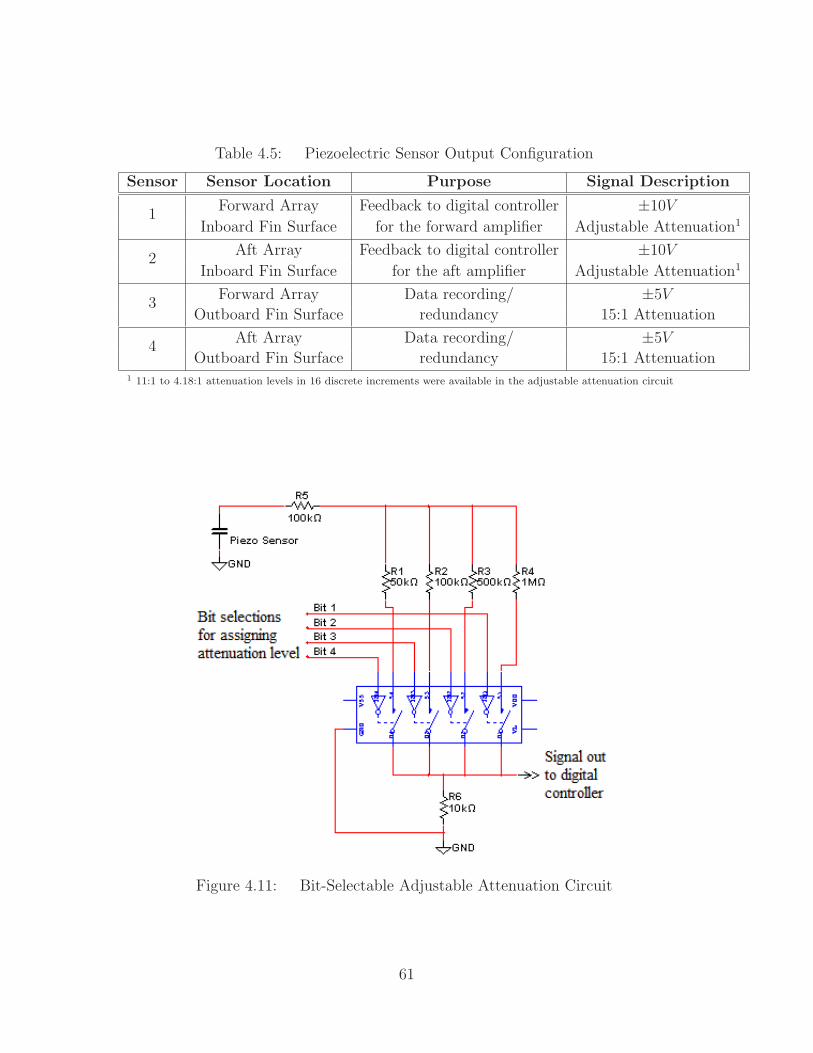
Table 4.5: Piezoelectric Sensor Output Configuration
Sensor Sensor Location Purpose Signal Description
1Forward Array Feedback to digital controller ±10V
Inboard Fin Surface for the forward amplifier Adjustable Attenuation1
2Aft Array Feedback to digital controller ±10V
Inboard Fin Surface for the aft amplifier Adjustable Attenuation1
3Forward Array Data recording/ ±5V
Outboard Fin Surface redundancy 15:1 Attenuation
4Aft Array Data recording/ ±5V
Outboard Fin Surface redundancy 15:1 Attenuation1 11:1 to 4.18:1 attenuation levels in 16 discrete increments were available in the adjustable attenuation circuit
Figure 4.11: Bit-Selectable Adjustable Attenuation Circuit
61

Figure 4.12: Amplifier Assembly
4.6 Transfer Function Model Realization
An accurate system model was needed to develop effective control algorithms.
First, the system was described according to the block diagram in Figure 4.13. The
input U(s), introduced in Figure 3.7, equals zero in Figure 4.13 and was included
for completeness for the calculation of the plant, P (s). Thus, the compensator and
plant components of the bock diagram can be put in terms of the closed-loop transfer
function
Y (s)
U(s)=
P (s)
1 + P (s)G(s)(4.2)
where G(s) was the digital control unit including its D/A and A/D functions and the
control law coded in the cRIO and P (s) was the plant including the drive amplifier, the
ventral fin with installed piezoelectric hardware, and the signal conditioning electron-
ics housed in the amplifier assembly. Defining the system in this way separated the
digital controller from the rest of the system simplifying experimental determination
of the transfer function for the plant, P (s).
62
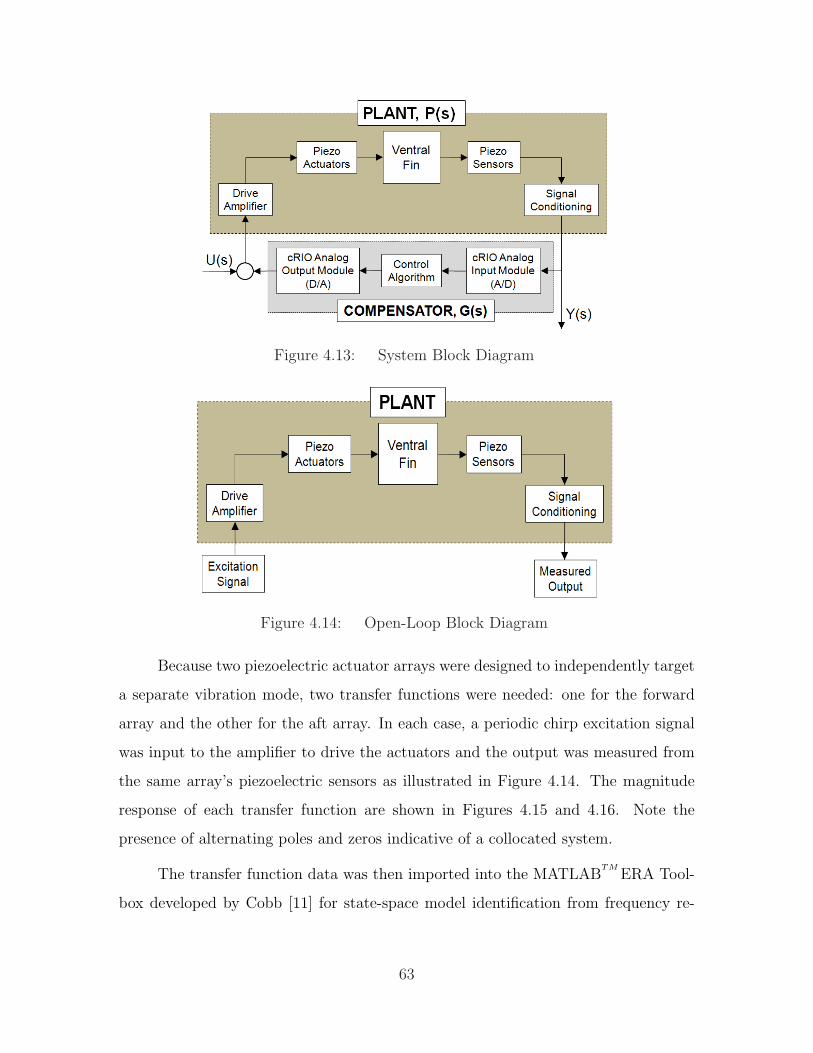
Figure 4.13: System Block Diagram
Figure 4.14: Open-Loop Block Diagram
Because two piezoelectric actuator arrays were designed to independently target
a separate vibration mode, two transfer functions were needed: one for the forward
array and the other for the aft array. In each case, a periodic chirp excitation signal
was input to the amplifier to drive the actuators and the output was measured from
the same array’s piezoelectric sensors as illustrated in Figure 4.14. The magnitude
response of each transfer function are shown in Figures 4.15 and 4.16. Note the
presence of alternating poles and zeros indicative of a collocated system.
The transfer function data was then imported into the MATLABTM
ERA Tool-
box developed by Cobb [11] for state-space model identification from frequency re-
63
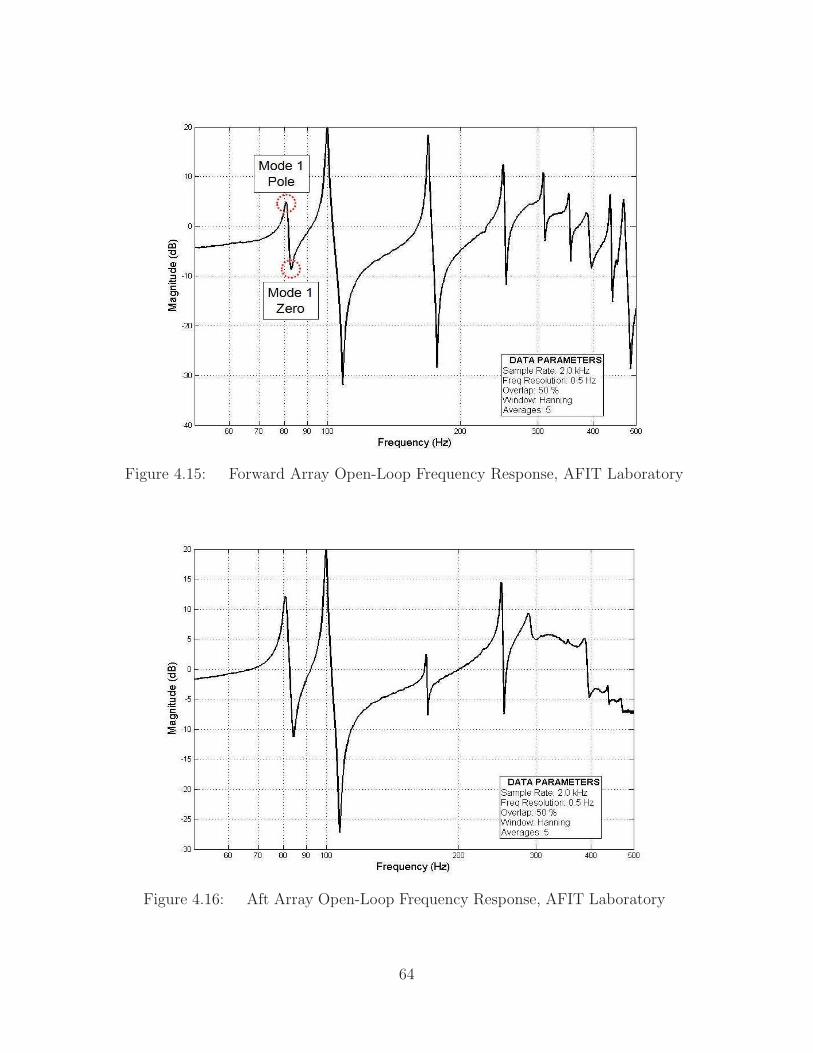
Figure 4.15: Forward Array Open-Loop Frequency Response, AFIT Laboratory
Figure 4.16: Aft Array Open-Loop Frequency Response, AFIT Laboratory
64
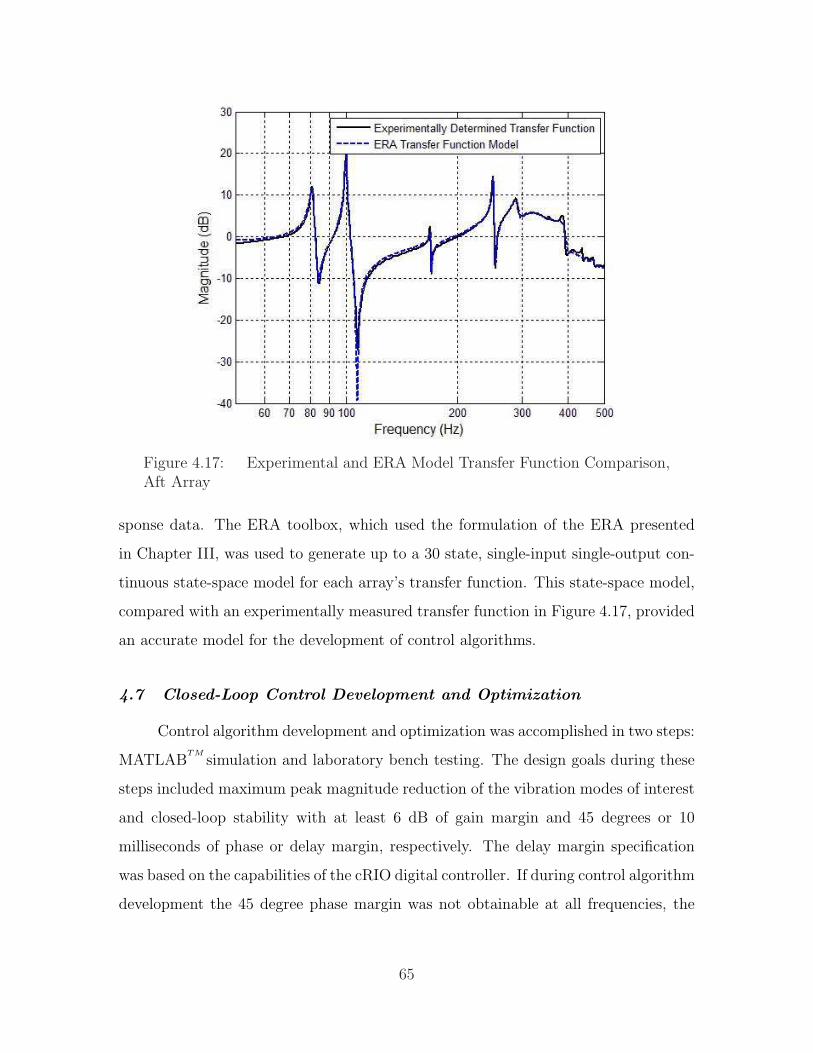
Figure 4.17: Experimental and ERA Model Transfer Function Comparison,Aft Array
sponse data. The ERA toolbox, which used the formulation of the ERA presented
in Chapter III, was used to generate up to a 30 state, single-input single-output con-
tinuous state-space model for each array’s transfer function. This state-space model,
compared with an experimentally measured transfer function in Figure 4.17, provided
an accurate model for the development of control algorithms.
4.7 Closed-Loop Control Development and Optimization
Control algorithm development and optimization was accomplished in two steps:
MATLABTM
simulation and laboratory bench testing. The design goals during these
steps included maximum peak magnitude reduction of the vibration modes of interest
and closed-loop stability with at least 6 dB of gain margin and 45 degrees or 10
milliseconds of phase or delay margin, respectively. The delay margin specification
was based on the capabilities of the cRIO digital controller. If during control algorithm
development the 45 degree phase margin was not obtainable at all frequencies, the
65
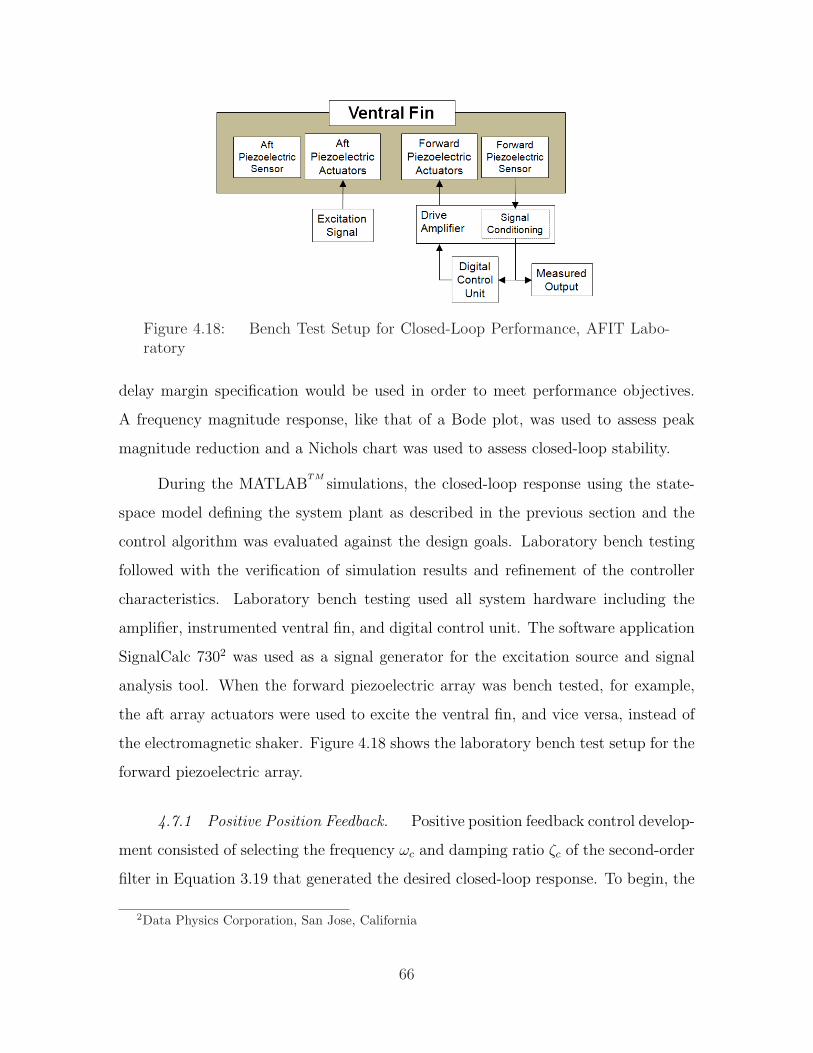
Figure 4.18: Bench Test Setup for Closed-Loop Performance, AFIT Labo-ratory
delay margin specification would be used in order to meet performance objectives.
A frequency magnitude response, like that of a Bode plot, was used to assess peak
magnitude reduction and a Nichols chart was used to assess closed-loop stability.
During the MATLABTM
simulations, the closed-loop response using the state-
space model defining the system plant as described in the previous section and the
control algorithm was evaluated against the design goals. Laboratory bench testing
followed with the verification of simulation results and refinement of the controller
characteristics. Laboratory bench testing used all system hardware including the
amplifier, instrumented ventral fin, and digital control unit. The software application
SignalCalc 7302 was used as a signal generator for the excitation source and signal
analysis tool. When the forward piezoelectric array was bench tested, for example,
the aft array actuators were used to excite the ventral fin, and vice versa, instead of
the electromagnetic shaker. Figure 4.18 shows the laboratory bench test setup for the
forward piezoelectric array.
4.7.1 Positive Position Feedback. Positive position feedback control develop-
ment consisted of selecting the frequency ωc and damping ratio ζc of the second-order
filter in Equation 3.19 that generated the desired closed-loop response. To begin, the
2Data Physics Corporation, San Jose, California
66
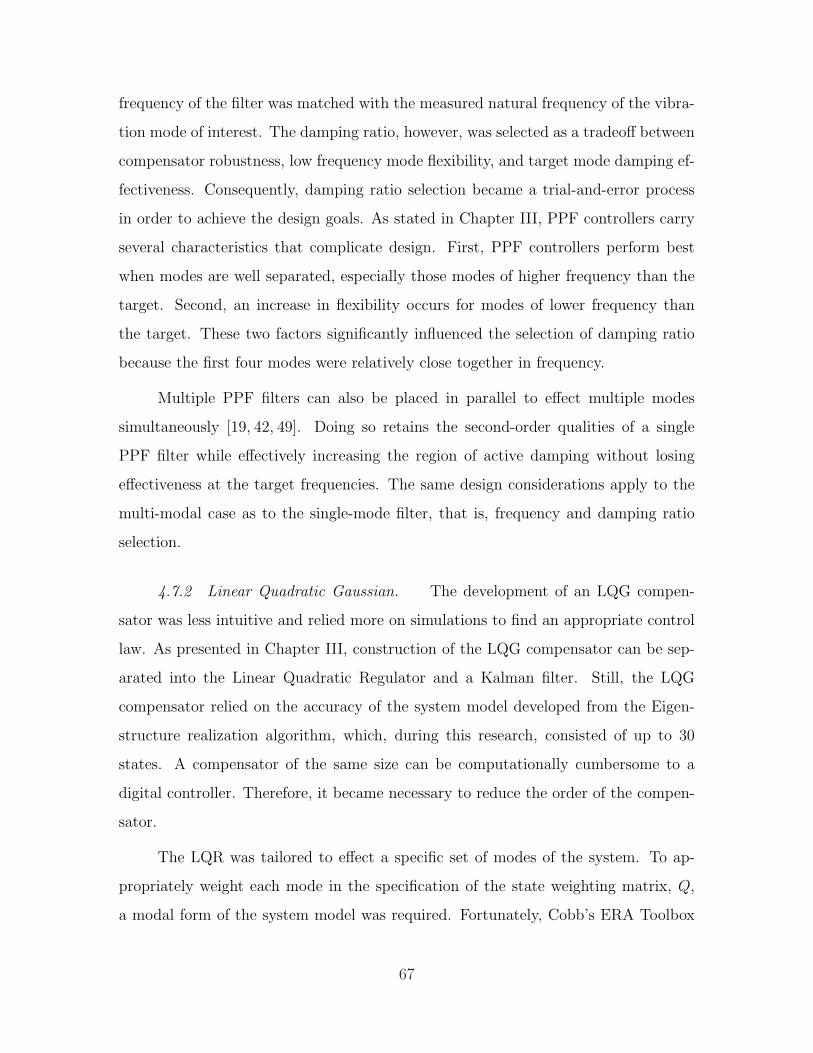
frequency of the filter was matched with the measured natural frequency of the vibra-
tion mode of interest. The damping ratio, however, was selected as a tradeoff between
compensator robustness, low frequency mode flexibility, and target mode damping ef-
fectiveness. Consequently, damping ratio selection became a trial-and-error process
in order to achieve the design goals. As stated in Chapter III, PPF controllers carry
several characteristics that complicate design. First, PPF controllers perform best
when modes are well separated, especially those modes of higher frequency than the
target. Second, an increase in flexibility occurs for modes of lower frequency than
the target. These two factors significantly influenced the selection of damping ratio
because the first four modes were relatively close together in frequency.
Multiple PPF filters can also be placed in parallel to effect multiple modes
simultaneously [19, 42, 49]. Doing so retains the second-order qualities of a single
PPF filter while effectively increasing the region of active damping without losing
effectiveness at the target frequencies. The same design considerations apply to the
multi-modal case as to the single-mode filter, that is, frequency and damping ratio
selection.
4.7.2 Linear Quadratic Gaussian. The development of an LQG compen-
sator was less intuitive and relied more on simulations to find an appropriate control
law. As presented in Chapter III, construction of the LQG compensator can be sep-
arated into the Linear Quadratic Regulator and a Kalman filter. Still, the LQG
compensator relied on the accuracy of the system model developed from the Eigen-
structure realization algorithm, which, during this research, consisted of up to 30
states. A compensator of the same size can be computationally cumbersome to a
digital controller. Therefore, it became necessary to reduce the order of the compen-
sator.
The LQR was tailored to effect a specific set of modes of the system. To ap-
propriately weight each mode in the specification of the state weighting matrix, Q,
a modal form of the system model was required. Fortunately, Cobb’s ERA Toolbox
67

utility for MATLABTM
[11] could output a state-space model of the system in block
diagonal form making the identification of specific modes within the system matrices
much easier. Customizing the weighting matrix Q from Equation 3.24 resulted in a
reduced LQR that targeted a smaller set of desired modes. Given that the closed-loop
system was SISO, Equation 3.24 reduced to
J =1
2
∫ tf
0
[x1 x2 · · · xn
]
q1 0 · · · 0
0 q2 · · · 0...
.... . .
...
0 0 · · · qn
x1
x2
...
xn
+ u2r
dt (4.3)
where qn was the state weighting constant and the control penalty matrix R simplified
to the constant r for the SISO case. Note that, for each mode, there were two states
in the model; therefore, two state weighting constants pertained to each mode.
Considering the bandwidth and frequency response of the amplifier, which had a
natural resonance at 300 Hz, the first three modes (up to 170 Hz) were included in the
final LQG formulations for this research. That is, all state weighting constants that
did not correspond to the poles and zeros of the first three modes of vibration were
made zero. The constant r was arbitrarily set to 100 to penalize control input. The
Kalman filter was specified by setting the noise covariance data for the measurement
noise and disturbance input to unity. Figure 4.19 provides an example of a reduced
order LQG compensator that targets the first three modes only, compared to a full
order compensator where the state weighting matrix was set to the identity matrix of
the original model size.
4.7.3 Digital Implementation. As mentioned, the larger the compensator
order, the more cumbersome it becomes to the digital controller, especially when us-
ing the finite difference method presented in Chapter III. However, due to schedule
constraints, the finite difference method of programming a discrete control law onto
the FPGA of the cRIO control unit was the only method available. Implementing a
68
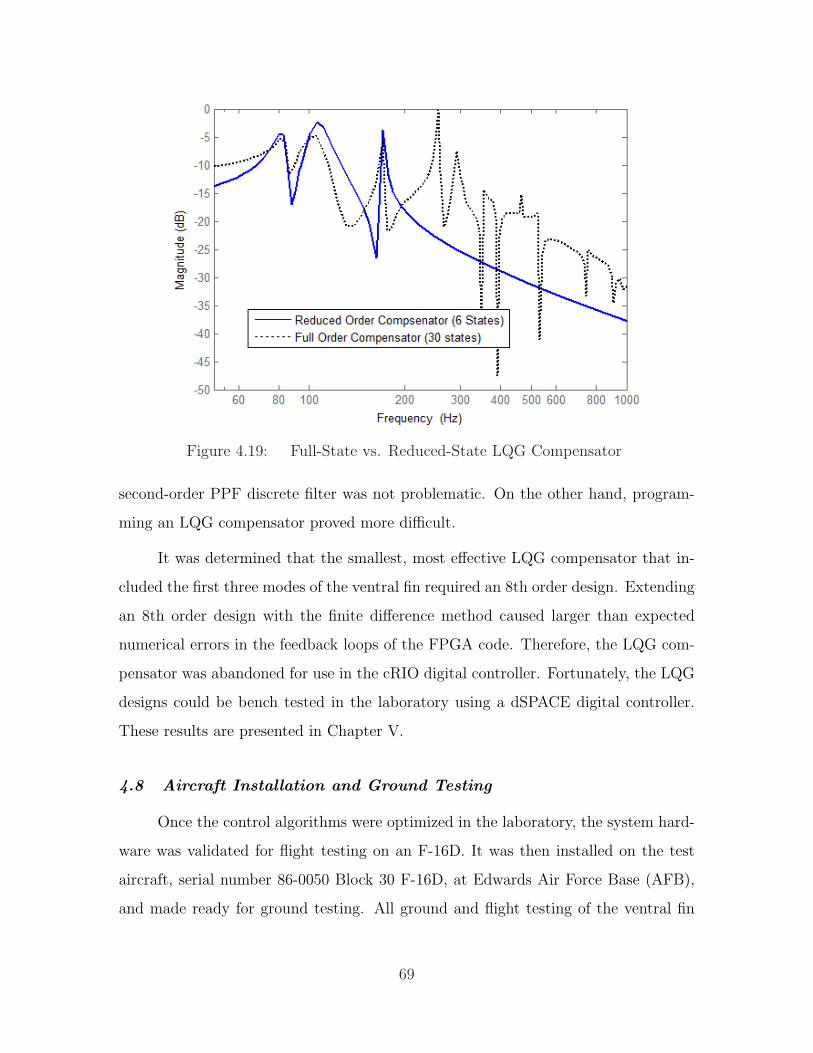
Figure 4.19: Full-State vs. Reduced-State LQG Compensator
second-order PPF discrete filter was not problematic. On the other hand, program-
ming an LQG compensator proved more difficult.
It was determined that the smallest, most effective LQG compensator that in-
cluded the first three modes of the ventral fin required an 8th order design. Extending
an 8th order design with the finite difference method caused larger than expected
numerical errors in the feedback loops of the FPGA code. Therefore, the LQG com-
pensator was abandoned for use in the cRIO digital controller. Fortunately, the LQG
designs could be bench tested in the laboratory using a dSPACE digital controller.
These results are presented in Chapter V.
4.8 Aircraft Installation and Ground Testing
Once the control algorithms were optimized in the laboratory, the system hard-
ware was validated for flight testing on an F-16D. It was then installed on the test
aircraft, serial number 86-0050 Block 30 F-16D, at Edwards Air Force Base (AFB),
and made ready for ground testing. All ground and flight testing of the ventral fin
69
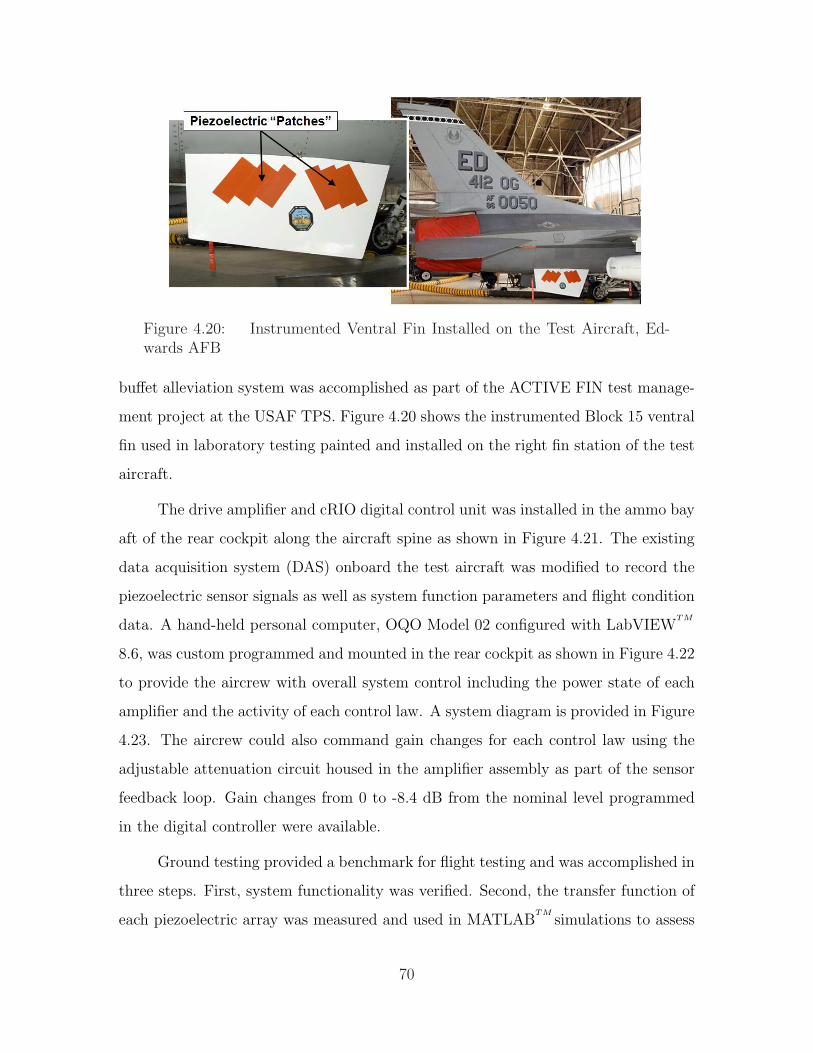
Figure 4.20: Instrumented Ventral Fin Installed on the Test Aircraft, Ed-wards AFB
buffet alleviation system was accomplished as part of the ACTIVE FIN test manage-
ment project at the USAF TPS. Figure 4.20 shows the instrumented Block 15 ventral
fin used in laboratory testing painted and installed on the right fin station of the test
aircraft.
The drive amplifier and cRIO digital control unit was installed in the ammo bay
aft of the rear cockpit along the aircraft spine as shown in Figure 4.21. The existing
data acquisition system (DAS) onboard the test aircraft was modified to record the
piezoelectric sensor signals as well as system function parameters and flight condition
data. A hand-held personal computer, OQO Model 02 configured with LabVIEWTM
8.6, was custom programmed and mounted in the rear cockpit as shown in Figure 4.22
to provide the aircrew with overall system control including the power state of each
amplifier and the activity of each control law. A system diagram is provided in Figure
4.23. The aircrew could also command gain changes for each control law using the
adjustable attenuation circuit housed in the amplifier assembly as part of the sensor
feedback loop. Gain changes from 0 to -8.4 dB from the nominal level programmed
in the digital controller were available.
Ground testing provided a benchmark for flight testing and was accomplished in
three steps. First, system functionality was verified. Second, the transfer function of
each piezoelectric array was measured and used in MATLABTM
simulations to assess
70
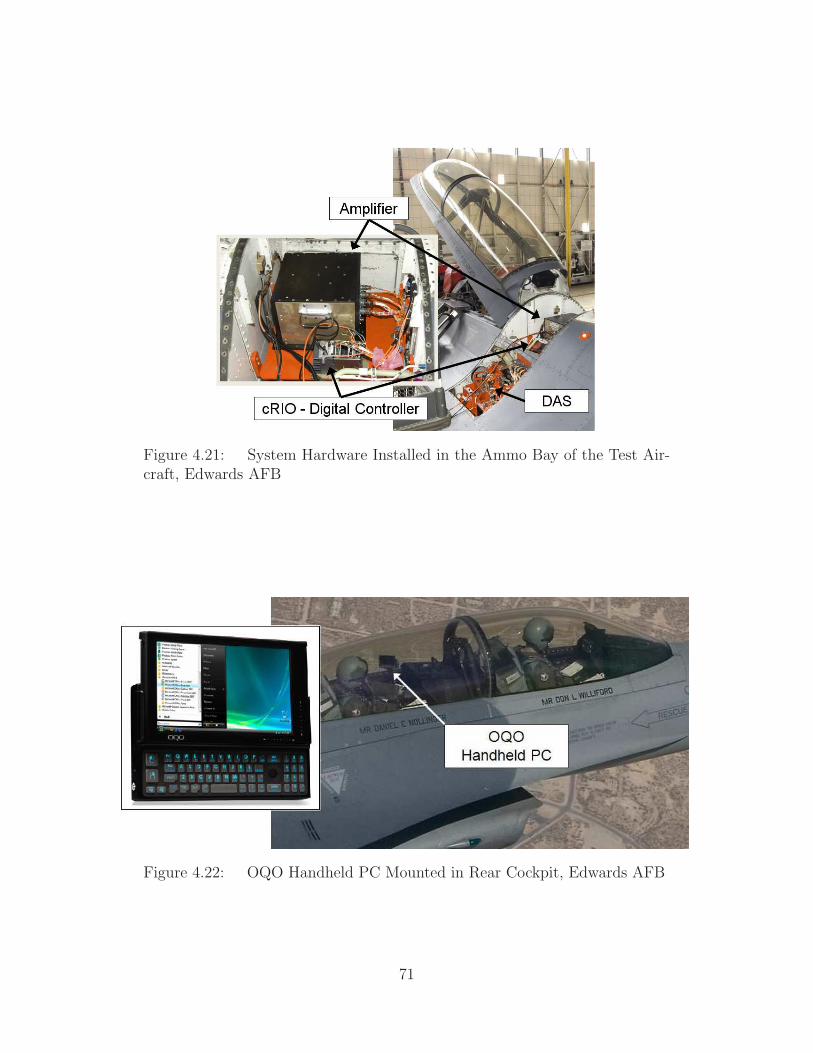
Figure 4.21: System Hardware Installed in the Ammo Bay of the Test Air-craft, Edwards AFB
Figure 4.22: OQO Handheld PC Mounted in Rear Cockpit, Edwards AFB
71
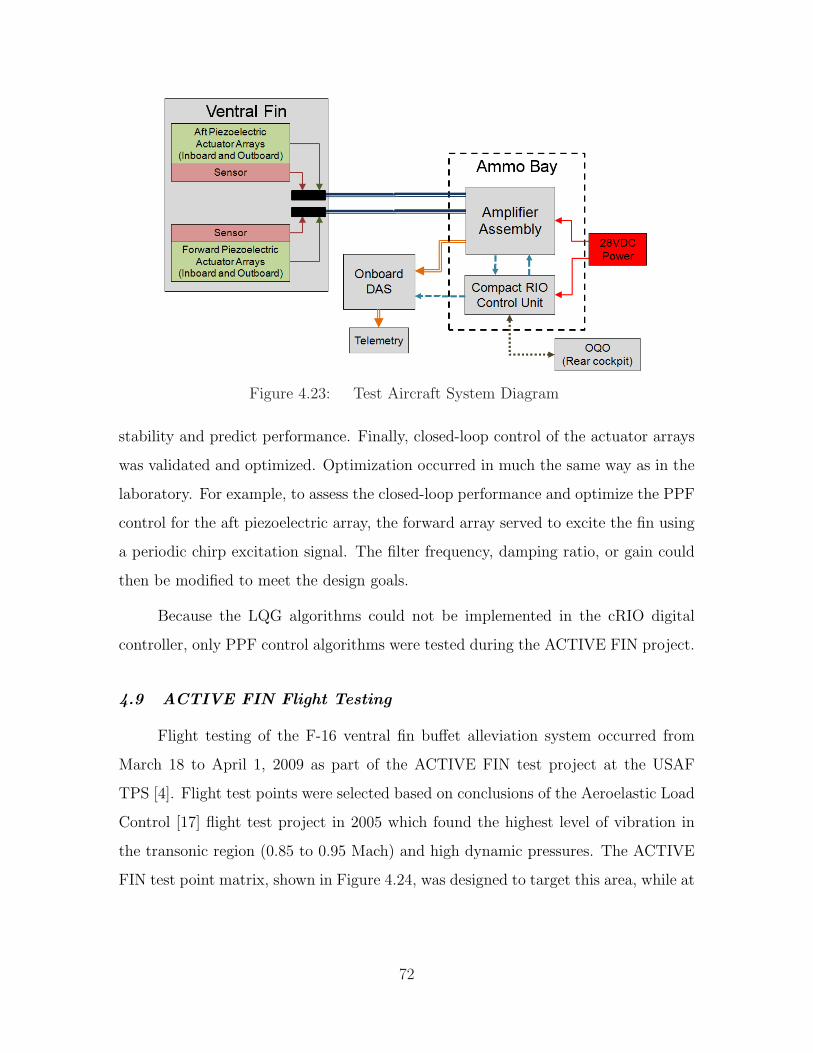
Figure 4.23: Test Aircraft System Diagram
stability and predict performance. Finally, closed-loop control of the actuator arrays
was validated and optimized. Optimization occurred in much the same way as in the
laboratory. For example, to assess the closed-loop performance and optimize the PPF
control for the aft piezoelectric array, the forward array served to excite the fin using
a periodic chirp excitation signal. The filter frequency, damping ratio, or gain could
then be modified to meet the design goals.
Because the LQG algorithms could not be implemented in the cRIO digital
controller, only PPF control algorithms were tested during the ACTIVE FIN project.
4.9 ACTIVE FIN Flight Testing
Flight testing of the F-16 ventral fin buffet alleviation system occurred from
March 18 to April 1, 2009 as part of the ACTIVE FIN test project at the USAF
TPS [4]. Flight test points were selected based on conclusions of the Aeroelastic Load
Control [17] flight test project in 2005 which found the highest level of vibration in
the transonic region (0.85 to 0.95 Mach) and high dynamic pressures. The ACTIVE
FIN test point matrix, shown in Figure 4.24, was designed to target this area, while at
72
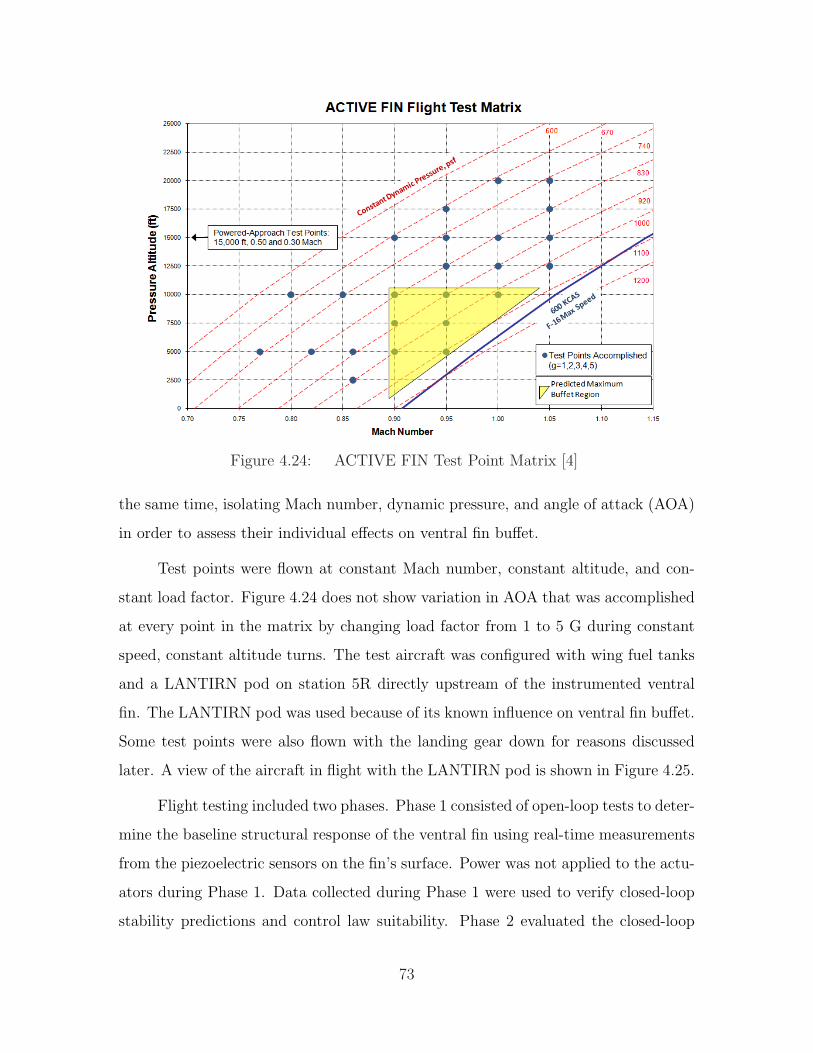
Figure 4.24: ACTIVE FIN Test Point Matrix [4]
the same time, isolating Mach number, dynamic pressure, and angle of attack (AOA)
in order to assess their individual effects on ventral fin buffet.
Test points were flown at constant Mach number, constant altitude, and con-
stant load factor. Figure 4.24 does not show variation in AOA that was accomplished
at every point in the matrix by changing load factor from 1 to 5 G during constant
speed, constant altitude turns. The test aircraft was configured with wing fuel tanks
and a LANTIRN pod on station 5R directly upstream of the instrumented ventral
fin. The LANTIRN pod was used because of its known influence on ventral fin buffet.
Some test points were also flown with the landing gear down for reasons discussed
later. A view of the aircraft in flight with the LANTIRN pod is shown in Figure 4.25.
Flight testing included two phases. Phase 1 consisted of open-loop tests to deter-
mine the baseline structural response of the ventral fin using real-time measurements
from the piezoelectric sensors on the fin’s surface. Power was not applied to the actu-
ators during Phase 1. Data collected during Phase 1 were used to verify closed-loop
stability predictions and control law suitability. Phase 2 evaluated the closed-loop
73

structural response where feedback control was activated in three different scenarios:
forward array active, aft array active, and both arrays active simultaneously.
At least five seconds of stabilized data were collected at each test point and
recorded by the onboard DAS at a sample rate of 6.9 kHz after being filtered by
the signal conditioning circuit in the amplifier. For data processing efficiency and to
control file size during post processing, the test data were re-sampled at 2.3 kHz by
extracting every third data sample from the flight test recording prior to frequency
spectrum analysis. Since the control algorithms were limited to vibration modes below
200 Hz, a Nyquist frequency of 1.15 kHz was adequate for data analysis.
Two measures of performance were obtained from flight data: mean vibration
reduction and modal peak magnitude reduction. The mean vibration of the ventral
fin was determined from the RMS voltage of a sensor during a data set from
VRMS =
√√√√ 1
n
n∑i=1
V 2i (4.4)
where n was the number of samples and Vi was the measured voltage of the piezo-
electric sensor sample. Peak magnitude reduction was determined by comparing the
open-loop and closed-loop frequency spectrum from the same flight condition. The
MATLABTM
pwelch algorithm, which follows Welch’s averaged, modified periodogram
power spectral estimation method, was used to estimate the frequency spectrum. The
Welch method was chosen due to its favorable noise reduction characteristics over
other estimation techniques. Parameters used in the frequency spectrum estimation
are listed in Table 4.6. The number of averages and data segment length (a subset
of the total data sample) was defined as a function of total sample size, frequency
resolution, and overlap.
74
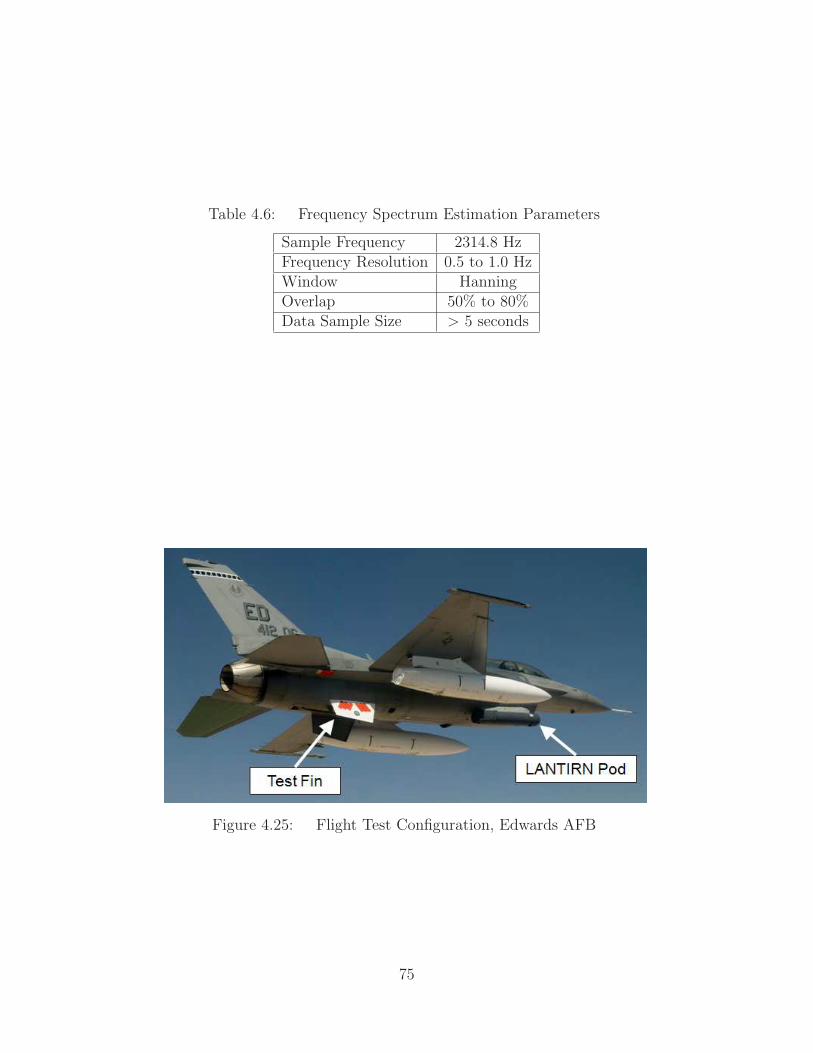
Table 4.6: Frequency Spectrum Estimation Parameters
Sample Frequency 2314.8 HzFrequency Resolution 0.5 to 1.0 HzWindow HanningOverlap 50% to 80%Data Sample Size > 5 seconds
Figure 4.25: Flight Test Configuration, Edwards AFB
75
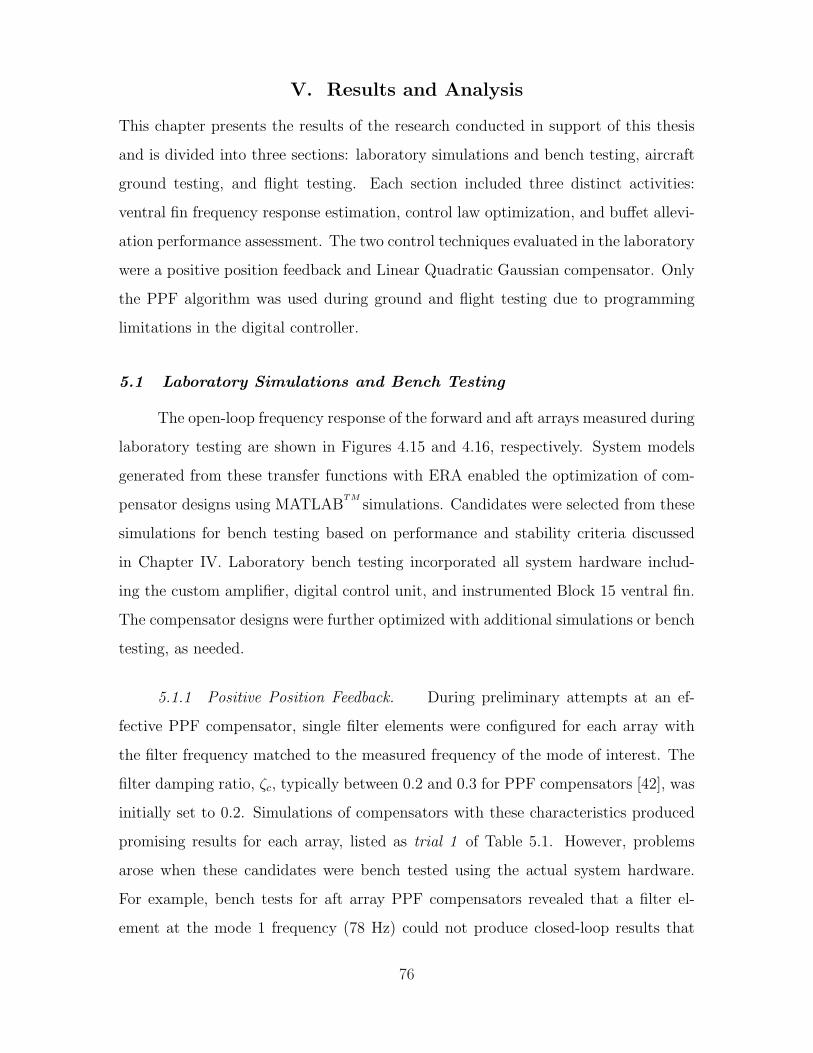
V. Results and Analysis
This chapter presents the results of the research conducted in support of this thesis
and is divided into three sections: laboratory simulations and bench testing, aircraft
ground testing, and flight testing. Each section included three distinct activities:
ventral fin frequency response estimation, control law optimization, and buffet allevi-
ation performance assessment. The two control techniques evaluated in the laboratory
were a positive position feedback and Linear Quadratic Gaussian compensator. Only
the PPF algorithm was used during ground and flight testing due to programming
limitations in the digital controller.
5.1 Laboratory Simulations and Bench Testing
The open-loop frequency response of the forward and aft arrays measured during
laboratory testing are shown in Figures 4.15 and 4.16, respectively. System models
generated from these transfer functions with ERA enabled the optimization of com-
pensator designs using MATLABTM
simulations. Candidates were selected from these
simulations for bench testing based on performance and stability criteria discussed
in Chapter IV. Laboratory bench testing incorporated all system hardware includ-
ing the custom amplifier, digital control unit, and instrumented Block 15 ventral fin.
The compensator designs were further optimized with additional simulations or bench
testing, as needed.
5.1.1 Positive Position Feedback. During preliminary attempts at an ef-
fective PPF compensator, single filter elements were configured for each array with
the filter frequency matched to the measured frequency of the mode of interest. The
filter damping ratio, ζc, typically between 0.2 and 0.3 for PPF compensators [42], was
initially set to 0.2. Simulations of compensators with these characteristics produced
promising results for each array, listed as trial 1 of Table 5.1. However, problems
arose when these candidates were bench tested using the actual system hardware.
For example, bench tests for aft array PPF compensators revealed that a filter el-
ement at the mode 1 frequency (78 Hz) could not produce closed-loop results that
76
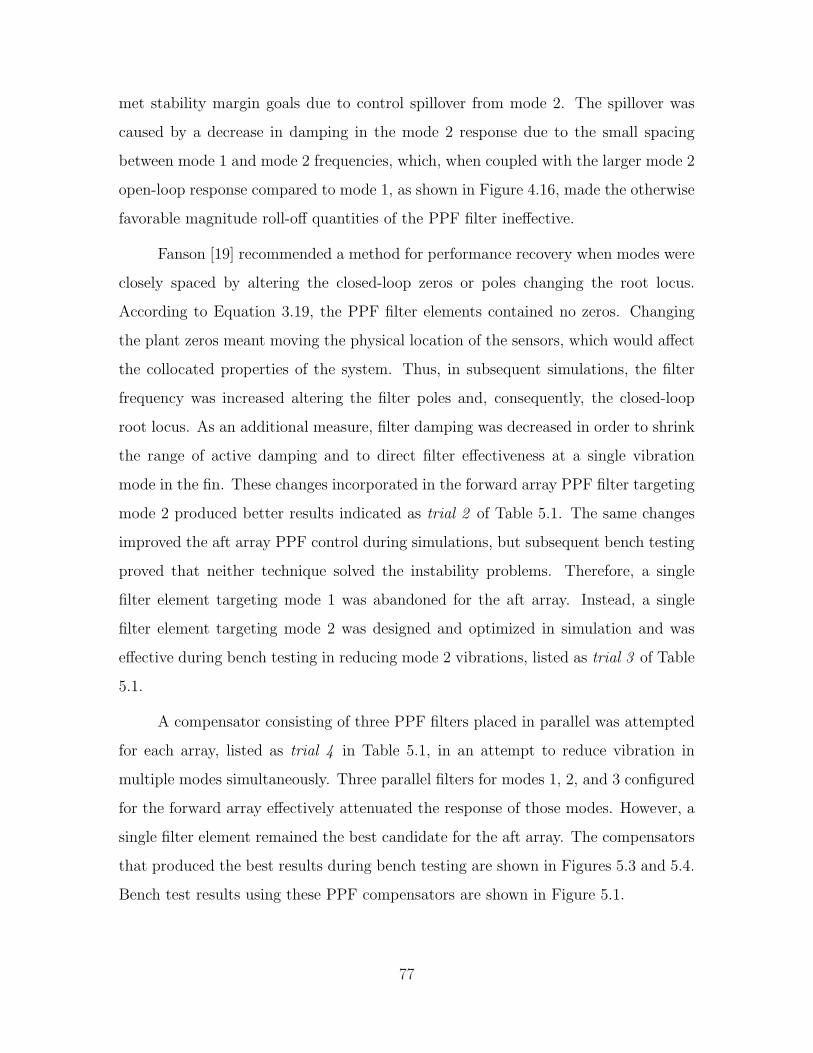
met stability margin goals due to control spillover from mode 2. The spillover was
caused by a decrease in damping in the mode 2 response due to the small spacing
between mode 1 and mode 2 frequencies, which, when coupled with the larger mode 2
open-loop response compared to mode 1, as shown in Figure 4.16, made the otherwise
favorable magnitude roll-off quantities of the PPF filter ineffective.
Fanson [19] recommended a method for performance recovery when modes were
closely spaced by altering the closed-loop zeros or poles changing the root locus.
According to Equation 3.19, the PPF filter elements contained no zeros. Changing
the plant zeros meant moving the physical location of the sensors, which would affect
the collocated properties of the system. Thus, in subsequent simulations, the filter
frequency was increased altering the filter poles and, consequently, the closed-loop
root locus. As an additional measure, filter damping was decreased in order to shrink
the range of active damping and to direct filter effectiveness at a single vibration
mode in the fin. These changes incorporated in the forward array PPF filter targeting
mode 2 produced better results indicated as trial 2 of Table 5.1. The same changes
improved the aft array PPF control during simulations, but subsequent bench testing
proved that neither technique solved the instability problems. Therefore, a single
filter element targeting mode 1 was abandoned for the aft array. Instead, a single
filter element targeting mode 2 was designed and optimized in simulation and was
effective during bench testing in reducing mode 2 vibrations, listed as trial 3 of Table
5.1.
A compensator consisting of three PPF filters placed in parallel was attempted
for each array, listed as trial 4 in Table 5.1, in an attempt to reduce vibration in
multiple modes simultaneously. Three parallel filters for modes 1, 2, and 3 configured
for the forward array effectively attenuated the response of those modes. However, a
single filter element remained the best candidate for the aft array. The compensators
that produced the best results during bench testing are shown in Figures 5.3 and 5.4.
Bench test results using these PPF compensators are shown in Figure 5.1.
77

5.1.2 Linear Quadratic Gaussian. Simulations and bench tests were also
accomplished for LQG designs. The first three modes of the ventral fin were included
in LQG compensator designs by making the state weighting constants in the state
weighting matrix equal to 1 for those modes. The control penalty constant was
set as 100. Effort was made to adjust the state weighting constants for each mode
to optimize performance during simulations and bench testing, but peak reduction
did not improve as to warrant further investigation. Thus, for simplicity, the state
weighting constants were kept equal to 1. The noise covariance data for the Kalman
filter design was not changed during optimizations and were also kept equal to 1.
The compensators that produced the best results during bench testing are shown in
Figures 5.5 and 5.6. Bench test results using these LQG compensators are shown in
Figure 5.2. It is important to note that bench testing the LQG compensators was
accomplished using a MATLABTM
based digital controller not fit for flight testing.
Therefore, bench test results listed in Table 5.2 do not account for the cRIO digital
controller interface.
78
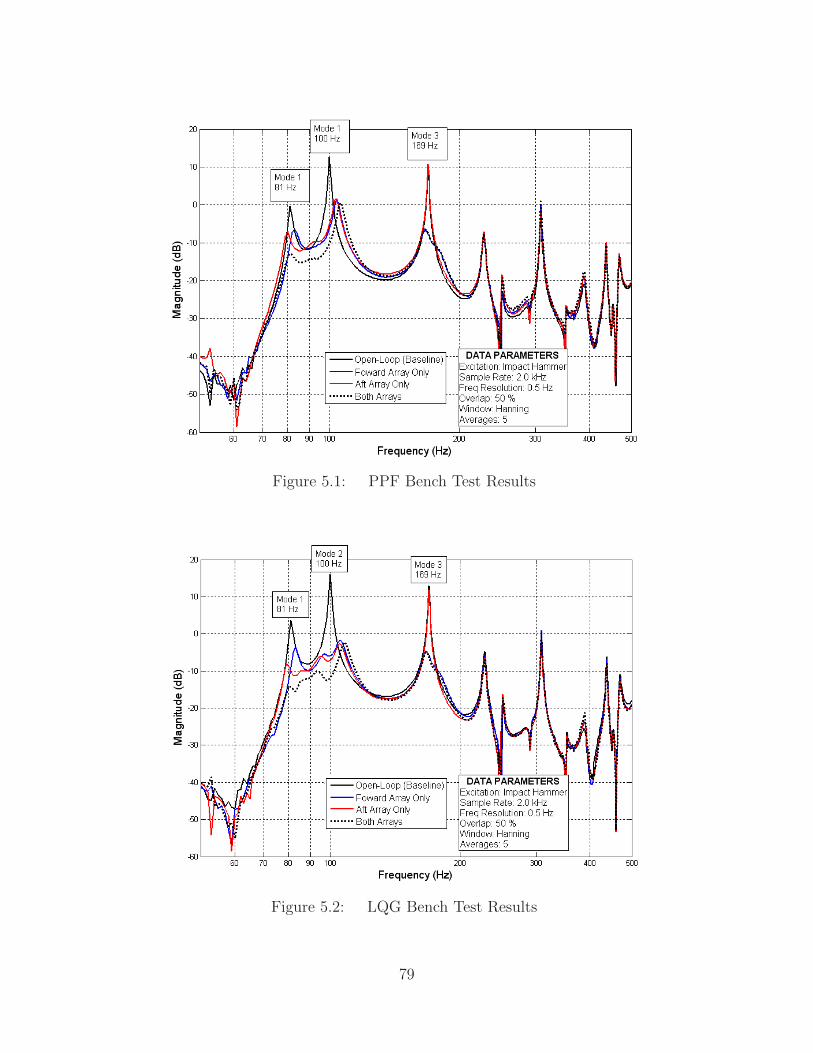
Figure 5.1: PPF Bench Test Results
Figure 5.2: LQG Bench Test Results
79
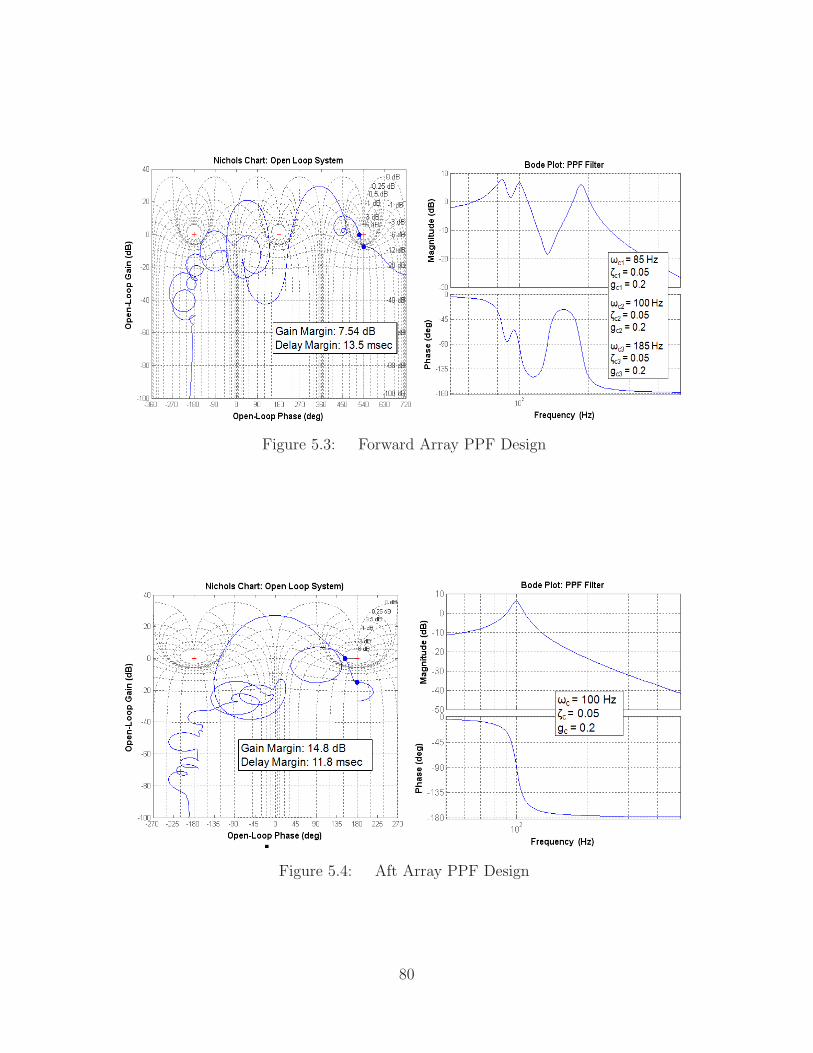
Figure 5.3: Forward Array PPF Design
Figure 5.4: Aft Array PPF Design
80
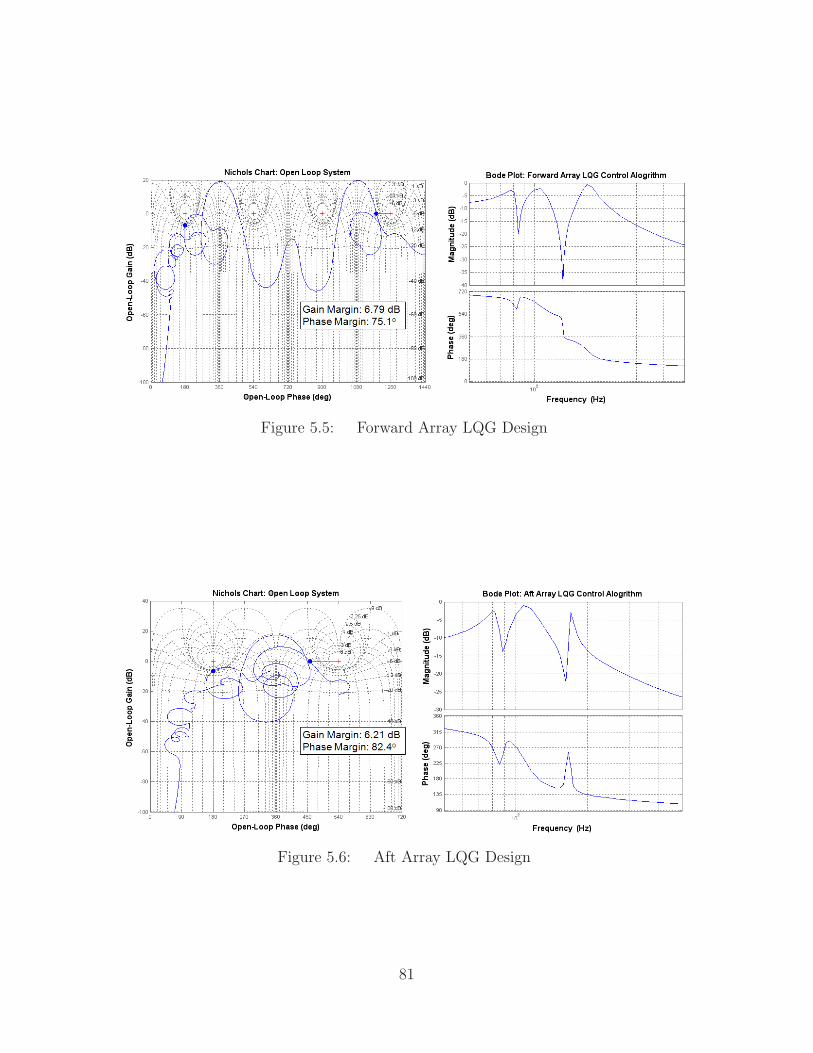
Figure 5.5: Forward Array LQG Design
Figure 5.6: Aft Array LQG Design
81
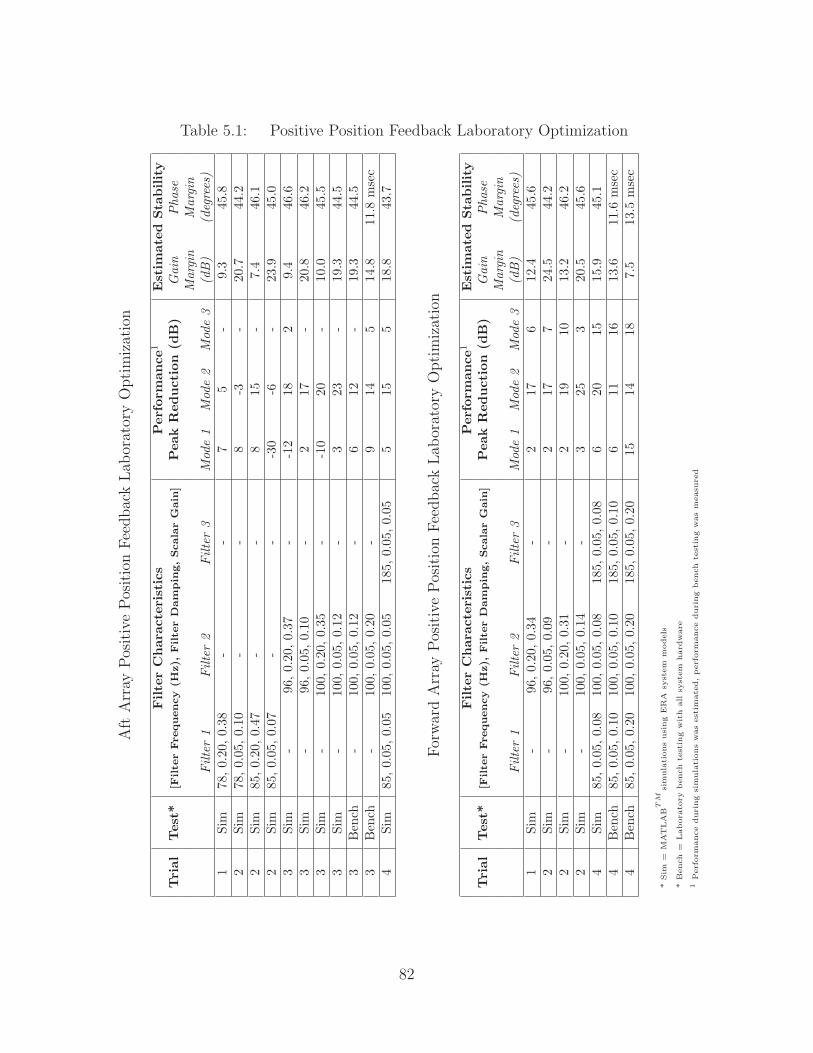
Table 5.1: Positive Position Feedback Laboratory OptimizationA
ftA
rray
Pos
itiv
ePos
itio
nFee
dbac
kLab
orat
ory
Opti
miz
atio
n
Filte
rC
har
acte
rist
ics
Per
form
ance
1Est
imat
edSta
bility
Tri
alTes
t*[F
ilte
rFrequency
(Hz),
Filte
rD
am
pin
g,Scala
rG
ain
]Pea
kR
educt
ion
(dB
)G
ain
Pha
seM
argi
nM
argi
nFilt
er1
Filt
er2
Filt
er3
Mod
e1
Mod
e2
Mod
e3
(dB)
(deg
rees
)1
Sim
78,0.
20,0.
38-
-7
5-
9.3
45.8
2Si
m78
,0.
05,0.
10-
-8
-3-
20.7
44.2
2Si
m85
,0.
20,0.
47-
-8
15-
7.4
46.1
2Si
m85
,0.
05,0.
07-
--3
0-6
-23
.945
.03
Sim
-96
,0.
20,0.
37-
-12
182
9.4
46.6
3Si
m-
96,0.
05,0.
10-
217
-20
.846
.23
Sim
-10
0,0.
20,0.
35-
-10
20-
10.0
45.5
3Si
m-
100,
0.05
,0.
12-
323
-19
.344
.53
Ben
ch-
100,
0.05
,0.
12-
612
-19
.344
.53
Ben
ch-
100,
0.05
,0.
20-
914
514
.811
.8m
sec
4Si
m85
,0.
05,0.
0510
0,0.
05,0.
0518
5,0.
05,0.
055
155
18.8
43.7
For
war
dA
rray
Pos
itiv
ePos
itio
nFee
dbac
kLab
orat
ory
Opti
miz
atio
n
Filte
rC
har
acte
rist
ics
Per
form
ance
1Est
imat
edSta
bility
Tri
alTes
t*[F
ilte
rFrequency
(Hz),
Filte
rD
am
pin
g,Scala
rG
ain
]Pea
kR
educt
ion
(dB
)G
ain
Pha
seM
argi
nM
argi
nFilt
er1
Filt
er2
Filt
er3
Mod
e1
Mod
e2
Mod
e3
(dB)
(deg
rees
)1
Sim
-96
,0.
20,0.
34-
217
612
.445
.62
Sim
-96
,0.
05,0.
09-
217
724
.544
.22
Sim
-10
0,0.
20,0.
31-
219
1013
.246
.22
Sim
-10
0,0.
05,0.
14-
325
320
.545
.64
Sim
85,0.
05,0.
0810
0,0.
05,0.
0818
5,0.
05,0.
086
2015
15.9
45.1
4B
ench
85,0.
05,0.
1010
0,0.
05,0.
1018
5,0.
05,0.
106
1116
13.6
11.6
mse
c4
Ben
ch85
,0.
05,0.
2010
0,0.
05,0.
2018
5,0.
05,0.
2015
1418
7.5
13.5
mse
c
*Sim
=M
AT
LA
BT
Msi
mula
tions
usi
ng
ER
Asy
stem
models
*B
ench
=Labora
tory
bench
test
ing
wit
hall
syst
em
hard
ware
1Perf
orm
ance
duri
ng
sim
ula
tions
was
est
imate
d,perf
orm
ance
duri
ng
bench
test
ing
was
measu
red
82
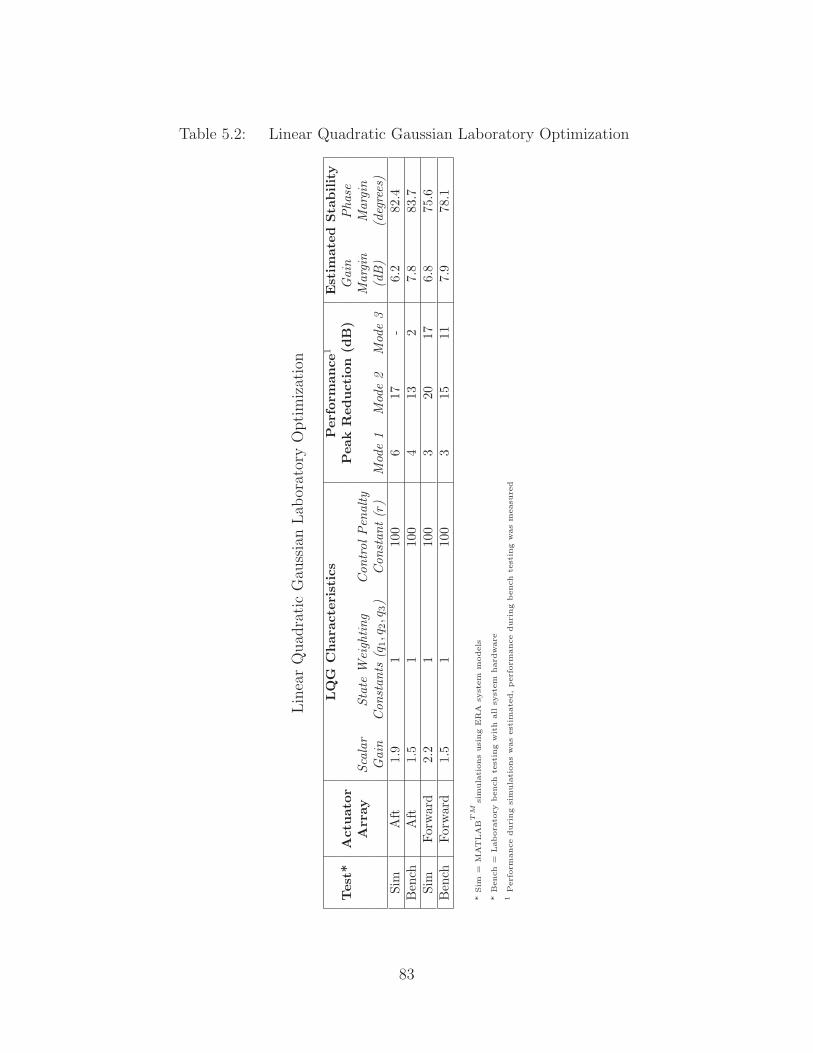
Table 5.2: Linear Quadratic Gaussian Laboratory Optimization
Lin
ear
Quad
rati
cG
auss
ian
Lab
orat
ory
Opti
miz
atio
n
LQ
GC
har
acte
rist
ics
Per
form
ance
1Est
imat
edSta
bility
Tes
t*A
ctuat
orPea
kR
educt
ion
(dB
)G
ain
Pha
seA
rray
Scal
arSt
ate
Wei
ghting
Con
trol
Pen
alty
Mar
gin
Mar
gin
Gai
nC
onst
ants
(q1,q
2,q
3)
Con
stan
t(r
)M
ode
1M
ode
2M
ode
3(d
B)
(deg
rees
)Si
mA
ft1.
91
100
617
-6.
282
.4B
ench
Aft
1.5
110
04
132
7.8
83.7
Sim
Forw
ard
2.2
110
03
2017
6.8
75.6
Ben
chFo
rwar
d1.
51
100
315
117.
978
.1
*Sim
=M
AT
LA
BT
Msi
mula
tions
usi
ng
ER
Asy
stem
models
*B
ench
=Labora
tory
bench
test
ing
wit
hall
syst
em
hard
ware
1Perf
orm
ance
duri
ng
sim
ula
tions
was
est
imate
d,perf
orm
ance
duri
ng
bench
test
ing
was
measu
red
83
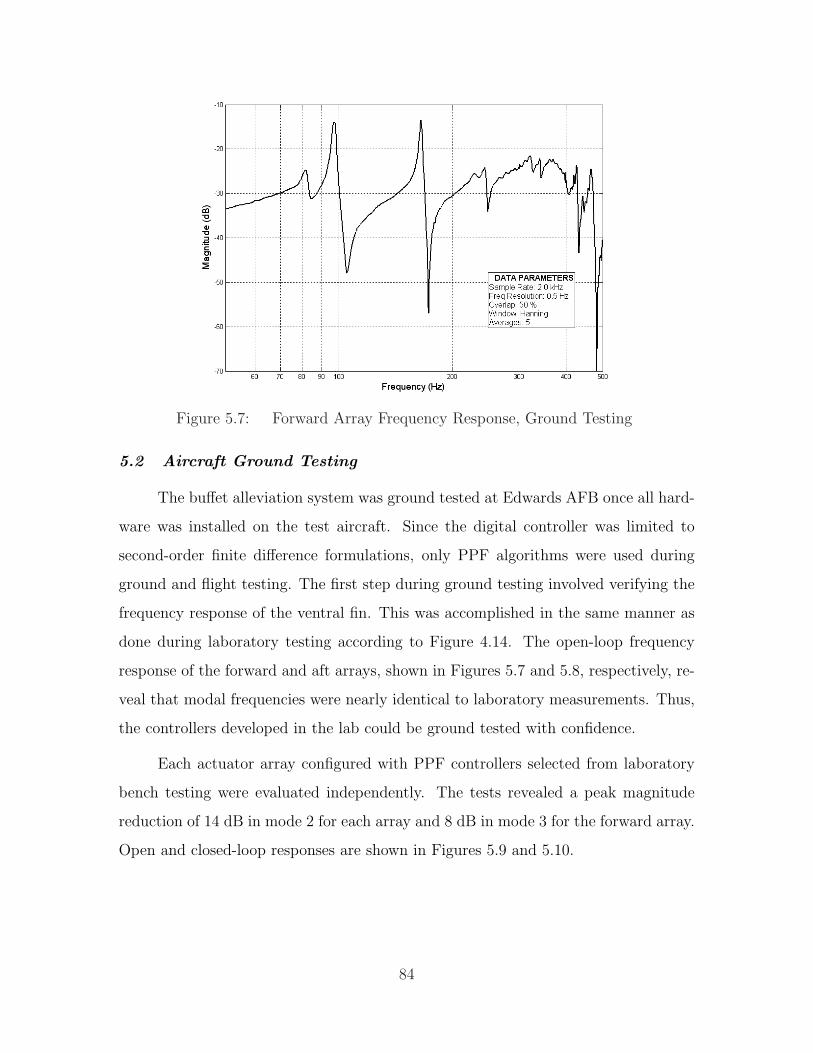
Figure 5.7: Forward Array Frequency Response, Ground Testing
5.2 Aircraft Ground Testing
The buffet alleviation system was ground tested at Edwards AFB once all hard-
ware was installed on the test aircraft. Since the digital controller was limited to
second-order finite difference formulations, only PPF algorithms were used during
ground and flight testing. The first step during ground testing involved verifying the
frequency response of the ventral fin. This was accomplished in the same manner as
done during laboratory testing according to Figure 4.14. The open-loop frequency
response of the forward and aft arrays, shown in Figures 5.7 and 5.8, respectively, re-
veal that modal frequencies were nearly identical to laboratory measurements. Thus,
the controllers developed in the lab could be ground tested with confidence.
Each actuator array configured with PPF controllers selected from laboratory
bench testing were evaluated independently. The tests revealed a peak magnitude
reduction of 14 dB in mode 2 for each array and 8 dB in mode 3 for the forward array.
Open and closed-loop responses are shown in Figures 5.9 and 5.10.
84
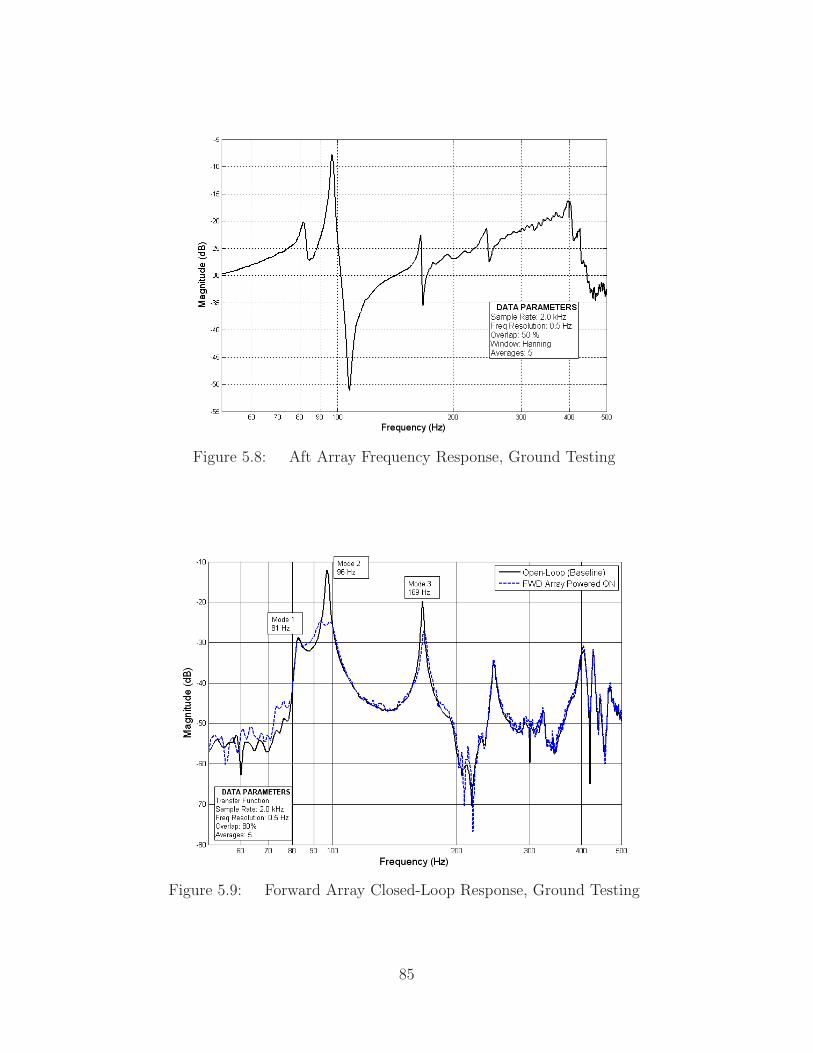
Figure 5.8: Aft Array Frequency Response, Ground Testing
Figure 5.9: Forward Array Closed-Loop Response, Ground Testing
85
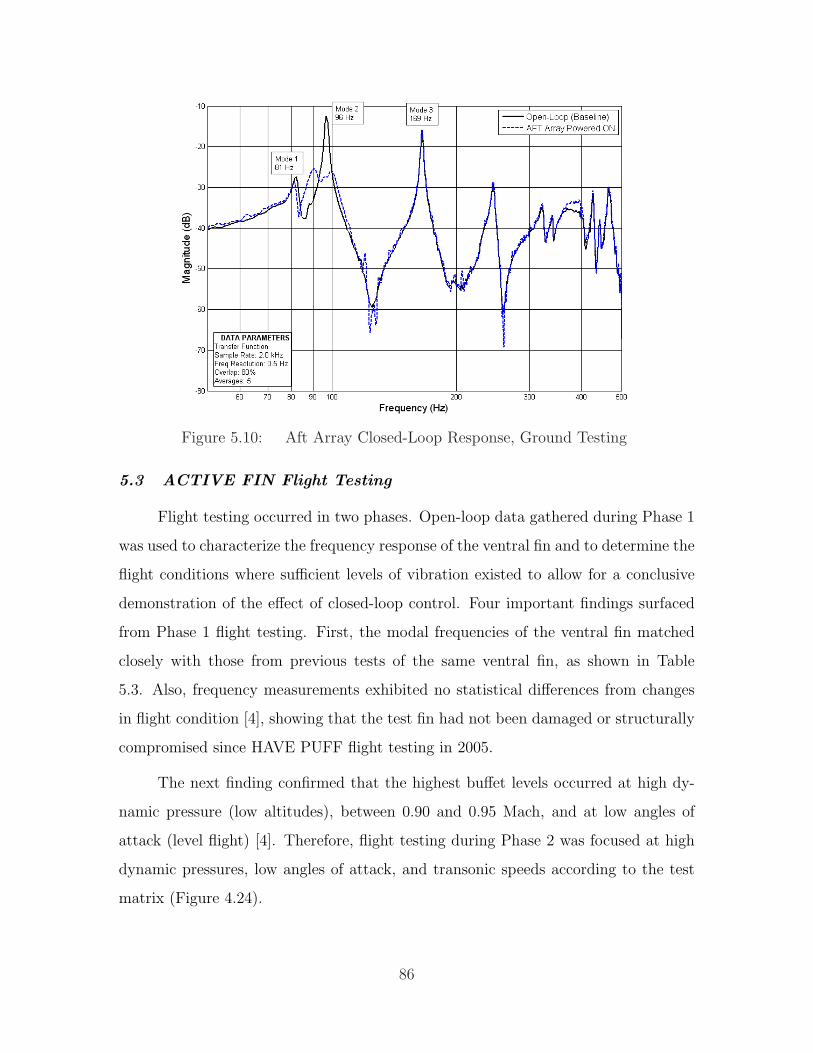
Figure 5.10: Aft Array Closed-Loop Response, Ground Testing
5.3 ACTIVE FIN Flight Testing
Flight testing occurred in two phases. Open-loop data gathered during Phase 1
was used to characterize the frequency response of the ventral fin and to determine the
flight conditions where sufficient levels of vibration existed to allow for a conclusive
demonstration of the effect of closed-loop control. Four important findings surfaced
from Phase 1 flight testing. First, the modal frequencies of the ventral fin matched
closely with those from previous tests of the same ventral fin, as shown in Table
5.3. Also, frequency measurements exhibited no statistical differences from changes
in flight condition [4], showing that the test fin had not been damaged or structurally
compromised since HAVE PUFF flight testing in 2005.
The next finding confirmed that the highest buffet levels occurred at high dy-
namic pressure (low altitudes), between 0.90 and 0.95 Mach, and at low angles of
attack (level flight) [4]. Therefore, flight testing during Phase 2 was focused at high
dynamic pressures, low angles of attack, and transonic speeds according to the test
matrix (Figure 4.24).
86
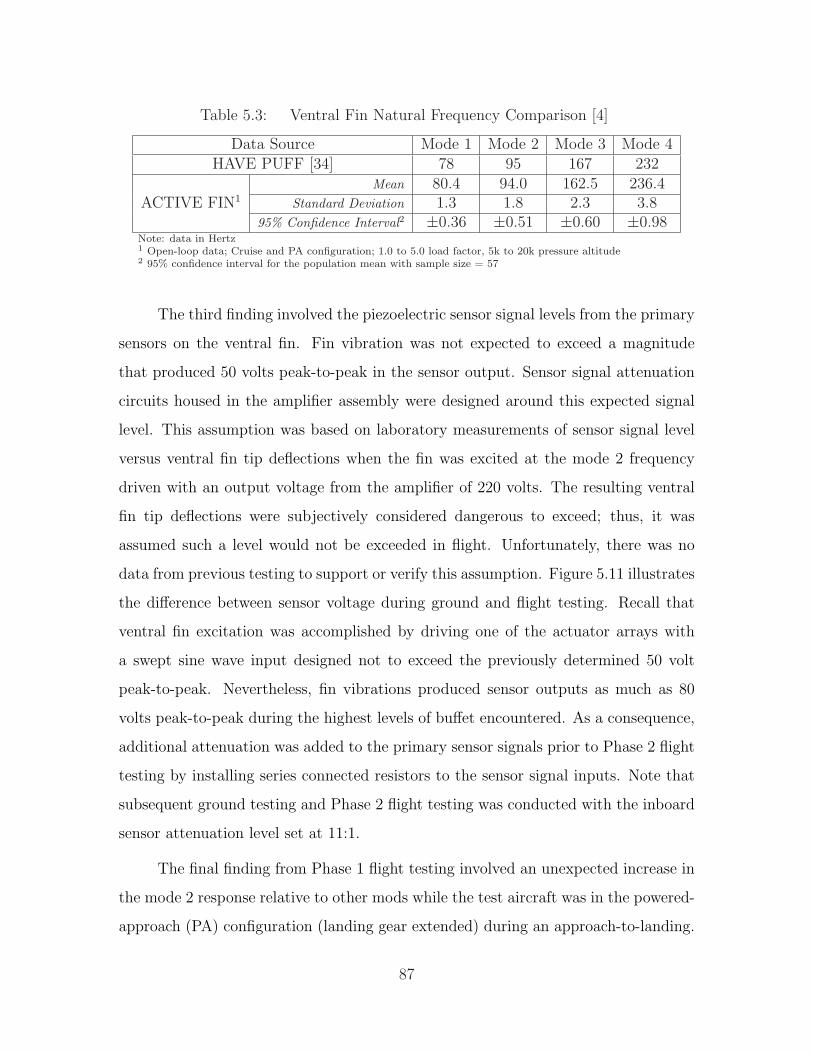
Table 5.3: Ventral Fin Natural Frequency Comparison [4]
Data Source Mode 1 Mode 2 Mode 3 Mode 4HAVE PUFF [34] 78 95 167 232
Mean 80.4 94.0 162.5 236.4ACTIVE FIN1 Standard Deviation 1.3 1.8 2.3 3.8
95% Confidence Interval2 ±0.36 ±0.51 ±0.60 ±0.98Note: data in Hertz1 Open-loop data; Cruise and PA configuration; 1.0 to 5.0 load factor, 5k to 20k pressure altitude2 95% confidence interval for the population mean with sample size = 57
The third finding involved the piezoelectric sensor signal levels from the primary
sensors on the ventral fin. Fin vibration was not expected to exceed a magnitude
that produced 50 volts peak-to-peak in the sensor output. Sensor signal attenuation
circuits housed in the amplifier assembly were designed around this expected signal
level. This assumption was based on laboratory measurements of sensor signal level
versus ventral fin tip deflections when the fin was excited at the mode 2 frequency
driven with an output voltage from the amplifier of 220 volts. The resulting ventral
fin tip deflections were subjectively considered dangerous to exceed; thus, it was
assumed such a level would not be exceeded in flight. Unfortunately, there was no
data from previous testing to support or verify this assumption. Figure 5.11 illustrates
the difference between sensor voltage during ground and flight testing. Recall that
ventral fin excitation was accomplished by driving one of the actuator arrays with
a swept sine wave input designed not to exceed the previously determined 50 volt
peak-to-peak. Nevertheless, fin vibrations produced sensor outputs as much as 80
volts peak-to-peak during the highest levels of buffet encountered. As a consequence,
additional attenuation was added to the primary sensor signals prior to Phase 2 flight
testing by installing series connected resistors to the sensor signal inputs. Note that
subsequent ground testing and Phase 2 flight testing was conducted with the inboard
sensor attenuation level set at 11:1.
The final finding from Phase 1 flight testing involved an unexpected increase in
the mode 2 response relative to other mods while the test aircraft was in the powered-
approach (PA) configuration (landing gear extended) during an approach-to-landing.
87
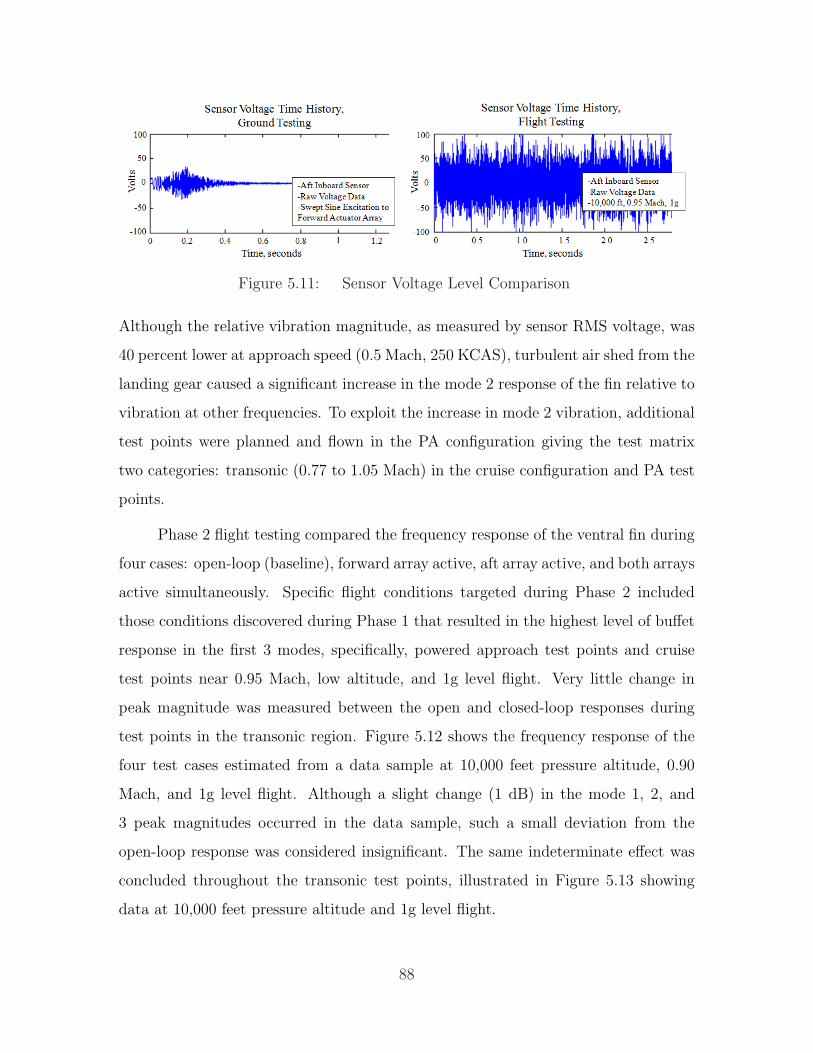
Figure 5.11: Sensor Voltage Level Comparison
Although the relative vibration magnitude, as measured by sensor RMS voltage, was
40 percent lower at approach speed (0.5 Mach, 250 KCAS), turbulent air shed from the
landing gear caused a significant increase in the mode 2 response of the fin relative to
vibration at other frequencies. To exploit the increase in mode 2 vibration, additional
test points were planned and flown in the PA configuration giving the test matrix
two categories: transonic (0.77 to 1.05 Mach) in the cruise configuration and PA test
points.
Phase 2 flight testing compared the frequency response of the ventral fin during
four cases: open-loop (baseline), forward array active, aft array active, and both arrays
active simultaneously. Specific flight conditions targeted during Phase 2 included
those conditions discovered during Phase 1 that resulted in the highest level of buffet
response in the first 3 modes, specifically, powered approach test points and cruise
test points near 0.95 Mach, low altitude, and 1g level flight. Very little change in
peak magnitude was measured between the open and closed-loop responses during
test points in the transonic region. Figure 5.12 shows the frequency response of the
four test cases estimated from a data sample at 10,000 feet pressure altitude, 0.90
Mach, and 1g level flight. Although a slight change (1 dB) in the mode 1, 2, and
3 peak magnitudes occurred in the data sample, such a small deviation from the
open-loop response was considered insignificant. The same indeterminate effect was
concluded throughout the transonic test points, illustrated in Figure 5.13 showing
data at 10,000 feet pressure altitude and 1g level flight.
88
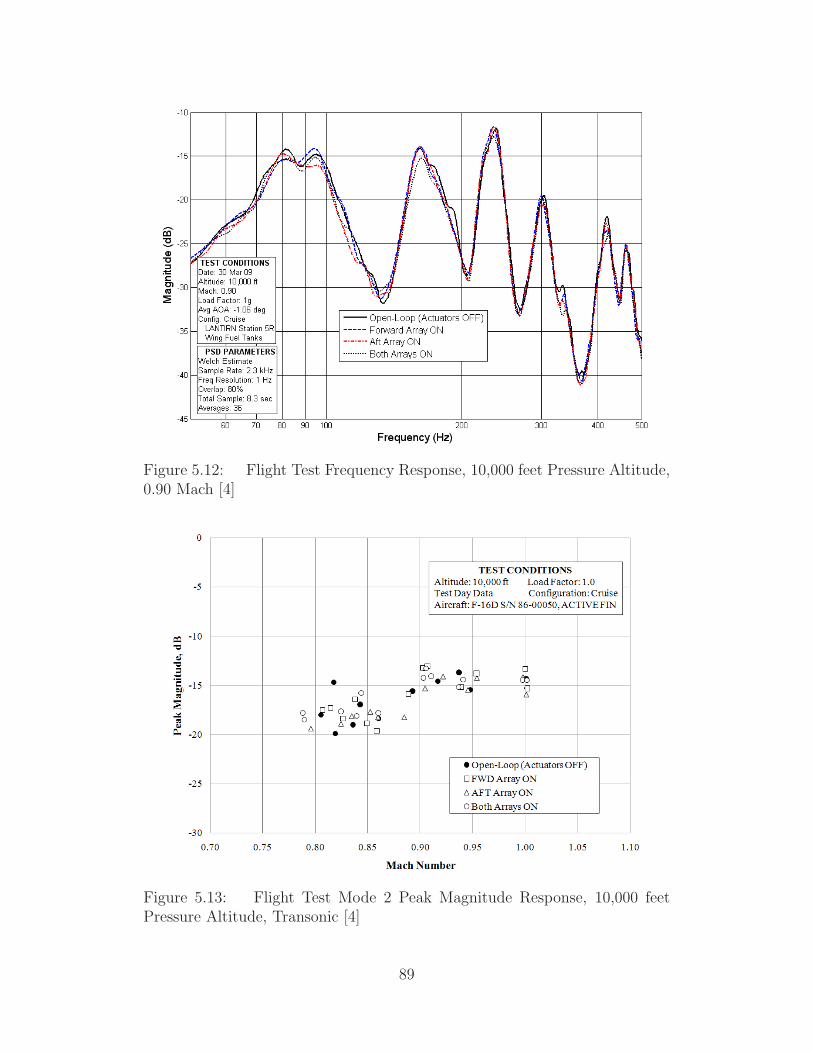
Figure 5.12: Flight Test Frequency Response, 10,000 feet Pressure Altitude,0.90 Mach [4]
Figure 5.13: Flight Test Mode 2 Peak Magnitude Response, 10,000 feetPressure Altitude, Transonic [4]
89
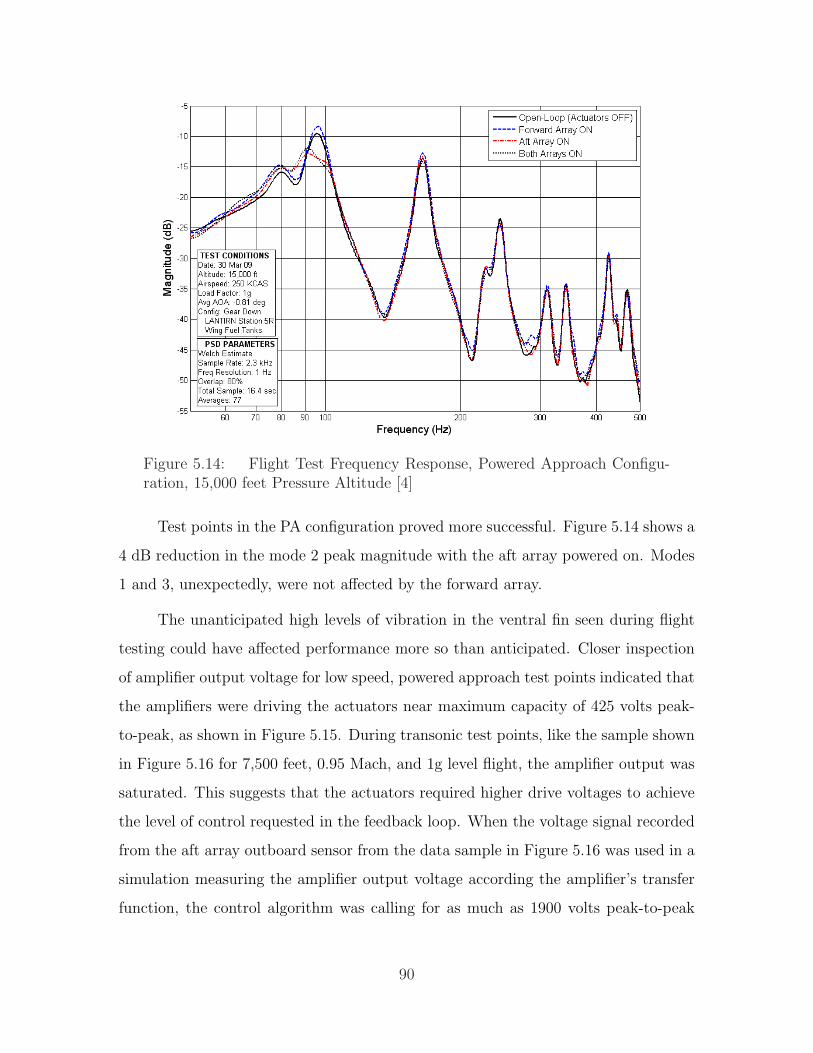
Figure 5.14: Flight Test Frequency Response, Powered Approach Configu-ration, 15,000 feet Pressure Altitude [4]
Test points in the PA configuration proved more successful. Figure 5.14 shows a
4 dB reduction in the mode 2 peak magnitude with the aft array powered on. Modes
1 and 3, unexpectedly, were not affected by the forward array.
The unanticipated high levels of vibration in the ventral fin seen during flight
testing could have affected performance more so than anticipated. Closer inspection
of amplifier output voltage for low speed, powered approach test points indicated that
the amplifiers were driving the actuators near maximum capacity of 425 volts peak-
to-peak, as shown in Figure 5.15. During transonic test points, like the sample shown
in Figure 5.16 for 7,500 feet, 0.95 Mach, and 1g level flight, the amplifier output was
saturated. This suggests that the actuators required higher drive voltages to achieve
the level of control requested in the feedback loop. When the voltage signal recorded
from the aft array outboard sensor from the data sample in Figure 5.16 was used in a
simulation measuring the amplifier output voltage according the amplifier’s transfer
function, the control algorithm was calling for as much as 1900 volts peak-to-peak
90

drive voltage from the amplifier, as indicated in Figure 5.17. The actuators installed
on the fin were limited to ±500 volts, therefore, design factors such as actuator sizing
or layering and sensor location or type may require reconsideration for better system
performance. For example, actuator arrays of smaller surface area that contain more
layers [20, 38] could, when located and oriented correctly, impart more strain in the
areas of maximum strain energy.
The use of self-sensing actuators [23,39,46] would provide a true collocated de-
sign improving stability characteristics potentially allowing for higher feedback gains.
Different sensor/control configurations such as acceleration feedback using accelerom-
eters may improve the detectability of certain vibration modes aiding closed-loop
algorithms.
91
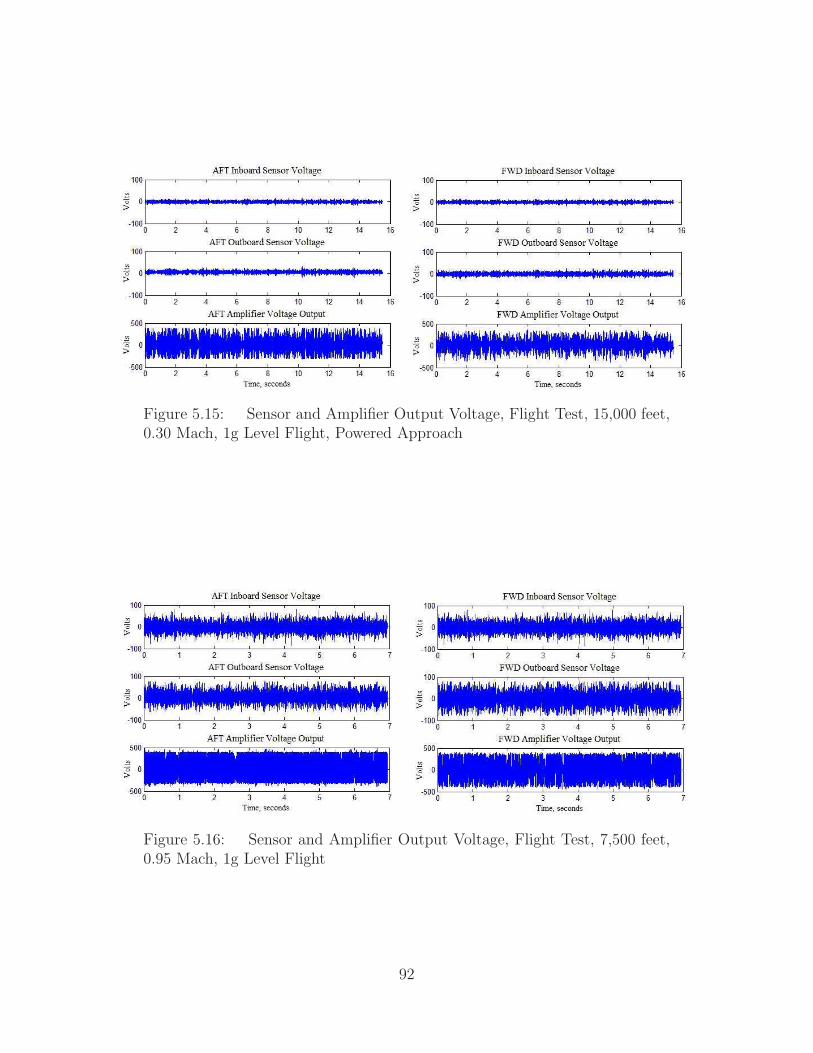
Figure 5.15: Sensor and Amplifier Output Voltage, Flight Test, 15,000 feet,0.30 Mach, 1g Level Flight, Powered Approach
Figure 5.16: Sensor and Amplifier Output Voltage, Flight Test, 7,500 feet,0.95 Mach, 1g Level Flight
92
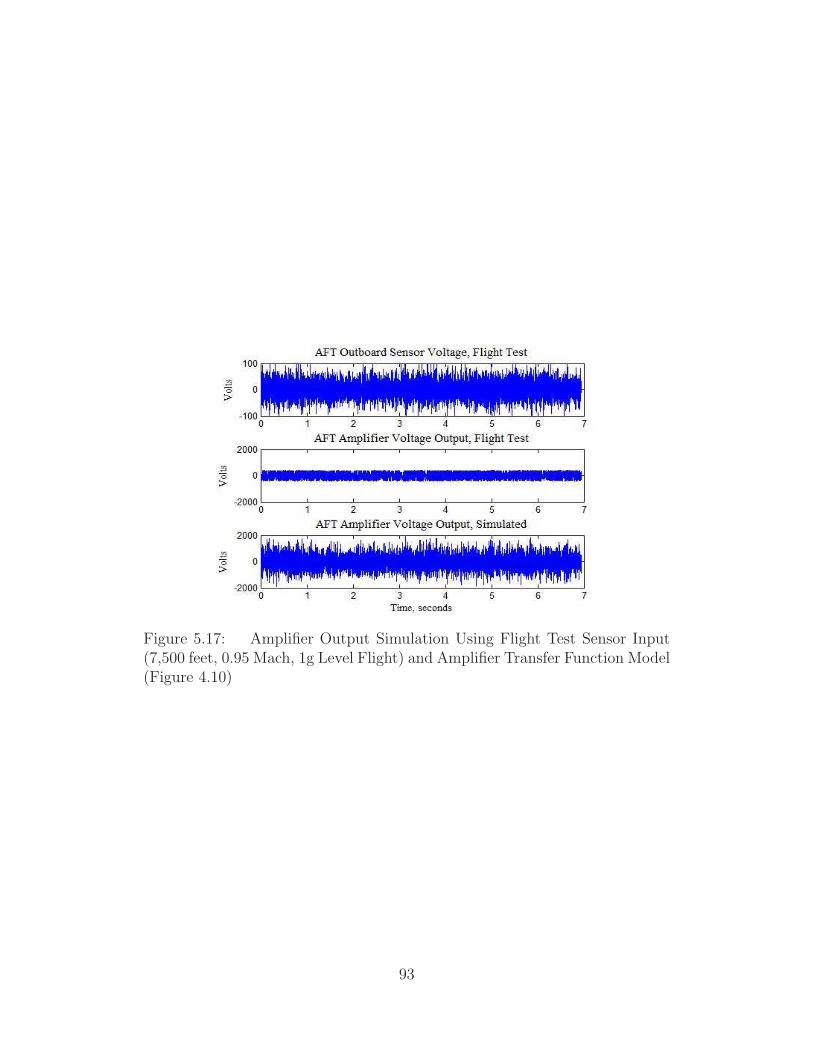
Figure 5.17: Amplifier Output Simulation Using Flight Test Sensor Input(7,500 feet, 0.95 Mach, 1g Level Flight) and Amplifier Transfer Function Model(Figure 4.10)
93
VI. Summary and Conclusions
The overall objective of the research presented in this thesis was to develop an au-
tonomous active control system using collocated piezoelectric actuators and sensors
to alleviate the buffet response of the first and second vibration modes of an F-16
Block 15 ventral fin during ground and flight tests. It is important to note that
this research was not addressing the failure of Block 15 ventral fins, but took ad-
vantage of the susceptibility of Block 15 ventral fins to aerodynamic buffet in order
to evaluate the effectiveness of closed-loop control of piezoelectric actuators. The
steps accomplished to meet that objective resulted in the successful development of
a buffet alleviation system including design and installation of piezoelectric actuators
and sensors, construction of a custom drive amplifier, and optimization of two sepa-
rate digital control techniques. Ground and flight testing demonstrated the effective,
albeit to a lesser degree than desired, alleviation of buffet vibrations of the ventral
fin during selected flight conditions. The results and conclusions of this research lay
the foundation for further study and optimization of a piezoelectric buffet alleviation
system for aerodynamic structures.
6.1 Summary
Piezoelectric actuators and sensors were designed according to recommendations
made by Morgenstern [7] to alleviate buffet vibrations in the first and second modes
of the ventral fin. To maximize effectiveness, the actuators were located on the fin
surface in areas of maximum strain energy and oriented with their actuation fibers
aligned with the direction of principle strain. The principle strain magnitudes and
directions of the first four modes of the ventral fin were experimentally determined
using a laser vibrometer and a central difference calculation prior to piezoelectric
hardware installation. The area of maximum strain energy for mode 1 and mode
2 was located on the aft and forward sections of the ventral fin, respectively, and
six total piezoelectric actuators, or patches, were placed in arrays in those areas to
control each mode. Each array included three patches on the inboard side of the fin
94
and three on the outboard side. The center patch on each side of each array included
an embedded piezoelectric sensor to provide collocated feedback for the closed-loop
control system.
The hardware used in this research, aside from the Block 15 ventral fin and
piezoelectric hardware, included a custom drive amplifier and the National Instru-
ments Inc. Compact RIO digital controller. The control algorithms were implemented
in the digital controller, which also served to control overall system function, using a
finite difference formulation. The custom amplifier needed to drive the piezoelectric
actuators on the ventral fin used a switch-mode topology because of its ability to
recover stored energy during subsequent load discharges when driving the primarily
reactive load of piezoelectric actuators. Two separate amplifiers were constructed to
drive each actuator array independently. The amplifier electronics, designed to oper-
ate on an F-16 aircraft during flight testing, also housed signal conditioning circuits
comprised of analog butterworth filters for the piezoelectric sensor signals.
Due to the non-linear effects of aerodynamic buffet, it was important for accurate
frequency response measurement and modal parameter estimation throughout the
testing effort. Control algorithm design required accurate system models and modal
information. The Eigenstructure realization algorithm provided an efficient means of
constructing state-space models that were easily implemented in control development
and closed-loop stability assessments. During flight testing, the Welch frequency
response estimation method was employed to generate power spectra and assess open
and closed-loop performance.
Two control techniques were employed in this research: positive position feed-
back and Linear Quadratic Gaussian compensators. Positive position feedback algo-
rithms, essentially second-order filter elements that act to increase damping at the
targeted structural mode, were specified by filter frequency, filter damping ratio, and
a scalar gain. Several PPF filters could be placed in parallel to control multiple modes
simultaneously. The selection of filter characteristics, however, proved difficult and
95
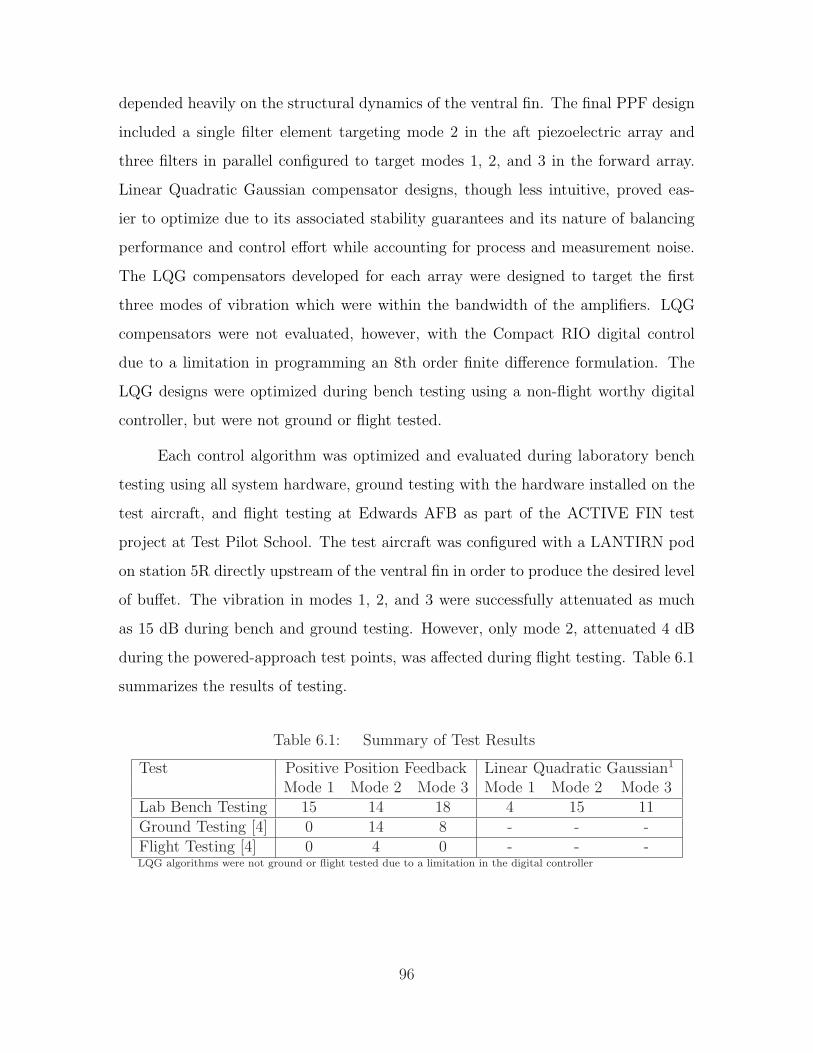
depended heavily on the structural dynamics of the ventral fin. The final PPF design
included a single filter element targeting mode 2 in the aft piezoelectric array and
three filters in parallel configured to target modes 1, 2, and 3 in the forward array.
Linear Quadratic Gaussian compensator designs, though less intuitive, proved eas-
ier to optimize due to its associated stability guarantees and its nature of balancing
performance and control effort while accounting for process and measurement noise.
The LQG compensators developed for each array were designed to target the first
three modes of vibration which were within the bandwidth of the amplifiers. LQG
compensators were not evaluated, however, with the Compact RIO digital control
due to a limitation in programming an 8th order finite difference formulation. The
LQG designs were optimized during bench testing using a non-flight worthy digital
controller, but were not ground or flight tested.
Each control algorithm was optimized and evaluated during laboratory bench
testing using all system hardware, ground testing with the hardware installed on the
test aircraft, and flight testing at Edwards AFB as part of the ACTIVE FIN test
project at Test Pilot School. The test aircraft was configured with a LANTIRN pod
on station 5R directly upstream of the ventral fin in order to produce the desired level
of buffet. The vibration in modes 1, 2, and 3 were successfully attenuated as much
as 15 dB during bench and ground testing. However, only mode 2, attenuated 4 dB
during the powered-approach test points, was affected during flight testing. Table 6.1
summarizes the results of testing.
Table 6.1: Summary of Test Results
Test Positive Position Feedback Linear Quadratic Gaussian1
Mode 1 Mode 2 Mode 3 Mode 1 Mode 2 Mode 3Lab Bench Testing 15 14 18 4 15 11Ground Testing [4] 0 14 8 - - -Flight Testing [4] 0 4 0 - - -LQG algorithms were not ground or flight tested due to a limitation in the digital controller
96
Several key findings were revealed during flight testing. First, with the test
aircraft configured with a LANTIRN pod, the highest level of mean vibration in
the ventral fin occurred at high dynamic pressure (low altitude), between 0.90 and
0.95 Mach, and a low angles of attack (level flight). Second, while in the powered-
approach configuration (landing gear down) and at approach speeds (200-250 KCAS),
the response of the second vibration mode increased relative to other frequencies
despite lower mean vibration in the fin. Test points in the PA configuration were
added to the test matrix and provided the best results of vibration attenuation during
flight. Finally, fin vibration during all test points was much higher than expected.
Due to this, the amplifier output was saturated during most test points suggesting
that the actuators required higher drive voltages than available from the amplifier to
achieve the level of control requested in the feedback loop. Further study is required
to evaluate design factors such as actuator size and layering, sensor location and type,
and amplifier design before efforts to improve the buffet alleviation system can begin.
6.2 Recommendations
The following recommendations are presented, in priority order, for future re-
search concerning a buffet alleviation system for the Block 15 F-16 ventral fin.
1. Calculate the observability/controllability of the first four modes for the existing
instrumentation configuration in order to assess the capability of the existing
system and to highlight options for improvement.
2. Investigate the benefits/drawbacks of implementing acceleration feedback con-
trol for alleviating buffet vibrations in the ventral using the existing or modified
piezoelectric actuator configuration. Accelerometers mounted near the tip of
the ventral fin could potentially provide improved delectability of the first two
modes.
3. Characterize the relationship between piezoelectric sensor voltage, fin displace-
ment, and actual strain in the ventral fin to provide a baseline for future testing.
97
4. Define the optimal design of piezoelectric actuators in targeting specific modes
of the ventral fin which may require actuators of different thickness or surface
area or use an array with layered actuators in order to generate sufficient strain
in the structure for a given drive voltage. Additional design effort could also
lead to a configuration that is capable of employing the entire voltage range of
the current MFC actuators (-500 to +1500 volts versus ±500 volts). [2, 50]
5. Evaluate robust control techniques, like Linear Quadratic Gaussian compen-
sators, during flight testing, which may require the use of different digital control
hardware.
6. Investigate the improvements to the existing ‘Class D’ drive amplifier. There
exists many ways to implement a ‘Class D’ switching topology in hardware. The
method employed in this research may have not been the most optimal given
the overall system design.
7. Investigate and potential benefits/drawbacks of a ‘Class AB’ (analog) amplifier
topology as the piezoelectric drive amplifier. Because a ‘Class D’ amplifier,
like that used in this research, is designed for a specific capacitive load and
bandwidth, it is inherently inflexible and, due to its switching characteristics,
generates high frequency noise which could influence performance and interfere
with other system components. A ‘Class AB’ amplifier is more flexible in terms
of applicable load and does not generate as much circuit noise. Theoretically,
a ‘Class AB’ amplifier is less efficient than a ‘Class D’; but its uses should be
explored in future work.
8. Investigate the feasibility of self-sensing piezoelectric actuators for true collo-
cated control. [23, 39,46]
9. Investigate the application of adaptive control algorithms for real-time stability
verification and gain scheduling to combat the non-linear effects of aerodynamic
buffet.
98

10. Investigate the benefits/drawbacks of modifications to the existing signal con-
ditioning (band-pass filter) including a cut-off frequency closer to the desired
Nyquist frequency.
99

Bibliography
1. Agnes, Gregory S., Stephen R. Whitehouse, and John R. Mackaman. “VibrationAttenuation of Aircraft Structures Utilizing Active Materials”. Smart Structuresand IntellIgent System, SPIE Vol. 1917:368–379, 1993.
2. Aldraihem, Osama J. et al. “Optimal Size and Location of Piezoelectric Ac-tuator/Sensors: Practical Considerations”. Journal of Guidance, Control, andDynamics, 23(3):509–515, May 2000.
3. Brennan, Matthew C. and Anna-Maria Rivas McGowan. Piezoelectric PowerRequirements for Active Vibration Control. Technical report, NASA LangleyResearch Center, Hampton, VA, 1997.
4. Browning, J., S.Y. Teo, C. Buckley, C. Seager, and L. Haubelt. ACTIVE FIN: F-16 Ventral Fin Buffet Alleviation Using Piezoelectric Actuators. Technical Infor-mation Memorandum AFFTC-TIM-09-06, Air Force Flight Test Center, EdwardsAFB, CA 93524, June 2009.
5. Burl, Jeffery B. Linear Optimal Control. Addison Wesley Longman, Inc., 1999.
6. Burnham, J. K., D. M. Pitt., E. V. White, D. A. Henderson, and R. W. Moses.“An Advanced Buffet Load Alleviation System”. 42nd AIAA/ASME/ASCE/AH-S/ASC Structures, Structural Dynamics, and Materials Conference and Exhibit,Seattle, WA, (AIAA-2001-1666), April 16-19 2001.
7. Canfield, Robert A., Shawn D. Morgenstern, and Donald L. Kunz. “Allevia-tion of Buffet-Induced Vibration using Piezoelectric Actuators”. Computers andStructures, 86:281–291, 2008.
8. Chaudhry, Zaffir A., T. Joseph, Fanping P. Sun, and Craig A. Rogers. “Local-Area Health Monitoring of Aircraft Via Piezoelectric Actuator/Sensor Patches”.Smart Structures and Materials: Smart Structures and Integrated Systems, Proc.of SPIE Vol. 2443:268–276, May 1995.
9. Chen, Yong, W. Viresh, and David Zimcik. “Development and Verification ofReal-Time Controllers for F/A-18 Vertical Fin Buffet Load Alleviation”. YujiMatsuzaki (editor), Smart Structures and Materials, volume Proc. of SPIE Vol.6173. National Research Council of Canada, Ottawa, ON CANADA K1A 0R6,2006.
10. Clingman, Dan J. and Mike Gamble. “High Voltage Switching Piezo Drive Am-plifier”. SPIE conference on indutrial and Commericial Applications of SmartStructures Technologies, Newport Beach, CA, SPIE Volume 3674:280–286, March1999.
100
11. Cobb, Richard. “State-Space Model Identification Using the Eigensystem Real-ization Alogrithm Toolbox for MATLAB
TM”. Software User Interface, Nov 2003.
Version 1.1.
12. Connolly, A. J., M. Green, J. F. Chicharo, and R. R. Bitmead. “The Designof LQG & H(infinity) Controllers for use in Active Vibration Control & NarrowBand Disturbance Rejection”. Proc. of the 34th Conference on Decision andControl, New Orleans, LA, 2982–2987, December 1995.
13. Culshaw, Brian. Smart Structures and Materials. Artech House, Inc., 685 CantonStreet, Norwood, MA 02062, 1996.
14. Cunningham, Atlee M. Buzz, Buffet and LCO on Military Aircraft - The Aeroe-lastician’s Nightmare. Technical report, Lockheed Martin Aeronautics Company,Fort Worth, TX, 2003.
15. Daue, Thomas. “Smart-Material Inc., Macro Fiber Composites”. ElectronicMessage, December 2007. Transmitted to Joseph Browning.
16. Dosch, J. J., D. J. Inman, and E. Garcia. “A Self-Sensing Piezoelectric Actuatorfor Collocated Control”. Journal of Intelligent Material System and Structure,Vol. 3:166–185, January 1992.
17. Enriquez, Reynaldo F. and Gregory J. Burgess. Aeroelastic Load Control InitialPhase I Flight Test Report. Technical Information Memorandum AFFTC-TIM-05-05, Air Force Flight Test Center, Edwards AFB, CA 93524, October 2005.
18. Falangas, Eric T. et al. Piezoceramic Actuator Active Vibration SuppressionSystem B-1B Flight Demonstration Program. Technical Report AFRL-VA-WP-TR-1999-3011, Air Vehicles Directorate, Air Force Research Laboratory, AFMC,Wright-Patterson AFB, Ohio, January 1998.
19. Fanson, J.L. and T.K. Caughey. “Positive Position Feedback Control for LargeSpace Structures”. AIAA, 28(4):717–724, 1990.
20. Galea, Stephen C., Douglas A. Henderson, Robert W. Moses, Edward V. White,and David G. Zimcik. “Next Generation Active Buffet Supression System”.AIAA/ICAS International Air and Space Symposium and Exposition. Dayton,Ohio, 14-17 July 2003.
21. Goh, C. J. and T. K. Caughey. “On the Stability Problem Caused by FiniteActuator Dynamics in the Collocated Control of Large Space Structures”. Inter-national Journal of Control, Vol. 41(No. 3):787–802, 1985.
22. Hanagud, Sathyanaraya. F-15 Tail Buffet Alleviation: A Smart Structures Ap-proach. Technical report, School of Aerospace Engineering, Georgia Institute ofTechnology, Atlanta, GA 30332, December 1998.
23. Hongsheng, Hu and Qian Suxiang. “Self-sensing Piezoelectric Actuator for ActiveVibration Control Based on Adaptive Filter”. 2564–2569. IEEE InternationalConference on Mechatronics and Automation, Harbin, China, August 2007.
101
24. Inman, Daniel J. Vibration With Control. John Wiley & Sons Ltd., The Atrium,Southern Gate, Chichester, West Sussex PO19 8SQ, England, 2006.
25. Institute of Electrical and Electronics Engineers, Inc Standards Association, NewYork City, New York. ANSI/IEEE Standard 176-1987,IEEE Standard on Piezo-electricity, 2004.
26. Juang, J. N. and R. S. Pappa. “An Eigensystem Realization Alogrithm for ModalParameter Identification and Model Reduction”. Journal of Guidance, Control,and Dynamics, 8(5):620–627, 1985.
27. Juang, J. N. and R. S. Pappa. “Effects of Noise on Modal Parameters Identifiedby the Eigensystem Realizationn Algorithm”. Journal of Guidance, Control, andDynamics, 9(3):294–303, 1986.
28. Kondoh, S., C. Yatomi, and K. Inoue. “The Positioning of Sensors and Actuatorsin the Vibration Control of Flexible Structures”. JSME International JournalSeries III, Vol. 33:175–181, 1990.
29. Lazarus, K. B., E. Saarmaa, and G. S. Agnes. “An Active Smart Material Systemfor Buffet Load Alleviation”. SPIE’s 2nd Annual International Symposium onSmart Structures and Materials, Vol. 2447:179–192, 1995.
30. Leo, Donald J. “Energy Analysis of Piezoelectric-Actuated Structures Drive byLinear Amplifiers”. Journal of Intelligent Material Systems and Structures, Vol.10:36–45, January 1999.
31. Lindner, D. K. and S. Chandrasekaran. “Power Flow Through Controlled Piezo-electric Actuators”. Journal of Intelligent Material Systems and Structures,(JIMSS-00-033), October 2000. Revised.
32. Lindner, D. K., N. Vujic, and D. J. Leo. “Comparison of Linear and SwitchingDrive Amplifiers for Piezoelectric Actuators”. 43rd AIAA/ASME/ASCE/AH-S/ASC Structures, Structural Dynamics, and Materials Conference, Denver CO,(AIAA-2002-1352):1–10, April 2002.
33. Luan, Jiyuan and Fred C. Lee. “Design of a High Frequency Switching Amplifierfor Smart Material Actuators with Improved Current Mode Control”. IEEE,Volume 1:59–64, May 1998.
34. Morgenstern, Shawn D., Aaron A. Tucker, Heather C. Giebner, Aniello Violetti,and Dick Wong. Limited Characterization of Dual Bimorph Synthetic Jet Actua-tors: Aeroelastic Load Control - Phase I, Project HAVE PUFF. Technical Infor-mation Memorandum AFFTC-TIM-05-07, Air Force Flight Test Center, EdwardsAFB, CA 93524, December 2005.
35. Moses, Robert W. Active Vertical Tail Buffeting Alleviation on a Twin-TailFigther Configuration in a Wind Tunnel. Conference paper, AeroelasticityBranch, NASA Langley Research Center, Hampton, VA 23681, 1997.
102
36. Moses, Robert W. NASA Langley Research Center’s Contributions to Inter-national Active Buffet Alleviation Programs. Technical report, AeroelasticityBranch, NASA Langley Research Center, Hampton, VA, 1999.
37. Nyquist, Henry. “Regeneration Theory”. Bell System Technical Journal, 11:126–147, 1932.
38. Pitt, Dale M., Michael J. Thomas, and Salvatore L. Liquore. Air Vehicles Technol-ogy Integration Program (AVTIP), Delivery Order 0025: Active Buffet Load Alle-viation System Ground Test. Technical Report AFRL-VA-WP-TR-2006-3005, AirVehicles Directorate, Air Force Research Laboratory, AFMC, Wright-PattersonAFB, Ohio, September 2005.
39. Pourboghrat, Farzad et al. “Vibration Control of Flexible Structures using Self-Sensing Actuators”. SPIE Conference on Smart Structures and Integrated Sys-tems, volume SPIE Vol. 3668. Newport Beach, California, March 1999.
40. Preumont, Andre. Vibration Control of Active Structures. Kluwer AcademicPublishers, 2nd edition, 2002.
41. Reid, J. Gary. Linear System Fundamentals. McGraw Hill Book Company, 1983.
42. Rew, Keun-Ho, Jae-Hung Han, and In Lee. “Adaptive Multi-Modal VibrationControl of Wing-Like Composite Structures Using Adaptive Positive PositionFeedback”. AIAA, April 2000.
43. Robert W. Moses, Aroan A. Bent Alessandro E. Pizzochero, Carol D. Wieseman.“Evalution of New Actuators in a Buffet Loads Environment”. Smart Structuresand Materials, 2001: Industrial and Commerical Applications of Smart StructuresTechnologies, Proceedings of SPIE Vol 4332:10–21, 2001.
44. Schultz, G. and G. Hiembold. “Dislocated Actuator/Sensor Positioning and Feed-back Design for Flexible Structures”. Journal of Guidance, Vol. 6:361–367, 1983.
45. Sheta, Essam F. et al. An Active Smart Material Control System for F/A-18Buffet Allevition. Technical report, International Forum on Aeroelasticity andStructural Dynamics, Amsterdam, Netherlands, June 2003.
46. Simmers, G.E. et al. “Improved Piezoelectric Self-Sensing Actuation”. Journalof Intelligent Material Systems and Structures, 15(12):941–953, December 2004.
47. Smart-Material, Inc. “Commerical Literature”. Website: http://www.smart-material.com, April 2008.
48. Sodano, Henry A., Gyuahae Park, and Daniel J. Inman. “An Investigation intothe Performance of Macro-Fiber Composites for Sensing and Structural VibrationApplications”. Mechanical Systems and Signal Processing, Vol. 18:683–697, 2004.
49. Song, G., S.P. Schmidt, and B.N. Agrawal. “Experimental Robustness Study ofPositive Position Feedback Control for Active Vibration Suppression”. Journalof Guidance and Control, 25(1):179–182, 2001.
103
50. Steffan, V. and D.J. Inman. “Optimal Design of Piezoelectric Materials for Vibra-tion Damping in Mechanical Systems”. Journal of Intelligent Material Systemsand Structures, 10(12):945–955, 1999.
51. van Tongeren, J.H., C.J. Lof, J.J. Meijer, and E.G.M. Geurts. F-16 VentralFins Analysis. Technical Report NLR-CR-99366, National Aerospace Laboratory,Amsterdam, The Netherlands, August 1999.
52. United States Patent 5, 752, 264. “Amplifier for Driving Large Capacitive Loads”,Novemember 23 1993.
53. Warkentin, David J. and Edward F. Crawley. “Power Flow and Amplifier Designfor Piezoelectric Actuators in Intelligent Structures”. SPIE Vol. 2190:283–294,1994.
54. ZONA Technology, Inc. ZAERO Theoretical Manual, Version 7.1. ZONA Tech-nology, Inc., Scottsdale, AZ 85251, September 2004.
104

Vita
Captain Joseph S. Browning was born in Stuttgart, Arkansas graduating from
Stuttgart High School in 1998. He attended the United States Air Force Academy
where he graduated with distinction earning a Bachelor of Science degree in Mechan-
ical Engineering.
Following his commission from the Air Force Academy as a 2nd Lieutenant in
the United States Air Force, Captain Browning was was assigned to the 36 Electronic
Warfare Squadron, 53rd Wind, Eglin Air Force Base, Florida where he served as an
operational test and evaluation engineer on the F-15E self-protection jammer and the
B-2 defensive management system. In 2006, he was selected for the combined Air
Force Institute of Technology/Test Pilot School program, and entered the Air Force
Institute of Technology master’s degree program. He graduated from the Test Pilot
School in June of 2009 with a Master of Science in Flight Test Engineering. This
thesis provides the final document required for him to earn his Master of Science
Degree in Aeronautical Engineering from the Air Force Institute of Technology.
Permanent address: 2950 Hobson WayAir Force Institute of TechnologyWright-Patterson AFB, OH 45433
105

REPORT DOCUMENTATION PAGE Form Approved OMB No. 0704–0188
The public reporting burden for this collection of information is estimated to average 1 hour per response, including the time for reviewing instructions, searching existing data sources, gathering and maintaining the data needed, and completing and reviewing the collection of information. Send comments regarding this burden estimate or any other aspect of this collection of information, including suggestions for reducing this burden to Department of Defense, Washington Headquarters Services, Directorate for Information Operations and Reports (0704–0188), 1215 Jefferson Davis Highway, Suite 1204, Arlington, VA 22202–4302. Respondents should be aware that notwithstanding any other provision of law, no person shall be subject to any penalty for failing to comply with a collection of information if it does not display a currently valid OMB control number. PLEASE DO NOT RETURN YOUR FORM TO THE ABOVE ADDRESS. 1. REPORT DATE (DD–MM–YYYY) 04-09-2009
2. REPORT TYPE Master’s Thesis
3. DATES COVERED (From — To) 1 Jan 07 – 4 Sep 09
4. TITLE AND SUBTITLE F-16 Ventral Fin Buffet Alleviation Using Piezoelectric Actuators
5a. CONTRACT NUMBER
5b. GRANT NUMBER
5c. PROGRAM ELEMENT NUMBER
6. AUTHOR(S) Capt Joseph S Browning
5d. PROJECT NUMBER 5e. TASK NUMBER
5f. WORK UNIT NUMBER
7. PERFORMING ORGANIZATION NAME(S) AND ADDRESS(ES) Air Force Institute of Technology Graduate School of Engineering and Management (AFIT/ENY) 2950 Hobson Way WPAFB OH 45433-7765
8. PERFORMING ORGANIZATION REPORT NUMBER AFIT/GAE/ENY-09-S01
9. SPONSORING / MONITORING AGENCY NAME(S) AND ADDRESS(ES) USAF Test Pilot School LtCol Timothy Jorris (661-277-3000) 1220 South Wolfe Ave Edwards AFB, CA 93524
10. SPONSOR/MONITOR’S ACRONYM(S) TPS
11. SPONSOR/MONITOR’S REPORT NUMBER(S)
12. DISTRIBUTION / AVAILABILITY STATEMENT APPROVED FOR PUBLIC RELEASE; DISTRIBUTION UNLIMITED
13. SUPPLEMENTARY NOTES
14. ABSTRACT Buffet-induced vibrations can have a disastrous impact on aircraft structures. Early attempts at combating buffet vibrations included passive methods such as structural enhancements and leading edge fences. Active methods have shown greater promise, including active airflow control, control surface modulation, and active structural control using piezoelectric actuators. Surface mounted piezoelectric actuators impart directional strain reducing the negative effects associated with harmful vibration. The Block-15 F-16 ventral fin represents an aircraft structure prone to failure when subjected to the buffet field from the wake of a LANTIRN pod. This research takes advantage of the susceptibility to buffet vibration of the Block 15 ventral fin in an effort to design an active control system to alleviate vibrations using piezoelectric actuators and sensors and to demonstrate its capability during flight test. It was sponsored by the United States Air Force (USAF) Test Pilot School (TPS). The development of an active control system began with the specification of piezoelectric actuators and sensors to be used in a collocated design to alleviate the vibrations of the first two modes of the ventral fin. A switching amplifier was designed and built to drive the actuators during all phases of testing. For the piezoelectric actuators to be effective, they needed to be located within the regions of highest strain energy and aligned with the principal strain vectors in those regions, the direction of principle strain was experimentally determined to ensure the proper orientation of the piezoelectric hardware on the ventral fin's surface. Two control techniques were used in this research: positive position feedback and Linear Quadratic Gaussian compensator. Both algorithms were developed and optimized during laboratory simulations and bench testing with system hardware where as much as 15 dB peak magnitude reduction was achieved in the ventral fin mode 1, 2, and 3 response. The positive position feedback algorithms were implemented during aircraft ground and flight testing at the USAF TPS, Edwards Air Force Base, California. Ground testing showed as much as 14 dB and 8 dB peak magnitude reduction in the mode 2 and mode 3 response, respectively. As much as 4 dB peak magnitude reduction was recorded in the mode 2 response during flight testing proving the potential of piezoelectric actuators in a buffet alleviation system. Still, there exists many design considerations, such as piezoelectric actuator and sensor configuration, that could lead to system improvement. 15. SUBJECT TERMS Piezoelectric, buffet, F-16, ventral fin, active control, positive position feedback, linear quadratic Gaussian 16. SECURITY CLASSIFICATION OF: UNCLASSIFIED
17. LIMITATION OF ABSTRACT UU
18. NUMBER OF PAGES
122
19a. NAME OF RESPONSIBLE PERSON Dr. Richard Cobb
a. REPORT U
b. ABSTRACT U
c. THIS PAGE U
19b. TELEPHONE NUMBER (Include Area Code) (937)255-3636, 4599
Standard Form 298 (Rev. 8–98) Prescribed by ANSI Std. Z39.18