Embed Size (px)
Citation preview

/V
.:t:;1QA #~B5
Prfj~~rtj of r:~ n~~~r~r:!fr:~ ITt TH~f/iE': :~,:~L ;\'.;~~ :\f-'~' :_~~i;' ;::t~>~;':j\:t~C3
CIVIL ENGINEERING STUDIES STRUCTURAL RESEARCH SERIES NO. 285
STUDIES F THE FATIGUE BEHAVI R
F BU ElDED J INTS
IN HY -80 AND HY -100 STEELS M6tZ Reference Ro~m Civil Engineering Department BI06 C. E. Building University of. Illinois Urbana, Illinois 61
By W. H. MUNSE
W. H. BRUCKNER
A. J. HARTMANN
J. B. RADZIMINSKI
R. W. HINTON
and
J. L MOONEY
A REPORT OF AN INVESTIGATION CONDUCTED
by
THE CIVIL ENGINEERING DEPARTMENT UNIVERSITY OF ILLINOIS
in cooperation with
THE BUREAU OF SHIPS, U.S. NAVY
Contract NObs 88058 Project Serial No. SR-007-01-01, Task 856
UNIVERSITY OF ILLINOIS
URBANA, ILLINOIS
NOVEMBER, 1964


STUDIES OF THE
FATIGUE BEHAVIOR OF BUTT-WELDED JOINTS
IN HY-80 AND HY-100 STEELS
by
W. H. Munse
W. H. B ruckne r
A. J. H a r't rna n n
J. B. Radzirninski
R. W. Hinton
and
J. L. Mooney
A Report of an Investigation Conducted
by
THE CIVIL ENGINEERING DEPARTMENT UNIVERSITY OF ILLINOIS
In Cooperation With The Bureau of Ships, U. S. Navy
Contract NObs 88058 Project Serial No. SR-007-01-01, Task 856
UNIVERSITY OF ILLINOIS
URBANA, I LL I NO I-S
NOVEMBER 1964
Property of t!;9 reDsmme~t of THEOHEriC:H i::;;; .~t;:;:_iLC ;'~iLGiiAriIGS
UNi~'I~~Sn ~ Df !LLifl~OiS


SYNOPSI S
The results of axial fatigue tests of transverse butt welded joints
in HY-80 steel containing internal defects are reported. The tests were con
ducted on 3/4 in. and 1-1/2 in. thick material under stress cycles of zero-to
tension and complete reversal. The types of weld defects studied include
porosity, slag inclusions, and artificially produced pores, and show that the
existence of weld defects measurably decreases the fatigue 1 ife of a joint at
a given stress cycle when compared to sound welded specimens (with reinforcement
removed). However, there does not appear to be a simple correlation between
type of defect or amount of defective area and fatigue strength.
As part of the study of weld defects, radiographic and ultrasonic
techniques were employed to determine the time to initiation and propagation
of fatigue cracks in welded joints. The results indicate that the first
appearance of a macrocrack (visible on the radiographs) occurs at sl ightly
more than half the test 1 ife. The subsequent crack propagation progresses
slowly and erratically at first, but the rate of growth is rapidly accelerated
from the time it reaches the specimen surface until complete fai lure occurs.
Metallurgical studies were conducted to examine the effect of restraint
during welding on the formation of internal microcracks (sulfide inclusions) in
welded joints, and the behavior of these joints under conditions of fatigue.
The studies indicate that the effects of metallurgical factors introduced by
restraint during welding are less critical than internal weld flaws (porosity,
slag, etc.) in reducing fatigue strength.
A preliminary study of the fatigue behavior of 3/4 in. thick HY-100
steel was completed. Tests were carried out on plain plate specimens and trans
verse butt welded joints in the as-welded condition using a zero-to-tension stress

cycle. Although the results for the plain plate specimens compared favorably
with similar tests on HY-80 steel, the fatigue behavior of the welded joints
in HY-100 was inferior to that of the HY-80 material. This is apparently due
to a greater sensitivity of the HY-100 steel to external weld geometry and to
the presence of even very small weld defects.


-iv-
TABLE OF CONTENTS
INTRODUCTION.
1.1 1.2 1.3
Object of Study. Scope of Investigation Acknowledgments ..... .
i I. DESCRIPTiON OF TEST PROGRAM
2.1 2.2 2.3 2.4 2.5
Material Fabrication of Specimens Description of Test Equipment. Testing Procedure ... Radiographic Studies
I I I. FATIGUE TESTS OF 3/4 iNCH HY-100 MATERIAL
3.1 I ntroductory Remarks 3.2 Tests of Plain Plate Specimens 3.3 Tests of As-Welded Butt Joints 3.4 Data Analysis ...... .
IV. FATIGUE TESTS OF TRANSVERSE BUTT WELDS IN HY-80 MATERIAL HAVING INTERNAL DEFECTS
4.1 Introductory Remarks 4.2 Porosity in 1-1/2 In. HY-80 Specimens. 4.3 Slag in 1-1/2 In. HY-80 Specimens. 4.4 Fatigue Tests of Defective Welds in 3/4 In.
HY - 80M ate ria 1 .... .... 4.5 Discussion of Results .. .
V. CRACK INITIATiON AND PROPAGATION.
5.1 Introductory Remarks ..... 5.2 Test Equipment and Testing Procedure 5.3 5.4 5.5
Initiation of Fatigue Crack Propagation .. Conclusions .....
Cracks
VI. METALLURGICAL STUDIES OF WELDED HY-80 STEEL
6.1 6.2 6.3 6.4 6.5
Introductory Remarks ...... . Experimental Procedures Material Description Distribution and Size of Sulfide Inclusions Discussion ............... . a. Hot Crack Geometry .......... . b. Effect of Restraint of the Butt Weld on Hot Cracks c. Effect of Sulfur Concentration on Hot Cracking
1 1 2
3
3 3 4 4 4
6
6 6 7 8
9
9 9
12
13 14
15
15 15 16 19 22
24
24 25 26 26 27 28 28 29


-v-
TABLE OF CONTENTS (cont'd)
d. Length of Hot Cracks . . . . . .... e. Metallographic Observations of Weld Metal Flaws f. Inclusion Study ......... . g. Effect of ilButter i ngll on the Frequency of Hot Cracks h. Effect of Hot Cracks on Fatigue Life .....
6.6 Conclusions.
V I I. SUMMARY
7.1 Fatigue Behavior of HY-100 Steel 7.2 Weld Defect Study of HY-80 Steel 7.3 Crack Growth Study ..... . 7.4 Metallurgical Studies ..... . 7.5 General Summary and Conclusions.
BIBLIOGRAPHY
TABLES .
FIGURES
APPENDIX A: Ultrasonic Crack Detection Study
29 29 30 30 31 33
35
35 35 36 36 37
39
40
A-l

Number
2.1
2.2
3.1
3.2
3.3
4.1
4.2
4.3
4.4
4.5
5.1
6.1
6.2
6.3
6.4
6.5
A.l
-vi-
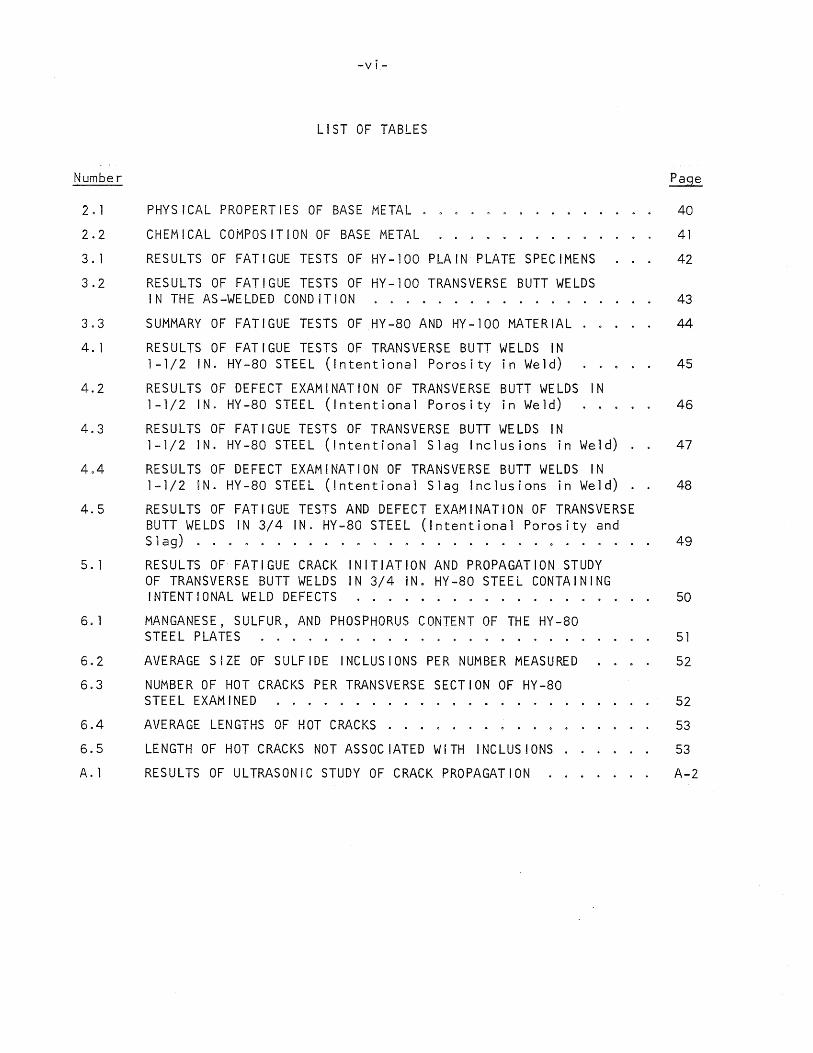
LIST OF TABLES
PHYSICAL PROPERTIES OF BASE METAL.
CHEMICAL COMPOSITION OF BASE METAL
RESULTS OF FATIGUE TESTS OF HY-100 PLAIN PLATE SPECIMENS
RESULTS OF FATIGUE TESTS OF HY-100 TRANSVERSE BUTT WELDS IN THE AS-WELDED CONDITION ............ .
SUMMARY OF FATIGUE TESTS OF HY-80 AND HY-100 MATERIAL
RESULTS OF FATIGUE TESTS OF TRANSVERSE BUTT WELDS IN 1-1/2 IN. HY-80 STEEL (Intentional Porosity in Weld)
RESULTS OF DEFECT EXAMINATION OF TRANSVERSE BUTT WELDS IN 1-1/2 IN. HY-80 STEEL (Intentional Porosity in Weld)
RESULTS OF FATIGUE TESTS OF TRANSVERSE BUTT WELDS IN 1-1/2 IN. HY-80 STEEL (Intentional Slag Inclusions in Weld)
RESULTS OF DEFECT EXAMINATION OF TRANSVERSE BUTT WELDS IN 1-1/2 iN. HY-80 STEEL (Intentional Slag Inclusions in Weld)
RESULTS OF FATIGUE TESTS AND DEFECT EXAMINATION OF TRANSVERSE BUTT WELDS IN 3/4 IN. HY-80 STEEL (!ntentional Porosity and Slag) . . . . . . . . . . . . . . . . . . . . . . . . . . .
RESULTS OF FATIGUE CRACK INITIATION AND PROPAGATION STUDY OF TRANSVERSE BUTT WELDS IN 3/4 iN. HY-80 STEEL CONTAINING INTENTIONAL WELD DEFECTS .............. .
MANGANESE, SULFUR, AND PHOSPHORUS CONTENT OF THE HY-80 STEEL PLATES .......... . . . . . . . . . . .
AVERAGE SIZE OF SULFIDE INCLUSIONS PER NUMBER MEASURED
NUMBER OF HOT CRACKS PER TRANSVERSE SECTION OF HY-80 STEEL EXAMINED ...... .
AVERAGE LENGTHS OF HOT CRACKS . . .
LENGTH OF HOT CRACKS NOT ASSOCIATED WiTH INCLUSIONS.
RESULTS OF ULTRASONIC STUDY OF CRACK PROPAGATION
40
41
42
43
44
45
46
47
48
49
50
51
52
52
53
53
A-2

-y i i-
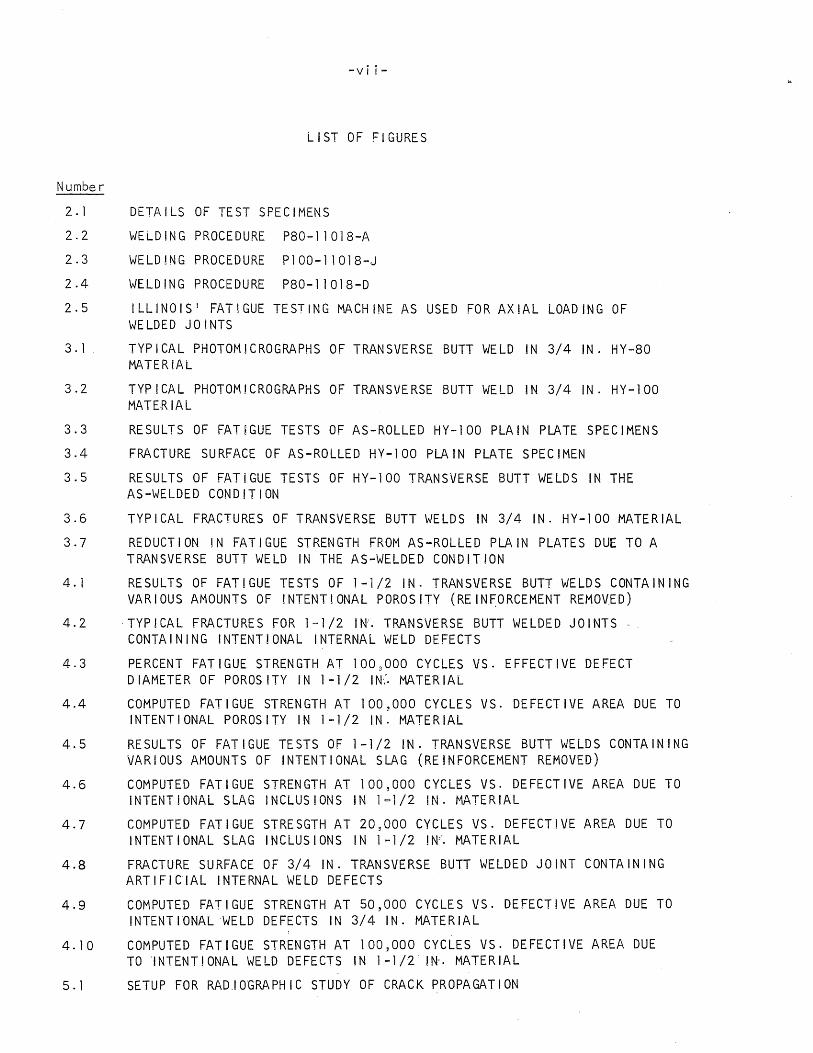
LIST OF FIGURES
N umbe r
2.1 DETA I LS OF TEST SPEC I MENS
2.2 WELDING PROCEDURE P80-11018-A
2.3 WELDING PROCEDURE P100-11018-J
2.4 WELDING PROCEDURE P80-11018-D
2.5 ILLINOIS l FATIGUE TESTING MACHINE AS USED FOR AXIAL LOAD ING OF WELDED JOINTS
3.1 TYPICAL PHOTOMICROGRAPHS OF TRANSVERSE BUTT WELD IN 3/4 IN. HY-80 MATERIAL
3.2 TYPICAL PHOTOMICROGRAPHS OF TRANSVE RSE BUTT WELD IN 3/4 IN. HY-I00 MATER IAL
3.3 RESULTS OF FATiGUE TESTS OF AS-ROLLED HY-100 PLAIN PLATE SPECIMENS
3.4 FRACTURE SURFACE OF AS-ROLLED HY-I00 PLAIN PLATE SPECIMEN
3.5 RESUL.TS OF FATiGUE TESTS OF HY-100 TRANSVERSE BUTT WELDS IN THE AS-WELDED CONDITION
3.6 TYPICAL FRACTURES OF TRANSVERSE BUTT WELDS IN 3/4 IN. HY-100 MATERIAL
3.7 REDUCTION IN FATIGUE STRENGTH FROM AS-ROLLED PLAIN PLATES DUE TO A TRANSVERSE BUTT WELD IN THE AS-WELDED CONDITION
4.1 RESULTS OF FATIGUE TESTS OF 1-1/2 IN. TRANSVERSE BUTT WELDS CONTAINING VARIOUS AMOUNTS OF INTENTIONAL POROSITY (REIN~ORCEMENT REMOVED)
4.2 TYPICAL FRACTURES FOR 1-1/2 IN'. TRANSVERSE BUTT WELDED JOINTS CONTAINING INTENTIONAL INTERNAL WELD DEFECTS
4.3 PERCENT FATIGUE STRENGTH AT 100~000 CYCLES VS. EFFECTIVE DEFECT DIAMETER OF POROS I TY IN 1 -1/2 I N':'. MATER IAL
4.4 COMPUTED FAT I GUE STRENGTH AT 100,000 CYCLES VS. DEFECT IVE AREA DUE TO INTENTIONAL POROSITY IN 1-1/2 IN. MATERIAL
4.5 RESULTS OF FATIGUE TESTS OF 1-1/2 IN. TRANSVERSE BUTT WELDS CONTAINING VARIOUS AMOUNTS OF INTENTIONAL SLAG (REINFORCEMENT REMOVED)
4.6 COMPUTED FATIGUE STRENGTH AT 100,000 CYCLES VS. DEFECTIVE AREA DUE TO iNTENTiONAL SLAG iNCLUSiONS iN 1=1/2 IN. MATERIAL
4.7 COMPUTED FATIGUE STRESGTH AT 20~000 CYCLES VS. DEFECTIVE AREA DUE TO INTENTIONAL SLAG INCLUSIONS IN 1-1/2 IN~ MATERIAL
4.8 FRACTURE SURFACE OF 3/4 IN. TRANSVERSE BUTT WELDED JOINT CONTAINING ARTIFICIAL INTERNAL WELD DEFECTS
4.9 COMPUTED FATIGUE STRENGTH AT 50,000 CYCLES VS. DEFECTIVE AREA DUE TO INTENT 10NALWELD DEFECTS IN 3/4 IN. MATERIAL
4.10 COMPUTED FATIGUE STRENGTH AT 100,000 CYCLES VS. DEFECTIVE AREA DUE TO 'INTENTIONAL WELD DEFECTS IN 1-1/2 IN'. MATERIAL
5.1 SETUP FOR RAD,I O'GRAPH I C STUDY OF CRACK PROPAGAT ION


-v iii-
LIST OF FIGURES (CONTD)
N umbe r
5.2 SETUP FOR ULTRASONIC STUDY OF CRACK PROPAGATION
5.3 CORRELATION BETWEEN INITIAL LENGTH OF INTENTIONAL WELD DEFECT AND INITIATION OF FATIGUE CRACKS
5.4 COMPARISON OF CYCLES OF FATIGUE CRACK PROPAGATION TO TEST LIFE IN 3/4 IN. HY-SO TRANSVERSE BUTT WELDED SPECIMENS TESTED AT ±50.0 KSI
5.5 COMPARISON OF CYCLES OF FATIGUE CRACK PROPAGATION TO TEST LIFE IN 3/4 IN. HY-SO TRANSVERSE BUTT WELDED SPECIMENS TESTED AT 0 TO +50.0 KSI
5.6 RATE OF CRACK PROPAGATION IN 3/4 IN. HY-SO TRANSVERSE BUTT WELDED SPECIMENS TESTED AT ±50.0 KSI
5.7 RATE OF CRACK PROPAGATION IN 3/4 IN. HY-SO TRANSVERSE BUTT WELDED SPECIMENS TESTED AT 0 TO +50.0 KSI
6.1 WELDING JIG USED TO RESTRAIN HY-SO STEEL DURING BUTT WELDING
6.2 MAIN PLATE OF HY-SO STEEL FROM WHICH TEST PLATES G-67, G-6S 9 AND G-69 WERE OBTAINED
6.3 SECTIONING PLAN FOR METALLOGRAPHIC SAMPLES OF BUTT WELDED HY-SO STEEL
6.4 TRANSVERSE SECTION OF A MULTIPASS BUTT WELD OF HY-SO STEEL
6.5 HISTOGRAM OF THE WIDTH OF INCLUSIONS IN THE Z-S7 and G-69 SAMPLES OF HY-SO STEEL
6.6 HISTOGRAM OF THE THICKNESS OF INCLUSIONS IN THE Z-S7 AND G-69 SAMPLES OF HY-SO STEEL
6.7 PHOTOMICROGRAPH OF A LARGE CRACK IN THE HAZ AND WELD METAL OF BUTT WELDED HY-SO STEEL
6.S PHOTOMICROGRAPH OF THE SAME CRACK SHOWN ABOVE AFTER 0.009 IN-. WAS POLISHED FROM THE TRANSVERSE SECTION
6.9 PHOTOMICROGRAPH OF A LARGE CRACK NOT APPARENTLY ASSOCIATED WITH INCLUSIONS
6.10 PHOTOMICROGRAPH OF CRACKS ASSOCIATED WITH POROSITY NEAR UNDERCUT RE G ION 0 F WE LD
6.11 PHOTOMICROGRAPH OF A LARGE CRACK ALONG THE "FINGER" OF THE WELD METAL THAT EXTENDS INTO THE BASE METAL
6.12 MICROHARDNESS SURVEY OF 1-1/2 IN. THICK HY-SO STEEL BUTT WELD
6.13 MI CROHARDNESS SURVEY OF THE WELD METAL AND HAZ OF "BUTTERED" HY-SO STEEL SCARF
6.14 FRACTURED SE'CTION OF HY-SO STEEL SAMPLE G-6S WELDED IN RESTRAINT
6.15 TRANSVERSE SECTION OF FRACTURED SAMPLE INDICATED BY THE ARROW IN FI·G. 6.14
6.16 PHOTOMICROGRAPH SHOWING FATIGUE CRACKS RADIATING FROM POROSITY IN HY-SO STEEL SAMPLE G-6S AFTER 13,000 CYCLES OF ±50.0 KSI


-ix-
LIST OF FIGURES (CONTD)
Number
A.l RESULTS OF ULTRASONIC CRACK DETECTION STUDY FOR SPECIMENS TESTED AT ±50.0 KSI
A.2 RESULTS OF ULTRASONIC CRACK DETEG.TION STUDY FOR SPECIMENS TESTED AT 0 TO +50.0 KSI

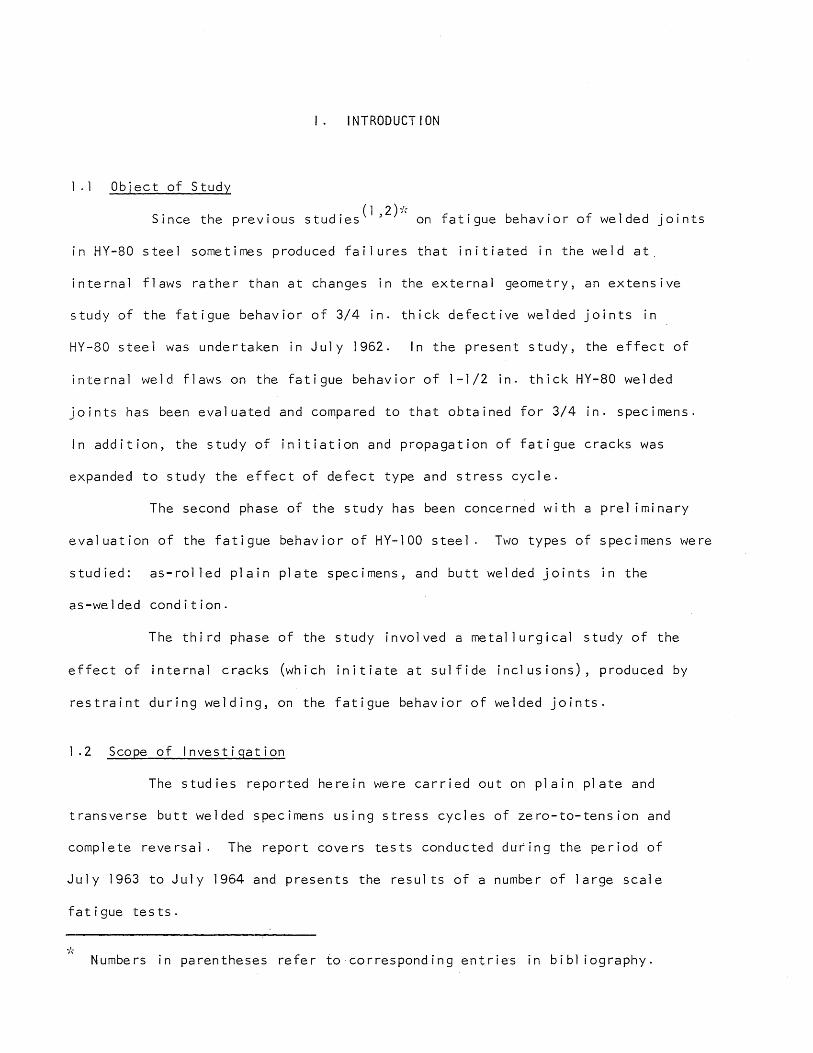
I. I NTRODUCT ION
1.1 Object of Study
(1 2) -;', Since the previous studies' on fatigue behavior of welded joints
in HY-80 steel sometimes produced failures that initiated in the weld at.
internal flaws rather than at changes in the external geometry, an extensive
study of the fatigue behavior of 3/4 in. thick defective welded joints in
HY-80 steel was undertaken in July 1962. In the present study, the effect of
internal weld flaws on the fatigue behavior of 1-1/2 in. thick HY-80 welded
joints has been evaluated and compared to that obtained for 3/4 in. specimens.
In addition, the study of initiation and propagation of fatigue cracks was
expanded to study the effect of defect type and stress cycle.
The second phase of the study has been concerned with a prel iminary
evaluation of the fatigue behavior of HY-IOO steel. Two types of specimens were
studied: as-rol led plain plate specimens, and butt welded joints in the
as-welded condition.
The third phase of the study involved a metallurgical study of the
effect of internal cracks (which initiate at sulfide inclusions), produced by
restraint during welding, on the fatigue behavior of welded joints.
1.2 Scope of Investigation
The studies reported herein were carried out on plain plate and
transverse butt welded specimens using stress cycles of zero-to-tension and
complete reversal. The report covers tests conducted during the period of
July 1963 to July 1964 and presents the resul ts of a number of large scale
fatigue tests.
Numbers in parentheses refer to corresponding entries in bibl iography.

-2-
Sixteen tests of 1-1/2 in. butt welded joints having slag and/or
porosity were carried out under zero-to-tension stress cycles. In addition, a
number of tests of 3/4 in. butt welded joints were conducted to study the
effect of stress cycle (zero-to-tension and complete reversal), and type of
internal weld flaw on the fatigue behavior of welded joints. These specimens
were tested with the weld reinforcement removed.
Fatigue tests were carried out on plain plate and butt welded speci
mens fabricated from 3/4 in. HY-100 material. A zero-to-tension stress cycle
was used for these tests.
Fatigue tests of butt welds fabricated under high welding restraint
were used to study the effect of restraint on the development of internal weld
cracks and their subsequent effect on the fatigue behavior of butt welded
joints in HY-80 material.
1.3 Acknowledgments
The tests described in this report are the result of an investigation
conducted in the Engineering Experiment Station of the University of III inois.
The program was carried out with funds provided by the Bureau of Ships, U.S.
Navy, under Contract 88058, Project Serial No. SR-007-01-01, Task 856.
The investigation constitutes a part of the structural research
program of the Civil Engineering Department of which Dr. N. M. Newmark is the
head. The research was conducted by A. J. Hartmann, J. B. Radziminski, and
J. L. Mooney, Research Assistants in Civil Engineering, under the direct super
vision of W. H. Munse, Professor of Civil Engineering. The metallurgical
studies were conducted by R. W. Hinton, Research Assistant in Metallurgical
Engineering, under the direct supervision of W. H. Bruckner, Research Professor
of Metallurgical Engineering.
The authors wish to express their appreciation to all the people on
the Staff of the Universi,ty who so ably assisted in the investigation.

-3-
I!. DESCRIPTION OF TEST PROGRAM
2 . 1 Ma te ria 1
Two steels of different strength, HY-80 and HY-100, were used in
this study; the HY-80 material was used in 3/4 in. and 1-1/2 in. thicknesses
while the HY-100 material was used in 3/4 in. thickness. The physical and
chemical properties of the materials are given in Tables 2.1 and 2.2, respec-
tive1y.
The welding electrodes employed throughout the test program were of
Mil 11018 grade. The electrodes were conditioned according to the requirements
of the Navy Specifications(5); a complete description of the procedure is
give n i n Re f. ( 2) .
2.2 Fabrication of Specimens
Figure 2.1 shows the geometry of the specimens tested in this test
program. The specimen blanks, 9 by 48 in., were flame cut from larger sections
of as-ro1 led HY-80 and HY-100 steel plates. The blanks used to fabricate
transverse butt welded joints were cut in half and the sawed edges were
beveled at 30 degrees to provide a double-V groove with a 60 degree included
angle. The welding procedures that were used are given in Figs. 2.2 and 2.3
(3/4 in. thick material) and Fig. 2.4 (1-1/2 in. thick material). All
welding was done in the flat position while the specimen blanks were clamped
to a special welding jig. A stringer bead technique was used in placing
successive passes and provides a heat treatment to the previously placed
passes.
The holes necessary to hold the specimen in the testing machine
were drilled and then the specimen blanks were machined to the desired

-4-
configuration (Fig. 2.1). In no case was material near the test section
removed by flame cutting. After being machined, the edges of the specimens
were ground and pol ished.
2.3 Description of Test Equipment
The tests were carried out using the University of III inois '
250,000 lb. lever-type fatigue machines (Fig. 2.5); one of the machines was
operated at 100 cpm while the other was operated at 160 cpm. There is a 15 to
force mul tipl ication provided between the dynamometer and the test specimen by
the lever system.
The throw of the eccentric determines the load range; i.e., the
difference between the maximum and minimum loads. The value of the maximum
load is set by means of the turnbuckle which is situated just below the
dynamome te r.
2.4 Testing Procedure
After the load had been set and the machine started, a microswitch
was set so that the machine would shut off when a crack had propagated ~rtially
through the specimen. Failure was assumed to have occurred when the micro
switch shut the machine off. The microswitch was then disconnected and the
machine restarted; this was done to completely fracture the specimen so that
the fracture surface could be examined and photographed.
2.5 Radiographic Studies
All specimens were subjected to radiographic examination prior to
test i ng in order to determine the qual i ty of the transverse butt wel ds. All
"sound" weld specimens showed no weld defects to be present although a number
of the specimens failed in the weld at minute weld flaws.


-5-
In addition, radiographs were taken at various stages of the tests
of some 3/4 in. butt welded specimens of (HY-80) purposely provided with slag
and porosity to evaluate crack initiation and propagation.

-6-
! I I. FATIGUE TESTS OF 3/4 INCH HY-100 MATERIAL
3.1 Introductory Remarks
Fatigue tests were carried out on plain plate and as-welded butt
joint specimens of HY-100 material. During the past few years, the use of
HY-100 has increased and as a result a knowledge of its fatigue behavior has
become important.
The transverse butt welds were fabricated using welding procedure
P100-1 l018-J, which is identical to procedure P80-1 1018-A used for the HY-80
material; no difficulty was encountered in the welding of the HY-100 material.
The weldor and the welding procedure were qual ified in accordance with
requirements given in Ref. (5) for HY-80 material. The joint was able to
undergo a 1800 guided side bend test without cracking. Figures 3.1 and 3.2
show typical micrographs for the HY-80 and HY-100 materials, respectively;
the microstructures of these materials are very similar.
3.2 Tests of Plain Plate Specimens
The results of the fatigue tests of plain plate specimens on a
zero-to-tension stress cycle are tabulated in Table 3.1 and plotted in Fig. 3.3.
The S-N curve shown in this figure for HY-100 material was obtained using the
procedure out1 ined in Ref. (2). In addition, Fig. 3.3 contains the S-N curve
for 3/4 in. HY-80 plain p1ates(4). Comparing the curves it is noted that the
slope for the HY-100 material is greater than that for the HY-80 material.
However, only a 1 imited number of tests were included in the study.
In a number of tests, failure initiated at the mill scale surface
near the radius of the test section rather than at the radius of the test
section. These failures initiated about 1/8 to 1/4 in. from the machined edge;


-7-
Fig. 3.4 shows this type of failure. The results tabulated in Table 3.1
indicate that the test 1 ives were not influenced by the mode of failure. One
of the specimens, HY-5, failed due to fretting in the upper pullhead after
396,500 cycles. The fretting cracks initiated at the drilled holes in the
pul lheads; examination of the area around the holes showed that the edges of
the holes were very rough. A new pullhead was welded to the specimen and a
total 1 ife of 546,300 cycles was obtained before failure occurred.
Comparing the average S-N curves for the HY-lOO and HY-80 material,
one may note that although the fatigue strength of HY-lOO is greater than the
fatigue strength of HY-80 for lives of less than 150,000 cycles, the situation
is reversed at longer lives.
3.3 Tests of As-Welded Butt Joints
The resul ts of the fatigue tests of as-welded butt joints on a
zero-to-tension stress cycle are tabulated in Table 3.2 and plotted in Fig. 3.5.
Figure 3.5 also contains the S-N curve for 3/4 in. HY-80 as-welded butt
.. (4) J 0 I nts . A 1 though the 3/4 in. HY-80 spec i mens all failed due to the stress
concen t ra t ion of the ex te rna 1 wel d geomet ry, this was not true for the HY-lOO
material. In a number of cases, failure occurred in the weld rather than at
the edge of the weld reinforcement because of very smal I defects which were
present in the root area of the weld. These defects (Fig. 3.6) were not visible
on the radiographs taken of the as-welded specimens prior to testing. Even on
the fracture surface, it was difficult to locate the defects because of their
smallness.
It can be seen on Fig. 3.5 that there was a large amount of scatter
in the test results when failure occurred in the weld. In addi,tinn the failures
propagated rapidly when they originated in the weld. When failure occurred in

-8-
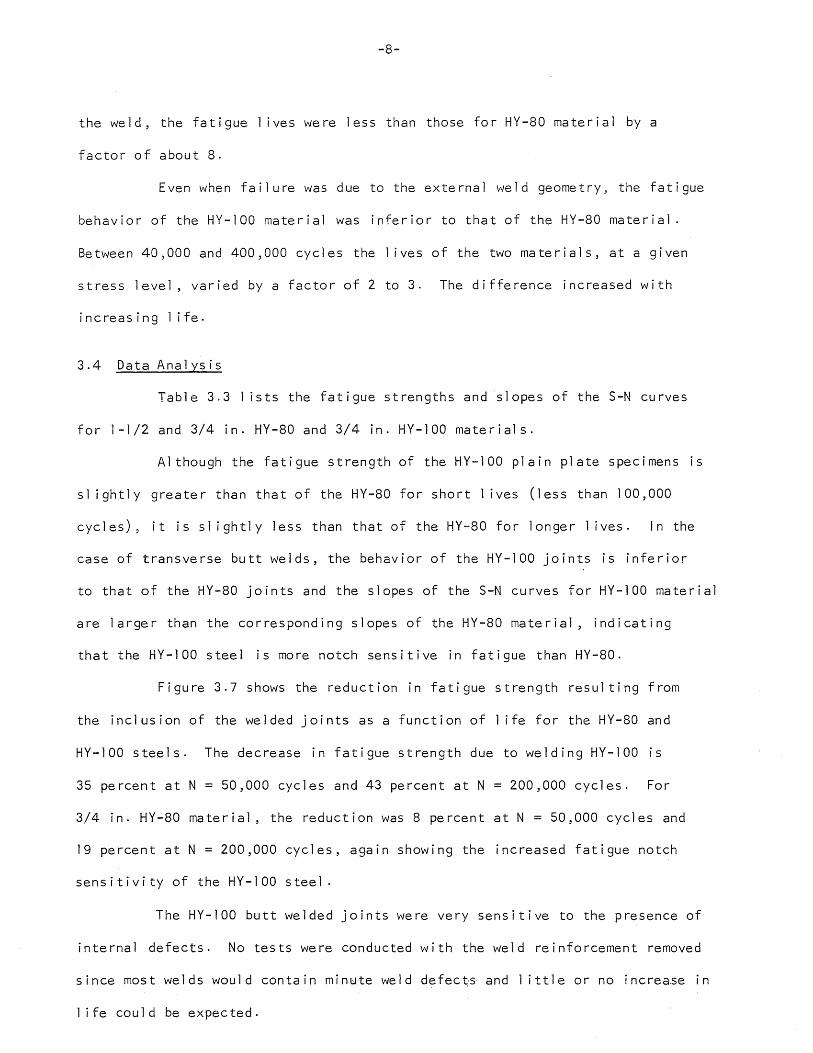
the weld, the fatigue 1 ives were less than those for HY-80 material by a
factor of about 8.
Even when failure was due to the external weld geometry, the fatigue
behavior of the HY-100 material was inferior to that of the HY-80 material.
Between 40,000 and 400,000 cycles the 1 ives of the two materials, at a given
stress level, varied by a factor of 2 to 3. The difference increased with
increas ing 1 ife.
3.4 Data Analysis
Table 3.3 1 ists the fatigue strengths and slopes of the S-N curves
for 1-1/2 and 3/4 in. HY-80 and 3/4 in. HY-100 materials.
Al though the fatigue strength of the HY-100 plain plate specimens is
sl ightly greater than that of the HY-80 for short 1 ives (less than 100,000
cycles), it is sl ightly less than that of the HY-80 for longer 1 ives. In the
case of transverse butt welds, the behavior of the HY-100 joints is inferior
to that of the HY-80 joints and the slopes of the S-N curves for HY-100 material
are larger than the corresponding slopes of the HY-80 material, indicating
that the HY-100 steel is more notch sensitive in fatigue than HY-80.
Figure 3.7 shows the reduction in fatigue strength resulting from
the inc 1 us ion 0 f the we 1 de d j 0 i n t s a s a fun c t ion 0 f 1 i fe for the H Y - 8 ° and
HY-100 steels. The decrease in fatigue strength due to welding HY-100 is
35 percent at N = 50,000 cycles and 43 percent at N = 200,000 cycles. For
3/4 in. HY-80 material, the reduction was 8 percent at N = 50,000 cycles and
19 percent at N = 200,000 cycles, again showing the increased fatigue notch
sensitivity of the HY-100 steel.
The HY-100 butt welded joints were very sensitive to the presence of
internal defects. No tests were conducted with the weld reinforcement removed
since most welds would contain minu·te weld defec~·s and 1 ittle or no increa.se in
1 ife could be expected.


-9-
IV. FATIGUE TESTS OF TRANSVERSE BUTT WELDS IN HY-80 MATERIAL
HAVING INTERNAL DEFECTS
4.1 I ntroductory Remarks
Fatigue tests were carried out on a number of defective butt welded
specimens in two thicknesses of HY-80 steel (3/4 in. and 1-1/2 in.) using two
stress cycles (complete reversal and zero-to-tension). The weld reinforcement
was removed on all specimens to improve defect definition on the radiographs
taken of each specimen and to remove any effect of the weld reinforcement on
the fatigue behavior.
The porosity and slag defects in the 3/4 in. thick specimens were
produced as described in Ref. (4). However~ some experimentation was necessary
to produce the larger amounts of slag and porosity desired in the 1-1/2 in.
specimens. This was necessary because the increased thickness required larger
defect areas to provide defects of the maximum size permitted by Navy
Specifications(5) .
In addition, several 3/4 in. thick transverse butt welded specimens
were fabricated with artificial defects (steel balls) in the root area of the
weld. The procedure had been reported previously(4).
4.2 Porosity in 1-1/2 In. HY-80 Specimens
The results of fatigue tests of 1-1/2 in. defective butt welds are
tabulated in Table 4.1 and plotted in Fig. 4.1. Since the tests were carried
out using two stress cycles, 0 to +70.0 ksi and 0 to +50.0 ksi, it was possible
to draw the S-N curve which is shown in Fig. 4.1. The slope, k = 0.21, is
larger than that for sound butt welds with weld reinforcement removed but is
less than that for butt welds tested in the as-welded condition. The S-N
curves for sound butt welds with and without weld reinforcement are also given


-10-
in Fig. 4.1 Comparing the three curves one may see that although the curve
for defective welds 1 ies entirely below that for welds with reinforcement
removed, it is below the curve for as-welded joints for 1 ives less than
150,000 cycles but above the curve for higher I ives. This indicates that at
long 1 ives the external geometry is more critical, with respect to fatigue,
than internal defects when the defects are of a size permitted by the code;
at the shorter 1 ives the internal defects produce greater effects than the
external geometry.
The geometry of the porosity in the 1-1/2 in. thick material was
similar to that of the 3/4 in. thick material which was discussed extensively
in a previous report(4). The majority of natural defects were roughly spherical
or ellipsoidal ~ Fig. 4.2a. The minimum distance from the surface of the weld
to the porosity ranged from 7/16 in. to 9/16 in. for the 1-1/2 in. thick
material and 7/32 in. to 5/16 in. for the 3/4 in. thick plate. All specimens
in the present test series with natural porosity were fabricated to produce a
single cluster of porosity. Specimens G-8l and G-88 each had fatigue cracks
that grew from the main cluster of porosity as weI I as from other small defects
located some distance from the cluster. Specimen G-8l had the lowest 1 ife
and specimen G-88 had the longest 1 ife of the specimens tested at 0 to +50.0 ksi.
The pore diameters in most of the test welds ranged from 1/64 in. to
-'-3/64 in. The effective defect diameter", d , was determined for the largest
e
flaw in any cluster that propagated to failure and is tabulated in Table 4.2.
Figure 4.3 shows a plot of the percent of FIOO 000 for a sound weld with the ~
reinforcement removed vs. the effective defect diameter; over the small range
Effective defect diameter de =.fd l d2 , where d1 and d2 = dimensions of major
and minor axes of pore. The ~aximum value of d is 1 isted in Tabl~ 4.2 e
for all specimens.


-11 -
of values studied there does not appear to be any consistent variation in
fatigue strength with the defect parameter, d e
This is in contrast to the
results obtained for 3/4 in. material where an increase in effective defect
diameter produced a decrease in F100 000' Nevertheless, it may be seen that , the welds with maximum defects ranging from 0.035 to 0.067 in. in diameter
had fatigue strengths at 100,000 cycles of approximately 65 percent of that
for a sound weld.
Another parameter that has been used to specify the amount of porosity
is the percentage of defective area in the gross area of the specimen, Ad' re .
The defective area is defined as the area of porosity in the group or groups
propagating to failure as measured on the fracture surface or as measured from
the radiograph assuming that the porosity is uniformly distributed in a
s phe rica 1 manne r . The A d for a specimen was usually somewhat greater when re .
based on the fracture surface than when based on radiographs because of the
difficul ty of interpreting the radiographs.
The average A d for the 1-1/2 in. thick specimens was approximately re .
equal to 0.16 percent; this is approximately the same as that obtained for
the 3/4 in. thick specimens tested previously. The parameter, Ad' (based re .
on the radiographs) is plotted vs. F100 000 in Fig. 4.4. There is a 1 ittle , scatter in the test results, and no consistent decrease in fatigue strength
with increasing Ared . is evident for 0.02 < Ared
. < 0.25 percent. This is
unl ike the case for 3/4 in. material for which a trend of decreasing fatigue
strength with increasing defective area was evident.
Table 4.2 also indicates whether welds satisfy Naval Specifications(5).
Only two of the members failed to meet the Specification requirements but all
of the members exhibited fatigue strengths considerably below that of a
sound weld.

-12-
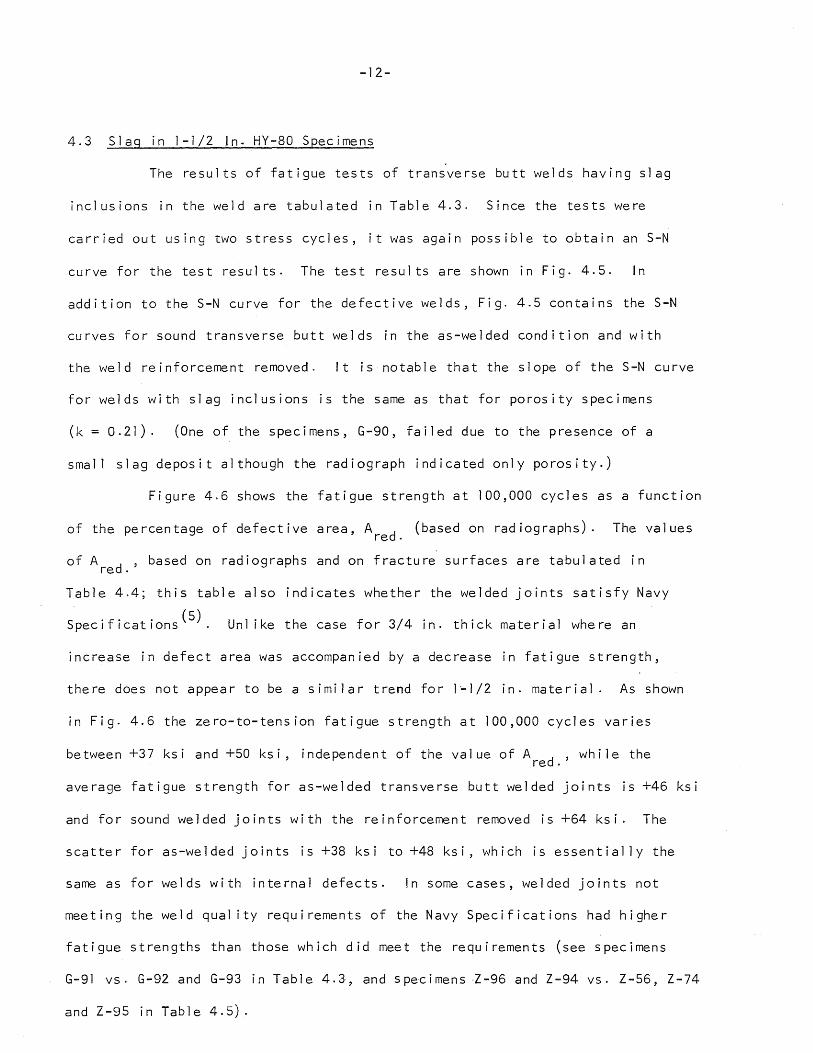
4.3 Slag in 1-1/2 In. HY-80 Specimens
The results of fatigue tests of transverse butt welds having slag
inclusions in the weld are tabulated in Table 4.3. Since the tests were
carried out using two stress cycles, it was again possible to obtain an S-N
curve for the test results. The test results are shown in Fig. 4.5. In
addition to the S-N curve for the defective welds, Fig. 4.5 contains the S-N
curves for sound transverse butt welds in the as-welded condition and with
the weld reinforcement removed. It is notable that the slope of the S-N curve
for welds with slag inclusions is the same as that for porosity specimens
(k = 0.21). (One of the specimens, G-90, failed due to the presence of a
small slag deposit although the radiograph indicated only porosity.)
Figure 4.6 shows the fatigue strength at 100,000 cycles as a function
of the percentage of defective area, A d (based on radiographs). The values re .
of Ad' based on radiographs and on fracture surfaces are tabulated in re .
Table 4.4; this table also indicates whether the welded joints satisfy Navy
Specifications(5). Unl ike the case for 3/4 in. thick material where an
increase in defect area was accompanied by a decrease in fatigue strength,
there does not appear to be a similar trend for 1--1/2 in. material. As shown
in Fig. 4.6 the zero-to-tension fatigue strength at 100,000 cycles varies
between +37 ksi and +50 ksi, independent of the value of Ad' while the re .
average fatigue strength for as-welded transverse butt welded joints is +46 ksi
and for sound welded joints with the reinforcement removed is +64 ksi. The
scatter for as-welded joints is +38 ksi to +48 ksi, which is essentially the
same as fo r we 1 ds with in te rna 1 defec ts . I n some cases, we 1 ded j 0 in ts not
meeting the weld qual ity requirements of the Navy Specifications had higher
fatigue strengths than those which did meet the requirements (see specimens
G-91 vs. G-92 and G-93 in Table 4.3, and specimens ·Z-96 and Z-94 vs. Z-56, Z-74
and Z-95 in Table 4.5).


-13-
When the fatigue strength at 20,000 cycles is considered, Fig. 4.7,
the effect of internal geometry on the fatigue 1 ife becomes more important.
At this 1 ife, the upper bound of the results for defective welds is about 6 ksi
lower than the average fatigue strength of the sound as-welded joints.
4.4 Fatigue Tests of Defective Welds in 3/4 .J.n·. HY-80 Material
Three transverse butt welded specimens, Z-lOO, Z-lOl, Z-102, containing
artificial porosity (drilled holes filled with steel balls), were tested to
study the effect of the spacing and number of defects in aline on the fatigue
1 ife. However, it was not possible to obtain fully the desired information
since Z-lOO failed due to lack of fusion in the root area rather than at
drilled holes. The 1 ives for these three specimens are given in Table 5.1 of
the propagation study.
Specimen Z-102, which had eleven 1/16 in. diameter bal Is spaced at
approximately 3 hole diameters, had a relatively long fatigue 1 ife for a
specimen with A d equal to 1.2 percent. This can be attributed to the widely re .
distributed defect area and to the shape of the defects. Only six of the steel
balls were included in the initial fatigue portion of the crack which propagated
to failure (Fig. 4.8).
A number of 3/4 in. butt welded joints having internal weld defects
were tested using a ±50.0 ksi stress cycle. The test results are tabulated in
Table 4.5; some of the complete reversal tests previously reported in Ref. (4)
are also included. The fatigue strength at 50,000 cycles has been plotted as
a function of the percentage of defective area, Ad' in Fig. 4.9. It does re .
not appear that the fatigue strength is a function of the defect area·
Furthermore, the upper bound of the scatter band for defective welds is about
12 ksi below the average fatigue strength for sound as-welded butt joints.


-14-
4.5 Discussion of Results
The fatigue strengths at 100,000 cycles vs· A d for 1-1/2 in. re .
transverse butt welds shown in Figs. 4.4 and 4.6 have been summarized in
Fig. 4.10. The graph indicates that, for the range of intentional defects
studied, the effect on the fatigue strength is independent of the type of
defect and the amount of defective area. It is evident also that at 100,000
cycles the fatigue strength of the members with intentional flaws is about
the same as that of the as-welded joints with the reinforcement in place (no
intentional defects).
From the study reported above, it appears that the intentional internal
weld defects in specimens with the weld reinforcement removed are of more
importance than the external geometry of sound as-welded joints at shorter 1 ives,
less than 100,000 cycles, while the external weld geometry appears to be more
important at the longer 1 ives. It is also evident that the present code
requirements for porosity and slag will not guarantee a fatigue behavior for
1-1/2 in. thick butt joints comparable to that of a sound joint. Neither does
there appear to be any correlation, within the specification$, between fatigue
strength and the defect size or area visible on radiographs.
Unl ike the resul ts obtained for zero-to-tens ion tests of defective
3/4 in. butt welded joints, there does not appear to be any change in the
fatigue strength at a given 1 ife with an increase in theperceDtage of defective
area, A 'd ' for complete reversal tests . . re .


-15-
V. CRACK INITIATION AND PROPAGATION
5.1 Introductory Remarks
The fatigue 1 ife of metals may be divided into two general categories: _'~
the number of cycles required to initiate a fatigue crack" or cracks at a
given stress level, and the cycles of crack propagation from initiation to
failure. As part of the present study, nine 3/4 in. thick HY-80 transverse
butt welded specimens, Z-94 through Z-102 inclusive, were examined during
testing by using both radiographic and ul trasonic techniques to determine the
time to crack initiation and subsequent propagation. Five specimens were
tested at ±50.0 ksi while the remaining four were tested at 0 to +50.0 ksi.
Each of the specimens contained weld defects, the defects varying in type and
size as shown in Table 5.1. The data for three specimens from an earl ier
study(4) , Z-70, Z-79, and Z-80, are also included in the results.
5.2 Test Equipment and Testinq Procedure
All specimens in this series were tested in the University of
III inois ' 250,000 lb. fatigue machine described earl ier. To study crack
initiation and propagation, two separate techniques were followed. The first
employed the use of the portable radiographic equipment shown in Figs. 5.1a
and 5. lb. The second method, used primarily for a qual itative comparison with
the radiographic technique, util ized the ul trasonic flaw detection equipment
shown in Figs. 5.2a and 5.2b.
Each of the specimens was x-rayed prior to testing to determine the
size and location of internal weld defects. The specimen was next secured in
Crack initiation - estimated he-rein as one-hal-f- the number of cycJes between last radiographic observation showing no crack and first radiograph showing crack.


-16-
the fatigue machine and subjected to repeated loadings (the number of cycles
depending on stress cycle) at which time the machine was shut off with the
specimen being held at maximum tensile load. With the specimen in this
position, a radiograph was then taken of the test section. Fol lowing this,
the ul trasonic flaw detector, employing both a normal probe and a 450 angle
probe, was used to scan the specimen through the region in which the weld was
situated. For each of eight consecutive locations along the surface of the
test section, the ampl itude of the peak response as indicated on the detector
scope for a constant pulse energy was recorded. No attempt was made to
correlate these readings with actual flaw sizes; the method was used simply to
obtain prel iminary data concerning the feasibil ity of using such a device to
detect the initiation of a fatigue crack. The results of the ultrasonic
detection study are presented and briefly discussed in Appendix A.
If the radiograph showed no fatigue crack in the test section the
procedure above was then repeated. This process continued until such time as
a crack became evident, after which radiographs and ultrasonic readings were
r e pe a te d ate ve r y 500 to 1 000 c y c 1 e sun til the s pe c i me n fa i 1 e d .
5.3 Initiation of Fatigue Cracks
This phase of the investigation consisted of a study, using radio
graphic detection, of the initiation of fatigue gracks in the 3/4 in. thick
HY-80 butt welded specimens. The test specimens contained various types of
weld defects; these defects were generally placed in the second weld pass and
were located approximately midway between the specimen faces. The objectives
of the investigation were twofold: (1) to determine whether, at a given stress
level, some direct correlation exists between the type or size of weld defect
and the initiation of a fatigue crack; and (2) to determine if there is some

-17-
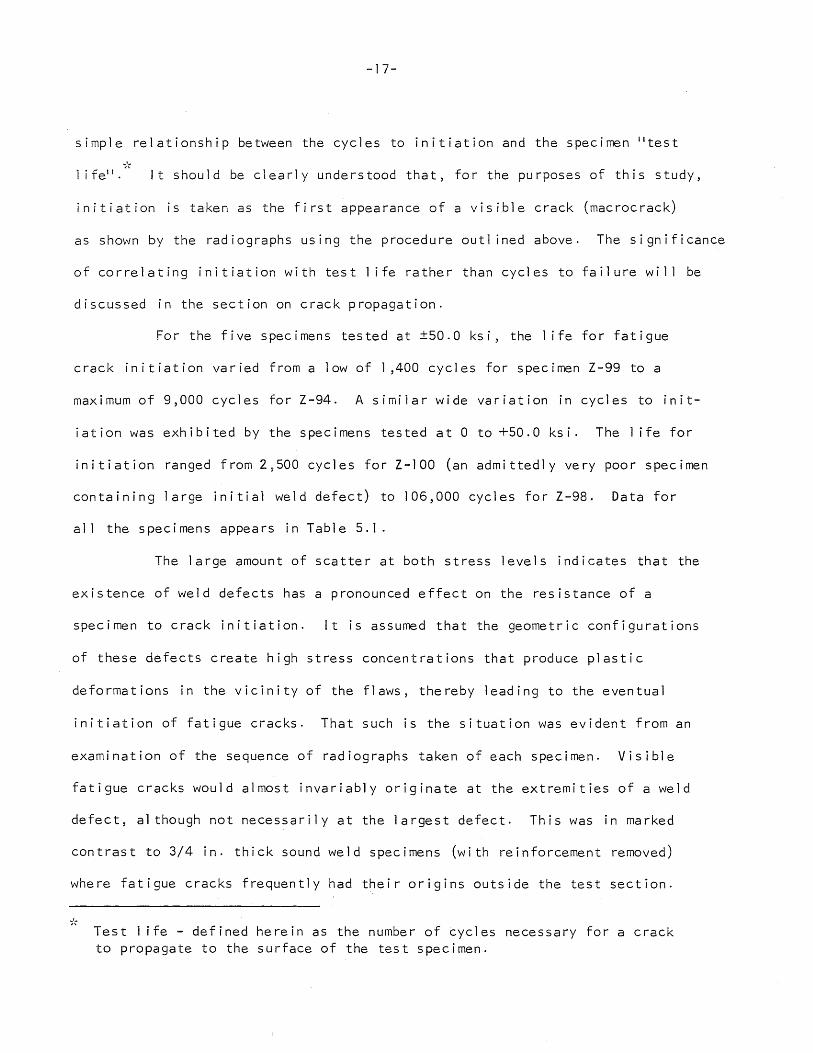
simple relationship between the cycles to initiation and the specimen "test ;',
1 i fell. It should be clearly understood that, for the purposes of this study,
initiation is taken as the first appearance of a visible crack (macrocrack)
as shown by the radiographs using the procedure outl ined above. The significance
of correlating initiation with test 1 ife rather than cycles to failure will be
discussed in the section on crack propagation.
For the five specimens tested at ±50.0 ksi, the 1 ife for fatigue
crack initiation varied from a low of 1,400 cycles for specimen Z-99 to a
maximum of 9,000 cycles for Z-94. A similar wide variation in cycles to init-
iation was exhibited by the specimens tested at 0 to +50.0 ksi. The 1 ife for
initiation ranged from 2,500 cycles for Z-lOO (an admittedly very poor specimen
containing large initial weld defect) to 106,000 cycles for Z-98. Data for
all the specimens appears in Table 5.1.
The large amount of scatter at both stress levels indicates that the
existence of weld defects has a pronounced effect on the resistance of a
specimen to crack initiation. It is assumed that the geometric configurations
of these defects create high stress concentrations that produce plastic
deformations in the vicinity of the flaws, thereby leading to the eventual
initiation of fatigue cracks. That such is the situation was evident from an
examination of the sequence of radiographs taken of each specimen. Visible
fatigue cracks would almost invariably originate at the extremities of a weld
defect, al though not necessarily at the largest defect. This was in marked
contrast to 3/4 in. thick sound weld specimens (with reinforcement removed)
where fatigue cracks frequently had their origins outside the test section.
Test 1 ife - defined herein as the number of cycles necessary for a crack to propagate to the surface of the test specimen.

-18-
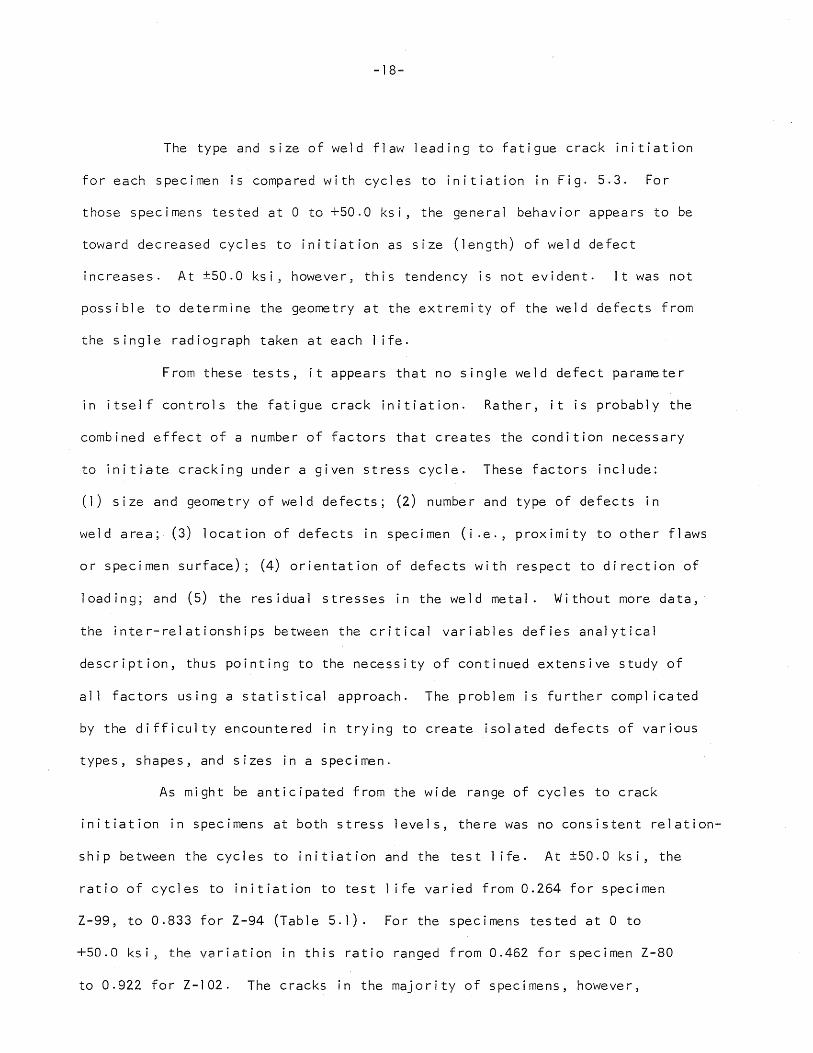
The type and size of weld flaw leading to fatigue crack initiation
for each specimen is compared with cycles to initiation in Fig. 5.3. For
those specimens tested at 0 to +50.0 ksi, the general behavior appears to be
toward decreased cycles to initiation as size (length) of weld defect
inc re as e 5 . A t ± 5 0 . 0 k s i, howe ve r, t his te n den c y i s not e v ide n t . I twa s not
possible to determine the geometry at the extremity of the weld defects from
the single radiograph taken at each life.
From these tests, it appears that no single weld defect parameter
in itself controls the fatigue crack initiation. Rather, it is probably the
combined effect of a number of factors that creates the condition necessary
to initiate cracking under a given stress cycle. These factors include:
(1) size and geometry of weld defects; (2) number and type of defects in
weld area; (3) location of defects in specimen (i .e., proximity to other flaws
or specimen surface); (4) orientation of defects with respect to direction of
loading; and (5) the residual stresses in the weld metal. Without more data,
the inter-relationships between the critical variables defies analytical
description, thus pointing to the necessity of continued extensive study of
all factors using a statistical approach. The problem is further compl icated
by the difficulty encountered in trying to create isolated defects of various
types, shapes, and sizes in a specimen.
As might be anticipated from the wide range of cycles to crack
initiation in specimens at both stress levels, there was no consistent relation
ship between the cycles to initiation and the test life. At ±50.0 ksi, the
ratio of cycles to initiation to test 1 ife varied from 0.264 for specimen
Z-99, to 0.833 for Z-94 (Table 5.1). For the specimens tested at 0 to
+50.0 ksi, the variation in this ratio ranged from 0.462 for specimen Z-80
to 0.922 for Z-102. The cracks in the majority of specimens, however,


-19-
initiated at more than half. the test 1 ife, with the average for all specimens
being 0.69. Thus, on the basis of these tests and the crack detection procedure
used, the number of cycles necessary to propagate the fatigue cracks to the
specimen surface was found to be less than 50 percent of the test 1 ife.,
5.4 Crack Propagation
The process of propagation of a crack initiating at an internal weld
defect in the 3/4 in. thick plate specimens can be divided into two reasonably
distinct regions. The first stage begins with the initiation of the crack
and continues until the crack approaches or actually intersects the specimen
surface (test 1 ife). It is during this period that the specimen experiences
true "fatigue crack" propagation, with the crack growing radially from the
defect and in a plane normal to the direction of loading. Thereafter, the
mode of propagation in the joints changes to one in which the crack progresses
along planes obl ique to the loading direction, exhibiting the so cal led
"shear-type" crack growth behavior illustrated in detail in a earl ier report(4).
The rate of propagation is rapidly accelerated during this latter stage and
ends with complete fracture within a relatively few cycles. This increased
rate of growth is due in large part to the higher stresses created as the
remaining net specimen section required to resist the load is decreased. The
extent of both modes of crack propagation can be easily distinguished by
visual observation of a specimen fracture surface, such as that shown in
Fig. 4.8.
The importance of test 1 ife rather than cycles to complete failure
as a measure of fatigue behavior now becomes apparent. It is the test 1 ife
that most accurately represents the 1 imit of extension of a true fatigue
crack in a plate specimen of the type used in this study, thus provid,ing a


-20-
consistent bound for evaluating the radiographic data regarding such crack
growth. It was the purpose of this phase of the project to investigate both
the fatigue and shear-type crack growth mechanisms and to cor/elate duration
and rate of propagation with test-stress conditions. A discussion of the
observations is presented below.
The number of cycles of propagation from initiation to test 1 ife,
for the specimens tested at ±50.0 ksi, varied from 1000 cycles for specimen
Z-97, to a maximum of 4,500 cycles for Z-96. There was an apparent general
trend but no clearly defined consistent ratio between duration of fatigue crack
growth and specimen 1 ife. Rather, Fig. 5.4 shows that the number of cycles
of propagation falls within a fairly narrow band regardless of the total 1 ife
of the specimen. This observation is even more pronounced for the tests
performed at 0 to +50.0 ksi, when all of the tests are considered. However,
as shown in Fig. 5.5, the cycles of fatigue crack propagation for the current
series of tests ranged from 2,700 for specimen Z-lOO to 14,000 for Z-98, and
show an increase in duration of crack propagation with an increase in test
1 ife, although the increase is not great. The specimens from the previous
tests had greater durations of propagation even though their total 1 ives were
lower.
That the duration of fatigue crack propagation should be approxi
mately constant at a given stress level may be reasoned by a closer observa
tion of the crack appearance. Although the geometric configurations of
internal weld defects do vary considerably (thus affecting initiation), once
a fatigue crack forms and begins to extend radially outward from the defect,
the geometry at the tip of the crack becomes similar in most cases. The
specimens then continue to undergo essentially constant fatigue crack growth
up to the point of intersection with the specimen surface, when the mode


-21-
changes to the shear-type mentioned above. Since the crack-initiating defects
were located near the center of the weld in the specimen and all specimens in
the group tested were 3/4 in. thick, it appears reasonable that they should
exhibit similar propagation times as, indeed, is substantiated by the infor-
mation presented in Figs. 5.4 and 5.5. The sl ight increase in duration of
propagation with test 1 ife may be due to such factors as variation in flaw
location, the residual stresses in the weld, etc.
The second objective of this study on propagation was to investigate
the actual rate of crack propagation, during both the normal fatigue and shear-
type growth stages. The results of measurements from the radiographs are
presented in Figs. 5.6 and 5.7 for tests performed at ±50.0 ksi and 0 to
+50.0 ksi respectively. The data are referred to test life, thus different-
iating the two separate stages of propagation. Although the scatter band for
crack length prior to the test 1 ife appears to indicate a uniform rate of
growth, tracing the data for an individual specimen tends to indicate a
stepped pattern of propagation, especially in the tests at 0 to +50.0 ksi.
This system of al ternating periods of growth and dormancy or near dormancy
has been reported in the 1 iterature(6,7) and appears to be fairly common
behavior in the early stages of fatigue crack propagation. The limited number
of observations in these tests, however, precludes any estimate of the number
or duration of these dormant periods.
In the zero-to-tension tests this step-type growth pattern continued
in some specimens for a time beyond the appearance of the crack on the specimen
surface. Thereafter, the growth rate accelerated rapidly and failure usually
occurred within few additional cycles. Figures 5.6 and 5.7 do~ however, show
a considerable range of cycles from test life to failure~ Although no
conclusions have been drawn concerning this variation in duration of crack


-22-
propagation at each stress cycle, two possibil ities are offered. First, the
planes that the crack fol lows after reaching the specimen surface are often
dictated by the location of other weld flaws in the near vicinity. The crack
will tend to grow toward these defects, especially if they, too, have
initiated fatigue cracks, If no such additional defects exist, the crack
often passes near or into the specimen heat affected zone and fol lows that
1 ine to failure. Depending upon the crack path taken, the crack will progress
through the test section at a slower or more rapid rate. A second possibil ity
would be the location of the propagating crack in the specimen cross-section.
A crack situated toward the edge of the specimen would tend to induce bending
as well as axial stresses in the rema'ining net section, thus increasing the
wedging action at the tip of the crack and further stimulating the rate of
propagation.
5.5 Conclusions
Based on the study reported herein, the following conclusions have
been drawn regarding the initiation and propagation of fatigue cracks in 3/4
in. thick HY-80 transverse butt wel~ed specimens containing weld defects:
1. At a given stress cycle, there is no consistent number of cycles
for the initiation of a macroscopic fatigue crack; nor is there a constant
ratio between cycles to initiation and test 1 ife (appearance of crack on
specimen surface). The number of cycles required to initiate such a crack is
apparently strongly dependent upon several critical parameters including:
a) type, quantity and geometry of internal weld defects~ and b) location of
defect in weld (whether in a tensile or compressive residual stress zone), and
orientation with respect to di rection of loading.
2. After ,the initiation of a fatigue crack at or in the vicinity
of a weld defect, the duration of its propagation to test 1 ife falls within a


-23-
fairly narrow range of cycles for a given stress level. This period defines
a region of IIfatigue crack" propagation. In the present series of tests this
crack propagation ranged from 1,000 to 4,500 cycles for specimens tested at
±50.0 ksi and from 7,000 to 14,000 cycles (excluding Z-lOO) for those tested
at 0 to +50.0 ksi. In most cases the mechanism of early crack propagation
appeared to fol low a stepped pattern of intermittent periods of growth and
dormancy rather than a constant or uniformly varying rate.
3. Beyond the point at which the crack reaches the specimen surface,
the increased stresses near the tip of the crack and throughout the entire
remaining net section cause a rapid increase in the rate of crack growth lead
ing to failure within a relatively few cycles. During this period of crack
propagation,the path of the crack usually progresses along planes obl ique to
the direction of loading. This pattern then continues until complete fracture
of the specimen takes place.

-24-
VI. METALLURGICAL STUDIES OF WELDED HY-80 STEEL
6.1 Introductory Remarks
In the previous study(4) on the effect of weld flaws on the fatigue
behavior of butt welded joints in HY-80 steel fatigue crack propagation was
observed. These fatigue cracks propagated either along the fusion 1 ine~ in
the weld metal or in the base metal. Frequently the crack propagation in
the base metal was observed along metal-inclusion boundaries. In a few cases,
the inclusions were melted near the fusion 1 ine leaving small hot cracks in
that region.
Because of the above observations the inclusions were suspected
of causing early fatigue failures when they produced hot cracks in the base
metal near the fusion 1 ine of the weld. These inclusions were tentatively
identified as sulfides because of their low mel ting point and their metal 10-
graphic appearance.
The metallurgical studies of weldments in HY-80 steel in this report
involved three main objectives:
(a) To develop quantitative relationships between the size of
sulfide stringer inclusions and their contribution to hot cracking in a
we 1 dment.
(b) To determine the separate contributions of the sulfides and
the stresses during welding on the initiation of cracks in the weld deposit
and heat affected zone of the base metal.
(c) To determine the efficacy of changes in welding procedure on
the red u c t ion 0 r eli min a t ion 0 f hot c r a c kin gin the de po site d we 1 d me tal .
After reproducible hot crack production in butt welded HY-80 steel
was attained, fatigue tests were performed on these joints.


-25-
6.2 Experimental Procedures
Restraint was appl ied to the HY-80 steel during butt welding in
order to develop a number of hot cracks. Welding procedure P80-11018 was
used to make the joints. The 300 double "V II grooves for normal butt welded
samples were cut in 3/4 in. and ]-1/2 in. thick HY-80 steel plates, with a
1/8 in. spacing between the plates at the root. Two 4~1/2 in. x 9 in.
plates were then placed in a 17 in. square block of 2 in. thick plain carbon
steel as shown in the diagram in Fig. 6.1. Both HY-80 steel plates were
then fil let welded into the plain carbon steel plate at both surfaces to
produce maximum restraint conditions during the butt welding. The
longitudinal restraint was decreased to some extent by fillet welding the
HY-80 plates only in the direction parallel to the long axis of the butt
weld. After the butt weld was completed, it was allowed to remain under
restraint for a minimum of 24 hours after the butt welding. The fi1 let
welds were initially checked by dye penetrant for possible surface cracking
but none was observed.
Since the hot cracks could not be determined by x-ray radiographY9
the samples were examined by metallurgical sectioning, pol ishing, and
etching. The length and position of the hot cracks were recorded. TL_ I flt!
sample was then repol ished and the hot cracks were again observed in order
to check the first observation.
A diagram of the test plate positions in the original HY-80 steel
plate is shown in Fig. 6.2. The test plates were cut into 9 in. wide strips
for test purposes. The butt weld was approximately 8 inches long in the 9 in.
"VII groove? but only the middle 6 inches of each butt weld was examined for
hot cracks. Metallographic sections were cut from the weld as shown in
Fig. 6.3 after each butt weld was held in restraint for a minimum time of

-26-
24 hours. The optimum observations of hot cracks were made at a magnification
of 400 diameters,
6.3 Material Description
The HY-80 steel was received in the quenched and tempered condition
and was welded in this condition for the metallurgical studies.
The chemical composition of each of the two HY-80 heats used in
this investigation is 1 isted in Table 2.2 as given by the "Mil 1 Report. 1I An
analysis for manganese, phosphorus and sulfur in each plate near the 3/4 in.
plate surface and at its mid-thickness is given in Table 601. An average of
the resul ts found in Table 6.1 will be used to represent the G-67, G-68, G-69,
and Z-87 plates, The G-69 plate was cut down from a 1-1/2 in. thick plate by
removing 3/8 in. from each side in order to obtain a 3/4 in. thick plate of
a higher sulfur composition. The Z-87 plate had been rol led down to its
3/4 in. thickness at the mill.
The G plates reprepent a higher sulfur content and were taken from
the bottom center of the ingot (plate A-5) as shown in Fig. 6.2. Since the
main rolling direction was known, a reasonably perpendicular cross-section
of the inclusions could be obtained. A direct measurement of the inclusion.'s
width and thickness for the G-69 and Z-87 plates was made at 300x.
6.4 Distribution and Size of Sulfide Inclusions
An average size for the inclusions was recorded by measuring the
widths and thicknesses of a number of inclusions in a section of the plate
transverse to the rolling direction at 300 diameters magnification. The
widths of the inclusions in the Z-87 plate were greater than those in the
G-69 plate on the average~ but the thickness of the inclusions in the Z-87
sample was less than those of the G-69 sample. If an average area of


-27-
inclusion perpendicular to the roI I ing direction is calculated~ assuming
a rectangular area, the average inclusion area in the Z-87 plate was 165 square
microns compared to 83 square microns for the G-69 plate inclusion area.
Table 6.2 1 ists the resul ts of this study and shows the difference in the
inclusions in the G-69 and Z-87 plates. Another approach taken to describe
the inclusions was to show the size distribution of a number of inclusions
measured within a selected area of the pol ished and etched sample. These
histograms of size distribution are shown in Figs 6.5 and 6.6. The histogram
in Fig. 6.5 shows two or more peaks in the width measurements because some
inclusions were discontinuous and they were measured separately. The only
difference observed between the width in the Z-87 and G-69 histograms is that
the inclusions are pinched off more frequently in the Z-87 samples.
The cracks were usua11y in stringer bands consisting of discontinuous
inclusions. An inclusion was usually located near the fusion 1 ine where the
crack was formed. The cracks that are associated with inclusions do not
have any characteristic size or shape. The histograms of inclusion width
and thickness measurements in samples G-69 and Z-87 also indicate that the
geometric size or shape of the inclusions do not affect the crack frequency
that is given in Table 6.3.
6.5 Discussion
The hot cracks referred to in this report are the small cracks
radiating from the inclusions that have partially melted near the fusion
1 i n eon the bas e me tal sid e . In some instances isolated flaws were observed
in the weld metal such as slag inclusions, porosity, cracking along fingers
of the weld metal and a few relatively large cracks not associated with
inclusions. These wil'/ be discussed later under the heading Ilmetallographic
observations of weld flaws. 11


-2S-
a· Hot Crack Geometry
The hot cracks were associated with inclusions because they were
found either radiating from an inclusion near the fusion 1 ine or they were
in 1 ine with stringer laminations on the base metal side of the weld. Examples
of both these conditions are shown in the photomicrographs of Figs. 6.7 and
6.So By sectioning the welds in both the transverse and longitudinal directions
the plane of the hot cracks was observed. The longitudinal section was along
the long axis of the weld and parallel to the fusion 1 ine. The hot cracks were
found to extend less than 0.025 mm from the fusion 1 ine into the base metal
in most cases. Most hot cracks extended from 0.025 mm to D~D5 mm along the
long axis of the weld, The plane of the fractured surface of the hot crack
was pa ra 11 e 1 to the ro 11 i ng direct ion.
b. Effect of Restraint of the Butt Weld on Hot Cracks
Unrestrained butt welds were made by welding procedure PSO-ll01S-D
on 1-1/2 in, thick HY-SO steel samples and no hot cracking was observed in
me tal log rap h i c sec t ion s 0 f the s e we 1 d s . I nan a t t em p t to c rea tea d d i t ion a 1
shrinkage stresses in the butt welds 1-1/2 in. x 1 in. x 1 in. blocks were
placed at the ends of the original 9 inch long butt weld double "V" groove in
order to prevent transverse shrinkage. few hot cracks were observed in this
sample. A summary of the above resul ts is 1 isted in Table 6.3.
The butt welding during full restraint described in the experimental
procedure section was successful in causing numerous hot cracks in the G-69
samples. Partial restraint of the butt weld, resulting from only fillet
welding the HY-SO plates in a direction parallel to the long axis of the butt
weld, also caused hot cracks. The amount of cracking per transverse sample
surface examined can be found in Table 6.3.


-29-
c· Effect of Sulfur Concentration on Hot Cracking
In the above tests only the 1 -1/2 in. thick G-69 plates of higher
sulfur content (0.0155% S) were examined. The following tests were conducted
on 3/4 in. thick plates butt welded by the same procedure. One G-69 plate was
cut down from its 1-1/2 in. thickness to a 3/4 in. thick plate and welded to a
rolled 3/4 in. thick Z-S7 plate with a lower sulfur content (0.011% S). The
unrestrained 3/4 in. plate 1 isted in Table 6.3 was a 1-1/2 in. thick HY-SO
steel plate cut down from plate G-67 by machining 3/4 in, from only one side.
No restraint was used in welding the cut down G-67 plate and only a few hot
cracks were observed in the numerous samples prepared (Table 6.3). The
restrained, 3/4 in. thick sample in Table 6.3 was made from a 3/4 in. thick
plate cut down from a 1-1/2 in. G-69 plate by machining off 3/S in. of the rol led
surface from both sides. This plate was welded to a rol led down 3/4 in. thick
Z-S7 plate. The striking result of the butt welded G-69 and Z-S7 plate was
that almost all the hot cracking was on the high sulfur side of the fully
restrained 3/4 in. butt weld.
d. Length of Hot Cracks
Tab 1 e 6. 4 1 i s t s the ave rage hot c r a c k 1 eng t h sob s e rve din the t ran s -
verse sections for all the welding conditions previously discussed for both the
1-1/2 in. and 3/4 in. thick samples. Most of these small hot cracks are about
0.025 mm long. Large cracks from other types of welding flaws are not included
in the values given in Tables 6.3 and 6.4, The relatively consistent hot crack
length can be related to the I imited depth to which inclusions melt beyond the
fusion 1 ine during the welding.
e. Metal lographic Observations of Weld Metal Flaws
Large cracks, apparently not related to inc1usions~ were observed in
rare instances and an example of this type of cracking is shown in Fig. 6.9.

-30-
Cracks were also observed to initiate from the periphery of slag inclusions,
porosity (Fig. 6.10) and Ilfingers" of weld metal in the base metal (Fig, 6.11).
These cracks were usually larger than the hot cracks and Table 6.5 1 ists the
samples in which these defects were found along with their crack lengths,
f. Inclusion Study
A more exact description of the inclusions was desired because of
the association of hot cracks with inclusions in the HY-80 steel microstructure.
Sulfides were assumed present from the results of a sulfur print which was
rnadeo Methods of extraction for the inclusions resulted in extracted particles
with an index of refraction between 1.35 and 1.63c This result was based on
Becke 1 ines observed around the edges of a large number of extracted stringers
immersed in 1 iquids of known indices of refraction. Sulfides must have an index
of refraction of two or better. it was concluded that sulfide inclusions were
not successfully extracted. X-ray diffraction patterns of the extracted
particles matched the ASTM pattern for iron sil icate. The sulfides were probably
dissolved in the solvent used for extracting inclusions since they were not
observed on the remaining sample or filtered from the solution.
g. Effect of IIButtering l1 on the Frequency of Hot Cracks
Two sections of the 1-1/2 in. thick G-69 plate were joined under ful 1
restraint by butt welding using welding procedure P80-11018-~ However, before
one section was placed in the full restraint apparatus it was Ilbuttered 'i
(coated with Ell018 weJd metal by weaving the electrode over one side of the
30 0 scarf.) The excess Ilbuttered il weld metal was machined off leaving a layer
of weld metal approximately 1/8 in. thick. The 1-1/2 in. thick sections were
then butt welded, sectioned and observed, The unbuttered side of the weld
had an average crack frequency and length similar to other 1-1/2 in. samples
welded in full restraint. The only cracks observed on the 'Ibuttered 'l side of

-31-
"the butt weld were near the root of the weld where i'buttered" weld metal had
not been placed. This clearly demonstrated that hot cracks can be decreased
to a low level by "buttering" the HY-80 steel before using regular welding
procedures provided the remaining buttered layer of weld metal is thick enough
to prevent the melting of inclusions in the base metal.
A microhardness survey (Fig. 6.12) in a transverse section of the
"buttered" and normal G-69 plate shows the different Diamond Pyramid Hardness
(DPH) in the Heat Affected Zone (HAZ) of the two plates and al so in the
remaining "buttered" weld metal left after machining. The maximum hardness in
the HAZ of the "buttered" section was lower than maximum hardness in the
unbuttered HAZ of the HY-80 steel butt weld. A hardness survey of the HAZ of
the buttered scarf is shown in Fig. 6.13. This hardness survey shows the
effect of the large heat input caused by the extensive weaving motion of the
electrode during the buttering operation.
h. Effect of Hot Cracks on Fatigue Life
A G-69 plate, 1-1/2 in. thick, was machined down to four 3/4 in. thick
plates by removing 3/8 in. from both sides giving a thinner plate of higher
sulfur content (0.0155% S), These plates were butt welded in full restraint to
make two samples. The samples were then tested in a method similar to a
regular 3/4 in. thick fatigue test samplen These samples were tested in 0 to
+50.0 ksi tensile stress fatigue cycles. One sample reached a fatigue 1 ife of
170~000 cycles and the other 280,000 before an attachment weld at the end of
each sample broke. The fu11y restrained welds containing hot cracks were not
broken. The attachment weld was repaired for the sample that reached 280,000
cycles and the test was continued. The attachment weld broke twice before a
total of 430,000 cycles was reached. The G-69 sample welded in restraint had
not broken, even after 430,000 cycles of stress of 0 to +50.0 ksi.

-32-
The order of magnitude calculation given below illustrates the
probable number of hot cracks contained in the 4 in. wide 3/4 in. thick fatigue
sample used in the test just described. From measurements reported in Table 6.3
each transverse section of a cut down 3/4 in. G-69 sample welded in restraint
should contain one (1) hot crack on the average. If it is assumed that each
hot crack extended along the long axis of the weld for 20 mils. (0.020 in.)
and no hot cracks overlapped along the long axis of the weld, then the number
of hot cracks is equal to 4 in./0.020 in. = 200 cracks in a 4 in. wide, 3/4 in.
thick test sample. The 430~000 cycle fatigue 1 ife of the fully restrained weld
sample approaches the fatigue 1 ife of the unwe1ded plate. Thus, the hot cracks
along the fusion 1 ine do not appear to have an effect on zero=to=tension fatigue
1 ives at this stress level.
Another 1-1/2 in. HY-80 steel sample was welded in restraint caused
by two 15 in. long plain carbon steel bars 3 in. square that were fillet welded
along the sides of the G-68 plate. The 1-1/2 in. thick plate was fillet welded
as if it were a 3/4 in. thick plate. The restraining bars were removed after
twenty-four hours and the entire plate was cut down to a 3/4 in. fatigue
sample. This sample was fatigue tested at a stress level of ±50.0 ksi. It
failed after 13,000 cycles compared to a good weld fatigue 1 ife of about
60,000 cycles at the same stress level. The sample was sectioned and pol ished
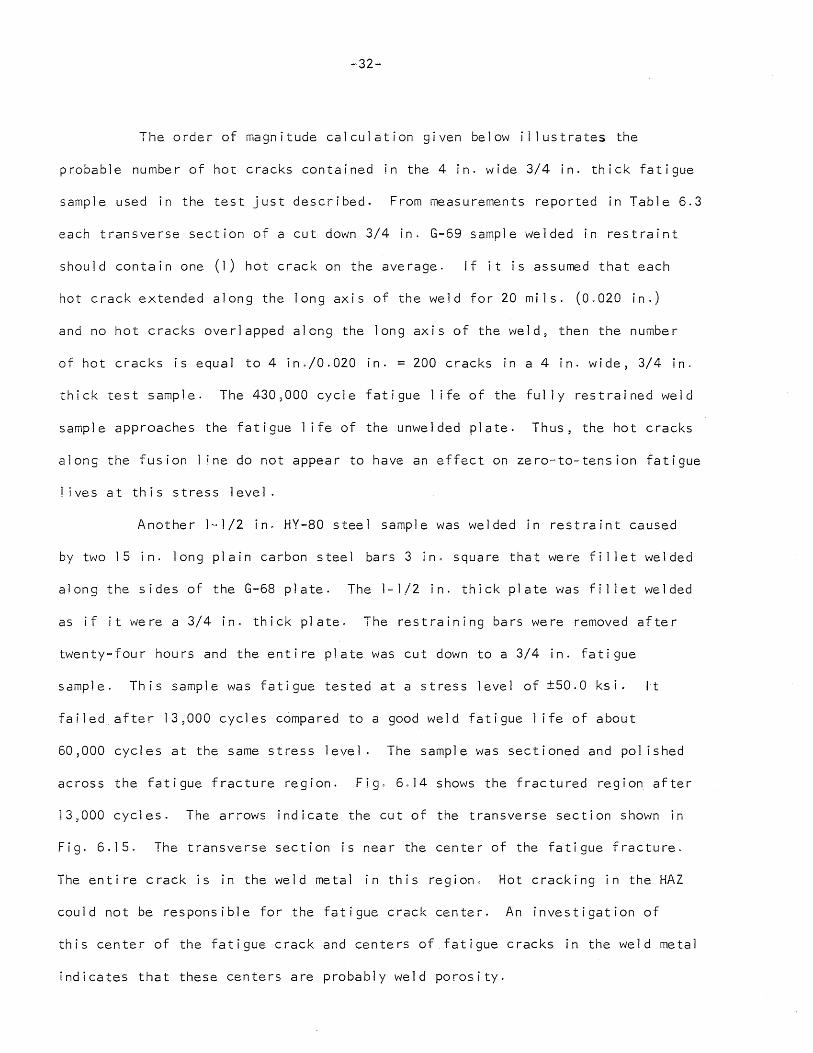
across the fatigue fracture region. Fig. 6.14 shows the fractured region after
13,000 cycles. The arrows indicate the cut of the transverse section shown in
Fig. 6.15. The transverse section is near the center of the fatigue fracture.
The entire crack is in the weld metal in this region. Hot cracking in the HAZ
could not be responsible for the fatigue crack center. An investigation of
this center of the fatigue crack and centers of fatigue cracks in the weld metal
indicates that these centers are probably weld porosity.

-33-
In a region of the same transverse section shown in Fig. 6.15 only
on the opposite side of the weld about 1/4 in. from the fracture, porosity was
observed. This pore was located near the root pass of the weld and very close
to the fusion 1 ine. This is a common location for small pores in the 3/4 in.
and 1-1/2 in. thick HY-80 steel butt welded plates. This pore was too small
to be observed in an x-ray radiograph of the plate even with reinforcement
removed. Two sma11 cracks were observed radiating out from each end of the pore
as shown in the metallographic section in Fig. 6.16. The cracks were nearly
parallel, within 40, with one crack direction making an angle of 850 to the
fatigue stress di rection and with the other crack making an angle of 87.50 to
the stress direction. Further proof that these were fatigue cracks rather than
shrinkage cracks was the fact that at a high magnification the cracks were
fine, close fitting rather than open3 smooth shrinkage separations.
6.6 Conclusions
The following conclusions are based on resul ts obtained from two
commercial heats of HY-80 steel;
1. Restraint during the welding of HY-80 steel promotes hot cracks
in the HAZ of HY-80 weldments. The hot cracks are on the average 0.025 mm in
length for the two heats investigated.
2. Higher concentrations of sulfur in HY-80 appear to promote hot
cracking. Hot cracks were observed for 0<0155% S, but practically no hot
cracks were observed for 0.011% S HY-80 steel weldments. However, the size
(width and thickness) of the inclusions does not appear to be related to the
hot crack frequency from the measurements of inclusion size made in this
investigation.


-34-
3. IIButtering" prevents hot cracking. "Buttering 'l al so causes a
sl ightly lower maximum hardness in the HAZ of the "buttered" HY-80 steel
compared to unbuttered HAZ.
4. Hundreds of hot cracks (micro-cracks) in the sample do not appear
to reduce the fatigue 1 ife to any great extent for weldments tested in tension
from ° to+50.0 ksi for the 0.0155% S HY-80 steel welded in full restraint. The
long axis of the weld was perpendicular to the axis of tension and the hot
cracks propagated in the general direction of tension causing a small stress
raiser factor.
5. In one case porosity was observed to be a nucleus for fatigue
cracking in the weld metal of the HY-80 steel sample G-68 subjected to 13,000
cycles of a reversal stress level of -50:0 ksi to +50.0 ksi. Porosity in the
weld metal was bel ieved to be responsible for the early fatigue failure of
the G-68 sample welded in restraint.


-35-
V II. SUMMARY
The following is a brief summary of the result~ of the various studies
reported here in. Ali mj ted number of tes ts were cond'Jcted and many of the
conclusions are based on a relatively small amount of data .. N\~vefthe~ess, there
are a number of observations that are considered to be very signific~nt and are
briefly summarized herein.
7.1 Fatigue Behavior of HY-I00 Steel
Fatigue tests carried out on plain plate and butt welded specimens
of HY-l00 indicate:
1. The axial fatigue strength of ~he HY~100 steel plate was not
greatly different from that of the'HY-80 plate previously tested under a
zero-to-tension stress cyc1e~,'
2. Under a zero-to-tension loading, transverse butt welded joints in
HY-IOO were found to have a lower fatigue resistance than comparable joints
in HY-80. Furthermore, the HY-100 joints appeared to be more sensitive to
the presence of internal flaws.
7.2 Weld Defect Study of HY-80 Steel
From the fatigue tests carried out on butt welds with intentional
intern?} defects it may be concluded that:
1. For the range of intentional defects studied, the effect on the
fatigue strength is independent of the type of defect and the amount of
defective area.
2. At 100,000 cycles the fatigue strength of the members with intentional
flaws is about the same as that of the as-welded joints with the reinforcement
in place (no intentional defects).


-36-
3. At shorter 1 ives (less than 100,000 cycles), it appears that the
intentional internal weld defects in specimens with weld reinforcement removed
are more important than the external geometry of some as-welded joints, while
the external weld geometry appears to be more important at the longer 1 ives.
7.3 Crack Growth Study
Radiographic techniques were employed to determine the number of
cycles to crack initiation and subsequent propagation of fati~ue cracks in
butt welded joints of HY-80 steel. Because of the lack of sensitivity and
difficulty of interpretation of the radiographs, there is some uncerteinty as
to the time of initiation. Nevertheiess, c3 nUn)ber of conclu,>ions can be drawn
on the basis of the test results:
I. For a given stress cycl~ there appeared to be no consistent number
of cycles for the initiation of a macroscopic fatigue crack; rather, the
initiation appears to be a function of the type and geometry of the internal
weld defects, the location of the defect with respect to the cross section of
the weld, and the residual stresses.
2. Upon initiation of a fatigue crack, the duration of propagation was
found to fall within a relatively narr~~ range of cycles for a given level of
appl ied stress.
3. On the basis of the crack detection procedure used in these tests,
the number of cycles necessary to propagate the fatigue crack to the specimen
surface was found to be less than 50 percent of the total 1 ife.
7.4 Metallurgical Studies
A number of metallurgical studies have been conducted to evaluate
the effects of inclusions and welding restraint upon the qual ity of weld metal


-37-
in butt welds of HY-80 steel e The results of these studies may be summarized
as follows:
1. The restraint during \'lfelding of HY ... 80 steel produced hot cracks in
the heat affected zone of the weldment.
The degree of hot cracking appeared to increase with an increase
in the sulphur concentration of the steel.
2. "Buttering" of the beveled plates helped to prevent hot cracking in
the heat affected zone.
3. The hot cracks (microcracks) in the \'Ieldments did not appear. to
reduce the fatigue 1 ife of the members to any great extent.
7.5 General Summary and Conclusions
On the basis of the results of the various tests reported herein
several general observations may be made concerning the behavior of HY-80 and
HY-I00 steels and welded joints in these steels. These conclusions are as
fol lows:
1. Based on the average values of fatigue strength at 100,000 cycles
shown in the fol10\'Jing tabulation» plain plate members of !-IY-80 and HY ... I00
are found to have fatigue strengths considerably above that of mild structural
steel. However, the increase in fatigue strength for the butt welded joint
in HY-I00 is much smaller than that for the HY-80 steel.
Steel F100,OOO' Ksi (Zero-to-tension)
Plairi Plate Transverse Butt Weld*
Mild structural steel (~~TA-A7) 48.0 32.3
HY-80 65.6 57. )
HY-100 68.6 41.4
"k As-wel ded, re i nforcement on


-38-
The as-welded joint efficiencies under axial loading are seen to
range between 60 and 87 percent for the HY-I00 and HY-80 materials respectively.
2. Radiographic evaluations in HY-80 demonstrate that the test joints
~"'ere wi thi n Navy spec i f i cat ions 1 imi ts for poros i ty and slag. HO\-1ever II when
the \oJe 1 d re i nforcement was removed from members hav i ng fl aV'/s with j n the
specification 1 imits, their fatigue strength at 100,000 cycles was no better
than that of sound as-welded butt joints ",lith the reinforcement in place .
. 3. Prel iminary results of ultrasonic measurements for crack prop3gation
and detect ion in HY-80 suggest that th i s detect i on method» if it can bl~ full y
developed, may provide earl ier crack detection than radiographic ex~mination.
HO\'Jever, this can only be real ized through extensive developments in the
operational techniques.
4. The microcracks observed in the butt YJeld'~d Joints of HY· ... SO had
less effect on the fatigue resistance of t:le members than trie porosity and
slag inc1usions permitted by present inspect;on specifications.


-39-
BIBLIOGRAPHY
1. Sahga1, R. K. and Munse, W. H., "Fatigue Behavior of Axially Loaded Weldments in HY-80 Steel ," Univers ity of 111 inois, Department of Civil Engineering, Structural Research Series 204, Septembe r 1960.
2 . H art ma n n, A. J. and M u n s e, 'vi. H., I I Fat i g u e Be h a v i 0 r 0 f We 1 de d J 0 i n t s and We1dments in HY-80 Steel Subjected to Axial Loadings," University of Illinois, Department of Civil Engineering, Structural Research Series 250, July 1962.
3 . Z i mme r ma n, J ~ E., Jr., and M un s e, W. H., I I Fat i g u e Be h a v i 0 r 0 f Defective Welded Joints in HY-80 Steel Subjected to Axial Loading," University of III inois, Department of Civil Engineering, Structural Research Series 252, July 1962.
4. Hartmann, A. J., Bruckner, W. H., Mooney, J. and Munse, W. H., "Effect of Weld Flaws on the Fatigue Behavior of Butt-Welded Joints in HY-80 Steel," University of Illinois, Department of Civil Engineering, Structural Research Series 275, December 1963. .
5. Bureau of Ships, U. S. Navy, "Fabrication, Welding and Inspection of HY-80 Submarine Hu1Is," NAVSHIPS 250-637-3, January 1962.
6. L i u, H. W., IIC rack P ropagat ion in Th in Me ta 1 Shee t Unde r Repea ted Loading," University of !11 inois, Department of Theoretical and App] ied Mechanics, Report No. 155, December 1959.
7 . Lip sit t, H. A., For be s, F. W. and B a i rd, R. B., II C rack Pro p a gat i on i n Cold Rolled Aluminum Sheet," Proceedings, American Society for Testing and Materials, 1959.


Heat De sign at ion Thickness Numbe r (inches)
69S344 G 1 -1/2
N31543 Z 3/4
N15423 HY 3/4
I', 0.2 percent offset
TABLE 2.1
PHYS I CAL PROPERT lIS OF BASE METAL
(Data Suppl ied by Manufacturer)
Propert ies in the Longitudinal Direction
Y i e 1 d ";', Tensile Elong. Reduction Strength Strength in 2 inches in Area
(ks i) (ksi) (pe rcent) (percent)
88.5 108.3 22.6 69.2
90.0 109.2 25.3 70.4
110.0 127.5 23.0 71 .1
Charpy V-Notch ft~lbs.
@ -120oF
92 I
136 ..J::::. 0 I
83


Chemical
-41-
TABLE 2.2
CHEMICAL COMPOSIT!ON OF BASE METAL
(From Mil J Report)
Content Heat N umbe r (pe rcent) 69S344 N3l543
C 0.16 0.17
Mn 0,33 0.28
P 0.021 0.010
S 0.019 0.009
Si 0.26 0.27
Ni 2.86 2.29
Cr 1.61 1.31
. Mo 0.48 0.32
Cu 0.06
N15423
0.20
0.30
0.010
0.014
0.21
3.00
1.67
0.50
0.11


TABLE 3.1
RESULTS OF FAT I GUE TESTS OF HY-l 00' PLA I N PLATE SPEC I MENS
(Zero-to-Tension)
Computed Fatigue Strength~ ksi ... }(
Spec i men Stress Life Locat ion N umbe r Cycle (cycles) of F50 ,000 F100 ,000 F200 ,000 F500 ,000
(ksi) Fracture ,1\,',
HY-4 o to +80.0 46~400 a 78.3 63.5 51.7
HY-6 o to +80.0 57,100 f 83.1 67.6 54.8
HY-7 o to +76,5 81 ,200 f 88.4 71.7 58.4
HY-3 o to +50.0 1180> 100 f 73.5 59.7 48.4 36.8
HY-2 o to +50.0 ~~53,100 a 81.1 66.1 53.6 40.7
HY-5 o to +50.0 !546,300 a 102.5 83.2 67.5 51.3
Average 84.5 68.6 55.7 42.9
if,
k=0.30l ,.,,',
failure initiated at r~dius of test section a:
f: failure initiated at mill scale surface near radius of test section
I .p,. tv I


TABLE 3.2
RESULTS OF FATIGUE TESTS OF HY-IOO TRANSVERSE BUTT WELDS IN THE AS-WELDED CONDITION
(Zero-to-Tension)
II:;
Computed Fatigue Strength, ksi Spec i men Stress Life Loca t ion
Numbe r Cycle (cycles) of F20 ,000 F50 ,000 F100,000 F200 ,000 (ksi) F rac tu re-/c;lnlc;
HY-: 9 o to +80.0 45 700 b ( 4 5 , 1 ),1,,1(,
HY- 8 o to +80.0 5~400 b ( 4 7 . 7 )'1,,,,,
HY~ 10 o to +80.0 8,200 b (56.3 )'I,;\-
HY-13 o to +50.0 24,100 b (53 .8 )''n\'
HY-ll o to +50,0 61,500 c 77.7 54.3 41.3 31.4
HY-12 o to +50.0 61 ~ 800 c 77.9 54.4 41.4 31.5
HY-14 o to +30.0 2123500 c -------- 53.1 40.4 30.8
HY-15 o to +30.0 240,600 c -------- 55.2 42.4 32.2
Ave rage 77.8 54.2 41.4 31.5
,'\ k = 0.394
,~.};.!I,
not included in average; fatigue strengths were calculated only for sound welds i',/'~i'\
b: failure initiated in weld metal
c: failure initiated at edge of weld reinforcement
I ~ W I

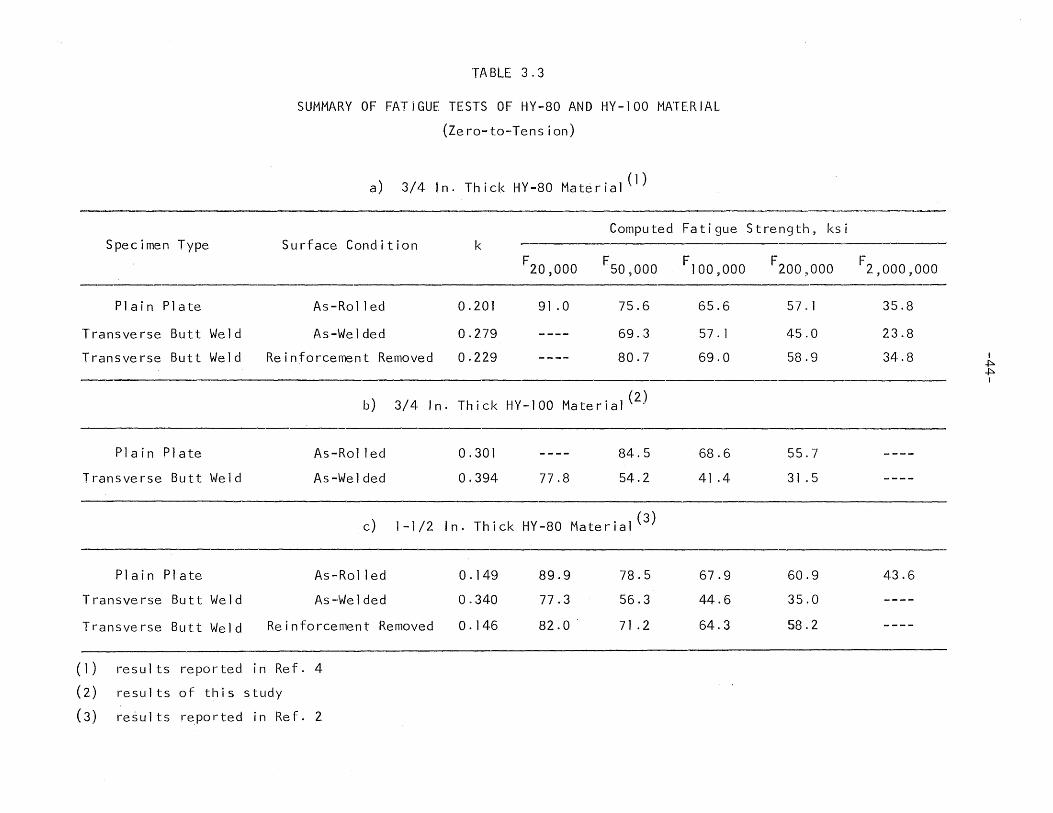
TABLE 3.3
SUMMARY OF FATIGUE TESTS OF HY-80 AND HY-IOO MATERIAL
(Zero-to-Tension)
a) 3/4 In. Thick HY-80 Material (1)
Computed Fatigue Strength, ksi S pe c i me n Type Surface Condition k
F20 ,000 F509000 F100sOOO F200 ,000
Plain Plate As-Roll ed 0.201 91.0 75.6 65.6 57. I
Transverse Butt Weld As-Welded 0.279 69.3 57.1 45.0
Transverse Butt Weld Reinforcement Removed 0,229 80.7 69.0 58.9
b) 3/4 In. Thick HY-IOO Material (2)
Plain Plate As-Ro 11 ed 0.301 84.5 68.6 55.7
Transverse Butt Weld As-Welded 0.394 77.8 54.2 41.4 31.5
c) 1-1/2 In. Thick HY-80 Material (3)
Plain Plate As-Rol led 0.149 89.9 78.5 67.9 60.9
Transverse Butt Weld As-'We I ded 0.340 77.3 56.3 44.6 35.0
Transverse Butt Weld Reinforcement Removed 0.146 82.0 71.2 64.3 58.2
( I ) results reported in Ref. 4
(2, ) results of this study
(3 ) re~ults reported in Ref. 2
F 2,000,000
35.8
23.8
34.8 I ~ ~ I
43.6


Spec i men Numbe r
G-82
G-89
G-84
G-85
G-83
G-81
G-87
G-86
G-88
,',
TABLE 4.1
RESULTS OF FATIGUE TESTS OF TRANSVERSE BUTT WELDS iN 1-1/2 IN. HY-80 STEEL
(Intentional Porosity in Weld)
_'~
Computed Fatigue Strength,A ksi S t res s Life Location Cycle (cycles) of
.. .1 ..... .1 ... F20 ,OOO F50,OOO F100 ?000 (ksi) Fracture
I .... , ..
o to +70.0 6,300 b 55.2 45.7 39.8
o to +70.0 6,700 b 55.9 46.4 40.2
o to +70.0 7 ~ I 00 b 56.6 46.9 40.6
o to +70.0 7)900 b 57.8 47.9 41.5
o to +70.0 10,900 b 61.8 51.2 44.4
o to +50.0 22,800 b 51.3 42.7 36.9
o to +50.0 39~nOO b 57.5 47.6 41.4
o to +50.0 53.,600 b 61.0 50.7 44,0
o to +50.0 56:1 000 b 61.8 51.2 44.4
Average 57.7 47.8 41.5
k = 0.210 ,'"I,
b: failure initiated in weld metal
I .p. U1 I


Spec i men Stress Numbe r Cycle
(ksi)
G-82 o to +70.0
G-89 o to +70.0
G-84 o to +70.0
G-85 o to +70,0
G-83 o to +70.0
G-81 o to +50.0
G-87 o to +50.0
G-86 o to +50.0
G-88 o to +50.0
TABLE .4.2
RESULTS OF DEFECT EXAMINATION OF TRANSVERSE BUTT WELDS IN 1-1/2 IN. HY-80 STEEL
(Intentional Porosity in Weld)
-;I~/I\ Defective Area, Percent
d Radiographic e ,I.
( i 11.» Based on Based on Rating"
Radiograph Fracture Surface
0.035 0.027 0.080 P
0.051 0.248 0.115 P
0.053 0.045 0.285 P
0.065 0.050 0.250 P
0.039 0.219 0.058 P
0.046 0.088 0.129 P
0.067 0.219 0.334 F
0.064 0.180 0.184 P
0.046 0.158 0.282 F
... ),
based on radiographic requirements of Navy Specifications(5) ...,',...,1,
effective diameter of largest pore in porosity clusters
Description of
Defect
one c I us te r
one cluster
one cluster I
one cl uster -J::>. (J) I
one c 1 us te r
two clusters; offset in the direction of stress
one c 1 us te r
one cluster
two clusters; offset in the di rection of stress

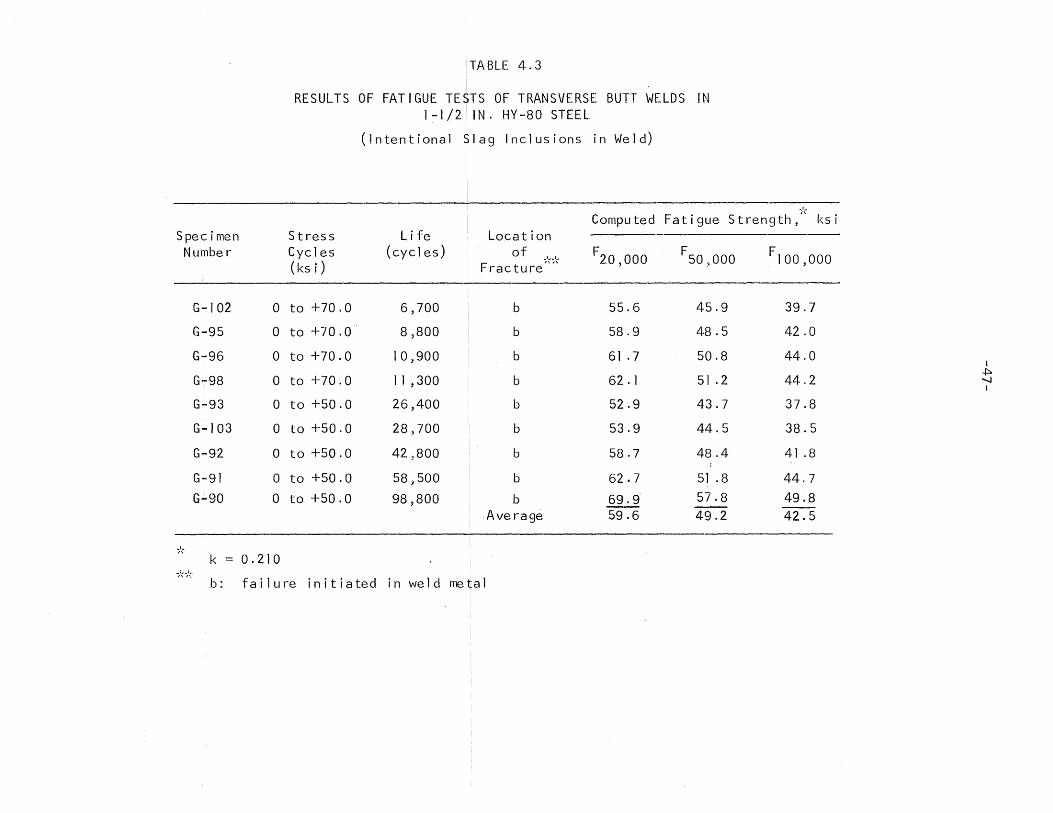
Spec i men N umbe r
G-102
G-95
G-96
G-98
G-93
G-103
G-92
G-91 G-90
...,',
TABLE 4.3
RESULTS OF FATIGUE TESTS OF TRANSVERSE BUTT WELDS IN 1~1/2 IN. HY-80 STEEL
(Intentional Slag Inclusions in Weld)
-'. Computed Fatigue Strength," ksi
Stress Life Location Cycles (cycles) of
.......... 1,., F20 ,000 F50~000 FIOO,OOO (ksi) Fracture
, ... , ...
o to +70.0 6,700 b 55.6 4~). 9 39.7
o to +70.0 8 j 800 b 58.9 48.5 42.0
o to +70.0 10,900 b 61.7 50.8 44.0
o to +70.0 11,300 b 62. I 51.2 44.2
o to +50.0 26,400 b 52.9 43.7 37.8
o to +50.0 28,700 b 53.9 44.5 38.5
o to +50.0 42~800 b 58.7 4B.4 41.8
o to +50.0 58 j 500 b 62.7 51 .8 44,7
o to +50.0 98,800 b 69.9 57'.8 49.B Ave rage 59.6 49.2 42.5
k = 0.210 it,,':.:
b: failure initiated in weld metal
I ,.p. '-I I


Specimen N umbe r
G-l02
G-95
G-96
G-98
G-93
G-I03
G-92
G-91
G-90
TABLE 4,4
RESULTS OF DEFECT EXAMINATION OF TRANSVERSE BUTT WELDS IN 1-1/2 IN. HY-80 STEEL
(Intentional Slag Inclusions in Weld)
Defective Area, Percent Stress Radiographic Cycle Based on Based on Rat i ng,l, (ksi) Radiographs Fracture Surface
o to +70.0 l.49 1.00 F
o to +70.0 0.022 0.025 P
o to +70.0 0.340 0.394 F
o to +70.0 0.349 0.040 P
o to +50.0 0.163 P
o to +50.0 0.688 0.027 F
o to +50.0 0.271 0.054 P
o to +50.0 0.258 0.076 F
o to +50.0 0.041 0.055 P
.. /~ based on radiographic requirements of Navy Specifications(5)
Description of
Defect
2 defects
2 defects I
+:0-ro I
defect not visible on X-ray
2 defects
porosity + slag

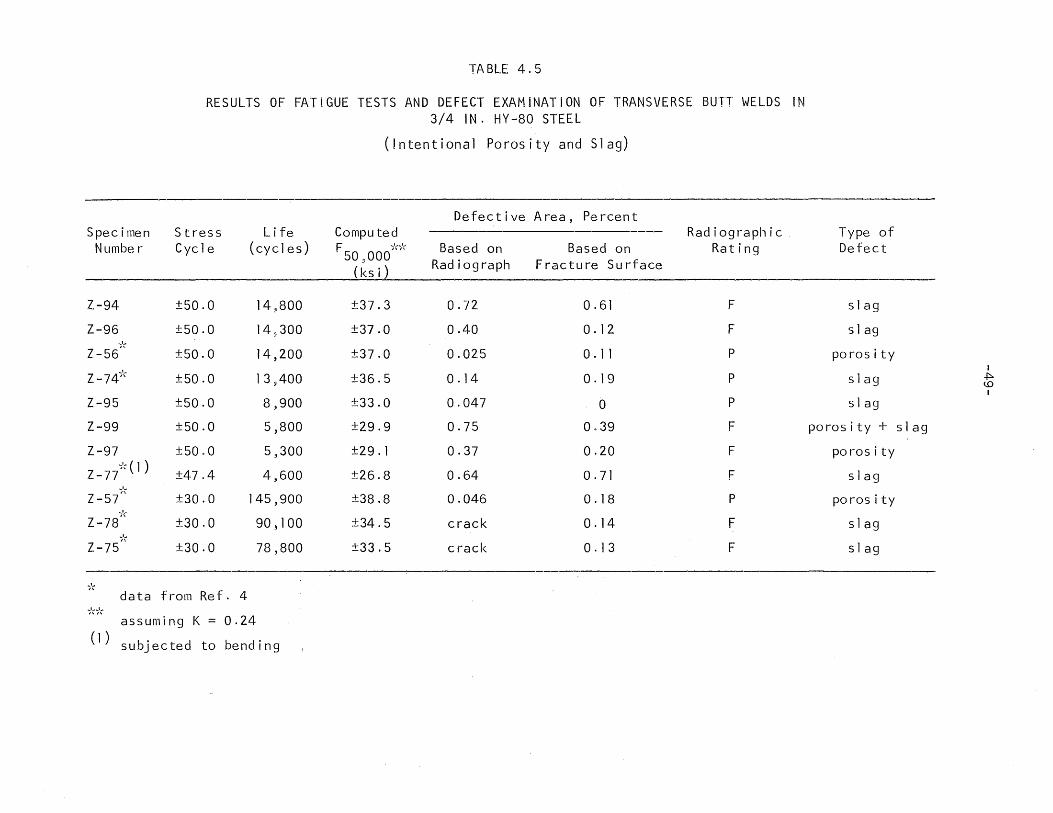
TA BLE 4.5
RESULTS OF FATIGUE TESTS AND DEFECT EXAMINATION OF TRANSVERSE BUTT WELDS IN 3/4 IN. HY-80 STEEL
(Intentional Porosity and Slag)
Defective Area, Percent Specimen Stress Life Compu ted Radiographic
Numbe r Cycl e (cycles) F ,S\i'~ Based on Based on Rating ·50 sOOO Radiograph Fracture Surface (ksi)
Z-94 ±50.0 14,800 ±37.3 0.72 0.61 F
Z-96 ±50.0 145300 ±37.0 0.40 0.12 F ';'~
Z-56 ±50.0 14,200 ±37.0 0.025 0.11 P
Z -74-,',: ±50.0 13,400 ±36.5 0.14 0.19 P
Z-95 ±50.0 8,900 ±33.0 0.047 0 P
Z-99 ±50.0 5,800 ±29.9 0.75 0.39 F
Z-97 ±50.0 5,300 ±29.1 0.37 0.20 F
Z-77 'k (l )
±47,4 4,600 ±26.8 0.64 0.71 F ~/;
Z-57 ±30.0 145,900 ±38.8 0.046 0.18 P ,'r
Z-78 ±30.0 90 ~ 1 00 ±34.5 crack 0.14 F ~/::
Z-75 ±30.0 78,800 ±33.5 crack 0.13 F
,'\ data from Ref. 4
i'\'i~\
assuming K = 0.24
(I) subjected to bending
Type of De fec t
slag
slag
poros i ty I
slag .p.. ill I
slag
porosity + slag
porosity
slag
porosity
slag
slag

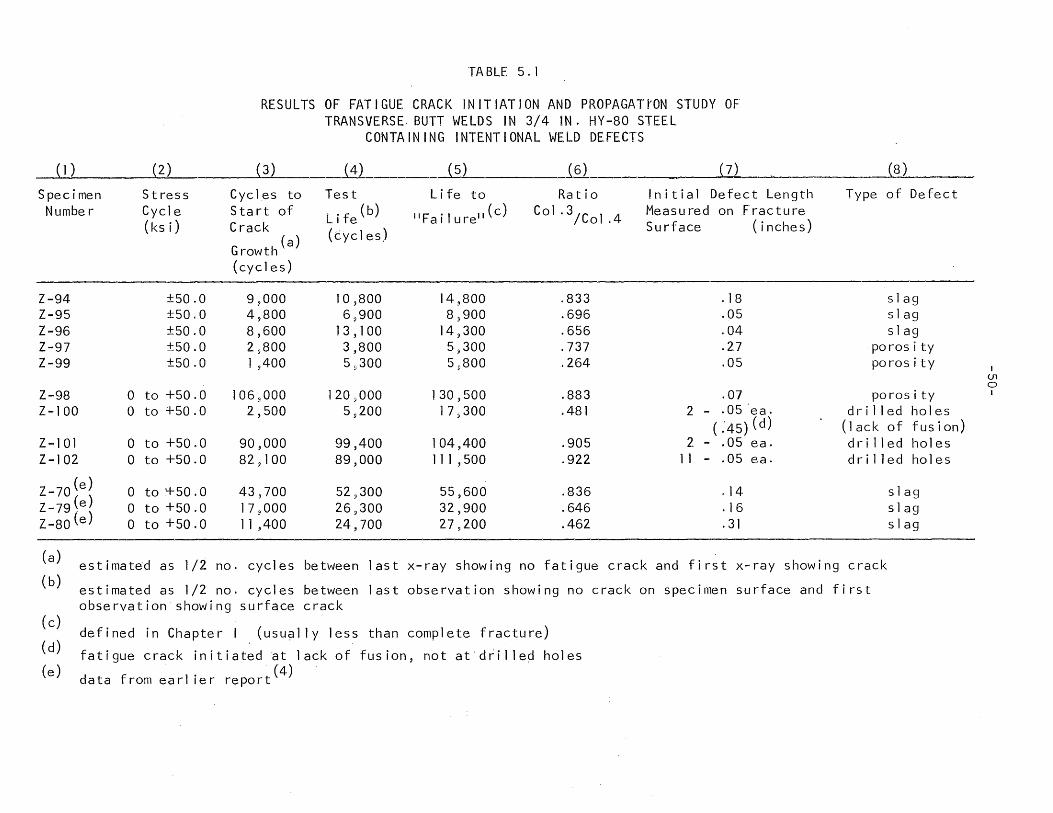
{I ) {2)
Spec i men S t res s Numbe r Cycle
(ksi)
Z-94 ±50.0 Z-95 ±50.0 Z-96 ±50.0 Z-97 ±50,0 Z-99 ±50.0
Z-98 o to +50.0 Z-IOO o to +50.0
Z-101 o to +50.0 Z-102 o to +50.0
Z-70(e) o to ~50. 0 Z-79~e) o to +50.0 Z-80(e) o to +50.0
TABLE 5.1
RESULTS OF FATIGUE CRACK INITIATION AND PROPAGATI'ON STUDY OF TRANSVERSE, BUTT WELDS IN 3/4 IN. HY-80 STEEL
CONTAINING INTENTIONAL WELD DEFECTS
{3) {4) { 5) {6) {7~
Cycles to Test Life to Rat i 0 Initial Defect Length Start of Life(b) "Fa i I ure" (c) Col.3/Col ,4 Measured on Fracture Crack (cycles)
Surface (inches) (a)
Growth (cycles)
9,000 10~800 14,800 .833 .18 4,800 6,900 8;;900 .696 .05 8,600 13,100 14,300 .656 .04 2,800 3,800 5~300 .737 .27 1 ,400 5,300 5~800 .264 .05
106,000 120;;000 130,500 .883 .07 2,500 5,200 1 7 ~ 300 ,481 2 - .05 "ea.
(:45)(d) 90,000 99,400 104,400 .905 2 - .05 ea. 82,100 89,000 111,500 .922 II - .05 ea.
43,700 52,300 55,600 .836 .14 17~000 26?300 32,900 .646 .16 11,400 24,700 27,200 .462 .31
{8 )
Type of De fec t
slag slag slag
porosity poros i ty
porosity drilled holes
(lack of fusion) d rill ed ho 1 es dril led holes
slag slag slag
(a)
(b) estimated as 1/2 no. cycles between last x-ray showing no fatigue crack and first x-ray showing crack
estimated as 1/2 no. cycles between last observation showing no crack on specimen surface and first observation showing surface crack
(c)
(d)
(e)
defined in Chapter I (usually less than complete fracture)
fatigue crack initiated ~t lack of fusion, not at"drilled holes
data from earlier report(4)
I (J1 0 I

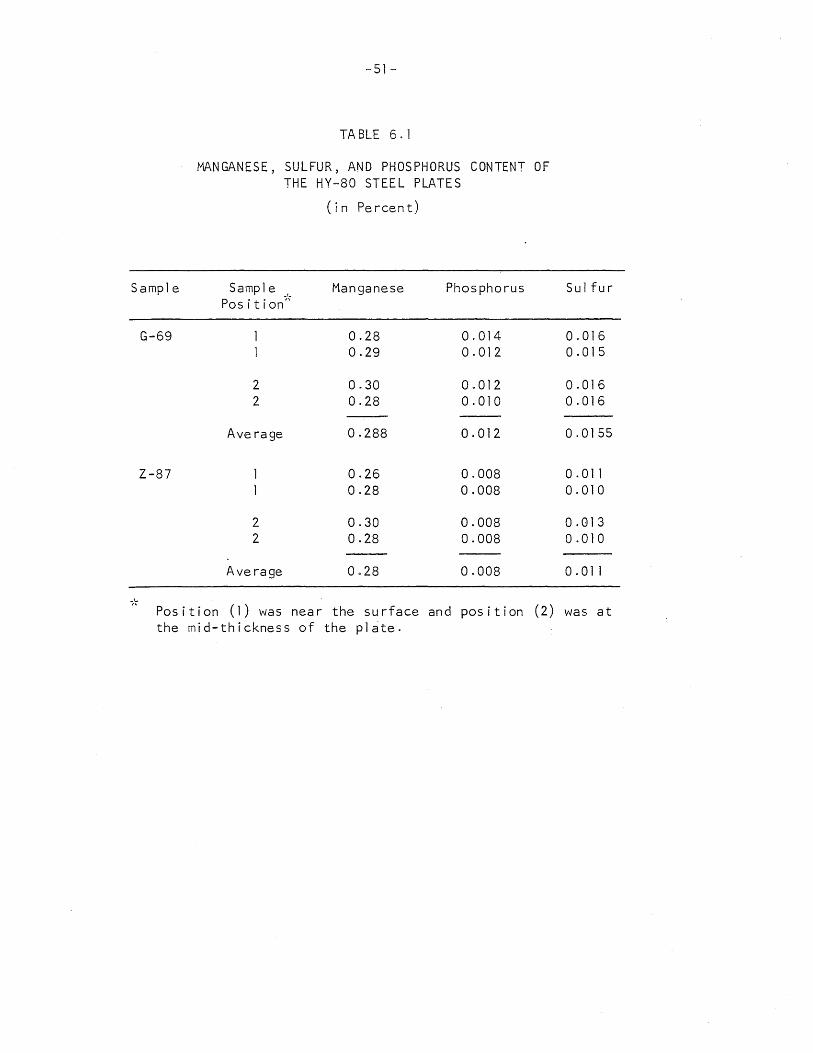
-51-
TA BLE 6.1
MANGANESE, SULFUR, AND PHOSPHORUS CONTENT OF THE HY-80 STEEL PLATES
( in Pe rcen t)
Sample Samp 1 e ;'~
Manganese Phosphorus Position
G-69 0.28 0.014 0.29 0.012
2 0.30 00012 2 0.28 0.010
Ave rage 0.288 0.012
Z-87 0.26 0.008 0.28 0.008
2 0.30 0.008 2 0.28 0.008
Average 0028 0.008
,': ( 1 ) Position was near the surface and position (2)
the mid-thickness of the plate.
Sulfur
0.016 0.015
0.016 0.016
0.0155
0.011 0.010
0.013 0.010
0.011
was at

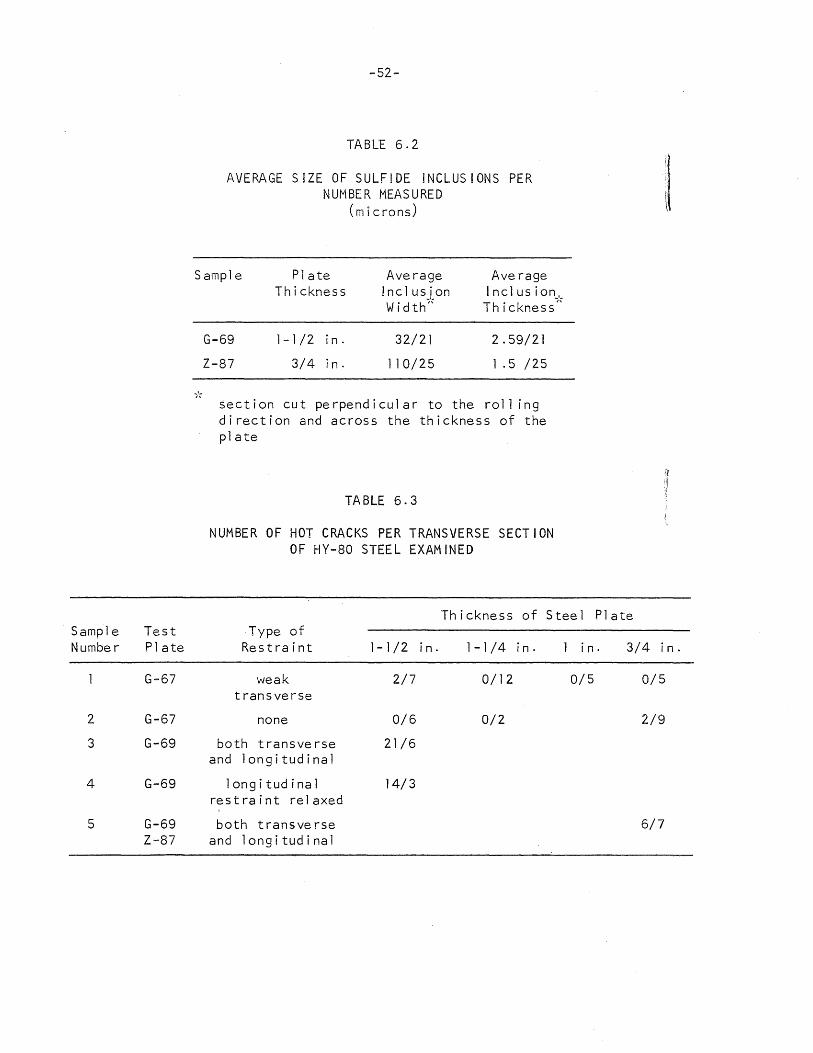
Sample Test Numbe r Plate
G-67
2 G-67
3 G-69
4 G-69
5 G-69 Z-S7
-52-
TABLE 6.2
AVERAGE SIZE OF SULF!DE INCLUSIONS PER NUMBER MEASURED
(microns)
S amp 1 e Plate Average Average Thickness !nc1usion I nc1 us ion",
~'-Width" Thickness
G-69 1-1/2 in. 32/21 2.59/21
Z-S7 3/4 in. 110/25 1 .5 /25
sec t ion cut pe r pe n d i c u 1 art 0 the r 0 1 1 i n g direction and across the thickness of the plate
TABLE 6.3
NUMBER OF HOT CRACKS PER TRANSVERSE SECTION OF HY-SO STEEL EXAMINED
Thickness of Steel Plate Type of
Restraint 1-1/2 in. 1-1/4 in. 1 in. 3/4 in.
weak 2/7 0/12 0/5 0/5 transverse
none 0/6 0/2 2/9
both transverse 21/6 and longitudinal
longitudinal 14/3 restraint relaxed
both t ransve rse 6/7 and longitudinal

.. /~ Samp 1 e
2
3
4
-53-
TABLE 6.4
AVERAGE LENGTHS Of HOT CRACKS (M. ill i me te rs)
Thickness of HY-80 Steel Plate
1-1/2 in, 3/4 in.
0.02
0.02
0,03
0.02 0.04
same samples as shown in Table 6.3
TABLE 6.5
LENGTHS OF HOT CRACKS NOT ASSOC!ATED WITH INCLUSIONS (M ill i meters)
Thickness of HY-80 Steel Plate ."
S amp] e 1-1/2 in, 3/4 in.
3A 13 crack a 0.08 crack b 0.11
3Al 0.20
4D5 0.26
2D10 0.50
All samples were from the 1-1/2 in. thick G-69 test plate, Thel-l/2 in. thick samples were cut down on one side in 2D10 and on both sides 4D5.
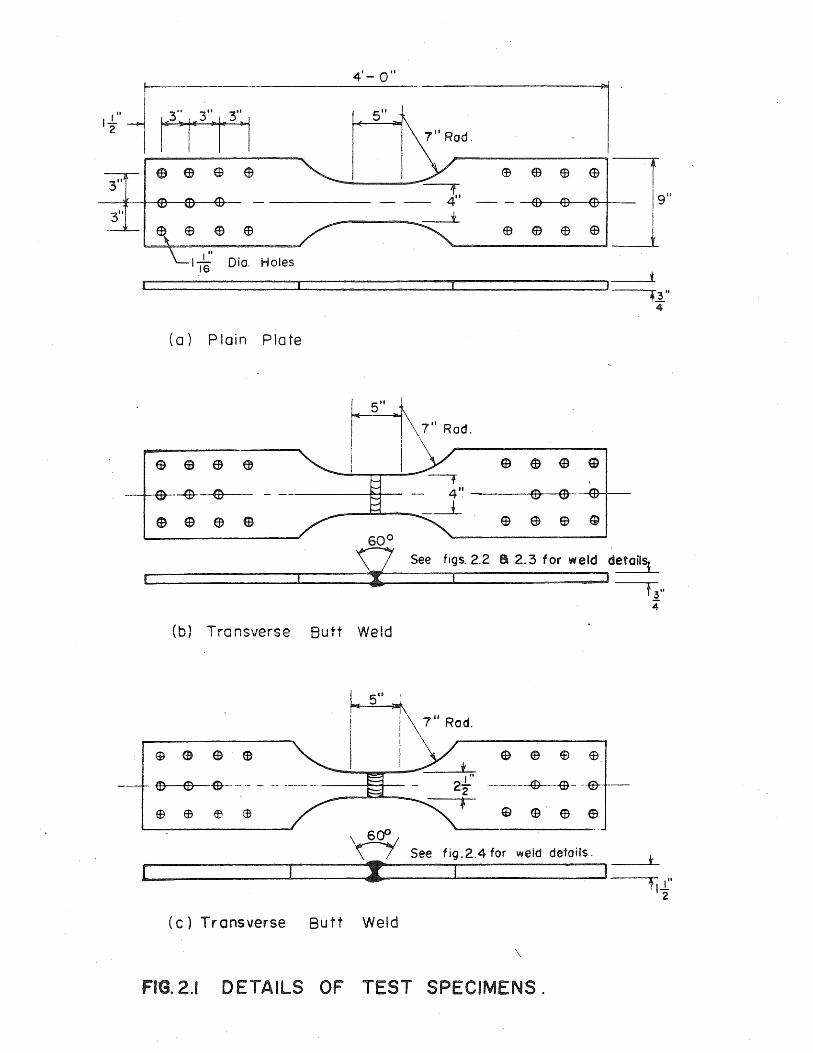
3"
4'- a"
5"
----r--------- 4"
I" I T6 Dio. Holes
(a) Plain Plate
ED CD e e G (1) -+(01+--
e e e e
__ -----:---.i.
'd r ~1\7"Rod. I i \ ! I Gl e (9 ~
1 I
t
D See flgs.2.2 8 2.3 for weld detail,;
L-____________ ~ ______ ~~------~------------~I-~ t 1"
4
(b) Transverse Butt Weld
~ 5" ~ I \\ 7 11
Rod.
I -----e---e~-~---e~.
. CD e $----.--- - - - ------ -- ---f'-1- ------.. -~-_e--.e_ --
(9 (D' e e
J See fig. 2.4 for weld details.
*
(c) Transverse Butt Weld
\
FIG. 2.1 DETAILS OF TEST SPECIMENS.

3' T
,.. 4" Test Section ... ,
J I ...
:3 I I - I
! I I ! I I I 2 I I ...
I : I , . 6
I. 6" Continllous Weld Passes .. I Root opening 13 in. Arrows indicate direction of weld ing.
Surface of plate adjacent to weld cleaned by grinding before welding.
Pass Electrode size, in. Current, amps. Rote of travel, in. / min.
I
2
3
4
5
6
i 32
c· ~ '-
2-16
l 16
l 16
l 16
Voltage :21 Volts
Polarity: D.C. Reversed
Preheat: 1500
F
Electrode: MIL 11018
130
140
230
220
210
210
I nterpass Temperature: 2000
F (Maximum)
Heat Input: 40,000 Joules/ in. (Maximum)
All welding in flat position
Underside of pass I glound before placing pass 2
5
5
8
7
7
1
FIG.2.2 WELDING PROCEDURE P80-IIOI8 .... A (Transverse Butt Welds in HY- SO)
~
5
4

3
2
6 i
~l-Root opening t In
l ! .... I I I I I I I .. I I I I I I ...
I I I
I
II 6" ContInuous Weld Passes i ~~.--------------------------~
Arrows Indicate direction of welding
Surface of plate adjacent to weld cleaned by grinding before welding
Pass Electrode size, In Current, amps Rate of travel, In. / mrn
I
2
3
4
5
6
i 130 5 32
..5 140 5 32 -
l 230 8 16
.l 220 7 16 _.- .-
3 210 7 IS --~-~ ~ 210 7 16
VOl tage . 21 Volts
Polarity. o C. Reversed
Preheat 1500
F
Electrode MIL 11018
I nterpass Temperature 2000
F (Maximum)
Heat Input 40,000 Joules/ In (Maximum)
All welding in flat position
Underside of pass I ground befGfe pioc,ng pass 2
FIG.2.3 WE LDING PROCEDURE PIOO-1I0IS-J (Transverse Butt Welds in HY-IOO)
I
I
5
4

° 60
2
4
6
8,10
12,14,16
18,20,22,24
, .. 2't" Test Section _I
I , I
J I I
1 ~
I J I I
J I I
I I I I I I
I
I I
I I I I
4" Continuous Weld Posses'
17,19,21,23
11,13,15
7,9
5
I
3
Roo t opening ~ in. Arrows indicate direction of welding.
Surface of plate adjacent to weld cleaned by grinding before welding.
Pass Electrode size, in. Current", amps. Rate of travel, in./min.
1 5 140 4 32
2 3 230 6 16
3 5 160 4 32
4-16 3 230 6 16
17-24 3 16
Vol toge: 21 Volts
Polarity: D. C. Reversed o
Preheat: 200 F
Electrode: MIL 11018
200
interposs Temperature: 200°F (Maximum)
Heat Input: 50,000 Joules I in. (Maximum)
All welding in flat position.
5
Underside of pass I bock-gouged with oi r arc before pass 3.
FIG.2.4 WELDING PROCEDURE P80-IIOI8-D (Transverse Butt Welds in HY .... 80)
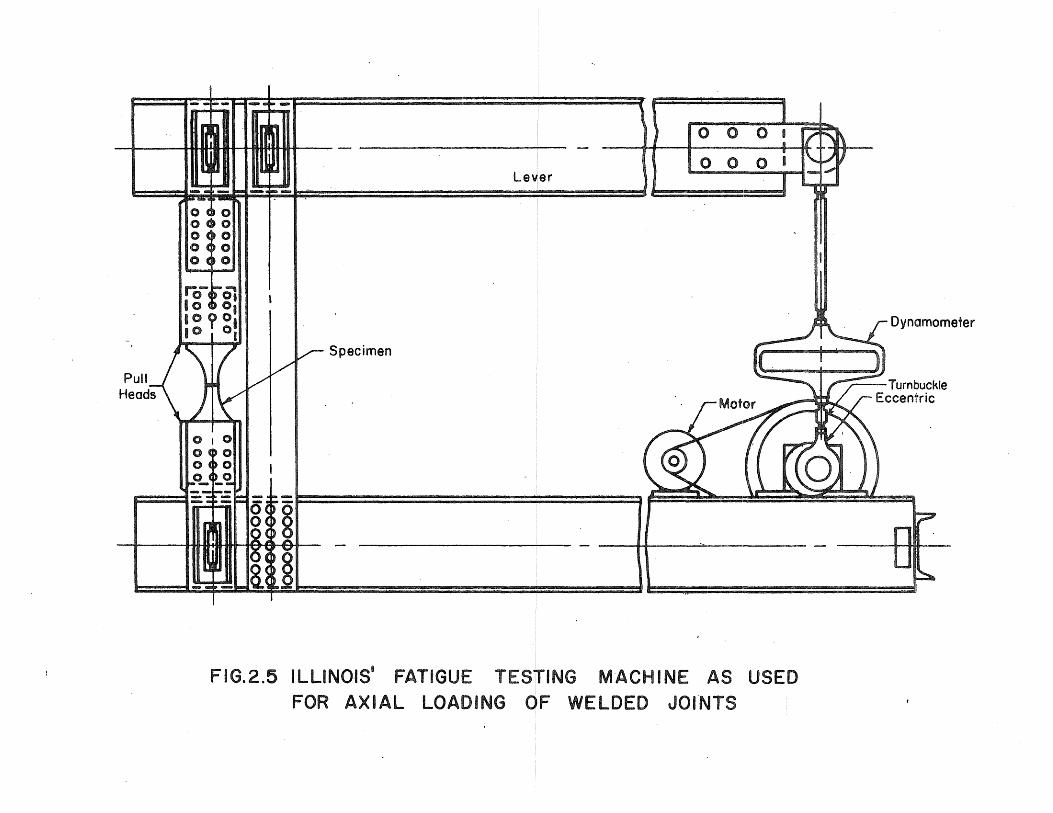
Lever
Specimen
FIG.2.5 ILLINOIS· FATIGUE TESTING M-ACHINE AS USED FOR AXIAL LOADING OF WELDED JOfNTS
Dynamometer

0) BASE METAL. (230X MAGNIFICATION)
b) HEAT AFFECTED ZONE. (230X MAGNIFICATION)
F IG.3.1 TYPICAL PHOTOMICROGRAPHS OF TRANSVERSE
BUTT WELD IN 3/4 IN. HY ... 80 MAT ERIAL.

0) BASE METAL. (230X MAGNIFICATION)
b)H'EAT AFFECTED ZONE. (230X MAGNIFICATION)
FIGs3.2 TYPICAL PHOTOMICROGRAPHS OF TRANSVERSE
BUTT WELD IN 3/4 IN. HY-IOO MATERIAL.

100 I --,....---
I I
--1-----1--'---
~ ~ ---- j --~-.... 1'- __ --.. N~ -- -~ ~ 1;::-- .. , .... ~ . .-
~
~ r- r-k=O.20 -- - /
80
60
40 (J)
- ~ --- '-' V ~
-- .. -.J. 1- .... ~ ~ .. r0- t--
k = 0.30-./ ......... r--- -- -- I"'"- __ ..
'-.lC:
(J) (J)
Q) .... -(J)
E 20 ::::J
E )(
0 ~
10 I _. Stress Cycle: Zero-to- Tension
- 0 3"
HY-IOO 4 8
- 3" ----- "4 HY- 80 r- ,
See Fig. 2.10 for specimen detoi Is 6
-' I I 1-i--sts- 1
20 40 60 8 I Do 200 400 ,
60 5
000
Cycles To Failure, In Thousands
FIG. 3.3 RESULTS OF FATIGUE TESTS OF AS - ROLLED HY-IOO PLAIN PLATE SPECIMENS.
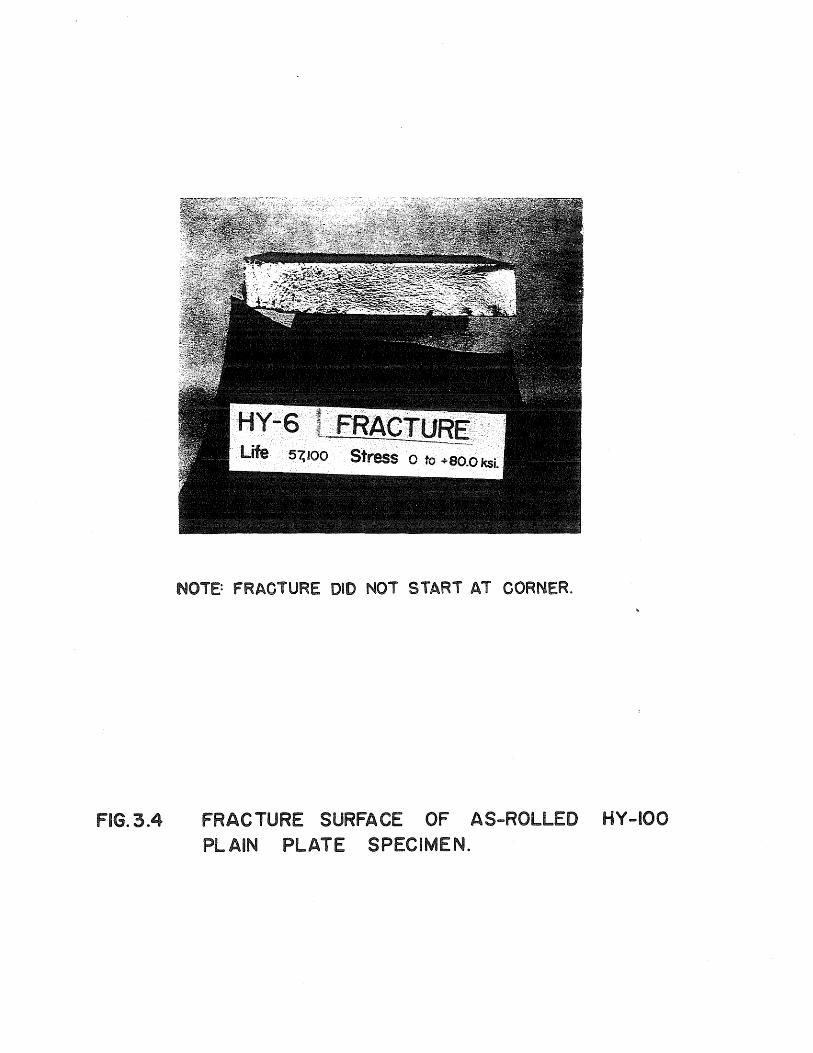
NOTE: FRACTURE DID NOT START AT CORNER.
FIG.3.4 FRACTURE SURFACE OF AS-ROLLED HY ... IOO PLAIN PLATE SPECIMEN.

100
80
60
40 (f)
..::c.
(f)
(f)
G,) b. -(J)
E 20 :J E )(
0 ~
10
8
6
5.
-
-lw --- ...... .. ---
~ ~ -.-~--- r----- f--. -- " --1-- - .......
"' ........ ...... V-- k = 0.297 --r-- -_.
~ .... r--.
/ W ~ r---- ......... 1-,0,. ........ ~ ~ ................
~ ~ .........
r-.... ""
......... ""'" V ~ .........
r--....... .... k = 0.394 r--~ ~
W: Indicates failure in weld
- Stress Cycle: Zera - to - Tension
--
r-
2
3" 0 HY-IOO "4
---- ~" HY-80 4 See Fig. 2.lb for specimen details
_1 I 1 I I I I
4 6 8 10 20 40 60 80 100 200
Cycles To Failure, In Thousands ,
FIG. 3.5 RESULTS OF FATIGUE TESTS OF HY-IOO TRANSVERSE BUTT WELDS IN THE AS-WELDED CONDITION.
j ---,
I
I
i
I
- I
J I I
~ .......
600

a) FAILURE INITIATED AT EDGE OF WELD REINFOR CEMENT.
b) FAILURE INITIATED IN WELD.
FIG.3.6 TYPICAL FRACTURES OF TRANSVERSE BUTT
WELDS IN 3/4 I.N. HY-IOO MATERIAL.
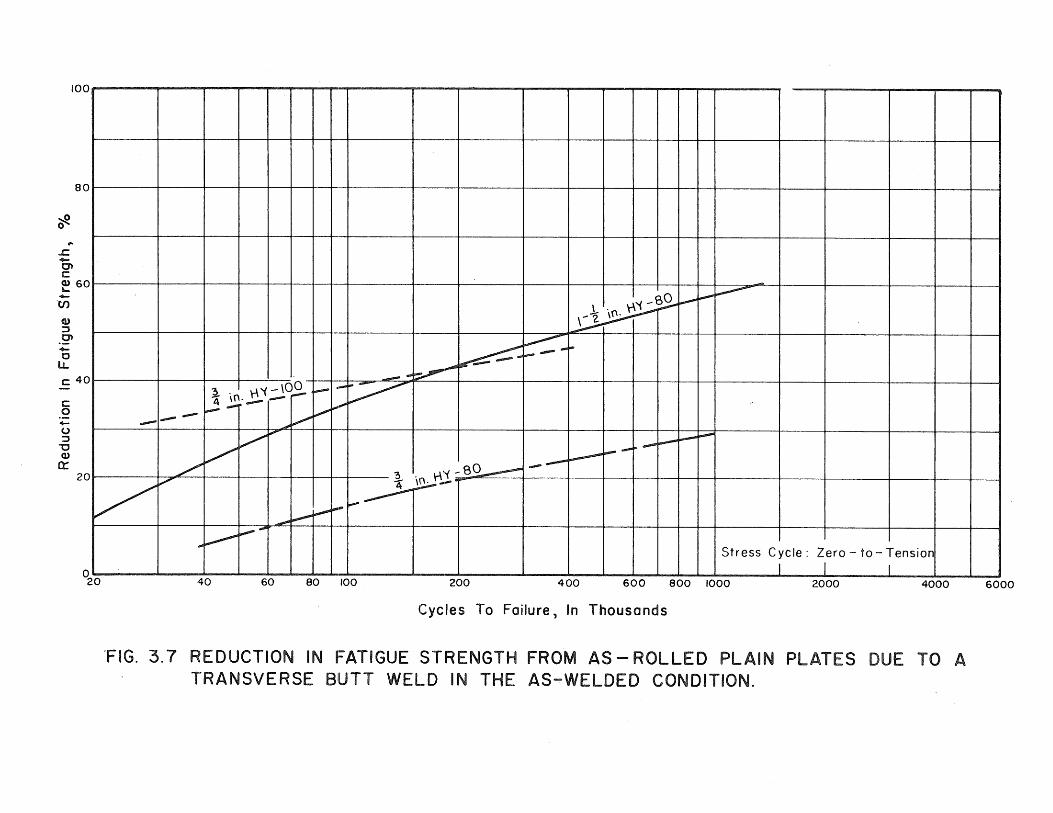
100
80
~ o
.c -tJ') c: Q) 60 '--V>
GJ ::J tJ') -o
LL
c: 40
c: o -(.) ::J -0 Q)
Q: 20
.... -~----·~-r~~~TT~--I- I _
1=U~~~~~IT~ r-
-
-'0 ,..-'--"'-
I 'r\'{-~...--.L~~ _ \- 2. __ i
~ ~"'F" I
--,"" -....-I L 1"'- -~~ 1 ___ +--t-.::--.11--:-:-\-\-::;'(-=_ \\(O~ ~ ...... --~
~ \n· __ ....... 1 ~ .... ~ - I-- .-, , ___ / _>--r-- .. ...- '- -,--..... _r _
~ 1~~~_~:~~=4~-+-tt1----t-~----r-~--./ Ll'i~O __ ~~ ~ \n. ,!.-.,....... L_ ~ _
... f'" --- I I
./ --I--'"" I-"" I Z to Tension /' -- Stress Cycle: ero ~ -f.---~ - 1 1 1
... , o 20 40 60 80 100 200 400 600 800 1000 2000 4000
Cycles To Failure, In Thousands
'FIG. :3.7 REDUCTION IN FATIGUE STRENGTH FROM AS - ROLLED PLAIN PLATES DUE TO A TRANSVERSE BUTT WELD IN THE AS-WELDED CONDITION.
6000

(I)
..lI::
(I) (I)
Cl) .... -en E :::J E )(
0 ~
100r.------~----~--,_--r_Ir~_,~------_r----,_----·--._--_,----r__.--.__._._.------II----u_------r----.---,---,
801 I ~ I 1- i':: I I I I I I ~~
60
4--I-k = 0.21
40
~1-4-
20
101 I I t Stress Cycle
8[ Zero - to - Tension
6+-See Fig. 2.lc for specimen details
5' I I I I I I ~ I ~ ~ I I I I I g 2 4 6 8 I 20 4 6 80 100 200 400 600
. Cycles To Failure, In Thousands
FIG. 4.1 RESULTS OF FATIGUE TESTS OF 1-1/2 IN. TRANSVERSE BUTT WELDS CONTAINING VARIOUS AMOUNTS OF INTENTIONJ~L POROSITY (REINFORCEMENT REMOVED).

FIG.4.2
a) POROSITY IN WELD.
b) SLAG IN WELD.
TYPICAL FRACTURES FOR 1-1/2 IN.
TRANSVERSE BUTT WELDED JOINTS
CONTAINING INTENTIONA INTERNAL
WELD DEFECTS.

-c: Q)
E Q)
0 to-O -... c: 'w
0::
..c. -'i en
3.2 Q)
~ "'0 c ~ 0
(f)
-... 0
0 0 0 ..
8 lJ...
\6-
0 "'0 - Q) c > Q) 0
0 E "-OJ OJ
a.. a::
100
90
80 I
70
60
Stress Cycle
r- Zero - to - Tension
Note: Diameter is based on maximum
--~~ 50 o
pore on fracture surface. I I I I
0.01 0.02
,
(Butt Welds - As· Welded) 0 0 0
u u
) o 0
0
0.03 0.04 0.05 ~ 0.06 0.07 0.08
Effective Defect Diameter, in.
FIG. 4.3 PERCENT FATIGUE STRENGTH AT 100,000 CYCLES VS. EFFECTIVE DEFECT DIAMETEH OF POROSITY IN 1-1/2 IN. MATERIAL.

100
CI) 80 ~
~
CI)
CD
~ U
o o 60 o .. o o .... o
:E 40 D C CD t... ....
(f)
QI :::s 0-. -~ 20
1)~ <)
C
------
Stress Cycle
Zero - to - Tension
Note: Area is based on the defect
o .02
area shown on radiograph.
.04 .06 . .08 10
(Butt Welds - Reinforcement Removed)
00 0 (Butt Welds - As . Welded)
0 .....,
~-1---r--'
20 .40 .60 .80 1.0 2.0 4.0
Percentage of Defective Area, % (A red )
FIG. 4.4 COMPUTED FATIGUE STRENGTH AT 100,000 CYCLES vs. DEFECTIVE AREA DUE TO INTENTIONAL. PCROSITY IN 1-1/2. IN. MATERIAL.
6.0
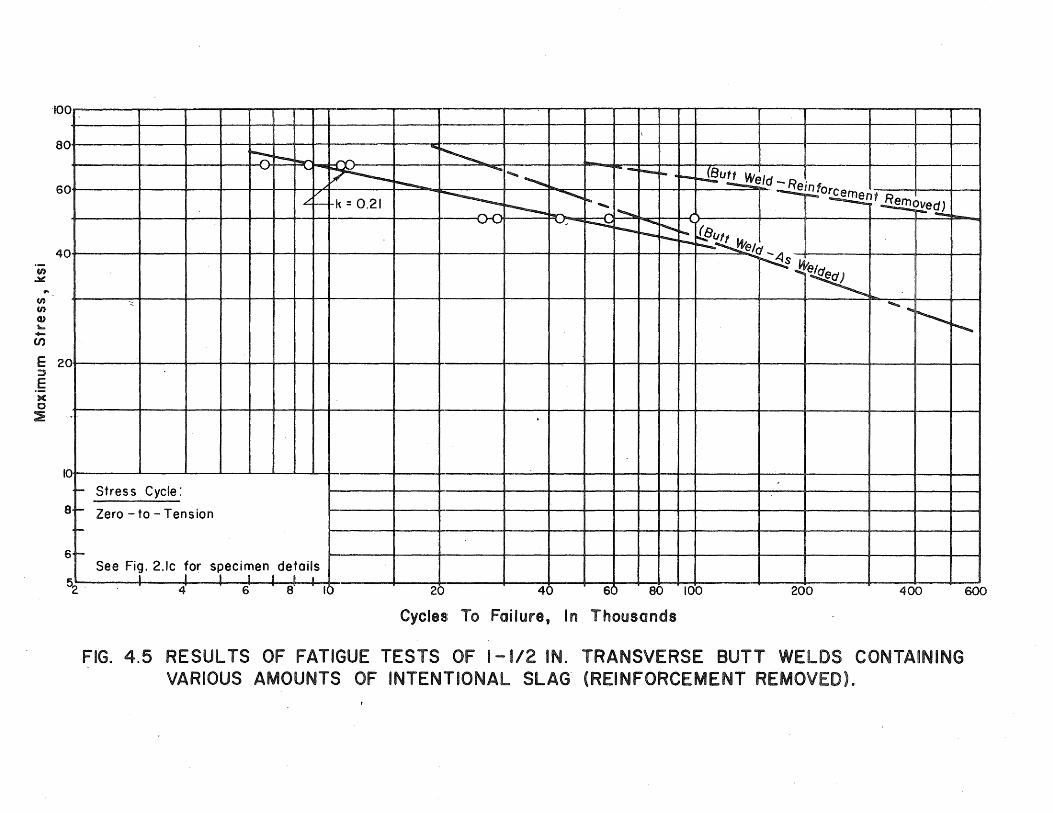
en .lII::
U) U)
100r-=r--------r----~----~--~~--,_~~--------~-----~------~r_----r_--_r--_r--,_~--r_~-------~----~:-------~----_r----r__,
80
40+--
~ I I -00 I I E 20t--
-I"+-::J
E )(
o ~
,0~----~--1---L-JL-L-1-L4------~--_+----_4--~~_t--t_i_i_t_r_----t_~1l----_t--~--1I~ t- Stres s Cycle:
8-1- Zero - to - Tension I-
6+-See Fig. 2.lc for specimen details
52 . .i_~_ I __ I J _ I I
4" 6' S" . 10 40 20 80 100 60 200 400
Cycles To Failure, In Thousands
FIG. 4.5 RESULTS OF FATIGUE TESTS OF 1-1/2 IN. TRANSVERSE BUTT WELDS CONTAINING VARIOUS AMOUNTS OF INTENTIONAL SLAG (REINFORCEMENT REMOVED).
600
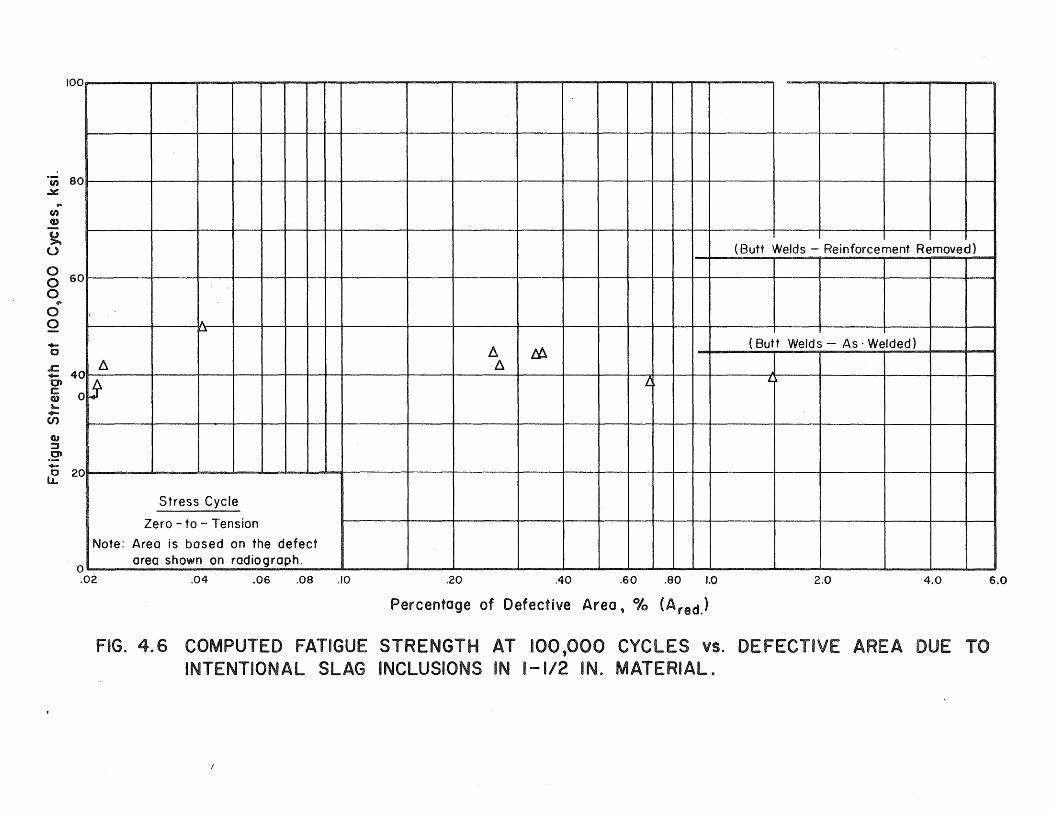
/00
CI) 80 .lI: .. CI)
CD
~ U
o o 60 o
flO
o o .... o
.c:. ~ 40 c Q) 0 '-.... en OJ :::J .~ -~ 20
lA IU
b.
~
Stress Cycle
Zero - to - Tension
Note: Area is based on the defect
o .02
_~grea show~~ __ !adiog~aph. .04 .06 .08 ./0
-
(Butt Welds - Reinforcement Removed)
b. fA (Butt Welds - As' Welded)
b. l. L
--'----~~~ -~ '---------------~ '--------
.20 .40 .60 .80 1.0 2.0 4.0
Percentage of Defective Area, % (A red)
FIG. 4.6 COMPUTED FATIGUE STRENGTH AT 100,000 CYCLES vs. DEFECTIVE AREA DUE TO INTENTIONAL SLAG INCLUSIONS IN 1-1/2 IN. MATERIAL.
I
I
6.0

100
en 80 ~
... en Q)
~ U
o o 60 o ci
__ N 0
-C
.t::. - 40 en c Q) '--UJ
W ::J .2' -0 20 LL
.,
(Butt Welds - Reinforcement Removed)
(Butt Welds - As' Welded)
" -bt. J.P.
~
Do Do
~ bt. f.
Stress Cycle
Zero - to - Tension
Note: Area is based on the defect
o .02
area show~ on ~CJdi9grc:Je~~ ___ ~ -~-
.04 .06 .08 .10 .. 20 .40 .60 .80 1.0 2.0 4.0 6.0
PercentClge of Defective Area, % (A red ,>
FIG. 4.7 COMPUTED FATIGUE STRENGTH AT '20,000 CYCLES vs. DEFECTIVE AREA DUE TO INTENTIONAL SLAG INCLUSIONS IN 1-1/2 IN. MATERIAL.

FIG.4.8
ELEVEN DRILLED HOLES IN A ROW.
FRACTURE SURFACE OF 3/4 IN. TRANSVERSE
BUTT WELDED JOINT CONTAINING ARTIFICAL
INTERNAL WELD DEFECTS.

100
en 80 ~ .. en CD
~ U
o o 60 o ci lO
.... o .c. 1; 40 IE:: Q)
'.... (J)
GJ· ::J .~ -~ 20
U 0
/::,.
o Porosity /::,. Slag Stress Cycle
Complete Reversal
Note: Area is based on the defect
o .02
area shown on radiograph.
.04 .06 .08 .10
~
,-
(Butt Weld - As . Welded)
/::,. L ~
0 A
.20 .40 .60 .80 1.0 2.0 4.0
Percentage of Defective Area, % CAred)
FIG. 4.9 COMPUTED FATIGUE STRENGTH AT 50,000 CYCLES VS. DEFECTIVE AREA DUE TO INTENTIONAL WELD DEFECTS IN 3/4 IN. MATERIAL.
6.0
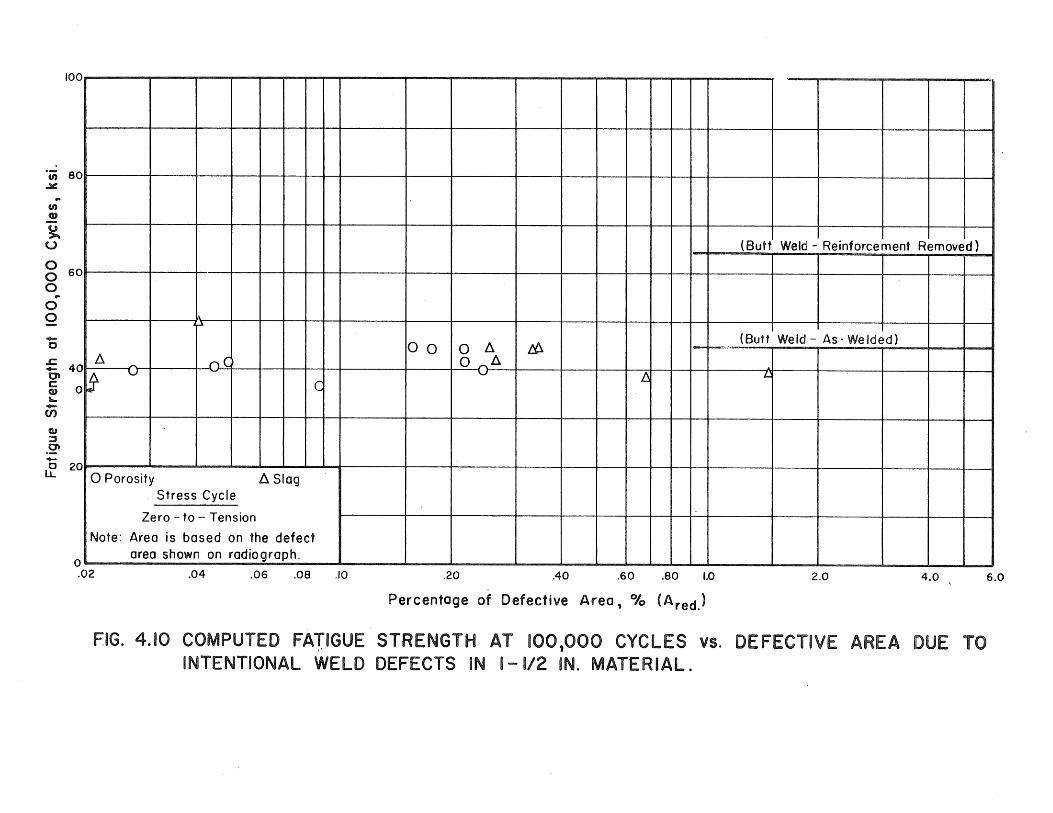
100
en 80 ~ .. en Q)
~ U
o o 60 o o o ... o
.s:::. en 40 c ~ 0 ... en cu :s .~ -
~ ~
~ ,..... (
~ C
If 20 o Porosity ~ Slag Stress Cycle
Zero - to - Tension
Note: Area is based on the defect
o .02
area shown on radiograph.
.04 .06 .08 .10
(Butt Weld - Reinforcement Removed)
00 0 ~ fA 1-r--'" (Butt Weld - As' Welded)
o _~ fj L:.
.20 .40 .60 .80 1.0 2.0 4.0
Percentage of Defective Area, % (A red)
FIG. 4.10 COMPUTED FATIGUE STRENGTH AT 100,000 CYCLES \IS. DEFECTIVE AREA DUE TO INTENTIONAL WELD DEFECTS IN 1-1/2 IN. MATERIAL.
6.0
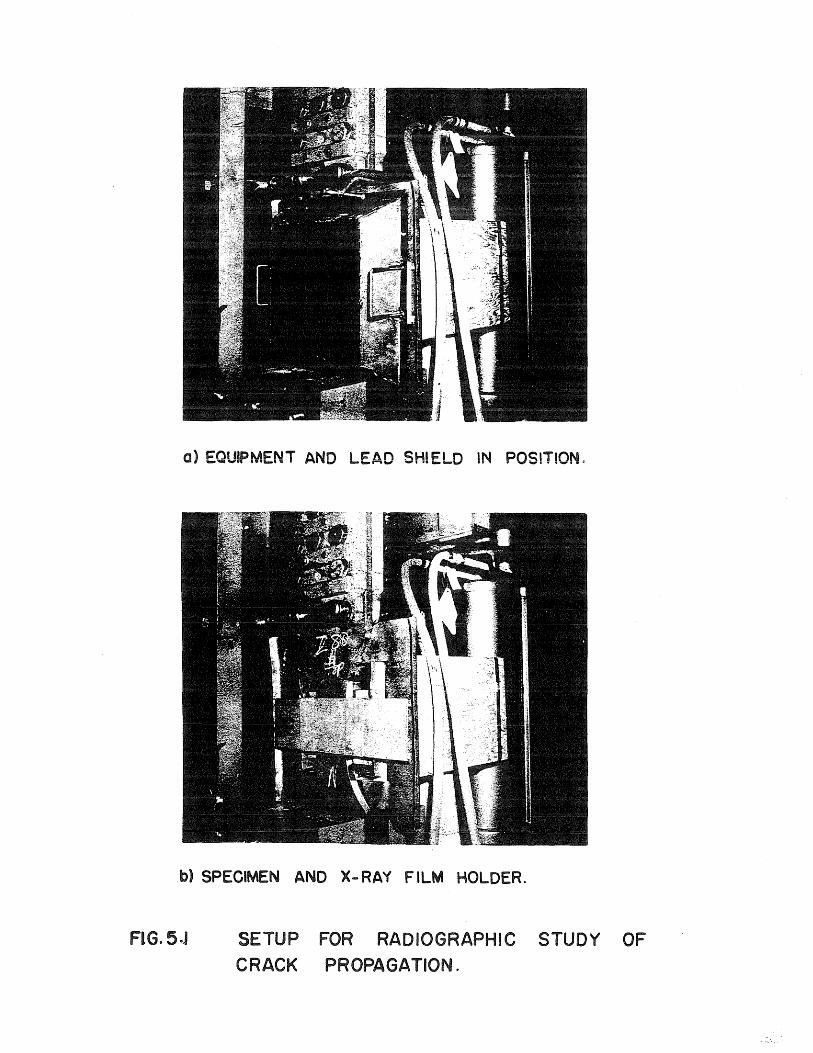
a) EQUIPMENT AND LEAD SHIELD IN POSITION.
b) SPECIMEN AND X-RAY FILM HOLDER.
FiG. 5·1 SETUP FOR RADIOGRAPHIC STUDY OF
CRACK PROPAGATION.
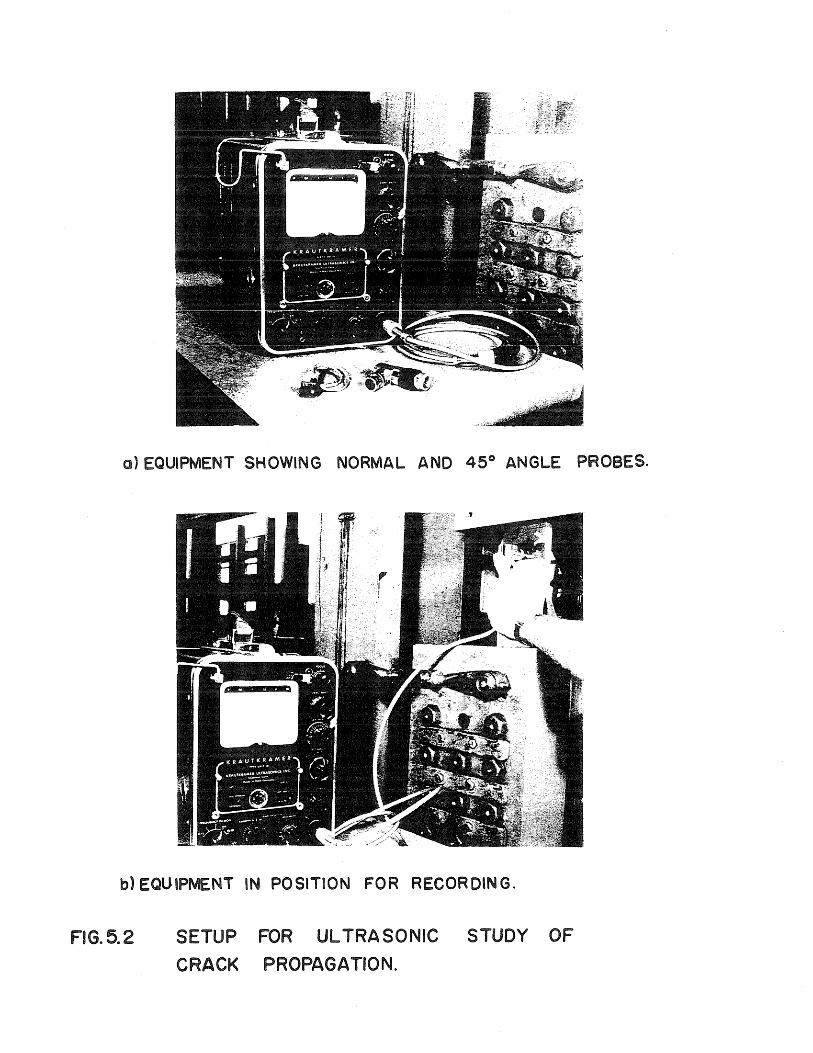
0) EQUIPMENT SHOWING NORMAL AND 45° ANGLE PROBES.
b) EQUIPMENT IN POSITION FOR RECORDING.
FIG. 5.2 SETUP FOR UL TRASONIC STUDY OF
CRACK PROPAGATION.

(I)
c: (1)
E 0 (1)
a. en c:
~
0 0 '-
U (1) ::I .Q' +-0
LL
~
0
c: 0 +-.2 +-
c (I)
~
.EO "0 ~LO § + en ::::lI 0 0 +-
L:. ..... 0 c -0
en 'U QlI (1)
- +-U (/)
>. w U .....
" Stress Cycle Type of
100 ± 50.0 ksi 0-50.0ksi Defect
.\ 0 • Slag ~ " Porosity
I Drilled Holes
\ Lack of Fusion
80 I \
\
\ (0 to + 50.0 ksi)
\ 60
\ \
40 \ . " 10
0 " 0
'\, I I
20 " I u • "
- -I-- •. ~J ~/). .............. • to-/). ----
o
5
o .10 .20 .30 .40 .50
Initiol Length of Weld Defect, inches
FIG. 5.3 CORRELATION BETWEEN INITIAL LENGTH OF INTENTIONAL WELD DEFECT AND INITIATION OF FATIGUE CRACKS.
(/)
c Q)
E 0 Q) Q.
(J)
C
.JIC: 0 0 '-u W ::I .~ +-0
LL
~
0
c .2 +-.Q :!: c
0 -".
(/) (/)
"O~
§ 0 (/) . ::1 0 oLO
L:. ..... -H c -0
(/) 'U (1) W -(,) (/)
>.. w u .....

en ~
E ~ ou .... LL ...... c 0 o en :;: "0 o c: 0\ 0 o en a. :J 00 .... ..c: a..t-oX c: u 'o .... U Q)
!t: ~ ..J
~-.- en - Q) ~ ..... ...... 0 o -c c o 0 :;::;: o 0 ..... -:J .'!: o c
8
6
4
2
o o
--~'pecirnen Symbol Z-94- 6. Z-95 0 Z -96 V Z -97 0 Z-2.2, 0
\I
0
2 4 6 8 10 12 14 16
Specimen Test Life., in Thousands of Cycles
FIG. 5.4 COMPARISON OF CYCLES OF FATIGUE CRACK PROPAGATION TO TES LIFE IN 3/4 IN. HY-80 TRANSVERSE BUTT WELDED SPECIMENS TESTED AT + 50.0 KSI.

(f) Q)
E ~ ou '-
lL. ..... o
c o CJ) :;: "0 o c 0\ 0 o CJ) a. :::J o 0 '- ..c.
a.. I-
..lit: C g '-u Q) ~
Q) ....J :J 0\ -:;: CJ) o Q)
lL. I-
..... 0 0 -c c 0 0 - -0 0 '-:::J
0 C
40 Specimen Symbol
I Z - 98 /::,. I
Z-IOO " f--------+---t----------I ---------t----z -101 0
Z-102 0 I
f--------.J
Z-70 * A Z-79 "* I I I l-80* •
30
-* Data from prevIous study 20
I
• i~ -- .-- ---------II .. -- ........ L ---- -- i-
------ --- 0 --- ----V-- --- ---
10
o o 20 40 60 80 100 120 140 160
Specimen Test Life, in Thousands of Cycles
FIG. 5.5 COMPARISON OF CYCLES OF FATIGUE CRACK PROPAGATION TO TEST LIFE IN 3/4 IN. HY-80 TRANSVERSE BUTT WELDED SPECIMENS TESTED AT 0 TO + 50.0 KSI.
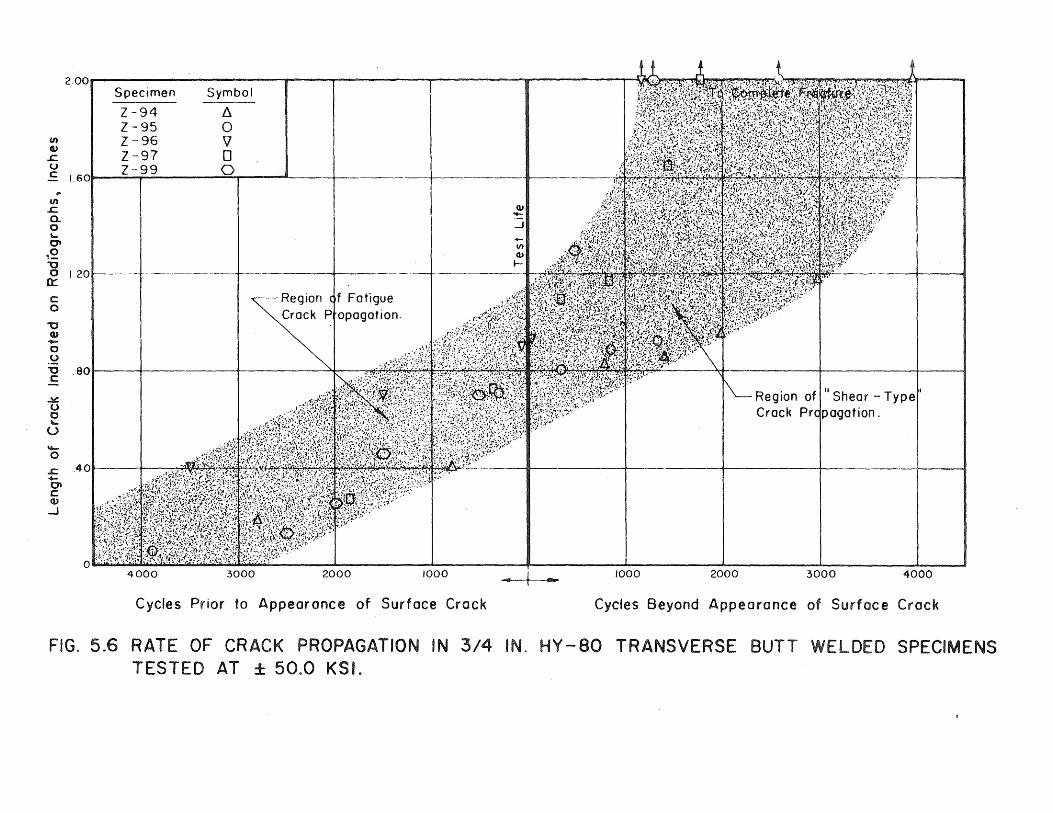
(J)
w .c. u c
"..
(/)
.c. a. o r... 0' ~2 "0 o
0::
c o "0 W -o .~ "0 c:
..:.:: u 0 r...
U \4-0
.c: -C" c: QJ
-I
__ -------------------~----~---------~--------,_--------_r~-~~~m~~~~·t~~~~~~~
I I ~
I 201--------+---------+-
I ~
en Q.)
I-
Region f Fatigue .. ,.:Y<~~~~ Crack P opagation. .r,l:·~P;-~;Pf
.801 , .. ~:~:,~~,;P)·ffip,1~~ftt
.40
o tn' it· ',:":'':;,",71- .. \.;z{~ ". ~;'I",;.-..... f! . ~-~"'( ... -n'",- t'-x"'" I •
4000 3000 2000 1000 --+--Cycles Prior to Appearance of Surface Crack
1000 2000
F_ ;>
Cra
3000 4000
Cycles Beyond Appearance of Surface Crock
FIG. 5.6 RATE OF CRACK PROPAGATION IN 3/4 IN. HY-80 TRANSVERSE BUTT WELDED SPECIMENS TESTED AT ± 50.0 KSI.

Spec I me n S y m b 0 I ~~''''~)~;.~ ~P.·~.::at'~·:~:\(··~·~~.J·:'~(~~~:'rt~~f~W<F.l·ij~W.~~;··(l.;;··:".·;;~h.:9·::1.~~it.:}>:'·:::. ·2.00 . T ... . :'t.>n~ .. ':'\.i:,·';·<~:."h -; .. ! ...... , ,I(L ', ..• ~~;. ..... " , .. '~ •• ,:.~ • .., •.•• : .... ,~, •• :"";.,.",:),",', ""';":.~. ~'<. ··t', 0'
~ 1.60 l;:i~ ~ J_-~_-_--L--- .;,IIIIJliltllltir'lili! ..
V)
..r::. Co "-0" o '0 o
0:;:
c o "0 Q) ... o ,~ "0 C
..¥: U o ....
·U
~
o ..r::. -C\ C w
...J
120
A I W Z-70~.. ! 1 ~ z -79'*. I -1
Z-80*. I (/) ---'- W
*" Dota from prevIous study .--1-- .. ___ --------111 ~, .... ,.! ......... ~ ..•.. r'''''''' ..... _ ... ! .• : .• k.'''''!t •.•.. <:.i>J\ ... r.""''''''_~''~'.'<.~''~': ... ,.0( ..... _ ... .
i F atiguc
.. - .,,~. ··~."'·Jf'.\<.' .... 1'." .• 1:1I'
. so .... ----i-
. II t II t-F~0~w\n:f S oa~ - Type Crack l-'r8Do. otlon . o
o:t:~~tlt{ }t~~~~&~tiiif~1?;\·~%~'·/"·· ~. _______ ~II-________ ..&... ________ ..A-________ .....J. ________ -'''''' ___ ...II
16000 12000 8000 4000 4000 8000 12000 16000
Cycles Prior to Appearance of Surface Crock Cycles Beyond Appearance of Surface Crock
FIG. 5.7 RATE OF CRACK PROPAGATION IN 3/4 IN. HY-80 TRANSVERSE BUTT WELDED SPECIMENS TESTED AT 0 TO + 50.0 KSI.

Note A
Note A: Fillet Weld All Around Except Across V - Groove,
R. D.: Main Rolling Direction.
A
CSJ"··; ... : '. ~
":".~::!,:;.
~
24"
I" 7-2
4..L" 2
I" 4-
L
Section AA
.', c·:····: f." ~ ..
::i:·t;· ,7 ... )','",". .... -.. ,'I"t',
·~J_'·I~:. l :"':.::~
~ 60°
~
-12" ~ HY - 80 Steel Plate
Mild Steel Plate
FIG. 6.1 WELDING JIG USED TO RESTRAIN HY-80 STEEL DURING BUTT WELDING.

130"
INGOT TOP
t 36" A A-3 A-6
t 36" A-I A- 4 A-7
+-36" A-2
L A-5 Main Rolling Direction
.....
l I~ I 144" .1 ~ ----- 440"
·1· 96" .1 j INGOT BOTTOM
FIG. 6.2 MAIN PLATE OF HY-80 STEEL FROM WHICH TEST PLATES G-67, G~68, AND G-69 WERE OBTAINED.
I

LO'IGITUD I NAL AX IS OF WELD :>
o DISCARJ
*" IN.
TOP VIEW
o SAMPLE ~IN.
FIG 6.3 SECTIONING PLAN FOR METALLOGRAPHIC
SAMPLES OF BUTT WELDED HY-80 STEEL.
FIG 6.4 TRANSVERSE SECTION OF A MULTIPASS BUTT -WELD OF HY-80 STEEL. 2X

8, i··~-----""-------""
71~------------+-------------4--------------r----------~-+-------------1--------------r-------------4-------------4-------------~
61 Z 87 Samples I
>.
u _ c: ~ 41 _ 0"
~ 3 ll..
fOO 200
4 W. U. I Micron
300 400 500 600 700
Width Units - (W.U.)
800 900
8.r------------~--------·-----..,._-----------------~----------------~-------------~----------------~----------------r-------------~~------------_....
71 -1-------------+-------------1-------------~------------_;
61 _
>. u 511-1----C Q) :::s 41----..,.-0" ~ 31 _
ll.. 2
00 fOO 200
G - 69 Samples
300 400 500 600 700 800 900
Width Units - (W.U.)
FIG. 6.5 HISTOGRAM OF THE WIDTH OF INCLUSIONS IN THE Z - 87 AND G- 69 SAMPLES OF HY -·80 STEEL.
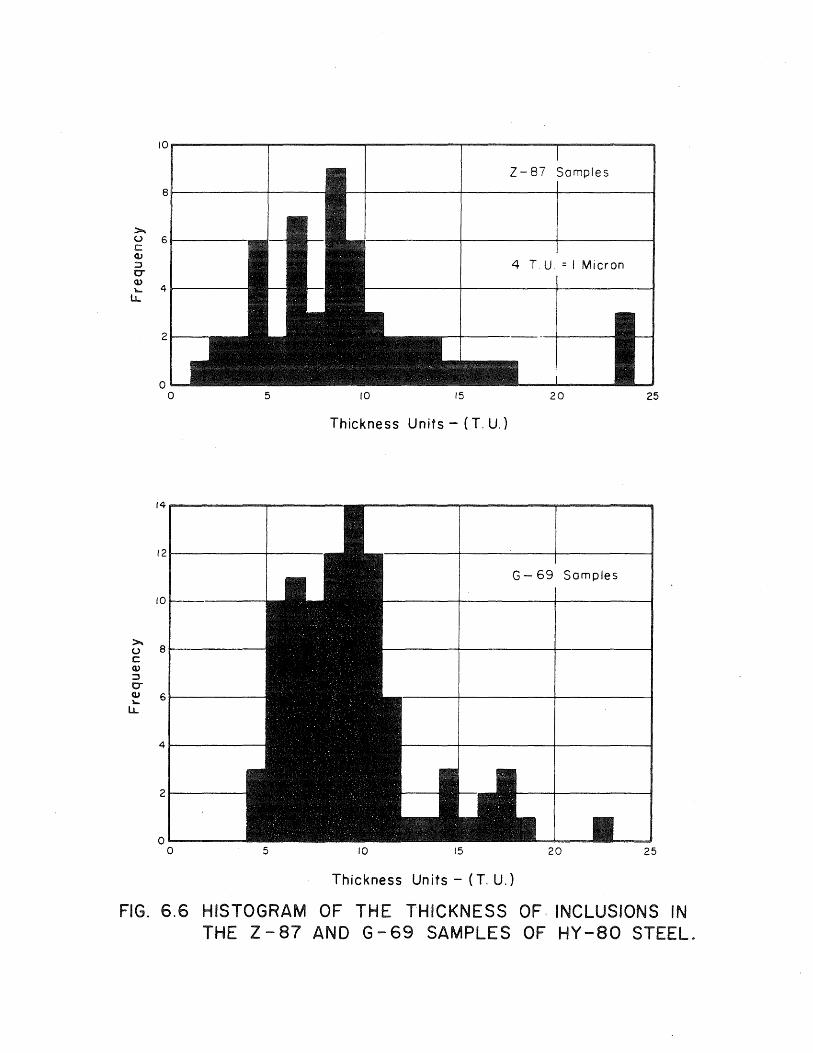
8~-------+-----
:>. u 6i----c: Q)
::J 0-
~ 4~--lJ..
:>.. u c: Q.)
::J 0-W '-
lJ..
2
o o
14
12
10
8
6
4
2
0 0
5
5
Z-87 Samples
4 T. U. = I Micron
/0 15 20 25
Thickness Units - (T. U.)
G - 69 Samples
10 15 20 25
Thickness Units - (T. U.)
FIG. 6.6 HISTOGRAM OF THE THICKNESS OF INCLUSIONS IN THE Z-87 AND G-69 SAMPLES OF HY-80 STEEL.

FIGS.7 PHOTOMICROGRAPH OF A LARG:e: CRACK IN
.THE HAZ AND WELD METAL OF BUTT ... WELDED
HY ... 80 STEEL. 465X
'FIG6.8 PHOTOMICROGRAPH OF THE SAME CRACK
SHOWN ABOVE AFTER 0.009 IN. WAS POLISHED
FROM THE TRANSVERSE SECTION. 200 X

FIG 6.9 PHOTOMICROGRAPH OF A LARGE CRACK
NOT APPARENTLY ASSOCIATED WITH
INCLUSIONS. 400 X.
FIG 6.10 PHOTOMICROGRAPH OF A CRACK ASSOOATED
WITH POROSITY NEAR UNDERCUT REGION
OF TH WE LO. 400 X e

FIG G.U PHOTOMICROGRAPH OF A CRACK ALONG
A ~FINGER~ OF WELD METAL THAT EXTENDS
INTO THE BASE METAL. 150 X.

CI)
CI)
Q)
C "0 "-0
I
:'Q E 0 "-~
a.. "0 c 0 E 0
0
600
500
400
300
200
100
a 2
I I I I 1 I
I -,-- ./ /'
13m m
_L_ 5 ...... , ........................... I -
A I
I 6 I
IJ\,,: I ,/ -
nl :1 I 0 40
Y W ~ I, ~
:N r--v ----:------I U
I I
~ I I
~~~ ....",.,.,..
Normal I I "Buttered" I I Base Metal HY-80 HAl F.I, Weld Metal
F.I L. HAl Base Metal HY - 80
I I I I
-
4 6 8 10 12 14 16 18 20 22 24 26 28 30 32 34 36 38
Distance Across Specimen - M. M.
FIG. 6.12 MICRO HARDNESS SURVEY OF 1- 1/2 IN. THICK HY - 80 STEEL BUTT WELD.

(f)
(f)
Q) C
"0 ~
o
500
40C
I 30C "0
E o ~
~
0..
"0 C 200 o E o o
10C
01
1~F\ A VV
Weld Metal
o 2
I I I
!'J\ !( ~ I ~ I
~ I
~) II Buttered II
HAZ
VI I I I I I
I I
F.IL. I I
4 6 8 10
I I I T I I
.......... I
I
F.IL. -
k ~ V ......... ~ --........... ......... -
Base Metal HY -80 Steel
12 14 16 18 20 22 24 26 28 30 32
Distance Across Specimen - M. M.
FIG. 6.13 MICRO HARDNESS SURVEY OF THE WELD METAL AND HAZ OF "BUTTERED" HY-80 STEEL SCARF.

FIG 6.14 FRACTURED SECTION OF HY'" 80 STEEL
SAMPLE G-68 WELDED IN RESTRAINT.
fiG 6.15 TRANSVERSE SECTION OF FRACTURED
SAMPLE I NDICA TED BY THE ARROW
IN FIG 6.14.

FIG 6.16 PHOTOMICROGRAPH SHOWING FATIGUE CRACKS
RADIATING FROM POROSllY IN HY-80
STEEL SAMPLE G ... 68 AFTER 13,000 CYCLES
OF i- 50.0 KSI. 120X.
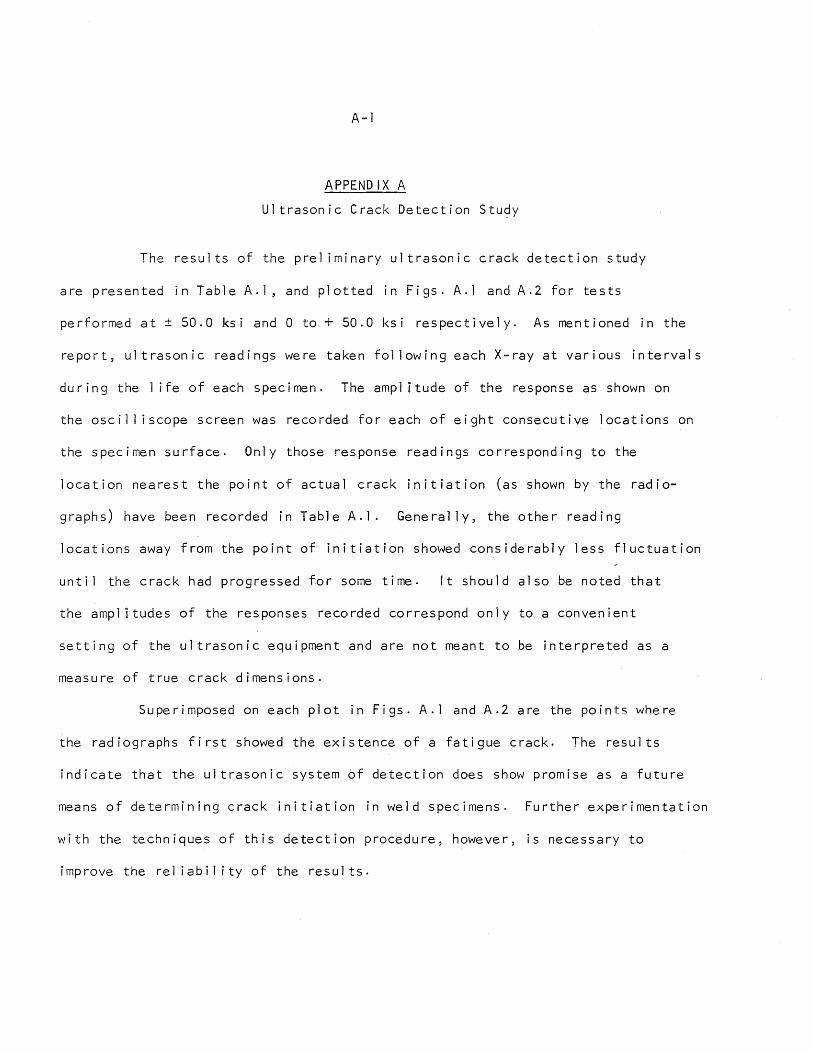
A-l
APPEND I X A
Ultrasonic Crack Detection Stu~y
The resul ts of the prel iminary ul trasonic crack detection study
are presented in Table A. 1, and plotted in Figs. A.l and A.2 for tests
performed at ± 50.0 ksi and 0 to + 50.0 ksi respectively. As mentioned in the
report, ultrasonic readings were taken fol lowing each X-ray at various intervals
during the 1 ife of each specimen. The ampl itude of the response as shown on
the oscil 1 iscope screen was recorded for each of eight consecutive locations on
the specimen surface. Only those response readings corresponding to the
location nearest the point of actual crack initiation (as shown by the radio
graphs) have been recorded in Table A. 1. Generally, the other reading
locations away from the point of initiation showed considerably less fluctuation
unti 1 the crack had progressed for some time. It should also be noted that
the ampl itudes of the responses recorded correspond only to a convenient
setting of the ultrasonic equipment and are not meant to be interpreted as a
measure of true crack dimensions.
Superimposed on each plot in Figs. A. 1 and A.2 are the points where
the radiographs first showed the existence of a fatigue crack. The results
indicate that the ultrasonic system of detection does show promise as a future
means of determining crack initiation in weld specimens. Further experimentation
with the techniques of this detection procedure, however, is necessary to
improve the rel iabil ity of the results.

TABLE A. 1
RESULTS OF ULTRASONIC STUDY OF CRACK PROPAGATION
Specimen Z-94 Specimen Z-96 Specimen Z-98 Specimen Z-lOl S pe c i me n Z - 1 02
Cycles Ultrasonic Cycles Ultrasonic Cycles Ultrasonic Cycles UI trasonic Cycles Ultrasonic read i ng reading read i ng read i ng reading
° 32 ° 16 0 30 0 26 0 34
2,000 29 1,000 20 2,000- 35 2,300- 28 2,000- 31
4,000 25 2,000 26 97,000 avg. 69,000 avg. 67,200 avg.
6,000 39 3,600 24 103,000 33 76,000 31 77, 100 32
8,000 37 6,100 32 109,000 36 85,000 35 87,000 29 » I
119 ~ 000 50 95,100 50 91,000 58 N
10,000 40 7,600 36
11,600 56 10,000 36 121 ,000 50 99,500 54 93,100 58
12,200 53 11,600 41 102,000 57 95,000 50
12,800 53 13,100 41 104,400 62 97,000 56
13,800 48 13,200 46 99,000 49

Ol c:
"'0 o (l)
a:: (l)
a. o u
(f)
~
o -u (l) -(lJ
o u c: o (J)
o ~ -
Specimen Z-96 45
40
35
30
25
20
60~------~------~------~------+-------+-------+-----~15
55 Specimen Z - 94
50
45
40
35
25
® First indication of fatigue crack as shown on radiograph.
20~------~------~------~------~----~~------~----~ o 2 4 6 8 10 12 14
Cycles, In Thousands
FIG. A.I RESULTS OF ULTRASONIC CRACK DETECTION STUDY FOR SPECIMENS TESTED AT ± 50.0 KSI.

60
50
0\ 40 c: "0
Specimen~ Z - 98
Avg. Magnitu~ -e--_ .......
o Q) 301 160
0::: Q)
a. o u
en 'o -u Q) -Q)
o .S? c o (J)
o '--:J
Specimen Z -101 ~ 50
40
:30
651 120
55
45
35
Specimen Z - 102
\.
75 85 95
Cycle s, In Thousands
105
® First indication of fatigue crack as shown on radiograph.
115
FIG. A.2 RESULTS OF ULTRASONIC CRA,CK DETECTION STUDY FOR SPECIMENS TESTED AT 0 TO + 50.0 KSI.
125