Embed Size (px)
Citation preview
2 English Edition No.47 June 2017
Feature Article
Real-time Measurement of Cp2Mg Vapor Concentration using Non-Dispersive Infrared SpectroscopyFeature ArticleReal-time Measurement of Cp2Mg Vapor Concentration
using Non-Dispersive Infrared Spectroscopy
Daisuke HAYASHIVapor concentration of bis-cyclopentadienyl magnesium, which is used for fabri-
cation of gallium-nitride semiconductor devices such as blue light-emitting
diodes, was measured by using non-dispersive infrared (NDIR) spectroscopy.
Different from conventional NDIR measurements, infrared absorbance at 12.8
μm corresponding to C-H bending motion was utilized. From the measurement
results, it becomes obvious that the vapor concentration was largely different
from the concentration calculated from the saturation vapor pressure, and that
the concentration and its dependence on carrier flow rate could be varied
according to bubbler bottles. In this article, the detail of measurement technology
along with experimental results is described.
Introduction
Bis-cyclopentadienylmagnesium (Cp2Mg) is used as a precursor of magnesium (Mg), which is a p-type dopant source for Gallium-Nitride (GaN) semiconductor devices. It was introduced for the first time for fabrication of blue light-emitting diodes by Amano et al.,[1] and recently is also applied for the fabrication process of other devices such as laser diodes[2] and high electron mobility transis-tors.[3] Cp2Mg is a white crystal under room temperature, and its vapor pressure is extremely small (9.0 Pa at 30°C) compared to other metal-organic (MO) materials such as Trimethylalminum and Trimethylgallium.[4] In metal-organic chemical vapor deposition (MOCVD) process, it is bubbled with a carrier gas to be sublimated into vapor phase, and then supplied to a reactor. As the electric con-ductivity of p-layer of the devices severely depends on the Mg concentration,[5] the supplied amount of Cp2Mg in the MOCVD has a crucial meaning for performance; there-fore, real-time measurement of Cp2Mg vapor is desired by many device manufacturers. However, because of the small vapor pressure, the real-time measurement is gener-ally considered difficult. In fact, the supply conditions of Cp2Mg are still being optimized by empirical means in most manufacturing lines.We have been proposing the real-time measurement of vapor concentrations of semiconductor precursors using non-dispersive infrared spectroscopy (NDIR) method.[6] In this article, we show the results of the real-time mea-surement of Cp2Mg vapor concentration by applying this method.
Cp2Mg infrared absorption spectrum
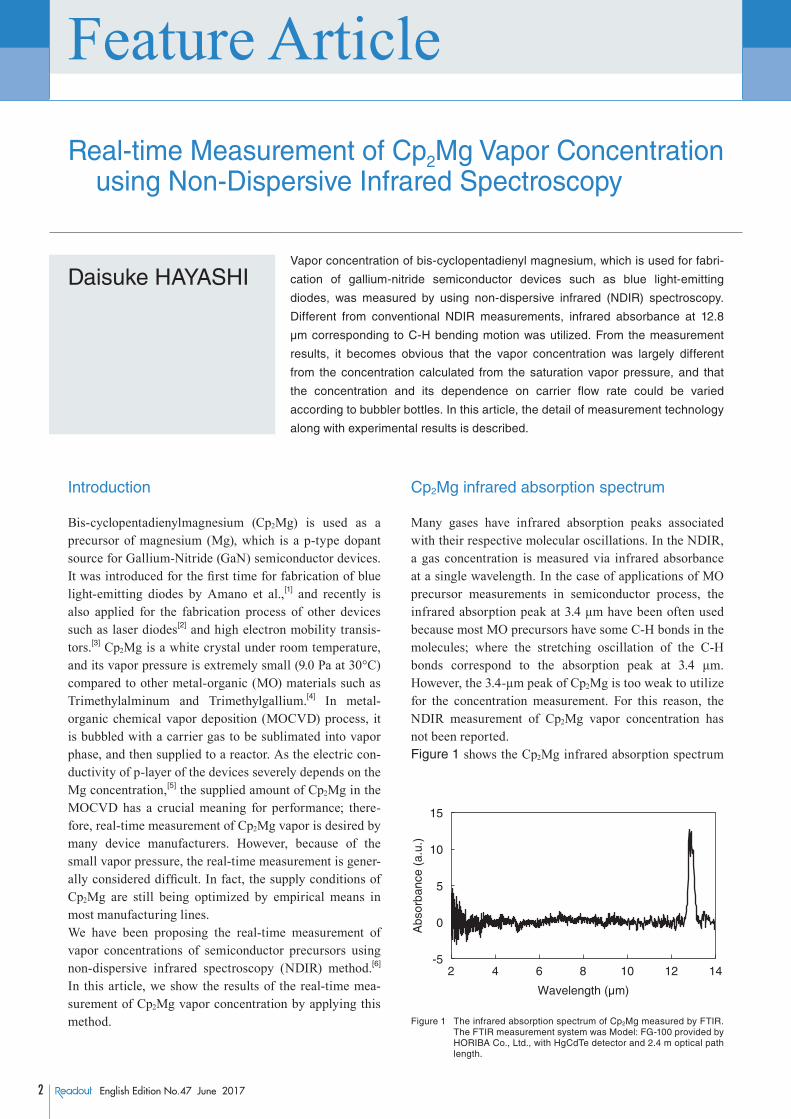
Many gases have infrared absorption peaks associated with their respective molecular oscillations. In the NDIR, a gas concentration is measured via infrared absorbance at a single wavelength. In the case of applications of MO precursor measurements in semiconductor process, the infrared absorption peak at 3.4 μm have been often used because most MO precursors have some C-H bonds in the molecules; where the stretching oscillation of the C-H bonds correspond to the absorption peak at 3.4 μm. However, the 3.4-μm peak of Cp2Mg is too weak to utilize for the concentration measurement. For this reason, the NDIR measurement of Cp2Mg vapor concentration has not been reported.Figure 1 shows the Cp2Mg infrared absorption spectrum
Wavelength (μm)
Abs
orba
nce
(a.u
.)
-5
0
5
10
15
1482 104 126
Figure 1 The infrared absorption spectrum of Cp2Mg measured by FTIR. The FTIR measurement system was Model: FG-100 provided by HORIBA Co., Ltd., with HgCdTe detector and 2.4 m optical path length.
Technical Reports
3English Edition No.47 June 2017
Feature Article
measured by Fourier-transform infrared (FTIR) spectros-copy. A strong absorption peak at 12.8 μm was clearly observed, which corresponds to C-H bending oscillations in the Cp2Mg molecule. On the other hand, another peak at 3.4 μm was very weak and was hidden within the noise band.
NDIR measurement system
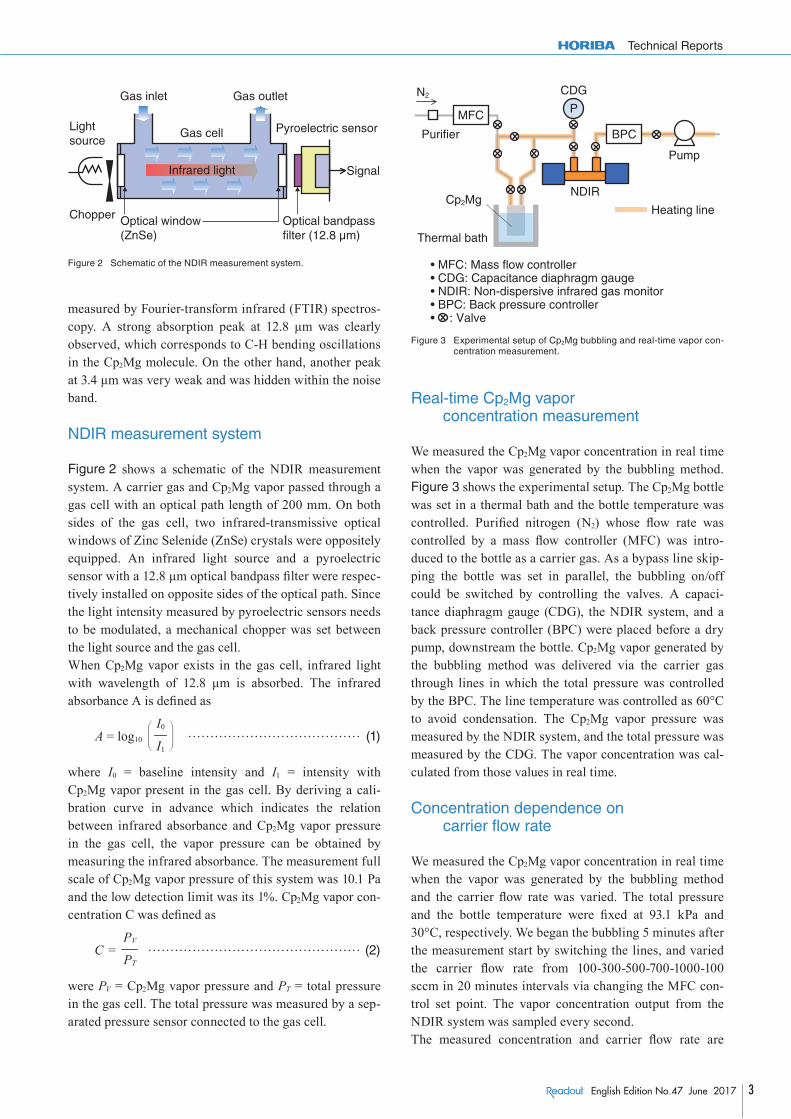
Figure 2 shows a schematic of the NDIR measurement system. A carrier gas and Cp2Mg vapor passed through a gas cell with an optical path length of 200 mm. On both sides of the gas cell, two infrared-transmissive optical windows of Zinc Selenide (ZnSe) crystals were oppositely equipped. An infrared light source and a pyroelectric sensor with a 12.8 μm optical bandpass fi lter were respec-tively installed on opposite sides of the optical path. Since the light intensity measured by pyroelectric sensors needs to be modulated, a mechanical chopper was set between the light source and the gas cell. When Cp2Mg vapor exists in the gas cell, infrared light with wavelength of 12.8 μm is absorbed. The infrared absorbance A is defi ned as
………………………………… (1)
where I0 = baseline intensity and I1 = intensity with Cp2Mg vapor present in the gas cell. By deriving a cali-bration curve in advance which indicates the relation between infrared absorbance and Cp2Mg vapor pressure in the gas cell, the vapor pressure can be obtained by measuring the infrared absorbance. The measurement full scale of Cp2Mg vapor pressure of this system was 10.1 Pa and the low detection limit was its 1%. Cp2Mg vapor con-centration C was defi ned as
………………………………………… (2)
were PV = Cp2Mg vapor pressure and PT = total pressure in the gas cell. The total pressure was measured by a sep-arated pressure sensor connected to the gas cell.
Real-time Cp2Mg vapor concentration measurement
We measured the Cp2Mg vapor concentration in real time when the vapor was generated by the bubbling method. Figure 3 shows the experimental setup. The Cp2Mg bottle was set in a thermal bath and the bottle temperature was controlled. Purifi ed nitrogen (N2) whose fl ow rate was controlled by a mass fl ow controller (MFC) was intro-duced to the bottle as a carrier gas. As a bypass line skip-ping the bottle was set in parallel, the bubbling on/off could be switched by controlling the valves. A capaci-tance diaphragm gauge (CDG), the NDIR system, and a back pressure controller (BPC) were placed before a dry pump, downstream the bottle. Cp2Mg vapor generated by the bubbling method was delivered via the carrier gas through lines in which the total pressure was controlled by the BPC. The line temperature was controlled as 60°C to avoid condensation. The Cp2Mg vapor pressure was measured by the NDIR system, and the total pressure was measured by the CDG. The vapor concentration was cal-culated from those values in real time.
Concentration dependence on carrier flow rate
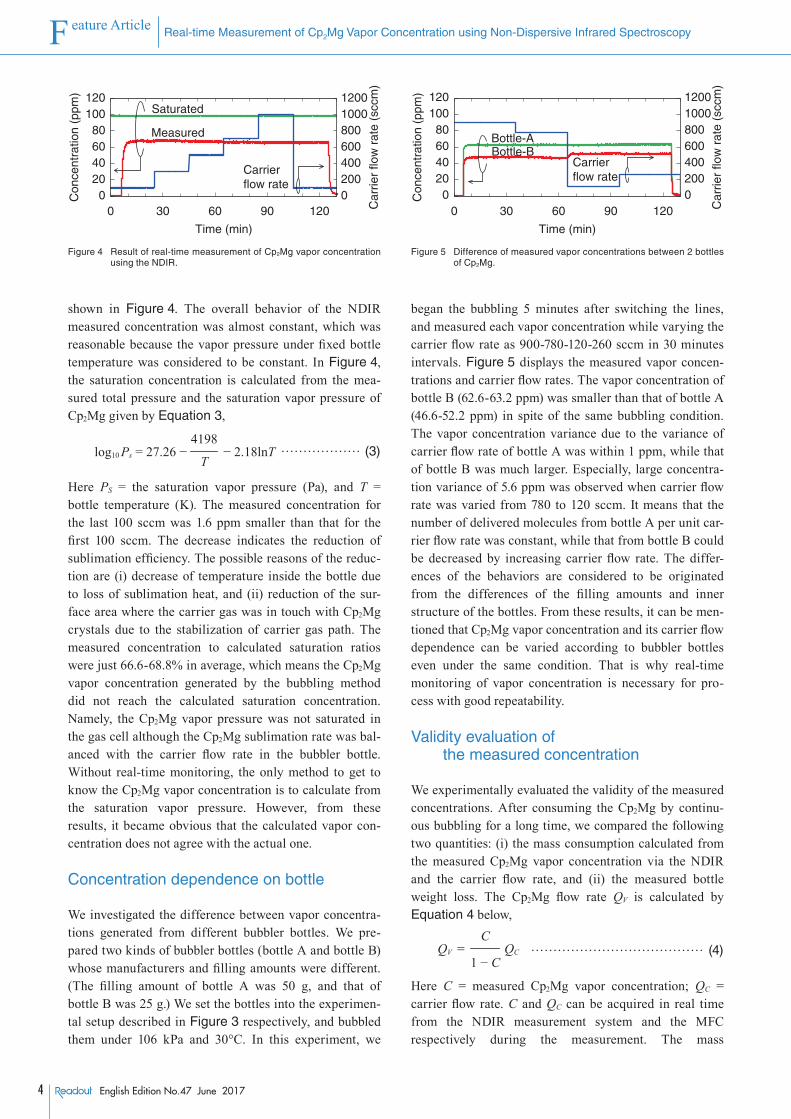
We measured the Cp2Mg vapor concentration in real time when the vapor was generated by the bubbling method and the carrier fl ow rate was varied. The total pressure and the bottle temperature were fi xed at 93.1 kPa and 30°C, respectively. We began the bubbling 5 minutes after the measurement start by switching the lines, and varied the carrier fl ow rate from 100-300-500-700-1000-100 sccm in 20 minutes intervals via changing the MFC con-trol set point. The vapor concentration output from the NDIR system was sampled every second.The measured concentration and carrier fl ow rate are
A = log10 I0I1
⎠――⎞
⎝――⎛
C = PVPT
Lightsource
Chopper
Gas inlet Gas outlet
Signal
Pyroelectric sensorGas cell
Optical window(ZnSe)
Optical bandpassfilter (12.8 μm)
Infrared light
Figure 2 Schematic of the NDIR measurement system.
Heating line
Pump
BPC
MFC
NDIR
P
CDG
Purifier
N2
Cp2Mg
Thermal bath
• MFC: Mass flow controller• CDG: Capacitance diaphragm gauge• NDIR: Non-dispersive infrared gas monitor• BPC: Back pressure controller• : Valve
Figure 3 Experimental setup of Cp2Mg bubbling and real-time vapor con-centration measurement.
4 English Edition No.47 June 2017
Feature Article
Real-time Measurement of Cp2Mg Vapor Concentration using Non-Dispersive Infrared Spectroscopy
shown in Figure 4. The overall behavior of the NDIR measured concentration was almost constant, which was reasonable because the vapor pressure under fixed bottle temperature was considered to be constant. In Figure 4, the saturation concentration is calculated from the mea-sured total pressure and the saturation vapor pressure of Cp2Mg given by Equation 3,
……………… (3)
Here PS = the saturation vapor pressure (Pa), and T = bottle temperature (K). The measured concentration for the last 100 sccm was 1.6 ppm smaller than that for the first 100 sccm. The decrease indicates the reduction of sublimation efficiency. The possible reasons of the reduc-tion are (i) decrease of temperature inside the bottle due to loss of sublimation heat, and (ii) reduction of the sur-face area where the carrier gas was in touch with Cp2Mg crystals due to the stabilization of carrier gas path. The measured concentration to calculated saturation ratios were just 66.6-68.8% in average, which means the Cp2Mg vapor concentration generated by the bubbling method did not reach the calculated saturation concentration. Namely, the Cp2Mg vapor pressure was not saturated in the gas cell although the Cp2Mg sublimation rate was bal-anced with the carrier flow rate in the bubbler bottle. Without real-time monitoring, the only method to get to know the Cp2Mg vapor concentration is to calculate from the saturation vapor pressure. However, from these results, it became obvious that the calculated vapor con-centration does not agree with the actual one.
Concentration dependence on bottle
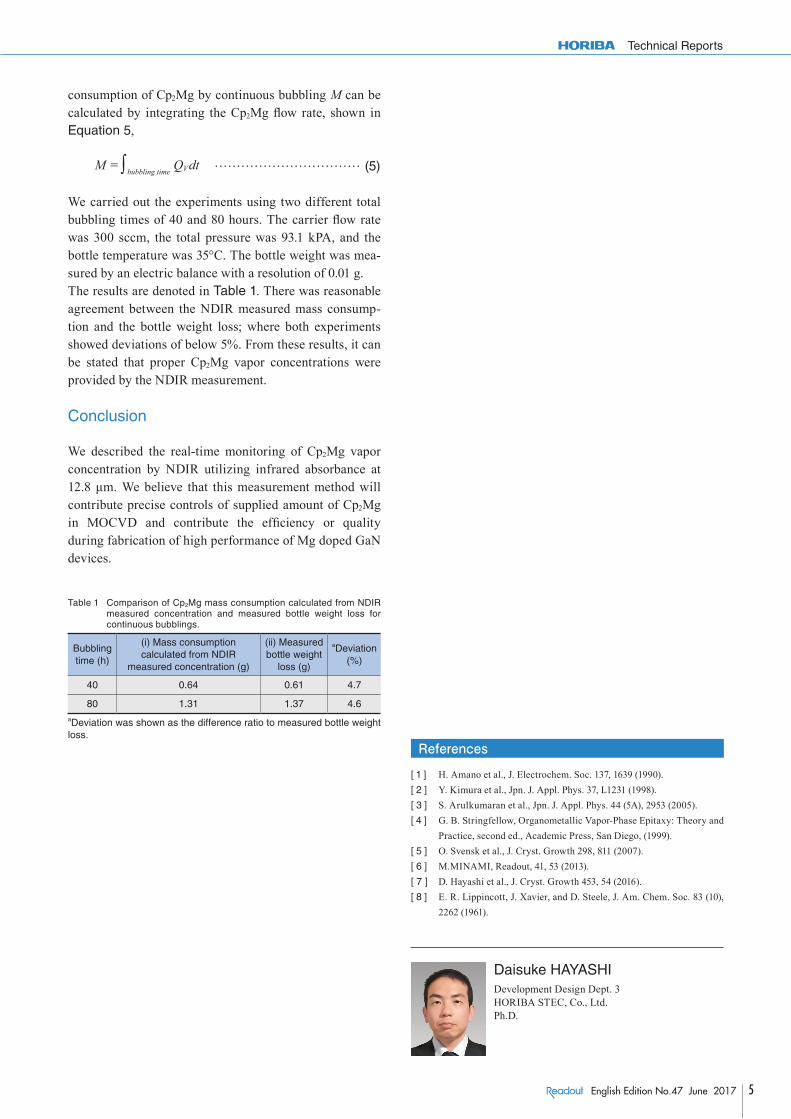
We investigated the difference between vapor concentra-tions generated from different bubbler bottles. We pre-pared two kinds of bubbler bottles (bottle A and bottle B) whose manufacturers and filling amounts were different. (The filling amount of bottle A was 50 g, and that of bottle B was 25 g.) We set the bottles into the experimen-tal setup described in Figure 3 respectively, and bubbled them under 106 kPa and 30°C. In this experiment, we
began the bubbling 5 minutes after switching the lines, and measured each vapor concentration while varying the carrier flow rate as 900-780-120-260 sccm in 30 minutes intervals. Figure 5 displays the measured vapor concen-trations and carrier flow rates. The vapor concentration of bottle B (62.6-63.2 ppm) was smaller than that of bottle A (46.6-52.2 ppm) in spite of the same bubbling condition. The vapor concentration variance due to the variance of carrier flow rate of bottle A was within 1 ppm, while that of bottle B was much larger. Especially, large concentra-tion variance of 5.6 ppm was observed when carrier flow rate was varied from 780 to 120 sccm. It means that the number of delivered molecules from bottle A per unit car-rier flow rate was constant, while that from bottle B could be decreased by increasing carrier flow rate. The differ-ences of the behaviors are considered to be originated from the differences of the filling amounts and inner structure of the bottles. From these results, it can be men-tioned that Cp2Mg vapor concentration and its carrier flow dependence can be varied according to bubbler bottles even under the same condition. That is why real-time monitoring of vapor concentration is necessary for pro-cess with good repeatability.
Validity evaluation of the measured concentration
We experimentally evaluated the validity of the measured concentrations. After consuming the Cp2Mg by continu-ous bubbling for a long time, we compared the following two quantities: (i) the mass consumption calculated from the measured Cp2Mg vapor concentration via the NDIR and the carrier flow rate, and (ii) the measured bottle weight loss. The Cp2Mg flow rate QV is calculated by Equation 4 below,
………………………………… (4)
Here C = measured Cp2Mg vapor concentration; QC = carrier flow rate. C and QC can be acquired in real time from the NDIR measurement system and the MFC respectively during the measurement. The mass
log10Ps = 27.26 − − 2.18lnT4198
T
QV = QC
C
1 − C
Measured
Saturated
Carrierflow rate
020406080
100120
Con
cent
ratio
n (p
pm)
020040060080010001200
Car
rier
flow
rat
e (s
ccm
)
Time (min)
1200 30 60 90
Figure 4 Result of real-time measurement of Cp2Mg vapor concentration using the NDIR.
020406080
100120
Con
cent
ratio
n (p
pm)
020040060080010001200
Car
rier
flow
rat
e (s
ccm
)
Time (min)
1200 30 60 90
Bottle-BBottle-A
Carrierflow rate
Figure 5 Difference of measured vapor concentrations between 2 bottles of Cp2Mg.
Technical Reports
5English Edition No.47 June 2017
consumption of Cp2Mg by continuous bubbling M can be calculated by integrating the Cp2Mg fl ow rate, shown in Equation 5,
…………………………… (5)
We carried out the experiments using two different total bubbling times of 40 and 80 hours. The carrier fl ow rate was 300 sccm, the total pressure was 93.1 kPA, and the bottle temperature was 35°C. The bottle weight was mea-sured by an electric balance with a resolution of 0.01 g.The results are denoted in Table 1. There was reasonable agreement between the NDIR measured mass consump-tion and the bottle weight loss; where both experiments showed deviations of below 5%. From these results, it can be stated that proper Cp2Mg vapor concentrations were provided by the NDIR measurement.
Conclusion
We described the real-time monitoring of Cp2Mg vapor concentration by NDIR utilizing infrared absorbance at 12.8 μm. We believe that this measurement method will contribute precise controls of supplied amount of Cp2Mg in MOCVD and contribute the effi ciency or quality during fabrication of high performance of Mg doped GaN devices.
∫M = QVdtbubbling time
References
[ 1 ] H. Amano et al., J. Electrochem. Soc. 137, 1639 (1990).[ 2 ] Y. Kimura et al., Jpn. J. Appl. Phys. 37, L1231 (1998).[ 3 ] S. Arulkumaran et al., Jpn. J. Appl. Phys. 44 (5A), 2953 (2005).[ 4 ] G. B. Stringfellow, Organometallic Vapor-Phase Epitaxy: Theory and
Practice, second ed., Academic Press, San Diego, (1999).[ 5 ] O. Svensk et al., J. Cryst. Growth 298, 811 (2007).[ 6 ] M.MINAMI, Readout, 41, 53 (2013).[ 7 ] D. Hayashi et al., J. Cryst. Growth 453, 54 (2016).[ 8 ] E. R. Lippincott, J. Xavier, and D. Steele, J. Am. Chem. Soc. 83 (10),
2262 (1961).
Daisuke HAYASHIDevelopment Design Dept. 3HORIBA STEC, Co., Ltd.Ph.D.
Table 1 Comparison of Cp2Mg mass consumption calculated from NDIR measured concentration and measured bottle weight loss for continuous bubblings.
Bubbling time (h)
(i) Mass consumption calculated from NDIR
measured concentration (g)
(ii) Measured bottle weight
loss (g)
aDeviation (%)
40 0.64 0.61 4.7
80 1.31 1.37 4.6aDeviation was shown as the difference ratio to measured bottle weight loss.