Embed Size (px)
Citation preview
f_ M_¢hJgam_9 _epart_emt @ff
:o_st Timber |industryNorth CentraiForest Experiment
_to,,o_ An Assessment of TimberResource
BuHetin.C-,lO9 Product Output and Use_ James E. Btyth, Anthony K. Weatherspoon, and W. Brad Smith
_- -
_-__. _ -------_

North Central Forest Experiment Station
Forest Service--U.S. Department of Agriculture1992 Folwell Avenue
St. Paul, Minnesota 55108
Manuscript approved for publication April 8, 19881988
FOREWORD
In this bulletin we discuss recent Michigan forest industry trends and
report the results of a detailed study of forest industry, industrial round-wood production, and associated primary mill wood and bark residue inMichigan in 1984. Such detailed information is necessary for intelligentplanning and decisionmaking in wood procurement, forest resourcemanagement, and forest industry development. Likewise, researchers needcurrent forest industry and industrial roundwood information for planning
projects.
Special thanks are given to the primary wood-using firms that suppliedinformation for this study and to the Michigan Department of NaturalResources foresters who canvassed these respondents. Their cooperation
is greatly appreciated.
All board feet data in this report have been converted to InternationalI/4-inch scale by applying a multiplier of 1.08 to all saw log volume reportedin Scribner Dec. C scale by sawmills, a multiplier of 1.04 to all veneer log
volume reported in Scribner Dec. C scale by veneer mills, a multiplier of1.38 to all saw log volume reported in Doyle scale by sawmills, and a
multiplier of I. 14 to all veneer log volume reported in Doyle scale by veneermills.
The last published report from a detailed study of all industrial round-wood output in Michigan was in 1977. Most comparisons in this report arewith the 1977 study results. Quantities shown may vary slightly from onetable to another because of rounding differences, but these differences are
insignificant.
.......................................... i ........... ±. ' ' .......
CONTENTS
Page
Highlights ............................................... 1Primary Forest Industry--Industrial Roundwood ............... 1
Pulpwood ................................................. 3Saw Logs ............................................... 4Veneer Logs .............................................. 4Other Products ............................................ 5
Logging Residue .......................................... 5Primary Mill Residue ...................................... 5Outlook ................................................. 6
Appendix ................................................. 6Study Methods .......................................... 6Sampling Error .......................................... 6Common and Scientific Names of Tree Species Mentioned ...... 6Definition of Terms ....................................... 7
Tables .................................................. 7
MICHIGAN TIMBER INDUSTRY--AN ASSESSMENT OFTIMBER PRODUCT OUTPUT AND USE
James E. B lyth,
Anthony K. Weatherspoon,and Wo Brad Smith
HIGHLIGHTS PRIMARY TIMBER INDUSTRY--
. Michigan industrial roundwood production INDUSTRIAL ROUNDWOODclimbed to 284.2 million cubic feet in 1984 from In terms of volume of wood used, pulp mills
216.3 million cubic feet in 1977. dominate Michigan forest industry but sawmills far. Pulpwood accounted for 61 percent of the in- outnumber any other mill category. Based on
dustrial roundwood harvest, compared to 55 per- studies since 1969, the active (operating) mill
cent in 1977. population has been in a narrow range from 347* Three species (aspen, hard maple, and red oak) in 1969 to 293 in 1975. Active mills declined by only
supplied 53 percent of the harvest. 4 from 1977. By contrast, 1,530 mills operated in* Michigan produced a record high 2.40 million 1954. Small sawmills constituted most of the
cords of pulpwood in 1984. This record was broken decline in active mills between 1954 and 1969. Of
in 1986 when production was 2.81 million cords, 316 primary mills operating in 1984, 275 werebased on the North Central Station's annual sawmills. Compared to 1977, 6 more large sawmillsstudy of pulpwood production, operated in 1984 as well as 8 more medium
, Aspen constituted 44 percent of the roundwood sawmills, but the number of small sawmills
cut for pulpwood, operating fell by 23.o Michigan pulp mills procured all but 3 percent
of their wood requirements within the State. Since at least 1954, the annual quantity of logs* Saw log production rose from 514 million board and bolts used per mill has increased. Most mills
feet in 1977 to 530 million board feet in 1984. built since 1954 have been larger than average for
® Principal saw log species were hard maple, red their mill type, and most mills that closed weresmall and inefficient. Although the industry is scat-
oak, aspen, and soft maple.* Average lumber output per sawmill rose 9 per- tered throughout the State, major mills are concen-
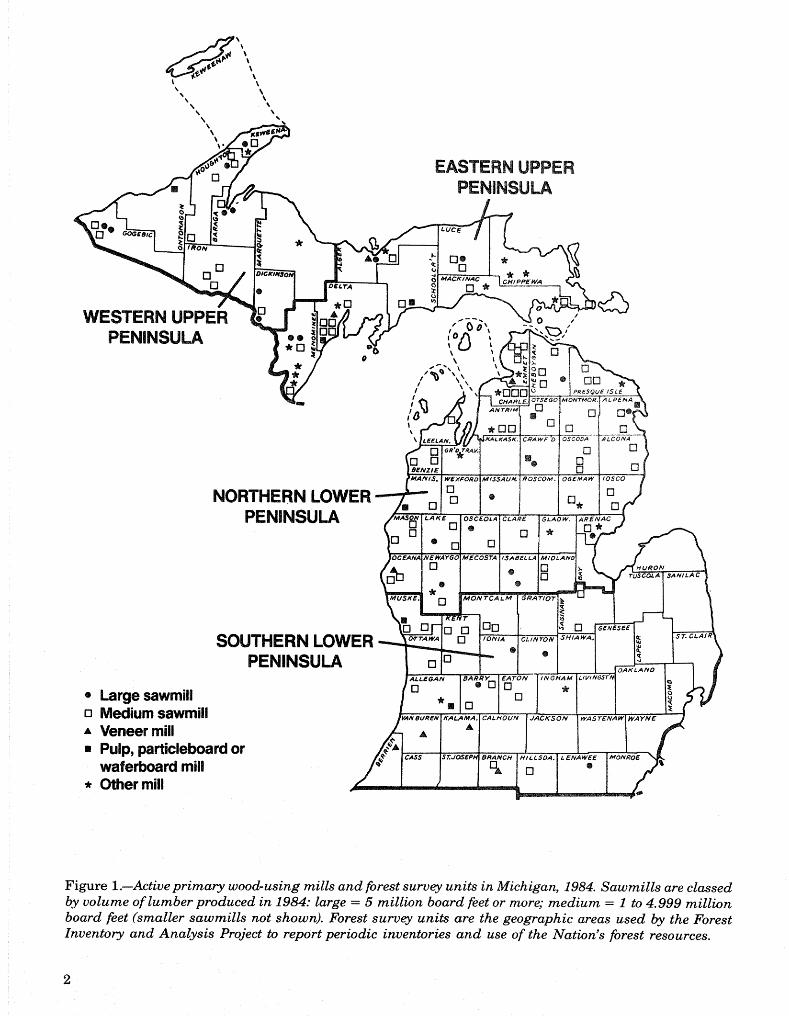
cent from 1977 to 1984. trated in the northern two-thirds of Michigan (fig.
® Michigan loggers cut 31..8 million board feet of 1).
veneer logs, 26 percent less than in 1977. Michigan's timber industry shared in the national® Logging residue generated in 1984 was estimated recovery from recession. National markets for wood
to be the equivalent of 802 thousand cords of products in 1984 were good because the U.S. waspulpwood, enough to supply three 500-ton/day recovering from a recession. Housing starts werepulp mills for 1 year. 1.745 million units, an increase of 2.4 percent from
o Eighty-eight percent or more of each residue class 1983 and the highest total since 1979. Wood and
(coarse, fine, bark) generated at Michigan upholstered furniture manufacturers had a goodprimary mills was used. year; new orders and shipments each totaled near-
JAMES E' BLYTH is a Principal Market Analyst ly $12 billion. U.S. lumber production in 1984 waswith the North Central Forest Experiment Station, 36.8 million board feet, 5.5 percent above theSt. Paul, Minnesota; average for 1975 to 1984. Domestic paper and
Anthony K. Weatherspoon is the Unit Leader, paperboard production reached a new high in theUtilization and Marketing, Michigan Department of U.S. of 69 million tons, up 5.6 percent from theNatural Resources, Lansing, Michigan; and WoBrad previous peak in 1983.Smith is a Principal Mensurationist with the NorthCentral Forest Experiment Station, St. Paul,Minnesota.
NORTHERN LOWERPENINSULA
SOUTHERN LOWERPENINSULA
• Large sawmill [][] Medium sawmill [] WAYNE
= Veneer mill
= Pulp, particleboard orwaferboard mill
. Other mill
Figure 1.--Active primary wood-using mills and forest survey units in Michigan, 1984. Sawmills are classedby volume of lumber produced in 1984: large = 5 million board feet or more; medium = 1 to 4.999 millionboard feet (smaller sawmills not shown). Forest survey units are the geographic areas used by the ForestInventory and Analysis Project to report periodic inventories and use of the Nation's forest resources.
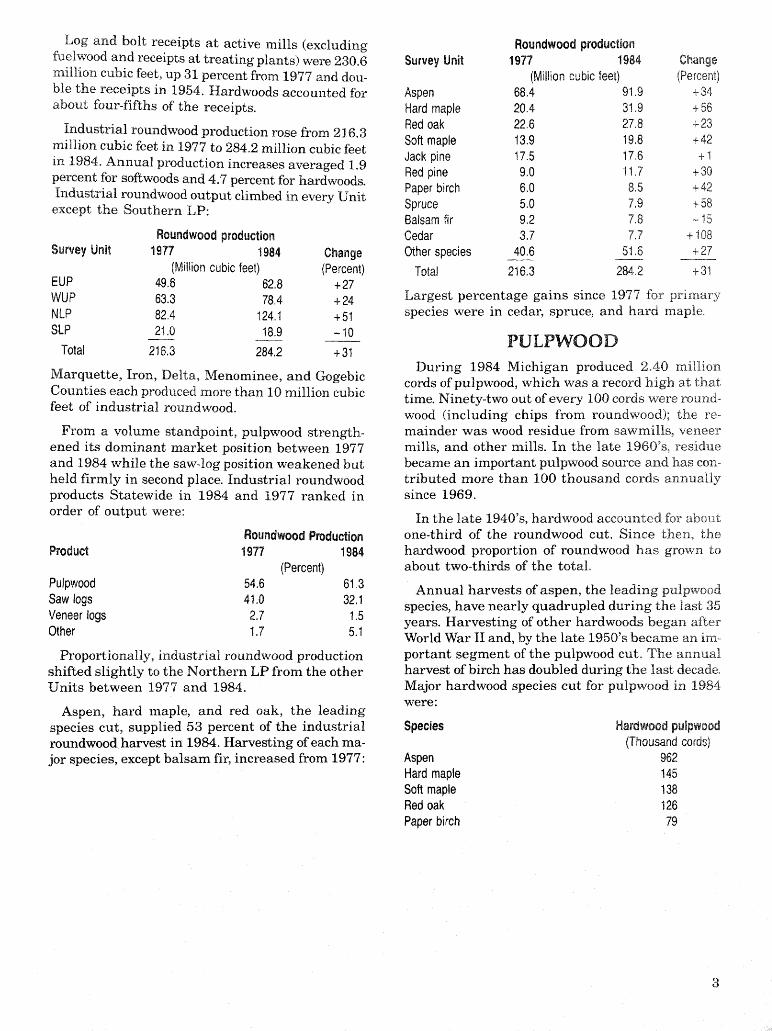
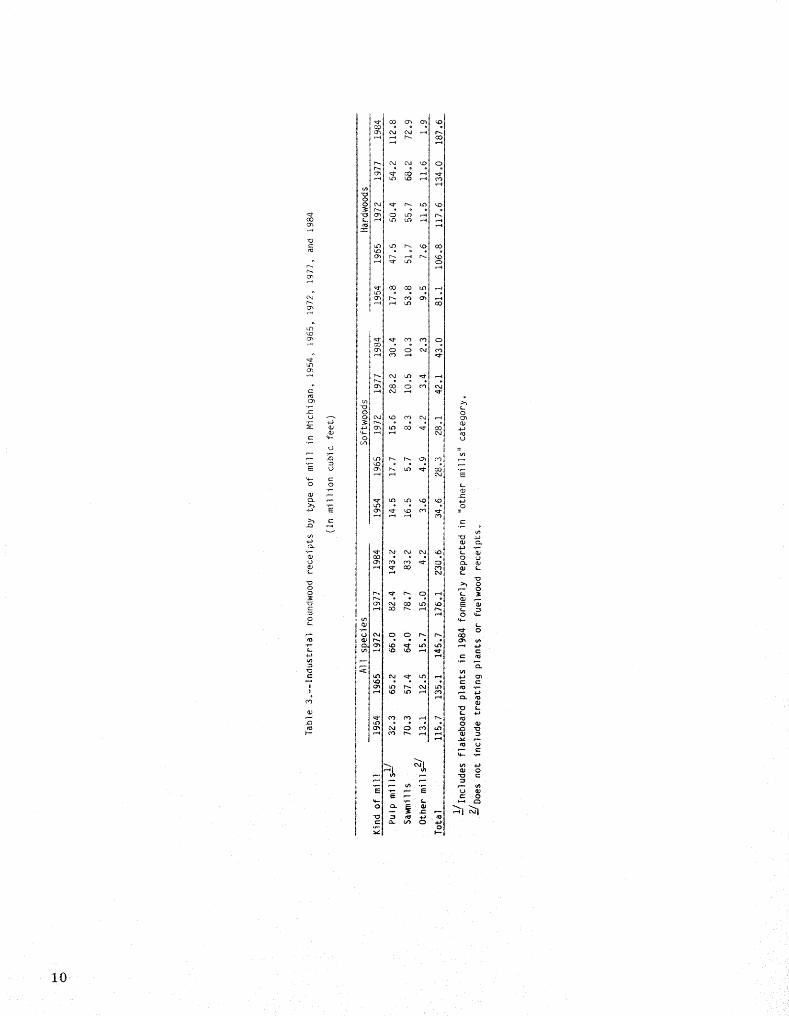
Log and bolt receipts at active mills (excluding Roundwoodproductionfuetwood and receipts at treating plants) were 230.6 Survey Unit 1977 1984 Changemillion cubic feet, up 31 percent from 1977 and dou- (Millioncubic feet) (Percent)ble the receipts in 1954. Hardwoods accounted for Aspen 68,4 91.9 + 34about four-fifths of the receipts. Hardmaple 20.4 31.9 +56
Redoak 22.6 27,8 +23Industrial roundwood production rose from 216.3
Softmaple 13.9 19,8 + 42million cubic feet in 1977 to 284.2 million cubic feetJack pine t7.5 17.6 +1
in 1984. Annual production increases averaged 1.9Redpine 9.0 1t,7 +30
percent for softwoods and 4.7 percent for hardwoods.Paperbirch 6.0 8.5 +42
Industrial roundwood output climbed in every Unit Spruce 5.0 7.9 + 58except the Southern LP: Balsam fir 9.2 72 - 15
Roundwoodproduction Cedar 3.7 7.7 + 108SurveyUnit 1977 1984 Change Otherspecies 40.6 51,6 +27
(Millioncubic feet) {Percent) Total 216.3 284.2 4-31EUP 49.8 62,8 +27WUP 63.3 78.4 +24 Largest percentage gains since 1977 for primary
NLP 82.4 t24.1 +51 species were in cedar, spruce, and hard maple.SLP 21.0 18.9 - 10
-- PULPWOODTotal 218.3 284.2 +31
During 1984 Michigan produced 2_40 millionMarquette, Iron, Delta, Menominee, and Gogebic cords of pulpwood, which was a record high at thatCounties each produced more than 10 million cubic time. Ninety-two out of every 100 cords were round-feet of industrial roundwood, wood (including chips from roundwood); the re-
From a volume standpoint, pulpwood strength- mainder was wood residue from sawmills, veneerened its dominant market position between 1977 mills, and other mills. In the late 1960's_ residueand 1984 while the sawdog position weakened but became an important pulpwood source and has con_held firmly in second place. Industrial roundwood tributed more than 100 thousand cords annuallyproducts Statewide in 1984 and 1977 ranked in since 1969.
order of output were: In the late 1940's, hardwood accounted for aboutRoundwoodProduction one-third of the roundwood cut. Since then, the
Product 1977 1984 hardwood proportion of roundwood has grown t,o
(Percent) about two-thirds of the total.
Pulpwood 54.6 61.3 Annual harvests of aspen, the leading pulpwoodSaw logs 41.0 32.1 species, have nearly quadrupled during the last 35Veneerlogs 2.7 1.5 years. Harvesting of other hardwoods began afterOther 1.7 5.1 World War II and, by the late 1950's became an ira-
Proportionally, industrial roundwood production portant segment of the pulpwood cut. The annualshifted slightly to the Northern LP from the other harvest of birch has doubled during the last decade°Units between 1977 and 1984. Major hardwood species cut for pulpwood in 1984
were:Aspen, hard maple, and red oak, the leading
species cut, supplied 53 percent of the industrial Species Hardwoodputpwoodroundwood harvest in 1984. Harvesting of each ma- (Thousandcords)jor species, except balsam fir, increased from 1977: Aspen 962
Hardmaple 145Softmaple 138Redoak 126
Paperbirch 79
Between 1946 and 1958, balsam fir was the Western UP for hard maple, in the Northern LP forleading softwood species fbr 9 years and hemlock cedar and red oak, and in the Western UP and Nor-was the leader for 3 years. Since 1958, pine has been thern LP for soft maple.the major softwood pulping species cut. After 1975the annual pine harvest exceeded 250 thousand Elm, aspen, and white pine production each
cords except for 1981. Composition of the 1984 pine declined more than 10 million board feet f)om 1977.Other significant declines were in jack and red pine.cut was jack pine (64 percent), red pine (27 percent),Elm saw log production Changes since 1977 reflectand white pine (9 percent). During the last two
decades, the annual harvest of balsam fir, hemlock, the heavy destruction of elm in the Northern LPand spruce has not shown any definite trends, and Eastern UP and the spread of the disease in
the Western UP:
About 4 out of 5 cords of Michigan pulpwood cutin 1984 remained in the State. Most (95 percent) Elm saw tog productionof the exports went to Wisconsin. Principal exports SurveyUnit 1977 1984were aspen, hard maple, jack pine, and spruce. (Thousand board feet, Int'l 1/4-inchrule)
EasternUP 7,301 437The Northern LP supplies more roundwood Western UP 8,589 3,256
pulpwood than any other Unit although annual pro- NorthernLP 2,980 378duction there between 1980 and 1984 was less Southern LP 332 580
stable than in the UP. Counties furnishing moreSaw log harvesting in the Northern LP and
than 100,000 cords each were Marquette, Iron, Western UP Units was more intensive in 1984 than
Delta, and Menominee. in 1977. The Northern LP furnished 42 percent ofNine Michigan mills (7 pulp, i particleboard, and the saw log volume, including 76 percent of the
1 wafbrboard) received 2.00 million cords of aspen, 68 percent of the red pine, and 57 percentpulpwood in 1984; only 3 percent came from out- of the red oak.
of-State. Hardwood mill residue was the principal Leading saw-log producing counties were Gogebic,import. Receipts were strong for aspen, jack pine, Marquette, and Luce. Sixteen counties each cutred oak, and soft maple. more than 10 million board feet.
During the late i940's, Michigan mills imported In 1984, 275 active (operating) sawmills receiv-more than one-third of their pulpwood from Canada. ed 484 million board feet of saw logs compared withThen Canadian imports began falling and have 457 million board feet received at 284 sawmills inbeen nominal since 1969. Wisconsin has been the
1977. Michigan imported a total of 7 million boardmajor source of imported wood since 1973.feet of saw logs fl'om Indiana, Wisconsin, and Ohio.
SA_V LOGS Average lumber output per sawmill rose 9 per-cent from 1977 to 1984. Output continues to riseMichigan loggers harvested 530 million board feet
of saw logs in 1984, up 16 million board feet from because most mills that close are small, most new
1977. Eighty-seven percent was hardwoods. Major mills are larger than average, and other mills haveimproved their productivity. Northern LP was the
species cut were: leading lumber-producing Unit.Species Saw log productionvolume
(Millionboardfeet, Int'l 1/4-inchrule) VENEEr{. LOG S
Hard maple 115 Of the 31.8 million board feet of veneer logs cutRed oak 94 in 1984 in Michigan, 35 percent remained in the
Aspen 85 State, 30 percent was shipped to Wisconsin, 24 per-Soft maple 47cent was shipped to Canada, and the remainder was
Ten percent of the saw log volume was shipped sent to Ohio, Indiana, Iowa, and Kentucky. Hardto Wisconsin and Indiana. Hard maple was the maple was the primary species cut followed by redprimary export species, oak, red pine, yellow birch, white pine, ash, and
Major production gains since 1977 were in hard paper birch. Red pine and hard maple were the chiefmaple (24 million board feet), cedar (11 million exports from Michigan. Top-producing countiesboard feet), red oak (11 million board feet), and soft were Luce, Houghton, Marquette, and Alger.
maple (11 million board feet). Demand for red oak Veneer log production fell 11 million board feetin furniture was high. Gains were mainly in the from the 1977 level. Declines were concentrated in
4
:!:i
aspen and yellow birch and were partially offset by The Northern LP and the Western UP Units pro-significant gains in red pine, red oak, and hard duced two-thirds of the residue:maple. No red pine was harvested for veneer logs:in 1977. SurveyUnit Residuevolume
(Millioncubic feet) (Percentof totat)Eight Michigan veneer mills received 13.7 million Eastern UP 15.9 25
board feet of logs and bolts, down 55 percent from Western UP 20.5 321977. Aspen accounted for most of the decline. Hard Northern LP 22.6 36maple was the major species processed in Michigan, Southern LP 4.3 7
followed by red oak, white oak, and yellow birch. Total 63.3 100Michigan supplied four-fifths of the log volume toresident veneer mills; the remainder came from In- Five counties--Marquette, iron, Delta, Gogebic,
diana, Minnesota, Pennsylvania, Kentucky, Illinois, and Menominee--each produced more than 3million cubic feet of logging residue.Ohio, and Wisconsin. White oak and red oak were
the principal species imported. PRIMARY MILL RESIDUE
OTHER PRODUCTS During 1984, Michigan primary wood-using milts
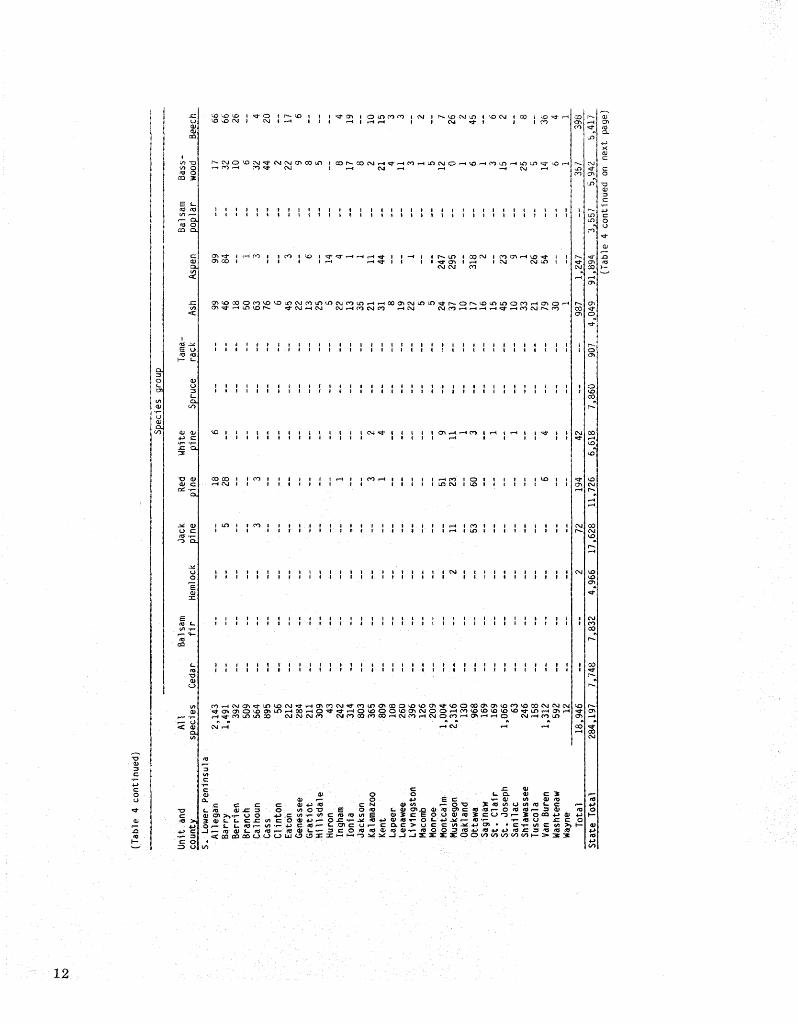
Other industrial roundwood products (5 percent (except the pulp, particleboard, and waferboardof all industrial roundwood) cut in Michigan in 1984 mills) generated 659 thousand green tons of coarsewere poles, commercial posts, industrial fuelwood, residue, 395 thousand green tons of fine residue,charcoal wood, cabin logs, and shingle bolts. In- and 282 thousand green tons of bark. Much of thisdustrial fuelwood accounted for 77 percent (161 residue was used: 97 percent of the coarse, 88 per-thousand cords) of these other products. Two-thirds cent of the fine, and 93 percent of the bark. Pulp(69 percent) of the fuelwood was softwoods. Com- mills consumed 56 percent of the coarse residue formereial posts (2.6 million) constituted another 18 fiber products, and industry and households con-percent of the other products; cedar was the leading sumed 34 percent for fuel. Fine residue was usedpost species. Nearly four-fifths of the posts were cut primarily for industrial fuel, soil conditioners,in the Eastern UR mulch, livestock bedding, and poultry litter. Bark
was used mainly for fuel.Residential fuelwood is a major nonindustrial pro-
Mills have found many additional markets for fineduet in Michigan; this study did not include samp-ling to estimate nonindustrial roundwood product residue and bark since 1977. In 1977, only 66 per-output, cent of the fine residue and 69 percent of the bark
were used. Most of the increased use by 1984 was
LOGGING RESIDUE for fuel:
Residuetype Residueusedfor fuelDuring 1984 loggers in Michigan generated anestimated 63.3 million cubic feet of logging residue. 1977 1984Logging residue includes all wood fiber left behind (Percent)from trees cut during logging operations and not Fine 17 39
Bark 25 56subsequently used. Total residue generated was
equivalent to 802 thousand cords of pulpwood, Market proportions for coarse residue did notenough wood to supply three 500-ton/day pulp mills change greatly between 1977 and 1984.for 1 year.
Counties each producing more than 35 thousandSix species accounted for two4hirds of the residue: green tons of coarse and fine residue in 1984 were
Species Residuevolume Alger, Menominee, Baraga, Dickinson, Gogebic, and
(Millioncubic feet) (Percentof total) Houghton. Estimates of residue in 1984 by type ofAspen 16,0 25 disposal for each county are found in the Appen-Hardmaple 9.7 15 dix. Individuals or firms desiring residue can useRed oak 4.8 8 the county data to pinpoint areas with the highest
Softmaple 4.5 7 residue concentrations.Jackpine 4,2 7Redpine 3.0 5
5
OUTLOOK Between 1977 and 1984,the average annual in-crease in industrial roundwood production was 4
Growth of the U.S. economy, and particularly the percent. Assuming we have no severe recessions:,midwestern economy, will be a major factor in deter- this average annual increase can probably be main-mining the rate of growth in demand for Michigan tained during the next decade (1984-].994) inindustrial roundwood products. Changes in demand Michigan.for housing, furniture, pallets, railroad ties, block-
ing, paper, and paperboard are all vitally importantto Michigan's primary wood-using industry.
APPENDIX
STUDY METHODS Black spruce ................. Picea marianaBalsam fir .................... Abies baLsarnea
Data for this publication came from canvassing Eastern hemlock ........... 7_uga canadensis(with a formal questionnaire) all the known Tamarack ..................... Larix laricina
primary wood-using mills that use Michigan logs Northern white-cedar ....... Th_]a oecidentalisand bolts. The study was a cooperative effort of the HARDWOODSMichigan Department of Natural Resources White oak
(MDNR) and the North Central Forest Experiment White oak .................... Quercus aibaStation (NCFES). All canvassing in Michigan was Bur oak ............... Q_ercus macrocarpa
done by the MDNR using mail and personal con- Chinkapin oak ....... Qztercus rnuehZenbergiitacts; fbllow-up on nonrespondents was by mail, Swamp white oak ........... Querc_s bicoto;"telephone, and personal contacts• MDNR utilization Red oak
and marketing specialists provided estimates bas- Northern red oak ............ Quercus rubraed on prior knowledge and contacts for a few Black oak .................. Quercus velutinaMichigan mills that did not furnish complete data. Pin oak .................. Querc_ts palustris
The NCFES mailed a formal questionnaire to all Hickoryout-of-State mills using Michigan roundwood. Bitternut hickory ......... Carya cordiforrnisFollow-up on nonrespondents was by mail and Pignut hickory ................ Carya giabratelephone• Shagbark hickory .............. Carya ovata
Yellow birch ............ Betula alleghaniensisLogging utilization factors were used to estimate Hard maple
the logging residue. These factors were determin- Black maple .................. Acer nigrumed from earlier Michigan logging studies by the Sugar maple ............... Acer saccharumNCFES. Soft maple
The NCFES edited and compiled the data. Red maple ................... Acer rubr_tmSilver maple ............. Acer saccharinum
SAMPLING ERROR American beech ............ Fagus grandifoliaAsh
Because all primary wood-using mills were can- Black ash .................. Fraxin_ts nigravassed, there is no sampling error for the round- White ash .............. Fraxinus americana
wood products they used or the wood and bark Balsam poplar ........... Populus balsarniferaresidue they generated• Aspen
Bigtooth aspen ........ Populus grandidentataCOMMON AND SCIENTIFIC Quaking aspen ......... Populus trernuloides
NAMES OF TREE SPECIES Eastern cottonwood .......... Populus deltoides
MENTIONED American basswood ........... Tilia americanaBlack walnut ................. Juglans nigra
SOFTWOODS ElmEastern white pine ............. Pinus strobus American elm ............ Ulmus americanaRed pine ..................... Pinus resinosa Rock elm .................. Ulmus thornasii
Jack pine .................. Pinus banksiana Slippery elm ................. Ulmus rubra
Spruce Paper birch ................. Betula papyriferaWhite spruce Picea glauca
• . • . . . . . • . . . • . o • •
6
DEFINITION OF TERMS air space. A cord of fuelwood contains 70 cubicfeet of wood and 58 cubic feet of bark and air
Coarse mitt residue.-:Wood residue suitable fbr space.chipping such as slabs, edgings, and veneer cores. State land.--Land owned by States or land leased
Corn:mereial forest; lando--Forest land producing to these governmental units for 50 years or more.or capable of producing crops of industrial woodand not withdrawn from timber utilization bystatute or administrative regulation. Generally, TABLE TITLESthis includes areas suitable for growing crops of
Table 1.--Number of active primary wood-usingindustrial wood in excess of 20 cubic feet per acreannuall_ mills in Michigan, 1954, 1965, 1969,
ConsumptionoThe quantity of a commodity, such 1972, 1975, 1977, and 1984
as pulpwood, utilized. Table 2. Industrial roundwood production byFine mitt residue.-zWood residue not suitable for species group and type of product,
chipping such as sawdust and veneer clippings. Michigan, 1984Forest industry land.--Land owned by companies
or individuals operating primary wood-using Table 3.--Industrial roundwood receipts by type ofmills_ mill in Michigan, 1954, 1965, 1972, 1977,
Forest survey unito--A geographical area (group and 1984
of counties) used by the Forest Inventory and Table 4.--Industrial roundwood production byAnalysis Project to report periodic inventories and species group, forest survey unit, anduse of the Nation's forest resources, county in Michigan, 1984
Industrial roundwood products.--Saw logs,
pulpwood, veneer logs, poles, commercial, posts, Table 5.--Michigan pulpwood production by speciespiling, cooperage logs, industrial fuelwood, shay- group, 1946-1984
ing bolts, lath bolts, charcoal bolts, and chips f)om Table 6.--Michigan pulpwood production by speciesroundwood used for pulp or board products° group and destination, 1984
Industrial roundwood production. The quan-Table 7.--Pulpwood production from roundwood bytity of industrial roundwood harvested in a
geographic area. species group, forest survey unit, and
Industrial roundwood reeeipts.--The quantity of county, Michigan, 1984
industrial roundwood received in a geographic Table &--Pulpwood receipts in Michigan by speciesarea, regardless of the geographic source, group, 1946-1984
Logging residue.The unused portions of trees cutor killed by logging. Table 9.--Pulpwood receipts in Michigan by area
of origin, 1946-1984National forest land.--Federal land that has been
legally designated as national forest or purchase Table 10.--Pulpwood receipts in Michigan byunits, and other land under the administration species group and area of origin, 1984
of the USDA Forest Service. Table 11.--Saw log production and receipts inPrimary wood-using mills.--Mills receiving Michigan by species group, 1977 and
roundwood or chips from roundwood for process- 1984ing into products.
Primary wood-using mill residue.--Wood Table 12.--Saw log production by forest surveymaterials (coarse and fine) and bark generated unit, species group, and State of destina-at manufacturing plants from roundwood process- tion, Michigan, 1984
ed into principal products. These residues include Table 13.--Saw log production by forest surveywood products (byproducts) obtained incidental toproduction of principal products and wood unit, county, and species group,materials not utilized for some product. Michigan, 1984
Roundwood_--Logs, bolts, or other round sections Table 14.-- Saw log receipts in Michigan by forestcut from trees (including chips from roundwood), survey unit, species group, and State of
Standard eord.--A stack of wood bolts (or the origin, 1984
equivalent) encompassing 128 cubic feet of wood, Table 15.--Veneer log production and receipts inbark, and air space. A cord of pulpwood contains79 cubic feet of wood and 49 cubic feet of bark and Michigan for selected years, 1946-1984
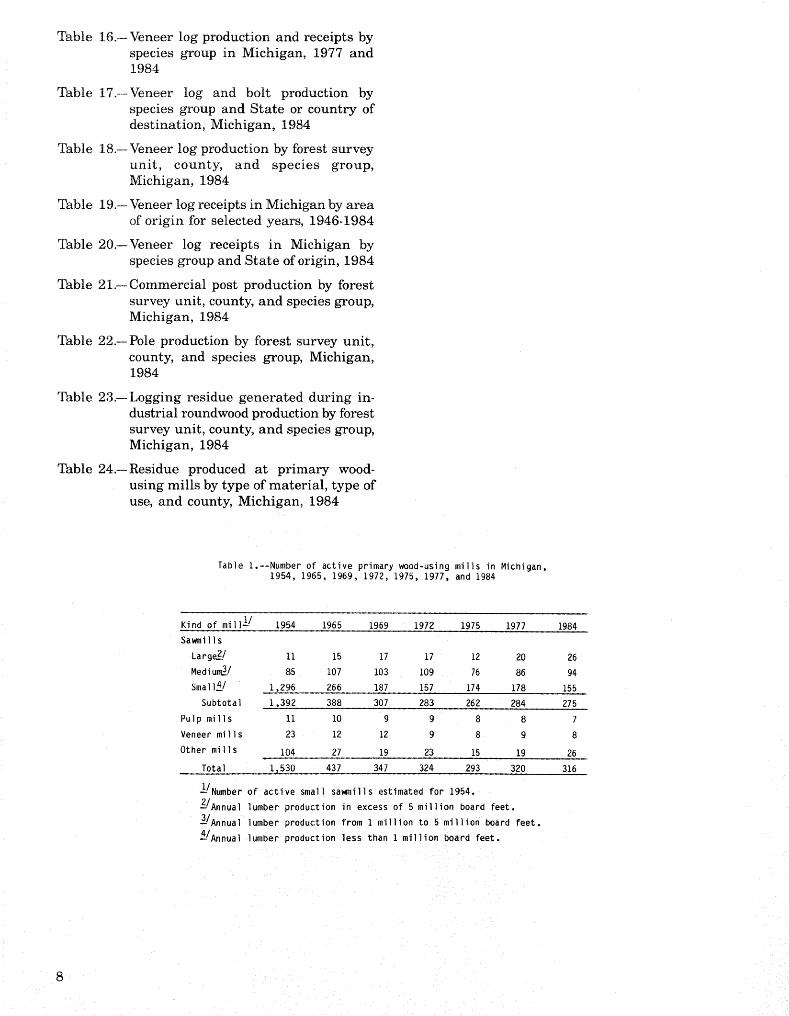
Table 16.--Veneer log production and receipts byspecies group in Michigan, 1977 and1984
Table 17.--Veneer log and bolt production byspecies group and State or country ofdestination, Michigan, 1984
Table 18.--Veneer log production by forest surveyunit, county, and species group,Michigan, 1984
Table 19.-- Veneer log receipts in Michigan by areaof origin for selected years, 1946-1984
Table 20.--Veneer log receipts in Michigan byspecies group and State of origin, 1984
Table 21.--Commercial post production by forestsurvey unit, county, and species group,Michigan, 1984
Table 22o--Pole production by forest survey unit,county, and species group, Michigan,1984
Table 23. Logging residue generated during in-dustrial roundwood production by forestsurvey unit, county, and species group,Michigan, 1984
Table 24.--Residue produced at primary wood-using mills by type of material, type ofuse, and county, Michigan, 1984
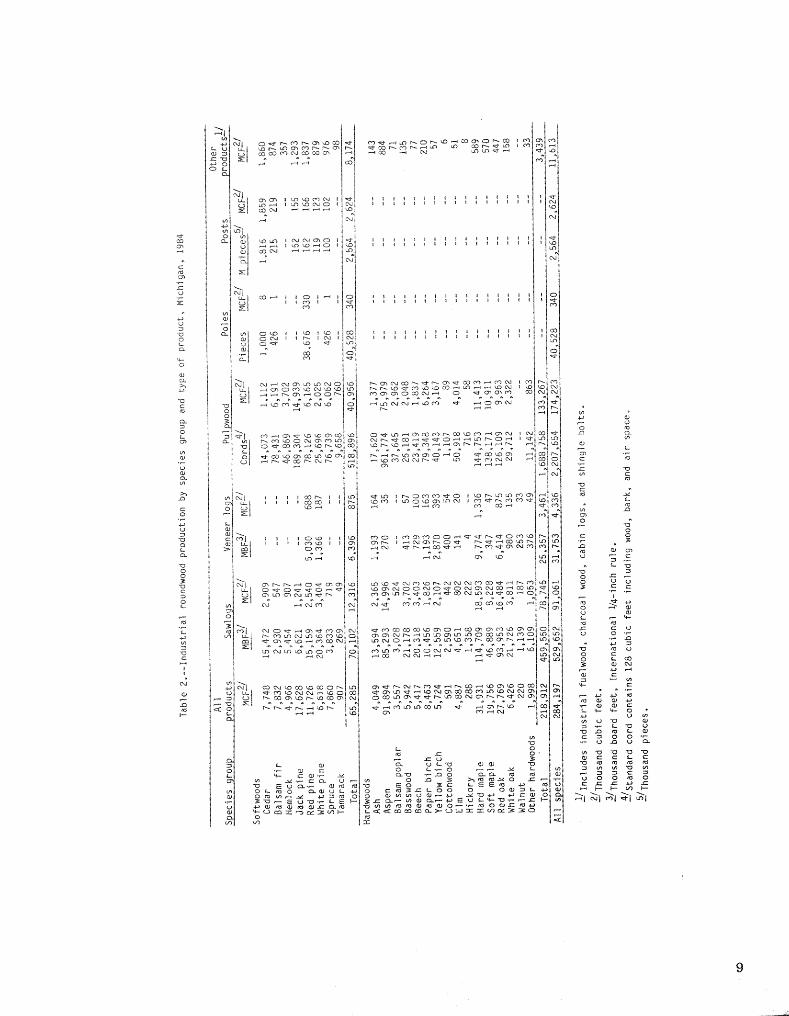
Table l.--Numberof active primarywood-usingmills in Michigan,1954, 1965, 1969, 1972, 1975, 1977, and 1984
Kind of mill-I/ 1954 1965 1969 1972 1975 1977 1984
Sawmills
Large._2/ 11 15 17 17 12 20 26
Medium_3/ 85 107 103 109 76 86 94
Sma114_/ I,296 266 187 t57 174 178 155
Subtotal i,392 388 307 283 262 284 275
Pulp mills 11 10 9 9 8 8 7
Veneer milIs 23 12 12 9 8 9 8
Other mi11s 104 27 19 23 15 19 26
Total i,530 437 347 324 293 320 316
-I/Numberof active small sawmills estimatedfor 1954.
2-/Annuallumber productionin excess of 5 million board feet.
--3/Annuallumber productionfrom 1 million to 5 million board feet.
4/Annual lumber productionless than I million board feet.
8
10
. - ........................................ -'iIi]_::'_'i°"'::i"--":'_iii'["i ..... i"[?'i" .,,_ ='iir_'--i_ ._n I ri i I" r r frlI'_- ' [ II ..... I....... -T...... TrYYYIT[III .........................
11.
12
13
_-._ o") a oo _"_ _::_,u'_"_ c'') i _o a "_ r"_cO _ o,J I o0o_ a _'_'_"_ _ t o.J j J _ 0 ,-.-_-,_ u_ o",i _ I o ! i i ,-,-1 ! i I I I'-_ i _ i
g
1.o .--_ _,4
iii i_1 it ! ii
i i i i , I i i I i i I i ! i ! i !
I
•r.,- 0 f,-+-) ";-" ._
14
H_"'........... TTF-I[I ' _ n................................... ]rF -[[[TFIIIIllFII[IFTI ...........r-r-_'lF]T T-TT-F--II"- ............. IIII I I
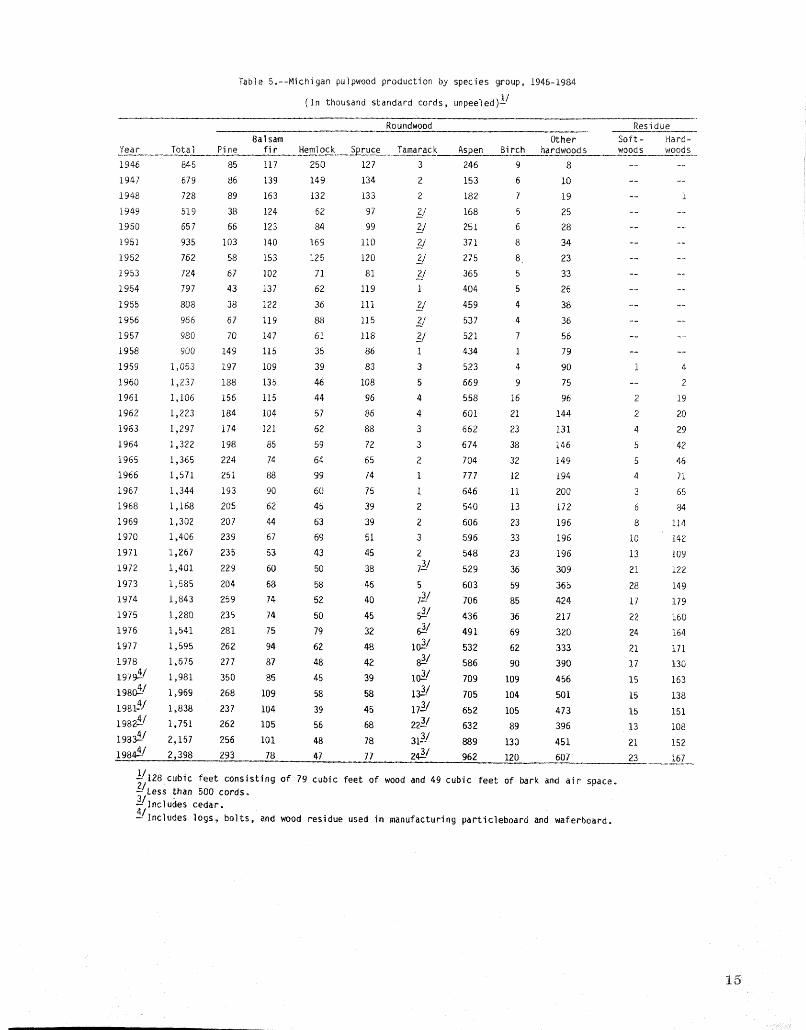
Table 5.--Michigan pulpwood production by species ,group, 1946_1984
(In thousand standard cords, unpeeled)_ /
Roundwood Residue
Balsam Other Soft- Hard-
Year Total Pine fir Hemlock Spruce Tamarack Aspen Birch hardwoods woods woods
1946 8_5 85 117 250 127 3 246 9 8 ....
1947 679 86 139 149 i34 2 153 6 10 ....
1948 728 89 163 132 133 2 182 7 19 -- 1
1949 519 38 124 62 97 2/ 168 5 25 .....
1950 657 66 123 84 99 2-/ 251 6 28 ....
1951 935 103 140 169 ii0 2/ 371 8 34 ....
1952 762 58 153 125 120 2/ 275 8 23 .....
1953 724 67 102 71 81 2/ 365 5 33 ....
1954 797 43 137 62 119 i 404 5 26 ....
1955 808 38 122 36 111 2/ 459 4 38 ....
1956 966 67 119 88 115 2_/ 537 4 36 ....
1957 980 70 147 61 118 2_/ 521 7 56 .....
1958 900 149 115 35 86 1 _34 i 79 ....
1959 1,053 197 109 39 83 3 523 4 90 1 4
_960 1,237 188 135 46 108 5 669 9 75 2
1961 1,106 i56 115 44 96 4 558 16 96 2 19
1962 1,223 184 104 57 86 4 601 21 144 2 20
1963 1,297 174 121 62 88 3 662 23 131 4 29
1964 1322 198 85 59 72 3 674 38 146 5 42
1965 1 365 224 74 64 65 2 704 32 149 5 46
1966 1 571 251 88 99 74 I III 12 194 4 71
1967 1 344 193 90 60 75 1 646 11 200 3 65
1968 1 168 205 62 45 39 2 540 13 172 6 84
1969 1 302 207 44 63 39 2 606 23 196 8 114
1970 1 406 239 67 69 51 3 596 33 196 10 142
1971 1 267 235 53 43 45 2 548 23 196 13 109
19/2 1,401 229 60 50 38 73-/ 529 36 309 21 122
1973 1,585 204 68 58 46 5 603 59 365 28 149
1974 1,843 259 74 52 40 73-/ 706 85 424 17 179
1975 1,280 235 74 50 45 5_3/ 436 36 217 22 160
1976 1,541 281 75 79 32 6_3/ 491 69 320 24 !64
1977 1,595 262 94 62 48 10_3/ 532 62 333 21 171
1978 1,675 277 87 48 42 8_3/ 586 90 390 17 130
!979 _4-/ 1,981 350 85 45 39 10_3/ 709 109 456 15 163
1980_/ 1,969 268 109 58 58 13_/ 705 104 501 15 138
1981_/ 1,838 237 104 39 45 173-/ 652 105 473 15 151
19824--/ 1,751 262 105 56 68 223-/ 632 89 396 13 108
1983_4/ 2,157 256 101 48 78 313-/ 889 130 451 21 152
1984 _4/ 2,398 293 78 47 77 24_3/ 962 120 607 23 167
_/128 cubic feet consisting of 79 cubic feet of wood and 49 cubic feet of bark and air space.?-/Less than 500 cords.
3-/Inc|udes cedar.
4-/lmcludes logs, bolts, and wood residue used in manufacturing particleboard and waferboardo
i5
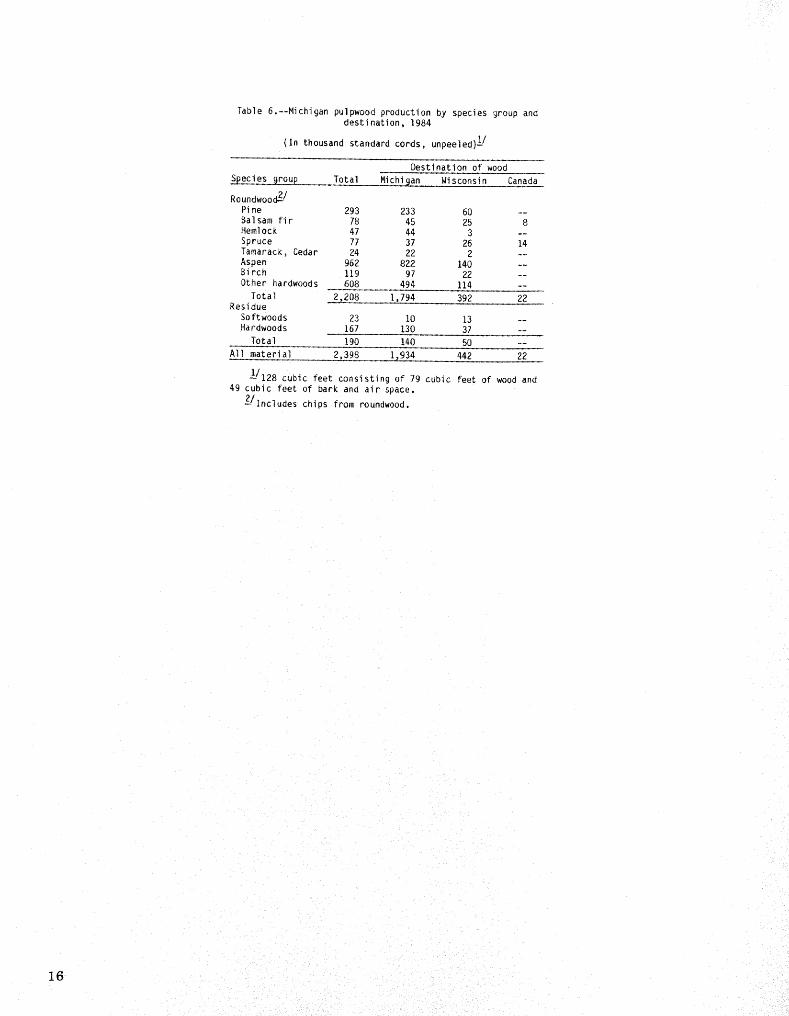
Table 6.--Michigan pulpwood production by species group anddestination, 1984
(in thousand standard cords, umpee]ed)_ /
Destination of wood
Total Michigan Wisconsin Canada
Roundwood_2/
Pine 293 233 60 --Ba|sam fir 18 45 25 8Hemlock 47 44 3 --Spruce 77 37 26 14TamaracK,Cedar 24 22 2 --Aspen 962 822 140 --Birch 119 97 22 --Other hardwoods 608 494 114 --
Total 2,208 1,794 392 22ResidueSoftwoods 23 10 13 --Hardwoods 167 130 37 --
Total 190 140 50 --
All material 2,398 1,934 442 22
I.-/128cubic feet consistingof 79 cubic feet of wood and49 cubic feet of bark ana air space.
2Jlncludeschips from roundwood.
16
17
i,,rr
18
_9
00 _- _
..... I ',',I ',: I I ',_°° ',',: I I_ _" "_ ',',_ °,
_._, _o, ,r-. , , , ,co
4J ,'-- I r-.-_-. r'_ I uoo'v 09 O0 .:3" o.J
I
._- ! ! o,J
:_:I
,.- ,,-._ ._>i!
_ ¢Jl I
i
I '_-_ _ I I I ,, I ,, ,, I I I ,, I :_ ,, I : I I : I ,, ;_ I : I II_ N ', ', _¢L_I ',0 ¢',a e_ ,_'
N _
-, 3
N
= __.- _ ,,-..- _ _ _ ,.,.-. _ ,,'- -I-_ _" _ .-" f..- _:_ C:: _....__"- e" "_ t" :_ _ t" C:: _ '" "_'-__ ° _ _-
¢.0 e_ -r- "a- ::_.,.I .,.1
2O
I I []]_ HI_F'Tllll_I'T_I I ................................. _
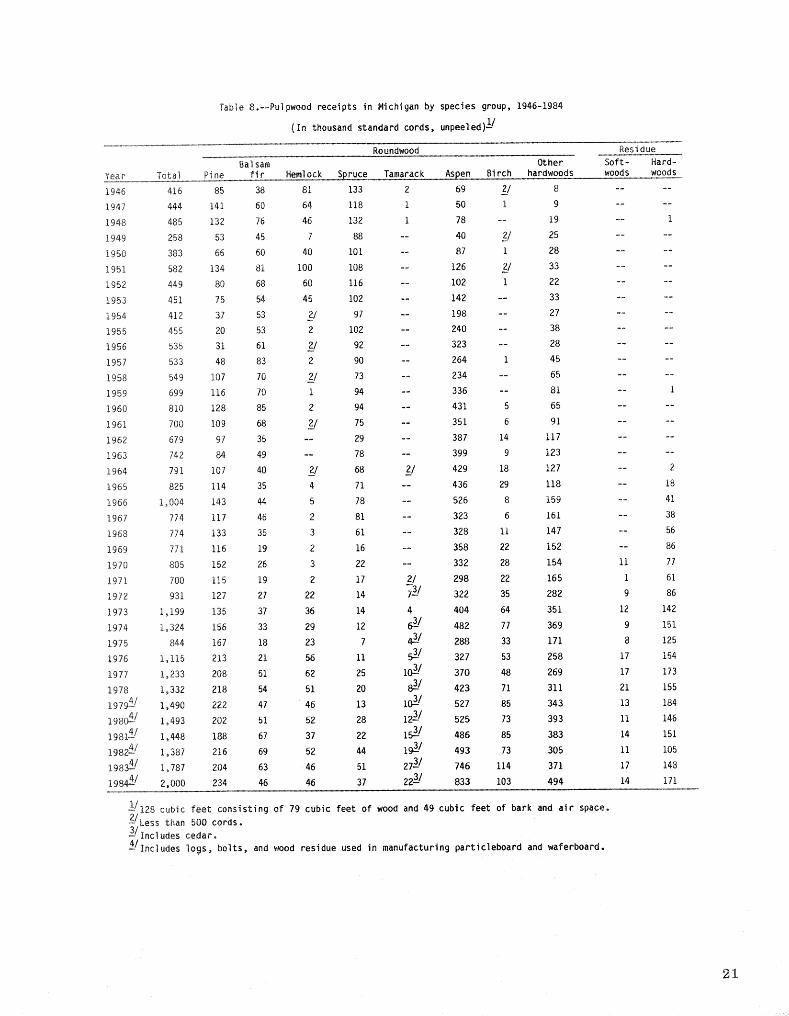
Table 8,_-Pulpwood receipts in Michigan by species group, 1946-1984
(In thousand standard cords, unpeeled) _/
Roundwood ResidueBalsam Other Soft- Hard-
Year Total Pine fir Hemlock Spruce Tamarack Aspen Birch hardwoods woods woods
1946 416 85 38 81 133 2 69 2/ 8 ....
1947 444 141 60 64 118 i 50 1 9 ....
1948 485 132 76 46 132 I 78 -- 19 -- 1
1949 258 53 45 7 88 -- 40 2-/ 25 ....
1950 383 56 60 40 i01 -- 87 I 28 ....
1961 582 134 81 i00 108 -- 126 2-/ 33 ....
1952 449 80 68 60 116 -- 102 I 22 ....
1953 451 75 54 45 102 -- 142 -- 33 ....
1954 412 37 53 2/ 97 -- 198 -- 27 ....1955 455 20 53 2 102 -- 240 -- 38 ....
1956 535 31 61 2-/ 92 -- 323 -- 28 ....
1957 533 48 83 2 90 -- 264 I 45 ....
1958 549 107 70 2--/ 73 -- 234 -- 65 ....1959 699 116 70 I 94 -- 336 -- 81 -- 1
1960 810 128 85 2 94 -- 431 5 65 ....
1961 700 109 68 2-/ 75 -- 351 6 91 .....1962 679 97 35 -- 29 -- 387 14 117 ....
1963 742 84 49 -- 78 -- 399 9 123 ....
1964 791 107 40 2-/ 68 2-/ 429 18 127 -- 21965 825 114 35 4 71 -- 436 29 118 -- 18
1966 1,004 143 44 5 78 -- 526 8 159 -- 41
1967 774 117 46 2 81 -- 323 6 161 -- 38
1968 774 133 35 3 61 -- 328 II 147 -- 56
1969 771 116 19 2 16 -- 358 22 152 -- 86
1970 805 152 26 3 22 -- 332 28 154 11 77
1971 700 115 19 2 17 2_/ 298 22 165 i 61
1972 931 127 27 22 14 73-/ 322 35 282 9 86
1973 1,199 135 37 36 14 4 404 64 351 12 142
1974 1,324 156 33 29 12 6_3/ 482 77 369 9 151
1975 844 167 18 23 7 4_3/ 288 33 171 8 125
1976 1_115 213 21 56 11 5_3/ 327 53 258 17 154
1977 i_233 208 51 62 25 i0_3/ 370 48 269 17 173
1978 1,332 218 54 51 20 8_3/ 423 71 311 21 155
1979_/ 1,490 222 47 46 13 i0_3/ 527 85 343 13 184
198C_4-/ I_493 202 51 52 28 123-/ 525 73 393 ii 146
1981._/ 1,448 188 67 37 22 15_3/ 486 85 383 14 151
1982_/ 1,387 216 69 52 44 19_3/ 493 73 305 11 105
1983,4-/ 1,787 204 63 46 51 273-/ 746 114 371 17 148
1984_/ 2,000 234 46 46 37 223-/ 833 103 494 14 171
_J128 cubic feet consisting of 79 cubic feet of wood and 49 cubic feet of bark and air space°2-/Less than 500 cords,3-/Includes cedar,
4-/Includes logs, bolts, and wood residue used in manufacturing particleboard and waferboard,
21
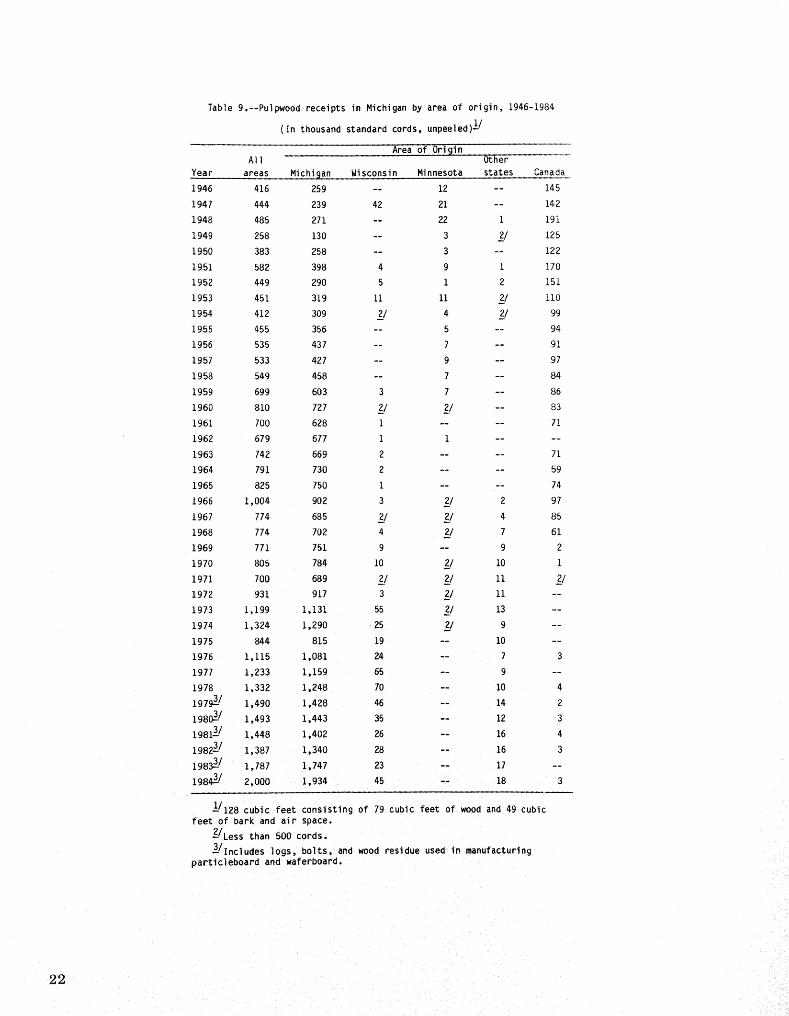
Table 9.--Pulpwoodreceiptsin Michigan by area of origin, 1946-1984
(In thousandstandard cords,unpeeled)_/
Area of OriginAll Other
Year areas Michigan Wisconsin Minnesota states Canada1946 416 259 -- 12 -- 145
1947 444 239 42 21 -- 142
1948 485 271 -- 22 1 191
1949 258 130 -- 3 2_/ 125
1950 383 258 -- 3 -- 122
1951 582 398 4 9 I 170
1952 449 290 5 1 2 151
1953 451 319 11 11 2_/ 110
1954 412 309 2_/ 4 2_/ 99
1955 455 356 -- 5 -- 94
1956 535 437 -- 7 -- 91
1957 533 427 -- 9 -- 97
1958 549 458 -- 7 -- 84
1959 699 603 3 7 -- 86
1960 810 727 2_/ 2-/ -- 83
1961 700 628 i .... 71
1962 679 677 i 1 ....
1963 742 669 2 .... 71
1964 791 730 2 .... 59
1965 825 750 i -- -- 74
1966 1,004 902 3 2_/ 2 97
1967 774 685 2_/ 2_/ 4 85
1968 774 702 4 2--/ 7 61
1969 771 751 9 -- 9 2
1970 805 784 10 2/ 10 1m
1971 700 689 2-/ 2_/ ii 2-/
1972 931 917 3 2/ 11 --m
1973 i,199 i,131 55 2_/ 13 --
1974 I,324 1,290 25 2_/ 9 --
1975 844 815 19 -- 10 --
1976 I,115 1,081 24 -- 7 3
1977 1,233 1,159 65 -- 9 --
1978 1,332 1,248 70 -- 10 4
1979_3/ 1,490 1,428 46 -- 14 2
1980_3/ 1,493 1,443 35 -- 12 3
1981_/ 1,448 1,402 26 -- 16 4
1982_/ 1,387 1,340 28 -- 16 3
1983_3/ 1,787 1,747 23 -- 17 --
1984_3/ 2,000 1,934 45 -- 18 3
I--/128cubic feet consistingof 79 cubic feet of wood and 49 cubicfeet of bark and air space.
2jLess than 500 cords.
_/Includes ]ogs, bolts, and wood residueused in manufacturingparticIeboardand waferboard.
22
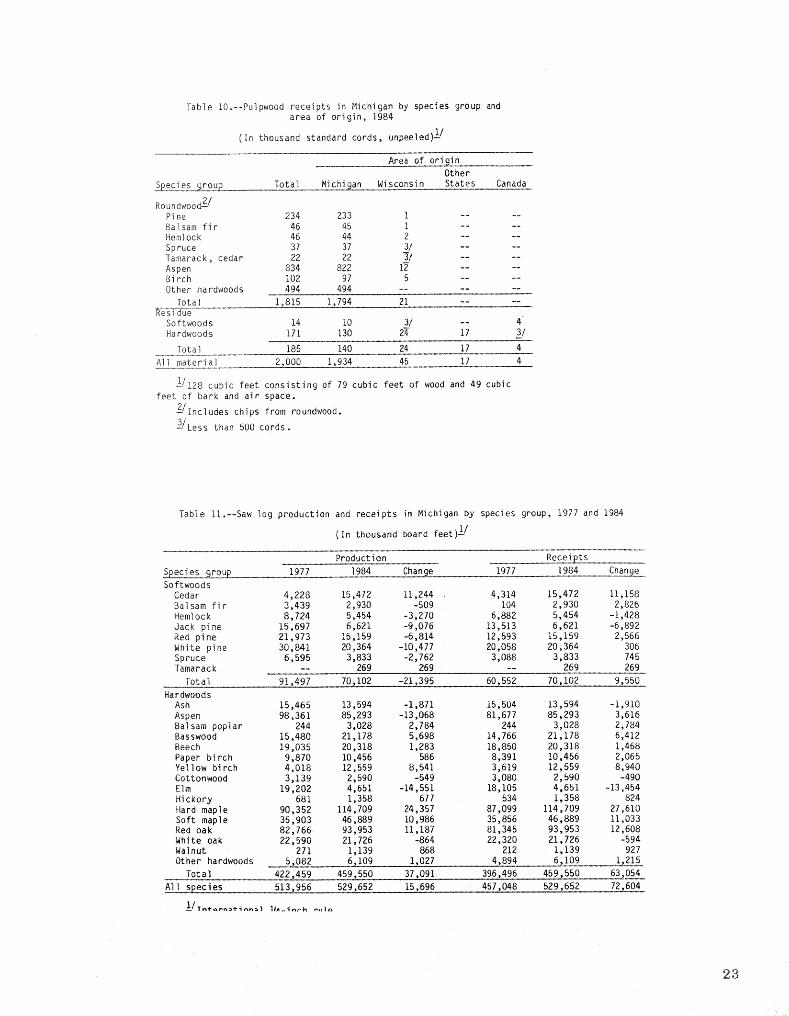
Table lO.--Pulpwood receipts in Michigan by species group andarea of origin, 1984
(In thousand standard cords, unpeeled) -I/
Area of orionOther
,S2eci es _.roup Total Michigan Wisconsin States Canada
Roundwood _/Pi ne 234 233 I ....Balsam fir 46 45 I ....Heml ock 46 44 2 ....
Spruce 37 37 3/ ....Tamarack, cedar 22 22 "3/ ....
Aspen 834 822 12 ....Birch 102 97 5 ....Other hardwoods 494 494 ......
Total 1,815 1,794 21 ....
Softwoods 14 10 3/ -- 4
Hardwoods 171 130 2# 17 --3/
Total 185 140 24 17 4
All material 2,000 1,934 45 17 4
Y128 cubic feet consisting of 79 cubic feet of wood and 49 cubicfeet of bark and air space.
-2/Includes chips from roundwood.
-3/Less than 500 cords.
Table 11o--Saw log production and receipts in Michigan by species group, 1977 and 1984
(In thousand board feet) i/
Production Receipts
Species grou_ 1977 1984 Chanqe 1977 1984 Change_Softwoods
Cedar 4,228 15,472 11,244 . 4,314 15,472 11,158Balsam fir 3,439 2,930 -509 104 2,930 2,826Hemlock 8,724 5,454 -3,270 6,882 5,454 -1,428
Jack pine 15,697 6,621 -9,076 13,513 6,621 -6,892Red pine 21,973 15,159 -6,814 12,593 15,159 2,566White pine 30,841 20,364 -10,477 20,058 20,364 306Spruce 6,595 3,833 -2,762 3,088 3,833 745Tamarack -- 269 269 -- 269 269
Total 91,497 70,102 -21,395 60,552 70,102 9,550
HardwoodsAsh 15,465 13,594 -1,871 15,504 13,594 -1,910
Aspen 98,361 85,293 -13,068 81,677 85,293 3,616Balsam poplar 244 3,028 2,784 244 3,028 2,784Basswood 15,480 21,178 5,698 14,766 21,178 6,412Beech 19,035 20,318 1,283 18,850 20,318 1,468Paper birch 9,870 10,456 586 8,391 10,456 2,065Yellow birch 4,018 12,559 8,541 3,619 12,559 8,940Cottonwood 3,139 2,590 -549 3,080 2,590 -490Elm 19,202 4,651 -14,551 18,105 4,651 -13,454Hickory 681 1,358 677 534 1,358 824Hard maple 90,352 114,709 24,357 87,099 114,709 27,610Soft map]e 35,903 46,889 10,986 35,856 46,889 11,033Red oak 82,766 93,953 11,187 81,345 93,953 12,608White oak 22,590 21,726 -864 22,320 21,726 -594Walnut 271 1,139 868 212 1,139 927Other hardwoods 5,082 6,109 1,027 4,894 6,109 1,215
Total 422,459 459,550 37,091 396,496 459,550 63,054
All species 513,956 529,652 15,696 457,048 529,652 72,604
23
± • _ ......................... ,._.].,,..._............ ............ _ .........
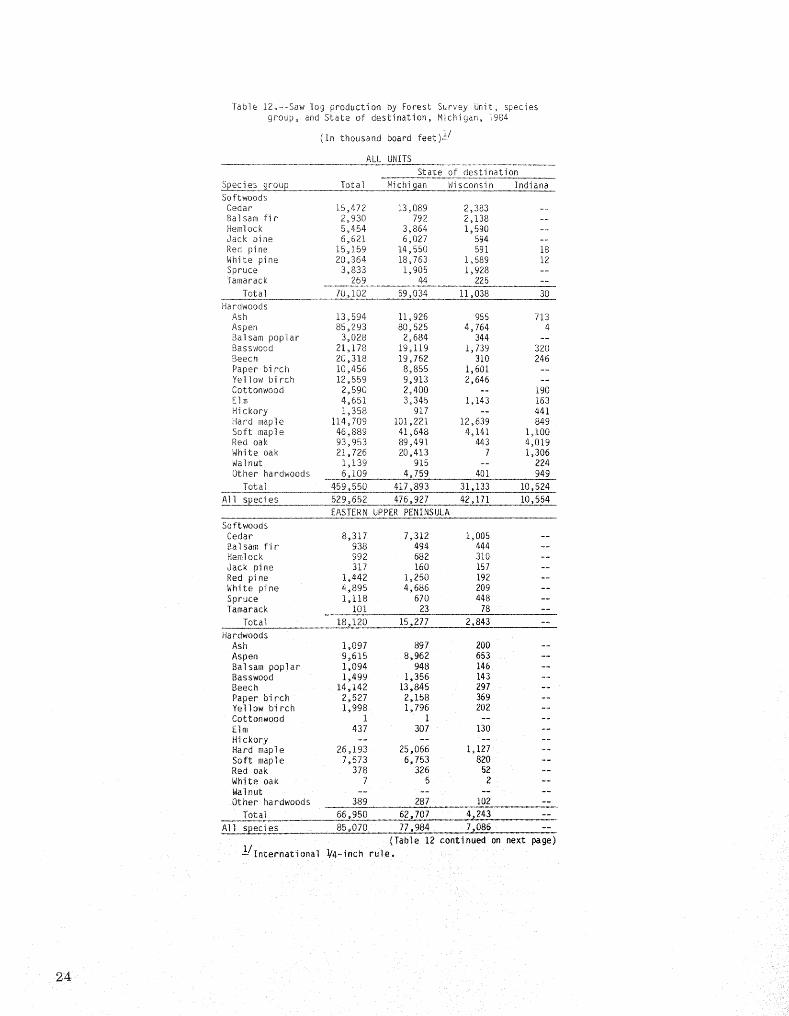
Table 12o--Saw log production by Forest Survey Unit_ speciesgroup_ and State of destination_ Michigan_ 1984
(In thousamd board feet) I--/
ALL UNITS
State of destination
.<_ec_es gr_ug__...... To.ta. lo__an Wisconsin IndianaSoftwoods
Cedar 15_472 13_089 2,383 --Balsam fir 2_930 792 2,138 --Hemlock 5,¢54 3,864 1,590 -_Jack pine 6_621 6,027 594 -_Red pine 15,159 14,550 591 18White pine 20,364 18_763 1_589 12Spruce 3,833 i_905 1,928 _-Tamarack 269 44 225 --
Total 70,102 59,034 11,038 30
HardwoodsAsh i3,594 11_926 955 713Aspen 85_293 80,525 4,764 4Balsam poplar 3,028 2,684 344 --Basswood 21,178 19,119 1,739 320Beech 20,318 19,762 310 246Paper birch 10,456 8,855 1,601 --Yellow birch 12,559 9,913 2,646 --Cottonwood 2,590 2,400 -- 190Elm 4,651 3,.345 1,143 163Hickory 1,358 917 -- 441Hard map_e 114,709 101,221 12,639 849Soft maple 46_889 41_648 4,141 1,100Red oak 93_953 89_491 443 4,019White oak 21,726 20,413 l 1,306Walnut 1,139 915 -- 224Other hardwoods 6,109 4_759 401 949
Total 459,550 417,893 31,133 10,524
All specles 529,652 476,927 42,171 10,554EASTERN UPPER PENINSULA
Softwoods
Cedar 8,317 7,312 1,005 --Bal sam fir 938 494 444 --Hem]ock 992 682 310 --
Jack pine 317 160 157 --Red pine 1,442 1,250 192 -_White pine 4,895 4,686 209 --Spruce 1,118 670 448 --Tamarack I01 23 18 --
Total 18,120 15,277 2,843 --
HardwoodsAsh 1_097 897 200 --
Aspen 9_615 8,962 653 --Ba]sam poplar 1,094 948 146 --Basswood 1,499 1,356 143 --Beech 14,142 13,845 297 --Paper birch 2_527 2,158 369 --Yellow birch 1,998 1,796 202 --Cottonwood 1 I ....Elm 437 307 130 --
Hickory .........Hard maple 26_193 25,066 1,127 --Soft maple 7,573 6,753 820 --Red oak 378 326 52 --White oak 7 5 2 --Walnut ........Other nardwooms 389 287 102 --
Total 66,950 62,707 4,243 --
_.l_ecles 85,070 77,984 7,086 --(Table 12 continued o. next page)
t-/International V4-inch rule.
24
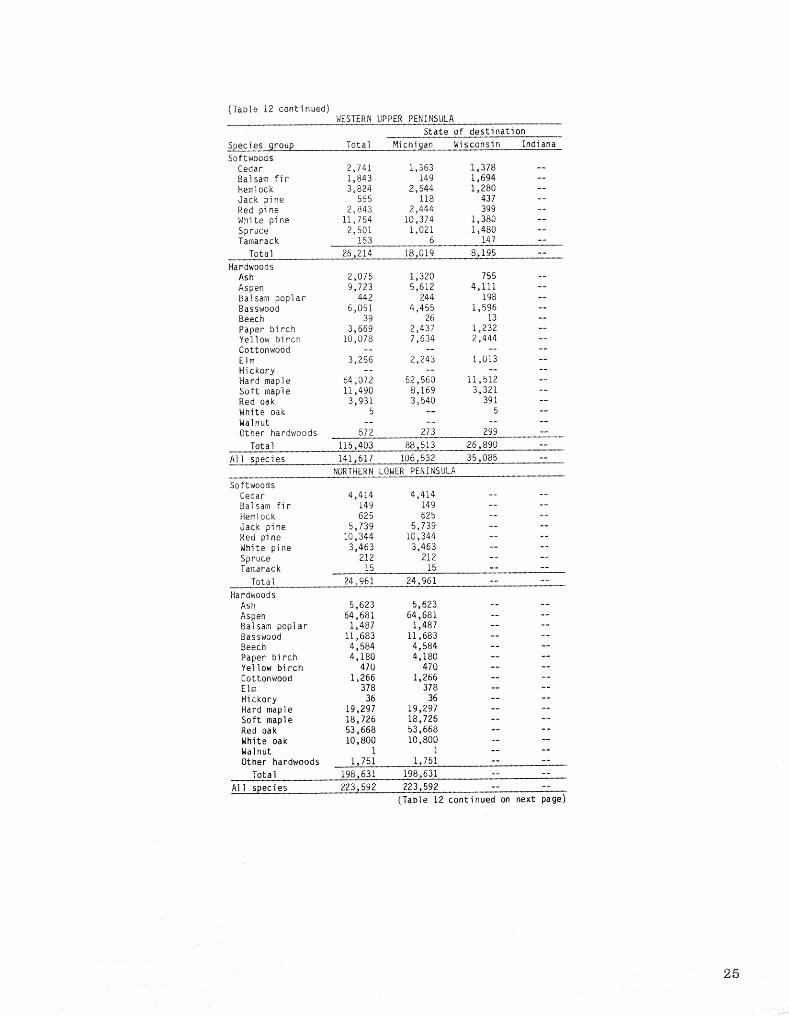
(Table 12 continued)WESTERNUPPER PENINSULA
State of destination
S=_pecies grou_ Total Michigan Wisconsin IndianaSoftwoods
Cedar 2,741 1,363 1,378 --Balsam fir 1,843 149 1,694 --Hemlock 3,824 2,544 1,280 --Jack pine 555 118 437 --Red pine 2,84,3 2,444 399 --White pine 11,754 10,374 1,380 --Spruce 2,501 1,021 1,480 --Tamarack 153 6 147 -_
Total 26,214 ],8,019 8,195 --
HardwoodsAsh 2,075 1,320 755 --
Aspen 9,723 5,612 4,111 --Balsam poplar 442 244 198 --Basswood 6,051 4,455 1,596 --Beech 39 26 13 --
Paper birch 3,669 2_437 1,232 --Yellow birch 10,078 7,634 2,444 -_Cottonwood ........
Elm 3,256 2,243 1,013 --Hickory .........Hard maple 64_072 52,560 11,512 --Soft maple 11,490 8,169 3,321 --Red oak 3,931 3,540 391 --White oak 5 -- 5 --Walnut ........Other hardwoods 572 273 299 --
Total 115,403 88,513 26,890 --
All species 141,617 106,532 35,085 --NORTHERN LOWER PENINSULA
SoftwoodsCedar 4,414 4,414 ....Balsam fir 149 149 ....Hemlock 625 625 ....
Jack pine 5,739 5,739 ....Red pine 10,344 10,344 ....White pine 3,463 3,463 ....Spruce 212 212 ....Tamarack 15 15 ....
Total 24_961 24,961 .....
Hardwoods
Ash 5,623 5,623 ....
Aspen 64,681 64,681 ....Balsam poplar 1,487 1,487 ....Basswood 11,683 11,683 .....Beech 4,584 4,584 ....
Paper birch 4,180 4,180 ....Yellow birch 470 470 ....
Cottonwood 1,266 1,266 ....Elm 378 378 ....
Hickory 36 36 ....Hard maple 19,297 19,297 ....Soft maple 18,726 18,726 ....Red oak 53,668 53,668 ....White oak 10,800 10,800 ....Walnut 1 i ....Other hardwoods 1,751 1,751 ....
Total 198,631 19,8,631 ....
_ecies 223,592 223,592 ....(Table 12 continued on next page)
25¸
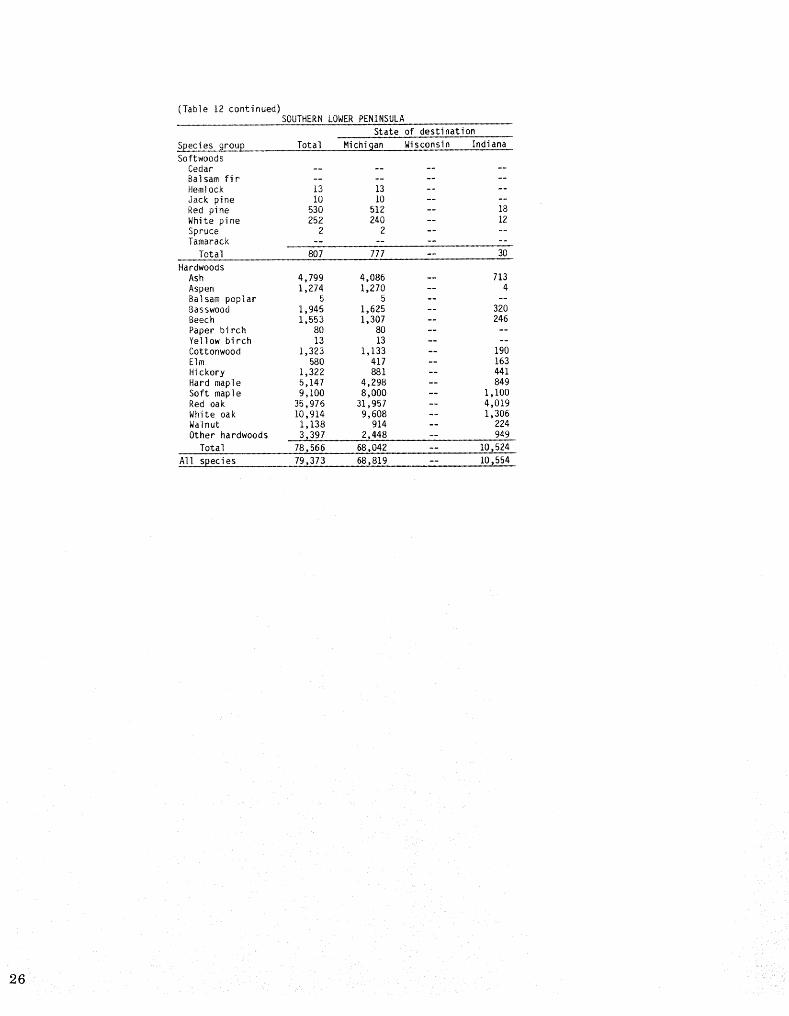
(Table 12 continued)SOUTHERNLOWERPENINSULA
State of destination
S_ciesgrg_U_) Total Michigan Wisconsin IndianaSoftwoodsCedar ........Balsam fir ........Hemlock 13 13 ....Jack pine 10 10 ....Red pine 530 512 -- 18White pine 252 240 -- 12Spruce 2 2 ....Tamarack .........
Total 807 777 -- 30Hardwoods
Ash 4,799 4,086 -- 713Aspen 1,274 1,270 -- 4Balsam poplar 5 5 .... :Basswood 1,945 1,625 -- 320Beech 1,553 1,307 -- 246Paper birch 80 80 ....Yellow birch 13 13 ....Cottonwood 1,323 1,133 -- 190Elm 580 417 -- 163Hickory 1,322 881 -- 441Hard maple 5,147 4,298 -- 849Soft maple 9,100 8,000 -- 1,100Red oak 35,976 31,957 -- 4,019White oak 10,914 9,608 -- 1,306Walnut 1,138 914 -- 224Other hardwoods 3,397 2,448 -- 949Total 78,566 68,042 -- 10,524
All species 79,373 68,819 -- 10,554
26
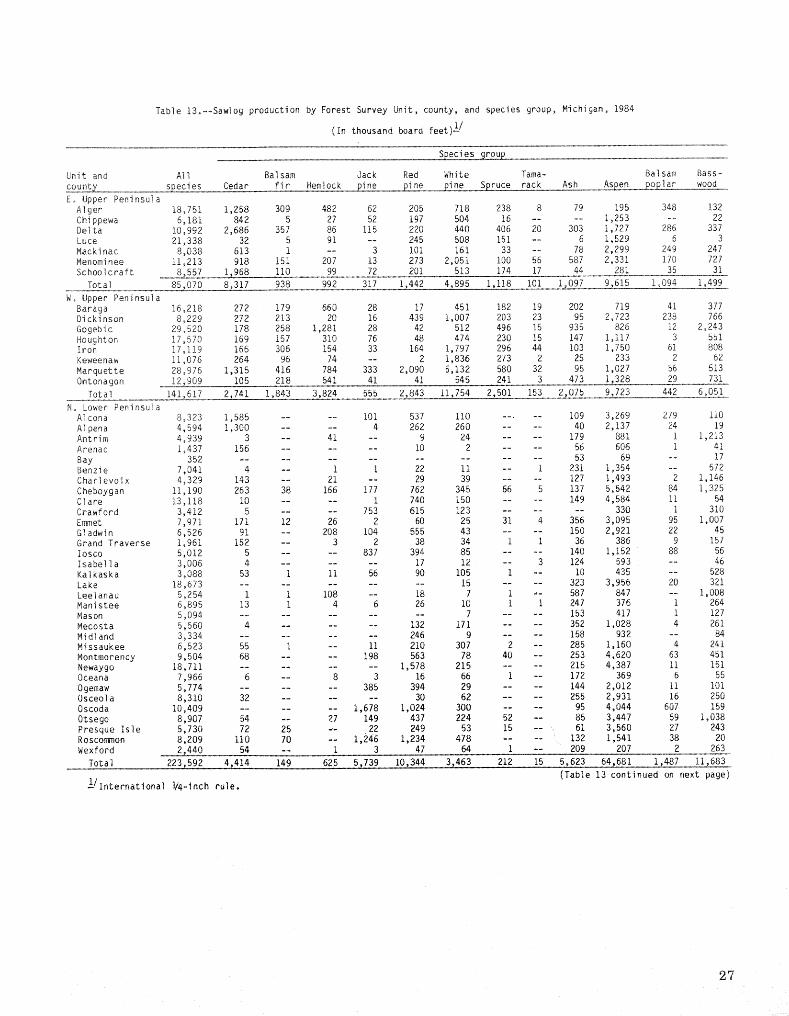
Table 13.--Sawlog production by Forest Survey Unit, county, and species group, Michigan, 1984
(In thousand board feet) I-/
S_ci es grp_u_
Unit and All Balsam Jack Red White Tama- Balsam Bass-
co:u_t_ species Cedar fir Hemlock pine ......... p_ruce rack Ash Aspen _r wood
E o Upper PeninsulaAlger 18,751 1,258 309 482 62 205 718 238 8 79 195 348 !32Chippewa 6,181 842 5 27 52 197 504 16 .... 1,253 -_ 22Delta 10,992 2,686 357 86 115 220 440 406 20 303 1,727 286 337Luce 21,338 32 5 91 -- 245 508 151 -- 6 1,529 6 3Mackinac 8,038 613 1 -- 3 101 161 33 -- 78 2,299 249 247Menominee 11,213 918 151 207 13 273 2,051 100 56 587 2,331 170 727Schoolcraft 8,557 1,968 110 99 72 201 513 174 17 44 281 35 31
Total 85,070 8,317 938 992 317 1,442 4,895 1,118 101 1,097 9,615 1o094 i_499
Wo Upper PeninsulaBaraga 16_218 272 179 660 28 17 451 182 19 202 719 41 377Dickinson 8,229 272 213 20 16 439 1,007 203 23 95 2,723 238 766Gogebic 29,520 178 258 1,281 28 42 512 496 15 935 826 12 2,243Houghton 17,570 169 157 310 76 48 474 230 15 147 1,117 3 551Iron 17,119 166 306 154 33 164 1,797 296 44 103 1,750 61 808Keweenaw 11,076 264 96 74 -- 2 1,836 273 2 25 233 2 62Marquette 28_976 1,315 416 784 333 2,090 5,132 580 32 95 1,027 56 513Ontonagon 12,909 105 218 541 41 41 545 241 3 473 1,328 29 731
Total 141_617 2,741 1,843 3,824 555 2,843 11,754 2,501 153 2,075 9,723 442 6,051
No Lower PeninsulaAlcona ;8,323 1,585 .... 101 537 110 ..... 109 3,269 279 110Alpena 4,594 1,300 .... 4 262 260 .... 40 2,137 24 19Antrim 4,939 3 -- 41 -- 9 24 ..... 179 881 1 1,213Arenac 1,437 156 ...... 10 2 .... 56 606 I 41Bay 352 ................ 53 69 -- 17Benzie 7.041 4 -- 1 I 22 11 -- i 231 1,354 -- 572Charlevoix 4 329 143 -- 21 -- 29 39 .... 127 1,493 2 1,146
Cheboygan 11 190 263 38 166 177 762 345 66 5 137 5,542 84 !,325Clare 1:3 118 10 .... i 740 150 .... 149 4,584 11 54Crawford 3 412 5 .... 753 615 123 ...... 330 i 310Emmet 7 971 171 12 26 2 60 25 31 4 356 3,095 95 1,007Gladwin 6 526 91 -- 208 104 555 43 .... 150 2,921 22 45Grand Traverse 1 961 152 -- 3 2 38 34 i I 36 386 9 157Iosco 5 012 5 .... 837 394 85 .... 140 1,152 88 56Isabella 3 006 4 ...... 17 12 -- 3 124 593 -- 46Kalkaska 3 088 53 i 11 56 90 105 I -- 10 435 -- 528Lake 18.673 .......... 15 .... 323 3,956 20 321Leelanau 5 254 I i 108 -- 18 7 i -- 587 847 -- 1,008Manistee 6 895 13 I 4 6 26 10 1 i 247 376 i 264Mason 5 094 .......... 7 .... 153 417 1 127Mecosta 5 560 4 ...... 132 171 .... 352 1,028 4 261Midland 3 334 ........ 246 9 .... 158 932 -- 84Missaukee 6 523 55 1 -- 11 210 307 2 -- 285 1,160 4 241
Montmorency 9,504 68 .... 198 563 78 40 -- 253 4,620 63 451Newaygo 18,711 ........ 1,578 215 .... 215 4,387 11 151Oceana 7,966 6 -- 8 3 16 66 1 -- 172 369 6 55
Ogemaw 5,774 ...... 385 394 29 .... 144 2,012 11 i01Osceola 8,310 32 ...... 30 62 .... 255 2,931 16 250Oscoda 10,409 ........ 1,678 1,024 300 .... 95 4,044 607 159Otsego 8,907 54 -- 27 149 437 224 52 -- 85 3,447 59 1,038Presque Isle 5,730 72 25 _- 22 249 53 15 -- _ 61 3,560 27 243
Roscommon 8,209 110 70 -- 1,246 1,234 478 .... 132 1,541 38 20Wexford 2,440 54 -- 1 3 47 64 1 -- 209 207 2 263
Total 223,592 4,414 149 625 5,739 10,344 3,463 212 15 5,623 64,681 1,487 11,,683
(Table 13 continued on next page)
t-/International V4-inch rule,
2?
(Tab]e 13 continued)
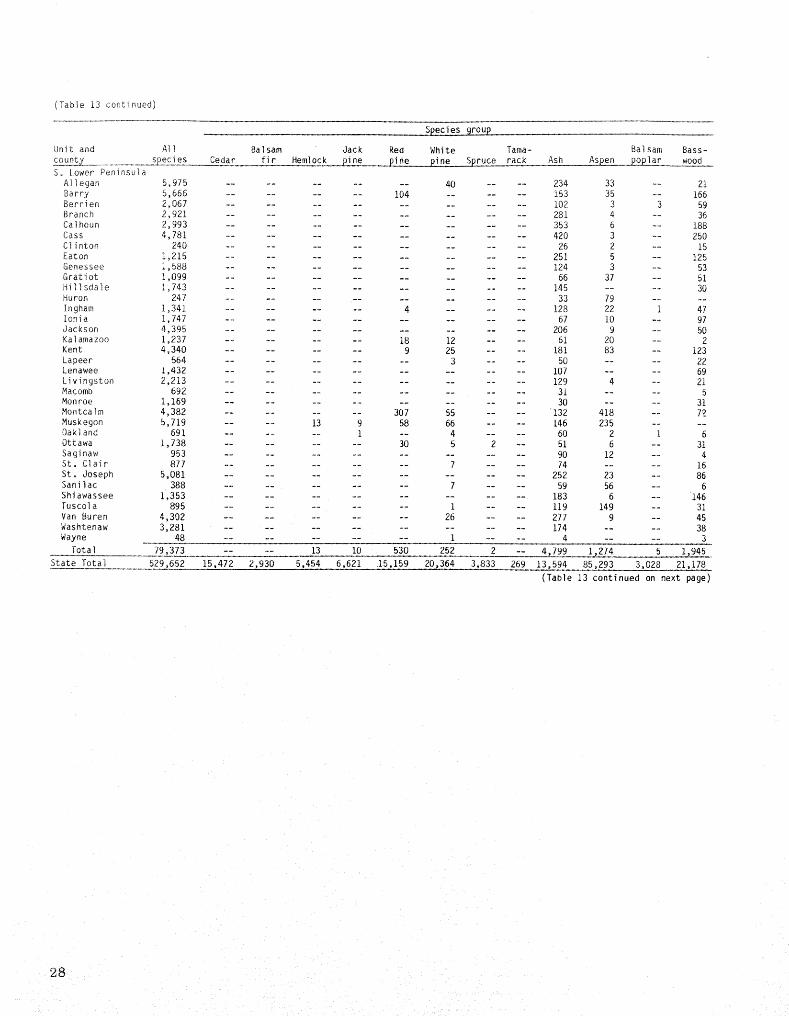
Species_up,
Unit .and All Balsam Jack Red White Tama- Balsam Bass-
£OU_Z species Cedar fir Hemlock pine __pine_ _._ruce rack Ash As_en_lar woodSo Lower Peninsula
A]legan 5,975 .......... 40 .... 234 33 -_ 21Barry 5,666 ........ 104 ...... 153 35 -_ 166Berrien 2,067 ................. 102 3 3 59Branch 2,921 ................ 281 4 -- 36Calhoun 2,993 ................ 353 6 -.- 188Cass 4,781 ................ 420 3 --- 250C]inton 240 ................ 26 2 -- 15Eaton 1,215 ................ 251 5 -- 125Genessee 1,588 ................ 124 3 -_ 53Gratiot 1,099 ................ 66 37 -- 51Hillsda]e 1,743 ................ 145 .... 30Huron 247 ...... .......... 33 79 ....Ingham i_341 ........ 4 ...... 128 22 1 47Ionia 1,747 ................ 67 10 -- 97Jackson 4,395 ................ 206 9 -- 50Kalamazoo 1,237 ........ 18 12 .... 61 20 -- 2Kent 4,340 ........ 9 25 .... 181 83 -- 123Lapeer 564 .......... 3 .... 50 .... 22Lenawee 1,432 ................. 107 .... 69Livingston 2,213 ................ 129 4 -- 21Macomb 692 ................ 31 .... 5Monroe 1,169 ................ 30 .... 31Montcalm 4,382 ........ 307 55 .... 132 418 -- 77Muskegon 5,719 .... 13 9 58 66 .... 146 235 ....Oakland 69L ...... I -- 4 .... 60 2 I 6
Uttawa 1,738 ........ 30 5 2 -- 51 6 -- 31Saglnaw 953 ................ 90 12 -- 4St. Clair 877 .......... 7 .... 74 .... 16St. Joseph 5,081 ................ 252 23 -- 86Sani]ac 388 .......... 7 .... 59 56 -- 6Shiawassee 1,353 ................ 183 6 -- 146Tusco]a 895 .......... I .... 119 149 -- 31Van Buren 4,302 .......... 26 .... 277 9 -- 45Was_tenaw 3,281 ................ 174 .... 38Wayne 48 ........... I ..... 4 .... 3
Total 79,373 .... 13 I0 530 252 2 -- 4,799 1,274 5 1,945
State Total 529,652 15,472 2,930 5,454 6,621 15,159 20,364 3,833 269 13,594 85,293 3,028 21,178
(Table 13 continued on next page)
28
..............................................................................................................rriT.............T ............ I I l i' ' n,T.........
(Table 13 continued)
Species groupOther
Unit and Paper Yellow Cotton- Hard Soft Red White hard-county Beech birch birch wood Elm Hickory maple maple oak oak Walnut woodsEo Upper Peninsula
Alger 4,187 202 365 -- 99 -- 7,305 2,359 30 .... 170Chippewa 1,207 22 255 ...... 1,645 123 11 ......Delta 260 747 387 -- 74 -- 1,537 880 76 .... 48Luce 6_593 34 431 -- 2 -- 9,510 2,179 2 .... iiMackinac 530 700 171 -- 43 -- 2,137 604 23 .... 45Menominee 173 592 208 I 151 -- 1,805 443 235 7 -- 14Schoolcraft 1,192 230 181 -- 68 -- 2,254 985 I .... 101
Total 14,142 2,527 1,998 I 437 -- 26,193 7,573 378 7 -- 389W, Upper Peninsula
Baraga -- 528 1,773 -- 191 -- 8,045 2,130 213 .... 191Dickinson -- 663 52 -- 157 -- 91! 127 285 .... 19Gogebic -- 141 3,018 -- 1,119 -- 16,455 1,843 51 I -- 66Houghton -- 179 1,499 -- 445 -- 9,484 1,903 732 I -- 30Iron -- 950 1,155 -- 618 -- 7,167 1,022 372 i -- 152Keweenaw -- 362 560 -- 5 -- 4,287 1,662 1,330 .... 1Marquette 39 726 1,165 -- 148 -- 11,916 1,790 734 .... 85Ontonagon -- 120 856 -- 573 -- 5,807 1,013 2i4 2 ,-- 28
Total 39 3,669 10,078 -- 3,256 -- 64,072 11,490 3,931 5 -- 572N° Lower Peninsula
Alcona 54 57 10 -- I -- 93 224 1,378 397 -- 9Alpena -- 51 3 ...... 47 94 317 36 ....Antrim 372 54 30 -- 86 -- 1,732 309 i .... 4Arenac 3 13 -- 8 .... 38 259 231 13 ....Bay ...... 112 ...... 94 2 5 ....Benzie 346 50 44 i I -- 1,911 1,060 1,374 i -- 56Charlevoix 430 ii 8 -- 21 -- 726 87 45 .... 1Cheboygan 118 614 20 21 II -- 801 378 288 8 -- 21Clare 103 367 13 6 -- I 148 1,230 4,568 900 -- 83Crawford 54 54 ........ 112 134 760 160 -- !Emmet 483 289 53 -- 19 -- 1,564 378 184 5 -- 112Gladwin -- 178 -- 73 4 -- 54 919 1,036 118 -- 5Grand Traverse 42 25 6 -- 5 -- 330 289 333 99 -- 13losco -- 97 -- 519 .... 24 956 560 75 -- 24Isabella 17 93 i 223 I -- 64 513 1,011 277 -- 7Kalkaska 78 74 27 -- 11 -- 744 266 519 5 -- 74Lake 123 155 26 8 55 -- 464 1,383 8,538 3,005 -- 281Leelanau 641 6 7 -- 3 -- 1,214 141 662 .... 2Manistee 255 63 5 2 6 -- 1,134 1,312 2,315 553 I 299Mason 124 I0 14 14 3 -- 356 410 3,107 324 -- 27Mecosta 26 249 3g -- 36 3 618 507 1,519 436 -- 175Midland 19 125 z 159 .... i0 682 733 173 -- 3Missaukee 79 429 6 I 5 -- 556 926 1,804 397 -- 44Montmorency 95 161 I -- I 6 855 444 1,414 188 -- 5Newaygo 279 16 12 78 2 16 684 1,536 7,556 1,856 -- 119Oceana 376 25 20 32 4 8 628 870 4,623 510 -- 168Ogemaw 3 76 2 -- I -- 97 849 1,433 227 -- 10Osceola 167 112 59 5 6 2 1,185 723 2,220 134 -- 121Oscoda 19 130 7 I I -- 161 273 1,600 289 -- 21Otsego 147 104 22 3 59 -- 2,093 314 586 3 -- 4Presque Isle 53 332 24 -- 2 -- 120 354 386 131 -- IRoscommon 2 151 4 ...... II 548 2,197 421 -- 6Wexford 76 9 6 -- 34 -- 723 264 368 54 -- 55
Total 4,584 4,180 470 1,266 378 36 19,297 18,726 53,668 10,800 I 1,751(Table 13 continued on next page)
29
(Table 13 continued)
Species groupOther
Unit and Paper Yellow Cotton- Hard Soft Red White hard-county Beech birch birch wood Elm Hickory maple maple oak oak Walnut woodsS. Lower Peninsula
A11egan 79 -- I 23 I0 17 238 487 3,544 719 24 505Barry 279 -- I 22 8 120 754 701 2,622 498 16 187Berrien 155 -- 1 116 36 30 491 120 566 117 -- 268Branch i .... 159 33 59 114 879 533 653 42 127Calhoun 28 -- I 12 27 62 127 498 1,051 495 9 136Cass 127 -- 5 13 130 176 312 624 1,672 473 111 465Clinton ...... 2 i 6 I0 67 67 19 24 1Eaton 107 .... 15 51 44 292 155 45 78 22 25Genessee Ii .... 6 16 2 95 188 723 344 20 3Gratiot ............ 80 211 530 124 ....Hillsdale ...... 45 15 9 265 254 645 275 28 32Huron -- 31 -- 82 ...... 16 ...... 6Ingham 14 .... 86 5 7 130 150 299 257 24 167lonia 122 ...... 2 22 159 165 889 80 46 88Jackson .... I 12 17 129 41 277 2,858 605 34 156Kalamazoo II -- I 37 5 43 24 178 578 143 3 101Kent 96 ...... 14 45 505 527 .2,157 465 11 99Lapeer 6 .... 14 1 -- 84 82 149 151 -- 2Lenawee 5 .... 8 10 30 133 143 613 258 41 15Livingston ...... 0 19 43 42 245 1,124 543 14 29Macomb ...... 17 50 -- 14 72 223 274 -- 6Monroe ...... 64 7 42 39 62 653 144 59 38Montcalm 47 ...... 20 I0 147 296 2,408 441 8 21Muskegon 135 2 1 I 2 i 173 500 3,516 702 -- 159Oakland 3 .... 7 29 22 14 64 270 195 -- 13Ottawa 222 .... 32 -- 6 107 256 813 123 11 43Saginaw -- 8 -- 256 .... 34 165 142 209 I 32St. Clair ...... 72 .... 27 80 176 425 ....St. Joseph 13 .... 3 17 264 141 435 2,908 320 371 248Sanilac I 21 -- 18 .... 15 69 54 82 ....Shiawassee 23 .... 33 1 12 151 130 417 216 5 30Tuscola I 18 -- 128 .... 70 266 55 46 4 7Van Buren 50 -- I 30 34 61 254 481 2,103 577 31 323Washtenaw 14 .... 7 17 57 62 254 1,562 852 179 65Wayne 3 .... 3 3 3 3 3 II Ii ....
Total 1,553 80 13 1,323 580 1,322 5,147 9,100 35,976 10,914 1,138 3,397State Total 20,318 10,456 12,559 2,590 4,651 1,358 114,709 46,889 93,953 21,726 1,139 6,109
3O
Table 14o--Saw log receipts in Michigan by Forest Survey Unit,species group, and State of origin, 1984
(In thousand board Keet) _/
ALL UNITS
All State of origin
__ States Michigan Indiana Wisconsin OhioSoftwoods
Cedar 13,089 13,089 ......Balsam fir 793 792 -- 1 --
Hemlock 3,864 3,864 ......Jack pine 6,027 6,027 ......Red pine 14,594 14,550 -- 44 --White pine 18,765 18,763 -- 2 --Spruce 1,906 1,905 -- I --Tamarack 44 44 ......
Total 59,082 59,034 -- 48 --Hardwoods
Ash 12,295 11,926 207 24 138Aspen 80,991 80,525 -- 466 --Balsam poplar 2,684 2,684 ......Basswood 19,206 19,119 25 45 17Beech 19,774 19,762 -- 12 --Paper birch 9,710 8,855 -- 855 --Yellow birch 9,919 9,913 -- 6 --Cottonwood 2,400 2,400 ......Elm 3,387 3,345 25 -- 17Hickory 917 917 ......Hard maple 101,839 101,221 83 480 55Soft maple 42,161 41,648 290 30 193Red oak 92,373 89,491 1,391 564 927White oak 21,516 20,413 678 -- 425Walnut 957 915 25 -- 17
Other hardwoods 4,759 4,759 ......
Total 424,888 417,893 2,724 2,482 1,789
All species 483,970 476,927 2,724 2,530 1,789EASTERN UPPER PENINSULA
SoftwoodsCedar 6,781 6,781 ......Balsam fir 578 578 ......Hemlock 1,189 1,189 ......
Jack pine 264 264 ......Red pine 3,487 3,487 ......White pine 9,701 9,701 ......Spruce 909 909 ......Tamarack 23 23 ......
TotaT 22,932 22,932 ......
HardwoodsAsh 848 824 -- 24 --
Aspen 7,584 7,420 -- 164 --Balsam poplar 802 802 ......Basswood 1,553 1,508 -- 45 --Beech 13,750 13,738 -- 12 --Paper birch 1,782 1,737 -- 45 --Yellow birch 2,020 2,014 -- 6 --Cottonwood I i ......Elm 325 325 ......
HicKory ..........Hard maple 28,737 28,662 -- 75 --Soft maple 6,784 6,754 -- 30 --Red oak 844 841 -- 3 --White OaK 4 4 ......Walnut ..........Other hardwoods 258 258 ......
Total 65,292 64,888 -- 404 --
All_ecies 88,224 87,820 -- 404 --(Table 14 continued on next page)
_/International V4-inch rule.
(Table 14 contimued)WESTERN UPPER PENINSULA
All State of origin
S_cies gr o_@u]_ States Michi _an Indiana Wisconsin OhioSoftwoods
Cedar 694 694 ......Balsam fir 66 65 -- 1 --
Hemlock 2,037 2,037 ......
Jack pine 14 14 ......Red pine 251 207 -- 44 _.-White pine 5,361 5,359 _- 2 --Spruce 783 782 -- L -_Tamarack 6 6 ......
Total 9,212 9,164 -- 48 --
HardwoodsAsh I_365 1,365 ......
Aspen 5,870 5,56_ -- 302 _-Balsam poplar 248 248 ......Basswood 4,145 4,145 ......Beech 31 31 ......
Paper birch 3o330 2,520 -- 810 ~-Yellow birch 7,365 7,365 ......Cottonwood ..........
Elm 2,202 2,202 ......Hickory ..........Hard maple 48,971 48,556 -- 405 --Soft maple 7,884 7,884 ......Red oak 3,571 3,010 -- 561 --White oak i 1 ......Walnut ..........Other hardwoods 278 278 ......
Total 85.251 83,183 -- 2,078 --
All species 94,473 92,347 -_- .... 2_126 --NORTHERN LOWER PENINSULA
Softwoods
Cedar 5,556 5,556 ......Balsam fir 149 149 .......Hemlock 638 538 ......
Jack pine 5,741 5,741 ......Red pine 8,750 8,750 ......White pine 3,234 3,234 ......Spruce 212 212 ......Tamarack 12 L2 ......
Total 24,292 24,292 ......
Hardwoods
Ash 4,271 4,271 ......
Aspen 64,702 64,702 ......Balsam pop_ar 1,617 1,617 ......Basswood 11,208 11,208 .......Beech 4,323 4,323 ......Paper birch 4,457 4,457 ......Yellow birch 496 496 ......Cottonwood 519 519 ......Elm 380 380 ......
Hickory 19 19 ......Hard maple 17,883 17,883 ......Soft maple 15,076 15,076 ......Red oak 44,264 44,264 ......White oak 8,437 8,437 ......Walnut 4 4 ......
Other hardwoods 1,374 1,374 ......
Tota_ 179,030 179,030 ......
All species 203_322 203,322 ......
(Table 14 continued on next page)
39,
(Table 14 continued)SOUTHERNLOWER PENINSULA
All State of ori I_.
_oup_ States Michigan,. Indiana Wisconsin OhioSoftwoods
Cedar 58 58 ......Balsam fir ..........Hemlock ..........
Jack pine 8 8 ......Red pine 2,106 2,106 ......White pine 469 469 ......Spruce 2 2 ......Tamarack 3 3 ......
Total 2,646 2,646 ......
HardwoodsAsh 5,811 5,466 207 -- 138
Aspen 2,835 2,835 ......Balsam poplar 17 17 ......Basswood 2,300 2,258 25 -- 17Beech 1,670 1,670 ......
Paper birch 141 141 ......Yellow birch 38 38 ......Cottonwood 1,880 1,880 ......Elm 480 438 25 -- 17
Hickory 898 898 ......Hard maple 6,248 6,110 83 -- 55Soft maple 12,417 11,934 290 -- 193Red oak 43,694 41,376 1,391 -- 927White oak 13,074 11,971 678 -- 425Walnut 953 911 25 -- 17Other hardwoods 2,849 2,849 ......
Total 95,305 90,792 2,724 -- 1,789
All species 97,951 93,438 2,724 -- 1,789
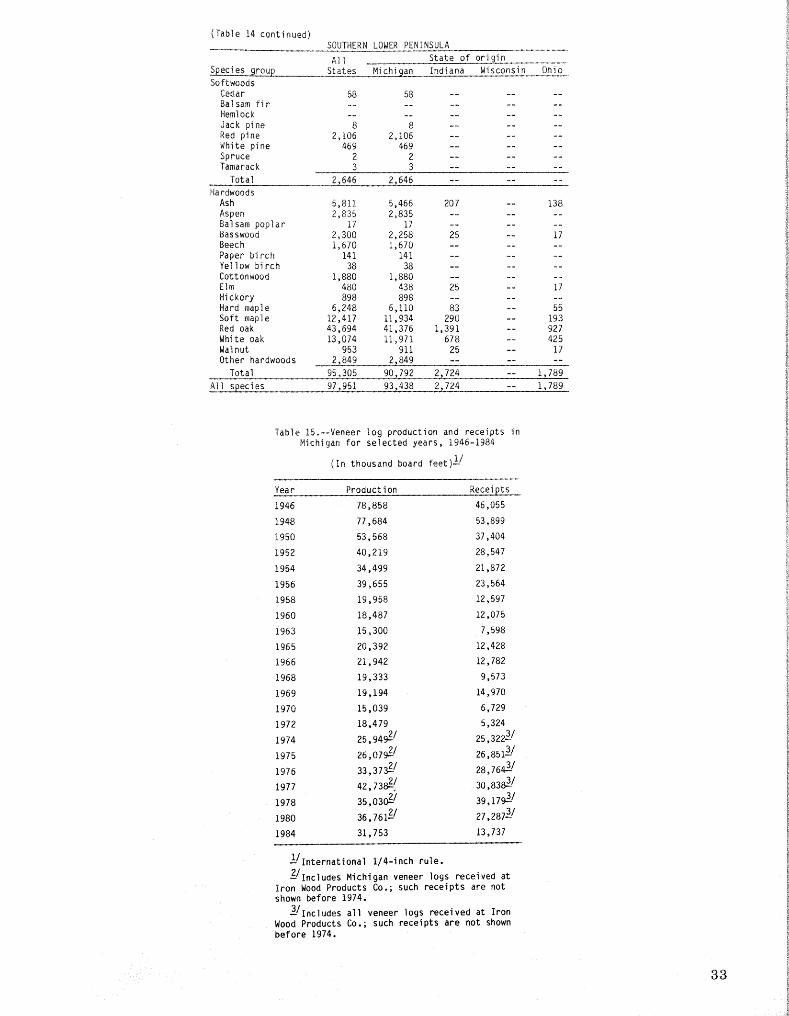
Table 15.--Veneer log production and receipts inMichigan for selected years, 1946-1984
(In thousand board feet) _/
Year Production Receits_._
1946 78,858 46,055
1948 77,684 53,899
1950 53,568 37,404
1952 40,219 28,547
1954 34,499 21,872
1956 39,655 23,564
1958 19,958 12,597
1960 18,487 12,075
1963 15,300 7,598
1965 20,392 12,428
1966 21,942 12,782
1968 19,333 9,573
1969 19,194 14,970
1970 15,039 6,729
1972 18,479 5,324
1974 25,949_2/ 25'3223--/
197s 26,07_/ 26,851_/1976 33, 373_2/ 28' 764_3/
3_i 3o,83_I1977 42,7 .
1978 35,03_i 39,17_i1980 36, 761_/ 27'2B73--/
1984 31,753 13,737
l._/international I/4-inch rule.
2--/Includes Michigan veneer logs received at
Iron Wood Products Co,; such receipts are notshown before 1974.
3--/Includes all veneer logs received at Iron
Wood Products Co.; such receipts are not shownbefore 1974.
33
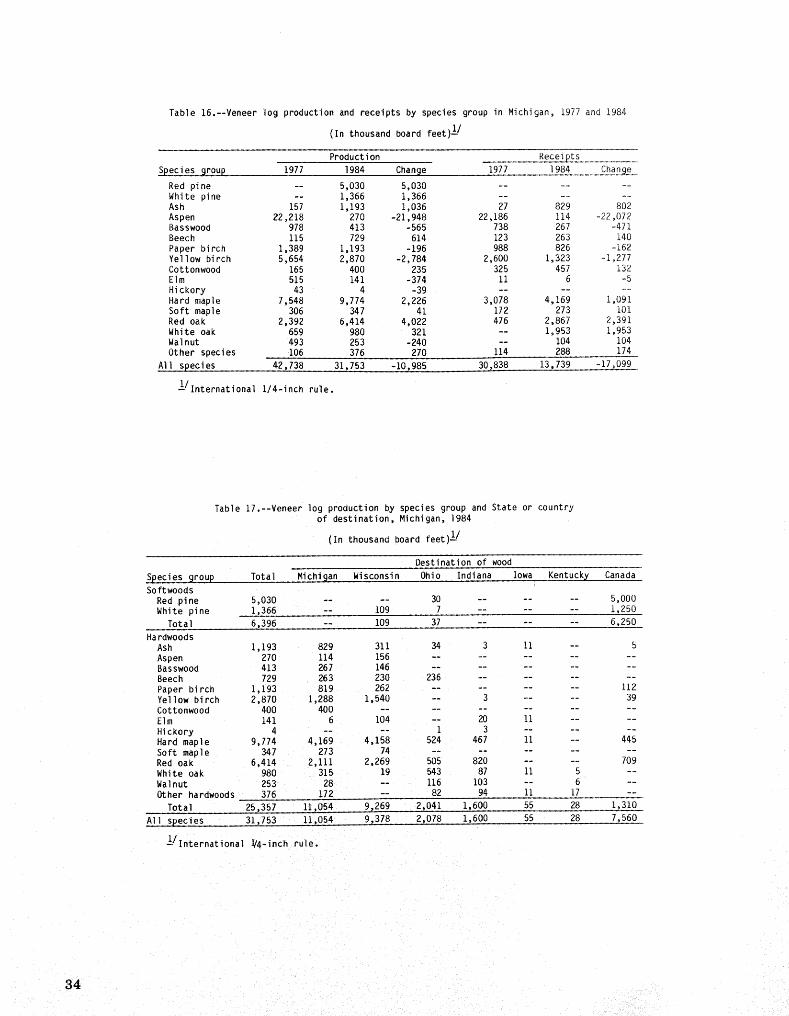
Table 16.--Veneerlog productionand receiptsby species group in Michigan, 1977and 1984
(In thousand board feet)_/
Production Receipts
Spec_gs,9,£,guP 1977 1984 Change 1977 1984 Chan_e
Red pine -- 5,030 5,030 ......White pine -- 1,366 1,366 .......Ash 157 1,193 1,036 27 829 802Aspen 22,218 270 -21,948 22,186 114 -22,072Basswood 978 413 -565 738 267 -471Beech 115 729 614 123 263 140Paper birch 1,389 1,193 -196 988 826 -162Yellow birch 5,654 2,870 -2,784 2,600 1,323 -1,277Cottonwood 165 400 235 325 457 132Elm 515 141 -374 11 6 -5Hickory 43 4 -39 ......Hard maple 7,548 9,774 2,226 3,078 4,169 1,091Soft maple 306 347 41 172 273 101Red oak 2,392 6,414 4,022 476 2,867 2,391White oak 659 980 321 -- 1,953 1,953Walnut 493 253 -240 -- 104 104Other species 106 376 270 114 288 174
All species........ 42,738 31,753 -10,985 30,838 13,739 -17,099
_/InternationalI/4-inch rule.
Table 17.--Veneerlog productionby speciesgroup and State or countryof destination,Michigan,]984
(In thousand board feet)!/
Destinationof wood
Species group Total Michigan Wisconsin Ohio Indiana Iowa Kentucky CanadaSoftwoodsRed pine 5,030 .... 30 ...... 5,000White pine 1,366 -- 109 7 ...... 1,250Total 6,396 -- 109 37 ...... 6,250
HardwoodsAsh 1,193 829 311 34 3 11 -- 5Aspen 270 114 156 ..........Basswood 413 267 146 ..........Beech 729 263 230 236 ........Paper birch 1,193 819 262 ........ 112Yellow birch 2,870 1,288 1,540 -- 3 .... 39Cottonwood 400 400 ............Elm 141 6 104 -- 20 11 ....Hickory 4 .... I 3 ......Hard maple 9,774 4,169 4,158 524 467 11 -- 445Soft maple 347 273 74 ..........Red oak 6,414 2,111 2,269 505 820 .... 709White oak 980 315 19 543 87 11 5 --Walnut 253 28 -- 116 103 -- 6 --Other hardwoods 376 172 -- 82 94 11 17 --
Total 25,357 11,054 9,269 2,041 1,600 55 28 1,310
All species 31,753 11,054 9,378 2,078 1,600 55 28 7,560
!/InternationalV4-inch rule.
84
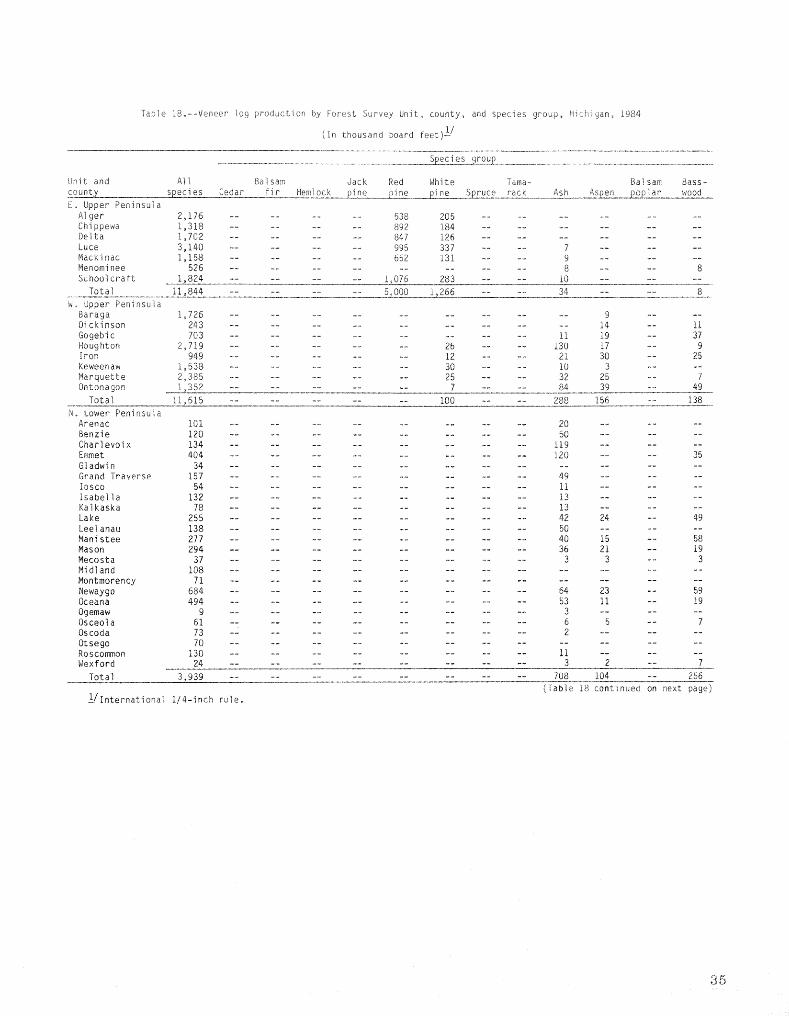
Table 18,o--Veneer ]o9 production by Fo<est Survey Unit, county, and species group_ lJici_igan, 1984
(In thousand board feet) _/
Unit and All Balsam Jack Red White Tama- Balsam Bass-
_9._ species Cedar fir Hemlock _iQe .... ___._e Spruce rack Ash Aspen ±o?]ar woodEo Upper Peni{Isuia
Alger 2_176 ......... 538 205 ..............Chippewa 1,318 ......... 892 184 ............Delta 1_702 ........ 847 ],26 .............Luce 3,140 ........ 995 337 .... 7 ......Mackinac 1,158 .......... 652 131 ...... 9 ......Menominee 526 .................. 8 .... 8
Schoolcraft 1,824 .......... I_076 283 .... 10 .......
Total 11,844 ........ 5_000 1,266 ..... 34 .... 8
_o Upper Peninsula8araga i_726 ................... 9 ....Oickinson 243 .................. 14 -- 11Gogebic 703 ................ 11 19 -- 37Houghton 2_7],9 ............ 26 .... 130 17 -- 9Iron 949 ........... 12 .... 21 30 -- 25
Keweenaw 1,538 ........... 30 .... I0 3 .....Marquette 2_385 ............ 25 .... 32 25 .°- 7Ontonagon i_352 ........... 7 ........ 84 39 -- 49
Total 11,6],5 ........... 100 .... 288 156 -- 138
No Lower PeninsulaArenac 101 ................ 20 .......8enzie 120 ................ 50 ........Charlevoix 134 ................ 119 ......Emmet 404 ................. 120 .... 35Gladwin 34 ........................
Grand Traverse 157 ................. 49 ......
losco 54 ................. ii ......
Isabella 132 ................ 13 .......
Kalkaska 78 ................ 13 ......Lake 255 ................ 42 24 -- 49
Lee]anau 138 ................ 50 ......Manistee 277 ................. 40 15 -- 58
Mason 294 ................ 36 21 -- 19Mecosta 37 ................ 3 3 -- 3Mid)and 108 .........................
Montmorency 71 ........................Newaygo 684 ................ 64 23 -- 59Oceana 494 ................ 53 11 -- 19
Ogemaw 9 ................ 3 ......Osceo]a 61 .................. 6 5 -- 7Oscoda 73 .................. 2 ......
Otse9o 70 ........................Roscommon 130 ................. II ......Wexford 24 ................ 3 2 -- 7
Total 3,939 ................ 708 104 -- 256
(Table i8 continued on next page)_/Internationai i/4-inch rule,
35
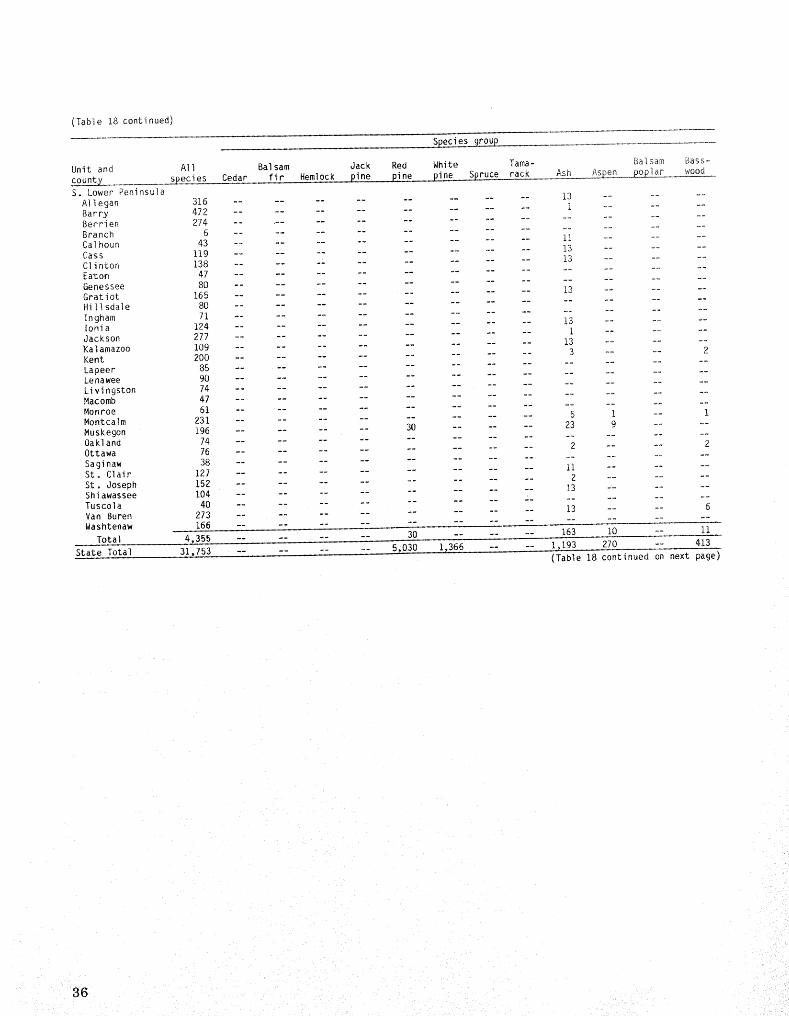
(Table 18 continued)
_group ....
Unit and A11 Bal sam Jack Red White Tama- Bai sam Bass_o
c ount_ species Cedar fir Hemlock p,in e pin__Spruce rack Ash As_en ._]@_@p]ar woodS. Lower Peninsula
A] _egan 316 ................ 13 .......Barry 472 ................ 1 ........Berri en 274 ...........................Branch 6 ........................Calhoun 43 ................ 11 .......Cass 119 ................. 13 ........Clinton 138 .............. 13 ........Eaton 47 ..........................Genessee 80 ........................Gratiot 165 ................ 13 ......Hillsdale 80 ..........................
Ingham 71 ........................Ionia 124 ................ 13 .......Jackson 277 ................ 1 ......Kalamazoo 109 ................ 13 ......Kent 200 ................ 3 .... 2
Lapeer 85 ........................Lenawee 90 ........................
Livingston 74 ........................Macomb 47 ........................Monroe 61 ........................Montcalm 231 ................ 5 I -- I
Muskegon 196 ........ 30 ...... 23 9 ....Oakland 74 ........................Ottawa 76 ................ 2 .... 2
Saginaw 38 ........................St, Clair 122 ................ ii ......
St. Joseph 152 ................. 2 .......Shi awassee 104 ................ 13 ......Tuscola 40 .......................Van Buren 273 ................ 13 .... 6Washtenaw 166 ........................
Total 4,355 ........ 30 ...... 163 10 -- 11
State Total • ,L31,753 ........ 5,030 1,366 .... i,_193 270 ---- 413(Table 18 continued on next page)
36
(Table 18 continued)
Species groupOther
Unit and Paper Yellow Cotton- Hard Soft Red White hard-Beech :birch birch wood Elm Hickory maple maple oak oak Walnut woodsco_2_/y_.......................................
E, Upper PeninsulaAlger -- i0 154 ....... 1,260 9 ............Chippewa -- 31 51 -- 44 -- 70 -- 46 ........Delta 35 320 85 ...... 250 -- 39 .......Luce 128 6 80 ...... 1,553 -- 34 ........Mackinac -- 39 59 ...... 194 -- 74 ........Menominee -- 243 24 ...... 74 -- 169 ......Schoolcraft 67 44 79 ......... 265 ............
Total 230 693 532 -- 44 -- 3,666 9 362 ......
No Upper PeninsulaBaraga -- 26 317 ...... 1,308 15 51 .........Dickinson -- 35 24 ...... 72 0 87 .......
Gogebic -- 16 248 -- 12 -- 246 5 109 .......Houghton -- 57 560 ...... 1,333 9 578 ......Iron -- 67 255 -- 20 -- 330 11 178 .......Keweenaw -- 72 166 ....... 370 3 884 .......
Marquette -- 206 437 ....... 526 15 1,107 .... 5Ontonagon -- 21 328 -- 28 -- 658 7 112 19 ....
Total -- 500 2,335 -- 60 -- 4,843 65 3,106 19 -- 5
No Lower PeninsulaArenac ............ 8 -.- 69 3 -- IBenzie ............ 5 -_ 65 ......Charlevoix ............ 15 ..........Emmet ............. 180 _- 66 .... 3Gladwin ................. 34 ......Grand Traverse ............ 43 .... 65 .......Iosco ................ 43 ......Isabella ................ 81 36 _- g
Kalkaska ................ 65 ......Lake 19 .......... 3 23 81 14 .....Leelanau ............. 6 -- 66 16 .....Manistee 78 .......... 35 51 .........Mason 10 .......... 15 25 82 86 ....Mecosta ............ 7 2 -- 19 ....Midland 43 .............. 30 35 ....
Montmorency ................ 71 ......Newaygo 39 .... 7 .... 34 51 201 191 -_ 15Oceana 30 .... 96 .... 29 30 120 66 -_ 40
Ogemaw ................... 5 -- IOsceola 6 .... 2 .... 30 5 ........Oscoda ................. 71 ......
Otsego ................. 70 ......Roscommon ................. 115 3 -- 1Wexford 7 ............ 5 ........
Total 232 .... 105 .... 410 192 1,395 474 -- 63
(Table 18 continued on next page,
37
(Table 18 continued)
Species groupOther
Unit and Paper Yel low Cotton- Hard Soft Red White hard-county Beech birch birch wood Elm Hickory maple maple oak oak Walnut woodsS. Lower Peninsula
AII egan 11 .... 40 ...... 9 115 94 _- 34Barry ...... 6 -- 1 197 -- 198 29 -- 40Berrien ...... 151 ii -- 34 11 10 .... 57Branch .................... 6 --Calhoun ................ 7 .... 25Cass .... 3 8 10 ...... 41 11 16 17Cl inton ............ 8 -- 90 17 7 3Eaton ............ 47 ...........Genessee 30 ........ -- 40 -- 10 ......Gratiot ............ 8 -- 106 36 _- 2Hi I l sdal e ............ 63 ....... 17 --Ingnam 15 .......... 33 -- 8 L5 ....Ionia ................. 92 17 -- 2Jacksor. .......... I .... 168 57 23 27Kalamazoo 6 .... 21 ...... 11 41 11 -- 6Kent i .......... 81 5 100 8 ....Lapeer 15 .......... 48 -- 22 ......Lenawee 15 .......... 57 -- 8 -- 10 --Livingston ................ 60 14 ....Macomb 15 .......... 32 ..........Monroe ............ 16 -- 24 -- 21 --Montcalm 2 ...... 10 .... 3 62 101 -- 46Muskegon 30 ............ 25 68 11 ....Oakl and 15 .......... 8 -- 51 .......Ottawa 7 .... 9 .... 32 3 21 ......Saginaw ............ 24 -- 14 ......St. Clair 44 .......... 40 -- 32 ......St. Joseph .......... 2 .... 46 10 91 1Shiawassee 29 .......... 24 -- 38 .......Tuscola ............ 40 ..........Van Buren 17 .... 60 6 -- 15 14 76 18 -- 48Washtenaw 15 .......... 8 -- 43 38 62 --
Total 267 -- 3 295 37 4 855 81 1,551 487 253 308State Total 729 1,193 2,870 400 141 4 9,774 347 6,414 980 253 376
38
Table 19.--Veneer log receipts in Michigan by area of origin for
selected years, 1946-19_4 !
(In thousand board feet) _/
Area of originAll Other
Year areas Michigan Wisconsin Minnesota States Canada
1946 46,055 44,534 .... 956 565
1948 53,899 50,151 127 _- 699 2,922
1950 37,404 33,125 454 73 477 3,275
1952 28,547 24,077 1,046 341 650 2,433
1954 21,872 18_596 582 183 137 2,374
1956 23,564 20,341 105 177 80 2,861
1958 12,597 10,785 80 166 40 1,526
1960 12 075 8,628 450 500 245 2,252
1963 7 598 5,315 495 235 165 1,388
1965 12 428 10,344 805 102 180 997
1966 12 782 10,654 585 138 206 1,199
1968 9 573 8,375 332 173 283 410
1969 14 970 12,663 i_498 300 59 450
1970 6 729 5,399 79 71 246 928
1972 5 324 4,565 66 33 -- 660
1974 25 322 _/ 12,724 !1,136 1,092 -- 370
1975 26.8512--/ 15,609 10,8_5 357 ....
1976 28 764-2-2/ 18,516 9,830 418 ....
1977 30 838 _2/ 30,378 .... 460 --
1978 39,179 _2/ 22,597 15,000 1,000 525 57
1980 27,287_/ 22,087 5,200 ......
1984 13,737 _/ 11,052 146 520 2,019 --
J International I/4-inch rule.
_/Includes all veneer logs received at Iron Wood Products Co.; such receipts arenot shown before 1974.
Table 20.--Veneer log receipts in Michigan by species group and State of origin, 1984
(In thousand board feet) _/
State of oriqinAll Penn-
Species group_tates Michigan Indiana Minnesota sylvania Kentucky, lllinois Ohio WisconsinHardwoods
Ash 829 829 ..............
Aspen 114 114 ..............Basswood 267 267 ..............Beech 263 263 ..............
Paper birch 826 819 ............ 7Yellow birch 1,323 1,288 ............ 35Cottonwood 457 400 57 ............Elm 6 6 ..............
Hard maple 4,169 4,169 ..............Soft maple 273 273 ...............Red oak 2,867 2,111 -- 520 132 ...... 104White oak 1,953 315 431 -- 259 431 345 172 --Walnut 104 28 46 .... 23 7 ....Other hardwoods 288 172 17 -- 99 ........
All ,species 13,739 11,054 55i 520 490 454 352 172 146
_/International V4-inch rule,
39,.,o
i_ii
Table 21o--Con_nercial post production by Forest Survey Unit, county, and species group_Michigan, 1984
(In thousand pieces)
Unit and All Balsam Jack Red White
coun_ _eci es Cedar fir pine p__ne _ ne S_ruce
Eastern Upper PeninsulaAl get 7 7 ..........Chippewa 2 2 ............Delta 475 150 1 108 108 108 -_Luce 4 ....... 4 ......Mackinac 37 22 5 ....... 10
Menominee 1,478 1,315 163 .........School craft 26 26 ..........
Total 2,029 1,522 169 108 112 108 10
Western Upper Penins_laBaraga 22 .... 22 ........Dickinson 38 37' i ........Keweenaw 30 30 ...........
Marquette 40 7 -- 22 --- 11 --Total 130 74 I 44 -- 11 --
_orthern Lower Peninsula
A1 pena 30 15 5 ....... 10Arenac 10 10 ..........Clare 5 5 ..........Crawford 15 ....... 15 ....Grand Traverse 10 10 ..........Isabel I a 2 2 ..........Mecosta 2 2 ..........Missaukee 6 6 ..........
Montmorency 30 15 5 ....... 10Ogemaw 15 ...... 15 ....Oscoda 20 ...... 20 ....
Presque Isle 260 155 35 ...... 70
_otal 405 220 45 -- 50 ..... 90
State total 2,564 1,816 215 152 162 119 i00
Table 22o--Pole production by Forest Survey Unit, county, and speciesgroup, Michigan,, 1984
(In number of pieces)
Unit and All Balsam Red
count_ species Ceaar fir _ SpruceEastern Upper Peninsula
Alger 1,378 -- 64 1,250 64Chippewa 3,138 .... 3_138 --Delta 2,453 1,000 171 1,111 171Luce 5,360 .... 5,360 -_Mackinac 3,272 .... 3,272 ®-Schoolcraft 3,375 -- 64 3_247 64
Total 18,976 1,000 299 17,378 299
Western Upper PeninsulaMarquette 128 -- 64 -_ 64
Total 128 -- 64 _- 64
Northern Lower Peninsula
Charlevoix 1,153 -- 21 1,111 21Cheboygan 42 -- 21 -- 21Emmet 42 -- 21 -- 21
Newaygo 16,667 .... 16,667 --
Total 17,904 -- 63 17,77.8 63
Southern Lower Peninsula
Allegan 2,112 .... 2,112 --Barry 704 .... 704 --Van Buren 704 .... 704 --
Total 3,520 ..... 3_ _-
State total 40,52§ 1,000 426 38,.6_76 426
4O
Table 23o--Logging residue generated during industrial roundwood production by Forest Survey Unit, county,and species group. Michigan, 198.4
(In thousand cubic feet)
Unit and All Balsam Jack Red White Tama- Balsam Bass-.
_gunt_y_ species Cedar fir Hemlock E_neo ,. _!ne_ne_ruce rack Ash .__Aspen__._p_2_lar woodE_ Upper Peninsula
Alger 2,253 137 91 91 70 116 114 113 10 13 90 46 25Chippewa 1,166 83 45 29 240 i48 55 138 8 2 138 9 6Delta 3,576 322 369 103 2_6 357 174 287 31 26 487 103 65Luce 1,750 6 43 76 123 64 44 103 4 2 170 9 4Mackinac 1,454 7.8 77 63 49 67 29 110 6 9 345 43 29Menominee 3,083 327 390 200 70 114 183 182 34 40 698 74 67Schoolcraft 2,602 215 118 133 520 325 101 142 28 7 161 51 33
Total 15,884 1,168 1,133 695 I_368 1,191 700 1,075 121 99 2,089 335 229
W° Upper PeninsulaBaraga 2,635 41 46 261 137 38 41 44 8 18 566 2 31Dickinson 1,886 44 168 74 50 67 82 168 16 8 776 34 56Gogebic 3_217 16 51 102 49 70 77 97 I 90 246 -- 140Houghton 1,641 14 29 46 81 19 26 30 4 19 229 -- 30Iron 3,749 32 228 53 63 81 160 264 25 33 967 13 56Keweenaw 631 25 8 4 .... 102 23 -- I 11 -- 3
Marquette 5,003 173 303 219 608 278 388 322 63 18 510 94 87Ontonagon 1,756 8 30 39 24 59 52 27 1 31 387 2 79
Total 20,518 353 863 798 i_012 612 928 975 118 218 3_692 145 482No Lower Peninsula
Alcona 1,401 133 2 -- 42 44 6 .... 15 850 43 7Alpena 788 111 3 -- 25 14 14 2 -- 9 468 18 --Antrim 278 .... 2 1 2 I .... 10 57 -- 66
Arenac 83 14 .............. 2 39 -- 2Bay 17 ................ 2 4 ....Benzie 572 ...... 1 11 1 .... 17 166 -- 33Charlevoix 319 13 -- i 2 I 2 .... 12 128 1 60
Cheboygan 1:,141 22 14 9 55 43 18 8 -- 17 645 11 IiClare 1,053 2 ..... 5 45 8 .... 8 623 1 2Crawford 433 ...... 131 76 9 .... 0 125 -- 16Emmet 502 15 1 I 1 35 1 3 -- 23 190 5 54Gladwin 610 7 -- 11 39 31 2 .... 8 384 4 2Grand Traverse 259 14 I -- 6 11 2 .... 4 136 -- 9Iosco 542 ...... 166 46 5 ..... 13 143 7 2Isabella 199 ........ I 1 ..... 6 85 -- 2Kalkaska 383 4 -- i 40 40 6 ...... 163 -- 27Lake 1,381 ...... 75 38 2 .... 19 438 I 17Leelanau 284 .... 6 -- i ...... 32 52 -- 54Manistee 936 I .... 19 44 I .... 24 210 -- 24Mason 517 ...... 4 5 ...... 10 235 -- 9Mecosta 600 ...... 3 24 9 .... 18 353 -- 14Midland 306 ........ 14 ...... 9 163 5 5Missaukee 1,016 4 .... 33 48 16 .... 16 609 -- 14Montmorency 1,040 7 1 -- 187 40 5 4 -- 17 494 11 24Newaygo 1,310 ...... 105 166 12 .... 13 399 -- 9Oceana 538 ...... 2 3 3 .... 10 173 -- 2
Ogemaw 848 ...... 207 43 i .... 13 309 3 6Osceola 907 3 .... 3 2 3 .... 14 526 -- 14Oscoda 1,115 _- i -- 344 94 17 .... 6 454 39 8Otsego 628 4 -- I 64 61 13 4 -- 5 241 4 55Presque Isle 890 27 48 -- 31 15 3 28 -- 14 511 14 15Roscommon 988 9 9 -- 222 91 26 1 -- 7 405 2 iWexford 781 4 .... 35 103 4 .... 12 208 -- 17
Total 22,665 394 80 32 1,848 1,192 191 50 -- 385 9,986 169 641
(Table 23 continued on next page)
41
(Table 23 continued)
Unit and All Balsam Jack Red White Tama- Balsam Bass-county species Cedar fir Hemlock pine. L pin,e pine S_uce rack Ash As____._o_ja_ woodS. Lower Peninsula
A]legan 479 .......... 2 .... 25 21 -- 3Barry 358 ...... I 7 ...... 12 18 -- 10Berrien 104 ................ 6 ..... 3Branch 138 ................ ],5 .... 2Calhoun 144 ...... I i ...... 19 .... 10Cass 228 ................ 22 .... 14Clinton 10 ................ 2 ......Eaton 60 ................ 14 ..... 6Genessee 67 ................ 6 .... 2Gratiot 49 ................ 3 i -- 2Hillsdale 78 ................ 8 .... 2Huron 12 ................ 2 3 ....Ingham 60 ................ 7 1 -- 2Ionia 78 ................ 3 ..... 6Jackson 179 ................ 10 .... 2Kalamazoo 85 ........ 1 i .... 4 2 .....Kent 192 .......... I .... I0 5 -- 6Lapeer 24 ................ 2 ..... 1Lenawee 62 ................ 6 .... 3Livingston 91 ................ 7 .... IMacomb 27 ................ 2 ......Monroe 50 ................ 2 .... 2Montcalm 233 ........ 16 3 .... 7 55 -- 4Muskegon 356 .... i 3 8 3 .... 8 34 ....Oakland 25 ................ 3 ......
Ottawa 171 ...... 15 20 1 .... 3 22 -- 2Saginaw 45 ................ 5 ......St. Clair 40 ................ 3 ......St. Joseph 254 ................ 14 5 -- 5Sani]ac 16 ................ 3 4 ....Shiawassee 63 ................ i0 .... 8Tuscola 46 ................ 6 7 -- 2Van Buren 301 .......... I .... 20 12 -- 4Washtenaw 136 ................ 9 .... 2Wayne ..........................
Total 4,261 .... I 20 53 12 .... 278 190 -- 104
State Total 63,328 1,915 2,076 1,526 4,248 3,048 1,831 2,100 239 980 15,957 649 1,456
(Tab]e 23 continued on next page)
42
(°Table 23 continued)
Species group
Other
Unit and Paper Yellow Cotton_ Hard Soft Red White hard-county Beech birch birch wood Elm Hickory maple maple oak oak Nal nut woods
E_ Upper PeninsulaAlger 277 53 100 -,o 62 -,- 638 190 I .... 16Ci_ippewa 76 14 26 -- 2 _- 118 27 1 ..... IDelta 121 162 151 --, 27 .... 290 190 4 ..... 11Luce 345 17 34 -_- 6 -- 570 129 I .......Mackinac 77 82 51 _- 7 -- 231 94 2 .... 5Menominee 73 135 92 -- 19 -_ 280 80 19 .... 6Schoolcraft 135 86 98 -- 15 _ 259 163 ....... 12
Total 1_I04 549 552 _ 138 -- 2_386 873 28 .... 51
Wo Upper PeninsulaBaraga -- 57 210 ,-- 221 -_ 704 175 11 .... 24Dickinson -_ 118 23 -- 14 -- 116 54 !4 I -- 3
Gogebic _-, 13 325 -- 228 _- I_497 173 7 ..... 35Houghton -- 23 121 -- 60 _- 723 127 51 .... 9Iron 46 115 241 -- 215 _ 924 185 ],9 .... 29Keweenaw -_ 21 33 ........ 237 89 74 ......
Marquette 140 190 239 ..... 28 -_ 1_017 245 64 .... 17Ontonagon -- 16 142 .... 85 -- 587 166 16 .... 5
Total 186 553 1,334 -- 851 -- 5,805 I_214 256 I -- 122
No Lower PeninsulaAlcona 5 35 ........... 8 49 138 24 ....
Alpena 2 35 ......... 5 38 40 4 ....Antrim 18 2 2 -- 5 -,- 94 18 .........Arenac ............ 2 14 10 .......
Bay .......... 6 ....... 5 .........Benzie 20 8 3 -- i _- 132 109 68 ...... 2Charlevoix 20 6 .... 1 -- 38 32 2 ........
Cheboygan 7 96 -- I .... 46 66 11 ..... 1Cl are 5 25 ........ 7 72 200 45 -- 5Crawford 3 2 ........ 6 10 47 8 ....Emmet 24 18 3 ........ 90 24 8 .... 6Gladwin -- 12 -- 5 .... 2 57 42 4 .....Grand Traverse 6 4 ........ 21 25 14 5 -- 1Iosco I 19 _- 27 .... 4 71 33 4 -_ IIsabella -- 5 .... 11 .... 3 29 42 14 ....Kalkaska 3 5 ! ....... 39 17 30 4 -- 3Lake 6 11 .... 2 -_ 29 111 4813 134 -- 15Leelanau 31 .......... 66 9 33 ......Manistee 47 30 16 -- 9 -- 95 I07 226 51 -- 32Mason 6 10 ......... 24 40 146 25 -- 3Mecosta -- 14 2 .... 2 -- 33 40 62 17 -- 9Midland 1 -20 -_ 15 ....... 37 29 8 .....
Missaukee 4 25 ......... 32 120 75 17 -- 3Montmorency 7 43 ......... 46 44 98 12 ....Newaygo 15 .... 5 .... 39 126 324 91 -- 6Oceana 20 2 -- 4 .... 34 55 195 26 -- 9
Ogemaw 1 24 ......... 12 70 131 28 ....Osceola 9 17 3 ....... 66 96 129 16 -- 6Oscoda -- 22 .......... 10 26 80 13 -- 1
Otsego 8 10 ..... 3 -- 112 19 24 ......Presque Isle 6 63 ......... 11 66 31 7 ....Roscommon -- 19 ............... 46 126 24 ....Wexford 10 9 3 -- 3 -- 79 189 80 20 -- 5
Total 285 591 33 74 26 -- 1,185 1,837 2,957 601 -- 108
(Table 23 continued on next page)
43
(Table 23 continued)
Species groupOther
Unit and Paper Yellow Cotton- Hard Soft Red White hard-.
county Beech birch birch wood Elm Hickory maple maple oak oak Nal_ut woodsS, Lower Peninsula
A11egan 23 .... 7 12 7 32 71 185 63 -- 28Barry 22 .... 2 3 9 52 54 124 33 -- 11Berrien 8 .... 10 2 2 27 6 21 4 -.- 15Branch ...... 8 2 3 7 46 20 25 3 7CaI houn I ...... 2 3 7 27 43 21 -- 9Cass 6 ...... 7 9 17 32 63 18 5 35Cl inton .............. 3 5 ...........Eaton 5 ...... 2 3 16 8 2 3 ..... iGenessee i .......... 6 10 28 14 .....Gratiot ............ 5 11 22 5 ......Hill sdale ...... 2 .... 15 14 25 9 i 2Huron -- 2 -- 5 .......... 0 .......
Ingham ...... 5 .... 8 8 12 9 .... 8Ionia 6 .......... 9 8 35 3 3 5Jackson .......... 6 2 14 111 23 2 9Kalamazoo 3 .... 3 2 5 4 17 29 8 _-- 6Kent 5 ........ 3 28 27 83 18 _- 6
Lapeer ............ 6 5 5 5 .......Lenawee .......... 2 8 8 23 9 3 --
Livingston .......... 3 2 13 42 21 .,.- 2Macomb ........ 2 -- I 4 9 9 ....Monroe ...... 3 .-- 3 2 3 25 5 3 2Montcalm 3 ...... i -- 7 17 98 20 -- 2
Muskegon 8 .......... 10 46 185 42 -- 8Oakl and ........ 2 .... 3 10 7 .....Ottawa 13 .... 2 I -- 9 21 49 11 -- 2
Saginaw ...... 14 .... 2 8 5 9 -- 2St. Clair I .... 4 .... 3 5 8 16 ....St. Joseph .......... 20 7 26 128 15 20 14Sanilac -- I .......... 3 2 3 ....Shiawassee I .... 2 .... 7 7 17 9 -- 2Tuscola ...... 7 .... 6 14 2 2 .....Van Buren 13 .... 5 l 6 24 41 105 38 2 17Washtenaw .......... 3 3 14 59 33 10 3Wayne ........................
Total 119 3 -- 79 45 87 332 600 1,580 510 52 196
State Total 1,694 1,696 1,919 153 1,060 87 9,/08 4,524 4,821 1,112 52 477 •
44
Table 24.--Residue produced at primary wood-using mills by type of material, type of use,and county, Michigan, 1984
(In thousand tons green weight)
EASTERNUPPERPENINSULAWood residue
County and Total Coarse_1/ Fine_2/ Bark_/_e of use Softwood Hardwood Softwood Hardwood Softwood Hardwood Softwood HardwoodAlger
Fiber products 2.19 34.28 2.19 34.28 ........Industrial fuel Io28 28.62 .... 1.28 28.62 1.62 16.70Domestic fuel -- 4,60 -- 4.60 ........Miscellaneous_/ _- .81 _- .81 ........
Total 3.47 68,31 2.19 39.69 1.28 28.62 1.62 16,70
ChippewaIndustrial fuel .51 .66 .... .51 .66 ....Domestic fuel 2.41 3.31 2.41 3.31 .... .87 1.24Miscellaneous_/ .70 .76 .... .70 .76 .01 --Not used .77 1,65 °36 .73 .41 .92 .13 .30
Total 4.39 6,38 2.77 4.04 1.62 2.34 1.01 1.54Delta
Fiber products .72 4.26 ,72 4.18 -- .08 ....Industrial fuel 7,90 4.99 4.31 2.23 3.59 2.76 2.70 3.31Domestic fuel .41 1.22 .41 1.21 -- .01 -- .01Miscellaneous_/ 1.53 2_12 i.ii .01 .42 2.11 .07 --Not used 1.34 .11 .98 .07 ,36 ,04 .26 .03
Total 11.90 12.70 7.53 7.70 4.37 5.00 3.03 3.35Luce
Fiber products .09 2.79 .09 2.79 ........Industrial fuel .51 24.07 .29 14.19 .22 9.88 .14 6.25Domestic fuel .01 -- .01 ..........Not used .I0 -- .06 -- .04 -- ,02 --
Total .71 26.86 .45 16.98 .26 9.88 .16 6,25Mackinac
Industrial fuel -- 4.51 -- 2,79 -- 1.72 -- 1.15Domestic fuel .51 1.97 .51 1.97 .... ,12 .79Miscellaneous_/ .54 1.02 .21 -- .33 1.02 .02 --Not used .52 .02 .27 -- .25 .02 .20 .02
Total 1.57 7.52 .99 4.76 .58 2.76 .34 1.96
(Table24 continuedon next page)
!/Suitablefor chipping such as slabs, edgings, veneer cores, etc.
2-/Notsuitable for chipping such as sawdust,veneer clippings,etc.
3-/Doesnot include bark at pulp and flakeboardmills.
_/Livestockbedding,mulch, poultry litter,etc.
45
(Table 24 continued)
Wood residue
County and Total Coarse!/ Fine-2-/ Bark_/_use Softwood Hardwood Softwood Hardwood Softwood Hardwood Softwood HardwoodMenominee
Fiber products 15,34 13.72 13.57 10.06 1.77 3.66 ....Industrial fuel 3.51 7.39 .34 4.71 3.17 2.68 6,83 6°40Domestic fuel .74 1.20 °74 1.20 .... ,21 .29Miscellaneous_/ 3.60 1.48 .... 3.60 1.48 Io56 --Not used ,06 1.58 .04 .08 .02 1.50 ,04 °06
Total 23.25 25.37 14.69 16.05 8,56 9o32 8.64 6.75Schoolcraft
Fiber products 1.34 4,03 1.34 4.03 .........Industrial fuel 1.96 2.41 .75 .04 1.21 2,37 _62 I_65Not used -- .22 -- .14 -- .08 -- °06
Total 3.30 6.66 2.09 4.21 1.21 2.45 .62 1,71All counties
Fiber products 19.68 59.08 17.91 55.34 1.77 3.74 ....Industrial fuel 15.67 72.65 5,69 23.96 9.98 48,69 11.91 35,46Domestic fuel 4.08 12.30 4.08 12.29 -- .01 1o20 2,33Miscellaneous_/ 6.37 6.19 1.32 .82 5.05 5.37 1,66 --Not used 2.79 3.58 1.71 1.02 1.08 2.56 ,65 .47
Total 48.59 153.80 30.71 93.43 17.88 60.37 15o42 38_26WESTERNUPPERPENINSULA
BaragaFiber products 1.75 8.43 1.75 8.43 ........Charcoal .30 1.58 .30 1.58 ........Industrial fuel .58 12.75 -- 10,14 .58 2.61 ,87 8_57Domestic fuel .01 -- .01 ...... .01 --Miscellaneous_/ ,63 9.11 .... ,63 9,11 .....
Total 3.27 31.87 2.06 20.15 1.21 11.72 .88 8_57Dickinson
Fiber products ,01 12.38 .01 12.38 ........Industrial fuel .01 26,00 -- 11o88 .01 14.12 -- i0_32Domestic fuel .44 .i7 .28 .12 .16 .05 °09 ,05Miscellaneous_/ -- .02 ...... .02 ....
Total .46 38.57 ,29 24.38 ,17 14,19 ,09 10_37
GogebicFiber products 2.94 28.38 2.02 19.53 .92 8.85 ....Industrial fuel .36 4.30 ,07 1,44 .29 2.86 .79 8,92Miscellaneous_/ .01 .51 .... .01 .51 ....
Total 3.31 33.19 2.09 20.97 1.22 12,22 ,79 8°92
(Table 24 continued on next page)l--/Suitable for chipping such as slabs, edgings, veneer cores, etc.
_/Not suitable for chipping such as sawdust, veneer clippings, etc.
--3--/Doesnot include bark at pulp and flakeboard mills.
_ILivestock bedding, mulch, poultry litter, etc,
46
(Table 24 continued)
Wood residue
County and Total Coarse_ / Fine._ / Bark _/
_e of use Softwood Hardwood Softwood Hardwood Softwood Hardwood Softwood Hardwood
Houghto_
Fiber products °29 21o44 °29 19.72 -- 1o72 ....Industrial fuel °62 15o21 -- 4°50 °62 10o71 °09 9°04Domestic fuel °80 Io20 °80 1o20 .... .33 o51Mi scel I a_eous_J °02 2 °36 ..... °02 2.36 ....Not used ................ 1.26
Total 1.73 40o21 io09 25.42 .64 i4.79 °42 10.81iron
Fiber products °- 9o05 -- 9.06 ........
Industria] fuel 2°93 1o12 1o85 -- 1_08 1.12 °79 3.86Domestic fuel .29 °04 °28 °04 .01 -- o10 .02Miscel _4/laneou<.3 °02 4.15 .... °02 4.15 ....Not used oi.4 .02 ..... o14 .02 ....
Total 3_3,8 14o39 2.13 9.10 io25 5.29 .89 3.88Keweenaw
Fiber products 3o10 12o97 3o10 12o97 ........Miscellaneous_/ ............. .01 .03
Not used 1.80 7°55 ..... 1.80 7.55 1.29 5.48
Iota] 4°90 20°52 3o10 12o97 1.80 7o55 Io30 5.51
MarquetteFiber products .o- °72 -- °72 ........Industrial fuel °39 °42 .... °39 .42 .38 .30Domestic fuel io54 °55 i_21 _54 .33 .01 .77 _23Miscel 4/taneous_ °09 °30 .... °09 °30 ....Not used °49 -- °38 -- oli -- .16 --
Total 2o51 1o99 1.59 1.26 _92 .73 Io31 .53
All counties
Fiber products 8°09 93°38 7o17 82.81 °92 10o57 ....Charcoal .30 1.58 °30 Io58 ........Industrial fuel 4°89 59.80 I.92 27.96 2.97 31o84 2.92 41.01Domestic fuel 3°08 1.96 2°58 io90 .50 .06 io30 .81Mi n _4/scella eou_ .... 77 16.45 .... .77 16.45 .01 .03Not used 2°43 7°57 °38 -- 2°05 7.57 1o45 6.74
Total 19o56 180o74 12o35 114o25 7.21 66.49 5.68 48.59
NORTHERNLOWER PENINSULA
Alcona
Fiber products -- 2°30 -- 2.30 ........Industrial fuel °.- io34 ....... Io34 ....Domestic fuel Io45 1o81 I_45 1o81 .... °60 .33
u_4/ °84 -1.06 ..... ,84 1,06 -- 1,42Miscellaneo __.
Iota] 2°29 6.51 1.45 4.11 .84 2°40 °60 1.75
(Table 24 continued on next page)
_/Suitab]e for chipping such as slabs_ edgings, veneer cores, etco
_/Not suitable for chipping such as sawdust, veneer clippings, etco
_/Does not include bark at pulp and flakeboard mi]]so
4--/Livestock bedding_ mu]ch_ poultry ]itter_ etco
47
(Table 24 continued)
Wood residue
Fin_ / Bark_County and Total Coarse_I/t_Lp__eofuse Softwood Hardwood Softwood Hardwood Softwood Hardwood Softwood HardwoodAlpena
Fiber products -- 4.88 -- 4.88 ........Industrial fuel ,78 ,71 ..... 78 o71 .....Domestic fuel 1,13 5.92 1.13 5°92 ..... 44 2°52Miscellaneous_/ 1.45 °28 .... 1,45 °28 -- 2°07Not used 4,37 5.29 3,76 -- o61 5,29 °94 _-
Total 7,73 17,08 4.89 10.80 2.84 6°28 io38 4°59Antrim
Industrial fuel _- 2,85 -- 2°85 ........Domestic fuel ,01 2.76 .01 2.76 ...... o13Miscellaneous_/ °06 3.18 ..... 06 3.18 °09 2o15Not used o10 .10 .10 ..... 10 ....
Total ,17 8.89 .11 5.61 .06 3°28 °09 2,28Arenac
Fiber products -- 5.99 -- 4.64 -- 1,35 .... 1,97Domestic fuel .33 8.33 .33 8.33 ...... 3°54Miscellaneous_/ o19 6.47 -- .17 .19 6,30 oi0 _-Not used .............. °07
Total .52 20,79 °33 13.14 .19 7,65 o10 5°58
BayDomestic fuel -- .15 -- .15 ...... .06Miscellaneous_/ -- .15 -- .04 -- .11 -- ,02Not used -- ,03 -- °02 -- .01 -- .01
Total -- °33 -- .21 -- .12 -- .09Benzie
Industrial fuel -- 2.99 -- 2,99 ...... 1.25Domestic fuel .02 3.63 ,01 3.59 .01 .04 -- Io49Miscellaneous_/ -- 3.68 ...... 3.68 ....Not used -- ,25 -- .09 -- .16 -- .04
Total .02 i0_55 o01 6,67 o01 3°88 -- 2_78Charlevoix
Fiber products .80 5.52 .80 5°52 ........Industrial fuel ,59 .13 .02 ,11 .57 .02 ,01 .04Domestic fuel .40 1.43 .40 1,43 ........Miscellaneous_/ 1.06 4.29 .58 -- ,48 4.29 ,42 2,27Not used -- .35 -- °35 .... .19 ,74
Total 2.85 ii,72 1.80 7.41 1.05 4o31 °62 3°05Cheboygan
Fiber products 1.19 13,77 1.19 13,77 ........Industrial fuel .01 .37 -- .28 .01 ,09 ,03 .28Domestic fuel .19 1.32 .19 .82 -_ ,50 _08 °02Miscellaneous_/ .18 2.17 .06 ,39 ,12 1,78 .51 5,27Not used 1.34 7.55 ,39 ,66 °95 6_89 .12 1,16
Total 2.91 25.18 1.83 15.92 1.08 9.26 °74 6.73
(Table 24 continued on next page)_/Suitable for chipping such as slabs, edgings, veneer cores, etco
_/Not suitable for chipping such as sawdust, veneer clippings, etc,
_Does not include bark at pulp and flakeboard mills°
_/Livestock bedding, mulch, poultry litter, etc,
48
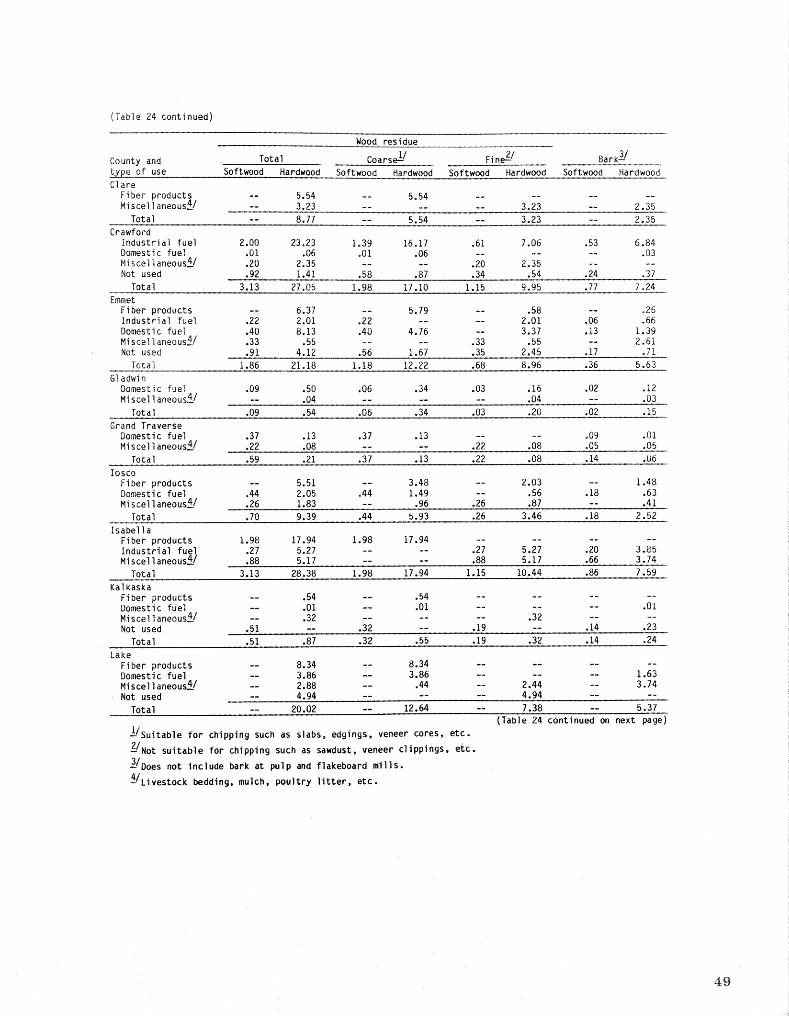
(Table 24 continued)
Wood residue
County and Total Coarse_I/ Fine2-,/ Bark_/ty_e of use Softwood Hardwood Softwood Hardwood Softwood Hardwood Softwood HardwoodClare
Fiber products -- 5.54 -- 5.54 ........Miscellaneous_/ -- 3.23 ...... 3.23 -- 2.35
Total -- 8.77 -- 5,54 -- 3.23 -- 2.35Crawford
Industrial fuel 2.00 23.23 1.39 16,17 .61 7.06 .53 6.84Domestic fuel ,01 .06 .01 °06 ...... .03Miscellaneous_/ .20 2.35 .... .20 2.35 ....Not used .92 1.41 .58 °87 .34 .54 .24 .37
Total 3.13 27.05 1.98 17.10 1.15 9.95 .77 7°24Emmet
Fiber products -- 6.37 -- 5.79 -- .58 -- _26Industrial fuel ,22 2.01 .22 .... 2,01 .06 .66Domestic fuel .40 8.13 .40 4.76 -- 3,37 ,13 1,39Miscellaneous_/ .33 .55 .... .33 .55 -- 2.61Not used .91 4.12 .56 1.67 .35 2,45 .17 .71
Total 1.86 21.18 1.18 12.22 .68 8.96 .36 5.63Gladwin
Domestic fuel .09 .50 .06 .34 .03 .16 .02 .12
Miscellaneous_/ -- .04 ...... .04 -- .03 ITotal .09 .54 .06 .34 .03 .20 .02 .15
Grand TraverseDomestic fuel .37 .13 .37 .13 .... .09 .01Miscellaneous_/ ,22 .08 -- -- .22 .08 .05 .05
Total .59 .21 .37 .13 .22 .08 .14 .06losco
Fiber products -- 5.51 -- 3.48 -- 2.03 -- 1.48Domestic fuel ,44 2.05 .44 1.49 -- .56 o18 .63Miscellaneous_/ .26 1.83 -- .96 .26 .87 -- .41
Total .70 9,39 .44 5.93 .26 3.46 .18 2.52Isabella
Fiber products 1.98 17.94 1.98 17.94 ........Industrial fuel .27 5.27 .... .27 5.27 .20 3.85Miscellaneous_/ .88 5.17 .... .88 5.17 .66 3.74
Total 3.13 28.38 1.98 17.94 1.15 10.44 .86 7.59Kalkaska
Fiber products -- .54 -- .54 ........Domestic fuel -- .01 -- .01 ...... .01Miscellaneous_/ -- .32 ...... .32 ....Not used .51 -- .32 -- .19 -- .14 .23
Total .51 .87 .32 ,55 .19 .32 .14 °24Lake
Fiber products -- 8.34 -- 8.34 ........Domestic fuel -- 3.86 -- 3.86 ...... 1.63Miscellaneous4_/ -- 2.88 -- ,44 -- 2.44 -- 3.74Not used -- 4.94 ...... 4.94 ....
Total -- 20.02 -- 12.64 -- 7.38 -- 5.37(Table24 continuedon next page)
1--/Suitablefor chippingsuch as slabs,edgings, veneer cores, etc.
2JNot suitable for chipping such as sawdust,veneer clippings,etc.
3-/Doesnot include bark at pulp and flakeboardmills.
_/Livestockbedding,mulch, poultry litter,etc.
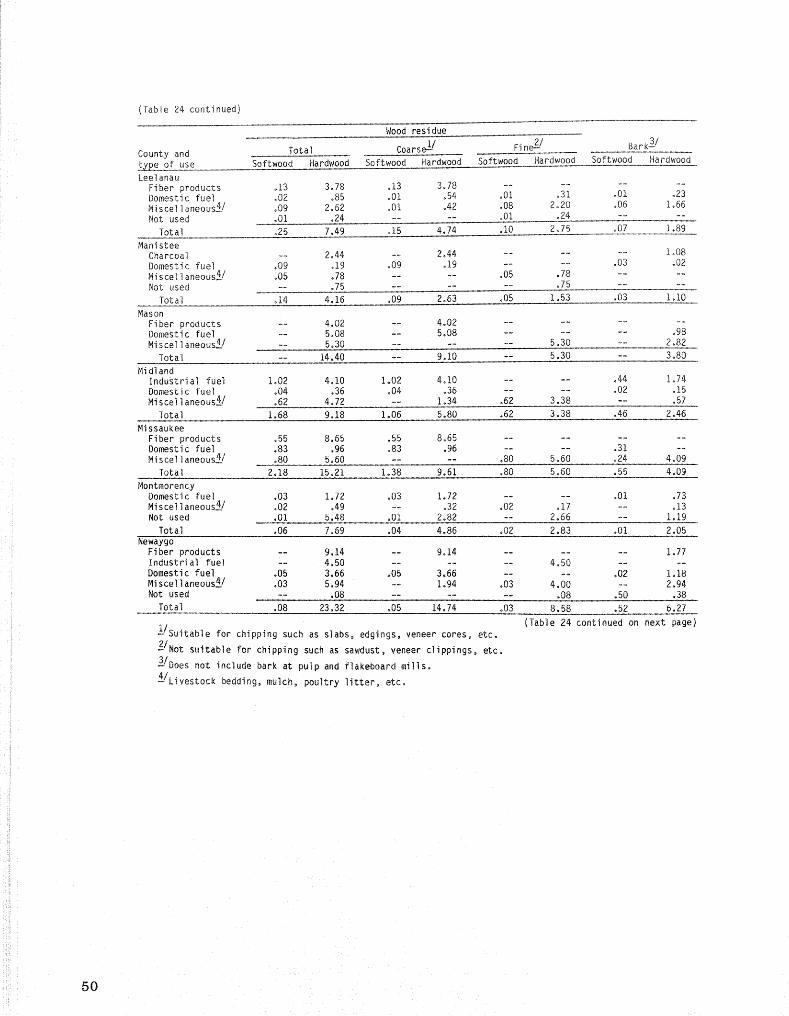
(Table 24 continued)
Woodresidue
County and Total Coarse_I/ Fine?-/ Bark_/tczpe of use Softwood Hardwood Softwood Hardwood Softwood Hardwood Softwood Hardwood
D Leelanau_i Fiber products o13 3.78 .13 3°78 ..........
Domestic fuel °02 °85 o01 .54 o01 o31 ,01 °23
i Miscellaneous_/ °09 2o52 o01 .42 ,08 2°20 o06 1966Not used ,01 .24 ..... 01 °24 ....
ii Total °25 7.49 o15 4°74 o10 2°75 °07 1.89
i Manistee!! Charcoal -- 2,44 -- 2°44 ...... 1o08
Domestic fuel °09 ,19 .09 o19 ..... 03 .02Miscellaneous_/ 905 °78 .... .05 .78 ....
ii Not used _- °75 ....... 75 ....Total o14 4.15 ,09 2°63 °05 1,53 °03 1,10
Mason_i Fiber products -- 4,02 -- 4,02 ..........] Domestic fuel -- 5°08 -- 5_08 ...... °98i Misceilaneous_/ -- 5,30 ...... 5_30 -- 2.82
Total -- 14o40 -- 9.10 -- 5.30 -- 3,80Midland
Industrial fuel Io02 4.10 1o02 4o10 .... °44 Io74Domestic fuel ,04 .36 °04 .36 .... ,02 .15Miscellaneous_/ °62 4.72 -- 1.34 062 3°38 -- .57
Total 1.68 9:18 1.06 5.80 .62 3.38 .46 2.46Missaukee
Fiber products °55 8.65 ,55 8.65 ........Domestic fuel .83 .96 °83 °96 .... o31 --Miscellaneous_/ °80 5,60 .... °80 5.60 .24 4,09
Total 2o18 15o21 1.38 9.61 _80 5.60 .55 4.09
MontmorencyDomestic fuel .03 1o72 .03 1.72 .... .01 .73Miscellaneous_/ °02 °49 -- °32 °02 .17 -- ,13Not used .01 5°48 .01 2,82 -- 2.56 -- 1.19
Total _06 7°69 °04 4.85 °02 2°83 _01 2.05Newaygo
Fiber products -- 9,14 -- 9o14 ...... 1,77Industrial fuel _- 4.50 ...... 4°50 ....Domestic fuel .05 3.66 .05 3.66 .... .02 1.18Miscellaneous_/ .03 5°94 -- 1,94 .03 4_00 -- 2,94Not used -- °08 ...... .08 .50 ,38
Total .08 23°32 °05 14.74 °03 8.58 °52 6.27
(Table 24 continued on next page)_/Suitable for chipping such as slabs_ edgings, veneer cores_ e%Co
_/Not suitable for chipping such as sawdust, veneer clippings, etc.
_/Does not include bark at pulp and flakeboard mills.
_/Livestock bedding, mulch° poultry litter, etc,
5O
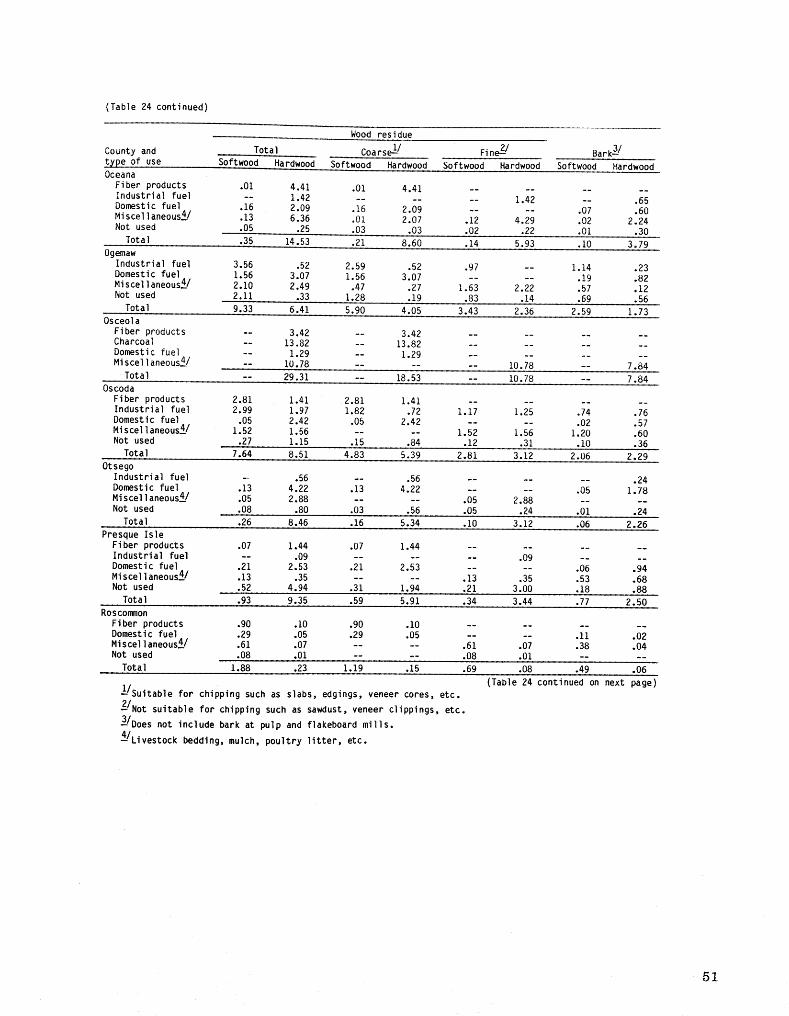
(Table 24 continued)
Wood residue
County and Total Coarse!1/ Fine_2/ Bark_/
type of use Softwood Hardwood Softwood Hardwood Softwood Hardwood Softwood HardwoodOceana
Fiber products .01 4.41 .01 4.41 ........Industrialfuel -- 1.42 ...... 1.42 -- .65Domestic fuel .16 2.09 .16 2.09 .... .07 .60Miscellaneous_/ .13 6.36 .01 2.07 .12 4.29 .02 2.24Not used .05 .25 .03 .03 .02 .22 .01 .30
Total .35 14.53 .21 8.60 .14 5.93 .10 3.79Ogemaw
Industrialfuel 3.56 .52 2.59 .52 .97 -- 1.14 .23Domestic fuel 1.56 3.07 1.56 3.07 .... .19 .82Miscellaneous_/ 2.10 2.49 .47 .27 1.63 2.22 .57 .12Not used 2.11 .33 1.28 .19 .83 .14 .69 .56
Total 9.33 6.41 5.90 4.05 3.43 2.36 2.59 1.73Osceola
Fiber products -- 3.42 -- 3.42 ........Charcoal -- 13.82 -- 13.82 ........Domestic fuel -- 1.29 -- 1.29 ........Miscellaneous_/ -- 10.78 ...... 10.78 -- 7.84Total -- 29.31 -- 18.53 -- 10.78 -- 7.84
Oscoda
Fiber products 2.81 1.41 2.81 1.41 ........Industrialfuel 2.99 1.97 1.82 .72 1.17 1.25 .74 .76Domestic fuel .05 2.42 .05 2.42 .... .02 .57Miscellaneous_/ 1.52 1.56 .... 1.52 1.56 1.20 .60Not used .27 1.15 .15 .84 .12 .31 .10 .36
Total 7.64 8.51 4.83 5.39 2.81 3.12 2.06 2.29OtsegoIndustrialfuel - .56 -- .56 ...... .24Domestic fuel .13 4.22 .13 4.22 .... .05 1.78Miscellaneous_/ .05 2.88 .... .05 2.88 ....Not used .08 .80 .03 .56 .05 .24 .01 .24
Total .26 8.46 .16 5.34 .10 3.12 .06 2.26Presque IsleFiber products .07 1.44 .07 1.44 ........Industrialfuel -- .09 ...... .09 ....Domestic fuel .21 2.53 .21 2.53 .... .06 .94Miscellaneous_/ .13 .35 .... .13 .35 .53 .68Not used .52 4.94 .31 1.94 .21 3.00 .18 .88Total .93 9.35 .59 5.91 .34 3.44 .77 2.50
RoscommonFiber products .90 .10 .90 .10 ........Domestic fuel .29 .05 .29 .05 .... .11 .02MisceIlaneous_/ .61 .07 .... .61 .07 .38 .04Not used .08 .01 .... .08 .01 ....
Total 1.88 .23 1.19 .15 .69 .08 .49 .06
(Table24 continuedon next page)_/Suitable for chippingsuch as slabs,edgings, veneer cores, etc.
_/Not suitable for chipping such as sawdust,veneer clippings,etc.
Z/Does not include bark at pulp and flakeboardmills.
_/Livestock bedding,mulch, poultry litter,etc.
51
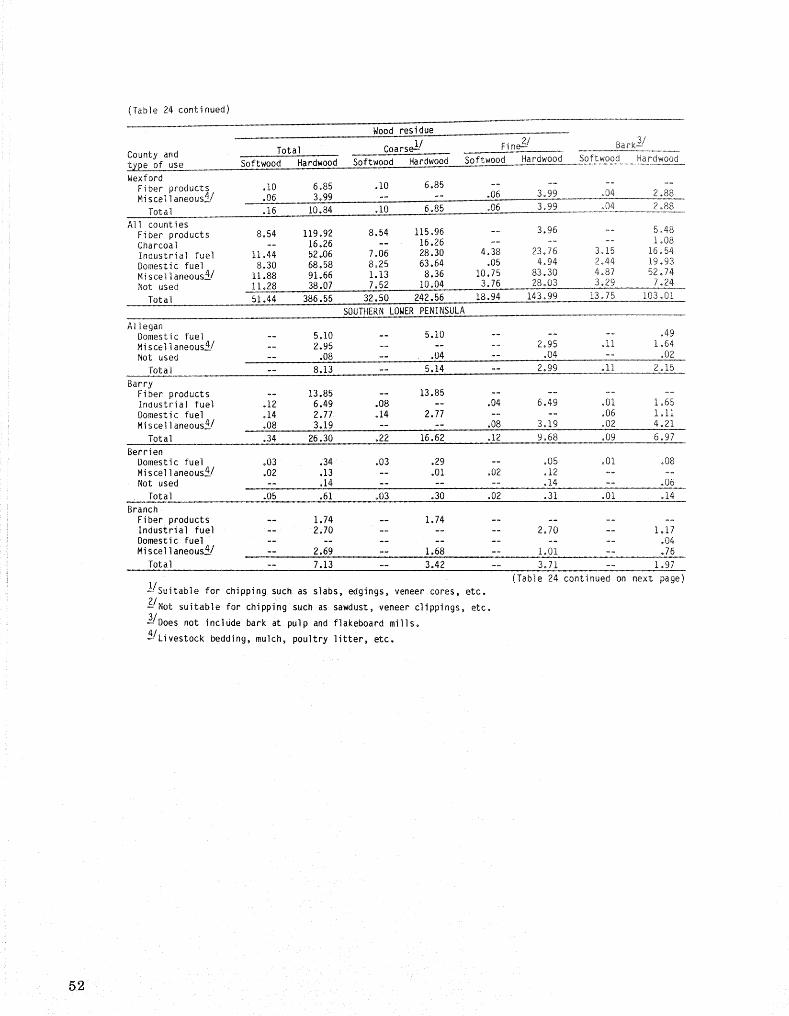
(Table 24 continued)
Wood residue
County and Total CoarseSt/ Fine_2/ Bar k_/t_e of use Softwood Hardwood Softwood Hardwood Softwood Hardwood Softwood HardwoodWexford
Fiber products .I0 6_85 .10 6,85 ..........Miscellaneous_J _06 3.99 ..... 06 3°99 °04 2_88
Total .16 10.84 .10 6°85 °06 3.99 °04 2°88All counties
Fiber products 8.54 119.92 8.54 115.96 -- 3_96 -_ 5°48Charcoal -- 16,26 -- 16,26 ....... io08Industrial fuel 11.44 52,06 7°06 28.30 4.38 23°76 3o15 16o54Domestic fuel 8.30 68,58 8,25 63.64 ,05 4°94 2°44 19.93MisceIIaneous_/ 11.88 91.66 1.13 8.36 10.75 83.30 4_87 52,74Not useG 11.28 38.07 7.52 10.04 3°76 28°03 3°29 7°24
Total 51.44 386,55 32,50 242.56 18.94 143.99 13.75 103o01SOUTHERNLOWERPENINSULA
AlleganDomestic fuel -- 5.10 -- 5.10 ...... °49Miscellaneous_/ -- 2.95 ...... 2.95 oli 1.64Not used -- .08 -- .04 -- _04 -- .02
Total -- 8.13 -- 5,14 -- 2.99 oli 2o15
BarryFiber products -- 13.85 -- 13.85 ........Industrial fuel .12 6.49 .08 -- °04 6.49 o01 1o65Domestic fuel _14 2,77 .14 2.77 .... °06 Io11Miscellaneous_/ _08 3.19 .... .08 3o19 °02 4_21
Total .34 26.30 .22 16.62 .12 9°68 .09 6°97Berrien
Domestic fuel °03 ,34 .03 °29 -- °05 o01 °08Miscel|aneous_/ .02 ,13 -- .01 .02 o12 ....Not used -- .14 ...... .14 -- ,06
Total ,05 .61 .03 °30 ,02 o31 o01 o14Branch
Fiber products -- 1,74 -- 1.74 ........Industrial fuel -- 2.70 ...... 2.70 -- i.17Domestic fuel .............. .04Miscellaneous_/ -- 2,69 -- 1.68 -- 1.01 -- .76
Total -- 7.13 -- 3.42 -- 3.71 -- 1.97
(Table 24 continued on next page)t-/Suitable for chipping such as slabs, edgings, veneer cores, etc.
Z/Not suitable for chipping such as sawdust, veneer clippings, etco
3-JDoesnot include bark at pulp and flakeboard mills.
4--/Livestock bedding, mulch, poultry litter, etc.
52
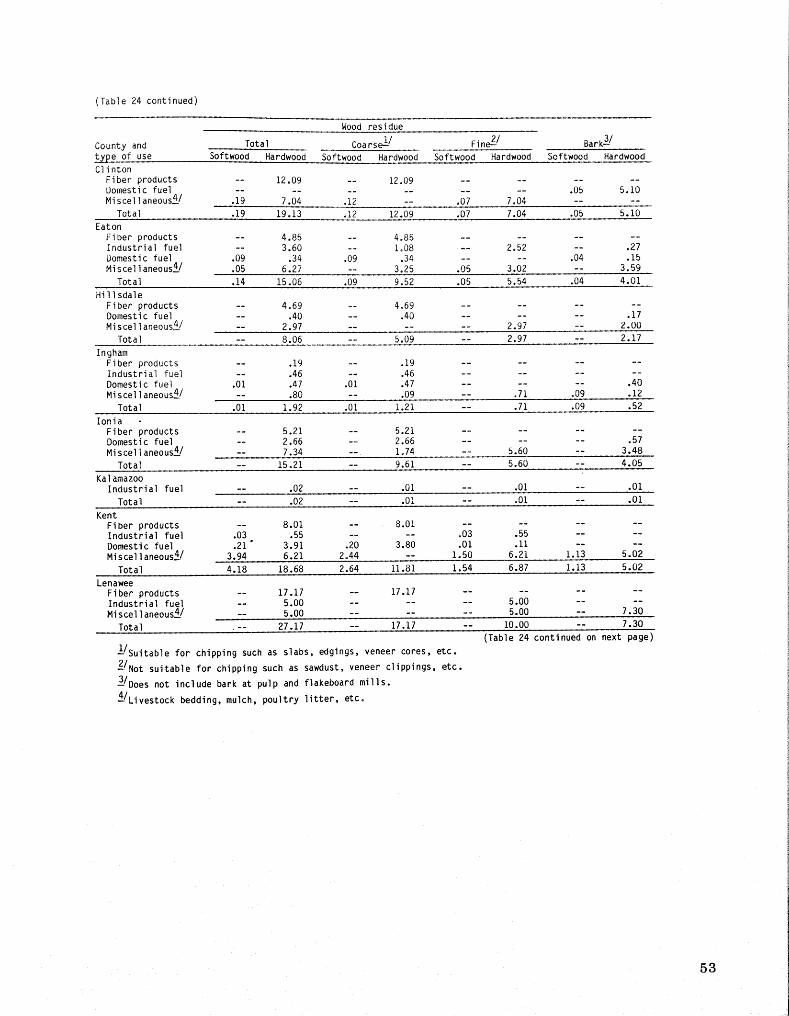
(Table 24 continued)
Wood residue
County and Total Coarse--11/ Fine_2/ Bark_/type of use Softwood Hardwood Softwood Hardwood Softwood Hardwood Softwood HardwoodClinton
Fiber products -- 12.09 -- 12_09 ........Domestic fuel ............ .05 5.10Miscellaneous_/ .19 7.04 .12 -- .07 7.04 ....
Total .19 19.13 .12 12.09 .07 7.04 .05 5.10Eaton
Fiber products -- 4.85 -- 4.85 ........Industrial fuel -- 3.60 -- 1.08 -- 2.52 -- .27Domestic fuel .09 .34 .09 .34 .... .04 .15Miscellaneous_/ .05 6.27 -- 3.25 .05 3.02 -- 3.59
Total .14 15.06 .09 9.52 .05 5.54 .04 4.01Hillsdale
Fiber products -- 4,69 -- 4.69 ........Domestic fuel -- .40 -- .40 ....... 17Miscellaneous_/ -- 2.97 ...... 2.97 -- 2.00
Total -- 8.06 -- 5.09 -- 2.97 -- 2.17
InghamFiber products -- .19 -- .19 ........industrial fuel -- .46 -- .46 ........Domestic fuel .01 .47 .01 .47 ...... .40Miscellaneous_/ -- .80 -- .09 -- o71 .09 .12
Total .01 1.92 .01 1.21 -- .71 .09 .52lonia
Fiber products -- 5.21 -- 5.21 ........Domestic fuel -- 2.66 -- 2.66 ...... .57Miscellaneous_/ -- 7.34 -- 1.74 -- 5.60 -- 3.48
Total -- 15.21 -- 9.61 -- 5.60 -- 4.05Kalamazoo
Industrial fuel -- .02 -- .01 -- .01 -- .01Total -- .02 -- .01 -- .01 -- .01
KentFiber products -- 8.01 -- 8.01 ........Industrial fuel .03 .55 .... .03 .55 ....Domestic fuel .21" 3.91 .20 3.80 .01 .ii ....Miscellaneous_/ 3.94 6.21 2.44 -- 1.50 6.21 1.13 5.02
Total 4.18 18.68 2.64 11.81 1.54 6.87 1.13 5.02Lenawee
Fiber products -- 17.17 -- 17.17 ........Industrial fuel -- 5.00 ...... 5.00 ....Miscellaneous_/ -- 5.00 ...... 5.00 -- 7.30
Total -- 27.17 -- 17.17 -- i0.00 -- 7.30(Table 24 continued on next page)
_/Suitable for chipping such as slabs, edgings, veneer cores, etc.
_/Not suitable for chipping such as sawdust, veneer clippings, etc.
Z/Does not include bark at pulp and flakeboard mills.
_/Livestock bedding, mulch, poultry litter, etc,
53
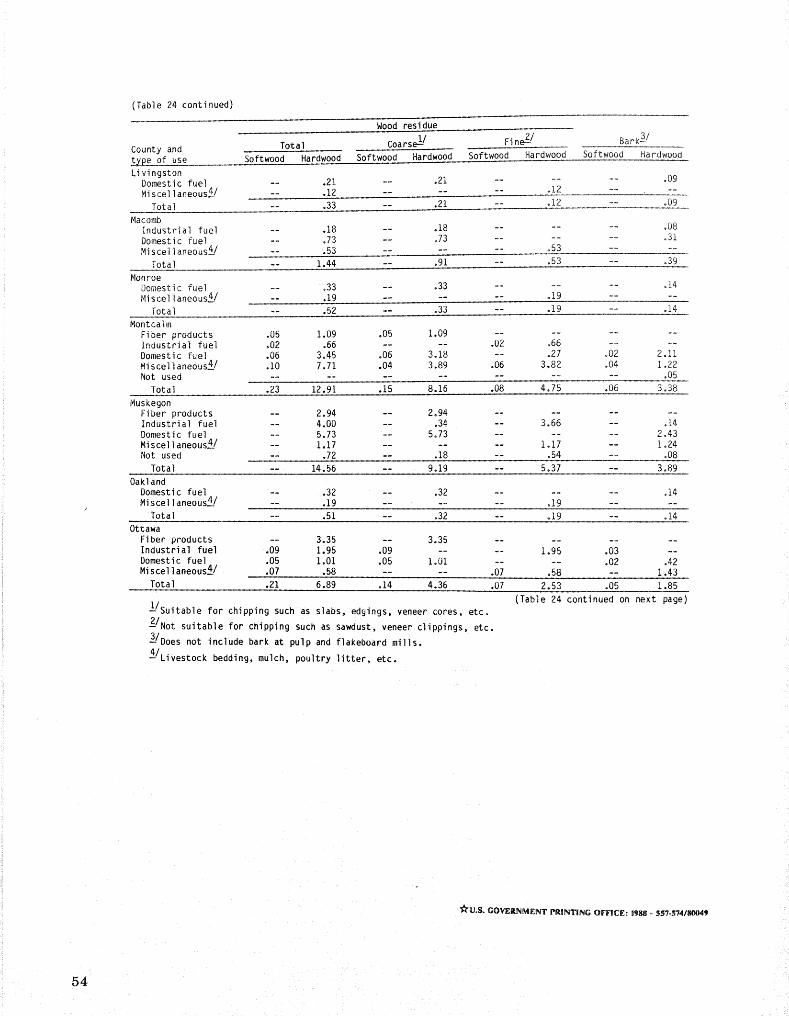
(Table 24 continued)
Wood residue
County and Total Coarse_I/ Fine_2/ Bark_/
of use Softwood Hardwood Softwood Hardwood Softwood Hardwood Softwood Hardwood
LivingstonDomestic fuel -- .21 -- .21 ...... _09Miscellaneous_/ -- .12 ....... 12 ....
Total -- .33 -- ,21 -- o12 -- _09
MacombIndustrial fuel -- ,18 -- ,18 ...... °08Domestic fuel -- ,73 -- ,73 ...... .31Miscellaneous_/ -- .53 ...... °53 ....
Total ---- 1.44 -- .91 -- .53 -- °39
MonroeDomestic fuel -- °33 -- °33 ...... .14Miscellaneous_/ -- .19 ...... _19 ....
Total -- .52 -- °33 -- .19 -- o14
Montcalm
Fioer products .05 1.09 .05 1.09 .........Industrial fuel .02 .66 .... ,02 .66 ....
Domestic fuel ,06 3.45 °06 3_18 -- .27 °02 2.11Miscellaneous_/ .i0 7.71 .04 3,89 .06 3.82 .04 1,22Not used .............. °05
Total .23 12.91 .15 8.16 ,08 4°75 .06 3.38
MuskegonFiber products -- 2.94 -- 2.94 ........Industrial fuel -- 4.00 -- .34 -- 3,66 -- ,14Domestic fuel -- 5.73 -- 5.73 ...... 2.43Miscellaneous_/ -- 1.17 ...... 1.17 -- 1.24Not used -- .72 -- .18 -- .54 -- °08
Total -- 14.56 -- 9.19 -- 5.3/ -- 3°89
Oakland
Domestic fuel -- .32 -- .32 ...... o14
Miscellaneous_/ -- o19 ...... .19 ....Total -- .51 -- .32 -- .19 -- ,14
Ottawa
Fiber products -- 3.35 -- 3.35 ........Industrial fuel ,09 1.95 .09 .... 1.95 ,03 --Domestic fuel .05 1,01 .05 1.01 .... .02 .42Miscellaneous_/ .07 .58 .... .07 .58 -- !.43
Total .21 6.89 o14 4.36 .07 2.53 .05 1.85
(Table 24 continued on next page)
l-/suitable for chipping such as slabs, edgings, veneer cores, etc.
?-/Not suitable for chipping such as sawdust, veneer clippings, etc.
_/Does not include bark at pulp and flakeboard mi|Is.
4-JLivestock bedding, mulch, poultry litter, etc.
"_U,$. GOVERNMENT PRINTING OFFICE: 191_ _ 557-574/g0049
64
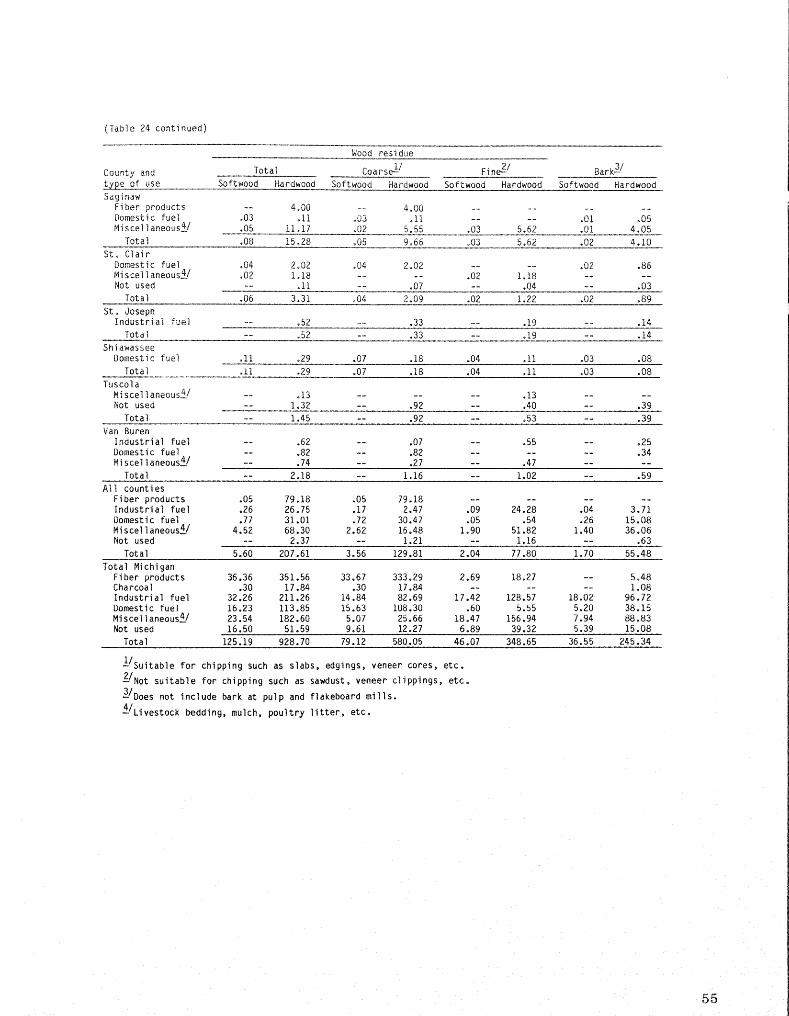
(Table 24 continued)
Wood residue
County and Total Coarse _I/ Fine_2/ Bark _/
t y_pe of use Softwood Hardwood Softwood Hardwood Softwood Hardwood Softwood Hardwood
SaginawFiber products -- 4.00 -- 4.00 .........Domestic fuel °03 o11 °03 ,11 .... ,01 .05Miscellaneous_/ .05 11,17 .02 5,55 .03 5,62 o01 4.05
Total .08 15.28 °05 9°66 °03 5.62 .02 4.10
St. Clair
Domestic fuel ,04 2002 _04 2.02 .... ,02 .86
Miscellaneous_/ .02 1.18 ..... .02 1,18 ....Not used -- .11 -- .07 -- .04 -- .03
Total .06 3.31 .04 2.09 .02 1.22 .02 .89
St. JosephIndustrial fuel -- .52 -- .33 -- .19 -- ,14
Total -- .52 -- .33 -- .19 -- .14
ShiawasseeDomestic fuel .II .29 .07 .18 .04 .11 .03 .08
Total .1i .29 .07 .18 .04 .II .03 .08
TuscolaMiscellaneous_/ -- .13 ...... .13 ....Not used -- 1.32 -- .92 -- .40 -- .39
Total -- 1.45 -- .92 -- .53 -- .39
Van Buren
Industrial fuel -- .62 -- .07 -- .55 -- .25Domestic fuel -- .82 -- .82 ...... .34Miscellaneous_/ -- °74 -- .27 -- .47 ....
Total -- 2.18 -- 1.16 -- 1.02 -- .59
All counties
Fiber products .05 79.18 .05 79.18 ........Industrial fuel .26 26.75 .17 2.47 .09 24.28 .04 3.71Domestic fuel .77 31.01 .72 30.47 .05 .54 .26 15.08Miscellaneous_/ 4.52 68.30 2.62 16.48 1.90 51.82 1.40 36.06Not used -- 2.37 -° 1.21 -- 1.16 -- .63
Total 5.60 207.61 3.56 129.81 2.04 77.80 1.70 55.48
Total MichiganFiber products 36.36 351.56 33.67 333.29 2.69 18.27 -- 5.48Charcoal .30 17.84 .30 17.84 ...... 1.08Industrial fuel 32.26 211.26 14.84 82.69 17.42 128.57 18.02 96.72Domestic fuel 16.23 113.85 15.63 108.30 .60 5.55 5.20 38_15
Miscellaneous_/ 23.54 182.60 5.07 25.66 18.47 156.94 7.94 88.83Not used 16.50 51.59 9.61 12.27 6.89 39.32 5.39 15.08
Total 125.19 928.70 79.12 580.05 46.07 348.65 36.55 245.34
_/Suitable for chipping such as slabs, edgings, veneer cores, etc.
_/Not suitable for chipping such as sawdust, veneer clippings, etc.
Z/Does not include bark at pulp and flakeboard mills.
--4--/Livestock bedding, mulch, poultry litter, etc.
65
. I _ __ e ...... i _ _ _ :
Blyth, James E°; Weatherspoon, Anthony K.; Smith, W. Brad.1988. Michigan timber industry--an assessment of timber pro-
duct output and use. Resoun Bull. NC-i09. St. Paul. MN: U.S.
Department of AgTiculture, Foregoc. Service. North CentralForest Experiment Station. 55 p.
Discusses recent Michigan forest industry trends; produc-
tion and receipts ofpulpwoo& saw logs, and veneer logs; and
production of other timber products in 1984. Reports on log-ging residue, on wood and bark residue generated at primarywood-using mills, and on disposition of this mill residue.
KEY WORDS: Pulpwood, saw togs, veneer logs, residue.