Embed Size (px)
Citation preview

I N T E R N A T I O N A L M O N E T A R Y F U N D
F I S C A L A F F A I R S D E P A R T M E N T

Uganda
TADAT Performance Assessment Report
Andrew Okello, Maimbo Nyanga, Berlin Msiska, Frank Van Brunschot, Sameera Khan and Grace Sowah
Fiscal Affairs Department
March 2019

2
The contents of this report constitute technical advice provided by the staff of the International Monetary Fund (IMF) to the authorities of Uganda (“TA recipient”) in response to their request for technical assistance. This report (in whole or in part) or summaries thereof may be disclosed by the IMF to IMF Executive Directors and members of their staff, as well as to other agencies or instrumentalities of the TA recipient, and upon their request, to World Bank staff and other technical assistance providers and donors with legitimate interest, unless the TA recipient specifically objects to such disclosure (see Operational Guidelines for the Dissemination of Technical Assistance Information— http://www.imf.org/external/np/pp/eng/2013/061013.pdf). Publication and disclosure of this report (in whole or in part) or summaries thereof to parties outside the IMF other than agencies or instrumentalities of the TA recipient, World Bank staff, other technical assistance providers and donors with legitimate interest shall require the explicit consent of the TA recipient and the IMF’s Fiscal Affairs Department.

2
Contents Page
ABBREVIATIONS AND ACRONYMS .................................................................................................................... 4
PREFACE ........................................................................................................................................................................ 5
II. COUNTRY BACKGROUND INFORMATION ...............................................................................................15 A. Country Profile .....................................................................................................................................15 B. Data Tables ............................................................................................................................................15 C. Economic Situation ............................................................................................................................15 D. Main Taxes ............................................................................................................................................15 E. Institutional Framework ....................................................................................................................16 F. International Information Exchange ............................................................................................17
III. ASSESSMENT OF PERFORMANCE OUTCOME AREAS .........................................................................18 A. POA 1: Integrity of the Registered Taxpayer Base .................................................................18 B. POA 2: Effective Risk Management ..............................................................................................20 C. POA 3: Supporting Voluntary Compliance ...............................................................................23 D. POA 4: Timely Filing of Tax Declarations ..................................................................................27 E. POA 5: Timely Payment of Taxes...................................................................................................29 F. POA 6: Accurate Reporting in Declarations ..............................................................................32 G. POA 7: Effective Tax Dispute Resolution ...................................................................................35 H. POA 8: Efficient Revenue Management .....................................................................................37 I. POA 9: Accountability and Transparency ....................................................................................39
Tables 1. Uganda: Summary of TADAT Performance ................................................................................................ 9 2. P1-1 Assessment .................................................................................................................................................18 3. P1-2 Assessment .................................................................................................................................................19 4. P2-3 Assessment .................................................................................................................................................21 5. P2-4 Assessment .................................................................................................................................................22 6. P2-5 Assessment .................................................................................................................................................22 7. P2-6 Assessment .................................................................................................................................................23 8. P3-7 Assessment .................................................................................................................................................24 9. P3-8 Assessment .................................................................................................................................................26 10. P3-9 Assessment ..............................................................................................................................................26 11. P4-10 Assessment ............................................................................................................................................28 12. P4-11 Assessment ............................................................................................................................................29 13. P5-12 Assessment ............................................................................................................................................30 14. P5-13 Assessment ............................................................................................................................................30 15. P5-14 Assessment ............................................................................................................................................31 16. P5-15 Assessment ........................................................................................................................................31 17. P6-16 Assessment ............................................................................................................................................33 18. P6-17 Assessment ............................................................................................................................................34 19. P6-18 Assessment ............................................................................................................................................34

3
20. P7-19 Assessment ............................................................................................................................................35 21. P7-20 Assessment ............................................................................................................................................36 22. P7-21 Assessment ............................................................................................................................................37 23. P8-22 Assessment ............................................................................................................................................38 24. P8-23 Assessment ............................................................................................................................................38 25. P8-24 Assessment ............................................................................................................................................39 26. P9-25 Assessment ............................................................................................................................................40 27. P9-26 Assessment ............................................................................................................................................41 28. P9-27 Assessment ............................................................................................................................................42 29. P9-28 Assessment ............................................................................................................................................42 Figure 1. Uganda: Distribution of Performance Scores ............................................................................................ 8 Attachments I. TADAT Framework ...............................................................................................................................................43 II. Uganda: Country Snapshot .............................................................................................................................45 III. Data Tables ..........................................................................................................................................................46 IV. Organizational Chart ........................................................................................................................................58 V. Sources of Evidence...........................................................................................................................................59

4
ABBREVIATIONS AND ACRONYMS
AG Auditor General ATAF African Tax Administration Forum BCP Business Continuity Plan BMS Block Management System BOU Bank of Uganda CG Commissioner General CIP Compliance Improvement Plan CIT Corporate Income Tax CRM Compliance Risk Management DRMS Domestic Revenue Mobilization Strategy DTA Double Taxation Agreement DTD Domestic Tax Department DWOC Debt Write-Off Committee ERM Enterprise Risk Management FAD Fiscal Affairs Department FAQs Frequently Asked Questions FIA Financial Intelligence Agency GDP Gross Domestic Product HRMM Human Resource Management Manual IACD Internal Audit and Compliance Department ICT Information Communication Technology IFMIS Integrated Financial Management Information System IGG Inspector General of Government IT Information Technology LTO Large Taxpayer Office MEC Management Executive Committee MTO Medium Taxpayer Office MOFPED Ministry of Finance, Planning and Economic Development MOU Memorandum of Understanding OAU Objections and Appeals Unit PAYE Pay-As-You-Earn PCA Public and Corporate Affairs PIT Personal Income Tax POA Performance Outcome Area RPD Research and Planning Department TADAT Tax Administration Diagnostic Assessment Tool TAT Tax Appeal Tribunal TIN Taxpayer Identification Number TREP Taxpayer Register Expansion Program UGX Ugandan Shilling URA Uganda Revenue Authority URSB Uganda Registration Services Bureau VAT Value Added Tax

5
PREFACE
Following a request from Ms. Doris Akol, Commissioner General (CG), Uganda Revenue Authority (URA), a repeat assessment of the system of tax administration of Uganda was undertaken during the period of February 12-27, 2019 using the Tax Administration Diagnostic Assessment Tool (TADAT). The repeat TADAT, which follows a similar assessment carried out in October 2015, provides a highlight of reform achievements or lack thereof, and new baseline information that can be used to determine reform priorities. The assessment team comprised the following: Messrs. Andrew Okello, IMF Fiscal Affairs Department (FAD)/team leader; Maimbo Nyanga (TADAT Secretariat); Berlin Msiska, IMF East Africa Technical Assistance Center; and Frank Van Brunschot, Netherlands Tax and Customs Administration; and Mses. Sameera Khan, African Tax Administration Forum (ATAF); and Grace Sowah, United Kingdom’s Department for International Development (DFID). The assessment team met Ms. Doris Akol, CG, URA, Mr. Henry Saka, Commissioner, Domestic Tax Department (DTD), and other senior management, as well as technical staff from the various headquarter departments and field offices in Jinja and Mukono. The assessment team expresses its appreciation to URA management and staff for the open, candid and active participation in the assessment. Particular thanks go to Ms. Milly Nalukwago, Assistant Commissioner (Research Planning and Development (RPD)) and her staff for very effectively facilitating the assessment team’s work. A draft Performance Assessment Report (PAR) was presented to the URA management team at the exit meeting on February 26, 2019. The authorities indicated that they had no comments on the PAR. This final report has been reviewed and cleared by FAD and the TADAT Secretariat.

6
EXECUTIVE SUMMARY Much progress has been made since the last TADAT assessment in August 2015. Particularly evident is the robust client service program, effective roll out of e-payment options and other electronic services, wider utilization of withholding and advance payment systems, application of modern compliance risk management applications to manage tax operations, coordinated initiatives to detect unregistered businesses and individuals, and reform to the dispute resolution procedures. However, several challenges persist. Despite the concerted effort, integrity of the registration database remains a major hindrance with a ripple effect on other areas such as managing of filing and payment compliance. The stock of tax arrears has grown significantly and comprises mostly old debt. Timely processing and payment of value added tax (VAT) refund claims remains a major challenge. Furthermore, limited focus on enforcing filing of tax returns and the large number of estimated assessments that are generated has contributed to the increase of disputes and uncollectible tax arrears.
Reform progress so far has established a strong foundation for embracing future opportunities envisaged in the government’s five-year Domestic Revenue Mobilization Strategy (DRMS). The DRMS proposes an integrated package of reforms in tax policy, legislation, and revenue administration that will be implemented over the next five years. The reforms will help the government realize its objective of improving revenue performance by up to 0.5 percentage points of gross domestic product (GDP) per year or 2.5 percentage points of GDP over the period. The results of the repeat TADAT assessment provide information on reform outcomes against the 2015 assessment results and up-to-date baseline information that could be used to develop new targets under the DRMS.
The main strengths and weaknesses as assessed by the repeat TADAT are summarized below. Additionally, Figure 1 provides a graphical snapshot of the distribution of the scores against the results in 2015 and Table 1 provides a summary on performance scores.1
1 The scoring is structured around the TADAT framework’s 9 performance outcome areas (POAs) and 28 high level indicators critical to tax administration performance. An ‘ABCD’ scale is used to score each indicator, with ‘A’ representing the highest level of performance and ‘D’ the lowest.

7
Strengths
■ The extent of intelligence gathering, research and crosschecking of data to identify compliance risks, using an automated risk engine is comprehensive.
■ The compliance management process is part of a multi-year national assessment plan and structured across the main taxpayers’ obligations, core taxes and taxpayer segments.
■ URA has a comprehensive process for the identification, assessment and mitigation of institutional risks.
■ URA performs well with respect to the scope, currency, accessibility of information and initiatives to reduce taxpayer compliance costs.
■ Electronic filing and payment of tax is fully rolled-out.
■ Withholding and advance payment systems are widely used.
■ Expanded use of withholding and advance payment systems.
■ Internal audit provides assurance of the soundness of URA’s internal controls, risk management, and governance frameworks.
Weaknesses
■ Integrity of the taxpayer registration database is compromised.
■ On-time return filing and payment ratios are low, although the full extent cannot be determined due to data limitations.
■ The stock of arrears is very high and comprises mostly old debt. Tax arrears older than 12 months has grown significantly from 23.6 percent in 2016 to 78.2 percent in 2018.
■ Independent surveys, based on statistical sampling techniques, have not been commissioned in recent years to obtain feedback on URA products, services, and staff integrity.
■ The administrative review process is very slow as only 79.5 percent of the cases were finalized within 90 days.
■ The rate of processing VAT refund claims is extremely low and the funding available to pay refund claims is insufficient.

8
Figure 1. Uganda: Distribution of Performance Scores2
2 An updated TADAT Field Guide was issued in November 2015 after the first (pilot phase) Uganda assessment of August 2015. As such, the 2015 assessment scores for indicators P3-8, P6-17, P8-22 and P8-23 cannot be compared directly with the same indicators of the February 2019 assessment. In these instances, a ‘-’ mark is shown against the relevant indicator.
Indicator 2015 Score 2019 ScoreP1-1 C CP1-2 C AP2-3 C AP2-4 C AP2-5 C AP2-6 C BP3-7 A AP3-8 BP3-9 B CP4-10 D+ D+P4-11 A AP5-12 C AP5-13 C AP5-14 D DP5-15 B+ CP6-16 D+ BP6-17 BP6-18 D CP7-19 B+ BP7-20 D DP7-21 A AP8-22 CP8-23 DP8-24 D D+P9-25 B BP9-26 B BP9-27 B DP9-28 B C+

9
Table 1. Uganda: Summary of TADAT Performance Assessment3
INDICATOR Score 2015
Score 2019 SUMMARY EXPLANATION OF ASSESSMENT
POA 1: Integrity of the Registered Taxpayer Base P1-1. Accurate and reliable taxpayer information. C C
Information held in the registration database adequately supports interactions with taxpayers and tax intermediaries. However, internal audit reports indicate a low confidence in the accuracy of the registration database for some core taxes.
P1-2. Knowledge of the potential taxpayer base. C A URA has undertaken a wide range of initiatives to detect unregistered
businesses and individuals. POA 2: Effective Risk Management
P2-3. Identification, assessment, ranking, and quantification of compliance risks. C A
URA has significantly improved their compliance risk management (CRM) processes since 2015 and has developed and fully implemented a comprehensive system for identification, assessment and quantification of compliance risks using a wide range of both internal and external data including the regular use of environmental scans.
P2-4. Mitigation of risks through a compliance improvement plan. C A
Risks are effectively mitigated through a compliance improvement plan (CIP) which has been implemented since 2017 and covers all core taxes, key taxpayer segments and the four main compliance obligations.
P2-5. Monitoring and evaluation of compliance risk mitigation activities. C A
The process to approve mitigation strategies, monitor their implementation, and evaluate their impact on compliance has been strengthened since 2015 and URA’s risks are monitored by the Management Executive Committee (MEC) regularly.
3 See footnote ‘2’ for the explanation of the ‘-’ mark.

10
INDICATOR Score 2015
Score 2019 SUMMARY EXPLANATION OF ASSESSMENT
P2-6. Identification, assessment, and mitigation of institutional risks. C B
An effective process for the identification, assessment and prioritization of institutional risks has been implemented and a comprehensive risk register is in place; however, the information communication technology (ICT) disaster recovery plan is only reviewed every two years.
POA 3: Supporting Voluntary Compliance P3-7. Scope, currency, and accessibility of information. A A
URA provides a wide range of up-to-date information both in English and several local dialects through various channels.
P3-8. Scope of initiatives to reduce taxpayer compliance costs. - B
Taxpayer compliance costs are being reduced via establishment of account management responsibilities, implementing a presumptive tax regime and simplified filing and payment procedures for small and micro businesses. However, use of pre-filled tax declarations has not been implemented yet.
P3-9. Obtaining taxpayer feedback on products and services. B C
Client feedback is obtained via social media, contact center client satisfaction surveys, and other surveys by URA staff. However, while an internal perception survey was conducted in 2019, an independent survey has not been commissioned since 2012.
POA 4: Timely Filing of Tax Declarations
P4-10. On-time filing rate. D+ D+ On-time filing rates are low and have seen minimal change since 2015. The exception is VAT where rates have improved.
P4-11. Use of electronic filing facilities. A A
Electronic filing of tax returns is mandatory for all taxpayers.
POA 5: Timely Payment of Taxes P5-12. Use of electronic payment methods. C A Electronic payments are mandatory for all core taxes.

11
INDICATOR Score 2015
Score 2019 SUMMARY EXPLANATION OF ASSESSMENT
P5-13. Use of efficient collection systems. C A
URA utilizes withholding and advance payment systems including for employment income, interest and dividends.
P5-14. Timeliness of payments. D D The on-time payment rate for VAT, by number of VAT payments, is
low. However, the ratio improves by value. P5-15. Stock and flow of tax arrears. B+ C
The stock of arrears is very high and comprises mostly old debt (78.2 percent).
POA 6: Accurate Reporting in Declarations P6-16. Scope of verification actions taken to detect and deter inaccurate reporting. D+ B
URA’s tax audit program meets international good practice. There is large-scale automated crosschecking of data reported in tax returns with information from internal and external sources. However, URA cannot currently enforce large-scale automated crosschecking of information from financial institutions.
P6-17. Extent of proactive initiatives to encourage accurate reporting.
- B URA has a system of public and private binding rulings for all core taxes in place. Cooperative compliance programs are in an early stage of development.
P6-18. Monitoring the extent of inaccurate reporting. D C
Two VAT gap studies have been completed; however, the two studies are separated by four years. Also, a study on the tax gap of the informal sector was completed and its recommendations implemented.

12
INDICATOR Score 2015
Score 2019 SUMMARY EXPLANATION OF ASSESSMENT
POA 7: Effective Tax Dispute Resolution P7-19. Existence of an independent, workable, and graduated dispute resolution process.
B+ B
A tiered review mechanism is used. Information on the dispute process is available and taxpayers are explicitly made aware of it.4 However, taxpayers may opt for a second review of the administrative objections decision issued and the objections review mechanism is not uniform across URA.
P7-20. Time taken to resolve disputes. D D
The tax administration routinely monitors the time taken to complete administrative reviews. However, the set standards within which tax dispute cases should be completed are not met.
P7-21. Degree to which dispute outcomes are acted upon.
A A Dispute outcomes of a material nature are monitored and considered in the formulation of policy, legislation, and administrative procedures.
POA 8: Efficient Revenue Management P8-22. Contribution to government tax revenue forecasting process. - C
URA forecasts and monitors tax revenue and collaborates effectively with the Ministry of Finance, Planning, and Economic Development (MOFPED). VAT refund forecasts fall short of levels required to meet actual refund claims.
P8-23. Adequacy of the tax revenue accounting system.
- D URA operates a robust accounting system; however, it does not interface directly with MOFPED’s revenue accounting system.
4Although there appears to be a decline in this area, based on what the mission was told and further clarification of previous procedures, the 2015 score should have been a “C+”

13
INDICATOR Score 2015
Score 2019 SUMMARY EXPLANATION OF ASSESSMENT
P8-24. Adequacy of tax refund processing D D+
There is risk-based verification of VAT refund claims. However, the rate of timely processing of VAT refund claims is extremely low and the funding available to pay refund claims when they occur is insufficient.
POA 9: Accountability and Transparency P9-25. Internal assurance mechanisms.
B B
Internal assurance mechanisms are in place and integrity-related statistics are published. However, the internal audit and compliance department (IACD) does not maintain a central repository of internal control policies, processes and procedures. There is infrequent independent review of internal audit operations and systems.
P9-26. External oversight of the tax administration. B B
Financial and operational performance is audited by the Auditor General (AG) and URA responds to any findings. The Inspector General of Government (IGG) investigates complaints from taxpayers on an ad hoc basis.
P9-27. Public perception of integrity. B D
An integrity perception survey that is based on a statistically valid sample of key taxpayer segments and population has not been completed in recent years.
P9-28. Publication of activities, results, and plans. B C+
The 2017/18 Annual Report outlining financial and operational performance was published but not in a timely manner. URA publishes its Corporate Plan. However, only elements of the operational plan are made public.

14
I. INTRODUCTION This report is structured around the TADAT framework of 9 POAs and 28 high level indicators critical to tax administration performance that is linked to the POAs. Forty-seven measurement dimensions are taken into account in arriving at each indicator score. A four-point ‘ABCD’ scale is used to score each dimension and indicator:
• ‘A’ denotes performance that meets or exceeds international good practice. In this regard, for TADAT purposes, a good practice is taken to be a tested and proven approach applied by a majority of leading tax administrations. It should be noted, however, that for a process to be considered ‘good practice,’ it does not need to be at the forefront or vanguard of technological and other developments. Given the dynamic nature of tax administration, the good practices described throughout the field guide can be expected to evolve over time as technology advances and innovative approaches are tested and gain wide acceptance.
• ‘B’ represents sound performance (i.e., a healthy level of performance but a rung below international good practice).
• ‘C’ means weak performance relative to international good practice.
• ‘D’ denotes inadequate performance and is applied when the requirements for a ‘C’ rating or higher are not met. Furthermore, a ‘D’ score is given in certain situations where there is insufficient information available to assessors to determine and score the level of performance. For example, where a tax administration is unable to produce basic numerical data for purposes of assessing operational performance (e.g., in areas of filing, payment, and refund processing) a ‘D’ score is given. The underlying rationale is that the inability of the tax administration to provide the required data is indicative of deficiencies in its management information systems and performance monitoring practices.
For further details on the TADAT framework, see Attachment I. Some points to note about the TADAT diagnostic approach are the following:
• TADAT assesses the performance outcomes achieved in the administration of the major direct and indirect taxes critical to central government revenues, specifically corporate income tax (CIT), personal income tax (PIT), VAT, and pay-as-you-earn (PAYE) amounts withheld by employers (which, strictly speaking, are remittances of PIT). By assessing outcomes in relation to administration of these core taxes, a picture can be developed of the relative strengths and weaknesses of a country’s tax administration.
• TADAT assessments are evidence based (see Attachment V for the sources of evidence applicable to the assessment of Uganda).

15
• TADAT is not designed to assess special tax regimes, such as those applying in the natural resource sector, nor does it assess customs administration.
• TADAT provides an assessment within the existing revenue policy framework in a country, with assessments highlighting performance issues that may be best dealt with by a mix of administrative and policy responses.
The aim of TADAT is to provide an objective assessment of the health of key components of the system of tax administration, the extent of reform required, and the relative priorities for attention. TADAT assessments are particularly helpful in:
• identifying the relative strengths and weaknesses in tax administration;
• facilitating a shared view among all stakeholders (country authorities, international organizations, donor countries, and technical assistance providers);
• setting the reform agenda (objectives, priorities, reform initiatives, and implementation sequencing);
• facilitating management and coordination of external support for reforms, and achieving faster and more efficient implementation; and
• monitoring and evaluating reform progress by way of subsequent repeat assessments.
II. COUNTRY BACKGROUND INFORMATION
A. Country Profile
General background information on Uganda and the environment in which its tax system operates are provided in the country snapshot in Attachment II.
B. Data Tables
Numerical data gathered from the authorities and used in this TADAT performance assessment is contained in the tables comprising Attachment III.
C. Economic Situation
The Ugandan economy grew at a faster pace in 2017/18 compared to 2016/17, supported by improvements in the service sector and a rebound in agriculture. GDP expanded by 6.1 percent in real terms—2.2 percentage points higher than the 2016/17 outturn of 3.9 percent. Annual headline and core inflation in 2017/18 averaged 3.4 percent and 2.7 percent, respectively, compared to 5.7 percent and 5.1 percent in 2016/17. The low inflation registered during the year

16
was largely a result of low food and energy inflation, the decline in international oil prices, and the relatively stable exchange rate. The current account deficit increased from 3.7 percent in 2016/17 to 6.1 percent of GDP in 2017/18. Imports of goods and services grew by 17 percent—mostly capital goods associated with the large infrastructure projects—outweighing the 9 percent growth of exports. Financing came from foreign direct investment, public-sector debt disbursements, and a decline in international reserves. Reserves amounted to US$3.2 billion at end 2017/18, equivalent to 4.6 months of import cover. Total revenue collection improved by 0.3 percent of GDP in 2017/18 to reach 14.4 percent of GDP. However, the fiscal deficit widened from 3.5 percent of GDP in 2016/17 to 5 percent of GDP in 2017/18 as infrastructure spending increased by over 1 percent of GDP. The deficit was largely financed externally. Public debt went up from 38 percent of GDP in 2016/17 to 41.3 percent in 2017/18, an increase of 3.3 percentage points. External debt increased by 3.5 percentage points while domestic debt decreased by 0.2 percentage points.
D. Main Taxes
Uganda’s main national domestic taxes comprise: PIT, CIT, VAT, and excise tax. The tax administration is also responsible for the collection of several non-tax revenues. Of the domestic tax and non-tax revenues (i.e., excluding customs duties), VAT is the largest tax-type revenue contributor—in 2017/18, it represented 41.3 percent of domestic tax and non-tax revenue; PIT contributed 22.0 percent, excises on domestic transactions contributed 8.7 percent, CIT contributed 8.1 percent, while other domestic tax and non-tax revenue contributed 18.0 percent. Further details on tax revenue collections are provided in Table 1 of Attachment III.
E. Institutional Framework
URA is responsible for administering and collecting direct and indirect taxes in the country, under the supervision of the MOFPED. As a revenue authority, it is also responsible for administering taxes on international trade (Customs), and several non-tax revenues which are not assessed under TADAT. A Board of Directors, appointed by and responsible to the Minister of Finance, Planning and Economic Development, formulates and oversees the day-to-day policies of URA. A Commissioner General, appointed by the Minister on the recommendation of the Board of Directors, manages the day-to-day affairs of URA. The CG is assisted by a management team comprising six Commissioners in charge of: (i) Corporate Services; (ii) Domestic Taxes; (iii) Tax Investigation; (iv) Customs; (v) Internal Audit and Compliance; and (vi) Legal Services and Board Affairs.
17
An organogram of URA’s management structure is provided in Attachment IV.
F. International Information Exchange
Uganda is a member of the East African Community (EAC). It is also a member of the Organization of Economic Co-operation and Development (OECD) Global Forum on Transparency and Exchange of Information for Tax Purposes. URA has seven double taxation agreements in force (Denmark, India, Mauritius, Netherlands, Norway, South Africa and the United Kingdom).

18
III. ASSESSMENT OF PERFORMANCE OUTCOME AREAS
A. POA 1: Integrity of the Registered Taxpayer Base
A fundamental initial step in administering taxes is taxpayer registration and numbering. Tax administrations must compile and maintain a complete database of businesses and individuals that are required by law to register; these will include taxpayers in their own right, as well as others such as employers with PAYE withholding responsibilities. Registration and numbering of each taxpayer underpins key administrative processes associated with filing, payment, assessment, and collection.
Two performance indicators are used to assess POA 1: • P1-1—Accurate and reliable taxpayer information. • P1-2—Knowledge of the potential taxpayer base.
P1-1: Accurate and reliable taxpayer information For this indicator two measurement dimensions assess (1) the adequacy of information held in the tax administration’s registration database and the extent to which it supports effective interactions with taxpayers and tax intermediaries (i.e., tax advisors and accountants); and (2) the accuracy of information held in the database. Assessed scores are shown in Table 2 followed by an explanation of reasons underlying the assessment. Table 2. P1-1 Assessment
Measurement Dimensions Scoring Method
Score 2019
P1-1-1. The adequacy of information held in respect of registered taxpayers and the extent to which the registration database supports effective interactions with taxpayers and tax intermediaries. M1 A C P1-1-2. The accuracy of information held in the registration database. C
Information held in the registration database adequately supports interactions with taxpayers and tax intermediaries. A 10-digit unique taxpayer identification number (TIN), with a check digit, is issued centrally through the eTAX system. Apart from facilitating routine identification of taxpayers for compliance actions, the TIN is used for other purposes such as importation of motor vehicles by individuals. Identifying information held in the database includes name, address, contact details, nature of business activity, tax obligations by tax type, and details of associated entities and related parties of the taxpayer (e.g., directors of registered companies). The registration information technology (IT) sub-system provides frontline staff with a whole-of-taxpayer view across core taxes, subject to user access controls. The system is able to readily generate registration-related management information (e.g., statistics of registered taxpayers by segment, location, and economic

19
sector).5 In addition, administrative assessments are generated using taxpayer information in the database. The system provides an audit trail of user access and changes made to taxpayer data. Taxpayers are able to securely update their demographic details online. Despite URA’s efforts to ensure its accuracy, information held in the database remains doubtful. Using documented procedures, URA embarked on a data cleansing exercise focused mainly on: (i) reducing the number of duplicate records; (ii) eliminating phony taxpayers, (iii) understanding the taxpayers’ business; and (iv) improving reliability of information held in the database. Although some progress has been made, more work is still planned.6 Although URA has access to the company registration database of the Uganda Registration Services Bureau (URSB), no similar access has been granted to authenticate the identity of individuals by the National Identification and Registration Authority and other issuers of proof-of-identity documents.7 As such, a crossmatch between individuals/business owners and their individual proof-of-identity details is not conducted. Internal audit reports indicate a low level of confidence in the accuracy of the registration database for some core taxes. For example, an audit in the Jinja field office indicated that: 364 taxpayers who declared business as source of income were not registered for any core tax; 17,837 registrants had duplicate email addresses; and 32 had no email addresses. Another audit for Kampala South Domestic Taxes office showed that 66 taxpayers were registered more than once. P1-2: Knowledge of the potential taxpayer base This indicator measures the extent of tax administration efforts to detect unregistered businesses and individuals. The assessed score is shown in Table 3 followed by an explanation of reasons underlying the assessment.
5 URA uses the United Nations International Standard Industrial Classification (ISIC) Rev.4 to classify its taxpayers.
6 For example, audit results for Kampala South Domestic Taxes office indicate that the compliance management headquarters team allocated 1,497 cases for cleansing based on three risks, namely: (i) landlord with no rental income; (ii) employer with no pay-as-you-earn (PAYE); and (iii) non-registration for VAT yet having a turnover above UGX150.0 million. At the time of the mission, only 747 cases had been cleaned.
7 A combination of any of the following two documents can be used for TIN registration – employee ID number, work permit, VISA number, National Social Security Fund number, voter’s card number, village identity card, diplomatic foreign affairs number, passport number, driving permit or current bank statement for past 90 days.

20
Table 3. P1-2 Assessment
Measurement Dimensions Scoring Method
Score 2019
P1-2. The extent of initiatives to detect businesses and individuals who are required to register but fail to do so. M1 A
A wide range of initiatives have been undertaken to detect unregistered businesses. The tax administration has signed collaboration and information-sharing memorandums of understanding (MOUs) with the Ministry of Local Government, Kampala Capital City Authority, Financial Intelligence Authority (FIA) and the URSB. Further, URA is involved in the Taxpayer Register Expansion Programme (TREP) that is part of the government’s strategy of improving efficiency in revenue collection and compliance through expansion of the tax base. Additionally, the tax administration introduced a block management system (BMS) in which central parts of Kampala have been divided into logical geographical blocks. A team of tax officers are assigned to systematically manage tax compliance of each taxpayer within their block on a day-to-day basis.8 From these efforts, during the 2017/18 financial year, URA increased the number of value clients9 from 144,620 to 166,820 taxpayers—of these, 19,214 new value clients were identified through the TREP, BMS and information sharing activities discussed above.
B. POA 2: Effective Risk Management
Tax administrations face numerous risks that have the potential to adversely affect revenue and/or tax administration operations. For convenience, these risks can be classified as: • compliance risks—where revenue may be lost if businesses and individuals fail to meet the
four main taxpayer obligations (i.e., registration in the tax system, filing of tax declarations, payment of taxes on time, and complete and accurate reporting of information in declarations); and
• institutional risks—where tax administration functions may be interrupted if certain external
or internal events occur, such as natural disasters, sabotage, loss or destruction of physical assets, failure of information technology system hardware or software, strike action by employees, and administrative breaches (e.g., leakage of confidential taxpayer information which results in loss of community confidence and trust in the tax administration).
8 During these door-to-door visits, individuals and businesses that escape the purview of the tax administration are identified, registered and tailored tax education is delivered to the new registrants.
9 Those taxpayers who filed a tax declaration or made a payment.

21
Risk management is essential to effective tax administration and involves a structured approach to identifying, assessing, prioritizing, and mitigating risks. It is an integral part of multi-year strategic and annual operational planning. Four performance indicators are used to assess POA 2: • P2-3—Identification, assessment, ranking, and quantification of compliance risks. • P2-4—Mitigation of risks through a compliance improvement plan. • P2-5—Monitoring and evaluation of compliance risk mitigation activities. • P2-6—Identification, assessment, and mitigation of institutional risks. P2-3: Identification, assessment, ranking, and quantification of compliance risks For this indicator two measurement dimensions assess (1) the scope of intelligence gathering and research to identify risks to the tax system; and (2) the process used to assess, rank, and quantify compliance risks. Assessed scores are shown in Table 4 followed by an explanation of reasons underlying the assessment.
Table 4. P2-3 Assessment
Measurement Dimensions Scoring Method
Score 2019
P2-3-1. The extent of intelligence gathering and research to identify compliance risks in respect of the main tax obligations M1
A A P2-3-2. The process used to assess, rank, and quantify taxpayer
compliance risks. A URA has an effective process for gathering intelligence and identifying compliance risks. Data from a range of third parties is gathered and interpreted—this includes from customs, the URSB, motor vehicle register, FIA and stamp duty on land payments. Data is also gathered and interpreted from internal sources such as taxpayer returns, and results from audit programs. Environmental scans, tax gap studies and sectoral research are conducted routinely and analyzed. Risk Bulletins are produced annually. A structured Compliance Risk Management (CRM) process has been developed and is effectively applied. A CRM process that is a part of a multi-year national assessment plan and structured across the main taxpayer obligations, core taxes and taxpayer segments now forms an integral part of URA’s strategic management, annual planning, and enterprise risk management (ERM) processes.

22
P2-4: Mitigation of risks through a compliance improvement plan This indicator examines the extent to which the tax administration has formulated a compliance improvement plan to address identified risks. The assessed score is shown in Table 5 followed by an explanation of reasons underlying the assessment. Table 5. P2-4 Assessment
Measurement Dimensions Scoring Method
Score 2019
P2-4. The degree to which the tax administration mitigates assessed risks to the tax system through a compliance improvement plan. M1 A
URA has developed a comprehensive compliance improvement plan (CIP) which has been fully implemented. The CIP is derived from URA’s corporate plan and structured across the main taxpayer obligations, all core taxes and key taxpayer segments. A risk matrix is updated annually and designed around identified compliance risks with recommended mitigation strategies. The compliance divisions are allocated resources to implement the plan. P2-5: Monitoring and evaluation of compliance risk mitigation activities This indicator looks at the process used to monitor and evaluate mitigation activities. The assessed score is shown in Table 6 followed by an explanation of reasons underlying the assessment. Table 6. P2-5 Assessment
Measurement Dimensions Scoring Method
Score 2019
P2-5. The process used to monitor and evaluate the impact of compliance risk mitigation activities. M1 A
Governance arrangements are in place for approving compliance risk mitigation strategies and monitoring progress with implementation. The MEC, chaired by the CG and comprising Commissioners from relevant departments, monitors the implementation and impact of risk mitigation activities for compliance and organizational risks. The ERM unit presents risks to the MEC monthly for action and decisions. The operationalization of the CIP is also monitored by the Domestic Tax Management team. Studies have been undertaken to evaluate the impact of compliance improvement initiatives on high-risk sectors. A post-audit impact report is done annually and the findings from the impact assessment and studies are used as feedback for improvement of the compliance risk

23
management processes and to inform requests for changes to the tax legislation. P2-6: Identification, assessment, and mitigation of institutional risks This indicator examines how the tax administration manages institutional risks. The assessed score is shown in Table 7 followed by an explanation of reasons underlying the assessment. Table 7. P2-6 Assessment
Measurement Dimensions Scoring Method
Score 2019
P2-6. The process used to identify, assess, and mitigate institutional risks. M1 B
URA’s process for management of institutional risks is effective. An ERM methodology10 using ISO 31000 is used to identify, assess, rank and mitigate institutional risks annually. All corporate risks are documented in a risk register. The ERM unit reports on both institutional and compliance risk mitigation activities to the MEC monthly. The ICT Disaster recovery plan is updated to include emerging threats and is effectively applied through disaster recovery simulations (failover tests) and drills. However, the disaster recovery plan is only reviewed every two years.
C. POA 3: Supporting Voluntary Compliance
To promote voluntary compliance and public confidence in the tax system, tax administrations must adopt a service-oriented attitude toward taxpayers, ensuring that taxpayers have the information and support they need to meet their obligations and claim their entitlements under the law. Because few taxpayers use the law itself as a primary source of information, assistance from the tax administration plays a crucial role in bridging the knowledge gap. Taxpayers expect that the tax administration will provide summarized, understandable information on which they can rely. Efforts to reduce taxpayer costs of compliance are also important. Small businesses, for example, gain from simplified record keeping and reporting requirements. Likewise, individuals with relatively simple tax obligations (e.g., employees, retirees, and passive investors) benefit from simplified filing arrangements and systems that eliminate the need to file. Three performance indicators are used to assess POA 3:
10 ERM methodology used by URA encompasses both the ICT disaster recovery and business continuity plans.

24
• P3-7—Scope, currency, and accessibility of information. • P3-8—Scope of initiatives to reduce taxpayer compliance costs. • P3-9—Obtaining taxpayer feedback on products and services.
P3-7: Scope, currency, and accessibility of information For this indicator four measurement dimensions assess (1) whether taxpayers have the information they need to meet their obligations; (2) whether the information available to taxpayers reflects the current law and administrative policy; (3) how easy it is for taxpayers to obtain information; and (4) how quickly the tax administration responds to requests by taxpayers and tax intermediaries for information (for this dimension, waiting time for telephone enquiry calls is used as a proxy for measuring a tax administration’s performance in responding to information requests generally). Assessed scores are shown in Table 8 followed by an explanation of reasons underlying the assessment.
Table 8. P3-7 Assessment
Measurement Dimensions Scoring Method
Score 2019
P3-7-1. The range of information available to taxpayers to explain, in clear terms, what their obligations and entitlements are in respect of each core tax.
M1
A
A P3-7-2. The degree to which information is current in terms of the law and administrative policy. A
P3-7-3. The ease by which taxpayers obtain information from the tax administration. A
P3-7-4. The time taken to respond to taxpayer and intermediary requests for information. A
Taxpayers have convenient access to information, in various local dialects, through a range of user-friendly channels. URA has a robust program to promote client service and public confidence in the tax system. The program is coordinated by the Public and Corporate Affairs (PCA) Department in liaison with the operational departments and field stations and delivers tax information for all core taxes, main compliance obligations and all categories of taxpayers via:
• URA website. • A self-help tax education portal which has videos, instructions, and guides. • Generic and sector-based tax literature which is presented in print, audio, or digital
formats and active participation on social media—Facebook, and Twitter. • A centralized inbound call center that is operated during normal working hours and for
extended hours during peak filing and tax payment periods. • Active engagement with private sector associations. • Staff visits to small and medium taxpayers premises (also called tax katales) and other
personalized assistance and public seminars and tax clinics for specific taxpayer groups.

25
• Client relationship managers in the large taxpayer office (LTO) and medium taxpayer office (MTO).
• Walk-in service centers in all field offices. • Letters, e-mails, text messages, and brochures. • The hosting of an annual “Taxpayers Appreciation Month.”11 • URA also seeks to educate future taxpayers (e.g. school children) through innovative
collaborative arrangements with various institutions. URA has documented procedures12 for preparing and communicating tax education material, including that related to changes in tax laws or process. This process is coordinated by dedicated PCA staff and includes: identification of changes in tax laws or process and making a case for the need for education material; preparing education material in liaison with subject matter experts; preparing training and taxpayer sensitization material in various local language dialects; and communicating changes in tax laws or process via URA website, newspapers, radio and television announcements; and meetings with targeted stakeholders to present the changes, including publication of a Budget booklet which is presented the day after the financial statement is read by the Minister of Finance, Planning and Economic Development. URA has a call center and calls are answered promptly. During 2017/18, the call center received an average of 5,500 telephone enquiry calls per month and answered 98.3 percent of these calls within 6 minutes’ waiting time. While impressive and meeting the TADAT score for good practice, taxpayer feedback via a September 2018 contact center satisfaction survey shows general dissatisfaction with the quality of service. For example, 44 percent of respondents felt that their issues were not resolved conclusively while 40 percent were dissatisfied with feedback from the call center. The survey made recommendations for improvement. P3-8: Scope of initiatives to reduce taxpayer compliance costs This indicator examines the tax administration’s efforts to reduce taxpayer compliance costs. Assessed scores are shown in Table 9 followed by an explanation of reasons underlying the assessment.
11 The month-long event, which is held in collaboration with other government institutions, involves several activities across the country to provide tax education, assistance, corporate social responsibility, and promote accountability on the use of government revenue.
12 As set out in the Public and Corporate Affairs Process Document.

26
Table 9. P3-8 Assessment
Measurement Dimensions Scoring Method
Score 2019
P3-8. The extent of initiatives to reduce taxpayer compliance costs. M1 B
Various measures have been put in place to reduce taxpayer compliance costs, including:
• Client relationship managers to facilitate compliance of large and medium taxpayers. • Implementation of a simplified presumptive tax regime for small and micro enterprises,
including a simplified payment option that also serves as a tax return. • A portal for taxpayers to access their tax account details on-line.13 • Publication of public notices in the newspapers, and tax rulings on the URA website. • Extensive use of withholding arrangements where tax withheld at source is treated as a
final tax. • Printing of a book of records with practical guidelines on keeping business records. • Frequently Asked Questions (FAQs) as well as responses to questionnaires obtained
through discussions with taxpayer focus groups are maintained and analyzed to identify areas in which services can be improved.
However, the URA has not yet implemented prefilled tax returns. P3-9: Obtaining taxpayer feedback on products and services For this indicator, two measurement dimensions assess (1) the extent to which the tax administration seeks taxpayer and other stakeholder views of service delivery; and (2) the degree to which taxpayer feedback is taken into account in the design of administrative processes and products. Assessed scores are shown in Table 10 followed by an explanation of reasons underlying the assessment.
Table 10. P3-9 Assessment
Measurement Dimensions Scoring Method
Score 2019
P3-9-1. The use and frequency of methods to obtain performance feedback from taxpayers on the standard of services provided. M1
C C P3-9-2. The extent to which taxpayer input is taken into account in the
design of administrative processes and products. A URA actively seeks client feedback via social media, call center satisfaction surveys, and 13 This portal was undergoing enhancements during the visit, an exercise that was expected to last up to one month but was available for the period under assessment.

27
face-to-face engagement. There is also evidence that results of such engagements were used to design tax policy changes and refine administrative procedures (e.g. design of a presumptive tax regime for small and micro enterprises). However, an independent client satisfaction survey has not been conducted since 2012.
D. POA 4: Timely Filing of Tax Declarations
Filing of tax declarations (also known as tax returns) remains a principal means by which a taxpayer’s tax liability is established and becomes due and payable. As noted in POA 3, however, there is a trend toward streamlining preparation and filing of declarations of taxpayers with relatively uncomplicated tax affairs (e.g., through prefilling tax declarations). Moreover, several countries treat income tax withheld at source as a final tax, thereby eliminating the need for large numbers of PIT taxpayers to file annual income tax declarations. There is also a strong trend towards electronic filing of declarations for all core taxes. Declarations may be filed by taxpayers themselves or via tax intermediaries. It is important that all taxpayers who are required to file do so, including those who are unable to pay the tax owing at the time a declaration is due (for these taxpayers, the first priority of the tax administration is to obtain a declaration from the taxpayer to confirm the amount owed, and then secure payment through the enforcement and other measures covered in POA 5). The following performance indicators are used to assess POA 4: • P4-10—On-time filing rate. • P4-11—Use of electronic filing facilities.
P4-10: On-time filing rate A single performance indicator, with four measurement dimensions, is used to assess the on-time filing rate for CIT, PIT, VAT, and PAYE withholding declarations. A high on-time filing rate is indicative of effective compliance management including, for example, provision of convenient means to file declarations (especially electronic filing facilities), simplified declarations forms, and enforcement action against those who fail to file on time. Assessed scores are shown in Table 11 followed by an explanation of reasons underlying the assessment.

28
Table 11. P4-10 Assessment
Measurement Dimensions Scoring Method
Score 2019
P4-10-1. The number of CIT declarations filed by the statutory due date as a percentage of the number of declarations expected from registered CIT taxpayers.
M2
D
D+
P4-10-2. The number of PIT declarations filed by the statutory due date as a percentage of the number of declarations expected from registered PIT taxpayers.
D
P4-10-3. The number of VAT declarations filed by the statutory due date as a percentage of the number of declarations expected from registered VAT taxpayers.
B
P4-10-4. The number of PAYE withholding declarations filed by employers by the statutory due date as a percentage of the number of PAYE declarations expected from registered employers.
C
On-time filing rates are low and have seen minimal change since 2015, the exception being VAT where the rate has improved. CIT and PIT rates are low at 33.1 percent and 14.5 percent, respectively. PAYE is higher at 60.3 percent, but the rate continues to fall short of a ‘B’ rating which would indicate healthy performance. The VAT rate has now reached 83.5 percent. Client Relationship Managers monitor filing at the LTO where CIT is 86.4 percent and VAT is 96.9 percent. Estimated assessments are generated when a return is late. A significant number of ‘inactive taxpayers’ on the URA’s registration database have an impact on the level of expected returns, and consequently affect the on-time filing rate. PAYE returns are mandatory only when a payment is made in the month which creates a challenge in distinguishing between a late return and a return that is not due. Late filing penalties are not applied until a return is filed. Where an estimated assessment is paid without submitting a return, no late filing penalty is levied, and no interest is applied. P4-11: Use of electronic filing facilities This indicator measures the extent to which declarations, for all core taxes, are filed electronically. Assessed scores are shown in Table 12 followed by an explanation of reasons underlying the assessment.

29
Table 12. P4-11 Assessment
Measurement Dimensions Scoring Method
Score 2019
P4-11. The extent to which tax declarations are filed electronically. M1 A
Electronic filing is mandatory for all core taxes. On-time filing data can be extracted directly from the eTAX system.
E. POA 5: Timely Payment of Taxes
Taxpayers are expected to pay taxes on time. Tax laws and administrative procedures specify payment requirements, including deadlines (due dates) for payment, who is required to pay, and payment methods. Depending on the system in place, payments due will be either self-assessed or administratively assessed. Failure by a taxpayer to pay on time results in imposition of interest and penalties and, for some taxpayers, legal debt recovery action. The aim of the tax administration should be to achieve high rates of voluntary on-time payment and low incidence of tax arrears. Four performance indicators are used to assess POA 5: • P5-12—Use of electronic payment methods. • P5-13—Use of efficient collection systems. • P5-14—Timeliness of payments. • P5-15—Stock and flow of tax arrears. P5-12: Use of electronic payment methods This indicator examines the degree to which core taxes are paid by electronic means, including through electronic funds transfer (where money is electronically transferred via the Internet from a taxpayer’s bank account to the government’s account), credit cards, and debit cards. For TADAT measurement purposes, payments made in person by a taxpayer to a third-party agent (e.g., a bank or post office) that are then electronically transferred by the agent to the government’s account are accepted as electronic payments. Assessed scores are shown in Table 13 followed by an explanation of reasons underlying the assessment.

30
Table 13. P5-12 Assessment
Measurement Dimensions Scoring Method
Score 2019
P5-12. The extent to which core taxes are paid electronically. M1 A
All core taxes are paid electronically. Various options are available to taxpayers to make payments, such as online payment at three banks, mobile payments and cash-over-counter payments at 24 banks. Future plans for electronic payments include the use of e-Wallet. See Table 9 of Attachment III. P5-13: Use of efficient collection systems This indicator assesses the extent to which acknowledged efficient collection systems—especially withholding at source and advance payment systems—are used. Assessed scores are shown in Table 14 followed by an explanation of reasons underlying the assessment. Table 14. P5-13 Assessment
Measurement Dimensions Scoring Method
Score 2019
P5-13. The extent to which withholding at source and advance payment systems are used. M1 A
URA makes good use of withholding in respect of employment income, interest, dividends, and advance payment systems. Withholding at source as prescribed in the Income Tax Act, Chapter 340 mandates withholding at source for all employment, interest and dividend income and other income like rental. Advance payment arrangements are also in place to collect income tax from businesses (CIT) and self-employed individuals (PIT) with the first payment due within the first six months of the year of assessment. P5-14: Timeliness of payments This indicator assesses the extent to which payments are made on time (by number and by value). For TADAT measurement purposes, VAT payment performance is used as a proxy for on-time payment performance of core taxes generally. A high on-time payment percentage is indicative of sound compliance management including, for example, provision of convenient payment methods and effective follow-up of overdue amounts. Assessed scores are shown in Table 15 followed by an explanation of reasons underlying the assessment.

31
Table 15. P5-14 Assessment
Measurement Dimensions Scoring Method
Score 2019
P5-14-1. The number of VAT payments made by the statutory due date in percent of the total number of payments due. M1
D D P5-14-2. The value of VAT payments made by the statutory due date in
percent of the total value of VAT payments due. C The number and value of VAT payments made by the statutory due date are low. The on-time payment rate with respect to VAT, especially by number of payments (at 48.9 percent), is weak relative to international good practice—see Table 10 of Attachment III. The rate for VAT on-time payments, by value, is higher at 63.8 percent. P5-15: Stock and flow of tax arrears This indicator examines the extent of accumulated tax arrears. Two measurement dimensions are used to gauge the size of the administration’s tax arrears inventory: (1) the ratio of end-year tax arrears to the denominator of annual tax collections; and (2) the more refined ratio of end-year ‘collectible tax arrears’ to annual collections.14 A third measurement dimension looks at the extent of unpaid tax liabilities that are more than a year overdue (a high percentage may indicate poor debt collection practices and performance given that the rate of recovery of tax arrears tends to decline as arrears get older). Assessed scores are shown in Table 16 followed by an explanation of reasons underlying the assessment.
Table 16. P5-15 Assessment
Measurement Dimensions Scoring Method
Score 2019
P5-15-1. The value of total core tax arrears at fiscal year-end as a percentage of total core tax revenue collections for the fiscal year.
M2
C
C P5-15-2. The value of collectible core tax arrears at fiscal year-end as a percentage of total core tax revenue collections for the fiscal year. B
P5-15-3. The value of core tax arrears more than 12 months’ old as a percentage of the value of all core tax arrears. D
The stock of tax arrears is very high and comprises mainly of old debt. Tax arrears data in Attachment III, Table 11 indicates ratios of 23.4 percent for P5-15-1, 6.1 percent for P5-15-2 and 78.2 percent for P5-15-3 in the most recent year (2017/18). Although URA has a debt 14 For purposes of this ratio, ’collectible’ tax arrears is defined as total domestic tax arrears excluding: (a) amounts formally disputed by the taxpayer and for which collection action has been suspended pending the outcome, (b) amounts that are not legally recoverable (e.g., debt foregone through bankruptcy), and (c) arrears otherwise uncollectible (e.g., the debtor has no funds or other assets).

32
management unit, debt recovery procedures, debt write-off procedures and a debt write-off committee, it has not managed to reduce the amount of tax arrears older than 12 months effectively. The value of core tax arrears has more than doubled from 23.6 percent in 2015/16 to 78.2 percent in the 2017/18.
F. POA 6: Accurate Reporting in Declarations
Tax systems rely heavily on complete and accurate reporting of information by taxpayers in tax declarations. Tax administrations therefore need to regularly monitor tax revenue losses from inaccurate reporting, especially by business taxpayers, and take a range of actions to ensure compliance. These actions fall into two broad groups: verification activities (e.g., tax audits, investigations, and income matching against third party information sources) and proactive initiatives (e.g., taxpayer assistance and education as covered in POA 3, and cooperative compliance approaches). If well designed and managed, tax audit programs can have far wider impact than simply raising additional revenue from discrepancies detected by tax audits. Detecting and penalizing serious offenders serve to remind all taxpayers of the consequences of inaccurate reporting. Also prominent in modern tax administration is high-volume automated crosschecking of amounts reported in tax declarations with third party information. Because of the high cost and relative low coverage rates associated with traditional audit methods, tax administrations are increasingly using technology to screen large numbers of taxpayer records to detect discrepancies and encourage correct reporting. Proactive initiatives also play an important role in addressing risks of inaccurate reporting. These include adoption of cooperative compliance approaches to build collaborative and trust-based relationships with taxpayers (especially large taxpayers) and intermediaries to resolve tax issues and bring certainty to companies’ tax positions in advance of a tax declaration being filed, or before a transaction is actually entered into. A system of binding tax rulings can play an important role here. Finally, on the issue of monitoring the extent of inaccurate reporting across the taxpayer population generally, a variety of approaches are being used, including: use of tax compliance gap estimating models, both for direct and indirect taxes; advanced analytics using large data sets (e.g., predictive models, clustering techniques, and scoring models) to determine the likelihood of taxpayers making full and accurate disclosures of income; and surveys to monitor taxpayer attitudes towards accurate reporting of income. Against this background, three performance indicators are used to assess POA 6:

33
P6-16—Scope of verification actions taken to detect and deter inaccurate reporting. P6-17—Extent of proactive initiatives to encourage accurate reporting. P6-18—Monitoring the extent of inaccurate reporting. P6-16: Scope of verification actions taken to detect and deter inaccurate reporting. For this indicator, two measurement dimensions provide an indication of the nature and scope of the tax administration’s verification program Assessed scores are shown in Table 17 followed by an explanation of reasons underlying the assessment.
Table 17. P6-16 Assessment
Measurement Dimensions Scoring Method
Score 2019
P6-16-1. The nature and scope of the tax audit program in place to detect and deter inaccurate reporting. M2
A B P6-16-2. The extent of large-scale automated crosschecking to verify
information in tax declarations. C
URA’s tax audit program meets international good practice. The CIP covers all core taxes and taxpayer segments, including high net worth individuals and the public sector. The CIP focuses on the highest risks and financial relevance using an automated risk engine. Cases are selected centrally. URA uses a wide range of audit types, including compliance audits, return examinations, refund audits, and compliance visits. To expand audit coverage, URA has allocated its resources to provide greater focus on compliance advisory visits and desk audits. Both direct and indirect audit methods are used. URA’s post assessment review evaluates the impact of audits on the level of compliance. There is large-scale automated crosschecking of data reported in PIT and CIT returns with information from internal and external sources. URA has invested in automated largescale crosschecking of third party information with PIT and CIT returns. This has led to substantial crosschecking of internal and external information from: VAT, employers, customs, motor vehicles, land registration, the national social security fund and other agencies via the government’s Integrated Financial Management Information System (IFMIS). Some information cannot be crosschecked due to missing TIN numbers. URA cannot currently enforce large-scale automated crosschecking of information from banks.

34
P6-17: Extent of proactive initiatives to encourage accurate reporting This indicator assesses the nature and scope of cooperative compliance and other proactive initiatives undertaken to encourage accurate reporting. Assessed scores are shown in Table 18 followed by an explanation of reasons underlying the assessment. Table 18. P6-17 Assessment
Measurement Dimensions Scoring Method
Score 2019
P6-17. The nature and scope of proactive initiatives undertaken to encourage accurate reporting. M1 B
URA has a system of public and private rulings for all core taxes in place. The Tax Procedures Code Act gives the taxpayer an opportunity to request a private ruling, which is binding on URA provided that the taxpayer has made a full and true disclosure of the facts. Public rulings (Practices Notes) are issued when deemed necessary. The LTO has adopted account management procedures and is considering implementation of cooperative compliance programs. P6-18: Monitoring the extent of inaccurate reporting This indicator examines the soundness of methods used by the tax administration to monitor the extent of inaccurate reporting in declarations. The assessed score is shown in Table 19 followed by an explanation of reasons underlying the assessment. Table 19. P6-18 Assessment
Measurement Dimensions Scoring Method
Score 2019
P6-18. The soundness of the method/s used by the tax administration to monitor the extent of inaccurate reporting. M1 C
Studies into the extent of inaccurate reporting for VAT were carried out in 2013/14 (IMF) and 2018/19 (Economic Policy Research Center). Other monitoring studies and related reports used by the URA include: a report on the tax gap of the informal sector which led to introduction of a new presumptive tax regime; and two studies on high net worth individuals. Further, the World Bank is currently helping the URA conduct a study on the tax gap on core taxes.

35
G. POA 7: Effective Tax Dispute Resolution
This POA deals with the process by which a taxpayer seeks an independent review, on grounds of facts or interpretation of the law, of a tax assessment resulting from an audit. Above all, a tax dispute process must safeguard a taxpayer’s right to challenge a tax assessment and get a fair hearing. The process should be based on a legal framework, be known and understood by taxpayers, be easily accessible, guarantee transparent independent decision-making, and resolve disputed matters in a timely manner. Three performance indicators are used to assess POA 7: • P7-19—Existence of an independent, workable, and graduated dispute resolution process. • P7-20—Time taken to resolve disputes. • P7-21—Degree to which dispute outcomes are acted upon.
P7-19: Existence of an independent, workable, and graduated resolution process For this indicator three measurement dimensions assess (1) the extent to which a dispute may be escalated to an independent external tribunal or court where a taxpayer is dissatisfied with the result of the tax administration’s review process; (2) the extent to which the tax administration’s review process is truly independent; and (3) the extent to which taxpayers are informed of their rights and avenues of review. Assessed scores are shown in Table 20 followed by an explanation of reasons underlying the assessment.
Table 20. P7-19 Assessment
Measurement Dimensions Scoring Method
Score 2019
P7-19-1. The extent to which an appropriately graduated mechanism of administrative and judicial review is available to, and used by, taxpayers.
M2
B
B P7-19-2. Whether the administrative review mechanism is independent of the audit process. C P7-19-3. Whether information on the dispute process is published, and whether taxpayers are explicitly made aware of it. A
A tiered review mechanism is in place and is used. A graduated mechanism that consists of a multi-layered administrative review process, an independent external specialist tax tribunal and a higher court for judicial reviews is in place. The first stage of objection lies with the Objections and Appeals Unit (OAU) for cases arising from taxpayers managed at headquarters and surrounding areas.15 Cases 15 OAU manages objections arising from: the Kampala medium tax office; LTO; joint audits from Kampala metro; and central region; and the public-sector office (responsible for the tax affairs of government departments and other public entities).

36
for other upcountry field offices are managed by different Objections Committees in the Eastern, Mid-Western, Northern and Western regions. However, taxpayers may opt for a second review of the objections decision issued rather than going to second stage. Such cases can only be reviewed if authorized by the Assistant Commissioner – Compliance Management. URA encourages reopening of cases as it is seen that it reduces the cost and time of litigation. Where a taxpayer is dissatisfied with the outcomes of the administrative review, the case may proceed to the second stage, the Tax Appeals Tribunal (TAT), and the third stage – the High Court of Uganda. Taxpayers use this formal dispute process. The objections review mechanism is not uniform across URA. Although the bulk of the objections are handled by the OAU, which is physically and organizationally independent of the audit department, membership of the objections committees in the four upcountry regions (chaired by the Station Head in charge of service management) may, in some cases, include auditors separate from those who were involved in the audit of the taxpayer. Information on the dispute process is available and taxpayers are explicitly made aware of it. URA provides information on the taxpayers’ appeal rights and the dispute process: (i) on its website; (ii) in taxpayer education brochures; (iii) in notices of assessment; and (iv) in the management letter on audit findings. The audit manual has provisions that require auditors to explicitly inform the taxpayers of their dispute rights and related procedures. P7-20: Time taken to resolve disputes This indicator assesses how responsive the tax administration is in completing administrative reviews. Assessed scores are shown in Table 21 followed by an explanation of reasons underlying the assessment. Table 21. P7-20 Assessment
Measurement Dimensions Scoring Method
Score 2019
P7-20. The time taken to complete administrative reviews. M1 D The tax administration routinely monitors the time taken to complete administrative reviews. However, during 2017/18, only 79.5 percent of the cases were finalized within 90 days. Reference Attachment III, Table 12 for details. P7-21: Degree to which dispute outcomes are acted upon This indicator looks at the extent to which dispute outcomes are taken into account in determining policy, legislation, and administrative procedure. The assessed score is shown in Table 22 followed by an explanation of reasons underlying the assessment.

37
Table 22. P7-21 Assessment
Measurement Dimensions Scoring Method
Score 2019
P7-21. The extent to which the tax administration responds to dispute outcomes. M1 A
Dispute outcomes of a material nature are monitored and considered in the formulation of policy, legislation, and administrative procedures. Evidence available shows that URA’s Legal Services and Board Affairs department routinely monitors and analyzes dispute outcomes and: (i) summary of judgements and rulings as well as learning points are shared with all staff on a quarterly basis through an internal memorandum; (ii) URA management uses the outcomes to amend administrative procedures; and (iii) the rulings are also posted on the website for the general public. Additionally, impact analysis reports on TAT and judicial decisions, especially those with significant revenue implications or outcomes that may potentially affect a large number of taxpayers, are communicated to the Tax Policy Department of MOFPED for appropriate action (e.g., amendment of the law).
H. POA 8: Efficient Revenue Management
This POA focuses on three key activities performed by tax administrations in relation to revenue management: • Providing input to government budgeting processes of tax revenue forecasting and tax
revenue estimating. (As a general rule, primary responsibility for advising government on tax revenue forecasts and estimates rests with the Ministry of Finance. The tax administration provides data and analytical input to the forecasting and estimating processes. Ministries of Finance often set operational revenue collection targets for the tax administration based on forecasts of revenue for different taxes.)16
• Maintaining a system of revenue accounts. • Paying tax refunds. Three performance indicators are used to assess POA 8: • P8-22—Contribution to government tax revenue forecasting process. • P8-23—Adequacy of the tax revenue accounting system.
16 It is common for Ministries of Finance to review budget revenue forecasts and related tax collection targets during the fiscal year (particularly mid-year) to take account of changes in forecasting assumptions, especially changes in the macroeconomic environment.

38
• P8-24—Adequacy of tax refund processing.
P8-22: Contribution to government tax revenue forecasting process This indicator assesses the extent of tax administration input to government tax revenue forecasting and estimating. The assessed score is shown in Table 23 followed by an explanation of reasons underlying the assessment. Table 23. P8-22 Assessment
Measurement Dimensions Scoring Method
Score 2019
P8-22. The extent of tax administration input to government tax revenue forecasting and estimating. M1 C
URA’s Research and Revenue Monitoring team consistently forecasts for all core taxes using a comprehensive forecasting model. The primary data source is historical performance, with adjustments made for revenue-enhancing measures and economic conditions. Revenue forecasts are agreed in consultation with the MOFPED and revenue collection against forecasts is reported regularly. Forecasts are adjusted in-year according to performance. VAT refund levels are forecast; however, forecast figures do not represent an adequate level of funding to meet refund claims. Processing of legitimate VAT refunds has fallen significantly short of the required standard in the past and as a result basing forecasts on historical data without appropriate adjustment is ineffective. Revenue forgone due to tax exemptions and incentives is monitored and reported upon. URA does not formally report on stock of tax losses carried forward. P8-23: Adequacy of the tax revenue accounting system
This indicator examines the adequacy of the tax revenue accounting system. Assessed scores are shown in Table 24 followed by an explanation of reasons underlying the assessment. Table 24. P8-23 Assessment
Measurement Dimensions Scoring Method
Score 2019
P8-23. Adequacy of the tax administration’s revenue accounting system. M1 D
URA operates a robust accounting system; however, it does not interface directly with the MOFPED revenue accounting system. All payments from taxpayers are through commercial banks, except for those from other government departments which are paid directly to the central bank. URA introduced an Oracle-based ERP system in November 2018. This automated

39
accounting system interfaces with commercial bank systems, and URA receives automatic notification of any payment, which also updates the taxpayer ledger. Manual intervention is required to link MOFPED and URA accounting information and numerous crosschecks are in place to ensure that the system fully accounts for all funds. All tax payments are posted to URA’s accounting systems within one business day; this is established in service-level agreements with the commercial banks and is monitored closely. URA’s quarterly internal audit program covers both financial management and systems audit, and information systems audit. P8-24: Adequacy of tax refund processing
For this indicator, two measurement dimensions assess the tax administration’s system of processing VAT refund claims. Assessed scores are shown in Table 25 followed by an explanation of reasons underlying the assessment.
Table 25. P8-24 Assessment
Measurement Dimensions Scoring Method
Score 2019
P8-24-1. Adequacy of the VAT refund system. M2
C D+ P8-24-2. The time taken to pay (or offset) VAT refunds.
D
All refund claims are subject to automatic risk assessment and review by an officer. Claims considered ‘suspect’ are subject to a pre-refund audit; and ‘credible’ cases receive lighter checks. Refund audits are also carried out post-refund in some cases. Yet funds available do not meet current monthly payment requirements. Unless there is an active objection or appeal, VAT credits will be offset against other liabilities before any repayment is made. Although the law states that 2 percent per month interest will be paid after 30 days, in practice no interest is paid on delayed refunds; the exception is in instances following a tribunal or court case. Few refund claims are processed in a timely manner. Only 6 percent were processed within the 30-day standard prescribed by TADAT, representing less than three 3 percent of the total value of claims filed in 2017/18. See Attachment III, Table 13 for details.
I. POA 9: Accountability and Transparency
Accountability and transparency are central pillars of good governance. Their institutionalization reflects the principle that tax administrations should be answerable for the way they use public resources and exercise authority. To enhance community confidence and trust, tax administrations should be openly accountable for their actions within a framework of responsibility to the minister, government, legislature, and the general public. Four performance indicators are used to assess POA 9:

40
• P9-25—Internal assurance mechanisms. • P9-26—External oversight of the tax administration. • P9-27—Public perception of integrity. • P9-28—Publication of activities, results, and plans. P9-25: Internal assurance mechanisms
For this indicator, two measurement dimensions assess the internal assurance mechanisms in place to protect the tax administration from loss, error, and fraud. Assessed scores are shown in Table 26 followed by an explanation of reasons underlying the assessment. Table 26. P9-25 Assessment
Measurement Dimensions Scoring Method
Score 2019
P9-25-1. Assurance provided by internal audit. M2
C B P9-25-2. Staff integrity assurance mechanisms.
A
URA has an independent internal audit unit that reports administratively to the CG and functionally to the Board through the audit committee. The IACD is not only responsible for internal audit functions, but also for ensuring staff compliance with the statutory, regulatory and supervisory obligations which apply to URA, provisions of the human resource management manual (HRMM) and the ethical standards specified in the code of ethics. IACD uses sound internal audit methodology that addresses risks and control weaknesses. Training on this working methodology is provided to internal audit staff. In addition, auditors are encouraged to become certified internal auditors. An annual internal audit plan covers internal control checks, operational performance audits, IT systems, and financial audits. IT systems control tools are used to detect incidents of threats to data integrity in eTAX. However, there is no central repository of internal control policies, processes and procedures in IACD. The frequency of external review of internal audit operations and systems does not provide reasonable assurance that it conforms to the standards of professional practice. Such an independent review was last done in 2012 with the next one earmarked for 2019, which will be in conformity with the Institute of Internal Auditors international standards for professional practice.17
17 Though the AG undertakes annual reviews of the operations of URA which may include IACD, this lacks the depth needed to assure IACD conformity to standards of professional practice.

41
Staff integrity assurance mechanisms are present in URA. IACD’s compliance unit (internal affairs) has appropriate investigative powers. The unit provides leadership to the formulation of integrity and ethics policy including code of ethics by making appropriate recommendations in advisory and review reports on various areas. The unit cooperates and has signed MOUs with the IGG and the police. The unit maintains integrity-related statistics while preserving confidentiality; these statistics are publicized in the annual report which is placed on URA website.
P9-26: External oversight of the tax administration
Two measurement dimensions of this indicator assess (1) the extent of independent external oversight of the tax administration’s operations and financial performance; and (2) the investigation process for suspected wrongdoing and maladministration. Assessed scores are shown in Table 27 followed by an explanation of reasons underlying the assessment.
Table 27. P9-26 Assessment
Measurement Dimensions Scoring Method
Score 2019
P9-26-1. The extent of independent external oversight of the tax administration’s operations and financial performance. M2
A B P9-26-2. The investigation process for suspected wrongdoing and
maladministration. C
Processes exist for the external oversight of URA. Annual financial and operational audits are carried out by the AG. Review findings are responded to by URA and included in the AG’s report. They are also discussed in parliament and open to the media. The AG’s report, including URA’s responses, is made available on AG’s website. The external oversight does not adequately address complaints on the treatment of taxpayers. IACD’s internal compliance unit which is responsible for receiving and investigating wrongdoing by URA staff works closely with the IGG (the Ombudsman equivalent who also acts as the national anti-corruption agency) whose functions include the promotion of fair, efficient and good governance in public offices. The URA is covered by the IGG’s mandate regarding taxpayer complaints. The IGG investigates taxpayers’ complaints on an ad hoc basis. P9-27: Public perception of integrity
This indicator examines measures taken to gauge public confidence in the tax administration. The assessed score is shown in Table 28 followed by an explanation of reasons underlying the assessment.

42
Table 28. P9-27 Assessment
Measurement Dimensions Scoring Method
Score 2019
P9-27. The mechanism for monitoring public confidence in the tax administration. M1 D
The mechanism for monitoring public confidence in URA is lacking. No independent survey monitoring public perceptions of integrity has been commissioned since 2012. P9-28: Publication of activities, results, and plans
Two measurement dimensions of this indicator assess the extent of (1) public reporting of financial and operational performance; and (2) publication of future directions and plans. Assessed scores are shown in Table 29 followed by an explanation of reasons underlying the assessment. Table 29. P9-28 Assessment
Measurement Dimensions Scoring Method
Score 2019
P9-28-1. The extent to which the financial and operational performance of the tax administration is made public, and the timeliness of publication. M2
B C+ P9-28-2. The extent to which the tax administration’s future directions
and plans are made public, and the timeliness of publication. C There has been an improvement in publicizing activities, results and plans of URA. The annual report outlining the financial and operational performance is prepared and submitted to the Minister of Finance, Planning and Economic Development who causes it to be laid before parliament. However, the last report was made public within 9 months of the end of the fiscal year. A four-year strategic plan and operational plans are prepared by URA. While the strategic plans are made public in advance of the plan period, only elements of the operational plans are made public.

43
Attachment I. TADAT Framework Performance outcome areas TADAT assesses the performance of a country’s tax administration system by reference to nine outcome areas: 1. Integrity of the registered taxpayer base: Registration of taxpayers and maintenance of a
complete and accurate taxpayer database is fundamental to effective tax administration.
2. Effective risk management: Performance improves when risks to revenue and tax administration operations are identified and systematically managed.
3. Supporting voluntary compliance: Usually, most taxpayers will meet their tax obligations if they are given the necessary information and support to enable them to comply voluntarily.
4. On-time filing of declarations: Timely filing is essential because the filing of a tax declaration is a principal means by which a taxpayer’s tax liability is established and becomes due and payable.
5. On-time payment of taxes: Nonpayment and late payment of taxes can have a detrimental effect on government budgets and cash management. Collection of tax arrears is costly and time consuming.
6. Accurate reporting in declarations: Tax systems rely heavily on complete and accurate
reporting of information in tax declarations. Audit and other verification activities and proactive initiatives of taxpayer assistance, promote accurate reporting and mitigate tax fraud.
7. Effective dispute resolution: Independent accessible, and efficient review mechanisms
safeguard a taxpayer’s right to challenge a tax assessment and get a fair hearing in a timely manner.

44
8. Efficient revenue management: Tax revenue collections must be fully accounted for, monitored against budget expectations, and analyzed to inform government revenue forecasting. Legitimate tax refunds to individuals and businesses must be paid promptly.
9. Accountability and transparency: As public institutions, tax administrations are answerable
for the way they use public resources and exercise authority. Community confidence and trust are enhanced when there is open accountability for administrative actions within a framework of responsibility to the minister, legislature, and general community.
Indicators and associated measurement dimensions A set of 28 high-level indicators critical to tax administration performance are linked to the performance outcome areas. It is these indicators that are scored and reported on. A total of 47 measurement dimensions are taken into account in arriving at the indicator scores. Each indicator has between one and four measurement dimensions. Repeated assessments will provide information on the extent to which a country’s tax administration is improving. Scoring methodology The assessment of indicators follows the same approach followed in the Public Expenditure and Financial Accountability (PEFA) diagnostic tool so as to aid comparability where both tools are used. Each of TADAT’s 47 measurement dimensions is assessed separately. The overall score for an indicator is based on the assessment of the individual dimensions of the indicator. Combining the scores for dimensions into an overall score for an indicator is done using one of two methods: Method 1 (M1) or Method 2 (M2). For both M1 and M2, the four-point ‘ABCD’ scale is used to score each dimension and indicator. Method M1 is used for all single dimensional indicators and for multi-dimensional indicators where poor performance on one dimension of the indicator is likely to undermine the impact of good performance on other dimensions of the same indicator (in other words, by the weakest link in the connected dimensions of the indicator). Method M2 is based on averaging the scores for individual dimensions of an indicator. It is used for selected multi-dimensional indicators where a low score on one dimension of the indicator does not necessarily undermine the impact of higher scores on other dimensions for the same indicator.

45
Attachment II. Uganda: Country Snapshot
Geography Uganda is a landlocked country bordered by Kenya in the east, Sudan in the north, Democratic Republic of the Congo in the west, Rwanda in the southwest and Tanzania in the south. Uganda’s total land area is 241,559 km2. About 37,000 km2 of this area is occupied by open water while the rest is land. The southern part of the country includes a substantial portion of Lake Victoria, which it shares with Kenya and Tanzania. Uganda is located on the East African plateau, averaging about 1,100 meters above sea level. Although generally equatorial, the climate is not uniform since the altitude modifies the climate. Uganda’s elevation, soil types and predominantly warm and wet climate impart a huge agricultural potential to the country. They also explain the country’s large variety of forests, grasslands and wildlife reserves. (Source: Uganda Facts and Figure - Ministry of Tourism Website).
Population 39.2 million (UBOS, 2018) Adult literacy rate 73.9 percent of persons aged 15 and over can read and write.
(UNESCO, Institute of Statistics, 2017) Gross domestic product 2017/2018 Nominal GDP: UGX 100,531.0 billion (BOU, 2018) Per capita GDP Annual GDP Per Capita at current prices for 2017/18 - US$ 724.1 or
UGX 2,683,850 (BOU, 2018) Main industries Sugar, brewing, tobacco, cotton textiles, cement and steel
production. (Source: CIA World Fact book 2017)
Communications
7.9 Internet users per 100 people (UCC) 55.048 Mobile ‘phone subscribers per 100 people (World Bank, 2017).
Main taxes VAT, Excise duties, Corporate Income tax, PAYE, Rental Income tax, Withholding Income tax. (Source: URA)
Domestic tax-to-GDP 10.7 percent in 2017/18, excluding Customs tax collections (14.2 percent including customs). (Source: URA)
Number of taxpayers CIT (86,114); PAYE (23,404), PIT (249,560); VAT (16,499), and Domestic Excise Taxes (246). (Source: URA)
Main collection agency Uganda Revenue Authority Number of staff in the main collection agency
2,401 (Source: URA Annual Report, 2017/18)
Financial Year July to June

46
Attachment III. Data Tables A. Domestic Tax Revenue Collections Table 1. Domestic Tax Revenue Collections1
[2015/16] [2016/17] [2017/18] In local currency
National budgeted tax revenue forecast2 6,552.6 7,324.8 8.705.0 Total tax revenue collections 8,651.7 9,630.8 10,930.8 Corporate Income Tax (CIT) 732.2 764.3 884.8 Personal Income Tax (PIT) 1,803.5 2,115.0 2,396.1 Value-Added Tax (VAT)—gross domestic collections 1,772.1 2,022.5 2,234.8 Value-Added Tax (VAT)—collected on imports 1,952.8 2,057.1 2,416.6 Value-Added Tax (VAT)—refunds approved and paid (141.8) (146.1) (131.6) Excises on domestic transactions 671.1 819.8 953.9 Excises—collected on imports 245.7 239.4 196.9 Other domestic taxes3 1,616.0 1,758.9 1,979.3
In percent of total tax revenue collections Total tax revenue collections 100.0 100.0 100.0 CIT 8.5 7.9 8.1 PIT 20.8 22.0 21.9 Value-Added Tax (VAT)—gross domestic collections 20.5 21.0 20.4 Value-Added Tax (VAT)—collected on imports 22.6 21.4 22.1 Value-Added Tax (VAT)—refunds approved and paid (1.6) (1.5) (1.2) Excises—collected on domestic transactions 7.8 8.5 8.7 Excises—collected on imports 2.8 2.5 1.8 Other domestic taxes 18.7 18.3 18.1
In percent of GDP Total tax revenue collections 10.4 10.5 10.9 CIT 0.9 0.8 0.9 PIT 2.2 2.3 2.4 Value-Added Tax (VAT)—gross domestic collections 2.1 2.2 2.2 Value-Added Tax (VAT)—collected on imports 2.4 2.2 2.4 Value-Added Tax (VAT)—refunds approved and paid (0.2) (0.2) (0.1) Excises—collected on domestic transactions 0.8 0.9 0.9 Excises—collected on imports 0.3 0.3 0.2 Other domestic taxes 1.9 1.9 2.0 Nominal GDP in local currency 83,091.0 91,718.0 100,531.0 Explanatory notes: 1 This table gathers data for three fiscal years (e.g. 2015 – 17) in respect of all domestic tax revenues collected by the tax administration at the national level, plus VAT and Excise tax collected on imports by the customs and/or other agency. 2 This forecast is normally set by the ministry of finance with input from the tax administration and, for purposes of this table, should only cover the taxes listed in the table. The final budgeted forecast, as adjusted through any mid-year review process, should be used. 3 Other domestic taxes collected at the national level by the tax administration include, for example, property taxes, financial transaction taxes, and environment taxes.

47
A. Movements in the Taxpayer Register
Table 2. Movements in the Taxpayer Register
(Ref: POA 1) 2015/16
Active1 [1] Inactive (not yet
deregistered) [2]
Total end-year
position [1 + 2]
Percentage of inactive (not yet
deregistered)
Deregistered during the year
Corporate income tax 28,830 41,935 70,765 59.3 1,176 Personal income tax 89,475 22,398 111,873 20.0 708 PAYE withholding (# of employers) 15,026 2,518 17,544 14.4 575 Value Added Tax 10,978 5,252 16,230 32.4 933 Domestic excise tax 258 - 258 0.0 78 2016/17 Corporate income tax 32,559 47,255 79,814 59.2 2,489 Personal income tax 108,549 63,558 172,107 36.9 1,464 PAYE withholding (# of employers) 17,166 3,828 20,994 18.2 696 Value Added Tax 12,560 5,501 18,061 30.5 1,828 Domestic excise tax 258 7 265 2.6 77 2017/18 Corporate income tax 35,117 50,997 86,114 59.2 4,491 Personal income tax 161,168 88,392 249,560 35.4 2,028 PAYE withholding (# of employers) 19,706 3,698 23,404 15.8 1,149 Value Added Tax 14,739 1,760 16,499 10.7 2,638 Domestic excise tax 246 - 246 - 46
Explanatory Note:
1’Active’ taxpayers means registrants from whom returns are expected, i.e. excluding those taxpayers who have not filed a return within at least the last year because the case is defunct, the taxpayer cannot be located, or the taxpayer is insolvent.

48
C. Telephone Enquiries
Table 3. Telephone Enquiry Call Waiting Time (2017/2018) (Ref: POA 3)
Month Total number of
telephone enquiry calls received
Telephone enquiry calls answered within 6 minutes’ waiting time
Number In percent of total calls
July 2017 4,314 4,296 99.6 August 2017 4,987 4,962 99.5
September 2017 5,103 5,047 98.9 October 2017 7,672 7,639 99.6
November 2017 8,983 8,549 95.2 December 2017 6,159 6,016 97.7
January 2018 5,453 5,424 99.5 February 2018 4,803 4,728 98.4
March 2018 5,393 5,305 98.4 April 2018 5,059 5,043 99.7 May 2018 4,839 4,763 98.4 June 2018 3,958 3,841 97.0
12-month total 66,723 65,613 98.3

49
D. Filing of Tax Declarations
Table 4. On-time Filing of CIT Declarations for the 2017/18 Income Year (Ref: POA 4)
Number of
declarations filed on-time1
Number of declarations expected
to be filed2
On-time filing rate3 (In percent)
All CIT taxpayers 22,687 72,995 31.1 Large taxpayers only 598 692 86.4
Explanatory notes:
1 ‘On-time’ filing means declarations (also known as ‘returns’) filed by the statutory due date for filing (plus any ‘days of grace’ applied by the tax administration as a matter of administrative policy).
2 ‘Expected declarations’ means the number of CIT declarations that the tax administration expected to receive from registered CIT taxpayers that were required by law to file declarations.
3 The ‘on-time filing rate’ is the number of declarations filed by the statutory due date as a percentage of the total number of declarations expected from registered taxpayers, i.e. expressed as a ratio:
𝑁𝑁𝑁𝑁𝑁𝑁𝑁𝑁𝑁𝑁𝑁𝑁 𝑜𝑜𝑜𝑜 𝐶𝐶𝐶𝐶𝐶𝐶 𝑑𝑑𝑁𝑁𝑑𝑑𝑑𝑑𝑑𝑑𝑁𝑁𝑑𝑑𝑑𝑑𝑑𝑑𝑜𝑜𝑑𝑑𝑑𝑑 𝑜𝑜𝑑𝑑𝑑𝑑𝑁𝑁𝑑𝑑 𝑁𝑁𝑏𝑏 𝑑𝑑ℎ𝑁𝑁 𝑑𝑑𝑁𝑁𝑁𝑁 𝑑𝑑𝑑𝑑𝑑𝑑𝑁𝑁
𝑁𝑁𝑁𝑁𝑁𝑁𝑁𝑁𝑁𝑁𝑁𝑁 𝑜𝑜𝑜𝑜𝑑𝑑𝑁𝑁𝑑𝑑𝑑𝑑𝑑𝑑𝑁𝑁𝑑𝑑𝑑𝑑𝑑𝑑𝑜𝑜𝑑𝑑𝑑𝑑 𝑁𝑁𝑒𝑒𝑒𝑒𝑁𝑁𝑑𝑑𝑑𝑑𝑁𝑁𝑑𝑑 𝑜𝑜𝑁𝑁𝑜𝑜𝑁𝑁 𝑁𝑁𝑁𝑁𝑟𝑟𝑑𝑑𝑑𝑑𝑑𝑑𝑁𝑁𝑁𝑁𝑁𝑁𝑑𝑑 𝐶𝐶𝐶𝐶𝐶𝐶 𝑑𝑑𝑑𝑑𝑒𝑒𝑒𝑒𝑑𝑑𝑏𝑏𝑁𝑁𝑁𝑁𝑑𝑑 𝑒𝑒 100
Table 5. On-time Filing of PIT Declarations for the 2017/2018 Income Year (Ref: POA 4)
Number of declarations filed on-time1
Number of declarations expected to be filed2
On-time filing rate3 (In percent)
24,420 168,024 14.5
Explanatory notes:
1 ‘On-time’ filing means declarations (also known as ‘returns’) filed by the statutory due date for filing (plus any ‘days of grace’ applied by the tax administration as a matter of administrative policy).
2 ‘Expected declarations’ means the number of PIT declarations that the tax administration expected to receive from registered PIT taxpayers that were required by law to file declarations.
3 The ‘on-time filing rate’ is the number of declarations filed by the statutory due date as a percentage of the total number of declarations expected from registered taxpayers, i.e. expressed as a ratio:
𝑁𝑁𝑁𝑁𝑁𝑁𝑁𝑁𝑁𝑁𝑁𝑁 𝑜𝑜𝑜𝑜 𝑃𝑃𝐶𝐶𝐶𝐶 𝑑𝑑𝑁𝑁𝑑𝑑𝑑𝑑𝑑𝑑𝑁𝑁𝑑𝑑𝑑𝑑𝑑𝑑𝑜𝑜𝑑𝑑𝑑𝑑 𝑜𝑜𝑑𝑑𝑑𝑑𝑁𝑁𝑑𝑑 𝑁𝑁𝑏𝑏 𝑑𝑑ℎ𝑁𝑁 𝑑𝑑𝑁𝑁𝑁𝑁 𝑑𝑑𝑑𝑑𝑑𝑑𝑁𝑁
𝑁𝑁𝑁𝑁𝑁𝑁𝑁𝑁𝑁𝑁𝑁𝑁 𝑜𝑜𝑜𝑜 𝑃𝑃𝐶𝐶𝐶𝐶 𝑑𝑑𝑁𝑁𝑑𝑑𝑑𝑑𝑑𝑑𝑁𝑁𝑑𝑑𝑑𝑑𝑑𝑑𝑜𝑜𝑑𝑑𝑑𝑑 𝑁𝑁𝑒𝑒𝑒𝑒𝑁𝑁𝑑𝑑𝑑𝑑𝑁𝑁𝑑𝑑 𝑜𝑜𝑁𝑁𝑜𝑜𝑁𝑁 𝑁𝑁𝑁𝑁𝑟𝑟𝑑𝑑𝑑𝑑𝑑𝑑𝑁𝑁𝑁𝑁𝑁𝑁𝑑𝑑 𝑃𝑃𝐶𝐶𝐶𝐶 𝑑𝑑𝑑𝑑𝑒𝑒𝑒𝑒𝑑𝑑𝑏𝑏𝑁𝑁𝑁𝑁𝑑𝑑 𝑒𝑒 100
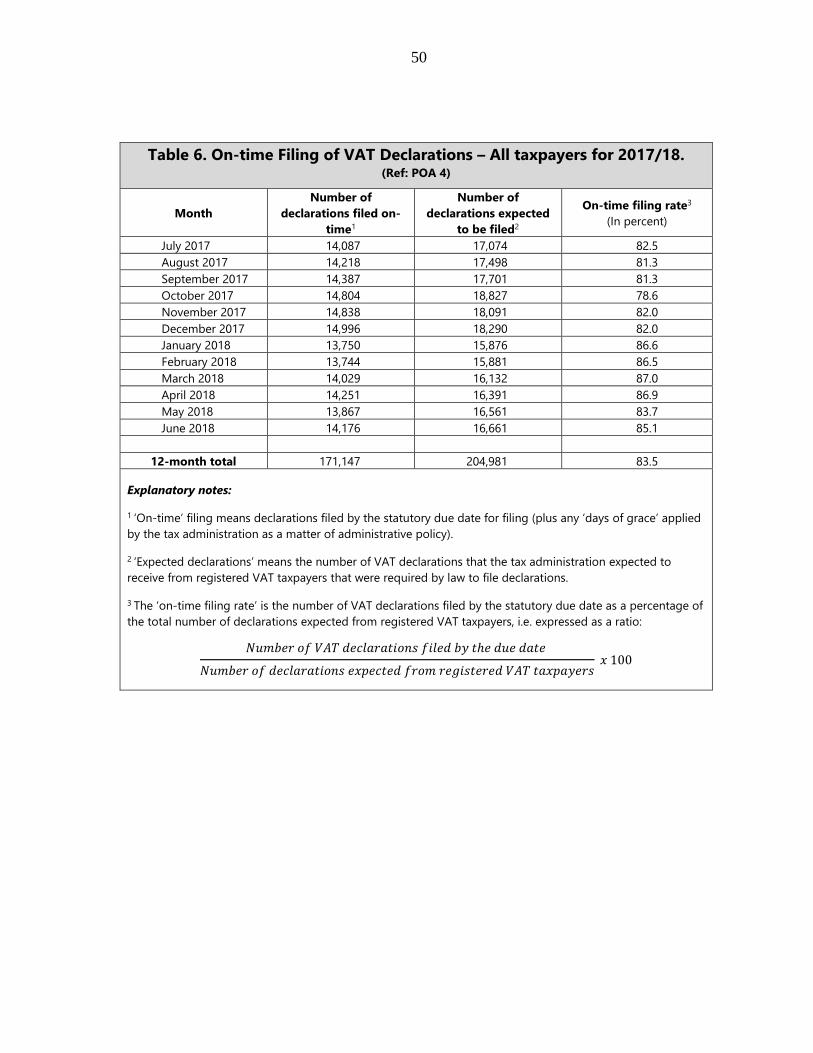
50
Table 6. On-time Filing of VAT Declarations – All taxpayers for 2017/18. (Ref: POA 4)
Month Number of
declarations filed on-time1
Number of declarations expected
to be filed2
On-time filing rate3 (In percent)
July 2017 14,087 17,074 82.5 August 2017 14,218 17,498 81.3 September 2017 14,387 17,701 81.3 October 2017 14,804 18,827 78.6 November 2017 14,838 18,091 82.0 December 2017 14,996 18,290 82.0 January 2018 13,750 15,876 86.6 February 2018 13,744 15,881 86.5 March 2018 14,029 16,132 87.0 April 2018 14,251 16,391 86.9 May 2018 13,867 16,561 83.7 June 2018 14,176 16,661 85.1
12-month total 171,147 204,981 83.5
Explanatory notes:
1 ‘On-time’ filing means declarations filed by the statutory due date for filing (plus any ‘days of grace’ applied by the tax administration as a matter of administrative policy).
2 ‘Expected declarations’ means the number of VAT declarations that the tax administration expected to receive from registered VAT taxpayers that were required by law to file declarations.
3 The ‘on-time filing rate’ is the number of VAT declarations filed by the statutory due date as a percentage of the total number of declarations expected from registered VAT taxpayers, i.e. expressed as a ratio:
𝑁𝑁𝑁𝑁𝑁𝑁𝑁𝑁𝑁𝑁𝑁𝑁 𝑜𝑜𝑜𝑜 𝑉𝑉𝑉𝑉𝐶𝐶 𝑑𝑑𝑁𝑁𝑑𝑑𝑑𝑑𝑑𝑑𝑁𝑁𝑑𝑑𝑑𝑑𝑑𝑑𝑜𝑜𝑑𝑑𝑑𝑑 𝑜𝑜𝑑𝑑𝑑𝑑𝑁𝑁𝑑𝑑 𝑁𝑁𝑏𝑏 𝑑𝑑ℎ𝑁𝑁 𝑑𝑑𝑁𝑁𝑁𝑁 𝑑𝑑𝑑𝑑𝑑𝑑𝑁𝑁
𝑁𝑁𝑁𝑁𝑁𝑁𝑁𝑁𝑁𝑁𝑁𝑁 𝑜𝑜𝑜𝑜 𝑑𝑑𝑁𝑁𝑑𝑑𝑑𝑑𝑑𝑑𝑁𝑁𝑑𝑑𝑑𝑑𝑑𝑑𝑜𝑜𝑑𝑑𝑑𝑑 𝑁𝑁𝑒𝑒𝑒𝑒𝑁𝑁𝑑𝑑𝑑𝑑𝑁𝑁𝑑𝑑 𝑜𝑜𝑁𝑁𝑜𝑜𝑁𝑁 𝑁𝑁𝑁𝑁𝑟𝑟𝑑𝑑𝑑𝑑𝑑𝑑𝑁𝑁𝑁𝑁𝑁𝑁𝑑𝑑 𝑉𝑉𝑉𝑉𝐶𝐶 𝑑𝑑𝑑𝑑𝑒𝑒𝑒𝑒𝑑𝑑𝑏𝑏𝑁𝑁𝑁𝑁𝑑𝑑 𝑒𝑒 100

51
Table 7. On-time Filing of VAT Declarations – Large taxpayers only for 2017/18. (Ref: POA 4)
Month Number of
declarations filed on-time1
Number of declarations expected
to be filed2
On-time filing rate3 (In percent)
July 2017 592 611 96.9 August 2017 577 602 95.9 September 2017 587 604 97.2 October 2017 600 612 98.0 November 2017 592 614 96.4 December 2017 598 615 97.2 January 2018 589 609 96.7 February 2018 589 609 96.7 March 2018 591 605 97.7 April 2018 593 607 97.7 May 2018 568 593 95.8 June 2018 573 592 96.8
12-month total 7,049 7,273 96.9
Explanatory notes:
1 ‘On-time’ filing means declarations filed by the statutory due date for filing (plus any ‘days of grace’ applied by the tax administration as a matter of administrative policy).
2 ‘Expected declarations’ means the number of VAT declarations that the tax administration expected to receive from large taxpayers that were required by law to file VAT declarations.
3 The ‘on-time filing rate’ is the number of VAT declarations filed by large taxpayers by the statutory due date as a percentage of the total number of VAT declarations expected from large taxpayers, i.e. expressed as a ratio:
𝑁𝑁𝑁𝑁𝑁𝑁𝑁𝑁𝑁𝑁𝑁𝑁 𝑜𝑜𝑜𝑜 𝑉𝑉𝑉𝑉𝐶𝐶 𝑑𝑑𝑁𝑁𝑑𝑑𝑑𝑑𝑑𝑑𝑁𝑁𝑑𝑑𝑑𝑑𝑑𝑑𝑜𝑜𝑑𝑑𝑑𝑑 𝑜𝑜𝑑𝑑𝑑𝑑𝑁𝑁𝑑𝑑 𝑁𝑁𝑏𝑏 𝑑𝑑ℎ𝑁𝑁 𝑑𝑑𝑁𝑁𝑁𝑁 𝑑𝑑𝑑𝑑𝑑𝑑𝑁𝑁 𝑁𝑁𝑏𝑏 𝑑𝑑𝑑𝑑𝑁𝑁𝑟𝑟𝑁𝑁 𝑑𝑑𝑑𝑑𝑒𝑒𝑒𝑒𝑑𝑑𝑏𝑏𝑁𝑁𝑁𝑁𝑑𝑑
𝑁𝑁𝑁𝑁𝑁𝑁𝑁𝑁𝑁𝑁𝑁𝑁 𝑜𝑜𝑜𝑜 𝑉𝑉𝑉𝑉𝐶𝐶 𝑑𝑑𝑁𝑁𝑑𝑑𝑑𝑑𝑑𝑑𝑁𝑁𝑑𝑑𝑑𝑑𝑑𝑑𝑜𝑜𝑑𝑑𝑑𝑑 𝑁𝑁𝑒𝑒𝑒𝑒𝑁𝑁𝑑𝑑𝑑𝑑𝑁𝑁𝑑𝑑 𝑜𝑜𝑁𝑁𝑜𝑜𝑁𝑁 𝑑𝑑𝑑𝑑𝑁𝑁𝑟𝑟𝑁𝑁 𝑑𝑑𝑑𝑑𝑒𝑒𝑒𝑒𝑑𝑑𝑏𝑏𝑁𝑁𝑁𝑁𝑑𝑑 𝑒𝑒 100

52
Table 8. On-time Filing of PAYE Withholding Declarations (filed by employers for 2017/18).
(Ref: POA 4)
Month Number of
declarations filed on-time1
Number of declarations expected to be filed2
On-time filing rate3 (In percent)
July 2017 13,246 21,233 62.4 August 2017 13,304 22,297 59.7 September 2017 13,771 22,943 60.0 October 2017 14,139 23,182 61.0 November 2017 14,241 23,533 60.5 December 2017 14,369 23,787 60.4 January 2018 14,023 23,969 58.5 February 2018 14,077 24,035 58.6 March 2018 14,845 24,428 60.8 April 2018 15,045 24,703 60.9 May 2018 15,073 24,887 60.6 June 2018 15,193 25,113 60.5
12-month total 171,326 284,105 60.3
Explanatory notes:
1 ‘On-time’ filing means declarations filed by the statutory due date for filing (plus any ‘days of grace’ applied by the tax administration as a matter of administrative policy). 2 ‘Expected declarations’ means the number of PAYE withholding declarations that the tax administration expected to receive from registered employers with PAYE withholding obligations that were required by law to file declarations. 3 The ‘on-time filing rate’ is the number of PAYE withholding declarations filed by employers by the statutory due date as a percentage of the total number of PAYE withholding declarations expected from registered employers, i.e. expressed as a ratio:
𝑁𝑁𝑁𝑁𝑁𝑁𝑁𝑁𝑁𝑁𝑁𝑁 𝑜𝑜𝑜𝑜 𝑃𝑃𝑉𝑉𝑃𝑃𝑃𝑃 𝑤𝑤𝑑𝑑𝑑𝑑ℎℎ𝑜𝑜𝑑𝑑𝑑𝑑𝑑𝑑𝑑𝑑𝑟𝑟 𝑑𝑑𝑁𝑁𝑑𝑑𝑑𝑑𝑑𝑑𝑁𝑁𝑑𝑑𝑑𝑑𝑑𝑑𝑜𝑜𝑑𝑑𝑑𝑑 𝑜𝑜𝑑𝑑𝑑𝑑𝑁𝑁𝑑𝑑 𝑁𝑁𝑏𝑏 𝑑𝑑ℎ𝑁𝑁 𝑑𝑑𝑁𝑁𝑁𝑁 𝑑𝑑𝑑𝑑𝑑𝑑𝑁𝑁
𝑁𝑁𝑁𝑁𝑁𝑁𝑁𝑁𝑁𝑁𝑁𝑁 𝑜𝑜𝑜𝑜 𝑃𝑃𝑉𝑉𝑃𝑃𝑃𝑃 𝑤𝑤𝑑𝑑𝑑𝑑ℎ𝑜𝑜𝑑𝑑𝑑𝑑𝑑𝑑𝑑𝑑𝑟𝑟 𝑑𝑑𝑁𝑁𝑑𝑑𝑑𝑑𝑑𝑑𝑁𝑁𝑑𝑑𝑑𝑑𝑑𝑑𝑜𝑜𝑑𝑑𝑑𝑑 𝑁𝑁𝑒𝑒𝑒𝑒𝑁𝑁𝑑𝑑𝑑𝑑𝑁𝑁𝑑𝑑 𝑜𝑜𝑁𝑁𝑜𝑜𝑁𝑁 𝑁𝑁𝑁𝑁𝑟𝑟𝑑𝑑𝑑𝑑𝑑𝑑𝑁𝑁𝑁𝑁𝑁𝑁𝑑𝑑 𝑁𝑁𝑁𝑁𝑒𝑒𝑑𝑑𝑜𝑜𝑏𝑏𝑁𝑁𝑁𝑁𝑑𝑑 𝑒𝑒 100
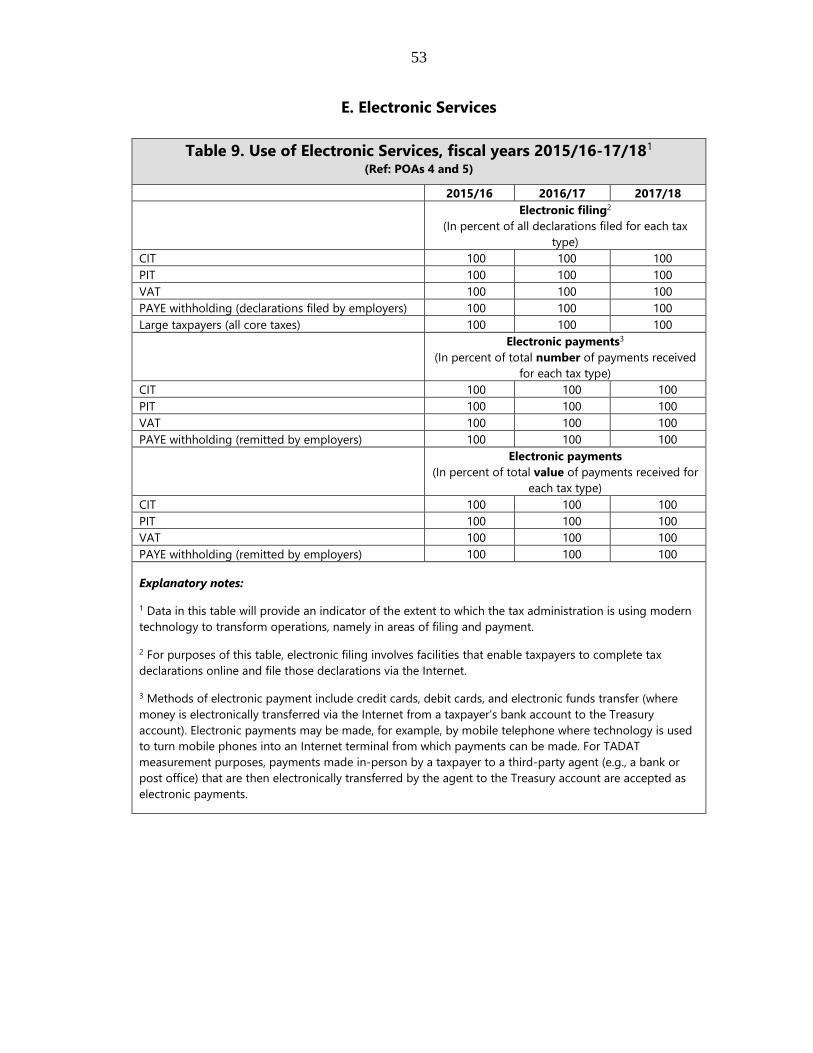
53
E. Electronic Services
Table 9. Use of Electronic Services, fiscal years 2015/16-17/181
(Ref: POAs 4 and 5) 2015/16 2016/17 2017/18 Electronic filing2
(In percent of all declarations filed for each tax type)
CIT 100 100 100 PIT 100 100 100 VAT 100 100 100 PAYE withholding (declarations filed by employers) 100 100 100 Large taxpayers (all core taxes) 100 100 100 Electronic payments3
(In percent of total number of payments received for each tax type)
CIT 100 100 100 PIT 100 100 100 VAT 100 100 100 PAYE withholding (remitted by employers) 100 100 100 Electronic payments
(In percent of total value of payments received for each tax type)
CIT 100 100 100 PIT 100 100 100 VAT 100 100 100 PAYE withholding (remitted by employers) 100 100 100
Explanatory notes:
1 Data in this table will provide an indicator of the extent to which the tax administration is using modern technology to transform operations, namely in areas of filing and payment.
2 For purposes of this table, electronic filing involves facilities that enable taxpayers to complete tax declarations online and file those declarations via the Internet.
3 Methods of electronic payment include credit cards, debit cards, and electronic funds transfer (where money is electronically transferred via the Internet from a taxpayer’s bank account to the Treasury account). Electronic payments may be made, for example, by mobile telephone where technology is used to turn mobile phones into an Internet terminal from which payments can be made. For TADAT measurement purposes, payments made in-person by a taxpayer to a third-party agent (e.g., a bank or post office) that are then electronically transferred by the agent to the Treasury account are accepted as electronic payments.

54
F. Payments
Table 10. VAT Payments Made During Fiscal Year 2017/18 (Ref: POA 5)
VAT payments made on-time1 VAT payments due2 On-time payment rate3
(In percent) Number of payments 49,680 101,538 48.9 Value of payments 1,923,306,986,537 3,014,969,284,966 63.8
Explanatory notes:
1 ‘On-time’ payment means paid on or before the statutory due date for payment.
2 ‘Payments due’ include all payments due, whether self-assessed or administratively assessed (including as a result of an audit).
3 The ‘on-time payment rate’ is the number (or value) of VAT payments made by the statutory due date in percent of the total number (or value) of VAT payments due, i.e. expressed as ratios:
• The on-time payment rate by number is:
𝑁𝑁𝑁𝑁𝑁𝑁𝑁𝑁𝑁𝑁𝑁𝑁 𝑜𝑜𝑜𝑜 𝑉𝑉𝑉𝑉𝑉𝑉 𝑝𝑝𝑝𝑝𝑝𝑝𝑁𝑁𝑁𝑁𝑝𝑝𝑝𝑝𝑝𝑝 𝑁𝑁𝑝𝑝𝑚𝑚𝑁𝑁 𝑁𝑁𝑝𝑝 𝑝𝑝ℎ𝑁𝑁 𝑚𝑚𝑁𝑁𝑁𝑁 𝑚𝑚𝑝𝑝𝑝𝑝𝑁𝑁
𝑉𝑉𝑜𝑜𝑝𝑝𝑝𝑝𝑇𝑇 𝑝𝑝𝑁𝑁𝑁𝑁𝑁𝑁𝑁𝑁𝑁𝑁 𝑜𝑜𝑜𝑜 𝑉𝑉𝑉𝑉𝑉𝑉 𝑝𝑝𝑝𝑝𝑝𝑝𝑁𝑁𝑁𝑁𝑝𝑝𝑝𝑝𝑝𝑝 𝑚𝑚𝑁𝑁𝑁𝑁 𝑒𝑒 100
• The on-time payment rate by value is:
𝑉𝑉𝑝𝑝𝑇𝑇𝑁𝑁𝑁𝑁 𝑜𝑜𝑜𝑜 𝑉𝑉𝑉𝑉𝑉𝑉 𝑝𝑝𝑝𝑝𝑝𝑝𝑁𝑁𝑁𝑁𝑝𝑝𝑝𝑝𝑝𝑝 𝑁𝑁𝑝𝑝𝑚𝑚𝑁𝑁 𝑁𝑁𝑝𝑝 𝑝𝑝ℎ𝑁𝑁 𝑚𝑚𝑁𝑁𝑁𝑁 𝑚𝑚𝑝𝑝𝑝𝑝𝑁𝑁
𝑉𝑉𝑜𝑜𝑝𝑝𝑝𝑝𝑇𝑇 𝑣𝑣𝑝𝑝𝑇𝑇𝑁𝑁𝑁𝑁 𝑜𝑜𝑜𝑜 𝑉𝑉𝑉𝑉𝑉𝑉 𝑝𝑝𝑝𝑝𝑝𝑝𝑁𝑁𝑁𝑁𝑝𝑝𝑝𝑝𝑝𝑝 𝑚𝑚𝑁𝑁𝑁𝑁 𝑒𝑒 100

55
G. Domestic Tax Arrears
Table 11. Value of Tax Arrears, Fiscal Years 2015/16 – 2017/181
(Ref: POA 5) 2015/16 2016/17 2017/18 In local currency
Total Core tax revenue collections (from Table 1) (A) 8,652 9,631 10,931 Total Core tax arrears at end of fiscal year2 (B) 1,218 1,961 2,560 Of which: Collectible3 (C) 252 253 667 Of which: More than 12 months’ old (D) 288 614 2,002 In percent Ratio of (B) to (A)4 14.1 20.4 23.4 Ratio of (C) to (A)5 2.9 2.6 6.1 Ratio of (D) to (B)6 23.6 31.3 78.2
Explanatory notes:
1 Data in this table will be used in assessing the value of tax arrears relative to annual collections and examining the extent to which unpaid tax liabilities are significantly overdue (i.e. older than 12 months).
2 ‘Total Core tax arrears’ include tax, penalties, and accumulated interest.
3 ’Collectible’ core tax arrears are defined as the total amount of domestic tax, including interest and penalties, that is overdue for payment and which is not subject to collection impediments. Collectible tax arrears therefore generally exclude: (a) amounts formally disputed by the taxpayer and for which collection action has been suspended pending the outcome, (b) amounts that are not legally recoverable (e.g., debt foregone through bankruptcy), and (c) arrears otherwise uncollectible (e.g., the debtor has no funds or other assets).
4 i.e. 𝑉𝑉𝑝𝑝𝑇𝑇𝑁𝑁𝑁𝑁 𝑜𝑜𝑜𝑜 𝑝𝑝𝑜𝑜𝑝𝑝𝑝𝑝𝑇𝑇 𝐶𝐶𝑜𝑜𝑁𝑁𝑁𝑁 𝑝𝑝𝑝𝑝𝑡𝑡 𝑝𝑝𝑁𝑁𝑁𝑁𝑁𝑁𝑝𝑝𝑁𝑁𝑝𝑝 𝑝𝑝𝑝𝑝 𝑁𝑁𝑝𝑝𝑚𝑚 𝑜𝑜𝑜𝑜 𝑜𝑜𝑓𝑓𝑝𝑝𝑓𝑓𝑝𝑝𝑇𝑇 𝑝𝑝𝑁𝑁𝑝𝑝𝑁𝑁 (𝐵𝐵)
𝑉𝑉𝑜𝑜𝑝𝑝𝑝𝑝𝑇𝑇 𝑓𝑓𝑜𝑜𝑁𝑁𝑁𝑁 𝑝𝑝𝑝𝑝𝑡𝑡 𝑓𝑓𝑜𝑜𝑇𝑇𝑇𝑇𝑁𝑁𝑓𝑓𝑝𝑝𝑁𝑁𝑚𝑚 𝑜𝑜𝑜𝑜𝑁𝑁 𝑜𝑜𝑓𝑓𝑝𝑝𝑓𝑓𝑝𝑝𝑇𝑇 𝑝𝑝𝑁𝑁𝑝𝑝𝑁𝑁 (𝑉𝑉) 𝑒𝑒 100
5 i.e. 𝑉𝑉𝑝𝑝𝑇𝑇𝑁𝑁𝑁𝑁 𝑜𝑜𝑜𝑜 𝑓𝑓𝑜𝑜𝑇𝑇𝑇𝑇𝑁𝑁𝑓𝑓𝑝𝑝𝑓𝑓𝑁𝑁𝑇𝑇𝑁𝑁 𝑓𝑓𝑜𝑜𝑁𝑁𝑁𝑁 𝑝𝑝𝑝𝑝𝑡𝑡 𝑝𝑝𝑁𝑁𝑁𝑁𝑁𝑁𝑝𝑝𝑁𝑁𝑝𝑝 𝑝𝑝𝑝𝑝 𝑁𝑁𝑝𝑝𝑚𝑚 𝑜𝑜𝑜𝑜 𝑜𝑜𝑓𝑓𝑝𝑝𝑓𝑓𝑝𝑝𝑇𝑇 𝑝𝑝𝑁𝑁𝑝𝑝𝑁𝑁 (𝐶𝐶)
𝑉𝑉𝑜𝑜𝑝𝑝𝑝𝑝𝑇𝑇 𝑓𝑓𝑜𝑜𝑁𝑁𝑁𝑁 𝑝𝑝𝑝𝑝𝑡𝑡 𝑓𝑓𝑜𝑜𝑇𝑇𝑇𝑇𝑁𝑁𝑓𝑓𝑝𝑝𝑁𝑁𝑚𝑚 𝑜𝑜𝑜𝑜𝑁𝑁 𝑜𝑜𝑓𝑓𝑝𝑝𝑓𝑓𝑝𝑝𝑇𝑇 𝑝𝑝𝑁𝑁𝑝𝑝𝑁𝑁 (𝑉𝑉) 𝑒𝑒 100
6 i.e. 𝑉𝑉𝑝𝑝𝑇𝑇𝑁𝑁𝑁𝑁 𝑜𝑜𝑜𝑜 𝑓𝑓𝑜𝑜𝑁𝑁𝑁𝑁 𝑝𝑝𝑝𝑝𝑡𝑡 𝑝𝑝𝑁𝑁𝑁𝑁𝑁𝑁𝑝𝑝𝑁𝑁𝑝𝑝 >12 𝑁𝑁𝑜𝑜𝑝𝑝𝑝𝑝ℎ𝑝𝑝 𝑜𝑜𝑇𝑇𝑚𝑚 𝑝𝑝𝑝𝑝 𝑁𝑁𝑝𝑝𝑚𝑚 𝑜𝑜𝑜𝑜 𝑝𝑝𝑁𝑁𝑝𝑝𝑁𝑁 (𝐷𝐷)𝑉𝑉𝑝𝑝𝑇𝑇𝑁𝑁𝑁𝑁 𝑜𝑜𝑜𝑜 𝑝𝑝𝑜𝑜𝑝𝑝𝑝𝑝𝑇𝑇𝑓𝑓𝑜𝑜𝑁𝑁𝑁𝑁 𝑝𝑝𝑝𝑝𝑡𝑡 𝑝𝑝𝑁𝑁𝑁𝑁𝑁𝑁𝑝𝑝𝑁𝑁𝑝𝑝 𝑝𝑝𝑝𝑝 𝑁𝑁𝑝𝑝𝑚𝑚 𝑜𝑜𝑜𝑜 𝑜𝑜𝑓𝑓𝑝𝑝𝑓𝑓𝑝𝑝𝑇𝑇 𝑝𝑝𝑁𝑁𝑝𝑝𝑁𝑁 (𝐵𝐵)
𝑒𝑒 100

56
H. Tax Dispute Resolution
Table 12. Finalization of Administrative Reviews for most recent 12-month period. (Ref: POA 7)
Month Total number finalized
Finalized within 30 days
Finalized within 60 days Finalized within 90 days
Number In percent of total Number In percent of
total Number In percent of total
July 2017 675 301 44.6 - - 79 11.7 August 2017 347 94 27.1 27 7.8 226 65.1
September 2017 272 12 4.4 59 21.7 133 48.9 October 2017 568 249 43.8 70 12.3 - -
November 2017 762 465 61.0 - - - - December 2017 482 240 49.8 73 15.1 35 7.3
January 2018 607 275 45.3 178 29.3 53 8.7 February 2018 490 151 30.8 - - 256 52.2
March 2018 492 108 22.0 - - 333 67.7 April 2018 561 299 53.3 - - 249 44.4 May 2018 715 344 48.1 - - 315 44.1 June 2018 909 260 28.6 - - 584 64.2
12-month total 6,880 2,798 40.7 407 5.9 2,263 32.9

57
I. Payment of VAT Refunds
Table 13. VAT Refunds for 2017/18. (Ref: POA 8)
Number of cases In local currency (billion) Total VAT refund claims received (A) 3,365 544 Total VAT refunds paid1 1,742 211 Of which: paid within 30 days (B)2 132 8 Of which: paid outside 30 days 1,610 203 Total VAT refund claims declined3 692 120 Of which: declined within 30 days (C) 74 6 Of which: declined outside 30 days 618 114 Total VAT refund claims not processed4 931 212 Of which: no decision taken to decline
refund 931 212
Of which: approved but not yet paid or offset
- -
In percent
Ratio of (B+C) to (A)5 6.1 2.7 Explanatory note: 1 Include all refunds paid, as well as refunds offset against other tax liabilities. 2 TADAT measures performance against a 30-day standard. 3 Include cases where a formal decision has been taken to decline (refuse) the taxpayer’s claim for refund (e.g., where the legal requirements for refund have not been met). 4 Include all cases where refund processing is incomplete—i.e. where (a) the formal decision has not been taken to decline the refund claim; or (b) the refund has been approved but not paid or offset. 5 i.e.
𝑉𝑉𝑝𝑝𝑇𝑇𝑁𝑁𝑁𝑁 𝑜𝑜𝑜𝑜 𝑉𝑉𝑉𝑉𝑉𝑉 𝑁𝑁𝑁𝑁𝑜𝑜𝑁𝑁𝑝𝑝𝑚𝑚𝑝𝑝 𝑝𝑝𝑝𝑝𝑓𝑓𝑚𝑚 𝑤𝑤𝑓𝑓𝑝𝑝ℎ𝑓𝑓𝑝𝑝 30 𝑚𝑚𝑝𝑝𝑝𝑝𝑝𝑝 (𝐵𝐵)+𝑉𝑉𝑉𝑉𝑉𝑉 𝑁𝑁𝑁𝑁𝑜𝑜𝑁𝑁𝑝𝑝𝑚𝑚𝑝𝑝 𝑚𝑚𝑁𝑁𝑓𝑓𝑇𝑇𝑓𝑓𝑝𝑝𝑁𝑁𝑚𝑚 𝑤𝑤𝑓𝑓𝑝𝑝ℎ𝑓𝑓𝑝𝑝 30 𝑚𝑚𝑝𝑝𝑝𝑝𝑝𝑝 (𝐶𝐶)𝑉𝑉𝑝𝑝𝑇𝑇𝑁𝑁𝑁𝑁 𝑜𝑜𝑜𝑜 𝑝𝑝𝑇𝑇𝑇𝑇 𝑉𝑉𝑉𝑉𝑉𝑉 𝑁𝑁𝑁𝑁𝑜𝑜𝑁𝑁𝑝𝑝𝑚𝑚 𝑓𝑓𝑇𝑇𝑝𝑝𝑓𝑓𝑁𝑁𝑝𝑝 𝑁𝑁𝑁𝑁𝑓𝑓𝑁𝑁𝑓𝑓𝑣𝑣𝑁𝑁𝑚𝑚
𝑒𝑒 100

58
Attachment IV. Organizational Chart

59
Attachment V. Sources of Evidence
Indicators Sources of Evidence P1-1. Accurate and reliable taxpayer information.
• Taxpayer profile form • MOU for TREP • Sample of taxpayers’ record rejected (on account of matching more than one
name and date of birth) • List of rejected applications for TIN • List of post registration verification • eTAX registration module process guide book • TIN application form • De-Activation/re-activation approval form • Step-by-step Guide: How to clean a taxpayer profile • 2017/18 Register cleansing program
P1-2. Knowledge of the potential taxpayer base.
• Business requirements for TREP information analysis and data sharing – rental data
• URA block management strategy • 2017/18 Kampala metro performance report • Half Year 2018/2019 DTD performance report • 2017/18 DTD annual report
P2-3. Identification, assessment, ranking, and quantification of compliance risks.
• 2017/18 compliance risk register • Risk parameters defining eHub • DTD operational risk descriptors • ICTD working paper 45: Boosting Revenue Collection through Taxing High
Net Worth Individuals – the Case of Uganda, January 2016 https://www.ictd.ac/publication/what-can-we-learn-from-the-uganda-revenue-authorithys-approach-to-taxing-high-net-worth-individuals/
• Trading licenses 2019 • Environmental scans including surveys- sighted • Uganda: Revenue Administration Gap Analysis Program
https://www.ura.go.ug/openFile.do?path=//webupload//download//staticContent//TOPMENU/1075/1076_Uganda_RA-GAP_RPT.pdf
• Studies into tax compliance -refer to pictures • IMF Uganda report
https://www.ura.go.ug/Resources/.../INLB/Uganda%20RA-GAP%20RPT%20(2).pdf
• Screen prints of external data systems used P2-4. Mitigation of risks through a compliance improvement plan.
• 2016/17-2019/20 corporate plan • URA CIP • ERM plan
P2-5. Monitoring and evaluation of compliance
• Post audit impact review • Risk bulletin 2017/18 (reference to reporting to MEC) - sighted • Minutes of the MEC risk management meeting • CIP review report

60
risk mitigation activities.
• Review of national audit plan • Minutes of MEC meeting on risk • Tax laws 2018 • URA organizational structure • ICTD working paper 45: Boosting Revenue Collection through Taxing High
Net Worth Individuals – the Case of Uganda, January 2016 https://www.ictd.ac/publication/what-can-we-learn-from-the-uganda-revenue-authorithys-approach-to-taxing-high-net-worth-individuals/
P2-6. Identification, assessment, and mitigation of institutional risks.
• URA ERM framework • Sampled risks submitted to the MEC for discussion • URA institutional risk register • Risk paper for CG presentation • Risks for business plan • Risk management policy • Risk management strategy 2018 • 2018/19 business plan • Annual risk report • Crisis management plan • 2017/18 ICT disaster recovery plan • Disaster recovery test simulation – failover tests. • Staff training programs in disaster recovery procedures
P3-7. Scope, currency, and accessibility of information.
• URA website – ura.go.ug – several information sources • Taxpayers charter • 2018/19 Work Plan for Tax Education • Service catalogue • Brochures in English and other local languages, e.g., Ebintu ebikuru
ebikwatirine esente ebi omuntu oine eby’obushuubuzi obukye, Okukuuma Ebiwandiiko By’obusuubuzi, enkugaanyay’ omusolo ku binensi entonotono, okubalirira emisolo ku byamaguzi ebiyingira Uganda
• 2017/18 CIP • Public notices and rulings - several • Process to update public information • Stakeholder engagement plan 2018/19 • Minutes of stakeholder meetings, several • TOTO (URA children’s magazine) • Key financial management skills for small businesses • Training manual for tax education (Government Revenue and Public Finance
and Fiscal Policy) for Secondary School P3-8. Scope of initiatives to reduce taxpayer compliance costs.
• 2017/18 URA client service charter • Book of records (Ekitabo kya Bizinensi) • Payment registration slip (for small taxpayers) • FAQs 2017/18
P3-9. Obtaining taxpayer feedback on
• Contact center customer satisfaction survey, September 2018 • Social media surveys - several • Lessons, opportunities and recommendations from the: 2016/17 URA’s online
clients standards evaluation survey

61
products and services.
• URA business process evaluation report, draft, February 2019 • Minutes of URA staff focus group discussion about SOMESA-Uganda
platform P4-10. On-time filing rate.
• Numerical data in Tables 4, 5, 6, 7 and 8 of attachment III • Field enquiries/observations
P4-11. Use of electronic filing facilities.
• Numerical data in Table 9 of attachment III • Field enquiries/observations
P5-12. Use of electronic payment methods.
• Attachment III, Table 9, • Tax laws 2018 • Payments step-by-step • Payment mode by tax type • Two-year plan to improve payment module • Online payment with Visa or Mastercard using web portal • How to re-register a payment • How to register a payment • Procedural guide to registering small business for payments (presumptive
taxes) P5-13. Use of efficient collection systems.
• Tax laws 2018 (Sections 115, 116, 117 and 118 of the Income Tax Act 340) • Registering a payment for advance tax motor vehicle • URA corporate plan 2016/17-2019/20
P5-14. Timeliness of payments.
• Attachment III, Table 10
P5-15. Stock and flow of tax arrears.
• Attachment III, Table 11 • 5th Debt Write-Off Committee (DWOC) meeting minutes • 6th DWOC meeting minutes • Bad debt management policy 2016 • Check list matrix for debt write offs
P6-16. Scope of verification actions taken to detect and deter inaccurate reporting.
• 2018/19 CIP • Compliance management division performance report January 2019 • Demonstration of automated crosschecking • Demonstration risk management unit • DTD compliance handbook (section 6.6) • DTD operational risk descriptors 2018/19 – Updated • Engine for 2018/19 CIP • Field visits LTO, MTO and STO (Jinja and Mukono DTD stations) • Interviews operational risk management unit and financial crime and joint
audit unit • Letter from URA to MOFPED (28 July 2016) • 2017/18 Post audit impact review • Risks per taxpayer segments • Screenshots of third party information • Tax Procedures Code Act 2014 • Uganda: Accessing Clients’ Bank Details – Alternatives for URA
https://allafrica.com/stories/201804170217.html • Website URA

62
P6-17. Extent of proactive initiatives to encourage accurate reporting.
• Examples of private rulings • Field visits LTO, MTO and STO (Jinja and Mukono DTD Stations) • Interview with Ass. Commissioner LTO. • Letter from URA to MOFPED (28 July 2016) • Presentation: Building a tax-paying culture in Uganda: cooperative
compliance • Tax Procedures Code Act 2014, Part XII • www.ura.go.ug (legal and policy section –Practice Notes)
P6-18. Monitoring the extent of inaccurate reporting.
• Economic Policy Research Centre, Research series no 145: The Value Added Tax Gap Analysis for Uganda October 2018). Published on website of EPRC (www.eprcug.org)
• Examples of Third Party information analysis • ICTD working paper 45: Boosting Revenue Collection through Taxing High
Net Worth Individuals – the Case of Uganda, January 2016 https://www.ictd.ac/publication/what-can-we-learn-from-the-uganda-revenue-authorithys-approach-to-taxing-high-net-worth-individuals/
• TADAT Performance Assessment Report, October 2015 • The Income Tax (amendment) bill, 2015 • Uganda: Revenue Administration Gap Analysis Program
https://www.ura.go.ug/openFile.do?path=//webupload//download//staticContent//TOPMENU/1075/1076_Uganda_RA-GAP_RPT.pdf
• URA: Expanding Uganda’s Tax-Base: Tapping into the informal sector, Draft report, March 2015
• VAT Pilot Compliance Program: Intermediate report, November 2018 • World Bank: Uganda: Improving Domestic Revenue Mobilization Background
Paper 1: An Assessment of Uganda’s Domestic Revenue Gaps and how to tap the potential. Draft version October 2017.
P7-19. Existence of an independent, workable, and graduated dispute resolution process.
• Objections and appeals guidelines • Guide on composition of objections committee for compliance centers and
reporting format • Objection to VAT Assessment • Minutes of a meeting with a taxpayer • Minutes of a meeting between the audit team and OAU • Income tax notice of assessment • 2017/18 Domestic tax annual report • Audit management letter to a taxpayer
P7-20. Time taken to resolve disputes.
• Numerical data in Table 12 of Attachment III
P7-21. Degree to which dispute outcomes are acted upon.
• Legal services and board affairs department internal memorandum to staff (for period October 2018 to February 2019)
• www.ura.go.ug (legal and policy section – summary of judgements/rulings) • URA submission on Tax policy department – MOFPED • DTD Compliance Handbook (section on audit)
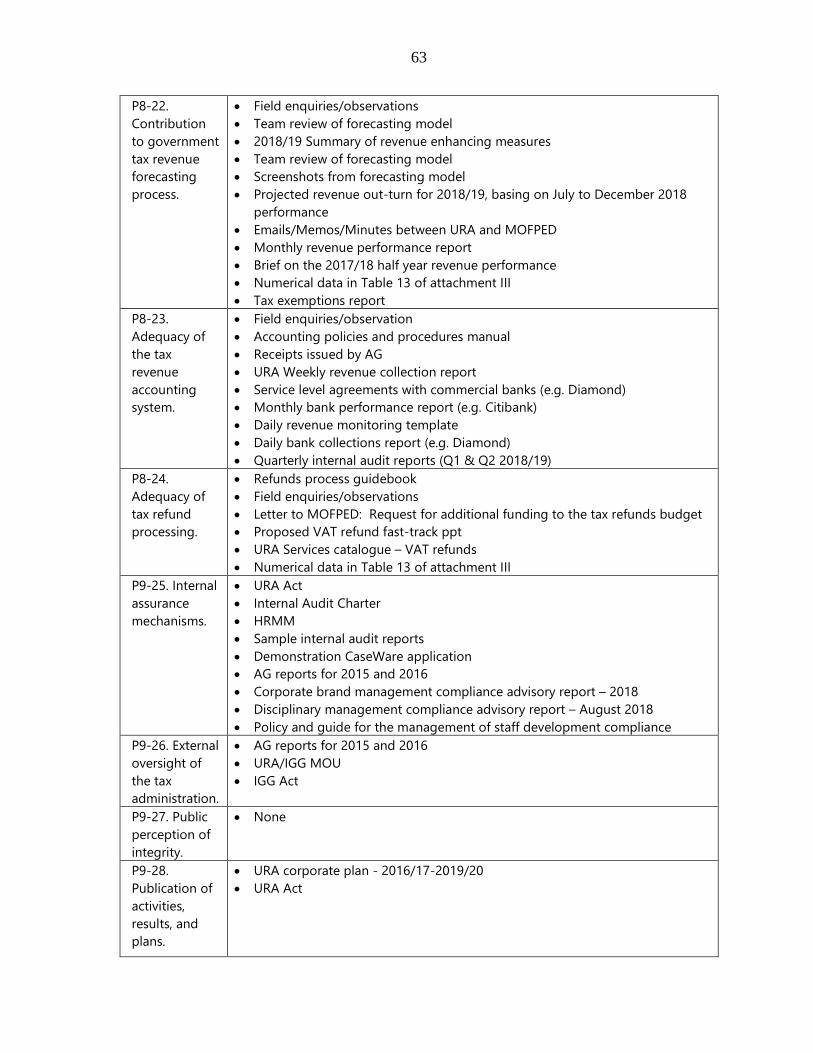
63
P8-22. Contribution to government tax revenue forecasting process.
• Field enquiries/observations • Team review of forecasting model • 2018/19 Summary of revenue enhancing measures • Team review of forecasting model • Screenshots from forecasting model • Projected revenue out-turn for 2018/19, basing on July to December 2018
performance • Emails/Memos/Minutes between URA and MOFPED • Monthly revenue performance report • Brief on the 2017/18 half year revenue performance • Numerical data in Table 13 of attachment III • Tax exemptions report
P8-23. Adequacy of the tax revenue accounting system.
• Field enquiries/observation • Accounting policies and procedures manual • Receipts issued by AG • URA Weekly revenue collection report • Service level agreements with commercial banks (e.g. Diamond) • Monthly bank performance report (e.g. Citibank) • Daily revenue monitoring template • Daily bank collections report (e.g. Diamond) • Quarterly internal audit reports (Q1 & Q2 2018/19)
P8-24. Adequacy of tax refund processing.
• Refunds process guidebook • Field enquiries/observations • Letter to MOFPED: Request for additional funding to the tax refunds budget • Proposed VAT refund fast-track ppt • URA Services catalogue – VAT refunds • Numerical data in Table 13 of attachment III
P9-25. Internal assurance mechanisms.
• URA Act • Internal Audit Charter • HRMM • Sample internal audit reports • Demonstration CaseWare application • AG reports for 2015 and 2016 • Corporate brand management compliance advisory report – 2018 • Disciplinary management compliance advisory report – August 2018 • Policy and guide for the management of staff development compliance
P9-26. External oversight of the tax administration.
• AG reports for 2015 and 2016 • URA/IGG MOU • IGG Act
P9-27. Public perception of integrity.
• None
P9-28. Publication of activities, results, and plans.
• URA corporate plan - 2016/17-2019/20 • URA Act

Fiscal Affairs Department
International Monetary Fund700 19th Street NWWashington, DC 20431USAhttp://www.imf.org/capacitydevelopment