Embed Size (px)
Citation preview

A RepoRtto the
MontAnALegisLAtuRe
LegisLAtive Auditdivision
18-02
FedeRAL singLe Audit
MARch 2020
Montana Single Audit Report
For the Two Fiscal Years Ended June 30, 2019

Federal Single AuditMontana’s federal Single Audit is a biennial audit that completes the reporting requirements of the Single Audit Act Amendments of 1996, and the Uniform Administrative Requirements, Cost Principles, and Audit Requirements for Federal Awards. The Single Audit Report is compiled from work performed by other annual or biennial individual agency audit engagements. Individual agency audits are conducted by the Legislative Audit Division to determine if an agency’s financial operations are properly conducted, the financial reports are presented fairly, and the agency has complied with applicable laws and regulations. In performing these audits, the audit staff use standards set forth by the American Institute of Certified Public Accountants and the United States Government Accountability Office.
Government Auditing Standards, the Single Audit Act Amendments of 1996, and the Uniform Administrative Requirements, Cost Principles, and Audit Requirements for Federal Awards require the auditor to issue certain financial, internal control, and compliance reports. The Single Audit Report complies with these reporting requirements and is intended for distribution to federal grantor agencies. The individual agency audit reports are not intended to comply with these reporting requirements and are therefore not intended for distribution to federal grantor agencies.
Audit staff members hold degrees with an emphasis in accounting. Many staff members hold Certified Public Accountant (CPA) certificates.
Audit StaffAlexa O’DellFlora Waske
Karen E. SimpsonKelly Zwang
Reports can be found in electronic format at:http://leg.mt.gov/audit
Legislative AuditCommittee
RepresentativesKim Abbott
[email protected] Bartel
[email protected] Burnett
[email protected] Hayman, Vice Chair
[email protected] Kerr-Carpenter
[email protected] Regier
SenatorsDee Brown, [email protected] Ellsworth
[email protected] Flowers
[email protected] Jacobson
[email protected] McNally
Members serve until a member’s legislative term of office ends or until a successor is appointed,
whichever occurs first.
§5-13-202(2), MCA
Fraud Hotline(Statewide)
1-800-222-4446(in Helena)
www.montanafraud.gov

LEGISLATIVE AUDIT DIVISION Angus Maciver, Legislative Auditor Deputy Legislative AuditorsDeborah F. Butler, Legal Counsel Cindy Jorgenson Joe Murray
Room 160 • State Capitol Building • PO Box 201705 • Helena, MT • 59620-1705Phone (406) 444-3122 • FAX (406) 444-9784 • E-Mail [email protected]
March 2020
The Legislative Audit Committeeof the Montana State Legislature:
This is our Single Audit Report of the state of Montana for the two fiscal years ended June 30, 2019. The Single Audit was conducted in accordance with Government Auditing Standards and Single Audit Act Amendments of 1996 and the Uniform Administrative Requirements, Cost Principles, and Audit Requirements for Federal Awards (Uniform Guidance). This document contains the Independent Auditor’s Reports on the state of Montana’s basic financial statements for the fiscal years ended June 30, 2019 (page A-5), and June 30, 2018 (page B-5). The Independent Auditor’s Reports also address the reasonableness of the schedules of expenditures of federal awards in relation to the basic financial statements.
The audit disclosed certain questioned costs and deficiencies in internal control and compliance, which are summarized in the Schedule of Findings and Questioned Costs (pages C-13 through C-117). The Independent Auditor’s Reports on pages A-1 and on B-1 summarize control deficiencies over financial reporting we consider to be significant deficiencies or material weaknesses. The Independent Auditor’s Report on page C-1 categorizes the disclosed control deficiencies affecting compliance with federal regulations as significant deficiencies or material weaknesses. The Independent Auditor’s Report on page C-1 also identifies compliance issues which resulted in opinion modifications for various federal programs administered by the state.
Management at administering agencies have responded to the audit findings, and the responses are included in each finding and the Corrective Action Plan compiled by the Governor’s Office of Budget and Program Planning (beginning on page D-1). The status of findings previously reported in state of Montana Single Audit Reports, for which continued reporting is required under Uniform Guidance, is included in the Summary Schedule of Prior Audit Findings (beginning on page E-1), which was also prepared by the Governor’s Office of Budget and Program Planning.
Respectfully submitted,
/s/ Angus Maciver
Angus MaciverLegislative Auditor


Table of ContentsReport Summary ...................................................................................................................S-1
FY19 FINANCIAL SECTION ���������������������������������������������������������������������������������������������������������������������1Report on Internal Control Over Financial Reporting and on Compliance and Other Matters Based on an Audit of Basic Financial Statements Performed in Accordance With Government Auditing Standards ................................................................................................................ A-1Independent Auditor’s Report ...............................................................................................A-5Management’s Discussion and Analysis .............................................................................. A-11Basic Financial Statements ..................................................................................................A-22Required Supplementary Information .............................................................................. A-178Schedule of Expenditures of Federal Awards ..................................................................... A-201
FY18 FINANCIAL SECTION ����������������������������������������������������������������������������������������������������������������� B-iReport on Internal Control Over Financial Reporting and on Compliance and Other Matters Based on an Audit of Financial Statements Performed in Accordance with Government Auditing Standards ................................................................................................................. B-1Independent Auditor’s Report ...............................................................................................B-5Management’s Discussion and Analysis ................................................................................B-9Basic Financial Statements ..................................................................................................B-20Required Supplementary Information .............................................................................. B-176Schedule of Expenditures of Federal Awards ..................................................................... B-199
AUDITOR’S REPORT AND FINDINGS ���������������������������������������������������������������������������������������������� C-iIndependent Auditor’s Report on Compliance for Each Major Federal Program and on
Internal Control Over Compliance Required by Uniform Guidance...............................C-1Section I–Summary of Auditor’s Results ............................................................................C-13Section II–Financial Statement Findings ............................................................................ C-15Section III–Federal Award Findings and Questioned Costs ............................................... C-21Appendix A-Research and Development Cluster Activity By CFDA# and Location ........C-113
CORRECTIVE ACTION PLAN �������������������������������������������������������������������������������������������������������������D-i
SUMMARY SCHEDULE OF PRIOR AUDIT FINDINGS �������������������������������������������������������������������E-i
18-02


Montana LegisLative audit division
Federal Single auditMontana Single Audit ReportFor the Two Fiscal Years Ended June 30, 2019
March 2020 18-02 report SuMMary
The State of Montana reported approximately $7.9 billion in federal funds for fiscal years 2018 and 2019. This is an increase over the prior biennium of approximately $600 million. We identified over $2.6 million in known questioned costs which are costs inappropriately charged to the federal programs due to violations of federal regulations. Additionally, we project likely questioned costs in excess of $91.4 million based on our testing. Federal grantor agencies are responsible for resolution of these questioned costs, and have the authority to require funds be repaid.
ContextMontana’s Federal Single Audit is a biennial audit that completes the audit and reporting requirements of the Single Audit Act Amendments of 1996 and the Uniform Administrative Requirements, Cost Principles, and Audit Requirements for Federal Awards (Uniform Guidance). The report contents are compiled from the work we performed during our annual and biennial agency audits. Single Audits are intended to provide federal grantor agencies with consistent and uniform evaluations of grant recipient’s management of federal funds.
The federal government provides extensive requirements for recipients of federal grants. Our audits of each state agency include determining compliance with these requirements when the federal grant is determined to be a major federal program under federal audit guidelines. The state of Montana spent approximately $4.0 billion and $3.9 billion in federal funds in fiscal years 2019 and 2018, respectively. Programs with expenditures totaling at least $22.06 million during the 2019 biennium and not determined to be low risk were identified as major federal programs. The federal audit
(continued on back)
guidelines establish criteria to consider when determining when a program is determined to be low risk. Among these requirements are whether the program was audited in one of the two most recent audits and whether any issues related to internal controls, compliance, or questioned costs were identified. After this determination is made, we were required to audit an additional 25 percent, or 1 program in this case, to replace these low risk programs with identified risky programs below the monetary threshold of $22.06 million. We audited an additional low risk program because initial projections indicated the program would exceed the threshold.
The state of Montana had 23 major federal programs during the 2019 biennium, as listed on page C-14, which are administered by 10 different state agencies. During fiscal years 2019 and 2018, approximately 78 percent of the federal funds spent were related to Montana’s major federal programs. Of the 78 percent, the Medicaid Cluster and the Highway Planning and Construction Cluster makes up approximately 52 percent and 16 percent, respectively.
S-1

For a complete copy of the report (18-02) or for further information, contact the Legislative Audit Division at 406-444-3122; e-mail to lad@mt�gov; or check the web site at
http://leg�mt�gov/auditReport Fraud, Waste, and Abuse to the Legislative Auditor’s FRAUD HOTLINE
Call toll-free 1-800-222-4446, or e-mail lad@mt�gov�
Federal audit regulations specifically require the Single Audit to report whether each major federal program complied with selected federal requirements. Out of the 23 major federal programs tested, we identified 15 that did not comply with federal requirements in all material respects. We rendered an adverse opinion on 3 programs and a qualified opinion on 12 programs that did not materially comply with federal requirements. We also identified over $2.6 million of known questioned costs, which are costs that resulted from a violation or possible violation of a statute, regulation, or the terms and conditions of a federal award, including funds used to match federal funds; where the costs, at the time of the audit, are not supported by adequate documentation; or where the costs incurred appear unreasonable and do not reflect the actions a prudent person would take in the circumstances. Additionally, we project likely questioned costs in excess of $91.4 million based on our testing.
Federal audit requirements also define varying degrees of deficiencies in internal controls. These include a control deficiency, a significant deficiency, and a material weakness, in order from least to most serious. The 40 recommendations contained in this report include 9 significant deficiencies and 26 material weaknesses.
Federal grantor agencies are the primary users of the Single Audit report, and the form of the audit report is designed to meet their oversight needs. Legislators and others may also find the report useful. In particular, the Schedules of Expenditures of Federal Awards
Resultsfor fiscal years 2019 and 2018, included in the report provide an overview of the state’s federal grant activity, by the Catalog of Federal Domestic Assistance number (CFDA#), and the Corrective Action Plan summarizes the efforts state agencies are taking to remediate identified noncompliance and internal control deficiencies.
S-2

FY19 Financial Section
18-02


FY19 Financial Section
TABLE OF CONTENTSReport on Internal Control Over Financial Reporting and on Compliance and Other Matters Based on an Audit of Basic Financial Statements Performed in Accordance With Government Auditing Standards ................................................................................................................ A-1Independent Auditor’s Report ...............................................................................................A-5Management’s Discussion and Analysis .............................................................................. A-11Basic Financial Statements ..................................................................................................A-22Required Supplementary Information .............................................................................. A-178Schedule of Expenditures of Federal Awards ..................................................................... A-201
A-i
18-02


Report on Internal Control Over Financial Reporting and on Compliance and Other Matters Based on an Audit of Financial Statements Performed in Accordance with
Government AuditinG StAndArdS
The Legislative Audit Committeeof the Montana State Legislature:
We have audited, in accordance with the auditing standards generally accepted in the United States of America and the standards applicable to the financial audits contained in Government Auditing Standards issued by the Comptroller General of the United States, the financial statements of the governmental activities, the business-type activities, the aggregate discretely presented component units, each major fund, and the aggregate remaining fund information of the State of Montana, as of and for the year ended June 30, 2019, and the related notes to the financial statements, which collectively comprise the State of Montana’s basic financial statements, and have issued our report thereon dated February 13, 2020. Our report includes qualified opinions on the General Fund and Federal Special Revenue Fund opinion units. We issued qualified opinions because the note disclosures do not include a material loss contingency between $84 and $163 million required by Generally Accepted Accounting Principles. Our report includes a reference to other auditors who audited the financial statements of the Montana State University component units and the University of Montana component units, as described in our report on the State of Montana’s financial statements. The financial statements of the Montana State University component units and the University of Montana component units were not audited in accordance with Government Auditing Standards, and accordingly, this report does not include reporting on internal control over financial reporting or instances of reportable noncompliance associated with these component units.
Internal Control Over Financial Reporting In planning and performing our audit of the financial statements, we considered the state of Montana’s internal control over financial reporting to determine the audit procedures that are appropriate in the circumstances for the purpose of expressing our opinions on the financial statements, but not for the purpose of expressing an opinion on the effectiveness of the state of Montana’s internal control. Accordingly, we do not express an opinion on the effectiveness of the state of Montana’s internal control.
LEGISLATIVE AUDIT DIVISION Angus Maciver, Legislative Auditor Deputy Legislative AuditorsDeborah F. Butler, Legal Counsel Cindy Jorgenson Joe Murray
Room 160 • State Capitol Building • PO Box 201705 • Helena, MT • 59620-1705Phone (406) 444-3122 • FAX (406) 444-9784 • E-Mail [email protected]
A-1

Our consideration of internal control was for the limited purpose described in the preceding paragraph and was not designed to identify all deficiencies in internal control that might be material weaknesses or significant deficiencies and therefore, material weaknesses or significant deficiencies may exist that were not identified. However, as described below, we identified certain deficiencies in internal control that we consider to be material weaknesses and significant deficiencies.
A deficiency in internal control exists when the design or operation of a control does not allow management or employees, in the normal course of performing their assigned functions, to prevent, or detect and correct, misstatements on a timely basis. A material weakness is a deficiency, or a combination of deficiencies, in internal control such that there is a reasonable possibility that a material misstatement of the entity’s financial statements will not be prevented, or detected and corrected on a timely basis. We believe the deficiency described below is a material weakness.
The Department of Public Health and Human Services (DPHHS) did not design and maintain adequate internal control over eligibility determinations in the Medicaid and Children’s Health Insurance Program (CHIP) during fiscal year 2019. Total expenditures under the programs were $1.5 billion and $104 million, respectively. The department’s internal controls were not sufficiently designed to identify and remove participants from the Medicaid or CHIP programs when participants misrepresent their household composition, sources of income, and residency in order to circumvent the programs’ eligibility requirements.
A significant deficiency is a deficiency, or a combination of deficiencies, in internal control that is less severe than a material weakness, yet important enough to merit the attention by those charged with governance. We consider the deficiency described below to be a significant deficiency.
The DPHHS does not have adequate internal controls to ensure transactions are processed in compliance with federal Supplemental Nutrition Assistance Program (SNAP) requirements. DPHHS did not receive a System and Organization Controls (SOC)-1 Type 2 report over their service provider that is responsible for settlement, or payment, to retailers that have agreed to accept Electronic Benefit Transactions (EBT) cards for food. EBT payments for SNAP for fiscal year 2019 were approximately $149 million. Without the SOC-1 Type 2 report, the department has no assurance that system processing is complete, accurate, timely, and authorized which are necessary for adequate internal controls.
Compliance and Other Matters As part of obtaining reasonable assurance about whether the state of Montana’s financial statements are free from material misstatement, we performed tests of its compliance with certain provisions of laws, regulations, contracts, and grant agreements, noncompliance with which could have a direct and material effect on the determination of financial statement amounts. However, providing an opinion on compliance with those provisions was not an objective of our audit, and accordingly, we do not
A-2
express such an opinion. The results of our tests disclosed instances of noncompliance or other matters that are required to be reported under Government Auditing Standards. The identified instances of noncompliance are described below.
The Montana Public Employees’ Retirement Board administers eight defined benefit retirement plans. The Montana Constitution and state law require all retirement systems to be actuarially sound. The actuarial valuations as of June 30, 2019, indicate the Game Wardens’ and Peace Officers,’ Highway Patrol Officers,’ and Public Employees’ retirement systems are not actuarially sound as they amortize in 53, 42, and 36 years, respectively. The maximum allowable amortization period is 30 years, as defined by state law.
At DPHHS, a significant number of clients receiving benefits under the department’s federal Medicaid and CHIP may not meet the applicable eligibility criteria. Likely questioned costs associated with payments made to ineligible recipients in fiscal year 2019 are projected to be between $41.6 million and $81.2 million.
State of Montana’s Response to FindingsThe State of Montana’s response to the findings identified in the report are described in the separately issued Department of Public Health and Human Services audit report (19-14), the separately issued Public Employees’ Retirement Administration audit report (18-08B), and on B-1 of this report. The responses in those reports were not subjected to the auditing procedures applied in those audits and, accordingly, we express no opinion on it.
Purpose of this ReportThe purpose of this report is solely to describe the scope of our testing of internal control and compliance and the results of that testing, and not to provide an opinion on the effectiveness of the State of Montana’s internal control or on compliance. This report is an integral part of an audit performed in accordance with Government Auditing Standards in considering the State of Montana’s internal control and compliance. Accordingly, this communication is not suitable for any other purpose.
Respectfully submitted,
/s/ Cindy Jorgenson
Cindy Jorgenson, CPADeputy Legislative AuditorHelena, MT
February 13, 2020
A-3

A-4

Independent Auditor’s Report
The Legislative Audit Committeeof the Montana State Legislature:IntroductionWe have audited the accompanying financial statements of the governmental activities, the business-type activities, the aggregate discretely presented component units, each major fund, and the aggregate remaining fund information of the state of Montana, as of and for the year ended June 30, 2019, and the related notes which collectively comprise the state of Montana’s basic financial statements, as follows:
� Statement of Net Position � Statement of Activities � Balance Sheet–Governmental Funds � Reconciliation of the Balance Sheet of Governmental Funds to the Statement of Net Position � Statement of Revenues, Expenditures, and Changes in Fund Balances–Governmental Funds � Reconciliation of the Statement of Revenues, Expenditures, and Changes in Fund Balances
of Governmental Funds to the Statement of Activities � Statement of Fund Net Position–Proprietary Funds � Statement of Revenues, Expenses, and Changes in Fund Net Position–Proprietary Funds � Statement of Cash Flows–Proprietary Funds � Statement of Fiduciary Net Position–Fiduciary Funds � Statement of Changes in Fiduciary Net Position–Fiduciary Funds
Management’s Responsibility for the Financial SchedulesManagement is responsible for the preparation and fair presentation of these financial statements in accordance with accounting principles generally accepted in the United States of America; this responsibility includes designing, implementing, and maintaining internal controls relevant to the preparation and fair presentation of financial statements that are free from material misstatement, whether due to fraud or error.
Auditor’s ResponsibilityOur responsibility is to express opinions on these financial statements based on our audit. We did not audit the financial statements of the Montana State University (MSU) component units and the University of Montana (UM) component units, which represents 15.46 percent, 31.44 percent, and
A-5LEGISLATIVE AUDIT DIVISION
Angus Maciver, Legislative Auditor Deputy Legislative AuditorsDeborah F. Butler, Legal Counsel Cindy Jorgenson Joe Murray
Room 160 • State Capitol Building • PO Box 201705 • Helena, MT • 59620-1705Phone (406) 444-3122 • FAX (406) 444-9784 • E-Mail [email protected]

5.51 percent, respectively of the assets, net position, and revenues of the aggregate discretely presented component units. Those financial statements were audited by other auditors whose reports have been furnished to us, and our opinions, insofar as they relate to the amounts included for the university component units, are based solely on the reports of other auditors.
We conducted our audit in accordance with auditing standards generally accepted in the United States of America and the standards applicable to financial audits contained in Government Auditing Standards, issued by the Comptroller General of the United States. Those standards require that we plan and perform the audit to obtain reasonable assurance about whether the financial statements are free from material misstatement. The financial statements of the MSU and UM component units were not audited in accordance with Government Auditing Standards.
An audit involves performing procedures to obtain audit evidence about the amounts and disclosures in the financial statements. The procedures selected depend on the auditor’s judgment, including the assessment of the risks of material misstatement of the financial statements, whether due to fraud or error. In making those risk assessments, the auditor considers internal controls relevant to the state of Montana’s preparation and fair presentation of the financial statements in order to design audit procedures that are appropriate in the circumstances, but not for the purpose of expressing an opinion on the effectiveness of the state of Montana’s internal control, and accordingly, we express no such opinion. An audit also includes evaluating the appropriateness of accounting policies used and the reasonableness of significant accounting estimates made by management, as well as the overall presentation of the financial statements.
We believe that the audit evidence we have obtained is sufficient and appropriate to provide a basis for our audit opinions.
Summary of OpinionsOpinion Unit Type of OpinionGovernmental Activities UnmodifiedBusiness-Type Activities UnmodifiedGeneral Fund QualifiedState Special Revenue Fund UnmodifiedFederal Special Revenue Fund QualifiedLand Grant UnmodifiedCoal Severance Tax UnmodifiedUnemployment Insurance UnmodifiedEconomic Development Bonds UnmodifiedAggregate Discretely Presented Component Units UnmodifiedAggregate Remaining Fund Information Unmodified
A-6

Basis for Qualified Opinions The Financial Statements do not disclose a loss contingency related to questioned costs between $84,000,000 and $163,100,000 of payments made to recipients who may not be eligible for the Medicaid and Children’s Health Insurance Program for fiscal years 2018 and 2019 at the state of Montana’s Department of Public Health and Human Services. The associated federal findings will be submitted to the Federal Audit Clearinghouse by March 31, 2020 as part of the State of Montana’s Single Audit Report. Once submitted, the federal grantor agency is responsible for issuing a management decision regarding the findings and any expected repayment of disallowed costs.
Accounting principles generally accepted in the United State of America require a loss contingency of this magnitude be disclosed. The questioned costs represent a range of costs paid by the federal government which it could disallow, requiring the state to return the federal share. While a contingency is a future event or circumstance which is possible but cannot be predicted with certainty, the likelihood of loss of this contingency is more than remote and therefore disclosure is required.
The omitted disclosure affects both the Federal Special Revenue Fund and General Fund opinion units because the questioned costs are expenditures in the Federal Special Revenue Fund and the General Fund is the only immediate option as alternative funding source if repayment is required.
Qualified OpinionsIn our opinion, except for the effects of the matters described in the “Basis for Qualified Opinion” paragraph, the financial statements referred to above present fairly, in all material respects, the financial position as of June 30, 2019, and the results of operations of the General Fund and Federal Special Revenue Fund major funds of the state of Montana for the year then ended in accordance with the accounting principles generally accepted in the United State of America.
Unmodified Opinions In our opinion, the financial statements referred to above present fairly, in all material respects, the financial position of the Governmental Activities and Business-Type Activities, State Special Revenue Fund, Land Grant, Coal Severance Tax, Unemployment Insurance and Economic Development Bonds major funds, and the Aggregate Discretely Presented Component Units and Aggregate Remaining Fund Information of the state of Montana, as of June 30, 2019, and the respective changes in financial position and, where applicable, cash flows thereof for the fiscal year then ended in conformity with accounting principles generally accepted in the United States of America.
Other Matters Required Supplementary InformationAccounting principles generally accepted in the United States of America require that the Management’s Discussion and Analysis, the Budgetary Comparison Schedule, the Pension Plan Information, the Other Postemployment Benefits (OPEB) Plan Information, and the Risk Management Trend Information, and the related notes, be presented to supplement the basic financial statements. Such information, although not a part of the basic financial statements, is required by the Governmental Accounting Standards Board who considers it to be an essential part of financial reporting for placing
A-7

the basic financial statements in an appropriate operational, economic, or historical context. We have applied certain limited procedures to the required supplementary information in accordance with auditing standards generally accepted in the United States of America, which consisted of inquiries of management about the methods of preparing the information and comparing the information for consistency with management’s responses to our inquiries, the basic financial statements, and other knowledge we obtained during our audit of the basic financial statements. We do not express an opinion or provide any assurance on the information because the limited procedures do not provide us with sufficient evidence to express an opinion or provide any assurance.
Supplementary InformationOur audit was conducted for the purpose of forming an opinion on the financial statements that collectively comprise the state of Montana’s basic financial statements as a whole. The Schedule of Expenditures of Federal Awards, as required by Title 2 U.S. Code of Federal Regulations Part 200, Uniform Administrative Requirements, Cost Principles, and Audit Requirements for Federal Awards, is presented for purposes of additional analysis and is not a required part of the basic financial statements. Such information is the responsibility of management and was derived from and relates directly to the underlying accounting and other records used to prepare the financial statements. The information has been subjected to the auditing procedures applied in the audit of the financial statements and certain additional procedures, including comparing and reconciling such information directly to the underlying accounting and other records used to prepare the financial statements or to the financial statements themselves, and other additional procedures in accordance with auditing standards generally accepted in the United States of America. In our opinion, the Schedule of Expenditures of Federal Awards is fairly stated in all material respects in relation to the basic financial statements taken as a whole.
Other Reporting Required by Government Auditing Standards In accordance with Government Auditing Standards, we have also issued our report dated February 13, 2020, on our consideration of the state of Montana’s internal control over financial reporting and on our tests of its compliance with certain provisions of laws, regulations, contracts, and grant agreements and other matters. The purpose of that report is to describe the scope of our testing of internal control over financial reporting and compliance and the results of that testing, and not to provide an opinion on internal control over financial reporting or on compliance. That report is an integral part of an audit performed in accordance with Government Auditing Standards in considering the state of Montana’s internal control over financial reporting and compliance.
Respectfully submitted,
/s/ Cindy Jorgenson
Cindy Jorgenson, CPADeputy Legislative AuditorHelena, MT
February 13, 2020
A-8

The State of Montana’s Basic Financial Statements, Required Supplementary Information, and
Schedule of Expenditures of Federal Awards

A-10

MANAGEMENT’S DISCUSSION AND ANALYSIS
INTRODUCTION
Management of the State of Montana (State) provides this Management’s Discussion and Analysis of the State ofMontana’s basic financial statements included in the Comprehensive Annual Financial Report (CAFR). This narrativeoverview and analysis of the financial activities of the State of Montana are for the fiscal year ended June 30, 2019.We encourage readers to consider this information in conjunction with the additional information that is furnished inthe State’s financial statements, which follow.
FINANCIAL HIGHLIGHTS
Government-wideThe assets and deferred outflows of resources of the State exceeded its liabilities and deferred inflows of resources atthe end of fiscal year 2019 by $9.7 billion compared with $8.9 billion at the end of fiscal year 2018, representing a9.0% increase in net position. Component units reported net position of $2.1 billion at the end of fiscal year 2019compared to $2.1 billion at the end of fiscal year 2018, representing a 0.9% increase in net position. More detail isprovided in the financial statement overview below.
Fund LevelAs of the close of fiscal year 2019, the State’s governmental funds reported combined ending fund balances of $4.5billion compared with $4.0 billion at fiscal year 2018. This represents a $510.9 million (12.7%) increase in total fundbalance. Of the 2019 balance, $1.8 billion is not in spendable form, primarily as permanent fund principal. Thus, $2.7billion is available for spending. The fund balance in spendable form is segregated by constraint as follows: $1.1 billionrestricted, $1.3 billion committed, $18.0 million assigned, and $348.6 million unassigned. These changes are discussedin more detail in the financial analysis of the State’s major funds presented below.
The State’s business-type activity funds reported net position at the close of fiscal year 2019 in the amount of $482.6million compared with fiscal year 2018 net position of $431.5 million. Of the 2019 business-type activity net position,$21.3 million was reported as net investment in capital assets. Net position of $461.3 million was in spendable formwith $19.0 million unrestricted and $442.3 million restricted to expenditure for a specific purpose. This represents a$51.2 million (12.5%) increase in spendable net position from the fiscal year 2018 balance of $410.1 million. Thesechanges are discussed in more detail in the financial analysis of the State’s major funds presented below.
Long-term DebtThe State’s total governmental activity bonds and notes payable for governmental activities decreased by $32.2 million,from $159.3 million in fiscal year 2018 to $127.1 million, a 20.2% decrease in fiscal year 2019.
Further detail relating to the State’s long-term debt is provided in notes to the financial statement’s Note 11.
OVERVIEW OF THE FINANCIAL STATEMENTS
This discussion and analysis is intended to serve as an introduction to the State of Montana’s basic financial statements.The State’s basic financial statements include three components: (1) government-wide financial statements, (2) fundfinancial statements, and (3) notes to the financial statements. The report also contains additional required supplementaryinformation, which includes budgetary schedules, pension and other post employment benefits plan information, andrisk management trends. These components are described below:
Basic Financial StatementsThe basic financial statements include two types of financial statements that present different views of the State – thegovernment-wide financial statements and the fund financial statements. These financial statements also include the
A-11

notes to the financial statements, which provide further detail and information related to the balances of the financialstatements.
Government-wide Financial StatementsThe government-wide financial statements provide a broad view of the State’s operations in a manner similar to aprivate-sector business. The statements provide both short-term and long-term information about the State’s financialposition, which assists in assessing the State’s economic condition at the end of the fiscal year. These are preparedusing the flow of economic resources measurement focus and the accrual basis of accounting. In other words, theyfollow methods that are similar to those used by most businesses, including all revenues and expenses connected withthe fiscal year, even if cash involved has not been received or paid. The government-wide financial statements includetwo statements: The Statement of Net Position and the Statement of Activities, as defined below.
The Statement of Net Position presents all of the government’s assets, deferred outflows of resources, liabilities, deferredinflows of resources, and net position. Over time, increases or decreases in the State’s net position may serve as a usefulindicator of whether the financial position of the State is improving or deteriorating.
The Statement of Activities presents information related to the government’s net position changes during the most recentfiscal year. All changes in net position are reported as soon as the underlying event giving rise to the change occurs,regardless of the timing of related cash flows. Thus, revenues and expenses are reported in this statement for someitems that will not result in cash flows until future fiscal periods. This statement also presents a comparison betweendirect expenses and program revenues for each function of the State.
Both of the above financial statements have separate sections for three different types of state activities. These threetypes of activities are as follows:
Governmental Activities – Activities mostly supported by taxes and intergovernmental revenues, including federalgrants. Most services normally associated with state government fall into this category, including education (supportfor both K-12 public schools and higher education), general government, health and human services, natural resources,public safety, and transportation.
Business-type Activities – Functions normally intended to recover all or a significant portion of their costs through userfees and charges to external users of goods and services. The major business-type activities of the State include theUnemployment Insurance Fund and the Municipal Finance Programs, which assists Montana’s small businesses andlocal governments in obtaining long-term, fixed-rate financing through private Montana lending institutions.
Discretely Presented Component Units – Operations for which the State has financial accountability, but have certainindependent qualities as well. In order to be considered component units, these entities must be legally separate to theextent that they may sue, or be sued, in their own right. For the most part, these entities operate similarly to privatesector businesses and the business-type activities described above. The State’s component units consist of one financingauthority, one housing board, one nonprofit independent public corporation, and two universities.
Fund Financial Statements - Reporting the State’s Major FundsA fund is a grouping of related accounts that is used to maintain control over resources that have been segregated forspecific activities or objectives. The State, like other state and local governments, uses fund accounting to ensure anddemonstrate compliance with finance-related legal requirements.
The fund financial statements focus on individual parts of the state government, reporting the State’s operations inmore detail than the government-wide statements. All of the funds can be divided into three categories. It is importantto note that these fund categories use different accounting approaches and should be interpreted individually. The threecategories of funds are as follows:
Governmental Funds – Most of the basic services provided by the State are financed through governmental funds.Governmental funds are used to account for essentially the same functions reported as governmental activities in thegovernment-wide financial statements. However, unlike the government-wide financial statements, the governmentalfund financial statements focus on near-term inflows and outflows of spendable resources. They also focus on thebalances of spendable resources available at the end of the fiscal year. Such information may be useful in evaluating
A-12

the government’s near-term financing requirements. This approach is known as using the flow of current financialresources measurement focus and the modified accrual basis of accounting. These statements provide a detailed short-term view of the State’s finances that assists in determining whether there will be adequate financial resources availableto meet the current needs of the State.
The State has five governmental funds that are considered major funds for presentation purposes. Each major fund ispresented in a separate column in the governmental fund balance sheet and in the governmental fund statement ofrevenues, expenditures, and changes in fund balances. The State’s five major governmental funds are the General Fund,the State Special Revenue Fund, the Federal Special Revenue Fund, the Coal Severance Tax Fund, and the Land GrantFund.
Proprietary Funds – When the State charges customers for the service it provides, whether to outside customers or toother agencies within the State, these services are generally reported in proprietary funds. Like the government-widestatements, proprietary fund statements utilize full accrual accounting, the same method used by private sectorbusinesses. Enterprise funds report activities that provide supplies and services to the general public. Whereas internalservice funds report activities that provide supplies and services to the State’s other programs and activities.
Fiduciary Funds – Resources held for the benefit of parties outside state government are accounted for in fiduciaryfunds. Fiduciary funds are not reflected in the government-wide financial statements because the resources of thesefunds are not available to support the State’s own programs. Fiduciary fund statements use the full accrual basis ofaccounting.
Notes to the Financial StatementsThe notes to the financial statements provide additional information that is essential for a full understanding of thegovernment-wide and the fund financial statements. The notes to the financial statements can be found immediatelyfollowing the fiduciary fund financial statements.
Required Supplementary InformationThe basic financial statements are followed by a section of required supplementary information. This section containsa budgetary comparison schedule, which includes the reconciliation between the statutory fund balance for budgetarypurposes and the fund balance for the General Fund and major special revenue funds as presented in the governmentalfund financial statements. Required supplementary information also includes pension and other post employmentbenefits plan information, as well as additional risk management trend data.
GOVERNMENT-WIDE FINANCIAL ANALYSIS
Montana’s overall financial position increased from the last fiscal year, as reflected in the $802.9 million increase(9.0%) in net position. This improvement resulted from continued economic growth, particularly related to tax revenue,capital grants and contributions, and investment earnings within the State.
Net PositionAs noted earlier, net position may serve over time as a useful indicator of a government’s financial position. The State’scombined net position (government and business-type activities) totaled $9.7 billion at the end of fiscal year 2019. Netposition of both governmental and business-type activities increased by $751.9 million (8.9%) and $51.1 million(11.8%), respectively. These changes are explained in detail in the major fund analysis below.
A portion of the State’s net position reflects its investment in capital assets such as land, buildings, equipment, andinfrastructure (roads, bridges, and other immovable assets) less any related debt used to acquire those assets that is stilloutstanding. The State uses these capital assets to provide services to citizens; consequently, these assets are not availablefor future spending. Although the State’s investment in its capital assets is reported net of related debt, it should benoted that the resources needed to repay this debt must be provided from other sources since the capital assets themselvescannot be used to liquidate these liabilities.
A-13

An additional portion of the State’s net position represents resources that are subject to external restrictions on howthey may be used. The remaining balance of unrestricted net position may be used to meet the State’s ongoing obligationsto citizens and creditors. Internally imposed designations of resources are not presented as restricted net position.
At the end of the current fiscal year, the State reported positive balances in net investment in capital assets and restrictednet position categories, along with a negative balance in the unrestricted category of net position, for both thegovernmental activities and the primary government as a whole. The negative unrestricted net position is primarily dueto the State's net pension liability. GASB Statements No. 68 and 71, related to pension liabilities and other balancesheet components, were implemented in fiscal year 2015 and are contributing factors to the negative net position. TheState also reported positive balances for all categories of net position for the business-type activities.
Net PositionJune 30,
(expressed in thousands)
GovernmentalActivities
Business-typeActivities
Total PrimaryGovernment
2018 2019 2018 2019 2018 2019Current and other assets $ 5,262,514 $ 5,762,815 $ 582,328 $ 629,612 $ 5,844,842 $ 6,392,427Capital assets 6,190,693 6,480,485 21,627 21,283 6,212,320 6,501,768 Total assets 11,453,207 12,243,300 603,955 650,895 12,057,162 12,894,195
Deferred outflows of resources 372,886 779,931 4,011 2,919 376,897 782,850
Long-term liabilities Due in more than one year 2,279,169 2,639,113 23,527 20,277 2,302,696 2,659,390Other liabilities 1,029,316 976,135 152,122 147,328 1,181,438 1,123,463 Total liabilities 3,308,485 3,615,248 175,649 167,605 3,484,134 3,782,853
Deferred inflows of resources 73,544 212,056 831 3,641 74,375 215,697
Net investment in capital assets 6,088,211 6,402,612 21,395 21,266 6,109,606 6,423,878Restricted 2,998,805 3,216,332 397,588 442,306 3,396,393 3,658,638Unrestricted (642,952) (423,017) 12,503 18,996 (630,449) (404,021)
Total net position $ 8,444,064 $ 9,195,927 $ 431,486 $ 482,568 $ 8,875,550 $ 9,678,495
A-14

The following condensed financial information was derived from the government-wide Statement of Activities,and reflects how the State’s net position changed during the fiscal year:
Changes in Net PositionFor Fiscal Year Ended June 30,
(expressed in thousands)
GovernmentalActivities
Business-typeActivities
Total PrimaryGovernment
2018 2019 2018 2019 2018 2019Revenues: Program revenues Charges for services $ 594,814 $ 623,732 $ 404,890 $ 426,701 $ 999,704 $ 1,050,433 Operating grants 2,555,898 2,611,941 65,885 68,243 2,621,783 2,680,184 Capital grants 447,018 527,900 685 512 447,703 528,412 General revenues Taxes 2,625,077 2,762,972 28,846 30,094 2,653,923 2,793,066 Other 69,101 248,070 4,019 2,398 73,120 250,468 Total revenues 6,291,908 6,774,615 504,325 527,948 6,796,233 7,302,563
Expenses: General government 674,329 829,657 674,329 829,657 Public safety 429,760 428,514 429,760 428,514 Transportation 527,927 547,907 527,927 547,907 Health and human service 2,681,151 2,680,251 2,681,151 2,680,251 Education 1,299,423 1,314,785 1,299,423 1,314,785 Natural resources 379,525 302,680 379,525 302,680 Interest on long-term debt 6,743 5,454 6,743 5,454 Unemployment Insurance 113,843 108,507 113,843 108,507 Liquor Stores 86,118 89,971 86,118 89,971 State Lottery 45,896 48,061 45,896 48,061 Municipal Finance Programs 2,648 2,937 2,648 2,937 Hail Insurance 576 933 576 933 Gen Govt Services 73,539 70,154 73,539 70,154 Prison Funds 9,130 9,307 9,130 9,307 MUS Group Insurance 88,912 88,330 88,912 88,330 MUS Workers Comp 2,738 3,887 2,738 3,887 Total expenses 5,998,858 6,109,248 423,400 422,087 6,422,258 6,531,335
Increase (decrease) in net position before transfers 293,050 665,367 80,925 105,861 373,975 771,228Transfers 48,854 55,786 (48,854) (55,786) — —Change in net position 341,904 721,153 32,071 50,075 373,975 771,228Net position, beg of year (as adjusted) 8,102,160 8,474,774 399,415 432,493 8,501,575 8,907,267Net position, end of year $ 8,444,064 $ 9,195,927 $ 431,486 $ 482,568 $ 8,875,550 $ 9,678,495
A-15

Governmental ActivitiesThe following chart depicts revenues of the governmental activities for the fiscal year:
Revenues - Govermental ActivitiesFiscal Year Ended June 30, 2019
Operating Grants: 38.6%
Capital Grants: 7.8%
Taxes: 40.8%
Charges for Services: 9.2%
Other: 3.6%
The following chart depicts expenses of the governmental activities for the fiscal year:
Expense - Governmental ActivitiesFiscal Year Ended June 30, 2019
Natural Resources: 5.0%
Education: 21.5%
Health and Human Services: 43.9%
Transportation:9.0%
Public Safety: 7.0%
General Government: 13.5%
Interest on Long-Term Debt: 0.1%
A-16

Business-type ActivitiesThe following chart depicts revenues of the business-type activities for the fiscal year:
Revenues - Business-type ActivitiesFiscal Year Ended June 30, 2019
Operating Grants: 12.9%
Capital Grants: 0.1%
Taxes: 5.7%
Other: 0.5%
Charges for Services: 80.8%
The following chart depicts expenses of the business-type activities for the fiscal year:
Expenses - Business-type ActivitiesFiscal Year Ended June 30, 2019
Prison Funds: 2.2%
MUS Group Insurance: 20.9%
MUS Workers Comp: 0.9%
Unemployment Insurance:25.7%
Liquor Stores: 21.3%
State Lottery: 11.4%
Municipal Finance Prog: 0.7%Hail Insurance: 0.2%
Gen Govt Services: 16.7%
A-17

FINANCIAL ANALYSIS OF THE STATE’S MAJOR FUNDS
As the State completed the year, its governmental funds reported fund balances of $4.5 billion. Of this total, $2.7 billion(60.6%) constitutes spendable fund balance and $1.8 billion (39.4%) is classified as non-spendable. The analysis ofthe following major funds, providing the majority of the fund balance for the government, follows.
General Fund Revenues and ExpendituresThe General Fund is the chief operating fund of the State. For fiscal year 2019, the total fund balance of the GeneralFund was reported at approximately $443.4 million. Of this balance, $4.2 million is non-spendable. The remaining$439.2 million is spendable with $60.7 million committed, $17.2 million assigned, and $361.3 million unassigned.This represents 16.0% of the $2.7 billion spendable governmental fund balances for all governmental funds. Of theassigned fund balance, $17.2 million relates to outstanding encumbrances at the end of the fiscal year. The committedfund balance of $60.7 million relates to the balance of the Budget Stabilization Reserve Fund, which is combined withthe General Fund for financial statement presentation. Further detail on the breakdown of fund balance for the GeneralFund is provided in Note 14 – Major Purpose Presentation.
Total fund balance increased by $244.1 million when compared to the previously reported fund balance of $199.3million. Changes in both expenditures and revenues are discussed in detail below. The Governor's Budget, as disclosedin the State of Montana Biennial Balance Sheet, dated November 15, 2018, showed enacted and proposed fund balancefor the General Fund of $168.5 million for fiscal year 2019, without regard to a fund balance spend down.
General Fund Revenues – Total General Fund revenues were $2.5 billion for fiscal year 2019 (lower than legislativeestimation), a 8.2% increase from the $2.3 billion reported in 2018 (which were lower than legislative estimation).Fiscal year 2019 tax revenue increased by 8.3% in total over 2018, with corporate income tax collections up 11.8%and individual income tax collections increased by 10.5%. Other noted increases in revenues included investmentearnings.
General Fund Expenditures – Total General Fund expenditures for fiscal year 2019 increased by $53.4 million (2.4%).This increase in expenditures occurred in the general government, health and human services, and education functionsas follows:
• General Government expenditures increased by $10.0 million (2.9%)• Health and human services expenditures increased by $9.2 million (1.8%) • Education expenditures increased by $28.6 million (2.8%)
The General Fund’s actual revenues and expenditures in comparison to budgeted revenues and expenditures is providedin more depth on the Budgetary Comparison Schedule within the Required Supplementary Information section of thisreport. The same level of detail used to report the actual revenues and expenditures is not readily available for allbudgetary revenues and expenditures, which may cause some variances.
General Fund Expenditure Budget ReversionsFund balances are not reserved for reverted appropriations. For fiscal year 2019, general fund appropriations thatreverted to 2020 were $42.4 million.
The Department of Public Health and Human Services had unspent appropriations of $19.1 million related to Medicaidsavings and other operational costs.
The Office of Public Instruction had unspent appropriations of $7.5 million related to operational transfers and educationcosts.
The Department of Corrections had unspent appropriations of $5.8 million related to mitigation of expenditures andcommunity placement into alternative programs.
The Judicial Branch had unspent appropriations of $3.3 million related to supplemental transfers and operations costs.
The Department of Legislative Services had unspent appropriations of $1.9 million related to operational costs and thereserve accounts.
A-18

The Department of Justice had unspent appropriations of $1.2 million related to operational costs, retirement transfers,and sobriety testing program costs.
The Department of Administration had unspent appropriations of $1.2 million, and these were attributable tosupplemental transfers, banking charges, and other operational costs.
The remaining unspent appropriation of $2.2 million was attributable to miscellaneous reversions across other agencies.
State Special Revenue FundThe fund balance of the State Special Revenue Fund increased by $112.8 million to $1.7 billion. Revenues increasedby $85.9 million (8.9%) and expenditures increased $13.9 million (1.3%), for fiscal year 2019. The largest increasesin revenues are attributable to an increase in investment earnings, grants/contracts/donations, and charges for services,along with licenses and permits. The largest increases in expenditures are attributable to capital outlay expendituresfor infrastructure and land easements. Other financing sources, such as insurance proceeds, increased due to claims fordamage suffered to MSU buildings.
Federal Special Revenue Fund The fund balance of the Federal Special Revenue Fund decreased by $2.5 million (25.3%) to the balance of negative$12.6 million. Revenues and expenditures increased by $83.5 million (2.9%) and $62.1 million (2.2%) respectively,for the fiscal year 2019. Revenue increases are attributable to increases in federal program revenue, while expenditureincreases are attributable to increases in capital outlay related expenditures. The capital outlay expenditure increaseof 21.1% is attributable to infrastructure expenditure increases by transportation.
Coal Severance Tax Permanent Fund The fund balance of the Coal Severance Tax Permanent Fund increased by $65.8 million (6.0%) to $1.2 billion. Revenueincreased by $66.3 million (168.7%) to $105.7 million, primarily due to an increase of investment revenue in the equityin pooled investments. Transfers out, which decreased by $4.2 million (9.5%), and the increase in investment earningshelped lead to the increase in fund balance.
Land Grant Permanent FundThe fund balance of the Land Grant Permanent Fund increased by $64.0 million (9.0%) to $774.2 million. Revenueincreased by $64.7 million to a total of $129.7 million, and investment earnings made up $54.6 million of the increase.Transfers out were $66.4 million, which was an increase of $4.2 million compared to 2018. The increase in revenuecombined with the increase in transfers lead to an overall increase in fund balance.
Unemployment Insurance Enterprise FundNet position restricted for unemployment compensation increased by $37.3 million (11.9%). The increase in net positionreflects the continued impact of low unemployment throughout fiscal year 2019, accompanied by an increase in thetaxable wage base from $32.0 thousand to $33.0 thousand in 2019.
Municipal Finance Programs FundNet position increased by 6.0% to $5.4 million in fiscal year 2019. Financing income revenue increased $212.0 thousand,and investment earnings increased $433.0 thousand, while expenses from interest expense increased $349.0 thousand.Overall revenues and expenditures increased 25.0% and 10.9%, which resulted in an increase of $304.0 thousand tonet position.
CAPITAL ASSETS AND DEBT ADMINISTRATION
Capital AssetsThe State’s investment in capital assets for its governmental and business-type activities, as of June 30, 2019, amountedto $8.9 billion, with related accumulated depreciation of $2.4 billion, leaving a net book value of $6.5 billion. Thisinvestment in capital assets includes land, buildings, improvements, equipment, infrastructure, intangible assets, andconstruction in progress. Infrastructure assets are items that are normally immovable and of value only to the State,such as roads, bridges, streets and sidewalks, drainage systems, lighting systems, and similar items.
A-19

The total increase in the State’s investment in capital assets for the current fiscal year was $289.4 million or 4.7% interms of net book value. Most increases in capital expenditures were seen in construction, or reconstruction, of roadsand bridges. Additional information relating to the State’s capital assets can be found in Note 5 of the notes to thefinancial statements.
Debt AdministrationMontana continues to receive excellent general obligation bond ratings from Moody’s Investor Service (Aa1), Standardand Poor’s Corporation (AA), and Fitch Ratings (AA+), which remain unchanged from 2018.
State debt may be authorized either by a two-thirds vote of the members of each house of the Legislature or by afavorable vote of a majority of the State’s electors voting thereon. There is no constitutional limit on the amount ofdebt that may be incurred by the State. The Montana Constitution does, however, prohibit the incurring of debt to coverdeficits caused by appropriations exceeding anticipated revenue.
The State of Montana’s general obligation debt decreased from $84.5 million at June 30, 2018, to $73.1 million at June30, 2019. There is cash available, of $7.5 million at the end of fiscal year 2019, in debt service funds to service generalobligation debt.
The below table contains the ratio of general obligation debt and total State debt to personal income and to the amountof debt per capita:
Amount(in thousands)
Percentage of Personal Income (1)
State DebtPer Capita (2)
General obligation debt $ 73,090 0.15 % $ 69Total State debt (3) $ 132,228 0.30 % $ 125
(1) Based on personal income for calendar year 2018.(2) Based on estimated 2018 Montana population.(3) Based on total of general obligation bonds, special revenue bonds, notes payable, and lease/installment purchase payable for the percentage
and state debt per capita.
More detailed information regarding the State’s long-term obligations is provided in Note 11 of the notes to the financialstatements and in the statistical tables.
ECONOMIC CONDITION AND OUTLOOK
Montana’s primary economic base remains concentrated in nonresident travel, agriculture, and mining, as well asservice-providing industries. Per the 2019 Labor Day Report issued by the Montana Department of Labor and Industry,Montana had real wage gains of 0.8% in 2019, which was faster than the rate of inflation. Montana’s unemploymentrate has continued to remain low, and the rate in July 2019 was 3.4% with the national rate around 3.7%. Montanaadded roughly 5,400 jobs in 2018, for a growth rate of 1.1%. Montana had an estimated 1,062,305 population as ofJuly 1, 2018. The Montana labor market has total nonfarm workers of 484,700 in August 2019 as compared to 479,800in September 2018. Montana’s real GDP growth over the time period 2017 to 2018 was .09%, while the nation changewas 2.9%. A more in-depth analysis of the State’s overall financial position can be found in the transmittal letter of thisreport.
The Montana Constitution, Article VIII, Section 15, states that public retirement systems shall be funded on an actuariallysound basis. Public pension plans are considered actuarially sound if the unfunded accrued actuarial liability amortizationperiod is within 30 years. As of June 30, 2019, the Game Warden & Peace Officers’ Retirement System (GWPORS),the Highway Patrol Officers’ Retirement System (HPORS), and the Public Employees’ Retirement System - DefinedBenefit Retirement System (PERS-DBRP) were not in compliance and do not amortize within 30 years. The unfundedliabilities in the other state retirement systems amortize in 30 years or less as of the fiscal year ended June 30, 2019.
The actuarial condition of these retirement plans is disclosed in greater detail in Note 6 of the financial statements. Theunfunded actuarial liability of these plans is long-term in nature and does not translate into an inability of the plans tomeet their current obligations in the near future.
A-20
REQUESTS FOR INFORMATION
This financial report is designed to provide a general overview of the State of Montana’s finances for all of Montana’scitizens, taxpayers, customers, investors, and creditors. The financial report seeks to demonstrate the State’saccountability for the money it receives. Questions concerning any of the information provided in this report or requestsfor additional information should be addressed to the State of Montana, Statewide Accounting Bureau, Room 255Mitchell Building, PO Box 200102, Helena, MT 59620.
A-21

STATEMENT OF NET POSITIONJUNE 30, 2019 (amounts expressed in thousands)
PRIMARY GOVERNMENTGOVERNMENTAL BUSINESS-TYPE COMPONENT
ACTIVITIES ACTIVITIES TOTAL UNITSASSETS
Cash/cash equivalents (Note 3) $ 1,612,746 $ 494,837 $ 2,107,583 $ 470,957Receivables (net) (Note 4) 519,928 43,731 563,659 149,579Due from primary government — — — 1,339Due from other governments 338,388 209 338,597 29,945Due from component units 1,075 3,228 4,303 204Internal balances 9,860 (9,860) — —Inventories 27,742 5,022 32,764 4,884Advances to component units 14,476 22,119 36,595 —Long-term loans/notes receivable 513,144 39,516 552,660 579,706Equity in pooled investments (Note 3) 2,432,243 18,314 2,450,557 49,230Investments (Note 3) 212,810 8,355 221,165 2,092,058Securities lending collateral (Note 3) 27,994 211 28,205 669Net pension asset (Note 6) 42,459 — 42,459 —Other assets 9,950 3,930 13,880 68,103Depreciable capital assets and infrastructure, net (Note 5) 4,303,317 9,956 4,313,273 862,632Land and nondepreciable capital assets (Note 5) 2,177,168 11,327 2,188,495 112,661
Total assets 12,243,300 650,895 12,894,195 4,421,967
DEFERRED OUTFLOWS OF RESOURCES (Note 4) 779,931 2,919 782,850 77,440
LIABILITIESAccounts payable (Note 4) 688,447 20,233 708,680 115,385Lottery prizes payable — 3,434 3,434 —Due to primary government — — — 4,303Due to other governments 31,440 113 31,553 32Due to component units 1,339 — 1,339 204Due to pension trust funds 32,587 — 32,587 —Advances from primary government — — — 36,595Unearned revenue 30,837 2,205 33,042 92,702Amounts held in custody for others 23,303 30 23,333 14,804Securities lending liability (Note 3) 27,994 211 28,205 669Other liabilities 5,998 2,211 8,209 22,400Short-term debt (Note 11) — 105,065 105,065 —Long-term liabilities (Note 11):
Due within one year 134,190 13,826 148,016 184,054Due in more than one year 364,339 7,327 371,666 1,688,809Net pension liability (Note 6) 2,220,765 11,943 2,232,708 193,190Total OPEB liability (Note 7) 54,009 1,007 55,016 39,694
Total liabilities 3,615,248 167,605 3,782,853 2,392,841
DEFERRED INFLOWS OF RESOURCES (Note 4) 212,056 3,641 215,697 35,704
A-22

PRIMARY GOVERNMENTGOVERNMENTAL BUSINESS-TYPE COMPONENT
ACTIVITIES ACTIVITIES TOTAL UNITSNET POSITION
Net investment in capital assets $ 6,402,612 $ 21,266 $ 6,423,878 $ 685,339Restricted for:
General government 4,691 — 4,691 —Transportation 85,939 — 85,939 —Natural resources 589,869 — 589,869 —Public safety 220,927 — 220,927 —Education 7,214 — 7,214 —Funds held as permanent investments:
Nonexpendable 1,760,945 — 1,760,945 427,988Expendable 546,747 — 546,747 —
Unemployment compensation — 351,527 351,527 —Montana Board of Housing — — — 157,475Other purposes — 90,779 90,779 243,107
Unrestricted (423,017) 18,996 (404,021) 556,953
Total net position $ 9,195,927 $ 482,568 $ 9,678,495 $ 2,070,862
The notes to the financial statements are an integral part of this statement.
A-23

STATEMENT OF ACTIVITIESFOR THE FISCAL YEAR ENDED JUNE 30, 2019 (amounts expressed in thousands)
PROGRAM REVENUESOPERATING CAPITAL
CHARGES GRANTS GRANTS NETFOR AND AND (EXPENSE)
FUNCTIONS/PROGRAMS EXPENSES SERVICES CONTRIBUTIONS CONTRIBUTIONS REVENUEPrimary government:
Governmental activities:General government $ 829,657 $ 185,120 $ 132,246 $ 936 $ (511,355)Public safety 428,514 180,998 55,948 — (191,568)Transportation 547,907 31,019 67,711 500,444 51,267Health and human services 2,680,251 44,517 2,015,043 — (620,691)Education 1,314,785 2,106 199,726 495 (1,112,458)Natural resources 302,680 179,972 141,267 26,025 44,584Interest on long-term debt 5,454 — — — (5,454)
Total governmental activities 6,109,248 623,732 2,611,941 527,900 (2,345,675)
Business-type activities:Unemployment Insurance 108,507 129,394 15,546 — 36,433Liquor Stores 89,971 104,456 — — 14,485State Lottery 48,061 60,269 — — 12,208Municipal Finance Programs 2,937 41 3,199 — 303Hail Insurance 933 1,032 44 — 143Other Service 70,154 25,871 46,114 512 2,343Prison Funds 9,307 7,864 — — (1,443)MUS1 Group Insurance 88,330 97,774 2,722 — 12,166MUS1 Workers Compensation 3,887 — 618 — (3,269)
Total business-type activities 422,087 426,701 68,243 512 73,369Total primary government $ 6,531,335 $ 1,050,433 $ 2,680,184 $ 528,412 $ (2,272,306)
Component units:Montana Board of Housing $ 22,715 $ 1,802 $ 24,873 $ — $ 3,960Facility Finance Authority 696 831 188 — 323Montana State Fund 228,399 161,259 — — (67,140)Montana State University 601,728 288,465 205,073 15,551 (92,639)University of Montana 455,815 180,684 134,960 20,299 (119,872)
Total component units $ 1,309,353 $ 633,041 $ 365,094 $ 35,850 $ (275,368)
A-24

PRIMARY GOVERNMENTGOVERNMENTAL BUSINESS-TYPE COMPONENT
ACTIVITIES ACTIVITIES TOTAL UNITSChanges in net position:
Net (expense) revenue $ (2,345,675) $ 73,369 $ (2,272,306) $ (275,368)General revenues:
Taxes: Property 305,126 — 305,126 — Fuel 261,687 — 261,687 — Natural resource 210,004 — 210,004 — Individual income 1,416,716 — 1,416,716 — Corporate income 186,172 — 186,172 — Other (Note 1) 383,267 30,094 413,361 —
Unrestricted grants and contributions 471 — 471 109Settlements 27,713 — 27,713 —Unrestricted investment earnings 201,926 142 202,068 19,520Transfers from primary government — — — 231,480Gain (loss) on sale of capital assets 7,320 7 7,327 (768)Miscellaneous 10,640 2,249 12,889 479
Contributions to term and permanent endowments — — — 35,873Transfers between primary government 55,786 (55,786) — —
Total general revenues, contributions, and transfers 3,066,828 (23,294) 3,043,534 286,693Change in net position 721,153 50,075 771,228 11,325
Total net position - July 1 - as previously reported 8,444,064 431,486 8,875,550 2,053,358Adjustments to beginning net position (Note 2) 30,710 1,007 31,717 6,179Total net position - July 1 - as adjusted 8,474,774 432,493 8,907,267 2,059,537Total net position - June 30 $ 9,195,927 $ 482,568 $ 9,678,495 $ 2,070,862
1Montana University SystemThe notes to the financial statements are an integral part of this statement.
A-25

BALANCE SHEETGOVERNMENTAL FUNDSJUNE 30, 2019 (amounts expressed in thousands)
SPECIAL REVENUE
GENERAL STATE FEDERALASSETSCash/cash equivalents (Note 3) $ 473,700 $ 807,146 $ 57,604Receivables (net) 292,305 121,979 76,683Interfund loans receivable (Note 12) 73,970 83,777 —Due from other governments 11,894 843 325,648Due from other funds (Note 12) 31,013 10,186 2,886Due from component units — 905 —Inventories 3,501 19,910 —Equity in pooled investments (Note 3) — 366,834 —Long-term loans/notes receivable — 485,826 4,870Advances to other funds (Note 12) 363 39,017 —Advances to component units — 6,888 —Investments (Note 3) 6,559 33,125 746Securities lending collateral (Note 3) — 4,222 —Other assets 2,684 6,174 177
Total assets $ 895,989 $ 1,986,832 $ 468,614
LIABILITIES, DEFERRED INFLOWS OF RESOURCES, AND FUND BALANCESLiabilities:
Accounts payable $ 257,045 $ 174,448 $ 237,821Interfund loans payable (Note 12) — 3,152 152,611Due to other governments 221 29,481 1,739Due to other funds (Note 12) 2,870 13,491 936Due to component units 32,645 309 973Advances from other funds (Note 12) — 6,836 36,209Unearned revenue 2,612 23,312 9,563Amounts held in custody for others 6,720 12,546 3,981Securities lending liability (Note 3) — 4,222 —Other liabilities — 521 —
Total liabilities 302,113 268,318 443,833
DEFERRED INFLOWS OF RESOURCES 150,467 4,680 37,395
Fund balances (Note 14):Nonspendable 4,197 20,806 119Restricted — 1,077,150 —Committed 60,721 615,878 —Assigned 17,178 — —Unassigned 361,313 — (12,733)
Total fund balances 443,409 1,713,834 (12,614)Total liabilities, deferred inflows of resources, and fund balances $ 895,989 $ 1,986,832 $ 468,614
The notes to the financial statements are an integral part of this statement.
A-26
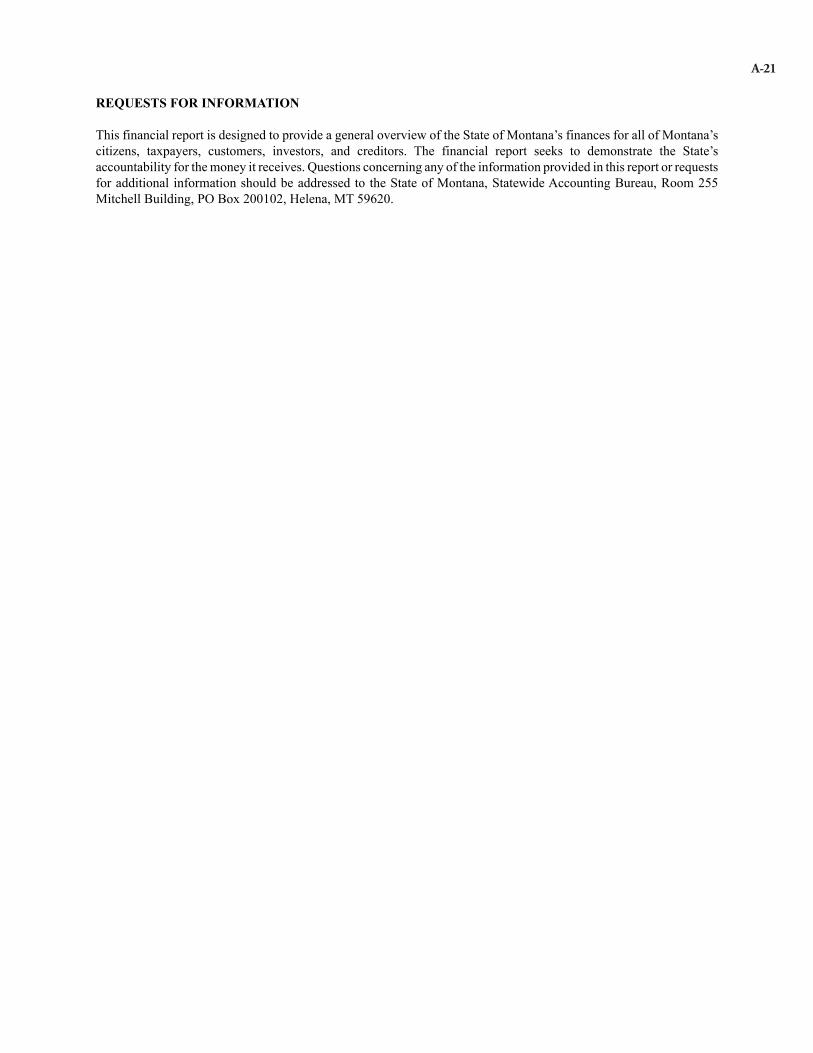
PERMANENTCOAL
SEVERANCE LANDTAX GRANT NONMAJOR TOTAL
$ 53,851 $ 16,870 $ 64,881 $ 1,474,05210,993 2,406 6,872 511,238
— — — 157,747— — — 338,3855 — 1,619 45,709
108 — — 1,013— — — 23,411
925,242 754,949 364,948 2,411,973— — 22,448 513,144
1,725 — 6,773 47,8787,589 — — 14,477
157,935 — — 198,36510,649 8,689 4,200 27,760
— — — 9,035$ 1,168,097 $ 782,914 $ 471,741 $ 5,774,187
$ — $ — $ 2,668 $ 671,9821,678 — 357 157,798
— — — 31,44133 — 703 18,033— — — 33,927— — 7,423 50,468— — — 35,487— 32 25 23,304
10,649 8,689 4,200 27,760— — — 521
12,360 8,721 15,376 1,050,721
— — 311 192,853
622,645 774,193 362,256 1,784,216— — 30,892 1,108,042
533,092 — 62,129 1,271,820— — 805 17,983— — (28) 348,552
1,155,737 774,193 456,054 4,530,613$ 1,168,097 $ 782,914 $ 471,741 $ 5,774,187
A-27

RECONCILIATION OF THE BALANCE SHEET OF GOVERNMENTAL FUNDS TO THESTATEMENT OF NET POSITIONJUNE 30, 2019(amounts expressed in thousands)
Total fund balances - governmental funds $ 4,530,613
Amounts reported for governmental activities in the Statement of Net Position are different due to:
Capital assets used in governmental activities are not current financial resources and therefore notreported in the governmental funds (Note 5):
Depreciable capital assets and infrastructure, net $ 4,303,317Land and nondepreciable capital assets 2,177,168 6,480,485
Deferred outflows of resources represent a consumption of net assets that will be reported as anoutflow of resources in a future period and therefore are not reported in the governmental funds. 779,931
Other assets not available in the current period and therefore are not reported in the governmentalfunds:
Net pension asset 42,459Long-term receivables (363)
Internal service funds are used by management to charge the costs of certain activities, such asinsurance and central computer services, to individual governmental funds. The assets andliabilities and of the internal service funds are included in the governmental activities in theStatement of Net Position, excluding internal service funds' capital assets, deferred outflows ofresources, deferred inflows of resources and long-term liabilities reported in specific areas. 166,913
Other liabilities that are not due and payable in the current period and are not reported in thegovernmental funds. (11,605)
A portion of deferred inflows of resources represents an acquisition of net assets that will berecognized as an inflow of resources in a future period, which differs than that reported in thegovernmental funds. (19,203)
Long-term liabilities and related accrued interest are not due and payable in the current period andtherefore are not reported in the governmental funds (Note 11):
Other long-term liabilities (498,529)Net pension liability (2,220,765)Total OPEB liability (54,009) (2,773,303)
Total net position - governmental activities $ 9,195,927
The notes to the financial statements are an integral part of this statement.
A-28

This page intentionally left blank.
A-29

STATEMENT OF REVENUES, EXPENDITURES, AND CHANGES IN FUND BALANCESGOVERNMENTAL FUNDSFOR THE FISCAL YEAR ENDED JUNE 30, 2019 (amounts expressed in thousands)
SPECIAL REVENUE
GENERAL STATE FEDERALREVENUES (Note 14)Licenses/permits $ 126,135 $ 234,410 $ —Taxes:
Natural resource 86,211 83,705 —Individual income 1,419,959 — —Corporate income 186,012 — —Property 288,070 17,057 —Fuel — 261,290 —Other 241,604 141,023 1
Charges for services/fines/forfeits/settlements 37,153 120,533 6,786Investment earnings 23,647 40,606 599Securities lending income — 110 —Sale of documents/merchandise/property 314 10,374 15Rentals/leases/royalties 10 1,090 —Contributions/premiums 5,833 28,745 —Grants/contracts/donations 8,261 50,158 17Federal 21,475 7,489 2,848,049Federal indirect cost recoveries 157 54,411 82,051Other revenues 5,863 3,488 1,306
Total revenues 2,450,704 1,054,489 2,938,824
EXPENDITURESCurrent:
General government 360,596 196,219 90,512Public safety 313,996 94,379 18,566Transportation — 242,915 116,829Health and human services 526,712 168,847 2,006,938Education 1,036,533 82,462 196,400Natural resources 32,012 194,083 82,386
Debt service:Principal retirement 15 634 39Interest/fiscal charges 216 226 6
Capital outlay 3,579 72,932 398,090Securities lending — 67 —
Total expenditures 2,273,659 1,052,764 2,909,766Excess of revenue over (under) expenditures 177,045 1,725 29,058
OTHER FINANCING SOURCES (USES)Inception of lease/installment contract 234 555 19Insurance proceeds 2 13,783 —General capital asset sale proceeds 89 872 71Refunding bond issued — — —Payment to refunding bond escrow agent — — —Energy conservation loans — 271 —Transfers in (Note 12) 122,579 175,613 2,368Transfers out (Note 12) (58,976) (80,541) (32,086)
Total other financing sources (uses) 63,928 110,553 (29,628)Net change in fund balances 240,973 112,278 (570)Fund balances - July 1 - as previously reported 199,319 1,601,060 (10,069)Adjustments to beginning fund balance (Note 2) 2,819 (624) (1,975)Fund balances - July 1 - as adjusted 202,138 1,600,436 (12,044)Increase (decrease) in inventories 298 1,120 —Fund balances - June 30 $ 443,409 $ 1,713,834 $ (12,614)
The notes to the financial statements are an integral part of this statement.
A-30

PERMANENTCOAL
SEVERANCE LANDTAX GRANT NONMAJOR TOTAL
$ — $ 1,844 $ — $ 362,389
30,638 — 9,389 209,943— — — 1,419,959— — — 186,012— — — 305,127— — — 261,290— — 1,585 384,213— — 11,243 175,715
74,764 56,691 39,122 235,429257 210 98 675— 11,717 — 22,420— 59,126 — 60,226— — — 34,578— 106 — 58,542— — — 2,877,013— — — 136,619— 19 — 10,676
105,659 129,713 61,437 6,740,826
— — 105 647,432— — 244 427,185— — — 359,744— — 1,411 2,703,908— — 12 1,315,407— 4,488 43 313,012
— — 27,180 27,868— — 6,072 6,520— 1,722 16,744 493,067
158 129 60 414158 6,339 51,871 6,294,557
105,501 123,374 9,566 446,269
— — — 808— — — 13,785— 6,976 8 8,016— — 4,575 4,575— — (6,844) (6,844)— — — 271
275 5 39,984 340,824(39,989) (66,359) (20,450) (298,401)(39,714) (59,378) 17,273 63,03465,787 63,996 26,839 509,303
1,089,950 710,197 429,241 4,019,698— — (26) 194
1,089,950 710,197 429,215 4,019,892— — — 1,418
$ 1,155,737 $ 774,193 $ 456,054 $ 4,530,613
A-31

RECONCILIATION OF THE STATEMENT OF REVENUES, EXPENDITURES, AND CHANGES INFUND BALANCES OF GOVERNMENTAL FUNDS TO THE STATEMENT OF ACTIVITIESFOR THE FISCAL YEAR ENDED JUNE 30, 2019(amounts expressed in thousands)
Net change in fund balances - total governmental funds $ 509,303
Amounts reported for governmental activities in the Statement of Activities are different due to:
Capital outlays are reported as expenditures in governmental funds. However, in the Statement ofActivities, these costs are allocated as depreciation expense over the useful life of the capital asset.Capital outlays exceeded depreciation expense in the current year by the following amount (Note 5): Capital outlay $ 493,067 Depreciation expense and amortization (230,093) 262,974
Miscellaneous transactions involving capital assets such as sales (gain/loss) and donations arereported in the Statement of Activities, but only proceeds from sales are reported in the governmentalfunds. (1,635)
Revenues reported in the Statement of Activities that do not provide current financial resources arenot reported as revenues in the governmental funds. 9,660
Internal service funds are used by management to charge the costs of certain activities, such asinsurance and central computer services, to individual governmental funds. Internal service funds arereported separately from governmental funds in the fund financial statements. In the government-wide statements, internal service funds are included with governmental activities. 32,344
Some expenses reported in the Statement of Activities do not require the use of current financialresources and therefore are not reported as expenditures in the governmental funds. Someexpenditures reported in the governmental funds either increase or decrease items reported in theStatement of Net Position. (91,493)
Change in net position - governmental activities $ 721,153
The notes to the financial statements are an integral part of this statement.
A-32

This page intentionally left blank.
A-33

STATEMENT OF FUND NET POSITIONPROPRIETARY FUNDSJUNE 30, 2019 (amounts expressed in thousands)
GOVERNMENTALBUSINESS-TYPE ACTIVITIES - ENTERPRISE FUNDS ACTIVITIES -
UNEMPLOYMENT INSURANCE
MUNICIPALFINANCE
PROGRAMS NONMAJOR TOTALINTERNALSERVICEFUNDS
ASSETSCurrent assets:
Cash/cash equivalents (Note 3) $ 347,980 $ 27,724 $ 119,133 $ 494,837 $ 138,695Receivables (net) (Note 4) 4,738 8,367 30,626 43,731 9,056Interfund loans receivable (Note 12) — — 22 22 44Due from other governments 43 — 166 209 6Due from other funds (Note 12) — 1,846 2 1,848 40Due from component units — 3,228 — 3,228 63Inventories — — 5,022 5,022 4,331Short-term investments (Note 3) — 2,684 — 2,684 —Securities lending collateral (Note 3) — — 211 211 233Other current assets — — 368 368 917
Total current assets 352,761 43,849 155,550 552,160 153,385
Noncurrent assets:Advances to other funds (Note 12) — 5,961 — 5,961 —Advances to component units — 22,119 — 22,119 —Long-term investments (Note 3) — 701 23,284 23,985 34,714Long-term notes/loans receivable 507 39,009 — 39,516 —Other long-term assets — 2,211 1,351 3,562 —Capital assets (Note 5):
Land — — 800 800 —Land improvements — — 3,830 3,830 95Buildings/improvements — — 10,199 10,199 6,069Equipment — 3 9,570 9,573 256,368Infrastructure — — 1,175 1,175 —Construction work in progress — — 6,887 6,887 6,159Intangible assets — — 2,062 2,062 1,093Other capital assets — — 3,640 3,640 —Less accumulated depreciation — (3) (16,880) (16,883) (160,856)
Total capital assets — — 21,283 21,283 108,928Total noncurrent assets 507 70,001 45,918 116,426 143,642
Total assets 353,268 113,850 201,468 668,586 297,027
DEFERRED OUTFLOWS OF RESOURCES (Note 4) — 80 2,839 2,919 12,159
A-34

STATEMENT OF FUND NET POSITIONPROPRIETARY FUNDSJUNE 30, 2019 (amounts expressed in thousands)
GOVERNMENTALBUSINESS-TYPE ACTIVITIES - ENTERPRISE FUNDS ACTIVITIES -
UNEMPLOYMENT INSURANCE
MUNICIPALFINANCE
PROGRAMS NONMAJOR TOTAL
INTERNALSERVICEFUNDS
LIABILITIESCurrent liabilities:
Accounts payable (Note 4) $ 1,741 $ 681 $ 17,811 $ 20,233 $ 14,347Lottery prizes payable — — 2,477 2,477 —Interfund loans payable (Note 12) — — — — 15Due to other governments — — 113 113 —Due to other funds (Note 12) — — 17,691 17,691 1,842Unearned revenue — — 2,205 2,205 1,380Lease/installment purchase payable (Note 10) — — 18 18 3,336Short-term debt (Note 11) — 105,065 — 105,065 —Bonds/notes payable - net (Note 11) — — — — 290Amounts held in custody for others — — 30 30 —Securities lending liability (Note 3) — — 211 211 233Estimated insurance claims (Note 8) — — 12,717 12,717 23,296Compensated absences payable (Note 11) — 19 1,029 1,048 4,135Arbitrage rebate tax payable (Note 11) — 43 — 43 —
Total current liabilities 1,741 105,808 54,302 161,851 48,874
Noncurrent liabilities:Lottery prizes payable — — 957 957 —Advances from other funds (Note 12) — — — — 3,371Lease/installment purchase payable (Note 10) — — — — 8,119Bonds/notes payable - net (Note 11) — — — — 409Estimated insurance claims (Note 8) — — 6,352 6,352 11,757Compensated absences payable (Note 11) — 51 923 974 3,635Arbitrage rebate tax payable (Note 11) — 1 — 1 —Net pension liability (Note 6) — 344 11,599 11,943 52,086Total OPEB liability (Note 7) — 20 987 1,007 3,188Other liabilities — 2,211 — 2,211 —
Total noncurrent liabilities — 2,627 20,818 23,445 82,565Total liabilities 1,741 108,435 75,120 185,296 131,439
DEFERRED INFLOWS OF RESOURCES (Note 4) — 82 3,559 3,641 11,768
NET POSITIONNet investment in capital assets — — 21,266 21,266 92,265Restricted for:
Unemployment compensation 351,527 — — 351,527 —Other purposes — 1,693 89,086 90,779 —
Unrestricted — 3,720 15,276 18,996 73,714Total net position $ 351,527 $ 5,413 $ 125,628 $ 482,568 $ 165,979
The notes to the financial statements are an integral part of this statement.
A-35
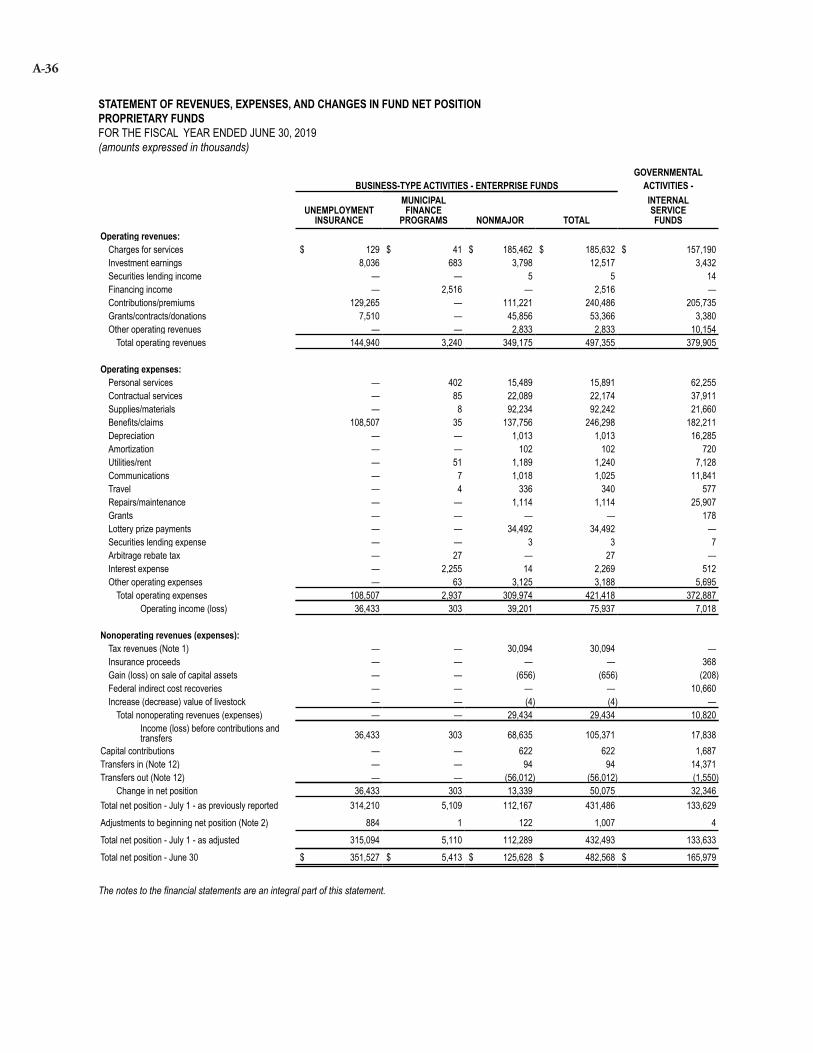
STATEMENT OF REVENUES, EXPENSES, AND CHANGES IN FUND NET POSITIONPROPRIETARY FUNDSFOR THE FISCAL YEAR ENDED JUNE 30, 2019 (amounts expressed in thousands)
GOVERNMENTALBUSINESS-TYPE ACTIVITIES - ENTERPRISE FUNDS ACTIVITIES -
UNEMPLOYMENT INSURANCE
MUNICIPALFINANCE
PROGRAMS NONMAJOR TOTAL
INTERNALSERVICEFUNDS
Operating revenues:Charges for services $ 129 $ 41 $ 185,462 $ 185,632 $ 157,190Investment earnings 8,036 683 3,798 12,517 3,432Securities lending income — — 5 5 14Financing income — 2,516 — 2,516 —Contributions/premiums 129,265 — 111,221 240,486 205,735Grants/contracts/donations 7,510 — 45,856 53,366 3,380Other operating revenues — — 2,833 2,833 10,154
Total operating revenues 144,940 3,240 349,175 497,355 379,905
Operating expenses:Personal services — 402 15,489 15,891 62,255Contractual services — 85 22,089 22,174 37,911Supplies/materials — 8 92,234 92,242 21,660Benefits/claims 108,507 35 137,756 246,298 182,211Depreciation — — 1,013 1,013 16,285Amortization — — 102 102 720Utilities/rent — 51 1,189 1,240 7,128Communications — 7 1,018 1,025 11,841Travel — 4 336 340 577Repairs/maintenance — — 1,114 1,114 25,907Grants — — — — 178Lottery prize payments — — 34,492 34,492 —Securities lending expense — — 3 3 7Arbitrage rebate tax — 27 — 27 —Interest expense — 2,255 14 2,269 512Other operating expenses — 63 3,125 3,188 5,695
Total operating expenses 108,507 2,937 309,974 421,418 372,887Operating income (loss) 36,433 303 39,201 75,937 7,018
Nonoperating revenues (expenses):Tax revenues (Note 1) — — 30,094 30,094 —Insurance proceeds — — — — 368Gain (loss) on sale of capital assets — — (656) (656) (208)Federal indirect cost recoveries — — — — 10,660Increase (decrease) value of livestock — — (4) (4) —
Total nonoperating revenues (expenses) — — 29,434 29,434 10,820Income (loss) before contributions andtransfers 36,433 303 68,635 105,371 17,838
Capital contributions — — 622 622 1,687Transfers in (Note 12) — — 94 94 14,371Transfers out (Note 12) — — (56,012) (56,012) (1,550)
Change in net position 36,433 303 13,339 50,075 32,346Total net position - July 1 - as previously reported 314,210 5,109 112,167 431,486 133,629Adjustments to beginning net position (Note 2) 884 1 122 1,007 4Total net position - July 1 - as adjusted 315,094 5,110 112,289 432,493 133,633Total net position - June 30 $ 351,527 $ 5,413 $ 125,628 $ 482,568 $ 165,979
The notes to the financial statements are an integral part of this statement.
A-36

STATEMENT OF REVENUES, EXPENSES, AND CHANGES IN FUND NET POSITIONPROPRIETARY FUNDSFOR THE FISCAL YEAR ENDED JUNE 30, 2019 (amounts expressed in thousands)
GOVERNMENTALBUSINESS-TYPE ACTIVITIES - ENTERPRISE FUNDS ACTIVITIES -
UNEMPLOYMENT INSURANCE
MUNICIPALFINANCE
PROGRAMS NONMAJOR TOTAL
INTERNALSERVICEFUNDS
Operating revenues:Charges for services $ 129 $ 41 $ 185,462 $ 185,632 $ 157,190Investment earnings 8,036 683 3,798 12,517 3,432Securities lending income — — 5 5 14Financing income — 2,516 — 2,516 —Contributions/premiums 129,265 — 111,221 240,486 205,735Grants/contracts/donations 7,510 — 45,856 53,366 3,380Other operating revenues — — 2,833 2,833 10,154
Total operating revenues 144,940 3,240 349,175 497,355 379,905
Operating expenses:Personal services — 402 15,489 15,891 62,255Contractual services — 85 22,089 22,174 37,911Supplies/materials — 8 92,234 92,242 21,660Benefits/claims 108,507 35 137,756 246,298 182,211Depreciation — — 1,013 1,013 16,285Amortization — — 102 102 720Utilities/rent — 51 1,189 1,240 7,128Communications — 7 1,018 1,025 11,841Travel — 4 336 340 577Repairs/maintenance — — 1,114 1,114 25,907Grants — — — — 178Lottery prize payments — — 34,492 34,492 —Securities lending expense — — 3 3 7Arbitrage rebate tax — 27 — 27 —Interest expense — 2,255 14 2,269 512Other operating expenses — 63 3,125 3,188 5,695
Total operating expenses 108,507 2,937 309,974 421,418 372,887Operating income (loss) 36,433 303 39,201 75,937 7,018
Nonoperating revenues (expenses):Tax revenues (Note 1) — — 30,094 30,094 —Insurance proceeds — — — — 368Gain (loss) on sale of capital assets — — (656) (656) (208)Federal indirect cost recoveries — — — — 10,660Increase (decrease) value of livestock — — (4) (4) —
Total nonoperating revenues (expenses) — — 29,434 29,434 10,820Income (loss) before contributions andtransfers 36,433 303 68,635 105,371 17,838
Capital contributions — — 622 622 1,687Transfers in (Note 12) — — 94 94 14,371Transfers out (Note 12) — — (56,012) (56,012) (1,550)
Change in net position 36,433 303 13,339 50,075 32,346Total net position - July 1 - as previously reported 314,210 5,109 112,167 431,486 133,629Adjustments to beginning net position (Note 2) 884 1 122 1,007 4Total net position - July 1 - as adjusted 315,094 5,110 112,289 432,493 133,633Total net position - June 30 $ 351,527 $ 5,413 $ 125,628 $ 482,568 $ 165,979
The notes to the financial statements are an integral part of this statement.
This page intentionally left blank.
A-37

STATEMENT OF CASH FLOWSPROPRIETARY FUNDSFOR THE FISCAL YEAR ENDED JUNE 30, 2019 (amounts expressed in thousands)
GOVERNMENTAL BUSINESS-TYPE ACTIVITIES - ENTERPRISE FUNDS ACTIVITIES -
MUNICIPAL INTERNAL UNEMPLOYMENT FINANCE SERVICE
INSURANCE PROGRAMS NONMAJOR TOTAL FUNDSCASH FLOWS FROM OPERATING ACTIVITIESReceipt from sales and service $ 130,815 $ 41 $ 297,394 $ 428,250 $ 361,793Payments to suppliers for goods and services (462) (240) (117,386) (118,088) (107,870)Payments to employees — (425) (16,601) (17,026) (66,920)Grant receipts (expenses) 7,489 — 45,784 53,273 3,198Cash payments for claims (109,510) — (137,049) (246,559) (174,849)Cash payments for prizes — — (34,858) (34,858) —Other operating revenues — — 2,833 2,833 20,814Other operating payments — — (3,120) (3,120) (5,696)
Net cash provided by (used for)operating activities 28,332 (624) 36,997 64,705 30,470
CASH FLOWS FROM NONCAPITALFINANCING ACTIVITIESCollection of taxes — — 30,094 30,094 —Transfer to other funds — — (56,015) (56,015) (1,552)Transfer from other funds — — 274 274 14,371Proceeds from interfund loans/advances — (1,788) — (1,788) 44Payment of interfund loans and advances — — (22) (22) (887)Payment of principal and interest on bonds and notes — (435) (14) (449) (1,291)
Net cash provided by (used for)noncapital financing activities — (2,223) (25,683) (27,906) 10,685
CASH FLOWS FROM CAPITAL AND RELATEDFINANCING ACTIVITIESProceeds from insurance — — — — 368Acquisition of capital assets — — (1,480) (1,480) (11,635)Proceeds from sale of capital assets — — 495 495 723
Net cash provided by (used for) capital andrelated financing activities — — (985) (985) (10,544)
CASH FLOWS FROM INVESTING ACTIVITIESSale (purchase) of investments — (8,448) (1,665) (10,113) 11,306Proceeds (loss) on sales or maturities of investments — 10,064 — 10,064 —Proceeds (loss) from securities lending transactions/investments — — 5 5 14Interest and dividends on investments 8,036 666 3,800 12,502 3,432Payment of securities lending costs — — (3) (3) (7)Collections of principal and interest on loans — 31,181 — 31,181 —Cash payment for loans — (26,977) — (26,977) —
Net cash provided by (used for)investing activities 8,036 6,486 2,137 16,659 14,745
Net increase (decrease) in cashand cash equivalents 36,368 3,639 12,466 52,473 45,356
Cash and cash equivalents, July 1 311,612 24,085 106,667 442,364 93,339Cash and cash equivalents, June 30 $ 347,980 $ 27,724 $ 119,133 $ 494,837 $ 138,695
The notes to the financial statements are an integral part of this statement.
A-38

STATEMENT OF CASH FLOWSPROPRIETARY FUNDSFOR THE FISCAL YEAR ENDED JUNE 30, 2019 (amounts expressed in thousands)
GOVERNMENTAL BUSINESS-TYPE ACTIVITIES - ENTERPRISE FUNDS ACTIVITIES -
MUNICIPAL INTERNAL UNEMPLOYMENT FINANCE SERVICE
INSURANCE PROGRAMS NONMAJOR TOTAL FUNDSCASH FLOWS FROM OPERATING ACTIVITIESReceipt from sales and service $ 130,815 $ 41 $ 297,394 $ 428,250 $ 361,793Payments to suppliers for goods and services (462) (240) (117,386) (118,088) (107,870)Payments to employees — (425) (16,601) (17,026) (66,920)Grant receipts (expenses) 7,489 — 45,784 53,273 3,198Cash payments for claims (109,510) — (137,049) (246,559) (174,849)Cash payments for prizes — — (34,858) (34,858) —Other operating revenues — — 2,833 2,833 20,814Other operating payments — — (3,120) (3,120) (5,696)
Net cash provided by (used for)operating activities 28,332 (624) 36,997 64,705 30,470
CASH FLOWS FROM NONCAPITALFINANCING ACTIVITIESCollection of taxes — — 30,094 30,094 —Transfer to other funds — — (56,015) (56,015) (1,552)Transfer from other funds — — 274 274 14,371Proceeds from interfund loans/advances — (1,788) — (1,788) 44Payment of interfund loans and advances — — (22) (22) (887)Payment of principal and interest on bonds and notes — (435) (14) (449) (1,291)
Net cash provided by (used for)noncapital financing activities — (2,223) (25,683) (27,906) 10,685
CASH FLOWS FROM CAPITAL AND RELATEDFINANCING ACTIVITIESProceeds from insurance — — — — 368Acquisition of capital assets — — (1,480) (1,480) (11,635)Proceeds from sale of capital assets — — 495 495 723
Net cash provided by (used for) capital andrelated financing activities — — (985) (985) (10,544)
CASH FLOWS FROM INVESTING ACTIVITIESSale (purchase) of investments — (8,448) (1,665) (10,113) 11,306Proceeds (loss) on sales or maturities of investments — 10,064 — 10,064 —Proceeds (loss) from securities lending transactions/investments — — 5 5 14Interest and dividends on investments 8,036 666 3,800 12,502 3,432Payment of securities lending costs — — (3) (3) (7)Collections of principal and interest on loans — 31,181 — 31,181 —Cash payment for loans — (26,977) — (26,977) —
Net cash provided by (used for)investing activities 8,036 6,486 2,137 16,659 14,745
Net increase (decrease) in cashand cash equivalents 36,368 3,639 12,466 52,473 45,356
Cash and cash equivalents, July 1 311,612 24,085 106,667 442,364 93,339Cash and cash equivalents, June 30 $ 347,980 $ 27,724 $ 119,133 $ 494,837 $ 138,695
The notes to the financial statements are an integral part of this statement.
STATEMENT OF CASH FLOWSPROPRIETARY FUNDSFOR THE FISCAL YEAR ENDED JUNE 30, 2019 (amounts expressed in thousands)
GOVERNMENTAL BUSINESS-TYPE ACTIVITIES - ENTERPRISE FUNDS ACTIVITIES
MUNICIPAL INTERNALUNEMPLOYMENT FINANCE SERVICE
INSURANCE PROGRAMS NONMAJOR TOTAL FUNDSReconciliation of operating income to net
cash provided by operating activities:
Operating income (loss) $ 36,433 $ 303 $ 39,201 $ 75,937 $ 7,018
Adjustments to reconcile operating incometo net cash provided for (used for)operating activities:
Depreciation — — 1,013 1,013 16,285Amortization — — 102 102 720Securities lending expense — — 3 3 7Investment earnings (8,036) (683) (3,800) (12,519) (3,432)Securities lending income — — (5) (5) (14)Financing income — (2,516) — (2,516) —Interest expense — 2,255 14 2,269 512Other revenue — — — — 10,660Change in assets, deferred outflows, liabilities anddeferred inflows:
Decr (Incr) in accounts receivable 417 — 1,273 1,690 (1,389)Decr (Incr) in due from other funds — — 9 9 62Decr (Incr) in due from component units — — — — (27)Decr (Incr) in due from other governments (21) — (71) (92) (4)Decr (Incr) in inventories — — (170) (170) (790)Decr (Incr) in other assets — 5 (458) (453) 291Incr (Decr) in accounts payable (461) 7 (3,098) (3,552) (366)Incr (Decr) in due to other funds — — 4,046 4,046 125Incr (Decr) in due to other governments — — 31 31 —Incr (Decr) in lottery prizes payable — — (366) (366) —Incr (Decr) in unearned revenue — — 6 6 (95)Incr (Decr) in compensated absences payable — 8 (27) (19) 266Incr (Decr) in total OPEB liability — — 64 64 226Incr (Decr) in estimated claims — — 109 109 2,148Incr (Decr) in other payables — (6) (213) (219) (1,648)Incr (Decr) in net pension liability and relatedaccounts — 3 (666) (663) (85)
Net cash provided by (used for)operating activities $ 28,332 $ (624) $ 36,997 $ 64,705 $ 30,470
Schedule of noncash transactions:Capital asset acquisitions from contributed capital $ — $ — $ 622 $ 622 $ 1,687Incr (Decr) in fair value of investments — (18) (903) (921) (1,098)Total noncash transactions $ — $ (18) $ (281) $ (299) $ 589
The notes to the financial statements are an integral part of this statement.
A-39

STATEMENT OF FIDUCIARY NET POSITIONFIDUCIARY FUNDSJUNE 30, 2019 (amounts expressed in thousands)
PENSION(AND OTHEREMPLOYEE PRIVATE INVESTMENTBENEFIT) PURPOSE TRUST AGENCY
TRUST FUNDS TRUST FUNDS FUNDS FUNDS ASSETS
Cash/cash equivalents (Note 3) $ 384,487 $ 76,957 $ 1,375,776 $ 14,747 Receivables (net):
Accounts receivable 21,296 — — 555 Interest 753 40 2,965 — Due from primary government 32,587 — — — Due from other PERB plans 606 — — — Long-term loans/notes receivable 13 — — —
Total receivables 55,255 40 2,965 555 Investments at fair value:
Equity in pooled investments (Note 3) 11,474,079 — 12,562 — Other investments (Note 3) 805,378 170,992 — —
Total investments 12,279,457 170,992 12,562 — Securities lending collateral (Note 3) 54,541 — 145 — Capital Assets:
Land 36 — — — Buildings/improvements 186 — — — Equipment 96 — — — Construction work in progress 1,505 — — — Accumulated depreciation (252) — — — Intangible assets 5,190 — — —
Total capital assets 6,761 — — — Other assets — 39,486 — 254
Total assets 12,780,501 287,475 1,391,448 15,556
DEFERRED OUTFLOWS OF RESOURCES 466 — — —
LIABILITIES Accounts payable 1,943 187 2,922 776 Due to other PERB plans 605 — — — Unearned revenue 434 — — — Amounts held in custody for others — — — 14,780 Securities lending liability (Note 3) 54,541 — 145 — Compensated absences payable 554 — — — Net pension liability (Note 6) 1,469 — — — Total OPEB liability (Note 7) 238 — — —
Total liabilities 59,784 187 3,067 15,556
DEFERRED INFLOWS OF RESOURCES 324 — — —
NET POSITION Held in trust for pension benefits 12,704,134 — — — Held in trust for other purposes 16,725 287,288 1,388,381 —
Total net position $ 12,720,859 $ 287,288 $ 1,388,381 $ —
The notes to the financial statements are an integral part of this statement.
A-40

STATEMENT OF FIDUCIARY NET POSITIONFIDUCIARY FUNDSJUNE 30, 2019 (amounts expressed in thousands)
PENSION(AND OTHEREMPLOYEE PRIVATE INVESTMENTBENEFIT) PURPOSE TRUST AGENCY
TRUST FUNDS TRUST FUNDS FUNDS FUNDS ASSETS
Cash/cash equivalents (Note 3) $ 384,487 $ 76,957 $ 1,375,776 $ 14,747 Receivables (net):
Accounts receivable 21,296 — — 555 Interest 753 40 2,965 — Due from primary government 32,587 — — — Due from other PERB plans 606 — — — Long-term loans/notes receivable 13 — — —
Total receivables 55,255 40 2,965 555 Investments at fair value:
Equity in pooled investments (Note 3) 11,474,079 — 12,562 — Other investments (Note 3) 805,378 170,992 — —
Total investments 12,279,457 170,992 12,562 — Securities lending collateral (Note 3) 54,541 — 145 — Capital Assets:
Land 36 — — — Buildings/improvements 186 — — — Equipment 96 — — — Construction work in progress 1,505 — — — Accumulated depreciation (252) — — — Intangible assets 5,190 — — —
Total capital assets 6,761 — — — Other assets — 39,486 — 254
Total assets 12,780,501 287,475 1,391,448 15,556
DEFERRED OUTFLOWS OF RESOURCES 466 — — —
LIABILITIES Accounts payable 1,943 187 2,922 776 Due to other PERB plans 605 — — — Unearned revenue 434 — — — Amounts held in custody for others — — — 14,780 Securities lending liability (Note 3) 54,541 — 145 — Compensated absences payable 554 — — — Net pension liability (Note 6) 1,469 — — — Total OPEB liability (Note 7) 238 — — —
Total liabilities 59,784 187 3,067 15,556
DEFERRED INFLOWS OF RESOURCES 324 — — —
NET POSITION Held in trust for pension benefits 12,704,134 — — — Held in trust for other purposes 16,725 287,288 1,388,381 —
Total net position $ 12,720,859 $ 287,288 $ 1,388,381 $ —
The notes to the financial statements are an integral part of this statement.
STATEMENT OF CHANGES IN FIDUCIARY NET POSITIONFIDUCIARY FUNDSFOR THE FISCAL YEAR ENDED JUNE 30, 2019 (amounts expressed in thousands)
PENSION(AND OTHEREMPLOYEE PRIVATE INVESTMENTBENEFIT) PURPOSE TRUST
TRUST FUNDS TRUST FUNDS FUNDSADDITIONSContributions/premiums:
Employer $ 258,436 $ — $ —Employee 244,080 — —Other contributions 115,393 18,439 1,497,949
Net investment earnings:Investment earnings 770,064 3,997 30,704Administrative investment expense (73,253) — —
Securities lending income 2,916 — 3Securities lending expense (1,463) — (2)Charges for services 567 — —Other additions 868 7,034 —
Total additions 1,317,608 29,470 1,528,654
DEDUCTIONSBenefits 928,849 — —Refunds 25,585 — —Distributions — 29,337 1,373,628Administrative expenses:
Personal services 5,495 — —Contractual services 3,534 848 —Supplies/materials 260 — —Depreciation 10 — —Amortization 1,288 — —Utilities/rent 374 — —Communications 209 — —Travel 52 — —Repair/maintenance 10 — —Other operating expenses 281 — —
Local assistance 11 — —Transfers to MUS-RP 232 — —Transfers to PERS-DCRP 1,969 — —
Total deductions 968,159 30,185 1,373,628Change in net position 349,449 (715) 155,026
Net position - July 1 - as previously reported 12,371,361 288,003 1,233,355Adjustments to beginning net position (Note 2) 49 — —Net position - July 1 - as adjusted 12,371,410 288,003 1,233,355Net position - June 30 $ 12,720,859 $ 287,288 $ 1,388,381
The notes to the financial statements are an integral part of this statement.
A-41

NOTES TO THE FINANCIAL STATEMENTS
NOTE 1. SUMMARY OF SIGNIFICANT ACCOUNTING POLICIES
The accompanying financial statements for the State of Montana (State) have been prepared in accordance withGenerally Accepted Accounting Principles (GAAP), as prescribed by the Governmental Accounting Standards Board(GASB).
A. Reporting Entity
For financial reporting purposes, the State includes funds that comprise the primary government and its componentunits. The component units are entities that the State is financially accountable for, or whose relationship with the Stateis such that exclusion would cause the State's financial statements to be misleading or incomplete. GASB has set forthcriteria to be considered in determining financial accountability. This criteria includes appointing a voting majority ofan organization's governing body, and (1) the ability of the State to impose its will on that organization or (2) thepotential for the organization to provide specific financial benefits to, or impose specific financial burdens on, the State.
Discretely Presented Component UnitsThese component units are entities that are legally separate from the State because they possess corporate powers, butare financially accountable to the State, or whose relationships with the State are such that exclusion would cause theState's financial statements to be misleading or incomplete. Complete financial statements of the individual componentunits, which issue separate financial statements, can be obtained from their respective administrative offices. Thecondensed financial statements, presented in Note 18, include the financial data of the entities listed below.
Complete financial statements for each of the individual discretely presented component units may be obtained at thefollowing addresses:
Montana Board of Housing301 South Park, Room 240PO Box 200528Helena, MT 59620-0528
Montana State Fund855 Front StreetPO Box 4759Helena, MT 59604-4759
Facility Finance Authority2401 Colonial Drive, 3rd FloorPO Box 200506Helena, MT 59620-0506
Universities and CollegesCommissioner of Higher Education560 North Park Ave, 4th FloorPO Box 203201Helena, MT 59620-3201
Montana Board of Housing (MBOH) – MBOH, which is a legally separate entity, is governed by a quasi-judicial boardappointed by the Governor with the advice and consent of the Senate. The State of Montana has the ability to modifyor approve: the budget; the rate or fee changes affecting revenues; and the ability to appoint, hire, reassign, or dismissthose responsible for the day-to-day operations of MBOH. It was created in 1975 to facilitate the availability of safeand affordable housing to persons and families of lower income. MBOH issues negotiable notes and bonds to fulfillits purposes. The total amount of notes and bonds outstanding at any time may not exceed $1.5 billion. The discountprice of bonds sold, not the face amount of the bonds, counts against this statutory ceiling. Neither the faith and creditnor taxing power of the State of Montana may be pledged for the amounts so issued. MBOH is attached to the State ofMontana, Department of Commerce for administrative purposes only. MBOH is audited annually by the State’sLegislative Audit Division.
Facility Finance Authority (FFA) – FFA, which is a legally separate entity, is governed by a quasi-judicial boardappointed by the Governor with the advice and consent of the Senate. The State of Montana has the ability to modifyor approve: the budget; the rate or fee changes affecting revenues; and the ability to appoint, hire, reassign, or dismissthose responsible for the day-to-day operations of FFA. FFA assists eligible, nonprofit Montana health care and othercommunity-based service providers to obtain and maintain access to the broadest range of low-cost capital financingas possible. FFA issues revenue bonds to fulfill its purposes. Neither the faith and credit or taxing power of the State
A-42

of Montana may be pledged for the amounts so issued. FFA is attached to the State of Montana, Department of Commercefor administrative purposes only. Individual financial reports are issued every two years and are audited by the State’sLegislative Audit Division.
Montana State Fund (MSF) – MSF is a nonprofit, independent public corporation established under Title 39, Chapter71 of the Montana Code Annotated (MCA). MSF provides Montana employers with an option for workers’ compensationand occupational disease insurance and guarantees available coverage for all employers in Montana. MSF is governedby a seven member Board of Directors appointed by the Governor with the advice and consent of the Senate. ThisBoard has full power, authority, and jurisdiction in the administration of MSF. MSF's results are included in the State'sComprehensive Annual Financial Report because of the significance of MSF's financial relationship with the State.MSF's board is allocated to the State of Montana, Department of Administration for administrative purposes only. MSFis reported on a calendar year basis and is audited annually by the State’s Legislative Audit Division and is also regulatedby the Montana State Auditor's Office as an authorized insurer that is subject to the provisions of Title 33, MontanaInsurance Code.
MSF functions as an autonomous insurance entity supported solely from its own revenues. All assets, debts, andobligations of MSF are separate and distinct from assets, debts, and obligations of the State of Montana. If MSF isdissolved by an act of law, the assets held by MSF are subject to the disposition provided by the Legislature enactingthe dissolution with due regard given to obligations incurred and existing (Section 39-71-2322, MCA).
MSF handles the administration of the claims of Montana State Fund and State of Montana (Old Fund) including:determining who a claimant is; what, if any, claims will be paid; and the amount of claims allowed to be paid. Old Fundcovers workers’ compensation claims that were incurred before July 1, 1990, and is reported within the governmentalactivities of the primary government, on the government-wide financial statements.
Universities and Colleges – The Montana Constitution, Article X, Section 9, grants governance authority over theMontana University System (MUS) to the Board of Regents (Board), with seven members appointed by the Governorand confirmed by the Senate. All state funds appropriated by the Legislature to the Board for the support of the MUSare channeled through the Office of the Commissioner of Higher Education (OCHE). The Constitution charges theBoard with hiring a Commissioner of Higher Education who serves as its executive staff. OCHE is the state-leveladministrative organization of the MUS.
The Board has responsibility for the following institutions: Montana State University - Bozeman and the units underit including Montana State University - Billings, Montana State University - Northern, and Great Falls College MontanaState University; and University of Montana - Missoula and the units under it including Montana TechnologicalUniversity, University of Montana - Western, and Helena College University of Montana. All units are funded throughstate appropriations, tuition, federal grants, and private donations and grants. The universities are audited annually bythe State’s Legislative Audit Division.
Though the following organizations perform functions related to the MUS, they are not considered part of Montana'sreporting entity: (1) Community Colleges which are considered part of local units of government; (2) the MontanaHigher Education Student Assistance Corporation, a private nonprofit corporation; and (3) the Student AssistanceFoundation of Montana, a private nonprofit corporation. Entities such as local school districts and local authorities ofvarious kinds are considered part of local units of government and have not been included. The state and federal supportof local public education systems is reported in the General Fund, the State Special Revenue Fund, and Federal SpecialRevenue Fund.
Fiduciary Fund Component UnitsComplete financial statements for each of the individual fiduciary fund component units may be obtained at the followingaddresses:
Teachers’ Retirement System100 North Park Avenue, Suite 110PO Box 200139Helena, MT 59620-0139
Public Employees’ Retirement Board100 North Park, Suite 200PO Box 200131Helena, MT 59620-0131
A-43

Teachers’ Retirement System (Pension Trust Fund) – This retirement plan is a legally separate entity with a boardappointed by the Governor. Its purpose is to provide retirement, disability, death and lump-sum payments to benefitrecipients of Montana's public teaching profession. The plan is funded from employer and employee contributions,investment earnings, and the State’s General Fund. The benefit payments and administrative costs of the Teachers’Retirement System are paid from the same funding sources. The system is audited annually by the State’s LegislativeAudit Division. Further detail related to the Teachers’ Retirement System is provided in Note 6.
Public Employees’ Retirement Board (Pension and Other Employee Benefit Trust Funds) – The Public Employees’Retirement Board (PERB) is appointed by the Governor and administers ten separate plans for the purpose of providingretirement, disability, death, and lump-sum payments to plan members. These legally separate plans include the PublicEmployees’ Retirement Plan – Defined Benefit and Defined Contribution and the associated education funds; theJudges’; the Highway Patrol Officers’; the Sheriffs’; the Game Wardens’ and Peace Officers’; the Municipal PoliceOfficers’; the Firefighters’ Unified Retirement Systems; the Volunteer Firefighters’ Compensation Act; and the Stateof Montana Deferred Compensation Program (457 Plan) retirement plans. The board also administers an Other PostEmployment Benefit (OPEB) disability plan on behalf of Public Employees’ Retirement Plan-Defined Contributionmembers.
PERB is responsible for the ten separate public employee plans, which includes the Deferred Compensation Program,and a separate Other Post Employment Benefit plan. These are reported as pension and other employee benefit trustfunds. The board is audited annually by the State’s Legislative Audit Division. Further detail related to the PERB isprovided in Note 6 and its OPEB plan information is provided in Note 7.
B. Government-wide and Fund Financial Statements
The government-wide financial statements, Statement of Net Position and Statement of Activities, report informationon all of the non-fiduciary activities of the State of Montana and its component units. For the most part, the impact ofinterfund activity has been removed from these statements. Governmental activities, which are normally supported byfees, taxes, and intergovernmental revenues, are reported separately from business-type activities, which rely to asignificant extent on fees and charges for support. Likewise, the State of Montana is reported separately from certainlegally separate component units for which the State is financially accountable.
The Statement of Activities demonstrates the degree to which the direct expenses of a function are offset by programrevenues. Direct expenses are those that are clearly identifiable with a specific function. Certain indirect costs areincluded in the program expense reported for the individual functions and activities. Program revenues include (1)charges to customers or applicants who purchase, use, or directly benefit from goods, services, or privileges providedby a given function; and (2) grants and contributions restricted to meeting the operational or capital requirements of aparticular function. Taxes and other revenues not meeting the definition of program revenues are reported as generalrevenues. The State does not allocate indirect expenses to functions in the Statement of Activities.
Separate fund financial statements are provided for governmental, proprietary, and fiduciary funds. Major individualgovernmental and major individual enterprise funds are reported as separate columns in the fund financial statements.Fiduciary fund statements are reported only in the fund financial statements.
C. Measurement Focus, Basis of Accounting, and Financial Statement Presentation
Government-wide, Proprietary, and Fiduciary Fund Financial StatementsThe government-wide, proprietary fund, and fiduciary fund financial statements are reported using the economicresources measurement focus and the accrual basis of accounting. Revenues are reported when earned; expenses arerecorded when a liability is incurred regardless of the timing of the related cash flows. Property taxes are recognizedas revenues in the year for which they are levied. Grants and similar items are recognized as revenues as soon as all ofthe eligibility requirements imposed by the provider are met. Agency funds report only assets and liabilities, recognizingreceivables and payables using the accrual basis of accounting.
As a general rule, material interfund revenues and expenses have been eliminated from the government-wide financialstatements. These have not been eliminated where their elimination would distort the direct costs and program revenuesof the functions involved.
A-44

Governmental Fund Financial StatementsGovernmental fund financial statements are reported using the current financial resources measurement focus and themodified accrual basis of accounting. Revenues are recognized when they are realizable, measurable, earned, andavailable. Revenue is considered realizable when it is probable the amount will be collected. Revenue is consideredmeasurable and realizable if the precise amount is known because the transaction is completed, or if there is enoughinformation to provide a reasonable estimate of the net realizable revenue to be received. Revenue is considered tohave been earned when the exchange of goods or services has taken place. Revenue is considered to be available if itis collectible within the current period, or soon enough thereafter, to pay liabilities of the current period. For this purpose,the State considers revenue available if it is expected to be collected within 60 days of the end of the current fiscalperiod. Expenditures generally are recorded when a liability is incurred, as under accrual accounting. However, debtservice expenditures as well as expenditures relating to compensated absences, claims, and judgments are recordedonly when payment is due.
The major revenue sources considered susceptible to accrual are licenses and permits, natural resource taxes, individualincome taxes, corporate income taxes, property taxes, fuel taxes, and certain federal revenues (reimbursable grants andU.S. mineral royalties). All other revenue is considered to be measurable and available when the cash is received.
Fund Financial StatementsThe State uses funds to report on its financial position and the results of its operations. A fund is a separate accountingentity with a self-balancing set of accounts. Fund accounting is designed to demonstrate legal compliance and to aidfinancial management by segregating transactions related to certain government functions or activities.
The financial activities of the State of Montana are classified into fund categories as described below:
Governmental FundsGeneral Fund – To account for all governmental financial resources, except those required to be accounted for in anotherfund.
Special Revenue Funds – To account for the proceeds of specific revenue sources restricted to expenditure for specifiedpurposes other than major capital projects. (1) The State Special Revenue Fund accounts for activities funded fromstate resources used to account for and report the proceeds of specific revenue sources that are restricted or committedto expenditure for specified purposes other than debt service or capital projects. Several funds are defined in statute asPermanent Funds, however per GASB Statement No. 54, Fund Balance Reporting and Governmental Fund TypeDefinitions (GASB 54), these funds should be reported within the State Special Revenue Fund. The respective effecton fund balance is approximately an $90.8 million increase. One specific fund is defined in statute as a Federal SpecialRevenue Fund, however per GASB 54, this fund should be reported within the State Special Revenue Fund. Therespective effect on fund balance is approximately a $25.3 million increase. (2) The Federal Special Revenue Fundaccounts for activities funded from federal sources used in the operation of state government.
Debt Service Funds – To account for resources accumulated for payment of principal and interest on general long-termobligation debt.
Capital Projects Funds – To account for resources used for the acquisition or construction of major capital facilities,other than those financed by proprietary or trust funds.
Permanent Funds – To account for resources that are permanently restricted to the extent that only earnings, not principal,may be used for the purposes of supporting the government’s programs. Several funds are defined in statute as PermanentFunds, however per GASB 54 these funds should be reported within the State Special Revenue Fund.
Proprietary FundsEnterprise Funds – To account for operations: (1) financed and operated similar to private business enterprises, wherethe intent of the Legislature is to finance or recover costs primarily through user charges; (2) where the Legislature hasdecided periodic determination of revenue earned, expenses incurred, or net income is appropriate; (3) where the activityis financed solely by a pledge of the net revenues from fees and charges of the activity; or (4) when laws or regulationsrequire that the activities’ costs of providing services, including capital costs, be recovered with fees and charges ratherthan with taxes or similar revenues. The primary focus of fee revenues charged by enterprise funds is users outside ofthe primary government. One specific fund is defined in statute as an Enterprise Fund, however, per GASB 34, this
A-45

fund should be reported within Internal Service Funds. The respective effect on net position is approximately a $4.8million increase.
Internal Service Funds – To account for the financing of goods and services provided by one department or agency toother departments, agencies, or other governmental entities on a cost-reimbursement basis.
The State of Montana reports two employee group benefits funds. The MUS Group Insurance Fund primarily chargesits fees to Montana State University and the University of Montana. The universities are reported as discretely presentedcomponent units, which the State considers to be external users, and as such, reports the MUS Group Insurance Fundas an enterprise fund. The Employee Group Benefits Fund charges its fees to funds of the primary government, and assuch, is reported as an internal service fund.
Fiduciary FundsFiduciary Funds are used to account for assets held by the State in a trustee capacity or as an agent for individuals,private organizations, or other governments. These assets cannot be used to support the government’s own programs.
Pension (and Other Employee Benefit) Trust Funds – To account for resources that are required to be held in trust forthe members and beneficiaries of the State’s defined benefit plans, defined contribution plans, other retirement plans,and other post employment benefit plan. Plan members receive retirement, disability, death, and lump-sum paymentsfrom the fund. Further detail related to the individual plans is provided in Note 6 and Note 7.
Private-Purpose Trust Funds –To account for assets held by the State in a trustee capacity, where both the principal andearnings benefit individuals, private organizations, or other governments. Examples include the State’s escheatedproperty fund, unliquidated security bonds held on deposit from self-insured employers, environmental reclamation,and bonds held in trust.
Investment Trust Fund – To account for the receipt of monies and the distribution of related investment earnings tolocal government agencies by the Montana Board of Investments for investment in the Short Term Investment Pool(STIP) and Trust Fund Investment Pool (TFIP).
Agency Funds – To account for assets held by the State as an agent for individuals, private organizations, and othergovernments. For example, various agencies hold deposits pending compliance with performance agreements. Otherexamples include monies belonging to state institution residents and child support payments from parents.
Major Governmental FundsThe General Fund is the State’s primary operating fund, as previously defined.
The State Special Revenue Fund accounts for activities funded from state sources, which are restricted either legallyor administratively for particular costs of an agency, program, or function.
The Federal Special Revenue Fund accounts for activities funded from federal sources used in the operation of stategovernment.
The Coal Severance Tax Fund, created by Article IX, Section 5 of the Montana State Constitution, receives 50% of allcoal tax collections. The principal in this fund can be expended only upon affirmative vote of three-fourths of eachhouse of the Legislature.
The Land Grant Permanent Fund accounts for lands granted to the State for support of public schools and stateinstitutions.
Major Enterprise FundsThe Unemployment Insurance Fund accounts for employer contributions deposited with the Secretary of the Treasuryof the United States to the credit of the State’s unemployment trust fund. Unemployment benefits are paid from thisfund to eligible recipients.
The Board of Investments (BOI) Municipal Finance Programs Fund accounts for the programs created under theMunicipal Finance Consolidation Act (MFCA) and the Economic Development Act. Primarily, this involves a MFCArevolving loan program that provides variable low interest rate loans to eligible Montana State agencies, universities,and local governments for a variety of projects statutorily defined. The funding for the revolving loan program is
A-46

from the issuance of put bonds. The MFCA program also provides local government entities access to tax-exemptfunds through the issuance of conduit (no-commitment) debt. In previous years this activity was referred to as theEconomic Development Bonds Fund. Separately issued financial statements may be obtained by contacting theMontana Board of Investments, 2401 Colonial Drive, 3rd Floor, PO Box 200126, Helena, MT 59620-0126.
D. Proprietary Activity Accounting and Financial Reporting
Proprietary funds distinguish operating revenues and expenses from non-operating items. Operating revenues generallyresult from providing services and delivering goods in connection with a proprietary fund’s principal ongoing operations.Operating expenses for enterprise and internal service funds include the cost of sales and services, administrativeexpenses, and depreciation on capital assets. All revenues and expenses not meeting these definitions are reported asnon-operating.
E. Cash/Cash Equivalents
For all funds, cash and cash equivalents consist of amounts deposited in the State Treasurer’s pooled cash account,cash deposits in checking accounts, cash invested in the Short Term Investment Pool (STIP), cash held by trustees,undeposited cash held by individual state agencies, and investments categorized as cash equivalents, which are short-term, highly liquid investments with original maturities of three months or less. Further detail related to cash and cashequivalents is provided in Note 3.
F. Receivables
This classification, net of estimated uncollectibles, consists primarily of receivables for goods sold and services provided,short-term loans and notes, interest and dividends, taxes due within 60 days of fiscal year-end, and income, withholding,and inheritance taxes that are past due. An allowance for uncollectible taxes is provided based upon historical analysis.Further detail related to receivables is provided in Note 4.
G. Inventories
Inventories of materials and supplies are reported at cost. The State allows agencies to use any generally acceptedinventory pricing method, but specifies the first-in, first-out method generally to be appropriate for most agencies.Governmental funds use the "purchase method," meaning inventory purchases are recorded as expenditures. At fiscalyear-end, inventory balances are shown as nonspendable, indicating they do not constitute available expendableresources. Proprietary and fiduciary funds report using the "consumption method," meaning inventories are expensedas used.
H. Equity in Pooled Investments
To account for equity in pooled investments, BOI uses one internal investment pool and one external investment pool.The internal investment pool is the Consolidated Asset Pension Pool (CAPP). The State's nine defined benefit pensiontrust funds are the only participants in CAPP. The external investment pool is the Trust Funds Investment Pool (TFIP).State agencies and qualifying local government can participate in TFIP. Current State agency TFIP participation iswithin the enterprise funds, internal service funds, permanent funds, investment trust funds, Montana University SystemUnits, and specific accounts established within the State and Federal Special Revenue Funds. The participant investmentsin the pools are reported at fair value in the assets within the individual funds. Further detail related to cash and cashequivalents and investments is provided in Note 3.
I. Investments
For agencies whose investment needs are not met by BOI’s established investment pools, BOI provides separateinvestments, which are combined and reported as Separately Managed Investments (SMI). SMI participants have directfixed income, equity, and Montana mortgage and loan investments. SMI investments are reported at fair value. Certainsecurities including asset-backed securities, variable-rate instruments, zero-coupon bonds, preferred stocks, andmortgage-backed securities are purchased for portfolio diversification and a competitive rate of return. Other Stateagencies, on a limited basis by statute, may administer other long-term investments. Most investments are reported atfair value on the Statement of Net Position. Further detail related to investments is provided in Note 3.
A-47

J. Capital Assets
Capital asset valuation is based on actual historical cost or, in the case of donations, acquisition value. Generalgovernment infrastructure capital assets are capitalized and reported on the government-wide financial statements.Infrastructure assets of proprietary funds are capitalized on the fund financial statements. Interest incurred during theconstruction of capital assets for proprietary funds is capitalized. Interest incurred during the construction of capitalassets for higher education component units is expensed. The State has chosen to use the depreciation approach forinfrastructure assets and is reporting accumulated depreciation on the Statement of Net Position and depreciationexpense on the Statement of Activities for these assets. Further detail related to capital assets is provided in Note 5.
Capital assets in proprietary, private-purpose trust, and pension trust funds are accounted for within their respectivefunds and are depreciated or amortized. Depreciation is on a straight-line basis with estimated useful lives of 25 to 60years for buildings, 10 to 50 years for infrastructure, 7 to 20 years for building improvements, and 3 to 10 years forequipment. State agencies are also required to extend or shorten the useful lives of capital assets to reflect their actualexperience or industry standards when appropriate. Amortization is on a straight-line basis with estimated useful livesof 4 years for software (internally and externally generated), 30 years for land use rights, and 20 years for otherintangibles.
The capitalization limit for buildings and building/land improvements is $25,000. The capitalization threshold forinfrastructure and internally-generated software is $500,000. The capitalization threshold for intangible assets is$100,000. The capitalization limit for other capital assets is $5,000. Agencies are allowed to capitalize additions tocollections and land acquisitions at any cost. Purchases under these thresholds are recorded as expenditures/expensesin the current period.
K. Deferred Outflows, Deferred Inflows, and Unearned Revenue
A deferred outflow of resources is a consumption of net assets by the government that is applicable to a future reportingperiod. A deferred inflow of resources is an acquisition of net assets by the government that is applicable to a futurereporting period. Deferred outflows and inflows of resources may include financial transactions related to refundingdebt, non-exchange transactions, derivative investment, OPEB, and pension related components and are reported onthe government-wide, proprietary fund, and fiduciary fund financial statements. Additionally, deferred inflows ofresources may include financial transactions related to unavailable revenue on the governmental fund financialstatements. Unavailable revenue is reported when assets are recognized, but those assets are not considered availableto pay liabilities of the current period. Unearned revenue is recognized as a liability on government-wide, governmentaland proprietary fund financial statements. Further detail related to deferred outflows of resources and deferred inflowsof resources is provided in Note 4.
L. Long-term Obligations
Long-term obligations expected to be financed from governmental funds are reported on the government-wide financialstatements. Long-term debt is recognized as a liability of a governmental fund when due, or when resources have beenaccumulated in the debt service fund for payment early in the following year. For other long-term obligations, onlythat portion expected to be financed from current expendable available financial resources is reported as a fund liabilityof a governmental fund on the fund financial statements. The remaining portion of such obligations is reported on thegovernment-wide financial statements. Long-term liabilities expected to be financed from proprietary and fiduciaryfund operations are accounted for in those funds. Further detail related to leases/installment purchases payable andlong-term liabilities is provided in Note 10 and Note 11, respectively.
M. Capital Leases
A capital lease is a lease which transfers benefits and risks of ownership to the lessee. At the inception of a capital lease,on the government-wide, proprietary fund, and fiduciary fund financial statements, a capital asset and a capital leaseliability are recorded at the present value of the future minimum lease payments. On the governmental fund financialstatements no asset or liability is recorded related to assets under capital leases. Rather, on the governmental fundfinancial statements, at the inception of a capital lease, capital outlay expenditures, and other financing sources (inceptionof lease/installment contract) are recorded at the net present value of the minimum lease payments. Further detail relatedto capital leases is provided in Note 10.
A-48

N. Bond Discounts/Premiums/Issuance Costs
Bond premiums and discounts, as well as issuance costs, are recognized in the period they are incurred. Bond proceedsand bond premiums are reported as an other financing source, and bond discounts are reported as an other financinguse. Issuance costs are reported as debt service expenditures whether or not they are withheld from the bond proceeds.Bonds payable are recorded net of any applicable premium or discount. Further detail related to long-term debt isprovided in Note 11.
O. Compensated Absences
Full-time state employees earn vacation leave ranging from 15 to 24 days per year depending on the individual's yearsof service. Teachers employed by the State do not receive vacation leave. Vacation leave may be accumulated andcarried over from one year to the next. The carryover is limited to two times the maximum number of days earnedannually. Sick leave is earned at the rate of 12 days per year with no limit on accumulation. Each contribution year, anemployee may contribute a maximum of 80 hours of sick or annual leave to a nonrefundable sick leave pool. Excessannual leave that is being forfeited can also be contributed, with no maximum contribution. The adjusted ending balanceof the pool for June 30, 2018, was 19,310 hours. For fiscal year 2019, 1,708 sick leave hours, 152 annual leave hours,and 305 excess annual leave hours were contributed to the sick leave pool, and 3,491 hours were withdrawn, leavinga balance of 17,984 hours in the pool. The liability associated with the pool is not reported in the accompanying financialstatements because these hours are nonrefundable to contributors, except by grants approved through an applicationprocess.
Vested or accumulated leave for proprietary and fiduciary funds is recorded as an expense and liability of those fundsin the fund financial statements. For governmental funds, the liability is not expected to be liquidated with expendablefinancial resources. The expenditure and liability for the governmental funds is reported only on the government-widefinancial statements. Upon retirement or termination, an employee is paid for 100% of unused vacation leave and 25%of unused sick leave. Further detail related to compensated absences is provided in Note 11.
P. Nonexchange Financial Guarantee
BOI provides loan guarantees from the Coal Severance Tax Fund to the Facility Finance Authority (FFA), a discretelypresented component unit of the State. BOI exposure to bond issues, surety bonds, and designated loans of the FFAtotaled $88.9 million as of June 30, 2019. FFA guarantee requests are submitted to BOI for review and approval. BOI’sparticipation, either duration or any other consideration, to either purchase bonds or loans or to lend money for depositinto FFA’s statutorily allowed capital reserve account is explicitly limited by statute which requires BOI to act prudently.The guarantee requests from FFA pertain to bonds issued by FFA with a term of up to 40 years. BOI and FFA haveentered into an agreement detailing repayment to BOI. BOI has not had to perform on any loan guarantee in the past.
Q. Fund Balance/Net Position
Fund BalanceThe classifications for fund balance used for governmental funds are reported in two general classifications,nonspendable and spendable. Nonspendable represents the portion of fund balance that is legally or contractuallyrequired to remain intact or is not in spendable form such as inventories, and, in the General Fund, long-term notes andloans receivable. Spendable fund balance is further categorized as restricted, committed, assigned, and unassigned.
The restricted fund balance category includes amounts that can be spent only for the specific purposes stipulated bythe State Constitution or external parties, such as the federal government, or through enabling legislation. For thepurpose of determining restricted amounts, enabling legislation does not include commitments resulting from Statelegislation if these constraints can be removed or changed by a similar legislative action.
The committed fund balance classification includes amounts that can be used only for the specific purposes determinedby a formal action of the government’s highest level of decision-making authority, the State’s Legislature, throughlegislation passed into law.
Amounts, in the assigned fund balance classification, are intended to be used by the government for specific purposes,but they do not meet the criteria to be classified as restricted or committed. Assignments of fund balance are createdby the executive branch. In governmental funds other than the General Fund, assigned fund balance also represents the
A-49

remaining amount that is not restricted or committed. The assigned fund balance for the General Fund are encumbrancesand assignments for the portion of current General Fund balance that is projected to be used to fund expenditures andother cash outflows in excess of the expected revenues and other cash inflows in fiscal years as needed. There is not aprojected spend down for fiscal year 2020, thus a related assignment of fund balance is not reported at 2019 fiscal year-end.
Unassigned fund balance is the residual classification for the General Fund and includes all spendable amounts notcontained in the other classifications. In other funds, the unassigned classification should be used only to report a deficitbalance resulting from overspending for specific purposes for which amounts had been restricted, committed, orassigned.
The State generally segregates restricted, committed, and assigned resources by account (sub-fund) within thegovernmental funds, other than the General Fund. When resources meeting more than one of these spendableclassifications are commingled in an account on the State’s accounting system the assumed order of spending is restrictedfirst, committed second, and finally assigned. State statute requires non-General Fund money be spent first wheneverpossible so any related available unassigned balance would be spent last.
General Fund - Fund BalanceAs of June 30, 2019, the State maintains a Budget Stabilization Reserve Fund as required by statute. For financialreporting purposes, this fund is combined with the General Fund as it does not meet the GASB 54 requirements to bea special revenue fund as the Legislature prescribed. The June 30, 2019, committed fund balance in the General Fundof $60.7 million, represents the Budget Stabilization Reserve Fund balance. Additionally, another $57.1 million wastransferred to the Budget Stabilization Reserve Fund after the close of fiscal year 2019, in accordance with 2019 SessionHouse Bill requirements.
Additionally, statute provides a minimum fund balance amount as follows: Section 17-7-140, MCA, defines minimumending fund balance and specifies the procedures that must be followed to make expenditure reductions or allow transfersfrom the Budget Stabilization Reserve Fund if a projected ending fund balance drops below minimum statutoryrequirements.
If the Budget Director determines that a deficit exists, statute requires reductions that must be made to assure that theprojected ending fund balance is in compliance with the minimum ending fund balance of General Fund appropriationsfor the biennium. Under circumstances when a deficit of this level is projected during a biennium, the Governor maydirect reductions from any General Fund expenditure not exempted by Section 17-7-140, MCA, including House Bill(HB) 2 (the State’s main appropriation bill), any other appropriation bills, statutory appropriations, or languageappropriations. Reductions may not exceed 10% of General Fund appropriations for any single “program,” as definedin HB 2. If a program has more than one appropriation, the reduction for one or more of the appropriations may exceed10% as long as the reduction for the program as a whole does not exceed 10%.
The Legislative and Judicial branches, the Montana School for the Deaf and Blind, principal and interest on State debt,salaries of elected officials, and public school BASE funding are exempt, statutorily, from reductions. These exemptionsshield approximately one-third of General Fund appropriations from reduction. Of the remaining expenditures, theGovernor may not direct executive agencies headed by elected officials or the Board of Regents to reduce theirexpenditures by more than the average reduction percentage imposed upon all other executive branch agencies.
Net PositionIn funds other than governmental, net position represents the difference between assets plus deferred outflows ofresources and liabilities plus deferred inflows of resources. The net investment in the capital assets portion of netposition consists of capital assets, net of accumulated depreciation, reduced by the outstanding balances of any borrowingused for the acquisition, construction, or improvement of those assets. Net position is reported as restricted when thereare limitations imposed on their use either through constitutional provisions, enabling legislation or through externalrestrictions imposed by creditors, grantors, or laws or regulations of other governments. The government-wide Statementof Net Position reported restricted net position of $3.7 billion.
A-50

Certain investments of the Municipal Finance Programs Fund are classified as restricted net position on the Statementof Fund Net Position for proprietary funds because their use is limited by applicable bond indenture agreements. Netposition associated with the Unemployment Insurance Fund is also classified as restricted.
R. Property Taxes
Real property taxes are normally levied in October and are usually payable in two installments on November 30 andMay 31. These taxes attach as an enforceable lien immediately if not paid when due.
Personal property tax levies are set each August, and notices are normally mailed the following March or April. Halfof mobile home taxes are due in 30 days and the remaining half on September 30. Taxes on all other types of personalproperty are to be paid in full 30 days after receipt of the notice. Property tax payments are recognized as deferredinflows of resources if received prior to levy or availability.
Personal property taxes attach as an enforceable lien immediately if not paid when due. Property taxes are collectedby each of Montana's 56 counties. The counties then remit the State's portion to the State Treasury. The majority ofthese taxes help fund public school systems and higher education.
S. Other Taxes
On the Statement of Activities, the revenue category “Other Taxes” consists of the following taxes (in thousands):
General FundState Special
Revenue
OtherGovernmental
FundsBusiness-Type
Funds TotalAccommodations $ 27,389 $ 36,590 $ — $ 26 $ 64,005Agriculture — 10,406 — — 10,406Car rental 4,376 1,459 — — 5,835Cigarette/tobacco/etc. 33,307 43,886 1,585 — 78,778Contractors gross receipts 3,597 — — — 3,597Energy tax 7,456 38 — — 7,494Fire protection — 3,921 — — 3,921Hospital benefit assessment 4,350 — — — 4,350Insurance premium 76,108 31,162 — — 107,270Light vehicle registration — 4,234 — — 4,234Liquor tax 5,517 2,227 — 30,068 37,812Livestock — 4,896 — — 4,896Other taxes 154 742 — — 896Public service commission — 2,296 — — 2,296Railroad car companies 3,595 — — — 3,595Telephone license 10,804 — — — 10,804Video gaming 63,168 4 — — 63,172
Total other taxes $ 239,821 $ 141,861 $ 1,585 $ 30,094 $ 413,361
T. Tax Abatements
In the Montana Board of Investment’s (BOI) Commercial Loan Program within the SMI, by statute, the infrastructureloan program is funded by an $80.0 million allocation. Eligible local governments request a loan for constructing orpurchasing infrastructure to be used by a basic sector business. The basic sector business will pay a user fee to the localgovernment that is pledged to BOI for the loan repayment. BOI reviews each loan and, only upon verification that theentities meet the loan requirements, is the loan approved by BOI. The local government entity must pass a resolutionauthorizing the acceptance of the commitment agreement. BOI indemnifies the local government regarding repaymentof the loan.
A-51

To be eligible for the program, the basic sector business must create at least 15 full-time basic sector jobs. The maximumloan size is $16.7 thousand times the number of full-time jobs created and the minimum loan size is $250.0 thousand.The maximum loan term is 25 years. There is also up to a 2.5% interest rate reduction for job creation. The reductionwill be reflected in the user fee rate charged to the basic sector business upon BOI review and approval. The basicsector business must create the required jobs within four years of the agreement. If the basic sector business does notcreate the required jobs within the four-year period, then the basic sector business must pay down the loan balance ofthe local government entity until the loan balance matches the eligible amount per the jobs created. BOI may increasethe interest rate commensurate with the number of jobs eliminated if the borrower eliminates 10 or more qualifyingjobs. The basic sector business must annually provide payroll documentation to BOI.
Pursuant to statute, a business that is created or expanded as the result of an Infrastructure Loan is entitled to a creditagainst either their State individual income taxes or corporate income taxes for the portion of the fees attributable tothe use of the infrastructure. The total amount of tax credit claimed may not exceed the amount of the loan. The creditmay be carried forward for seven years or carried back for three years.
During the fiscal year ended June 30, 2019, basic sector business entities made total user fee payments of $6.6 million,representing $5.9 million of principal and $723.0 thousand in interest. During the fiscal year ended June 30, 2019, atotal of $3.8 million was claimed as a credit against State individual and corporation tax. The following table detailsthe fiscal year 2019 credit claimed by tax type and the tax year it was applied against (in thousands):
Infrastructure Credit ClaimedTax Year
2018Tax Year
2017 TotalCorporate income tax $ — $ 319 $ 319Individual income tax 164 3,286 3,450 Total amount claimed $ 164 $ 3,605 $ 3,769
U. Irrevocable Split Interest Agreements
Irrevocable split-interest agreements are used by donors to provide resources to two or more beneficiaries, includinggovernments. These agreements can be created through trusts or other legally enforceable agreements withcharacteristics that are equivalent to irrevocable split-interest agreements. The University of Montana campuses havethree irrevocable split interest agreements during the fiscal year ended June 30, 2019. Further detail related to theseagreements are provided in Note 3.
A-52

NOTE 2. OTHER ACCOUNTING CHANGES
A. New Accounting Guidance Implemented
For the year ended June 30, 2019, the State of Montana implemented the provisions of GASB Statement No. 83, CertainAsset Retirement Obligations (GASB 83). An Asset Retirement Obligation (ARO) is a legally enforceable liabilityassociated with the retirement of a tangible capital asset that has future legal obligations required to be performed. ThisStatement establishes criteria for measuring and recognizing a liability and a corresponding deferred outflow of resourcesfor an ARO. The objective of this Statement is to enhance comparability of financial statements among governmentsby establishing uniform criteria for governments to recognize and measure certain AROs, including obligations thatmay not have been previously reported. This Statement also will enhance the usefulness of the information providedto financial statement users by requiring related disclosures.
For the year ended June 30, 2019, the State of Montana implemented the provisions of GASB Statement No. 88, CertainDisclosures Related to Debt, including Direct Borrowings and Direct Placements (GASB 88). This Statement establishesa definition of debt for purposes of note disclosures to financial statements. This Statement requires that additionalessential information related to debt be disclosed, including unused lines of credit; assets pledged as collateral for thedebt; and terms specified in debt agreements related to significant events of default with finance-related consequences,significant termination events with finance-related consequences, and significant subjective acceleration clauses. ThisStatement also requires that existing and additional information be provided for direct borrowings and direct placementsof debt separately from other debt. The objective of this Statement is to improve financial reporting by providing usersof financial statements with essential information that currently is not consistently provided. In addition, informationabout resources to liquidate debt and the risks associated with changes in terms associated with debt will be disclosed.As a result, users will have better information to understand the effects of debt on a government's future resource flows.
B. Adjustments to Beginning Net Position
For the year ended June 30, 2019, there were no material adjustments to beginning net position.
A-53

NOTE 3. CASH/CASH EQUIVALENTS AND INVESTMENTS
This note details the following asset classifications (in thousands):
Cash/cash equivalents $ 4,452,168Equity in pooled investments $ 13,986,428Investments $ 3,346,082
Carrying amounts for the bank balance for cash deposits and fair values for the State's cash equivalents and investmentsare presented in Tables 1 through 4.
A. General
Outside of statutory requirements, the State does not maintain a statewide risk policy for cash/cash equivalents orinvestments, held outside of the Montana Board of Investments (BOI). The investment risk policy for State cash/cashequivalents and investments, including the BOI Municipal Finance Programs Fund deposits and investments managedby BOI, have been detailed below.
(1) BOI was created by the Legislature to manage the Unified Investment Program (UIP) established by the StateConstitution. The UIP is comprised of involuntary participating state funds, including pensions, trusts, insurance,operating funds and by statute voluntarily participating local government funds. BOI manages the UIP pursuant to the“Prudent Expert Principle” mandated by State law, which requires an investment manager to:
1. discharge the duties with the care, skill, prudence, and diligence, under the circumstances then prevailing, thata prudent person acting in a like capacity with the same resources and familiar with like matters exercises inthe conduct of an enterprise of a like character with like aims;
2. diversify the holdings of each fund within the Unified Investment Program to minimize the risk of loss andto maximize the rate of return unless, under the circumstances, it is clearly prudent not to do so; and
3. discharge the duties solely in the interest of and for the benefit of the funds forming the Unified InvestmentProgram.
BOI is not registered with the US Securities and Exchange Commission as an investment company. BOI’s investmentprogram is governed by Investment Policy Statements (IPS) approved by BOI.
Currently, only the nine retirement funds that participate in the Consolidated Asset Pension Pool (CAPP), the DefinedContribution Disability Plan, and the Montana State Fund (MSF) may invest in public corporate capital stock. NeitherState law nor the State Constitution place restrictions on retirement fund investments. BOI approves a separate IPSfor each pool and Separately Managed Investments (SMI) participant, which provides BOI staff a broad strategicframework under which the investments are managed. The IPS’s also reflect BOI approved asset allocation ranges.By statute, local government entities can voluntarily invest in the Short Term Investment Pool (STIP). By statute, witha qualifying event, local government entities may also voluntarily invest in the Trust Funds Investment Pool (TFIP).
As of June 30, 2019, BOI separately managed investments outside of the pools on behalf of 16 participants. Theinvestments are combined for reporting purposes in the SMI portion of the UIP. In prior years, the SMI portion of theUIP was referred to as All Other Funds (AOF). SMI participants include the State Treasurer's Cash Fund, State agencyinsurance reserves, and other State agencies. SMI participation is at the discretion of BOI staff for State agenciesallowed to participate in the UIP.
State agencies and local government entities may participate in one or more pools. By investing in pools, participantsare provided broad diversification. State agencies may also have direct fixed income, equity, or loan investments.These investments are combined and reported as SMI.
Separately issued investment pool financial statements may be obtained by contacting:
A-54

Montana Board of Investments2401 Colonial Drive, 3rd FloorPO Box 200126Helena, MT 59620-0126
BOI’s separately issued Unified Investment Program financial statements include the activity for MSF within SMI ona June 30, 2019, basis. MSF, a discretely presented component of the State, by statute, prepares separately issuedfinancial statements on a calendar year-end basis. Due to the difference in reporting periods, there will be a variancebetween the note disclosures and the financial statements for cash/cash equivalents and investments.
(a) Cash and cash equivalents consist of funds deposited by individual funds in the State Treasurer’s pooled cashaccount, cash deposits in checking accounts, cash invested in STIP, cash held by trustees, undeposited cash held byindividual State agencies, and investments categorized as cash equivalents.
Cash deposited with the State Treasurer’s pooled cash account is invested by BOI in short-term securities and otherinvestments. Because these funds are immediately available to the individual funds, their investment in the pooled cashaccount is reported as a cash equivalent. BOI also manages STIP, which provides individual State agencies and localgovernments an opportunity to invest excess cash in a pool that is managed to preserve principal while providing 24-hour liquidity. Because these pooled funds are invested in short-term, highly liquid investments, the individual fundinvestments in the STIP are reported as a cash equivalent.
(b) Investment securities are reported by investment portfolio and type in Table 2 – Cash Equivalents, Table 3 –Equityin Pooled Investments, and Table 4 – Investments. Unrealized gains and losses are included as a component of investmentincome. Unrealized gains and losses are computed based on changes in the fair value of investments held from thebeginning of the year, but unsold at the fiscal year-end. The net change in fair value of investments also consists ofthe realized gains or losses. Interest income is recognized when earned. Dividend income is recorded on the ex-dividend date.
Investments reported at fair value are on a trade date basis. Quoted market prices, when available, have been used tovalue investments. The fair values for securities that have no quoted market prices representing estimated fair value.Alternative investment securities are valued using the most recent estimates of fair value from the investment managers.Fair value measurements are reviewed monthly, and third-party valuations are reviewed for reasonableness andcompliance with approved price source authorization policy. BOI categorizes its fair value measurements within thefair value hierarchy established by generally accepted accounting principles as follows:
Level 1 – Quoted prices for identical assets or liabilities in active markets.Level 2 – Prices determined using inputs, other than quoted prices included within Level 1, that are observable for an
asset or liability, either directly or indirectly.Level 3 – Prices are determined using unobservable inputs.
(c) Security Lending - BOI is authorized by law to lend its securities and has contracted with the custodial bank, tolend BOI’s securities to broker-dealers and other entities with a simultaneous agreement to return the collateral for thesame securities in the future. The custodial bank is required to maintain collateral equal to 102.0% of the fair value ofdomestic securities and 105.0% of the fair value of international securities while the securities are on loan. On anyday, including June 30, the markets may move in a positive or negative direction resulting in under or overcollateralization. The custodial bank compensates for market movement by recalculating on the following businessday to meet the collateralization requirements. BOI and the custodial bank split the earnings, 80/20 respectively, onsecurity lending activities. BOI retains all rights and risks of ownership during the loan period. The custodial bankindemnifies BOI’s credit risk exposure to the borrowers.
During fiscal year 2019, the custodial bank lent BOI’s public securities and received as collateral: US dollar cash; USgovernment and government sponsored agency securities; US corporate debt securities and structured securities ratedAA-/Aa3 or higher; sovereign debt securities of the Group of Ten nations; and debt securities issued by certainsupranational agencies. The custodial bank does not have the ability to sell collateral securities unless the borrowerdefaults.
A-55

BOI imposed no restrictions on the amount of securities available to lend during fiscal year 2019. However, STIPassets are currently not available for securities lending. There were no failures by any borrowers to return loanedsecurities or pay distributions thereon during the period that resulted in a declaration and notice of default of theborrower. There were no losses during fiscal year 2019 resulting from a borrower default. As of June 30, 2019, nosecurities were recalled and not yet returned.
The cash collateral received for each loan was invested, together with the cash collateral of other qualified plan lenders,in an investment fund, the Navigator Securities Lending Government Money Market (Navigator) portfolio.
BOI and the borrowers maintain the right to terminate all securities lending transactions on notice. Since the securitieslending transactions were terminable at will, their duration did not generally match the duration of the investmentsmade with the cash collateral received from the borrower. The average duration was 36 days and the average weightedfinal maturity was 109 days within the Navigator portfolio.
(d) Investment Pools and SMI are described in the following paragraphs.
CAPP
The CAPP IPS contains prescribed asset allocation ranges among the allowable asset classes and is subject to changeas modifications are adopted by BOI. BOI annually affirms or revises the asset allocation ranges for the retirementplans. The CAPP IPS contains investment objectives and guidelines for each underlying asset class, with a purpose ofproviding diversified exposure within the asset class in a prudent and cost-effective manner. Due to a longer-termfocus, CAPP's asset classes differ from other classes that are allowable for other programs. CAPP's underlying assetclasses are as follows:
• Domestic Equities• International Equities• Private Equities• Natural Resources• Real Estate• US Treasury Inflation-Protected Securities (TIPS)• Broad Fixed Income• US Treasury/Agency• Investment Grade• Mortgage Backed Securities• High Yield• Cash• Diversifying Strategies
The CAPP IPS is the only IPS that allows for investments that can be held in non-US securities in a foreign currency.Per the CAPP IPS, the Investment Grade Credit Asset Class, Agency Mortgage Backed Securities Asset Class, andHigh Yield Asset Class sections have maximum restrictions that can be held. Currency exposures may be hedged, ina defensive manner, at the discretion of the active managers to preserve the US dollar value of investments made.
TFIP
The TFIP IPS provides for a 2.0% portfolio limit for dollar denominated debt obligations of domestic and foreigncorporations, also known as Yankee bonds, and a 3.0% portfolio limit in non-agency mortgage pass-through (MBS)securities. TFIP invests primarily in investment grade, US dollar denominated fixed income securities. The portfoliohas high yield and core real estate exposure.
STIP
The STIP IPS limits concentration of credit risk exposure by limiting portfolio investment types to 3.0% in any issuerexcept for US Treasury and US Agency securities as well as any repurchase agreements with a financial institution.
A-56

STIP invests primarily in short-term, high quality, fixed income securities with a maximum maturity of 397 days orless. Variable securities shall have a maximum maturity of 2 years. STIP shall maintain a dollar-weighted averageportfolio maturity of 60 days or less. STIP is managed to preserve principal while providing 24-hour liquidity for stateagency and local government participants.
BOI maintains a reserve account that may be used to offset losses within the STIP portfolio. The STIP reserve for theyear ending June 30, 2019, is detailed as follows:
STIP Reserve (in thousands)
Beginning STIP Reserve $ 32,565STIP Reserve activityInvestment Earnings:
Net increase (decrease) on fair value of investments 49Interest income 774Transfer of daily STIP income 4,927
Recoveries from write offs 9,055Credit enhancement fees 158
Total STIP Reserve activity 14,963Ending STIP Reserve $ 47,528
SMI
SMI invests primarily in investment grade, US dollar denominated fixed income securities. However, one participantportfolio has exposure to core real estate. The SMI portfolio also includes Veteran's Home Loan Mortgages (VHLM)and loans funded by the Coal Severance Tax Trust Fund, as authorized by statute.
(e) Investment Risk Disclosures are described in the following paragraphs, with more detail provided in later sections.
Custodial Credit RiskCustodial credit risk for cash and cash equivalents and investments is the risk that, in the event of the failure of thecounterparty to a transaction, BOI may not be able to recover the value of the investment or collateral securities thatare in the possession of an outside party. Per policy, BOI’s custodial bank must hold short-term and long-term creditratings by at least one Nationally Recognized Statistical Rating Organization (NRSRO) with a minimum requirementof A1/P1 (short-term) and A3/A-1 (long-term).
As of June 30, 2019, all the public securities, as well as securities held by the separate public equity account managers,were registered in the nominee name for BOI and held in the possession of BOI’s custodial bank. The equity indexfunds, securities held at the State’s depository bank, real estate, mortgage and loan investments were purchased andrecorded in BOI’s name. Commingled fund investments are registered in the name of BOI. Therefore, BOI is notsubject to custodial credit risk.
Concentration of Credit RiskConcentration of credit risk is the risk of loss attributable to the magnitude of any single investment per issuer name.Investments explicitly guaranteed by the US government are excluded from the concentration of credit risk requirement.Concentration of credit risk for 2019 is addressed within all IPS as set by BOI.
Credit Risk and Interest Rate RiskCredit risk is the risk that an issuer or other counterparty to an investment will not fulfill its obligation. Except for USgovernment securities, the pools' fixed income instruments have credit risk as measured by NRSRO ratings. Creditrisk is contemplated for each individual portfolio in the IPS. Credit risk is managed by constraining portfolio purchasesaround investment grade NRSRO ratings as appropriate. The US government guarantees its securities directly or
A-57

indirectly. Obligations of the US government, or obligations explicitly guaranteed by the US government, are notconsidered to have credit risk and do not require disclosure of credit risk.
As of June 30, 2019 the CAPP's cash equivalents' position held at the custodial bank included $566.4 million unratedheld in money market funds and $9.8 million was invested in an overnight repurchase agreement collateralized at102.0%.
As a matter of STIP investment policy, BOI can only purchase securities from a pre-approved Approved Issuer list.By STIP policy, permitted money market investments include only SEC registered 2a-7 institutional money marketfunds that are considered US Treasury or US Government money market mutual funds according to the SEC regulationsor short-term investment vehicle available through the custodial bank. As of June 30, 2019, all the STIP money marketinvestments were in US Governmental money markets.
Interest rate risk is the risk that changes in interest rates will adversely affect the fair value of an investment. BOI useseffective duration as a measure of interest rate risk for all fixed income portfolios. CAPP, TFIP, and SMI at fair valueinvestments are categorized to disclose credit and interest rate risk for fixed income securities. Credit risk is disclosedusing the weighted credit quality rating by investment type. Interest rate risk is disclosed using the weighted effectiveduration. NRSRO provides the credit ratings. According to the STIP investment policy, “The STIP portfolio willminimize interest rate risk by:
1. structuring the investment portfolio so securities mature to meet cash requirements for ongoing operationsthereby normally avoiding the need to sell securities on the open market prior to maturity;
2. maintaining a dollar-weighted average portfolio maturity (WAM) of 60 days or less (for this purpose, the dateto the next coupon reset date will be used for all floating or variable rate securities); and
3. STIP will maintain a reserve account.”
CAPP, TFIP, SMI, and STIP may hold fixed and variable rate securities. Interest payments on variable securities arebased on an underlying reference rate, for example the Secured Overnight Financing Rate (SOFR).
STIP investments at fair value are categorized to disclose credit risk and weighted average maturity (WAM) as of June30, 2019. Credit risk reflects the weighted security quality rating by investment type as of the June 30 report date.Although the STIP investments have been rated by investment security type, STIP, as an external investment pool, hasnot been rated. STIP interest rate risk is determined using the WAM method. The WAM measure expresses investmenttime horizons (the time when investments are due or reset and payable in days, months or years) weighted to reflectthe dollar size of the individual investments within an investment type. Inclusive of cash and cash equivalents, theWAM averages 41 days for the portfolio. Based on their short weighted average maturity and the relative immaterialdifference from their cost to fair value, BOI determined the cash equivalents to have little discernible interest rate risk.
Foreign Currency RiskForeign currency risk is the risk that changes in exchange rates will adversely affect the fair value of an investment.BOI's foreign currency exposure by denomination and investment type are reported, in US dollars, at fair value and islimited to CAPP.
Counterparty Credit Risk - Investment DerivativesCounterparty credit risk is the risk that the counterparty will not fulfill its obligations. The following table depictsBOI's counterparty credit risk exposure to its investment derivatives.
A-58

Counterparty Credit Risk - Credit Default Swaps - as of June 30, 2019(in thousands)
Maximum loss before/after netting and collateralMaximum amount of loss BOI would face in case of default of allcounterparties, i.e. aggregated (positive) fair value of OTCpositions $ 310Effect of collateral reducing maximum exposure —Liabilities subject to netting arrangements reducing exposure —
Resulting net exposure 310
Other Policy Considerations For other risk, BOI approves both the IPS and benchmark used for each portfolio. Per the CAPP IPS, the TIPS PAC,US Treasury/Agency PAC, Investment Grade Credit PAC, and Agency Mortgage-Backed PAC, average duration willbe maintained in a range within 20.0% of the benchmark duration. The Broad Fixed Income PAC and High Yield PACaverage duration will be maintained in a range within 25.0% of the index duration. Per the TFIP IPS, the averageduration will be maintained in a range within 20.0% of the benchmark duration. Interest rate risk for SMI is contemplatedin each individual IPS and is managed by limiting the maturity of individual securities and/or matching liabilities tomaturities per estimated cash flows.
Fair Value of Derivative InstrumentsThe UIP invests in currency forward contract, credit default swaps, index futures (long duration) and warrants whichare classified as investment derivatives. The derivatives increased in fair value for the year ended June 30, 2019, by$698.0 thousand. The contracts had a fair value of $400.0 thousand, and the notional amount of the contracts was $14.4million as of June 30, 2019.
(2) The BOI Municipal Finance Programs Fund deposits and investments are restricted by the bond trust indenturesto the following: government and agency obligations, certificates of deposits, repurchase agreements, and investmentagreements. The bond trust indenture addresses custodial credit risk, concentration of credit risk, credit risk, interestrate and credit quality risk, by detailing the permitted investments. BOI's STIP IPS details custodial credit risk,concentration of credit risk, and credit risk. Deposits and investments must be made with Montana banks or in the STIPadministered by BOI.
Custodial Credit Risk – Custodial credit risk is the risk that, in the event of the failure of the counterparty to a transaction,BOI will not be able to recover the value of the investment or collateral securities that are in the possession of an outsideparty. Per policy, BOI’s custodial bank must hold short-term and long-term credit rating by at least one NRSRO witha minimum requirement of A1/P1 (short-term) and A3/A-1 (long-term).
Cash – Custodial risk for cash is the risk that, in the event of the failure of the custodial bank, the cash orcollateral securities may not be recovered from an outside party. The securities used as collateral are held bythe trustee in the name of BOI.
Investments – As of June 30, 2019, the Municipal Finance Programs securities were recorded by the trustee inthe name of BOI by specific account.
Concentration of Credit Risk - Concentration of credit risk is the risk of loss attributed to the magnitude of any singleinvestment per issuer name. The Municipal Finance Programs investments directly issued or explicitly guaranteed bythe US government and investments in mutual funds are excluded from the concentration of credit risk requirement.The STIP investment policy limits concentration of credit risk by limiting portfolio investment types to 3.0% in anyissuer with the exception of US Treasury and US Agency securities, as well as, any repurchase agreements with afinancial institution. As of June 30, 2019, STIP concentration risk was within the policy as set by BOI.
Credit Risk - Credit risk is the risk that an issuer or other counterparty to an investment will not fulfill its obligation.The Municipal Finance Programs US government direct-backed securities, consisting of US Treasury notes and bills,are guaranteed directly by the US government. Obligations of the US government or obligations explicitly guaranteed
A-59

by the US government are not considered to have credit risk and do not require disclosure of credit quality. Permittedinvestments, as described in the indenture, include, “Either (i) long term obligations of such bank, trust company orassociation are rated in one of the three highest investment category of the Standard & Poor’s Corporation or Moody’sInvestor Service Inc., which investment category shall not be less than the prevailing rate on the bonds or (ii) the depositsare continuously secured as to principal, but only to the extent not insured by the Bank Insurance Fund or the SavingsAssociation Insurance Fund, or any successor to either, of the Federal Deposit Insurance Corporation (FDIC).”
BOI’s STIP IPS specifies that STIP securities have a minimum of two credit ratings as provided by nationally recognizedstatistical rating organizations, to assist in the monitoring and management of credit risk. The purchase of STIP securitiesother than US government or US agency obligations are restricted to those which are pre-approved. Although the STIPinvestments have been rated by investment security type, STIP, as an external investment pool, has not been rated.
Interest Rate Risk - Interest rate risk is the risk that changes in interest rates will adversely affect the fair value of aninvestment. Permitted investments as described in the Indenture details the allowable investments, including those inSTIP. STIP interest rate risk is determined using the WAM method. According to the STIP IPS, “The STIP portfoliowill minimize interest rate risk by:
1. structuring the investment portfolio so securities mature to meet cash requirements for ongoing operations,thereby normally avoiding the need to sell securities on the open market prior to maturity;
2. maintaining a dollar-weighted average portfolio maturity (WAM) of 60 days or less (for this purpose, the dateto the next coupon reset date will be used for all floating or variable rate securities); and
3. STIP will maintain a reserve account.”
The Municipal Finance Program investments are categorized to disclose credit and interest rate risk as of June 30, 2019.Credit risk is disclosed using the weighted credit quality rating by investment type. Interest rate risk is disclosed usingweighted effective duration as calculated by BOI. The credit quality ratings have been calculated excluding non-ratedinvestment types. Both the credit quality ratings and duration have been calculated excluding cash equivalents, as BOIdetermined that these securities did not contain these risk elements. There were no derivative transactions during the2019 fiscal year for investments held by the trustee. Based on their short weighted average maturity and the relativeimmaterial difference from their cost to fair value as of June 30, 2019, BOI deemed the cash equivalents to have littlediscernible interest rate risk.
B. Cash/Cash Equivalents
(1) Cash Deposits – The State requires collateralization based on the average daily bank balance in the depositorybank holding the main state bank account. For other depository banks, state statutes require collateralization at 50.0%of the bank balance. The cash deposits amount includes both primary government and component unit deposits.
Table 1 – Cash Deposit Amounts(in thousands)
CarryingAmount
Cash held by State/State's agent $ 72,193Uninsured and uncollateralized cash 9,920Undeposited cash 577Cash in US Treasury 353,632Cash in MSU component units 7,935Cash in UM component units 16,200Less: outstanding warrants (49,688)
$ 410,769
As of June 30, 2019, the carrying amount of deposits for component units was $207.2 million as included in Table 1.
(2) Cash Equivalents – consists of cash in the State Treasury invested by individual funds in the Short-term InvestmentPool (STIP), the State Treasurer’s pooled cash account, and in identifiable securities and investments considered to be
A-60

cash equivalents. Cash equivalents, generally, are short-term, highly liquid investments with original maturities of threemonths or less that are measured at cost. Cash equivalents may be under the control of BOI or other agencies, as allowedby law.
Table 2 - Cash Equivalents (in thousands)
FairValue
Treasuries (1) $ 174,733Corporate commercial paper (2) 200,145Corporate notes (2) 448,909Certificates of deposit (2) 325,235Agency or government related (2) 873,181Money market fund unrated 150,638STIP cash and cash equivalents (2) 1,995,098Less: STIP Adjustments (3) (126,540)
Total cash equivalents $ 4,041,399(1) A portion is also included in the Investments Measured at Fair Value and NAV table.(2) Also included in the Investments Measured at Fair Value and NAV table.(3) Includes adjustments for STIP Reserve, STIP included in pooled investments, and holding classification differences.
As of June 30, 2019, local governments had invested $1.4 billion and component units of the State of Montana had invested $551.1million in STIP.
STIP Cash Equivalent Credit Quality Ratings as of June 30, 2019(in thousands)
Total CashEquivalents Credit Quality Rating
Treasuries $ 310,466 A-1+Agency or government related 356,614 A-1+Asset backed commercial paper 1,116,921 A-1+Corporate commercial paper 189,596 A-1+Certificates of deposit 21,501 A-1+
Total cash equivalents $ 1,995,098
STIPCredit Quality Rating and Weighted Average of Maturity as of June 30, 2019
(in thousands)
Security Investment Type
Total FixedIncome
Investmentsat Fair Value
CreditQualityRating WAM (Days)
Treasuries $ 129,877 A-1+ 20Agency or government related 873,181 A-1+ 69Corporate:
Commercial paper 200,145 A-1+ 16Notes 448,909 A-1+ 61
Certificates of deposit 325,235 A-1+ 45Total STIP fixed income investments at fair value $ 1,977,347
A-61

C. Equity in Pooled Investments
These securities consist of investments held by BOI in pooled investment funds. The Consolidated Asset Pension Pool(CAPP) and Trust Funds Investment Pool (TFIP) were created to allow qualifying funds to participate in diversifiedinvestment pools. Purchases are subject to the statutorily mandated “Prudent Expert Principle” (see Table 3 – Equityin Pooled Investments).
Table 3 – Equity in Pooled Investments(in thousands)
Fair Value (1)
CAPP:Consolidated asset pension pool $ 11,495,868
TFIP:Trust funds investment pool 2,456,087 Total pooled investments 13,951,955 Pool adjustments (net) 34,473
Total equity in pooled investments $ 13,986,428
(1) Includes cash/cash equivalents and investments.
As of June 30, 2019, the fair value of the underlying securities on loan was $595.2 million. Collateral provided for the securities onloan totaled $606.9 million, consisting of $83.4 million in cash and $523.5 million in securities.
As of June 30, 2019, local governments invested $12.3 million in TFIP.
State of Montana investments are categorized below to disclose credit and interest rate risk as of June 30, 2019, asrequired for applicable pools.
Credit Quality Rating and Effective Duration as of June 30, 2019Fair Value (in thousands)
Security Investment Type CAPP TFIP SMI
Total FixedIncome
Investmentsat Fair Value
Credit QualityRatings Range
EffectiveDuration(Years)
Treasuries $ 1,337,688 $ 481,464 $ 346,460 $ 2,165,612 AAA 3.21-8.08Agency or Government Related 218,805 340,285 150,949 710,039 AAA 2.97-4.22Asset Backed Securities 33,332 75,392 57,708 166,432 AAA 1.88-1.99Mortgage Backed Securities:
Noncommercial 356,424 248,265 55,083 659,772 AAA 3.60-4.24Commercial 162,244 220,519 27,312 410,075 AA+ to AAA 4.69-7.34
Corporate:Financial 248,750 324,236 270,351 843,337 BBB+ to A- 3.25-4.14Industrial 492,119 500,951 356,212 1,349,282 BB to A- 3.63-6.44Utility 24,490 21,222 21,630 67,342 BB+ to BBB+ 1.94-3.07
High Yield Bond Fund — 51,966 — 51,966 BB- 2.40Commingled Asset Allocation Funds 104,686 — — 104,686 NR NATotal fixed income investments at fair value $ 2,978,538 $ 2,264,300 $ 1,285,705 $ 6,528,543
State of Montana investments are measured at fair value and categorized within the fair value hierarchy established byGASB Statement No. 72 – Fair Value Measurement and Application, as defined below.
A-62

Fixed income and equity investments classified in Level 1 of the fair value hierarchy are valued using prices quotedin active markets for those securities. Fixed income investments classified in Level 2 of the fair value hierarchy arevalued using a matrix pricing technique. Matrix pricing is used to value securities based on the securities’ relationshipto benchmark quoted prices.
Residential Mortgages classified in Level 3 of the fair value hierarchy are present value adjusted.
Direct real estate classified in Level 3 of the fair value hierarchy are based on the latest appraisal value.
Investments measured at cost are included to account for all investments within each pool and SMI. These assetsrepresent cash equivalents and Montana Mortgages and Loans.
Each of the investment pools and SMI has the following fair value measurements as of June 30, 2019:
Investments Measured at Fair Value(in thousands)
Fair Value Measurements Using
June 30, 2019
Quoted prices in Active Markets for Identical Assets
(Level 1)
Significant Other Observable
Inputs(Level 2)
SignificantUnobservable
(Level 3)Investments by fair value levelFixed income investments:
Treasuries $ 2,295,489 $ 2,295,489 $ — $ —Agency or Government Related 1,583,220 — 1,583,220 —Asset Backed Securities 166,431 — 166,431 —Mortgage Backed Securities:
Noncommercial 659,772 — 659,772 —Commercial 410,075 — 410,075 —
Corporate:Commercial Paper 200,145 — 200,145 —Commercial Notes 448,909 — 448,909 —Certificates of Deposit 325,235 — 325,235Financial 843,337 — 843,337 —Industrial 1,349,282 — 1,349,282 —Utility 67,342 — 67,342 —
Equity investments 3,632,285 3,632,285 — —International equity investments 1,967,247 1,967,247 — —Direct Real Estate 19,185 — — 19,185Residential Mortgages 3,358 — — 3,358Investment derivate instruments:
Credit default swaps 310 — 310 —Total investments by fair value level 13,971,622 7,895,021 6,054,058 22,543
Investments measured at the net asset value (NAV)Commingled Asset Allocation Funds 104,686Private Equity Partnerships 1,551,573Core Real Estate 620,022Non-Core Real Estate 405,296Timber 106,902High Yield Bond Fund 51,966
A-63

The investments measured at NAV for the year ended June 30, 2019, are detailed below.
Investments Measured at NAV (in thousands)
Fair ValueUnfunded
Commitments
RedemptionFrequency (If
Currently Eligible)Redemption
Notice PeriodCommingled Asset Allocation Funds $ 104,686 $ — Daily 1 dayPrivate Equity Partnerships 1,551,573 919,698Core Real Estate 620,022 — Monthly, quarterly 45-90 daysNon-Core Real Estate 405,296 257,589Timber 106,902 14,225High Yield Bond Fund 51,966 — Monthly 30 days
Total investments measured at the NAV $ 2,840,445 $ 1,191,512
STIP and $1.7 billion of SMI are included, and also reported in Tables 2 and 4, respectively.
Commingled Asset Allocation Funds – This type consists of institutional investment funds that invest in global tacticalasset allocation funds. The fair values of these investments use the NAV per share (or its equivalent) of the investments.
Private Equity Partnerships – This type includes investments in limited partnerships. Generally, the types of partnershipstrategies included in this portfolio are: venture capital, growth equity, buyouts, special situations, mezzanine, energy,and distressed debt. These investments are considered long-term. Redemptions are restricted over the life of thepartnership. During the life of the partnerships, distributions are received as underlying partnership investments arerealized. It is expected that the underlying assets of the funds will be liquidated over 10 years. It is probable all of theinvestments in this type will be sold at an amount different from the NAV per share (or its equivalent) of BOI’s ownershipinterest in partners’ capital.
Core Real Estate – This type includes funds that invest primarily in core real estate, which makes equity investmentsin operating and substantially-leased institutional quality real estate in traditional property types (apartments, office,retail, industrial, and hotel), through commingled funds. The primary investment objectives of these core real estatefunds are to invest in real estate that will generate income from predictable sources of revenue and not to realize gainson the underlying assets. This investment type receives distributions of generated income and occasionally through theliquidation of the underlying assets of the fund. The fair values of these investments use the NAV per share (or itsequivalent) of BOI’s ownership interest in the partners’ capital. Redemption of these investments is restricted based onthe availability of cash flow arising from investment transactions, sales, and other fund operations occurring in theordinary course of business. Therefore, requested redemptions from a fund will be redeemed as funds become available.
Investments Measured at Fair Value(in thousands)
Fair Value Measurements Using
June 30, 2019
Quoted prices in Active Markets for Identical Assets
(Level 1)
Significant Other Observable
Inputs(Level 2)
SignificantUnobservable
(Level 3)Total investments measured at NAV 2,840,445
Total investments measured at fair value 16,812,067Investments at cost
Cash and cash equivalents held at custodial bank 2,594,018SMI Montana Mortgages and Loans 167,356
Total investments not categorized 2,761,374Total investments $ 19,573,441
A-64

Non-Core Real Estate – This type includes private partnership funds that primarily invest in value added andopportunistic real estate funds. These funds assume more risk than the core real estate funds in order to achieve a greaterreturn on investment. Returns are driven both by current income and by expected capital appreciation. This investmenttype receives distributions of generated income and occasionally through the liquidation of the underlying assets of thefund. It is expected that the underlying assets of the funds will be liquidated over 7 to 10 years. These investments cannever be redeemed. The fair values of these investments use the NAV per share (or its equivalent) of BOI’s ownershipinterest in the partners’ capital.
Timber – This type includes private partnership funds that primarily invest in timber funds. The underlying assets ofthese types of funds are typically made of tree farms and managed forest. Returns come from biological growth, upwardproduct class movement, and appreciation in timber and land prices. This investment type receives distributions ofgenerated income and occasionally through the liquidation of the underlying assets of the fund. It is expected that theunderlying assets of the funds will be liquidated over 12 to 20 years. These investments can never be redeemed withthe funds. The fair values of these investments use the NAV per share (or its equivalent) of BOI’s ownership interestin the partners’ capital.
High Yield Bond Fund – This type consists of predominantly US corporate credits, whether in the form of bonds orloans, that are rated below investment grade. These assets carry a higher risk of default than investment grade securitiesand accordingly provide a higher level of income or yield commensurate with that risk. The fair values of theseinvestments use the NAV per share (or its equivalent) of the investments.
As of the June 30, 2019, exchange date, BOI’s foreign currency exposure by denomination and investment type arereported, in US dollars, at fair value in the table below and is limited to CAPP. Excluded are the foreign investmentsdenominated in US dollars for the American Depositary Receipts (ADRs), sovereign debt, and commingled indexfunds.
A-65

Foreign Currency Exposure by CountryInvestment Type in US Dollar Equivalent
(in thousands)Foreign Currency
Denomination CurrencyInternational
EquitiesPrivateEquity
Real EstateEquity
Australian Dollar $ — $ 29,752 $ — $ —Brazilian Real 58 19,314 — —Canadian Dollar 76 56,063 — —Czech Koruna — 799 — —Danish Krone — 10,939 — —EMU – Euro 110 180,950 18,510 1,422Hong Kong Dollar 67 36,067 — —Hungarian Forint 18 1,873 — —Indonesian Rupiah 2 1,120 — —Japanese Yen 276 100,630 — —Korean Fortnit 2 15,948 — —Malaysian Ringgit 1 1,596 — —Mexican Peso 4 4,976 — —New Israeli Sheqel — 6,704 — —New Zealand Dollar — 211 — —Norwegian Krone — 6,243 — —Philippine Peso 3 70 — —Polish Zloty — 2,238 — —Pound Stering 121 93,259 — —Singapore Dollar 1 12,220 — —South African Rand 19 11,715 — —South Korean Won (97) 15,390 — —Swedish Krona 1 28,927 — —Swiss Franc 1 32,154 — —New Taiwan Dollar 8 4,178 — —Thailand Baht — 5,142 — —Yuan Renminbi 316 8,898 — —
Total cash andsecurities $ 987 $ 687,376 $ 18,510 $ 1,422
Investments in alternative equity are usually made through limited partnership agreements that involve many limitedpartners and a general partner who is responsible for all investment decisions. The limited partners make an originalcommitment, after which capital is called as needed by the general partner to make investments. These agreements willusually last for a minimum of 10 years. The table below shows the remaining BOI commitments to CAPP alternativeequity managers by pension asset class (PAC), as of June 30, 2019.
Commitments to Fund Managers(in thousands)
Pension Asset ClassOriginal
CommitmentCommitmentRemaining
Private Equities PAC $ 2,570,722 $ 761,179Real Estate PAC 1,511,666 257,589Natural Resources PAC 464,412 172,744
Total $ 4,546,800 $ 1,191,512
A-66

D. Investments
Article VIII of Montana's Constitution, with supporting statutes, authorizes BOI to manage the State's UnifiedInvestment Program. Long-term investments are administered by the following agencies, as allowed by state law,Section 17-6-201, MCA:
Long-term Investments
DepartmentPercent
AdministeredBoard of Investments 50.00%Universities 18.60MPERA (Montana Public Employee Retirement Administration) 23.71College Savings Plan 4.78Montana Board of Housing 1.39Other (1) 1.52 Total 100.00%
(1) Other consists of the Commissioner of Higher Education, the Department of Administration, the Department of Commerce, the
Department of Natural Resources and Conservation, the Department of Revenue, and State Auditor.
BOI must employ the "Prudent Expert Rule" in managing the State's investment portfolio. Investments are presentedat fair value. Investment fair values for publicly traded securities are determined primarily by reference to market pricessupplied to BOI's custodial bank or trustee. State investments are categorized within the fair value hierarchy establishedby GASB Statement No. 72.
The PERS Defined Contribution Retirement Plan (DCRP) and the Deferred Compensation Plan’s Montana Fixed Fundis a stable value investment option administered and monitored by the Public Employees’ Retirement Board (PERB)with input from the Employee Investment Advisory Committee and the investment consultant. The PERB has establishedan investment policy for the Montana Fixed Fund to identify objectives, investment guidelines, and outline theresponsibility of the outside vendors: stable value manager Pacific Investment Management Company LLC (PIMCO),custodial bank State Street Bank and Trust Company (State Street), and third-party synthetic Guaranteed InterestContract (GIC) providers, Transamerica Life Insurance Company (Transamerica), Prudential Insurance Company ofAmerica (Prudential), and Voya Retirement Insurance and Annuity Company (Voya). All money invested in the MontanaFixed Fund of the PERS-DCRP and Deferred Compensation Plan are held in a Pooled Trust. The third party recordkeeper, Empower ™ Retirement, tracks and reports the daily trading and valuations of all investment options, includingthe assets held by the individual mutual fund companies.
Table 4 – Investments (in thousands)
Fair ValueJune 30, 2019
Quoted prices in Active Markets for Identical Assets
(Level 1)
Significant Other Observable Inputs
(Level 2)
SignificantUnobservable
Inputs(Level 3)
Primary governmentInvestments by fair value levelTreasuries (1) $ 3,959 $ 3,959 $ — $ —Agency/Government Related (1) 26,663 — 26,663 —Government Securities 3,600 3,600 — —Stocks 6,258 6,258 — —Other 22,749 — 22,749 —
Total investments at fair value 63,229 13,817 49,412 —
Investments at costMontana Mortgages and Loans (3) 157,935
A-67

(1) The credit quality rating and duration are included in above sections for the rated investments.(2) For more detail, refer to component unit separately issued financial statements.(3) The total for Montana Mortgages and Loans does not include Coal Severance Tax loans, which was included on SMI financial statements. This amountof $9.4 million is considered advances to other funds/component units and amounts due from component units in the Coal Tax Severance column of thegovernmental fund financial statements.
As of June 30, 2019, the fair value of the investments on loan was $128.5 million. Collateral provided for the investments on loan totaled $131.2 millionconsisting of $8.1 million in cash and $123.1 million in securities.
$1.7 billion of SMI is included, and also reported in the Investments Measured at Fair Value and NAV table.
Table 4 – Investments (in thousands)
Fair ValueJune 30, 2019
Quoted prices in Active Markets for Identical Assets
(Level 1)
Significant Other Observable Inputs
(Level 2)
SignificantUnobservable
Inputs(Level 3)
Total investments at cost 157,935Total primary government 221,164
Component units/fiduciary fundsInvestments by fair value levelTreasuries (1) 317,615 317,615 — —Agency/Government Related (1) 124,286 — 124,286 —Asset Backed Securities (1) 57,708 — 57,708 —Mortgage Backed Securities (1) 55,083 — 55,083 —Commercial Mortgage Backed Securities (1) 27,312 — 27,312 —Financial-Corporate (1) 270,351 — 270,351 —Industrial-Corporate (1) 356,212 — 356,212 —Utility-Corporate (1) 21,630 — 21,630 —Equity Investments 169,265 169,265 — —529 College Savings Plan 160,074 — 160,074 —VEBA 7,466 7,466 — —State Auditor 10,919 6,464 4,455 —MSU Investments (2) 23,546 — 23,546 —MSU Component Unit Investments (2) 161,675 158,066 2,346 1,263UM Component Unit Investments (2) 186,536 136,896 38,839 10,801Board of Housing (2) 41,971 8,323 33,648 —
Total investments at fair value 1,991,649 804,095 1,175,490 12,064Investments at net asset value (NAV)Core Real Estate 85,053Deferred Compensation (2) 532,205Defined Contribution (2) 260,973MSU Component Unit Investments (2) 96,693UM Component Unit Investments (2) 124,344UM Other Investments (2) 363UM Interest in Split Interest (2) 4,399
Total investments at NAV 1,104,030Investments at costMSU Component Unit Investments (2) 24,875Board of Housing (2) 4,364
Total Investments at Cost 29,239Total component unit/fiduciary investments 3,124,918Total investments $ 3,346,082
Securities lending investment pool $ 8,047
A-68

Municipal Finance Programs – Rated SecuritiesCredit Quality Rating and Effective Duration as of June 30, 2019
(in thousands)
Security Investment TypeFair
Value
CreditQuality
Rating (1)Effective
Duration (1)
Short-term investmentsUS Treasury obligations $ 2,684 AA+ 0.15
Restricted investmentsUS Treasury obligations 701 AA+ 1.45
Total investments $ 3,385
(1) Credit Quality Rating and Effective Duration are weighted.
A-69

NOTE 4. DISAGGREGATION OF ACCOUNTS RECEIVABLE, ACCOUNTS PAYABLE, DEFERREDOUTFLOWS OF RESOURCES AND DEFERRED INFLOWS OF RESOURCES
Accounts receivable, accounts payable, deferred outflows of resources and deferred inflows of resources on theStatement of Net Position as of June 30, 2019, consisted of the following (in thousands):
A. Accounts Receivables
Governmental Activities
CoalSeverance
Tax
FederalSpecial
RevenueGeneral
Fund
InternalServiceFunds
LandGrant
NonmajorGovernmental
FundsState Special
RevenueCharges for services/fines/forfeitures $ — $ 5,509 $ 1,919 $ 776 $ — $ — $ 10,025Contributions/premiums — — — 8,043 — — 2,040Grants/contracts/donations — — — — — 16 304Investment income 3,596 — 2,260 249 2,406 4,256 4,245License and permits — — — — — — 8,524Other receivables — 72,891 6,797 4 — — 667Reimbursements/overpayments — 348 19,337 — — — 15,039Taxes 7,398 — 387,046 — — 2,600 98,663
Total receivables 10,994 78,748 417,359 9,072 2,406 6,872 139,507Less: allowance for doubtful accounts — (2,065) (125,058) (16) — — (17,891)
Receivables, net $ 10,994 $ 76,683 $ 292,301 $ 9,056 $ 2,406 $ 6,872 $ 121,616
Business-type Activities
MunicipalFinance
ProgramsNonmajor
Enterprise FundsUnemployment
InsuranceCharges for services $ — $ 27,985 $ —Contributions/premiums — 2,776 5,387Loans/investment income 8,367 265 —Other receivables — 64 —Reimbursements/overpayments — — 2,279
Total receivables 8,367 31,090 7,666Less: allowance for doubtful accounts — (464) (2,928)
Receivables, net $ 8,367 $ 30,626 $ 4,738
A-70

NOTE 4. DISAGGREGATION OF ACCOUNTS RECEIVABLE, ACCOUNTS PAYABLE, DEFERREDOUTFLOWS OF RESOURCES AND DEFERRED INFLOWS OF RESOURCES
Accounts receivable, accounts payable, deferred outflows of resources and deferred inflows of resources on theStatement of Net Position as of June 30, 2019, consisted of the following (in thousands):
A. Accounts Receivables
Governmental Activities
CoalSeverance
Tax
FederalSpecial
RevenueGeneral
Fund
InternalServiceFunds
LandGrant
NonmajorGovernmental
FundsState Special
RevenueCharges for services/fines/forfeitures $ — $ 5,509 $ 1,919 $ 776 $ — $ — $ 10,025Contributions/premiums — — — 8,043 — — 2,040Grants/contracts/donations — — — — — 16 304Investment income 3,596 — 2,260 249 2,406 4,256 4,245License and permits — — — — — — 8,524Other receivables — 72,891 6,797 4 — — 667Reimbursements/overpayments — 348 19,337 — — — 15,039Taxes 7,398 — 387,046 — — 2,600 98,663
Total receivables 10,994 78,748 417,359 9,072 2,406 6,872 139,507Less: allowance for doubtful accounts — (2,065) (125,058) (16) — — (17,891)
Receivables, net $ 10,994 $ 76,683 $ 292,301 $ 9,056 $ 2,406 $ 6,872 $ 121,616
Business-type Activities
MunicipalFinance
ProgramsNonmajor
Enterprise FundsUnemployment
InsuranceCharges for services $ — $ 27,985 $ —Contributions/premiums — 2,776 5,387Loans/investment income 8,367 265 —Other receivables — 64 —Reimbursements/overpayments — — 2,279
Total receivables 8,367 31,090 7,666Less: allowance for doubtful accounts — (464) (2,928)
Receivables, net $ 8,367 $ 30,626 $ 4,738
B. Deferred Outflows of Resources
Governmental Activities
Federal SpecialRevenue General Fund
Internal ServiceFunds
NonmajorGovernmental
FundsState Special
RevenueOPEB deferred outflows (1) $ — $ 5,032 $ 239 $ — $ —Pension deferred outflows (2) 28 760,165 11,920 — 86Refunding deferred outflows — — — 2,461 —
Total deferred outflows $ 28 $ 765,197 $ 12,159 $ 2,461 $ 86
Business-type Activities
MunicipalFinance
ProgramsNonmajor
Enterprise FundsOPEB deferred outflows (1) $ 1 $ 65Pension deferred outflows (2) 79 2,774
Total deferred outflows $ 80 $ 2,839
(1) Further detail regarding OPEB related deferred outflows of resources is provided in Note 7.(2) Further detail regarding pension related deferred outflows of resources is provided in Note 6.
C. Accounts Payables
Governmental Activities
Federal SpecialRevenue General Fund
Internal ServiceFunds
NonmajorGovernmental
FundsState Special
RevenueAccrued interest $ 6 $ 387 $ 27 $ 1,668 $ 58Payroll 8,554 21,965 3,829 6 20,567Tax refunds — 161,767 — — —Vendors/individuals 229,267 73,312 10,491 2,663 153,880
Payables, net $ 237,827 $ 257,431 $ 14,347 $ 4,337 $ 174,505
Business-type ActivitiesMunicipalFinance
ProgramsNonmajor
Enterprise FundsUnemployment
InsuranceAccrued interest $ 655 $ 3 $ —Payroll 19 986 —Vendors/individuals 7 16,822 1,741
Payables, net $ 681 $ 17,811 $ 1,741
A-71

D. Deferred Inflows of Resources
Governmental Activities
Federal SpecialRevenue General Fund
Internal ServiceFunds
NonmajorGovernmental
FundsState Special
RevenueOPEB deferred inflows (1) $ — $ 3,998 $ 257 $ — $ —Pension deferred inflows (2) 57 195,919 11,511 — 79Refunding deferred inflows — — — 235 —
Total deferred inflows $ 57 $ 199,917 $ 11,768 $ 235 $ 79
Business-type Activities
MunicipalFinance
ProgramsNonmajor
Enterprise FundsOPEB deferred inflows (1) $ 2 $ 77Pension deferred inflows (2) 80 3,482
Total deferred inflows $ 82 $ 3,559
(1) Further detail regarding OPEB related deferred inflows of resources is provided in Note 7. (2) Further detail regarding pension related deferred inflows of resources is provided in Note 6.
A-72

D. Deferred Inflows of Resources
Governmental Activities
Federal SpecialRevenue General Fund
Internal ServiceFunds
NonmajorGovernmental
FundsState Special
RevenueOPEB deferred inflows (1) $ — $ 3,998 $ 257 $ — $ —Pension deferred inflows (2) 57 195,919 11,511 — 79Refunding deferred inflows — — — 235 —
Total deferred inflows $ 57 $ 199,917 $ 11,768 $ 235 $ 79
Business-type Activities
MunicipalFinance
ProgramsNonmajor
Enterprise FundsOPEB deferred inflows (1) $ 2 $ 77Pension deferred inflows (2) 80 3,482
Total deferred inflows $ 82 $ 3,559
(1) Further detail regarding OPEB related deferred inflows of resources is provided in Note 7. (2) Further detail regarding pension related deferred inflows of resources is provided in Note 6.
NOTE 5. CAPITAL ASSETS
Changes in capital asset balances for the fiscal year ended June 30, 2019, are reflected in the following table (inthousands):
Governmental ActivitiesBeginningBalance Increases (1) Decreases (1)
EndingBalance
Capital assets not being depreciated:Land $ 719,083 $ 18,281 $ (339) $ 737,025Construction work in progress 927,077 447,886 (269,145) 1,105,818Easements 192,587 26,226 — 218,813Museum and art 85,440 230 — 85,670Other 29,282 560 — 29,842
Total capital assets not being depreciated 1,953,469 493,183 (269,484) 2,177,168
Capital assets being depreciated:Infrastructure 5,429,950 246,256 (102,648) 5,573,558Land improvements 65,508 3,743 — 69,251Buildings/improvements 591,294 18,362 (4,019) 605,637Equipment 397,503 23,249 (10,491) 410,261Easements - amortized 1,450 — (73) 1,377Other 5,402 164 — 5,566
Total capital assets being depreciated 6,491,107 291,774 (117,231) 6,665,650
Less accumulated depreciation for:Infrastructure (1,615,849) (186,967) 102,648 (1,700,168)Land improvements (30,431) (3,035) 28 (33,438)Buildings/improvements (383,435) (18,986) 3,397 (399,024)Equipment (253,624) (25,772) 8,734 (270,662)Other (4,042) (266) — (4,308)
Total accumulated depreciation (2,287,381) (235,026) 114,807 (2,407,600)
Total capital assets being depreciated, net 4,203,726 56,748 (2,424) 4,258,050
Intangible assets 33,498 41,595 (29,826) 45,267
Governmental activities capital assets, net $ 6,190,693 $ 591,526 $ (301,734) $ 6,480,485
(1) The increases and decreases noted above include adjustments related to prior periods and correction of errors.
A-73

Business-type ActivitiesBeginningBalance Increases (1) Decreases (1)
EndingBalance
Capital assets not being depreciated:Land $ 800 $ — $ — $ 800Construction work in progress 7,791 878 (1,782) 6,887Other 4,251 46 (657) 3,640
Total capital assets not being depreciated 12,842 924 (2,439) 11,327
Capital assets being depreciated:Infrastructure 1,175 — — 1,175Land improvements 3,830 — — 3,830Buildings/improvements 10,146 53 — 10,199Equipment 9,546 159 (132) 9,573
Total capital assets being depreciated 24,697 212 (132) 24,777
Less accumulated depreciation for: Infrastructure (727) (19) — (746)Land improvements (1,915) (149) — (2,064)Buildings/improvements (6,503) (296) — (6,799)Equipment (6,845) (549) 120 (7,274)
Total accumulated depreciation (15,990) (1,013) 120 (16,883)
Total capital assets being depreciated, net 8,707 (801) (12) 7,894
Intangible assets 78 2,086 (102) 2,062
Business-type activities capital assets, net $ 21,627 $ 2,209 $ (2,553) $ 21,283
(1) The increases and decreases noted above include adjustments related to prior periods and corrections of errors.
Depreciation expense was charged to governmental functions as follows (in thousands):Depreciation (2)
General government $ 8,190Public safety 7,570Transportation, including depreciation of the highway system maintained by the State 189,740Health and human services 2,480Education 191Natural resources, including depreciation of the state's dams 10,569Depreciation on capital assets held by the internal service funds 16,286
Total depreciation expense – Governmental Activities $ 235,026
Depreciation expense was charged to business-type activities as follows (in thousands):Depreciation (2)
Liquor Stores $ 108State Lottery 52Prison Funds 566West Yellowstone Airport 233Other Enterprise Funds 54
Total depreciation expense – Business-type Activities $ 1,013
(2) Depreciation expenses noted above include adjustments related to prior periods and correction of errors.
A-74

NOTE 6. RETIREMENT PLANS
A. General
The funding policies for each plan provide for periodic employee, employer, and State nonemployer contributions atrates specified by state law. An actuary determines the actuarial implications of the funding requirement in an annualactuarial valuation. The actuarial method used to determine the implications of the statutory funding level is the EntryAge Actuarial Cost Method, with both normal cost and amortization of the unfunded actuarial liability determined asa level percentage of payroll expense. Benefits are established by state law and can only be amended by the Legislature.
Montana State Fund, a discretely presented component unit of the State, by statute, prepares separately issued financialstatements on a calendar year-end basis. Due to the difference in reporting period, there will be a variance between thenote disclosures and the financial statements for some pension related items.
Public Employees’ Retirement Board
The Public Employees’ Retirement Board (PERB) oversees eight defined benefit plans: Public Employees’ RetirementSystem-Defined Benefit Retirement Plan (PERS-DBRP); Judges’ Retirement System (JRS); Highway Patrol Officers’Retirement System (HPORS); Sheriffs’ Retirement System (SRS); Game Wardens’ and Peace Officers’ RetirementSystem (GWPORS); Municipal Police Officers’ Retirement System (MPORS); Firefighters’ Unified Retirement System(FURS); and Volunteer Firefighters’ Compensation Act (VFCA). The PERB also oversees two defined contributionplans: Public Employees’ Retirement System-Defined Contribution Retirement Plan (PERS-DCRP) and the 457-Deferred Compensation Plan (457 Plan). The PERB also oversees education funds related to the pension plans. All ofthe benefit plans, defined benefit and defined contribution, are administered by the Montana Public Employees’Retirement Administration (MPERA). Separately issued financial statements and actuarial reports can be obtained at100 North Park, Suite 200, PO Box 200131, Helena, MT 59620-0131. The financial statements and the latest actuarialvaluation may also be obtained here: http://mpera.mt.gov/. The financial statements for the PERS-DBRP includeactivity for the defined benefit plan and the associated education fund. The PERS-DCRP financial statements includeactivity for the defined contribution plan and the associated education fund.
The PERB is an independent, seven-member board, appointed by the Governor. The members are assigned five-year,staggered terms. The PERB consists of two members at large, two active defined benefit public employees, one activedefined contribution public employee, one member experienced in investments, and one retired public employee. ThePERB approves the annual operating budget, developed by MPERA management, before the beginning of the fiscalyear. As governed by statute, the PERB’s defined benefit administrative expenses may not exceed 1.5% of the totaldefined benefit plan retirement benefits paid. In addition, the PERB decides legislative policy and priorities, hires theexecutive director, establishes the policies and procedures that govern operations at MPERA, and hear and rule onappeal matters of disabilities, retirees, and members. PERB members do not receive compensation for their service tothe MPERA, but are reimbursed for necessary expenses incurred while serving.
All defined benefit pension plans provide retirement, disability, and death benefits to the plan members and theirbeneficiaries. The PERS-DCRP Disability OPEB Plan provides a defined benefit for disabled members of the PERS-DCRP. Beneficiaries do not receive disability benefits but may attain retirement benefits from the PERS-DCRP. Asummary of the plan eligibility and benefits are found in the Summary of Benefits sections throughout Note 6.
Teachers’ Retirement System
The Teachers’ Retirement System (TRS) is a defined benefit plan administered by the Teachers Retirement Board(TRB). The plan prepares a publicly issued comprehensive annual financial report that includes financial statementsand required supplementary information for TRS. Separately issued financial statements, actuarial valuations, andexperience studies can be obtained at 100 N Park Avenue, Suite 110, PO Box 200139, Helena, MT 59620-0319; or canbe found online at https://trs.mt.gov/.
The TRB consists of six members, all of which are appointed by the Governor. Three TRB members must be teachingprofessionals who, when appointed, are active members of TRS; at least one of them must be an active classroomteacher. One TRB member must be a retired teacher who was a member of TRS at the time of retirement. Two TRB
A-75

members are appointed from the public at large. TRB members serve staggered, five-year terms. Three TRB membersconstitutes a quorum.
A summary of the number of participating employer and nonemployer contributing entities as of June 30, 2019, follows:
Classification of Participant GWPORSPERS-DBRP
PERS-DCRP SRS MPORS FURS VFCA TRS
Employer 7 546 320 57 33 27 235 366Nonemployer contributing entity — 1 — — 1 1 1 1
Total Participants 7 547 320 57 34 28 236 367
There are 685 State employees who are eligible to participate in defined benefit pension plans, other than the planslisted above.
B. Summary of Significant Accounting Policies
The MPERA prepares its financial statements using fund accounting principles and the accrual basis of accounting.The basis of accounting indicates the timing of transactions or events for recognition in the financial statements. Planmember contributions, employer contributions, and related receivables are recognized as revenues in the accountingperiod in which they are earned and become measurable, pursuant to formal commitments and statutory requirements.Benefit payments and refunds/distributions are recognized in the accounting period in which they are due and payablein accordance with the terms of each plan. Administrative and other expenses, and the associated liabilities, arerecognized in the period the liability is incurred. Administrative expenses are financed through investment earnings onthe pension trust fund for the defined benefit plans. Interfund receivables and payables exist at year-end for definedbenefit administrative expenses that are accounted for within PERS-DBRP and allocated to the other defined benefitplans at year-end. Costs specifically related to the computer system upgrades are charged directly to the individualplans. The MPERA adheres to all applicable Governmental Accounting Standards Board (GASB) statements.
The TRS prepares its financial statements using the accrual basis of accounting. For the purposes of measuring the netpension liability, deferred inflows of resources, and deferred outflows of resources related to pensions, pension expense,information about the fiduciary net position of the TRS, and additions to/deductions from TRS’s fiduciary net position,the items have been determined on the same accrual basis as they are reported by the TRS. For this purpose, plancontributions are recognized as of employer payroll paid dates. Benefit payments and refunds are recognized when dueand payable in accordance with the benefit terms. Investments are reported at fair value. The TRS adheres to all applicableGASB statements.
The pension trust fund financial statements presented in this report are prepared using the accrual basis of accountingin the same manner as that described for the pension plan administrators above.
A-76
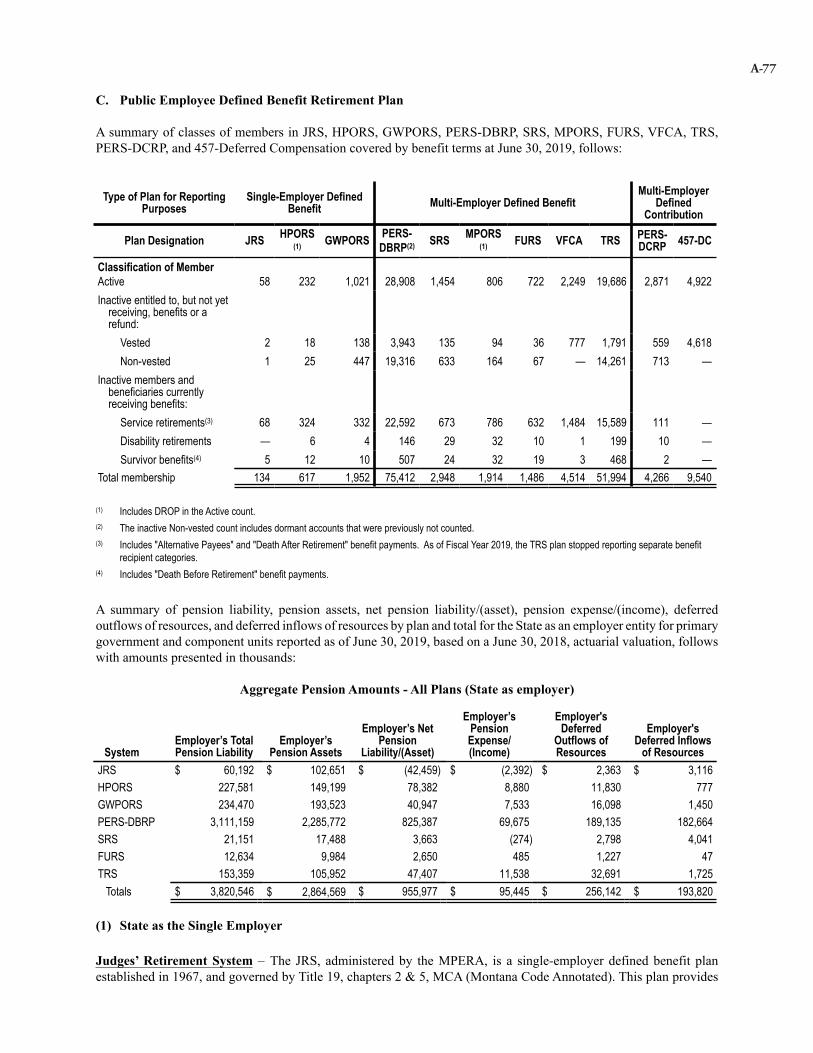
C. Public Employee Defined Benefit Retirement Plan
A summary of classes of members in JRS, HPORS, GWPORS, PERS-DBRP, SRS, MPORS, FURS, VFCA, TRS,PERS-DCRP, and 457-Deferred Compensation covered by benefit terms at June 30, 2019, follows:
Type of Plan for ReportingPurposes
Single-Employer DefinedBenefit Multi-Employer Defined Benefit
Multi-EmployerDefined
Contribution
Plan Designation JRS HPORS(1) GWPORS PERS-
DBRP(2) SRS MPORS(1) FURS VFCA TRS PERS-
DCRP 457-DC
Classification of Member Active 58 232 1,021 28,908 1,454 806 722 2,249 19,686 2,871 4,922Inactive entitled to, but not yet
receiving, benefits or arefund:
Vested 2 18 138 3,943 135 94 36 777 1,791 559 4,618Non-vested 1 25 447 19,316 633 164 67 — 14,261 713 —
Inactive members andbeneficiaries currentlyreceiving benefits:
Service retirements(3) 68 324 332 22,592 673 786 632 1,484 15,589 111 —Disability retirements — 6 4 146 29 32 10 1 199 10 —Survivor benefits(4) 5 12 10 507 24 32 19 3 468 2 —
Total membership 134 617 1,952 75,412 2,948 1,914 1,486 4,514 51,994 4,266 9,540
(1) Includes DROP in the Active count.(2) The inactive Non-vested count includes dormant accounts that were previously not counted.(3) Includes "Alternative Payees" and "Death After Retirement" benefit payments. As of Fiscal Year 2019, the TRS plan stopped reporting separate benefit
recipient categories. (4) Includes "Death Before Retirement" benefit payments.
A summary of pension liability, pension assets, net pension liability/(asset), pension expense/(income), deferredoutflows of resources, and deferred inflows of resources by plan and total for the State as an employer entity for primarygovernment and component units reported as of June 30, 2019, based on a June 30, 2018, actuarial valuation, followswith amounts presented in thousands:
Aggregate Pension Amounts - All Plans (State as employer)
SystemEmployer’s TotalPension Liability
Employer’sPension Assets
Employer’s NetPension
Liability/(Asset)
Employer’sPensionExpense/(Income)
Employer'sDeferred
Outflows ofResources
Employer'sDeferred Inflows
of ResourcesJRS $ 60,192 $ 102,651 $ (42,459) $ (2,392) $ 2,363 $ 3,116HPORS 227,581 149,199 78,382 8,880 11,830 777GWPORS 234,470 193,523 40,947 7,533 16,098 1,450PERS-DBRP 3,111,159 2,285,772 825,387 69,675 189,135 182,664SRS 21,151 17,488 3,663 (274) 2,798 4,041FURS 12,634 9,984 2,650 485 1,227 47TRS 153,359 105,952 47,407 11,538 32,691 1,725
Totals $ 3,820,546 $ 2,864,569 $ 955,977 $ 95,445 $ 256,142 $ 193,820
(1) State as the Single Employer
Judges’ Retirement System – The JRS, administered by the MPERA, is a single-employer defined benefit planestablished in 1967, and governed by Title 19, chapters 2 & 5, MCA (Montana Code Annotated). This plan provides
A-77

retirement benefits for all Montana judges of the district courts, justices of the Supreme Court, the Chief Water Judge,and the Associate Water Judge. Benefits are established by state law and can only be amended by the Legislature. TheJRS provides retirement, disability, and death benefits to plan members and their beneficiaries. Benefits are based oneligibility, years of service and compensation. Member rights are vested after five years of service.
Summary of BenefitsMember’s current salary1 or highest average compensation (HAC)2
1Hired prior to July 1, 1997, and non-Guaranteed Annual Benefit Adjustment (GABA) – monthlycompensation at time of retirement;2Hired on or after July 1, 1997, or electing GABA – HAC during any consecutive 36 months;2Hired on or after July 1, 2013 – 110% annual cap on compensation considered as a part of a member’sHAC.
Eligibility for benefitAge 60, 5 years of membership service;Any age with 5 years of membership service – involuntary termination, actuarially reduced.
Vesting5 years of membership service.
Monthly benefit formula3.33% of current salary1 (non-GABA) or HAC2 (GABA) per year of service credit for the first 15 yearsof service credit, plus 1.785% per year for each year after 15 years.
Guaranteed Annual Benefit Adjustment (GABA)Hired on or after July 1, 1997, or those electing GABA – after the member has completed 12 full monthsof retirement, the member’s benefit increases by a maximum of 3.0% each January, inclusive of all otheradjustments to the member’s benefit.
Minimum benefit adjustment (non-GABA)If hired prior to July 1, 1997, and member did not elect GABA – current salary of an active member insame position is used in the calculation of the monthly benefit each time the Legislature increases salariesfor active judges.
Contributions to the PlanRates are specified by state law for periodic employee and employer contributions. The Legislature has the authorityto establish and amend contribution rates to the plan.
Member contributions to the system – Contributions are deducted from each member’s salary and remittedby the participating employer. An individual account is established for each member’s contributions andinterest allocations until a retirement or refund request is processed. Plan members are required tocontribute 7.0% of the member’s monthly compensation.
Employer contributions to the system – As the employer, the State was required to contribute 25.81%of a member’s compensation until January 1, 2018, at which time the contribution rate was reduced to0% temporarily until June 30, 2019.
Actuarial AssumptionsThe total pension liability/(asset) used to calculate the net pension liability/(asset) was determined by an actuarialvaluation as of June 30, 2017, with update procedures used to roll forward the total pension liability/(asset) to June 30,2018. The actuarial assumptions used in the June 30, 2018, valuation were based on the results of the last actuarialexperience study dated May 2017 for the six-year period ended June 30, 2016. There were several significant assumptionsand other inputs used to measure the total pension liability/(asset). Among those assumptions were the following:
• Investment Return 7.65% • Admin Expense as a % of Payroll 0.18%
A-78
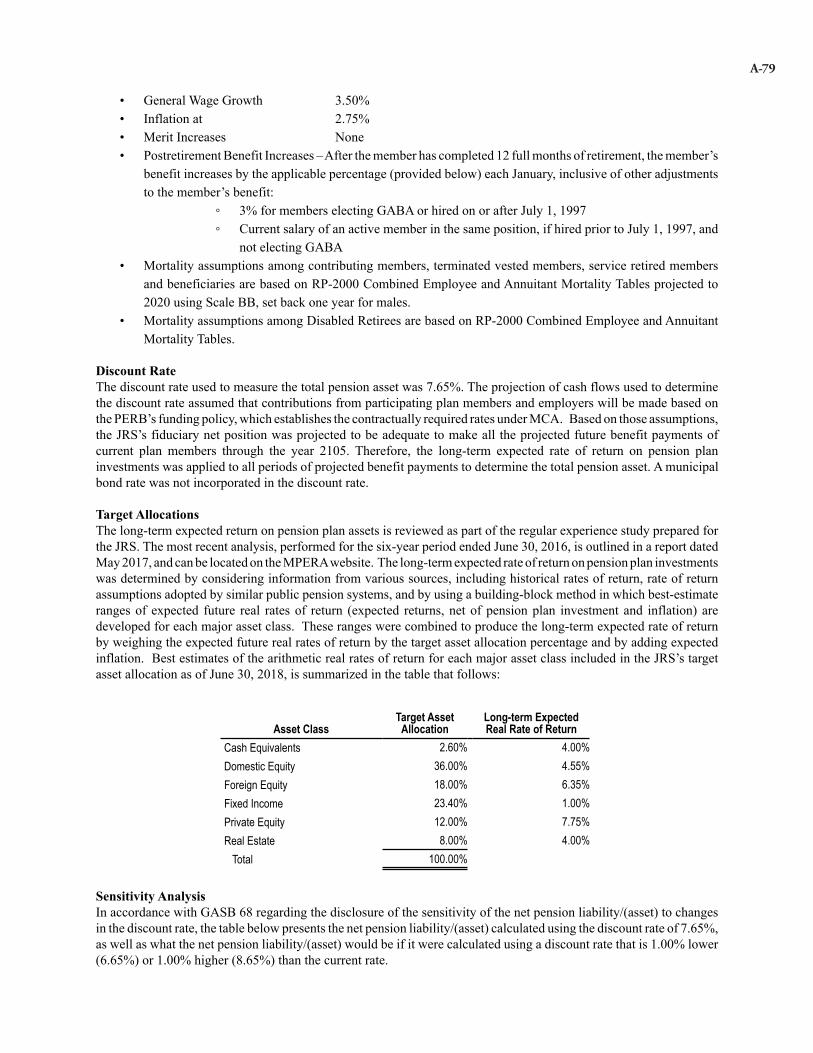
• General Wage Growth 3.50% • Inflation at 2.75% • Merit Increases None • Postretirement Benefit Increases – After the member has completed 12 full months of retirement, the member’s
benefit increases by the applicable percentage (provided below) each January, inclusive of other adjustmentsto the member’s benefit:
◦ 3% for members electing GABA or hired on or after July 1, 1997◦ Current salary of an active member in the same position, if hired prior to July 1, 1997, and
not electing GABA• Mortality assumptions among contributing members, terminated vested members, service retired members
and beneficiaries are based on RP-2000 Combined Employee and Annuitant Mortality Tables projected to2020 using Scale BB, set back one year for males.
• Mortality assumptions among Disabled Retirees are based on RP-2000 Combined Employee and AnnuitantMortality Tables.
Discount RateThe discount rate used to measure the total pension asset was 7.65%. The projection of cash flows used to determinethe discount rate assumed that contributions from participating plan members and employers will be made based onthe PERB’s funding policy, which establishes the contractually required rates under MCA. Based on those assumptions,the JRS’s fiduciary net position was projected to be adequate to make all the projected future benefit payments ofcurrent plan members through the year 2105. Therefore, the long-term expected rate of return on pension planinvestments was applied to all periods of projected benefit payments to determine the total pension asset. A municipalbond rate was not incorporated in the discount rate.
Target AllocationsThe long-term expected return on pension plan assets is reviewed as part of the regular experience study prepared for the JRS. The most recent analysis, performed for the six-year period ended June 30, 2016, is outlined in a report datedMay 2017, and can be located on the MPERA website. The long-term expected rate of return on pension plan investmentswas determined by considering information from various sources, including historical rates of return, rate of returnassumptions adopted by similar public pension systems, and by using a building-block method in which best-estimateranges of expected future real rates of return (expected returns, net of pension plan investment and inflation) aredeveloped for each major asset class. These ranges were combined to produce the long-term expected rate of returnby weighing the expected future real rates of return by the target asset allocation percentage and by adding expectedinflation. Best estimates of the arithmetic real rates of return for each major asset class included in the JRS’s targetasset allocation as of June 30, 2018, is summarized in the table that follows:
Asset ClassTarget Asset
AllocationLong-term ExpectedReal Rate of Return
Cash Equivalents 2.60% 4.00%Domestic Equity 36.00% 4.55%Foreign Equity 18.00% 6.35%Fixed Income 23.40% 1.00%Private Equity 12.00% 7.75%Real Estate 8.00% 4.00%
Total 100.00%
Sensitivity AnalysisIn accordance with GASB 68 regarding the disclosure of the sensitivity of the net pension liability/(asset) to changesin the discount rate, the table below presents the net pension liability/(asset) calculated using the discount rate of 7.65%,as well as what the net pension liability/(asset) would be if it were calculated using a discount rate that is 1.00% lower(6.65%) or 1.00% higher (8.65%) than the current rate.
A-79

(in thousands)1.0% Decrease
(6.65%)Current
Discount Rate1.0% Increase
(8.65%)JRS net pension (asset) $ (36,544) $ (42,459) $ (47,564)
Net Pension AssetIn accordance with GASB 68, the employer is required to recognize and report certain amounts associated with itsparticipation in the JRS. GASB 68 became effective June 30, 2015, and includes requirements for participant to recordand report its net pension asset (NPA), pension expense, deferred inflows of resources and deferred outflows of resourcesassociated with pensions.
(dollars presented in thousands)Net Pension Liability(Asset) as of 6/30/17
Net Pension Liability(Asset) as of 6/30/18 Percent of NPA
Employer’s proportionate share $ (35,855) $ (42,459) 100%
At June 30, 2019, the employer reported a net pension asset of $42.5 million for its proportionate share of the netpension asset. The net pension asset was measured as of June 30, 2018, and the total pension liability used to calculatethe net pension asset was determined by an actuarial valuation as of June 30, 2017, with update procedures used to rollforward the total pension liability to June 30, 2018. The employer’s proportion of the net pension asset was based onthe employer’s contributions received by JRS during the measurement period July 1, 2017, through June 30, 2018,relative to the total employer contributions received from all of the JRS participating employers.
Changes in actuarial assumptions and methods: There were no changes in assumptions or other inputthat affected the measurement of the total pension liability (asset).
Changes in benefit terms: There have been no changes in benefit terms since the previous measurementdate.
Changes in proportionate share: There were no changes between the measurement date of the net pensionasset and the employer’s reporting date that are expected to have a significant effect on the employer’sproportionate share of the net pension asset.
Other Items Related to and Changes in Net Pension Asset
(in thousands)Total Pension
LiabilityPlan FiduciaryNet Position
Net PensionLiability/(Asset)
Balances at 6/30/2017 $ 60,798 $ 96,653 $ (35,855)Service costs 1,664 — 1,664Interest 4,503 — 4,503Difference between expectedand actual experience (2,901) — (2,901)Contributions – employer — 1,085 (1,085)Contributions – member — 575 (575)Net investment income — 8,467 (8,467)Refunds of contributions (149) (149) —Benefit payments (3,723) (3,723) —Administrative expense — (264) 264Other changes — 7 (7)Net changes (606) 5,998 (6,604)
Balances at 6/30/2018 $ 60,192 $ 102,651 $ (42,459)
A-80

Pension ExpenseAt June 30, 2019, the employer recognized pension expense/(income) of $(2.4) million for the JRS.
Deferred Outflows and InflowsAt June 30, 2019, the employer recognized a beginning deferred outflow of resources for fiscal year 2018 contributionsof $1.1 million.
As of the fiscal year ended June 30, 2019, remaining deferred outflows of resources and deferred inflows of resourcesrelated to the JRS are from the following sources:
(in thousands)Deferred Outflows
of ResourcesDeferred Inflows
of ResourcesNet difference between projected and actual
earnings on pension plan investments $ — $ 605Changes of assumptions 1,932 —Differences between expected and actual
experience 431 2,511Totals $ 2,363 $ 3,116
Amounts reported as deferred outflows of resources related to pensions resulting from the employer’s contributionsmade subsequent to the June 30, 2018, measurement date will be recognized as a reduction of the net pension liabilityin the fiscal year ended June 30, 2020.
Other amounts reported as deferred outflows of resources and deferred inflows of resources related to pensions will berecognized in pension expense as follows:
(in thousands)
Year ended June 30:
Amount recognized in PensionExpense as an increase or
(decrease) to Pension Expense2020 $ 6792021 4852022 (1,683)2023 (234)2024 —Thereafter —
Highway Patrol Officers’ Retirement System – The HPORS, administered by the MPERA, is a single-employerdefined benefit plan established in July 1, 1945, and governed by Title 19, chapters 2 & 6, MCA. This plan providesretirement benefits to all members of the Montana Highway Patrol, including supervisory personnel. Benefits areestablished by state law and can only be amended by the Legislature. The HPORS provides retirement, disability, anddeath benefits to plan members and their statutory beneficiaries. Benefits are based on eligibility, years of service, andhighest average compensation. Member rights for death and disability are vested immediately. All other member rightsare vested after 5 or 10 years of service.
Section 19-6-709, MCA provides eligible members retired prior to July 1, 1991, or their survivors, an annualsupplemental lump-sum payment distributed each September. This lump-sum payment is funded by a statutoryappropriation requested by the PERB from the General Fund. Factors impacting eligibility include the number of yearsthe recipient has received a service retirement or disability benefit, the recipient’s age, and whether the recipient isemployed in a position covered by a retirement system under Title 19, MCA.
A-81
Deferred Retirement Option Plan (DROP)Beginning October 1, 2015, eligible members of HPORS can participate in the DROP by filing a one-time irrevocableelection with the PERB. The DROP is governed by Title 19, Chapter 6, Part 10, MCA. A member must have completedat least twenty years of membership service to be eligible. They may elect to participate in the DROP for a minimumof one month and a maximum of 60 months and may only participate in the DROP once. A participant remains a memberof the HPORS, but will not receive membership service or service credit in the system for the duration of the member’sDROP period. During participation in the DROP, all mandatory employer contributions continue to the retirementsystem; mandatory employee contributions are deposited to the members DROP account. A monthly benefit is calculatedbased on salary and years of service to date as of the beginning of the DROP period. The monthly benefit is paid intothe member’s DROP account until the end of the DROP period. At the end of the DROP period, the participant mayreceive the balance of the DROP account in a lump-sum payment or in a direct rollover to another eligible plan, asallowed by the IRS. If the participant continues employment after the DROP period ends, they will again accruemembership service and service credit. The DROP account cannot be distributed until employment is formallyterminated. As of June 30, 2019, the balance held by MPERA for HPORS DROP participants was approximately $2.0million.
Summary of Benefits Member’s highest average compensation (HAC)Hired prior to July 1, 2013 – HAC during any consecutive 36 months;Hired on or after July 1, 2013 – 110% annual cap on compensation considered as a part of a member’sHAC.
Eligibility for benefit20 years of membership service, regardless of age.
Early RetirementHired prior to July 1, 2013 – 5 years of membership service, actuarially reduced from age 60.Hired on or after July 1, 2013 – 10 years of membership service, actuarially reduced from age 60.
Second Retirement (applies to retirement system members who return on or after July 1, 2017 to activeservice covered by the system from which they retired):
a. If the member works more than 480 hours in a calendar year and accumulates less than5 years of service credit before terminating again, the member:
• is not awarded service credit for the period of reemployment;• is refunded the accumulated contributions associated with the period of
reemployment;• starting the first month following termination of service, receives the same
retirement benefit previously paid to the member; and • does not accrue post-retirement benefit adjustments during the term of
reemployment but receives a GABA in January immediately followingthe second retirement.
b. If the member works more than 480 hours in a calendar year and accumulates at least 5years of service credit before terminating again, the member:
• is awarded service credit for the period of reemployment;• starting the first month following termination of service, receives:
◦ the same retirement benefit previously paid to the member; and◦ a second retirement benefit for the period of reemployment
calculated based on the laws in effect as of the member's rehiredate; and
• does not accrue post-retirement benefit adjustments during the term ofreemployment but receive a GABA:
◦ on the initial retirement benefit starting January immediatelyfollowing second retirement; and
◦ on the second retirement benefit starting in January afterreceiving that benefit for at least 12 months
A-82

Deferred Retirement Option Plan (DROP)Beginning October 1, 2015, eligible members of HPORS can participate in the DROP by filing a one-time irrevocableelection with the PERB. The DROP is governed by Title 19, Chapter 6, Part 10, MCA. A member must have completedat least twenty years of membership service to be eligible. They may elect to participate in the DROP for a minimumof one month and a maximum of 60 months and may only participate in the DROP once. A participant remains a memberof the HPORS, but will not receive membership service or service credit in the system for the duration of the member’sDROP period. During participation in the DROP, all mandatory employer contributions continue to the retirementsystem; mandatory employee contributions are deposited to the members DROP account. A monthly benefit is calculatedbased on salary and years of service to date as of the beginning of the DROP period. The monthly benefit is paid intothe member’s DROP account until the end of the DROP period. At the end of the DROP period, the participant mayreceive the balance of the DROP account in a lump-sum payment or in a direct rollover to another eligible plan, asallowed by the IRS. If the participant continues employment after the DROP period ends, they will again accruemembership service and service credit. The DROP account cannot be distributed until employment is formallyterminated. As of June 30, 2019, the balance held by MPERA for HPORS DROP participants was approximately $2.0million.
Summary of Benefits Member’s highest average compensation (HAC)Hired prior to July 1, 2013 – HAC during any consecutive 36 months;Hired on or after July 1, 2013 – 110% annual cap on compensation considered as a part of a member’sHAC.
Eligibility for benefit20 years of membership service, regardless of age.
Early RetirementHired prior to July 1, 2013 – 5 years of membership service, actuarially reduced from age 60.Hired on or after July 1, 2013 – 10 years of membership service, actuarially reduced from age 60.
Second Retirement (applies to retirement system members who return on or after July 1, 2017 to activeservice covered by the system from which they retired):
a. If the member works more than 480 hours in a calendar year and accumulates less than5 years of service credit before terminating again, the member:
• is not awarded service credit for the period of reemployment;• is refunded the accumulated contributions associated with the period of
reemployment;• starting the first month following termination of service, receives the same
retirement benefit previously paid to the member; and • does not accrue post-retirement benefit adjustments during the term of
reemployment but receives a GABA in January immediately followingthe second retirement.
b. If the member works more than 480 hours in a calendar year and accumulates at least 5years of service credit before terminating again, the member:
• is awarded service credit for the period of reemployment;• starting the first month following termination of service, receives:
◦ the same retirement benefit previously paid to the member; and◦ a second retirement benefit for the period of reemployment
calculated based on the laws in effect as of the member's rehiredate; and
• does not accrue post-retirement benefit adjustments during the term ofreemployment but receive a GABA:
◦ on the initial retirement benefit starting January immediatelyfollowing second retirement; and
◦ on the second retirement benefit starting in January afterreceiving that benefit for at least 12 months
c. A member who returns to covered service is not eligible for a disability benefit.
VestingHired prior to July 1, 2013 – 5 years of membership service.Hired on or after July 1, 2013 – 10 years of membership service.
Monthly benefit formulaRetire prior to July 1, 2013 – 2.5% of HAC per year of service credit.Retire on or after July 1, 2013 – 2.6% of HAC per year of service credit.
Guaranteed Annual Benefit Adjustment (GABA)Hired on or after July 1, 1997, or those electing GABA – after the member has completed 12 full monthsof retirement, the member’s benefit increases by a maximum of 3.0% each January, inclusive of all otheradjustments to the member’s benefit.
Hired on or after July 1, 2013 – after the member has completed 36 full months of retirement, themember’s benefit increase by a maximum of 1.5% each January, inclusive of all other adjustments tothe member’s benefit.
Minimum Monthly Benefit (non-GABA)If hired prior to July 1, 1997, and member did not elect GABA – the minimum monthly benefit is equalto 2% of the service credit multiplied by the current base compensation of a probationary highway patrolofficer. Any annual increase is limited to 5.0% over the current benefit and may not exceed 60% of thecurrent base salary of a probationary officer.
Contributions to the PlanRates are specified by state law for periodic employee and employer contributions. The Legislature has the authorityto establish and amend contribution rates to the plan.
Member contributions to the system – Contributions are deducted from each member’s salary andremitted by participating employer. Hired prior to July 1, 1997, and not electing GABA – Plan members are required to contribute 13.00%.Hired after June 30, 1997, and electing GABA – Plan members are required to contribute 13.05%.
Employer contributions to the system – As the employer, the State is required to contribute 38.33% ofa member’s compensation. The first 28.15% is payable from the same sources used to pay a member’scompensation. The remaining amount, equal to 10.18%, is payable from the General Fund through astatutory appropriation.
Actuarial AssumptionsThe total pension liability used to calculate the net pension liability was determined by an actuarial valuation as of June30, 2017, with update procedures used to roll forward the total pension liability to June 30, 2018. The actuarialassumptions used in the June 30, 2018, valuation were based on the results of the last actuarial experience study, datedMay 2017 for the six-year period ended June 30, 2016. There were several significant assumptions and other inputsused to measure the total pension liability. Among those assumptions were the following:
• Investment Return 7.65%• Administrative Expense as a % of Payroll 0.30%• General Wage Growth 3.50%• Inflation at 2.75%• Merit Increases 0 to 6.30%• Postretirement Benefit Increases – After the member has completed 12 full months of retirement, the member’s
benefit increases by the applicable percentage each January, inclusive of other adjustments to the member’sbenefit:
◦ If electing GABA or hired on or after July 1, 1997 – 3.00%◦ Hired on or after July 1, 2013 – 1.50%
A-83
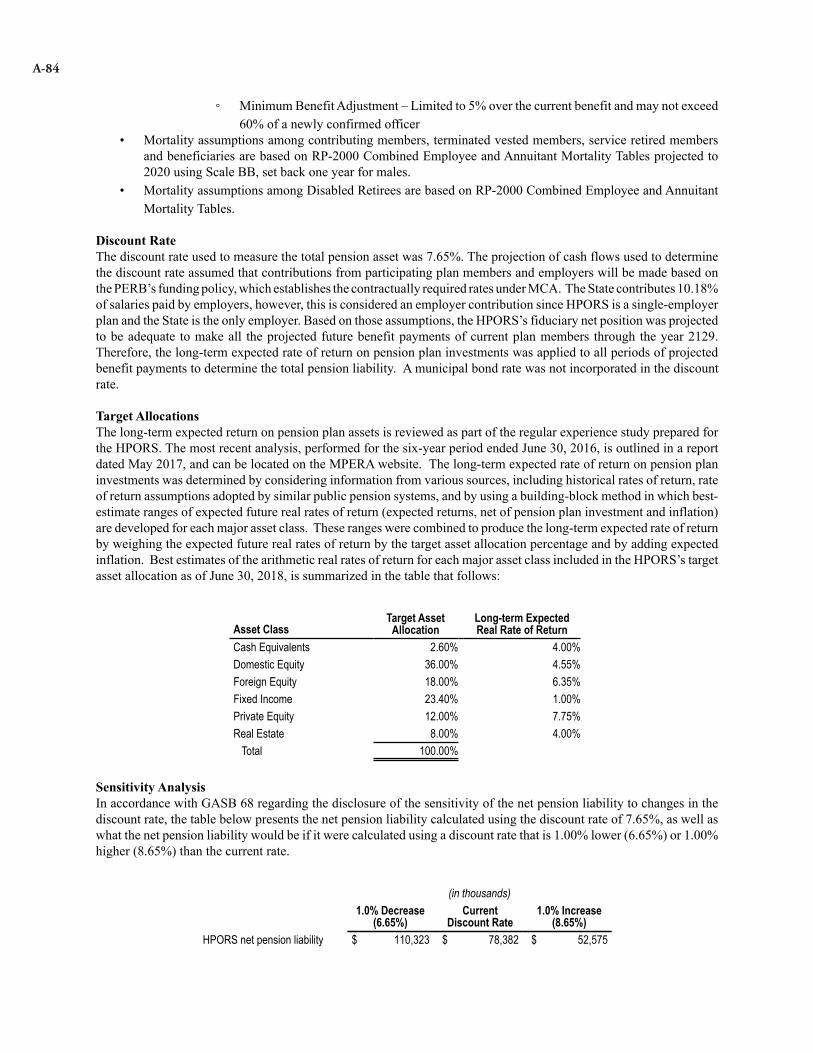
◦ Minimum Benefit Adjustment – Limited to 5% over the current benefit and may not exceed60% of a newly confirmed officer
• Mortality assumptions among contributing members, terminated vested members, service retired membersand beneficiaries are based on RP-2000 Combined Employee and Annuitant Mortality Tables projected to2020 using Scale BB, set back one year for males.
• Mortality assumptions among Disabled Retirees are based on RP-2000 Combined Employee and AnnuitantMortality Tables.
Discount RateThe discount rate used to measure the total pension asset was 7.65%. The projection of cash flows used to determinethe discount rate assumed that contributions from participating plan members and employers will be made based onthe PERB’s funding policy, which establishes the contractually required rates under MCA. The State contributes 10.18%of salaries paid by employers, however, this is considered an employer contribution since HPORS is a single-employerplan and the State is the only employer. Based on those assumptions, the HPORS’s fiduciary net position was projectedto be adequate to make all the projected future benefit payments of current plan members through the year 2129.Therefore, the long-term expected rate of return on pension plan investments was applied to all periods of projectedbenefit payments to determine the total pension liability. A municipal bond rate was not incorporated in the discountrate.
Target AllocationsThe long-term expected return on pension plan assets is reviewed as part of the regular experience study prepared for the HPORS. The most recent analysis, performed for the six-year period ended June 30, 2016, is outlined in a reportdated May 2017, and can be located on the MPERA website. The long-term expected rate of return on pension planinvestments was determined by considering information from various sources, including historical rates of return, rateof return assumptions adopted by similar public pension systems, and by using a building-block method in which best-estimate ranges of expected future real rates of return (expected returns, net of pension plan investment and inflation)are developed for each major asset class. These ranges were combined to produce the long-term expected rate of returnby weighing the expected future real rates of return by the target asset allocation percentage and by adding expectedinflation. Best estimates of the arithmetic real rates of return for each major asset class included in the HPORS’s targetasset allocation as of June 30, 2018, is summarized in the table that follows:
Asset ClassTarget Asset
AllocationLong-term ExpectedReal Rate of Return
Cash Equivalents 2.60% 4.00%Domestic Equity 36.00% 4.55%Foreign Equity 18.00% 6.35%Fixed Income 23.40% 1.00%Private Equity 12.00% 7.75%Real Estate 8.00% 4.00%
Total 100.00%
Sensitivity AnalysisIn accordance with GASB 68 regarding the disclosure of the sensitivity of the net pension liability to changes in thediscount rate, the table below presents the net pension liability calculated using the discount rate of 7.65%, as well aswhat the net pension liability would be if it were calculated using a discount rate that is 1.00% lower (6.65%) or 1.00%higher (8.65%) than the current rate.
(in thousands)1.0% Decrease
(6.65%)Current
Discount Rate1.0% Increase
(8.65%)HPORS net pension liability $ 110,323 $ 78,382 $ 52,575
A-84

Net Pension LiabilityIn accordance with GASB 68, employer is required to recognize and report certain amounts associated with itsparticipation in the HPORS. GASB 68 became effective June 30, 2015, and includes requirements for participant torecord and report its net pension liability (NPL), pension expense, deferred inflows or resources, and deferred outflowsof resources associated with pensions.
(dollars presented in thousands)Net Pension Liability
as of 6/30/17Net Pension Liability
as of 6/30/18 Percent of NPLEmployer's proportionate share $ 78,385 $ 78,382 100%
At June 30, 2019, the employer reported a liability of $78.4 million for its proportionate share of the net pension liability.The net pension liability was measured as of June 30, 2018, and the total pension liability used to calculate the netpension liability was determined by an actuarial valuation as of June 30, 2017, with update procedures used to rollforward the total pension liability to June 30, 2018. The employer’s proportion of the net pension liability was basedon the employer’s contributions received by HPORS during the measurement period July 1, 2017, through June 30,2018, relative to the total employer contributions received from all of the HPORS participating employers.
Changes in actuarial assumptions and methods: There were no changes in assumptions or other inputsthat affected the measurement of the total pension liability.
Changes in benefit terms: There have been no changes in benefit terms since the previous measurementdate.
Changes in proportionate share: There were no changes between the measurement date of the net pensionliability and the employer’s reporting date that are expected to have a significant effect on the employer’sproportionate share of the net pension liability.
Other Items Related to and Changes in Net Pension Liability
(in thousands)Total Pension
LiabilityPlan FiduciaryNet Position
Net PensionLiability
Balances at 6/30/2017 $ 218,922 $ 140,537 $ 78,385Service costs 3,643 — 3,643Interest 16,294 — 16,294Difference expected and actual experience 590 — 590Contributions – employer — 5,858 (5,858)Contributions – non-employer (State) — 250 (250)Contributions – member — 2,387 (2,387)Net investment income — 12,283 (12,283)Refund of contributions (322) (322) —Benefit payments (11,546) (11,546) —Administrative expense — (256) 256Other changes — 8 (8)Net changes 8,659 8,662 (3)
Balances at 6/30/2018 $ 227,581 $ 149,199 $ 78,382
Pension ExpenseAt June 30, 2019, the employer recognized pension expense of $8.9 million for the HPORS.
A-85

Deferred Outflows and InflowsAt June 30, 2019, the employer recognized a beginning deferred outflow of resources for fiscal year 2018 contributionsof $6.1 million.
As of the fiscal year ended June 30, 2019, remaining deferred outflows of resources and deferred inflows of resourcesrelated to the HPORS are from the following sources:
(in thousands)Deferred Outflows
of ResourcesDeferred Inflows of
ResourcesDifference between expected and actual experience $ 1,833 $ —
Changes of assumptions 3,946 —Net difference between projected and actual
earnings on pension plan investments — 777Contributions paid to HPORS subsequent to the
measurement date – FY 2019 contributions 6,051 —Totals $ 11,830 $ 777
Amounts reported as deferred outflows of resources related to pensions resulting from the employer’s contributionsmade subsequent to the June 30, 2018, measurement date will be recognized as a reduction of the net pension liabilityin the fiscal year ended June 30, 2020.
Other amounts reported as deferred outflows of resources and deferred inflows of resources related to pensions will berecognized in pension expense as follows:
(in thousands)
Year endedJune 30:
Amount recognized in PensionExpense as an increase or(decrease) to Pension Expense
2020 $ 3,6802021 2,8912022 (1,235)2023 (334)2024 —Thereafter —
Game Wardens’ & Peace Officers’ Retirement System – The GWPORS, administered by the MPERA, is a multi-employer, cost-sharing defined benefit plan established in 1963, and governed by Title 19, chapters 2 & 8, MCA. Thisplan provides retirement benefits to all persons employed as a game warden, warden supervisory personnel, or statepeace officer. Benefits are established by state law and can only be amended by the Legislature. The GWPORS providesretirement, disability and death benefits to plan members and their beneficiaries. Benefits are based on eligibility, yearsof service and highest average compensation.
The State of Montana and its discretely presented component units are the only employers who participate in theGWPORS. Therefore, while the plan is considered to be a multi-employer, cost-sharing defined benefit plan for actuarialvaluation purposes, in accordance with GASB 68, the plan is treated as if it were a single-employer defined benefitpension plan type for financial reporting.
A-86
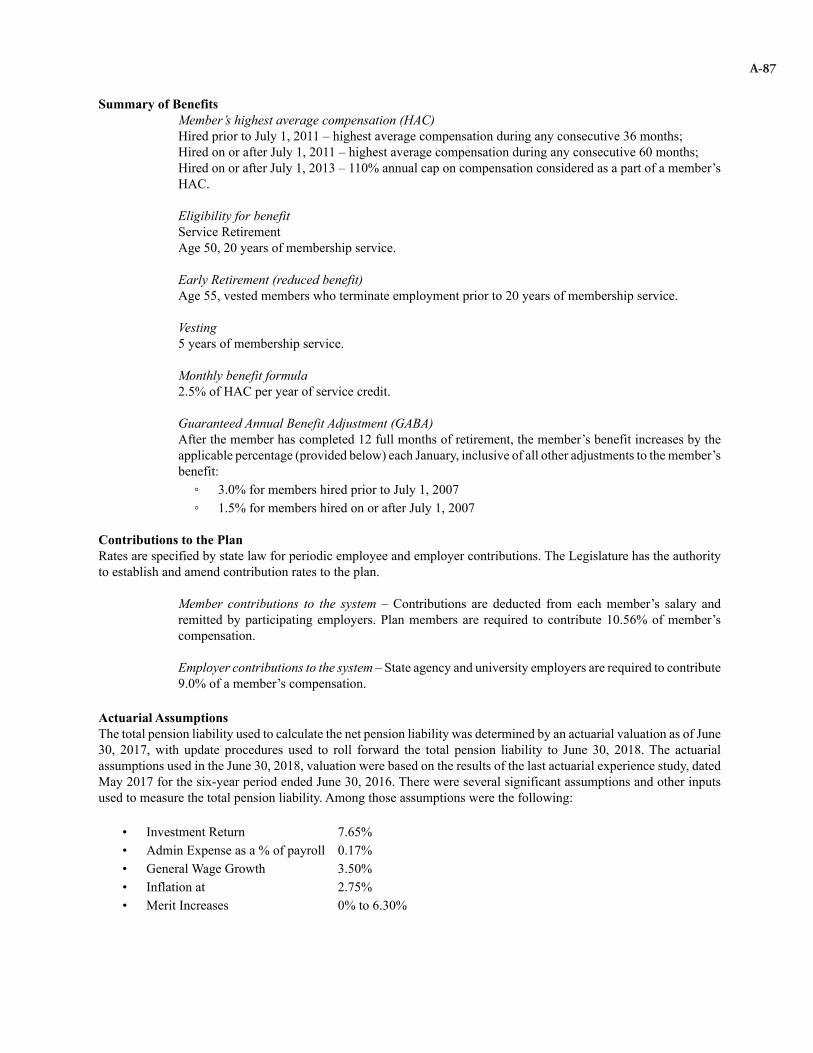
Deferred Outflows and InflowsAt June 30, 2019, the employer recognized a beginning deferred outflow of resources for fiscal year 2018 contributionsof $6.1 million.
As of the fiscal year ended June 30, 2019, remaining deferred outflows of resources and deferred inflows of resourcesrelated to the HPORS are from the following sources:
(in thousands)Deferred Outflows
of ResourcesDeferred Inflows of
ResourcesDifference between expected and actual experience $ 1,833 $ —
Changes of assumptions 3,946 —Net difference between projected and actual
earnings on pension plan investments — 777Contributions paid to HPORS subsequent to the
measurement date – FY 2019 contributions 6,051 —Totals $ 11,830 $ 777
Amounts reported as deferred outflows of resources related to pensions resulting from the employer’s contributionsmade subsequent to the June 30, 2018, measurement date will be recognized as a reduction of the net pension liabilityin the fiscal year ended June 30, 2020.
Other amounts reported as deferred outflows of resources and deferred inflows of resources related to pensions will berecognized in pension expense as follows:
(in thousands)
Year endedJune 30:
Amount recognized in PensionExpense as an increase or(decrease) to Pension Expense
2020 $ 3,6802021 2,8912022 (1,235)2023 (334)2024 —Thereafter —
Game Wardens’ & Peace Officers’ Retirement System – The GWPORS, administered by the MPERA, is a multi-employer, cost-sharing defined benefit plan established in 1963, and governed by Title 19, chapters 2 & 8, MCA. Thisplan provides retirement benefits to all persons employed as a game warden, warden supervisory personnel, or statepeace officer. Benefits are established by state law and can only be amended by the Legislature. The GWPORS providesretirement, disability and death benefits to plan members and their beneficiaries. Benefits are based on eligibility, yearsof service and highest average compensation.
The State of Montana and its discretely presented component units are the only employers who participate in theGWPORS. Therefore, while the plan is considered to be a multi-employer, cost-sharing defined benefit plan for actuarialvaluation purposes, in accordance with GASB 68, the plan is treated as if it were a single-employer defined benefitpension plan type for financial reporting.
Summary of BenefitsMember’s highest average compensation (HAC)Hired prior to July 1, 2011 – highest average compensation during any consecutive 36 months; Hired on or after July 1, 2011 – highest average compensation during any consecutive 60 months; Hired on or after July 1, 2013 – 110% annual cap on compensation considered as a part of a member’sHAC.
Eligibility for benefit Service RetirementAge 50, 20 years of membership service.
Early Retirement (reduced benefit) Age 55, vested members who terminate employment prior to 20 years of membership service.
Vesting 5 years of membership service.
Monthly benefit formula 2.5% of HAC per year of service credit.
Guaranteed Annual Benefit Adjustment (GABA) After the member has completed 12 full months of retirement, the member’s benefit increases by theapplicable percentage (provided below) each January, inclusive of all other adjustments to the member’sbenefit:
◦ 3.0% for members hired prior to July 1, 2007 ◦ 1.5% for members hired on or after July 1, 2007
Contributions to the PlanRates are specified by state law for periodic employee and employer contributions. The Legislature has the authorityto establish and amend contribution rates to the plan.
Member contributions to the system – Contributions are deducted from each member’s salary andremitted by participating employers. Plan members are required to contribute 10.56% of member’scompensation.
Employer contributions to the system – State agency and university employers are required to contribute9.0% of a member’s compensation.
Actuarial AssumptionsThe total pension liability used to calculate the net pension liability was determined by an actuarial valuation as of June30, 2017, with update procedures used to roll forward the total pension liability to June 30, 2018. The actuarialassumptions used in the June 30, 2018, valuation were based on the results of the last actuarial experience study, datedMay 2017 for the six-year period ended June 30, 2016. There were several significant assumptions and other inputsused to measure the total pension liability. Among those assumptions were the following:
• Investment Return 7.65% • Admin Expense as a % of payroll 0.17%• General Wage Growth 3.50% • Inflation at 2.75%• Merit Increases 0% to 6.30%
A-87

• Postretirement Benefit Increases – After the member has completed 12 full months of retirement, the member’sbenefit increases by the applicable percentage each January, inclusive of other adjustments to the member’sbenefit:
◦ 3.00% for members hired prior to July 1, 2007 ◦ 1.50% for members hired on or after July 1, 2007
• Mortality assumptions among contributing members, terminated vested members, service retired membersand beneficiaries are based on RP-2000 Combined Employee and Annuitant Mortality Tables projected to2020 using Scale BB, set back one year for males.
• Mortality assumptions among Disabled Retirees are based on RP-2000 Combined Employee and AnnuitantMortality Tables.
Discount RateThe discount rate used to measure the total pension asset was 7.65%. The projection of cash flows used to determinethe discount rate assumed that contributions from participating plan members and employers will be made based onthe PERB’s funding policy, which establishes the contractually required rates under MCA. Based on those assumptions,the GWPORS’s fiduciary net position was projected to be adequate to make all the projected future benefit paymentsof current plan members through the year 2117. Therefore, the long-term expected rate of return on pension planinvestments was applied to all periods of projected benefit payments to determine the total pension liability. A municipalbond rate was not incorporated in the discount rate.
Target AllocationsThe long-term expected return on pension plan assets is reviewed as part of the regular experience study prepared for the GWPORS. The most recent analysis, performed for the six-year period ended June 30, 2016, is outlined in a reportdated May 2017, and can be located on the MPERA website. The long-term expected rate of return on pension planinvestments was determined by considering information from various sources, including historical rates of return, rateof return assumptions adopted by similar public pension systems, and by using a building-block method in which best-estimate ranges of expected future real rates of return (expected returns, net of pension plan investment and inflation)are developed for each major asset class. These ranges were combined to produce the long-term expected rate of returnby weighing the expected future real rates of return by the target asset allocation percentage and by adding expectedinflation. Best estimates of the arithmetic real rates of return for each major asset class included in the GWPORS’starget asset allocation as of June 30, 2018, is summarized in the table that follows:
Asset ClassTarget Asset
AllocationLong-term ExpectedReal Rate of Return
Cash Equivalents 2.60% 4.00%Domestic Equity 36.00% 4.55%Foreign Equity 18.00% 6.35%Fixed Income 23.40% 1.00%Private Equity 12.00% 7.75%Real Estate 8.00% 4.00%
Total 100.00%
A-88

Sensitivity AnalysisIn accordance with GASB 68 regarding the disclosure of the sensitivity of the net pension liability to changes in thediscount rate, the table below presents the net pension liability calculated using the discount rate of 7.65%, as well aswhat the net pension liability would be if it were calculated using a discount rate that is 1.00% lower (6.65%) or 1.00%higher (8.65%) than the current rate.
(in thousands)
1.0% Decrease(6.65%)
CurrentDiscount Rate
1.0% Increase(8.65%)
Primary government employer GWPORS net pensionliability $ 72,781 $ 38,851 $ 11,194
Discretely presented component units employerGWPORS net pension liability 3,927 2,096 604Total employer GWPORS net pension liability $ 76,708 $ 40,947 $ 11,798
Net Pension LiabilityIn accordance with GASB 68, employers are required to recognize and report certain amounts associated with theirparticipation in the GWPORS. Statement 68 became effective June 30, 2015, and includes requirements for participantsto record and report their proportionate share of the collective net pension liability (NPL), pension expense, deferredinflows of resources and deferred outflows of resources associated with pensions.
(dollars presented in thousands)Net Pension
Liability as of 6/30/17
Net PensionLiability
as of 6/30/18Percent of
Collective NPLPrimary government employer proportionate share $ 35,297 $ 38,851 94.880929%Discretely presented component units employer
proportionate share 2,063 2,096 5.119071%
Total employer GWPORS proportionate share $ 37,360 $ 40,947 100%
At June 30, 2019, the employer reported a total liability of $40.9 million for its proportionate share of the net pensionliability. The net pension liability was measured as of June 30, 2018, and the total pension liability used to calculatethe net pension liability was determined by an actuarial valuation as of June 30, 2017, with update procedures used toroll forward the total pension liability to June 30, 2018. The employer’s proportion of the net pension liability wasbased on the employer’s contributions received by GWPORS during the measurement period July 1, 2017, throughJune 30, 2018, relative to the total employer contributions received from all of GWPORS participating employers.
Changes in actuarial assumptions and methods: There were no changes in assumptions or other inputs thataffected the measurement of the total pension liability.
Changes in benefit terms: There have been no changes in benefit terms since the previous measurement date.
Changes in proportionate share: Between the measurement date of the collective net pension liability and theemployer’s reporting date, there were no changes in proportion that are expected to have a significant effecton the employer’s proportionate share of the collective net pension liability.
A-89

Other Items Related to and Changes in Net Pension LiabilityThe State, as the primary government employer, has the following balances and changes related to the GWPORS’s NetPension Liability:
(in thousands)Total Pension
LiabilityPlan FiduciaryNet Position
Net PensionLiability
Balances at 6/30/2017 $ 201,284 $ 165,987 $ 35,297Service costs 7,683 — 7,683Interest 15,198 — 15,198Difference between expected
and actual experience 4,536 — 4,536Contributions – employer — 4,377 (4,377)Contributions – member — 5,230 (5,230)Net investment income — 14,776 (14,776)Refunds of contributions (1,049) (1,049) —Benefit payments (6,189) (6,189) —Administrative expense — (350) 350Other changes (1) 1,004 834 170Net changes 21,183 17,629 3,554
Balances at 6/30/2018 $ 222,467 $ 183,616 $ 38,851(1) The Changes in Net Pension Liability table is only provided at the system level. The ending balances and thecomponents of the changes are derived from the primary government's proportionate share of the total planbalances and the discretely presented component unit's proportionate share of the total plan balances. Due to thechange in proportionate share in each year, the other changes line item includes the difference between theproportionate share of the balances and the preliminary calculated balances.
The State’s discretely presented component units, as employers, have the following balances and changes related tothe GWPORS’s Net Pension Liability:
(in thousands)Total Pension
LiabilityPlan FiduciaryNet Position
Net PensionLiability
Balances at 6/30/2017 $ 11,917 $ 9,854 $ 2,063Service costs 415 — 415Interest 820 — 820Difference between expected
and actual experience 245 — 245
Contributions - employer — 236 (236)Contributions - member — 282 (282)Net investment income — 797 (797)Refunds of contributions (56) (56) —Benefit payments (334) (334) —Administrative expense — (19) 19Other changes (1) (1,004) (853) (151)Net changes 86 53 33
Balances at 6/30/2018 $ 12,003 $ 9,907 $ 2,096(1) The Changes in Net Pension Liability table is only provided at the system level. The ending balances and thecomponents of the changes are derived from the primary government's proportionate share of the total planbalances and the discretely presented component unit's proportionate share of the total plan balances. Due to thechange in proportionate share in each year, the other changes line item includes the difference between theproportionate share of the balances and the preliminary calculated balances.
A-90

Other Items Related to and Changes in Net Pension LiabilityThe State, as the primary government employer, has the following balances and changes related to the GWPORS’s NetPension Liability:
(in thousands)Total Pension
LiabilityPlan FiduciaryNet Position
Net PensionLiability
Balances at 6/30/2017 $ 201,284 $ 165,987 $ 35,297Service costs 7,683 — 7,683Interest 15,198 — 15,198Difference between expected
and actual experience 4,536 — 4,536Contributions – employer — 4,377 (4,377)Contributions – member — 5,230 (5,230)Net investment income — 14,776 (14,776)Refunds of contributions (1,049) (1,049) —Benefit payments (6,189) (6,189) —Administrative expense — (350) 350Other changes (1) 1,004 834 170Net changes 21,183 17,629 3,554
Balances at 6/30/2018 $ 222,467 $ 183,616 $ 38,851(1) The Changes in Net Pension Liability table is only provided at the system level. The ending balances and thecomponents of the changes are derived from the primary government's proportionate share of the total planbalances and the discretely presented component unit's proportionate share of the total plan balances. Due to thechange in proportionate share in each year, the other changes line item includes the difference between theproportionate share of the balances and the preliminary calculated balances.
The State’s discretely presented component units, as employers, have the following balances and changes related tothe GWPORS’s Net Pension Liability:
(in thousands)Total Pension
LiabilityPlan FiduciaryNet Position
Net PensionLiability
Balances at 6/30/2017 $ 11,917 $ 9,854 $ 2,063Service costs 415 — 415Interest 820 — 820Difference between expected
and actual experience 245 — 245
Contributions - employer — 236 (236)Contributions - member — 282 (282)Net investment income — 797 (797)Refunds of contributions (56) (56) —Benefit payments (334) (334) —Administrative expense — (19) 19Other changes (1) (1,004) (853) (151)Net changes 86 53 33
Balances at 6/30/2018 $ 12,003 $ 9,907 $ 2,096(1) The Changes in Net Pension Liability table is only provided at the system level. The ending balances and thecomponents of the changes are derived from the primary government's proportionate share of the total planbalances and the discretely presented component unit's proportionate share of the total plan balances. Due to thechange in proportionate share in each year, the other changes line item includes the difference between theproportionate share of the balances and the preliminary calculated balances.
Pension ExpenseAt June 30, 2019, the employer recognized a total pension expense of $7.5 million for its proportionate share of theGWPORS pension expense: $7.2 million related to the primary government and $360.3 thousand related to componentunits.
Deferred Outflows and InflowsAt June 30, 2019, the State, as a primary government employer, recognized a beginning deferred outflow of resourcesfor fiscal year 2018 contributions of $4.3 million.
As of the fiscal year ended June 30, 2019, remaining deferred outflows of resources and deferred inflows of resourcesfor the primary government, as an employer, related to the GWPORS are from the following sources:
(in thousands)Deferred Outflows
of ResourcesDeferred Inflows
of ResourcesDifference between expected and actual experience $ 7,340 $ —Net difference between projected and actual earnings
on pension plan investments — 1,195
Changes in assumptions 3,346 —Changes in proportion and differences between
employer contributions and proportionate shareof contributions
191 111
Contributions paid to GWPORS subsequent to themeasurement date – FY 2019 contributions 4,419 —
Totals $ 15,296 $ 1,306
Amounts reported as deferred outflows of resources related to pensions resulting from the employer’s contributionsmade subsequent to the June 30, 2018, measurement date will be recognized as a reduction of the net pension liabilityin the fiscal year ended June 30, 2020.
Other amounts reported as deferred inflows of resources related to pensions will be recognized in pension expense asfollows:
(in thousands)
Year ended June 30:
Amount recognized in PensionExpense as an increase or
(decrease) to Pension Expense2020 $ 4,1142021 3,2702022 1,6642023 5232024 —Thereafter —
The State’s discretely presented component units, as employers, recognized a beginning deferred outflow of resourcesfor fiscal year 2018 contributions of $234.2 thousand.
A-91

As of the fiscal year ended June 30, 2019, remaining deferred outflows of resources and deferred inflows of resourcesfor the State’s discretely presented component units, as employers, related to the GWPORS are from the followingsources:
(in thousands)Deferred Outflows
of ResourcesDeferred Inflows
of ResourcesDifference between expected and actual experience $ 396 $ —Net difference between projected and actual earnings
on pension plan investments — 64
Changes in assumptions 181 —Changes in proportion and differences between
employer contributions and proportionate shareof contributions
— 80
Contributions paid to GWPORS subsequent to themeasurement date – FY 2019 contributions 225 —
Totals $ 802 $ 144
Amounts reported as deferred outflows of resources related to pensions resulting from the employer’s contributionsmade subsequent to the June 30, 2018, measurement date will be recognized as a reduction of the net pension liabilityin the fiscal year ended June 30, 2020.
Other amounts reported as deferred outflows of resources and deferred inflows of resources related to pensions will berecognized in pension expense as follows:
(in thousands)
Year ended June 30:
Amount recognized in PensionExpense as an increase or
(decrease) to Pension Expense2020 $ 1952021 1502022 632023 252024 —Thereafter —
(2) State as an Employer and/or a Nonemployer Contributing Entity to Cost-Sharing Multiple-Employer Plans
Public Employees’ Retirement System - Defined Benefit Retirement Plan – The PERS-DBRP, administered by theMPERA, is a multiple-employer, cost-sharing plan established July 1, 1945, and governed by Title 19, Chapters 2 &3, MCA. This plan covers employees of the State and local governments, and certain employees of the MontanaUniversity System and school districts.
All new members are initially members of the PERS-DBRP and have a 12-month window during which they maychoose to remain in the PERS-DBRP or join the Public Employees’ Retirement System-Defined Contribution RetirementPlan (PERS-DCRP) by filing an irrevocable election. Members may not be participants of both the defined contributionand defined benefit retirement plans. All new members from the universities also have a third option to join the universitysystem’s Montana University System-Retirement Program (MUS-RP).
The PERS-DBRP provides retirement, disability, and death benefits to plan members and their beneficiaries. Benefitsare established by state law and can only be amended by the Legislature. Benefits are based on eligibility, years ofservice, and highest average compensation.
A-92

Summary of BenefitsMember’s highest average compensation (HAC) Hired prior to July 1, 2011 – HAC during any consecutive 36 months; Hired on or after July 1, 2011 – HAC during any consecutive 60 months; Hired on or after July 1, 2013 – 110% annual cap on compensation considered as a part of a member’sHAC. Eligibility for benefit Service retirement:
Hired prior to July 1, 2011 –Age 60, 5 years of membership service; Age 65, regardless of membership service; or Any age, 30 years of membership service.
Hired on or after July 1, 2011 –Age 65, 5 years of membership service; Age 70, regardless of membership service.
Early retirement, actuarially reduced: Hired prior to July 1, 2011 –Age 50, 5 years of membership service; or Any age, 25 years of membership service.Hired on or after July 1, 2011 – Age 55, 5 years of membership service.
Second retirement (all require retuning to PERS-covered employment or PERS service):Retire before January 1, 2016 and accumulate less than 2 years’ additional service credit or retireon or after January 1, 2016 and accumulate less than 5 years’ additional service credit:
• A refund of member’s contributions from second employment plus regular interest(0.77%);
• No service credit for second employment;• Start the same benefit amount the month following termination; and• GABA starts again in the January immediately following second retirement
Retire before January 1, 2016 and accumulate at least 2 years of additional service credit:• A recalculated retirement benefit based on laws in effect at second retirement; and• GABA starts the January after receiving recalculated benefit for 12 months
Retire on or after January 1, 2016 and accumulate 5 or more years of additional service credit:• The same retirement benefit as prior to their return to service;• A second retirement benefit for second period of service based on laws in effect at
second retirement; • GABA starts on both benefits in the January after receiving the original and new benefit
for 12 months
Vesting 5 years of membership service
Monthly benefit formula Members hired prior to July 1, 2011 –
Less than 25 years of membership service: 1.785% of HAC per year of service credit; 25 years of membership service or more: 2% of HAC per year of service credit.
A-93

Members hired on or after July 1, 2011 – Less than 10 years of membership service: 1.5% of HAC per year of service credit; 10 years or more, but less than 30 years of membership service: 1.785% of HAC per year ofservice credit; 30 years or more of membership service: 2% of HAC per year of service credit.
Guaranteed Annual Benefit Adjustment (GABA) – After the member has completed 12 full months ofretirement, the member’s benefit increases by the applicable percentage (provided below) each January,inclusive of other adjustments to the member’s benefit:
◦ 3.0% for members hired prior to July 1, 2007 ◦ 1.5% for members hired between July 1, 2007 and June 30, 2013◦ Members hired on or after July 1, 2013
a. 1.5% for each year PERS is funded at or above 90%;b. 1.5% is reduced by 0.1% for each 2% PERS is funded below 90%; and,c. 0% whenever the amortization period for PERS is 40 years or more.
Contributions to the PlanRates are specified by state law for periodic employee, employer, and nonemployer entity contributions. The Legislaturehas the authority to establish and amend contribution rates to the plan.
Member contributions to the system: Contributions are deducted from each member’s salary and remittedby participating Employers. Plan members are required to contribute 7.90% of member’s compensation.The 7.90% member contribution rate is temporary and will be decreased to 6.9% on January 1 followingactuary valuation results that show the amortization period has dropped below 25 years and would remainbelow 25 years following the reduction of both the additional Employer and additional membercontribution rates.
Employer contributions to the systemState and University System employers are required to contribute 8.67% of member compensation. Local government entities are required to contribution 8.57% of member compensation. School district employers contributed 8.30% of member compensation.
Per the 2013 Legislative Session’s House Bill 454, section 4, effective July 1, 2013, PERS employercontributions temporarily increased 1%. Beginning July 1, 2014, employer contributions will increasean additional 0.1% a year over 10 years, through 2024. The Employer additional contributions includingthe 0.27% added in 2007 and 2009, terminates on January 1 following actuary valuation results thatshow the amortization period of the PERS-DBRP has dropped below 25 years and would remain below25 years following the reductions of both the additional employer and member contributions rates. Asof January 1, 2019, the additional contributions will not be terminated.
Effective July 1, 2013, employers are required to make contributions on working retirees’ compensation.Member contributions for working retirees are not required.
The portion of employer contributions allocated to the Plan Choice Rate (PCR) are included in theemployer's reporting. The PCR was paid off effective March 2016 and the contributions previouslydirected to the PCR are now directed to member accounts.
Non-Employer Entity Contributions Special Funding
The State contributes 0.1% of member compensation on behalf of local government entities. The State contributes 0.37% of member compensation on behalf of school district entities. The State contributes a Statutory Appropriation from General Fund. Funding provided for theyear ended June 30, 2019, totaled $33.5 million.
A-94

Actuarial Assumptions The total pension liability used to calculate the net pension liability was determined by an actuarial valuation as of June30, 2017, with update procedures used to roll forward the total pension liability to June 30, 2018. There were severalsignificant assumptions and other inputs used to measure the total pension liability. The actuarial assumptions used inthe June 30, 2018, valuation were based on the results of the last actuarial experience study, dated May 2017 for thesix-year period ended June 30, 2016. Among those assumptions were the following:
• Investment Return 7.65% • Admin Expense as a % of Payroll 0.26%• General Wage Growth 3.50% • Inflation at 2.75%• Merit Increases 0 to 4.8% • Postretirement Benefit Increases – After the member has completed 12 full months of retirement, the member’s
benefit increases by the applicable percentage each January, inclusive of all other adjustments to the member’sbenefit:
◦ 3.00% for members hired prior to July 1, 2007 ◦ 1.50% for members hired between July 1, 2007 and June 30, 2013◦ Members hired on or after July 1, 2013:
▪ 1.50% for each year PERS is funded at or above 90%▪ 1.50% is reduced by 0.1% for each 2% PERS is funded below 90%; and▪ 0% whenever the amortization period for PERS is 40 years or more
• Mortality assumptions among contributing members, terminated vested members, service retired membersand beneficiaries are based on RP-2000 Combined Employee and Annuitant Mortality Tables projected to2020 using Scale BB, set back one year for males.
• Mortality assumptions among Disabled Retirees are based on RP-2000 Combined Employee and AnnuitantMortality Tables.
Discount Rate The discount rate used to measure the total pension liability was 7.65%. The projection of cash flows used to determinethe discount rate assumed that contributions from participating plan members, employers, and nonemployer contributingentities will be made based on the PERB’s funding policy, which establishes the contractually required rates underMCA. The State contributes 0.1% of salaries for local governments and 0.37% for school districts. In addition, theState contributes a Statutory Appropriation from the General Fund. Based on those assumptions, the PERS-DBRP’sfiduciary net position was projected to be adequate to make all the projected future benefit payments of current planmembers through the year 2122. Therefore, the long-term expected rate of return on pension plan investments wasapplied to all periods of projected benefit payments to determine the total pension liability. A municipal bond rate wasnot incorporated in the discount rate.
A-95

Target Allocations The long-term expected return on pension plan assets is reviewed as part of the regular experience study prepared for the PERS-DBRP. The most recent analysis, performed for the six-year period ended June 30, 2016, is outlined in areport dated May 2017, and can be located on the MPERA website. The long-term expected rate of return on pensionplan investments was determined by considering information from various sources, including historical rates of return,rate of return assumptions adopted by similar public pension systems, and by using a building-block method in whichbest-estimate ranges of expected future real rates of return (expected returns, net of pension plan investment andinflation) are developed for each major asset class. These ranges were combined to produce the long-term expectedrate of return by weighing the expected future real rates of return by the target asset allocation percentage and by addingexpected inflation. Best estimates of the arithmetic real rates of return for each major asset class included in the PERS-DBRP’s target asset allocation as of June 30, 2018, is summarized in the table that follows:
Asset ClassTarget Asset
AllocationLong-term ExpectedReal Rate of Return
Cash Equivalents 2.60% 4.00%Domestic Equity 36.00% 4.55%Foreign Equity 18.00% 6.35%Fixed Income 23.40% 1.00%Private Equity 12.00% 7.75%Real Estate 8.00% 4.00%
Total 100.00%
Sensitivity AnalysisIn accordance with GASB 68 regarding the disclosure of the sensitivity of the net pension liability (NPL) to changesin the discount rate, the table below presents the net pension liability calculated using the discount rate of 7.65%, aswell as what the net pension liability would be if it were calculated using a discount rate that is 1.00% lower (6.65%)or 1.00% higher (8.65%) than the current rate.
(in thousands)1.0% Decrease
(6.65%)Current
Discount Rate1.0% Increase
(8.65%)State as an employer in PERS-DBRP – net
pension liability $ 1,193,700 $ 825,387 $ 522,943
State as a nonemployer contributing entity toPERS-DBRP – net pension liability 752,125 520,058 329,495
Net Pension LiabilityIn accordance with GASB 68, employers and the nonemployer contributing entities are required to recognize and reportcertain amounts associated with their participation in the PERS-DBRP. GASB 68 became effective June 30, 2015, andincludes requirements for participants to record and report their proportionate share of the collective net pension liability,pension expense, deferred inflows of resources and deferred outflows of resources associated with pensions. Theproportionate shares were determined based on contributions made to the plan by employers and the nonemployercontributing entity special funding.
In accordance with GASB 68, the PERS-DBRP has a special funding situation where the State is legally responsiblefor making contributions directly to the PERS-DBRP on behalf of the employers. Due to the existence of this specialfunding situation, the State is required to report a proportionate share of a local government or school district’s collectivenet pension liability that is associated with the non-State employer.
A-96

Target Allocations The long-term expected return on pension plan assets is reviewed as part of the regular experience study prepared for the PERS-DBRP. The most recent analysis, performed for the six-year period ended June 30, 2016, is outlined in areport dated May 2017, and can be located on the MPERA website. The long-term expected rate of return on pensionplan investments was determined by considering information from various sources, including historical rates of return,rate of return assumptions adopted by similar public pension systems, and by using a building-block method in whichbest-estimate ranges of expected future real rates of return (expected returns, net of pension plan investment andinflation) are developed for each major asset class. These ranges were combined to produce the long-term expectedrate of return by weighing the expected future real rates of return by the target asset allocation percentage and by addingexpected inflation. Best estimates of the arithmetic real rates of return for each major asset class included in the PERS-DBRP’s target asset allocation as of June 30, 2018, is summarized in the table that follows:
Asset ClassTarget Asset
AllocationLong-term ExpectedReal Rate of Return
Cash Equivalents 2.60% 4.00%Domestic Equity 36.00% 4.55%Foreign Equity 18.00% 6.35%Fixed Income 23.40% 1.00%Private Equity 12.00% 7.75%Real Estate 8.00% 4.00%
Total 100.00%
Sensitivity AnalysisIn accordance with GASB 68 regarding the disclosure of the sensitivity of the net pension liability (NPL) to changesin the discount rate, the table below presents the net pension liability calculated using the discount rate of 7.65%, aswell as what the net pension liability would be if it were calculated using a discount rate that is 1.00% lower (6.65%)or 1.00% higher (8.65%) than the current rate.
(in thousands)1.0% Decrease
(6.65%)Current
Discount Rate1.0% Increase
(8.65%)State as an employer in PERS-DBRP – net
pension liability $ 1,193,700 $ 825,387 $ 522,943
State as a nonemployer contributing entity toPERS-DBRP – net pension liability 752,125 520,058 329,495
Net Pension LiabilityIn accordance with GASB 68, employers and the nonemployer contributing entities are required to recognize and reportcertain amounts associated with their participation in the PERS-DBRP. GASB 68 became effective June 30, 2015, andincludes requirements for participants to record and report their proportionate share of the collective net pension liability,pension expense, deferred inflows of resources and deferred outflows of resources associated with pensions. Theproportionate shares were determined based on contributions made to the plan by employers and the nonemployercontributing entity special funding.
In accordance with GASB 68, the PERS-DBRP has a special funding situation where the State is legally responsiblefor making contributions directly to the PERS-DBRP on behalf of the employers. Due to the existence of this specialfunding situation, the State is required to report a proportionate share of a local government or school district’s collectivenet pension liability that is associated with the non-State employer.
(dollars presented in thousands)Net Pension
Liability as of6/30/17
Net PensionLiability as of
6/30/18Percent of
Collective NPLState's proportionate share as an employer entity $ 1,033,200 $ 825,387 39.546272%State's proportionate share as a nonemployer
contributing entity 19,622 520,058 24.917247%
State of Montana totals $ 1,052,822 $ 1,345,445 64.463519%
Per Section 19-3-320, MCA, effective July 1, 2017, the State provided the state statutory appropriation directly to thePERS-DBRP. The state statutory appropriation is considered a special funding situation and increased the state'sproportionate share. All PERS-DBRP participating employers' proportionate shares have decreased as a result of theincreased state proportion as compared to prior years.
At June 30, 2019, the State reported a liability of $1.3 billion for its proportionate share of the net pension liability asan employer and nonemployer contributing entity. The net pension liability was measured as of June 30, 2018, and thetotal pension liability used to calculate the net pension liability was determined by an actuarial valuation as of June 30,2017, with update procedures used to roll forward the total pension liability to June 30, 2018. The proportion of thenet pension liability is based on the employer’s and nonemployer's special funding contributions received by the PERS-DBRP during the measurement period of July 1, 2017, through June 30, 2018, relative to the total employer andnonemployer special funding contributions received from all PERS-DBRP participating employers.
Changes in actuarial assumptions and methods: There were no changes in assumptions or other inputsthat affected the measurement of the total pension liability.
Changes in benefit terms: There have been no changes in benefit terms since the previous measurementdate.
Changes in proportionate share: Between the measurement date of the collective net pension liabilityand the employer’s reporting date there were no changes in proportion that would have an effect on theemployer’s proportionate share of the collective net pension liability.
Employer Pension Expense and Nonemployer Contributing Entity Grant ExpensesAt June 30, 2019, the State as an employer recognized a pension expense of $69.7 million for its proportionate shareof the PERS-DBRP’s pension expense. The State as a nonemployer contributing entity recognized grant expense of$1.1 million for special funding support provided by the General Fund for its proportionate share of the PERS-DBRP’spension expense that is associated with local government and school district participants in the plan. The State as anonemployer contributing entity recognized grant expense of $33.6 million for special funding support provided bythe General Fund as a statutory appropriation for all participating employers in the plan. The State as a nonemployercontributing entity recognized pension expense of $132.1 million that is actuarially allocated to the State as anonemployer. The total pension expense recognized by the State as a nonemployer was $166.8 million. Total pensionrelated expenses recognized by the State, both as employer and nonemployer contributing entity at June 30, 2019, were$236.5 million.
Deferred Outflows and InflowsAt June 30, 2019, the State as an employer recognized a beginning deferred outflow of resources for fiscal year 2018contributions of $54.8 million.
A-97

As of the fiscal year ended June 30, 2019, the State as an employer has the following proportionate shares of the PERS-DBRP’s deferred outflows of resources and deferred inflows of resources from the following sources:
(in thousands)Deferred Outflows
of ResourcesDeferred Inflows
of ResourcesActual versus expected experience $ 62,765 $ —Net difference between projected and actual earnings on
pension plan investments — 12,818
Change of assumptions 70,187 —
Changes in proportion and differences between employercontributions and proportionate share of contributions — 169,846
Contributions paid to PERS-DBRP subsequent to themeasurement date – FY 2019 contributions 56,183 —
Totals $ 189,135 $ 182,664
Amounts reported as deferred outflows of resources related to pensions resulting from the employer’s contributionsmade subsequent to the June 30, 2018, measurement date will be recognized as a reduction of the net pension liabilityin the fiscal year ended June 30, 2020.
Other amounts reported as deferred outflows of resources and deferred inflows of resources related to pensions will berecognized in pension expense as follows:
(in thousands)
Year ended June 30:
Amount recognized in PensionExpense as an increase or
(decrease) to Pension Expense2020 $ 14,0482021 2,0032022 (60,496)2023 (5,267)2024 —Thereafter —
At June 30, 2019, the State as a nonemployer contributing entity recognized a beginning deferred outflow of resourcesfor fiscal year 2018 contributions of $34.7 million.
As of the fiscal year ended June 30, 2019, the State as a nonemployer contributing entity reported its proportionateshare of the PERS-DBRP’s deferred outflows of resources and deferred inflows of resources from the following sources:
(in thousands)Deferred Outflows
of ResourcesDeferred Inflows
of ResourcesActual versus expected experience $ 39,547 $ —Net difference between projected and actual earnings
on pension plan investments — 8,077
Change of assumptions 44,223 —Changes in proportion and differences between
employer contributions and proportionate share ofcontributions
296,154 —
Contributions paid to PERS-DBRP subsequent to themeasurement date – FY 2019 contributions 34,642 —
Totals $ 414,566 $ 8,077
A-98

Amounts reported as deferred outflows of resources related to pensions resulting from the nonemployer’s contributionsmade subsequent to the June 30, 2018, measurement date will be recognized as a reduction to its share of the net pensionliability in the fiscal year ended June 30, 2020.
Other amounts reported as deferred inflows of resources related to pensions will be recognized in grant expense asfollows:
(in thousands)
Year ended June 30:
Amount recognized in GrantExpense as an increase or
(decrease) to Grant Expense2020 $ 144,0202021 135,5942022 95,5522023 (3,319)2024 —Thereafter —
Sheriffs’ Retirement System – The SRS, administered by the MPERA, is a multiple-employer, cost-sharing definedbenefit plan established July 1, 1974, and governed by Title 19, chapters 2 & 7, MCA. This plan provides retirementbenefits to all Department of Justice criminal and gambling investigators hired after July 1, 1993, all detention officershired after July 1, 2005, and to all Montana sheriffs. Benefits are established by state law and can only be amended bythe Legislature. The SRS provides retirement, disability and death benefits to plan members and their beneficiaries.Benefits are based on eligibility, years of service and highest average compensation.
Summary of BenefitsMember’s highest average compensation (HAC) Hired prior to July 1, 2011 – highest average compensation during any consecutive 36 months; Hired on or after July 1, 2011 – highest average compensation during any consecutive 60 months. Hired on or after July 1, 2013 – 110% annual cap on compensation considered as a part of a member’sHAC.
Eligibility for benefit Service Retirement: 20 years of membership service, regardless of age. Early Retirement: Age 50, 5 years of membership service, actuarially reduced.
Second Retirement (applies to retirement system members re-employed in a SRS position on or afterJuly 1, 2017):
a. If the member works more than 480 hours in a calendar year and accumulates less than 5years of service credit before terminating again, the member:
• is not awarded service credit for the period of reemployment;• is refunded the accumulated contributions associated with the period of
reemployment;• starting the first month following termination of service, receives the same
retirement benefit previously paid to the member; and • does not accrue post-retirement benefit adjustments during the term of
reemployment but receives a GABA in January immediately followingthe second retirement.
b. If the member works more than 480 hours in a calendar year and accumulates at least 5years of service credit before terminating again, the member:
• is awarded service credit for the period of reemployment;• starting the first month following termination of service, receives:
◦ the same retirement benefit previously paid to the member; and
A-99

◦ a second retirement benefit for the period of reemploymentcalculated based on the laws in effect as of the member's rehiredate; and
• do not accrue post-retirement benefit adjustments during the term ofreemployment but receive a GABA:
◦ on the initial retirement benefit starting in January immediatelyfollowing second retirement; and
◦ on the second retirement benefit starting in January afterreceiving that benefit for at least 12 months
c. A member who returns to covered service is not eligible for a disability benefit.
Vesting 5 years of membership service
Monthly benefit formula 2.5% of HAC per year of service
Guaranteed Annual Benefit Adjustment (GABA) After the member has completed 12 full months of retirement, the member’s benefit increases by theapplicable percentage (provided below) each January, inclusive of all other adjustments to the member’sbenefit.
◦ 3.0% for members hired prior to July 1, 2007 ◦ 1.5% for members hired on or after July 1, 2007
Contributions to the PlanRates are specified by state law for periodic employee and employer contributions and are a percentage of the member’scompensation. The Legislature has the authority to establish and amend contribution rates to the plan.
Member contributions to the system – Contributions are deducted from each member’s salary andremitted by participating employers. Plan members are required to contribute 10.495% of member’scompensation.
Employer contributions to the system – The employers are required to contribute 13.115% of membercompensation. Employer contributions are required to be paid on working retiree compensation. Membercontributions are not required for working retirees.
Actuarial AssumptionsThe total pension liability used to calculate the net pension liability was determined by an actuarial valuation as of June30, 2017, with update procedures used to roll forward the total pension liability to June 30, 2018. The actuarialassumptions used in the June 30, 2018, valuation were based on the results of the last actuarial experience study, datedMay 2017 for the six-year period ended June 30, 2016. There were several significant assumptions and other inputsused to measure the total pension liability. Among those assumptions were the following:
• Investment Return 7.65% • Administrative Expense as a % of Payroll 0.21%• General Wage Growth 3.50% • Inflation at 2.75%• Merit Increases 0.00% to 6.30% • Postretirement Benefit Increases – After the member has completed 12 full months of retirement, the member’s
benefit increases by the applicable percentage each January, inclusive of other adjustments to the member’sbenefit.
◦ 3.00% for members hired prior to July 1, 2007◦ 1.50% for members hired on or after July 1, 2007
A-100

• Mortality assumptions among contributing members, terminated vested members, service retired membersand beneficiaries are based on RP-2000 Combined Employee and Annuitant Mortality Tables projected to2020 using Scale BB, set back one year for males.
• Mortality assumptions among Disabled Retirees are based on RP-2000 Combined Employee and AnnuitantMortality Tables.
Discount Rate The discount rate used to measure the total pension liability was 7.65%. The projection of cash flows used to determinethe discount rate assumed that contributions from participating plan members, employers, and nonemployer contributingentities will be made based on the PERB’s funding policy, which establishes the contractually required rates underMCA. SRS’s fiduciary net position was projected to be adequate to make all the projected future benefit payments ofcurrent plan members through the year 2118. Therefore, the long-term expected rate of return on pension planinvestments was applied to all periods of projected benefit payments to determine the total pension liability. A municipalbond rate was not incorporated in the discount rate.
Target AllocationsThe long-term expected return on pension plan assets is reviewed as part of the regular experience study prepared for the SRS. The most recent analysis, performed for the six-year period ended June 30, 2016, is outlined in a report datedMay 2017, and can be located on the MPERA website. The long-term expected rate of return on pension plan investmentswas determined by considering information from various sources, including historical rates of return, rate of returnassumptions adopted by similar public pension systems, and by using a building-block method in which best-estimateranges of expected future real rates of return (expected returns, net of pension plan investment and inflation) aredeveloped for each major asset class. These ranges were combined to produce the long-term expected rate of returnby weighing the expected future real rates of return by the target asset allocation percentage and by adding expectedinflation. Best estimates of the arithmetic real rates of return for each major asset class included in the SRS’s targetasset allocation as of June 30, 2018, is summarized in the table that follows:
Asset ClassTarget Asset
AllocationLong-term ExpectedReal Rate of Return
Cash Equivalents 2.60% 4.00%Domestic Equity 36.00% 4.55%Foreign Equity 18.00% 6.35%Fixed Income 23.40% 1.00%Private Equity 12.00% 7.75%Real Estate 8.00% 4.00%
Total 100.00%
Sensitivity AnalysisIn accordance with GASB 68 regarding the disclosure of the sensitivity of the net pension liability to changes in thediscount rate, the table below presents the net pension liability calculated using the discount rate of 7.65%, as well aswhat the net pension liability would be if it were calculated using a discount rate that is 1.00% lower (6.65%) or 1.00%higher (8.65%) than the current rate.
(in thousands)1.0% Decrease
(6.65%)Current
Discount Rate1.0% Increase
(8.65%)Employer’s SRS net pension liability $ 6,666 $ 3,663 $ 1,204
Net Pension LiabilityIn accordance with GASB 68, employers are required to recognize and report certain amounts associated with theirparticipation in the SRS. GASB 68 became effective June 30, 2015, and includes requirements for participants to record
A-101

and report their proportionate share of the collective net pension liability (NPL), pension expense, deferred inflows ofresources, and deferred outflows of resources associated with pensions.
(dollars presented in thousands)Net Pension Liability
as of 6/30/17Net Pension Liability
as of 6/30/18Percent of
Collective NPLEmployer proportionate share $ 3,696 $ 3,663 4.872800%
At June 30, 2019, the State as an employer reported a liability of $3.7 million for its proportionate share of net pensionliability. The net pension liability was measured as of June 30, 2018, and the total pension liability used to calculatethe net pension liability was determined by an actuarial valuation as of June 30, 2017, with update procedures used toroll forward the total pension liability to June 30, 2018. The employer’s proportion of the net pension liability wasbased on the employer’s contributions received by the SRS during the measurement period, July 1, 2017, through June30, 2018, relative to the total employer contributions received from all of SRS participating employers.
Changes in actuarial assumptions and methods: There were no changes in assumptions or other inputsthat affected the measurement of the total pension liability.
Changes in benefit terms: There have been no changes in benefit terms since the previous measurementdate.
Changes in proportionate share: Between the measurement date of the collective net pension liabilityand the employer’s reporting date there were no changes in proportion that are expected to have asignificant effect on the Employer’s proportionate share of the collective net pension liability.
Pension ExpenseAt June 30, 2019, the employer recognized a pension expense/(income) of $(274.0) thousand for its proportionate shareof the SRS pension expense/(income).
Deferred Outflows and InflowsAt June 30, 2019, the State as an employer recognized a beginning deferred outflow of resources for fiscal year 2018contributions of $495.8 thousand.
As of the fiscal year ended June 30, 2019, the State, as an employer, reported its proportionate share of the SRS'sdeferred outflows of resources and deferred inflows of resources from the following sources:
(in thousands)Deferred Outflows
of ResourcesDeferred Inflows
of ResourcesDifference between actual and expected experience $ 202 $ 8Net difference between projected and actual earnings
on pension plan investments — 102
Changes of assumptions 2,083 3,464Changes in proportion and differences between
employer contributions and proportionate shareof contributions
— 467
Contributions paid to SRS subsequent to themeasurement date – FY 2019 contributions 513 —
Totals $ 2,798 $ 4,041
Amounts reported as deferred outflows of resources related to pensions resulting from the employer’s contributionsmade subsequent to the measurement date of June 30, 2018, will be recognized as a reduction of the net pension liabilityin the fiscal year ended June 30, 2020.
A-102

Other amounts reported as deferred inflows of resources related to pensions will be recognized in pension expense asfollows:
(in thousands)
Year ended June 30:
Amount recognized in PensionExpense as an increase or
(decrease) to Pension Expense2020 $ (470)2021 (557)2022 (741)2023 122024 —Thereafter —
Municipal Police Officers’ Retirement System – The MPORS, administered by the MPERA, is a multiple-employer,cost-sharing defined benefit plan that was established in 1974 and is governed by Title 19, chapters 2 & 9, MCA. Thisplan covers all municipal police officers employed by first- and second-class cities and other cities that adopt the plan.Benefits are established by state law and can only be amended by the Legislature. The MPORS provides retirement,disability, and death benefits to plan members and their beneficiaries. Benefits are based on eligibility, years of service,and final average compensation.
Deferred Retirement Option Plan (DROP)Beginning July 2002, eligible members of the MPORS can participate in the DROP by filing a one-time irrevocableelection with the PERB. The DROP is governed by Title 19, Chapter 9, Part 12, MCA. A member must have completedat least twenty years of membership service to be eligible. They may elect to participate in the DROP for a minimumof one month and a maximum of 60 months and may only participate in the DROP once. A participant remains a memberof the MPORS, but will not receive membership service or service credit in the system for the duration of the member’sDROP period. During participation in the DROP, all mandatory contributions continue to the retirement system. Amonthly benefit is calculated based on salary and years of service to the date of the beginning of the DROP period. Themonthly benefit is paid into the member’s DROP account until the end of the DROP period. At the end of the DROPperiod, the participant may receive the balance of the DROP account in a lump-sum payment or in a direct rollover toanother eligible plan, as allowed by the IRS. If the participant continues employment after the DROP period ends, theywill again accrue membership service and service credit. The DROP account cannot be distributed until employmentis formally terminated. As of June 30, 2019, the balance held by MPERA for MPORS DROP participants wasapproximately $9.5 million.
The State is not an employer participant in the MPORS plan. However, because the PERB is a fiduciary componentunit of the State, this CAFR presents certain information to help ensure compliance with GASB 67. In addition, theState provides nonemployer entity contributions classified as special funding in accordance with GASB 68. Disclosuresmade in this financial report for MPORS are meant to reflect the aforementioned relationships.
Summary of BenefitsMember’s final average compensation (FAC) Hired prior to July 1, 1977 – average monthly compensation of final year of service; Hired on or after July 1, 1977 – final average compensation (FAC) for last consecutive 36 months. Hired on or after July 1, 2013 – 110% annual cap on compensation considered as a part of a member’sFAC.
A-103

Eligibility for benefit Service Retirement: Age 50, with 5 years of membership service, or 20 years of membership service,regardless of age. Second Retirement: Age 50, reemployed in a MPORS position Vesting Death and disability rights are vested immediately.5 years of membership service.
Monthly benefit formula 2.5% of FAC per year of service credit.
Second retirement benefit formula for members re-employed in a MPORS position after July 1, 2017:1) If the member works more than 480 hours in a calendar year and accumulates less than 5
years of service credit before terminating again, the member:a. Is not awarded service credit for the period of reemployment;b. Is refunded the accumulated contributions associated with the period of reemployment;c. Starting the first month following termination of service, receives the same retirement
benefit previously paid to the member; andd. Does not accrue post-retirement benefit adjustments during the term of reemployment
but receives a Guaranteed Annual Benefit Adjustment (GABA) in January immediatelyfollowing second retirement.
2) If the member works more than 480 hours in a calendar year and accumulates at least 5years of service credit before terminating again, the member:
a. Is awarded service credit for the period of reemployment;b. Starting the first month following termination of service, receives:
i. The same retirement benefit previously paid to the member, andii. A second retirement benefit for the period of reemployment calculated based on
the laws in effect as of the member's rehire date; andc. Does not accrue post-retirement benefit adjustments during the term of reemployment
but receives a GABA:i. On the initial retirement benefit in January immediately following second
retirement, andii. On the second retirement benefit starting in January after receiving that benefit
for at least 12 months.3) A member who returns to covered service is not eligible for a disability benefit.
Guaranteed Annual Benefit Adjustment (GABA) Hired on or after July 1, 1997, or those electing GABA – after the member has completed 12 full monthsof retirement, the member’s benefit increases by a maximum of 3% each January, inclusive of all otheradjustments to the member’s benefit.
Minimum benefit adjustment (non-GABA) If hired before July 1, 1997, and member did not elect GABA– the monthly retirement, disability or survivor’s benefit may not be less than 50% of the compensationof a newly confirmed officer of the employer where the member was last employed.
Contributions to the PlanRates are specified by state law for periodic employee, employer, and nonemployer entity contributions. The Legislaturehas the authority to establish and amend contribution rates to the plan.
A-104

Member contributions – Contribution rates are dependent upon date of hire as a police officer.Contributions are deducted from each member’s salary and remitted by the participating Employer. Forfiscal year 2019: • If hired prior to July 1, 1975, member contributions as a percentage of salary are 5.80%• If hired after June 30, 1975, and prior to July 1, 1979, member contributions as a percentage of salaryare 7.00%; • If hired after June 30, 1979, and prior to July 1, 1997, member contributions as a percentage of salaryare 8.50%; and, • If hired on or after July 1, 1997, and for members electing GABA, member contributions as apercentage of salary are 9.00%.
Employer Contributions – Employers are required to contribute 14.41% of a member’s compensation.
Nonemployer Entity Contributions – The State contributes 29.37% of a member’s compensation fromthe General Fund. These amounts are considered a special funding situation in accordance with GASB68.
Actuarial AssumptionsThe total pension liability used to calculate the net pension liability was determined by an actuarial valuation as of June30, 2017, with update procedures used to roll forward the total pension liability to June 30, 2018. The actuarialassumptions used in the June 30, 2018, valuation were based on the results of the last actuarial experience study, datedMay 2017 for the six-year period ended June 30, 2016. There were several significant assumptions and other inputsused to measure the total pension liability. Among those assumptions were the following:
• Investment Return 7.65% • Admin expense as a % of Payroll 0.24%• General Wage Growth 3.50% • Inflation at 2.75%• Merit Increases 0.00% to 6.60% • Postretirement Benefit Increases
◦ GABAHired on or after July 1, 1997, or those electing GABA – after the member has completed 12 fullmonths of retirement, the member’s benefit increases by a maximum of 3% each January, inclusiveof all other adjustments to the member’s benefit
◦ Minimum benefit adjustment (non-GABA)If hired before July 1, 1997 and member did not elect GABA – the monthly retirement, disability orsurvivor’s benefit may not be less than 50% the compensation of a newly confirmed officer in thecity that the member was last employed
• Mortality assumptions among contributing members, terminated vested members, service retired membersand beneficiaries are based on RP-2000 Combined Employee and Annuitant Mortality Tables projected to2020 using Scale BB, set back one year for males.
• Mortality assumptions among Disabled Retirees are based on RP-2000 Combined Employee and AnnuitantMortality Tables.
Discount RateThe discount rate used to measure the total pension liability was 7.65%. The projection of cash flows used to determinethe discount rate assumed that contributions from participating plan members, employers, and nonemployer contributingentities will be made based on the PERB’s funding policy, which establishes the contractually required rates underMCA. The State contributes 29.37% of salaries paid by employers. Based on those assumptions, the MPORS’s fiduciarynet position was projected to be adequate to make all the projected future benefit payments of current plan membersthrough the year 2132. Therefore, the long-term expected rate of return on pension plan investments was applied to
A-105

all periods of projected benefit payments to determine the total pension liability. A municipal bond rate was notincorporated in the discount rate.
Target AllocationsThe long-term expected return on pension plan assets is reviewed as part of the regular experience study prepared for the MPORS. The most recent analysis, performed for the six-year period ended June 30, 2016, is outlined in a reportdated May 2017, and can be located on the MPERA website. The long-term expected rate of return on pension planinvestments was determined by considering information from various sources, including historical rates of return, rateof return assumptions adopted by similar public pension systems, and by using a building-block method in which best-estimate ranges of expected future real rates of return (expected returns, net of pension plan investment and inflation)are developed for each major asset class. These ranges were combined to produce the long-term expected rate of returnby weighing the expected future real rates of return by the target asset allocation percentage and by adding expectedinflation. Best estimates of the arithmetic real rates of return for each major asset class included in the MPORS’s targetasset allocation as of June 30, 2018, is summarized in the table that follows:
Asset ClassTarget Asset
AllocationLong-term ExpectedReal Rate of Return
Cash Equivalents 2.60% 4.00%Domestic Equity 36.00% 4.55%Foreign Equity 18.00% 6.35%Fixed Income 23.40% 1.00%Private Equity 12.00% 7.75%Real Estate 8.00% 4.00%
Total 100.00%
Sensitivity AnalysisIn accordance with GASB 68, regarding the disclosure of the sensitivity of the net pension liability to changes in thediscount rate, the table below presents the net pension liability calculated using the discount rate of 7.65%, as well aswhat the net pension liability would be if it were calculated using a discount rate that is 1.00% lower (6.65%) or 1.00%higher (8.65%) than the current rate.
(in thousands)1.0% Decrease
(6.65%)Current
Discount Rate1.0% Increase
(8.65%)State as a nonemployer entity net
pension liability $ 174,579 $ 114,956 $ 67,274
Net Pension LiabilityIn accordance with GASB 68, employers and nonemployer contributing entities are required to recognize and reportcertain amounts associated with their participation in the MPORS. GASB 68 became effective June 30, 2015, andincludes requirements for participants to record and report their proportionate share of the collective net pension liability,pension expense, deferred inflows of resources, and deferred outflows of resources associated with pensions.
A-106

all periods of projected benefit payments to determine the total pension liability. A municipal bond rate was notincorporated in the discount rate.
Target AllocationsThe long-term expected return on pension plan assets is reviewed as part of the regular experience study prepared for the MPORS. The most recent analysis, performed for the six-year period ended June 30, 2016, is outlined in a reportdated May 2017, and can be located on the MPERA website. The long-term expected rate of return on pension planinvestments was determined by considering information from various sources, including historical rates of return, rateof return assumptions adopted by similar public pension systems, and by using a building-block method in which best-estimate ranges of expected future real rates of return (expected returns, net of pension plan investment and inflation)are developed for each major asset class. These ranges were combined to produce the long-term expected rate of returnby weighing the expected future real rates of return by the target asset allocation percentage and by adding expectedinflation. Best estimates of the arithmetic real rates of return for each major asset class included in the MPORS’s targetasset allocation as of June 30, 2018, is summarized in the table that follows:
Asset ClassTarget Asset
AllocationLong-term ExpectedReal Rate of Return
Cash Equivalents 2.60% 4.00%Domestic Equity 36.00% 4.55%Foreign Equity 18.00% 6.35%Fixed Income 23.40% 1.00%Private Equity 12.00% 7.75%Real Estate 8.00% 4.00%
Total 100.00%
Sensitivity AnalysisIn accordance with GASB 68, regarding the disclosure of the sensitivity of the net pension liability to changes in thediscount rate, the table below presents the net pension liability calculated using the discount rate of 7.65%, as well aswhat the net pension liability would be if it were calculated using a discount rate that is 1.00% lower (6.65%) or 1.00%higher (8.65%) than the current rate.
(in thousands)1.0% Decrease
(6.65%)Current
Discount Rate1.0% Increase
(8.65%)State as a nonemployer entity net
pension liability $ 174,579 $ 114,956 $ 67,274
Net Pension LiabilityIn accordance with GASB 68, employers and nonemployer contributing entities are required to recognize and reportcertain amounts associated with their participation in the MPORS. GASB 68 became effective June 30, 2015, andincludes requirements for participants to record and report their proportionate share of the collective net pension liability,pension expense, deferred inflows of resources, and deferred outflows of resources associated with pensions.
In accordance with GASB 68, the MPORS has a special funding situation in which the State is legally responsible formaking contributions directly to the MPORS on behalf of the employers. Due to the existence of this special fundingsituation, the State is required to report a proportionate share of a local government’s collective net pension liabilitythat is associated with the non-State employer.
(dollars presented in thousands)Net Pension Liability
as of 6/30/17Net Pension Liability
as of 6/30/18Percent of
Collective NPLState as a nonemployer contributing
entity – proportionate share $ 119,354 $ 114,956 67.124706%
At June 30, 2019, the State as a nonemployer contributing entity reported a liability of $115.0 million for its proportionateshare of the net pension liability. The net pension liability was measured as of June 30, 2018, and the total pensionliability used to calculate the net pension liability was determined by an actuarial valuation as of June 30, 2017, withupdate procedures used to roll forward the total pension liability to June 30, 2018. The nonemployer’s proportion ofthe net pension liability was based on the nonemployer’s special funding contributions received by the MPORS duringthe measurement period of July 1, 2017, through June 30, 2018, relative to total contributions received from all of theMPORS’s participating employers and the nonemployer contributing entity.
Changes in actuarial assumptions and methods: There were no changes in assumptions or other inputs thataffected the measurement of the total pension liability.
Changes in benefit terms: There have been no changes in benefit terms since the previous measurement date.
Changes in proportionate share: Between the measurement date of the collective net pension liability and theemployer’s reporting date there were no changes in proportion that would have an effect on the employer’sproportionate share of the collective net pension liability.
Grant Expense Related to Special FundingThe State recognized grant expense of $13.0 million for special funding support provided by the General Fund for itsproportionate share of the MPORS’s pension expense that is associated with other employer participants in the plan.
Deferred Outflows and InflowsAt June 30, 2019, the State as a nonemployer contributing entity recognized a beginning deferred outflow of resourcesfor fiscal year 2018 contributions of $15.3 million.
As of the fiscal year ended June 30, 2019, the State as a nonemployer reported its proportionate share of the deferredoutflows of resources and deferred inflows of resources related to MPORS from the following sources:
(in thousands)Deferred Outflows
of ResourcesDeferred Inflows
of ResourcesDifference between expected and actual experience $ 322 $ 2,293Net difference between projected and actual earnings
on pension plan investments — 871
Change of assumptions 5,374 —Changes in proportion and differences between
employer contributions and proportionate share ofcontributions 358 —
Contributions paid to MPORS subsequent to themeasurement date – FY 2019 Contributions 15,941 —Totals $ 21,995 $ 3,164
A-107

Amounts reported as deferred outflows of resources related to pensions resulting from the nonemployer’s contributionsmade subsequent to the June 30, 2018, measurement date will be recognized as a reduction of the net pension liabilityin the fiscal year ended June 30, 2020.
Other amounts reported as deferred inflows of resources related to pensions will be recognized in grant expense asfollows:
(in thousands)
Year ended June 30:
Amount recognized in GrantExpense as an increase or(decrease) to Grant Expense
2020 $ 3,0722021 2,4792022 (2,149)2023 (512)2024 —Thereafter —
Firefighters’ Unified Retirement System – The FURS, administered by the MPERA, is a multiple-employer, cost-sharing defined benefit plan established in 1981, and governed by Title 19, chapters 2 & 13, MCA. This system providesretirement benefits to firefighters employed by first- and second-class cities, other cities and rural fire district departmentsthat adopt the plan, and to firefighters hired by the Montana Air National Guard on or after October 1, 2001. Benefitsare established by state law and can only be amended by the Legislature. The FURS provides retirement, disability,and death benefits to plan members and their beneficiaries. Benefits are based on eligibility, years of service, andcompensation.
Summary of BenefitsMember’s compensationHired prior to July 1, 1981, and not electing GABA – highest monthly compensation (HMC);Hired after June 30, 1981, and those electing GABA – highest average compensation (HAC) during anyconsecutive 36 months.Hired on or after July 1, 2013 – 110% annual cap on compensation considered as a part of a member’shighest average compensation.Part-time firefighter – 15% of regular compensation of a newly confirmed full-time firefighter.
Eligibility for benefitService retirement: 20 years of membership service, regardless of age.Early Retirement: Age 50, 5 years of membership service.
VestingDeath and disability rights are vested immediately 5 years of membership service.
Monthly benefit formulaMembers hired prior to July 1, 1981, and not electing GABA are entitled to the greater of:
2.5% of HMC per year of service; or
• if less than 20 years of service – 2% of HMC for each year of service;
• if more than 20 years of service – 50% of the member’s HMC plus 2% of themember’s HMC for each year of service over 20 years.
Members hired on or after July 1, 1981, and those electing GABA: 2.5% of HAC per year of membershipservice.
A-108

Guaranteed Annual Benefit Adjustment (GABA)Hired on or after July 1, 1997, or those electing GABA – after the member has completed 12 full monthsof retirement, the member’s benefit increases by a maximum of 3% each January, inclusive of all otheradjustments to the member’s benefit.
Minimum Benefit Adjustment (non-GABA)If hired before July 1, 1997 and the member did not elect GABA, the monthly retirement, disability orsurvivor’s benefit may not be less than 50% of the compensation of a newly confirmed active firefighterof the employer that last employed the member.
Contributions to the PlanRates are specified by state law for periodic employee, employer and nonemployer entity contributions. The Legislaturehas the authority to establish and amend contribution rates to the plan. Effective July 1, 2013, employer and statecontributions are required to be paid on working retiree compensation. Member contributions are not required forworking retirees.
Member contributions to the system – Contributions are deducted from each member’s salary andremitted by the participating Employer. For members:
Hired prior to July 1, 1997 and not electing GABA, member contributions as a percentage ofsalary are 9.50%;Hired on or after July 1, 1997 and electing GABA, member contributions as a percentage ofsalary are 10.70%.
Employer contributions to the system – Employers are required to contribute 14.36% of member’scompensation.
Nonemployer entity contributions to the system – The State contributes 32.61% of a member’scompensation from the General Fund.
Actuarial AssumptionsThe total pension liability used to calculate the net pension liability was determined by an actuarial valuation as of June30, 2017, with update procedures used to roll forward the total pension liability to June 30, 2018. The actuarialassumptions used in the June 30, 2018, valuation were based on the results of the last actuarial experience study, datedMay 2017 for the six-year period ended June 30, 2016. There were several significant assumptions and other inputsused to measure the total pension liability. Among those assumptions were the following:
• Investment Return 7.65% • Admin Expense as a % of Payroll 0.23%• General Wage Growth 3.50% • Inflation at 2.75% • Merit Increases 0% to 6.30% • Postretirement Benefit Increases
◦ GABAHired on or after July 1, 1997, or those electing GABA – after the member has completed 12 full monthsof retirement, the member’s benefit increases by a maximum of 3% each January, inclusive of all otheradjustment to the member’s benefit.
◦ Minimum Benefit Adjustment (non-GABA)Hired before July 1, 1997 and member did not elect GABA – the monthly retirement, disability or survivor’sbenefit may not be less than 50% the compensation of a newly confirmed firefighter employed by thecity that last employed the member.
• Mortality assumptions among contributing members, terminated vested members, service retired membersand beneficiaries are based on RP-2000 Combined Employee and Annuitant Mortality Tables projected to2020 using Scale BB, set back one year for males.
A-109

• Mortality assumptions among Disabled Retirees are based on RP-2000 Combined Employee and AnnuitantMortality Tables.
Discount RateThe discount rate used to measure the total pension liability was 7.65%. The projection of cash flows used to determinethe discount rate assumed that contributions from participating plan members, employers, and nonemployer contributingentities will be made based on the PERB’s funding policy, which establishes the contractually required rates underMCA. The State contributes 32.61% of salaries paid by employers. Based on those assumptions, the FURS’s fiduciarynet position was projected to be adequate to make all the projected future benefit payments of current plan membersthrough the year 2134. Therefore, the long-term expected rate of return on pension plan investments was applied toall periods of projected benefit payments to determine the total pension liability. A municipal bond rate was notincorporated in the discount rate.
Target AllocationsThe long-term expected return on pension plan assets is reviewed as part of the regular experience study prepared for the FURS. The most recent analysis, performed for the six-year period ended June 30, 2016, is outlined in a reportdated May 2017, and can be located on the MPERA website. The long-term expected rate of return on pension planinvestments was determined by considering information from various sources, including historical rates of return, rateof return assumptions adopted by similar public pension systems, and by using a building-block method in which best-estimate ranges of expected future real rates of return (expected returns, net of pension plan investment and inflation)are developed for each major asset class. These ranges were combined to produce the long-term expected rate of returnby weighing the expected future real rates of return by the target asset allocation percentage and by adding expectedinflation. Best estimates of the arithmetic real rates of return for each major asset class included in the FURS’s targetasset allocation as of June 30, 2018, is summarized in the table that follows:
Asset ClassTarget Asset
AllocationLong-term ExpectedReal Rate of Return
Cash Equivalents 2.60% 4.00%Domestic Equity 36.00% 4.55%Foreign Equity 18.00% 6.35%Fixed Income 23.40% 1.00%Private Equity 12.00% 7.75%Real Estate 8.00% 4.00%Total 100.00%
Sensitivity AnalysisIn accordance with GASB 68 regarding the disclosure of the sensitivity of the net pension liability to changes in thediscount rate, the table below presents the net pension liability calculated using the discount rate of 7.65%, as well aswhat the net pension liability would be if it were calculated using a discount rate that is 1.00% lower (6.65%) or 1.00%higher (8.65%) than the current rate.
(in thousands)1.0% Decrease
(6.65%)Current Discount
Rate1.0% Increase
(8.65%)State as an employer in FURS – net pension
liability $ 4,542 $ 2,650 $ 1,126
State as a nonemployer contributing entity toFURS – net pension liability 134,175 78,285 33,263
Net Pension LiabilityIn accordance with GASB 68, employers and nonemployer contributing entities are required to recognize and reportcertain amounts associated with their participation in the FURS. GASB 68 became effective June 30, 2015, and includes
A-110

requirements to record and report their proportionate share of the collective net pension liability, pension expense,deferred inflows of resources and deferred outflows of resources associated with pensions.
In accordance with GASB 68, the FURS has a special funding situation in which the State is legally responsible formaking contributions directly to the FURS on behalf of the employers. Due to the existence of this special fundingsituation, the State is required to report a proportionate share of a local government or fire district’s collective netpension liability that is associated with the non-State employer.
(dollars presented in thousands)Net Pension Liability
as of 6/30/17Net Pension Liability
as of 6/30/18Percent of
Collective NPLState's proportionate share as an
employer entity $ 2,525 $ 2,650 2.300917%
State's proportionate share as anonemployer contributing entity 76,724 78,285 67.972164%
State of Montana totals $ 79,249 $ 80,935 70.273081%
At June 30, 2019, the State reported a liability of $80.9 million for its proportionate share of the net pension liabilityas an employer and nonemployer contributing entity in relation to the FURS. The net pension liability was measuredas of June 30, 2018, and the total pension liability used to calculate the net pension liability was determined by anactuarial valuation as of June 30, 2017, with update procedures used to roll forward the total pension liability to June30, 2018. The proportion of the net pension liability was based on the all employer and nonemployer contributionsreceived by the FURS during the measurement period, July 1, 2017, through June 30, 2018, relative to the totalcontributions received from all FURS participating employers and the nonemployer contributing entity.
Changes in actuarial assumptions and methods: There were no changes in assumptions or other inputs thataffected the measurement of the total pension liability.
Changes in benefit terms: There have been no changes in benefit terms since the previous measurement date.
Changes in proportionate share: Between the measurement date of the collective net pension liability and theemployer’s reporting date there were no changes in proportion that would have an effect on the employer’sproportionate share of the collective net pension liability.
Employer Pension Expense and Nonemployer Contributing Entity Special Funding Grant ExpenseAt June 30, 2019, the State as an employer recognized pension expense of $485.0 thousand for its proportionate shareof the FURS pension expense. The State also recognized grant expense of $11.7 million for special funding supportprovided by the General Fund for its proportionate share of the FURS’s pension expense that is associated with otheremployer participants in the plan. Total pension related expenses at June 30, 2019, was $12.2 million.
Deferred Outflows and InflowsAt June 30, 2019, the State, as an employer, recognized a beginning deferred outflow of resources for fiscal year 2018contributions of $517.9 thousand.
As of the fiscal year ended June 30, 2019, the State as an employer reported its proportionate share of deferred outflowsof resources and deferred inflows of resources related to the FURS from the following sources:
A-111

(in thousands)Deferred Outflows
of ResourcesDeferred Inflows
of ResourcesDifference between actual and expected experience $ 297 $ 15Net difference between projected and actual earnings
on pension plan investments — 32
Change of assumptions 259 —Changes in proportion and differences between
employer contributions and proportionate shareof contributions
177 —
Contributions paid to FURS subsequent to themeasurement date – FY 2019 contributions 494 —
Totals $ 1,227 $ 47
Amounts reported as deferred outflows of resources related to pensions resulting from the employer’s contributionsmade subsequent to the measurement date of June 30, 2018, will be recognized as a reduction of the net pension liabilityin the fiscal year ended June 30, 2020.
Other amounts reported as deferred outflows of resources and deferred inflows of resources related to pensions will berecognized in pension expense as follows:
(in thousands)
Year ended June 30:
Amount recognized in PensionExpense as an increase or
(decrease) to Pension Expense2020 $ 2652021 2172022 222023 1142024 68Thereafter —
At June 30, 2019, the State recognized a beginning deferred outflow of resources as a nonemployer contributing entityfor fiscal year 2018 contributions of $15.3 million.
As of the fiscal year ended June 30, 2019, the State as a nonemployer contributing entity reported its proportionateshare of deferred outflows of resources and deferred inflows of resources related to FURS from the following sources:
(in thousands)Deferred Outflows
of ResourcesDeferred Inflows
of ResourcesDifference between expected and actual experience $ 8,788 $ 431Net difference between projected and actual
earnings on pension plan investments — 950
Change in assumptions 7,665 —Changes in proportion and differences between
employer contributions and proportionate shareof contributions
117 —
Contributions paid to FURS subsequent to themeasurement date – FY 2019 contributions 16,209 —
Totals $ 32,779 $ 1,381
A-112

Amounts reported as deferred outflows of resources related to pensions resulting from the nonemployer’s contributionsmade subsequent to the June 30, 2018, measurement date will be recognized as a reduction of the net pension liabilityin the fiscal year ended June 30, 2020.
Other amounts reported as deferred inflows of resources related to pensions will be recognized in grant expense asfollows:
(in thousands)
Year ended June 30:
Amount recognized in GrantExpense as an increase or(decrease) to Grant Expense
2020 $ 5,2042021 3,7842022 1,3142023 3,1952024 1,692Thereafter —
Volunteer Firefighters’ Compensation Act – The VFCA, administered by the MPERA, is a multiple-employer, cost-sharing defined benefit plan that was established in 1965, and governed by Title 19, chapter 17, MCA. All membersare unpaid volunteers and the State is the only contributor to the plan. Benefits are established by state law and canonly be amended by the Legislature. The VFCA provides pension, disability, and survivorship benefits for all eligiblevolunteer firefighters who are members of qualified volunteer fire companies in unincorporated areas, towns or villages,and includes volunteer fire departments, fire districts, and fire service areas under the laws of the State. Benefits arebased on eligibility and years of service. Member rights are vested after ten years of credited service. The VFCA alsoprovides limited benefits for death or injuries incurred in the line of duty. A member who chooses to retire and draw apension benefit may return to service with a volunteer fire department without loss of benefits However, a returningretired member may not be considered an active member accruing credit for service.
Summary of BenefitsEligibility for benefitAge 55, 20 years of credited service;Age 60, 10 years of credited service.
Effective July 1, 2011, members who retire on or after July 1, 2011, and have greater than 30 years ofcredited service will receive $7.50 per month for each additional year of credited service over 30 yearsif the pension trust fund is actuarially sound, amortizing any unfunded liabilities in 20 years or less.This determination will be made annually and a member’s benefit will be capped at $250 a month (30years of credited service) if the amortization period grows to greater than 20 years.
Vesting10 years of credited service.
Monthly benefit formula (effective January 1, 2016)$8.75 per year of credited service up to 20 years;$7.50 per year of credited service after 20 years
Contributions to the PlanThe State, as a nonemployer contributing entity, is the only contributor to the VFCA. Contributions are 5% of fireinsurance premium taxes collected on certain fire risks. This requires the plan to be treated as a special funding situationin accordance with GASB 68. The State Auditor makes annual payments from the General Fund to the VFCA fund.Rates are specified by state law for contributions to the VFCA plan. The State legislature has the authority to establishand amend contribution rates to the plan.
A-113

Actuarial AssumptionsThe total pension liability used to calculate the net pension liability was determined by an actuarial valuation as of June30, 2017, with update procedures used to roll forward the total pension liability to June 30, 2018. There were severalsignificant assumptions and other inputs used to measure the total pension liability. The actuarial assumptions used inthe June 30, 2018, valuation were based on the results of the last actuarial experience study, dated May 2017 for thesix-year period ended June 30, 2016. Among those assumptions were the following:
• Investment Return 7.65% • Inflation at 2.75%• Mortality assumptions among contributing members, terminated vested members, service retired members
and beneficiaries are based on RP-2000 Combined Employee and Annuitant Mortality Tables projected to2020 using Scale BB, set back one year for males.
• Mortality assumptions among Disabled Retirees are based on RP-2000 Combined Employee and AnnuitantMortality Tables.
For VFCA, administrative expenses are assumed to equal $89.3 thousand. This dollar amount is added to normal costfor valuation purposes.
Discount RateThe discount rate used to measure the total pension liability was 7.65%. The projection of cash flows used to determinethe discount rate assumed that contributions from the nonemployer contributing entity will be made based on the PERB’sfunding policy, which establishes the contractually required rates under MCA. The State contributes 5% of fire insurancepremium taxes paid on certain fire risks. Based on those assumptions, the VFCA’s fiduciary net position was projectedto be adequate to make all the projected future benefit payments of current plan members through the year 2110. Amunicipal bond rate was not incorporated in the discount rate.
Target AllocationsThe long-term expected return on pension plan assets is reviewed as part of the regular experience study prepared for the VFCA. The most recent analysis, performed for the six-year period ended June 30, 2016, is outlined in a reportdated May 2017, and can be located on the MPERA website. The long-term expected rate of return on pension planinvestments was determined by considering information from various sources, including historical rates of return, rateof return assumptions adopted by similar public pension systems, and by using a building-block method in which best-estimate ranges of expected future real rates of return (expected returns, net of pension plan investment and inflation)are developed for each major asset class. These ranges were combined to produce the long-term expected rate of returnby weighing the expected future real rates of return by the target asset allocation percentage and by adding expectedinflation. Best estimates of the arithmetic real rates of return for each major asset class included in the VFCA’s targetasset allocation as of June 30, 2018, is summarized in the table that follows:
Asset ClassTarget Asset
AllocationLong-term ExpectedReal Rate of Return
Cash Equivalents 2.60% 4.00%Domestic Equity 36.00% 4.55%Foreign Equity 18.00% 6.35%Fixed Income 23.40% 1.00%Private Equity 12.00% 7.75%Real Estate 8.00% 4.00%
Total 100.00%
Sensitivity AnalysisIn accordance with GASB 68 regarding the disclosure of the sensitivity of the net pension liability to changes in thediscount rate, the above table presents the net pension liability calculated using the discount rate of 7.65%, as well as
A-114

what the net pension liability would be if it were calculated using a discount rate that is 1.00% lower (6.65%) or 1.00%higher (8.65%) than the current rate.
(in thousands)1.0% Decrease
(6.65%)Current
Discount Rate1.0% Increase
(8.65%)State as a nonemployer entity net
pension liability $ 12,207 $ 7,667 $ 3,821
Net Pension LiabilityIn accordance with GASB 68, employers and nonemployer contributing entities are required to recognize and reportcertain amounts associated with their participation in the VFCA. GASB 68 became effective June 30, 2015, and includesrequirements to record and report proportionate shares of the collective net pension liability, pension expense, deferredinflows of resources, and deferred outflows of resources associated with pensions.
In accordance with GASB 68, the VFCA has a special funding situation in which the State is legally responsible formaking contributions directly to the VFCA on behalf of volunteer employers. Due to the existence of this special fundingsituation, the State is required to report a proportionate share of a volunteer fire company’s collective net pensionliability that is associated with the non-State volunteer employer.
(dollars presented in thousands)Net Pension Liability
as of 6/30/17Net Pension Liability
as of 6/30/18Percent of
Collective NPLState as a nonemployer
proportionate share $ 10,087 $ 7,667 100%
At June 30, 2019, the State reported a liability of $7.7 million for its proportionate share of the net pension liability.The total pension liability used to calculate the net pension liability was determined by an actuarial valuation as of June30, 2017, with update procedures used to roll forward the total pension liability to June 30, 2018. The nonemployer’sproportion of the net pension liability was based on the nonemployer’s contributions received by the VFCA during themeasurement period, July 1, 2017, through June 30, 2018, relative to total contributions received.
Changes in actuarial assumptions and methods: There were no changes in assumptions or other inputsthat affected the measurement of the total pension liability.
Changes in benefit terms: There have been no changes in benefit terms since the previous measurementdate.
Changes in proportionate share: There were no changes between the measurement date of the collectivenet pension liability and the nonemployer’s reporting date that are expected to have a significant effecton the nonemployer’s proportionate share of the collective net pension liability.
Grant Expense Related to Special FundingThe State as a nonemployer contributing entity recognized grant expense of $664.1 thousand for special funding supportprovided by a portion of fire tax premiums paid to the State and transferred to MPERA for its proportionate share ofthe VFCA pension expense that is associated with other employer participants in the plan.
Deferred Outflows and InflowsAt June 30, 2019, the State as a nonemployer contributing entity recognized a beginning deferred outflow of resourcesfor fiscal year 2018 contributions of $2.2 million.
A-115
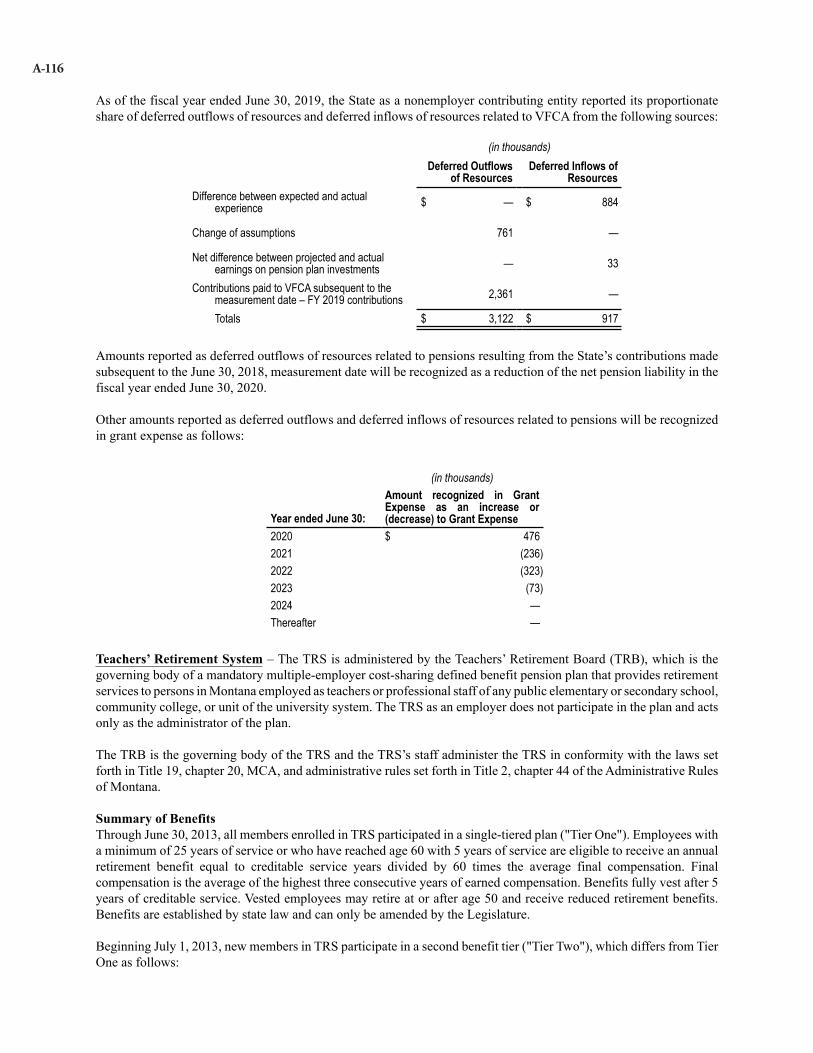
As of the fiscal year ended June 30, 2019, the State as a nonemployer contributing entity reported its proportionateshare of deferred outflows of resources and deferred inflows of resources related to VFCA from the following sources:
(in thousands)Deferred Outflows
of ResourcesDeferred Inflows of
ResourcesDifference between expected and actual
experience $ — $ 884
Change of assumptions 761 —
Net difference between projected and actualearnings on pension plan investments — 33
Contributions paid to VFCA subsequent to themeasurement date – FY 2019 contributions 2,361 —
Totals $ 3,122 $ 917
Amounts reported as deferred outflows of resources related to pensions resulting from the State’s contributions madesubsequent to the June 30, 2018, measurement date will be recognized as a reduction of the net pension liability in thefiscal year ended June 30, 2020.
Other amounts reported as deferred outflows and deferred inflows of resources related to pensions will be recognizedin grant expense as follows:
(in thousands)
Year ended June 30:
Amount recognized in GrantExpense as an increase or(decrease) to Grant Expense
2020 $ 4762021 (236)2022 (323)2023 (73)2024 —Thereafter —
Teachers’ Retirement System – The TRS is administered by the Teachers’ Retirement Board (TRB), which is thegoverning body of a mandatory multiple-employer cost-sharing defined benefit pension plan that provides retirementservices to persons in Montana employed as teachers or professional staff of any public elementary or secondary school,community college, or unit of the university system. The TRS as an employer does not participate in the plan and actsonly as the administrator of the plan.
The TRB is the governing body of the TRS and the TRS’s staff administer the TRS in conformity with the laws setforth in Title 19, chapter 20, MCA, and administrative rules set forth in Title 2, chapter 44 of the Administrative Rulesof Montana.
Summary of Benefits Through June 30, 2013, all members enrolled in TRS participated in a single-tiered plan ("Tier One"). Employees witha minimum of 25 years of service or who have reached age 60 with 5 years of service are eligible to receive an annualretirement benefit equal to creditable service years divided by 60 times the average final compensation. Finalcompensation is the average of the highest three consecutive years of earned compensation. Benefits fully vest after 5years of creditable service. Vested employees may retire at or after age 50 and receive reduced retirement benefits.Benefits are established by state law and can only be amended by the Legislature.
Beginning July 1, 2013, new members in TRS participate in a second benefit tier ("Tier Two"), which differs from TierOne as follows:
A-116

• Tier Two uses a 5-year average final compensation (as opposed to 3-year AFC in Tier One)• Tier Two provides for unreduced service retirement benefits at age 60 with 5 years of creditable service or at
age 55 with at least 30 years of creditable service (rather than at age 60 with 5 years of service or at any agewith creditable service in 25 years in Tier One)
• Tier Two provides for early retirement benefits with 5 years of creditable service at age 55 (rather than age50 in Tier One)
• Tier Two has a one percent higher normal employee contribution rate (though a temporary 1% supplementalemployee contribution rate is also now currently in place for Tier One members), and
• Tier Two provides for an enhanced benefit calculation—1.85% of the AFC multiplied by the years of creditableservice—for members retiring with at least 30 years of creditable service and at least 60 years of age (ratherthan 1.6667 x AFC x years of creditable service)
A guaranteed annual benefit adjustment (GABA) is payable on January 1 of each calendar year for each retiree whohas received at least 36 monthly retirement benefit payments prior to that date. The GABA is applicable to both TierOne and Tier Two members. The GABA for Tier 1 members is 1.5% of the benefit payable as of January 1. For TierTwo members the GABA each year may vary from 0.5% to 1.5% based on the retirement system’s funding status andthe period required to amortize any unfunded accrued actuarial liability as determined in the prior actuarial valuation.
Contributions to the SystemAll active employees in the TRS, regardless of employer type, are required to provide a contribution equal to 8.15%of their compensation.
All State and University employers are required to contribute 11.35% of compensation provided to an active,nonreemployed member. All school district and other employers are required to contribute 8.97% of an active,nonreemployed, member's compensation to the System.
Section 19-20-605, MCA, requires each employer to contribute 9.85% of total compensation paid to all reemployedTRS retirees employed in a TRS reportable position. Pursuant to Section 19-20-609, MCA, this amount shall increaseby 1.00% for fiscal year 2014 and increase by 0.10% each fiscal year through 2024 until the total employer contributionis equal to 11.85% of reemployed retiree compensation.
The TRS receives a portion of the total required statutory contributions directly from the State for all employers. Theemployers are considered to be in a special funding situation and the State is treated as a nonemployer contributingentity in the TRS. The System receives 0.11% of earned compensation from the General Fund for all TRS members.The TRS also receives 2.38% of earned compensation from the General Fund for TRS members employed at schooldistricts, community colleges, educational cooperatives, and counties in Montana. Finally, the State is also required tocontribute $25 million in perpetuity payable July 1 of each year. The Legislature has the authority to establish andamend contribution rates to the plan.
Actuarial AssumptionsThe total pension liability as of June 30, 2018, is based on the results of an actuarial valuation date of July 1, 2018.There were several significant assumptions and other inputs used to measure the total pension liability. The actuarialassumptions used in the July 1, 2018, valuation were based on the results of the last actuarial experience study, datedMay 2018. Among those assumptions were the following:
• Total Wage Increases 3.25% to 7.76% for non-university members(includes 3.25% general wage increase assumption) 4.25% for university members
• Merit Increases 0 to 4.51% for non-university members1.00% for university members
• Investment Return 7.50%• Price Inflation 2.50% • Admin Expense as a % of Payroll 0.36% • Postretirement Benefit Increases (starting three years after retirement)
◦ Tier One members: If the retiree has received benefits for at least three years, the retirement allowancewill be increased by 1.5% on January 1.
A-117

◦ Tier Two members: The retirement allowance will be increased by an amount equal to or greater than0.5% but no more than 1.5% if the most recent actuarial valuation shows the TRS to be at least 90.0%funded and the provisions of the increase is not projected to cause the funded ratio to be less than 85.0%.
• Mortality among contributing members, service retired members, and beneficiaries:◦ For Males and Females: RP-2000 Healthy Combined Mortality Table projected to 2022 adjusted for partial
credibility setback for two years. The tables include margins for mortality improvements which is expectedto occur in the future.
• Mortality among disabled members◦ For Males: RP-2000 Disabled Mortality Table for Males, set back three years, with mortality improvements
projected by Scale BB to 2022.◦ For Females: RP-2000 Disabled Mortality Table for Females, set forward two years, with mortality
improvements projected by Scale BB to 2022.
Discount Rate The discount rate used to measure the total pension liability was 7.50%. The projection of cash flows used to determinethe discount rate assumed that contributions from participating TRS members, employers, and nonemployer contributingentities will be made based on the TRB’s funding policy, which establishes the contractually required rates under MCA.In addition to these contributions, the State General Fund will contribute $25.0 million annually to the TRS payableJuly 1 of each year. Based on those assumptions, the TRS’s fiduciary net position was projected to be adequate to makeall the projected future benefit payments of current plan members through the year 2126. Therefore, the long-termexpected rate of return on pension plan investments was applied to all periods of projected benefit payments to determinethe total pension liability. No municipal bond rate was incorporated in the discount rate.
Target AllocationsThe assumed long-term expected return on pension plan assets is reviewed as part of the regular experience studiesprepared for the TRS. The most recent analysis, performed for the period covering fiscal years 2013 through 2017, isoutlined in a report dated May 3, 2018. Several factors are considered in evaluating the long-term rate of returnassumption including long-term historical data, estimates inherent in current market data, and an analysis in whichbest-estimate ranges of expected future real rates of return (expected return, net of investment expense and inflation).Estimates of variability and correlations for each asset class, were developed by the TRS's investment consultant. Theseranges were combined to develop the long-term expected rate of return by weighting the expected future real rates ofreturn by the target asset allocation percentage and then adding expected inflation. The long-term rate of returnassumption is intended to be a long-term assumption (30 to 50 years) and is not expected to change absent a significantchange in the asset allocation, a change in the inflation assumption, or a fundamental change in the market that altersexpected returns in future years. The average long term capital market assumptions published in the Survey of CapitalMarket Assumptions 2017 Edition by Horizon Actuarial Service, LLC, yield a median real return of 5.07%. The TRS'srecommended assumption of 5.00% for the real return reflects granting each source some degree of credibility. Combinedwith the 2.50% inflation assumption, the resulting nominal return is 7.50%. Best estimates of arithmetic real rates ofreturn for each major asset class included in the TRS’s target asset allocation as of June 30, 2018, is summarized in thetable below:
Asset ClassTarget Asset
AllocationLong-Term ExpectedReal Rate of Return
Broad US Equity 35.00% 6.68%Broad International Equity 18.00% 6.98%Private Equity 10.00% 10.15%Natural Resources 3.00% 4.09%Core Real Estate 7.00% 5.38%TIPS 3.00% 1.78%Intermediate Duration Bonds 19.00% 2.15%High Yield Bonds 3.00% 4.36%Cash 2.00% 0.81%
Total 100.00%
A-118

Sensitivity AnalysisIn accordance with GASB 68 regarding the disclosure of the sensitivity of the net pension liability to changes in thediscount rate, the table below presents the net pension liability calculated using the discount rate of 7.50%, as well aswhat the net pension liability would be if it were calculated using a discount rate that is 1.00% lower (6.50%) or 1.00%higher (8.50%) than the current rate.
(in thousands)1.0% Decrease
(6.50%)Current Discount
Rate1.0% Increase
(8.50%)State as an employer in TRS – net pension
liability $ 65,186 $ 47,407 $ 32,515
State as a nonemployer contributing entityto TRS – net pension liability 963,094 700,417 480,403
Net Pension LiabilityIn accordance with GASB 68, employers and nonemployer contributing entities are required to recognize and reportcertain amounts associated with their participation in the TRS. GASB 68 became effective June 30, 2015, and includesrequirements for participants to record and report their proportionate share of the collective net pension liability, pensionexpense, deferred inflows of resources, and deferred outflows of resources associated with pensions. In accordancewith GASB 68, the TRS has a special funding situation in which the State is legally responsible for making contributionsdirectly to TRS that are used to provide pension benefits to the retired members of the TRS. Due to the existence ofthis special funding situation, the State is required to report a proportionate share of a local government or schooldistrict’s collective net pension liability that is associated with the non-State employer.
(dollars presented in thousands)Net Pension Liability
as of 6/30/17Net Pension Liability
as of 6/30/18Percent of
Collective NPLState's as an employer entity $ 48,227 $ 47,407 2.554088%State's as a nonemployer entity 642,958 700,417 37.735743%
State of Montana totals $ 691,185 $ 747,824 40.289831%
A-119

At June 30, 2019, the State reported a liability of $747.8 million for its proportionate share of the net pension liabilityas an employer and nonemployer contributing entity. The net pension liability was measured as of June 30, 2018, andthe total pension liability used to calculate the net pension liability was determined by an actuarial valuation as of July1, 2018. The employer’s proportion of the net pension liability was based on the State’s contributions received by theTRS during the measurement period, July 1, 2017, through June 30, 2018, relative to all contributions received fromthe TRS’s participating employers and the nonemployer contributing entity.
Changes in actuarial assumptions and methods: As a result of the recent actuarial experience study, datedMay 2018, the following changes to the actuarial assumptions were made since the previous measurementdate:• Assumed rate of inflation was reduced from 3.25% to 2.50%• Payroll growth assumption was reduced from 4.00% to 3.25%• Investment return assumption was reduced from 7.75% to 7.50%• Wage growth assumption was reduced from 4.00% to 3.25%• Mortality among contributing members, service retired members, and beneficiaries was updated to the
following:◦ For Males and Females: RP-2000 Healthy Combined Mortality Table projected to 2022 adjusted for
partial credibility setback for two years. The tables include margins for mortality improvement whichis expected to occur in the future.
• Mortality among disabled members was updated to the following:◦ For Males: RP-2000 Disabled Mortality Table, set back three years, with mortality improvements
projected by Scale BB to 2022.◦ For Females: RP-2000 Disabled Mortality Table, set forward two years, with mortality improvements
projected by Scale BB to 2022.• Retirement rates were updated• Termination rates were updated• Rates of salary increases were updated
Changes in benefit terms: There have been no changes in benefit terms since the previous measurement date.
Changes in proportionate share: There were no changes between the measurement date of the collective netpension liability and the employer’s reporting date.
Employer Pension Expense and Nonemployer Contributing Entity Special Funding Grant ExpenseAt June 30, 2019, the State as an employer recognized a pension expense of $11.5 million for its proportionate shareof the collective TRS pension expense. The State as a nonemployer contributing entity also recognized grant expenseof $41.4 million for special funding support provided by the State’s General Fund for its proportionate share of thecollective TRS pension expense that is associated with other employer participants in the TRS. Total pension relatedexpenses for fiscal year 2019 was $52.9 million.
Deferred Outflows and InflowsAt June 30, 2019, the State as an employer recognized a beginning deferred outflow of resources for fiscal year 2018contributions of $17.3 million.
A-120
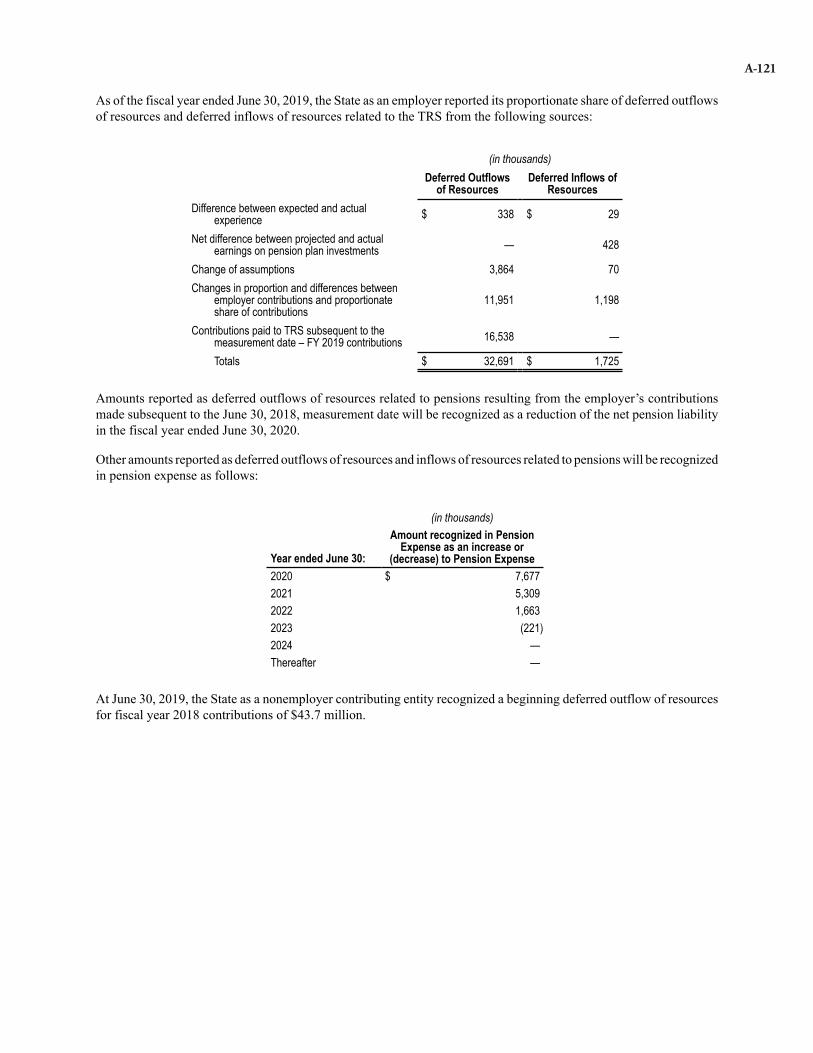
As of the fiscal year ended June 30, 2019, the State as an employer reported its proportionate share of deferred outflowsof resources and deferred inflows of resources related to the TRS from the following sources:
(in thousands)Deferred Outflows
of ResourcesDeferred Inflows of
ResourcesDifference between expected and actual
experience $ 338 $ 29
Net difference between projected and actualearnings on pension plan investments — 428
Change of assumptions 3,864 70Changes in proportion and differences between
employer contributions and proportionateshare of contributions
11,951 1,198
Contributions paid to TRS subsequent to themeasurement date – FY 2019 contributions 16,538 —
Totals $ 32,691 $ 1,725
Amounts reported as deferred outflows of resources related to pensions resulting from the employer’s contributionsmade subsequent to the June 30, 2018, measurement date will be recognized as a reduction of the net pension liabilityin the fiscal year ended June 30, 2020.
Other amounts reported as deferred outflows of resources and inflows of resources related to pensions will be recognizedin pension expense as follows:
(in thousands)
Year ended June 30:
Amount recognized in PensionExpense as an increase or
(decrease) to Pension Expense2020 $ 7,6772021 5,3092022 1,6632023 (221)2024 —Thereafter —
At June 30, 2019, the State as a nonemployer contributing entity recognized a beginning deferred outflow of resourcesfor fiscal year 2018 contributions of $43.7 million.
A-121

As of the fiscal year ended June 30, 2019, the State as a nonemployer contributing entity reported its proportionateshare of deferred outflows of resources and deferred inflows of resources from the following sources:
(in thousands)Deferred Outflows
of ResourcesDeferred Inflows
of ResourcesDifference between expected and actual experience $ 4,998 $ 437Net difference between projected and actual
earnings on pension plan investments — 6,322
Changes of assumptions 57,095 1,037Changes in proportion and differences between
employer contributions and proportionate shareof contributions
5,910 29,044
Contributions paid to TRS subsequent to themeasurement date – FY 2019 Contributions 44,333 —
Totals $ 112,336 $ 36,840
Amounts reported as deferred outflows of resources related to pensions resulting from the nonemployer’s contributionssubsequent to the June 30, 2018, measurement date will be recognized as a reduction of the net pension liability in thefiscal year ended June 30, 2020.
Other amounts reported as deferred outflows and inflows of resources related to pensions will be recognized in grantexpense as follows:
(in thousands)
Year ended June 30:
Amount recognized in GrantExpense as an increase or(decrease) to Grant Expense
2020 $ 18,5832021 16,5292022 (688)2023 (3,261)2024 —Thereafter —
D. Legal Actuarial Status of Plans
The Montana Constitution, Article VIII, Section 15, and Section 19-2-409, MCA state that public retirement systemsshall be funded on an actuarially sound basis. To maintain a fund on an actuarially sound basis, the rate of contributionsshould fund the normal cost, in addition to amortizing the unfunded liability over a period not to exceed 30 years.
A traditional funding actuarial valuation of each of the defined benefit plans is performed annually. The purpose of thetraditional funding actuarial valuation is to measure funding progress, and to determine the actuarial determinedcontribution, contribution sufficiency or deficiency, and other actuarial information necessary for monitoring fundingposition. The most recent actuarial valuation was performed for fiscal year ended June 30, 2019. The statutory fundingrate is tested in the valuation of each public retirement plan to determine if it is sufficient to cover the normal cost rateplus an amortization payment of the unfunded actuarial liability, if any, within 30 years. As of June 30, 2019, the GameWarden & Peace Officers’ Retirement System (GWPORS), the Highway Patrol Officers’ Retirement System (HPORS),and the Public Employees’ Retirement System-Defined Benefit Retirement Plan (PERS-DBRP) were not in complianceand do not amortize within 30 years.
E. Public Employee Defined Contribution Retirement Plans
Public Employees’ Retirement System-Defined Contribution Retirement Plan – The Public Employees’ RetirementSystem - Defined Contribution Retirement Plan (PERS-DCRP) is a multiple Employer plan established July 1, 2002,
A-122

and governed by Title 19, Chapters 2 & 3, MCA. This plan is available to eligible employees of the State, MontanaUniversity System, local governments, and school districts. All new PERS members are initially members of the PERS-DBRP and have a 12-month window during which they may choose to transfer to the PERS-DCRP, or remain in thePERS-DBRP, by filing an irrevocable election. If an election is not filed, the member remains in the PERS-DBRP.Members may not be members of both the defined contribution and defined benefit retirement plans. The PERS-DBRCprovides retirement, disability and death benefits to plan members and their beneficiaries.
Member and Employer contribution rates are established by state law and may be amended only by the Legislature.Employees contribute at a rate of 7.90% of their compensation. Contributions made to the plan by an employee remain100% vested in their interest. Members who achieve 5 years of employment are vested in the plan. Should they terminateprior to this 5-year period, all employer contributions are forfeited to the plan. Amounts forfeited are held in a separateplan forfeiture account and can only be used to pay the administrative expenses, including startup costs, of the plan.Total pension expense for the State as a PERS-DCRP employer for the year ended June 30, 2019, is $7.5 million andcontribution forfeitures were $414.7 thousand.
Local government entities contribute 8.57% of member compensation. School district employers contributed 8.30%of member compensation. The State contributes 0.10% of member compensation on behalf of local government entitiesand 0.37% of member compensation on behalf of school district entities. Each State agency and University employercontributed 8.67% of member compensation.
The total contribution rate of 8.67%, referenced in the preceding paragraph, is allocated as follows: 8.33% to themember’s retirement account; 0.04% to the defined contribution education fund; and 0.30% to the defined contributionOther Post Employment Benefit (OPEB) disability plan.
The PERS-DCRP also administers an OPEB disability plan. Refer to PERB's annual financial report for additionalinformation related to this portion of the plan.
457-Deferred Compensation Plan – The 457-Deferred Compensation Plan (457-Plan) is a voluntary supplementalretirement savings plan established in 1974. The Deferred Compensation Plan is governed by Title 19, Chapter 50,MCA, in accordance with Internal Revenue Code (IRC) Section 457. This plan is available to all employees of theState, Montana University System, and contracting political subdivisions. The State and 53 non-state entity employersparticipate in the 457-Plan.
Assets of the Deferred Compensation Plan are required to be held in trusts, custodial accounts or insurance companycontracts for the exclusive benefit of participants and their beneficiaries. Empower Retirement™ is the record keeperfor the plan. Participants elect to defer a portion of their salary, within IRC limits. The deferred salary is not availableto employees until separation from service, retirement, death, or upon an unforeseeable emergency while still employed,provided IRS-specified criteria are met.
F. Montana University System Retirement Program
Montana University System-Retirement Program (MUS-RP) – This system was established in January 1988 andis underwritten by the Teachers Insurance and Annuity Association (TIAA). Effective July 1, 1993, MUS-RP was madethe mandatory retirement plan for new faculty and administrative staff with contracts under the authority of the Boardof Regents, previously referred to as the Optional Retirement Program (ORP). The MUS-RP is a defined contributionretirement plan governed by Title 19, Chapter 21, MCA. Combined contributions to the faculty and professional staffplan cannot exceed 13% of the participant’s compensation per Section 19-21-203, MCA. Combined contributions tothe classified staff plan are 16.57% per Section 19-3-316, MCA and Section 19-3-315, MCA.
The benefits at retirement depend upon the amount of contributions, amount of investment gains and losses, and theemployee life expectancy at retirement. Under the MUS-RP, each employee enters into an individual contract withTIAA. Individuals are immediately vested with all contributions. The Montana University System records employee/employer contributions, and remits monies to TIAA. Total contributions made to the plan by the employer were $16.7million and the total employee contributions were $19.3 million for the fiscal year ended June 30, 2019.
A-123

G. Method Used to Value Investments
The Montana Board of Investments (BOI) manages the investments, as authorized by state law, for the defined benefitretirement plans in two investment pools, the Consolidated Asset Pension Pool (CAPP) and the Short-Term InvestmentPool (STIP). CAPP is an internal investment pool and STIP is an external investment pool. Each retirement plan’sownership in the pools is based on the funds contributed. Individual investments in the pools are not specificallyidentified to the respective retirement plan. Investments are reported at either fair value or cost, depending on theunderlying investment type. Matrix pricing is used to value securities based on the securities' relationship to benchmarkquoted prices. Mortgages are present value adjusted. The fair value of direct real estate investments is based on thelatest appraised value. Investment valuation not classified within the fair value measurement levels are reported at NetAsset Value. Further detail related to investments is provided in Note 3.
H. Long-term Contracts for Contributions
Per Section 19-2-706, MCA, the Montana Legislature enacted a provision of the Employee Protection Act (EPA)allowing state and university system employees who are eligible for a service retirement and whose positions havebeen eliminated to have their Employer pay a portion of the total cost of purchasing up to three years of “1-for-5”additional service. In fiscal year 2019, there were 260 employees participating in the program.
The Employer has up to ten years to complete payment for the service purchases and is charged the actuarially requiredrate of return as established by MPERA on the unpaid balance. Total contributions received (including interest) duringfiscal year 2019 totaled $136.7 thousand. The outstanding balance at June 30, 2019, totaled $12.8 thousand.
I. Litigation
Tadman, et al. v. State. A retired member of the Sheriffs' Retirement System filed a class action in the eighth JudicialDistrict of Montana against the State of Montana on October 6, 2015, alleging the inappropriate advising, reporting,and withholding of state and federal income taxes on certain line-of-duty disability benefits before conversion to anormal retirement benefit. The plaintiff is represented by Lawrence A. Anderson, an attorney located in Great Falls,Montana. The State was served with the Complaint on November 25, 2015, and is represented by Jean Faure and JasonHolden of the Faure Holden law firm in Great Falls, Montana. On June 11, 2019, the Court issued an Order grantingPlaintiff's Motion to Certify Class. The Court has defined the prospective class of plaintiffs in this matter and the partieswere instructed by the Court to meet and confer to agree on the class form of notice and notice plan concerning thematter.
Murnion v. MPERA AND PERB. A retired member of the Public Employees' Retirement System appealed a FinalOrder of the PERB upholding the Hearing Examiner's Proposed Findings of Fact and Conclusions of Law determiningthat the retired member was not entitled to full-time PERS service credit for his part-time years of employment. OnMarch 15, 2019, the retired member filed a Petition for Appeal of Agency Action and Complaint in the first JudicialDistrict of Montana in order to appeal the PERB's Final Order under the provisions of the Montana AdministrativeProcedure Act (MAPA). On June 26, 2019, MPERA filed a motion to vacate any forthcoming Scheduling Order, set abriefing schedule to control the judicial review of this matter, and dismiss the retired member's Count II and III forfailure to state a claim within the Court's jurisdiction, or, in the alternative, confine any review of each claim to theadministrative record. On July 12, 2019, a Scheduling Order was issued by the Court calling for additional periods fordiscovery and setting a date for a two-day non-jury bench trial beginning on July 8, 2020. On July 15, 2019, Petitionerfiled a response to MPERA's motion, and MPERA filed a reply on July 19, 2019. A notice of submittal was filed byMPERA on July 22, 2019. An estimate of the potential liability for the Murnion case cannot be made.
A-124

NOTE 7. OTHER POSTEMPLOYMENT BENEFITS (OPEB)
A. General Information Non-trust Plans
The State of Montana (State) and the Montana University System (MUS) provide optional postemployment healthcarebenefits in accordance with Section 2-18-704, MCA to the following employees and dependents who elect to continuecoverage and pay administratively established contributions: (1) employees and dependents who retire under applicableretirement provisions and (2) surviving dependents of deceased employees. Medical, dental, and vision benefits areavailable through this plan. The State and MUS offer OPEB plans that are not administered through trusts; as such,there are no plan assets accumulated to offset the total OPEB liability.
In accordance with Section 2-18-704, MCA, the State provides post-retirement health insurance benefits to eligibleemployees who receive retirement benefits from the Public Employees’ Retirement System (PERS) or various otherState retirement systems, and elect to start medical coverage within 60 days of leaving employment. Retirementeligibility criteria differ by State retirement plan. Further detail on State Retirement Plans are provided in Note 6. MUSprovides post-retirement health insurance benefits to eligible employees who receive retirement benefits from theirplan, or an annuity under the MUS-RP, and have been employed by MUS for at least five years, are age 50, or haveworked 25 years with MUS. They must elect to start medical coverage within 60 days of leaving employment. Spouses,unmarried dependent children, and surviving spouses are also eligible for both plans.
Montana State Fund, a discretely presented component of the State and participant in the State OPEB plan, by statute,prepares separately issued financial statements on a calendar year-end basis. Due to the difference in reporting period,there will be a variance between the note disclosures and the financial statements for OPEB related information.
B. Plan Descriptions
Both healthcare OPEB plans for the State and MUS are reported as single employer plans. In addition to the primarygovernment, the participating employers under the State OPEB plan are: Facility Finance Authority, Montana Boardof Housing, Public Employees’ Retirement System, Montana State Fund, and Teachers’ Retirement System. Theparticipating employers under the MUS OPEB plan are: Office of Commissioner of Higher Education (OCHE), MontanaState University - Billings (MSU-Billings), Montana State University - Bozeman (MSU-Bozeman), Great Falls CollegeMSU, Montana State University - Northern (MSU-Northern), Montana Technological University, Helena College UM,University of Montana - Missoula (UM-Missoula), and University of Montana - Western (UM-Western). Participatingemployers under MUS, but excluded from the total OPEB liability due to not qualifying as component units, are:Dawson Community College (Dawson CC), Flathead Valley Community College (Flathead CC), and Miles CommunityCollege (Miles CC). Each participating employer is required to disclose additional information as required per GASBStatement No. 75, Accounting and Financial Reporting for Postemployment Benefits Other than Pensions (GASB 75).
The State and MUS pay for post employment healthcare benefits on a pay-as-you-go basis. Section 2-18-8, MCA givesauthority for establishing and amending the funding policy to the Department of Administration for the State grouphealth insurance plan. Section 20-25-13, MCA gives authority for establishing and amending the funding policy to theBoard of Regents for the MUS group health insurance plan. The healthcare OPEB plans allow retirees to participate,as a group, at a rate that does not cover all of the related costs. This results in reporting the total OPEB liability in therelated financial statements and note disclosures. Reported contributions are not a result of direct funding to the plansor for associated liabilities, but are a measure of the difference in retiree payments into the plans and actual medicalcosts associated with those individuals paid for by the plans. The healthcare OPEB plans are reported as agency funds.There are no assets or liabilities as only contributions collected and distributions made are reflected in these funds.
As of December 31, 2018, the State OPEB plan’s administratively established retiree medical premiums vary between$439.00 and $1,633.00 per month, depending on the medical plan selected, family coverage, and Medicare eligibility.Administratively established dental premiums vary between $41.10 and $70.00 per month and vision hardwarepremiums vary between $7.64 and $22.26 per month, depending on the coverage selected. The plan provides differentcoinsurance amounts and deductibles depending on whether members use in-network or out-of-network providers. Theplan automatically reduces claim reimbursement for members eligible for Medicare, even if the member is not enrolledin Medicare.
A-125

As of June 30, 2019, the MUS OPEB plan’s administratively established retiree medical premiums vary between$327.00 and $2,403.00 per month. Retiree dental premiums vary between $52.00 and $156.00 per month while visionpremiums vary from $9.71 to $28.31, depending on the types and number of dependents enrolled. The plan providesdifferent coinsurance amounts and deductibles depending on whether members use in-network or out-of-networkproviders. The plan automatically reduces claim reimbursement for members eligible for Medicare, even if the memberis not enrolled in Medicare.
C. Basis of Accounting
Total OPEB liability is reported on an accrual basis on the proprietary and fiduciary fund financial statements, thegovernment-wide financial statements, and the component unit financial statements. Total OPEB liability is not reportedon the governmental fund financial statements, as it is considered a long-term liability. Plan member contributions arerecognized in the period in which the contributions are made. Benefits and refunds are recognized when due and payablein accordance with the terms of each plan.
Both OPEB plans state that an employee enrolled in the OPEB plan who (a) at least meets the early retirement criteriadefined by Montana Public Employees’ Retirement Administration (MPERA); and (b) makes arrangements with theirrespective benefit office, within 60 days of the date active employee coverage ends, to continue post-retirement coverage,may continue with the OPEB plan on a self-pay basis, retroactive back to the date active employee coverage was lost,and adhere to these provisions. Therefore, each plan does not include terminated employees who have accumulatedbenefits but are not yet receiving them. There have been no significant changes in the number covered or the type ofcoverage as of June 30, 2019.
The number of State Plan participants as of March 31, 2018(1), follows:
State Plan Participants
Enrollment State (2)
FacilityFinance
Authority (3)
MontanaBoard
of Housing (3)
Public EmployeeRetirement
Board (3)
MontanaState
Fund (3)
TeachersRetirementSystem (3) Total
Active employees 12,210 1 15 46 293 20 12,585Retired employees, spouses, and surviving spouses 2,846 2 3 1 14 7 2,873 Total 15,056 3 18 47 307 27 15,458
The number of MUS Plan participants as of March 31, 2018(1), follows:
MUS Plan Participants
EnrollmentMSU-
GFC (3)UM-
HC (3)MSU-
Billings (3)MSU-
Bozeman (3)MSU-
Northern (3) OCHE (2)UM-
Missoula (3)
UM-MT
Tech (3)
UM-Western (3) Total
Active employees 120 97 462 3,094 176 61 2,143 437 188 6,778Retired employees, spouses, and surviving spouses 7 20 136 578 42 23 579 102 61 1,548 Total 127 117 598 3,672 218 84 2,722 539 249 8,326
(1) Due to roll-forward of the actuary report, Plan Participants are the same as the previous measurement date.(2) Primary Government(3) Discrete Component Units of Primary Government
A-126

D. Schedule of Changes in Total OPEB liability
The following table presents the other items related to and changes in the total OPEB liability:
Annual OPEB Cost & Changes in Total OPEB liability(in thousands)
State Plan MUS Plan
PrimaryGovernmentTotal OPEB
Liability
DiscreteComponentUnit Total
OPEBLiability
Total StatePlan
PrimaryGovernmentTotal OPEB
Liability
DiscreteComponentUnit Total
OPEBLiability
Total MUSPlan
Balances at 6/30/2018 (1) $ 49,473 $ 986 $ 50,459 $ 401 $ 35,037 $ 35,438Changes for the year:
Service cost 2,017 45 2,062 12 1,940 1,952Interest 1,947 43 1,990 9 1,486 1,495
Changes of assumptions or otherinputs 2,828 67 2,895 8 1,343 1,351
Benefit payments (1,672) (37) (1,709) (5) (883) (888)Net changes 5,120 118 5,238 24 3,886 3,910
Balances at 6/30/2019 (2) $ 54,593 $ 1,104 $ 55,697 $ 425 $ 38,923 $ 39,348(1) Primary Government and Discrete Component Unit beginning balance for the Total OPEB Liability of the State Plan includes a prior period adjustment of $3.0thousand between the State and Facility Finance Authority.(2) State and discretely presented component units proportion of the collective total OPEB liability as of the measurement date for fiscal years 2018 and 2019 forthe State Plan was 100% both years and for the MUS Plan is 95.62% and 95.59%, respectively.
E. Actuarial Methods and Assumptions
The total OPEB liability (TOL) measured under GASB 75 is based upon service cost and more standardized reportingassumptions than prior GASB Statements. As a pay-as-you-go public entity, GASB 75 requires a 20-year currentmunicipal bond discount rate to establish an Actuarially Determined Contribution (ADC). The GASB 75 valuation isfurther required to show both historical and projected future net changes in TOL, as well as sensitivity to changes inkey underlying assumptions. Actuarially determined amounts are subject to continual revisions, meaning actual resultsare compared with past expectations and new estimates are made about the future. Actuarial calculations reflect a long-term perspective. The projection of benefits for financial reporting purposes does not explicitly incorporate the potentialeffects of legal or contractual funding limitations on the pattern of cost sharing between the employer and plan membersin the future.
The schedule of changes in the State’s and MUS's TOL and related ratios, presented as required supplementaryinformation following the notes to the financial statements, is designed to present multi-year trend information aboutwhether the actuarial value of plan TOL is increasing or decreasing over time relative to the actuarial liabilities forbenefits. The schedule of changes in the State’s and MUS's TOL and related ratios are based on the substantive plan(the plan as understood by the employer and the plan members). This includes the types of benefits provided at thetime of each valuation and the historical pattern of sharing of benefit costs between the employer and plan membersto that point.
A-127

The State's OPEB Plan TOL on December 31, 2017, rolled forward to March 31, 2019, actuarial valuation wasdetermined using the following actuarial assumptions and other inputs, applied to all periods included in themeasurement, unless otherwise specified:
Other Postemployment BenefitsState Single Employer Plan
Retiree/SurvivingSpouse Spouse
Contributions (in thousands): Before Medicare eligibility $ 13,572 $ 5,268 After Medicare eligibility 5,271 4,403
Actuarial valuation date December 31, 2017
Experience study period January 1, 2015 through December 31, 2017
Actuarial measurement date (1) March 31, 2019
Actuarial cost method Entry age normal funding method
Amortization method Open basis
Remaining amortization period 20 years
Asset valuation method Not applicable since no assets meet the definitionof plan assets under GASB 75
Actuarial assumptions: Discount rate 3.79% Projected payroll increases 4.00% Participation: Future retirees 55.00% Future eligible spouses 60.00% Marital status at retirement 70.00%
(1) Updated procedures were used to roll forward the total OPEB liability to the measurement date.
Mortality - Health: For TRS, healthy mortality is assumed to follow the RP-2000 Healthy Annuitant MortalityTable for ages 50 and above and the RP-2000 Combined Healthy Annuitant Mortality Table for ages below50, set back four years for males, set back two years for females, with mortality improvements projected byScale BB to 2018. For all other groups, healthy mortality is assumed to follow the RP-2000 Combined MortalityTable with improvements projected by Scale BB to 2020, set back one year for males.
Mortality - Disabled: For TRS, disabled mortality is assumed to follow the RP-2000 Disabled Mortality Table,set forward one year for males and set forward five years for females, with mortality improvements projectedby Scale BB to 2018. For all other groups, disabled mortality is assumed to follow the RP-2000 CombinedMortality Table with no projections.
Changes in actuarial assumptions and methods since last measurement date: Changes in actuarial assumptionsinclude interest rate based upon the March 31, 2019, 20-year municipal bond index per GASB 75 requirements.
Changes in benefit terms since last measurement date: None.
A-128

Additional information as of the latest actuarial valuation for MUS OPEB plan follows:
Other Postemployment BenefitsMUS Single Employer Plan
Retiree/SurvivingSpouse Spouse
Contributions (in thousands): Before Medicare eligibility $ 11,264 $ 4,728 After Medicare eligibility 4,806 3,620
Actuarial valuation date December 31, 2017
Actuarial measurement date (1) March 31, 2019
Experience study period January 1, 2015 through December 31, 2017
Actuarial cost method Entry age normal funding method
Amortization method Open basis
Remaining amortization period 20 year period
Asset valuation method Not applicable since no assets meet the definition ofplan assets under GASB 75
Actuarial assumptions: Discount rate 3.79% Projected payroll increases 4.00% Participation: Future retirees 55.00% Future eligible spouses 60.00% Marital status at retirement 70.00%
(1) Updated procedures were used to roll forward the total OPEB liability to the measurement date.
Mortality - Health: For TRS and MUS-RP, healthy mortality is assumed to follow the RP-2000 HealthyAnnuitant Mortality Table for ages 50 and above and the RP-2000 Combined Healthy Annuitant MortalityTable for ages below 50, set back four years for males, set back two years for females, with mortalityimprovements projected by Scale BB to 2018. For all other groups, healthy mortality is assumed to followthe RP-2000 Combined Mortality Table with improvements projected by Scale BB to 2020, set back one yearfor males.
Mortality - Disabled: For TRS and MUS-RP, disabled mortality is assumed to follow the RP-2000 DisabledMortality Table, set forward one year for males and set forward five years for females, with mortalityimprovements projected by Scale BB to 2018. For all other groups, disabled mortality is assumed to followthe RP-2000 Combined Mortality Table with no projections.
Changes in actuarial assumptions and methods since last measurement date: Changes in actuarial assumptionsinclude interest rate based upon the March 31, 2019, 20-year municipal bond index per GASB 75 requirements.
Changes in benefit terms since last measurement date: None.
A-129

Sensitivity of the TOL to changes in the discount rateThe following presents the TOL of the State and MUS OPEB plans, as well as what they would be if calculated usinga discount rate that is 1-percentage-point lower (2.79 percent) or 1-percentage-point higher (4.79 percent) than thecurrent discount rate:
State OPEB plan (in thousands)
1.0% Decrease (2.79%)Current Discount Rate
(3.79%) 1.0% Increase (4.79%)Primary Government $ 67,045 $ 54,593 $ 45,078Discrete Component Units 1,422 1,104 865
Total OPEB liability $ 68,467 $ 55,697 $ 45,943
MUS OPEB plan (in thousands)
1.0% Decrease (2.79%)Current Discount Rate
(3.79%) 1.0% Increase (4.79%)Primary Government $ 518 $ 425 $ 353Discrete Component Units 47,107 38,923 32,564
Total OPEB liability $ 47,625 $ 39,348 $ 32,917
Sensitivity of the TOL to changes in the healthcare cost trend ratesThe following presents the TOL of the State and MUS OPEB plans, as well as what they would be if calculated usinghealthcare cost trend rates that are 1-percentage-point lower (6.0 percent) or 1-percentage-point higher (8.0 percent)than the current healthcare cost trend rates:
State Plan (in thousands)
1.0% Decrease (6.0%)Current Healthcare Cost
Trend Rate (7.0%) 1.0% Increase (8.0%)Primary Government $ 44,316 $ 54,593 $ 68,535Discrete Component Unit 847 1,104 1,460
Total OPEB liability $ 45,163 $ 55,697 $ 69,995
MUS Plan (in thousands)
1.0% Decrease (6.0%)Current Healthcare Cost
Trend Rate (7.0%) 1.0% Increase (8.0%)Primary Government $ 347 $ 425 $ 528Discrete Component Unit 31,821 38,923 48,321
Total OPEB liability $ 32,168 $ 39,348 $ 48,849
A-130

OPEB Expense and Deferred Outflows of Resources and Deferred Inflows of Resources Related to OPEBFor the year ended June 30, 2019, the State OPEB plan's OPEB expense is $2.0 million and MUS OPEB plan's OPEBexpense is $2.3 million.
At June 30, 2019, the State OPEB plan deferred outflows and inflows of resources are from the following sources:
State Plan (in thousands)
Deferred Outflows ofResources
Deferred Inflows ofResources
Primary Government
Difference between expected and actual experience $ — $ 4,064Changes of assumptions or other inputs 2,828 254Amounts associated with transactions subsequent to themeasurement date of the total OPEB liability 2,496 —
Total $ 5,324 $ 4,318Discrete Component Units
Difference between expected and actual experience $ 105 $ 373Changes of assumptions or other inputs 74 23Amounts associated with transactions subsequent to themeasurement date of the total OPEB liability 40 —
Total $ 219 $ 396
At June 30, 2019, MUS OPEB plan deferred outflows and inflows of resources are from the following sources:
MUS Plan (in thousands)
Deferred Outflows ofResources
Deferred Inflows ofResources
Primary Government
Difference between expected and actual experience $ — $ 14Changes of assumptions or other inputs 8 2Amounts associated with transactions subsequent to themeasurement date of the total OPEB liability 5 —
Total $ 13 $ 16Discrete Component Units
Difference between expected and actual experience $ — $ 1,198Changes of assumptions or other inputs 1,343 166Amounts associated with transactions subsequent to themeasurement date of the total OPEB liability 264 —
Total $ 1,607 $ 1,364
A-131

Deferred outflows of resources and deferred inflows of resources related to TOL will be recognized as OPEBexpense as follows:
Amount recognized in OPEB expense as an increase or (decrease) to OPEBexpense
State Plan (in thousands)
Year ended June 30 Primary GovernmentDiscrete Component
Units State Plan Total2020 $ (141) $ (20) $ (161)2021 (141) (20) (161)2022 (141) (20) (161)2023 (141) (20) (161)2024 (141) (20) (161)
Thereafter (783) (119) (902)
Amount recognized in OPEB expense as an increase or (decrease) to OPEBexpense
MUS Plan (in thousands)
Year ended June 30 Primary GovernmentDiscrete Component
Units MUS Plan Total2020 $ (1) $ (5) $ (6)2021 (1) (5) (6)2022 (1) (5) (6)2023 (1) (5) (6)2024 (1) (5) (6)
Thereafter (5) 6 1
A-132

F. General Information Trust Plan
General Information Section 19-3-2141, MCA, establishes a long-term disability plan trust fund (PERS-DCRP Disability) for all State ofMontana employees that participate in the Public Employee Retirement System-Defined Contribution Retirement Plan(PERS-DCRP). All new PERS members are initially members of the Public Employee Retirement System-DefinedBenefit Retirement Plan (PERS-DBRP) and have a 12-month window during which they may choose to transfer to thePERS-DCRP or remain in the PERS-DBRP by filing an irrevocable election. If an election is not filed, the memberremains in the PERS-DBRP. Members may not be members of both the defined contribution and defined benefitretirement plans. Only those participants that choose the PERS-DCRP are covered by the PERS-DCRP Disability plan.
Plan DescriptionThe PERS-DCRP Disability is a multiple-employer cost sharing plan that covers employees of the State, localgovernments, and certain employees of the university system and school districts, who are not covered by a separateretirement system governed by Title 19, MCA. The PERS-DCRP Disability plan provides disability benefits to PERS-DCRP plan members who are vested in the plan and are currently ineligible for retirement.
A separate trust has been established for purposes of providing disability benefits to PERS-DCRP Disability planmembers and it is accounted for as a fiduciary fund. The assets are held in a trust capacity for the beneficiaries. ThePublic Employee Retirement System issues publicly available annual reports which include financial statements andrequired supplemental information for the plan. Those reports may be obtained online (http://mpera.mt.gov) or bycontacting the following:
Public Employees’ Retirement Board 100 North Park, Suite 200P.O. Box 200131Helena, MT 59620-0131
G. Termination Benefits
During the year ended June 30, 2019, the State made the following termination benefit arrangements: continued coverageof group health insurance benefits for thirty-five employees provided for up to six months, one-time lump-sum incentivepayments for thirty-six employees, and paid administrative leave for nine employees. In determining the terminationbenefit liability related to the continued coverage of group health insurance benefits, it was assumed that these benefitswould be paid for the entire period of the arrangement.
During the year ended June 30, 2019, component units of the State made the following termination benefit arrangements:continued coverage of health insurance benefits and/or one-time incentive payments for seventeen employees.
During the year ended June 30, 2019, the cost of termination benefits for the fiscal year was $510.2 thousand and $673.9thousand for the State and its component units, respectively.
A-133

NOTE 8. RISK MANAGEMENT
There are three primary government public entity risk pools and one claims-servicing pool that are reported within theenterprise funds. These pools include Hail Insurance, the Montana University System (MUS) Group Insurance Plan,the MUS Workers Compensation Program, and the Subsequent Injury claims-servicing pool. The State of Montana(Old Fund) provides risk financing as an entity other than a public entity risk pool. The liability and payment of theworkers compensation claims for incidents occurring before July 1, 1990, are reported in the government-wide financialstatements within the primary government. Unpaid claims and claim adjustment expenses are estimated based on theultimate cost of settling the claims including the effects of inflation and other societal/economic factors. Additionally,the primary government reports its own risk management activity within two internal service funds: Employees GroupBenefits Plans and Administration Insurance Plans. In all of these funds, there are no significant reductions in insurancecoverage from the prior year. These funds use the accrual basis of accounting. By statute, these funds cannot invest incommon stock. Investments are recorded at fair value. Premiums and discounts are amortized using the straight-linemethod over the life of the securities.
A. Public Entity Risk Pools
(1) Hail Insurance – Any Montana producer engaged in growing crops subject to destruction or damage by hail mayparticipate in the Hail Insurance program. The Hail Insurance program issued 641 policies during the 2019 growingseason. This fund accounts for premium assessments paid by producers for crop acreage insured, investment and interestearnings, administrative costs, and claims paid for hail damage. Depending upon the actuarial soundness of the reservefund and the damage in a season, producers may receive a premium refund. Anticipated investment income is consideredin computing a premium deficiency, of which there is none.
A claim must be submitted to the State Board of Hail Insurance within 14 days of a loss occurrence. The claim mustindicate whether the grain is stemming, in the boot, heading out, in the milk, in the stiff dough, ready to bind, or combine.If beans, peas, or other crops are damaged, the growth-stage must also be indicated. Inspection of a crop will occur aspromptly as possible after claim receipt. The liability on all insured crops expires after October 1. The insurance onlycovers loss or damage to growing grain that exceeds 5.0% destruction by hail.
To reduce its exposure to large losses, the fund purchased Crop Hail Quota Share Reinsurance for the 2019 growingseason, with an 80.0% share of premiums and losses allotted to the Reinsurer and a 20.0% share of each allotted to theState Hail Insurance. The fund recorded a liability of $17.4 thousand which is 20.0% of the estimated claims ($79.9thousand) plus adjustment expenses through June 30, 2019. The amount deducted from the estimated claims as of June30, 2019, for reinsurance was $63.9 thousand (80.0% of estimated claims). The premiums ceded to the reinsurer throughJune 30, 2019 were $990.6 thousand which was 80.0% of total premiums of $1.2 million.
Any crop insurance liability is paid to the producers within one year of occurrence; therefore, liabilities are notdiscounted. The fund has no excess insurance or annuity contracts.
(2) Montana University System (MUS) Group Insurance Plan – This plan is authorized by the Board of Regentsand in Section 20-25-13, MCA. The Plan's purpose is to provide medical, dental, prescription drug, and related groupbenefits coverage to employees of the Montana University System and affiliates, as well as their dependents, retirees,and COBRA members. The MUS Group Benefits Plan is fully self-insured, except for life insurance, long-term care,long-term disability, and accidental death and dismemberment insurance. Delta Dental administers the dental plan,Blue Cross and Blue Shield of Montana administers the vision plan, and Navitus is the administrator for the prescriptiondrug program. Allegiance Benefit Plan Management, Blue Cross and Blue Shield of Montana, and Pacific Source arethe three third-party claims administrators for the self-insured managed care plan. Allegiance Benefit Plan Management,Blue Cross and Blue Shield of Montana, and Pacific Source have contracts for utilization management. The utilizationmanagement program consists of hospital pre-authorization and medical necessity review as well as large casemanagement. Premiums are collected from employees through payroll deductions and recorded in the MUS GroupInsurance enterprise fund. The claims liability is calculated by Actuaries Northwest and estimated to be $10.0 millionas of June 30, 2019, based on prior year experience. A liability is reported in the accompanying financial statementsfor these estimated claims.
(3) Montana University System (MUS) Workers’ Compensation Program – This plan was formed to provide self-insured workers compensation coverage for employees of the MUS. The MUS Board of Regents provides workers’
A-134

compensation coverage under Compensation Plan Number One (Section 39-7-2101, MCA). The program is self-insuredfor workers’ compensation claims with losses in excess of $750.0 thousand per occurrence ($500.0 thousand for claimsoccurring prior to July 1, 2013) and $1.0 million per aircraft occurrence covered by reinsurance with a commercialcarrier. Employer’s liability claims are covered to a maximum of $1.0 million above the self-insured amount of $750.0thousand ($500.0 thousand for claims occurring prior to July 1, 2013). During fiscal year 2019, the program ceded$311.5 thousand in premiums to reinsurers.
Premium rates for all participating campuses are established by the MUS Workers’ Compensation Program Committeebased on actuarial calculations of premium need and composite premium rate. Premium rates are adjusted periodicallybased on inflation, claims experience, and other factors. Premiums are recorded as revenue in the MUS Workers’Compensation Program in the period for which coverage is provided. Members may be subject to supplementalassessments in the event of deficiencies. The program considers anticipated investment income in determining if apremium deficiency exists.
The fund recorded a liability of $6.8 million for estimated claims at June 30, 2019. The liability is based on the estimatedultimate cost of settling the reported and unreported claims, claims reserve development including the effects of inflation,and other societal and economic factors. Estimated amounts of subrogation and reinsurance recoverable on unpaidclaims are deducted from the liability for unpaid claims. Estimated claims liabilities are recomputed periodically basedon current review of claims information, experience with similar claims, and other factors. Adjustments to estimatedclaims liabilities are recorded as an increase or decrease in claims expense in the period the adjustments are made.
(4) Subsequent Injury – The purpose of the Subsequent Injury Fund (SIF) is to assist individuals with a permanentimpairment that may create an obstacle to employment by limiting workers' compensation exposure for employers whohire SIF-certified individuals. The program is funded through an annual assessment for Montana self-insured employersand a surcharge on premium for private insured and Montana State Fund policyholders.
The Employment Relations Division sets the assessment and surcharge rates annually. The amount assessed is calculatedby adding the amount of paid losses reimbursed by SIF from April 1 of the previous calendar year through March 31of the current calendar year, plus the expenses of administration, less other income earned. Employers share in thereimbursement in two ways: (1) If self-insured, the reimbursement is based on their share of overall paid losses in theprevious calendar year. (2) If insured through a private carrier or Montana State Fund, the reimbursement is based onboth overall paid losses in the previous calendar year and the amount of the employer's premium paid for their business.
The SIF program reduces the liability of the employer (if self-insured) or insurer by placing a limit of 104 weeks onthe amount an employer (if self-insured), or the employer’s insurer, will have to pay for medical and wage loss benefitsin the event a worker who is SIF-certified becomes injured or re-injured on the job. SIF will assume liability for theclaim when the 104 weeks is reached. For an insured employer, since the insurer's liability is limited to 104 weeks onthe claim, this can favorably impact the employer’s modification factor, which in turn could keep premiums lower thanwould otherwise be the case without SIF. For a self-insured employer, it provides a direct recovery of expenses paidfor a workers’ compensation claim. If a certified worker does become injured on the job, the worker remains entitledto all benefits due under the Workers’ Compensation Act.
An estimated liability is recorded based on a projected cost analysis and total population of registered SIF participants.As of June 30, 2019, the amount of this liability was estimated to be $2.3 million.
(5) Changes in Claims Liabilities for the Past Two Years – As indicated above, these funds establish liabilities forboth reported and unreported insured events including estimates of future payments of losses and related claimadjustment expenses. The following tables present changes (in thousands) in those aggregate liabilities during the pasttwo years. All information in these tables is presented at face value and has not been discounted.
A-135

Hail Insurance MUS GroupInsurance Plan
MUS WorkersCompensation
2019 2018 2019 2018 2019 2018Unpaid claims and claim adjustment expenses at beginning of year $ 35 $ 2 $ 10,200 $ 10,000 $ 5,831 $ 7,298
Incurred claims and claim adjustment expenses: provision for insured events of the current year 422 120 88,473 86,485 2,523 2,794Less excess insurance reimbursement - - - - - -
Increase (decrease) in provision for insured events of prior years 96 12 - - 93 (1,273) Total incurred claims and claim adjustment expenses 518 132 88,473 86,485 2,616 1,521
Payments:Claims and claim adjustment expenses attributable to insured events of the current year (405) (85) (88,673) (86,285) (644) (605)
Claims and claim adjustment expenses attributable to insured events of prior years (131) (14) - - (1,014) (2,383)
Total payments (536) (99) (88,673) (86,285) (1,658) (2,988)
Total unpaid claims and claim adjustment expenses at end of year $ 17 $ 35 $ 10,000 $ 10,200 $ 6,789 $ 5,831
B. Entities Other Than Pools
(1) Administration Insurance Plans – This self-insurance plan provides coverage for general liability, automobileliability, automobile physical damage, foster care liability, and State-administered foreclosure of housing units. TheState self-insures the $1.5 million deductible per occurrence for most property insurance, as well as various deductibleamounts for other State property. The State also self-insures against losses of property below $1.5 million of value,with State agencies paying the first $1.0 thousand. Commercial property insurance protects approximately $5.8 billionof State-owned buildings and contents. The State’s property insurance includes separate earthquake and flood protectioncoverage, with deductibles of $2.0 million for earthquake and $2.0 million for flood per occurrence. Premiums arecollected from all state agencies, including component units, and recorded as revenue in the Administration InsuranceFund.
An annual actuarial study, prepared by Willis Towers Watson Company, and issued for the accident period July 1, 2009,through June 30, 2019, is the basis for estimating the liability for unpaid claims and is supported by historical loss data.As of June 30, 2019, estimated claims liability was $16.2 million.
(2) Employee Group Benefits Plans – The medical and dental health plans provided by the State are fully self-insuredwith the State assuming the risk for claims incurred by employees of the State, elected officials, retirees, formeremployees covered by COBRA benefits, and their dependents. The State contracted with Allegiance as the third-partyadministrator for medical coverage. Delta Dental is the administrator for dental coverage. Navitus is the administratorfor the pharmacy program. Contributions are collected through payroll deductions, deductions through the PublicEmployees Retirement Administration, the Legislative Branch, and self-payments. The contributions are recorded asrevenue in the Employee Group Benefits internal service fund. As of June 30, 2019, estimates for claims liabilities,which include both incurred but not reported claims and grandfathered claims resulting from a 1998 change in periodfor which the benefit coverage is available, as well as other actuarially determined liabilities, were $18.9 million as
A-136

provided by Actuaries Northwest, a consulting actuarial firm. In fiscal year 2020, $18.7 million of these claims liabilitiesare estimated to be paid.
(3) State of Montana (Old Fund) – State of Montana (Old Fund) covers workers’ compensation claims that wereincurred before July 1, 1990. Old Fund was originally a risk financing insurance entity, but upon depletion of all of itsassets, is now financed by the General Fund. The participants within the pool are individuals outside of governmentalentities.
An actuarial study prepared by Willis Towers Watson, as of June 30, 2019, estimated the cost of settling claims thathave been reported, but not settled, and claims that have been incurred, but not reported. At June 30, 2019, $44.3 millionof unpaid claims and claim adjustment expenses were reported at face value.
(4) Changes in Claims Liabilities for the Past Two Years – These funds establish liabilities for both reported andincurred, but not reported, claims. Grandfathered claims are not included as they relate to future claims not yet incurred.The following table presents changes in the balances of claims liabilities during the past two fiscal years (in thousands).
AdministrationInsurance Plans
Employers GroupBenefits Plan
State of Montana Old Fund
2019 2018 2019 2018 2019 2018Amount of claims liabilities at the beginning of each fiscal year $ 15,180 $ 16,054 $ 17,723 $ 17,696 $ 31,109 $ 32,212
Incurred claims:Provision for insured events of the current year 4,803 4,714 175,435 171,930 - -
Increase (decrease) in provision for insured events of prior years 12,348 11,070 (1,672) (4,013) 22,193 6,002
Total incurred claims 17,151 15,784 173,763 167,917 22,193 6,002
Payments:Claims attributable to insured events of the current year (2,167) (1,852) (156,695) (154,468) - -
Claims attributable to insured events of prior years (14,007) (14,806) (15,895) (13,422) (9,036) (7,105)
Total payments (16,174) (16,658) (172,590) (167,890) (9,036) (7,105)
Total claims liability at end of each fiscal year $ 16,157 $ 15,180 $ 18,896 $ 17,723 $ 44,266 $ 31,109
A-137

NOTE 9. COMMITMENTS
A. Highway Construction
At June 30, 2019, the Department of Transportation had contractual commitments of approximately $294.4 million forconstruction of various highway projects. Funding for these highway projects is to be provided from federal grants andmatched with state special revenue funds.
B. Capital Construction
At June 30, 2019, the Department of Administration, Architecture & Engineering Division, had commitments ofapproximately $30.4 million for capital projects construction. The primary government will fund $3.7 million of theseprojects, with the remaining $26.8 million funding coming from the Montana University System.
At June 30, 2019, Fish, Wildlife, and Parks (FWP) had contractual commitments of approximately $4.6 million forengineering and construction of various capital projects. The majority of the funding for these projects is to be providedby federal grants and state special revenue funds.
C. Loan and Mortgage Commitments
The Montana Board of Investments (BOI) makes firm commitments to fund commercial loans, residential mortgagesand Veterans' Home Loan Mortgages (VHLM) from the Coal Severance Tax Permanent Trust Fund. These commitmentshave expiration dates and may be extended according to BOI policies. As of June 30, 2019, BOI had committed, butnot yet purchased, $38.7 million in loans from Montana lenders. In addition to the above commitments, lenders hadreserved $23.9 million for loans as of June 30, 2019. As of June 30, 2019, another $1.7 million represented lenderreservations for the VHLM residential mortgage purchases with no purchase commitments.
The BOI makes reservations to fund mortgages from the State’s pension funds. As of June 30, 2019, there were nomortgage reservations. All BOI residential mortgage purchases are processed by the Montana Board of Housing(MBOH). The MBOH does not differentiate between a mortgage reservation and a funding commitment.
The BOI makes firm commitments to fund loans from the INTERCAP loan program. The BOI’s outstandingcommitments to eligible Montana governments, as of June 30, 2019, totaled $33.0 million.
D. Department of Corrections Bond Commitments
At June 30, 2019, the outstanding tax-exempt bonds distributed by the Facility Finance Authority were issued in theamount of $12.6 million of which $1.7 million in principal payments are scheduled to be paid by June 30, 2020. Thesebonds have been issued to facilities operating treatment and prerelease centers. The Department of Corrections agreesto provide payment on behalf of the contractors for the total principal and interest regarding these outstanding bonds.These costs are then recovered through the center's monthly billing for inmate room and board.
E. Department of Labor and Industry Commitments
At June 30, 2019, Department of Labor and Industry, had $1.8 million contractual commitments for Montana StateAmeriCorps Programs and a $2.3 million commitment for IT contracts. The funding for these programs is federal grantsand state special revenue funds.
A-138

F. Proprietary Fund Commitments
Budgets are administratively established in the enterprise and internal service funds, excluding depreciation,compensated absences, and bad debt expense. Appropriations may be committed for goods/services that are not receivedas of fiscal year-end. These executory commitments are included in unrestricted net position in the accompanyingfinancial statements as follows (in thousands):
Enterprise Funds AmountHail Insurance $ 13Liquor Warehouse 219Prison Industries 3Secretary of State Business Services 1,957West Yellowstone Airport 4Subtotal - Enterprise funds $ 2,196
Internal Service FundsAircraft Operations $ 195Commerce Centralized Services 5Labor Central Services 1,048Admin Central Services 2Print and Mail Services 70Buildings and Grounds 80Subtotal - Internal Service funds $ 1,400
G. Encumbrances
As of June 30, 2019, the State of Montana encumbered expenditures as presented in the table below (in thousands):
Federal SpecialRevenue Fund General Fund
NonmajorGovernmental
FundsState Special
Revenue Fund TotalEncumbrances $ 47,391 $ 17,178 $ 431 $ 60,810 $ 125,810
A-139

NOTE 10. LEASES/INSTALLMENT PURCHASES PAYABLE
The State has entered into various capital and operating leases for land, buildings, equipment, and computer software.Lease contracts are required by law to contain a clause indicating continuation of the lease is subject to funding by theLegislature. It is expected, in the normal course of operations, that most of these leases will be replaced by similarleases.
A. Capital Leases/Installment Purchases
Obligations under capital leases/installment purchases at June 30, 2019, were as follows (in thousands):
Fiscal Year Ending June 30:Governmental
ActivitiesBusiness-Type
Activities2020 $ 3,939 $ 182021 3,598 —2022 2,877 —2023 1,710 —2024 774 —2025 - 2029 229 —Total minimum payments 13,127 18Less: interest (582) —
Present value of minimum payments $ 12,545 $ 18
Assets acquired under capital leases for the primary government by asset class were as follows (in thousands):
Asset ClassBuildings $ 1,596Equipment 21,496Less: Accum Depreciation (9,901)Net Book Value $ 13,191
B. Operating Leases
Primary government rental payments for operating leases in fiscal year 2019 totaled $27.5 million. Future rentalpayments under operating leases are as follows (in thousands):
Fiscal Year Ending June 30:Governmental
ActivitiesBusiness-Type
Activities2020 $ 23,746 $ 5842021 18,961 5922022 17,689 5592023 19,012 5632024 13,239 5632025 - 2029 47,159 1,6562030 - 2034 26,741 744Thereafter 15,392 888
Total future rental payments $ 181,939 $ 6,149
A-140

NOTE 11. STATE SHORT-TERM DEBT AND LONG-TERM LIABILITIES
A. General Information
The State has no constitutional limit on its power to issue obligations or incur debt, other than a provision that no debtmay be created to cover deficits incurred because appropriations exceeded anticipated revenues. No State debt shallbe created unless authorized by a two-thirds vote of the members of each house of the Legislature or a majority of theelectors voting thereon. The Board of Examiners (consisting of the Governor, Secretary of State, and Attorney General)is authorized, pursuant to various enabling acts, to issue bonds and notes of the State.
B. Short-term Debt
The Board of Examiners, upon recommendation of the Department of Administration, may issue notes in anticipationof the receipt of taxes and revenues. Notes may not be issued to refund outstanding notes.
During fiscal year 2019, the State issued two bond anticipation notes. The proceeds of Water/Wastewater 2019B andDrinking Water 2019A will be used to fund water and wastewater system improvements and rehabilitation. The Stateissued three bond anticipation notes during fiscal year 2016, the last of which was paid off during fiscal year 2019.The State issued one bond anticipation note in fiscal year 2017 and two bond anticipation notes in fiscal year 2018, allof which were paid off during fiscal year 2019. The following schedule summarizes the activity for the year endedJune 30, 2019 (in thousands):
BANS Beginning Balance Additions ReductionsEndingBalance
Drinking Water – 2015B 350 — 350 —Coal Severance Tax – 2016E 1,180 520 1,700 —Water/Wastewater – 2017B 450 1,050 1,500 —Drinking Water – 2017C 900 1,600 2,500 —Drinking Waste – 2019A (1) — 1,400 — 1,400Water/Wastewater – 2019B (1) — 1,190 — 1,190
(1) These bond anticipation notes have not been fully drawn at fiscal year-end.
The Board of Investments (BOI) of the State is authorized to issue Intermediate Term Capital (INTERCAP) bondsunder the Municipal Finance Consolidation Act. These bonds may not aggregate more than $190.0 million as amendedby the 2007 Legislature. The purpose of the bonds is to provide funds for BOI to make loans to eligible governmentunits. The bonds are not a debt or liability of the State. The bonds are limited obligations of BOI, payable solely from(1) repayments of principal and interest on loans made by BOI to participating eligible governmental units, (2) investmentincome under the indenture, and (3) an irrevocable pledge by BOI. BOI has no taxing power. The bonds may beredeemed, at the bondholder's option, any March 1, prior to maturity. BOI did not enter into an arms-length financingagreement to convert the bonds "put," or tender, and were not resold into some other form of long-term obligation.Accordingly, these bonds, considered demand bonds, are included in short-term debt. The amounts issued andoutstanding at June 30, 2019, were as follows (in thousands):
A-141

Amount BalanceSeries Issued June 30, 20192000 $ 15,000 $ 14,2552003 15,000 14,3302004 18,500 18,0002007 15,000 14,6502010 12,000 11,9002013 12,000 11,9702017 20,000 19,960
$ 105,065
The following schedule summarizes the activity relating to the demand bonds during the year ended June 30, 2019 (inthousands):
BeginningBalance Additions Reductions Ending
BalanceDemand bonds $ 105,110 $ — $ 45 $ 105,065
A-142

C. Long-term Debt
The full faith, credit, and taxing powers of the State are pledged for the payment of all general obligation debt. Revenueand mortgage bonds are secured by a pledge from the facilities to which they relate and by certain other revenues, fees,and assets of the State and the various colleges and universities. Primary government bonds and notes outstanding atJune 30, 2019, were as follows (in thousands):
Principal PaymentsAmount Interest Fiscal Year In Year of Balance
Governmental Activities Series Issued Range (%) (1) 2020 Maturity (2) June 30, 2019General obligation bondsHard Rock Mining Reclamation 2002C $ 2,500 3.5-4.7 $ 170 200 (2023) $ 740CERCLA Program (5) 2005D 2,000 3.25-4.3 110 140 (2026) 875Energy Conservation Program (4) 2006B 3,750 4.0-6.0 305 330 (2022) 955Long-Range Bldg Program 2008D 3,100 3.375-4.35 150 220 (2028) 1,645Long-Range Bldg Program Refunding 2010A 20,220 2.0-4.0 685 710 (2021) 1,395Drinking Water Revolving Fund Refunding (3) 2010B 5,400 2.0-4.0 510 110 (2026) 1,750Trust Land (Taxable) 2010F 21,000 1.55-4.9 970 1,450 (2031) 14,235Long-Range Bldg Program 2010G 550 1.5-2.7 60 60 (2021) 120Long-Range Bldg Program Refunding 2011D 5,755 3.0 -3.25 650 720 (2023) 2,735Long-Range Bldg Program Refunding 2013C 6,780 2.0-4.0 670 115 (2025) 3,680Water Pollution Control Revolving Fund (Taxable)(3) 2013D 1,035 0.4-3.7 105 120 (2024) 555Water Pollution Control Revolving Fund (3) 2013E 5,000 2.0-3.0 300 300 (2024) 1,500Long-Range Bldg Program Refunding 2014 28,810 1.5-5.0 2,035 820 (2028) 19,590Long-Range Bldg Program Refunding 2015A 9,340 2.0-4.0 1,260 1,260 (2020) 1,260Water Pollution Control Revolving Fund (3) 2015C 24,365 3.0-5.0 870 1,860 (2036) 22,055
Total general obligation bonds $139,605 $ 8,850 $ 73,090
Special revenue bondsState Hospital Project (6) 2018 $ 4,575 4.0-5.05 $ 1,095 1,165 (2022) $ 3,390Renewable Resource Program (7) 2003A 3,000 1.05-4.05 180 215 (2024) 985Renewable Resource Program (7) 2010B 1,730 2.0-3.6 80 115 (2031) 1,145Renewable Resource Program (Taxable) (7) 2010C 6,720 0.9-4.2 395 170 (2031) 3,935U.S. Highway 93 GARVEE (8) 2012 50,915 0.9-1.9 11,040 11,040 (2020) 11,040Renewable Resource Program (7) 2013A 2,255 2.0-3.625 140 185 (2029) 1,600Renewable Resource Program (Taxable) (7) 2013B 3,390 1.0-4.75 205 290 (2029) 2,420U.S. Highway 93 GARVEE Refunding (8) 2016 22,540 0.74-1.86 3,225 3,740 (2023) 13,910
Total special revenue bonds $ 95,125 $ 16,360 $ 38,425
A-143

Principal PaymentsAmount Interest Fiscal Year In Year of Balance
Governmental Activities Issued Range (%) (1) 2020 Maturity (2) June 30, 2019Notes PayableMiddle Creek Dam Project (9) $ 3,272 8.125 $ 92 226 (2034) $ 1,945Tongue River Dam Project (10) 11,300 — 290 290 (2038) 5,506ITSD IBM Mainframes Maintenance 500 1.07 127 127 (2020) 127ITSD IBM Professional Services 758 0.19 163 72 (2023) 572 Total notes payable $ 15,830 $ 672 $ 8,150 Subtotal governmental activities, before unamortized balances 119,665 Unamortized discount (7) Unamortized premium 7,461Total governmental activities $250,560 $ 25,882 $ 127,119
(1) The interest range is over the life of the obligation.(2) Year of maturity refers to fiscal year.(3) These bonds provide matching funds to enable the State to obtain capitalization grants from the U.S Environmental Protection Agency for water system
development loans to state political subdivisions.(4) Bonds issued for financing the design, construction, and installation of energy conservation projects at various state buildings.(5) The CERCLA (Comprehensive Environmental Response, Compensation, and Liability Act) Program Bonds were issued for the purpose of financing the costs
of State of Montana participation in the remedial actions under Section 104 of the CERCLA 42 United States Code Sections 9601-9657, and State of Montanacosts for maintenance of sites under CERCLA. The CERCLA Bonds are secured additionally by a pledge of monies received by the State as cost recoverypayments and revenues derived from the resource indemnity and groundwater assessment tax in the event cost recovery payments are insufficient.
(6) Facility Finance Authority loan to the Department of Public Health and Human Services for the Montana State Hospital Project.(7) Issued by the Department of Natural Resources and Conservation and backed by a pledge of coal severance taxes and project revenues.(8) The U.S. Highway 93 GARVEES (Grant Anticipation Revenue Vehicles) Bonds were issued for the purpose of improving a 44.8-mile stretch of U.S. Highway
93. Repayment of the bonds is secured by a pledge of certain federal aid revenues.(9) U.S. Bureau of Reclamation loan to the Department of Natural Resources & Conservation.(10) Northern Cheyenne Tribe loan to the Department of Natural Resources & Conservation. The loan will not accrue interest and will be repaid over 39 years.
Loan repayment is secured by the issuance of a coal severance tax bond to the tribe.
D. Debt Service Requirements
Primary government debt service requirements at June 30, 2019, were as follows (in thousands):
Governmental ActivitiesGeneral Obligation Bonds Special Revenue Bonds Notes Payable
Year Ended June 30: Principal Interest Principal Interest Principal Interest2020 $ 8,850 $ 2,990 $ 16,360 $ 1,657 $ 672 $ 542021 7,825 2,706 5,555 974 552 482022 7,080 2,485 5,790 729 560 452023 6,825 2,145 4,860 472 466 412024 6,155 1,870 1,165 238 398 402025 - 2029 22,205 5,706 4,140 561 2,067 2042030 - 2034 10,520 2,045 555 27 2,276 2042035 - 2039 3,630 184 — — 1,159 —
Total $ 73,090 $ 20,131 $ 38,425 $ 4,658 $ 8,150 $ 636
A-144

E. Summary of Changes in Long-term Liabilities
Primary government long-term liability activities for the year ended June 30, 2019, were as follows (in thousands):
BeginningBalance Additions Reductions
EndingBalance
AmountsDue WithinOne Year
AmountsDue In MoreThan One
YearGovernmental activitiesBonds/notes payable
General obligation bonds $ 84,460 $ — $ 11,370 $ 73,090 $ 8,850 $ 64,240Special revenue bonds 56,435 — 18,010 38,425 16,360 22,065Notes payable 9,307 — 1,157 8,150 672 7,478
150,202 — 30,537 119,665 25,882 93,783Unamortized discount (8) 1 — (7) — (7)Unamortized premium 9,095 — 1,634 7,461 — 7,461
Total bonds/notes payable (2) 159,289 1 32,171 127,119 25,882 101,237
Other liabilitiesLease/installment purchase payable 13,698 2,458 3,611 12,545 3,684 8,861Operating lease rent holiday 17 — 9 8 8 —Pension benefits payable 4 — — 4 2 2Compensated absences payable (1) 101,759 54,683 54,757 101,685 54,443 47,242Arbitrage rebate tax payable (1) 83 — 83 — — —Estimated insurance claims (1) 64,013 213,107 197,802 79,318 30,662 48,656Pollution remediation 198,645 — 20,795 177,850 19,509 158,341Net pension liability (3) 1,831,200 564,245 174,680 2,220,765 — 2,220,765Total OPEB liability 48,930 5,079 — 54,009 — 54,009
Total other liabilities 2,258,349 839,572 451,737 2,646,184 108,308 2,537,876Total governmental activities long-term
liabilities $ 2,417,638 $ 839,573 $ 483,908 $ 2,773,303 $ 134,190 $ 2,639,113
Business-type activitiesLease/installment purchase payable $ 231 $ — $ 213 $ 18 $ 18 $ —Compensated absences payable 2,042 1,030 1,050 2,022 1,048 974Arbitrage rebate tax payable 17 70 43 44 43 1Estimated insurance claims 18,960 91,609 91,500 19,069 12,717 6,352Net pension liability (3) 16,371 123 4,551 11,943 — 11,943Total OPEB liability 942 65 — 1,007 — 1,007
Total business-type activities long-termliabilities $ 38,563 $ 92,897 $ 97,357 $ 34,103 $ 13,826 $ 20,277
(1) The compensated absences liability attributable to the governmental activities will be liquidated by several of the governmental and internal service funds.The arbitrage rebate tax payable will be liquidated by debt service funds. The Employee Group Benefits and Administration Insurance internal service fundswill liquidate the estimated insurance claims liability.
(2) Deferred outflows, including those related to bonds payable, are reported separately on the Statement of Net Position based on GASB Statement No. 65.(3) The total net pension liability beginning balances were restated due to a prior period adjustment.
A-145

F. Refunded and Early Retired Debt
RefundedOn July 24, 2018, the Facility Finance Authority (FFA) issued revenue refunding bonds in the amount of $4.6 millionto make a current refunding of $6.8 million Series 1997 Montana State Hospital Revenue Bonds. The refunding resultedin an economic gain of $174.9 thousand and a difference in cash flow requirements of $2.6 million.
PrepaymentsThe Department of Natural Resources and Conservation (DNRC) used current available resources to make a prepaymentof $180.0 thousand on Series 2010H general obligation bond, resulting in a payoff.
G. No-Commitment Debt
Information is presented below for financing authorities participating in debt issues. The related debt issued does notconstitute a debt, liability, obligation, or pledge of faith and credit of the State. Accordingly, these bonds and notes arenot reflected on the accompanying financial statements.
Montana Board of Investments (BOI)BOI is authorized to issue Qualified Zone Academy Bonds (QZAB) under the Municipal Finance Consolidation Act,as conduit (no commitment) debt. The revenues, and in some cases, the taxing power of the borrower are pledged torepay the bonds. At June 30, 2019, QZAB debt outstanding aggregated $5.0 million.
BOI is also authorized to issue Qualified School Construction Bonds (QSCB) under the Municipal FinanceConsolidation Act, as conduit (no commitment) debt. The revenues of the borrower are pledged to repay the bonds. AtJune 30, 2019, QSCB debt outstanding aggregated $4.5 million.
Beginning Farm Loan ProgramThe Department of Agriculture is authorized to request issuance of bonds by BOI to finance projects for beginningfarmers within the state, if it appears, after a properly noticed public hearing, that the project is in the public interestof the state. These non-recourse, industrial development revenue bonds do not constitute a debt, liability, or obligationof the State. The remaining balance of this bond was paid in full during 2019.
H. Estimated Pollution Remediation Obligation
Estimated pollution remediation obligations are obligations to address the current or potential detrimental effects ofexisting pollution by participating in pollution remediation activities such as site assessments and cleanups. Theestimates are derived using the expected cash flows method as well as technical estimates from record of decisions,consent decrees and/or settlement agreements. There may be factors influencing the estimates that are not known atthis time. Prospective recoveries from other responsible parties may reduce the State’s obligation.
The State’s estimated pollution remediation liability as of June 30, 2019, was $177.8 million. Of this liability, $6.2million resulted in settlement agreements to provide restoration of natural resources, water supplies and natural resource-based recreational opportunities up to the settlement amount; $165.4 million is based on decrees or settlements forremediation activities. Other estimated liabilities have been recorded for soil and PCB contamination, as well as removalof asbestos contamination. The estimated pollution remediation liability was recorded in compliance with accountingand reporting standards and does not constitute the State’s total acceptance of the liability or responsibility on thesematters.
A-146

I. Non-Exchange Financial Guarantee
BOI provides loan guarantees from the Coal Severance Tax Fund to the Facility Finance Authority (FFA). BOI exposureto bond issues, surety bonds, and designated loans of the FFA totaled $88.9 million as of June 30, 2019. FFA is adiscretely presented component unit of the State of Montana. FFA guarantee requests are submitted to BOI for reviewand approval. BOI’s participation, either duration or any other consideration, to either purchase bonds or loans or tolend money for deposit into FFA’s statutorily allowed capital reserve account is explicitly limited by statute whichrequires BOI to act prudently. The guarantee requests from FFA pertain to bonds issued by FFA with a term of up to40 years. BOI receives a credit enhancement fee at FFA bond closing based on the term of the financing, the type ofbond, the rating of the borrower, and the type of reserve fund. BOI and FFA have entered into an agreement detailingrepayment to BOI. The credit enhancement fee received during the fiscal year was $133.5 thousand. BOI has not hadto perform on any loan guarantee in the past.
The following schedule summarizes the activity related to the non-exchange financial guarantee during the year endedJune 30, 2019 (in thousands):
BeginningBalance Additions Reductions
EndingBalance
$ 81,451 $ 11,000 $ 3,510 $ 88,941
A-147

NOTE 12. INTERFUND BALANCES AND TRANSFERS
A. Balances Due From/To Other Funds
Balances due from/to other funds arise when there is a time lag between the dates that reimbursable expenditures andinterfund services provided/used are recorded in the accounting system, and the dates on which payments are made.Balances also arise when there is a time lag between the dates that transfers between funds are recorded, and the dateson which payments are made. Balances due from/to other funds also include the current portion of balances related toamounts loaned by the Municipal Finance Programs to other funds, under the Board of Investments' INTERCAP loanprogram. Balances due from/to other funds are expected to be repaid within one year from origination.
Balances due from/to other funds at June 30, 2019, consisted of the following (in thousands):
Due to Other FundsCoal
SeveranceTax
FederalSpecial
RevenueGeneral
Fund
InternalServiceFunds
NonmajorEnterpriseFunds (3)
NonmajorGovernmental
Funds
StateSpecial
Revenue TotalDue from Other FundsCoal Severance Tax $ — $ — $ — $ — $ — $ 5 $ — $ 5Municipal Finance Programs — — — 1,842 — 4 — 1,846Federal Special Revenue — — 2,418 — — — 468 2,886General Fund — 863 — — 17,422 — 12,728 31,013Internal Service Funds 33 — — — — — 7 40Nonmajor Enterprise Funds — 2 — — — — — 2Nonmajor GovernmentalFunds (1) — 71 331 — — — 288 690State Special Revenue (2) — — 121 — — 694 — 815
Total $ 33 $ 936 $ 2,870 $ 1,842 $ 17,422 $ 703 $ 13,491 $ 37,297
(1) Total due from other funds to the non-major governmental funds on the financial statements is reported as $1.6 million. The difference of $929.0 thousandbetween the amount reported above of $690.0 thousand and the amount reported in the fund financial statements relates to long-term receivables. Thereceivables are reported on the fund financial statement and the long-term liabilities are reported on the government-wide statement.
(2) Total due from other funds to the state special revenue fund on the fund financial statement is reported as $10.2 million. The difference of $9.4 millionbetween the amount reported above of $815.0 thousand and the amount reported in the fund financial statement relates to long-term receivables. Thereceivables are reported on the fund financial statement and the long-term liabilities are reported on the government-wide statement.
(3) Total due to other funds from the non-major enterprise funds on the fund financial statement is reported as $17.7 million. The difference of $268.5 thousandbetween the amount reported above of $17.4 million and the amount reported on the fund financial statement relates to loans payable. The receivablesare reported on the government-wide statement and the liabilities are reported on the fund financial statement.
B. Interfund Loans Receivable/Payable
Montana statutes include a provision for interfund loans when the expenditure of an appropriation is necessary and thecash balance in the account from which the appropriation was made is insufficient to pay the expenditure. Interfundloans receivable/payable are expected to be repaid within one year from the date of origination.
A-148

Interfund loans receivable/payable at June 30, 2019, consisted of the following (in thousands):
Interfund Loans PayableCoal
SeveranceTax
FederalSpecial
Revenue
InternalServiceFunds
NonmajorGovernmental
Funds
StateSpecial
Revenue TotalInterfund Loans ReceivableGeneral Fund $ 1,678 $ 68,792 $ — $ 357 $ 3,143 $ 73,970 Internal Service Funds — 44 — — — 44Nonmajor Enterprise Funds — 13 — — 9 22State Special Revenue — 83,762 15 — — 83,777
Total $ 1,678 $ 152,611 $ 15 $ 357 $ 3,152 $157,813
C. Advances To/From Other Funds
Advances to/from other funds represent the portion of interfund loans that are not expected to be repaid within oneyear from the date of origination. Advances to/from other funds also include the noncurrent portion of balances relatedto amounts loaned by the Municipal Finance Programs to other funds, under the Board of Investments' INTERCAPloan program. For more information on the INTERCAP loan program, refer to Note 11.
Advances to/from other funds at June 30, 2019, consisted of the following (in thousands):
Advances from Other FundsFederalSpecial
Revenue
InternalServiceFunds
NonmajorGovernmental
Funds
StateSpecial
Revenue TotalAdvances to Other FundsCoal Severance Tax $ — $ — $ 1,725 $ — $ 1,725General Fund 300 — — 63 363Municipal Finance Programs — 3,371 2,590 — 5,961Nonmajor Governmental Funds — — — 6,773 6,773State Special Revenue 35,909 — 3,108 — 39,017
Total $ 36,209 $ 3,371 $ 7,423 $ 6,836 $ 53,839
Additional detail for certain advance balances at June 30, 2019, follows (in thousands):
Advances from the Municipal Finance Programs under the INTERCAP Loan Program
Departmental Function BalanceNatural Resources and Conservation $ 2,590Transportation 3,371
Total $ 5,961
D. Interfund Transfers
Routine transfers between funds are recorded to (1) transfer revenues from the fund legally required to receive therevenue to the fund authorized to expend the revenue, (2) transfer resources from the General Fund and special revenuefunds to debt service funds to support principal and interest payments, (3) transfer resources from enterprise funds tothe General Fund to finance general government expenditures, and (4) provide operating subsidies.
A-149

Interfund transfers for the year ended June 30, 2019, consisted of the following (in thousands):
Transfers OutCoal
SeveranceTax
FederalSpecial
RevenueGeneralFund (1)
InternalServiceFunds (2)
LandGrant
NonmajorEnterpriseFunds (3)
NonmajorGovernmental
Funds
StateSpecial
Revenue TotalTransfers InCoal Severance Tax $ — $ — $ — $ — $ — $ — $ 275 $ — $ 275Federal Special Revenue — — — — — — — 2,368 2,368General Fund (1) 18,172 135 — 638 6 48,212 — 55,416 122,579Internal Service Funds — — 1,241 — — — — 13,130 14,371Land Grant — — 5 — — — — — 5Nonmajor Enterprise Funds — — — 69 — — — 25 94Nonmajor Governmental Funds 635 17,814 9,664 160 1,601 — 508 9,602 39,984State Special Revenue 21,182 14,137 48,066 20 64,752 7,789 19,667 — 175,613
Total $ 39,989 $ 32,086 $ 58,976 $ 887 $ 66,359 $ 56,001 $ 20,450 $ 80,541 $355,289
(1) $60.7 million was transferred from the General Fund to the Budget Stabilization Reserve Fund, however, those funds are combined for reporting purposes.Therefore the transfer is not accounted for in the above table as both the transfer-in and the respective transfer-out have been eliminated as requiredfor proper financial reporting.
(2) Total transfers-out for internal service funds on the fund financial statements is reported as $1.6 million. The difference of $663.2 thousand between theamount reported above of $887.0 thousand and the amount reported on the fund financial statements relates to the transfer of capital assets betweena governmental fund type and the internal service fund type. When capital assets are transferred between these fund types, the transferring fund reportsthe net book value of the capital asset as a transfer-out, and the receiving fund reports the net book value of the capital asset as a capital contribution.
(3) Total transfers-out for nonmajor enterprise funds on the fund financial statements is reported as $56.0 million. The difference of $10.7 thousand betweenthe amount reported above of $56.0 million and the amount reported on the fund financial statements relates to the transfer of capital assets betweena governmental fund type and the nonmajor enterprise fund type. When capital assets are transferred between these fund types, the transferring fundreports the net book value of the capital asset as a transfer-out, and the receiving fund reports the net book value of the capital asset as a capitalcontribution.
A-150

Interfund transfers for the year ended June 30, 2019, consisted of the following (in thousands):
Transfers OutCoal
SeveranceTax
FederalSpecial
RevenueGeneralFund (1)
InternalServiceFunds (2)
LandGrant
NonmajorEnterpriseFunds (3)
NonmajorGovernmental
Funds
StateSpecial
Revenue TotalTransfers InCoal Severance Tax $ — $ — $ — $ — $ — $ — $ 275 $ — $ 275Federal Special Revenue — — — — — — — 2,368 2,368General Fund (1) 18,172 135 — 638 6 48,212 — 55,416 122,579Internal Service Funds — — 1,241 — — — — 13,130 14,371Land Grant — — 5 — — — — — 5Nonmajor Enterprise Funds — — — 69 — — — 25 94Nonmajor Governmental Funds 635 17,814 9,664 160 1,601 — 508 9,602 39,984State Special Revenue 21,182 14,137 48,066 20 64,752 7,789 19,667 — 175,613
Total $ 39,989 $ 32,086 $ 58,976 $ 887 $ 66,359 $ 56,001 $ 20,450 $ 80,541 $355,289
(1) $60.7 million was transferred from the General Fund to the Budget Stabilization Reserve Fund, however, those funds are combined for reporting purposes.Therefore the transfer is not accounted for in the above table as both the transfer-in and the respective transfer-out have been eliminated as requiredfor proper financial reporting.
(2) Total transfers-out for internal service funds on the fund financial statements is reported as $1.6 million. The difference of $663.2 thousand between theamount reported above of $887.0 thousand and the amount reported on the fund financial statements relates to the transfer of capital assets betweena governmental fund type and the internal service fund type. When capital assets are transferred between these fund types, the transferring fund reportsthe net book value of the capital asset as a transfer-out, and the receiving fund reports the net book value of the capital asset as a capital contribution.
(3) Total transfers-out for nonmajor enterprise funds on the fund financial statements is reported as $56.0 million. The difference of $10.7 thousand betweenthe amount reported above of $56.0 million and the amount reported on the fund financial statements relates to the transfer of capital assets betweena governmental fund type and the nonmajor enterprise fund type. When capital assets are transferred between these fund types, the transferring fundreports the net book value of the capital asset as a transfer-out, and the receiving fund reports the net book value of the capital asset as a capitalcontribution.
NOTE 13. FUND EQUITY DEFICITS
The following funds have a deficit net position remaining at June 30, 2019, as follows (in thousands):
Fund Type/Fund Deficit (1)
Governmental FundsFederal Special Revenue (2) $ (12,614)Federal/Private Construction Grants (28)
Internal Service FundsInformation Tech Services $ (15,163)Building and Grounds (1,111)Admin Central Services (1,594)Labor Central Services (5,433)Commerce Central Services (1,256)OPI Central Services (1,948)DEQ Indirect Cost Pool (3,460)Payroll Processing (1,626)Investment Division (2,941)Aircraft Operation (617)Justice Legal Services (491)Personnel Training (170)Other Internal Services (444)SABHRS Finance & Budget Bureau (404)
Enterprise FundState Lottery $ (1,855)Subsequent Injury (811)
(1) The allocation of net pension liability and total OPEB liability isa significant factor in creating these deficits. For more detailrelated to these liabilities, see Notes 6 and 7 respectively.
(2) The primary reason causing fund deficit in Federal SpecialRevenue Fund is due to CY2017 and CY2018 fire seasonfederally reimbursable costs. The federal fund reimbursementwas unavailable to receive within 60 days of 6/30/2019, creatinga deferred inflow and a fund deficit in the same amount.
A-151

NOTE 14. MAJOR PURPOSE PRESENTATION
Special Revenue and Fund Balances Classifications by Purpose – In the governmental fund financial statements,classifications of special revenue fund revenues and fund balances are presented in the aggregate. The tables presentedbelow further display the special revenue fund revenues and fund balances by major purpose for the year ending June30, 2019.
State Special Revenue By Source (in thousands)
GeneralGovernment
PublicSafety Transportation
Health andHuman
Services EducationNatural
Resources TotalLicenses/permits $ 77,119 $ 44,902 $ 23,331 $ 3,498 $ 160 $ 85,400 $ 234,410Taxes 221,994 4,238 261,298 — 1 15,544 503,075Charges for services 40,467 21,023 6,638 33,845 1,935 16,625 120,533Investment earnings 833 13,158 442 455 1,529 24,189 40,606Securities lending income — 44 — 1 5 60 110Sale of documents/
merchandise/property 1,512 3,050 115 98 2 5,597 10,374Rentals/leases/royalties 263 11 416 56 5 339 1,090Contributions/premiums 28,440 — — — — 305 28,745Grants/contracts/donations 2,164 15,779 630 9,083 1,794 20,708 50,158Federal 7,051 19 1 335 5 78 7,489Federal indirect costrecoveries — — 49,891 43 — 4,477 54,411Other revenues 2,150 558 335 209 170 66 3,488Transfers in 45,259 7,962 1,491 8,158 886 111,857 175,613
Total State SpecialRevenue $ 427,252 $ 110,744 $ 344,588 $ 55,781 $ 6,492 $ 285,245 $ 1,230,102
Federal Special Revenue By Source (in thousands)
GeneralGovernment
PublicSafety Transportation
Health andHuman
Services EducationNatural
Resources TotalTaxes $ — $ — $ — $ — $ — $ 1 $ 1Charges for services 822 29 — 5,929 1 5 6,786Investment earnings 282 16 — — 100 201 599Sale of documents/
merchandise/property 15 — — — — — 15Grants/contracts/donations — — — 17 — — 17Federal 93,337 17,802 517,211 1,919,819 196,211 103,669 2,848,049Federal indirect cost
recoveries 1 — — 80,701 46 1,303 82,051Other revenues 7 8 — 1,229 2 60 1,306Transfers in — 1,359 — 1,009 — — 2,368
Total Federal SpecialRevenue $ 94,464 $ 19,214 $ 517,211 $ 2,008,704 $ 196,360 $ 105,239 $ 2,941,192
A-152

Governmental Fund Balance By Function, June 30, 2019(in thousands)
Special Revenue Permanent
General State Federal
CoalSeverance
TaxLand
Grant Nonmajor TotalFund balances:
NonspendableInventory $ 3,501 $ 19,910 $ — $ — $ — $ — $ 23,411Permanent fund principal — 500 — 622,645 774,193 362,256 1,759,594Long-term notes/receivables 363 — — — — — 363Prepaid expense 333 396 119 — — — 848
Total nonspendable 4,197 20,806 119 622,645 774,193 362,256 1,784,216Restricted
General government — 320 — — — 18,495 18,815Public safety — 204,134 — — — 1 204,135Transportation — 111,164 — — — — 111,164Health and human services — 5,470 — — — 680 6,150Education — 14,438 — — — 20 14,458Natural resources — 741,624 — — — 11,696 753,320
Total restricted — 1,077,150 — — — 30,892 1,108,042Committed
General government 60,721 154,593 — 533,092 — 30,488 778,894Public safety — 73,059 — — — — 73,059Transportation — 16,781 — — — — 16,781Health and human services — 44,461 — — — — 44,461Education — 17,413 — — — — 17,413Natural resources — 309,571 — — — 31,641 341,212
Total committed 60,721 615,878 — 533,092 — 62,129 1,271,820Assigned
General government — — — — — 467 467Public safety — — — — — 338 338Encumbrance 17,178 — — — — — 17,178
Total assigned 17,178 — — — — 805 17,983Unassigned 361,313 — (12,733) — — (28) 348,552
Total fund balance $ 443,409 $ 1,713,834 $ (12,614) $ 1,155,737 $ 774,193 $ 456,054 $ 4,530,613
A-153

NOTE 15. RELATED PARTY TRANSACTIONS
The Montana School for the Deaf and Blind is associated with a foundation, which is a nonprofit organization outsideof state government. The school’s foundation is governed by a board of directors that annually approves a budget forthe financial support to be provided to the school. This budget defines the allowable expense categories for the year.A school employee is the person approving the expenses to be paid by the foundation based on its budget. The employeesubmits the approved invoices to the foundation’s bookkeeper, who then prepares the checks and submits them to aboard member who reviews backup documentation and signs the checks.
The Department of Labor and Industry's Workforce Services Division rents space in Libby, MT, from Mineral Plaza,LLC, in which one of the owners is a local job service manager. The term of the lease is July 1, 2013 and ending June30, 2021. The annual lease amount is currently set at $21.3 thousand.
The relative of a member of Montana Department of Transportation’s (MDT) management team is part owner of abusiness that holds a State term contract for supplies. A term contract is a contract in which a source for supplies isestablished for a specific period of time at a predetermined unit price. The term contracts are issued by the StateProcurement Bureau of the Department of Administration (DOA) and state agencies are required to use the DOA issuedterm contracts for such supplies. MDT purchased supplies from this business in the amount of $100.0 thousand for thefiscal year ended June 30, 2019.
A relative of a member of MDT's Management Team is part owner of a business which has been granted the right bythe local airport to operate and provide related services. There is only one such operator at this airport. Given thisexclusivity, MDT had transactions with this business. MDT purchased services in the amount of $19.7 thousand forthe fiscal year ended June 30, 2019.
Per Section 85-1-617 and 85-1-624, MCA, Renewable Resource Grant and Loan Program, the Department of NaturalResources and Conservation (DNRC) is eligible to issue General Obligation (GO) bonds for the purpose of makingprivate sale loans. DNRC has applied and received “recycled loan funds” from the SRF program for the non-pointsource private loan program. The loans are GO private sale bonds. The balances for loans in repayment for fiscal year2019 was $3.1 million. The loans have interest rates ranging from 3.0% to 4.3% and are repaid over 15 years. Theseloans are presented as Advances to Other Funds on the balance sheets.
Per Administrative Rules of Montana 17.58.101, the Montana Petroleum Tank Release Compensation Board (Board)is an independent board that is attached to Department of Environmental Quality (DEQ) for administrative purposesonly. Board members are required to follow Montana's code of ethics, that includes recusing oneself in matters relatedto a conflict of interest. To ensure DEQ are following state law, all contracts are required to go through a competitivebidding process. Four Board members were identified as having related party transactions with DEQ. These relationshipsinclude members who are: 1) an employee of a company that had a release and is receiving funds; 2) an agent for aninsurer that covered a station tank release and is receiving funds; 3) an officer in a bank that receives funds; and 4) acontractor for DEQ, that is responsible for clean-up oversite, and is also a shareholder of a separate company thatreceives funds. Total payments to all related parties were direct payments to the contractors in the amount of $146.4thousand and $15.2 thousand, and indirect payments to the bank and the insurance company in the amount of $7.9thousand and $11.9 thousand, respectively, for the fiscal year ended June 30, 2019.
All lotteries that offer multi-state games transact with the Multi-State Lottery Association (MUSL), which requires thedirectors from each of the states to be on the MUSL board of directors. The Director of the Montana Lottery is on theMUSL board, along with being the Secretary of the MUSL board of directors. The Director of the Montana Lottery isin a management position for both MUSL and the Montana Lottery, who have significant transactions between eachother. The Montana Lottery has prize reserves with MUSL in the amounts of $1.1 million for the fiscal year ended June30, 2019. The prize reserve monies are assets to the Montana Lottery and would be transferred over if the lottery wereto quit any of the multi-state games. Weekly, MUSL collects each state’s share of prize expenses to go towards respectivejackpots. If a state has a large enough amount/number of winners for any particular draw, MUSL would then reimburseany state for the excess amount of prizes paid out. The Montana Lottery paid MUSL $8.9 million for its share of prizesand received reimbursements for prizes in the amount of $661.2 thousand for the fiscal year ended June 30, 2019.
A-154

NOTE 16. CONTINGENCIES
Litigation
The State is party to legal proceedings, which normally occur in government operations. The legal proceedings are not,in the opinion of the State's legal counsel and the Department of Administration, likely to have a material adverseimpact on the State's financial position, except where listed below.
In State of Montana v. Philip Morris, Inc., No. CDV 97-306 (Mont. first Jud. Dist. Lewis & Clark County), the Stateof Montana filed various claims against six tobacco manufacturers seeking recovery of an unspecified amount ofdamages, penalties, and attorney’s fees. The lawsuit was resolved eventually through two settlements. The State firstsettled its claims against one of the manufacturers, Liggett & Meyers, Inc., for $1.0 million to be paid over a 20-yearperiod. Next, Montana was among the Settling States that signed onto the 1998 Master Settlement Agreement (MSA)and settled its claims against the remaining manufacturers for a settlement amount calculated annually on cigarettesales by Participating Manufacturers in perpetuity. The base amount was augmented by $90.0 million in 1999 for astrategic contribution portion for those states instrumental in obtaining the settlement, with the additional amount tobe paid in equal installments over a 10-year period beginning in 2007 and ending in 2017. Multiple other tobaccoproduct manufacturers joined the MSA after the initial signing period. Collectively, the signing manufacturers areknown as “Participating Manufacturers.”
The settlement provides that the tobacco product manufacturers may potentially offset, against their payment in anyyear, certain amounts of money if it is found that the Participating Manufacturers have lost more than 2% of theirnational market share (from 1997) to non-settling manufacturers (known as NPMs), and that the disadvantages imposedby the settlement were a “significant factor” in the market share loss. The settlement further provides that the offset,known as the “NPM adjustment,” may not be taken against the payments to any state that has enacted a “QualifyingStatute” and diligently enforced the statute during the year in question. Montana enacted such a Qualifying Statute in1999, Section 16-11-401 to 404, MCA, and complementary legislation in 2003, Section 16-11-501 to 512, MCA.
In March 2006, a determination was made (pursuant to the settlement) that the Participating Manufacturers had lostsufficient market share in 2003 to trigger an NPM adjustment analysis, and that disadvantages caused by the settlementwere a significant factor in the market share loss. Similar findings have been made or agreed to for years 2004 through2017. The State filed a motion in the Montana lawsuit seeking a declaration that it diligently enforced its QualifyingStatute during 2003. The Participating Manufacturers moved to compel arbitration of the question. The First JudicialDistrict Court ordered arbitration but was overruled on appeal to the Montana Supreme Court. Virtually all of the otherSettling States filed similar motions or new actions in their various court systems preferring to litigate their diligentenforcement disputes in court rather than in the tobacco companies proposed nationwide arbitration. Montana was theonly state to prevail on its argument against arbitration before its highest state court. Montana then successfully defendedthe favorable ruling from a petition for rehearing in Montana and ultimately a certiorari petition to the U.S. SupremeCourt filed by tobacco companies which the Court rejected.
Simultaneously, arbitration between the other Settling States and the tobacco companies commenced and proceededto discovery. After the U.S. Supreme Court denied cert regarding Montana’s participation in the arbitration, the tobaccocompanies sought and received a stay of Montana’s litigation pending completion of the nationwide arbitration,effectively shutting Montana out of any opportunity for input or influence over standards for determining what constitutes“diligent enforcement,” and potentially subjecting Montana to whatever standards may ultimately result from theongoing nationwide arbitration for lack of any alternative interpretative precedent. Thereafter, the Montana SupremeCourt granted Montana’s writ for supervisory control, overturned the stay, and allowed the State’s district court actionto proceed to discovery.
The Montana litigation ended with entry of a stipulated consent decree on June 25, 2012, reflecting the tobaccocompanies’ determination after initial discovery that they would not contest Montana’s diligent enforcement during2003. In the nationwide arbitration, and as applied to Montana’s consent decree, a “no contest” determination for anindividual state means that state would not participate in the NPM Adjustment for 2003, (i.e., as a “no contest” stateMontana had no reduction to its annual OPM settlement payments for 2003).
A-155

However, the “no contest” for 2003 has no precedential effect in any subsequent year for Montana or any other state’scase. Accordingly, Montana was not subject to the 2003 NPM Adjustment, but the consent decree specifically articulatedthat Defendants’ consent to its terms “is not a factual concession that Montana, in fact, did or did not diligently enforcethe Montana Qualifying Statute in 2003 or any other year.”
Despite Montana’s successful defense of its 2003 and 2004 enforcement actions, no precedential protections exist, andthe State remains vulnerable to further expected, litigation regarding its diligent enforcement in 2005-2017, for whichyears the Participating Manufacturers have already received a determination that MSA terms were a “substantial factor”reducing their market share and triggering an NPM Adjustment analysis with the potential to reduce annual paymentsfor those Settling States which failed to diligently enforce their statutes.
The Participating Manufacturers conceded that Montana enacted a qualifying statute within the meaning of the MSA,which was in full force and effect during 2005-2016 and thereafter to date. Factual arguments exist to show that Montanadiligently enforced its Qualifying Statute during 2005-2017. However, legal and procedural uncertainties exist thatmake an adverse determination possible. An adverse determination on the diligent enforcement issue could result inthe loss of some or all of the MSA annual payments to the State for years 2005-2017, which would be recouped throughan offset of payments due to Montana in future years. The Participating Manufacturers will assert claims for NPMadjustments for future years as well. The outcome of these claims is also uncertain.
In 2015, certain Settling States and Participating Manufacturers commenced multi-state arbitration of the issue ofdiligent enforcement for calendar year 2004. Montana is not a party to this arbitration; this arbitration continues.
Montana filed a Declaratory Judgment Motion in 2017 for the 2004 NPM Adjustment to have its MSA Court (FirstJudicial District) declare that Montana had a qualifying statute in place and diligently enforced its Qualifying Statutefor the 2004 calendar year. The Participating Manufacturers conceded that Montana has a Qualifying Statute. As partof this action, Montana successfully obtained a ruling from its MSA Court on the burden of proof whereby theParticipating Manufacturers must prove that Montana did not diligently enforce its Qualifying Statute to succeed underthe NPM Adjustment. Montana is the only state party to the MSA with this ruling on the burden of proof. On the eveof trial, the Participating Manufacturers settled with Montana for all of the 2004 NPM Adjustment funds previouslywithheld plus interest and earnings. The settlement does not provide precedent for future NPM Adjustment proceedingswith the exception of the ruling on the burden of proof.
PPL v. Montana involves ownership of sections of riverbed on the Missouri, Clark Fork, and Madison rivers. The caseoriginated in 2003, when a group of parents of school age children sued Petitioner PPL Montana, LLC (PPL), in FederalCourt alleging that the company must pay rent for the use of state-owned riverbeds to generate hydroelectric power.After the Federal Court dismissed the case for lack of jurisdiction, PPL filed an action in state district court seeking adeclaration that the state could not charge them rent for use of the riverbeds at issue. The State intervened in the caseand counterclaimed for a declaration that PPL and its co-plaintiffs unlawfully occupied state lands and must compensatethe State land trust on behalf of its public beneficiaries for the use of those lands. The legal test for ownership of theriverbeds is whether the rivers at issue were navigable at the time of statehood. Based upon the historical record, theDistrict Court granted the State summary judgment on the question of navigability and the case proceeded to trial onthe issue of compensation for use of trust lands. In June of 2008, the Court issued its ruling and ordered that PPL owedthe State almost $41.0 million for past use of the riverbeds.
PPL appealed the decision to the Montana Supreme Court. The case was briefed and argued before the Court, and inMarch of 2010, the Montana Supreme Court issued a decision upholding the district court’s finding of navigability anddetermination of compensation.
PPL appealed the case to the United States Supreme Court. The case was briefed and argued, and in February of 2012,the Court reversed the Montana Supreme Court’s decision. The United States Supreme Court concluded that theMontana courts had applied an incorrect legal standard for determining a river’s navigability. The Court clarified thatnavigability had to be determined on a segment-by-segment basis. The Court remanded the case for further proceedings,and the case currently is pending in the Montana First Judicial District, Lewis and Clark County, Judge MichaelMcMahon presiding. The cause number is CDV 2004-846. Additional detail is provided below as the case has beenremanded to the United States District Court, District of Montana, Helena Division.
A-156

The most obvious impact of the Supreme Court’s decision is that the State is no longer entitled to the $41.0 millionjudgment. The monetary amount that the State may be entitled to depends on the navigability of the rivers, which willhave to be determined under the Supreme Court’s segment-by-segment approach. Going forward, the litigation willfocus on applying the Supreme Court’s segmentation approach to determine the navigable reaches of the Madison,Clark Fork, and Missouri Rivers. At this stage, it is difficult to predict an outcome on this litigation.
A less obvious financial impact is the bill of costs that PPL submitted to the district court following the remand. PPLrequested that the district court tax the State of Montana with $1.2 million for PPL’s costs relating to the appellateproceedings. All, but approximately $31.0 thousand, relate to premiums that PPL paid for a supersedeas bond in supportof staying the $41.0 million judgment. In May 2012, the State filed its response to PPL’s bill of costs and agreed tocosts for $31.3 thousand. However, the State moved the court to deny PPL’s request for costs related to the supersedeasbond. The parties stipulated to hold this issue in abeyance until the court is able to rule on all remaining matters in thecase. Counsel for the State has agreed to release the supersedeas bond. In the opinion of counsel, there are good legalarguments that support the State’s position that it should not be required to pay the supersedeas bond premiums; however,legal and procedural uncertainties exist that make an adverse determination reasonably possible.
This case, also known as State of Montana v. Talen Montana, LLC et al. (Cause No. CV 16-35-H-DLC-JCL), wasremanded to the United States District Court, District of Montana, Helena Division, and carries on with the HonorableDana L. Christensen, United State Judge, assigned to further proceedings and entry of judgment. The District Courtentered an order on February 12, 2019, joining the United States (U.S.) as a defendant, due to the potential of overlappingclaims between the State and the U.S. After expiration of the statutory notice period required for claims against theU.S., the State’s Complaint was amended to add the U.S. The U.S., Talen, and NW Energy have not yet filed answersto the Amended Complaint but will do so before year end 2019. The State’s claims against the utilities remain unchangedand the State still holds the opinion that no further potential liability to the State is expected relative to this action andno additional updates are necessary in regard to the outstanding litigation.
Diaz et al. v. Blue Cross and Blue Shield of Montana et al. (Diaz), was a lawsuit filed in the Montana First JudicialDistrict Court, Lewis and Clark County, Cause No. BVD-2008-956, in October 2008, by plaintiffs Jeanette Diaz, LeahHoffman-Bernhardt, and Rachel Laudon, individually, and on behalf of others similarly situated, naming Blue Crossand Blue Shield of Montana (BCBS), New West Health Services (New West), Montana Comprehensive HealthAssociation, and the State of Montana (State) as defendants. The complaint alleges that the defendants have violatedthe made-whole laws of Montana and illegally given themselves subrogation rights.
On June 12, 2009, Plaintiffs filed with the District court a motion for class certification. The District Court Judgedenied Plaintiffs’ motion for class certification on December 16, 2009. Plaintiffs appealed this decision to the MontanaSupreme Court. As part of the review of the underlying decision denying class certification, the Montana SupremeCourt remanded the case to the District Court to determine the question of whether the made-whole laws, codified inSection 2-18-902 and 33-30-1102, MCA, apply to the various types of third-party administrators (TPAs) at issue inDiaz. The District Court held that these laws do not apply to TPAs. Plaintiffs appealed this decision.
On December 21, 2011 the Supreme Court issued its decision, holding that the District Court abused its discretion indenying a class action and that BCBS and New West, as TPAs of the State’s health plan, are not subject to the made-whole laws as “insurers” under Section 2-18-901 to 902, MCA, or under a third party beneficiary theory.
On June 20, 2012, the District Court ruled on the State’s summary judgment motion seeking an order from the courtthat the State has not violated the made-whole laws in the administration of its health plan. The court denied the State’smotion, ruling that the State is an insurer for the purposes of the made-whole laws and that it must conduct a made-whole analysis before exercising and subrogation/coordination of benefits rights. The State filed with the District Courta motion requesting that the court certify its decision to the Montana Supreme Court. The District Court granted themotion, and the Montana Supreme Court, over Plaintiffs’ objection, ultimately agreed in a November 27, 2012, Orderto hear this issue. The Plaintiffs also appealed to the Montana Supreme Court the District Court’s definition of the classaction.
On August 6, 2013, the Montana Supreme Court issued its opinion, affirming the Montana First Judicial District Court’sdecision defining the class action to include only those State benefit plan members who had timely filed claims forcovered benefits within eight years before the filing of the Plaintiffs’ complaint.
A-157
On November 6, 2013, the Montana Supreme Court issued its opinion, affirming the District Court’s June 20, 2012,decision that the applicable made-whole laws apply to the State benefit plan.
On September 8, 2014, the District Court issued an order ruling on several motions that the parties had filed. Theprincipal rulings were: (i) the Court authorized Plaintiffs to proceed with additional discovery to determine if the classdefinition should be altered or amended; (ii) given its order to allow additional discovery, the Court held in abeyanceits decision on the State’s Motion for Summary Judgment requesting that the class be limited to those who timely filedclaims within the one-year filing restriction contained in the State’s policy; (iii) the Court granted the Plaintiffs’ motionsasking the Court to require the State conform its health plans, procedures, notices and practices to comply with theMontana Supreme Court’s rulings in this case and to pay covered medical expenses, await the resolution of claimsagainst liability carriers, and then conduct a made-whole determination before it can exercise subrogation or acceptreimbursements from its members or providers; and (iv) the Court ordered the parties to develop a class notice to besent to past and current plan members dated back to eight years before this suit was filed. The State and Plaintiffs’counsel are currently working on the notice.
On April 13, 2015, the District Court issued an Order on Interest to Be Paid, requiring the State to include in thepayments ultimately made to class members' interest at the rate of 10.0% per annum. For claims arising before December24, 2009, interest will begin 30 days following the Montana Supreme Court’s decision in Blue Cross and Blue Shieldof Montana, Inc. v. Montana State Auditor. For any claims arising after December 24, 2009, interest will begin startingon the day the underlying medical expenses were incurred.
On October 5, 2015, the Plaintiffs filed with the District Court a motion directing the State to pay attorney fees arisingfrom the class action suit. On November 9, 2015, the District Court issued an order denying Plaintiffs’ motion forattorney fees.
On December 14, 2015, the District Court issued an order certifying that its orders concerning interest and attorneyfees were final for purposes of an appeal to the Montana Supreme Court. On January 12, 2016, the Plaintiffs filed aNotice of Appeal with the Montana Supreme Court, appealing the interest and attorney fee orders.
Pursuant to the Montana Supreme Court’s mandatory mediation process, the parties reached a settlement on attorneyfee payments; however, the parties did not reach agreement on the interest issue. On October 25, 2016, the MontanaSupreme Court issued its ruling on the interest issue, finding that November 14, 2009, is the date that interest commences;and, for claims arising after November 14, 2009, interest will begin starting on the day the underlying medical expenseswere incurred.
As of June 30, 2016, the State booked an accrual of approximately $1.5 million, which includes a base payment plusinterest consistent with the District Court’s April 13, 2015, order. Interest will be recalculated based on the SupremeCourt's October 25, 2016, decision.
On April 28, 2017, the District Court appointed a Special Master to consider and resolve issues regarding expandingthe class to persons with unsubmitted claims; whether to include claims after 2009; whether the State must identifymembers from third party administrators other than Blue Cross/Blue Shield; whether, if at all, the State must reformits systematic practices; supervising the payment and notice process; which party or parties should pay the SpecialMaster for her time and expenses; whether the District Court should approve a partial payment of attorney fees; settinga time frame for making claims; setting a time for ending the class action; determining payment of residual funds; andany other issues as necessary to facilitate the swift and equitable resolution of the case. The Special Master has heldseveral hearings regarding these issues and a recommended decision was expected to be issued in early 2018.
On June 21, 2017, the Special Master issued a report and recommended order regarding the partial payment of Plaintiffs’counsels’ attorney fees. This recommendation was based on a stipulation the State and the Plaintiffs’ counsel hadreached, agreeing that the State would pay counsel $400.8 thousand for claims made by individuals that could bedocumented. The State has paid this amount to class counsel.
The Special Master issued a second report and recommended order expanding the class on August 8, 2018. The principalfindings of this recommendation were to expand the class definition to include those individuals who did not submit
A-158

claims to the State for processing; to expand the class to end June 30, 2016; and to redefine the class as (a) employees,employee dependents, retirees and retiree dependents who participate or participated in the State of Montana’s healthbenefit plan(s), administered or operated by the State and/or the third party administrators whose claims for coveredbenefits took place no earlier than eight years prior to the filing of the complaint in this action, which was October 23,2008; (b) who were injured through the legal fault of persons who have legal obligations to compensate them for alldamages sustained; and (c) who have not been made whole for their damages (or for whom the State and TPAs conductedno made whole analysis) because the State and the third party administrators programmatically failed to pay benefitsfor their covered medical costs. The District Court Judge has yet to approve these recommendations.
On April 23, 2019, the District Court Judge approved the parties' motion for a process to identify and distribute residualfunds for known class members on the master list for Blue Cross Blue Shield of Montana claims. On May 2, 2019, theState issued payment of $122.0 thousand to the Hunt Law Firm for the residual funds and interest thereon.
On May 1, 2019, the parties filed the Notice to Special Master of Agreement on Notice Procedure. Pursuant to thatnotice, the State distributed notices to all former and current State employees enrolled in the State health plan betweenJanuary 1, 2010 through June 30, 2016. Notice was distributed through email and first-class mail. Initial distributionof notices was May 23, 2019. The deadline for a claimant to return a claim to the State is November 30, 2019.
As of June 30, 2019, the State paid Plaintiffs $2.0 million, including the payment for residual funds and interest. Sincethe case is ongoing, the State does not have sufficient information to determine the ultimate cost to the State.
Disability Rights Montana v. Batista (Cause # CV-15-22) is a civil rights case filed by the ACLU of Montana on behalfof Plaintiff, alleging deliberate indifference in the provision of mental health care to seriously mentally ill inmates atMontana State Prison. The District Court dismissed the case for failure to state a claim, which order was appealed byPlaintiffs to the Ninth Circuit Court of Appeals. Recently, the Ninth Circuit Court of Appeals overturned the districtcourt’s ruling and remanded the case back to the district court in front of a new judge. As a result, the Department ofCorrections (Department) is ramping up discovery and the defense of the case through outside legal counsel. Thedepartment had previously exchanged settlement proposals without success. Because of recently passed legislation,the department is required to implement significant changes in the use of restrictive housing, especially with seriouslymentally ill inmates. The Plaintiff has made a number of unreasonable demands that would cost the Department millionsof dollars and at least $800.0 thousand in attorney’s fees and undisclosed expert witness fees. At this time the Departmentcannot specify an anticipated amount of financial obligation.
Michael Jackson v. Montana Department of Corrections (Department), Montana State Prison (MSP) (Cause # DV-18-70)is a case pending in Powell County District Court. Mr. Jackson is a current employee, suing the Department for allowingrace discrimination at MSP and creating a hostile work environment. He is seeking lost wages, humiliation, andemotional distress damages as well as attorney’s fees and costs. The Human Rights Bureau found no reasonable causein his claims. The Department has hired outside legal counsel to represent it in this matter. At this time, the Departmentis discussing a possible settlement of the case for a minimal amount.
Kila Sheperd v. Montana Department of Corrections (Department) is a Step III Grievance proceeding, in accordancewith 2.21.8017, Administrative Rules of Montana (ARM), and the Department has hired outside counsel to representit regarding Ms. Sheperd's termination from her position at the Department. Ms. Sheperd seeks in excess of $1.0 millionfor punitive damages, lost wages, loss of benefits, emotional distress, and attorney's fees.
Smith, et al. v. State of Montana (Cause # BDV-2018-804) is a case filed by a group of Medicaid recipients as well asa group of Medicaid providers. The allegations include violations of the Montana Administrative Procedure Act andother related allegations. The complaint also includes an alleged violation of the Americans with Disabilities Act basedon a reduction in rates and resulting reductions in services. The rules in question set Medicaid reimbursement rates at2.99% less than the previously set rates, as well as a reduction in rates for targeted Case Management. The potentialliability in this case is estimated to be between $19.0 and $21.0 million.
Vincent, Benner, and Hoch v. DPHHS (CDV-19-0314, Eighth Judicial District Court, Cascade County) was filed May17, 2019, by Montana Optometric Association members seeking class certification of all licensed Montana optometristswho are participating providers in Montana Medicaid. The named plaintiffs claim the department’s Medicaid ratestructure discriminates against them because they are paid less than physicians (doctors of medicine or doctors
A-159

osteopathy) for performing the same services. They cite Section 37-10-104, MCA as the basis of the discriminationclaim. They seek declaratory relief and permanent injunctive relief in their claims of discrimination, violations ofMAPA, and breach of contract and implied covenant of good faith. They request damages, interests, costs and attorneyfees, which would amount to more than $1 million.
Moody's Market, Inc. et al. v. Montana State Fund, Montana Board of Investments, and State of Montana (Cause #DV-18-12) is a case filed by a group of Montana State Fund (MSF) policyholders, in Lake County District Court, inan effort to prevent the Board of Investments (BOI) from charging a 3.0% management fee on any single investorwhose average portfolio balance held by BOI is greater than $1.0 billion. This fee was implemented per Senate Bill 4,passed during the 2017 Legislative Special Session. The District Court issued a decision dismissing MSF as a partyand subsequently dismissed the case against the State of Montana and Board of investments. The plaintiffs appealedthe District Court Decision to the Montana Supreme Court.
The Public Employee Retirement Board (PERB) has two items of outstanding litigation in relation to the Sheriffs’Retirement System (SRS) and the Montana Public Employee's Retirement Administration (MPERA). Refer to Note 6,section I for additional disclosure in relation to this legal proceeding.
The Montana State Fund, a discretely presented component unit of the State, has three items of litigation, in additionto the case listed above, in relation to their operations and underlying statutory authority governing the program. Referto Note 18, section O for additional disclosure in relation to these legal proceedings.
Federal Contingencies
Food Distribution Program – The amount reported for Food Distribution programs (CFDA #10.555, #10.565, #10.567,#10.569, and #10.570) represents the dollar value of food commodities distributed to eligible recipients during the year.The U.S. Department of Agriculture provides the current value of the commodities used by the State to compute theamount reported. The amount of funds received to administer the program is also included in the reported amount.The State also distributes food commodities to other states in the western region of the United States, the value of whichis excluded from the reported amounts. During fiscal year 2019, the State distributed $1.6 million of food commoditiesunder CFDA #10.567 to other states.
The State of Montana distributed $13.8 million in commodities in fiscal year 2019. The value at June 30, 2019, ofcommodities stored at the State’s warehouse is $3.7 million, for which the State is liable in the event of loss. The Statehas insurance to cover this liability.
Miscellaneous Contingencies
Loan Enhancements – As of June 30, 2019, the Board of Investments (BOI) had provided loan guarantees from theCoal Severance Tax Permanent Fund to the Municipal Finance Programs and the Facility Finance Authority (acomponent unit of the State of Montana), totaling $186.6 million. The BOI’s exposure to bond issues of the MunicipalFinance Programs was $105.1 million, while exposure to bond issues, surety bonds, and designated loans of the FacilityFinance Authority was $88.9 million. The BOI has not been held responsible on any loan guarantee in the past.
Gain Contingencies – Certain natural resource and corporate tax assessments are not reported on the State's financialstatements because they are being protested administratively. As of June 30, 2019, the following assessments (by fundtype) were outstanding (in thousands):
Taxes General FundCorporate Tax $ 13,238
Collectability of these contingencies is dependent upon the decisions of the court, other authorities, or agreed uponsettlements. The corporate tax assessments include material estimates that could result in a significant reduction of the
A-160

tax assessed once actual numbers are provided. Interest related to corporate tax assessments is distributed to the GeneralFund and is included in the assessment total above.
Loss Contingencies – Certain corporations have requested refunds that are not reported on the State’s financial statementsas of June 30, 2019. The corporations have appealed the Department of Revenue's decision to deny or adjust the refund.As of June 30, 2019, these include $5.3 million of General Fund corporate tax refunds. It is estimated that the majorityof these corporations' tax refunds would consist primarily of tax and could be significantly reduced or eliminated dueto audits and appeals currently in process.
Certain companies have protested property taxes that have been included as revenue on the State’s financial statementsas of June 30, 2019. As of June 30, 2019, these include $405.6 thousand of protested property taxes recorded in theGeneral Fund and $459.2 thousand recorded in the State Special Revenue Fund.
Federal Grants - The State receives significant financial assistance from the Federal government in the form of grantsand entitlements, including several non-cash programs (which are not included in the basic financial statements). Receiptof grants is generally conditioned upon compliance with terms and conditions of the grant agreements and applicableFederal regulations, including the expenditure of resources for eligible purposes. Substantially all grants are subjectto either the Federal Single Audit Act or financial and compliance audits by the granter agencies of the Federalgovernment or their designees. Disallowances and sanctions as a result of these audits may become liabilities of theState. The State is currently involved in administrative and legal proceedings, with certain federal agencies, contestingvarious disallowances and sanctions related to federal assistance programs ranging from $1.2 million to $5.0 millionat June 30, 2019. The State's management believes ultimate disallowances and sanctions, if any, will not have a materialeffect on the basic financial statements.
A-161

NOTE 17. SUBSEQUENT EVENTS
Investment Related Issues
Since June 30, 2019, the Board of Investments (BOI) made additional commitments to fund loans from the INTERCAPloan program in the amount of $12.8 million.
In June 2019, BOI requested a 100.0% redemption in the amount of $101.0 million from one manager, pertaining toinvestments within the Trust Funds Investment Pool. Since the date of the request, the redemption has been received.
Since June 30, 2019, BOI has committed an additional $380.0 million to alternative equity partnerships withinConsolidated Asset Pension Pool, with allocations of $160.0 million within the Private Equity Pension Asset Class,$50.0 million within the Natural Resource Pension Asset Class, and $170.0 million within the Real Estate PensionAsset Class.
Since June 30, 2019, BOI has received an additional $5.5 million in loan reservations from Montana Lenders andcommitted $17.8 million in loans from the Coal Severance Tax Permanent Fund.
The BOI’s Chief Investment Officer (CIO) resigned July 19, 2019. Per the BOI's Governance Policy, the ExecutiveDirector will be the acting CIO until the BOI hires a replacement.
In August 2019, the plaintiffs, in relation to the case of the Moody's Market, Inc. et al. v. Montana State Fund, MontanaBoard of Investments, and State of Montana disclosed in Note 16 - Contingencies, appealed the District Court Decisionto the Montana Supreme Court.
In October 2019, a single state entity borrower pre-paid $11.5 million in principle on outstanding INTERCAP loansto BOI.
Other Subsequent Events
On May 21, 2018, the Board of Examiners authorized a $4.0 million General Obligation Bond Anticipation Note forthe Water Pollution Control State Revolving Fund Program, and a $3.4 million General Obligation Bond AnticipationNote for the Drinking Water State Revolving Fund Program. BOI has approved the loans. As of June 30, 2019, thebonds have not been issued.
On June 17, 2019, the Board of Examiners authorized a $6.5 million Coal Severance Tax bond for the RenewableResource Grant and Loan Program. As of June 30, 2019, the bond has not been issued.
Since June 30, 2019, the Risk Management and Tort Defense Division of the Department of Administration has received$12.4 million of commercial insurance proceeds related to a catastrophic property loss at Montana State University -Bozeman that occurred on March 7, 2019. The total cost of this claim is projected at $44.0 million, of which the divisionpaid a deductible of $1.5 million in fiscal year 2019. The remainder of the loss will be paid by the State's commercialexcess property insurance carriers and it is estimated that the claim will be closed by the end of fiscal year 2023.
On August 26, 2019, the State paid $74.6 thousand to a Missoula lawmaker to settle a request in legal fees filed in July.The legal fees were split in half between the Commissioner of Political Practice and the Department of Justice.
On October 8, 2019, the Board of Examiners authorized a resolution to issue an amount, not to exceed $33.0 million,of General Obligation Bonds Series 2019. The bonds were authorized in House Bill 652 during the 2019 LegislativeSession.
On October 21, 2019, the case of the Montana Health Care Association, et al, v. Department of Public Health andHuman Services was settled. On November 26, 2019, a final adoption notice for Montana Administrative Register(MAR) Notice No. 37-898 was filed for the rate increases made retroactive to November 1, 2019. As soon as the rulenotice is filed, the parties will jointly request the court stay the proceedings for so long as the Medicaid reimbursement
A-162
rates remain at or above the new rate. If the rates remain at or above such levels through June 30, 2021, the partiesagree to dismiss the matter with prejudice as fully settled on the merits.
During the 2019 Legislative Session, House Bill 725 passed and was later signed by the Governor. This bill allowedsports wagering in the state with the Montana Lottery facilitating this activity. Though it is difficult to quantify theresults of this new Lottery product, it may have a significant effect on the Montana Lottery and its financial statements.This new gaming will most likely be started in the fiscal year ended June 30, 2020.
A-163

NOTE 18. COMPONENT UNITS
A. Condensed Financial Statements
Below are the condensed financial statements of the component units for the State of Montana as of June 30, 2019 (inthousands):
Condensed Statement of Net PositionComponent Units
MontanaBoard ofHousing
FacilityFinance
Authority
MontanaState
Fund (1)
MontanaState
University
Universityof
Montana
TotalComponent
UnitsAssets:Cash, investments and other assets $ 664,517 $ 8,350 $ 1,560,689 $ 677,096 $ 534,479 $ 3,445,131Due from primary government — — — 390 949 1,339Due from component units — — — 5 199 204Capital assets (net) (Note 18C) 1 — 34,806 536,633 403,853 975,293
Total assets 664,518 8,350 1,595,495 1,214,124 939,480 4,421,967
Deferred Outflows of Resources 699 55 6,965 40,416 29,305 77,440
Liabilities:Accounts payable and other liabilities 10,771 21 93,269 78,449 63,482 245,992Due to primary government — 24 — 2,114 2,165 4,303Due to component units — — — 199 5 204Advances from primary government — — — 18,964 17,631 36,595Long-term liabilities (Note 18I) 496,541 239 1,025,191 362,294 221,482 2,105,747
Total liabilities 507,312 284 1,118,460 462,020 304,765 2,392,841
Deferred Inflows of Resources 429 78 814 13,498 20,885 35,704
Net Position:Net investment in capital assets 1 — 34,806 351,533 298,999 685,339Restricted 157,475 — — 335,500 335,595 828,570Unrestricted — 8,043 448,380 91,989 8,541 556,953
Total net position $ 157,476 $ 8,043 $ 483,186 $ 779,022 $ 643,135 $ 2,070,862
(1) Montana State Fund reports their financial statements on a calendar-year basis. The information provided is for the year ended December 31, 2018.
A-164

Condensed Statement of ActivitiesComponent Units
MontanaBoard ofHousing
FacilityFinance
Authority
MontanaState
Fund (1)
MontanaState
University
Universityof
Montana
TotalComponent
UnitsExpenses $ 22,715 $ 696 $ 228,399 $ 601,728 $ 455,815 $ 1,309,353
Program Revenues:Charges for services 1,802 831 161,259 288,465 180,684 633,041Operating grants and contributions 24,873 188 — 205,073 134,960 365,094Capital grants and contributions — — — 15,551 20,299 35,850
Total program revenues 26,675 1,019 161,259 509,089 335,943 1,033,985Net (expense) program revenues 3,960 323 (67,140) (92,639) (119,872) (275,368)
General Revenues:Unrestricted grants and contributions — — — 109 — 109Unrestricted investment earnings — — 4,555 8,445 6,520 19,520Transfer from primary government — — — 130,064 101,416 231,480Gain (loss) on sale of capital assets — — (30) (739) 1 (768)Miscellaneous — — 479 — — 479Contributions to term and permanent
endowments — — — 16 35,857 35,873Total general revenues and contributions — — 5,004 137,895 143,794 286,693
Change in net position 3,960 323 (62,136) 45,256 23,922 11,325
Total net position – July 1 – as previouslyreported 153,519 7,718 539,091 733,766 619,264 2,053,358
Adjustments to beginning net position (3) 2 6,231 — (51) 6,179Total net position – July 1 – as restated 153,516 7,720 545,322 733,766 619,213 2,059,537Total net position – June 30 $ 157,476 $ 8,043 $ 483,186 $ 779,022 $ 643,135 $ 2,070,862
(1) Montana State Fund reports their financial statements on a calendar-year basis. The information provided is for the year ended December 31, 2018.
B. Cash/Cash Equivalents and Investments
Due to the integration of funds and combined financial information, component unit cash and cash equivalents, equityin pooled investments and investments are included with the primary government in Note 3.
A-165
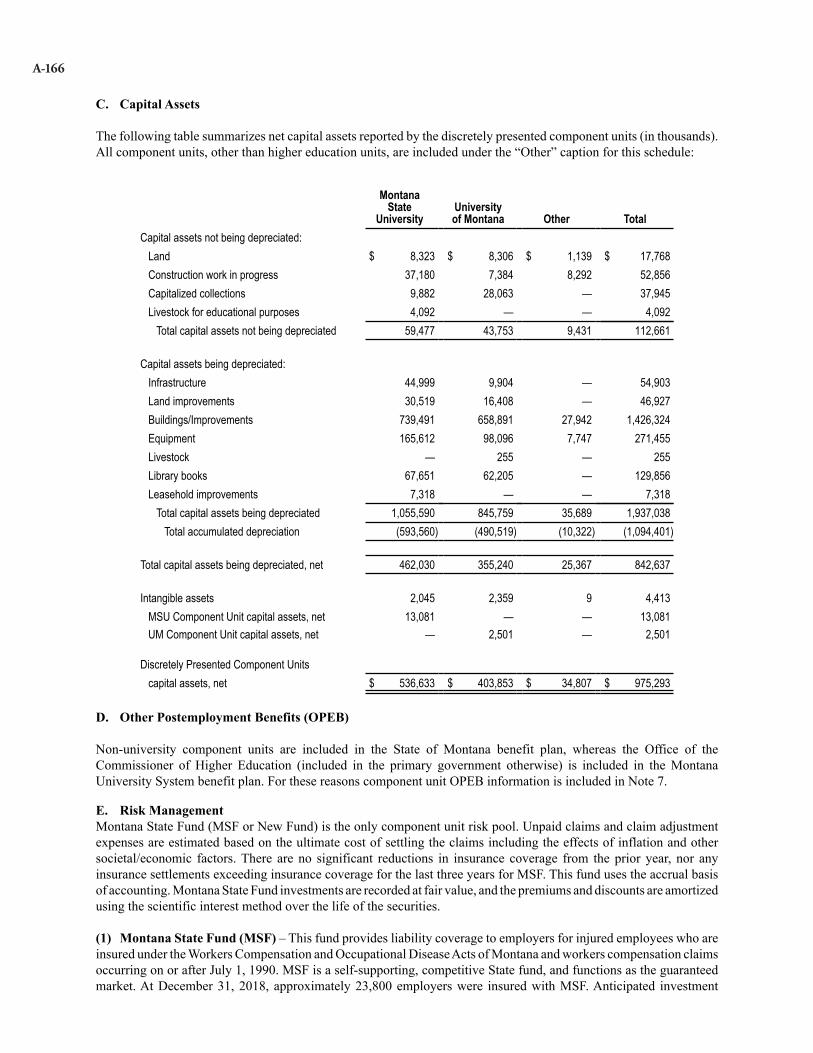
C. Capital Assets
The following table summarizes net capital assets reported by the discretely presented component units (in thousands).All component units, other than higher education units, are included under the “Other” caption for this schedule:
MontanaState
UniversityUniversityof Montana Other Total
Capital assets not being depreciated:Land $ 8,323 $ 8,306 $ 1,139 $ 17,768Construction work in progress 37,180 7,384 8,292 52,856Capitalized collections 9,882 28,063 — 37,945Livestock for educational purposes 4,092 — — 4,092
Total capital assets not being depreciated 59,477 43,753 9,431 112,661
Capital assets being depreciated:Infrastructure 44,999 9,904 — 54,903Land improvements 30,519 16,408 — 46,927Buildings/Improvements 739,491 658,891 27,942 1,426,324Equipment 165,612 98,096 7,747 271,455Livestock — 255 — 255Library books 67,651 62,205 — 129,856Leasehold improvements 7,318 — — 7,318
Total capital assets being depreciated 1,055,590 845,759 35,689 1,937,038Total accumulated depreciation (593,560) (490,519) (10,322) (1,094,401)
Total capital assets being depreciated, net 462,030 355,240 25,367 842,637
Intangible assets 2,045 2,359 9 4,413MSU Component Unit capital assets, net 13,081 — — 13,081UM Component Unit capital assets, net — 2,501 — 2,501
Discretely Presented Component Unitscapital assets, net $ 536,633 $ 403,853 $ 34,807 $ 975,293
D. Other Postemployment Benefits (OPEB)
Non-university component units are included in the State of Montana benefit plan, whereas the Office of theCommissioner of Higher Education (included in the primary government otherwise) is included in the MontanaUniversity System benefit plan. For these reasons component unit OPEB information is included in Note 7.
E. Risk ManagementMontana State Fund (MSF or New Fund) is the only component unit risk pool. Unpaid claims and claim adjustmentexpenses are estimated based on the ultimate cost of settling the claims including the effects of inflation and othersocietal/economic factors. There are no significant reductions in insurance coverage from the prior year, nor anyinsurance settlements exceeding insurance coverage for the last three years for MSF. This fund uses the accrual basisof accounting. Montana State Fund investments are recorded at fair value, and the premiums and discounts are amortizedusing the scientific interest method over the life of the securities.
(1) Montana State Fund (MSF) – This fund provides liability coverage to employers for injured employees who areinsured under the Workers Compensation and Occupational Disease Acts of Montana and workers compensation claimsoccurring on or after July 1, 1990. MSF is a self-supporting, competitive State fund, and functions as the guaranteedmarket. At December 31, 2018, approximately 23,800 employers were insured with MSF. Anticipated investment
A-166

income is considered for computing a premium deficiency, and employers must pay premiums to MSF within specifiedtime frames.
An actuarial study prepared by Willis Towers Watson, as of December 31, 2018, estimated the cost of settling claimsthat have been reported but not settled, and claims that have been incurred but not reported. Due to the fact that actualclaim costs depend on such complex factors as inflation and changes in the law, claim liabilities are recomputedperiodically using a variety of actuarial and statistical techniques in order to produce current estimates that reflect recentsettlements, claim frequency, and other economic and societal factors.
A provision for inflation is implicit in the calculation of estimated future claim costs because reliance is placed bothon actual historical data that reflect past inflation and on other factors that are considered to be appropriate modifiersof past experience. As of December 31, 2018, $941.6 million of unpaid claims and claim adjustment expenses werepresented at face value.
Section 39-71-2311, MCA, requires MSF to set premiums, at least annually, at a level sufficient to insure adequatefunding of the insurance program during the period the rates will be in effect. It also requires MSF to establish aminimum surplus above risk-based capital requirements to support MSF against risks inherent in the business ofinsurance.
For the year ended December 31, 2018, MSF ceded premiums to other reinsurance companies to limit the exposurearising from large losses. These arrangements consist of excess of loss contracts that protect against individualoccurrences over stipulated amounts, and an aggregate stop loss contract which protects MSF against the potential thataggregate losses will exceed expected levels expressed as a percentage of premium. The excess of loss contract providescoverage for occurrences up to $100.0 million; however, MSF retains the first $5.0 million of coverage. The excess ofloss protection applies to an individual occurrence with the maximum of $5.0 million on any one life.
The term of the current aggregate stop loss contract is January 1, 2017 through December 31, 2019. The contractprovides coverage based on MSF’s premium levels not to exceed 15.0% of the subject net earned premium. In the eventreinsurers are unable to meet their obligations, under either the excess of loss contracts or the aggregate stop losscontract, MSF would remain liable for all losses, as the reinsurance agreements do not discharge MSF from its primaryliability to the policyholders.
Premium revenue was reduced by premiums paid for reinsurance coverage of $10.0 million during the year endedDecember 31, 2018.
Estimated claim reserves were reduced by $1.3 million as of December 31, 2018, for the amount of reinsurance estimatedto be ultimately recoverable on incurred losses due to the excess of loss reinsurance contract. There were no estimatedrecoverables due to the aggregate stop loss contract.
(2) Changes in Claims Liabilities for the Past Two Years – As indicated above, this fund establishes liabilities forboth reported and unreported insured events including estimates of future payments of losses and related claimadjustment expenses. The following table presents changes (in thousands) in the aggregate liabilities for Montana StateFund net of estimated reinsurance recoverable. The information presented is at face value and has not been discounted.
A-167

Year EndedDecember 31, 2018
Year EndedDecember 31, 2017
Unpaid claims and claim adjustments expensesat beginning of year $ 919,690 $ 921,532
Incurred claims and claim adjustment expenses:Provision for insured event of the current
year 137,066 137,222Increase (decrease) in provision for insured
events of prior years (15,141) (14,195)Total incurred claims and claim adjustment
expenses 121,925 123,027Payments:
Claims and claim adjustment expensesattributable to insured events of thecurrent year (22,903) (24,597)
Claims and claim adjustment expensesattributable to insured events of prior years (77,074) (100,272)
Total payments (99,977) (124,869)Total unpaid claims and claim adjustment
expenses at end of year $ 941,638 $ 919,690
F. Capital Leases/Installment Purchases
Obligations under capital leases/installment purchases at June 30, 2019, were as follows (in thousands):
Fiscal Year Ending June 30:
DiscretelyPresented
Component Units2020 $ 1972021 1482022 1032023 622024 25Thereafter 4
Total minimum payments 539Less: interest (43)
Present value of minimumpayments $ 496
A-168

G. Operating Leases
Future rental payments under operating leases at June 30, 2019, are as follows (in thousands):
Fiscal Year Ending June 30:Discretely Presented
Component Units2020 $ 3,2582021 2,4122022 1,5242023 1,2012024 5,545Thereafter 1,121
Total future rental payments $ 15,061
H. Debt Service Requirements
Debt service requirements of discretely presented component units at June 30, 2019, were as follows (in thousands):
Montana Board of Housing Montana State UniversityMontana State University
Direct Placement University of MontanaYear
EndedJune 30:
Principal Interest Principal Interest Principal Interest Principal Interest2020 $ 17,095 $ 16,430 $ 10,533 $ 6,917 $ 409 $ 466 $ 9,765 $ 3,0582021 17,895 16,053 10,190 6,569 421 454 10,125 2,6562022 18,185 15,619 10,460 6,227 433 442 10,611 2,2382023 18,785 15,131 6,275 5,927 446 429 11,277 1,8112024 19,270 14,588 6,580 5,682 459 416 11,182 1,4722025 - 2029 106,795 63,092 32,300 23,799 2,505 1,868 21,595 3,6632030 - 2034 108,880 44,274 29,695 18,015 2,896 1,477 9,150 1,2952035 - 2039 88,420 25,745 25,700 11,738 3,347 1,026 2,780 1912040 - 2044 69,875 10,845 26,975 5,836 3,869 504 — —2045 - 2049 20,885 1,776 10,940 844 1,274 37 — — Total $ 486,085 $ 223,553 $ 169,648 $ 91,554 $ 16,059 $ 7,119 $ 86,485 $ 16,384
A-169

I. Summary of Changes in Long-term Liabilities Payable
Long-term liability activity of discretely presented component units for the year ended June 30, 2019, was as follows(in thousands):
BeginningBalance (3) Additions Reductions
EndingBalance
AmountsDue WithinOne Year
AmountsDue In MoreThan One
YearDiscretely presented component unitsBonds/notes payable
Montana Board of Housing $ 451,869 $ 90,796 $ 49,440 493,225 $ 17,095 $ 476,130Montana State University (MSU) 190,410 348 12,414 178,344 10,533 167,811MSU Direct Placement 16,455 — 397 16,058 409 15,649University of Montana (UM) 97,118 — 9,482 87,636 9,801 77,835
Total bonds/notes payable (1) 755,852 91,144 71,733 775,263 37,838 737,425
Other liabilitiesLease/installment purchase payable 436 225 165 496 174 322Compensated absences payable 63,083 30,740 28,632 65,191 32,538 32,653Arbitrage rebate tax payable 652 520 48 1,124 390 734Estimated insurance claims 919,690 121,925 99,977 941,638 113,205 828,433Due to federal government 31,818 720 2 32,536 — 32,536Derivative instrument liability 3,080 1,147 — 4,227 — 4,227Reinsurance funds withheld 85,870 11,099 48,583 48,386 — 48,386Unearned compensation 391 — — 391 — 391Net pension liability 222,792 3,364 32,966 193,190 — 193,190Total OPEB liability (2) 35,764 5,044 1,114 39,694 — 39,694
Total other liabilities 1,363,576 174,784 211,487 1,326,873 146,307 1,180,566
$ 2,119,428 $ 265,928 $ 283,220 $ 2,102,136 184,145 1,917,991
Long-term liabilities of Montana University System component units (4) (91) 3,702Total discretely presented component units’ long-term liabilities $ 184,054 $ 1,921,693
(1) When applicable, this amount includes unamortized discounts and unamortized premiums.(2) The Total OPEB liability beginning balance for Montana State Fund (MSF) was restated due to the implementation of GASB No. 75.(3) Beginning balances are taken from component unit financial statements.(4) Interentity transaction eliminations between Montana University System component units for debt shown in the component unit information can cause negative
balances in component unit information.
J. Refunded and Early Retired Debt
Refunded DebtOn September 4, 2018, Montana State University issued Series F 2018 bonds in the amount of 19.8 million, to refundSeries J 2005 in the same principal amount at a rate of 0.45% above Securities Industry and Financial Markets Association(SIFMA).
A-170

Defeased Debt OutstandingThe University of Montana has defeased certain bond issues by placing proceeds of new bonds in an irrevocable trust.The proceeds, together with interest earned thereon, will be sufficient for future debt service payments on the refundedissues. Accordingly, the trust account assets and the liability for the defeased bonds are not included in the University'sconsolidated financial statements. As of June 30, 2019, $75.2 million of bonds outstanding were considered defeased.
K. No-Commitment Debt
Information is presented below for financing authorities participating in debt issues. The State has no obligation forthis debt. Accordingly, these bonds and notes are not reflected in the accompanying financial statements.
Facility Finance Authority (FFA)FFA is authorized to issue bonds and notes to finance projects for qualifying health care and other community-basedservice providers. The revenue bonds are payable solely from loan repayments to be made by eligible facilities pursuantto loan agreements, and further, from the funds created by the indentures and investment earnings thereon. The notesare payable solely from loan repayments pursuant to loan agreements. The revenue bonds and notes payable issued byFFA do not constitute a debt, liability, obligation, or pledge of faith and credit of the State of Montana, with the exceptionof the Montana State Hospital Project included in Note 11. At June 30, 2019, revenue bonds and notes outstandingaggregated $1.1 billion.
The Board of Investments and FFA have entered into a capital reserve account agreement for certain bond issues. SeeNote 16 for more information.
Montana Board of Housing (MBOH)MBOH is authorized to issue bonds and make mortgage loans in order to finance affordable housing for Montanaresidents. The bonds are special limited obligations, payable solely from pledged revenues and assets of the borrower,not general obligations of MBOH. These bonds issued by MBOH do not constitute a debt, liability, obligation, or pledgeof faith and credit of the State of Montana. At June 30, 2019, bonds outstanding aggregated $55.0 million.
L. Non-Exchange Financial Guarantee
BOI provides loan guarantees from the Coal Severance Tax Fund to the Facility Finance Authority (FFA). BOI exposureto bond issues, surety bonds, and designated loans of the FFA totaled $88.9 million as of June 30, 2019. FFA is adiscretely presented component unit of the State of Montana. FFA guarantee requests are submitted to BOI for reviewand approval. BOI’s participation, either duration or any other consideration, to either purchase bonds or loans or tolend money for deposit into FFA’s statutorily allowed capital reserve account is explicitly limited by statute whichrequires BOI to act prudently. The guarantee requests from FFA pertain to bonds issued by FFA with a term of up to40 years. BOI and FFA have entered into an agreement detailing repayment to BOI. BOI has not had to perform on anyloan guarantee in the past.
The following schedule summarizes the activity related to the non-exchange financial guarantee during the year endedJune 30, 2019 (in thousands):
BeginningBalance Additions Reductions
Ending Balance
$ 81,451 $ 11,000 $ 3,510 $ 88,941
M. Derivative Transactions Related to Long-term Debt
Montana State University (MSU) has two interest rate swaps as of June 30, 2019. Interest rate swaps are classified ashedging derivative instruments if the instruments meet the criteria of paragraphs 27 (a) and (b) of GASB StatementNo. 53 – Accounting and Financial Reporting for Derivative Instruments (GASB 53), or as investment derivativeinstruments if they do not.
A-171

Derivative DescriptionTrade Date
EffectiveDate
TerminationDate Terms Counterparty
$25.75 million fixed payer swap 3/10/2005 7/21/2005 11/15/2035 Pay 3.953%, Receive SIFMA Deutsche Bank AG$25.25 million basis swap 12/19/2006 11/15/2007 11/15/2035 Pay SIFMA, Receive 86.8%
of 10-year SIFMAMorgan Stanley Capital
Services Inc.
As of June 30, 2019, the fixed payer swap is classified as a hedging derivative instrument under GASB 53, whereasthe basis swap is an investment derivative instrument because there is no identified financial risk being hedged by thebasis swap that can be expressed in terms of exposure to adverse changes in cash flows or fair values. GASB 53 includesfour methods for evaluating hedge effectiveness; a governmental entity may use any of the evaluation methods outlinedin GASB 53 and is not limited to using the same method from period to period. The four methods described in GASB53 are: consistent critical terms, synthetic instrument, dollar-offset, and regression analysis. In addition, GASB 53permits a governmental entity to use other quantitative methods that are based on “established principles of financialeconomic theory.” The fixed payer swap passes the established criteria using the regression analysis methodology.
The fair values of the interest rate swaps were estimated using the zero-coupon method. This method calculates thefuture net settlement payments required by the swap, assuming that the current forward rates implied by the yield curvecorrectly anticipate future spot interest rates. These payments are then discounted using the spot rates implied by thecurrent yield curve for hypothetical zero-coupon bonds due on the date of each future net settlement on the swaps. Tomeasure non-performance risk for a derivative liability, credit spreads implied by the credit rating for debt issues byentities with similar credit characteristics were used. This is the best method available under current market conditionssince MSU has no credit default swaps that actively trade in the marketplace. For a derivative asset, the adjustment fornon-performance risk of counterparties was determined by analyzing counterparty-specific credit default swaps, ifavailable. If not available, credit default swaps in the market for entities of similar type and rating were used, alongwith information found in various public and private information services. This analysis is used to construct a creditcurve that is applied to the discount curve on the net settlement payments of the derivative.
The counterparty to the fixed payer swap had the right to terminate the swap at $0 on December 14, 2016 (a Europeanoption); this option was not exercised. As of the trade date, the option’s value included intrinsic value and time value.The option’s intrinsic value (calculated as the difference between the at-market rate of 4.11% and the off-market rateof 3.953%) is accounted for as a loan receivable and is repaid by the off-market portion of each swap payment. OnSeptember 10, 2010, the Series J bonds were converted to index bonds. On September 4, 2018, the original Series Jbonds were refunded in full with proceeds form the Series F 2018 bonds which were issued in a "SIFMA Index Rate"mode. While in the SIFMA Index Rate, and through the Index Interest Rate Period which spans from September 4,2018 through and including September 1, 2023, the interest rate is reset weekly at a rate of the SIFMA rate plus a fixedspread. The spread is based on the long-term, unenhanced rating assigned to MSU with the current spread as of June30, 2019, was 0.45%. The dependent variable in the regression is the interest rates of the hedged cash flows; theindependent variable is the floating rates due under the hedging derivative.
The fair value of the fixed payer swap liability as of June 30, 2019, is at fair value level 2, and was based on forwardSIFMA rates using the three month Libor Zero Curve, and the BMA Swaption Volatility on the AA Rated Muni RevenueCurve. The fair value of the nonhedging derivative investment is also at level 2, and was based on forward SIFMArates using the 10-year forward BMA constant maturity swap using the three month Libor Zero Curve, and the BMASwaption Volatility on the counterparty’s credit default swap.
A-172

The following table summarizes the reported balances as of, and the derivative instrument activity during, the yearended June 30, 2019 (in thousands):
Activity During 2019 Fair Values at June 30, 2019Cash flow hedges: Notional Classification Amount Classification AmountCash flow hedge –
Pay fixed interest rate swap $ 19,025 Interest expense $ 18 Loan receivable $ 212Investment income — Derivative liability 4,227Deferred outflow 1,147
Investment derivative –
Basis swap $ 19,025 Investment loss $ 200Investment (excluding
interest accrued) $ 256
The objective and terms of MSU’s hedging derivative outstanding as of June 30, 2019, is as follows (in thousands):
Type ObjectiveNotional amount Effective Date
TerminationDate
Cash (Paid)/Received Terms
Pay fixed, cancelableinterest rate swap
Hedge interest rate riskon Series J 2005 Bonds $ 19,025 7/21/2005 11/15/2035 $ —
Pay 3.953%Receive SIFMA
Credit Risk
It is MSU’s policy to enter into derivative agreements with highly rated counterparties. As of June 30, 2019, counterpartyratings were A3 by Moody’s and BBB+ by Standard and Poor’s (S&P). MSU manages credit risk by requiring itscounterparties to post collateral in certain events. MSU is entitled to collateral from its fixed payer swap counterpartyif the interest rate swap’s fair value is greater than $5.0 million and the counterparty is rated A+ or A, by S&P, or A1or A2 by Moody’s. If the counterparty to the fixed payer swap is rated A- or below, by S&P, or A3 or below by Moody’s,MSU is entitled to collateral up to 100% of the swap’s fair value. MSU is not required to post collateral. MSU willcontinue to monitor counterparty credit risk.
MSU enters into derivative agreements with multiple counterparties to limit concentration of credit risk. Currently,MSU has interest rate swaps with two different counterparties and each counterparty accounts for approximately 50%of outstanding notional. MSU monitors counterparty credit risk on an ongoing basis.
Interest Rate Risk
Interest payments on variable rate debt will typically increase as interest rates increase. MSU believes it has significantlyreduced interest rate risk by entering into a pay-fixed, receive floating interest rate swap. As interest rates increase, netswap payments decrease so that changes in hedged variable-rate debt interest payments, attributable to SIFMA, arelargely offset by the net swap payments.
Basis Risk
The variable-rate cash flows being hedged by the pay-fixed swap will increase or decrease as SIFMA rates increase ordecrease. Because the hedged cash flows are SIFMA based and the floating receipts of the pay-fixed swap are SIFMAbased, there is no basis risk.
Termination Risk
MSU or its counterparties may terminate a derivative instrument if the other party fails to perform under the terms ofthe contract. In addition, MSU’s fixed payer swap counterparty has the right to terminate the derivative if the creditrating of MSU’s unenhanced long-term revenue bond rating is withdrawn, suspended or reduced below BBB-, in thecase of S&P, or below Baa3 in the case of Moody’s. If such an event occurs, MSU could be forced to terminate the
A-173
fixed payer swap in a liability position. As of June 30, 2019, MSU’s unenhanced long-term revenue bond rating wasAa3 by Moody’s and A+ by S&P.
Foreign Currency RiskAll hedging derivatives are denominated in US Dollars and therefore MSU is not exposed to foreign currency risk.
Market Access RiskMarket access risk is the risk that MSU will not be able to enter credit markets or that credit will become more costly.For example, to complete a derivative instrument’s objective, an issuance of refunding bonds may be planned in thefuture. If at that time MSU is unable to enter credit market, expected cost savings may not be realized.
N. Related Party Transactions
Private nonprofit organizations with relations to the University of Montana (UM) include the Alumni Association, theMontana Technology Enterprise Center (MonTEC), the Montana Tech Booster Club, and the Montana Tech AlumniAssociation. The associations and booster club operate exclusively for the purpose of encouraging, promoting andsupporting educational programs, research, scholarly pursuits and athletics at, or in connection with UM. For the yearended June 30, 2019, $229.4 thousand was transferred from or expended by the Montana Tech Booster Club forscholarships and construction projects. In exchange, UM provides the associations and booster club with office space,staff, and some related office expenses. MonTEC was established as a nonprofit 501(c)3 corporation in fiscal year 2001as a result of an agreement between UM and the Missoula Area Economic Development Foundation (MAEDF).MonTEC provides low cost lease space and business consulting to local “start-up” companies. The corporation’s boardof directors is comprised of four members. Two members of the board of directors are UM employees, and two arenon-UM employees. UM does not provide office space or other services to MonTEC.
Private nonprofit organizations affiliated with Montana State University (MSU) include the MSU-Bozeman Bookstore,Friends of KUSM, and Friends of KEMC. Friends of Montana Public Television provided $1.4 million during 2019and Friends of KEMC Public Radio provided $900.0 thousand during 2019 in support of MSU’s television and radiostations.
O. Litigation Contingencies
Susan Hensley v. Montana State Fund is based on a Petition for Hearing filed before the Workers’ Compensation Courtin October 2013. The matter is Susan Hensley vs. Montana State Fund, WCC No. 2013-3235. Under House Bill 334,as passed by the legislature in 2011 and codified in section 39-71-703 (2), MCA, when a claimant receives a Class Iimpairment, it is not payable unless the claimant has an actual wage loss as a result of the compensable injury oroccupational disease. The law was effective July 1, 2011, and applicable to claims that occurred on or after that date.The petitioner in this matter is challenging the constitutionality of section 39-71-703 (2), MCA. State Fund anticipatesthe chances are remote, but as with any litigated matter there is the possibility of an adverse decision. Should the statutebe held unconstitutional, determined to be applicable to other claims and also determined to be retroactively applicable,potential liability is estimated to be at least $2.2 million per year, as based on the National Council on CompensationInsurance initial pricing, and current estimated business volumes. However, based on experience, costs may besubstantially higher than the estimate of $2.2 million per year.
Montana State Fund received another Petition for Hearing that was filed before the Workers’ Compensation Court.The matter is Steven Hanson v. Montana State Fund, WCC No. 2014-3398. This is a companion case to Susan Hensleyv. Montana State Fund and has been held in abeyance pending a decision in Hensley.
Mak and Sons Concrete Construction Service v. Montana State Fund is a matter filed in the First Judicial District Courtand involves the issue of whether the Montana State Fund breached its contract to provide workers' compensationinsurance coverage. The Montana State Fund canceled Mak and Sons’ policy of insurance due to not receiving timelypayment of premium. During the uninsured period, several employees of Mak and Sons were involved in a motorvehicle accident. As a result, Mak and Sons sued the Montana State Fund seeking to have coverage for the injuries aswell as for breach of the contract of insurance and breach of the covenant of good faith and fair dealing. Should Makand Sons prevail, MSF estimates the loss may approach $1.0 million.
A-174

P. Subsequent Events
On July 11, 2019, a loan of $335.9 thousand was made from the Facilities Finance Authority (FFA) to Central MontanaMedical Center to finance equipment and renovation to create an interventional radiology suite.
On July 15, 2019, a loan of $498.5 thousand was made from FFA to Northeast Montana Health Services to refinancedebt incurred to replace its boiler system.
On July 18, 2019, a loan of $298.5 thousand was made from FFA to Job Connection to refinance debt incurred to buildan administrative building.
On July 30, 2019, Single Family Mortgage Bonds, 2019 Series B, were issued by the Board of Housing (BOH) for$30.0 million to be used for the purpose of acquiring additional mortgage loans in Montana.
In July 2019, Montana State University (MSU) received authorization from the Board of Regents to expend up to $1.5million for the planning and design of the Bobcat Athletic Complex and Academic Excellence Center, a 40,000 square-foot addition to the north end of Bobcat Stadium in Bozeman. The project will be financed with private donations of$15.0 million and $3.0 million from the MSU non-state funds. Construction is expected to begin after the 2019 footballseason and expected to be open for the 2021 football season. MSU also received authorization from the Board ofRegents to lease the Bobcat Stadium and surrounding area to the MSU Alumni Foundation (MSUAF) for the purposeof constructing the Bobcat Athletics Complex and enter into a Memorandum of Understanding with MSUAF for thisproject.
On August 8, 2019, bonds of $4.0 million were issued by FFA for the Bighorn Valley Health Center to construct a newcommunity health clinic in Hardin, MT.
On September 13, 2019, Montana State Fund's board declared a dividend of $30.0 million to be distributed toapproximately 23,000 employers.
On September 3, 2019, a loan of $99.1 thousand was made from FFA to McCone County Health Center, Inc. to financea hot water heater installation and boiler repairs.
On September 10, 2019, a loan of $1.5 million was made from FFA to Marcus Daly Memorial Hospital to finance thepurchase of a clinic building.
On September 5, 2019, on behalf of the University of Montana (UM), the Board of Regents (the Board) priced $54.5million of General Revenue Bonds Series 2019B and $92.4 million of General Revenue Bonds Series 2019C (Taxable),collectively referred to as Series 2019BC Bonds. The bond issuance closed on September 26, 2019. The proceeds ofthe sale of the Series 2019BC (the Refinancing), were used to defease and refund $88.8 million of outstandingindebtedness, pay costs and expenses in connection with the issuance of the Series 2019BC Bonds, and generate proceedsof $63.4 million which will be used to fund capital improvements for UM. Such capital improvements may include therenewal and renovation of existing student housing, dining and recreational facilities, deferred maintenance projects,and plant upgrades which are expected to result in significant energy cost savings. The Refinancing consisted of adefeasance and refunding of the following: (i) Refunding taxable and tax-exempt Revenue Bonds, Series K 2010outstanding in the aggregate principal amount of $19.6 million; (ii) Refunding taxable and tax-exempt Revenue Bonds,Series L 2012 outstanding in the aggregate principal amount of $35.1 million; (iii) Revenue Bonds, Series M 2013outstanding in the aggregate principal amount of $3.8 million; (iv) Refunding Revenue Bonds, Series N 2015 outstandingin the aggregate principal amount of $14.8 million; (v) Board of Investments INTERCAP Program loans outstandingin the aggregate principal amount of $11.5 million; and (vi) State Building Energy Conservation Program (SBECP)loans outstanding in the aggregate principal amount of $4.0 million. Concurrently with the Refinancing, the Boardexchanged UM's General Revenue Bonds, Series 2019A in the amount of $13.2 million, for its Revenue Bonds, SeriesO 2017 outstanding in the amount of $13.2 million. The Series 2019A Bonds were issued under the Indenture of Trust(Indenture) between the Board and the Trustee, and the Series O 2017 Bonds were cancelled. As defined in the Indenturefor the Series 2019A and Series 2019BC Bonds, UM has pledged all permitted revenues after certain charges forpayment of operation and maintenance expenses.
A-175

On October 4, 2019, bonds of $125.4 million were issued by FFA for the Sisters of Charity Leavenworth Health System,Inc. to refinance its Series 2010 bonds which refunded prior debt, as well as, funding equipment and renovations atfacilities in Billings, Butte, and Miles City, MT.
On November 11, 2019, a loan of $581.2 thousand was made from FFA to Eastern Montana Mental Health Servicesto finance existing debt and furnish a group home in Glendive, MT.
On November 12, 2019, a loan of $500.0 thousand was made from FFA to Eastern Montana Mental Health Servicesto finance existing debt and furnish a group home in Glendive, MT.
On January 16, 2020, Single Family Mortgage Bonds, 2020 Series A, were issued by BOH for $42.4 million to be usedfor the purpose of acquiring additional mortgage loans and refunding certain BOH Single Family Homeownershipbonds.
Q. Commitments
Montana State Fund (MSF or New Fund) is in a multi-year project to replace its legacy policy management system.The first phase to select vendors, coordinate change management processes and develop and implement core policymanagement and billing transaction systems is expected to be completed by December 2019 and require totalexpenditures estimated at $21.0 million. The total project cost from January 1, 2017 to December 31, 2018 was $12.7million. The last phase to develop remaining enhancement features will be planned and arranged with consultingservices towards the end of 2019. Costs during the application development phase will be capitalized and recorded asconstruction work in process until the system is deployed.
As of June 30, 2019, Montana State University (MSU) had issued purchase orders committing the expenditure ofapproximately $12.9 million for equipment, supplies and services which had not yet been received.
In September, 2018, the US Department of Education (Department) informed the University of Montana (UM) that itwas imposing a fine of $966.6 thousand for its failure to comply with the requirements of the Jeanne Clery Disclosureof Campus Security Policy and Campus Crime Statistics Act (the Clery Act) in Section 485 (f) of the Higher EducationAct of 1965, 20 USC Section 1092 (f). In October, 2018, UM submitted a letter to appeal the proposed fine action andrequested a hearing with the Department’s Office of Hearings and Appeals. In January, 2019, UM and the Departmentagreed to resolve the matter and the fine amount was reduced to $395.0 thousand, to be paid in installments over fiveyears. UM subsequently paid off the remaining balance due to the Department in July, 2019.
A-176

NOTE 19. MATERIAL VIOLATIONS OF FINANCE-RELATED LEGAL PROVISIONS
Constitutionality of Retirement Plan Funding
The Montana Constitution, Article VIII, Section 15, states that public retirement systems shall be funded on an actuariallysound basis. Public pension plans are considered actuarially sound if the unfunded accrued actuarial liability amortizationperiod is within 30 years. As of June 30, 2019, the Game Warden & Peace Officers’ Retirement System (GWPORS),the Highway Patrol Officers’ Retirement System (HPORS), and the Public Employees’ Retirement System - DefinedBenefit Retirement Plan (PERS-DBRP) were not in compliance and do not amortize within 30 years. The unfundedliabilities in the other state retirement systems amortize in 30 years or less as of the fiscal year ended June 30, 2019.
A-177

BUDGETARY COMPARISON SCHEDULEGENERAL AND MAJOR SPECIAL REVENUE FUNDSFOR THE FISCAL YEAR ENDED JUNE 30, 2019 (amounts expressed in thousands)
GENERAL FUNDORIGINAL FINALBUDGET BUDGET ACTUAL VARIANCE
REVENUESLicenses/permits $ 124,034 $ 124,034 $ 126,135 $ 2,101Taxes:
Natural resource 67,687 67,687 86,211 18,524Individual income 1,404,299 1,404,299 1,419,959 15,660Corporate income 173,148 173,148 186,012 12,864Property 287,638 287,638 288,070 432Fuel — — — —Other 244,842 244,842 241,604 (3,238)
Charges for services/fines/forfeits/settlements 38,999 38,999 37,153 (1,846)Investment earnings — — 23,647 23,647Sale of documents/merchandise/property 356 356 314 (42)Rentals/leases/royalties 10 10 10 —Contributions/premiums 5,838 5,838 5,833 (5)Grants/contracts/donations 3,953 3,953 8,261 4,308Federal 21,820 21,820 21,475 (345)Federal indirect cost recoveries 66 66 157 91Other revenues 5,999 5,999 5,861 (138)
Total revenues 2,378,689 2,378,689 2,450,702 72,013
EXPENDITURESCurrent:
General government 377,031 377,031 360,596 16,435Public safety 331,800 331,800 313,996 17,804Transportation 180 180 — 180Health and human services 564,544 564,544 526,712 37,832Education 1,045,134 1,045,134 1,036,533 8,601Natural resources 36,486 36,486 32,012 4,474
Debt service (Note RSI-1):Principal retirement — — 15 (15)Interest/fiscal charges — — 216 (216)
Capital outlay (Note RSI-1) — — 3,579 (3,579)Total expenditures 2,355,175 2,355,175 2,273,659 81,516
Excess of revenue over (under) expenditures 23,514 23,514 177,043 153,529
OTHER FINANCING SOURCES (USES)Insurance proceeds — — 2 2General capital asset sale proceeds 47 47 89 42Energy conservation loans — — — —Transfers in (Note 12) 78,231 78,231 122,579 44,348Transfers out (Note 12) (251,909) (251,909) (58,977) 192,932
Total other financing sources (uses) (173,631) (173,631) 63,693 237,324Net change in fund balances
(Budgetary basis) (150,117) (150,117) 240,736 390,853
RECONCILIATION OF BUDGETARY/GAAP REPORTING1. Securities lending income — — — —2. Securities lending costs — — — —3. Inception of lease/installment contract — — 234 2344. Adjustments for nonbudgeted activity — — — —
(GAAP basis) (150,117) (150,117) 240,970 391,087
Fund balance - July 1 — — 199,318 199,318Prior period adjustments — — 2,820 2,820Increase (decrease) in inventories — — 298 298
Fund balances - June 30 $ (150,117) $ (150,117) $ 443,406 $ 593,523The notes to the required supplementary information are an integral part of this schedule. Budgetary data is not broken down to the same account level as actual financial statement data, which accounts for some of the larger variances.The original and final budget figures reflect adjustments to the original budget for various reasons, including legislative and executive changes.
A-178

BUDGETARY COMPARISON SCHEDULEGENERAL AND MAJOR SPECIAL REVENUE FUNDSFOR THE FISCAL YEAR ENDED JUNE 30, 2019 (amounts expressed in thousands)
GENERAL FUNDORIGINAL FINALBUDGET BUDGET ACTUAL VARIANCE
REVENUESLicenses/permits $ 124,034 $ 124,034 $ 126,135 $ 2,101Taxes:
Natural resource 67,687 67,687 86,211 18,524Individual income 1,404,299 1,404,299 1,419,959 15,660Corporate income 173,148 173,148 186,012 12,864Property 287,638 287,638 288,070 432Fuel — — — —Other 244,842 244,842 241,604 (3,238)
Charges for services/fines/forfeits/settlements 38,999 38,999 37,153 (1,846)Investment earnings — — 23,647 23,647Sale of documents/merchandise/property 356 356 314 (42)Rentals/leases/royalties 10 10 10 —Contributions/premiums 5,838 5,838 5,833 (5)Grants/contracts/donations 3,953 3,953 8,261 4,308Federal 21,820 21,820 21,475 (345)Federal indirect cost recoveries 66 66 157 91Other revenues 5,999 5,999 5,861 (138)
Total revenues 2,378,689 2,378,689 2,450,702 72,013
EXPENDITURESCurrent:
General government 377,031 377,031 360,596 16,435Public safety 331,800 331,800 313,996 17,804Transportation 180 180 — 180Health and human services 564,544 564,544 526,712 37,832Education 1,045,134 1,045,134 1,036,533 8,601Natural resources 36,486 36,486 32,012 4,474
Debt service (Note RSI-1):Principal retirement — — 15 (15)Interest/fiscal charges — — 216 (216)
Capital outlay (Note RSI-1) — — 3,579 (3,579)Total expenditures 2,355,175 2,355,175 2,273,659 81,516
Excess of revenue over (under) expenditures 23,514 23,514 177,043 153,529
OTHER FINANCING SOURCES (USES)Insurance proceeds — — 2 2General capital asset sale proceeds 47 47 89 42Energy conservation loans — — — —Transfers in (Note 12) 78,231 78,231 122,579 44,348Transfers out (Note 12) (251,909) (251,909) (58,977) 192,932
Total other financing sources (uses) (173,631) (173,631) 63,693 237,324Net change in fund balances
(Budgetary basis) (150,117) (150,117) 240,736 390,853
RECONCILIATION OF BUDGETARY/GAAP REPORTING1. Securities lending income — — — —2. Securities lending costs — — — —3. Inception of lease/installment contract — — 234 2344. Adjustments for nonbudgeted activity — — — —
(GAAP basis) (150,117) (150,117) 240,970 391,087
Fund balance - July 1 — — 199,318 199,318Prior period adjustments — — 2,820 2,820Increase (decrease) in inventories — — 298 298
Fund balances - June 30 $ (150,117) $ (150,117) $ 443,406 $ 593,523The notes to the required supplementary information are an integral part of this schedule. Budgetary data is not broken down to the same account level as actual financial statement data, which accounts for some of the larger variances.The original and final budget figures reflect adjustments to the original budget for various reasons, including legislative and executive changes.
STATE SPECIAL REVENUE FUND FEDERAL SPECIAL REVENUE FUNDORIGINAL FINAL ORIGINAL FINALBUDGET BUDGET ACTUAL VARIANCE BUDGET BUDGET ACTUAL VARIANCE
$ 227,602 $ 227,602 $ 234,402 $ 6,800 $ — $ — $ — $ —
73,486 73,486 83,705 10,219 — — — —— — — — — — — —— — — — — — — —
18,809 18,809 18,675 (134) — — — —303,092 303,092 261,290 (41,802) — — — —148,128 148,128 141,023 (7,105) 6 6 1 (5)119,924 119,924 118,036 (1,888) 6,856 6,856 6,786 (70)
— — 16,857 16,857 — — 599 59910,196 10,196 10,256 60 17 17 15 (2)
974 974 966 (8) 1 1 — (1)27,814 27,814 28,745 931 — — — —14,283 14,283 39,788 25,505 18 18 17 (1)7,228 7,228 7,115 (113) 2,931,863 2,931,863 2,848,049 (83,814)
51,438 51,438 54,368 2,930 82,379 82,379 82,051 (328)38,556 38,556 2,956 (35,600) 1,206 1,206 1,308 102
1,041,530 1,041,530 1,018,182 (23,348) 3,022,346 3,022,346 2,938,826 (83,520)
346,881 346,881 195,442 151,439 271,426 271,426 90,512 180,91491,522 91,522 77,612 13,910 49,840 49,840 18,566 31,274357,670 357,670 242,884 114,786 633,924 633,924 116,829 517,095178,740 178,740 163,544 15,196 2,304,206 2,304,206 2,006,938 297,26897,276 97,276 80,785 16,491 325,366 325,366 196,400 128,966298,337 298,337 176,439 121,898 176,784 176,784 82,386 94,398
— — 634 (634) — — 39 (39)— — 226 (226) — — 6 (6)— — 66,639 (66,639) — — 398,090 (398,090)
1,370,426 1,370,426 1,004,205 366,221 3,761,546 3,761,546 2,909,766 851,780(328,896) (328,896) 13,977 342,873 (739,200) (739,200) 29,060 768,260
13,245 13,245 13,783 538 — — — —64 64 872 808 46 46 71 25— — 272 272 — — — —
278,437 278,437 161,199 (117,238) 15,057 15,057 2,369 (12,688)(110,225) (110,225) (65,310) 44,915 (89,994) (89,994) (32,087) 57,907181,521 181,521 110,816 (70,705) (74,891) (74,891) (29,647) 45,244
(147,375) (147,375) 124,793 272,168 (814,091) (814,091) (587) 813,504
— — 110 110 — — — —— — (67) (67) — — — —— — 555 555 — — 19 19— — (13,111) (13,111) — — — —
(147,375) (147,375) 112,280 259,655 (814,091) (814,091) (568) 813,523
— — 1,601,060 1,601,060 — — (10,070) (10,070)— — (624) (624) — — (1,975) (1,975)— — 1,120 1,120 — — — —
$ (147,375) $ (147,375) $ 1,713,836 $ 1,861,211 $ (814,091) $ (814,091) $ (12,613) $ 801,478
A-179
NOTES TO THE REQUIRED SUPPLEMENTARY INFORMATION
NOTE RSI – 1. BUDGETARY REPORTING
A. State Budget Process
The Montana Legislature meets in the odd-numbered years to prepare annual budgets for the next biennium. TheConstitution requires that legislative appropriations not exceed available revenues. The Legislature uses revenueestimates in the budgetary process to establish appropriation levels. Expenditures may not legally exceed budgetappropriations at the fund level. In addition, the State Constitution prohibits borrowing to cover deficits incurred becauseappropriations exceeded anticipated revenues. State law requires an appropriation for disbursements from the general,special revenue and capital projects funds, except for those special revenue funds from non-state and non-federal sourcesrestricted by law or by the terms of an agreement. The level of budgetary control is established by fund type, exceptcapital project funds, which are at project level. Budgets may be established in other funds for administrative purposes.
Agency budget requests are submitted to the Governor, and the Legislative Fiscal Division receives a copy. The Officeof Budget and Program Planning (OBPP) and the Governor analyze the requests, establish priorities, and develop therequests into the executive budget request submitted to the Legislature. Joint appropriations subcommittee hearingsare held, and an omnibus appropriation bill is reported in the House and subsequently sent to the Senate. The Legislaturegenerally enacts one bill to establish the majority of appropriations for the next two fiscal years. OBPP establishesappropriations for each program by accounting entity (fund) within an agency. The Legislature enacts otherappropriations, but only within the available revenue. Agencies must prepare and submit to the budget directoroperational plans showing the allocation of operating budgets by expenditure category (i.e., personal services, operatingexpenses, equipment, etc.). The budget director or other statutorily designated approving authority may authorizechanges among expenditure categories and transfers between program appropriations.
Appropriations may not be increased by amendment in the General Fund. However, a department, institution, or agencyof the executive branch desiring authorization to make expenditures from the General Fund during the first fiscal yearof the biennium from appropriations for the second fiscal year of the biennium may apply for authorization from theGovernor through the budget director. In the second year of the biennium, during the legislative session, the Legislaturemay authorize supplemental appropriations. The Governor, or designee, may approve budget amendments for non-general fund monies not available for consideration by the Legislature and for emergencies. In the accompanyingfinancial schedule, original and final budget amounts are reported. There were no expenditures in excess of totalauthorized appropriations in the State's budgeted funds for the fiscal year.
Appropriations for debt service activities are continuing through statutory authority until the obligation is extinguished.Because these non-operating budgets primarily serve a management control purpose, and related appropriations arecontinuing in nature, no comparison between budgeted and actual amounts for funds budgeted on this basis is provided.
Appropriations for capital projects funds are not made on an annual basis, but are adopted on a project-length basis.Because these non-operating budgets primarily serve a management control purpose, and related appropriations arecontinuing in nature, no comparison between budgeted and actual amounts for funds budgeted on this basis is provided.
Appropriations may be continued into the next fiscal year when authorized by the Legislature or the Governor's Office.After fiscal year-end, appropriations that are not continued are reverted. The reverted appropriations remain availablefor one fiscal year for expenditures that exceed the amount accrued or encumbered. Fund balances are not reserved forreverted appropriations. For fiscal year 2019, reverted governmental fund appropriations were as follows: $42.4 millionin the General Fund, $172.3 million in the State Special Revenue Fund, and $356.6 million in the Federal SpecialRevenue Fund. Agencies are allowed to carry forward 30.0% of their reverted operating appropriations into the nexttwo fiscal years. This amount can be used for new expenditures at the request of the agency and upon approval of OBPP.
B. Budget Basis
The Legislature's legal authorization ("appropriations") to incur obligations is enacted on a basis inconsistent withGenerally Accepted Accounting Principles (GAAP). The budget basis differs from GAAP for encumbrances outstandingat fiscal year-end, compensated absences, capital assets and inventories purchased in proprietary funds, certain loansfrom governmental funds, and other miscellaneous nonbudgeted activity.
A-180

REQUIRED SUPPLEMENTARY INFORMATION
NOTE RSI – 2. PENSION PLAN INFORMATION
Required Supplementary Information State of Montana as an Employer Entity
Judges’ Retirement SystemSchedule of Changes in Net Pension Liability/(Asset) and Related Ratios ˡ
For the Fiscal Year Ended June 30(dollars in thousands)
2019 2018 2017 2016 2015Total Pension Liability (TPL)Service costs $ 1,664 $ 1,628 $ 1,578 $ 1,653 $ 1,594Interest 4,503 4,044 3,986 3,934 3,824Differences between expected and actual experience (2,901) 862 (1,341) (1,032) —Changes of assumptions — 3,865 — — —Refunds of contributions (149) — — — —Benefit payments (3,723) (3,554) (3,416) (3,041) (3,023)
Net change in total pension liability (606) 6,845 807 1,514 2,395Total pension liability – beginning 60,798 53,953 53,146 51,632 49,237Total pension liability – ending $ 60,192 $ 60,798 $ 53,953 $ 53,146 $ 51,632
Plan Fiduciary Net PositionContributions – employer $ 1,085 $ 1,800 $ 1,806 $ 1,684 $ 1,651Contributions – member 575 488 729 534 481Net investment income 8,467 10,368 1,779 3,843 12,421Refunds of contributions (149) — — — —Benefit payments (3,723) (3,554) (3,416) (3,041) (3,023)Administrative expense (264) (254) (197) (136) (100)Other 7 — (3) — —
Net change in plan fiduciary net position 5,998 8,848 698 2,884 11,430Plan fiduciary net position - beginning 96,653 87,805 87,107 84,223 72,793Plan fiduciary net position - ending $ 102,651 $ 96,653 $ 87,805 $ 87,107 $ 84,223
Net Pension (Asset) – Beginning $ (35,855) $ (33,852) $ (33,961) $ (32,591) $ (23,556)Net Pension (Asset) – Ending $ (42,459) $ (35,855) $ (33,852) $ (33,961) $ (32,591)
Plan fiduciary net position as a percentage of TPL 170.54% 158.97% 162.74% 163.90% 163.12%Covered payroll $ 7,291 $ 6,974 $ 6,920 $ 6,525 $ 6,355Net pension (asset) as a percentage of covered payroll (582.35)% (514.12)% (489.19)% (521.00)% (513.00)%
ˡ Schedules are intended to present information for 10 years. Additional years will be displayed as they become available.
A-181

Schedule of Employer Contributions ˡFor the Fiscal Year Ended June 30
(in thousands)
2019 2018 2017 2016 2015Contractually required contributions $ — $ 1,085 $ 1,800 $ 1,786 $ 1,684Contributions made in relation to the contractually
required contributions — 1,085 1,800 1,786 1,684Contribution deficiency/(excess) $ — $ — $ — $ — $ —
Covered payroll $ 7,382 $ 7,291 $ 6,974 $ 6,920 $ 6,525Contributions as a percentage of covered payroll 0.00% 14.88% 25.81% 26.00% 26.00%
ˡ Schedules are intended to present information for 10 years. Additional years will be displayed as they become available.
Judges’ Retirement SystemNotes to Required Supplementary Information
For the Year Ended June 30, 2019
Method and assumptions used in calculations of contractually determined contributions: The contractually requiredcontribution rates are determined on an annual basis for the fiscal year beginning July 1, 2018, determined as of June30, 2018.
The following key methods and assumptions were used to determine the contractual contribution rates reported in thatschedule:
Actuarial cost method Entry age NormalAmortization method Level percentage of pay, openAsset valuation method 4-year smoothed marketWage inflation 3.50%, including inflationSalary increases 0% Inflation 2.75%Investment rate of return 7.65%, net of pension plan investment expense, including inflationMortality (healthy) RP-2000 Combined employee and annuitant mortality table projected
to 2020 using scale BB, males set back 1 yearMortality (disabled) RP-2000 Combined employee and annuitant mortality tableAdmin expense as a % of payroll 0.18%
Changes of assumptions: No changes in assumptions or other inputs that affected the measurement date have beenmade since the prior measurement date.
A-182

Required Supplementary Information State of Montana as an Employer Entity
Highway Patrol Officers’ Retirement SystemSchedule of Changes in Net Pension Liability and Related Ratios ˡ
For the Fiscal Year Ended June 30(dollars in thousands)
2019 2018 2017 2016 2015Total Pension Liability (TPL)Service costs $ 3,643 $ 3,665 $ 3,799 $ 3,598 $ 3,464Interest 16,294 15,121 14,545 14,113 13,518Changes in benefits — — — 1,856 —Difference between expected and actualexperience 590 2,774 18 267 —Changes of assumptions — 7,892 — — —Benefit payments (11,546) (11,037) (10,482) (10,001) (9,443)Refunds of contributions (322) (245) (94) — —
Net change in total pension liability 8,659 18,170 7,786 9,833 7,539Total pension liability – beginning 218,922 200,752 192,966 183,133 175,594Total pension liability – ending $ 227,581 $ 218,922 $ 200,752 $ 192,966 $ 183,133
Plan Fiduciary Net PositionContributions – employer $ 5,858 $ 5,782 $ 5,916 $ 5,840 $ 5,736Contributions – non-employer 250 263 243 — —Contributions – member 2,387 1,950 1,917 1,624 1,458Net investment income 12,283 15,099 2,605 5,738 18,677Benefit payments (11,546) (11,037) (10,482) (10,001) (9,443)Administrative expense (256) (248) (197) (144) (109)Refunds of contributions (322) (245) (94) — —Other 8 — (2) — —
Net change in plan fiduciary net position 8,662 11,564 (94) 3,057 16,319Plan fiduciary net position – beginning 140,537 128,973 129,067 126,010 109,691Plan fiduciary net position – ending $ 149,199 $ 140,537 $ 128,973 $ 129,067 $ 126,010
Net Pension Liability – Beginning $ 78,385 $ 71,779 $ 63,899 $ 57,123 $ 65,903Net Pension Liability – Ending $ 78,382 $ 78,385 $ 71,779 $ 63,899 $ 57,123
Plan fiduciary net position as a percentage of TPL 65.56% 64.20% 64.24% 67.00% 69.00%Covered payroll $ 15,251 $ 14,779 $ 15,276 $ 14,549 $ 14,149Net pension liability as a percentage of covered
payroll 513.95% 530.38% 469.88% 439.00% 404.00%
Schedule of Employer Contributions ˡFor the Fiscal Year Ended June 30
(dollars in thousands)
2019 2018 2017 2016 2015Contractually required contributions $ 6,051 $ 5,843 $ 5,706 $ 6,161 $ 5,782Contributions in relation to the contractually required
contributions 6,051 5,843 5,706 6,161 5,782Contribution deficiency/(excess) $ — $ — $ — $ — $ —
Covered payroll $ 15,178 $ 15,251 $ 14,779 $ 15,276 $ 14,549Contributions as a percentage of covered payroll 39.87% 38.31% 38.61% 40.00% 40.00%
ˡ Schedules are intended to present information for 10 years. Additional years will be displayed as they become available.
A-183

Notes to Required Supplementary InformationHighway Patrol Officers’ Retirement System
For the Year Ended June 30, 2019
Method and assumptions used in calculations of contractually determined contributions: The contractually requiredcontribution rates are determined on an annual basis for the fiscal year beginning July 1, 2018, determined as of June30, 2018.
The following key methods and assumptions were used to determine the contractual contribution rates reported in thatschedule:
Actuarial cost method Entry age NormalAmortization method Level percentage of pay, openAsset valuation method 4-year smoothed marketWage inflation 3.50%, including inflationSalary increases 0% to 6.30%Inflation 2.75%Investment rate of return 7.65%, net of pension plan investment expense, including inflationMortality (healthy) RP-2000 Combined employee and annuitant mortality table projected
to 2020 using scale BB, males set back 1 yearMortality (disabled) RP-2000 Combined employee and annuitant mortality tableAdmin expense as a % of payroll 0.30%
Changes of assumptions: No changes in assumptions or other inputs that affected the measurement date have beenmade since the prior measurement date.
A-184

Required Supplementary Information State of Montana as an Employer Entity
Game Wardens’ and Peace Officers’ Retirement SystemSchedule of Changes in Net Pension Liability and Related Ratios ˡ
For the Fiscal Year Ended June 30 (dollars in thousands)
2019 2018 2017 2016 2015Total Pension Liability (TPL)Service costs $ 8,098 $ 8,623 $ 8,403 $ 8,008 $ 7,850Interest 16,018 14,269 12,911 12,398 11,258Difference between expected and actualexperience 4,781 3,743 2,705 731 —Changes of assumptions — 5,878 — — —Benefit payments (6,523) (5,810) (5,068) (5,352) (5,229)Refunds of contributions (1,105) (1,036) (1,066) — —
Net change in total pension liability 21,269 25,667 17,885 15,785 13,879Total pension liability – beginning 213,201 187,534 169,649 153,864 139,985Total pension liability – ending $ 234,470 $ 213,201 $ 187,534 $ 169,649 $ 153,864
Plan Fiduciary Net PositionContributions - employer $ 4,613 $ 4,464 $ 4,278 $ 4,088 $ 3,762Contributions - member 5,512 5,278 5,036 4,924 4,462Net investment income 15,573 18,590 3,167 6,435 20,069Benefit payments (6,523) (5,810) (5,068) (5,352) (5,229)Administrative expense (369) (329) (269) (200) (162)Refunds of contributions (1,105) (1,036) (1,066) — —Other (19) (1) (31) — —
Net change in plan fiduciary net position 17,682 21,156 6,047 9,895 22,902Plan fiduciary net position – beginning 175,841 154,685 148,638 138,743 115,841Plan fiduciary net position – ending $ 193,523 $ 175,841 $ 154,685 $ 148,638 $ 138,743
Net Pension Liability – Beginning $ 37,360 $ 32,849 $ 21,011 $ 15,121 $ 24,144Net Pension Liability – Ending $ 40,947 $ 37,360 $ 32,849 $ 21,011 $ 15,121
Plan fiduciary net position as a percentage of TPL 82.54% 82.48% 82.48% 87.00% 90.00%Covered payroll $ 50,823 $ 49,381 $ 47,108 $ 44,885 $ 41,637Net pension liability as a percentage of covered
payroll 80.57% 75.66% 69.73% 47.00% 36.00%
Schedule of Employer Contributions 1For the Fiscal Year Ended June 30
(dollars in thousands)
2019 2018 2017 2016 2015Contractually required contributions $ 4,644 $ 4,574 $ 4,447 $ 4,240 $ 4,040Contributions in relation to the contractually
required contributions 4,644 4,574 4,447 4,240 4,040Contribution deficiency/(excess) $ — $ — $ — $ — $ —
Covered payroll $ 51,677 $ 50,823 $ 49,381 $ 47,108 $ 44,885Contributions as a percentage of covered payroll 8.99% 9.00% 9.01% 9.00% 9.00%
ˡ Schedules are intended to present information for 10 years. Additional years will be displayed as they become available.
A-185
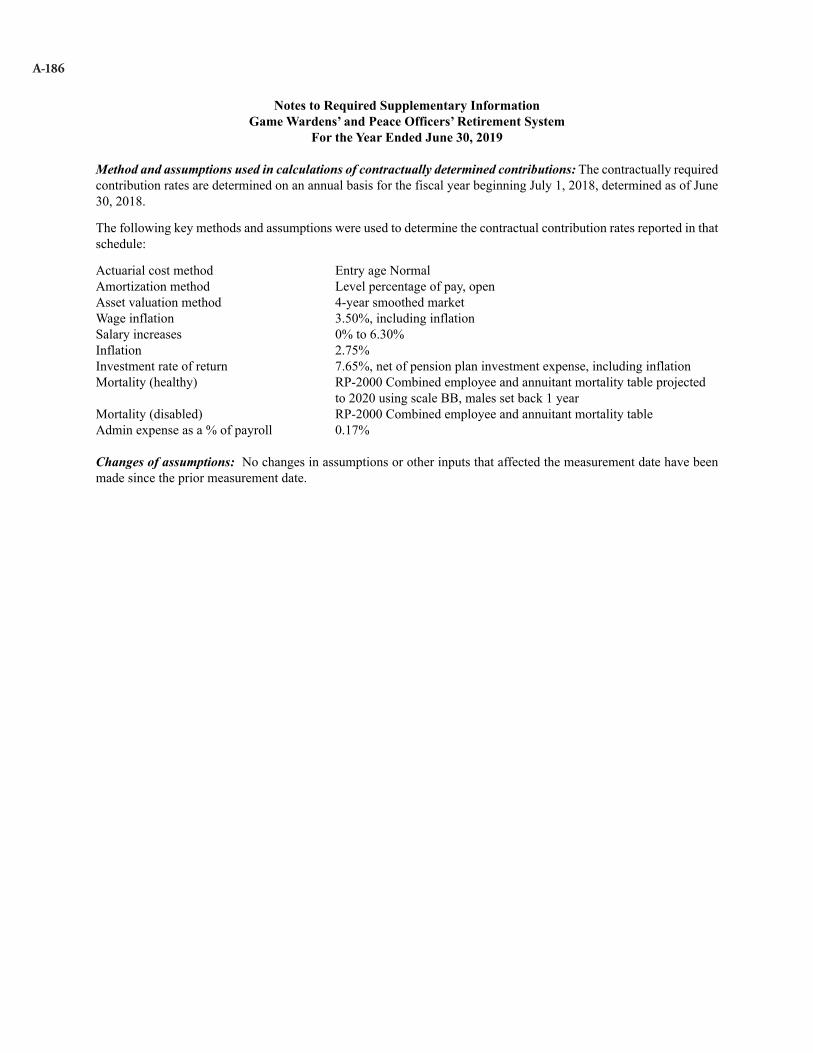
Notes to Required Supplementary InformationGame Wardens’ and Peace Officers’ Retirement System
For the Year Ended June 30, 2019
Method and assumptions used in calculations of contractually determined contributions: The contractually requiredcontribution rates are determined on an annual basis for the fiscal year beginning July 1, 2018, determined as of June30, 2018.
The following key methods and assumptions were used to determine the contractual contribution rates reported in thatschedule:
Actuarial cost method Entry age NormalAmortization method Level percentage of pay, openAsset valuation method 4-year smoothed marketWage inflation 3.50%, including inflationSalary increases 0% to 6.30%Inflation 2.75%Investment rate of return 7.65%, net of pension plan investment expense, including inflationMortality (healthy) RP-2000 Combined employee and annuitant mortality table projected
to 2020 using scale BB, males set back 1 yearMortality (disabled) RP-2000 Combined employee and annuitant mortality tableAdmin expense as a % of payroll 0.17%
Changes of assumptions: No changes in assumptions or other inputs that affected the measurement date have beenmade since the prior measurement date.
A-186

Required Supplementary Information State of Montana as an Employer Entity
Public Employees’ Retirement System-Defined Benefit Retirement SystemSchedule of Proportionate Share of the Net Pension Liability ˡ
For the Year Ended June 30(dollars in thousands)
2019 2018 2017 2016 2015Employer’s proportion of the net pension liability 39.546272% 53.049189% 53.241100% 53.611080% 53.223780%Employer’s proportionate share of the net pension
liability $ 825,387 $ 1,033,200 $ 906,880 $ 749,414 $ 663,174Employer’s covered payroll $ 640,177 $ 648,671 $ 621,755 $ 620,286 $ 597,083Employer ’s proportionate share of the net pension
liability as a percentage of its covered payroll 128.93% 159.28% 145.86% 120.82% 111.07 %Plan fiduciary net position as a percentage of the
total pension liability 73.47% 74.00% 75.00% 78.00% 80.00%
Schedule of Employer Contributions ˡFor the Fiscal Year Ended June 30
(dollars in thousands)
2019 2018 2017 2016 2015Contractually required contributions $ 56,183 $ 54,844 $ 56,256 $ 59,073 $ 58,575Contributions in relation to the contractually
required contributions 56,183 54,844 56,256 59,073 58,575Contribution deficiency/(excess) $ — $ — $ — $ — $ —
Covered payroll $ 638,674 $ 640,177 $ 648,671 $ 621,755 $ 620,286Contributions as a percentage of covered payroll 8.80% 8.57% 8.67% 9.50% 9.44%
ˡ Schedules are intended to present information for 10 years. Additional years will be displayed as they become available.
Notes to Required Supplementary InformationFor the Year Ended June 30, 2019
Method and assumptions used in calculations of contractually determined contributions: The contractually requiredcontribution rates are determined on an annual basis for the fiscal year beginning July 1, 2018, determined as of June30, 2018.
The following actuarial methods and assumptions were used to determine contractual contribution rates reported inthat schedule:
Actuarial cost method Entry age NormalAmortization method Level percentage of payroll, openAsset valuation method 4-year smoothed marketWage inflation 3.50%, includes inflationSalary increases 0% to 4.80%Inflation 2.75%Investment rate of return 7.65%, includes inflationMortality (healthy) RP-2000 Combined employee and annuitant mortality table projected
to 2020 using scale BB, males set back 1 yearMortality (disabled) RP-2000 Combined employee and annuitant mortality tableAdmin expense as a % of payroll 0.26%
Changes of assumptions: No changes in assumptions or other inputs that affected the measurement date have beenmade since the prior measurement date.
A-187

Required Supplementary Information State of Montana as a Nonemployer Entity
Public Employees’ Retirement System-Defined Benefit Retirement SystemSchedule of Proportionate Share of the Net Pension Liability ˡ
For the Year Ended June 30(dollars in thousands)
2019 2018 2017 2016 2015Nonemployer’s proportion of the net pension
liability 24.917247% 1.007464% 0.956169% 0.956090% 0.961287%Nonemployer’s proportionate share of the net
pension liability $ 520,058 $ 19,622 $ 16,287 $ 13,365 $ 11,978Plan fiduciary net position as a percentage of the
total pension liability 73.47% 74.00% 75.00% 78.00% 80.00%
Schedule of Nonemployer Contributions 1 For the Fiscal Year Ended June 30
(dollars in thousands)
2019 2018 2017 2016 2015Contractually required contributions $ 34,642 $ 34,706 $ 28,763 $ 30,800 $ 32,397Contributions in relation to the contractually
required contributions 34,642 34,706 28,763 30,800 32,397Contribution deficiency/(excess) $ — $ — $ — $ — $ —
ˡ Schedules are intended to present information for 10 years. Additional years will be displayed as they become available.
Notes to Required Supplementary InformationFor the Year Ended June 30, 2019
Method and assumptions used in calculations of contractually determined contributions: The contractuallydetermined contribution rates are set forth by the Legislature and are contained within the Montana Code Annotated(MCA). The amounts used for the valuation as of the year ended June 30, 2018, are as follows:
Special Funding The State contributes 0.1% of member compensation on behalf of local government entities per Section19-3-319, MCA.The State contributes 0.37% of member compensation on behalf of school district entities per Section 19-3-319,MCA. The State contributes a Statutory Appropriation from General Fund per Section 19-3-320, MCA.
Changes of assumptions: No changes in assumptions or other inputs that affected the measurement date have beenmade since the prior measurement date.
A-188

Required Supplementary Information State of Montana as an Employer Entity
Sheriffs’ Retirement SystemSchedule of Proportionate Share of the Net Pension Liability ˡ
For the Year Ended June 30 (dollars in thousands)
2019 2018 2017 2016 2015Employer’s proportion of the net pension liability 4.872800% 4.856692% 5.454386% 5.637055% 5.535000%Employer’s proportionate share of the net pension
liability $ 3,663 $ 3,696 $ 9,582 $ 5,434 $ 2,304Employer’s covered payroll $ 3,781 $ 3,634 $ 3,850 $ 3,836 $ 3,580Employer ’s proportionate share of the net pension
liability as a percentage of its covered payroll 96.88% 101.71% 248.88% 141.66% 64.36%Plan fiduciary net position as a percentage of the
total pension liability 82.68% 81.00% 63.00% 75.00% 87.00%
Schedule of Employer Contributions 1For the Fiscal Year Ended June 30
(dollars in thousands)
2019 2018 2017 2016 2015Contractually required contributions $ 513 $ 496 $ 368 $ 389 $ 388Contributions in relation to the contractually
required contributions 513 496 368 389 388Contribution deficiency/(excess) $ — $ — $ — $ — $ —
Covered payroll $ 3,915 $ 3,781 $ 3,634 $ 3,850 $ 3,836Contributions as a percentage of covered payroll 13.10% 13.12% 10.13% 10.10% 10.11%
ˡ Schedules are intended to present information for 10 years. Additional years will be displayed as they become available.
Notes to Required Supplementary InformationFor the Year ended June 30, 2019
Method and assumptions used in calculations of contractually determined contributions: The contractually requiredcontribution rates are determined on an annual basis for the fiscal year beginning July 1, 2018, determined as of June30, 2018. The following actuarial methods and assumptions were used to determine contractual contribution ratesreported in that schedule:
Actuarial cost method Entry age NormalAmortization method Level percentage of payroll, openAsset valuation method 4-year smoothed marketWage Inflation 3.50%, includes inflationSalary increases 0% to 6.30%Inflation 2.75%Investment rate of return 7.65%, includes inflationMortality (healthy) RP-2000 Combined employee and annuitant mortality table projected
to 2020 using scale BB, set back 1 year for malesMortality (disabled) RP-2000 Combined employee and annuitant mortality tableAdmin expense as a % of payroll 0.21%
Changes of assumptions: No changes in assumptions or other inputs that affected the measurement date have beenmade since the prior measurement date.
A-189

Required Supplementary InformationState of Montana as a Nonemployer Contributing Entity
Municipal Peace Officers’ Retirement SystemSchedule of Proportionate Share of the Net Pension Liability ˡ
For the Year Ended June 30 (dollars in thousands)
2019 2018 2017 2016 2015Nonemployer’s proportion of the net pension liability 67.124706% 67.085433% 66.499650% 66.954111 % 66.888728%Nonemployer’s proportionate share of the net
pension liability $ 114,956 $ 119,354 $ 119,708 $ 110,756 $ 105,106Plan fiduciary net position as a percentage of the
total pension liability 70.95% 68.00% 66.00% 67.00% 67.00%
Schedule of Nonemployer Contributions ˡFor the Fiscal Year Ended June 30
(dollars in thousands)
2019 2018 2017 2016 2015Contractually required contributions $ 15,941 $ 15,283 $ 13,215 $ 13,752 $ 13,433Contributions in relation to the contractually
required contributions 15,941 15,283 13,215 13,752 13,433Contribution deficiency/(excess) $ — $ — $ — $ — $ —
ˡ Schedules are intended to present information for 10 years. Additional years will be displayed as they become available.
Notes to Required Supplementary InformationFor the Year Ended June 30, 2019
Method and assumptions used in calculations of contractually determined contributions: The contractuallydetermined contribution rates are set forth by the Legislature and are contained within the Montana Code Annotated(MCA). The amounts used for the valuation as of the year ended June 30, 2018, are as follows:
The State contributes 29.37% of member compensation on behalf of all employer entities per Section 19-9-702,MCA.
Changes of assumptions: No changes in assumptions or other inputs that affected the measurement date have beenmade since the prior measurement date.
A-190

Required Supplementary InformationState of Montana as an Employer Entity
Firefighters’ Unified Retirement SystemSchedule of Proportionate Share of the Net Pension Liability ˡ
For the Year Ended June 30 (dollars in thousands)
2019 2018 2017 2016 2015Employer’s proportion of the net pension liability 2.300917% 2.233929% 2.261523% 2.399255% 1.850026%Employer’s proportionate share of the net pension
liability $ 2,650 $ 2,525 $ 2,583 $ 2,454 $ 1,806Employer’s covered payroll $ 1,103 $ 1,022 $ 974 $ 986 $ 735Employer ’s proportionate share of the net pension
liability as a percentage of its covered payroll 240.25% 247.06% 265.20% 249.00% 245.00%Plan fiduciary net position as a percentage of the
total pension liability 79.03% 78.00% 75.00% 77.00% 77.00%
Schedule of Employer Contributions ˡFor the Fiscal Year Ended June 30
(dollars in thousands)
2019 2018 2017 2016 2015Contractually required contributions $ 494 $ 518 $ 472 $ 475 $ 142Contributions in relation to the contractually
required contributions 494 518 472 475 142Contribution deficiency/(excess) $ — $ — $ — $ — $ —
Covered payroll $ 1,051 $ 1,103 $ 1,022 $ 974 $ 986Contributions as a percentage of covered payroll 47.00% 46.96% 46.18% 49.00% 14.40%
ˡ Schedules are intended to present information for 10 years. Additional years will be displayed as they become available.
Notes to Required Supplementary InformationFor the Year Ended June 30, 2019
Method and assumptions used in calculations of contractually determined contributions: The contractually requiredcontribution rates are determined on an annual basis for the fiscal year beginning July 1, 2018, determined as of June30, 2018. The following actuarial methods and assumptions were used to determine contractual contribution ratesreported in that schedule:
Actuarial cost method Entry age NormalAmortization method Level percentage of payroll, openAsset valuation method 4-year smoothed marketWage inflation 3.50%, including inflationInflation 2.75%Salary increases 0% to 6.30%Investment rate of return 7.65%, including inflationMortality (healthy) RP-2000 Combined employee and annuitant mortality table projected
to 2020 using scale BB, males set back 1 yearMortality (disabled) RP-2000 Combined employee and annuitant mortality tableAdmin as a % of payroll 0.23%
Changes of assumptions: No changes in assumptions or other inputs that affected the measurement date have beenmade since the prior measurement date.
A-191

Required Supplementary InformationState of Montana as a Nonemployer Contributing Entity
Firefighters’ Unified Retirement SystemSchedule of Proportionate Share of the Net Pension Liability ˡ
For the Year Ended June 30(dollars in thousands)
2019 2018 2017 2016 2015Nonemployer’s proportion of the net pension
liability 67.972164% 67.876338% 67.809541% 67.358196% 68.005182%Nonemployer’s proportionate share of the net
pension liability $ 78,285 $ 76,724 $ 77,448 $ 68,892 $ 66,384Plan fiduciary net position as a percentage of the
total pension liability 79.03% 78.00% 75.00% 77.00% 77.00%
Schedule of Nonemployer Contributions ˡFor the Fiscal Year Ended June 30
(dollars in thousands)
2019 2018 2017 2016 2015Contractually required contributions $ 16,209 $ 15,272 $ 14,042 $ 13,635 $ 13,573Contributions in relation to the contractually
required contributions 16,209 15,272 14,042 13,635 13,573Contribution deficiency/(excess) $ — $ — $ — $ — $ —
ˡ Schedules are intended to present information for 10 years. Additional years will be displayed as they become available.
Notes to Required Supplementary InformationFor the Year Ended June 30, 2019
Method and assumptions used in calculations of statutorily determined contributions: The statutorily determinedcontribution rates are set forth by the Legislature and are contained within the Montana Code Annotated (MCA). Theamounts used for the valuation as of the year ended June 30, 2018, are as follows:
The State contributes 32.61% of member compensation on behalf of all employer entities per Section19-13-604, MCA.
Changes of assumptions: No changes in assumptions or other inputs that affected the measurement date have beenmade since the prior measurement date.
A-192

Required Supplementary InformationState of Montana as a Nonemployer Contributing Entity
Volunteer Firefighters’ Compensation ActSchedule of Proportionate Share of the Net Pension Liability ˡ
For the Year Ended June 30(dollars in thousands)
2019 2018 2017 2016 2015Nonemployer’s proportion of the net pension liability 100% 100% 100% 100% 100%Nonemployer’s proportionate share of the net
pension liability $ 7,667 $ 10,087 $ 10,599 $ 10,504 $ 5,089Plan fiduciary net position as a percentage of the
total pension liability 83.48% 78.00% 76.00% 76.00% 87.00%
Schedule of Nonemployer Contributions ˡFor the Fiscal Year Ended June 30
(dollars in thousands)
2019 2018 2017 2016 2015Contractually required contributions $ 2,361 $ 2,207 $ 2,054 $ 2,024 $ 1,913Contributions in relation to the contractually
required contributions 2,361 2,207 2,054 2,024 1,913Contribution deficiency/(excess) $ — $ — $ — $ — $ —
ˡ Schedules are intended to present information for 10 years. Additional years will be displayed as they become available.
Notes to Required Supplementary InformationFor the Year Ended June 30, 2019
Method and assumptions used in calculations of actuarially determined contributions: The statutorily determinedcontribution rates are set forth by the Legislature and are contained within the Montana Code Annotated (MCA). Theamounts used for the valuation as of the year ended June 30, 2018, are as follows:
The State contributes 5% of certain fire tax insurance premiums paid per Section 19-17-301, MCA.
Changes of assumptions: No changes in assumptions or other inputs that affected the measurement date have beenmade since the prior measurement date.
A-193

Required Supplementary InformationState of Montana as an Employer Entity
Teachers’ Retirement SystemSchedule of Proportionate Share of the Net Pension Liability ˡ
For the Year Ended June 30(dollars in thousands)
2019 2018 2017 2016 2015Employer’s proportion of the net pension liability 2.554088% 2.860298% 3.121008% 3.422388% 4.689747%Employer’s proportionate share of the net pension
liability $ 47,407 $ 48,227 $ 57,016 $ 56,230 $ 72,168Employer’s covered payroll $ 24,275 $ 26,944 $ 28,915 $ 31,252 $ 32,937Employer ’s proportionate share of the net pension
liability as a percentage of its covered payroll 195.29% 178.99% 197.18% 179.00% 219.00%Plan fiduciary net position as a percentage of the
total pension liability 69.09% 70.00% 67.00% 69.00% 70.00%
Schedule of Employer Contributions ˡFor the Fiscal Year Ended June 30
(dollars in thousands)
2019 2018 2017 2016 2015Contractually required contributions $ 16,538 $ 17,298 $ 17,396 $ 16,946 $ 16,234Contributions in relation to the contractually
required contributions 16,538 17,298 17,396 16,946 16,234Contribution deficiency/(excess) $ — $ — $ — $ — $ —
Covered payroll $ 23,250 $ 24,275 $ 26,944 $ 28,915 $ 31,252
Contributions as a percentage of covered payroll 71.13% 71.26% 64.56% 58.00% 52.00%
ˡ Schedules are intended to present information for 10 years. Additional years will be displayed as they become available.
Notes to Required Supplementary InformationFor the Year Ended June 30, 2019
Changes of assumptions: As a result of the recent actuarial experience study, dated May 3, 2018, since reporting year2019, assumptions about mortality, inflation, wage growth, investment return, salary increase, retirement rates,termination rates, and investment expenses were adjusted to more closely match actual experience and benefit statutes.
Method and assumptions used in calculations of actuarially determined contributions: The actuarially determinedcontribution rates are determined on an annual basis for the fiscal year beginning July 1, 2018, determined as of June30, 2018.
The following actuarial methods and assumptions were used to determine actuarial contribution rates reported in thatschedule:
Actuarial cost method Entry ageAmortization method Level percentage of pay, openRemaining amortization period 22 yearsAsset valuation method 4-year smoothed marketWage inflation 3.25%, including inflationInflation 2.50%Salary increase 3.25% to 7.76%, including inflation for non-University Members and
4.25% for University MembersInvestment rate of return 7.50%, net of pension plan investment expense, and including inflation
A-194

Required Supplementary InformationState of Montana as a Nonemployer Contributing Entity
Teachers’ Retirement SystemSchedule of Proportionate Share of the Net Pension Liability ˡ
For the Year Ended June 30(dollars in thousands)
2019 2018 2017 2016 2015Nonemployer’s proportion of the net pension
liability 37.735743% 38.133267% 38.729473% 39.384625% 38.777294%Nonemployer’s proportionate share of the net
pension liability $ 700,417 $ 642,958 $ 707,527 $ 647,092 $ 596,724Plan fiduciary net position as a percentage of the
total pension liability 69.09% 70.00% 67.00% 69.00% 70.00%
Schedule of Nonemployer Contributions ˡFor the Fiscal Year Ended June 30
(dollars in thousands)
2019 2018 2017 2016 2015Contractually required contributions $ 44,333 $ 43,718 $ 43,028 $ 42,400 $ 42,806Contributions in relation to the contractually
required contributions 44,333 43,718 43,028 42,400 42,806Contribution deficiency/(excess) $ — $ — $ — $ — $ —
ˡ Schedules are intended to present information for 10 years. Additional years will be displayed as they become available.
Notes to Required Supplementary InformationFor the Year Ended June 30, 2019
Method and assumptions used in calculations of contractually determined contributions: The contractually requiredcontribution rates are set forth by the Legislature and are contained within the Montana Code Annotated (MCA). Theamounts used for the valuation as of the year ended June 30, 2018, are as follows:
The State contributes 0.11% of the compensation of members participating per Section 19-20-604, MCA.
The State contributes 2.38% of member compensation on behalf of school district and community collegeentities per Section 19-20-607, MCA.
The State contributes a $25 million payment from the General Fund per Section 19-20-607, MCA.
Changes of assumptions: As a result of the recent actuarial experience study, dated May 3, 2018, since reporting year2019, assumptions about mortality, inflation, wage growth, investment return, salary increase, retirement rates,termination rates, and investment expenses were adjusted to more closely match actual experience and benefit statutes.
A-195

REQUIRED SUPPLEMENTARY INFORMATION
NOTE RSI – 3. OTHER POSTEMPLOYMENT BENEFITS PLAN INFORMATION (OPEB)
The State of Montana and MUS OPEB plans allow retirees to participate, as a group, at a rate that does not cover allof the related costs. This results in the reporting of the Total OPEB Liability in the related financial statements and notedisclosures.
In accordance with GASB 75, the following information is presented to reflect the funding progress of the OtherPostemployment Benefits Plans for the State of Montana OPEB plan.
Total OPEB Liability and Related RatiosLast 10 Fiscal Years (1)
(in thousands)TotalOPEB
Liability 2019 2018
Service cost $ 2,062 $ 1,889Interest 1,990 2,014Difference betweenexpected and actualexperience
— (4,723)
Changes of assumptions orother inputs
2,895 (295)
Benefit payments (1,709) 1,705Net change in TotalOPEB Liability
5,238 590
Total OPEB Liability -Beginning 50,459 49,869
Total OPEB Liability -Ending $ 55,697 $ 50,459
State and discretelypresented component units'proportion of the collectiveTotal OPEB Liability 100% 100%
Covered employee payroll $ 702,688 $ 675,661
Total OPEB Liability as apercentage of coveredemployee payroll
7.93% 7.47%
(1) Schedules are intended to present information for 10 years. Additional years will be displayed as they become available.
Note to Schedule: No assets are accumulated in a trust that meets the criteria of GASB 75.
Factors that significantly affect trends in the amounts reported:
Changes of benefit terms, No changes in assumptions or other inputs that affected the measurement date have beenmade since the prior measurement date.
A-196

In accordance with GASB 75, the following information is presented to reflect the funding progress of the OtherPostemployment Benefits Plans for MUS plan.
Total OPEB Liability and Related RatiosLast 10 Fiscal Years (1)
(in thousands)TotalOPEB
Liability 2019 2018
Service cost $ 1,952 $ 1,954Interest 1,495 1,410Difference between expectedand actual experience
— (1,323)
Changes of assumptions orother inputs
1,351 (182)
Benefit payments (888) (679)Net change in Total OPEBLiability
3,910 1,180
Total OPEB Liability -Beginning
35,438 34,258
Total OPEB Liability -Ending $ 39,348 $ 35,438
State and discretelypresented component units'proportion of the collectiveTotal OPEB Liability 95.59% 95.62%
Covered employee payroll (2) $ 451,613 $ 434,243
Total OPEB Liability as apercentage of coveredemployee payroll
9.11% 8.53%
(1) Schedules are intended to present information for 10 years. Additional years will be displayed as they become available.(2) Amount reported is for the whole MUS plan, Community Colleges are included due to lack of ability to separate covered employee payroll.
Note to Schedule: No assets are accumulated in a trust that meets the criteria of GASB 75.
Factors that significantly affect trends in the amounts reported:
Changes of benefit terms, No changes in assumptions or other inputs that affected the measurement date have beenmade since the prior measurement date.
A-197

REQUIRED SUPPLEMENTARY INFORMATION
NOTE RSI – 4. RISK MANAGEMENT TREND INFORMATION
The following tables present risk management trend information for the Hail Insurance Fund and the MUS GroupBenefits Fund. The Hail Insurance Fund pays claims within a calendar year cycle that parallels the growing seasonfrom spring planting to fall harvesting; therefore, it has no development cycle. The MUS Group Benefits Fund has athree to five-year development cycle.
The tables illustrate how the earned revenues (net of reinsurance) of the funds and their investment income compareto related costs of loss (net of loss assumed by reinsurers) and other expenses assumed by the funds as of the end ofthe fiscal year (in thousands). Section 3 shows the funds’ incurred claims and allocated claim adjustment expense (bothpaid and accrued) as originally reported at the end of the first year in which the event that triggered coverage under thecontract occurred. Section 4 shows the cumulative amounts paid as of the end of successive years for each policy year.Section 6 shows how each policy year's incurred claims increased or decreased as of the end of successive years. Thisannual re-estimation results from new information received on known claims, reevaluation of existing information onknown claims, as well as emergence of new claims not previously known. Section 7 compares the latest re-estimatedincurred claims amount to the amount originally established (Section 3) and shows whether this latest estimate of claimscost is greater or less than originally thought. As data for individual policy years mature, the correlation between originalestimates and re-estimated amounts is commonly used to evaluate the accuracy of incurred claims currently recognizedin less mature policy years. This table will be revised as data for successive policy years develops.
A-198

Stat
e of M
onta
na H
ail In
sura
nce P
rogr
amCl
aims D
evelo
pmen
t Inf
orm
atio
n20
1920
1820
1720
1620
1520
1420
1320
1220
1120
101.
Prem
ium
s and
inve
stm
ent r
even
ue E
arne
d$
4,836
$4,3
20$
5,918
$7,4
46$
8,309
$8,0
29$
7,101
$7,0
34$
6,710
$6,8
66 C
eded
3,605
3,255
4,771
6,346
2,049
——
——
— N
et ea
rned
1,231
1,065
1,147
1,100
6,260
8,029
7,101
7,034
6,710
6,866
2. Un
alloc
ated
expe
nses
inclu
ding
over
head
$41
2$
448
$45
5$
424
$1,1
24$
1,033
$3,5
62$
2,308
$1,5
45$
2,637
3. Es
timat
ed lo
sses
and
expe
nses
end
ofac
ciden
t yea
r$
422
$12
0$
819
$32
4$
6,660
$13
,511
$2,2
21$
4,608
$6,3
09$
3,961
4. Ne
t paid
(cum
ulat
ive) a
s of:
End
of po
licy y
ear
$40
5$
85$
817
$18
9$
6,643
$13
,285
$1,8
81$
3,857
$6,1
44$
3,723
One
year
later
——
——
——
Two
year
s late
r—
——
——
Thr
ee ye
ars l
ater
——
——
Fou
r yea
rs lat
er—
——
Five
year
s late
r—
— S
ix ye
ars l
ater
— S
even
year
s late
r E
ight y
ears
later
Nine
year
s late
r5.
Re-e
stim
ated
cede
d lo
sses
and
expe
nses
$—
$—
$—
$—
$—
$—
$—
$—
$—
$—
6. Re
-est
imat
ed n
et in
curre
d lo
sses
and
expe
nse:
End
of po
licy y
ear
$42
2$
120
$81
9$
324
$6,6
60$
13,51
1$
2,221
$4,6
08$
6,309
$3,9
61 O
ne ye
ar la
ter—
——
——
— T
wo ye
ars l
ater
——
——
— T
hree
year
s late
r—
——
— F
our y
ears
later
——
— F
ive ye
ars l
ater
——
Six
year
s late
r—
Sev
en ye
ars l
ater
Eigh
t yea
rs lat
er N
ine ye
ars l
ater
7. In
crea
se (d
ecre
ase)
in es
timat
ed n
etin
curre
d lo
sses
and
expe
nses
from
end
of p
olicy
year
$—
$—
$—
$—
$—
$—
$—
$—
$—
$—
A-199

Mont
ana U
nive
rsity
Sys
tem
– Me
dica
l, Den
tal, V
ision
, Rx C
laim
sCl
aims D
evelo
pmen
t Inf
orm
atio
n20
1920
1820
1720
1620
1520
1420
1320
1220
1120
101.
Prem
ium
s and
inve
stm
ent R
even
ue$
98,88
5$
99,36
9$
100,6
93$
84,29
7$
80,76
4$
79,25
7$
76,50
5$
75,91
1$
73,07
8$
62,85
1
2. Un
alloc
ated
expe
nses
inclu
ding
over
head
$5,1
50$
5,111
$5,1
96$
5,129
$5,1
98$
4,787
$3,9
38$
4,063
$4,6
63$
3,629
3. Es
timat
ed lo
sses
and
expe
nses
end
ofac
ciden
t yea
r$
93,39
2$
90,42
7$
85,80
2$
87,23
3$
87,35
3$
71,87
7$
69,32
5$
64,33
1$
64,91
9$
65,57
5
4. Ne
t paid
(cum
ulat
ive) a
s of:
End
of po
licy y
ear
$82
,055
$80
,393
$75
,601
$76
,400
$79
,388
$63
,317
$61
,964
$56
,981
$57
,018
$58
,989
One
year
later
$89
,050
$84
,575
85,79
688
,943
69,07
367
,988
62,93
763
,495
66,99
1 T
wo ye
ars l
ater
$84
,729
85,89
489
,261
69,07
468
,024
62,96
863
,538
67,02
2 T
hree
year
s late
r86
,002
89,26
469
,076
68,02
462
,974
63,53
967
,041
Fou
r yea
rs lat
er89
,271
69,07
668
,024
62,97
463
,539
67,04
1 F
ive ye
ars l
ater
69,07
668
,024
62,97
463
,539
67,04
2 S
ix ye
ars l
ater
68,02
462
,974
63,53
967
,042
Sev
en ye
ars l
ater
62,97
463
,539
67,04
2 E
ight y
ears
later
63,53
967
,042
Nine
year
s late
r67
,042
5. Re
-est
imat
ed ce
ded
loss
es an
dex
pens
es$
—$
—$
—$
—$
—$
—$
—$
—$
—$
—
6. Re
-est
imat
ed n
et in
curre
d lo
sses
and
expe
nse:
End
of po
licy y
ear
$93
,392
$90
,427
$85
,802
$87
,233
$87
,353
$71
,877
$69
,325
$64
,331
$64
,919
$65
,575
One
year
later
89,03
684
,567
86,14
888
,824
71,70
068
,349
63,44
663
,941
67,00
6 T
wo ye
ars l
ater
84,72
985
,894
89,26
169
,074
68,02
462
,968
63,53
867
,022
Thr
ee ye
ars l
ater
86,00
289
,264
69,07
668
,024
62,97
463
,539
67,04
1 F
our y
ears
later
89,27
169
,076
68,02
462
,974
63,53
967
,041
Five
year
s late
r69
,076
68,02
462
,974
63,53
967
,042
Six
year
s late
r68
,024
62,97
463
,539
67,04
2 S
even
year
s late
r62
,974
63,53
967
,042
Eigh
t yea
rs lat
er63
,539
67,04
2 N
ine ye
ars l
ater
67,04
2
7. In
crea
se (d
ecre
ase)
in es
timat
ed n
etin
curre
d lo
sses
and
expe
nses
from
end
of p
olicy
year
$—
$(1
,391)
$(1
,073)
$(1
,231)
$1,9
12$
(2,80
0)$
(1,30
2)$
(1,35
7)$
(1,38
0)$
1,467
A-200

Stat
e of
Mon
tana
Sche
dule
of E
xpen
ditu
res o
f Fed
eral
Aw
ards
For t
he Fi
scal
Yea
r End
ed Ju
ne 3
0, 2
019
Amou
nt to
Sub
recip
ient
sEx
pend
iture
sCO
RPOR
ATIO
N FO
R NA
TION
AL &
COM
MUN
ITY
SERV
ICE
94.0
03St
ate
Com
miss
ions
$260
,602
94.0
06Am
eriC
orps
$3,3
64,1
11$3
,586
,411
94.0
09Tr
aini
ng a
nd T
echn
ical A
ssist
ance
$197
,031
94.0
13Vo
lunt
eers
in S
ervi
ce to
Am
erica
$810
,475
TOTA
L$4
,854
,519
CORP
ORAT
ION
FOR
NATI
ONAL
& C
OMM
UNIT
Y SE
RVIC
E TO
TAL
$4,8
54,5
19DE
PART
MEN
T OF
AGR
ICUL
TURE
10.0
01Ag
ricul
tura
l Res
earc
h Ba
sic a
nd A
pplie
d Re
sear
ch
Uni
vers
ity o
f Wyo
min
g
100
3948
-MSU
$2,5
1210
.025
Plan
t and
Ani
mal
Dise
ase,
Pes
t Con
trol
, and
Ani
mal
Car
e
$1
,090
,289
10.0
93Vo
lunt
ary
Publ
ic Ac
cess
and
Hab
itat I
ncen
tive
Prog
ram
$47,
902
10.1
62In
spec
tion
Grad
ing
and
Stan
dard
izatio
n
$1
5,90
610
.163
Mar
ket P
rote
ctio
n an
d Pr
omot
ion
$163
,341
10.1
70Sp
ecia
lty C
rop
Bloc
k Gr
ant P
rogr
am -
Farm
Bill
$267
,453
$1,3
81,8
2010
.310
Agric
ultu
re a
nd F
ood
Rese
arch
Initi
ativ
e (A
FRI)
$45,
414
U
nive
rsity
of I
daho
B
DK48
9-SB
-001
$8,9
4310
.433
Rura
l Hou
sing
Pres
erva
tion
Gran
ts
$3
4,71
810
.435
Stat
e M
edia
tion
Gran
ts
$1
5,32
310
.475
Coop
erat
ive
Agre
emen
ts w
ith S
tate
s for
Intr
asta
te M
eat a
nd P
oultr
y In
spec
tion
$976
,037
10.5
00Co
oper
ativ
e Ex
tens
ion
Serv
ice
$1
1,75
0$4
50,5
43
Kan
sas S
tate
Uni
vers
ity
S19
162
$2,4
30
Kan
sas S
tate
Uni
vers
ity
S19
102
$15,
793
K
ansa
s Sta
te U
nive
rsity
S
1814
2$5
,313
K
ansa
s Sta
te U
nive
rsity
S
1711
5$6
,648
U
nive
rsity
of M
issou
ri
C00
0593
81-8
$6,1
4410
.536
CACF
P Tr
aini
ng G
rant
s
$369
10.5
41Ch
ild N
utrit
ion-
Tech
nolo
gy In
nova
tion
Gran
t
$559
,821
10.5
57W
IC S
pecia
l Sup
plem
enta
l Nut
ritio
n Pr
ogra
m fo
r Wom
en, I
nfan
ts, a
nd C
hild
ren
$4,2
62,9
92$1
2,58
8,19
710
.558
Child
and
Adu
lt Ca
re F
ood
Prog
ram
$617
,011
$12,
022,
689
10.5
60St
ate
Adm
inist
rativ
e Ex
pens
es fo
r Chi
ld N
utrit
ion
$880
,475
10.5
67Fo
od D
istrib
utio
n Pr
ogra
m o
n In
dian
Res
erva
tions
$2,1
75,8
42$9
,439
,743
10.5
72W
IC F
arm
ers'
Mar
ket N
utrit
ion
Prog
ram
(FM
NP)
$4
9,38
0
The
acco
mpa
nyin
g no
tes a
re a
n in
tegr
al p
art o
f thi
s sch
edul
e.
A-201

Stat
e of
Mon
tana
Sche
dule
of E
xpen
ditu
res o
f Fed
eral
Aw
ards
For t
he Fi
scal
Yea
r End
ed Ju
ne 3
0, 2
019
Amou
nt to
Sub
recip
ient
sEx
pend
iture
s10
.574
Team
Nut
ritio
n Gr
ants
$386
,036
10.5
75Fa
rm to
Sch
ool G
rant
Pro
gram
$23,
493
$30,
523
10.5
76Se
nior
Far
mer
s Mar
ket N
utrit
ion
Prog
ram
$81,
086
$82,
124
10.5
78W
IC G
rant
s To
Stat
es (W
GS)
$9
6,04
510
.579
Child
Nut
ritio
n Di
scre
tiona
ry G
rant
s Lim
ited
Avai
labi
lity
$50,
604
$200
,940
10.5
82Fr
esh
Frui
t and
Veg
etab
le P
rogr
am
$1
,731
,654
$1,8
27,2
3110
.601
Mar
ket A
cces
s Pro
gram
U
.S. L
ives
tock
Gen
etics
Exp
ort,
Inc.
M
T DO
A 20
18$1
5,69
910
.605
Qua
lity
Sam
ples
Pro
gram
$299
10.6
52Fo
rest
ry R
esea
rch
$450
,657
N
atio
nal W
ilder
ness
Ste
war
dshi
p Al
lianc
e
WI2
018
$17,
834
10.6
64Co
oper
ativ
e Fo
rest
ry A
ssist
ance
$2,8
12,7
81$5
,046
,320
A
mer
ican
Fore
st F
ound
atio
n
AFF
-FS-
15-0
39 S
UBAW
ARD
15-D
G-11
1325
44-0
39 G
CSI
$6,9
16
Gal
latin
Cou
nty
2
018-
579
$14,
215
G
alla
tin C
ount
y
201
8-57
8$2
9,14
110
.669
Coop
erat
ive
Land
scap
e Co
nser
vatio
n
$5
,000
10.6
74W
ood
Utili
zatio
n As
sista
nce
$38,
950
$100
,573
10.6
76Fo
rest
Lega
cy P
rogr
am
$4
,002
,636
10.6
78Fo
rest
Ste
war
dshi
p Pr
ogra
m
$4
1,24
4$4
1,24
410
.680
Fore
st H
ealth
Pro
tect
ion
$2,9
5610
.683
Natio
nal F
ish a
nd W
ildlif
e Fo
unda
tion
$27,
391
10.6
91Go
od N
eigh
bor A
utho
rity
$229
,360
10.6
99Pa
rtne
rshi
p Ag
reem
ents
$95,
634
10.9
02So
il an
d W
ater
Con
serv
atio
n
$4
8,49
3$1
16,2
0910
.912
Envi
ronm
enta
l Qua
lity
Ince
ntiv
es P
rogr
am
$3
2,53
610
.924
Cons
erva
tion
Stew
ards
hip
Prog
ram
$9,6
9410
.931
Agric
ultu
ral C
onse
rvat
ion
Ease
men
t Pro
gram
$1,9
79,7
1910
.UXX
Misc
ella
neou
s Non
-Maj
or G
rant
s
$250
,691
TOTA
L$5
4,90
7,37
3 Ch
ild N
utrit
ion
Clus
ter
10.5
53Sc
hool
Bre
akfa
st P
rogr
am
$1
0,60
7,56
2$1
0,60
7,56
210
.555
Natio
nal S
choo
l Lun
ch P
rogr
am
$2
8,59
7,67
2$3
2,14
1,17
710
.556
Spec
ial M
ilk P
rogr
am fo
r Chi
ldre
n
$6
,572
$6,5
7210
.559
Sum
mer
Foo
d Se
rvice
Pro
gram
for C
hild
ren
$2,3
18,3
43$2
,680
,999
TOTA
L$4
5,43
6,31
0
The
acco
mpa
nyin
g no
tes a
re a
n in
tegr
al p
art o
f thi
s sch
edul
e.
A-202
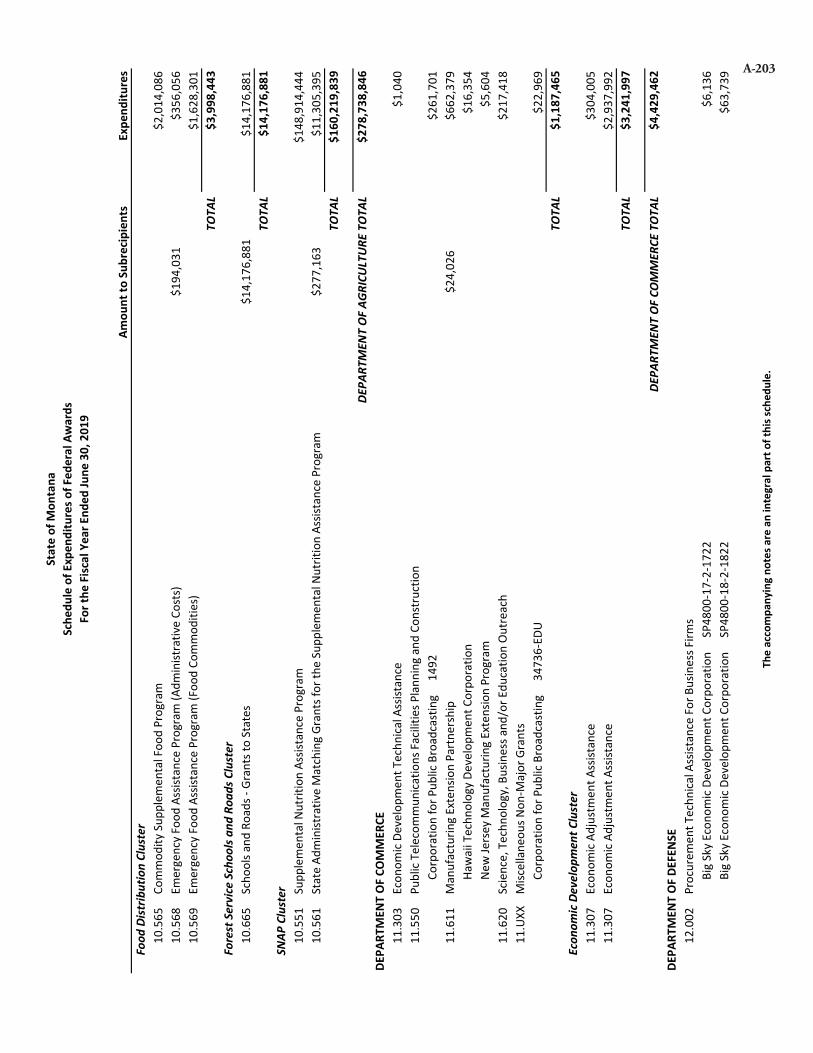
Stat
e of
Mon
tana
Sche
dule
of E
xpen
ditu
res o
f Fed
eral
Aw
ards
For t
he Fi
scal
Yea
r End
ed Ju
ne 3
0, 2
019
Amou
nt to
Sub
recip
ient
sEx
pend
iture
sFo
od D
istrib
utio
n Cl
uste
r10
.565
Com
mod
ity S
uppl
emen
tal F
ood
Prog
ram
$2,0
14,0
8610
.568
Emer
genc
y Fo
od A
ssist
ance
Pro
gram
(Adm
inist
rativ
e Co
sts)
$194
,031
$356
,056
10.5
69Em
erge
ncy
Food
Ass
istan
ce P
rogr
am (F
ood
Com
mod
ities
)
$1,6
28,3
01TO
TAL
$3,9
98,4
43Fo
rest
Ser
vice
Sch
ools
and
Road
s Clu
ster
10.6
65Sc
hool
s and
Roa
ds -
Gran
ts to
Sta
tes
$1
4,17
6,88
1$1
4,17
6,88
1TO
TAL
$14,
176,
881
SNAP
Clu
ster
10.5
51Su
pple
men
tal N
utrit
ion
Assis
tanc
e Pr
ogra
m
$1
48,9
14,4
4410
.561
Stat
e Ad
min
istra
tive
Mat
chin
g Gr
ants
for t
he S
uppl
emen
tal N
utrit
ion
Assis
tanc
e Pr
ogra
m
$2
77,1
63$1
1,30
5,39
5TO
TAL
$160
,219
,839
DEPA
RTM
ENT
OF A
GRIC
ULTU
RE T
OTAL
$278
,738
,846
DEPA
RTM
ENT
OF C
OMM
ERCE
11.3
03Ec
onom
ic De
velo
pmen
t Tec
hnica
l Ass
istan
ce
$1
,040
11.5
50Pu
blic
Tele
com
mun
icatio
ns F
acili
ties P
lann
ing
and
Cons
truc
tion
C
orpo
ratio
n fo
r Pub
lic B
road
cast
ing
1
492
$261
,701
11.6
11M
anuf
actu
ring
Exte
nsio
n Pa
rtne
rshi
p
$2
4,02
6$6
62,3
79
Haw
aii T
echn
olog
y De
velo
pmen
t Cor
pora
tion
$16,
354
N
ew Je
rsey
Man
ufac
turin
g Ex
tens
ion
Prog
ram
$5,6
0411
.620
Scie
nce,
Tec
hnol
ogy,
Bus
ines
s and
/or E
duca
tion
Outr
each
$217
,418
11.U
XXM
iscel
lane
ous N
on-M
ajor
Gra
nts
Cor
pora
tion
for P
ublic
Bro
adca
stin
g
347
36-E
DU$2
2,96
9TO
TAL
$1,1
87,4
65Ec
onom
ic De
velo
pmen
t Clu
ster
11.3
07Ec
onom
ic Ad
just
men
t Ass
istan
ce
$3
04,0
0511
.307
Econ
omic
Adju
stm
ent A
ssist
ance
$2,9
37,9
92TO
TAL
$3,2
41,9
97
DEPA
RTM
ENT
OF C
OMM
ERCE
TOT
AL$4
,429
,462
DEPA
RTM
ENT
OF D
EFEN
SE12
.002
Proc
urem
ent T
echn
ical A
ssist
ance
For
Bus
ines
s Firm
s
B
ig S
ky E
cono
mic
Deve
lopm
ent C
orpo
ratio
n
SP4
800-
17-2
-172
2$6
,136
B
ig S
ky E
cono
mic
Deve
lopm
ent C
orpo
ratio
n
SP4
800-
18-2
-182
2$6
3,73
9
The
acco
mpa
nyin
g no
tes a
re a
n in
tegr
al p
art o
f thi
s sch
edul
e.
A-203

Stat
e of
Mon
tana
Sche
dule
of E
xpen
ditu
res o
f Fed
eral
Aw
ards
For t
he Fi
scal
Yea
r End
ed Ju
ne 3
0, 2
019
Amou
nt to
Sub
recip
ient
sEx
pend
iture
s12
.112
Paym
ents
to S
tate
s in
Lieu
of R
eal E
stat
e Ta
xes
$4
,563
12.3
57RO
TC La
ngua
ge a
nd C
ultu
re T
rain
ing
Gran
ts
Ins
titut
e of
Inte
rnat
iona
l Edu
catio
n
260
6-UM
T-G-
5-GO
-051
-PO7
$96,
009
I
nstit
ute
of In
tern
atio
nal E
duca
tion
P
GO18
01-U
MT-
16-P
GO-0
51-P
O2$1
45,3
0212
.400
Mili
tary
Con
stru
ctio
n, N
atio
nal G
uard
$655
,308
12.4
01Na
tiona
l Gua
rd M
ilita
ry O
pera
tions
and
Mai
nten
ance
(O&
M) P
roje
cts
$2
3,91
5,37
112
.404
Natio
nal G
uard
Cha
lleNG
e Pr
ogra
m
$4
,386
,420
12.5
79La
ngua
ge T
rain
ing
Cent
er
Ins
titut
e of
Inte
rnat
iona
l Edu
catio
n
PGO
1801
-UM
T-16
-LTC
-052
-PO3
$148
,421
I
nstit
ute
of In
tern
atio
nal E
duca
tion
P
G018
01-U
MT-
16$1
,595
,145
I
nstit
ute
of In
tern
atio
nal E
duca
tion
2
603-
UMT-
5-LT
C-05
2-PO
8$6
29,5
7512
.620
Troo
ps to
Tea
cher
s Gra
nt P
rogr
am
$4
29,1
5912
.UXX
Misc
ella
neou
s Non
-Maj
or G
rant
s
$113
,560
$1,4
96,6
39
Bat
telle
Mem
oria
l Ins
titut
e
US0
01-0
0059
0859
$18,
100
P
acifi
c Sta
tes M
arin
e Fi
sher
ies C
omm
issio
n
19-
102P
$61,
112
P
acifi
c Sta
tes M
arin
e Fi
sher
ies C
omm
issio
n
18-
128P
$192
,703
P
acifi
c Sta
tes M
arin
e Fi
sher
ies C
omm
issio
n
18-
93P
$1,1
08,7
90
Pac
ific S
tate
s Mar
ine
Fish
erie
s Com
miss
ion
1
9-85
P$8
12,9
54TO
TAL
$35,
765,
446
DEPA
RTM
ENT
OF D
EFEN
SE T
OTAL
$35,
765,
446
DEPA
RTM
ENT
OF E
DUCA
TION
84.0
02Ad
ult E
duca
tion
- Bas
ic Gr
ants
to S
tate
s
$1,0
78,8
22$1
,335
,438
84.0
10Ti
tle I
Gran
ts to
Loca
l Edu
catio
nal A
genc
ies
$4
5,13
4,32
7$4
6,40
7,67
784
.011
Mig
rant
Edu
catio
n St
ate
Gran
t Pro
gram
$1,2
25,5
00$1
,400
,817
84.0
13Ti
tle I
Stat
e Ag
ency
Pro
gram
for N
egle
cted
and
Del
inqu
ent C
hild
ren
and
Yout
h
$2
63,4
7284
.031
High
er E
duca
tion
Inst
itutio
nal A
id
$4
07,8
5384
.048
Care
er a
nd T
echn
ical E
duca
tion
-- Ba
sic G
rant
s to
Stat
es
$5
89,3
70$5
,326
,318
84.1
26Re
habi
litat
ion
Serv
ices V
ocat
iona
l Reh
abili
tatio
n Gr
ants
to S
tate
s
$8,1
34,8
3584
.177
Reha
bilit
atio
n Se
rvice
s Ind
epen
dent
Livi
ng S
ervi
ces f
or O
lder
Indi
vidu
als W
ho a
re B
lind
$244
,793
84.1
81Sp
ecia
l Edu
catio
n-Gr
ants
for I
nfan
ts a
nd F
amili
es
$1
,928
,370
84.1
84Sc
hool
Saf
ety
Natio
nal A
ctiv
ities
$44,
584
$782
,742
84.1
87Su
ppor
ted
Empl
oym
ent S
ervi
ces f
or In
divi
dual
s with
the
Mos
t Sig
nific
ant D
isabi
litie
s
$340
,953
84.1
96Ed
ucat
ion
for H
omel
ess C
hild
ren
and
Yout
h
$1
85,1
92$2
61,3
76
The
acco
mpa
nyin
g no
tes a
re a
n in
tegr
al p
art o
f thi
s sch
edul
e.
A-204

Stat
e of
Mon
tana
Sche
dule
of E
xpen
ditu
res o
f Fed
eral
Aw
ards
For t
he Fi
scal
Yea
r End
ed Ju
ne 3
0, 2
019
Amou
nt to
Sub
recip
ient
sEx
pend
iture
s84
.287
Twen
ty-F
irst C
entu
ry C
omm
unity
Lear
ning
Cen
ters
$5,1
87,3
16$5
,515
,683
84.2
99In
dian
Edu
catio
n --
Spec
ial P
rogr
ams f
or In
dian
Chi
ldre
n
Aan
iiih
Nako
da C
olle
ge
S29
9B18
0009
$17,
278
B
lack
feet
Com
mun
ity C
olle
ge
S29
9B16
0026
$114
,824
B
lack
feet
Com
mun
ity C
olle
ge
TCT
C#2-
386-
1-15
04$6
1,47
8
Bla
ckfe
et C
omm
unity
Col
lege
T
CTC#
2-38
61-5
107
$9,5
38
For
t Pec
k Co
mm
unity
Col
lege
E
D-GR
ANTS
-061
418-
001
$6,0
0684
.323
Spec
ial E
duca
tion
- Sta
te P
erso
nnel
Dev
elop
men
t
$78,
655
$487
,331
84.3
25Sp
ecia
l Edu
catio
n - P
erso
nnel
Dev
elop
men
t to
Impr
ove
Serv
ices a
nd R
esul
ts fo
r Chi
ldre
n w
ith
Disa
bilit
ies
$2
84,8
16
84.3
26Sp
ecia
l Edu
catio
n Te
chni
cal A
ssist
ance
and
Diss
emin
atio
n to
Impr
ove
Serv
ices a
nd R
esul
ts fo
r Chi
ldre
n w
ith D
isabi
litie
s
$97,
249
H
elen
Kel
ler N
atio
nal C
ente
r
H326
T180
026
$56,
134
84.3
34Ga
inin
g Ea
rly A
war
enes
s and
Rea
dine
ss fo
r Und
ergr
adua
te P
rogr
ams
$1
,582
,140
$4,2
72,6
5984
.335
Child
Car
e Ac
cess
Mea
ns P
aren
ts in
Sch
ool
$7
,635
84.3
58Ru
ral E
duca
tion
$319
,262
$354
,959
84.3
65En
glish
Lang
uage
Acq
uisit
ion
Stat
e Gr
ants
$493
,800
$1,2
12,9
1384
.366
Mat
hem
atics
and
Scie
nce
Part
ners
hips
$195
,493
$293
,039
B
ozem
an P
ublic
Sch
ools
1
6 03
50 1
513
MSP
$5,4
9684
.367
Supp
ortin
g Ef
fect
ive
Inst
ruct
ion
Stat
e Gr
ants
$9,3
24,9
40$9
,733
,551
N
atio
nal W
ritin
g Pr
ojec
t
16-M
T03-
SEED
2017
-CRW
PAI
$16,
601
N
atio
nal W
ritin
g Pr
ojec
t
93-M
T01-
SEED
2017
-ILI
$73
84.3
69Gr
ants
for S
tate
Ass
essm
ents
and
Rel
ated
Act
iviti
es
$3
,167
,117
84.3
71Co
mpr
ehen
sive
Liter
acy
Deve
lopm
ent
$6
,977
,526
$7,5
25,8
1184
.372
Stat
ewid
e Lo
ngitu
dina
l Dat
a Sy
stem
s
$783
,705
84.3
77Sc
hool
Impr
ovem
ent G
rant
s
$570
,118
$1,1
73,3
9684
.418
Prom
otin
g Re
adin
ess o
f Min
ors i
n Su
pple
men
tal S
ecur
ity In
com
e
Sta
te o
f Uta
h
Con
trac
t REF
# 14
6214
$586
,554
U
nive
rsity
of U
tah
1
0033
712
$43,
410
84.4
19Pr
esch
ool D
evel
opm
ent G
rant
s
$6,4
16,4
96$8
,710
,375
84.4
24St
uden
t Sup
port
and
Aca
dem
ic En
richm
ent P
rogr
am
$4
,068
,521
$4,2
07,8
8984
.998
Amer
ican
Prin
ting
Hous
e fo
r the
Blin
d
$6
,562
84.U
XXM
iscel
lane
ous N
on-M
ajor
Gra
nts
$9
1,66
8TO
TAL
$115
,678
,394
The
acco
mpa
nyin
g no
tes a
re a
n in
tegr
al p
art o
f thi
s sch
edul
e.
A-205

Stat
e of
Mon
tana
Sche
dule
of E
xpen
ditu
res o
f Fed
eral
Aw
ards
For t
he Fi
scal
Yea
r End
ed Ju
ne 3
0, 2
019
Amou
nt to
Sub
recip
ient
sEx
pend
iture
sSp
ecia
l Edu
catio
n Cl
uste
r (ID
EA)
84.0
27Sp
ecia
l Edu
catio
n Gr
ants
to S
tate
s
$35,
693,
224
$39,
377,
764
M
issou
la A
rea
Educ
atio
n Co
oper
ativ
e
$6
4,20
884
.173
Spec
ial E
duca
tion
Pres
choo
l Gra
nts
$1
,192
,488
$1,1
95,4
83TO
TAL
$40,
637,
455
Stud
ent F
inan
cial A
ssist
ance
Clu
ster
84.0
07Fe
dera
l Sup
plem
enta
l Edu
catio
nal O
ppor
tuni
ty G
rant
s
$1,5
30,3
7284
.033
Fede
ral W
ork-
Stud
y Pr
ogra
m
$2
,118
,635
84.0
38Fe
dera
l Per
kins
Loan
Pro
gram
_Fed
eral
Cap
ital C
ontr
ibut
ions
$33,
380,
106
84.0
63Fe
dera
l Pel
l Gra
nt P
rogr
am
$4
4,70
6,51
784
.268
Fede
ral D
irect
Stu
dent
Loan
s
$166
,350
,722
84.3
79Te
ache
r Edu
catio
n As
sista
nce
for C
olle
ge a
nd H
ighe
r Edu
catio
n Gr
ants
(TEA
CH G
rant
s)
$7
,706
TOTA
L$2
48,0
94,0
58TR
IO C
lust
er84
.042
TRIO
Stu
dent
Sup
port
Ser
vice
s
$2,0
42,0
6684
.044
TRIO
Tal
ent S
earc
h
$1
,166
,169
84.0
47TR
IO U
pwar
d Bo
und
$1,9
23,9
3584
.217
TRIO
McN
air P
ost-B
acca
laur
eate
Ach
ieve
men
t
$68,
345
TOTA
L$5
,200
,515
DEPA
RTM
ENT
OF E
DUCA
TION
TOT
AL$4
09,6
10,4
22DE
PART
MEN
T OF
ENE
RGY
81.0
41St
ate
Ener
gy P
rogr
am
$4
04,1
6281
.042
Wea
ther
izatio
n As
sista
nce
for L
ow-In
com
e Pe
rson
s
$3,3
16,1
9281
.086
Cons
erva
tion
Rese
arch
and
Dev
elop
men
t
P
acifi
c Sta
tes M
arin
e Fi
sher
ies C
omm
issio
n
18-
50G
$32,
249
P
acifi
c Sta
tes M
arin
e Fi
sher
ies C
omm
issio
n
19-
36G
$56,
477
81.1
17En
ergy
Effi
cienc
y an
d Re
new
able
Ene
rgy
Info
rmat
ion
Diss
emin
atio
n, O
utre
ach,
Tra
inin
g an
d Te
chni
cal
Anal
ysis/
Assis
tanc
e
$5
3,33
0
81.1
38St
ate
Heat
ing
Oil a
nd P
ropa
ne P
rogr
am
$8
,707
81.U
XXM
iscel
lane
ous N
on-M
ajor
Gra
nts
$2
85,2
76TO
TAL
$4,1
56,3
93
DEPA
RTM
ENT
OF E
NERG
Y TO
TAL
$4,1
56,3
93
The
acco
mpa
nyin
g no
tes a
re a
n in
tegr
al p
art o
f thi
s sch
edul
e.
A-206

Stat
e of
Mon
tana
Sche
dule
of E
xpen
ditu
res o
f Fed
eral
Aw
ards
For t
he Fi
scal
Yea
r End
ed Ju
ne 3
0, 2
019
Amou
nt to
Sub
recip
ient
sEx
pend
iture
sDE
PART
MEN
T OF
HEA
LTH
AND
HUM
AN S
ERVI
CES
93.0
41Sp
ecia
l Pro
gram
s for
the
Agin
g, T
itle
VII,
Chap
ter 3
, Pro
gram
s for
Pre
vent
ion
of E
lder
Abu
se, N
egle
ct,
and
Expl
oita
tion
$20,
028
$27,
944
93.0
42Sp
ecia
l Pro
gram
s for
the
Agin
g, T
itle
VII,
Chap
ter 2
, Lon
g Te
rm C
are
Ombu
dsm
an S
ervi
ces f
or O
lder
In
divi
dual
s
$74,
046
$74,
046
93.0
43Sp
ecia
l Pro
gram
s for
the
Agin
g, T
itle
III, P
art D
, Dise
ase
Prev
entio
n an
d He
alth
Pro
mot
ion
Serv
ices
$1
42,5
50$1
42,5
5093
.051
Alzh
eim
er's
Dise
ase
Dem
onst
ratio
n Gr
ants
to S
tate
s
$137
,750
93.0
52Na
tiona
l Fam
ily C
areg
iver
Sup
port
, Titl
e III
, Par
t E
$9
57,5
01$1
,017
,206
93.0
70En
viro
nmen
tal P
ublic
Hea
lth a
nd E
mer
genc
y Re
spon
se
$3
0,27
2$4
24,4
9693
.071
Med
icare
Enr
ollm
ent A
ssist
ance
Pro
gram
$103
,272
$108
,703
93.0
72Lif
espa
n Re
spite
Car
e Pr
ogra
m
$1
48,6
51$1
88,8
60
93.0
74Ho
spita
l Pre
pare
dnes
s Pro
gram
(HPP
) and
Pub
lic H
ealth
Em
erge
ncy
Prep
ared
ness
(PHE
P) A
ligne
d Co
oper
ativ
e Ag
reem
ents
$3,1
46,5
28$6
,075
,883
93.0
79Co
oper
ativ
e Ag
reem
ents
to P
rom
ote
Adol
esce
nt H
ealth
thro
ugh
Scho
ol-B
ased
HIV
/STD
Pre
vent
ion
and
Scho
ol-B
ased
Sur
veill
ance
$84,
473
93.0
90Gu
ardi
ansh
ip A
ssist
ance
$1,8
92,2
2393
.092
Affo
rdab
le C
are
Act (
ACA)
Per
sona
l Res
pons
ibili
ty E
duca
tion
Prog
ram
$127
,755
$231
,868
93.1
03Fo
od a
nd D
rug
Adm
inist
ratio
n Re
sear
ch
$2
47,5
94
93.1
04Co
mpr
ehen
sive
Com
mun
ity M
enta
l Hea
lth S
ervi
ces f
or C
hild
ren
with
Ser
ious
Em
otio
nal D
istur
banc
es
(SED
)
$1,0
75,4
03
93.1
10M
ater
nal a
nd C
hild
Hea
lth F
eder
al C
onso
lidat
ed P
rogr
ams
$5
6,84
8$3
97,4
3393
.116
Proj
ect G
rant
s and
Coo
pera
tive
Agre
emen
ts fo
r Tub
ercu
losis
Con
trol
Pro
gram
s
$191
,960
93.1
27Em
erge
ncy
Med
ical S
ervi
ces f
or C
hild
ren
$407
,999
93.1
30Co
oper
ativ
e Ag
reem
ents
to S
tate
s/Te
rrito
ries f
or th
e Co
ordi
natio
n an
d De
velo
pmen
t of P
rimar
y Ca
re
Offic
es
$1
5,43
3$1
47,1
21
93.1
36In
jury
Pre
vent
ion
and
Cont
rol R
esea
rch
and
Stat
e an
d Co
mm
unity
Bas
ed P
rogr
ams
$7
56,1
2593
.150
Proj
ects
for A
ssist
ance
in T
rans
ition
from
Hom
eles
snes
s (PA
TH)
$2
90,6
83$3
01,3
5493
.155
Rura
l Hea
lth R
esea
rch
Cent
ers
Nat
iona
l Rur
al H
ealth
Ass
ocia
tion
2
017
SRHA
TEC
HNIC
AL A
SSIS
TANC
E$3
,165
93.1
57Ce
nter
s of E
xcel
lenc
e
$1
,059
93.1
65Gr
ants
to S
tate
s for
Loan
Rep
aym
ent P
rogr
am
$1
52,1
14$1
52,1
1493
.184
Disa
bilit
ies P
reve
ntio
n
$1
00,0
00$3
41,7
7793
.217
Fam
ily P
lann
ing
Serv
ices
$1
,633
,858
$2,3
11,8
9293
.235
Title
V S
tate
Sex
ual R
isk A
void
ance
Edu
catio
n (T
itle
V St
ate
SRAE
) Pro
gram
$61,
990
93.2
36Gr
ants
to S
tate
s to
Supp
ort O
ral H
ealth
Wor
kfor
ce A
ctiv
ities
$144
,106
$281
,824
The
acco
mpa
nyin
g no
tes a
re a
n in
tegr
al p
art o
f thi
s sch
edul
e.
A-207

Stat
e of
Mon
tana
Sche
dule
of E
xpen
ditu
res o
f Fed
eral
Aw
ards
For t
he Fi
scal
Yea
r End
ed Ju
ne 3
0, 2
019
Amou
nt to
Sub
recip
ient
sEx
pend
iture
s93
.240
Stat
e Ca
pacit
y Bu
ildin
g
$2
80,5
0293
.241
Stat
e Ru
ral H
ospi
tal F
lexib
ility
Pro
gram
$859
,278
$967
,243
93.2
43Su
bsta
nce
Abus
e an
d M
enta
l Hea
lth S
ervi
ces P
roje
cts o
f Reg
iona
l and
Nat
iona
l Sig
nific
ance
$3,6
60,9
90$6
,044
,053
93.2
51Un
iver
sal N
ewbo
rn H
earin
g Sc
reen
ing
$313
,208
93.2
62Oc
cupa
tiona
l Saf
ety
and
Heal
th P
rogr
am
$1
35,8
2993
.268
Imm
uniza
tion
Coop
erat
ive
Agre
emen
ts
$3
59,4
55$1
3,49
0,21
193
.270
Vira
l Hep
atiti
s Pre
vent
ion
and
Cont
rol
$4
5,00
0$1
15,2
3993
.297
Teen
age
Preg
nanc
y Pr
even
tion
Prog
ram
$95,
016
93.3
05PP
HF 2
018:
Offi
ce o
f Sm
okin
g an
d He
alth
-Nat
iona
l Sta
te-B
ased
Tob
acco
Con
trol
Pro
gram
s-Fi
nanc
ed in
pa
rt b
y 20
18 P
reve
ntio
n an
d Pu
blic
Heal
th fu
nds (
PPHF
)
$31,
236
$863
,821
93.3
07M
inor
ity H
ealth
and
Hea
lth D
ispar
ities
Res
earc
h
$9
,885
,550
93.3
23Ep
idem
iolo
gy a
nd La
bora
tory
Cap
acity
for I
nfec
tious
Dise
ases
(ELC
)
$2,2
41,0
2293
.324
Stat
e He
alth
Insu
ranc
e As
sista
nce
Prog
ram
$406
,410
$498
,139
93.3
36Be
havi
oral
Risk
Fac
tor S
urve
illan
ce S
yste
m
$2
77,5
98
93.3
54Pu
blic
Heal
th E
mer
genc
y Re
spon
se:
Coop
erat
ive
Agre
emen
t for
Em
erge
ncy
Resp
onse
: Pub
lic H
ealth
Cr
isis R
espo
nse
$39,
272
$533
,633
93.3
69AC
L Ind
epen
dent
Livi
ng S
tate
Gra
nts
$2
83,2
59
93.4
26Im
prov
ing
the
Heal
th o
f Am
erica
ns th
roug
h Pr
even
tion
and
Man
agem
ent o
f Dia
bete
s and
Hea
rt D
iseas
e an
d St
roke
-Fin
ance
d in
par
t by
2018
Pre
vent
ion
and
Publ
ic He
alth
Fun
ds
$3
18,1
12$2
,274
,476
93.4
34Ev
ery
Stud
ent S
ucce
eds A
ct/P
resc
hool
Dev
elop
men
t Gra
nts
$4
98,3
19$5
59,3
8493
.448
Food
Saf
ety
and
Secu
rity
Mon
itorin
g Pr
ojec
t
$156
,865
93.4
49Ru
min
ant F
eed
Ban
Supp
ort P
roje
ct
$2
7,63
493
.464
ACL A
ssist
ive
Tech
nolo
gy
$5
09,3
7593
.500
Preg
nanc
y As
sista
nce
Fund
Pro
gram
$386
,223
$866
,379
93.5
16Pu
blic
Heal
th T
rain
ing
Cent
ers P
rogr
am
Uni
vers
ity o
f Col
orad
o De
nver
1
0005
8720
3$1
5,65
7
Uni
vers
ity o
f Col
orad
o De
nver
F
Y19.
641.
005
$11,
045
93.5
18Af
ford
able
Car
e Ac
t - M
edica
re Im
prov
emen
ts fo
r Pat
ient
s and
Pro
vide
rs
$2
5,66
0$2
5,97
7
93.5
21Th
e Af
ford
able
Car
e Ac
t: Bu
ildin
g Ep
idem
iolo
gy, L
abor
ator
y, a
nd H
ealth
Info
rmat
ion
Syst
ems C
apac
ity in
th
e Ep
idem
iolo
gy a
nd La
bora
tory
Cap
acity
for I
nfec
tious
Dise
ase
(ELC
) and
Em
ergi
ng In
fect
ions
Pro
gram
(E
IP) C
oope
rativ
e Ag
reem
ents
; PPH
F
$2
2,38
3
93.5
56Pr
omot
ing
Safe
and
Sta
ble
Fam
ilies
$713
,716
$1,0
26,6
8193
.563
Child
Sup
port
Enf
orce
men
t
$11,
130,
801
93.5
66Re
fuge
e an
d En
tran
t Ass
istan
ce S
tate
/Rep
lace
men
t Des
igne
e Ad
min
ister
ed P
rogr
ams
$3
03,9
05$4
77,8
7893
.568
Low
-Inco
me
Hom
e En
ergy
Ass
istan
ce
$9
38,9
16$2
1,29
9,96
2
The
acco
mpa
nyin
g no
tes a
re a
n in
tegr
al p
art o
f thi
s sch
edul
e.
A-208
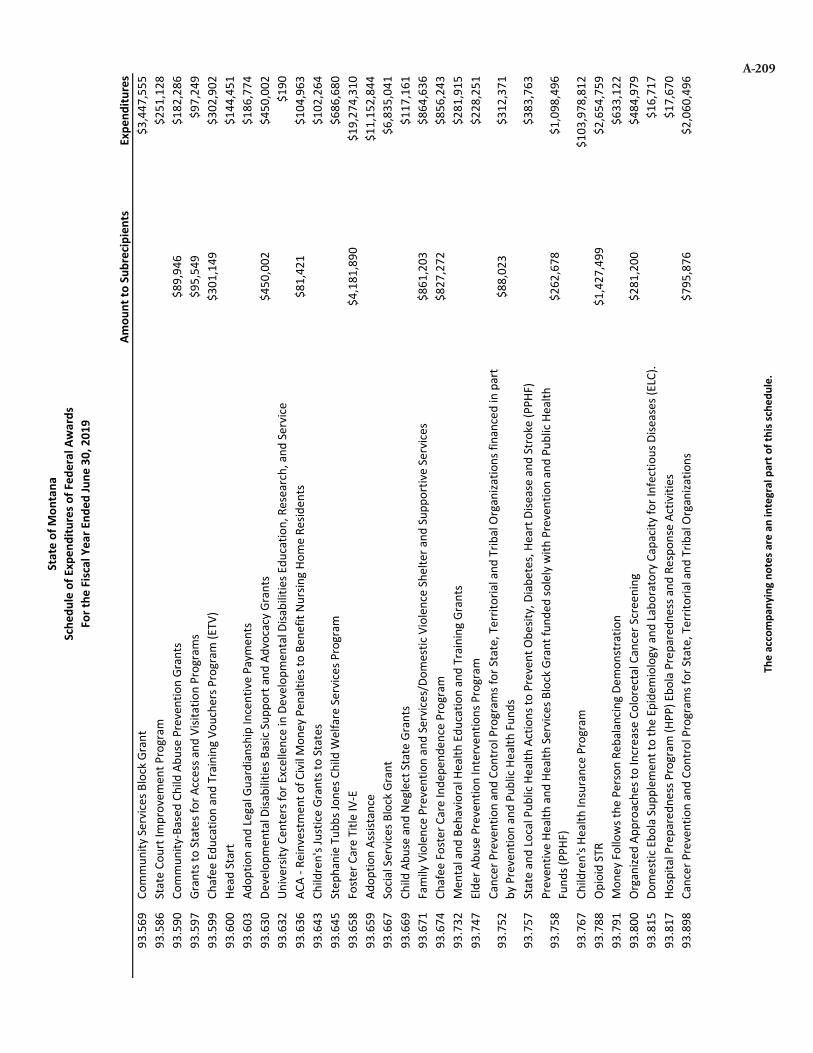
Stat
e of
Mon
tana
Sche
dule
of E
xpen
ditu
res o
f Fed
eral
Aw
ards
For t
he Fi
scal
Yea
r End
ed Ju
ne 3
0, 2
019
Amou
nt to
Sub
recip
ient
sEx
pend
iture
s93
.569
Com
mun
ity S
ervi
ces B
lock
Gra
nt
$3
,447
,555
93.5
86St
ate
Cour
t Im
prov
emen
t Pro
gram
$251
,128
93.5
90Co
mm
unity
-Bas
ed C
hild
Abu
se P
reve
ntio
n Gr
ants
$89,
946
$182
,286
93.5
97Gr
ants
to S
tate
s for
Acc
ess a
nd V
isita
tion
Prog
ram
s
$95,
549
$97,
249
93.5
99Ch
afee
Edu
catio
n an
d Tr
aini
ng V
ouch
ers P
rogr
am (E
TV)
$3
01,1
49$3
02,9
0293
.600
Head
Sta
rt
$1
44,4
5193
.603
Adop
tion
and
Lega
l Gua
rdia
nshi
p In
cent
ive
Paym
ents
$186
,774
93.6
30De
velo
pmen
tal D
isabi
litie
s Bas
ic Su
ppor
t and
Adv
ocac
y Gr
ants
$450
,002
$450
,002
93.6
32Un
iver
sity
Cent
ers f
or E
xcel
lenc
e in
Dev
elop
men
tal D
isabi
litie
s Edu
catio
n, R
esea
rch,
and
Ser
vice
$190
93.6
36AC
A - R
einv
estm
ent o
f Civ
il M
oney
Pen
altie
s to
Bene
fit N
ursin
g Ho
me
Resid
ents
$81,
421
$104
,963
93.6
43Ch
ildre
n's J
ustic
e Gr
ants
to S
tate
s
$102
,264
93.6
45St
epha
nie
Tubb
s Jon
es C
hild
Wel
fare
Ser
vice
s Pro
gram
$686
,680
93.6
58Fo
ster
Car
e Ti
tle IV
-E
$4
,181
,890
$19,
274,
310
93.6
59Ad
optio
n As
sista
nce
$11,
152,
844
93.6
67So
cial S
ervi
ces B
lock
Gra
nt
$6
,835
,041
93.6
69Ch
ild A
buse
and
Neg
lect
Sta
te G
rant
s
$117
,161
93.6
71Fa
mily
Vio
lenc
e Pr
even
tion
and
Serv
ices/
Dom
estic
Vio
lenc
e Sh
elte
r and
Sup
port
ive
Serv
ices
$8
61,2
03$8
64,6
3693
.674
Chaf
ee F
oste
r Car
e In
depe
nden
ce P
rogr
am
$8
27,2
72$8
56,2
4393
.732
Men
tal a
nd B
ehav
iora
l Hea
lth E
duca
tion
and
Trai
ning
Gra
nts
$2
81,9
1593
.747
Elde
r Abu
se P
reve
ntio
n In
terv
entio
ns P
rogr
am
$2
28,2
51
93.7
52Ca
ncer
Pre
vent
ion
and
Cont
rol P
rogr
ams f
or S
tate
, Ter
ritor
ial a
nd T
ribal
Org
aniza
tions
fina
nced
in p
art
by P
reve
ntio
n an
d Pu
blic
Heal
th F
unds
$88,
023
$312
,371
93.7
57St
ate
and
Loca
l Pub
lic H
ealth
Act
ions
to P
reve
nt O
besit
y, D
iabe
tes,
Hear
t Dise
ase
and
Stro
ke (P
PHF)
$383
,763
93.7
58Pr
even
tive
Heal
th a
nd H
ealth
Ser
vice
s Blo
ck G
rant
fund
ed so
lely
with
Pre
vent
ion
and
Publ
ic He
alth
Fu
nds (
PPHF
)
$262
,678
$1,0
98,4
96
93.7
67Ch
ildre
n's H
ealth
Insu
ranc
e Pr
ogra
m
$1
03,9
78,8
1293
.788
Opio
id S
TR
$1
,427
,499
$2,6
54,7
5993
.791
Mon
ey F
ollo
ws t
he P
erso
n Re
bala
ncin
g De
mon
stra
tion
$633
,122
93.8
00Or
gani
zed
Appr
oach
es to
Incr
ease
Col
orec
tal C
ance
r Scr
eeni
ng
$2
81,2
00$4
84,9
7993
.815
Dom
estic
Ebo
la S
uppl
emen
t to
the
Epid
emio
logy
and
Labo
rato
ry C
apac
ity fo
r Inf
ectio
us D
iseas
es (E
LC).
$16,
717
93.8
17Ho
spita
l Pre
pare
dnes
s Pro
gram
(HPP
) Ebo
la P
repa
redn
ess a
nd R
espo
nse
Activ
ities
$17,
670
93.8
98Ca
ncer
Pre
vent
ion
and
Cont
rol P
rogr
ams f
or S
tate
, Ter
ritor
ial a
nd T
ribal
Org
aniza
tions
$795
,876
$2,0
60,4
96
The
acco
mpa
nyin
g no
tes a
re a
n in
tegr
al p
art o
f thi
s sch
edul
e.
A-209

Stat
e of
Mon
tana
Sche
dule
of E
xpen
ditu
res o
f Fed
eral
Aw
ards
For t
he Fi
scal
Yea
r End
ed Ju
ne 3
0, 2
019
Amou
nt to
Sub
recip
ient
sEx
pend
iture
s
93.9
12Ru
ral H
ealth
Car
e Se
rvice
s Out
reac
h, R
ural
Hea
lth N
etw
ork
Deve
lopm
ent a
nd S
mal
l Hea
lth C
are
Prov
ider
Qua
lity
Impr
ovem
ent P
rogr
am
$5
92$3
78,4
89
93.9
17HI
V Ca
re F
orm
ula
Gran
ts
$1
,032
,893
$2,3
59,4
2393
.940
HIV
Prev
entio
n Ac
tiviti
es H
ealth
Dep
artm
ent B
ased
$552
,268
$1,0
35,7
6793
.945
Assis
tanc
e Pr
ogra
ms f
or C
hron
ic Di
seas
e Pr
even
tion
and
Cont
rol
$5
9,63
6
93.9
46Co
oper
ativ
e Ag
reem
ents
to S
uppo
rt S
tate
-Bas
ed S
afe
Mot
herh
ood
and
Infa
nt H
ealth
Initi
ativ
e Pr
ogra
ms
$1
77,7
25
93.9
58Bl
ock
Gran
ts fo
r Com
mun
ity M
enta
l Hea
lth S
ervi
ces
$6
71,3
98$1
,190
,538
93.9
59Bl
ock
Gran
ts fo
r Pre
vent
ion
and
Trea
tmen
t of S
ubst
ance
Abu
se
$3
,495
,196
$7,9
10,3
7793
.977
Sexu
ally
Tra
nsm
itted
Dise
ases
(STD
) Pre
vent
ion
and
Cont
rol G
rant
s
$253
,583
93.9
94M
ater
nal a
nd C
hild
Hea
lth S
ervi
ces B
lock
Gra
nt to
the
Stat
es
$9
62,1
30$1
,862
,824
93.U
XXM
iscel
lane
ous N
on-M
ajor
Gra
nts
$1
99,6
90TO
TAL
$264
,149
,714
Agin
g Cl
uste
r93
.044
Spec
ial P
rogr
ams f
or th
e Ag
ing,
Titl
e III
, Par
t B, G
rant
s for
Sup
port
ive
Serv
ices a
nd S
enio
r Cen
ters
$1,9
96,3
14$2
,349
,994
93.0
45Sp
ecia
l Pro
gram
s for
the
Agin
g, T
itle
III, P
art C
, Nut
ritio
n Se
rvice
s
$3,2
60,2
17$3
,707
,676
93.0
53Nu
triti
on S
ervi
ces I
ncen
tive
Prog
ram
$881
,143
$1,2
17,4
20TO
TAL
$7,2
75,0
90CC
DF C
lust
er93
.575
Child
Car
e an
d De
velo
pmen
t Blo
ck G
rant
$6,5
24,7
15$1
9,08
5,61
693
.596
Child
Car
e M
anda
tory
and
Mat
chin
g Fu
nds o
f the
Chi
ld C
are
and
Deve
lopm
ent F
und
$6,1
78,1
48TO
TAL
$25,
263,
764
Mat
erna
l, In
fant
, and
Ear
ly C
hild
hood
Hom
e Vi
sitin
g Cl
uste
r93
.870
Mat
erna
l, In
fant
and
Ear
ly C
hild
hood
Hom
e Vi
sitin
g Gr
ant P
rogr
am
$5
,296
,344
$6,2
20,2
89TO
TAL
$6,2
20,2
89M
edica
id C
lust
er93
.775
Stat
e M
edica
id F
raud
Con
trol
Uni
ts
$7
06,9
8393
.777
Stat
e Su
rvey
and
Cer
tifica
tion
of H
ealth
Car
e Pr
ovid
ers a
nd S
uppl
iers
(Titl
e XV
III) M
edica
re
$2
,575
,722
93.7
78M
edica
l Ass
istan
ce P
rogr
am
$5
81,2
67$1
,478
,459
,908
TOTA
L$1
,481
,742
,613
Stud
ent F
inan
cial A
ssist
ance
Clu
ster
93.2
64Nu
rse
Facu
lty Lo
an P
rogr
am (N
FLP)
$11,
744
93.3
42He
alth
Pro
fess
ions
Stu
dent
Loan
s, In
cludi
ng P
rimar
y Ca
re Lo
ans/
Loan
s for
Disa
dvan
tage
d St
uden
ts
$2
35,9
84
The
acco
mpa
nyin
g no
tes a
re a
n in
tegr
al p
art o
f thi
s sch
edul
e.
A-210

Stat
e of
Mon
tana
Sche
dule
of E
xpen
ditu
res o
f Fed
eral
Aw
ards
For t
he Fi
scal
Yea
r End
ed Ju
ne 3
0, 2
019
Amou
nt to
Sub
recip
ient
sEx
pend
iture
s93
.364
Nurs
ing
Stud
ent L
oans
$2,9
90,9
83TO
TAL
$3,2
38,7
11TA
NF C
lust
er93
.558
Tem
pora
ry A
ssist
ance
for N
eedy
Fam
ilies
$812
,151
$29,
518,
632
TOTA
L$2
9,51
8,63
2
DEPA
RTM
ENT
OF H
EALT
H AN
D HU
MAN
SER
VICE
S TO
TAL
$1,8
17,4
08,8
13DE
PART
MEN
T OF
HOM
ELAN
D SE
CURI
TY97
.012
Boat
ing
Safe
ty F
inan
cial A
ssist
ance
$564
,012
97.0
23Co
mm
unity
Ass
istan
ce P
rogr
am S
tate
Sup
port
Ser
vice
s Ele
men
t (CA
P-SS
SE)
$3
71,4
1697
.029
Floo
d M
itiga
tion
Assis
tanc
e
$1
29,4
31($
138,
847)
97.0
36Di
sast
er G
rant
s - P
ublic
Ass
istan
ce (P
resid
entia
lly D
ecla
red
Disa
ster
s)
$1
,791
,381
$2,5
20,8
2297
.039
Haza
rd M
itiga
tion
Gran
t
$159
,207
$134
,036
97.0
41Na
tiona
l Dam
Saf
ety
Prog
ram
$212
,826
97.0
42Em
erge
ncy
Man
agem
ent P
erfo
rman
ce G
rant
s
$2,1
15,6
75$3
,102
,920
97.0
43St
ate
Fire
Tra
inin
g Sy
stem
s Gra
nts
$4
,083
97.0
45Co
oper
atin
g Te
chni
cal P
artn
ers
$6
,851
,212
97.0
47Pr
e-Di
sast
er M
itiga
tion
$2,1
53,4
30$2
,164
,222
97.0
67Ho
mel
and
Secu
rity
Gran
t Pro
gram
$2,7
25,9
30$4
,508
,115
K
alisp
ell P
olice
Dep
artm
ent
18
-SPW
SPW
-06-
008
$2,4
8297
.082
Eart
hqua
ke C
onso
rtiu
m
$1
4,33
7TO
TAL
$20,
311,
636
DEPA
RTM
ENT
OF H
OMEL
AND
SECU
RITY
TOT
AL$2
0,31
1,63
6DE
PART
MEN
T OF
HOU
SING
& U
RBAN
DEV
ELOP
MEN
T14
.228
Com
mun
ity D
evel
opm
ent B
lock
Gra
nts/
Stat
e's p
rogr
am a
nd N
on-E
ntitl
emen
t Gra
nts i
n Ha
wai
i
$6,0
68,1
67$6
,378
,008
14.2
31Em
erge
ncy
Solu
tions
Gra
nt P
rogr
am
$7
28,1
4914
.235
Supp
ortiv
e Ho
usin
g Pr
ogra
m
($
26,4
78)
14.2
38Sh
elte
r Plu
s Car
e
$4
2,06
214
.239
Hom
e In
vest
men
t Par
tner
ship
s Pro
gram
$4,1
46,1
56$4
,393
,409
14.2
41Ho
usin
g Op
port
uniti
es fo
r Per
sons
with
AID
S
$9
49,0
8214
.275
Hous
ing
Trus
t Fun
d
$4
30,9
21$6
18,3
71
14.3
26Pr
ojec
t Ren
tal A
ssist
ance
Dem
onst
ratio
n (P
RA D
emo)
Pro
gram
of S
ectio
n 81
1 Su
ppor
tive
Hous
ing
for
Pers
ons w
ith D
isabi
litie
s
$114
,174
TOTA
L$1
3,19
6,77
7
The
acco
mpa
nyin
g no
tes a
re a
n in
tegr
al p
art o
f thi
s sch
edul
e.
A-211

Stat
e of
Mon
tana
Sche
dule
of E
xpen
ditu
res o
f Fed
eral
Aw
ards
For t
he Fi
scal
Yea
r End
ed Ju
ne 3
0, 2
019
Amou
nt to
Sub
recip
ient
sEx
pend
iture
sHo
usin
g Vo
uche
r Clu
ster
14.8
71Se
ctio
n 8
Hous
ing
Choi
ce V
ouch
ers
$2
1,78
1,58
5TO
TAL
$21,
781,
585
Sect
ion
8 Pr
ojec
t-Bas
ed C
lust
er14
.195
Sect
ion
8 Ho
usin
g As
sista
nce
Paym
ents
Pro
gram
$22,
801,
654
14.8
56Lo
wer
Inco
me
Hous
ing
Assis
tanc
e Pr
ogra
m S
ectio
n 8
Mod
erat
e Re
habi
litat
ion
$1,8
45,8
77TO
TAL
$24,
647,
531
DEPA
RTM
ENT
OF H
OUSI
NG &
URB
AN D
EVEL
OPM
ENT
TOTA
L$5
9,62
5,89
3DE
PART
MEN
T OF
JUST
ICE
16.0
17Se
xual
Ass
ault
Serv
ices F
orm
ula
Prog
ram
$310
,886
$330
,659
16.5
28En
hanc
ed T
rain
ing
and
Serv
ices t
o En
d Vi
olen
ce a
nd A
buse
of W
omen
Late
r in
Life
$116
,269
16.5
40Ju
veni
le Ju
stice
and
Del
inqu
ency
Pre
vent
ion
$318
,516
$337
,376
16.5
43M
issin
g Ch
ildre
n's A
ssist
ance
$99,
188
R
ady
Child
ren'
s Hos
pita
l-San
Die
go
UNI
V OF
MT
2018
-01
$11,
629
16.5
54Na
tiona
l Crim
inal
Hist
ory
Impr
ovem
ent P
rogr
am (N
CHIP
)
$1,6
27,3
4116
.560
Natio
nal I
nstit
ute
of Ju
stice
Res
earc
h, E
valu
atio
n, a
nd D
evel
opm
ent P
roje
ct G
rant
s
$128
,594
B
ozem
an P
ublic
Sch
ools
2
014-
MU-
0017
(UM
#1)
$222
,228
16.5
75Cr
ime
Vict
im A
ssist
ance
$7,2
12,0
90$8
,027
,770
S
tate
of W
yom
ing
2
016-
VA-G
X-00
51$5
0816
.576
Crim
e Vi
ctim
Com
pens
atio
n
$9
,737
16.5
82Cr
ime
Vict
im A
ssist
ance
/Disc
retio
nary
Gra
nts
$7
92,4
4316
.585
Drug
Cou
rt D
iscre
tiona
ry G
rant
Pro
gram
$675
,495
16.5
88Vi
olen
ce A
gain
st W
omen
For
mul
a Gr
ants
$833
,380
$987
,633
16.5
89Ru
ral D
omes
tic V
iole
nce,
Dat
ing
Viol
ence
, Sex
ual A
ssau
lt, a
nd S
talk
ing
Assis
tanc
e Pr
ogra
m
Cou
nty
of M
issou
la
201
5-W
R-AX
-001
3$1
8,56
416
.590
Gran
ts to
Enc
oura
ge A
rres
t Pol
icies
and
Enf
orce
men
t of P
rote
ctio
n Or
ders
Pro
gram
$241
,905
16.5
93Re
siden
tial S
ubst
ance
Abu
se T
reat
men
t for
Sta
te P
rison
ers
$5
7,33
0$5
7,33
016
.606
Stat
e Cr
imin
al A
lien
Assis
tanc
e Pr
ogra
m
$2
2,19
416
.609
Proj
ect S
afe
Neig
hbor
hood
s
$5,5
17$5
,517
16.7
10Pu
blic
Safe
ty P
artn
ersh
ip a
nd C
omm
unity
Pol
icing
Gra
nts
$1
42,6
5616
.726
Juve
nile
Men
torin
g Pr
ogra
m
Nat
iona
l 4-H
Cou
ncil
4
H NM
P-9:
201
8-JU
-FX-
0005
$3,6
75
Nat
iona
l 4-H
Cou
ncil
4
-H U
NDER
OJJD
P 20
16-JU
-FX-
002
$16
N
atio
nal 4
-H C
ounc
il
4-H
UND
ER O
JJDP
2017
JUFX
0016
$35,
647
The
acco
mpa
nyin
g no
tes a
re a
n in
tegr
al p
art o
f thi
s sch
edul
e.
A-212

Stat
e of
Mon
tana
Sche
dule
of E
xpen
ditu
res o
f Fed
eral
Aw
ards
For t
he Fi
scal
Yea
r End
ed Ju
ne 3
0, 2
019
Amou
nt to
Sub
recip
ient
sEx
pend
iture
s16
.735
PREA
Pro
gram
: Str
ateg
ic Su
ppor
t for
PRE
A Im
plem
enta
tion
$43,
040
16.7
38Ed
war
d By
rne
Mem
oria
l Jus
tice
Assis
tanc
e Gr
ant P
rogr
am
$6
70,6
39$9
16,0
3616
.741
DNA
Back
log
Redu
ctio
n Pr
ogra
m
$2
74,9
6716
.742
Paul
Cov
erde
ll Fo
rens
ic Sc
ienc
es Im
prov
emen
t Gra
nt P
rogr
am
$1
02,8
6116
.745
Crim
inal
and
Juve
nile
Just
ice a
nd M
enta
l Hea
lth C
olla
bora
tion
Prog
ram
$7,9
38$7
,938
16.7
50Su
ppor
t for
Ada
m W
alsh
Act
Impl
emen
tatio
n Gr
ant P
rogr
am
$3
2,60
116
.751
Edw
ard
Byrn
e M
emor
ial C
ompe
titiv
e Gr
ant P
rogr
am
$2
2,40
016
.754
Haro
ld R
oger
s Pre
scrip
tion
Drug
Mon
itorin
g Pr
ogra
m
$1
5816
.818
Child
ren
Expo
sed
to V
iole
nce
$183
,117
$328
,971
16.8
27Ju
stice
Rei
nves
tmen
t Ini
tiativ
e
Cou
ncil
of S
tate
Gov
ernm
ents
1
9-SA
-161
-269
0
$109
,475
16.8
33Na
tiona
l Sex
ual A
ssau
lt Ki
t Ini
tiativ
e
$6
77,3
4216
.838
Com
preh
ensiv
e Op
ioid
Abu
se S
ite-B
ased
Pro
gram
$12,
020
16.8
39ST
OP S
choo
l Vio
lenc
e
$7
5,76
516
.922
Equi
tabl
e Sh
arin
g Pr
ogra
m
$1
45,3
08TO
TAL
$16,
643,
256
DEPA
RTM
ENT
OF JU
STIC
E TO
TAL
$16,
643,
256
DEPA
RTM
ENT
OF LA
BOR
17.0
02La
bor F
orce
Sta
tistic
s
$710
,552
17.0
05Co
mpe
nsat
ion
and
Wor
king
Con
ditio
ns
$9
2,38
917
.201
Regi
ster
ed A
ppre
ntice
ship
$88,
598
$607
,752
17.2
25Un
empl
oym
ent I
nsur
ance
$117
,177
,840
17.2
35Se
nior
Com
mun
ity S
ervi
ce E
mpl
oym
ent P
rogr
am
$4
16,3
88$4
36,3
0617
.245
Trad
e Ad
just
men
t Ass
istan
ce
$2
78,5
5417
.268
H-1B
Job
Trai
ning
Gra
nts
Nor
ther
n W
yom
ing
Com
mun
ity C
olle
ge
011
717-
1$3
83,8
1717
.271
Wor
k Op
port
unity
Tax
Cre
dit P
rogr
am (W
OTC)
$66,
000
17.2
73Te
mpo
rary
Labo
r Cer
tifica
tion
for F
orei
gn W
orke
rs
$2
13,9
5817
.277
WIO
A Na
tiona
l Disl
ocat
ed W
orke
r Gra
nts /
WIA
Nat
iona
l Em
erge
ncy
Gran
ts
$1
52,1
71$1
,375
,776
17.2
82Tr
ade
Adju
stm
ent A
ssist
ance
Com
mun
ity C
olle
ge a
nd C
aree
r Tra
inin
g (T
AACC
CT) G
rant
s
$157
,229
$394
,255
17.5
04Co
nsul
tatio
n Ag
reem
ents
$513
,616
17.6
00M
ine
Heal
th a
nd S
afet
y Gr
ants
$252
,487
TOTA
L$1
22,5
03,3
02
The
acco
mpa
nyin
g no
tes a
re a
n in
tegr
al p
art o
f thi
s sch
edul
e.
A-213

Stat
e of
Mon
tana
Sche
dule
of E
xpen
ditu
res o
f Fed
eral
Aw
ards
For t
he Fi
scal
Yea
r End
ed Ju
ne 3
0, 2
019
Amou
nt to
Sub
recip
ient
sEx
pend
iture
sEm
ploy
men
t Ser
vice
Clu
ster
17.2
07Em
ploy
men
t Ser
vice
/Wag
ner-P
eyse
r Fun
ded
Activ
ities
$5,4
71,0
4317
.801
Disa
bled
Vet
eran
s' Ou
trea
ch P
rogr
am (D
VOP)
$561
,173
17.8
04Lo
cal V
eter
ans'
Empl
oym
ent R
epre
sent
ativ
e Pr
ogra
m
$4
5,07
5TO
TAL
$6,0
77,2
91W
IOA
Clus
ter
17.2
58W
IOA
Adul
t Pro
gram
$507
,206
$2,1
58,1
7517
.259
WIO
A Yo
uth
Activ
ities
$1,5
01,3
36$1
,993
,346
17.2
78W
IOA
Dislo
cate
d W
orke
r For
mul
a Gr
ants
$77,
569
$1,6
18,8
45TO
TAL
$5,7
70,3
66
DEPA
RTM
ENT
OF LA
BOR
TOTA
L$1
34,3
50,9
59DE
PART
MEN
T OF
STA
TE19
.009
Acad
emic
Exch
ange
Pro
gram
s - U
nder
grad
uate
Pro
gram
s
$278
,890
$1,0
93,5
6419
.010
Acad
emic
Exch
ange
Pro
gram
s - H
uber
t H. H
umph
rey
Fello
wsh
ip P
rogr
am
Ins
titut
e of
Inte
rnat
iona
l Edu
catio
n
HHH
1901
$89,
469
I
nstit
ute
of In
tern
atio
nal E
duca
tion
II
E013
8_2.
22.1
8$1
33,7
7919
.040
Publ
ic Di
plom
acy
Prog
ram
s
$2,4
6319
.401
Acad
emic
Exch
ange
Pro
gram
s - S
chol
ars
$4
49,8
16$1
,122
,025
19.4
15Pr
ofes
siona
l and
Cul
tura
l Exc
hang
e Pr
ogra
ms -
Citi
zen
Exch
ange
s
$68,
104
$1,0
78,7
1419
.600
Bure
au o
f Nea
r Eas
tern
Affa
irs
Geo
rget
own
Univ
ersit
y
S-N
EAAC
-17-
CA-1
016
$47,
318
G
eorg
etow
n Un
iver
sity
M
SU-2
0190
310
$26,
194
TOTA
L$3
,593
,526
DEPA
RTM
ENT
OF S
TATE
TOT
AL$3
,593
,526
DEPA
RTM
ENT
OF T
HE IN
TERI
OR15
.025
Serv
ices t
o In
dian
Chi
ldre
n, E
lder
ly a
nd F
amili
es
$1
20,1
5715
.034
Agric
ultu
re o
n In
dian
Land
s
F
ort B
elkn
ap C
omm
unity
Cou
ncil
A
10AV
0058
3$5
9,68
015
.130
Indi
an E
duca
tion
Assis
tanc
e to
Sch
ools
$8,6
8715
.224
Cultu
ral a
nd P
aleo
ntol
ogica
l Res
ourc
es M
anag
emen
t
$67,
523
15.2
25Re
crea
tion
and
Visit
or S
ervi
ces
$3
3,83
115
.228
BLM
Wild
land
Urb
an In
terfa
ce C
omm
unity
Fire
Ass
istan
ce
$8
,914
15.2
30In
vasiv
e an
d No
xious
Pla
nt M
anag
emen
t
$5,3
49
The
acco
mpa
nyin
g no
tes a
re a
n in
tegr
al p
art o
f thi
s sch
edul
e.
A-214

Stat
e of
Mon
tana
Sche
dule
of E
xpen
ditu
res o
f Fed
eral
Aw
ards
For t
he Fi
scal
Yea
r End
ed Ju
ne 3
0, 2
019
Amou
nt to
Sub
recip
ient
sEx
pend
iture
s15
.231
Fish
, Wild
life
and
Plan
t Con
serv
atio
n Re
sour
ce M
anag
emen
t
$62,
135
15.2
36En
viro
nmen
tal Q
ualit
y an
d Pr
otec
tion
$632
,475
15.2
39M
anag
emen
t Ini
tiativ
es
$2
,500
15.2
50Re
gula
tion
of S
urfa
ce C
oal M
inin
g an
d Su
rface
Effe
cts o
f Und
ergr
ound
Coa
l Min
ing
$2,0
18,4
4115
.252
Aban
done
d M
ine
Land
Rec
lam
atio
n (A
MLR
)
$1,9
99,1
3115
.427
Fede
ral O
il an
d Ga
s Roy
alty
Man
agem
ent S
tate
and
Trib
al C
oord
inat
ion
$496
,760
15.5
14Re
clam
atio
n St
ates
Em
erge
ncy
Drou
ght R
elie
f
$33,
777
15.5
17Fi
sh a
nd W
ildlif
e Co
ordi
natio
n Ac
t
$133
,273
15.5
24Re
crea
tion
Reso
urce
s Man
agem
ent
$6
5,62
415
.608
Fish
and
Wild
life
Man
agem
ent A
ssist
ance
$56,
808
15.6
26En
hanc
ed H
unte
r Edu
catio
n an
d Sa
fety
$48,
445
15.6
28M
ultis
tate
Con
serv
atio
n Gr
ant
Nor
th C
arol
ina
Stat
e Un
iver
sity
2
018-
0319
-06
$4,1
7915
.634
Stat
e W
ildlif
e Gr
ants
$754
,181
15.6
37M
igra
tory
Bird
Join
t Ven
ture
s
$21,
000
$47,
437
15.6
57En
dang
ered
Spe
cies C
onse
rvat
ion
– Re
cove
ry Im
plem
enta
tion
Fund
s
$2,2
29,1
65
Wild
life
Man
agem
ent I
nstit
ute
W
NS 2
018-
08 (5
8185
)$1
2,62
915
.660
Enda
nger
ed S
pecie
s - C
andi
date
Con
serv
atio
n Ac
tion
Fund
s
$86,
506
S
tate
of U
tah
1
8610
3$4
,284
15.6
63Na
tiona
l Fish
and
Wild
life
Foun
datio
n
$3
4,60
115
.666
Enda
nger
ed S
pecie
s Con
serv
atio
n-W
olf L
ives
tock
Loss
Com
pens
atio
n an
d Pr
even
tion
$66,
053
$130
,000
15.6
70Ad
aptiv
e Sc
ienc
e
$1
04,8
0615
.678
Coop
erat
ive
Ecos
yste
m S
tudi
es U
nits
$300
,822
15.9
04Hi
stor
ic Pr
eser
vatio
n Fu
nd G
rant
s-In
-Aid
$85,
817
$755
,425
15.9
16Ou
tdoo
r Rec
reat
ion
Acqu
isitio
n, D
evel
opm
ent a
nd P
lann
ing
$367
,900
$1,0
40,4
8415
.944
Natu
ral R
esou
rce
Stew
ards
hip
$15,
764
15.9
45Co
oper
ativ
e Re
sear
ch a
nd T
rain
ing
Prog
ram
s – R
esou
rces
of t
he N
atio
nal P
ark
Syst
em
$3
3,17
715
.959
Educ
atio
n Pr
ogra
m M
anag
emen
t
L
ittle
Eag
le G
rant
Sch
ool
$1
,519
P
asch
al S
herm
an In
dian
Sch
ool
$1
7,84
215
.981
Wat
er U
se a
nd D
ata
Rese
arch
$12,
513
15.U
XXM
iscel
lane
ous N
on-M
ajor
Gra
nts
$1
26,1
23TO
TAL
$11,
564,
967
The
acco
mpa
nyin
g no
tes a
re a
n in
tegr
al p
art o
f thi
s sch
edul
e.
A-215

Stat
e of
Mon
tana
Sche
dule
of E
xpen
ditu
res o
f Fed
eral
Aw
ards
For t
he Fi
scal
Yea
r End
ed Ju
ne 3
0, 2
019
Amou
nt to
Sub
recip
ient
sEx
pend
iture
sFi
sh a
nd W
ildlif
e Cl
uste
r15
.605
Spor
t Fish
Res
tora
tion
$7,7
45,3
8915
.611
Wild
life
Rest
orat
ion
and
Basic
Hun
ter E
duca
tion
$196
,907
$13,
218,
280
TOTA
L$2
0,96
3,66
9
DEPA
RTM
ENT
OF T
HE IN
TERI
OR T
OTAL
$32,
528,
636
DEPA
RTM
ENT
OF T
RANS
PORT
ATIO
N20
.106
Airp
ort I
mpr
ovem
ent P
rogr
am
$6
10,4
0720
.200
High
way
Res
earc
h an
d De
velo
pmen
t Pro
gram
$220
,226
20.2
15Hi
ghw
ay T
rain
ing
and
Educ
atio
n
$2
14,0
0020
.218
Mot
or C
arrie
r Saf
ety
Assis
tanc
e
$2
,670
,091
20.2
32Co
mm
ercia
l Driv
er's
Licen
se P
rogr
am Im
plem
enta
tion
Gran
t
$95,
257
20.2
37M
otor
Car
rier S
afet
y As
sista
nce
High
Prio
rity
Activ
ities
Gra
nts a
nd C
oope
rativ
e Ag
reem
ents
$12,
690
20.2
40Fu
el T
ax E
vasio
n-In
terg
over
nmen
tal E
nfor
cem
ent E
ffort
$105
,361
20.5
05M
etro
polit
an T
rans
port
atio
n Pl
anni
ng a
nd S
tate
and
Non
-Met
ropo
litan
Pla
nnin
g an
d Re
sear
ch
$5
10,6
08$5
98,0
3420
.509
Form
ula
Gran
ts fo
r Rur
al A
reas
$8,6
00,1
44$1
0,15
4,07
420
.608
Min
imum
Pen
altie
s for
Rep
eat O
ffend
ers f
or D
rivin
g W
hile
Into
xicat
ed
$2
40,3
30$6
46,4
09
20.6
14Na
tiona
l Hig
hway
Tra
ffic S
afet
y Ad
min
istra
tion
(NHT
SA) D
iscre
tiona
ry S
afet
y Gr
ants
and
Coo
pera
tive
Agre
emen
ts
$8
9,39
1
20.7
00Pi
pelin
e Sa
fety
Pro
gram
Sta
te B
ase
Gran
t
$187
,918
20.7
03In
tera
genc
y Ha
zard
ous M
ater
ials
Publ
ic Se
ctor
Tra
inin
g an
d Pl
anni
ng G
rant
s
$174
,099
$210
,543
TOTA
L$1
5,81
4,40
1Fe
dera
l Tra
nsit
Clus
ter
20.5
26Bu
s and
Bus
Fac
ilitie
s For
mul
a Pr
ogra
m
$8
02,5
60$8
02,5
60TO
TAL
$802
,560
High
way
Pla
nnin
g an
d Co
nstr
uctio
n Cl
uste
r20
.205
High
way
Pla
nnin
g an
d Co
nstr
uctio
n
$3
,265
,136
$486
,079
,449
20.2
19Re
crea
tiona
l Tra
ils P
rogr
am
$1
,874
,977
$2,0
10,8
5020
.224
Fede
ral L
ands
Acc
ess P
rogr
am
$7
,065
,820
TOTA
L$4
95,1
56,1
19Hi
ghw
ay S
afet
y Cl
uste
r20
.600
Stat
e an
d Co
mm
unity
Hig
hway
Saf
ety
$262
,454
$1,5
39,5
0220
.616
Natio
nal P
riorit
y Sa
fety
Pro
gram
s
$404
,579
$2,0
14,1
73TO
TAL
$3,5
53,6
75
The
acco
mpa
nyin
g no
tes a
re a
n in
tegr
al p
art o
f thi
s sch
edul
e.
A-216

Stat
e of
Mon
tana
Sche
dule
of E
xpen
ditu
res o
f Fed
eral
Aw
ards
For t
he Fi
scal
Yea
r End
ed Ju
ne 3
0, 2
019
Amou
nt to
Sub
recip
ient
sEx
pend
iture
sTr
ansit
Ser
vice
s Pro
gram
s Clu
ster
20.5
13En
hanc
ed M
obili
ty o
f Sen
iors
and
Indi
vidu
als w
ith D
isabi
litie
s
$1,2
45,6
28$1
,412
,460
TOTA
L$1
,412
,460
DEPA
RTM
ENT
OF T
RANS
PORT
ATIO
N TO
TAL
$516
,739
,215
DEPA
RTM
ENT
OF T
REAS
URY
21.U
XXM
iscel
lane
ous N
on-M
ajor
Gra
nts
$2
,376
TOTA
L$2
,376
DEPA
RTM
ENT
OF T
REAS
URY
TOTA
L$2
,376
DEPA
RTM
ENT
OF V
ETER
ANS
AFFA
IRS
64.0
14Ve
tera
ns S
tate
Dom
icilia
ry C
are
$193
,485
64.0
15Ve
tera
ns S
tate
Nur
sing
Hom
e Ca
re
$6
,300
,914
64.1
24Al
l-Vol
unte
er F
orce
Edu
catio
nal A
ssist
ance
$95,
066
TOTA
L$6
,589
,465
DEPA
RTM
ENT
OF V
ETER
ANS
AFFA
IRS
TOTA
L$6
,589
,465
ELEC
TION
ASS
ISTA
NCE
COM
MIS
SION
90.4
0420
18 H
AVA
Elec
tion
Secu
rity
Gran
ts
$3
87,0
00TO
TAL
$387
,000
ELEC
TION
ASS
ISTA
NCE
COM
MIS
SION
TOT
AL$3
87,0
00EN
VIRO
NMEN
TAL P
ROTE
CTIO
N AG
ENCY
66.0
34Su
rvey
s, St
udie
s, Re
sear
ch, I
nves
tigat
ions
, Dem
onst
ratio
ns, a
nd S
pecia
l Pur
pose
Act
iviti
es R
elat
ing
to
the
Clea
n Ai
r Act
$335
,158
66.0
40St
ate
Clea
n Di
esel
Gra
nt P
rogr
am
$1
97,4
6366
.202
Cong
ress
iona
lly M
anda
ted
Proj
ects
$15,
195
66.2
04M
ultip
urpo
se G
rant
s to
Stat
es a
nd T
ribes
$54,
109
66.4
19W
ater
Pol
lutio
n Co
ntro
l Sta
te, I
nter
stat
e, a
nd T
ribal
Pro
gram
Sup
port
$231
,106
66.4
33St
ate
Unde
rgro
und
Wat
er S
ourc
e Pr
otec
tion
$108
,000
66.4
54W
ater
Qua
lity
Man
agem
ent P
lann
ing
$7,1
3866
.460
Nonp
oint
Sou
rce
Impl
emen
tatio
n Gr
ants
$1,9
31,6
7766
.461
Regi
onal
Wet
land
Pro
gram
Dev
elop
men
t Gra
nts
$7
1,81
566
.514
Scie
nce
To A
chie
ve R
esul
ts (S
TAR)
Fel
low
ship
Pro
gram
$12,
407
66.5
16P3
Aw
ard:
Nat
iona
l Stu
dent
Des
ign
Com
petit
ion
for S
usta
inab
ility
$8,1
9666
.605
Perfo
rman
ce P
artn
ersh
ip G
rant
s
$5,5
33,9
50
The
acco
mpa
nyin
g no
tes a
re a
n in
tegr
al p
art o
f thi
s sch
edul
e.
A-217

Stat
e of
Mon
tana
Sche
dule
of E
xpen
ditu
res o
f Fed
eral
Aw
ards
For t
he Fi
scal
Yea
r End
ed Ju
ne 3
0, 2
019
Amou
nt to
Sub
recip
ient
sEx
pend
iture
s66
.608
Envi
ronm
enta
l Inf
orm
atio
n Ex
chan
ge N
etw
ork
Gran
t Pro
gram
and
Rel
ated
Ass
istan
ce
$4
5,67
666
.708
Pollu
tion
Prev
entio
n Gr
ants
Pro
gram
$162
,783
66.7
16Re
sear
ch, D
evel
opm
ent,
Mon
itorin
g, P
ublic
Edu
catio
n, O
utre
ach,
Tra
inin
g, D
emon
stra
tions
, and
Stu
dies
e
Xten
sion
Foun
datio
n
SA-
2017
-67
$36,
609
e
Xten
sion
Foun
datio
n
SA-
2019
-61
$4,3
8066
.717
Sour
ce R
educ
tion
Assis
tanc
e
$1
,285
66.8
02Su
perfu
nd S
tate
, Pol
itica
l Sub
divi
sion,
and
Indi
an T
ribe
Site
-Spe
cific
Coop
erat
ive
Agre
emen
ts
$1
,880
,518
66.8
04Un
derg
roun
d St
orag
e Ta
nk P
reve
ntio
n, D
etec
tion
and
Com
plia
nce
Prog
ram
$383
,499
66.8
05Le
akin
g Un
derg
roun
d St
orag
e Ta
nk T
rust
Fun
d Co
rrec
tive
Actio
n Pr
ogra
m
$5
64,3
5366
.809
Supe
rfund
Sta
te a
nd In
dian
Trib
e Co
re P
rogr
am C
oope
rativ
e Ag
reem
ents
$186
,217
66.8
17St
ate
and
Trib
al R
espo
nse
Prog
ram
Gra
nts
$7
13,7
71TO
TAL
$12,
485,
305
Clea
n W
ater
Sta
te R
evol
ving
Fun
d Cl
uste
r66
.458
Capi
taliz
atio
n Gr
ants
for C
lean
Wat
er S
tate
Rev
olvi
ng F
unds
$283
,924
,110
TOTA
L$2
83,9
24,1
10Dr
inki
ng W
ater
Sta
te R
evol
ving
Fun
d Cl
uste
r66
.468
Capi
taliz
atio
n Gr
ants
for D
rinki
ng W
ater
Sta
te R
evol
ving
Fun
ds
$1
71,5
89,9
33TO
TAL
$171
,589
,933
ENVI
RONM
ENTA
L PRO
TECT
ION
AGEN
CY T
OTAL
$467
,999
,348
EQUA
L EM
PLOY
MEN
T OP
PORT
UNIT
Y CO
MM
ISSI
ON30
.001
Empl
oym
ent D
iscrim
inat
ion
Title
VII
of th
e Ci
vil R
ight
s Act
of 1
964
$225
,960
TOTA
L$2
25,9
60
EQUA
L EM
PLOY
MEN
T OP
PORT
UNIT
Y CO
MM
ISSI
ON T
OTAL
$225
,960
EXEC
UTIV
E OF
FICE
OF T
HE P
RESI
DENT
95.0
01Hi
gh In
tens
ity D
rug
Traf
ficki
ng A
reas
Pro
gram
$25,
217
TOTA
L$2
5,21
7
EXEC
UTIV
E OF
FICE
OF
THE
PRES
IDEN
T TO
TAL
$25,
217
GENE
RAL S
ERVI
CES
ADM
INIS
TRAT
ION
39.0
03Do
natio
n of
Fed
eral
Sur
plus
Per
sona
l Pro
pert
y
($
48,0
97)
39.0
11El
ectio
n Re
form
Pay
men
ts
$1
31,1
74TO
TAL
$83,
077
GENE
RAL S
ERVI
CES
ADM
INIS
TRAT
ION
TOTA
L$8
3,07
7
The
acco
mpa
nyin
g no
tes a
re a
n in
tegr
al p
art o
f thi
s sch
edul
e.
A-218

Stat
e of
Mon
tana
Sche
dule
of E
xpen
ditu
res o
f Fed
eral
Aw
ards
For t
he Fi
scal
Yea
r End
ed Ju
ne 3
0, 2
019
Amou
nt to
Sub
recip
ient
sEx
pend
iture
sIN
STIT
UTE
OF M
USEU
M A
ND LI
BRAR
Y SE
RVIC
ES45
.301
Mus
eum
s for
Am
erica
$9,2
1845
.310
Gran
ts to
Sta
tes
$1
,123
,522
45.3
12Na
tiona
l Lea
ders
hip
Gran
ts
$2
0,19
6$1
24,4
3345
.313
Laur
a Bu
sh 2
1st C
entu
ry Li
brar
ian
Prog
ram
$47,
774
TOTA
L$1
,304
,947
INST
ITUT
E OF
MUS
EUM
AND
LIBR
ARY
SERV
ICES
TOT
AL$1
,304
,947
LIBRA
RY O
F CON
GRES
S42
.UXX
Misc
ella
neou
s Non
-Maj
or G
rant
s
$9,4
22TO
TAL
$9,4
22
LIBR
ARY
OF C
ONGR
ESS
TOTA
L$9
,422
NATI
ONAL
AER
ONAU
TICS
AND
SPA
CE A
DMIN
ISTR
ATIO
N43
.001
Scie
nce
$165
,278
S
pace
Scie
nce
Inst
itute
9
50$1
,729
U
nive
rsity
of W
ashi
ngto
n
UW
SC89
87$3
4,42
043
.008
Educ
atio
n
Scie
ncen
ter
20
16-0
1-UM
T/NN
X16A
M22
G$9
,928
TOTA
L$2
11,3
55
NATI
ONAL
AER
ONAU
TICS
AND
SPA
CE A
DMIN
ISTR
ATIO
N TO
TAL
$211
,355
NATI
ONAL
ARC
HIVE
S AN
D RE
CORD
S AD
MIN
ISTR
ATIO
N89
.003
Natio
nal H
istor
ical P
ublic
atio
ns a
nd R
ecor
ds G
rant
s
$14,
621
TOTA
L$1
4,62
1
NATI
ONAL
ARC
HIVE
S AN
D RE
CORD
S AD
MIN
ISTR
ATIO
N TO
TAL
$14,
621
NATI
ONAL
END
OWM
ENT
FOR
THE
ARTS
45.0
24Pr
omot
ion
of th
e Ar
ts G
rant
s to
Orga
niza
tions
and
Indi
vidu
als
$2
9,35
1
Art
s Mid
wes
t
0001
9995
$546
A
rts M
idw
est
00
0219
28$2
4,99
245
.025
Prom
otio
n of
the
Arts
Par
tner
ship
Agr
eem
ents
$372
,152
$741
,756
TOTA
L$7
96,6
45
NATI
ONAL
END
OWM
ENT
FOR
THE
ARTS
TOT
AL$7
96,6
45
The
acco
mpa
nyin
g no
tes a
re a
n in
tegr
al p
art o
f thi
s sch
edul
e.
A-219

Stat
e of
Mon
tana
Sche
dule
of E
xpen
ditu
res o
f Fed
eral
Aw
ards
For t
he Fi
scal
Yea
r End
ed Ju
ne 3
0, 2
019
Amou
nt to
Sub
recip
ient
sEx
pend
iture
sNA
TION
AL E
NDOW
MEN
T FO
R TH
E HU
MAN
ITIE
S45
.129
Prom
otio
n of
the
Hum
aniti
es F
eder
al/S
tate
Par
tner
ship
H
uman
ities
Mon
tana
1
7R06
4$8
50
Hum
aniti
es M
onta
na
17R
025
$6,4
3445
.149
Prom
otio
n of
the
Hum
aniti
es D
ivisi
on o
f Pre
serv
atio
n an
d Ac
cess
$93,
394
I
daho
Sta
te H
istor
ical S
ocie
ty
$1
16,1
3445
.163
Prom
otio
n of
the
Hum
aniti
es P
rofe
ssio
nal D
evel
opm
ent
$9
6,84
9TO
TAL
$313
,661
NATI
ONAL
END
OWM
ENT
FOR
THE
HUM
ANIT
IES
TOTA
L$3
13,6
61NA
TION
AL S
CIEN
CE FO
UNDA
TION
47.0
76Ed
ucat
ion
and
Hum
an R
esou
rces
S
alish
Koo
tena
i Col
lege
1
1023
62$3
82TO
TAL
$382
NATI
ONAL
SCI
ENCE
FOU
NDAT
ION
TOTA
L$3
82PE
ACE
CORP
S45
.400
Peac
e Co
rps’
Glob
al H
ealth
and
PEP
FAR
Initi
ativ
e Pr
ogra
m
$1
0,13
0TO
TAL
$10,
130
PEAC
E CO
RPS
TOTA
L$1
0,13
0SM
ALL B
USIN
ESS
ADM
INIS
TRAT
ION
59.0
37Sm
all B
usin
ess D
evel
opm
ent C
ente
rs
$7
18,3
8959
.058
Fede
ral a
nd S
tate
Tec
hnol
ogy
Part
ners
hip
Prog
ram
$56,
143
59.0
61St
ate
Trad
e Ex
pans
ion
$402
,931
TOTA
L$1
,177
,463
SMAL
L BUS
INES
S AD
MIN
ISTR
ATIO
N TO
TAL
$1,1
77,4
63SO
CIAL
SEC
URIT
Y AD
MIN
ISTR
ATIO
N96
.008
Socia
l Sec
urity
- W
ork
Ince
ntiv
es P
lann
ing
and
Assis
tanc
e Pr
ogra
m
$6
4,92
7$1
93,7
80TO
TAL
$193
,780
Disa
bilit
y In
sura
nce/
SSI C
lust
er96
.001
Socia
l Sec
urity
Disa
bilit
y In
sura
nce
$5,8
25,7
80TO
TAL
$5,8
25,7
80
SOCI
AL S
ECUR
ITY
ADM
INIS
TRAT
ION
TOTA
L$6
,019
,560
The
acco
mpa
nyin
g no
tes a
re a
n in
tegr
al p
art o
f thi
s sch
edul
e.
A-220

Stat
e of
Mon
tana
Sche
dule
of E
xpen
ditu
res o
f Fed
eral
Aw
ards
For t
he Fi
scal
Yea
r End
ed Ju
ne 3
0, 2
019
Rese
arch
and
Dev
elop
men
t Clu
ster
Amou
nt to
Sub
recip
ient
s
E
xpen
ditu
res
DEPA
RTM
ENT
OF A
GRIC
ULTU
REAg
ricul
tura
l Res
earc
h Se
rvice
10.0
01Ag
ricul
tura
l Res
earc
h Ba
sic a
nd A
pplie
d Re
sear
ch
$1
83,1
98
Sou
th D
akot
a St
ate
Univ
ersit
y
3TN
612
$15,
036
S
outh
Dak
ota
Stat
e Un
iver
sity
3
TK61
2$9
,006
W
ashi
ngto
n St
ate
Univ
ersit
y
134
967-
G003
986
$1,3
62An
imal
and
Pla
nt H
ealth
Insp
ectio
n Se
rvice
10.0
25Pl
ant a
nd A
nim
al D
iseas
e, P
est C
ontr
ol, a
nd A
nim
al C
are
$42,
000
$502
,913
U
tah
Stat
e Un
iver
sity
2
0059
2-39
0$3
8,35
9Ec
onom
ic Re
sear
ch S
ervi
ce10
.250
Agric
ultu
ral a
nd R
ural
Eco
nom
ic Re
sear
ch, C
oope
rativ
e Ag
reem
ents
and
Col
labo
ratio
ns
$1
3,88
6
Cor
nell
Cent
er fo
r Beh
avio
ral E
cono
mics
in C
hild
Nut
ritio
n
778
67-1
0660
$1,7
76Fa
rm S
ervi
ce A
genc
y10
.406
Farm
Ope
ratin
g Lo
ans
($
2,30
9)Fo
reig
n Ag
ricul
tura
l Ser
vice
10.6
10Ex
port
Gua
rant
ee P
rogr
am
$9
6,44
2$2
18,0
0310
.960
Tech
nica
l Agr
icultu
ral A
ssist
ance
R
utge
rs, T
he S
tate
Uni
vers
ity o
f New
Jers
ey
SA#
5566
; PO
5669
45$1
2,45
4Fo
rest
Ser
vice
10.6
52Fo
rest
ry R
esea
rch
$12,
886
$3,7
36,4
16
Hyd
roso
lutio
ns In
c.
MSA
201
7-TO
1$5
1,98
6
Nat
ureS
erve
M
T-02
4-FY
18 U
SFOR
064-
000
$11,
816
R
iver
Man
agem
ent S
ocie
ty
201
7RM
S-W
SR50
($7,
759)
10.6
64Co
oper
ativ
e Fo
rest
ry A
ssist
ance
$10,
282
10.6
72Ru
ral D
evel
opm
ent,
Fore
stry
, and
Com
mun
ities
$1,8
0910
.680
Fore
st H
ealth
Pro
tect
ion
$1,1
29$1
12,2
66
Sal
ish K
oote
nai C
olle
ge
201
5-38
424-
2403
1$6
,700
10.6
84In
tern
atio
nal F
ores
try
Prog
ram
s
$25,
000
$556
,273
10.6
99Pa
rtne
rshi
p Ag
reem
ents
$147
,964
Misc
ella
neou
s10
.RD
Misc
ella
neou
s Res
earc
h an
d De
velo
pmen
t
$268
,399
U
nive
rsity
of C
alifo
rnia
, Dav
is
A17
-083
7-S0
01$3
5,61
2
The
acco
mpa
nyin
g no
tes a
re a
n in
tegr
al p
art o
f thi
s sch
edul
e.
A-221

Stat
e of
Mon
tana
Sche
dule
of E
xpen
ditu
res o
f Fed
eral
Aw
ards
For t
he Fi
scal
Yea
r End
ed Ju
ne 3
0, 2
019
Rese
arch
and
Dev
elop
men
t Clu
ster
Amou
nt to
Sub
recip
ient
s
E
xpen
ditu
res
U
nive
rsity
of I
llino
is at
Urb
ana-
Cham
paig
n
078
863-
1698
3$1
07,1
38Na
tiona
l Ins
titut
e of
Food
and
Agr
icultu
re10
.200
Gran
ts fo
r Agr
icultu
ral R
esea
rch,
Spe
cial R
esea
rch
Gran
ts
Uni
vers
ity o
f Cal
iforn
ia, D
avis
A
18-1
334-
S001
$4,2
48
Uni
vers
ity o
f Ida
ho
AP1
008-
SB1-
8708
48/P
0057
780
$9,2
1510
.202
Coop
erat
ive
Fore
stry
Res
earc
h
$4
97,2
7910
.203
Paym
ents
to A
gricu
ltura
l Exp
erim
ent S
tatio
ns U
nder
the
Hatc
h Ac
t
$2,5
33,1
3210
.207
Anim
al H
ealth
and
Dise
ase
Rese
arch
$41,
593
10.2
15Su
stai
nabl
e Ag
ricul
ture
Res
earc
h an
d Ed
ucat
ion
$119
,563
$784
,577
U
nive
rsity
of I
daho
B
JKP8
5-SB
-001
/PO0
0505
3$3
0,86
6
Uta
h St
ate
Univ
ersit
y
201
207-
554
$32,
031
U
tah
Stat
e Un
iver
sity
1
5089
3-00
001-
174
$82,
347
U
tah
Stat
e Un
iver
sity
2
0059
2-39
0$5
0,87
8
Uta
h St
ate
Univ
ersit
y
140
8670
26-2
33$8
84$3
7,41
0
Uta
h St
ate
Univ
ersit
y
201
207-
587
$4,9
11
Uta
h St
ate
Univ
ersit
y
200
592-
395
$36,
444
U
tah
Stat
e Un
iver
sity
2
0059
2-38
4$1
2,85
7
Uta
h St
ate
Univ
ersit
y
200
592-
385
$5,4
95
Uta
h St
ate
Univ
ersit
y
200
592-
447
$6,2
02
Uta
h St
ate
Univ
ersit
y
201
207-
597
$1,6
54
Uta
h St
ate
Univ
ersit
y
140
8670
34-3
67$1
U
tah
Stat
e Un
iver
sity
2
0120
7-50
4$2
4,12
210
.217
High
er E
duca
tion
- Ins
titut
ion
Chal
leng
e Gr
ants
Pro
gram
$25,
187
$96,
528
10.2
2719
94 In
stitu
tions
Res
earc
h Pr
ogra
m
For
t Pec
k Co
mm
unity
Col
lege
F
PCC-
0920
18-0
01$1
,702
L
ittle
Big
Hor
n Co
llege
$6,7
54
Sal
ish K
oote
nai C
olle
ge
201
6-38
424-
2558
$3,7
78
Sal
ish K
oote
nai C
olle
ge
201
5-38
424-
2266
8$5
,862
S
alish
Koo
tena
i Col
lege
1
$14,
821
S
alish
Koo
tena
i Col
lege
S
AA-1
6-M
SU-0
01$1
5,48
310
.303
Inte
grat
ed P
rogr
ams
$1
21,9
43
The
acco
mpa
nyin
g no
tes a
re a
n in
tegr
al p
art o
f thi
s sch
edul
e.
A-222

Stat
e of
Mon
tana
Sche
dule
of E
xpen
ditu
res o
f Fed
eral
Aw
ards
For t
he Fi
scal
Yea
r End
ed Ju
ne 3
0, 2
019
Rese
arch
and
Dev
elop
men
t Clu
ster
Amou
nt to
Sub
recip
ient
s
E
xpen
ditu
res
10.3
04Ho
mel
and
Secu
rity
Agric
ultu
ral
Kan
sas S
tate
Uni
vers
ity
S17
045
$29,
802
10.3
07Or
gani
c Agr
icultu
re R
esea
rch
and
Exte
nsio
n In
itiat
ive
$3,7
50$4
4,00
3
Nat
iona
l Cen
ter f
or A
ppro
pria
te T
echn
olog
y
$23,
680
10.3
09Sp
ecia
lty C
rop
Rese
arch
Initi
ativ
e
$1
72,4
80
Col
orad
o St
ate
Univ
ersit
y
G-1
363-
04$1
3,68
7
Cor
nell
Univ
ersit
y
739
99-1
0426
$84,
206
U
nive
rsity
of M
inne
sota
H
0070
8250
3$1
7,64
2
Uni
vers
ity o
f Ten
ness
ee
850
0042
739
$18,
275
10.3
10Ag
ricul
ture
and
Foo
d Re
sear
ch In
itiat
ive
(AFR
I)
$1
56,8
07$1
,585
,524
C
olor
ado
Stat
e Un
iver
sity
G
-916
00-3
$166
,336
C
olor
ado
Stat
e Un
iver
sity
G
-916
00-2
($5,
843)
K
ansa
s Sta
te U
nive
rsity
S
1518
4$4
,184
N
orth
Car
olin
a St
ate
Univ
ersit
y
201
5-00
97-0
5$8
,158
T
he U
nive
rsity
of N
orth
Car
olin
a at
Gre
ensb
oro
2
0180
006.
1$1
,362
U
nive
rsity
of C
alifo
rnia
, Dav
is
201
6035
66-0
8$2
13,1
49
Uni
vers
ity o
f Neb
rask
a- Li
ncol
n
25-
6268
-000
5-00
4$3
83
Uni
vers
ity o
f Neb
rask
a-Lin
coln
2
5-62
68-0
005-
004
$334
U
nive
rsity
of V
erm
ont
29
034S
UB51
753
$24,
966
10.3
12Bi
omas
s Res
earc
h an
d De
velo
pmen
t Ini
tiativ
e Co
mpe
titiv
e Gr
ants
Pro
gram
(BRD
I)
$6
6,56
6$3
42,5
1010
.318
Wom
en a
nd M
inor
ities
in S
cienc
e, T
echn
olog
y, E
ngin
eerin
g, a
nd M
athe
mat
ics F
ield
s
$17,
544
10.3
29Cr
op P
rote
ctio
n an
d Pe
st M
anag
emen
t Com
petit
ive
Gran
ts P
rogr
am
$1
04,6
80$4
63,3
6710
.330
Alfa
lfa a
nd F
orag
e Re
sear
ch P
rogr
am
$7
9,09
3
Uni
vers
ity o
f Cal
iforn
ia, D
avis
A
18-0
619-
S003
$38,
490
10.5
00Co
oper
ativ
e Ex
tens
ion
Serv
ice
$3
4,24
1$3
,163
,880
Natu
ral R
esou
rces
Con
serv
atio
n Se
rvice
10.9
02So
il an
d W
ater
Con
serv
atio
n
$2
66,0
54
Phe
asan
ts F
orev
er, I
nc.
LP
CI 1
8-01
$83,
647
$245
,363
P
heas
ants
For
ever
, Inc
.
68-3
A75-
16-7
36$1
66,0
6410
.903
Soil
Surv
ey
$7
5,58
010
.912
Envi
ronm
enta
l Qua
lity
Ince
ntiv
es P
rogr
am
$2
5,62
9
The
acco
mpa
nyin
g no
tes a
re a
n in
tegr
al p
art o
f thi
s sch
edul
e.
A-223

Stat
e of
Mon
tana
Sche
dule
of E
xpen
ditu
res o
f Fed
eral
Aw
ards
For t
he Fi
scal
Yea
r End
ed Ju
ne 3
0, 2
019
Rese
arch
and
Dev
elop
men
t Clu
ster
Amou
nt to
Sub
recip
ient
s
E
xpen
ditu
res
Risk
Man
agem
ent A
genc
y10
.460
Risk
Man
agem
ent E
duca
tion
Part
ners
hips
$51,
354
Rura
l Bus
ines
s Coo
pera
tive
Serv
ice10
.350
Tech
nica
l Ass
istan
ce to
Coo
pera
tives
N
atio
nal A
ssoc
iatio
n of
Dev
elop
men
t Org
aniza
tions
8
00.0
1$1
97,4
39US
DA, O
ffice
of t
he C
hief
Eco
nom
ist10
.290
Agric
ultu
ral M
arke
t and
Eco
nom
ic Re
sear
ch
$3
,083
DEPA
RTM
ENT
OF A
GRIC
ULTU
RE T
OTAL
$18,
032,
497
DEPA
RTM
ENT
OF C
OMM
ERCE
Natio
nal I
nstit
ute
of S
tand
ards
and
Tec
hnol
ogy
11.6
20Sc
ienc
e, T
echn
olog
y, B
usin
ess a
nd/o
r Edu
catio
n Ou
trea
ch
$1
0,00
0Na
tiona
l Oce
anic
and
Atm
osph
eric
Adm
inist
ratio
n11
.431
Clim
ate
and
Atm
osph
eric
Rese
arch
$130
,518
U
nive
rsity
Cor
pora
tion
for A
tmos
pher
ic Re
sear
ch
SUB
SAW
D000
858
$120
,742
11.4
38Pa
cific
Coas
t Sal
mon
Rec
over
y Pa
cific
Salm
on T
reat
y Pr
ogra
m
Ber
ing
Sea
Fish
erm
en's
Asso
ciatio
n
AC-
1609
$29,
004
11.4
72Un
allie
d Sc
ienc
e Pr
ogra
m
Nor
th P
acifi
c Res
earc
h Bo
ard
1
718B
$45,
015
N
orth
Pac
ific R
esea
rch
Boar
d
171
8A$1
4,08
3
DEPA
RTM
ENT
OF C
OMM
ERCE
TOT
AL$3
49,3
62DE
PART
MEN
T OF
DEF
ENSE
Adva
nced
Res
earc
h Pr
ojec
ts A
genc
y12
.910
Rese
arch
and
Tec
hnol
ogy
Deve
lopm
ent
$4
94,4
86$1
,238
,167
N
orth
Car
olin
a St
ate
Univ
ersit
y
201
6-28
96-0
4$3
77,5
63De
fens
e Lo
gist
ics A
genc
y12
.002
Proc
urem
ent T
echn
ical A
ssist
ance
For
Bus
ines
s Firm
s
B
ig S
ky E
cono
mic
Deve
lopm
ent A
utho
rity
S
P480
0-17
-2-1
722
$14,
224
B
ig S
ky E
cono
mic
Deve
lopm
ent A
utho
rity
S
P480
0-18
-2-1
822
$70,
359
The
acco
mpa
nyin
g no
tes a
re a
n in
tegr
al p
art o
f thi
s sch
edul
e.
A-224

Stat
e of
Mon
tana
Sche
dule
of E
xpen
ditu
res o
f Fed
eral
Aw
ards
For t
he Fi
scal
Yea
r End
ed Ju
ne 3
0, 2
019
Rese
arch
and
Dev
elop
men
t Clu
ster
Amou
nt to
Sub
recip
ient
s
E
xpen
ditu
res
Depa
rtm
ent o
f the
Air
Forc
e12
.800
Air F
orce
Def
ense
Res
earc
h Sc
ienc
es P
rogr
am
$1
,637
,396
$17,
881,
616
U
nive
rsity
of M
inne
sota
A
0057
2060
2$1
99,8
14De
part
men
t of t
he A
rmy
12.1
14Co
llabo
rativ
e Re
sear
ch a
nd D
evel
opm
ent
$6
8,23
9
Wes
t Poi
nt M
ilita
ry A
cade
my
$31,
914
12.4
20M
ilita
ry M
edica
l Res
earc
h an
d De
velo
pmen
t
$290
,855
$992
,708
U
nive
rsity
of C
alifo
rnia
, Dav
is
A19
-038
2-S0
01$6
,299
12.4
31Ba
sic S
cient
ific R
esea
rch
$131
,361
$3,8
73,6
82De
part
men
t of t
he N
avy
12.3
00Ba
sic a
nd A
pplie
d Sc
ient
ific R
esea
rch
$246
,028
B
lack
mor
e Se
nsor
s and
Ana
lytic
s
$84,
980
S
2 Co
rpor
atio
n
S2-
5504
-15-
01UC
$57,
107
T
PS A
ssoc
iate
s, In
c.
PO
MSU
-797
1/30
02$3
,106
Misc
ella
neou
s12
.RD
Misc
ella
neou
s Res
earc
h an
d De
velo
pmen
t
$46,
747
$4,4
77,4
30
Duk
e Un
iver
sity
3
13-0
873
$47,
260
D
uke
Univ
ersit
y
SUB
CONT
RACT
NUM
BER
313-
0742
$166
,813
E
aste
rn B
and
of C
hero
kee
Indi
ans
19
0016
3$1
6,17
2
Lei
dos
PO
1016
9067
($28
)
Nut
roni
cs, I
nc.
SU
BK-M
SU-V
DHW
FS-0
1-10
0518
$36,
243
N
utro
nics
, Inc
.
SUBK
-MSU
-NLA
O-01
-100
518
$45,
664
N
utro
nics
, Inc
.
SUBK
-MSU
-COR
CS-0
1-10
0518
$75,
010
S
2 Co
rpor
atio
n
S2-
1954
-16-
01$5
16
S2
Corp
orat
ion
S
2-17
-000
3-01
($14
9)
S2
Corp
orat
ion
S
2-55
04-1
6-01
C$2
7,27
9
Sm
artr
onix
1
8-01
8PO
$31,
718
S
pect
ral M
olec
ular
Imag
ing
($
108)
T
ufts
Uni
vers
ity
ARM
212-
MSU
/ PO#
EP0
1663
21$4
9,18
7
Woo
ds H
ole
Rese
arch
Cen
ter
W
HRC-
NG04
61-0
1$2
9,95
0
The
acco
mpa
nyin
g no
tes a
re a
n in
tegr
al p
art o
f thi
s sch
edul
e.
A-225

Stat
e of
Mon
tana
Sche
dule
of E
xpen
ditu
res o
f Fed
eral
Aw
ards
For t
he Fi
scal
Yea
r End
ed Ju
ne 3
0, 2
019
Rese
arch
and
Dev
elop
men
t Clu
ster
Amou
nt to
Sub
recip
ient
s
E
xpen
ditu
res
Offic
e of
the
Secr
etar
y of
Def
ense
12.6
30Ba
sic, A
pplie
d, a
nd A
dvan
ced
Rese
arch
in S
cienc
e an
d En
gine
erin
g
Nat
iona
l Scie
nce
Teac
hers
Ass
ocia
tion
$22,
742
T
echn
olog
y St
uden
t Ass
ocia
tion
$38,
507
12.6
32Le
gacy
Res
ourc
e M
anag
emen
t Pro
gram
$137
,186
DEPA
RTM
ENT
OF D
EFEN
SE T
OTAL
$30,
347,
198
DEPA
RTM
ENT
OF E
DUCA
TION
Inst
itute
of E
duca
tion
Scie
nces
84.3
05Ed
ucat
ion
Rese
arch
, Dev
elop
men
t and
Diss
emin
atio
n
SRI
Inte
rnat
iona
l
51-0
0131
2$1
30,7
46
Uni
vers
ity o
f Miss
ouri
C
0006
4217
-1$2
0,30
4Of
fice
of E
lem
enta
ry a
nd S
econ
dary
Edu
catio
n84
.299
Indi
an E
duca
tion
-- Sp
ecia
l Pro
gram
s for
Indi
an C
hild
ren
$422
,661
84.3
67Su
ppor
ting
Effe
ctiv
e In
stru
ctio
n St
ate
Gran
ts
Nat
iona
l Writ
ing
Proj
ect
09
-MT0
2-SE
ED20
17 IL
I($
23)
Offic
e of
Pos
tsec
onda
ry E
duca
tion
84.1
16Fu
nd fo
r the
Impr
ovem
ent o
f Pos
tsec
onda
ry E
duca
tion
W
este
rn In
ters
tate
Com
miss
ion
for H
ighe
r Edu
catio
n
$2
,056
84.2
17TR
IO M
cNai
r Pos
t-Bac
cala
urea
te A
chie
vem
ent
$1
53,1
71
DEPA
RTM
ENT
OF E
DUCA
TION
TOT
AL$7
28,9
15DE
PART
MEN
T OF
ENE
RGY
81.0
49Of
fice
of S
cienc
e Fi
nanc
ial A
ssist
ance
Pro
gram
$594
,057
$1,5
21,1
15
Am
ethy
st R
esea
rch
Inc.
$2
4,81
9
Gla
cigen
Mat
eria
ls, In
c.
$5
4,61
1
Mon
tana
Em
erge
nt T
echn
olog
ies
$2
36,4
50
Uni
vers
ity o
f Wyo
min
g
DE-
SC00
1267
1$1
75,4
00
Was
hing
ton
Stat
e Un
iver
sity
1
3234
5-G0
0379
7$1
18,1
11
Was
hing
ton
Stat
e Un
iver
sity
1
3412
4-G0
0396
8$1
22,2
19
Yal
e Un
iver
sity
G
R104
542
(CON
-800
0148
0)$1
19,2
59
The
acco
mpa
nyin
g no
tes a
re a
n in
tegr
al p
art o
f thi
s sch
edul
e.
A-226

Stat
e of
Mon
tana
Sche
dule
of E
xpen
ditu
res o
f Fed
eral
Aw
ards
For t
he Fi
scal
Yea
r End
ed Ju
ne 3
0, 2
019
Rese
arch
and
Dev
elop
men
t Clu
ster
Amou
nt to
Sub
recip
ient
s
E
xpen
ditu
res
81.0
86Co
nser
vatio
n Re
sear
ch a
nd D
evel
opm
ent
$2
,882
,843
K
oote
nai T
ribe
of Id
aho
2
002-
011-
00-F
WP-
FY19
$79,
611
K
oote
nai T
ribe
of Id
aho
2
002-
011-
00-F
WP-
FY18
$104
,719
81.0
87Re
new
able
Ene
rgy
Rese
arch
and
Dev
elop
men
t
$2,3
20
Cle
mso
n Un
iver
sity
2
107-
219-
2023
054
$34,
784
M
ichig
an S
tate
Uni
vers
ity
RC1
0773
9$1
40,2
85
Oce
an R
enew
able
Pow
er C
ompa
ny
$2
,582
U
nive
rsity
of T
oled
o
F-2
019-
14$1
72,9
1481
.089
Foss
il En
ergy
Res
earc
h an
d De
velo
pmen
t
$599
,071
$2,2
79,0
4781
.121
Nucle
ar E
nerg
y Re
sear
ch, D
evel
opm
ent a
nd D
emon
stra
tion
$64,
390
81.1
35Ad
vanc
ed R
esea
rch
Proj
ects
Age
ncy
- Ene
rgy
C
orne
ll Un
iver
sity
8
4185
-110
60$1
,200
Misc
ella
neou
s81
.RD
Misc
ella
neou
s Res
earc
h an
d De
velo
pmen
t
B
atte
lle E
nerg
y Al
lianc
e
DE-
AC07
-05I
D145
17$4
3
San
dia
Natio
nal L
abor
ator
ies
16
6330
2$1
6,88
1
San
dia
Natio
nal L
abor
ator
ies
19
2224
4$3
5,83
5
DEPA
RTM
ENT
OF E
NERG
Y TO
TAL
$8,1
89,4
38DE
PART
MEN
T OF
HEA
LTH
AND
HUM
AN S
ERVI
CES
Adm
inist
ratio
n fo
r Chi
ldre
n an
d Fa
mili
es93
.670
Child
Abu
se a
nd N
egle
ct D
iscre
tiona
ry A
ctiv
ities
F
utur
es W
ithou
t Vio
lenc
e
243
8$5
,437
F
utur
es W
ithou
t Vio
lenc
e
275
6$3
1,87
9
Fut
ures
With
out V
iole
nce
2
671
$35,
179
Adm
inist
ratio
n fo
r Com
mun
ity Li
ving
93.4
33AC
L Nat
iona
l Ins
titut
e on
Disa
bilit
y, In
depe
nden
t Liv
ing,
and
Reh
abili
tatio
n Re
sear
ch
$1
50,2
60$1
,672
,090
I
nstit
ute
for R
ehab
ilita
tion
and
Rese
arch
1
8-M
S2-0
17$1
7,82
7
Ins
titut
e fo
r Reh
abili
tatio
n an
d Re
sear
ch
18-
PDR-
01$2
,330
I
nstit
ute
for R
ehab
ilita
tion
and
Rese
arch
1
9-M
S2-0
17$3
7,11
5
Uni
vers
ity o
f Kan
sas
FY
2017
-048
$54,
486
$258
,479
The
acco
mpa
nyin
g no
tes a
re a
n in
tegr
al p
art o
f thi
s sch
edul
e.
A-227

Stat
e of
Mon
tana
Sche
dule
of E
xpen
ditu
res o
f Fed
eral
Aw
ards
For t
he Fi
scal
Yea
r End
ed Ju
ne 3
0, 2
019
Rese
arch
and
Dev
elop
men
t Clu
ster
Amou
nt to
Sub
recip
ient
s
E
xpen
ditu
res
93.6
32Un
iver
sity
Cent
ers f
or E
xcel
lenc
e in
Dev
elop
men
tal D
isabi
litie
s Edu
catio
n, R
esea
rch,
and
Se
rvice
$556
,500
Cent
ers f
or D
iseas
e Co
ntro
l and
Pre
vent
ion
93.1
36In
jury
Pre
vent
ion
and
Cont
rol R
esea
rch
and
Stat
e an
d Co
mm
unity
Bas
ed P
rogr
ams
$1
18,8
27$3
79,6
9193
.184
Disa
bilit
ies P
reve
ntio
n
Spe
cial O
lym
pics
Y
R 18
-800
-133
$20,
000
93.2
62Oc
cupa
tiona
l Saf
ety
and
Heal
th P
rogr
am
$1
01,2
91
Pen
nsyl
vani
a St
ate
Univ
ersit
y
596
5-M
SU-C
SU-1
107
$32,
196
P
enns
ylva
nia
Stat
e Un
iver
sity
5
867-
MSU
-CSU
-110
7$3
7,01
0
Uni
vers
ity o
f Col
orad
o
FY1
8.34
7.00
4$2
,742
93.4
24NO
N-AC
A/PP
HF—
Build
ing
Capa
city
of th
e Pu
blic
Heal
th S
yste
m to
Impr
ove
Popu
latio
n He
alth
th
roug
h Na
tiona
l Non
prof
it Or
gani
zatio
ns
Ass
ocia
tion
of M
ater
nal &
Chi
ld H
ealth
Pro
gram
s
0327
18-3
6A$9
,831
N
atio
nal A
ssoc
iatio
n of
Chr
onic
Dise
ase
Dire
ctor
s
1312
018
$128
N
atio
nal A
ssoc
iatio
n of
Chr
onic
Dise
ase
Dire
ctor
s
251-
1501
-1 #
2702
019
$1,2
95
93.9
44Hu
man
Imm
unod
efici
ency
Viru
s (HI
V)/A
cqui
red
Imm
unod
efici
ency
Viru
s Syn
drom
e (A
IDS)
Su
rvei
llanc
e
Ass
ocia
tion
of U
nive
rsity
Cen
ters
on
Disa
bilit
ies
$5,4
91Fo
od a
nd D
rug
Adm
inist
ratio
n93
.103
Food
and
Dru
g Ad
min
istra
tion
Rese
arch
$39,
041
Heal
th R
esou
rces
and
Ser
vice
s Adm
inist
ratio
n93
.107
Area
Hea
lth E
duca
tion
Cent
ers
$4
53,9
38$7
87,3
9893
.110
Mat
erna
l and
Chi
ld H
ealth
Fed
eral
Con
solid
ated
Pro
gram
s
U
tah
Stat
e Un
iver
sity
P
O369
026-
E$7
3
Uta
h St
ate
Univ
ersit
y
PO4
0594
7-E
$9,0
0093
.155
Rura
l Hea
lth R
esea
rch
Cent
ers
Nat
iona
l Rur
al H
ealth
Ass
ocia
tion
N
RHA
2019
$5,3
1293
.178
Nurs
ing
Wor
kfor
ce D
iver
sity
($19
3)93
.301
Smal
l Rur
al H
ospi
tal I
mpr
ovem
ent G
rant
Pro
gram
$385
,927
$443
,816
93.3
59Nu
rse
Educ
atio
n, P
ract
ice Q
ualit
y an
d Re
tent
ion
Gran
ts
$2
01,0
60$6
52,8
9293
.504
Fam
ily to
Fam
ily H
ealth
Info
rmat
ion
Cent
ers
$4
,947
93.7
32M
enta
l and
Beh
avio
ral H
ealth
Edu
catio
n an
d Tr
aini
ng G
rant
s
$415
,881
The
acco
mpa
nyin
g no
tes a
re a
n in
tegr
al p
art o
f thi
s sch
edul
e.
A-228

Stat
e of
Mon
tana
Sche
dule
of E
xpen
ditu
res o
f Fed
eral
Aw
ards
For t
he Fi
scal
Yea
r End
ed Ju
ne 3
0, 2
019
Rese
arch
and
Dev
elop
men
t Clu
ster
Amou
nt to
Sub
recip
ient
s
E
xpen
ditu
res
93.8
22He
alth
Car
eers
Opp
ortu
nity
Pro
gram
$257
,072
93.8
84Gr
ants
for P
rimar
y Ca
re T
rain
ing
and
Enha
ncem
ent
$7
5,68
3$4
55,4
4593
.913
Gran
ts to
Sta
tes f
or O
pera
tion
of S
tate
Offi
ces o
f Rur
al H
ealth
$181
,067
93.9
69PP
HF G
eria
tric
Educ
atio
n Ce
nter
s
$158
,812
$790
,741
Indi
an H
ealth
Ser
vice
93.9
33De
mon
stra
tion
Proj
ects
for I
ndia
n He
alth
B
lack
feet
Com
mun
ity C
olle
ge
201
4-01
-MSU
$4,6
69
For
t Pec
k Co
mm
unity
Col
lege
F
PCC
- AIH
EC$7
93.9
70He
alth
Pro
fess
ions
Rec
ruitm
ent P
rogr
am fo
r Ind
ians
$616
,718
Misc
ella
neou
s93
.RD
Misc
ella
neou
s Res
earc
h an
d De
velo
pmen
t
$653
,963
$3,6
44,1
00
Am
erica
n Pu
blic
Heal
th A
ssoc
iatio
n
$1
2,50
0
Bos
ton
Child
ren'
s Hos
pita
l
GENF
D000
1583
403
$142
,915
C
ell S
igna
ling
Tech
nolo
gy
K-0
0205
2$1
9
Duk
e Un
iver
sity
7
273
POPS
V$1
0,09
3
ICF
Inte
rnat
iona
l
17RW
SK00
07$7
5,90
9
ICF
Inte
rnat
iona
l
18BB
SK00
53 (H
HSN2
6100
014)
$58,
599
Natio
nal I
nstit
utes
of H
ealth
93.1
13En
viro
nmen
tal H
ealth
$570
,668
$2,1
14,9
77
Mea
dow
lark
Scie
nce
and
Educ
atio
n LL
C
UM
_ES0
1A1
$30,
235
M
ichig
an S
tate
Uni
vers
ity
RC1
0730
7MON
$105
,113
S
crip
ps R
esea
rch
Inst
itute
5
-532
34$6
5,36
2
Uni
vers
ity o
f New
Mex
ico
3RY
74 P
ILOT
PRO
JECT
$14,
930
U
nive
rsity
of N
ew M
exico
3
RY74
$68,
809
93.1
72Hu
man
Gen
ome
Rese
arch
I
nstit
ute
for S
yste
ms B
iolo
gy
201
8.00
08$3
3,70
9
Sou
thce
ntra
l Fou
ndat
ion
2
018-
201
$185
,262
93.1
73Re
sear
ch R
elat
ed to
Dea
fnes
s and
Com
mun
icatio
n Di
sord
ers
MGH
Inst
itute
of H
ealth
Pro
fess
ions
3
0032
6-01
$74,
522
M
GH In
stitu
te o
f Hea
lth P
rofe
ssio
ns
300
315
$98,
104
P
rom
iliad
Bio
phar
ma
Inc.
R
41-D
C017
641-
01$9
5,09
9
The
acco
mpa
nyin
g no
tes a
re a
n in
tegr
al p
art o
f thi
s sch
edul
e.
A-229

Stat
e of
Mon
tana
Sche
dule
of E
xpen
ditu
res o
f Fed
eral
Aw
ards
For t
he Fi
scal
Yea
r End
ed Ju
ne 3
0, 2
019
Rese
arch
and
Dev
elop
men
t Clu
ster
Amou
nt to
Sub
recip
ient
s
E
xpen
ditu
res
93.2
13Re
sear
ch a
nd T
rain
ing
in C
ompl
emen
tary
and
Inte
grat
ive
Heal
th
$4
3,41
7
Fla
t Ear
th, I
nc.
$2
9,19
693
.242
Men
tal H
ealth
Res
earc
h Gr
ants
$3,5
16
Uni
vers
ity o
f Was
hing
ton
U
WSC
1019
1 (B
PO28
076)
$1,4
2093
.273
Alco
hol R
esea
rch
Prog
ram
s
$29,
130
93.2
79Dr
ug A
buse
and
Add
ictio
n Re
sear
ch P
rogr
ams
$4
29
Yal
e Un
iver
sity
G
K000
120
(CON
-800
0042
6)$2
6,07
693
.286
Disc
over
y an
d Ap
plie
d Re
sear
ch fo
r Tec
hnol
ogica
l Inn
ovat
ions
to Im
prov
e Hu
man
Hea
lth
$1
04,9
43$1
95,2
9693
.307
Min
ority
Hea
lth a
nd H
ealth
Disp
ariti
es R
esea
rch
$325
,302
$731
,935
93.3
50Na
tiona
l Cen
ter f
or A
dvan
cing
Tran
slatio
nal S
cienc
es
Uni
vers
ity o
f Was
hing
ton
U
WSC
997
9$3
5,18
793
.351
Rese
arch
Infra
stru
ctur
e Pr
ogra
ms
$8
42,2
7093
.361
Nurs
ing
Rese
arch
M
edica
l Col
lege
of W
iscon
sin
PO
1759
446
$28,
328
U
nive
rsity
of F
lorid
a
UFD
SP00
0121
50$1
44,1
3193
.393
Canc
er C
ause
and
Pre
vent
ion
Rese
arch
$315
,876
93.8
37Ca
rdio
vasc
ular
Dise
ases
Res
earc
h
$6
1,04
4
Mou
nt S
inai
Sch
ool o
f Med
icine
0
255-
7875
-460
9($
102)
93.8
38Lu
ng D
iseas
es R
esea
rch
$237
,732
93.8
46Ar
thrit
is, M
uscu
losk
elet
al a
nd S
kin
Dise
ases
Res
earc
h
$1
6,14
193
.847
Diab
etes
, Dig
estiv
e, a
nd K
idne
y Di
seas
es E
xtra
mur
al R
esea
rch
$826
,875
93.8
53Ex
tram
ural
Res
earc
h Pr
ogra
ms i
n th
e Ne
uros
cienc
es a
nd N
euro
logi
cal D
isord
ers
$3
97,5
66$1
,945
,114
U
nive
rsity
of W
ashi
ngto
n
UW
SC10
752/
BPO
3477
4$3
2,31
1
Yal
e Un
iver
sity
M
17A1
2590
-GR1
0424
8 (8
0001
410)
$250
,683
93.8
55Al
lerg
y an
d In
fect
ious
Dise
ases
Res
earc
h
$1
,256
,480
$5,5
18,6
81
Alb
ert E
inst
ein
Colle
ge o
f Med
icine
P
0703
570
(SUB
NO:
311
94A)
$5,6
21
Em
ory
Univ
ersit
y
A15
6367
$246
H
arva
rd U
nive
rsity
1
1448
7-51
0946
8$3
4,45
6
Ind
iana
Uni
vers
ity
PO1
4643
01$6
4,50
9
Int
act G
enom
ics, I
nc.
18
_876
5MTU
$49,
991
O
hio
Stat
e Un
iver
sity
U
T182
09$2
,166
P
rom
iliad
Bio
phar
ma
Inc.
R
42AI
1181
04$1
,265
The
acco
mpa
nyin
g no
tes a
re a
n in
tegr
al p
art o
f thi
s sch
edul
e.
A-230
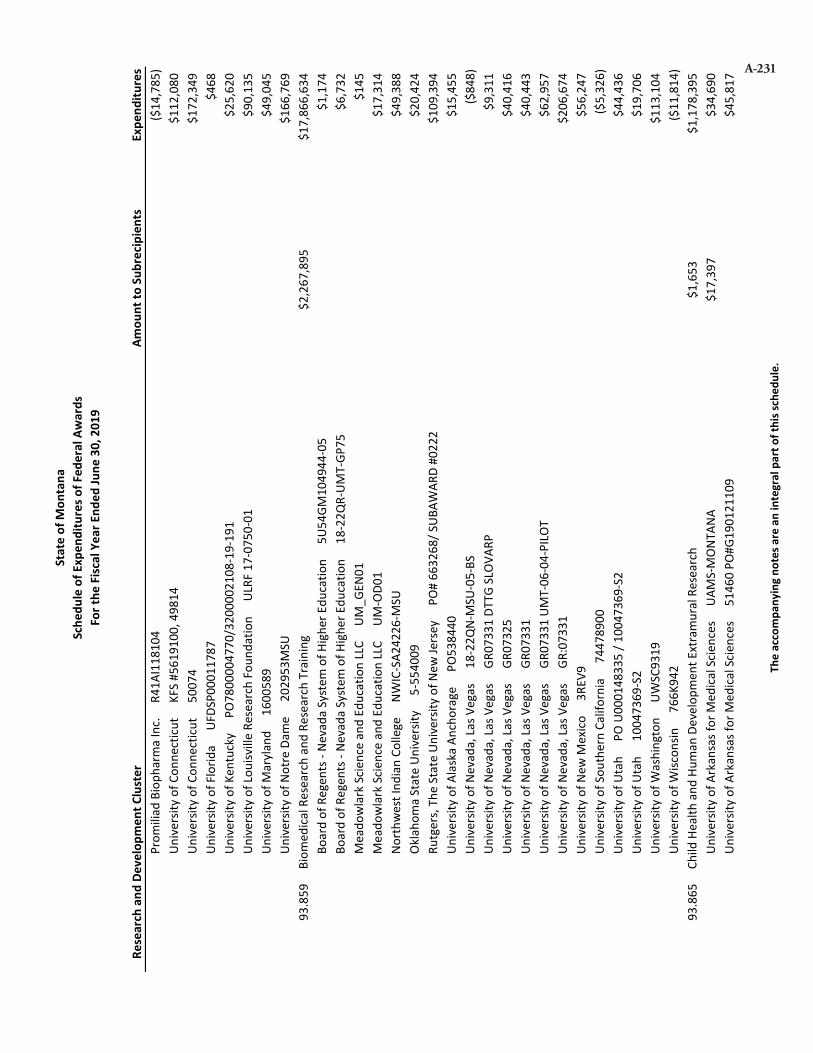
Stat
e of
Mon
tana
Sche
dule
of E
xpen
ditu
res o
f Fed
eral
Aw
ards
For t
he Fi
scal
Yea
r End
ed Ju
ne 3
0, 2
019
Rese
arch
and
Dev
elop
men
t Clu
ster
Amou
nt to
Sub
recip
ient
s
E
xpen
ditu
res
P
rom
iliad
Bio
phar
ma
Inc.
R
41AI
1181
04($
14,7
85)
U
nive
rsity
of C
onne
cticu
t
KFS
#561
9100
, 498
14$1
12,0
80
Uni
vers
ity o
f Con
nect
icut
50
074
$172
,349
U
nive
rsity
of F
lorid
a
UFD
SP00
0117
87$4
68
Uni
vers
ity o
f Ken
tuck
y
PO7
8000
0477
0/32
0000
2108
-19-
191
$25,
620
U
nive
rsity
of L
ouisv
ille
Rese
arch
Fou
ndat
ion
U
LRF
17-0
750-
01$9
0,13
5
Uni
vers
ity o
f Mar
ylan
d
160
0589
$49,
045
U
nive
rsity
of N
otre
Dam
e
202
953M
SU$1
66,7
6993
.859
Biom
edica
l Res
earc
h an
d Re
sear
ch T
rain
ing
$2,2
67,8
95$1
7,86
6,63
4
Boa
rd o
f Reg
ents
- Ne
vada
Sys
tem
of H
ighe
r Edu
catio
n
5U5
4GM
1049
44-0
5$1
,174
B
oard
of R
egen
ts -
Neva
da S
yste
m o
f Hig
her E
duca
tion
1
8-22
QR-
UMT-
GP75
$6,7
32
Mea
dow
lark
Scie
nce
and
Educ
atio
n LL
C
UM
_GEN
01$1
45
Mea
dow
lark
Scie
nce
and
Educ
atio
n LL
C
UM
-OD0
1$1
7,31
4
Nor
thw
est I
ndia
n Co
llege
N
WIC
-SA2
4226
-MSU
$49,
388
O
klah
oma
Stat
e Un
iver
sity
5
-554
009
$20,
424
R
utge
rs, T
he S
tate
Uni
vers
ity o
f New
Jers
ey
PO#
663
268/
SUB
AWAR
D #0
222
$109
,394
U
nive
rsity
of A
lask
a An
chor
age
P
O538
440
$15,
455
U
nive
rsity
of N
evad
a, La
s Veg
as
18-
22Q
N-M
SU-0
5-BS
($84
8)
Uni
vers
ity o
f Nev
ada,
Las V
egas
G
R073
31 D
TTG
SLOV
ARP
$9,3
11
Uni
vers
ity o
f Nev
ada,
Las V
egas
G
R073
25$4
0,41
6
Uni
vers
ity o
f Nev
ada,
Las V
egas
G
R073
31$4
0,44
3
Uni
vers
ity o
f Nev
ada,
Las V
egas
G
R073
31 U
MT-
06-0
4-PI
LOT
$62,
957
U
nive
rsity
of N
evad
a, La
s Veg
as
GR:
0733
1$2
06,6
74
Uni
vers
ity o
f New
Mex
ico
3RE
V9$5
6,24
7
Uni
vers
ity o
f Sou
ther
n Ca
lifor
nia
7
4478
900
($5,
326)
U
nive
rsity
of U
tah
P
O U0
0014
8335
/ 10
0473
69-S
2$4
4,43
6
Uni
vers
ity o
f Uta
h
100
4736
9-S2
$19,
706
U
nive
rsity
of W
ashi
ngto
n
UW
SC93
19$1
13,1
04
Uni
vers
ity o
f Wisc
onsin
7
66K9
42($
11,8
14)
93.8
65Ch
ild H
ealth
and
Hum
an D
evel
opm
ent E
xtra
mur
al R
esea
rch
$1,6
53$1
,178
,395
U
nive
rsity
of A
rkan
sas f
or M
edica
l Scie
nces
U
AMS-
MON
TANA
$17,
397
$34,
690
U
nive
rsity
of A
rkan
sas f
or M
edica
l Scie
nces
5
1460
PO#
G190
1211
09$4
5,81
7
The
acco
mpa
nyin
g no
tes a
re a
n in
tegr
al p
art o
f thi
s sch
edul
e.
A-231

Stat
e of
Mon
tana
Sche
dule
of E
xpen
ditu
res o
f Fed
eral
Aw
ards
For t
he Fi
scal
Yea
r End
ed Ju
ne 3
0, 2
019
Rese
arch
and
Dev
elop
men
t Clu
ster
Amou
nt to
Sub
recip
ient
s
E
xpen
ditu
res
93.8
66Ag
ing
Rese
arch
$49,
100
$53,
678
J
ohns
Hop
kins
Uni
vers
ity
200
3050
472
$19,
218
M
ichig
an S
tate
Uni
vers
ity
RC1
0887
7UM
$43,
089
U
nive
rsity
of W
ashi
ngto
n
UW
SC10
030/
BPO2
6347
$125
,229
93.8
67Vi
sion
Rese
arch
$154
,275
U
nive
rsity
of C
alifo
rnia
, Ber
kele
y
PO
#BB0
1134
177
$53,
496
93.8
79M
edica
l Lib
rary
Ass
istan
ce
Aug
usta
Uni
vers
ity R
esea
rch
Inst
itute
, Inc
.
3224
2-1
$23,
095
B
aylo
r Col
lege
of M
edici
ne
700
0000
701
$40,
114
I
nstit
ute
for R
ehab
ilita
tion
and
Rese
arch
1
8-NL
M-0
1($
3,09
9)Of
fice
of th
e Se
cret
ary
93.0
01Ci
vil R
ight
s and
Priv
acy
Rule
Com
plia
nce
Activ
ities
A
rrev
us
$6
6,50
0Su
bsta
nce
Abus
e an
d M
enta
l Hea
lth S
ervi
ces A
dmin
istra
tion
93.2
43Su
bsta
nce
Abus
e an
d M
enta
l Hea
lth S
ervi
ces P
roje
cts o
f Reg
iona
l and
Nat
iona
l Sig
nific
ance
$61,
103
$937
,086
C
omm
unity
Con
nect
ions
$24,
124
C
omm
unity
Impa
ct C
oalit
ion
$16,
171
H
arris
on C
ount
y Fa
mily
Res
ourc
e Ne
twor
k
$1
6,58
9
Pot
omac
Hig
hlan
ds G
uild
$16,
272
P
rest
era
Cent
er
$1
6,83
9
Wes
tbro
ok H
ealth
Ser
vice
s
$16,
767
DEPA
RTM
ENT
OF H
EALT
H AN
D HU
MAN
SER
VICE
S TO
TAL
$48,
315,
586
DEPA
RTM
ENT
OF JU
STIC
EOf
fice
of Ju
stice
Pro
gram
s16
.560
Natio
nal I
nstit
ute
of Ju
stice
Res
earc
h, E
valu
atio
n, a
nd D
evel
opm
ent P
roje
ct G
rant
s
$74,
237
DEPA
RTM
ENT
OF JU
STIC
E TO
TAL
$74,
237
DEPA
RTM
ENT
OF S
TATE
Bure
au o
f Edu
catio
nal a
nd C
ultu
ral A
ffairs
19.4
08Ac
adem
ic Ex
chan
ge P
rogr
ams -
Tea
cher
s
I
nter
natio
nal R
esea
rch
and
Exch
ange
s Boa
rd
FY1
9-FT
EA-M
SU-0
1$9
34
The
acco
mpa
nyin
g no
tes a
re a
n in
tegr
al p
art o
f thi
s sch
edul
e.
A-232

Stat
e of
Mon
tana
Sche
dule
of E
xpen
ditu
res o
f Fed
eral
Aw
ards
For t
he Fi
scal
Yea
r End
ed Ju
ne 3
0, 2
019
Rese
arch
and
Dev
elop
men
t Clu
ster
Amou
nt to
Sub
recip
ient
s
E
xpen
ditu
res
I
nter
natio
nal R
esea
rch
and
Exch
ange
s Boa
rd
FY1
8-TE
A-M
SU-0
2$4
4,90
4
Int
erna
tiona
l Res
earc
h an
d Ex
chan
ges B
oard
F
Y18-
TEA-
MSU
-01
$148
,972
19.4
15Pr
ofes
siona
l and
Cul
tura
l Exc
hang
e Pr
ogra
ms -
Citi
zen
Exch
ange
s
I
nstit
ute
of In
tern
atio
nal E
duca
tion
A
SPEN
INST
ITUT
E SI
IIEI
201
7$5
,506
Bure
au o
f Nea
r Eas
tern
Affa
irs19
.600
Bure
au o
f Nea
r Eas
tern
Affa
irs
Geo
rget
own
Univ
ersit
y
MSU
-GR2
0576
9$2
07,3
85
DEPA
RTM
ENT
OF S
TATE
TOT
AL$4
07,7
01DE
PART
MEN
T OF
THE
INTE
RIOR
Bure
au o
f Lan
d M
anag
emen
t15
.224
Cultu
ral a
nd P
aleo
ntol
ogica
l Res
ourc
es M
anag
emen
t
$100
,756
K
autz
Env
ironm
enta
l Con
sulta
nts,
Inc.
K
AUTZ
17-
18$3
6,34
4
Soc
iety
for C
alifo
rnia
Arc
haeo
logy
$11,
616
15.2
25Re
crea
tion
and
Visit
or S
ervi
ces
$2
7,21
415
.228
BLM
Wild
land
Urb
an In
terfa
ce C
omm
unity
Fire
Ass
istan
ce
$8
,043
15.2
30In
vasiv
e an
d No
xious
Pla
nt M
anag
emen
t
$17,
472
15.2
31Fi
sh, W
ildlif
e an
d Pl
ant C
onse
rvat
ion
Reso
urce
Man
agem
ent
$2
85,2
53
Wes
tern
Ass
ocia
tion
of F
ish a
nd W
ildlif
e Ag
encie
s
$26,
251
W
yom
ing
Gam
e an
d Fi
sh D
epar
tmen
t
0026
70$2
7715
.232
Wild
land
Fire
Res
earc
h an
d St
udie
s
$171
,990
U
tah
Stat
e Un
iver
sity
2
0058
8-00
001-
294
$13,
126
15.2
36En
viro
nmen
tal Q
ualit
y an
d Pr
otec
tion
$149
,141
15.2
38Ch
alle
nge
Cost
Sha
re
$4
4,26
4Bu
reau
of R
ecla
mat
ion
15.5
30W
ater
Con
serv
atio
n Fi
eld
Serv
ices (
WCF
S)
Far
mer
Can
al C
ompa
ny o
f Gal
latin
Cou
nty
R
17AP
0032
5$5
3,33
2M
iscel
lane
ous
15.R
DM
iscel
lane
ous R
esea
rch
and
Deve
lopm
ent
$2
36,6
48
Ore
gon
Stat
e Un
iver
sity
L0
205A
-A$1
72,4
82
PG
Envi
ronm
enta
l
5000
2.00
1$7
0,25
7
Por
tland
Sta
te U
nive
rsity
1
0000
6$1
03,8
05
The
acco
mpa
nyin
g no
tes a
re a
n in
tegr
al p
art o
f thi
s sch
edul
e.
A-233

Stat
e of
Mon
tana
Sche
dule
of E
xpen
ditu
res o
f Fed
eral
Aw
ards
For t
he Fi
scal
Yea
r End
ed Ju
ne 3
0, 2
019
Rese
arch
and
Dev
elop
men
t Clu
ster
Amou
nt to
Sub
recip
ient
s
E
xpen
ditu
res
Natio
nal P
ark
Serv
ice15
.915
Tech
nica
l Pre
serv
atio
n Se
rvice
s
$177
,784
15.9
21Ri
vers
, Tra
ils a
nd C
onse
rvat
ion
Assis
tanc
e
Riv
er M
anag
emen
t Soc
iety
2
017R
MS-
WSR
50$1
4,33
715
.926
Amer
ican
Batt
lefie
ld P
rote
ctio
n
$3
1,99
115
.945
Coop
erat
ive
Rese
arch
and
Tra
inin
g Pr
ogra
ms –
Res
ourc
es o
f the
Nat
iona
l Par
k Sy
stem
$23,
252
$722
,181
U
nive
rsity
of C
alifo
rnia
, San
ta C
ruz
A1
5-01
16-S
001-
P064
4054
$6,4
66
Uni
vers
ity o
f Wyo
min
g
100
3410
D-M
SU$4
,890
U
nive
rsity
of W
yom
ing
NPS
Rese
arch
Cen
ter
10
0341
0C-M
SU($
1)Of
fice
of S
urfa
ce M
inin
g, R
ecla
mat
ion
and
Enfo
rcem
ent
15.2
50Re
gula
tion
of S
urfa
ce C
oal M
inin
g an
d Su
rface
Effe
cts o
f Und
ergr
ound
Coa
l Min
ing
$246
,133
15.2
55Sc
ienc
e an
d Te
chno
logy
Pro
ject
s Rel
ated
to C
oal M
inin
g an
d Re
clam
atio
n
$7
2,54
2U.
S. Fi
sh a
nd W
ildlif
e Se
rvice
15.6
05Sp
ort F
ish R
esto
ratio
n
$4
3,00
8
Wyo
min
g Ga
me
and
Fish
Dep
artm
ent
00
2243
$10,
005
W
yom
ing
Gam
e an
d Fi
sh D
epar
tmen
t
0028
22$3
4,45
215
.608
Fish
and
Wild
life
Man
agem
ent A
ssist
ance
$98,
904
15.6
11W
ildlif
e Re
stor
atio
n an
d Ba
sic H
unte
r Edu
catio
n
$1
,552
,373
I
daho
Dep
artm
ent o
f Fish
and
Gam
e
IDFG
-MA-
2015
1029
SHE
EP$1
22
Ida
ho D
epar
tmen
t of F
ish a
nd G
ame
ID
FG-M
A-20
1510
29$1
58,2
20
Ida
ho D
epar
tmen
t of F
ish a
nd G
ame
ID
FA-F
Y19-
113
$58,
286
I
daho
Dep
artm
ent o
f Fish
and
Gam
e
IDFG
-MA-
2015
1029
PRE
Y$5
,582
I
daho
Dep
artm
ent o
f Fish
and
Gam
e
IDFG
-MA-
2015
1029
-POP
$8,7
49
Ken
tuck
y De
part
men
t of F
ish a
nd W
ildlif
e Re
sour
ces
PO
N2 6
60 1
7000
0146
5$1
9
Mich
igan
Sta
te U
nive
rsity
R
C108
133
UMT
$25,
033
M
issou
ri De
part
men
t of C
onse
rvat
ion
3
77-B
$89,
914
M
issou
ri De
part
men
t of C
onse
rvat
ion
3
69-B
$155
,452
S
tate
of C
olor
ado
1
7-IG
A-94
119
$36,
452
S
tate
of N
orth
Dak
ota
Gam
e an
d Fi
sh D
epar
tmen
t
W-6
8-R-
3$2
47,5
50
Sta
te o
f Sou
th D
akot
a
19C
S06W
008
$38,
532
S
tate
of S
outh
Dak
ota
1
9CS0
6W01
2$1
14,9
89
The
acco
mpa
nyin
g no
tes a
re a
n in
tegr
al p
art o
f thi
s sch
edul
e.
A-234

Stat
e of
Mon
tana
Sche
dule
of E
xpen
ditu
res o
f Fed
eral
Aw
ards
For t
he Fi
scal
Yea
r End
ed Ju
ne 3
0, 2
019
Rese
arch
and
Dev
elop
men
t Clu
ster
Amou
nt to
Sub
recip
ient
s
E
xpen
ditu
res
U
nive
rsity
of M
issou
ri
C00
0524
12-1
$12,
960
U
nive
rsity
of M
issou
ri
C00
0477
58-1
$24,
705
15.6
15Co
oper
ativ
e En
dang
ered
Spe
cies C
onse
rvat
ion
Fund
$8,7
5515
.631
Part
ners
for F
ish a
nd W
ildlif
e
$3
0,64
215
.634
Stat
e W
ildlif
e Gr
ants
$9,7
50$5
3,45
015
.637
Mig
rato
ry B
ird Jo
int V
entu
res
$1
97,5
5415
.650
Rese
arch
Gra
nts (
Gene
ric)
$5
5,14
115
.655
Mig
rato
ry B
ird M
onito
ring,
Ass
essm
ent a
nd C
onse
rvat
ion
$42,
561
15.6
57En
dang
ered
Spe
cies C
onse
rvat
ion
– Re
cove
ry Im
plem
enta
tion
Fund
s
$385
,313
S
tate
of S
outh
Dak
ota
1
9-06
00-0
48$7
,561
15.6
60En
dang
ered
Spe
cies -
Can
dida
te C
onse
rvat
ion
Actio
n Fu
nds
$3
3615
.663
Natio
nal F
ish a
nd W
ildlif
e Fo
unda
tion
N
atio
nal F
ish a
nd W
ildlif
e Fo
unda
tion
0
103.
13.0
3886
2$1
4,02
5
The
Nat
ure
Cons
erva
ncy
M
TFO0
7011
7_NK
$2,3
2415
.665
Natio
nal W
etla
nds I
nven
tory
$55,
562
15.6
70Ad
aptiv
e Sc
ienc
e
$7
,966
W
este
rn A
ssoc
iatio
n of
Fish
and
Wild
life
Agen
cies
SB
SI-C
-17-
08$2
5,56
715
.678
Coop
erat
ive
Ecos
yste
m S
tudi
es U
nits
$236
,977
U.S.
Geo
logi
cal S
urve
y15
.805
Assis
tanc
e to
Sta
te W
ater
Res
ourc
es R
esea
rch
Inst
itute
s
$8,5
24$1
55,9
9115
.807
Eart
hqua
ke H
azar
ds P
rogr
am A
ssist
ance
$115
.808
U.S.
Geo
logi
cal S
urve
y Re
sear
ch a
nd D
ata
Colle
ctio
n
$1
3,75
0$3
86,3
92
Mou
ntai
n St
udie
s Ins
titut
e
201
8-00
1$6
,650
15.8
10Na
tiona
l Coo
pera
tive
Geol
ogic
Map
ping
$235
,282
15.8
12Co
oper
ativ
e Re
sear
ch U
nits
$142
,505
15.8
15Na
tiona
l Lan
d Re
mot
e Se
nsin
g Ed
ucat
ion
Outr
each
and
Res
earc
h
Am
erica
View
Inc
AV
18-M
T-01
$15,
553
15.8
20Na
tiona
l and
Reg
iona
l Clim
ate
Adap
tatio
n Sc
ienc
e Ce
nter
s
C
olor
ado
Stat
e Un
iver
sity
G
-500
03-1
$11,
461
C
olor
ado
Stat
e Un
iver
sity
G
-521
23-0
1$1
6,45
7
Uni
vers
ity o
f Was
hing
ton
U
WSC
1009
7/BP
#271
33($
3,21
4)
The
acco
mpa
nyin
g no
tes a
re a
n in
tegr
al p
art o
f thi
s sch
edul
e.
A-235

Stat
e of
Mon
tana
Sche
dule
of E
xpen
ditu
res o
f Fed
eral
Aw
ards
For t
he Fi
scal
Yea
r End
ed Ju
ne 3
0, 2
019
Rese
arch
and
Dev
elop
men
t Clu
ster
Amou
nt to
Sub
recip
ient
s
E
xpen
ditu
res
U
nive
rsity
of W
ashi
ngto
n
UW
SC10
097/
BP03
3702
$19,
355
U
nive
rsity
of W
ashi
ngto
n
UW
SC10
097/
BPO3
3701
$24,
969
15.9
80Na
tiona
l Gro
und-
Wat
er M
onito
ring
Netw
ork
$22,
791
DEPA
RTM
ENT
OF T
HE IN
TERI
OR T
OTAL
$7,6
77,8
28DE
PART
MEN
T OF
TRA
NSPO
RTAT
ION
Fede
ral A
viat
ion
Adm
inist
ratio
n20
.109
Air T
rans
port
atio
n Ce
nter
s of E
xcel
lenc
e
$1
07,3
45Fe
dera
l Hig
hway
Adm
inist
ratio
n20
.200
High
way
Res
earc
h an
d De
velo
pmen
t Pro
gram
$980
,984
$1,8
94,7
25
Cal
iforn
ia D
epar
tmen
t of T
rans
port
atio
n
65A
0604
$57,
722
C
alifo
rnia
Dep
artm
ent o
f Tra
nspo
rtat
ion
6
5A05
50$1
8,15
5
Cal
iforn
ia D
epar
tmen
t of T
rans
port
atio
n
65A
0614
$51,
488
C
alifo
rnia
Dep
artm
ent o
f Tra
nspo
rtat
ion
6
5A06
06$5
7,22
9
Cal
iforn
ia S
tate
Uni
vers
ity, L
ong
Beac
h
SG1
9941
6100
$25,
242
I
daho
Dep
artm
ent o
f Tra
nspo
rtat
ion
2
016-
01$8
,958
M
aine
Dep
artm
ent o
f Tra
nspo
rtat
ion
0
1758
2.18
($11
)
Min
neso
ta D
epar
tmen
t of T
rans
port
atio
n
100
3322
WOR
K OR
DER
NO. 2
$12
M
inne
sota
Dep
artm
ent o
f Tra
nspo
rtat
ion
1
0033
22 W
ORK
ORDE
R NO
. 4$2
1,38
0
Min
neso
ta D
epar
tmen
t of T
rans
port
atio
n
100
3322
WO
3$3
0,99
6
Nev
ada
Depa
rtm
ent o
f Tra
nspo
rtat
ion
P
701-
18-8
03 T
ASK
01$5
2,87
9
Sou
th D
akot
a De
part
men
t of T
rans
port
atio
n
311
280
SD20
16-0
3$1
4,25
1
Tra
nspo
rtat
ion
Rese
arch
Boa
rd
HR
20-1
22 S
UB00
0125
6$4
8,03
1$1
39,9
72
Was
hing
ton
Stat
e De
part
men
t of T
rans
port
atio
n
T67
37 T
ASK
12$3
1,33
9
Was
hing
ton
Stat
e De
part
men
t of T
rans
port
atio
n
T67
37 T
ASK
11$2
8,89
220
.205
High
way
Pla
nnin
g an
d Co
nstr
uctio
n
$1
,024
,438
C
ente
r for
Larg
e La
ndsc
ape
Cons
erva
tion
$7,6
95
Mar
ylan
d De
part
men
t of T
rans
port
atio
n
P01
814
X-1
$7,8
40$7
0,45
9
Min
neso
ta D
epar
tmen
t of T
rans
port
atio
n
100
2306
$43,
251
$181
,407
Fede
ral T
rans
it Ad
min
istra
tion
20.5
14Pu
blic
Tran
spor
tatio
n Re
sear
ch, T
echn
ical A
ssist
ance
, and
Tra
inin
g
ICF
Inte
rnat
iona
l
19SS
SK00
91$9
,337
The
acco
mpa
nyin
g no
tes a
re a
n in
tegr
al p
art o
f thi
s sch
edul
e.
A-236

Stat
e of
Mon
tana
Sche
dule
of E
xpen
ditu
res o
f Fed
eral
Aw
ards
For t
he Fi
scal
Yea
r End
ed Ju
ne 3
0, 2
019
Rese
arch
and
Dev
elop
men
t Clu
ster
Amou
nt to
Sub
recip
ient
s
E
xpen
ditu
res
Natio
nal H
ighw
ay T
raffi
c Saf
ety
Adm
inist
ratio
n20
.600
Stat
e an
d Co
mm
unity
Hig
hway
Saf
ety
N
orth
Dak
ota
Depa
rtm
ent o
f Tra
nspo
rtat
ion
1
2181
527
$15,
205
N
orth
Dak
ota
Depa
rtm
ent o
f Tra
nspo
rtat
ion
1
2180
620
$9,0
00
20.6
14Na
tiona
l Hig
hway
Tra
ffic S
afet
y Ad
min
istra
tion
(NHT
SA) D
iscre
tiona
ry S
afet
y Gr
ants
and
Co
oper
ativ
e Ag
reem
ents
$15,
884
20.6
16Na
tiona
l Prio
rity
Safe
ty P
rogr
ams
Was
hing
ton
Traf
fic S
afet
y Co
mm
issio
n
$6
1,17
8
Was
hing
ton
Traf
fic S
afet
y Co
mm
issio
n
201
9-AG
-278
4$6
6,16
9
Yal
e Un
iver
sity
G
K000
707
(CON
800
0065
7)$3
,603
Offic
e of
the
Secr
etar
y20
.701
Univ
ersit
y Tr
ansp
orta
tion
Cent
ers P
rogr
am
$6
32,8
96$1
,190
,688
U
nive
rsity
of A
lask
a Fa
irban
ks
UAF
14-
0098
FP4
2825
$6,6
54
DEPA
RTM
ENT
OF T
RANS
PORT
ATIO
N TO
TAL
$5,2
02,2
91DE
PART
MEN
T OF
TRE
ASUR
YCo
mm
unity
Dev
elop
men
t Fin
ancia
l Ins
titut
ions
21.0
20Co
mm
unity
Dev
elop
men
t Fin
ancia
l Ins
titut
ions
Pro
gram
$25,
499
DEPA
RTM
ENT
OF T
REAS
URY
TOTA
L$2
5,49
9DE
PART
MEN
T OF
VET
ERAN
S AF
FAIR
SVA
Hea
lth A
dmin
istra
tion
Cent
er64
.054
Rese
arch
and
Dev
elop
men
t
$215
,145
DEPA
RTM
ENT
OF V
ETER
ANS
AFFA
IRS
TOTA
L$2
15,1
45EN
VIRO
NMEN
TAL P
ROTE
CTIO
N AG
ENCY
66.2
02Co
ngre
ssio
nally
Man
date
d Pr
ojec
ts
Ida
ho D
epar
tmen
t of E
nviro
nmen
tal Q
ualit
y
557
4$5
4,23
2
Ida
ho D
epar
tmen
t of E
nviro
nmen
tal Q
ualit
y
K19
6$5
7,04
866
.454
Wat
er Q
ualit
y M
anag
emen
t Pla
nnin
g
Cla
rk F
ork
Coal
ition
0
0856
418
$19,
561
The
acco
mpa
nyin
g no
tes a
re a
n in
tegr
al p
art o
f thi
s sch
edul
e.
A-237

Stat
e of
Mon
tana
Sche
dule
of E
xpen
ditu
res o
f Fed
eral
Aw
ards
For t
he Fi
scal
Yea
r End
ed Ju
ne 3
0, 2
019
Rese
arch
and
Dev
elop
men
t Clu
ster
Amou
nt to
Sub
recip
ient
s
E
xpen
ditu
res
66.4
61Re
gion
al W
etla
nd P
rogr
am D
evel
opm
ent G
rant
s
$228
,091
U
nive
rsity
of W
yom
ing
1
0042
54-U
M$1
5,88
266
.466
Ches
apea
ke B
ay P
rogr
am
Nat
iona
l Fish
and
Wild
life
Foun
datio
n
060
2.18
.062
653
$34,
427
66.5
09Sc
ienc
e To
Ach
ieve
Res
ults
(STA
R) R
esea
rch
Prog
ram
L
ittle
Big
Hor
n Co
llege
M
SU-L
BHC
$10,
589
U
nive
rsity
of N
ew M
exico
3
RAW
5 / 8
3615
701
$13,
125
66.5
10Su
rvey
s, St
udie
s, In
vest
igat
ions
and
Spe
cial P
urpo
se G
rant
s with
in th
e Of
fice
of R
esea
rch
and
Deve
lopm
ent
Peg
asus
Tec
hnica
l Ser
vice
s
#MON
TS-1
8-00
1$3
6,52
0
66.7
16Re
sear
ch, D
evel
opm
ent,
Mon
itorin
g, P
ublic
Edu
catio
n, O
utre
ach,
Tra
inin
g, D
emon
stra
tions
, an
d St
udie
s
$23,
133
66.9
51En
viro
nmen
tal E
duca
tion
Gran
ts
Ariz
ona
Stat
e Un
iver
sity
A
SUB0
0000
207
$804
Misc
ella
neou
s66
.RD
Misc
ella
neou
s Res
earc
h an
d De
velo
pmen
t
P
egas
us T
echn
ical S
ervi
ces I
nc.
M
ONTT
-18-
001
$2,5
47
Peg
asus
Tec
hnica
l Ser
vice
s Inc
.
MON
TT-1
9-00
1$4
,585
ENVI
RONM
ENTA
L PRO
TECT
ION
AGEN
CY T
OTAL
$500
,544
INST
ITUT
E OF
MUS
EUM
AND
LIBR
ARY
SERV
ICES
45.3
12Na
tiona
l Lea
ders
hip
Gran
ts
$1
16,9
8545
.313
Laur
a Bu
sh 2
1st C
entu
ry Li
brar
ian
Prog
ram
$63,
449
INST
ITUT
E OF
MUS
EUM
AND
LIBR
ARY
SERV
ICES
TOT
AL$1
80,4
34NA
TION
AL A
ERON
AUTI
CS A
ND S
PACE
ADM
INIS
TRAT
ION
43.0
01Sc
ienc
e
$4
24,8
72$3
,220
,623
A
rizon
a St
ate
Univ
ersit
y
16-
005
$54,
219
B
ay A
rea
Envi
ronm
enta
l Res
earc
h In
stitu
te
ELA
_NEX
_103
018
$20,
478
C
alifo
rnia
Inst
itute
of T
echn
olog
y
158
7131
$16,
994
D
artm
outh
Col
lege
R
1148
$2,7
80
Dar
tmou
th C
olle
ge
R10
60$1
55,2
25
The
acco
mpa
nyin
g no
tes a
re a
n in
tegr
al p
art o
f thi
s sch
edul
e.
A-238

Stat
e of
Mon
tana
Sche
dule
of E
xpen
ditu
res o
f Fed
eral
Aw
ards
For t
he Fi
scal
Yea
r End
ed Ju
ne 3
0, 2
019
Rese
arch
and
Dev
elop
men
t Clu
ster
Amou
nt to
Sub
recip
ient
s
E
xpen
ditu
res
G
eorg
ia In
stitu
te o
f Tec
hnol
ogy
R
H809
-03
$702
,103
L
ockh
eed
Mar
tin C
orpo
ratio
n
PO
4103
3991
82$1
0,28
9
Loc
khee
d M
artin
Cor
pora
tion
8
1000
0270
2$3
10,2
94
Prin
ceto
n Un
iver
sity
S
UB00
0014
8$2
0,12
4
SET
I Ins
titut
e
SC
3118
$28,
138
S
mith
soni
an A
stro
phys
ical O
bser
vato
ry
SV9
-890
01$1
09,3
26
Sm
ithso
nian
Ast
roph
ysica
l Obs
erva
tory
G
O2-1
3126
C$6
,750
S
mith
soni
an A
stro
phys
ical O
bser
vato
ry
GO7
-180
86A
$12,
305
S
mith
soni
an A
stro
phys
ical O
bser
vato
ry
GO4
-150
98B
$16,
304
S
mith
soni
an A
stro
phys
ical O
bser
vato
ry
GO8
-190
69X
$16,
702
S
mith
soni
an A
stro
phys
ical O
bser
vato
ry
GO5
-160
91B
$40,
480
S
mith
soni
an A
stro
phys
ical O
bser
vato
ry
SV7
-770
03$6
1,93
4
Sm
ithso
nian
Ast
roph
ysica
l Obs
erva
tory
G
09-2
0094
X$2
,935
S
outh
wes
t Res
earc
h In
stitu
te
H99
053C
O$9
,288
S
outh
wes
t Res
earc
h In
stitu
te
K99
081K
J$6
0,62
4
Spa
ce T
eles
cope
Scie
nce
Inst
itute
H
ST-G
O-12
584.
006A
($70
)
Spa
ce T
eles
cope
Scie
nce
Inst
itute
H
ST-G
O-14
047.
005-
A$7
,078
S
pace
Tel
esco
pe S
cienc
e In
stitu
te
HST
-GO-
1394
3.00
7-A
$21,
110
S
pace
Tel
esco
pe S
cienc
e In
stitu
te
HST
-GO-
1425
1.00
4-A
$38,
171
S
tone
Aer
ospa
ce/P
SC, I
nc.
$4
,636
S
tott
ler H
enke
Ass
ocia
tes,
Inc.
E
PS-M
AEST
R01-
STOT
TLER
HENK
E-M
SU$3
,013
S
tott
ler H
enke
Ass
ocia
tes,
Inc.
D
IS-M
AEST
RO1-
STOT
TLER
-HEN
KE-M
O$3
6,73
0
Sus
tain
able
Bio
prod
ucts
N
ASA
STTR
$22,
825
U
nive
rsiti
es S
pace
Res
earc
h As
socia
tion
0
4555
-036
$3,6
00
Uni
vers
ity o
f Ala
ska
Fairb
anks
U
AF 1
8-00
82$6
6,79
8
Uni
vers
ity o
f Cal
iforn
ia, B
erke
ley
S
A186
8-26
308P
G; B
B000
9055
5$1
0,02
7
Uni
vers
ity o
f Cal
iforn
ia, I
rvin
e
201
6-33
48$5
9,86
0
Uni
vers
ity o
f Col
orad
o De
nver
1
5526
10 /
NNA1
5BB0
2A$8
3,01
9
Uni
vers
ity o
f Mar
ylan
d
3TB
432
$12,
669
U
nive
rsity
of S
outh
ern
Calif
orni
a
557
4717
4($
153)
U
nive
rsity
of W
ashi
ngto
n
UW
SC88
79/B
PO13
182
$113
,582
The
acco
mpa
nyin
g no
tes a
re a
n in
tegr
al p
art o
f thi
s sch
edul
e.
A-239

Stat
e of
Mon
tana
Sche
dule
of E
xpen
ditu
res o
f Fed
eral
Aw
ards
For t
he Fi
scal
Yea
r End
ed Ju
ne 3
0, 2
019
Rese
arch
and
Dev
elop
men
t Clu
ster
Amou
nt to
Sub
recip
ient
s
E
xpen
ditu
res
U
nive
rsity
of W
iscon
sin
756
K954
$4,5
86
Wild
life
Cons
erva
tion
Socie
ty
SER
DP11
0515
-217
$157
,676
43.0
08Ed
ucat
ion
$18,
711
$1,6
11,3
99
Uni
vers
ity C
orpo
ratio
n Fo
r Atm
osph
eric
Rese
arch
S
UBAW
ED00
0758
$29,
933
43.0
09Cr
oss A
genc
y Su
ppor
t
$1,7
2243
.012
Spac
e Te
chno
logy
$1,1
18$2
74,6
36M
iscel
lane
ous
43.R
DM
iscel
lane
ous R
esea
rch
and
Deve
lopm
ent
Cal
iforn
ia In
stitu
te o
f Tec
hnol
ogy
1
4221
20$6
3,44
1
NATI
ONAL
AER
ONAU
TICS
AND
SPA
CE A
DMIN
ISTR
ATIO
N TO
TAL
$7,5
04,2
03NA
TION
AL E
NDOW
MEN
T FO
R TH
E HU
MAN
ITIE
S45
.129
Prom
otio
n of
the
Hum
aniti
es F
eder
al/S
tate
Par
tner
ship
H
uman
ities
Mon
tana
1
8R04
5$5
,150
45.1
61Pr
omot
ion
of th
e Hu
man
ities
Res
earc
h
$2
,900
NATI
ONAL
END
OWM
ENT
FOR
THE
HUM
ANIT
IES
TOTA
L$8
,050
NATI
ONAL
SCI
ENCE
FOUN
DATI
ON47
.041
Engi
neer
ing
Gran
ts
$2
3,39
9$2
,191
,029
C
ase
Wes
tern
Res
erve
Uni
vers
ity
RES
5140
53$3
5,51
6
Yal
e Un
iver
sity
G
R102
667
(CON
-800
0127
)$3
2,15
847
.049
Mat
hem
atica
l and
Phy
sical
Scie
nces
$2,2
15,5
36
Ass
ocia
tion
of U
nive
rsiti
es fo
r Res
earc
h in
Ast
rono
my
N
8746
3C$1
74,4
22
S2
Corp
orat
ion
S
2-13
3088
0-13
-03
$67,
553
U
nive
rsity
of W
iscon
sin-M
ilwau
kee
1
5340
5537
$64,
650
47.0
50Ge
oscie
nces
$237
,419
$2,3
83,4
17
Geo
rge
Was
hing
ton
Univ
ersit
y
14-
S17
(PLR
-130
4555
)$9
,780
G
eorg
e W
ashi
ngto
n Un
iver
sity
1
4-S1
7$1
0,11
2
Leh
igh
Univ
ersit
y/Gl
obal
Vill
age
5
4385
1-78
002
$3,4
34
Sou
th D
akot
a Sc
hool
of M
ines
M
SU 1
7-22
$14,
516
U
nive
rsity
of C
olor
ado
1
5553
38-P
O 10
0085
6931
$16,
980
U
nive
rsity
of C
olor
ado
Denv
er
155
5337
/PO#
1000
8553
08$1
57,7
82
The
acco
mpa
nyin
g no
tes a
re a
n in
tegr
al p
art o
f thi
s sch
edul
e.
A-240

Stat
e of
Mon
tana
Sche
dule
of E
xpen
ditu
res o
f Fed
eral
Aw
ards
For t
he Fi
scal
Yea
r End
ed Ju
ne 3
0, 2
019
Rese
arch
and
Dev
elop
men
t Clu
ster
Amou
nt to
Sub
recip
ient
s
E
xpen
ditu
res
U
nive
rsity
of H
awai
i at M
anoa
M
A 13
91$2
4,45
0
Uni
vers
ity o
f Haw
aii a
t Man
oa
MA1
3002
9/M
A113
1$2
,006
U
nive
rsity
of K
ansa
s
FY20
18-0
50$3
2,06
4
Uni
vers
ity o
f Ten
ness
ee
A17
-012
4-S0
01$4
,130
W
oods
Hol
e Oc
eano
grap
hic I
nstit
utio
n
A10
1357
$68,
932
47.0
70Co
mpu
ter a
nd In
form
atio
n Sc
ienc
e an
d En
gine
erin
g
$1
4,41
2$7
59,0
13
Uni
vers
ity o
f Nor
th T
exas
G
F300
41-1
$16,
954
47.0
74Bi
olog
ical S
cienc
es
$1
42,7
04$4
,544
,760
A
rizon
a St
ate
Univ
ersit
y
18-
450
$39,
141
C
ary
Inst
itute
of E
cosy
stem
Stu
dies
3
340-
2002
0187
3$1
0,48
6
Was
hing
ton
Stat
e Un
iver
sity
1
1899
6_G0
0335
7$6
3,28
447
.075
Socia
l, Be
havi
oral
, and
Eco
nom
ic Sc
ienc
es
$1
15,8
61$6
70,6
22
Ohi
o St
ate
Univ
ersit
y
600
5942
5, P
O RF
0150
0712
$8,7
4847
.076
Educ
atio
n an
d Hu
man
Res
ourc
es
$4
5,31
2$3
,430
,009
A
aniii
h Na
koda
Col
lege
M
SU-3
753/
01$8
1,72
2
Chi
ef D
ull K
nife
Col
lege
1
3615
22$8
,490
C
olor
ado
Stat
e Un
iver
sity
9
6702
-5$7
7,29
7
Mat
hem
atica
l Ass
ocia
tion
of A
mer
ica
MAA
3-8
-710
-891
$121
,697
M
ichig
an S
tate
Uni
vers
ity
RC1
0410
1MON
TANA
$31,
929
S
alish
Koo
tena
i Col
lege
M
SUN-
18-1
$2,2
46
Sal
ish K
oote
nai C
olle
ge
HRD
-126
2779
$13,
552
U
nive
rsity
of S
an D
iego
$1,9
8847
.078
Pola
r Pro
gram
s
$41,
912
47.0
79Of
fice
of In
tern
atio
nal S
cienc
e an
d En
gine
erin
g
$1
22,5
5547
.080
Offic
e of
Cyb
erin
frast
ruct
ure
$545
,668
47.0
83Of
fice
of In
tegr
ativ
e Ac
tiviti
es
$1
,091
,091
$3,6
72,0
53
Sou
th D
akot
a Sc
hool
of M
ines
S
DSM
T-M
SU 1
8-04
$398
,292
T
rust
ees o
f Dar
tmou
th C
olle
ge
R89
6/R8
97/1
6327
38$2
37,5
12
Uni
vers
ity o
f Ala
ska
$5,5
08
Uni
vers
ity o
f Sou
ther
n Ca
lifor
nia
8
7383
750/
PO#1
0558
532
$22,
088
NATI
ONAL
SCI
ENCE
FOU
NDAT
ION
TOTA
L$2
2,43
5,99
3
The
acco
mpa
nyin
g no
tes a
re a
n in
tegr
al p
art o
f thi
s sch
edul
e.
A-241

Stat
e of
Mon
tana
Sche
dule
of E
xpen
ditu
res o
f Fed
eral
Aw
ards
For t
he Fi
scal
Yea
r End
ed Ju
ne 3
0, 2
019
Rese
arch
and
Dev
elop
men
t Clu
ster
Amou
nt to
Sub
recip
ient
s
E
xpen
ditu
res
SOCI
AL S
ECUR
ITY
ADM
INIS
TRAT
ION
96.0
07So
cial S
ecur
ity R
esea
rch
and
Dem
onst
ratio
n
Uni
vers
ity o
f Wisc
onsin
-Mad
ison
8
51K2
33$4
2,71
2
SOCI
AL S
ECUR
ITY
ADM
INIS
TRAT
ION
TOTA
L$4
2,71
2
RESE
ARCH
AND
DEV
ELOP
MEN
T CL
USTE
R TO
TAL
$150
,237
,633
SCHE
DULE
OF
EXPE
NDIT
URES
OF
FEDE
RAL A
WAR
DS T
OTAL
$3,9
74,1
65,2
84
The
acco
mpa
nyin
g no
tes a
re a
n in
tegr
al p
art o
f thi
s sch
edul
e.
A-242

STATE OF MONTANA NOTES TO THE SCHEDULE OF EXPENDITURES OF FEDERAL AWARDS
FOR THE FISCAL YEAR ENDED JUNE 30, 2019 Note 1. Summary of Significant Accounting Policies
Basis of Presentation
The accompanying Schedule of Expenditures of Federal Awards includes the federal award activity of the state of Montana under programs of the federal government for the fiscal year ended June 30, 2019. The information in this schedule is presented in accordance with the requirements of Title 2 U.S. Code of Federal Regulations Part 200, Uniform Administrative Requirements, Cost Principles, and Audit Requirements for Federal Awards (referred to as the “Uniform Guidance”), and where applicable, Office of Management and Budget Circular A-133 requirements. Because this schedule presents only a selected portion of the operations of the state of Montana, it is not intended to, and does not present, the financial positions, change in net assets, or, where applicable, its cash flows for the fiscal year ended June 30, 2019.
Significant Accounting Policies
Expenditures shown on the Schedule of Expenditures of Federal Awards are reported on the modified accrual basis of accounting, except as noted below. Under the modified accrual basis of accounting, expenditures are generally recorded in the accounting period in which the liability is incurred. However, there are some payments, such as compensated absences, that are only recorded when the payment is due. Such expenditures are recognized following the cost principles contained in the Uniform Guidance, OMB Circular A-87, or other costs circulars wherein certain types of expenditures are not allowed or are limited as to reimbursement. Negative amounts shown on the schedule represent adjustments or credits made in the normal course of business to amounts reported as expenditures in prior years. The Montana University System uses full accrual accounting to report campus federal expenditure activity. The Unemployment Insurance, Section 8 Voucher, and Section 8 Project-Based programs are accounted for as enterprise fund activity. Enterprise funds also use the full accrual basis of accounting. Under the full accrual basis of accounting, expenditures are recorded when a liability is incurred, regardless of the timing of the related cash flows.
A-243

Loan and Loan Guarantee Programs (Note 2), Federal Excess Personal Property (Note 7), and the Department of Defense Firefighting Property (Note 8) are presented using the basis of accounting described in each note. The Books for the Blind and Physically Handicapped Program (Note 9) is not presented on the Schedule of Expenditures of Federal Awards but is provided as additional information regarding the types of donations received by the state as part of this federal program. The state of Montana did not elect to use the 10% de minimis indirect cost rate allowed under the Uniform Guidance. Food Distribution Program The amount reported for Food Distribution programs (CFDA #10.555, #10.565, #10.567, #10.569, and #93.053) represents the dollar value of food commodities distributed to eligible recipients during the year. The U.S. Department of Agriculture provides the current value of the commodities used by the state to compute the amount reported. The amount of funds received to administer the program is also included in the reported amount. Montana also distributes food commodities to other states in the western region of the United States. During fiscal year 2019, Montana distributed $1,563,112 of food commodities under CFDA #10.567 to other states.
The state of Montana distributed $13,773,898 in commodities in fiscal year 2019. The value at June 30, 2019 of commodities stored at the state’s warehouse is $3,724,894, for which the state is liable in the event of loss. The state has insurance to cover this liability. Minority Health and Health Disparities Research The amount reported for the Minority Health and Health Disparities Research Program (CFDA #93.307) includes endowment funds of $9,375,000, along with interest earned on the endowment. The entire endowment amount is reported as expended each year, as the funds are restricted for the life of the endowment. Immunization Cooperative Agreements
The amount reported for the Immunization Cooperative Agreements (CFDA #93.268) includes the dollar value of vaccine doses received during fiscal year 2019. The state used the Centers for Disease Control’s price list to calculate the value of doses received. During fiscal year 2019, Montana received 207,800 vaccine doses valued at $11,711,263.
Note 2. Loan and Loan Guarantee Programs
The following loan and loan guarantee programs are reported on the Schedule of Expenditures of Federal Awards at their July 1, 2018 beginning loan balance plus the amount of any interest subsidy, cash, or administrative cost allowance received during fiscal year 2019:
A-244

CFDA # Federal Loan/Loan Guarantee ProgramState Revolving Loans
FY 2019 Ending Balance
66.458 Capitalization Grants for Clean Water State Revolving Funds 294,644,540$
66.468 Capitalization Grants for Drinking Water State Revolving Funds 169,316,440$
Total State Revolving Loan Programs 463,960,980$
CFDA # Federal Loan/Loan Guarantee ProgramStudent Financial Assistance
FY 2019 Ending Balance
University Loans
84.038 Federal Perkins Loan Program_Federal Capital Contributions $28,083,702
93.264 Nurse Faculty Loan Program (NFLP) $8,630
93.364 Nursing Student Loans $2,593,214
93.342 Health Professions Student Loans, Including Primary Care Loans/Loans for Disadvantaged Students $195,156
Total Student Financial Assistance Programs $30,880,702
Perkins Loan Programs
Under the Perkins Loan Extension Act of 2015, universities participating in this program are no longer permitted to make Perkins Loan disbursements after June 30, 2018. Institutions may choose to continue servicing their existing Perkins Loans until such time the institution’s outstanding loans have been paid in full or otherwise retired. Both Montana State University and the University of Montana have chosen to continue to service their current loans. Economic Adjustment Assistance Program
The Economic Adjustment Assistance Program (CFDA #11.307) consists of two separate awards which are reported on the Schedule of Expenditures of Federal Awards at their June 30, 2019 ending loan balances. The amount of loans outstanding as of June 30, 2019 is $304,005 for award number 05-19-02445 and $2,937,992 for award number 05-79-73005. The calculation for each of these loan balances is as follows:
A-245

Award Number: 05-19-02445State Name = EDA Revolving LoanFederal Grantor = US Department of CommerceFederal Program Name = Title IX SSED Revolving Loan FundFederal Catalog Number = 11.307
RLF Loan Balance FYE 2019 324,918$ Cash & Investments FYE 2019 103,258$ FY 2019 Admin paid out of RLF Income -$ Unpaid Principal of loans written of during FY -$
428,176$
Federal Percentage 71%
Federal Share of Revolving Loan Fund 304,005$ Award Number: 05-79-73005State Name = EDA Revolving LoanFederal Grantor = US Department of CommerceFederal Program Name = Economic Adjustment AssistanceFederal Catalog Number = 11.307
RLF Loan Balance FYE 2019 4,467,703$ Cash & Investments FYE 2019 1,371,384$ FY 2019 Admin paid out of RLF Income 36,898$ Unpaid Principal of loans written of during FY -$
5,875,985$
Federal Percentage 50%
Federal Share of Revolving Loan Fund 2,937,992$ Other Federal Loans The following loans, originally funded through federal programs, do not have any continuing federal compliance requirements imposed on the state, other than the loan repayments. These loans are not reported on the Schedule of Expenditures of Federal Awards:
A-246
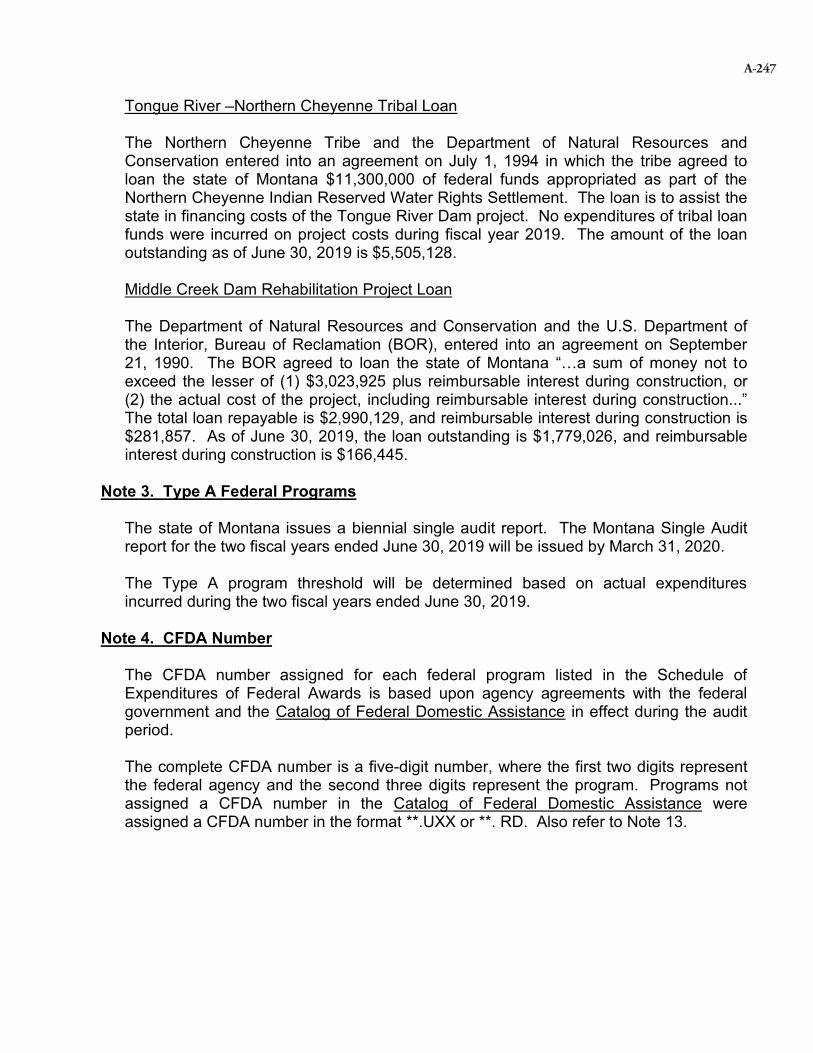
Tongue River –Northern Cheyenne Tribal Loan The Northern Cheyenne Tribe and the Department of Natural Resources and Conservation entered into an agreement on July 1, 1994 in which the tribe agreed to loan the state of Montana $11,300,000 of federal funds appropriated as part of the Northern Cheyenne Indian Reserved Water Rights Settlement. The loan is to assist the state in financing costs of the Tongue River Dam project. No expenditures of tribal loan funds were incurred on project costs during fiscal year 2019. The amount of the loan outstanding as of June 30, 2019 is $5,505,128. Middle Creek Dam Rehabilitation Project Loan The Department of Natural Resources and Conservation and the U.S. Department of the Interior, Bureau of Reclamation (BOR), entered into an agreement on September 21, 1990. The BOR agreed to loan the state of Montana “…a sum of money not to exceed the lesser of (1) $3,023,925 plus reimbursable interest during construction, or (2) the actual cost of the project, including reimbursable interest during construction...” The total loan repayable is $2,990,129, and reimbursable interest during construction is $281,857. As of June 30, 2019, the loan outstanding is $1,779,026, and reimbursable interest during construction is $166,445.
Note 3. Type A Federal Programs
The state of Montana issues a biennial single audit report. The Montana Single Audit report for the two fiscal years ended June 30, 2019 will be issued by March 31, 2020. The Type A program threshold will be determined based on actual expenditures incurred during the two fiscal years ended June 30, 2019.
Note 4. CFDA Number
The CFDA number assigned for each federal program listed in the Schedule of Expenditures of Federal Awards is based upon agency agreements with the federal government and the Catalog of Federal Domestic Assistance in effect during the audit period. The complete CFDA number is a five-digit number, where the first two digits represent the federal agency and the second three digits represent the program. Programs not assigned a CFDA number in the Catalog of Federal Domestic Assistance were assigned a CFDA number in the format **.UXX or **. RD. Also refer to Note 13.
A-247

Note 5. Program Clusters
As defined by 2 CFR section 200.17, a cluster of programs is a grouping of closely related programs that share common compliance requirements. Except for the Student Financial Assistance Cluster, clusters of programs are presented on the Schedule of Expenditures of Federal Awards either within their respective federal agency (for non-research and development programs) or by federal agency and major subdivision (for research and development programs).
Student Financial Assistance Cluster Amounts reported for the Student Financial Assistance Cluster include programs administered by both the Department of Education and the Department of Health and Human Services. These clusters are shown separately, within their respective federal agencies, on the Schedule of Expenditures of Federal Awards. The combined Student Financial Assistance Cluster includes the following programs:
CFDA # Student Financial Assistance Cluster FY 19 Expenditures
84.007 Federal Supplemental Educational Opportunity Grants $1,530,37284.033 Federal Work-Study Program $2,118,63584.038 Federal Perkins Loan Program_Federal Capital Contributions $33,380,10684.063 Federal Pell Grant Program $44,706,51784.268 Federal Direct Student Loans $166,350,722
84.379 Teacher Education Assistance for College and Higher Education Grants (TEACH Grants) $7,706
93.264 Nurse Faculty Loan Program (NFLP) $11,744
93.342 Health Professions Student Loans, Including Primary Care Loans/Loans for Disadvantaged Students $235,984
93.364 Nursing Student Loans $2,990,983
Total Student Financial Assistance Cluster $251,332,769 Note 6. Research and Development Grants
Research and Development includes all research activities, both basic and applied, and all development activities that are performed by a non-federal entity. Research is defined as a systematic study directed toward fuller scientific knowledge or understanding of the subject studied. The term research also includes activities involving the training of individuals in research techniques, where such activities utilize the same facilities as other research and development activities, and where such activities are not included in the instruction function. Development is the systematic use of knowledge and understanding gained from research directed toward the production of useful materials, devices, systems, or
A-248

methods, including design and development of prototypes and processes. Federal awards that meet the research and development criteria are listed in the Research and Development Cluster.
Note 7. Federal Excess Personal Property
The state of Montana receives Federal Excess Personal Property (FEPP). The title to this property remains with the federal agency. In accordance with General Services Administration guidelines, the amounts are presented at fair market value at the time of receipt by the state, which is determined to be 22.47% of the original acquisition cost of the property. Property received under CFDA #81.UXX, Miscellaneous Non-major Grants, is shown at its fair market value at the time of receipt. The following is a list of the FEPP received by the state of Montana during fiscal year 2019. The negative amount reflects property sold (title transferred at public sale) or other disposition.
CFDA # Program FY 19 Amount
FY 19 Ending
Inventory 10.203 Payments to Agricultural Experiment Stations Under the Hatch Act
($5,123) $119,934
10.500 Cooperative Extension Service $0 $3,039 10.664 Cooperative Forestry Assistance ($57,223) $4,480,061 10.UXX Miscellaneous – Non-major Grants $0 $131,341 15.UXX Miscellaneous - Non-major Grants $3,420 $3,420 39.003 Donation of Federal Surplus Personal Property ($48,097) $105,615 81.UXX Miscellaneous Non-major Grants ($545) $4,605 43.UXX Miscellaneous – Non-major Grants $0 $640,395 47.UXX Miscellaneous – Non-major Grants ($32,672) $119,251
Note 8. Department of Defense Firefighting Property
The Department of Natural Resources and Conservation (DNRC) receives Department of Defense Firefighting Property (FFP). The title to this property is transferred to the DNRC. In accordance with General Services Administration guidelines, the amounts are presented at fair market value at the time of receipt by DNRC, which is determined to be 22.47% of the original acquisition cost of the property. The following is the value of FFP received by the state of Montana during fiscal year 2019:
CFDA # Program FY 19
Amount FY 19 Ending
Inventory 12.UXX Miscellaneous – Non-major Grants $581,375 $3,035,787
A-249

Note 9. Books for the Blind and Physically Handicapped
The Montana State Library receives “talking book” machines, cassette books, accessories, and magazines from the federal government under the Books for the Blind and Physically Handicapped Program (CFDA #42.001). These items are then distributed to provide library services to blind and physically handicapped individuals. The federal government retains title to these items. The approximate value of the items in inventory (not distributed to individuals) at June 30, 2019 was $895,905. Since this program is considered a federal “use of equipment” agreement, the accompanying Schedule of Expenditures of Federal Awards does not include this amount.
Note 10. Unemployment Benefits
The unemployment compensation system is a federal-state partnership. State unemployment insurance laws must conform to certain provisions of the federal law. Federal funds are expended for administrative costs. State unemployment taxes must be deposited into a state account in the Federal Unemployment Trust Fund and are used only to pay benefits. State Unemployment Insurance (UI) funds, as well as federal funds, are included on the Schedule of Expenditures of Federal Awards. The following schedule provides a breakdown of the state and federal portions of the total expenditures recorded for the Unemployment Insurance Program (CFDA #17.225).
State UI Expenditures $ 99,152,095 Federal UI Expenditures 18,025,746 Total $117,177,841
Note 11. Subgrants to State Agencies
Federal assistance transferred from one Montana state agency to another Montana state agency is shown only once on the Schedule of Expenditures of Federal Awards. Federal assistance received from non-state sources, which are considered subgrants by the awarding agency, are treated as pass-through grants to the state. These pass-through awards are listed below the direct federal awards reported on the Schedule of Expenditures of Federal Awards. Pass-through grant numbers are included for those awards that were assigned an identifying number.
Note 12. Subgrants to Non-State Agencies
Federal assistance transferred from a Montana state agency or university to a non-state agency, such as a city, county, tribal government, or nonprofit organization, is identified in the Amount to Subrecipients column shown in the Schedule of Expenditures of Federal Awards. These amounts are included in the expenditure totals shown on the report.
A-250

The Amounts to Subrecipients does not include federal assistance transferred from a Montana state agency or university that was originally received as a subgrant from another Montana state agency or university. These amounts are not included in the expenditure totals shown on the report, since the original award is only shown once on the Schedule of Expenditures of Federal Awards, as described in Note 11 above. A summary of amounts that were subgranted to a non-state agency, such as a city, county, tribal government, or nonprofit organization, which were made from awards originally received from another Montana state agency or university, is shown below:
CFDA # Federal ProgramAmount to
Subrecipients
Non Research and Development84.048 Career and Technical Education -- Basic Grants to States $2,555,75384.334 Gaining Early Awareness and Readiness for Undergraduate Programs $25,02484.419 Preschool Development Grants $374,54793.262 Occupational Safety and Health Program $3,904
Total - Non Research and Development $2,959,228
Research and Development Cluster93.778 Medical Assistance Program $67,66093.859 Biomedical Research and Research Training $63,789
Total Research and Development Cluster $131,449
Note 13. Federal Awards not having a CFDA Number
The following schedules contain contract or grant numbers associated with awards that did not have a CFDA number and were assigned either a **.UXX or **.RD number in the Schedule of Expenditures of Federal Awards. Not all **.UXX or **.RD awards reported on the SEFA had a grant or contract number. Also refer to Note 4.
A-251

FY18 Financial Section
18-02


FY18 Financial Section
TABLE OF CONTENTS
Report on Internal Control Over Financial Reporting and on Compliance and Other Matters Based on an Audit of Financial Schedules Performed in Accordance with Government Auditing Standards .............................................................................................................B-1Independent Auditor’s Report ...............................................................................................B-5Management Discussion and Analysis ..................................................................................B-9Basic Financial Statements ..................................................................................................B-20Required Supplementary Information .............................................................................. B-176Schedule of Expenditures of Federal Awards ..................................................................... B-199
18-02


LEGISLATIVE AUDIT DIVISION Angus Maciver, Legislative Auditor Deputy Legislative AuditorsDeborah F. Butler, Legal Counsel Cindy Jorgenson Joe Murray
Room 160 • State Capitol Building • PO Box 201705 • Helena, MT • 59620-1705Phone (406) 444-3122 • FAX (406) 444-9784 • E-Mail [email protected]
Report on Internal Control Over Financial Reporting and on Compliance and Other Matters Based on an Audit
of Financial Statements Performed in Accordance with Government AuditinG StAndArdS
The Legislative Audit Committeeof the Montana State Legislature
We have audited, in accordance with the auditing standards generally accepted in the United States of America and the standards applicable to the financial audits contained in Government Auditing Standards issued by the Comptroller General of the United States, the financial statements of the governmental activities, the business-type activities, the aggregate discretely presented component units, each major fund, and the aggregate remaining fund information of the state of Montana, as of and for the year ended June 30, 2018, and the related notes to the financial statements, which collectively comprise the state of Montana’s basic financial statements, and have issued our report thereon dated December 21, 2018. Our report includes a reference to other auditors who audited the financial statements of the Montana State University component units and the University of Montana component units, as described in our report on the state of Montana’s financial statements. The financial statements of the Montana State University component units and the University of Montana component units were not audited in accordance with Government Auditing Standards, and accordingly, this report does not include reporting on internal control over financial reporting or instances of reportable noncompliance associated with these component units.
Internal Control Over Financial Reporting In planning and performing our audit of the financial statements, we considered the state of Montana’s internal control over financial reporting to determine the audit procedures that are appropriate in the circumstances for the purpose of expressing our opinions on the financial statements, but not for the purpose of expressing an opinion on the effectiveness of the state of Montana’s internal control. Accordingly, we do not express an opinion on the effectiveness of the state of Montana’s internal control.
Our consideration of internal control was for the limited purpose described in the preceding paragraph and was not designed to identify all deficiencies in internal control that might be material weaknesses or significant deficiencies and therefore, material weaknesses or significant deficiencies may exist that were not identified. However, as described below, we identified certain deficiencies in internal control that we consider to be material weaknesses and significant deficiencies.
B-1

B-2
A deficiency in internal control exists when the design or operation of a control does not allow management or employees, in the normal course of performing their assigned functions, to prevent, or detect and correct, misstatements on a timely basis. A material weakness is a deficiency, or a combination of deficiencies, in internal control such that there is a reasonable possibility that a material misstatement of the entity’s financial statements will not be prevented, or detected and corrected on a timely basis. We consider the deficiency described below for the financial reporting of the Board of Investment’s Enterprise Fund Economic Development Bond activity to be a material weakness.
The Board of Investment’s internal controls over financial reporting were not sufficient to ensure complete and accurate Statement of Cash Flows financial reporting, in accordance with generally accepted accounting principles. This control deficiency is associated with the Economic Development Bonds major fund and the portion of the Business-Type Activities attributed to this activity.
A significant deficiency is a deficiency, or a combination of deficiencies, in internal control that is less severe than a material weakness, yet important enough to merit the attention by those charged with governance. We consider the deficiency described below to be a significant deficiency.
The Board of Investment’s internal controls over financial reporting were not sufficient to ensure complete and accurate financial reporting, in accordance with generally accepted accounting principles. This control deficiency is associated with the investment note disclosures in Note 3, as compiled by the Department of Administration State Financial Services Division.
Compliance and Other Matters As part of obtaining reasonable assurance about whether the state of Montana’s financial statements are free from material misstatement, we performed tests of its compliance with certain provisions of laws, regulations, contracts, and grant agreements, noncompliance with which could have a direct and material effect on the determination of financial statement amounts. However, providing an opinion on compliance with those provisions was not an objective of our audit, and accordingly, we do not express such an opinion. The results of our tests disclosed instances of noncompliance or other matters that are required to be reported under Government Auditing Standards. The identified instances of noncompliance are described below:
The Montana Public Employees’ Retirement Board administers eight defined benefit retirement plans. The Montana Constitution and state law require all retirement systems to be actuarially sound. The Highway Patrol Officers’ Retirement System, Game Wardens’ and Peace Officers’ Retirement System, and Public Employees’ Retirement System–Defined Benefit Retirement Plan were not actuarially sound at June 30, 2018, because they amortize in 40 years, 72 years, and 38 years, respectively. The maximum allowable amortization period is 30 years, as defined by state law.
The Teachers’ Retirement Board (Board) administers one defined-benefit retirement plan that provides retirement services to individuals employed as teachers, administrators, and in other professional and skilled positions employed in public education in Montana. The Montana Constitution requires all retirement systems to be actuarially sound. The retirement system is not actuarially sound at June 30,

B-3
2018, because it amortizes in 31 years. The maximum allowable amortization period is 30 years, as defined by Board policy.
State of Montana’s Response to FindingsThe state of Montana’s response to the findings identified in this report are described in the separately issued Board of Investment audit report (18-04A), Public Employees’ Retirement Administration audit report (18-08A), Teachers’ Retirement System audit report (18-09A), and on page B-1 of this report. The state of Montana’s response was not subjected to the auditing procedures applied in the audit of the financial statements and, accordingly, we express no opinion on it.
Purpose of this ReportThe purpose of this report is solely to describe the scope of our testing of internal control and compliance and the results of that testing, and not to provide an opinion on the effectiveness of the state of Montana’s internal control or on compliance. This report is an integral part of an audit performed in accordance with Government Auditing Standards in considering the state of Montana’s internal control and compliance. Accordingly, this communication is not suitable for any other purpose.
Respectfully submitted,
/s/ Cindy Jorgenson
Cindy Jorgenson, CPADeputy Legislative AuditorHelena, MT
December 21, 2018

B-4

Independent Auditor’s Report
The Legislative Audit Committeeof the Montana State Legislature:
IntroductionWe have audited the accompanying financial statements of the governmental activities, the business-type activities, the aggregate discretely presented component units, each major fund, and the aggregate remaining fund information of the state of Montana, as of and for the year ended June 30, 2018, and the related notes which collectively comprise the state of Montana’s basic financial statements, as follows:
� Statement of Net Position
� Statement of Activities
� Balance Sheet – Governmental Funds
� Reconciliation of the Balance Sheet – Governmental Funds to the Statement of Net Position
� Statement of Revenues, Expenditures, and Changes in Fund Balances – Governmental Funds
� Reconciliation of the Statement of Revenues, Expenditures, and Changes in Fund Balances – Governmental Funds to the Statement of Activities
� Statement of Fund Net Position – Proprietary Funds
� Statement of Revenues, Expenses, and Changes in Fund Net Position – Proprietary Funds
� Statement of Cash Flows – Proprietary Funds
� Statement of Fiduciary Net Position – Fiduciary Funds
� Statement of Changes in Fiduciary Net Position – Fiduciary Funds
Management’s Responsibility for the Financial StatementsManagement is responsible for the preparation and fair presentation of these financial statements in accordance with accounting principles generally accepted in the United States of America; this responsibility includes designing, implementing, and maintaining internal controls relevant to the preparation and fair presentation of financial statements that are free from material misstatement, whether due to fraud or error.
Auditor’s Responsibility Our responsibility is to express opinions on these financial statements based on our audit. We did not audit the financial statements of the Montana State University (MSU) component units and the
LEGISLATIVE AUDIT DIVISION Angus Maciver, Legislative Auditor Deputy Legislative AuditorsDeborah F. Butler, Legal Counsel Cindy Jorgenson Joe Murray
Room 160 • State Capitol Building • PO Box 201705 • Helena, MT • 59620-1705Phone (406) 444-3122 • FAX (406) 444-9784 • E-Mail [email protected]
B-5

University of Montana (UM) component units, which represents 16.37 percent, 42.63 percent, and 18.78 percent, respectively of the assets, net position, and revenues of the aggregate discretely presented component units. Those financial statements were audited by other auditors whose reports have been furnished to us, and our opinions, insofar as they relate to the amounts included for the university component units, are based solely on the reports of other auditors.
We conducted our audit in accordance with auditing standards generally accepted in the United States of America and the standards applicable to financial audits contained in Government Auditing Standards, issued by the Comptroller General of the United States. Those standards require that we plan and perform the audit to obtain reasonable assurance about whether the financial statements are free from material misstatement. The financial statements of the MSU and UM component units were not audited in accordance with Government Auditing Standards.
An audit involves performing procedures to obtain audit evidence about the amounts and disclosures in the financial statements. The procedures selected depend on the auditor’s judgment, including the assessment of the risks of material misstatement of the financial statements, whether due to fraud or error. In making those risk assessments, the auditor considers internal controls relevant to the state of Montana’s preparation and fair presentation of the financial statements in order to design audit procedures that are appropriate in the circumstances, but not for the purpose of expressing an opinion on the effectiveness of the state of Montana’s internal control, and accordingly, we express no such opinion. An audit also includes evaluating the appropriateness of accounting policies used and the reasonableness of significant accounting estimates made by management, as well as the overall presentation of the financial statements.
We believe that the audit evidence we have obtained is sufficient and appropriate to provide a basis for our audit opinions.
Summary of OpinionsOpinion Unit Type of OpinionGovernmental Activities UnmodifiedBusiness-Type Activities UnmodifiedGeneral Fund UnmodifiedState Special Revenue Fund UnmodifiedFederal Special Revenue Fund UnmodifiedLand Grant UnmodifiedCoal Severance Tax UnmodifiedUnemployment Insurance UnmodifiedEconomic Development Bonds Unmodified Aggregate Discretely Presented Component Units UnmodifiedAggregate Remaining Fund Information Unmodified
B-6
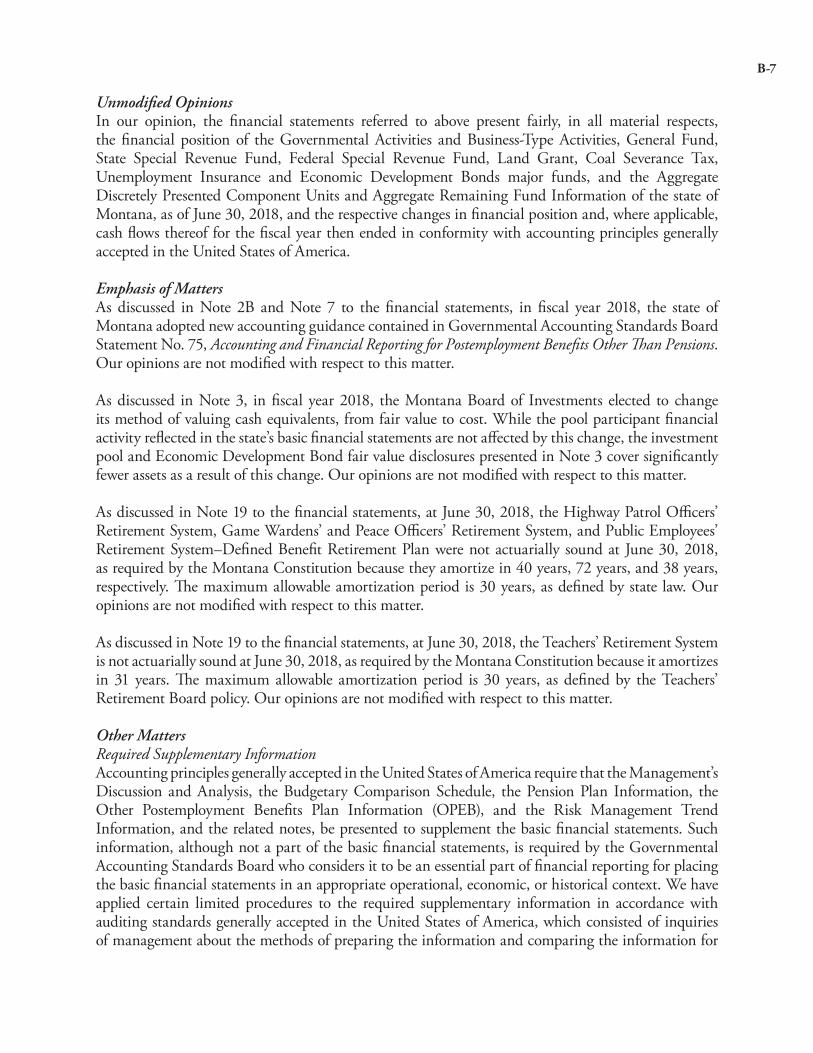
Unmodified Opinions In our opinion, the financial statements referred to above present fairly, in all material respects, the financial position of the Governmental Activities and Business-Type Activities, General Fund, State Special Revenue Fund, Federal Special Revenue Fund, Land Grant, Coal Severance Tax, Unemployment Insurance and Economic Development Bonds major funds, and the Aggregate Discretely Presented Component Units and Aggregate Remaining Fund Information of the state of Montana, as of June 30, 2018, and the respective changes in financial position and, where applicable, cash flows thereof for the fiscal year then ended in conformity with accounting principles generally accepted in the United States of America.
Emphasis of Matters As discussed in Note 2B and Note 7 to the financial statements, in fiscal year 2018, the state of Montana adopted new accounting guidance contained in Governmental Accounting Standards Board Statement No. 75, Accounting and Financial Reporting for Postemployment Benefits Other Than Pensions. Our opinions are not modified with respect to this matter.
As discussed in Note 3, in fiscal year 2018, the Montana Board of Investments elected to change its method of valuing cash equivalents, from fair value to cost. While the pool participant financial activity reflected in the state’s basic financial statements are not affected by this change, the investment pool and Economic Development Bond fair value disclosures presented in Note 3 cover significantly fewer assets as a result of this change. Our opinions are not modified with respect to this matter.
As discussed in Note 19 to the financial statements, at June 30, 2018, the Highway Patrol Officers’ Retirement System, Game Wardens’ and Peace Officers’ Retirement System, and Public Employees’ Retirement System–Defined Benefit Retirement Plan were not actuarially sound at June 30, 2018, as required by the Montana Constitution because they amortize in 40 years, 72 years, and 38 years, respectively. The maximum allowable amortization period is 30 years, as defined by state law. Our opinions are not modified with respect to this matter.
As discussed in Note 19 to the financial statements, at June 30, 2018, the Teachers’ Retirement System is not actuarially sound at June 30, 2018, as required by the Montana Constitution because it amortizes in 31 years. The maximum allowable amortization period is 30 years, as defined by the Teachers’ Retirement Board policy. Our opinions are not modified with respect to this matter.
Other Matters Required Supplementary InformationAccounting principles generally accepted in the United States of America require that the Management’s Discussion and Analysis, the Budgetary Comparison Schedule, the Pension Plan Information, the Other Postemployment Benefits Plan Information (OPEB), and the Risk Management Trend Information, and the related notes, be presented to supplement the basic financial statements. Such information, although not a part of the basic financial statements, is required by the Governmental Accounting Standards Board who considers it to be an essential part of financial reporting for placing the basic financial statements in an appropriate operational, economic, or historical context. We have applied certain limited procedures to the required supplementary information in accordance with auditing standards generally accepted in the United States of America, which consisted of inquiries of management about the methods of preparing the information and comparing the information for
B-7

consistency with management’s responses to our inquiries, the basic financial statements, and other knowledge we obtained during our audit of the basic financial statements. We do not express an opinion or provide any assurance on the information because the limited procedures do not provide us with sufficient evidence to express an opinion or provide any assurance.
Supplementary InformationOur audit was conducted for the purpose of forming an opinion on the financial statements that collectively comprise the state of Montana’s basic financial statements as a whole. The Schedule of Expenditures of Federal Awards, as required by Title 2 U.S. Code of Federal Regulations Part 200, Uniform Administrative Requirements, Cost Principles, and Audit Requirements for Federal awards, is presented for purposes of additional analysis and is not a required part of the basic financial statements. Such information is the responsibility of management and was derived from and relates directly to the underlying accounting and other records used to prepare the financial statements. The information has been subjected to the auditing procedures applied in the audit of the financial statements and certain additional procedures, including comparing and reconciling such information directly to the underlying accounting and other records used to prepare the financial statements or to the financial statements themselves, and other additional procedures in accordance with auditing standards generally accepted in the United States of America. In our opinion, the Schedule of Expenditures of Federal Awards is fairly stated in all material respects in relation to the basic financial statements taken as a whole.
Other Reporting Required by Government Auditing Standards In accordance with Government Auditing Standards, we have also issued our report dated December 21, 2018, on our consideration of the state of Montana’s internal control over financial reporting and on our tests of its compliance with certain provisions of laws, regulations, contracts, and grant agreements and other matters. The purpose of that report is to describe the scope of our testing of internal control over financial reporting and compliance and the results of that testing, and not to provide an opinion on internal control over financial reporting or on compliance. That report is an integral part of an audit performed in accordance with Government Auditing Standards in considering the state of Montana’s internal control over financial reporting and compliance.
Respectfully submitted,
/s/ Cindy Jorgenson
Cindy Jorgenson, CPADeputy Legislative AuditorHelena, MT
December 21, 2018
B-8

MANAGEMENT’S DISCUSSION AND ANALYSIS
INTRODUCTION
Management of the State of Montana (State) provides this Management’s Discussion and Analysis of the State ofMontana’s basic financial statements included in the Comprehensive Annual Financial Report (CAFR). This narrativeoverview and analysis of the financial activities of the State of Montana is for the fiscal year ended June 30, 2018. Weencourage readers to consider this information in conjunction with the additional information that is furnished in theState’s financial statements, which follow.
FINANCIAL HIGHLIGHTS
Government-wideThe assets and deferred outflows of resources of the State exceeded its liabilities and deferred inflows of resources atthe end of fiscal year 2018 by $8.9 billion compared with $8.2 billion at the end of fiscal year 2017, representing a7.6% increase in net position. Component units reported net position of $2.1 billion at the end of fiscal year 2018compared to $1.9 billion at the end of fiscal year 2017, representing a 7.6% increase in net position. More detail isprovided in the financial statement overview below.
Fund LevelAs of the close of fiscal year 2018, the State’s governmental funds reported combined ending fund balances of $4.0billion compared with $3.9 billion at fiscal year 2017. Of the 2018 balance, $1.6 billion is not in spendable form,primarily as permanent fund principle. Thus, $2.4 billion is available for spending. The fund balance in spendable formis segregated by constraint as follows: $1.1 billion restricted, $1.1 billion committed, $8.6 million assigned and $176.6million unassigned. This represents a $100.1 million (2.6%) increase in total fund balance. These changes are discussedin more detail in the financial analysis of the State’s major funds presented below.
The State’s business-type activity funds reported net position at the close of fiscal year 2018 in the amount of $431.5million compared with fiscal year 2017 net position of $395.0 million. Of the 2018 business-type activity net position,$21.4 million was reported as net investment in capital assets. Net position of $410.1 million was in spendable formwith $12.5 million unrestricted and $397.6 million restricted to expenditure for a specific purpose. This represents a$34.1 million (9.1%) increase in spendable net position from the fiscal year 2017 balance of $376.0 million. Thesechanges are discussed in more detail in the financial analysis of the State’s major funds presented below.
Long-term DebtThe State’s total governmental activity bonds and notes payable for governmental activities decreased by $34.1 million,from $193.4 million in fiscal year 2017 to $159.3 million, a 17.6% decrease in fiscal year 2018.
Further detail relating to the State’s long-term debt is provided in notes to the financial statement’s Note 11.
OVERVIEW OF THE FINANCIAL STATEMENTS
This discussion and analysis is intended to serve as an introduction to the State of Montana’s basic financial statements.The State’s basic financial statements include three components: (1) government-wide financial statements, (2) fundfinancial statements, and (3) notes to the financial statements. The report also contains additional required supplementaryinformation, which includes budgetary schedules, pension and other post employment benefits plan information, andrisk management trends. These components are described below:
Basic Financial StatementsThe basic financial statements include two types of financial statements that present different views of the State – thegovernment-wide financial statements and the fund financial statements. These financial statements also include the
B-9

notes to the financial statements, which provide further detail and information related to the balances of the financialstatements.
Government-wide Financial StatementsThe government-wide financial statements provide a broad view of the State’s operations in a manner similar to aprivate-sector business. The statements provide both short-term and long-term information about the State’s financialposition, which assists in assessing the State’s economic condition at the end of the fiscal year. These are preparedusing the flow of economic resources measurement focus and the accrual basis of accounting. In other words, theyfollow methods that are similar to those used by most businesses, including all revenues and expenses connected withthe fiscal year, even if cash involved has not been received or paid. The government-wide financial statements includetwo statements: The Statement of Net Position and the Statement of Activities, as defined below.
The Statement of Net Position presents all of the government’s assets, deferred outflows of resources, liabilities, deferredinflows of resources, and net position. Over time, increases or decreases in the State’s net position may serve as auseful indicator of whether the financial position of the State is improving or deteriorating.
The Statement of Activities presents information related to the government’s net position changes during the most recentfiscal year. All changes in net position are reported as soon as the underlying event giving rise to the change occurs,regardless of the timing of related cash flows. Thus, revenues and expenses are reported in this statement for someitems that will not result in cash flows until future fiscal periods. This statement also presents a comparison betweendirect expenses and program revenues for each function of the State.
Both of the above financial statements have separate sections for three different types of state activities. These threetypes of activities are as follows:
Governmental Activities – Activities mostly supported by taxes and intergovernmental revenues, including federalgrants. Most services normally associated with state government fall into this category including: education (supportfor both K-12 public schools and higher education), general government, health and human services, natural resources,public safety, and transportation.
Business-type Activities – Functions normally intended to recover all or a significant portion of their costs through userfees and charges to external users of goods and services. The major business-type activities of the State include theUnemployment Insurance Fund and the Economic Development Bonds Program, which assists Montana’s smallbusinesses and local governments in obtaining long-term, fixed-rate financing through private Montana lendinginstitutions.
Discretely Presented Component Units – Operations for which the State has financial accountability, but have certainindependent qualities as well. In order to be considered component units, these entities must be legally separate to theextent that they may sue, or be sued, in their own right. For the most part, these entities operate similarly to privatesector businesses and the business-type activities described above. The State’s component units consist of one financingauthority, one housing board, one nonprofit independent public corporation, and two universities.
Fund Financial Statements - Reporting the State’s Major FundsA fund is a grouping of related accounts that is used to maintain control over resources that have been segregated forspecific activities or objectives. The State, like other state and local governments, uses fund accounting to ensure anddemonstrate compliance with finance-related legal requirements.
The fund financial statements focus on individual parts of the state government, reporting the State’s operations inmore detail than the government-wide statements. All of the funds can be divided into three categories. It is importantto note that these fund categories use different accounting approaches and should be interpreted individually. The threecategories of funds are as follows:
Governmental Funds – Most of the basic services provided by the State are financed through governmental funds.Governmental funds are used to account for essentially the same functions reported as governmental activities in thegovernment-wide financial statements. However, unlike the government-wide financial statements, the governmentalfund financial statements focus on near-term inflows and outflows of spendable resources. They also focus on the
B-10

balances of spendable resources available at the end of the fiscal year. Such information may be useful in evaluatingthe government’s near-term financing requirements. This approach is known as using the flow of current financialresources measurement focus and the modified accrual basis of accounting. These statements provide a detailed short-term view of the State’s finances that assists in determining whether there will be adequate financial resources availableto meet the current needs of the State.
The State has five governmental funds that are considered major funds for presentation purposes. Each major fund ispresented in a separate column in the governmental fund balance sheet and in the governmental fund statement ofrevenues, expenditures, and changes in fund balances. The State’s five major governmental funds are the General Fund,the State Special Revenue Fund, the Federal Special Revenue Fund, the Coal Severance Tax Fund, and the Land GrantFund.
Proprietary Funds – When the State charges customers for the service it provides, whether to outside customers or toother agencies within the State, these services are generally reported in proprietary funds. Like the government-widestatements, proprietary fund statements utilize full accrual accounting, the same method used by private sectorbusinesses. Enterprise funds report activities that provide supplies and services to the general public. Whereas, internalservice funds report activities that provide supplies and services to the State’s other programs and activities.
Fiduciary Funds – Resources held for the benefit of parties outside state government are accounted for in fiduciaryfunds. Fiduciary funds are not reflected in the government-wide financial statements because the resources of thesefunds are not available to support the State’s own programs. Fiduciary fund statements use the full accrual basis ofaccounting.
Notes to the Financial StatementsThe notes to the financial statements provide additional information that is essential for a full understanding of thegovernment-wide and the fund financial statements. The notes to the financial statements can be found immediatelyfollowing the fiduciary fund financial statements.
Required Supplementary InformationThe basic financial statements are followed by a section of required supplementary information. This section containsa budgetary comparison schedule which includes the reconciliation between the statutory fund balance for budgetarypurposes and the fund balance for the General Fund and major special revenue funds as presented in the governmentalfund financial statements. Required supplementary information also includes pension and other post employmentbenefits plan information, as well as additional risk management trend data.
GOVERNMENT-WIDE FINANCIAL ANALYSIS
Montana’s overall financial position increased from the last fiscal year as reflected in the $627.4 million increase (7.6%)in net position. This improvement resulted from a continued economic growth, particularly related to tax revenue,within the State. Additionally, $245.0 million of the increase is related to the implementation of GASB Statement No.75 (GASB 75) and the restatement of total OPEB liability.
Net PositionAs noted earlier, net position may serve over time as a useful indicator of a government’s financial position. The State’scombined net position (government and business-type activities) totaled $8.9 billion at the end of fiscal year 2018. Netposition of the both governmental and business-type activities increased by $590.9 million (7.5%) and $36.5 million(9.2%), respectively. These changes are explained in detail in the major fund analysis below.
A portion of the State’s net position reflects its investment in capital assets such as land, buildings, equipment andinfrastructure (roads, bridges, and other immovable assets) less any related debt used to acquire those assets that is stilloutstanding. The State uses these capital assets to provide services to citizens; consequently, these assets are not availablefor future spending. Although the State’s investment in its capital assets is reported net of related debt, it should benoted that the resources needed to repay this debt must be provided from other sources since the capital assets themselvescannot be used to liquidate these liabilities.
B-11

An additional portion of the State’s net position represents resources that are subject to external restrictions on howthey may be used. The remaining balance of unrestricted net position may be used to meet the State’s ongoing obligationsto citizens and creditors. Internally imposed designations of resources are not presented as restricted net position.
At the end of the current fiscal year, the State reported positive balances in net investment in capital assets and restrictednet position categories, along with a negative balance in the unrestricted category of net position, for both thegovernmental activities and the primary government as a whole. The negative unrestricted net position is primarily dueto net pension liability. GASB Statements No. 68 and 71, related to pension liabilities and other balance sheetcomponents, were implemented in fiscal year 2015 and are contributing factors to the negative net position. The Statealso reported positive balances for all categories of net position for the business-type activities.
Net PositionJune 30,
(expressed in thousands)
GovernmentalActivities
Business-typeActivities
Total PrimaryGovernment
2017 2018 2017 2018 2017 2018Current and other assets $ 5,143,823 $ 5,262,514 $ 549,267 $ 582,328 $ 5,693,090 $ 5,844,842Capital assets 5,991,964 6,190,693 19,400 21,627 6,011,364 6,212,320 Total assets 11,135,787 11,453,207 568,667 603,955 11,704,454 12,057,162
Deferred outflows of resources 342,370 372,886 3,120 4,011 345,490 376,897
Long-term liabilities Due in more than one year 2,513,940 2,279,169 27,252 23,527 2,541,192 2,302,696Other liabilities 1,055,609 1,029,316 149,298 152,122 1,204,907 1,181,438 Total liabilities 3,569,549 3,308,485 176,550 175,649 3,746,099 3,484,134
Deferred inflows of resources 55,436 73,544 229 831 55,665 74,375
Net investment in capital assets 5,873,003 6,088,211 18,986 21,395 5,891,989 6,109,606Restricted 2,951,964 2,998,805 367,734 397,588 3,319,698 3,396,393Unrestricted (971,795) (642,952) 8,288 12,503 (963,507) (630,449)
Total net position $ 7,853,172 $ 8,444,064 $ 395,008 $ 431,486 $ 8,248,180 $ 8,875,550
B-12

The following condensed financial information was derived from the government-wide Statement of Activities,and reflects how the State’s net position changed during the fiscal year:
Changes in Net PositionFor Fiscal Year Ended June 30,
(expressed in thousands)
GovernmentalActivities
Business-typeActivities
Total PrimaryGovernment
2017 2018 2017 2018 2017 2018Revenues: Program revenues Charges for services $ 571,927 $ 594,814 $ 389,279 $ 404,890 $ 961,206 $ 999,704 Operating grants 2,506,711 2,555,898 60,219 65,885 2,566,930 2,621,783 Capital grants 434,860 447,018 604 685 435,464 447,703 General revenues Taxes 2,352,133 2,625,077 27,958 28,846 2,380,091 2,653,923 Other 93,077 69,101 3,708 4,019 96,785 73,120 Total revenues 5,958,708 6,291,908 481,768 504,325 6,440,476 6,796,233
Expenses: General government 688,798 674,329 688,798 674,329 Public safety 454,194 429,760 454,194 429,760 Transportation 484,214 527,927 484,214 527,927 Health and human service 2,668,273 2,681,151 2,668,273 2,681,151 Education 1,344,121 1,299,423 1,344,121 1,299,423 Natural resources 295,853 379,525 295,853 379,525 Interest on long-term debt 7,484 6,743 7,484 6,743 Unemployment Insurance 117,788 113,843 117,788 113,843 Liquor Stores 83,313 86,118 83,313 86,118 State Lottery 43,377 45,896 43,377 45,896 Economic Dev Bonds 1,851 2,648 1,851 2,648 Hail Insurance 1,696 576 1,696 576 Gen Govt Services 72,489 73,539 72,489 73,539 Prison Funds 8,140 9,130 8,140 9,130 MUS Group Insurance 81,051 88,912 81,051 88,912 MUS Workers Comp 2,786 2,738 2,786 2,738 Total expenses 5,942,937 5,998,858 412,491 423,400 6,355,428 6,422,258
Increase (decrease) in net position before transfers 15,771 293,050 69,277 80,925 85,048 373,975Transfers 46,141 48,854 (46,141) (48,854) — —Change in net position 61,912 341,904 23,136 32,071 85,048 373,975Net position, beg of year (as adjusted) 7,791,260 8,102,160 371,872 399,415 8,163,132 8,501,575Net position, end of year $ 7,853,172 $ 8,444,064 $ 395,008 $ 431,486 $ 8,248,180 $ 8,875,550
B-13

Governmental ActivitiesThe following chart depicts revenues of the governmental activities for the fiscal year:
Revenues - Govermental ActivitiesFiscal Year Ended June 30, 2018
Operating Grants: 40.6%
Capital Grants: 7.1%
Taxes: 41.7%
Charges for Services: 9.5%Other: 1.1%
The following chart depicts expenses of the governmental activities for the fiscal year:
Expense - Governmental ActivitiesFiscal Year Ended June 30, 2018
Natural Resources: 6.3%
Education: 21.7%
Health and Human Services: 44.7%
Transportation:8.8%
Public Safety: 7.2%
General Government: 11.2%
Interest on Long-Term Debt: 0.1%
B-14

Business-type ActivitiesThe following chart depicts revenues of the business-type activities for the fiscal year:
Revenues - Business-type ActivitiesFiscal Year Ended June 30, 2018
Operating Grants: 13.1%
Capital Grants: 0.1%
Taxes: 5.7%
Other: 0.8%
Charges for Services: 80.3%
The following chart depicts expenses of the business-type activities for the fiscal year:
Expenses - Business-type ActivitiesFiscal Year Ended June 30, 2018
Prison Funds: 2.2%
MUS Group Insurance: 21.0%
MUS Workers Comp: 0.7%
Unemployment Insurance: 26.9%Liquor Stores: 20.3%
State Lottery: 10.8%
Economic Dev Bonds: 0.6%Hail Insurance: 0.1%
Gen Govt Services: 17.4%
B-15

FINANCIAL ANALYSIS OF THE STATE’S MAJOR FUNDS
As the State completed the year, its governmental funds reported fund balances of $4.0 billion. Of this total, $2.4 billion(59.4%) constitutes spendable fund balance and $1.6 billion (40.6%) is classified as non-spendable. The analysis ofthe following major funds, providing the majority of the fund balance for the government, follows.
General Fund Revenues and ExpendituresThe General Fund is the chief operating fund of the State. For fiscal year 2018, the total fund balance of the GeneralFund was reported at approximately $199.3 million. Of this balance $4.6 million is non-spendable. The remaining$194.7 million is spendable with $8.0 million assigned and $186.7 million unassigned. This represents 8.2% of the$2.4 billion spendable governmental fund balances for all governmental funds. Of the assigned fund balance, $8.0million relates to outstanding encumbrances at the end of the fiscal year. Further detail on the breakdown of fund balancefor the General Fund is provided in Note 14 – Major Purpose Presentation.
Total fund balance increased by $132.3 million when compared to the previously reported fund balance of $67.0 million.Changes in both expenditures and revenues are discussed in detail below. The 2017 Special Legislative Session projected$69.4 million General Fund unassigned fund balance for fiscal year 2018, without regard to a fund balance spend downin fiscal year 2019.
General Fund Revenues – Total General Fund revenues were $2.3 billion for fiscal year 2018 (lower than legislativeestimation), a 9.7% increase from the $2.1 billion reported in 2017 (which were also lower than legislative estimation).Fiscal year 2018 tax revenue increased by 10.2% in total over 2017, with natural resource and corporate income taxcollections up 21.2% and 24.9%, respectively. Individual income tax collections increased by 10.6%. Transfers alsoincreased $68.6 million (92.3%) due to the 2017 Special Legislative Session activity. Other noted increases in revenuesincluded investment earnings, contributions/premiums, and federal revenues.
General Fund Expenditures – Total General Fund expenditures for fiscal year 2018 decreased by $94.9 million (4.1%).This decrease in expenditures occurred in the public safety, health and human services, education and natural resourcefunctions as follows:
• Public safety expenditures decreased by $7.7 million (2.4%)• Health and human services expenditures decreased by $21.2 million (3.9%) • Education expenditures decreased by $50.7 million (4.8%) • Natural resources expenditures decreased by $6.3 million (16.8%)
Transfers out increased by $13.8 million (30.5%) to $59.2 million in 2018, mostly attributable to the increase in firesuppression transfers. During the 2017 Special Legislative Session, HB 2 revisions were adopted, which called for $9.4million cuts to judicial, law enforcement, and justice, along with $49.2 million in cuts to health and human services,$6.3 million cuts to education, and $4.6 million cuts for natural resources and transportation. These cuts help to explainthe majority of the decrease in General Fund expenditures across the board.
The General Fund’s actual revenues and expenditures in comparison to budgeted revenues and expenditures is providedin more depth on the Budgetary Comparison Schedule within the Required Supplementary Information section of thisreport. The same level of detail used to report the actual revenues and expenditures is not readily available for allbudgetary revenues and expenditures, which may cause some variances.
General Fund Expenditure Budget ReversionsFund balances are not reserved for reverted appropriations. For fiscal year 2018, general fund appropriations thatreverted to 2019 were $9.4 million.
The Department of Administration had unspent appropriations of $1.1 million, these were attributable to supplementaltransfers, banking charges, and other operational costs.
The Department of Public Health and Human Services had unspent appropriations of $6.0 million related to Medicaidsavings and other operational costs.
B-16

The Department of Justice and the School for the Deaf and Blind had unspent appropriations of $462.6 thousand and$467.6 thousand respectively, related to operational transfers and education costs.
The remaining unspent appropriation of $1.4 million was attributable to miscellaneous reversions across other agencies.
State Special Revenue FundThe fund balance of the State Special Revenue Fund increased by $19.6 million to $1.6 billion . Revenues increasedby $66.3 million (7.3%) and expenditures increased $31.8 million (3.2%), for fiscal year 2018. The largest increasesin revenues are attributable to an increase in natural resource and fuel tax collections, along with licenses and permits.The largest increases in expenditures are attributable to general government and natural resource related expenditures.Other financing sources such as transfers in and out both increased due to the 2017 Special Legislative Session. Thegeneral increase in both fuel and natural resource taxes along with fund balance is due to the steady crude oil increaseover the prior year. This resulted in higher revenues than in the previous year when including the 2017 Special LegislativeSession increase in the per gallon fuel tax.
Federal Special Revenue Fund The fund balance of the Federal Special Revenue Fund decreased by $22.1 million (183.4%) to the balance of negative$10.1 million. Revenues and expenditures increased by $45.0 million (1.6%) and $67.8 million (2.4%) respectively,for the fiscal year 2018. Revenue increases are attributable to increases in federal program revenue, expenditure increasesare attributable to increases in health and human services, public safety, and natural resources related expenditures.The natural resources expenditure increase of 35% is attributable to the 2017 fire season which was the most expensivefire season in Montana's history.
Coal Severance Tax Permanent Fund The fund balance of the Coal Severance Tax Permanent Fund decreased by $4.3 million (0.4%) to $1.1 billion. Revenueincreased by $2.6 million (7.0%) to $39.3 million, primarily due to an increase in international coal exports whichincreased natural resource taxes $7.5 million. Thus an increase in transfers out, which increased by $1.2 million (2.7%),and a decrease in investment earnings of $4.8 million helped to offset the increase in revenue and led to the decreasein fund balance.
Land Grant Permanent FundThe fund balance of the Land Grant Permanent Fund decreased by $15.3 million (2.1%) to $710.2 million. Total LandGrant revenue was $65.2 million, transfers out were $62.1 million, and the fund purchased land for $12.9 million.which lead to the decrease in fund balance.
Unemployment Insurance Enterprise FundNet position restricted for unemployment compensation increased by $15.6 million (5.2%). The increase in net positionreflects the continued impact of low unemployment throughout fiscal year 2018 accompanied by an increase in thetaxable wage base from $31.4 thousand to $32.0 thousand in 2018.
Economic Development Bonds Enterprise FundNet position increased by 0.5% to $5.1 million in fiscal year 2018. Financing income revenue increased $637.0 thousand,while expenses from interest expense increased $665.0 thousand. Overall revenues and expenditures increased 45.2%and 43.2% which kept revenues almost even with expenditures for the year.
CAPITAL ASSETS AND DEBT ADMINISTRATION
Capital AssetsThe State’s investment in capital assets for its governmental and business-type activities, as of June 30, 2018, amountedto $8.5 billion, with related accumulated depreciation of $2.3 billion, leaving a net book value of $6.2 billion. Thisinvestment in capital assets includes land, buildings, improvements, equipment, infrastructure, intangible assets, andconstruction in progress. Infrastructure assets are items that are normally immovable and of value only to the State,such as roads, bridges, streets and sidewalks, drainage systems, lighting systems, and similar items.
The total increase in the State’s investment in capital assets for the current fiscal year was $201.0 million or 3.4% interms of net book value. Most increases in capital expenditures were seen in construction, or reconstruction, of roads
B-17

and bridges. Additional information relating to the State’s capital assets can be found in Note 5 of the notes to thefinancial statements.
Debt AdministrationMontana continues to receive excellent general obligation bond ratings from Moody’s Investor Service (Aa1), Standardand Poor’s Corporation (AA), and Fitch Ratings (AA+), which remain unchanged from 2017.
State debt may be authorized either by a two-thirds vote of the members of each house of the Legislature, or by afavorable vote of a majority of the State’s electors voting thereon. There is no constitutional limit on the amount ofdebt that may be incurred by the State. The Montana Constitution does, however, prohibit the incurring of debt to coverdeficits caused by appropriations exceeding anticipated revenue.
The State of Montana’s general obligation debt decreased from $98.6 million at June 30, 2017, to $84.5 million at June30, 2018. There is cash available, of $7.4 million at the end of fiscal year 2018, in debt service funds to service generalobligation debt.
The below table contains the ratio of general obligation debt and total State debt to personal income and to the amountof debt per capita:
Amount(in thousands)
Percentage of Personal Income (1)
State DebtPer Capita (2)
General obligation debt $ 84,460 0.14 % $ 65Total State debt (3) $ 164,131 0.34 % $ 156
(1) Based on personal income for calendar year 2017.(2) Based on estimated 2017 Montana population.(3) Based on total of general obligation bonds, special revenue bonds, notes payable and lease/installment purchase payable for the percentage
and state debt per capita.
More detailed information regarding the State’s long-term obligations is provided in Note 11 of the notes to the financialstatements and in the statistical tables.
ECONOMIC CONDITION AND OUTLOOK
Montana’s primary economic base remains concentrated in agriculture, mining, manufacturing, and nonresident travel.Per the 2018 Labor Day Report issued by the Montana Department of Labor and Industry, Montana had real wage gainsof 1.1% in 2018, which was faster than the rate of inflation. Montana’s unemployment rate has continued to remainlow and in the last year the national rate joined Montana with a rate around 4.0%. Montana added roughly 4,600 jobsin 2017, for a growth rate of 1.0%. Montana had an estimated 1,050,493 population as of July 1, 2017. The Montanalabor market has total nonfarm workers of 479,800 in September 2018 as compared to 475,200 in August 2017.Montana’s real GDP growth over the 2007 to 2017 time-frame outpaced the nation with an average of roughly 1.3%per year to real GDP. A more in-depth analysis of the State’s overall financial position can be found in the transmittalletter of this report.
During to fiscal year-end 2018, a special session of the Legislature was called to order to address an anticipated GeneralFund deficit for the budget period ended June 30, 2019. More information, related to the financial impacts are providedin the letter of transmittal.
The Montana Constitution, Article VIII, Section 15, states that public retirement systems shall be funded on an actuariallysound basis. Public pension plans are considered actuarially sound if the unfunded accrued actuarial liability amortizationperiod is within 30 years. As of June 30, 2018, the Game Warden & Peace Officers’ Retirement System (GWPORS),the Highway Patrol Officers’ Retirement System (HPORS), the Public Employees’ Retirement System - Defined BenefitRetirement System (PERS-DBRP), and the Teachers' Retirement System (TRS) were not in compliance and do notamortize within 30 years. The unfunded liabilities in the other state retirement systems amortize in 30 years or less asof the fiscal year ended June 30, 2018.
B-18

The actuarial condition of these retirement plans is disclosed in greater detail in Note 6 of the financial statements. Theunfunded actuarial liability of these plans is long-term in nature and does not translate into an inability of the plans tomeet their current obligations in the near future.
REQUESTS FOR INFORMATION
This financial report is designed to provide a general overview of the State of Montana’s finances for all of Montana’scitizens, taxpayers, customers, investors, and creditors. The financial report seeks to demonstrate the State’saccountability for the money it receives. Questions concerning any of the information provided in this report or requestsfor additional information should be addressed to the State of Montana, Statewide Accounting Bureau, Room 255Mitchell Building, PO Box 200102, Helena, MT 59620.
B-19

STATEMENT OF NET POSITIONJUNE 30, 2018 (amounts expressed in thousands)
PRIMARY GOVERNMENTGOVERNMENTAL BUSINESS-TYPE COMPONENT
ACTIVITIES ACTIVITIES TOTAL UNITSASSETS
Cash/cash equivalents (Note 3) $ 1,268,555 $ 442,364 $ 1,710,919 $ 476,816Receivables (net) (Note 4) 486,051 46,776 532,827 182,680Due from primary government — — — 1,183Due from other governments 378,733 116 378,849 27,925Due from component units 3,395 2,993 6,388 271Internal balances 4,764 (4,764) — —Inventories 28,369 4,852 33,221 4,664Advances to component units 15,435 20,736 36,171 —Long-term loans/notes receivable 486,893 39,365 526,258 493,184Equity in pooled investments (Note 3) 2,266,228 14,771 2,280,999 47,127Investments (Note 3) 246,443 11,795 258,238 2,145,398Securities lending collateral (Note 3) 31,553 206 31,759 21,655Net pension asset (Note 6) 35,855 — 35,855 —Other assets 10,240 3,118 13,358 94,238Depreciable capital assets and infrastructure, net (Note 5) 4,237,224 8,785 4,246,009 797,969Land and nondepreciable capital assets (Note 5) 1,953,469 12,842 1,966,311 130,147
Total assets 11,453,207 603,955 12,057,162 4,423,257
DEFERRED OUTFLOWS OF RESOURCES (Note 4) 372,886 4,011 376,897 78,926
LIABILITIESAccounts payable (Note 4) 744,307 23,717 768,024 105,337Lottery prizes payable — 3,801 3,801 —Due to primary government — — — 6,388Due to other governments 35,892 83 35,975 104Due to component units 1,183 — 1,183 271Due to pension trust funds 32,014 — 32,014 —Advances from primary government — — — 36,171Unearned revenue 22,017 2,197 24,214 99,066Amounts held in custody for others 18,825 30 18,855 16,761Securities lending liability (Note 3) 31,553 206 31,759 21,655Other liabilities 5,955 1,855 7,810 22,560Short-term debt (Note 11) — 105,110 105,110 —Long-term liabilities (Note 11):
Due within one year 137,570 15,123 152,693 191,241Due in more than one year 399,938 6,127 406,065 1,673,109
Net pension liability (Note 6) 1,830,301 16,458 1,846,759 222,792Total OPEB liability (Note 7) 48,930 942 49,872 41,995
Total liabilities 3,308,485 175,649 3,484,134 2,437,450
DEFERRED INFLOWS OF RESOURCES (Note 4) 73,544 831 74,375 11,375
B-20

PRIMARY GOVERNMENTGOVERNMENTAL BUSINESS-TYPE COMPONENT
ACTIVITIES ACTIVITIES TOTAL UNITSNET POSITION
Net investment in capital assets $ 6,088,211 $ 21,395 $ 6,109,606 $ 650,844Restricted for:
General government 23,409 — 23,409 —Transportation 58,959 — 58,959 —Natural resources 531,240 — 531,240 —Public safety 230,682 — 230,682 —Education 6,060 — 6,060 —Funds held as permanent investments:
Nonexpendable 1,608,361 — 1,608,361 412,779Expendable 540,094 — 540,094 —
Unemployment compensation — 314,210 314,210 —Montana Board of Housing — — — 153,518Other purposes — 83,378 83,378 229,878
Unrestricted (642,952) 12,503 (630,449) 606,339
Total net position $ 8,444,064 $ 431,486 $ 8,875,550 $ 2,053,358
The notes to the financial statements are an integral part of this statement.
B-21

STATEMENT OF ACTIVITIESFOR THE FISCAL YEAR ENDED JUNE 30, 2018 (amounts expressed in thousands)
PROGRAM REVENUESOPERATING CAPITAL
CHARGES GRANTS GRANTS NETFOR AND AND (EXPENSE)
FUNCTIONS/PROGRAMS EXPENSES SERVICES CONTRIBUTIONS CONTRIBUTIONS REVENUEPrimary government:
Governmental activities:General government $ 674,329 $ 170,447 $ 137,295 $ 1,205 $ (365,382)Public safety 429,760 175,999 21,614 107 (232,040)Transportation 527,927 27,319 60,003 429,478 (11,127)Health and human services 2,681,151 41,916 2,009,235 — (630,000)Education 1,299,423 13,972 197,030 1,119 (1,087,302)Natural resources 379,525 165,161 130,721 15,109 (68,534)Interest on long-term debt 6,743 — — — (6,743)
Total governmental activities 5,998,858 594,814 2,555,898 447,018 (2,401,128)
Business-type activities:Unemployment Insurance 113,843 114,678 13,967 — 14,802Liquor Stores 86,118 99,059 — — 12,941State Lottery 45,896 56,400 — — 10,504Economic Development Bonds 2,648 37 2,554 — (57)Hail Insurance 576 1,065 22 — 511Other Service 73,539 25,386 48,198 685 730Prison Funds 9,130 7,733 — — (1,397)MUS1 Group Insurance 88,912 100,532 928 — 12,548MUS1 Workers Compensation 2,738 — 216 — (2,522)
Total business-type activities 423,400 404,890 65,885 685 48,060Total primary government $ 6,422,258 $ 999,704 $ 2,621,783 $ 447,703 $ (2,353,068)
Component units:Montana Board of Housing $ 20,996 $ 1,516 $ 19,336 $ — $ (144)Facility Finance Authority 515 613 2,208 — 2,306Montana State Fund 227,078 166,768 — — (60,310)Montana State University 584,734 280,592 176,777 5,219 (122,146)University of Montana 447,609 189,675 150,945 191 (106,798)
Total component units $ 1,280,932 $ 639,164 $ 349,266 $ 5,410 $ (287,092)
B-22

PRIMARY GOVERNMENTGOVERNMENTAL BUSINESS-TYPE COMPONENT
ACTIVITIES ACTIVITIES TOTAL UNITSChanges in net position:
Net (expense) revenue $ (2,401,128) $ 48,060 $ (2,353,068) $ (287,092)General revenues:
Taxes: Property 293,530 — 293,530 — Fuel 259,162 — 259,162 — Natural resource 209,776 — 209,776 — Individual income 1,304,715 — 1,304,715 — Corporate income 170,607 — 170,607 — Other (Note 1) 387,287 28,846 416,133 —
Unrestricted grants and contributions 12,595 233 12,828 111Settlements 19,794 — 19,794 —Unrestricted investment earnings 29,241 66 29,307 99,080Transfers from primary government — — — 228,646Gain (loss) on sale of capital assets 2,595 11 2,606 328Miscellaneous 4,876 3,709 8,585 1,085
Contributions to term and permanent endowments — — — 21,373Transfers between primary government 48,854 (48,854) — —
Total general revenues, contributions, and transfers 2,743,032 (15,989) 2,727,043 350,623Change in net position 341,904 32,071 373,975 63,531
Total net position - July 1 - as previously reported 7,853,172 395,008 8,248,180 1,907,768Adjustments to beginning net position (Note 2) 248,988 4,407 253,395 82,059Total net position - July 1 - as adjusted 8,102,160 399,415 8,501,575 1,989,827Total net position - June 30 $ 8,444,064 $ 431,486 $ 8,875,550 $ 2,053,358
1Montana University SystemThe notes to the financial statements are an integral part of this statement.
B-23

BALANCE SHEETGOVERNMENTAL FUNDSJUNE 30, 2018 (amounts expressed in thousands)
SPECIAL REVENUE
GENERAL STATE FEDERALASSETSCash/cash equivalents (Note 3) $ 242,215 $ 762,741 $ 57,464Receivables (net) 285,885 120,718 53,234Interfund loans receivable (Note 12) 72,467 60,222 —Due from other governments 13,937 408 364,388Due from other funds (Note 12) 28,839 10,604 2,580Due from component units — 1,020 11Inventories 3,798 21,030 —Equity in pooled investments (Note 3) — 353,135 —Long-term loans/notes receivable — 458,592 3,899Advances to other funds (Note 12) 489 39,589 —Advances to component units — 7,739 —Investments (Note 3) 5,759 39,090 1,231Securities lending collateral (Note 3) — 4,909 —Other assets 2,988 5,926 114
Total assets $ 656,377 $ 1,885,723 $ 482,921
LIABILITIES, DEFERRED INFLOWS OF RESOURCES, AND FUND BALANCESLiabilities:
Accounts payable $ 258,704 $ 177,751 $ 288,003Interfund loans payable (Note 12) — 5,215 125,499Due to other governments 153 33,474 2,265Due to other funds (Note 12) 2,355 15,457 1,016Due to component units 32,031 498 668Advances from other funds (Note 12) — 7,660 35,596Unearned revenue 2,838 20,776 3,054Amounts held in custody for others 5,848 12,838 13Securities lending liability (Note 3) — 4,909 —Other liabilities 1 824 —
Total liabilities 301,930 279,402 456,114
DEFERRED INFLOWS OF RESOURCES 155,128 5,261 36,876
Fund balances (Note 14):Nonspendable 4,614 21,876 57Restricted — 1,043,005 —Committed — 536,179 —Assigned 7,998 — —Unassigned 186,707 — (10,126)
Total fund balances 199,319 1,601,060 (10,069)Total liabilities, deferred inflows of resources, and fund balances $ 656,377 $ 1,885,723 $ 482,921
The notes to the financial statements are an integral part of this statement.
B-24
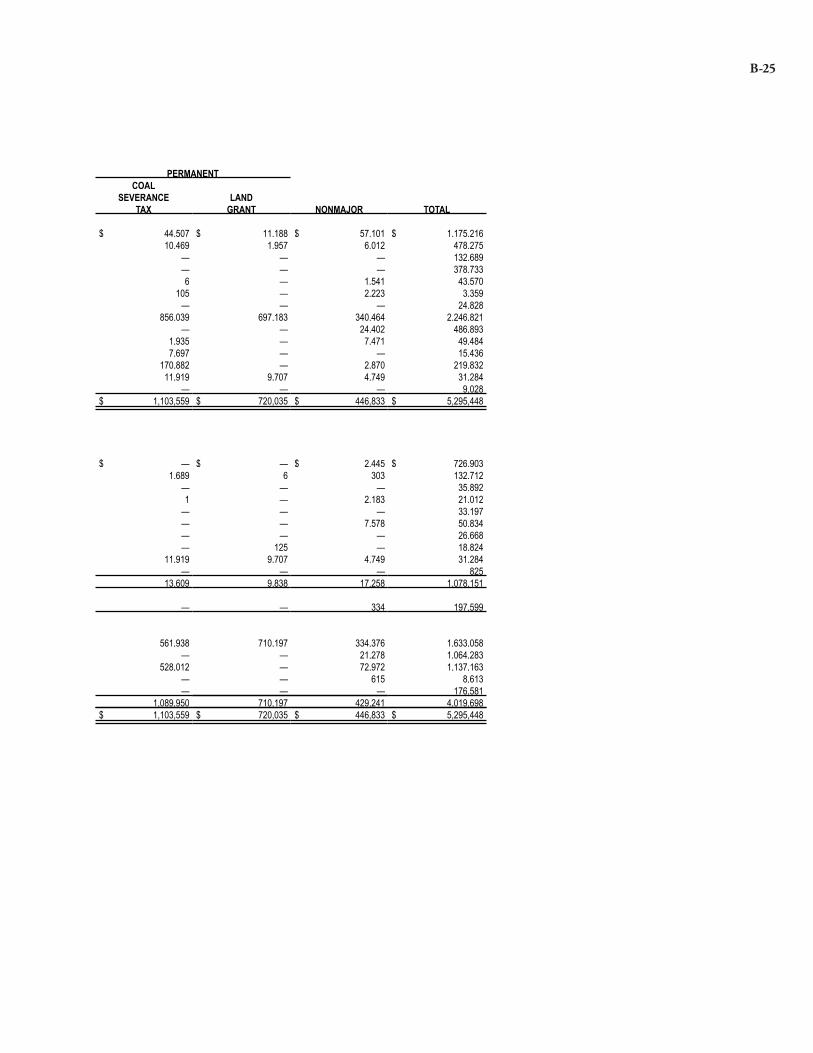
PERMANENTCOAL
SEVERANCE LANDTAX GRANT NONMAJOR TOTAL
$ 44,507 $ 11,188 $ 57,101 $ 1,175,21610,469 1,957 6,012 478,275
— — — 132,689— — — 378,7336 — 1,541 43,570
105 — 2,223 3,359— — — 24,828
856,039 697,183 340,464 2,246,821— — 24,402 486,893
1,935 — 7,471 49,4847,697 — — 15,436
170,882 — 2,870 219,83211,919 9,707 4,749 31,284
— — — 9,028$ 1,103,559 $ 720,035 $ 446,833 $ 5,295,448
$ — $ — $ 2,445 $ 726,9031,689 6 303 132,712
— — — 35,8921 — 2,183 21,012— — — 33,197— — 7,578 50,834— — — 26,668— 125 — 18,824
11,919 9,707 4,749 31,284— — — 825
13,609 9,838 17,258 1,078,151
— — 334 197,599
561,938 710,197 334,376 1,633,058— — 21,278 1,064,283
528,012 — 72,972 1,137,163— — 615 8,613— — — 176,581
1,089,950 710,197 429,241 4,019,698$ 1,103,559 $ 720,035 $ 446,833 $ 5,295,448
B-25

This page intentionally left blank.
B-26

RECONCILIATION OF THE BALANCE SHEET OF GOVERNMENTAL FUNDS TO THESTATEMENT OF NET POSITIONJUNE 30, 2018(amounts expressed in thousands)
Total fund balances - governmental funds $ 4,019,698
Amounts reported for governmental activities in the Statement of Net Position are different due to:
Capital assets used in governmental activities are not current financial resources and therefore notreported in the governmental funds (Note 5):
Depreciable capital assets and infrastructure, net $ 4,237,224Land and nondepreciable capital assets 1,953,469 6,190,693
Deferred outflows of resources represent a consumption of net assets that will be reported as anoutflow of resources in a future period and therefore are not reported in the governmental funds. 372,886
Other assets not available in the current period and therefore are not reported in the governmentalfunds:
Net pension asset 35,855Long-term receivables 108
Internal service funds are used by management to charge the costs of certain activities, such asinsurance and central computer services, to individual governmental funds. The assets, deferredoutflows of resources, liabilities and deferred inflows of resources of the internal service funds areincluded in the governmental activities in the Statement of Net Position, excluding internal servicefunds' capital assets and long-term liabilities reported in specific areas. 129,735
Other liabilities that are not due and payable in the current period and are not reported in thegovernmental funds. (12,228)
Deferred inflows of resources represent an acquisition of net assets that will be recognized as aninflow of resources in a future period and therefore are not reported in the governmental funds. 124,056
Long-term liabilities and related accrued interest are not due and payable in the current period andtherefore are not reported in the governmental funds (Note 11):
Other long-term liabilities (537,508)Net pension liability (1,830,301)Total OPEB liability (48,930) (2,416,739)
Total net position - governmental activities $ 8,444,064
The notes to the financial statements are an integral part of this statement.
B-27

STATEMENT OF REVENUES, EXPENDITURES, AND CHANGES IN FUND BALANCESGOVERNMENTAL FUNDSFOR THE FISCAL YEAR ENDED JUNE 30, 2018 (amounts expressed in thousands)
SPECIAL REVENUE
GENERAL STATE FEDERALREVENUES (Note 14)Licenses/permits $ 126,637 $ 220,898 $ —Taxes:
Natural resource 86,090 82,085 —Individual income 1,285,132 — —Corporate income 166,393 — —Property 277,127 16,403 —Fuel — 258,920 —Other 237,112 146,246 1
Charges for services/fines/forfeits/settlements 35,776 109,846 18,295Investment earnings 12,805 9,582 447Securities lending income 1 114 —Sale of documents/merchandise/property 334 10,000 —Rentals/leases/royalties 7 1,234 —Contributions/premiums 5,250 27,471 —Grants/contracts/donations 10,856 24,274 18Federal 21,154 9,338 2,768,657Federal indirect cost recoveries 257 49,007 67,346Other revenues 400 3,165 516
Total revenues 2,265,331 968,583 2,855,280
EXPENDITURESCurrent:
General government 350,591 200,367 92,688Public safety 311,184 89,213 15,824Transportation — 220,368 111,201Health and human services 517,528 160,049 1,997,224Education 1,007,891 76,112 209,620Natural resources 31,394 235,021 92,184
Debt service:Principal retirement 22 634 32Interest/fiscal charges 283 355 5
Capital outlay 1,377 56,645 328,856Securities lending — 65 —
Total expenditures 2,220,270 1,038,829 2,847,634Excess of revenue over (under) expenditures 45,061 (70,246) 7,646
OTHER FINANCING SOURCES (USES)Inception of lease/installment contract — 312 —Insurance proceeds — 309 —General capital asset sale proceeds 96 1,805 31Energy conservation loans — 1,589 —Transfers in (Note 12) 142,442 175,712 2,518Transfers out (Note 12) (59,155) (90,735) (32,381)
Total other financing sources (uses) 83,383 88,992 (29,832)Net change in fund balances 128,444 18,746 (22,186)Fund balances - July 1 - as previously reported 66,984 1,581,457 12,078Adjustments to beginning fund balance (Note 2) 4,625 1,691 39Fund balances - July 1 - as adjusted 71,609 1,583,148 12,117Increase (decrease) in inventories (734) (834) —Fund balances - June 30 $ 199,319 $ 1,601,060 $ (10,069)
The notes to the financial statements are an integral part of this statement.
B-28

PERMANENTCOAL
SEVERANCE LANDTAX GRANT NONMAJOR TOTAL
$ — $ 1,456 $ — $ 348,991
31,304 — 9,377 208,856— — — 1,285,132— — — 166,393— — — 293,530— — — 258,920— — 1,600 384,959— — 10,845 174,762
7,831 2,058 12,035 44,758189 154 72 530— 10,519 1,074 21,927— 50,704 — 51,945— — — 32,721— 126 — 35,274— — — 2,799,149— — — 116,610— — — 4,081
39,324 65,017 35,003 6,228,538
— 57 99 643,802— — 608 416,829— — — 331,569— — 372 2,675,173— — 24 1,293,647— 4,227 477 363,303
— — 31,280 31,968— — 7,445 8,088— 16,057 22,248 425,18392 76 36 26992 20,417 62,589 6,189,831
39,232 44,600 (27,586) 38,707
— — — 312— — — 309— 2,269 1 4,202— — — 1,589
656 5 48,203 369,536(44,189) (62,135) (30,758) (319,353)(43,533) (59,861) 17,446 56,595(4,301) (15,261) (10,140) 95,302
1,094,251 725,458 439,356 3,919,584— — 25 6,380
1,094,251 725,458 439,381 3,925,964— — — (1,568)
$ 1,089,950 $ 710,197 $ 429,241 $ 4,019,698
B-29
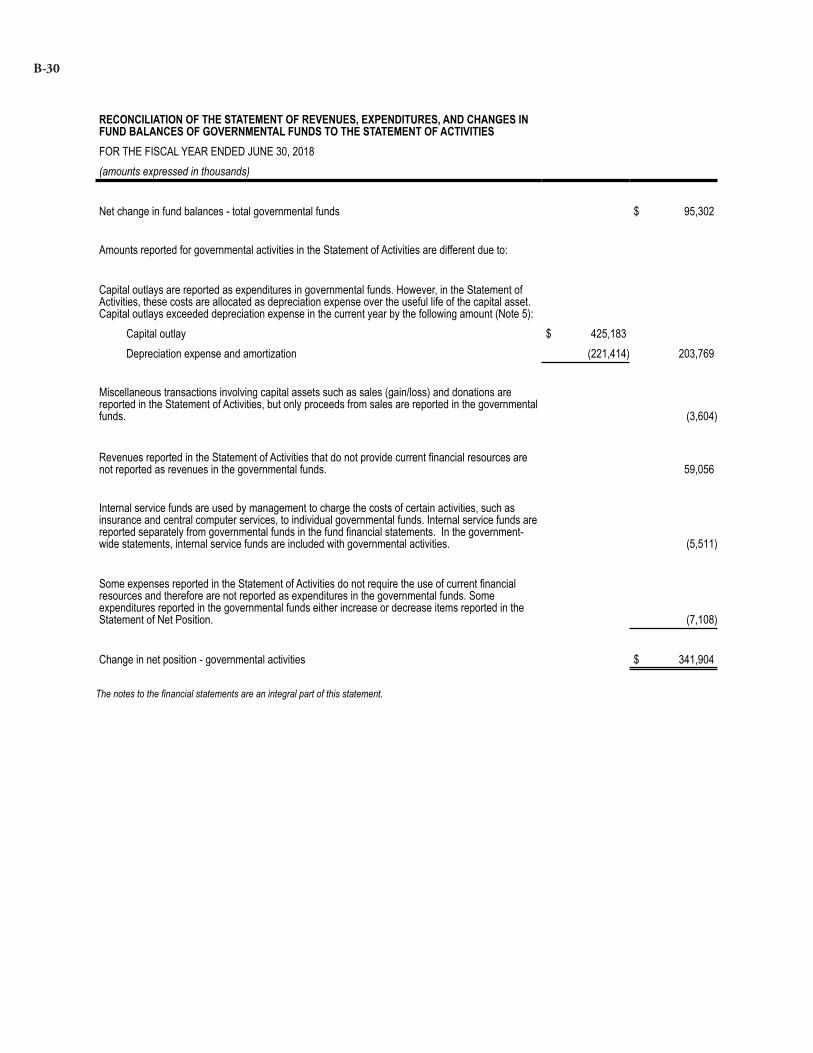
RECONCILIATION OF THE STATEMENT OF REVENUES, EXPENDITURES, AND CHANGES INFUND BALANCES OF GOVERNMENTAL FUNDS TO THE STATEMENT OF ACTIVITIESFOR THE FISCAL YEAR ENDED JUNE 30, 2018(amounts expressed in thousands)
Net change in fund balances - total governmental funds $ 95,302
Amounts reported for governmental activities in the Statement of Activities are different due to:
Capital outlays are reported as expenditures in governmental funds. However, in the Statement ofActivities, these costs are allocated as depreciation expense over the useful life of the capital asset.Capital outlays exceeded depreciation expense in the current year by the following amount (Note 5): Capital outlay $ 425,183 Depreciation expense and amortization (221,414) 203,769
Miscellaneous transactions involving capital assets such as sales (gain/loss) and donations arereported in the Statement of Activities, but only proceeds from sales are reported in the governmentalfunds. (3,604)
Revenues reported in the Statement of Activities that do not provide current financial resources arenot reported as revenues in the governmental funds. 59,056
Internal service funds are used by management to charge the costs of certain activities, such asinsurance and central computer services, to individual governmental funds. Internal service funds arereported separately from governmental funds in the fund financial statements. In the government-wide statements, internal service funds are included with governmental activities. (5,511)
Some expenses reported in the Statement of Activities do not require the use of current financialresources and therefore are not reported as expenditures in the governmental funds. Someexpenditures reported in the governmental funds either increase or decrease items reported in theStatement of Net Position. (7,108)
Change in net position - governmental activities $ 341,904
The notes to the financial statements are an integral part of this statement.
B-30

STATEMENT OF FUND NET POSITIONPROPRIETARY FUNDSJUNE 30, 2018 (amounts expressed in thousands)
GOVERNMENTALBUSINESS-TYPE ACTIVITIES - ENTERPRISE FUNDS ACTIVITIES -
UNEMPLOYMENT INSURANCE
ECONOMICDEVELOPMENT
BONDS NONMAJOR TOTALINTERNALSERVICEFUNDS
ASSETSCurrent assets:
Cash/cash equivalents (Note 3) $ 311,612 $ 24,085 $ 106,667 $ 442,364 $ 93,339Receivables (net) 4,118 10,938 31,720 46,776 7,665Interfund loans receivable (Note 12) — — — — 35Due from other governments 22 — 94 116 —Due from other funds (Note 12) — 3,315 11 3,326 13Due from component units — 2,993 — 2,993 36Inventories — — 4,852 4,852 3,541Short-term investments (Note 3) — 4,263 — 4,263 —Securities lending collateral (Note 3) — — 206 206 270Other current assets — 5 80 85 1,209
Total current assets 315,752 45,599 143,630 504,981 106,108
Noncurrent assets:Advances to other funds (Note 12) — 5,556 — 5,556 —Advances to component units — 20,736 — 20,736 —Long-term investments (Note 3) — 684 21,619 22,303 46,020Long-term notes/loans receivable 662 38,692 11 39,365 —Other long-term assets — 1,854 1,178 3,032 —Capital assets (Note 5):
Land — — 800 800 236Land improvements — — 3,830 3,830 95Buildings/improvements — — 10,146 10,146 6,070Equipment — 4 9,542 9,546 249,614Infrastructure — — 1,175 1,175 —Construction work in progress — — 7,791 7,791 4,277Intangible assets — — 78 78 2,086Other capital assets — — 4,251 4,251 —Less accumulated depreciation — (3) (15,987) (15,990) (148,653)
Total capital assets — 1 21,626 21,627 113,725Total noncurrent assets 662 67,523 44,434 112,619 159,745
Total assets 316,414 113,122 188,064 617,600 265,853
DEFERRED OUTFLOWS OF RESOURCES — 90 3,921 4,011 13,984
B-31

STATEMENT OF FUND NET POSITIONPROPRIETARY FUNDSJUNE 30, 2018 (amounts expressed in thousands)
GOVERNMENTALBUSINESS-TYPE ACTIVITIES - ENTERPRISE FUNDS ACTIVITIES -
UNEMPLOYMENT INSURANCE
ECONOMICDEVELOPMENT
BONDS NONMAJOR TOTAL
INTERNALSERVICEFUNDS
LIABILITIESCurrent liabilities:
Accounts payable $ 2,204 $ 604 $ 20,909 $ 23,717 $ 14,713Lottery prizes payable — — 3,047 3,047 —Interfund loans payable (Note 12) — — — — 12Due to other governments — — 83 83 —Due to other funds (Note 12) — — 13,645 13,645 1,718Unearned revenue — — 2,197 2,197 1,474Lease/installment purchase payable (Note 10) — — 213 213 3,132Short-term debt (Note 11) — 105,110 — 105,110 —Bonds/notes payable - net (Note 11) — — — — 779Amounts held in custody for others — — 30 30 1Securities lending liability (Note 3) — — 206 206 270Estimated insurance claims (Note 8) — — 13,877 13,877 22,029Compensated absences payable (Note 11) — 33 1,000 1,033 4,094
Total current liabilities 2,204 105,747 55,207 163,158 48,222
Noncurrent liabilities:Lottery prizes payable — — 754 754 —Advances from other funds (Note 12) — — — — 4,206Lease/installment purchase payable (Note 10) — — 18 18 9,971Bonds/notes payable - net (Note 11) — — — — 699Estimated insurance claims (Note 8) — — 5,083 5,083 10,875Compensated absences payable (Note 11) — 29 980 1,009 3,410Arbitrage rebate tax payable (Note 11) — 17 — 17 —Net pension liability (Note 6) — 419 16,039 16,458 64,195Total OPEB liability (Note 7) — 19 923 942 2,961Other liabilities — 1,855 — 1,855 —
Total noncurrent liabilities — 2,339 23,797 26,136 96,317Total liabilities 2,204 108,086 79,004 189,294 144,539
DEFERRED INFLOWS OF RESOURCES — 17 814 831 1,669
NET POSITIONNet investment in capital assets — 1 21,394 21,395 94,723Restricted for:
Unemployment compensation 314,210 — — 314,210 —Other purposes — 1,368 82,010 83,378 —
Unrestricted — 3,740 8,763 12,503 38,906Total net position $ 314,210 $ 5,109 $ 112,167 $ 431,486 $ 133,629
The notes to the financial statements are an integral part of this statement.
B-32

STATEMENT OF REVENUES, EXPENSES, AND CHANGES IN FUND NET POSITIONPROPRIETARY FUNDSFOR THE FISCAL YEAR ENDED JUNE 30, 2018 (amounts expressed in thousands)
GOVERNMENTALBUSINESS-TYPE ACTIVITIES - ENTERPRISE FUNDS ACTIVITIES -
UNEMPLOYMENT INSURANCE
ECONOMICDEVELOPMENT
BONDS NONMAJOR TOTAL
INTERNALSERVICEFUNDS
Operating revenues:Charges for services $ 129 $ 37 $ 175,503 $ 175,669 $ 154,028Investment earnings 6,958 250 1,381 8,589 760Securities lending income — — 5 5 21Financing income — 2,304 — 2,304 —Contributions/premiums 114,549 — 114,081 228,630 184,497Grants/contracts/donations 7,009 — 48,079 55,088 3,657Other operating revenues — — 4,302 4,302 9,284
Total operating revenues 128,645 2,591 343,351 474,587 352,247
Operating expenses:Personal services — 381 16,670 17,051 61,657Contractual services — 168 21,104 21,272 36,048Supplies/materials — 10 88,405 88,415 27,379Benefits/claims 113,259 52 139,531 252,842 180,481Depreciation — 1 1,037 1,038 12,706Amortization — — 116 116 1,077Utilities/rent — 51 1,349 1,400 7,317Communications — 13 1,195 1,208 13,087Travel — 4 307 311 525Repairs/maintenance — — 1,024 1,024 20,230Grants — — — — 229Lottery prize payments — — 32,551 32,551 —Securities lending expense — — 2 2 14Arbitrage rebate tax — (1) — (1) —Interest expense — 1,906 24 1,930 496Other operating expenses 584 63 3,365 4,012 7,183
Total operating expenses 113,843 2,648 306,680 423,171 368,429Operating income (loss) 14,802 (57) 36,671 51,416 (16,182)
Nonoperating revenues (expenses):Tax revenues (Note 1) — — 28,846 28,846 —Non-employer pension revenue — 6 227 233 917Insurance proceeds — — — — 230Gain (loss) on sale of capital assets — — (228) (228) (234)Federal indirect cost recoveries — — — — 8,858Increase (decrease) value of livestock — — 4 4 —
Total nonoperating revenues (expenses) — 6 28,849 28,855 9,771Income (loss) before contributions andtransfers 14,802 (51) 65,520 80,271 (6,411)
Capital contributions — — 3,474 3,474 80Transfers in (Note 12) — — 762 762 1,723Transfers out (Note 12) — — (52,436) (52,436) (904)
Change in net position 14,802 (51) 17,320 32,071 (5,512)Total net position - July 1 - as previously reported 298,631 5,084 91,293 395,008 128,785Adjustments to beginning net position (Note 2) 777 76 3,554 4,407 10,356Total net position - July 1 - as adjusted 299,408 5,160 94,847 399,415 139,141Total net position - June 30 $ 314,210 $ 5,109 $ 112,167 $ 431,486 $ 133,629
The notes to the financial statements are an integral part of this statement.
B-33
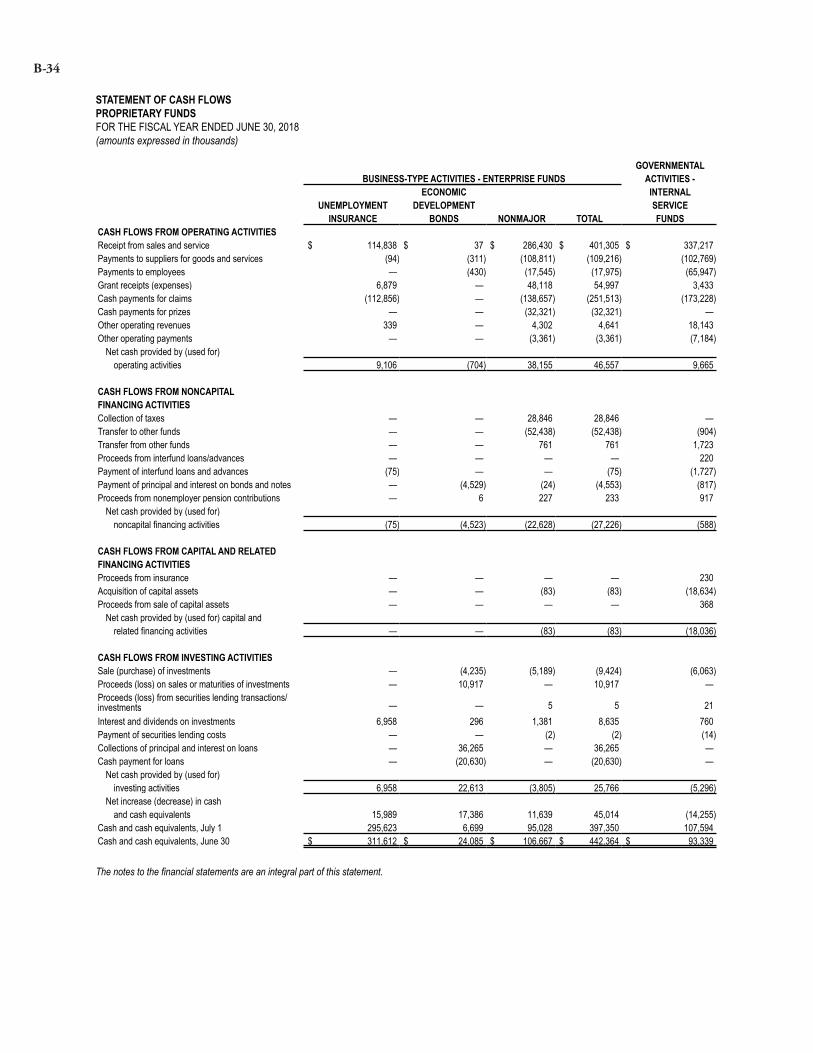
STATEMENT OF CASH FLOWSPROPRIETARY FUNDSFOR THE FISCAL YEAR ENDED JUNE 30, 2018 (amounts expressed in thousands)
GOVERNMENTAL BUSINESS-TYPE ACTIVITIES - ENTERPRISE FUNDS ACTIVITIES -
ECONOMIC INTERNAL UNEMPLOYMENT DEVELOPMENT SERVICE
INSURANCE BONDS NONMAJOR TOTAL FUNDSCASH FLOWS FROM OPERATING ACTIVITIESReceipt from sales and service $ 114,838 $ 37 $ 286,430 $ 401,305 $ 337,217Payments to suppliers for goods and services (94) (311) (108,811) (109,216) (102,769)Payments to employees — (430) (17,545) (17,975) (65,947)Grant receipts (expenses) 6,879 — 48,118 54,997 3,433Cash payments for claims (112,856) — (138,657) (251,513) (173,228)Cash payments for prizes — — (32,321) (32,321) —Other operating revenues 339 — 4,302 4,641 18,143Other operating payments — — (3,361) (3,361) (7,184)
Net cash provided by (used for)operating activities 9,106 (704) 38,155 46,557 9,665
CASH FLOWS FROM NONCAPITALFINANCING ACTIVITIESCollection of taxes — — 28,846 28,846 —Transfer to other funds — — (52,438) (52,438) (904)Transfer from other funds — — 761 761 1,723Proceeds from interfund loans/advances — — — — 220Payment of interfund loans and advances (75) — — (75) (1,727)Payment of principal and interest on bonds and notes — (4,529) (24) (4,553) (817)Proceeds from nonemployer pension contributions — 6 227 233 917
Net cash provided by (used for)noncapital financing activities (75) (4,523) (22,628) (27,226) (588)
CASH FLOWS FROM CAPITAL AND RELATEDFINANCING ACTIVITIESProceeds from insurance — — — — 230Acquisition of capital assets — — (83) (83) (18,634)Proceeds from sale of capital assets — — — — 368
Net cash provided by (used for) capital andrelated financing activities — — (83) (83) (18,036)
CASH FLOWS FROM INVESTING ACTIVITIESSale (purchase) of investments — (4,235) (5,189) (9,424) (6,063)Proceeds (loss) on sales or maturities of investments — 10,917 — 10,917 —Proceeds (loss) from securities lending transactions/investments — — 5 5 21Interest and dividends on investments 6,958 296 1,381 8,635 760Payment of securities lending costs — — (2) (2) (14)Collections of principal and interest on loans — 36,265 — 36,265 —Cash payment for loans — (20,630) — (20,630) —
Net cash provided by (used for)investing activities 6,958 22,613 (3,805) 25,766 (5,296)
Net increase (decrease) in cashand cash equivalents 15,989 17,386 11,639 45,014 (14,255)
Cash and cash equivalents, July 1 295,623 6,699 95,028 397,350 107,594Cash and cash equivalents, June 30 $ 311,612 $ 24,085 $ 106,667 $ 442,364 $ 93,339
The notes to the financial statements are an integral part of this statement.
B-34

STATEMENT OF CASH FLOWSPROPRIETARY FUNDSFOR THE FISCAL YEAR ENDED JUNE 30, 2018 (amounts expressed in thousands)
GOVERNMENTAL BUSINESS-TYPE ACTIVITIES - ENTERPRISE FUNDS ACTIVITIES
ECONOMIC INTERNALUNEMPLOYMENT DEVELOPMENT SERVICE
INSURANCE BONDS NONMAJOR TOTAL FUNDSReconciliation of operating income to net
cash provided by operating activities:
Operating income (loss) $ 14,802 $ (57) $ 36,671 $ 51,416 $ (16,182)
Adjustments to reconcile operating incometo net cash provided for (used for)operating activities:
Depreciation — 1 1,037 1,038 12,706Amortization — — 116 116 1,077Securities lending expense — — 2 2 14Investment earnings (6,958) (250) (1,381) (8,589) (760)Securities lending income — — (5) (5) (21)Financing income — (2,304) — (2,304) —Interest expense — 1,906 24 1,930 496Other revenue 775 4 — 779 8,854Arbitrage rebate tax — (1) — (1) —Change in assets, deferred outflows, liabilities anddeferred inflows:
Decr (Incr) in accounts receivable 565 51 (4,335) (3,719) (1,891)Decr (Incr) in due from other funds — — (11) (11) 19Decr (Incr) in due from component units — — — — (36)Decr (Incr) in due from other governments 16 — 39 55 1Decr (Incr) in inventories — — 636 636 (584)Decr (Incr) in other assets — (5) 187 182 600Incr (Decr) in accounts payable (94) (2) 4,872 4,776 (4,458)Incr (Decr) in due to other funds — — 101 101 (116)Incr (Decr) in due to other governments — — 9 9 —Incr (Decr) in lottery prizes payable — — 230 230 —Incr (Decr) in unearned revenue — — 197 197 (150)Incr (Decr) in compensated absences payable — — (5) (5) 41Incr (Decr) in total OPEB liability — (68) (152) (220) 32Incr (Decr) in estimated claims — — (1,280) (1,280) (846)Incr (Decr) in other payables — (4) (181) (185) 7,191Incr (Decr) in net pension liability and relatedaccounts — 25 1,384 1,409 3,678
Net cash provided by (used for)operating activities $ 9,106 $ (704) $ 38,155 $ 46,557 $ 9,665
Schedule of noncash transactions:Capital asset acquisitions from contributed capital $ — $ — $ 3,474 $ 3,474 $ 80Incr (Decr) in fair value of investments — 14 294 308 862Total noncash transactions $ — $ 14 $ 3,768 $ 3,782 $ 942
The notes to the financial statements are an integral part of this statement.
B-35

STATEMENT OF FIDUCIARY NET POSITIONFIDUCIARY FUNDSJUNE 30, 2018 (amounts expressed in thousands)
PENSION(AND OTHEREMPLOYEE PRIVATEBENEFIT) PURPOSE INVESTMENT AGENCY
TRUST FUNDS TRUST FUNDS TRUST FUNDS ASSETS
Cash/cash equivalents (Note 3) $ 297,410 $ 85,549 $ 1,221,292 $ 11,097 Receivables (net):
Accounts receivable 28,248 — — 607 Interest 437 33 2,180 — Due from primary government 32,014 — — — Due from other PERB plans 673 — — — Long-term loans/notes receivable 16 — — —
Total receivables 61,388 33 2,180 607 Investments at fair value:
Equity in pooled investments (Note 3) 11,308,857 — 12,028 — Other investments (Note 3) 738,309 164,815 — —
Total investments 12,047,166 164,815 12,028 — Securities lending collateral (Note 3) 73,608 — 167 — Capital Assets:
Land 35 — — — Buildings/improvements 186 — — — Equipment 96 — — — Construction work in progress 787 — — — Accumulated depreciation (242) — — — Intangible assets 6,477 — — —
Total capital assets 7,339 — — — Other assets — 37,607 — 302
Total assets 12,486,911 288,004 1,235,667 12,006
DEFERRED OUTFLOWS OF RESOURCES 569 — — —
LIABILITIES Accounts payable 38,708 1 2,145 673 Due to other PERB plans 673 — — — Unearned revenue 440 — — — Amounts held in custody for others — — — 11,333 Securities lending liability (Note 3) 73,608 — 167 — Compensated absences payable 600 — — — Net pension liability (Note 6) 1,777 — — — Total OPEB liability (Note 7) 224 — — —
Total liabilities 116,030 1 2,312 12,006
DEFERRED INFLOWS OF RESOURCES 89 — — —
NET POSITION Held in trust for pension benefits
and other purposes $ 12,371,361 $ 288,003 $ 1,233,355 $ —
The notes to the financial statements are an integral part of this statement.
B-36

STATEMENT OF CHANGES IN FIDUCIARY NET POSITIONFIDUCIARY FUNDSJUNE 30, 2018 (amounts expressed in thousands)
PENSION(AND OTHEREMPLOYEE PRIVATEBENEFIT) PURPOSE INVESTMENT
TRUST FUNDS TRUST FUNDS TRUSTADDITIONSContributions/premiums:
Employer $ 253,455 $ — $ —Employee 240,153 — —Other contributions 114,862 16,743 1,516,370
Net investment earnings:Investment earnings 1,078,508 9,620 17,429Administrative investment expense (71,584) — —
Securities lending income 2,220 — 3Securities lending expense (886) — (1)Charges for services 601 — —Other additions 886 4,993 —
Total additions 1,618,215 31,356 1,533,801
DEDUCTIONSBenefits 881,509 — —Refunds 24,731 — —Distributions — 33,030 1,346,652Administrative expenses:
Personal services 4,924 — —Contractual services 5,287 822 —Supplies/materials 145 — —Depreciation 10 — —Amortization 1,238 — —Utilities/rent 375 — —Communications 238 — —Travel 55 — —Repair/maintenance 26 — —Other operating expenses 391 — —
Local assistance 11 — —Transfers to MUS-RP 198 — —Transfers to PERS-DCRP 2,069 — —
Total deductions 921,207 33,852 1,346,652Change in net position 697,008 (2,496) 187,149
Net position - July 1 - as previously reported 11,673,439 290,499 1,046,206Adjustments to beginning net position (Note 2) 914 — —Net position - July 1 - as adjusted 11,674,353 290,499 1,046,206Net position - June 30 $ 12,371,361 $ 288,003 $ 1,233,355
The notes to the financial statements are an integral part of this statement.
B-37

NOTES TO THE FINANCIAL STATEMENTS
NOTE 1. SUMMARY OF SIGNIFICANT ACCOUNTING POLICIES
The accompanying financial statements for the State of Montana (State) have been prepared in accordance withGenerally Accepted Accounting Principles (GAAP), as prescribed by the Governmental Accounting Standards Board(GASB).
A. Reporting Entity
For financial reporting purposes, the State includes funds that comprise the primary government and its componentunits. The component units are entities that the State is financially accountable for, or whose relationship with the Stateis such that exclusion would cause the State's financial statements to be misleading or incomplete. GASB has set forthcriteria to be considered in determining financial accountability. This criteria includes appointing a voting majority ofan organization's governing body, and (1) the ability of the State to impose its will on that organization or (2) thepotential for the organization to provide specific financial benefits to, or impose specific financial burdens on, the State.
Discretely Presented Component UnitsThese component units are entities that are legally separate from the State because they possess corporate powers, butare financially accountable to the State, or whose relationships with the State are such that exclusion would cause theState's financial statements to be misleading or incomplete. Complete financial statements of the individual componentunits, which issue separate financial statements, can be obtained from their respective administrative offices. Thecondensed financial statements, presented in Note 18, include the financial data of the entities listed below.
Complete financial statements for each of the individual discretely presented component units may be obtained at thefollowing addresses:
Montana Board of Housing301 South Park, Room 240PO Box 200528Helena, MT 59620-0528
Montana State Fund855 Front StreetPO Box 4759Helena, MT 59604-4759
Facility Finance Authority2401 Colonial Drive, 3rd FloorPO Box 200506Helena, MT 59620-0506
Universities and CollegesCommissioner of Higher Education560 North Park Ave, 4th FloorPO Box 203201Helena, MT 59620-3201
Montana Board of Housing (MBOH) – MBOH, which is a legally separate entity, is governed by a quasi-judicial boardappointed by the Governor. The State of Montana has the ability to modify or approve: the budget; the rate or feechanges affecting revenues; and the ability to appoint, hire, reassign, or dismiss those responsible for the day-to-dayoperations of MBOH. It was created in 1975 to facilitate the availability of decent, safe, and sanitary housing to personsand families of lower income. MBOH issues negotiable notes and bonds to fulfill its purposes. The total amount ofnotes and bonds outstanding at any time may not exceed $1.5 billion. The discount price of bonds sold, not the faceamount of the bonds, counts against this statutory ceiling. Neither the faith and credit nor taxing power of the State ofMontana may be pledged for the amounts so issued. MBOH is attached to the State of Montana, Department of Commercefor administrative purposes only. MBOH is audited annually by the State’s Legislative Audit Division.
Facility Finance Authority (FFA) – FFA, which is a legally separate entity, is governed by a quasi-judicial boardappointed by the Governor with the advice and consent of the Senate. The State of Montana has the ability to modifyor approve: the budget; the rate or fee changes affecting revenues; and the ability to appoint, hire, reassign, or dismissthose responsible for the day-to-day operations of FFA. FFA assists eligible, nonprofit Montana health care and othercommunity-based service providers to obtain and maintain access to the broadest range of low-cost capital financingas possible. FFA issues revenue bonds to fulfill its purposes. Neither the faith and credit or taxing power of the Stateof Montana may be pledged for the amounts so issued. FFA is attached to the State of Montana, Department of Commerce
B-38

for administrative purposes only. Individual financial reports are issued every two years and are audited by the State’sLegislative Audit Division.
Montana State Fund (MSF) – MSF is a nonprofit, independent public corporation established under Section 39-71 ofthe Montana Code Annotated (MCA). MSF provides Montana employers with an option for workers’ compensationand occupational disease insurance and guarantees available coverage for all employers in Montana. MSF is governedby a seven member Board of Directors appointed by the Governor. This Board has full power, authority, and jurisdictionin the administration of MSF. A financial benefit/burden relationship exists between MSF and the primary government.MSF is attached to the State of Montana, Department of Administration for administrative purposes only. MSF isreported on a calendar year basis and is audited annually by the State’s Legislative Audit Division.
MSF functions as an autonomous insurance entity supported solely from its own revenues. All assets, debts, andobligations of MSF are separate and distinct from assets, debts, and obligations of the State of Montana. If MSF isdissolved by an act of law, the assets held by MSF are subject to the disposition provided by the Legislature enactingthe dissolution with due regard given to obligations incurred and existing (Section 39-71-2322, MCA).
MSF handles the administration of the claims of Montana State Fund and State of Montana (Old Fund) including:determining who a claimant is; what, if any, claims will be paid; and the amount of claims allowed to be paid. Old Fundcovers workers’ compensation claims that were incurred before July 1, 1990, and is reported within the governmentalactivities of the primary government, on the government-wide financial statements.
Universities and Colleges – The Montana Constitution, Article X, Section 9, grants governance authority over theMontana University System (MUS) to the Board of Regents (Board), with seven members appointed by the Governorand confirmed by the Senate. All state funds appropriated by the Legislature to the Board for the support of the MUSare channeled through the Office of the Commissioner of Higher Education (OCHE). The Constitution charges theBoard with hiring a Commissioner of Higher Education who serves as its executive staff. OCHE is the state-leveladministrative organization of the MUS.
The Board has responsibility for the following institutions: Montana State University - Bozeman and the units underit including Montana State University - Billings, Montana State University - Northern, and Great Falls College MontanaState University; and University of Montana - Missoula and the units under it including Montana TechnologicalUniversity, University of Montana - Western and Helena College University of Montana. All units are funded throughstate appropriations, tuition, federal grants, and private donations and grants. The universities are audited annually bythe State’s Legislative Audit Division.
Though the following organizations perform functions related to the MUS, they are not considered part of Montana'sreporting entity: (1) Community Colleges which are considered part of local units of government; (2) the MontanaHigher Education Student Assistance Corporation, a private nonprofit corporation; and (3) the Student AssistanceFoundation of Montana, a private nonprofit corporation. Entities such as local school districts and local authorities ofvarious kinds are considered part of local units of government and have not been included. The state and federal supportof local public education systems is reported in the General Fund, the State Special Revenue Fund and Federal SpecialRevenue Fund.
Fiduciary Fund Component UnitsComplete financial statements for each of the individual fiduciary fund component units may be obtained at the followingaddresses:
Teachers’ Retirement System1500 East Sixth AvenuePO Box 200139Helena, MT 59620-0139
Public Employees’ Retirement Board100 North Park, Suite 200PO Box 200131Helena, MT 59620-0131
Teachers’ Retirement System (Pension Trust Fund) – This retirement plan is a legally separate entity with a boardappointed by the Governor. Its purpose is to provide retirement, disability, death and lump-sum payments to benefitrecipients of Montana's public teaching profession. The plan is funded from employer and employee contributions,investment earnings, and the State’s General Fund. The benefit payments and administrative costs of the Teachers’
B-39

Retirement System are paid from the same funding sources. The system is audited annually by the State’s LegislativeAudit Division. Further detail related to the Teachers’ Retirement System is provided in Note 6.
Public Employees’ Retirement Board (Pension and Other Employee Benefit Trust Funds) – The Public Employees’Retirement Board (PERB) is appointed by the Governor and administers eleven separate plans for the purpose ofproviding retirement, disability, death, and lump-sum payments to plan members. These legally separate plans includethe Public Employees’ Retirement Plan – Defined Benefit and Defined Contribution and the associated education funds;the Judges’; the Highway Patrol Officers’; the Sheriffs’; the Game Wardens’ and Peace Officers’; the Municipal PoliceOfficers’; the Firefighters’ Unified Retirement Systems; the Volunteer Firefighters’ Compensation Act; and the Stateof Montana Deferred Compensation Program (457 Plan) retirement plans. The board also administers an Other PostEmployment Benefit (OPEB) disability plan on behalf of Public Employees’ Retirement Plan-Defined Contributionmembers.
PERB is responsible for the eleven separate public employee plans, including the Deferred Compensation Programand Other Post Employment Benefit plan. These are reported as pension and other employee benefit trust funds. Theboard is audited annually by the State’s Legislative Audit Division. Further detail related to the PERB is provided inNote 6 and its OPEB plan information is provided in Note 7.
B. Government-wide and Fund Financial Statements
The government-wide financial statements, Statement of Net Position and Statement of Activities, report informationon all of the non-fiduciary activities of the State of Montana and its component units. For the most part, the impact ofinterfund activity has been removed from these statements. Governmental activities, which are normally supported byfees, taxes, and intergovernmental revenues, are reported separately from business-type activities, which rely to asignificant extent on fees and charges for support. Likewise, the State of Montana is reported separately from certainlegally separate component units for which the State is financially accountable.
The Statement of Activities demonstrates the degree to which the direct expenses of a function are offset by programrevenues. Direct expenses are those that are clearly identifiable with a specific function. Certain indirect costs areincluded in the program expense reported for the individual functions and activities. Program revenues include (1)charges to customers or applicants who purchase, use, or directly benefit from goods, services, or privileges providedby a given function; and (2) grants and contributions restricted to meeting the operational or capital requirements of aparticular function. Taxes and other revenues not meeting the definition of program revenues are reported as generalrevenues. The State does not allocate indirect expenses to functions in the Statement of Activities.
Separate fund financial statements are provided for governmental, proprietary, and fiduciary funds. Major individualgovernmental and major individual enterprise funds are reported as separate columns in the fund financial statements.Fiduciary fund statements are reported only in the fund financial statements.
C. Measurement Focus, Basis of Accounting, and Financial Statement Presentation
Government-wide, Proprietary, and Fiduciary Fund Financial StatementsThe government-wide, proprietary fund, and fiduciary fund financial statements are reported using the economicresources measurement focus and the accrual basis of accounting. Revenues are reported when earned; expenses arerecorded when a liability is incurred regardless of the timing of the related cash flows. Property taxes are recognizedas revenues in the year for which they are levied. Grants and similar items are recognized as revenues as soon as all ofthe eligibility requirements imposed by the provider are met. Agency funds report only assets and liabilities, recognizingreceivables and payables using the accrual basis of accounting.
As a general rule, material interfund revenues and expenses have been eliminated from the government-wide financialstatements. These have not been eliminated where their elimination would distort the direct costs and program revenuesof the functions involved.
Governmental Fund Financial StatementsGovernmental fund financial statements are reported using the current financial resources measurement focus and themodified accrual basis of accounting. Revenues are recognized when they are realizable, measurable, earned, andavailable. Revenue is considered realizable when it is probable the amount will be collected. Revenue is consideredmeasurable and realizable if the precise amount is known because the transaction is completed, or if there is enoughinformation to provide a reasonable estimate of the net realizable revenue to be received. Revenue is considered to
B-40

have been earned when the exchange of goods or services has taken place. Revenue is considered to be available if itis collectible within the current period, or soon enough thereafter, to pay liabilities of the current period. For this purpose,the State considers revenue available if it is expected to be collected within 60 days of the end of the current fiscalperiod. Expenditures generally are recorded when a liability is incurred, as under accrual accounting. However, debtservice expenditures as well as expenditures relating to compensated absences, claims, and judgments are recordedonly when payment is due.
The major revenue sources considered susceptible to accrual are licenses and permits, natural resource taxes, individualincome taxes, corporate income taxes, property taxes, fuel taxes, and certain federal revenues (reimbursable grants andU.S. mineral royalties). All other revenue is considered to be measurable and available when the cash is received.
Fund Financial StatementsThe State uses funds to report on its financial position and the results of its operations. A fund is a separate accountingentity with a self-balancing set of accounts. Fund accounting is designed to demonstrate legal compliance and to aidfinancial management by segregating transactions related to certain government functions or activities.
The financial activities of the State of Montana are classified into fund categories as described below:
Governmental FundsGeneral Fund – To account for all governmental financial resources, except those required to be accounted for in anotherfund.
Special Revenue Funds – To account for the proceeds of specific revenue sources restricted to expenditure for specifiedpurposes other than major capital projects. (1) The State Special Revenue Fund accounts for activities funded fromstate resources used to account for and report the proceeds of specific revenue sources that are restricted or committedto expenditure for specified purposes other than debt service or capital projects. Several funds are defined in statute asPermanent Funds, however per GASB Statement No. 54, Fund Balance Reporting and Governmental Fund TypeDefinitions (GASB 54), these funds should be reported within the State Special Revenue Fund. The respective effecton fund balance is approximately an $86.2 million increase. One specific fund is defined in statute as a Federal SpecialRevenue Fund, however per GASB 54, this fund should be reported within the State Special Revenue Fund. Therespective effect on fund balance is approximately a $23.5 million increase. (2) The Federal Special Revenue Fundaccounts for activities funded from federal sources used in the operation of state government.
Debt Service Funds – To account for resources accumulated for payment of principal and interest on general long-termobligation debt.
Capital Projects Funds – To account for resources used for the acquisition or construction of major capital facilities,other than those financed by proprietary or trust funds.
Permanent Funds – To account for resources that are permanently restricted to the extent that only earnings, not principal,may be used for the purposes of supporting the government’s programs. Several funds are defined in statute as PermanentFunds, however per GASB 54 these funds should be reported within the State Special Revenue Fund.
Proprietary FundsEnterprise Funds – To account for operations: (1) financed and operated similar to private business enterprises, wherethe intent of the Legislature is to finance or recover costs primarily through user charges; (2) where the Legislature hasdecided periodic determination of revenue earned, expenses incurred, or net income is appropriate; (3) where the activityis financed solely by a pledge of the net revenues from fees and charges of the activity; or (4) when laws or regulationsrequire that the activities’ costs of providing services, including capital costs, be recovered with fees and charges ratherthan with taxes or similar revenues. The primary focus of fee revenues charged by enterprise funds is users outside ofthe primary government. One specific fund is defined in statute as an Enterprise Fund, however, per GASB 34, thisfund should be reported within Internal Service Funds. The respective effect on net position is approximately a $4.4million increase.
Internal Service Funds – To account for the financing of goods and services provided by one department or agency toother departments, agencies, or other governmental entities on a cost-reimbursement basis.
B-41

The State of Montana reports two employee group benefits funds. The MUS Group Insurance Fund primarily chargesits fees to Montana State University and the University of Montana. The universities are reported as discretely presentedcomponent units, which the State considers to be external users, and as such, reports the MUS Group Insurance Fundas an enterprise fund. The Employee Group Benefits Fund charges its fees to funds of the primary government, and assuch, is reported as an internal service fund.
Fiduciary FundsFiduciary Funds are used to account for assets held by the State in a trustee capacity or as an agent for individuals,private organizations, or other governments. These assets cannot be used to support the government’s own programs.
Pension (and Other Employee Benefit) Trust Funds – To account for resources that are required to be held in trust forthe members and beneficiaries of the State’s defined benefit plans, defined contribution plans, other retirement plansand other post employment benefit plan. Plan members receive retirement, disability, death, and lump-sum paymentsfrom the fund. Further detail related to the individual plans is provided in Note 6 and Note 7.
Private-Purpose Trust Funds –To account for assets held by the State in a trustee capacity, where both the principal andearnings benefit individuals, private organizations, or other governments. Examples include the State’s escheatedproperty fund, unliquidated security bonds held on deposit from self-insured employers, environmental reclamation,and bonds held in trust.
Investment Trust Fund – To account for the receipt of monies and the distribution of related investment earnings tolocal government agencies by the Montana Board of Investments for investment in the Short-term Investment Pool(STIP) and Trust Fund Investment Pool (TFIP).
Agency Funds – To account for assets held by the State as an agent for individuals, private organizations, and othergovernments. For example, various agencies hold deposits pending compliance with performance agreements. Otherexamples include monies belonging to state institution residents and child support payments from parents.
Major Governmental FundsThe General Fund is the State’s primary operating fund, as previously defined.
The State Special Revenue Fund accounts for activities funded from state sources, which are restricted either legallyor administratively for particular costs of an agency, program, or function.
The Federal Special Revenue Fund accounts for activities funded from federal sources used in the operation of stategovernment.
The Coal Severance Tax Fund, created by Article IX, Section 5 of the Montana State Constitution, receives 50% of allcoal tax collections. The principal in this fund can be expended only upon affirmative vote of three-fourths of eachhouse of the Legislature.
The Land Grant Permanent Fund accounts for lands granted to the State for support of public schools and stateinstitutions.
Major Enterprise FundsThe Unemployment Insurance Fund accounts for employer contributions deposited with the Secretary of the Treasuryof the United States to the credit of the State’s unemployment trust fund. Unemployment benefits are paid from thisfund to eligible recipients.
The Economic Development Bonds Fund (EDB) accounts for the Economic Development Bond Act (EDBA)programs and the Municipal Finance Consolidation Act (MFCA) programs. The EDBA programs provide qualifyingMontana businesses access to tax-exempt funds through the issuance of conduit (no-commitment) debt. The MFCAprograms provide low cost funds to eligible Montana governments to finance capital expenditures. Separately issuedfinancial statements may be obtained by contacting the Montana Board of Investments, 2401 Colonial Drive, 3rdFloor, PO Box 200126, Helena, MT 59620-0126.
B-42

D. Proprietary Activity Accounting and Financial Reporting
Proprietary funds distinguish operating revenues and expenses from non-operating items. Operating revenues generallyresult from providing services and delivering goods in connection with a proprietary fund’s principal ongoing operations.Operating expenses for enterprise and internal service funds include the cost of sales and services, administrativeexpenses, and depreciation on capital assets. All revenues and expenses not meeting these definitions are reported asnon-operating.
E. Cash/Cash Equivalents
For all funds, cash and cash equivalents consist of amounts deposited in the State Treasurer’s pooled cash account,cash deposits in checking accounts, cash invested in the Short-term Investment Pool (STIP), cash held by trustees,undeposited cash held by individual state agencies, and investments categorized as cash equivalents, which are short-term, highly liquid investments with original maturities of three months or less. Further detail related to cash and cashequivalents is provided in Note 3.
F. Receivables
This classification, net of estimated uncollectibles, consists primarily of receivables for goods sold and services provided,short-term loans and notes, interest and dividends, taxes due within 60 days of fiscal year-end, and income, withholding,and inheritance taxes that are past due. An allowance for uncollectible taxes is provided based upon historical analysis.Further detail related to receivables is provided in Note 4.
G. Inventories
Inventories of materials and supplies are reported at cost. The State allows agencies to use any generally acceptedinventory pricing method, but specifies the first-in, first-out method generally to be appropriate for most agencies.Governmental funds use the "purchase method," meaning inventory purchases are recorded as expenditures. At fiscalyear-end, inventory balances are shown as nonspendable, indicating they do not constitute available expendableresources. Proprietary and fiduciary funds report using the "consumption method," meaning inventories are expensedas used.
H. Equity in Pooled Investments
To account for equity in pooled investments, the Montana Board of Investments (BOI) uses one internal investmentpool and one external investment pool. The internal investment pool is the Consolidated Asset Pension Pool (CAPP).The external investment pool is the Trust Fund Investment Pool (TFIP). Current State agency participation in the poolsis within the enterprise funds, permanent funds, private-purpose trust funds, investment trust funds, pension trust funds,Montana University System Units, and specific funds established within the State Special Revenue Fund. The State’snine retirement funds can only participate in CAPP. Other State agencies and qualifying local governments canparticipate in TFIP. The participant investments in the pools are reported at fair value in the assets within the individualfunds. Further detail related to cash and cash equivalents and investments is provided in Note 3.
I. Investments
For agencies whose investment needs are not met by BOI’s established investment pools, BOI provides separateinvestments, which are combined and reported as Separately Managed Investments (SMI). SMI participants have directfixed income, equity and Montana mortgage and loan investments. SMI investments are reported at fair value. Certainsecurities including asset-backed securities, variable-rate instruments, zero-coupon bonds, preferred stocks, andmortgage-backed securities are purchased for portfolio diversification and a competitive rate of return. Other Stateagencies, on a limited basis by statute, may administer other long-term investments. Most investments are reported atfair value on the Statement of Net Position. Further detail related to investments is provided in Note 3.
B-43

J. Capital Assets
Capital asset valuation is based on actual historical cost or, in the case of donations, acquisition value. Generalgovernment infrastructure capital assets are capitalized and reported on the government-wide financial statements.Infrastructure assets of proprietary funds are capitalized on the fund financial statements. Interest incurred during theconstruction of capital assets for proprietary funds is capitalized. Interest incurred during the construction of capitalassets for higher education component units is expensed. The State has chosen to use the depreciation approach forinfrastructure assets and is reporting accumulated depreciation on the Statement of Net Position and depreciationexpense on the Statement of Activities for these assets. Further detail related to capital assets is provided in Note 5.
Capital assets in proprietary, private-purpose trust, and pension trust funds are accounted for within their respectivefunds and are depreciated or amortized. Depreciation is on a straight-line basis with estimated useful lives of 25 to 60years for buildings, 10 to 50 years for infrastructure, 7 to 20 years for building improvements and 3 to 10 years forequipment. State agencies are also required to extend or shorten the useful lives of capital assets to reflect their actualexperience or industry standards when appropriate. Amortization is on a straight-line basis with estimated useful livesof 4 years for software (internally and externally generated), 30 years for land use rights, and 20 years for otherintangibles.
The capitalization limit for buildings and building/land improvements is $25,000. The capitalization threshold forinfrastructure and internally-generated software is $500,000. The capitalization threshold for intangible assets is$100,000. The capitalization limit for other capital assets is $5,000. Agencies are allowed to capitalize additions tocollections and land acquisitions at any cost. Purchases under these thresholds are recorded as expenditures/expensesin the current period.
K. Deferred Outflows, Deferred Inflows, and Unearned Revenue
A deferred outflow of resources is a consumption of net assets by the government that is applicable to a future reportingperiod. A deferred inflow of resources is an acquisition of net assets by the government that is applicable to a futurereporting period. Deferred outflows and inflows of resources may include financial transactions related to refundingdebt, non-exchange transactions, derivative investment, OPEB, and pension related components and are reported onthe government-wide, proprietary fund, and fiduciary fund financial statements. Additionally, deferred inflows ofresources may include financial transactions related to unavailable revenue on the governmental fund financialstatements. Unavailable revenue is reported when assets are recognized, but those assets are not considered availableto pay liabilities of the current period. Unearned revenue is recognized as a liability on government-wide, governmentaland proprietary fund financial statements. Further detail related to deferred outflows of resources and deferred inflowsof resources is provided in Note 4.
L. Long-term Obligations
Long-term obligations expected to be financed from governmental funds are reported on the government-wide financialstatements. Long-term debt is recognized as a liability of a governmental fund when due, or when resources have beenaccumulated in the debt service fund for payment early in the following year. For other long-term obligations, onlythat portion expected to be financed from current expendable available financial resources is reported as a fund liabilityof a governmental fund on the fund financial statements. The remaining portion of such obligations is reported on thegovernment-wide financial statements. Long-term liabilities expected to be financed from proprietary and fiduciaryfund operations are accounted for in those funds. Further detail related to leases/installment purchases payable andstate debt is provided in Note 10 and Note 11, respectively.
M. Capital Leases
A capital lease is a lease which transfers benefits and risks of ownership to the lessee. At the inception of a capital lease,on the government-wide, proprietary fund, and fiduciary fund financial statements, a capital asset and a capital leaseliability are recorded at the present value of the future minimum lease payments. On the governmental fund financialstatements no asset or liability is recorded related to assets under capital leases. Rather, on the governmental fundfinancial statements, at the inception of a capital lease, capital outlay expenditures and other financing sources (inceptionof lease/installment contract) are recorded at the net present value of the minimum lease payments. Further detail relatedto capital leases is provided in Note 10.
B-44

N. Bond Discounts/Premiums/Issuance Costs
Bond premiums and discounts, as well as issuance costs, are recognized in the period they are incurred. Bond proceedsand bond premiums are reported as an other financing source, and bond discounts are reported as an other financinguse. Issuance costs are reported as debt service expenditures whether or not they are withheld from the bond proceeds.Bonds payable are recorded net of any applicable premium or discount. Further detail related to long-term debt isprovided in Note 11.
O. Compensated Absences
Full-time state employees earn vacation leave ranging from 15 to 24 days per year depending on the individual's yearsof service. Teachers employed by the State do not receive vacation leave. Vacation leave may be accumulated andcarried over from one year to the next. The carryover is limited to two times the maximum number of days earnedannually. Sick leave is earned at the rate of 12 days per year with no limit on accumulation. Each contribution year, anemployee may contribute a maximum of 80 hours of sick or annual leave to a nonrefundable sick leave pool. Excessannual leave that is being forfeited can also be contributed, with no maximum contribution. The adjusted ending balanceof the pool for June 30, 2017, was 20,984 hours. For fiscal year 2018, 795 sick leave hours, 176 annual leave hours,and 1,859 excess annual leave hours were contributed to the sick leave pool, and 4,504 hours were withdrawn, leavinga balance of 19,310 hours in the pool. The liability associated with the pool is not reported in the accompanying financialstatements because these hours are nonrefundable to contributors, except by grants approved through an applicationprocess.
Vested or accumulated leave for proprietary and fiduciary funds is recorded as an expense and liability of those fundsin the fund financial statements. For governmental funds, the liability is not expected to be liquidated with expendablefinancial resources. The expenditure and liability for the governmental funds is reported only on the government-widefinancial statements. Upon retirement or termination, an employee is paid for 100% of unused vacation leave and 25%of unused sick leave. Further detail related to compensated absences is provided in Note 11.
P. Nonexchange Financial Guarantee
BOI provides loan guarantees from the Coal Severance Tax Fund to the Facility Finance Authority (FFA). BOI exposureto bond issues, surety bonds, and designated loans of the FFA totaled $81.5 million as of June 30, 2018. FFA is adiscretely presented component unit of the State of Montana. FFA guarantee requests are submitted to BOI for reviewand approval. BOI’s participation, either duration or any other consideration, to either purchase bonds or loans or tolend money for deposit into FFA’s statutorily allowed capital reserve account is explicitly limited by statute whichrequires BOI to act prudently. The guarantee requests from FFA pertain to bonds issued by FFA with a term of up to40 years. BOI and FFA have entered into an agreement detailing repayment to BOI. BOI has not had to perform onany loan guarantee in the past.
Q. Fund Balance/Net Position
Fund BalanceThe classifications for fund balance used for governmental funds are reported in two general classifications,nonspendable and spendable. Nonspendable represents the portion of fund balance that is legally or contractuallyrequired to remain intact or is not in spendable form such as inventories, and, in the General Fund, long-term notes andloans receivable. Spendable fund balance is further categorized as restricted, committed, assigned, and unassigned.
The restricted fund balance category includes amounts that can be spent only for the specific purposes stipulated bythe State Constitution or external parties, such as the federal government, or through enabling legislation. For thepurpose of determining restricted amounts, enabling legislation does not include commitments resulting from Statelegislation if these constraints can be removed or changed by a similar legislative action.
The committed fund balance classification includes amounts that can be used only for the specific purposes determinedby a formal action of the government’s highest level of decision-making authority, the State’s Legislature, throughlegislation passed into law.
B-45

Amounts, in the assigned fund balance classification, are intended to be used by the government for specific purposes,but they do not meet the criteria to be classified as restricted or committed. Assignments of fund balance are createdby the executive branch. In governmental funds other than the General Fund, assigned fund balance also represents theremaining amount that is not restricted or committed. The assigned fund balance for the General Fund are encumbrancesand assignments for the portion of current General Fund balance that is projected to be used to fund expenditures andother cash outflows in excess of the expected revenues and other cash inflows in fiscal years as needed. There is not aprojected spend down for fiscal year 2019, thus a related assignment of fund balance is not reported at 2018 fiscal year-end.
Unassigned fund balance is the residual classification for the General Fund and includes all spendable amounts notcontained in the other classifications. In other funds, the unassigned classification should be used only to report adeficit balance resulting from overspending for specific purposes for which amounts had been restricted, committed,or assigned.
The State generally segregates restricted, committed, and assigned resources by account (sub-fund) within thegovernmental funds, other than the General Fund. When resources meeting more than one of these spendableclassifications are commingled in an account on the State’s accounting system the assumed order of spending is restrictedfirst, committed second, and finally assigned. State statute requires non-General Fund money be spent first wheneverpossible so any related available unassigned balance would be spent last.
General Fund - Fund BalanceAs of June 30, 2018, the State did not maintain a stabilization fund. However, based on fiscal year 2018 unauditedGeneral Fund revenue totals, $45.7 million was transferred into the Budget Stabilization Reserve Fund during fiscalyear 2019, in accordance with 2017 Special Session Senate Bill 9. Additionally, statute provides a minimum fundbalance amount as follows: Section 17-7-140, MCA, defines minimum ending fund balance and specifies the proceduresthat must be followed to make expenditure reductions if a projected ending fund balance drops below minimum statutoryrequirements.
If the Budget Director determines that a deficit exists, statute requires reductions that must be made to assure that theprojected ending fund balance is in compliance with the minimum ending fund balance of General Fund appropriationsfor the biennium. Under circumstances when a deficit of this level is projected during a biennium, the Governor maydirect reductions from any General Fund expenditure not exempted by Section 17-7-140, MCA, including House Bill(HB) 2 (the State’s main appropriation bill), any other appropriation bills, statutory appropriations, or languageappropriations. Reductions may not exceed 10% of General Fund appropriations for any single “program,” as definedin HB 2. If a program has more than one appropriation, the reduction for one or more of the appropriations may exceed10% as long as the reduction for the program as a whole does not exceed 10%.
The Legislative and Judicial branches, the Montana School for the Deaf and Blind, principal and interest on state debt,salaries of elected officials, and public school BASE funding are exempt, statutorily, from reductions. These exemptionsshield approximately one-third of General Fund appropriations from reduction. Of the remaining expenditures, theGovernor may not direct executive agencies headed by elected officials or the Board of Regents to reduce theirexpenditures by more than the average reduction percentage imposed upon all other executive branch agencies.
Net PositionIn funds other than governmental, net position represents the difference between assets plus deferred outflows ofresources and liabilities plus deferred inflows of resources. The net investment in the capital assets portion of netposition consists of capital assets, net of accumulated depreciation, reduced by the outstanding balances of any borrowingused for the acquisition, construction, or improvement of those assets. Net position is reported as restricted when thereare limitations imposed on their use either through constitutional provisions, enabling legislation or through externalrestrictions imposed by creditors, grantors, or laws or regulations of other governments. The government-wide Statementof Net Position reported restricted net position of $3.4 billion.
Certain investments of the Economic Development Bonds Fund are classified as restricted net position on the Statementof Fund Net Position for proprietary funds because their use is limited by applicable bond indenture agreements. Netposition associated with the Unemployment Insurance Fund is also classified as restricted.
B-46

R. Property Taxes
Real property taxes are normally levied in October and are usually payable in two installments on November 30 andMay 31. These taxes attach as an enforceable lien immediately if not paid when due.
Personal property tax levies are set each August, and notices are normally mailed the following March or April. Halfof mobile home taxes are due in 30 days and the remaining half on September 30. Taxes on all other types of personalproperty are to be paid in full 30 days after receipt of the notice. Property tax payments are recognized as deferredinflows of resources if received prior to levy or availability.
Personal property taxes attach as an enforceable lien immediately if not paid when due. Property taxes are collectedby each of Montana's 56 counties. The counties then remit the State's portion to the State Treasury. The majority ofthese taxes help fund public school systems and higher education.
S. Other Taxes
On the Statement of Activities, the revenue category “Other Taxes” consists of the following taxes (in thousands):
General FundState Special
Revenue
OtherGovernmental
FundsBusiness-Type
Funds TotalAccommodations $ 24,430 $ 33,259 $ — $ 20 $ 57,709Agriculture — 10,774 — — 10,774Car Rental 3,644 1,215 — — 4,859Cigarette/tobacco/etc. 33,792 44,830 1,600 — 80,222Contractors gross receipts 4,267 — — — 4,267Energy tax 8,042 145 — — 8,187Fire protection — 3,824 — — 3,824Hospital benefit assessment 4,351 — — — 4,351Insurance premium 75,239 31,017 — — 106,256Light vehicle registration — 4,280 — — 4,280Liquor tax 5,452 2,203 — 28,826 36,481Livestock — 9,749 — — 9,749Other taxes 218 932 — — 1,150Public service commission — 3,994 — — 3,994Railroad car companies 3,629 — — — 3,629Telephone license 16,068 — — — 16,068Video gaming 60,324 9 — — 60,333
Total other taxes $ 239,456 $ 146,231 $ 1,600 $ 28,846 $ 416,133
T. Tax Abatements
In the Montana Board of Investment’s (BOI) Commercial Loan Program within the SMI, by statute, the infrastructureloan program is funded by an $80.0 million allocation. Eligible local governments request a loan for constructing orpurchasing infrastructure to be used by a basic sector business. The basic sector business will pay a user fee to the localgovernment that is pledged to BOI for the loan repayment. BOI reviews each loan and, only upon verification that theentities meet the loan requirements, is the loan approved by BOI. The local government entity must pass a resolutionauthorizing the acceptance of the commitment agreement. BOI indemnifies the local government regarding repaymentof the loan.
B-47

To be eligible for the program, the basic sector business must create at least 15 full-time basic sector jobs. The maximumloan size is $16.7 thousand times the number of full-time jobs created and the minimum loan size is $250.0 thousand.The maximum loan term is 25 years. There is also up to a 2.5% interest rate reduction for job creation. The reductionwill be reflected in the user fee rate charged to the basic sector business upon BOI review and approval. The basicsector business must create the required jobs within four years of the agreement. If the basic sector business does notcreate the required jobs within the four-year period, then the basic sector business must pay down the loan balance ofthe local government entity until the loan balance matches the eligible amount per the jobs created. BOI may increasethe interest rate commensurate with the number of jobs eliminated if the borrower eliminates 10 or more qualifyingjobs. The basic sector business must annually provide payroll documentation to BOI.
Pursuant to statute, a business that is created or expanded as the result of an Infrastructure Loan is entitled to a creditagainst either their State individual income taxes or corporate income taxes for the portion of the fees attributable tothe use of the infrastructure. The total amount of tax credit claimed may not exceed the amount of the loan. The creditmay be carried forward for seven years or carried back for three years.
During the fiscal year ended June 30, 2018, basic sector business entities made total user fee payments of $3.5 million,representing $2.4 million of principal and $1.1 million in interest. During the fiscal year ended June 30, 2018, a totalof $1.4 million was claimed as a credit against State individual and corporation tax. The following table details thefiscal year 2018 credit claimed by tax type and the tax year it was applied against (in thousands):
Infrastructure Credit ClaimedTax Year
2017Tax Year
2016 TotalCorporate income tax $ — $ 706 $ 706Individual income tax 66 624 690 Total amount claimed $ 66 $ 1,330 $ 1,396
U. Irrevocable Split Interest Agreements
Irrevocable split-interest agreements are used by donors to provide resources to two or more beneficiaries, includinggovernments. These agreements can be created through trusts or other legally enforceable agreements withcharacteristics that are equivalent to irrevocable split-interest agreements. The University of Montana campuses havethree irrevocable split interest agreements during the fiscal year ended June 30, 2018. Further detail related to theseagreements are provided in Note 3.
B-48

NOTE 2. OTHER ACCOUNTING CHANGES
A. New Accounting Guidance Implemented
For the year ended June 30, 2018, the State of Montana implemented the provisions of GASB Statement No. 75,Accounting and Financial Reporting for Postemployment Benefits Other Than Pensions (GASB 75). The objective ofthis Statement is to improve the accounting and financial reporting by state and local governments for postemploymentbenefits other than pensions (other postemployment benefits or OPEB). It also improves the information provided bystate and local governmental employers about financial support for OPEB that is provided by other entities. GASB 75replaces the requirements of GASB Statement No. 45, Accounting and Financial Reporting by Employers forPostemployment Benefits Other Than Pensions, as amended, and GASB Statement No. 57, OPEB Measurements byAgent Employers and Agent Multiple-Employer Plans. An actuarial valuation of the total OPEB liability is required atleast biennially for all plans. Montana State Fund (MSF), a discretely presented component unit of the State of Montana,has a December 31 year-end. Therefore, MSF financial information related to OPEB is reported under GASB 45 inthis report. MSF will implement GASB 75 for their December 31, 2018 reporting period.
For the year ended June 30, 2018, the State of Montana implemented the provisions of GASB Statement No. 81,Irrevocable Split-Interest Agreements (GASB 81). This Statement requires recognition of resources by a governmentin the following circumstances: (1) A government, acting as the intermediary, recognizes assets, liabilities to otherbeneficiaries, and deferred inflows of resources at the inception of the agreement when the government receives theresources pursuant to an irrevocable split-interest agreement; (2) A government recognizes assets representing itsbeneficial interests in irrevocable split-interest agreements that are administered by a third party, and deferred inflow,when the government becomes aware of the agreement and has sufficient information to measure the beneficial interest;(3) A government recognizes revenue for the amount reported as deferred inflows of resources at the termination ofthe irrevocable split-interest agreement or applicable reporting period.
For the year ended June 30, 2018, the State of Montana implemented the provisions of GASB Statement No. 85,Omnibus 2017 (GASB 85). The objective of this Statement is to address practice issues that have been identified duringimplementation and application of certain GASB Statements. This Statement addresses a variety of topics includingissues related to (1) blending component units in circumstances in which the primary government is a business-typeactivity that reports in a single column for financial statement presentation, (2) reporting amounts previously reportedas goodwill and “negative” goodwill, (3) measuring certain money market investments and participating interest earninginvestment contracts at amortized cost, and (4) postemployment benefits (pensions and other postemployment benefitsOPEB).
For the year ended June 30, 2018, the State of Montana implemented the provisions of GASB Statement No. 86, CertainDebt Extinguishment Issues (GASB 86). The objective of this Statement is to provide guidance for (1) transactions inwhich cash and other monetary assets acquired with only existing resources-resources other than the proceeds ofrefunding debt-are placed in an irrevocable trust for the sole purpose of extinguishing debt (in-substance defeasanceof debt), (2) prepaid insurance on debt that is extinguished, and (3) notes disclosure to financial statements for debtthat is defeased in substance. In financial statements using the economic resources measurement focus, governmentsshould (1) no longer report the debt as a liability, and (2) recognize any difference between the reacquisition price (theamount required to be placed in the trust) and the net carrying amount of the debt defeased in substance using onlyexisting resources as a separately identified gain or loss in the period of the defeasance. In financial statements usingthe current financial resources measurement focus, governments should recognize the reacquisition price as a debtservice expenditure in the period of the defeasance. This Statement requires that any remaining prepaid insurance relatedto the extinguished debt be included in the net carrying amount of that debt for the purpose of calculating the gain orloss.
For the year ended June 30, 2018, the Montana University Systems, discretely presented component units of the Stateof Montana, early implemented the provisions of GASB Statement No. 89, Accounting for Interest Cost Incurred beforethe End of a Construction Period (GASB 89). GASB 89 replaces the requirements of paragraphs 5-22 of GASBStatement No. 62, Codification of Accounting and Financial Reporting Guidance Contained in Pre-November 30, 1989FASB and AICPA Pronouncements. This statement requires that interest cost incurred before the end of a constructionperiod be recognized as an expense or an expenditure in the period in which the cost is incurred for financial statementsprepared using the economic resources measurement focus or the current financial resources measurement focus,
B-49

respectively. This statement does not change the recording of interest costs incurred before the end of a constructionperiod for financial statements prepared using the current financial resources measurement focus (modified accrual).As a result, interest cost incurred before the end of a construction period will not be included in the historical cost ofa capital asset reported on the financial statements. The State of Montana did not early implement GASB 89 for theyear ended June 30, 2018.
B. Adjustments to Beginning Net Position
GASB Statement No. 75, Accounting and Financial Reporting for Postemployment Benefits Other Than Pensions(GASB 75), requires a retroactive restatement of financial statements for all prior periods presented. If restatement forprior periods is not practical, the cumulative effect of applying the statements is presented as a restatement of beginningnet position for the earliest period restated. In accordance with GASB 75, the State of Montana restated OPEB liabilitiesbeginning with the year ended June 30, 2018. A significant decrease of OPEB liabilities for the primary governmenthas been reported in the amount of $245.0 million, creating an increase to beginning net position in the same amount.A significant decrease of OPEB liabilities for the discretely presented component units of the State of Montanaaggregated has been reported in the amount of $82.0 million, creating an increase to beginning net position in the sameamount.
B-50

NOTE 3. CASH/CASH EQUIVALENTS AND INVESTMENTS
This note details the following asset classifications (in thousands):
Cash/cash equivalents $ 3,799,431Equity in pooled investments $ 13,649,012Investments $ 3,294,000
Carrying amounts for the bank balance for cash deposits and fair values for the State's cash equivalents and investmentsare presented in Tables 1 through 4.
A. General
Outside of statutory requirements, the State does not maintain a statewide risk policy for cash/cash equivalents orinvestments, held outside of the Montana Board of Investments (BOI). The investment risk policy for State cash/cashequivalents and investments, including the Economic Development Bonds (EDB) deposits and investments managedby BOI, have been detailed below.
(1) BOI was created by the Legislature to manage the Unified Investment Program (UIP) established by the StateConstitution. The UIP is comprised of involuntary participating state funds, including pensions, trusts, insurance,operating funds and by statute voluntarily participating local government funds. BOI manages the UIP pursuant to the“Prudent Expert Principle” mandated by State law, which requires an investment manager to:
1. discharge the duties with the care, skill, prudence, and diligence, under the circumstances then prevailing, thata prudent person acting in a like capacity with the same resources and familiar with like matters exercises inthe conduct of an enterprise of a like character with like aims;
2. diversify the holdings of each fund within the Unified Investment Program to minimize the risk of loss andto maximize the rate of return unless, under the circumstances, it is clearly prudent not to do so; and
3. discharge the duties solely in the interest of and for the benefit of the funds forming the Unified InvestmentProgram.
BOI is not registered with the US Securities and Exchange Commission as an investment company. BOI’s investmentprogram is governed by Investment Policy Statements (IPS) approved by BOI.
Currently, only the nine retirement funds participate in the Consolidated Asset Pension Pool (CAPP). The DefinedContribution Disability Plan, and the Montana State Fund (Workers’ Compensation) may invest in public corporatecapital stock. Neither State law nor the State Constitution place restrictions on retirement fund investments. BOIapproves a separate IPS for each pool and SMI participant, which provides BOI staff a broad strategic framework underwhich the investments are managed. The IPS’s also reflect BOI approved asset allocation ranges. By statute, localgovernment entities can voluntarily invest in the Short Term Investment Pool (STIP). By statute, with a qualifyingevent, local government entities may also voluntarily invest in the Trust Funds Investment Pool (TFIP).
To facilitate management of the UIP, BOI uses a combination of one internal investment pool, two external investmentpools and the SMI to meet the financial goals and expectations of state and local government agencies and entitieswhich entrust these funds to BOI. The investment activity reported within BOI’s financial statements is included aspart of the governmental, proprietary, and fiduciary fund financial statements within this report. Three pools and SMIare contained within the UIP:
• The Consolidated Pension Asset Pool (CAPP), an internal investment pool• Trust Funds Investment Pool (TFIP), an external investment pool• Short Term Investment Pool (STIP), an external investment pool• Separately Managed Investments (SMI)
B-51

As of June 30, 2018, BOI separately managed investments outside of the pools on behalf of 16 participants. Theinvestments are combined for reporting purposes in the SMI portion of the UIP. In prior years, the SMI portion of theUIP was referred to as All Other Funds (AOF). SMI participants include the State Treasurer's Cash Fund, State agencyinsurance reserves, and other State agencies. SMI participation is at the discretion of BOI staff for State agenciesallowed to participate in the UIP.
State agencies and local government entities may participate in one or more pools. By investing in pools, participantsare provided broad diversification. State agencies may also have direct fixed income, equity, or loan investments.These investments are combined and reported as SMI.
Separately issued investment pool financial statements may be obtained by contacting:
Montana Board of Investments2401 Colonial Drive, 3rd FloorPO Box 200126Helena, MT 59620-0126
BOI’s separately issued Unified Investment Program financial statements include the activity for Montana State Fund(MSF) within SMI on a June 30, 2018, basis. MSF, a discretely presented component of the State, by statute, preparesseparately issued financial statements on a calendar year-end basis. Due to the difference in reporting periods, therewill be a variance between the note disclosures and the financial statements for cash/cash equivalents and investments.
(a) Cash and cash equivalents consist of funds deposited by individual funds in the State Treasurer’s pooled cashaccount, cash deposits in checking accounts, cash invested in STIP, cash held by trustees, undeposited cash held byindividual State agencies, and investments categorized as cash equivalents. For the fiscal year ending June 30, 2018,BOI reevaluated the measurement of cash and cash equivalents, now reporting such investments at cost. Under GASB,cash equivalents can be reported under fair value or cost basis. BOI analyzed the immaterial difference of cashequivalents between their fair value and cost and determined the more relevant disclosure was under the cost method.The change did not cause a restatement of beginning net position due to the immaterial impact on beginning net position.
Cash deposited with the State Treasurer’s pooled cash account is invested by BOI in short-term securities and otherinvestments. Because these funds are immediately available to the individual funds, their investment in the pooled cashaccount is reported as a cash equivalent. BOI also manages STIP, which provides individual State agencies and localgovernments an opportunity to invest excess cash in a pool that is managed to preserve principal while providing 24-hour liquidity. Because these pooled funds are invested in short-term, highly liquid investments, the individual fundinvestments in the STIP are reported as a cash equivalent.
(b) Investment securities are reported by investment portfolio and type in Table 2 – Cash Equivalents, Table 3 –Equityin Pooled Investments, and Table 4 – Investments. Unrealized gains and losses are included as a component of investmentincome. Unrealized gains and losses are computed based on changes in the fair value of investments held from thebeginning of the year, but unsold at the fiscal year end. The net change in fair value of investments also consists ofthe realized gains or losses. Interest income is recognized when earned. Dividend income is recorded on the ex-dividend date.
Investments are reported at fair value on a trade date basis. Quoted market prices, when available, have been used tovalue investments. The fair values for securities that have no quoted market prices represent estimated fair value.Alternative investment securities are valued using the most recent estimates of fair value from the investment managers.Fair value measurements are reviewed monthly, and third-party valuations are reviewed for reasonableness andcompliance with approved price source authorization policy. All investment portfolios are presented at “fair” value.BOI categorizes its fair value measurements within the fair value hierarchy established by generally accepted accountingprinciples as follows:
Level 1 – Quoted prices for identical assets or liabilities in active markets.Level 2 – Prices determined using inputs, other than quoted prices included within Level 1, that are observable for an
asset or liability, either directly or indirectly.Level 3 – Prices are determined using unobservable inputs.
B-52

(c) Security Lending - BOI is authorized by law to lend its securities and has contracted with the custodial bank, tolend BOI’s securities to broker-dealers and other entities with a simultaneous agreement to return the collateral for thesame securities in the future. The custodial bank is required to maintain collateral equal to 102% of the fair value ofdomestic securities and 105% of the fair value of international securities while the securities are on loan. On any day,including June 30, the markets may move in a positive or negative direction resulting in under or over collateralization.The custodial bank compensates for market movement by recalculating on the following business day to meet thecollateralization requirements. BOI and the custodial bank split the earnings, 80/20 respectively, on security lendingactivities. BOI retains all rights and risks of ownership during the loan period. The custodial bank indemnifies BOI’scredit risk exposure to the borrowers.
During fiscal year 2018, the custodial bank lent BOI’s public securities and received as collateral: US dollar cash; USgovernment and government sponsored agency securities; US corporate debt securities and structured securities ratedAA-/Aa3 or higher; sovereign debt securities of the Group of Ten nations; and debt securities issued by certainsupranational agencies. The custodial bank does not have the ability to sell collateral securities unless the borrowerdefaults.
BOI imposed no restrictions on the amount of securities available to lend during fiscal year 2018. However, STIPassets are currently not available for securities lending. There were no failures by any borrowers to return loanedsecurities or pay distributions thereon during the period that resulted in a declaration and notice of default of theborrower. There were no losses during fiscal year 2018 resulting from a borrower default. As of June 30, 2018, nosecurities were recalled and not yet returned.
The cash collateral received for each loan was invested, together with the cash collateral of other qualified plan lenders,in an investment fund, the Navigator Securities Lending Government Money Market (Navigator) portfolio.
BOI and the borrowers maintain the right to terminate all securities lending transactions on notice. Since the securitieslending transactions were terminable at will, their duration did not generally match the duration of the investmentsmade with the cash collateral received from the borrower. The average duration was 10 days and the average weightedfinal maturity was 70 days within the Navigator portfolio.
(d) Investment Pools and SMI are described in the following paragraphs.
CAPP
The CAPP IPS contains prescribed asset allocation ranges among the allowable asset classes and is subject to changeas modifications are adopted by BOI. BOI annually affirms or revises the asset allocation ranges for the retirementplans. The CAPP IPS contains investment objectives and guidelines for each underlying asset class, with a purpose ofproviding diversified exposure within the asset class in a prudent and cost-effective manner. Due to a longer-termfocus, CAPP's asset classes differ from other classes that are allowable for other programs. CAPP's underlying assetclasses are as follows:
• Domestic Equities• International Equities• Private Equities• Natural Resources• Real Estate• US Treasury Inflation-Protected Securities (TIPS)• Broad Fixed Income• US Treasury/Agency• Investment Grade• Mortgage Backed Securities• High Yield• Cash• Diversifying Strategies
B-53

The CAPP IPS is the only IPS that allows for investments that can be held in non-US securities in a foreign currency.Per the CAPP IPS, the Investment Grade Credit Asset Class, Agency Mortgage Backed Securities Asset Class and HighYield Asset Class sections have maximum restrictions that can be held. Currency exposures may be hedged, in adefensive manner, at the discretion of the active managers to preserve the US dollar value of investments made.
TFIP
The TFIP IPS provides for a 2% portfolio limit for dollar denominated debt obligations of domestic and foreigncorporations, also known as Yankee bonds, and a 3% portfolio limit in non-agency mortgage pass-through (MBS)securities. TFIP invests primarily in investment grade, US dollar denominated fixed income securities. The portfoliohas high yield and core real estate exposure.
STIP
The STIP IPS limits concentration of credit risk exposure by limiting portfolio investment types to 3% in any issuerexcept for US Treasury and US Agency securities as well as any repurchase agreements with a financial institution.
STIP invests primarily in short-term, high quality, fixed income securities with a maximum maturity of 397 days orless. Variable securities shall have a maximum maturity of 2 years. STIP shall maintain a dollar-weighted averageportfolio maturity of 60 days or less. STIP is managed to preserve principal while providing 24-hour liquidity for stateagency and local government participants.
SMI
SMI invests primarily in investment grade, US dollar denominated fixed income securities. However, one participantportfolio has exposure to core real estate. The SMI portfolio also includes Veteran's Home Loan Mortgages (VHLM)and commercial loans.
The SMI Montana loans receivable represent commercial loans funded from the Coal Severance Tax Trust Fund byBOI and Montana Facility Finance Authority. The VHLM are also funded from the Coal Severance Tax Trust Fund.The Coal Severance Tax Trust Fund loan portfolio also includes loans made by the Montana Science and TechnologyAlliance (MSTA) Board. The MSTA Board was abolished on July 1, 1999 and the MSTA portfolio was assigned toBOI.
(e) Investment Risk Disclosures are described in the following paragraphs, with more detail provided in later sections.
Custodial Credit RiskCustodial credit risk for cash and cash equivalents and investments is the risk that, in the event of the failure of thecounterparty to a transaction, BOI may not be able to recover the value of the investment or collateral securities thatare in the possession of an outside party. Per policy, BOI’s custodial institution must hold short-term and long-termcredit ratings by at least one Nationally Recognized Statistical Rating Organization (NRSRO) with a minimumrequirement of A1/P1 (short-term) and A3/A-1 (long-term).
As of June 30, 2018, all the public securities, as well as securities held by the separate public equity account managers,were registered in the nominee name for BOI and held in the possession of BOI’s custodial bank. The equity indexfunds, securities held at the State’s depository bank, real estate, mortgage and loan investments were purchased andrecorded in BOI’s name. Commingled fund investments are registered in the name of BOI.
Concentration of Credit RiskConcentration of credit risk is the risk of loss attributable to the magnitude of any single investment per issuer name.Investments explicitly guaranteed by the US government are excluded from the concentration of credit risk requirement.Concentration of credit risk for 2018 is addressed within all IPS as set by BOI.
Credit Risk and Interest Rate RiskCredit risk is the risk that an issuer or other counterparty to an investment will not fulfill its obligation. Except for USgovernment securities, the pools' fixed income instruments have credit risk as measured by NRSRO ratings. Creditrisk is contemplated for each individual portfolio in the IPS. Credit risk is managed by constraining portfolio purchases
B-54

around investment grade NRSRO ratings as appropriate. The US government guarantees its securities directly orindirectly. Obligations of the US government, or obligations explicitly guaranteed by the US government, are notconsidered to have credit risk and do not require disclosure of credit risk.
The CAPP's cash equivalents' position held at its custodial bank was unrated, with approximately $330.3 million heldin Money Market Funds and an additional $4.3 million held by the CAPP's fiscal agent as of June 30, 2018. BOIdetermined that there was no significant credit quality risk associated with the cash equivalents.
As a matter of STIP investment policy, BOI can only purchase securities from a pre-approved Approved Issuer list.By STIP policy, permitted money market investments include only SEC registered 2a-7 Institutional Money MarketFunds that are considered US Treasury or US Government money market mutual funds according to the SEC regulationsor short-term investment vehicle available through the custodial bank. As of June 30, 2018, all the STIP money marketinvestments were in US Governmental Money Markets. BOI determined that there was no significant credit qualityrisk associated with the cash equivalents and did not suffer a loss event on the cash equivalents as of June 30, 2018.
Interest rate risk is the risk that changes in interest rates will adversely affect the fair value of an investment. BOI useseffective duration as a measure of interest rate risk for all fixed income portfolios. CAPP, TFIP, and SMI at fair valueinvestments are categorized to disclose credit and interest rate risk for fixed income securities. Credit risk is disclosedusing the weighted credit quality rating by investment type. Interest rate risk is disclosed using the weighted effectiveduration. The credit quality ratings have been calculated excluding non-rated investment types. NRSRO provides thecredit ratings. According to the STIP investment policy, “The STIP portfolio will minimize interest rate risk by:
1. structuring the investment portfolio so securities mature to meet cash requirements for ongoing operationsthereby normally avoiding the need to sell securities on the open market prior to maturity;
2. maintaining a dollar-weighted average portfolio maturity (WAM) of 60 days or less (for this purpose, the dateto the next coupon reset date will be used for all floating or variable rate securities); and
3. STIP will maintain a reserve account.”
CAPP, TFIP, SMI, and STIP may hold fixed and variable rate securities. Interest payments on variable securities arebased on an underlying reference rate, for example the London Interbank Offered Rate (LIBOR).
STIP investments at fair value are categorized to disclose credit risk and weighted average maturity (WAM) as of June30, 2018. Credit risk reflects the weighted security quality rating by investment type as of the June 30 report date.Although the STIP investments have been rated by investment security type, STIP, as an external investment pool, hasnot been rated. STIP interest rate risk is determined using the WAM method. The WAM measure expresses investmenttime horizons (the time when investments are due or reset and payable in days, months or years) weighted to reflectthe dollar size of the individual investments within an investment type. Inclusive of cash and cash equivalents, theWAM averages 46 days for the portfolio. Based on their short weighted average maturity and the relative immaterialdifference from their cost to fair value, BOI determined the cash equivalents to have little discernible interest rate risk.
Foreign Currency RiskForeign currency risk is the risk that changes in exchange rates will adversely affect the fair value of an investment.BOI's foreign currency exposure by denomination and investment type are reported, in US dollars, at fair value.
CAPP is the only IPS that allows for investments that can be held in non-US securities in a foreign currency. Per theCAPP IPS, the Investment Grade Credit Asset Class, Agency Mortgage Backed Securities Asset Class, and High YieldAsset Class sections have maximum restrictions that can be held. Currency exposures may be hedged, in a defensivemanner, at the discretion of the active managers to preserve the US dollar value of investments made.
Other Policy Considerations For other risk, BOI approves both the IPS and benchmark used for each portfolio. Per the CAPP IPS, the TIPS PAC,US Treasury/Agency PAC, Investment Grade Credit PAC, and Agency Mortgage-Backed PAC, average duration willbe maintained in a range within 20% of the benchmark duration. The Broad Fixed Income PAC and High Yield PACaverage duration will be maintained in a range within 25% of the index duration. Per the TFIP IPS, the average durationwill be maintained in a range within 20% of the benchmark duration. Interest rate risk for SMI is contemplated in each
B-55

individual IPS and is managed by limiting the maturity of individual securities and/or matching liabilities to maturitiesper estimated cash flows.
Fair Value of Derivative InstrumentsThe UIP invests in currency forward contract, index futures (long duration) and rights which are classified as investmentderivatives. The derivatives increase in fair value for the year ended June 30, 2018, by $170.0 thousand. The contractshad a fair value of $15.0 thousand, and the notional amount of the contracts was $818.0 thousand as of June 30, 2018.
STIP ReserveIn November 2007, the STIP reserve account was established. The STIP reserve account may be used to offset losseswithin the STIP portfolio. STIP distributes income to its participants based on accrued interest and discount amortization,net of fees and STIP reserve expense. Prior to the year ending June 30, 2018, the STIP reserve was reported as a liability,instead of as a component of BOI's fiduciary net position in accordance with GAAP. BOI restated the liability as anincrease to fiduciary net position of $24.2 million as of July 1, 2017. The STIP reserve for the year ending June 30,2018, is detailed as follows:
STIP Reserve (in thousands)
Beginning STIP Reserve $ 24,235Additions Interest Income 350Other income
Transfer of daily STIP income 4,192 Recoveries from write offs 3,626
Perm Coal enhancement fees 162Total additions 8,330
Total STIP Reserve Activity $ 8,330Ending STIP reserve $ 32,565
(2) The EDB deposits and investments are restricted by the bond trust indentures to the following: government andagency obligations, certificates of deposits, repurchase agreements, and investment agreements. The bond trust indentureaddresses custodial credit risk, concentration of credit risk, credit risk, interest rate and credit quality risk, by detailingthe permitted investments. BOI's STIP IPS details custodial credit risk, concentration of credit risk, and credit risk.Deposits and investments must be made with Montana banks or in the STIP administered by BOI.
For the fiscal year ending June 30, 2018, BOI reevaluated the measurement of cash and cash equivalents, now reportingsuch investments at cost. Under GASB, cash equivalents can be reported under fair value or cost basis. BOI analyzedthe immaterial difference of cash equivalents between their fair value and cost and determined the more relevantdisclosure was under the cost method. The change did not cause a restatement of beginning net position due to theimmaterial impact on beginning net position.
Custodial Credit Risk – Custodial credit risk is the risk that, in the event of the failure of the counterparty to a transaction,BOI will not be able to recover the value of the investment or collateral securities that are in the possession of an outsideparty. Per policy, BOI’s custodial institution must hold short-term and long-term credit rating by at least one NRSROwith a minimum requirement of A1/P1 (short-term) and A3/A-1 (long-term).
Cash – Custodial risk for cash is the risk that, in the event of the failure of the custodial financial institution,the cash or collateral securities may not be recovered from an outside party. The securities used as collateralare held by the trustee in the name of BOI.
Investments – As of June 30, 2018, EDB securities were recorded by the trustee in the name of BOI by specificaccount.
B-56

Concentration of Credit Risk - Concentration of credit risk is the risk of loss attributed to the magnitude of any singleinvestment per issuer name. The EDB investments directly issued or explicitly guaranteed by the US government andinvestments in mutual funds are excluded from the concentration of credit risk requirement. The STIP investment policylimits concentration of credit risk by limiting portfolio investment types to 3% in any issuer with the exception of USTreasury and US Agency securities, as well as, any repurchase agreements with a financial institution. As of June 30,2018, STIP concentration risk was within the policy as set by BOI.
Credit Risk - Credit risk is the risk that an issuer or other counterparty to an investment will not fulfill its obligation.The EDB’s US government direct-backed securities, consisting of US Treasury notes and bills, are guaranteed directlyby the US government. Obligations of the US government or obligations explicitly guaranteed by the US governmentare not considered to have credit risk and do not require disclosure of credit quality. Permitted investments, as describedin the indenture, include, “Either (i) long term obligations of such bank, trust company or association are rated in oneof the three highest investment category of the Standard & Poor’s Corporation or Moody’s Investor Service Inc., whichinvestment category shall not be less than the prevailing rate on the bonds or (ii) the deposits are continuously securedas to principal, but only to the extent not insured by the Bank Insurance Fund or the Savings Association InsuranceFund, or any successor to either, of the Federal Deposit Insurance Corporation (FDIC).”
BOI’s STIP investment policy statement specifies that STIP securities have a minimum of two credit ratings as providedby nationally recognized statistical rating organizations, to assist in the monitoring and management of credit risk. Thepurchase of STIP securities other than US government or US agency obligations are restricted to those which are pre-approved. Although the STIP investments have been rated by investment security type, STIP, as an external investmentpool, has not been rated.
Interest Rate Risk - Interest rate risk is the risk that changes in interest rates will adversely affect the fair value of aninvestment. Permitted investments as described in the Indenture details the allowable investments, including those inSTIP. STIP interest rate risk is determined using the WAM method. According to the STIP IPS, “The STIP portfoliowill minimize interest rate risk by:
1. structuring the investment portfolio so securities mature to meet cash requirements for ongoing operations,thereby normally avoiding the need to sell securities on the open market prior to maturity;
2. maintaining a dollar-weighted average portfolio maturity (WAM) of 60 days or less (for this purpose, the dateto the next coupon reset date will be used for all floating or variable rate securities); and
3. STIP will maintain a reserve account.”
The EDB investments are categorized to disclose credit and interest rate risk as of June 30, 2018. Credit risk is disclosedusing the weighted credit quality rating by investment type. Interest rate risk is disclosed using weighted effectiveduration as calculated by BOI. The credit quality ratings have been calculated excluding non-rated investment types.Both the credit quality ratings and duration have been calculated excluding cash equivalents, as management of BOIdetermined that these securities did not contain these risk elements. There were no derivative transactions during the2018 fiscal year for investments held by the trustee. Based on their short weighted average maturity and the relativeimmaterial difference from their cost to fair value, BOI determined the cash equivalents to have little discernible interestrate risk and a loss event did not occur as of June 30, 2018.
B. Cash/Cash Equivalents
(1) Cash Deposits – The State requires collateralization based on the average daily bank balance in the depositorybank holding the main state bank account. For other depository banks, state statutes require collateralization at 50% ofthe bank balance. The cash deposits amount includes both primary government and component unit deposits.
B-57

Table 1 – Cash Deposit Amounts(in thousands)
CarryingAmount
Cash held by State/State's agent $ 91,359Uninsured and uncollateralized cash 8,214Undeposited cash 512Cash in US Treasury 316,605Cash in MSU component units 8,065Cash in UM component units 11,465Less: outstanding warrants (82,211)
$ 354,009
As of June 30, 2018, the carrying amount of deposits for component units was $182.5 million as included in Table 1.
(2) Cash Equivalents – consists of cash in the State Treasury invested by individual funds in the Short-term InvestmentPool (STIP), the State Treasurer’s pooled cash account, and in identifiable securities and investments considered to becash equivalents. Cash equivalents, generally, are short-term, highly liquid investments with original maturities of threemonths or less that are measured at cost. Cash equivalents may be under the control of BOI or other agencies, as allowedby law.
Table 2 - Cash Equivalents (in thousands)
FairValue
Treasuries (1) $ 92,881Corporate commercial paper (2) 288,944Corporate notes (2) 225,121Certificate of deposit (2) 546,591Money market fund unrated 152,372STIP cash and cash equivalents (2) 2,250,669Less: STIP included in pooled investment balance (111,156)
Total cash equivalents $ 3,445,422(1) A portion is also included in the Investments Measured at Fair Value and NAV table.(2) Also included in the Investments Measured at Fair Value and NAV table.
As of June 30, 2018, local governments had invested $1.2 billion and component units of the State of Montana had invested $412.7million in STIP.
STIP Cash Equivalent Credit Quality Ratings (in thousands)
Total Fixed IncomeInvestments at Fair
Value Credit Quality RatingTreasuries $ 239,483 A-1+Asset backed commercial paper 1,105,685 A-1Corporate commercial paper 233,356 A-1+Corporate notes 55,004 A-1+Certificate of deposit 124,915 A-1US government agency 351,707 A-1+US Government money market funds 140,357 A-1+Cash held at fiscal agent 162 NR
Total cash equivalents $ 2,250,669
B-58

STIPCredit Quality Rating and Weighted Average of Maturity as of June 30, 2018
(in thousands)
Security Investment Type
Total FixedIncome
Investmentsat Fair Value
CreditQualityRating WAM (Days)
Treasuries $ 19,900 A-1+ 97Corporate:
Commercial Paper 288,944 A-1 71Notes 225,121 A-1+ 67
Certificates of Deposit 546,591 A-1 42Total STIP fixed income investments at fair value $ 1,080,556
C. Equity in Pooled Investments
These securities consist of investments held by BOI in pooled investment funds. The Consolidated Asset Pension Pool(CAPP) and Trust Funds Investment Pool (TFIP) were created to allow qualifying funds to participate in diversifiedinvestment pools. Purchases are subject to the statutorily mandated “Prudent Expert Principle” (see Table 3 – Equityin Pooled Investments).
Table 3 – Equity in Pooled Investments(in thousands)
Fair Value (1)
CAPP:Consolidated asset pension pool $ 11,315,343
TFIP:Trust funds investment pool 2,333,070 Total pooled investments 13,648,413 Pool adjustments (net) 599
Total equity in pooled investments $ 13,649,012
(1) Includes cash/cash equivalents and investments.
As of June 30, 2018, the fair value of the underlying securities on loan was $937.7 million. Collateral provided for the securities onloan totaled $957.5 million, consisting of $106.2 million in cash and $851.3 million in securities.
As of June 30, 2018, local governments invested $12.0 million in TFIP.
State of Montana investments are categorized below to disclose credit and interest rate risk as of June 30, 2018, asrequired for applicable pools.
B-59

Credit Quality Rating and Effective Duration as of June 30, 2018Fair Value (in thousands)
Security Investment Type CAPP TFIP SMI
Total FixedIncome
Investmentsat Fair Value
Credit QualityRatingsRange
EffectiveDuration(Years)
Treasuries $ 1,226,714 $ 536,787 $ 330,905 $ 2,094,406 AAA 3.61-7.59Agency or Government Related 130,363 137,558 264,686 532,607 AAA 3.06-6.06Asset Backed Securities 14,743 81,854 44,314 140,911 AAA 2.07-2.74Mortgage Backed Securities:
Noncommercial 480,163 446,905 38,563 965,631 AAA 5.11-5.82Commercial 56,498 144,288 16,406 217,192 AAA 4.36-6.12
Corporate:Financial 261,035 275,280 250,987 787,302 BBB+, A- 3.15-4.46Industrial 431,025 416,570 316,685 1,164,280 BB+, A 4.09-6.66Utility 24,967 23,463 21,413 69,843 BBB, BBB+ 2.75-4.69
High Yield Bond Fund — 100,994 — 100,994 B 3.64
Total fixed income investments at fair value $ 2,625,508 $ 2,163,699 $ 1,283,959 $ 6,073,166
State of Montana investments are measured at fair value and categorized within the fair value hierarchy established byGASB Statement No. 72 – Fair Value Measurement and Application, as defined below.
CAPP, STIP, and SMI – Fixed income and equity investments classified in Level 1 of the fair value hierarchy are valuedusing prices quoted in active markets for those securities. Fixed income investments classified in Level 2 of the fairvalue hierarchy are valued using a matrix pricing technique. Matrix pricing is used to value securities based on thesecurities’ relationship to benchmark quoted prices.
CAPP – Residential Mortgages classified in Level 3 of the fair value hierarchy are present value adjusted. Direct realestate classified in Level 3 of the fair value hierarchy are based on the latest appraisal value.
Pools and SMI – Investments measured at cost are included to account for all investments within each pool and SMI.These assets represent cash equivalents and Montana Mortgages and Loans.
Each of the investment pools and SMI have the following fair value measurements as of June 30, 2018:
Investments Measured at Fair Value(in thousands)
Fair Value Measurements Using
June 30, 2018
Quoted prices in Active Markets for Identical Assets
(Level 1)
Significant Other Observable
Inputs(Level 2)
SignificantUnobservable
(Level 3)Investments by fair value levelFixed income investments:
Treasuries $ 2,114,306 $ 2,114,306 $ — $ —Agency or Government Related 532,607 — 532,607 —Asset Backed Securities 140,911 — 140,911 —Mortgage Backed Securities 965,631 — 965,631 —Commercial Mortgage Backed Securities 217,192 — 217,192 —
Corporate:Commercial Paper 288,944 — 288,944 —
B-60

Investments Measured at Fair Value(in thousands)
Fair Value Measurements Using
June 30, 2018
Quoted prices in Active Markets for Identical Assets
(Level 1)
Significant Other Observable
Inputs(Level 2)
SignificantUnobservable
(Level 3)Commercial Notes 225,121 — 225,121 —Certificates of Deposit 546,591 — 546,591Financial 787,302 — 787,302 —Industrial 1,164,280 — 1,164,280 —Utility 69,843 — 69,843 —
Equity investments:Consumer Discretionary 269,082 269,082 — —Consumer Staples 71,850 71,850 — —Energy 108,933 108,933 — —Financials 267,097 267,097 — —Health Care 228,681 228,681 — —Industrials 274,462 274,462 — —Information Technology 444,999 444,999 — —Materials 90,942 90,942 — —Mutual Funds 2,233,394 2,233,394 — —Real Estate 41,022 41,022 — —Telecommunication Services 12,920 12,920 — —Utilities 30,738 30,738 — —
International equity investments:Consumer Discretionary 111,748 111,748 — —Consumer Staples 84,360 84,360 — —Energy 50,331 50,331 — —Financials 154,819 154,819 — —Health Care 54,635 54,635 — —Industrials 116,210 116,210 — —Information Technology 128,410 128,410 — —Materials 37,300 37,300 — —Mutual Funds 270,338 270,338 — —Private Placement 1,239 1,239 — —Real Estate 13,427 13,427 — —Rights/Warrants 15 15 — —Telecommunication Services 12,031 12,031 — —Utilities 4,876 4,876 — —
Direct Real Estate 19,185 — — 19,185Residential Mortgages 3,861 — — 3,861
Total investments by fair value level $ 12,189,633 $ 7,228,165 $ 4,938,422 $ 23,046Investments measured at the net asset value (NAV)Commingled Equity Index Funds 1,116,165Private Equity – Private Equity Partnerships 1,365,239Core Real Estate 557,350Non-core Real Estate 396,524Timber 110,153High Yield Bond Fund 100,994
Total investments measured at NAV 3,646,425Total investments measured at fair value 15,836,058
B-61

The investments measured at NAV for the year ended June 30, 2018, are detailed below.
Investments Measured at NAV (in thousands)
Fair ValueUnfunded
Commitments
RedemptionFrequency (If
Currently Eligible)Redemption
Notice PeriodCAPP
Commingled Equity Index Funds $ 936,139 $ — Daily 1 dayPrivate Equity – Private Equity Partnerships 1,365,239 938,879Core Real Estate 329,903 80,000 Monthly, quarterly 45-90 daysNon-core Real Estate 396,524 285,064Timber 110,153 17,657
Total investments measured at the NAV $ 3,137,958 $ 1,321,600TFIP
Core Real Estate 138,538 Monthly, quarterly 45-90 daysHigh Yield Bond Fund 100,994 Monthly 30 days
Total investments measured at NAV $ 239,532SMI
Core Real Estate 88,909 Monthly, quarterly 45-90 daysCommingled Equity Index Funds 180,026 Daily 1 day
Total investments measured at NAV $ 268,935
STIP and $1.7 billion of SMI are included, and also reported in Tables 2 and 4, respectively.
Commingled Equity Index Funds – This type consists of institutional investment funds that invest in domestic equitiesand funds that invest in international equities. The fair values of these investments use the NAV per share (or itsequivalent) of the investments.
High Yield Bond Fund – This type consists of predominantly US corporate credits, whether in the form of bonds orloans, that are rated below investment grade. These assets carry a higher risk of default than investment grade securitiesand accordingly provide a higher level of income or yield commensurate with that risk. The fair values of theseinvestments use the NAV per share (or its equivalent) of the investments.
Core Real Estate – This type includes funds that invest primarily in core real estate, which makes equity investmentsin operating and substantially-leased institutional quality real estate in traditional property types (apartments, office,retail, industrial and hotel), through commingled funds. The primary investment objectives of these core real estatefunds are to invest in real estate that will generate income from predictable sources of revenue and not to realize gainson the underlying assets. This investment type receives distributions of generated income and occasionally through theliquidation of the underlying assets of the fund. The fair values of these investments use the NAV per share (or itsequivalent) of BOI’s ownership interest in the partners’ capital. Redemption of these investments is restricted based onthe availability of cash flow arising from investment transactions, sales, and other fund operations occurring in theordinary course of business. Therefore, requested redemptions from a fund will be redeemed as funds become available.
Investments Measured at Fair Value(in thousands)
Fair Value Measurements Using
June 30, 2018
Quoted prices in Active Markets for Identical Assets
(Level 1)
Significant Other Observable
Inputs(Level 2)
SignificantUnobservable
(Level 3)Investments not required to be categorizedCash and cash equivalents held at custodial bank 2,585,318Montana Mortgages and Loans at cost 180,618
Total investments not categorized 2,765,936Total investments $ 18,601,994
B-62

The investments measured at NAV for the year ended June 30, 2018, are detailed below.
Investments Measured at NAV (in thousands)
Fair ValueUnfunded
Commitments
RedemptionFrequency (If
Currently Eligible)Redemption
Notice PeriodCAPP
Commingled Equity Index Funds $ 936,139 $ — Daily 1 dayPrivate Equity – Private Equity Partnerships 1,365,239 938,879Core Real Estate 329,903 80,000 Monthly, quarterly 45-90 daysNon-core Real Estate 396,524 285,064Timber 110,153 17,657
Total investments measured at the NAV $ 3,137,958 $ 1,321,600TFIP
Core Real Estate 138,538 Monthly, quarterly 45-90 daysHigh Yield Bond Fund 100,994 Monthly 30 days
Total investments measured at NAV $ 239,532SMI
Core Real Estate 88,909 Monthly, quarterly 45-90 daysCommingled Equity Index Funds 180,026 Daily 1 day
Total investments measured at NAV $ 268,935
STIP and $1.7 billion of SMI are included, and also reported in Tables 2 and 4, respectively.
Commingled Equity Index Funds – This type consists of institutional investment funds that invest in domestic equitiesand funds that invest in international equities. The fair values of these investments use the NAV per share (or itsequivalent) of the investments.
High Yield Bond Fund – This type consists of predominantly US corporate credits, whether in the form of bonds orloans, that are rated below investment grade. These assets carry a higher risk of default than investment grade securitiesand accordingly provide a higher level of income or yield commensurate with that risk. The fair values of theseinvestments use the NAV per share (or its equivalent) of the investments.
Core Real Estate – This type includes funds that invest primarily in core real estate, which makes equity investmentsin operating and substantially-leased institutional quality real estate in traditional property types (apartments, office,retail, industrial and hotel), through commingled funds. The primary investment objectives of these core real estatefunds are to invest in real estate that will generate income from predictable sources of revenue and not to realize gainson the underlying assets. This investment type receives distributions of generated income and occasionally through theliquidation of the underlying assets of the fund. The fair values of these investments use the NAV per share (or itsequivalent) of BOI’s ownership interest in the partners’ capital. Redemption of these investments is restricted based onthe availability of cash flow arising from investment transactions, sales, and other fund operations occurring in theordinary course of business. Therefore, requested redemptions from a fund will be redeemed as funds become available.
Investments Measured at Fair Value(in thousands)
Fair Value Measurements Using
June 30, 2018
Quoted prices in Active Markets for Identical Assets
(Level 1)
Significant Other Observable
Inputs(Level 2)
SignificantUnobservable
(Level 3)Investments not required to be categorizedCash and cash equivalents held at custodial bank 2,585,318Montana Mortgages and Loans at cost 180,618
Total investments not categorized 2,765,936Total investments $ 18,601,994
Non-Core Real Estate – This type includes private partnership funds that primarily invest in value added andopportunistic real estate funds. These funds assume more risk than the core real estate funds in order to achieve a greaterreturn on investment. Returns are driven both by current income and by expected capital appreciation. This investmenttype receives distributions of generated income and occasionally through the liquidation of the underlying assets of thefund. It is expected that the underlying assets of the funds will be liquidated over 7 to 10 years. These investments cannever be redeemed with the funds. The fair values of these investments use the NAV per share (or its equivalent) ofBOI’s ownership interest in the partners’ capital.
Timber – This type includes private partnership funds that primarily invest in timber funds. The underlying assets ofthese types of funds are typically made of tree farms and managed forest. Returns come from biological growth, upwardproduct class movement, and appreciation in timber and land prices. This investment type receives distributions ofgenerated income and occasionally through the liquidation of the underlying assets of the fund. It is expected that theunderlying assets of the funds will be liquidated over 12 to 20 years; these investments can never be redeemed withthe funds. The fair values of these investments use the NAV per share (or its equivalent) of BOI’s ownership interestin the partners’ capital.
Private Equity Partnerships – This type includes investments in limited partnerships. Generally, the types of partnershipstrategies included in this portfolio are: venture capital, growth equity, buyouts, special situations, mezzanine, anddistressed debt. These investments and are considered illiquid. Redemptions are restricted over the life of the partnership.During the life of the partnerships, distributions are received as underlying partnership investments are realized. It isexpected that the underlying assets of the funds will be liquidated over 10 years. It is probable all of the investmentsin this type will be sold at an amount different from the NAV per share (or its equivalent) of BOI’s ownership interestin partners’ capital.
As of the June 30, 2018, exchange date, BOI’s foreign currency exposure by deposits and investment type are reported,in US dollars, at fair value in the table below. Excluded are the foreign investments denominated in US dollars for theAmerican Depositary Receipts, sovereign debt and commingled index funds.
B-63

Foreign Currency Exposure by Country(in thousands)
Foreign CurrencyDenomination Currency Equities
PrivateEquity Real Estate
Australian Dollar $ — $ 23,306 $ — $ —Brazilian Real — 14,814 — —Canadian Dollar 65 53,456 — —Danish Krone — 13,104 — —EMU – Euro 46 168,668 21,400 2,000Hong Kong Dollar 1 37,984 — —Indonesian Rupiah 25 623 — —Korean Fortnit 4 15,946Japanese Yen 322 109,401 — —Malaysian Ringgit 16 2,626 — —Mexican Peso 2 2,430 — —New Israeli Sheqel — 3,686 — —New Zealand Dollar — 238 — —Norwegian Krone — 11,022 — —Philippine Peso 1 1,201 — —Phillippine Piso — 34Polish Zloty 3 2,161 — —Pound Stering 248 103,975Singapore Dollar 77 12,089 — —South African Rand — 14,129 — —South Korean Won — 25,224 — —Swedish Krona — 22,659 — —Swiss Franc — 32,240 — —New Taiwan Dollar — 4,887 — —Thailand Baht 6 5,141 — —Yuan Renminbi 94 7,774 — —
Total cash andsecurities $ 910 $ 688,818 $ 21,400 $ 2,000
Investments in alternative equity are usually made through limited partnership agreements that involve many limitedpartners and a general partner who is responsible for all investment decisions. The limited partners make an originalcommitment, after which capital is called as needed by the general partner to make investments. These agreements willusually last for a minimum of 10 years. The table below shows the remaining BOI commitments to CAPP alternativeequity managers by pension asset class (PAC), as of June 30, 2018.
Commitments to Fund Managers(in thousands)
PoolOriginal
CommitmentCommitmentRemaining
Private Equities PAC $ 2,580,722 $ 807,355Real Estate PAC 1,655,262 365,064Natural Resources PAC 420,000 149,181
Total $ 4,655,984 $ 1,321,600
B-64

D. Investments
Article VIII of Montana's Constitution, with supporting statutes, authorizes BOI to manage the State's UnifiedInvestment Program. Long-term investments are administered by the following agencies, as allowed by state law,Section 17-6-201, MCA:
Long-term Investments
DepartmentPercent
AdministeredBoard of Investments 50.97%Universities 19.06MPERA (Montana Public Employee Retirement Administration) 22.14College Savings Plan 4.71Montana Board of Housing 1.67Other (1) 1.45 Total 100.00%
(1) Other consists of the Commissioner of Higher Education, the Department of Administration, the Department of Commerce, the
Department of Natural Resources and Conservation, the Department of Public Health and Human Services, the Departmentof Revenue, and State Auditor.
BOI must employ the "Prudent Expert Rule" in managing the State's investment portfolio. Investments are presentedat fair value. Investment fair values for publicly traded securities are determined primarily by reference to market pricessupplied to BOI's custodial bank or trustee. State investments are categorized within the fair value hierarchy establishedby GASB Statement No. 72.
The PERS Defined Contribution Retirement Plan (DCRP) and the Deferred Compensation Plan’s Montana Fixed Fundis a stable value investment option administered by outside vendors; Pacific Investment Management Company LLC(PIMCO), custodial bank State Street Bank and Trust Company (State Street), and third-party synthetic GuaranteedInterest Contract (GIC) providers, Transamerica Life Insurance Company (Transamerica), Prudential InsuranceCompany of America (Prudential) and Voya Retirement Insurance & Annuity Company (Voya). All money invested inthe Montana Fixed Fund (stable value investment option) of the PERS-DCRP and Deferred Compensation Plan areheld in a Pooled Trust. The third party record keeper, Empower ™ Retirement, tracks and reports the daily trading andvaluations of all investment options, including the assets held by the individual mutual fund companies.
Table 4 – Investments (in thousands)
Fair ValueJune 30, 2018
Quoted prices in Active Markets for Identical Assets
(Level 1)
Significant Other Observable Inputs
(Level 2)
SignificantUnobservable
Inputs(Level 3)
Primary governmentInvestments by fair value levelTreasuries (1) $ 8,823 $ 8,823 $ — $ —Agency/Government Related (1) 47,962 — 47,962 —Government Securities 5,958 3,867 2,091 —Stocks 5,447 5,447 — —Other 19,166 — 19,166 —
Total investments at fair value 87,356 18,137 69,219 —
Investments at costMontana Mortgages and Loans (3) 180,618
Total investments at cost 180,618Total primary government 267,974
Component units/fiduciary funds
B-65

(1) The credit quality rating and duration are included in above sections for the rated investments.(2) For more detail, refer to component unit separately issued financial statements.(3) The total for Montana Mortgages and Loans does not include Coal Severance Tax loans, which was included on SMI financial statements. This amountof $9.7 million is considered advances to other funds/component units and amounts due from component units in the Coal Tax Severance column of thegovernmental fund financial statements.
As of June 30, 2018, the fair value of the investments on loan was $131.4 million. Collateral provided for the investments on loan totaled $134.1 millionconsisting of $14.4 million in cash and $119.7 million in securities.
$1.7 billion of SMI is included, and also reported in the Investments Measured at Fair Value and NAV table.
Table 4 – Investments (in thousands)
Fair ValueJune 30, 2018
Quoted prices in Active Markets for Identical Assets
(Level 1)
Significant Other Observable Inputs
(Level 2)
SignificantUnobservable
Inputs(Level 3)
Investments by fair value levelTreasuries (1) 272,324 272,324 — —Agency/Government Related (1) 216,724 — 216,724 —Asset Backed Securities (1) 44,314 — 44,314 —Mortgage Backed Securities (1) 38,563 — 38,563 —Commercial Mortgage Backed Securities (1) 16,406 — 16,406 —Financial-Corporate (1) 250,987 — 250,987 —Industrial-Corporate (1) 316,685 — 316,685 —Utility-Corporate (1) 21,413 — 21,413 —529 College Savings Plan 154,733 — 154,733 —VEBA 6,956 — 6,956 —State Auditor 10,082 — 10,082 —MSU Component Unit Investments (2) 295,063 153,063 44,027 97,973UM Component Unit Investments (2) 175,380 130,426 34,012 10,942Board of Housing (2) 53,249 20,872 32,377 —
Total investments at fair value 1,872,879 576,685 1,187,279 108,915Investments at net asset value (NAV)Core Real Estate 88,909Commingled Equity Index Funds 180,026Deferred Compensation (2) 501,608Defined Contribution (2) 225,634UM Component Unit Investments (2) 123,987UM Other Investments (2) 612UM Interest in Split Interest (2) 4,239
Total investments at NAV 1,125,015Investments at costMSU Component Unit Investments (2) 26,390Board of Housing (2) 1,742
Total Investments at Cost 28,132Total component unit/fiduciary investments 3,026,026Total investments $ 3,294,000
Securities lending investment pool $ 14,392
B-66

EDB – Rated SecuritiesCredit Quality Rating and Effective Duration as of June 30, 2018
(in thousands)
Security Investment TypeFair
Value
CreditQuality
Rating (1)Effective
Duration (1)
Short-term investmentsUS Treasury obligations $ 3,182 AA 0.24US Agency obligations 1,080 AA 0.63
Restricted investmentsUS Treasury obligations 685 AA 2.42
Total investments $ 4,947
(1) Credit Quality Rating and Effective Duration are weighted.
B-67

NOTE 4. DISAGGREGATION OF ACCOUNTS RECEIVABLE, ACCOUNTS PAYABLE, DEFERREDOUTFLOWS OF RESOURCES AND DEFERRED INFLOWS OF RESOURCES
Accounts receivable, accounts payable, deferred outflows of resources and deferred inflows of resources on theStatement of Net Position as of June 30, 2018, consisted of the following (in thousands):
A. Accounts Receivables
Governmental Activities
CoalSeverance
Tax
FederalSpecial
RevenueGeneral
Fund
InternalServiceFunds
LandGrant
NonmajorGovernmental
FundsState Special
RevenueCharges for services/fines/forfeitures $ — $ 6,156 $ 1,054 $ 556 $ — $ — $ 10,416Contributions/premiums — — — 6,909 — — 1,790Grants/contracts/donations — 11 — — — — 351Investment income 3,225 — 1,350 217 1,956 3,549 4,229License and permits — — — — — — 7,785Other receivables — 49,019 8,133 — — — 146Reimbursements/overpayments — 133 14,587 — — — 14,919Taxes 7,244 — 387,843 — — 2,474 99,298
Total receivables 10,469 55,319 412,967 7,682 1,956 6,023 138,934Less: allowance for doubtful accounts — (2,085) (127,081) (17) — — (18,116)
Receivables, net $ 10,469 $ 53,234 $ 285,886 $ 7,665 $ 1,956 $ 6,023 $ 120,818
Business-type ActivitiesEconomic
DevelopmentBonds
NonmajorEnterprise Funds
UnemploymentInsurance
Charges for services $ — $ 26,927 $ —Contributions/premiums — 5,017 5,662Loans/investment income 10,675 191 —Other receivables 263 80 —Reimbursements/overpayments — — 1,819
Total receivables 10,938 32,215 7,481Less: allowance for doubtful accounts — (495) (3,363)
Receivables, net $ 10,938 $ 31,720 $ 4,118
B-68

B. Deferred Outflows of Resources
Governmental Activities
Federal SpecialRevenue General Fund
Internal ServiceFunds
NonmajorGovernmental
FundsState Special
RevenueOPEB deferred outflows (1) $ — $ 895 $ 58 $ — $ —Pension deferred outflows (2) 26 354,870 13,926 — 105Refunding deferred outflows — — — 3,006 —
Total deferred outflows $ 26 $ 355,765 $ 13,984 $ 3,006 $ 105
Business-type ActivitiesEconomic
DevelopmentBonds
NonmajorEnterprise Funds
OPEB deferred outflows (1) $ — $ 17Pension deferred outflows (2) 90 3,904
Total deferred outflows $ 90 $ 3,921
(1) Further detail regarding OPEB related deferred outflows of resources is provided in Note 7.(2) Further detail regarding pension related deferred outflows of resources is provided in Note 6.
C. Accounts Payables
Governmental Activities
Federal SpecialRevenue General Fund
Internal ServiceFunds
NonmajorGovernmental
FundsState Special
RevenueAccrued interest $ 4 $ 369 $ 21 $ 2,267 $ 51Payroll 7,714 21,139 3,760 37 20,882Tax refunds — 169,494 — — —Vendors/individuals 280,290 68,069 10,932 2,408 156,870
Payables, net $ 288,008 $ 259,071 $ 14,713 $ 4,712 $ 177,803
Business-type ActivitiesEconomic
DevelopmentBonds
NonmajorEnterprise Funds
UnemploymentInsurance
Accrued interest $ 578 $ 4 $ —Payroll 20 1,037 —Vendors/individuals 6 19,868 2,204
Payables, net $ 604 $ 20,909 $ 2,204
B-69

D. Deferred Inflows of Resources
Governmental Activities
Federal SpecialRevenue General Fund
Internal ServiceFunds
NonmajorGovernmental
FundsState Special
RevenueOPEB deferred inflows (1) $ — $ 4,358 $ 280 $ — $ —Pension deferred inflows (2) 1 66,962 1,389 — 24Refunding deferred inflows — — — 530 —
Total deferred inflows $ 1 $ 71,320 $ 1,669 $ 530 $ 24 All deferred inflows of resources in the governmental fund financial statements consist of unavailable revenue.
Business-type ActivitiesEconomic
DevelopmentBonds
NonmajorEnterprise Funds
OPEB deferred inflows (1) $ 2 $ 84Other deferred inflows — 5Pension deferred inflows (2) 15 725
Total deferred inflows $ 17 $ 814
(1) Further detail regarding OPEB related deferred inflows of resources is provided in Note 7. (2) Further detail regarding pension related deferred inflows of resources is provided in Note 6.
B-70

NOTE 5. CAPITAL ASSETS
Changes in capital asset balances for the fiscal year ended June 30, 2018, are reflected in the following table (inthousands):
Governmental ActivitiesBeginningBalance Increases (1) Decreases (1)
EndingBalance
Capital assets not being depreciated:Land $ 694,036 $ 25,847 $ (800) $ 719,083Construction work in progress 835,991 337,733 (246,647) 927,077Easements 181,017 11,570 — 192,587Museum and art (2) 84,581 859 — 85,440Other (2) 28,889 393 — 29,282
Total capital assets not being depreciated 1,824,514 376,402 (247,447) 1,953,469
Capital assets being depreciated:Infrastructure 5,273,579 273,138 (116,767) 5,429,950Land improvements 62,272 3,236 — 65,508Buildings/improvements 600,939 8,904 (18,549) 591,294Equipment 379,018 31,349 (12,864) 397,503Easements - amortized 1,523 — (73) 1,450Other 7,197 246 (2,041) 5,402
Total capital assets being depreciated 6,324,528 316,873 (150,294) 6,491,107
Less accumulated depreciation for:Infrastructure (1,546,498) (177,612) 108,261 (1,615,849)Land improvements (27,623) (2,984) 176 (30,431)Buildings/improvements (374,600) (19,762) 10,927 (383,435)Equipment (239,325) (22,155) 7,856 (253,624)Other (5,825) (226) 2,009 (4,042)
Total accumulated depreciation (2,193,871) (222,739) 129,229 (2,287,381)
Total capital assets being depreciated, net 4,130,657 94,134 (21,065) 4,203,726
Intangible assets 36,793 10,410 (13,705) 33,498
Governmental activities capital assets, net $ 5,991,964 $ 480,946 $ (282,217) $ 6,190,693
(1) The increases and decreases noted above include adjustments related to prior periods and correction of errors.(2) The restatement of beginning balance from museum and art to other is due to a correction of prior period reclassification.
B-71

Business-type ActivitiesBeginningBalance Increases (1) Decreases (1)
EndingBalance
Capital assets not being depreciated:Land $ 800 $ — $ — $ 800Construction work in progress 4,615 3,375 (199) 7,791Other 4,309 10 (68) 4,251
Total capital assets not being depreciated 9,724 3,385 (267) 12,842
Capital assets being depreciated:Infrastructure 1,175 — — 1,175Land improvements 3,830 — — 3,830Buildings/improvements 10,123 23 — 10,146Equipment 9,375 309 (138) 9,546
Total capital assets being depreciated 24,503 332 (138) 24,697
Less accumulated depreciation for: Infrastructure (708) (19) — (727)Land improvements (1,766) (149) — (1,915)Buildings/improvements (6,185) (318) — (6,503)Equipment (6,362) (552) 69 (6,845)
Total accumulated depreciation (15,021) (1,038) 69 (15,990)
Total capital assets being depreciated, net 9,482 (706) (69) 8,707
Intangible assets 194 — (116) 78
Business-type activities capital assets, net $ 19,400 $ 2,679 $ (452) $ 21,627
(1) The increases and decreases noted above include adjustments related to prior periods and corrections of errors.
Depreciation expense was charged to governmental functions as follows (in thousands):Depreciation (2)
General government $ 8,248Public safety 7,474Transportation, including depreciation of the highway system maintained by the State 180,824Health and human services 2,768Education 253Natural resources, including depreciation of the state's dams 10,466Depreciation on capital assets held by the internal service funds 12,706
Total depreciation expense – Governmental Activities $ 222,739
Depreciation expense was charged to business-type activities as follows (in thousands):Depreciation (2)
Liquor Stores $ 142State Lottery 51Prison Funds 559West Yellowstone Airport 233Other Enterprise Funds 53
Total depreciation expense – Business-type Activities $ 1,038
(2) Depreciation expenses noted above include adjustments related to prior periods and correction of errors.
B-72

NOTE 6. RETIREMENT PLANS
A. General
The funding policies for each plan provide for periodic employee, employer, and State of Montana (State) nonemployercontributions at rates specified by state law. An actuary determines the actuarial implications of the funding requirementin an annual actuarial valuation. The actuarial method used to determine the implications of the statutory funding levelis the Entry Age Actuarial Cost Method, with both normal cost and amortization of the unfunded actuarial liabilitydetermined as a level percentage of payrolls. Benefits are established by state law and can only be amended by theLegislature.
Montana State Fund, a discretely presented component of the State, by statute, prepares separately issued financialstatements on a calendar year-end basis. Due to the difference in reporting period, there will be a variance between thenote disclosures and the financial statements for some pension related items.
Public Employees’ Retirement Board
The Public Employees’ Retirement Board (PERB) oversees eight defined benefit plans: Public Employees’ RetirementSystem-Defined Benefit Retirement Plan (PERS-DBRP); Judges’ Retirement System (JRS); Highway Patrol Officers’Retirement System (HPORS); Sheriffs’ Retirement System (SRS); Game Wardens’ and Peace Officers’ RetirementSystem (GWPORS); Municipal Police Officers’ Retirement System (MPORS); Firefighters’ Unified Retirement System(FURS); and Volunteer Firefighters’ Compensation Act (VFCA). The PERB also oversees two defined contributionplans: Public Employees’ Retirement System-Defined Contribution Retirement Plan (PERS-DCRP) and the 457-Deferred Compensation Plan (457 Plan). The PERB also oversees education funds related to the pension plans. All ofthe benefit plans, defined benefit and defined contribution, are administered by the Montana Public Employees’Retirement Administration (MPERA). Separately issued financial statements and actuarial reports can be obtained at100 North Park, Suite 200, PO Box 200131, Helena, MT 59620-0131. The financial statements and the latest actuarialvaluation may also be attained here: http://mpera.mt.gov/. The financial statements for the PERS-DBRP includeactivity for the defined benefit plan and the associated education fund. The PERS-DCRP financial statements includeactivity for the defined contribution plan and the associated education fund.
The PERB is an independent, seven-member board, appointed by the Governor. The members are assigned five-year,staggered terms. The PERB consists of two members at large, two active defined benefit public employees, one activedefined contribution public employee, one member experienced in investments, and one retired public employee. ThePERB approves the annual operating budget, developed by MPERA management, before the beginning of the fiscalyear. As governed by statute, the PERB’s defined benefit administrative expenses may not exceed 1.5% of the totaldefined benefit plan retirement benefits paid. In addition, the PERB decides legislative policy and priorities, hires theexecutive director, establishes the policies and procedures that govern operations at MPERA, and hear and rule onappeal matters of disabilities, retirees, and members. PERB members do not receive compensation for their service tothe MPERA, but are reimbursed for necessary expenses incurred while serving.
All defined benefit pension plans provide retirement, disability, and death benefits to the plan members and theirbeneficiaries. The PERS-DCRP Disability OPEB Plan provides a defined benefit for disabled members of the PERS-DCRP. Beneficiaries do not receive disability benefits but may attain retirement benefits from the PERS-DCRP. Asummary of the plan eligibility and benefits are found in the Summary of Benefits sections throughout Note 6.
Teachers’ Retirement System
The Teachers’ Retirement System (TRS) is a defined benefit plan administered by the Teachers Retirement Board(TRB). The plan prepares a publicly issued comprehensive annual financial report that includes financial statementsand required supplementary information for TRS. Separately issued financial statements, actuarial valuations andexperience studies can be obtained at 1500 East Sixth Avenue, PO Box 200139, Helena, MT 59620-0319; or can befound online at https://trs.mt.gov/.
The TRB consists of six members, all of which are appointed by the Governor. Three TRB members must be teachingprofessionals who, when appointed, are active members of TRS; at least one of them must be an active classroomteacher. One TRB member must be a retired teacher who was a member of TRS at the time of retirement. Two TRB
B-73

members are appointed from the public at large. TRB members serve staggered five-year terms. Three TRB membersconstitutes a quorum.
A summary of the number of participating employer and nonemployer contributing entities as of June 30, 2018, follows:
Classification of Participant GWPORSPERS-DBRP
PERS-DCRP SRS MPORS FURS VFCA TRS
Employer 7 544 316 57 33 27 235 365Nonemployer contributing entity — 1 — — 1 1 1 1
Total Participants 7 545 316 57 34 28 236 366
There are approximately 700 State employees who are eligible to participate in defined benefit pension plans, otherthan the plans listed above.
B. Summary of Significant Accounting Policies
The MPERA prepares its financial statements using the accrual basis of accounting. For the purposes of measuring thenet pension liability, deferred inflows of resources and deferred outflows of resources related to pensions, pensionexpense, information about the fiduciary net position, and additions to/deductions from fiduciary net position, the itemshave been determined on the same accrual basis as they are reported by the MPERA. For this purpose, membercontributions are recognized in the period in which contributions are due. Employer contributions are recognized whendue and the employer has made a formal commitment to provide the contributions. Revenues are recognized in theaccounting period they are earned and become measurable. Benefit payments and refunds are recognized in theaccounting period when due and payable in accordance with the benefit terms. Expenses are recognized in the periodincurred. Investments are reported at fair value. The MPERA adheres to all applicable Governmental AccountingStandards Board (GASB) statements.
The TRS prepares its financial statements using the accrual basis of accounting. For the purposes of measuring the netpension liability, deferred inflows of resources and deferred outflows of resources related to pensions, pension expense,information about the fiduciary net position of the TRS, and additions to/deductions from TRS’s fiduciary net position,the items have been determined on the same accrual basis as they are reported by the TRS. For this purpose, plancontributions are recognized as of employer payroll paid dates. Benefit payments and refunds are recognized whendue and payable in accordance with the benefit terms. Investments are reported at fair value. The TRS adheres to allapplicable GASB statements.
The pension trust fund financial statements presented in this report are prepared using the accrual basis of accountingin the same manner as that described for the pension plan administrators above.
B-74

C. Public Employee Defined Benefit Retirement Plan
A summary of classes of members in JRS, HPORS, GWPORS, PERS-DBRP, SRS, MPORS, FURS, VFCA, TRS,PERS-DCRP, and 457-Deferred Compensation covered by benefit terms at June 30, 2018, follows:
Type of Plan for ReportingPurposes
Single-Employer DefinedBenefit Multi-Employer Defined Benefit
Multi-EmployerDefined
Contribution
Plan Designation JRS HPORS(1) GWPORS PERS-
DBRP(2) SRS MPORS(1) FURS VFCA TRS PERS-
DCRP 457-DC
Classification of Member Active 55 233 1,010 28,646 1,429 787 691 2,029 19,267 2,690 4,904Inactive entitled to, but not yet
receiving, benefits or arefund:
Vested 3 14 123 3,793 129 78 41 815 1,772 559 4,484Nonvested 1 23 382 17,973 539 153 66 — 13,967 724 —
Inactive members andbeneficiaries currentlyreceiving benefits:
Service retirements(3) 64 319 298 21,901 629 748 623 1,469 15,933 97 —Disability retirements 1 7 3 158 27 32 9 1 — 8 —Survivor benefits(4) 5 12 11 497 25 32 20 4 — 2 —
Total Membership 129 608 1,827 72,968 2,778 1,830 1,450 4,318 50,939 4,080 9,388
(1) Includes DROP in the Active count.(2) The inactive Nonvested count includes dormant accounts that were previously not counted.(3) Includes "Alternative Payees" and "Death After Retirement" benefit payments. As of Fiscal Year 2018, the TRS plan stopped reporting separate benefit
recipient categories. (4) Includes "Death Before Retirement" benefit payments.
A summary of pension liability, pension assets, net pension liability/(asset), pension expense/(income), deferredoutflows of resources, and deferred inflows of resources by plan and total for the State as an employer entity reportedas of June 30, 2018, based on a June 30, 2017, actuarial valuation, follows with amounts presented in thousands:
SystemEmployer’s TotalPension Liability
Employer’sPension Assets
Employer’s NetPension
Liability/(Asset)
Employer’sPensionExpense/(Income)
Employer'sDeferred
Outflows ofResources
Employer'sDeferred Inflows
of ResourcesJRS $ 60,798 $ 96,653 $ (35,855) (1,291) $ 4,631 $ 1,172HPORS 218,922 140,537 78,385 9,107 13,919 299GWPORS 213,201 175,841 37,360 7,386 14,653 703PERS-DBRP 3,936,327 2,903,127 1,033,200 127,773 230,916 21,056SRS 19,767 16,071 3,696 50 3,404 5,410FURS 11,360 8,835 2,525 458 1,051 19TRS 161,230 113,003 48,227 12,062 29,886 1,820
Totals $ 4,621,605 $ 3,454,067 $ 1,167,538 $ 155,545 $ 298,460 $ 30,479
(1) State as the Single Employer
Judges’ Retirement System – The JRS, administered by the MPERA, is a single-employer defined benefit planestablished in 1967, and governed by Title 19, chapters 2 & 5, MCA (Montana Code Annotated). This plan providesretirement benefits for all Montana judges of the district courts, justices of the Supreme Court, the Chief Water Judge,and the Associate Water Judge. Benefits are established by state law and can only be amended by the Legislature. The
B-75

JRS provides retirement, disability, and death benefits to plan members and their beneficiaries. Benefits are based oneligibility, years of service and compensation. Member rights are vested after five years of service.
Summary of BenefitsMember’s current salary1 or highest average compensation (HAC)2
1Hired prior to July 1, 1997, and non-Guaranteed Annual Benefit Adjustment (GABA) – monthlycompensation at time of retirement;2Hired on or after July 1, 1997, or electing GABA – HAC during any consecutive 36 months;2Hired on or after July 1, 2013 – 110% annual cap on compensation considered as a part of a member’sHAC.
Eligibility for benefitAge 60, 5 years of membership service;Any age with 5 years of membership service – involuntary termination, actuarially reduced.
Vesting5 years of membership service.
Monthly benefit formula3⅓% of current salary1 (non-GABA) or HAC2 (GABA) per year of service credit for the first 15 yearsof service credit, plus 1.785% per year for each year after 15 years.
Guaranteed Annual Benefit Adjustment (GABA)Hired on or after July 1, 1997, or those electing GABA – after the member has completed 12 full monthsof retirement, the member’s benefit increases by a maximum of 3.0% each January, inclusive of all otheradjustments to the member’s benefit.
Minimum benefit adjustment (non-GABA)If hired prior to July 1, 1997, and member did not elect GABA – current salary of an active member insame position is used in the calculation of the monthly benefit each time the Legislature increases salariesfor active judges.
Contributions to the PlanRates are specified by state law for periodic employee and employer contributions. The Legislature has the authorityto establish and amend contribution rates to the plan.
Member contributions to the system – Contributions are deducted from each member’s salary and remittedby the participating employer. An individual account is established for each member’s contributions andinterest allocations until a retirement or refund request is processed. Plan members are required tocontribute 7.0% of the member’s monthly compensation.
Employer contributions to the system – As the employer, the State is required to contribute 25.81% ofa member’s compensation until January 1, 2018, at which time the contribution rate is reduced to 0%.
Actuarial AssumptionsThe total pension liability/(asset) used to calculate the net pension liability/(asset) was determined by an actuarialvaluation as of June 30, 2016, with update procedures used to roll forward the total pension liability/(asset) to June 30,2017. The actuarial assumptions used in the June 30, 2017, valuation were based on the results of the last actuarialexperience study dated May 2017 for the six-year period ended June 30, 2016. There were several significant assumptionsand other inputs used to measure the total pension liability/(asset). Among those assumptions were the following:
• Investment Return 7.65% • Admin Expense as a % of Payroll 0.17%• General Wage Growth 3.50% • Inflation at 2.75%
B-76

• Merit Increases None • Postretirement Benefit Increases – After the member has completed 12 full months of retirement, the member’s
benefit increases by the applicable percentage (provided below) each January, inclusive of other adjustmentsto the member’s benefit:
◦ 3% for members electing GABA or hired on or after July 1, 1997◦ Current salary of an active member in the same position, if hired prior to July 1, 1997, and
not electing GABA• Mortality assumptions among contributing members, terminated vested members, service retired members
and beneficiaries are based on RP 2000 Combined Employee and Annuitant Mortality Tables projected to2020 using Scale BB, set back one year for males.
• Mortality assumptions among Disabled Retirees are based on RP 2000 Combined Employee and AnnuitantMortality Tables.
Discount RateThe discount rate used to measure the total pension asset was 7.65%. The projection of cash flows used to determinethe discount rate assumed that contributions from participating plan members and employers will be made based onthe PERB’s funding policy, which establishes the contractually required rates under MCA. Based on those assumptions,the JRS’s fiduciary net position was projected to be adequate to make all the projected future benefit payments ofcurrent plan members through the year 2103. Therefore, the long-term expected rate of return on pension planinvestments was applied to all periods of projected benefit payments to determine the total pension asset. A municipalbond rate was not incorporated in the discount rate.
Target AllocationsThe long-term expected return on pension plan assets is reviewed as part of the regular experience study prepared for the JRS. The most recent analysis, performed for the six-year period ended June 30, 2016, is outlined in a report datedMay 2017, and can be located on the MPERA website. The long-term expected rate of return on pension plan investmentswas determined by considering information from various sources, including historical rates of return, rate of returnassumptions adopted by similar public pension systems, and by using a building-block method in which best-estimateranges of expected future real rates of return (expected returns, net of pension plan investment and inflation) aredeveloped for each major asset class. These ranges were combined to produce the long-term expected rate of returnby weighing the expected future real rates of return by the target asset allocation percentage and by adding expectedinflation. Best estimates of the arithmetic real rates of return for each major asset class included in the JRS’s targetasset allocation as of June 30, 2017, is summarized in the table that follows:
Asset ClassTarget Asset
AllocationLong-term ExpectedReal Rate of Return
Cash Equivalents 2.60% 4.00%Domestic Equity 36.00% 4.55%Foreign Equity 18.00% 6.35%Fixed Income 23.40% 1.00%Private Equity 12.00% 7.75%Real Estate 8.00% 4.00%
Sensitivity AnalysisIn accordance with GASB 68 regarding the disclosure of the sensitivity of the net pension liability/(asset) to changesin the discount rate, the table below presents the net pension liability/(asset) calculated using the discount rate of 7.65%,as well as what the net pension liability/(asset) would be if it were calculated using a discount rate that is 1.00% lower(6.65%) or 1.00% higher (8.65%) than the current rate.
B-77

(in thousands)1.0% Decrease
(6.65%)Current
Discount Rate1.0% Increase
(8.65%)JRS Net Pension (Asset) $ (29,908) $ (35,855) $ (40,986)
Net Pension AssetIn accordance with GASB 68, employers are required to recognize and report certain amounts associated with theirparticipation in the JRS. GASB 68 became effective June 30, 2015, and includes requirements for participants to recordand report their proportionate share of the collective net pension asset (NPA), pension expense, deferred inflows ofresources and deferred outflows of resources associated with pensions.
(dollars presented in thousands)Net Pension Liability(Asset) as of 6/30/16
Net Pension Liability(Asset) as of 6/30/17
Percent ofCollective NPA
Employer’s Proportionate Share $ (33,852) $ (35,855) 100%
At June 30, 2018, the employer reported a net pension asset of $35.9 million for its proportionate share of the netpension asset. The net pension asset was measured as of June 30, 2017, and the total pension liability used to calculatethe net pension asset was determined by an actuarial valuation as of June 30, 2016, with update procedures used to rollforward the total pension liability to June 30, 2017. The employer’s proportion of the net pension asset was based onthe employer’s contributions received by JRS during the measurement period July 1, 2016, through June 30, 2017,relative to the total employer contributions received from all of the JRS participating employers.
Changes in actuarial assumptions and methods: The following changes in assumptions were identified:1. The discount rate was lowered from 7.75% to 7.65%2. The inflation rate was reduced from 3.00% to 2.75%3. The wage inflation rate was reduced from 4.00% to 3.50%4. The non-disabled mortality assumption was updated
Changes in benefit terms: The following changes to plan provisions were identified:1. Refunds
a. Terminating members eligible to retire may, in lieu of receiving a monthlyretirement benefit, refund their accumulated contributions in a lump sum.
b. Terminating members with accumulated contributions between $200 and$1,000 who wish to rollover their refund must do so within 90 days oftermination of service.
c. Trust, estates, and charitable organizations listed as beneficiaries are entitled toreceive only a lump sum payment.
2. Interest credited to member accountsa. Effective July 1, 2017, the interest rate credited to member accounts increased
from 0.25% to 0.77%.3. Lump-sum payouts
a. Effective July 1, 2017, lump sum payouts in all systems are limited to themember’s accumulated contributions rather than the present value of themember’s benefit.
Changes in proportionate share: There were no changes between the measurement date of the collectivenet pension asset and the employer’s reporting date that are expected to have a significant effect on theemployer’s proportionate share of the collective net pension asset.
B-78

Other Items Related to and Changes in Net Pension Asset
(in thousands)Total Pension
LiabilityPlan FiduciaryNet Position
Net PensionLiability/(Asset)
Balances at 6/30/2016 $ 53,953 $ 87,805 $ (33,852)Service Costs 1,628 — 1,628Interest 4,044 — 4,044Difference between Expectedand Actual Experience 862 — 862Changes of assumptions 3,865 — 3,865Contributions – employer — 1,800 (1,800)Contributions – member — 488 (488)Net Investment Income — 10,368 (10,368)Benefit Payments (3,554) (3,554) —Administrative Expense — (254) 254Net Changes 6,845 8,848 (2,003)
Balances at 6/30/2017 $ 60,798 $ 96,653 $ (35,855)
Pension ExpenseAt June 30, 2018, the employer recognized pension expense/(income) of $(1.3) million for the JRS.
Deferred Outflows and InflowsAt June 30, 2018, the employer recognized a beginning deferred outflow of resources for fiscal year 2017 contributionsof $1.8 million.
As of the fiscal year ended June 30, 2018, remaining deferred outflows of resources and deferred inflows of resourcesrelated to the JRS are from the following sources:
(in thousands)Deferred Outflows
of ResourcesDeferred Inflows
of ResourcesNet Difference between projected and actual
earnings on pension plan investments $ — $ 243Changes of assumptions 2,899 —Differences between expected and actual
experience 647 929Contributions paid to JRS subsequent to the
measurement date – FY 2018 Contributions 1,085 —Totals $ 4,631 $ 1,172
Amounts reported as deferred outflows of resources related to pensions resulting from the employer’s contributionsmade subsequent to the June 30, 2017, measurement date will be recognized as a reduction of the net pension liabilityin the fiscal year ended June 30, 2019.
B-79

Other amounts reported as deferred outflows of resources and deferred inflows of resources related to pensions will berecognized in pension expense as follows:
(in thousands)
Year ended June 30:
Amount recognized in PensionExpense as an increase or
(decrease) to Pension Expense2019 $ 162020 1,6382021 1,4432022 (723)2023 —Thereafter —
Highway Patrol Officers’ Retirement System – The HPORS, administered by the MPERA, is a single-employerdefined benefit plan established in July 1, 1945, and governed by Title 19, chapters 2 & 6, MCA. This plan providesretirement benefits to all members of the Montana Highway Patrol, including supervisory personnel. Benefits areestablished by state law and can only be amended by the Legislature. The HPORS provides retirement, disability, anddeath benefits to plan members and their statutory beneficiaries. Benefits are based on eligibility, years of service, andhighest average compensation. Member rights for death and disability are vested immediately. All other member rightsare vested after 5 or 10 years of service.
Section 19-6-709, MCA provides eligible members retired prior to July 1, 1991, or their survivors, an annualsupplemental lump-sum payment distributed each September. This lump-sum payment is funded by a statutoryappropriation requested by the PERB from the General Fund. Factors impacting eligibility include the number of yearsthe recipient has received a service retirement or disability benefit, the recipient’s age, and whether the recipient isemployed in a position covered by a retirement system under Title 19, MCA.
Deferred Retirement Option Plan (DROP)Beginning October 1, 2015, eligible members of HPORS can participate in the DROP by filing a one-time irrevocableelection with the PERB. The DROP is governed by Title 19, Chapter 6, Part 10, MCA. A member must have completedat least twenty years of membership service to be eligible. They may elect to participate in the DROP for a minimumof one month and a maximum of 60 months and may only participate in the DROP once. A participant remains a memberof the HPORS, but will not receive membership service or service credit in the system for the duration of the member’sDROP period. During participation in the DROP, all mandatory employer contributions continue to the retirementsystem; mandatory employee contributions are deposited to the members DROP account. A monthly benefit is calculatedbased on salary and years of service to date as of the beginning of the DROP period. The monthly benefit is paid intothe member’s DROP account until the end of the DROP period. At the end of the DROP period, the participant mayreceive the balance of the DROP account in a lump-sum payment or in a direct rollover to another eligible plan, asallowed by the IRS. If the participant continues employment after the DROP period ends, they will again accruemembership service and service credit. The DROP account cannot be distributed until employment is formallyterminated. The balance held by MPERA for HPORS DROP participants as of June 30, 2018, was approximately $1.2million.
Summary of Benefits Member’s highest average compensation (HAC)Hired prior to July 1, 2013 – HAC during any consecutive 36 months;Hired on or after July 1, 2013 – 110% annual cap on compensation considered as a part of a member’sHAC.
Eligibility for benefit20 years of membership service, regardless of age.
Early RetirementHired prior to July 1, 2013 – 5 years of membership service, actuarially reduced from age 60.
B-80

Hired on or after July 1, 2013 – 10 years of membership service, actuarially reduced from age 60.
VestingHired prior to July 1, 2013 – 5 years of membership service.Hired on or after July 1, 2013 – 10 years of membership service.
Monthly benefit formulaRetire prior to July 1, 2013 – 2.5% of HAC per year of service credit.Retire on or after July 1, 2013 – 2.6% of HAC per year of service credit.
Guaranteed Annual Benefit Adjustment (GABA)Hired on or after July 1, 1997, or those electing GABA – after the member has completed 12 full monthsof retirement, the member’s benefit increases by a maximum of 3.0% each January, inclusive of all otheradjustments to the member’s benefit.
Hired on or after July 1, 2013 – after the member has completed 36 full months of retirement, themember’s benefit increase by a maximum of 1.5% each January, inclusive of all other adjustments tothe member’s benefit.
Minimum Monthly Benefit (non-GABA)If hired prior to July 1, 1997, and member did not elect GABA – the minimum monthly benefit is equalto 2% of the service credit multiplied by the current base compensation of a probationary highway patrolofficer. Any annual increase is limited to 5.0% over the current benefit and may not exceed 60% of thecurrent base salary of a probationary officer.
Contributions to the PlanRates are specified by state law for periodic employee and employer contributions. The Legislature has the authorityto establish and amend contribution rates to the plan.
Member contributions to the system – Contributions are deducted from each member’s salary andremitted by participating employer. Hired prior to July 1, 1997, and not electing GABA – Plan members are required to contribute 13.00%.Hired after June 30, 1997, and electing GABA – Plan members are required to contribute 13.05%.
Employer contributions to the system – As the employer, the State is required to contribute 38.33% ofa member’s compensation. The first 28.15% is payable from the same sources used to pay a member’scompensation. The remaining amount, equal to 10.18%, is payable from the General Fund through astatutory appropriation.
Actuarial AssumptionsThe total pension liability used to calculate the net pension liability was determined by an actuarial valuation as of June30, 2016, with update procedures used to roll forward the total pension liability to June 30, 2017. The actuarialassumptions used in the June 30, 2017, valuation were based on the results of the last actuarial experience study, datedMay 2017 for the six-year period ended June 30, 2016. There were several significant assumptions and other inputsused to measure the total pension liability. Among those assumptions were the following:
• Investment Return 7.65%• Administrative Expense as a % of Payroll 0.28%• General Wage Growth 3.50%• Inflation at 2.75%• Merit Increases 0 to 6.30%• Postretirement Benefit Increases – After the member has completed 12 full months of retirement, the member’s
benefit increases by the applicable percentage each January, inclusive of other adjustments to the member’sbenefit:
◦ If electing GABA or hired on or after July 1, 1997 – 3.00%◦ Hired on or after July 1, 2013 – 1.50%
B-81

◦ Minimum Benefit Adjustment – Limited to 5% over the current benefit and may not exceed60% of a newly confirmed officer
• Mortality assumptions among contributing members, terminated vested members, service retired membersand beneficiaries are based on RP 2000 Combined Employee and Annuitant Mortality Tables projected to2020 using Scale BB, set back one year for males.
• Mortality assumptions among Disabled Retirees are based on RP 2000 Combined Employee and AnnuitantMortality Tables.
Discount RateThe discount rate used to measure the total pension asset was 7.65%. The projection of cash flows used to determinethe discount rate assumed that contributions from participating plan members and employers will be made based onthe PERB’s funding policy, which establishes the contractually required rates under MCA. The State contributes 10.18%of salaries paid by employers, however, this is considered an employer contribution since HPORS is a single-employerplan and the State is the only employer. Based on those assumptions, the HPORS’s fiduciary net position was projectedto be adequate to make all the projected future benefit payments of current plan members through the year 2124.Therefore, the long-term expected rate of return on pension plan investments was applied to all periods of projectedbenefit payments to determine the total pension liability. A municipal bond rate was not incorporated in the discountrate.
Target AllocationsThe long-term expected return on pension plan assets is reviewed as part of the regular experience study prepared for the HPORS. The most recent analysis, performed for the six-year period ended June 30, 2016, is outlined in a reportdated May 2017, and can be located on the MPERA website. The long-term expected rate of return on pension planinvestments was determined by considering information from various sources, including historical rates of return, rateof return assumptions adopted by similar public pension systems, and by using a building-block method in which best-estimate ranges of expected future real rates of return (expected returns, net of pension plan investment and inflation)are developed for each major asset class. These ranges were combined to produce the long-term expected rate of returnby weighing the expected future real rates of return by the target asset allocation percentage and by adding expectedinflation. Best estimates of the arithmetic real rates of return for each major asset class included in the HPORS’s targetasset allocation as of June 30, 2017, is summarized in the table that follows:
Asset ClassTarget Asset
AllocationLong-term ExpectedReal Rate of Return
Cash Equivalents 2.60% 4.00%Domestic Equity 36.00% 4.55%Foreign Equity 18.00% 6.35%Fixed Income 23.40% 1.00%Private Equity 12.00% 7.75%Real Estate 8.00% 4.00%
Sensitivity AnalysisIn accordance with GASB 68 regarding the disclosure of the sensitivity of the net pension liability to changes in thediscount rate, the table below presents the net pension liability calculated using the discount rate of 7.65%, as well aswhat the net pension liability would be if it were calculated using a discount rate that is 1.00% lower (6.65%) or 1.00%higher (8.65%) than the current rate.
(in thousands)1.0% Decrease
(6.65%)Current
Discount Rate1.0% Increase
(8.65%)HPORS Net Pension Liability $ 108,542 $ 78,385 $ 53,937
Net Pension LiabilityIn accordance with GASB 68, employers are required to recognize and report certain amounts associated with theirparticipation in the HPORS. GASB 68 became effective June 30, 2015, and includes requirements for participants to
B-82
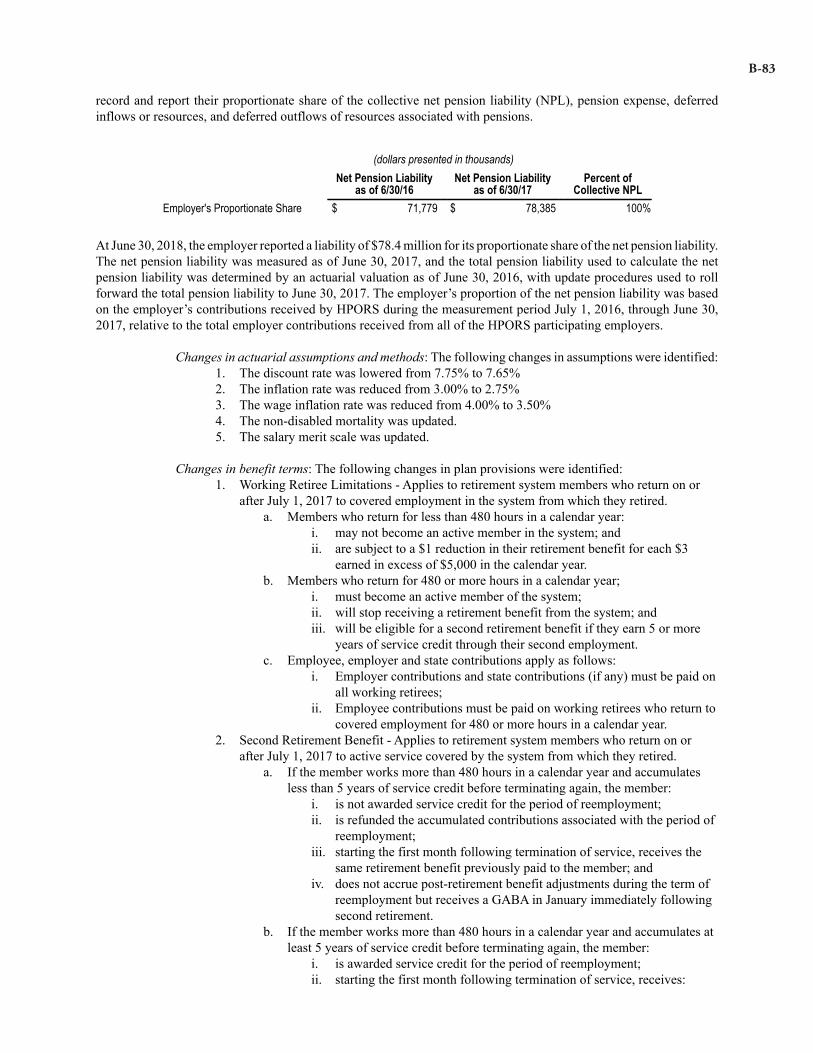
record and report their proportionate share of the collective net pension liability (NPL), pension expense, deferredinflows or resources, and deferred outflows of resources associated with pensions.
(dollars presented in thousands)Net Pension Liability
as of 6/30/16Net Pension Liability
as of 6/30/17Percent of
Collective NPLEmployer's Proportionate Share $ 71,779 $ 78,385 100%
At June 30, 2018, the employer reported a liability of $78.4 million for its proportionate share of the net pension liability.The net pension liability was measured as of June 30, 2017, and the total pension liability used to calculate the netpension liability was determined by an actuarial valuation as of June 30, 2016, with update procedures used to rollforward the total pension liability to June 30, 2017. The employer’s proportion of the net pension liability was basedon the employer’s contributions received by HPORS during the measurement period July 1, 2016, through June 30,2017, relative to the total employer contributions received from all of the HPORS participating employers.
Changes in actuarial assumptions and methods: The following changes in assumptions were identified:1. The discount rate was lowered from 7.75% to 7.65%2. The inflation rate was reduced from 3.00% to 2.75%3. The wage inflation rate was reduced from 4.00% to 3.50%4. The non-disabled mortality was updated.5. The salary merit scale was updated.
Changes in benefit terms: The following changes in plan provisions were identified:1. Working Retiree Limitations - Applies to retirement system members who return on or
after July 1, 2017 to covered employment in the system from which they retired.a. Members who return for less than 480 hours in a calendar year:
i. may not become an active member in the system; andii. are subject to a $1 reduction in their retirement benefit for each $3
earned in excess of $5,000 in the calendar year.b. Members who return for 480 or more hours in a calendar year;
i. must become an active member of the system;ii. will stop receiving a retirement benefit from the system; andiii. will be eligible for a second retirement benefit if they earn 5 or more
years of service credit through their second employment.c. Employee, employer and state contributions apply as follows:
i. Employer contributions and state contributions (if any) must be paid onall working retirees;
ii. Employee contributions must be paid on working retirees who return tocovered employment for 480 or more hours in a calendar year.
2. Second Retirement Benefit - Applies to retirement system members who return on orafter July 1, 2017 to active service covered by the system from which they retired.
a. If the member works more than 480 hours in a calendar year and accumulatesless than 5 years of service credit before terminating again, the member:
i. is not awarded service credit for the period of reemployment;ii. is refunded the accumulated contributions associated with the period of
reemployment;iii. starting the first month following termination of service, receives the
same retirement benefit previously paid to the member; andiv. does not accrue post-retirement benefit adjustments during the term of
reemployment but receives a GABA in January immediately followingsecond retirement.
b. If the member works more than 480 hours in a calendar year and accumulates atleast 5 years of service credit before terminating again, the member:
i. is awarded service credit for the period of reemployment;ii. starting the first month following termination of service, receives:
B-83

1. the same retirement benefit previously paid to the member;and
2. a second retirement benefit for the period of reemploymentcalculated based on the laws in effect as of the member’srehire date; and
iii. does not accrue post-retirement benefit adjustments during the term ofreemployment but receives a GABA:
1. on the initial retirement benefit in January immediatelyfollowing second retirement; and
2. on the second retirement benefit starting in January afterreceiving that benefit for at least 12 months
c. A member who returns to covered service is not eligible for a disability benefit.3. Refunds
a. Terminating members eligible to retire may, in lieu of receiving a monthlyretirement benefit, refund their accumulated contributions in a lump sum.
b. Terminating members with accumulated contributions between $200 and $1,000who wish to rollover their refund must do so within 90 days of termination ofservice.
c. Trusts, estates, and charitable organizations listed as beneficiaries are entitled toreceive only a lump sum payment.
4. Interest credited to member accountsa. Effective July 1, 2017, the interest rate credited to member accounts increased
from 0.25% to 0.77%5. Lump-sum payout
a. Effective July 1, 2017, lump sum payouts in all systems are limited to themember’s accumulated contributions rather than the present value of themember’s benefit.
Changes in proportionate share: There were no changes between the measurement date of the collectivenet pension liability and the employer’s reporting date that are expected to have a significant effect onthe employer’s proportionate share of the collective net pension liability.
Other Items Related to and Changes in Net Pension Liability
(in thousands)Total Pension
LiabilityPlan FiduciaryNet Position
Net PensionLiability
Balances at 6/30/2016 $ 200,752 $ 128,973 $ 71,779Service Costs 3,665 — 3,665Interest 15,121 — 15,121Difference expected and actual
experience 2,774 — 2,774Changes in assumptions 7,892 — 7,892Contributions – employer — 5,782 (5,782)Contributions – non-employer — 263 (263)Contributions – member — 1,950 (1,950)Net Investment Income — 15,099 (15,099)Refund of Contributions (245) (245) —Benefit Payments (11,037) (11,037) —Administrative Expense — (248) 248Net Changes 18,170 11,564 6,606
Balances at 6/30/2017 $ 218,922 $ 140,537 $ 78,385
B-84

Pension ExpenseAt June 30, 2018, the employer recognized pension expense of 9.1 million for the HPORS.
Deferred Outflows and InflowsAt June 30, 2018, the employer recognized a beginning deferred outflow of resources for fiscal year 2017 contributionsof $5.7 million.
As of the fiscal year ended June 30, 2018, remaining deferred outflows of resources related to the HPORS are fromthe following sources:
(in thousands)Deferred Outflows
of ResourcesDeferred Inflows of
ResourcesDifference between expected and actual experience $ 2,156 $ —
Changes of assumptions 5,920 —Net difference between projected and actual
earnings on pension plan investments — 299Contributions paid to HPORS subsequent to the
measurement date – FY 2018 Contributions 5,843 —Totals $ 13,919 $ 299
Amounts reported as deferred outflows of resources related to pensions resulting from the employer’s contributionsmade subsequent to the June 30, 2017, measurement date will be recognized as a reduction of the net pension liabilityin the fiscal year ended June 30, 2019.
Other amounts reported as deferred outflows of resources and deferred inflows of resources related to pensions will berecognized in pension expense as follows:
(in thousands)
Year endedJune 30:
Amount recognized in PensionExpense as an increase or(decrease) to Pension Expense
2019 $ 1,8812020 3,8672021 3,0772022 (1,048)2023 —Thereafter —
Game Wardens’ & Peace Officers’ Retirement System – The GWPORS, administered by the MPERA, is a multi-employer, cost-sharing defined benefit plan established in 1963, and governed by Title 19, chapters 2 & 8, MCA. Thisplan provides retirement benefits to all persons employed as a game warden, warden supervisory personnel, or statepeace officer. Benefits are established by state law and can only be amended by the Legislature. The GWPORS providesretirement, disability and death benefits to plan members and their beneficiaries. Benefits are based on eligibility, yearsof service and highest average compensation.
The State of Montana and its discretely presented component units are the only employers who participate in theGWPORS. Therefore, while the plan is considered to be a multi-employer, cost-sharing defined benefit plan for actuarialvaluation purposes, in accordance with GASB 68, the plan is treated as if it were a single-employer defined benefitpension plan type for financial reporting.
B-85

Summary of BenefitsMember’s highest average compensation (HAC)Hired prior to July 1, 2011 – highest average compensation during any consecutive 36 months; Hired on or after July 1, 2011 – highest average compensation during any consecutive 60 months; Hired on or after July 1, 2013 – 110% annual cap on compensation considered as a part of a member’sHAC.
Eligibility for benefit Service RetirementAge 50, 20 years of membership service.
Early Retirement (reduced benefit) Age 55, vested members who terminate employment prior to 20 years of membership service.
Vesting 5 years of membership service.
Monthly benefit formula 2.5% of HAC per year of service credit.
Guaranteed Annual Benefit Adjustment (GABA) After the member has completed 12 full months of retirement, the member’s benefit increases by theapplicable percentage (provided below) each January, inclusive of all other adjustments to the member’sbenefit:
◦ 3.0% for members hired prior to July 1, 2007 ◦ 1.5% for members hired on or after July 1, 2007
Contributions to the PlanRates are specified by state law for periodic employee and employer contributions. The Legislature has the authorityto establish and amend contribution rates to the plan.
Member contributions to the system – Contributions are deducted from each member’s salary andremitted by participating employers. Plan members are required to contribute 10.56% of member’scompensation.
Employer contributions to the system – State agency and university employers are required to contribute9.0% of a member’s compensation.
Actuarial AssumptionsThe total pension liability used to calculate the net pension liability was determined by an actuarial valuation as of June30, 2016, with update procedures used to roll forward the total pension liability to June 30, 2017. The actuarialassumptions used in the June 30, 2017, valuation were based on the results of the last actuarial experience study, datedMay 2017 for the six-year period ended June 30, 2016. There were several significant assumptions and other inputsused to measure the total pension liability. Among those assumptions were the following:
• Investment Return 7.65% • Admin Expense as a % of payroll 0.17%• General Wage Growth 3.50% • Inflation at 2.75%• Merit Increases 0% to 6.30%
B-86

• Postretirement Benefit Increases – After the member has completed 12 full months of retirement, the member’sbenefit increases by the applicable percentage each January, inclusive of other adjustments to the member’sbenefit:
◦ 3.00% for members hired prior to July 1, 2007 ◦ 1.50% for members hired on or after July 1, 2007
• Mortality assumptions among contributing members, terminated vested members, service retired membersand beneficiaries are based on RP 2000 Combined Employee and Annuitant Mortality Tables projected to2020 using Scale BB, set back one year for males.
• Mortality assumptions among Disabled Retirees are based on RP 2000 Combined Employee and AnnuitantMortality Tables.
Discount RateThe discount rate used to measure the total pension asset was 7.65%. The projection of cash flows used to determinethe discount rate assumed that contributions from participating plan members and employers will be made based onthe PERB’s funding policy, which establishes the contractually required rates under MCA. Based on those assumptions,the GWPORS’s fiduciary net position was projected to be adequate to make all the projected future benefit paymentsof current plan members through the year 2117. Therefore, the long-term expected rate of return on pension planinvestments was applied to all periods of projected benefit payments to determine the total pension liability. A municipalbond rate was not incorporated in the discount rate.
Target AllocationsThe long-term expected return on pension plan assets is reviewed as part of the regular experience study prepared for the GWPORS. The most recent analysis, performed for the six-year period ended June 30, 2016, is outlined in a reportdated May 2017, and can be located on the MPERA website. The long-term expected rate of return on pension planinvestments was determined by considering information from various sources, including historical rates of return, rateof return assumptions adopted by similar public pension systems, and by using a building-block method in which best-estimate ranges of expected future real rates of return (expected returns, net of pension plan investment and inflation)are developed for each major asset class. These ranges were combined to produce the long-term expected rate of returnby weighing the expected future real rates of return by the target asset allocation percentage and by adding expectedinflation. Best estimates of the arithmetic real rates of return for each major asset class included in the GWPORS’starget asset allocation as of June 30, 2017, is summarized in the table that follows:
Asset ClassTarget Asset
AllocationLong-term ExpectedReal Rate of Return
Cash Equivalents 2.60% 4.00%Domestic Equity 36.00% 4.55%Foreign Equity 18.00% 6.35%Fixed Income 23.40% 1.00%Private Equity 12.00% 7.75%Real Estate 8.00% 4.00%
B-87

Sensitivity AnalysisIn accordance with GASB 68 regarding the disclosure of the sensitivity of the net pension liability to changes in thediscount rate, the table below presents the net pension liability calculated using the discount rate of 7.65%, as well aswhat the net pension liability would be if it were calculated using a discount rate that is 1.00% lower (6.65%) or 1.00%higher (8.65%) than the current rate.
(in thousands)1.0%
Decrease(6.65%)
CurrentDiscount Rate
1.0% Increase(8.65%)
Primary Government GWPORS Net Pension Liability $ 66,423 $ 35,297 $ 10,179Discretely Presented Component Units GWPORS Net
Pension Liability 3,632 2,063 557Total Employer GWPORS Net Pension Liability $ 70,055 $ 37,360 $ 10,736
Net Pension LiabilityIn accordance with GASB 68, employers are required to recognize and report certain amounts associated with theirparticipation in the GWPORS. Statement 68 became effective June 30, 2015, and includes requirements for participantsto record and report their proportionate share of the collective net pension liability (NPL), pension expense, deferredinflows of resources and deferred outflows of resources associated with pensions.
(dollars presented in thousands)Net Pension
Liability as of 6/30/16
Net PensionLiability
as of 6/30/17Percent of
Collective NPLPrimary Government Employer Proportionate Share $ 31,020 $ 35,297 94.815012%Discretely Presented Component Unit Share 1,829 2,063 5.184988%
Total Employer GWPORS Proportionate Share $ 32,849 $ 37,360 100%
At June 30, 2018, the employer reported a total liability of $37.4 million for its proportionate share of the net pensionliability. The net pension liability was measured as of June 30, 2017, and the total pension liability used to calculatethe net pension liability was determined by an actuarial valuation as of June 30, 2016, with update procedures used toroll forward the total pension liability to June 30, 2017. The employer’s proportion of the net pension liability wasbased on the employer’s contributions received by GWPORS during the measurement period July 1, 2016, throughJune 30, 2017, relative to the total employer contributions received from all of GWPORS participating employers.
Changes in actuarial assumptions and methods: The following changes in assumptions were identified:1. The discount rate was lowered from 7.75% to 7.65%2. The inflation rate was reduced from 3.00% to 2.75%3. The wage inflation rate was reduced from 4.00% to 3.50%4. The non-disabled mortality and withdrawal assumptions were updated.5. The salary merit scale was updated.
The following changes in method was identified:1. Administrative expenses are recognized by an additional amount added to the normal cost contribution
rate for the plan. This amount will vary from year to year based on the prior year's actual expense.2. For consistency in changes of the base wage growth, the payroll growth assumption as a level percent
of pay was reduced from 4.00% to 3.50%.
Changes in benefit terms: The following changes in plan terms were identified:1. Working Retiree Limitation applies to retirement system members who return on or
after July 1, 2017, to covered employment in the system from which they retired.2. Second Retirement Benefit applies to retirement system members who return on or after July 1, 2017,
to active service covered by the system from which they retired.
B-88

3. Beneficiaries of GWPORS members who die prior to retirement are eligible for either a lump-sumbenefit or a monthly survivor benefit. The monthly survivor benefit may be paid out as an option 1,2, 3 or 4, at the survivor’s discretion. Previously, statute provided for lump-sum payments only.
4. Refundsa. Terminating members eligible to retire may, in lieu of receiving a monthly retirement benefit,
refund their accumulated contributions in a lump sum.b. Terminating members with accumulated contributions between $200 and $1,000 who wish
to rollover their refund must do so within 90 days of termination of service.c. Trusts, estates, and charitable organizations listed as beneficiaries are entitled to receive
only a lump sum payment.5. Interest credited to member accounts increased from 0.25% to 0.77%.6. Lump-sum payouts in all systems are limited to the member’s accumulated contributions rather than
the present value of the member’s benefit.
Changes in proportionate share: Between the measurement date of the collective net pension liability and theemployer’s reporting date there were no changes in proportion that are expected to have a significant effecton the employer’s proportionate share of the collective net pension liability.
Other Items Related to and Changes in Net Pension LiabilityThe State, as the primary government employer, has the following balances and changes related to the GWPORS’s NetPension Liability:
(in thousands)Total Pension
LiabilityPlan FiduciaryNet Position
Net PensionLiability
Balances at 6/30/2016 $ 176,947 $ 145,928 $ 31,019Service Costs 8,176 — 8,176Interest 13,529 — 13,529Difference between Expected
and Actual Experience 3,549 — 3,549Changes in assumptions 5,573 — 5,573Contributions – employer — 4,231 (4,231)Contributions – member — 5,004 (5,004)Net Investment Income — 17,626 (17,626)Benefit Payments (5,508) (5,508) —Administrative Expense — (312) 312Refunds of Contributions (982) (982) —Net Changes 24,337 20,059 4,278
Balances at 6/30/2017 $ 201,284 $ 165,987 $ 35,297
B-89

The State’s discretely presented component units, as employers, have the following balances and changes related tothe GWPORS’s Net Pension Liability:
(in thousands)Total Pension
LiabilityPlan FiduciaryNet Position
Net PensionLiability
Balances at 6/30/2016 $ 10,587 $ 8,757 $ 1,830Service Costs 446 — 446Interest 740 — 740Difference between Expected
and Actual Experience 193 — 193
Changes in assumptions 305 — 305Contributions - employer — 231 (231)Contributions - member — 274 (274)Net Investment Income — 963 (963)Benefit Payments (300) (300) —Administrative Expense — (17) 17Refunds of Contributions (54) (54) —Net Changes 1,330 1,097 233
Balances at 6/30/2017 $ 11,917 $ 9,854 $ 2,063
Pension ExpenseAt June 30, 2018, the employer recognized a total pension expense of $7.4 million for its proportionate share of theGWPORS pension expense: $7.0 million related to the primary government and $361.4 thousand related to componentunits.
Deferred Outflows and InflowsAt June 30, 2018, the State, as a primary government employer, recognized a beginning deferred outflow of resourcesfor fiscal year 2017 contributions of $4.2 million. As of the fiscal year ended June 30, 2018, remaining deferred outflowsof resources and deferred inflows of resources for the primary government, as an employer, related to the GWPORSare from the following sources:
(in thousands)Deferred Outflows
of ResourcesDeferred Inflows
of ResourcesDifference between expected and actual experience $ 4,945 $ —Net difference between projected and actual earnings
on pension plan investments — 514
Changes in assumptions 4,458 —Changes in proportion and differences between
employer contributions and proportionate shareof contributions
162 75
Contributions paid to GWPORS subsequent to themeasurement date – FY 2018 Contributions 4,340 —
Totals $ 13,905 $ 589
Amounts reported as deferred outflows of resources related to pensions resulting from the employer’s contributionsmade subsequent to the June 30, 2017, measurement date will be recognized as a reduction of the net pension liabilityin the fiscal year ended June 30, 2019.
B-90
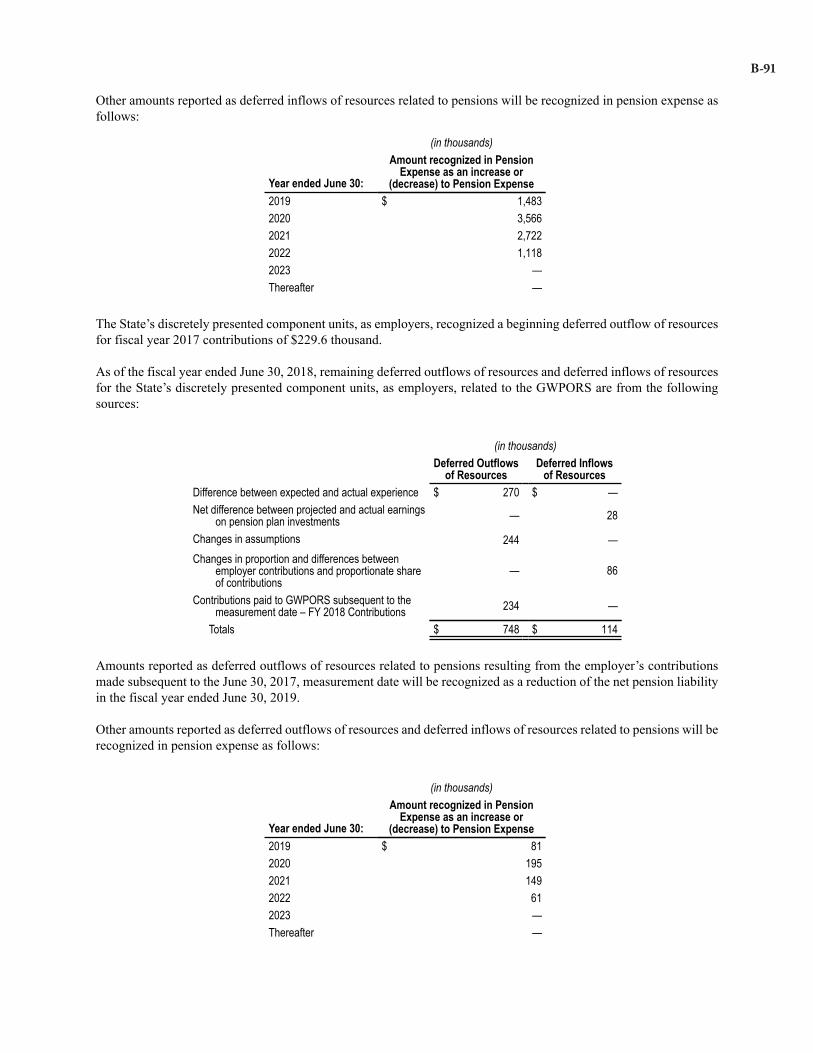
Other amounts reported as deferred inflows of resources related to pensions will be recognized in pension expense asfollows:
(in thousands)
Year ended June 30:
Amount recognized in PensionExpense as an increase or
(decrease) to Pension Expense2019 $ 1,4832020 3,5662021 2,7222022 1,1182023 —Thereafter —
The State’s discretely presented component units, as employers, recognized a beginning deferred outflow of resourcesfor fiscal year 2017 contributions of $229.6 thousand.
As of the fiscal year ended June 30, 2018, remaining deferred outflows of resources and deferred inflows of resourcesfor the State’s discretely presented component units, as employers, related to the GWPORS are from the followingsources:
(in thousands)Deferred Outflows
of ResourcesDeferred Inflows
of ResourcesDifference between expected and actual experience $ 270 $ —Net difference between projected and actual earnings
on pension plan investments — 28
Changes in assumptions 244 —Changes in proportion and differences between
employer contributions and proportionate shareof contributions
— 86
Contributions paid to GWPORS subsequent to themeasurement date – FY 2018 Contributions 234 —
Totals $ 748 $ 114
Amounts reported as deferred outflows of resources related to pensions resulting from the employer’s contributionsmade subsequent to the June 30, 2017, measurement date will be recognized as a reduction of the net pension liabilityin the fiscal year ended June 30, 2019.
Other amounts reported as deferred outflows of resources and deferred inflows of resources related to pensions will berecognized in pension expense as follows:
(in thousands)
Year ended June 30:
Amount recognized in PensionExpense as an increase or
(decrease) to Pension Expense2019 $ 812020 1952021 1492022 612023 —Thereafter —
B-91
(2) State as an Employer and/or a Nonemployer Contributing Entity to Cost-Sharing Multiple-Employer Plans
Public Employees’ Retirement System - Defined Benefit Retirement Plan – The PERS-DBRP, administered by theMPERA, is a multiple-employer, cost-sharing plan established July 1, 1945, and governed by Title 19, Chapters 2 &3, MCA. This plan covers employees of the State and local governments, and certain employees of the MontanaUniversity System and school districts.
All new members are initially members of the PERS-DBRP and have a 12-month window during which they maychoose to remain in the PERS-DBRP or join the Public Employees’ Retirement System-Defined Contribution RetirementPlan (PERS-DCRP) by filing an irrevocable election. Members may not be participants of both the defined contributionand defined benefit retirement plans. All new members from the universities also have a third option to join the universitysystem’s Montana University System-Retirement Program (MUS-RP).
The PERS-DBRP provides retirement, disability, and death benefits to plan members and their beneficiaries. Benefitsare established by state law and can only be amended by the Legislature. Benefits are based on eligibility, years ofservice, and highest average compensation.
Summary of BenefitsMember’s highest average compensation (HAC) Hired prior to July 1, 2011 – HAC during any consecutive 36 months; Hired on or after July 1, 2011 – HAC during any consecutive 60 months; Hired on or after July 1, 2013 – 110% annual cap on compensation considered as a part of a member’sHAC. Eligibility for benefit Service retirement:
Hired prior to July 1, 2011 –Age 60, 5 years of membership service; Age 65, regardless of membership service; or Any age, 30 years of membership service.
Hired on or after July 1, 2011 –Age 65, 5 years of membership service; Age 70, regardless of membership service.
Early retirement, actuarially reduced: Hired prior to July 1, 2011 –Age 50, 5 years of membership service; or Any age, 25 years of membership service.Hired on or after July 1, 2011 – Age 55, 5 years of membership service.
Second retirement (all require retuning to PERS-covered employment or PERS service):Retire before January 1, 2016 and accumulate less than 2 years’ additional service credit or retireon or after January 1, 2016 and accumulate less than 5 years’ additional service credit:
• A refund of member’s contributions from second employment plus regular interest(.77%);
• No service credit for second employment;• Start the same benefit amount the month following termination; and• GABA starts again in the January immediately following second retirement
Retire before January 1, 2016 and accumulate at least 2 years of additional service credit:• A recalculated retirement benefit based on laws in effect at second retirement; and• GABA starts the January after receiving recalculated benefit for 12 months
B-92

Retire on or after January 1, 2016 and accumulate 5 or more years of additional service credit:• The same retirement benefit as prior to their return to service;• A second retirement benefit for second period of service based on laws in effect at
second retirement; • GABA starts on both benefits in the January after receiving the original and new benefit
for 12 months
Vesting 5 years of membership service
Monthly benefit formula Members hired prior to July 1, 2011 –
Less than 25 years of membership service: 1.785% of HAC per year of service credit; 25 years of membership service or more: 2% of HAC per year of service credit.
Members hired on or after July 1, 2011 – Less than 10 years of membership service: 1.5% of HAC per year of service credit; 10 years or more, but less than 30 years of membership service: 1.785% of HAC per year ofservice credit; 30 years or more of membership service: 2% of HAC per year of service credit.
Guaranteed Annual Benefit Adjustment (GABA) – After the member has completed 12 full months ofretirement, the member’s benefit increases by the applicable percentage (provided below) each January,inclusive of other adjustments to the member’s benefit:
◦ 3.0% for members hired prior to July 1, 2007 ◦ 1.5% for members hired between July 1, 2007 and June 30, 2013◦ Members hired on or after July 1, 2013
a. 1.5% for each year PERS is funded at or above 90%;b. 1.5% is reduced by 0.1% for each 2% PERS is funded below 90%; and,c. 0% whenever the amortization period for PERS is 40 years or more.
Contributions to the PlanRates are specified by state law for periodic employee, employer, and nonemployer entity contributions. The Legislaturehas the authority to establish and amend contribution rates to the plan.
Member contributions to the system: Contributions are deducted from each member’s salary and remittedby participating Employers. Plan members are required to contribute 7.90% of member’s compensation.The 7.90% member contribution rate is temporary and will be decreased to 6.9% on January 1 followingactuary valuation results that show the amortization period has dropped below 25 years and would remainbelow 25 years following the reduction of both the additional Employer and additional membercontribution rates.
Employer contributions to the systemState and University System employers are required to contribute 8.57% of member compensation. Local government entities are required to contribution 8.47% of member compensation. School district employers contributed 8.20% of member compensation.
Per the 2013 Legislative Session’s House Bill 454, section 4, effective July 1, 2013, PERS employercontributions temporarily increased 1%. Beginning July 1, 2014, employer contributions will increasean additional 0.1% a year over 10 years, through 2024. The Employer additional contributions includingthe 0.27% added in 2007 and 2009, terminates on January 1 following actuary valuation results thatshow the amortization period of the PERS-DBRP has dropped below 25 years and would remain below25 years following the reductions of both the additional employer and member contributions rates. Asof January 1, 2018, the additional contributions will not be terminated.
B-93

Effective July 1, 2013, employers are required to make contributions on working retirees’ compensation.Member contributions for working retirees are not required.
The portion of employer contributions allocated to the Plan Choice Rate (PCR) are included in theemployer's reporting. The PCR was paid off effective March 2016 and the contributions previouslydirected to the PCR are now directed to member accounts.
Non-Employer Entity Contributions Special Funding
The State contributes 0.1% of member compensation on behalf of local government entities. The State contributes 0.37% of member compensation on behalf of school district entities. The State contributes a portion of Coal Severance Tax income and interest earnings from theCoal Trust Permanent Trust fund. Funding provided for the year ended June 30, 2018, totaled$31.4 million.
Actuarial Assumptions The total pension liability used to calculate the net pension liability was determined by an actuarial valuation as of June30, 2016, with update procedures used to roll forward the total pension liability to June 30, 2017. There were severalsignificant assumptions and other inputs used to measure the total pension liability. The actuarial assumptions used inthe June 30, 2017, valuation were based on the results of the last actuarial experience study, dated May 2017 for thesix-year period ended June 30, 2016. Among those assumptions were the following:
• Investment Return 7.65% • Admin Expense as a % of Payroll 0.26%• General Wage Growth 3.50% • Inflation at 2.75%• Merit Increases 0 to 4.8% • Postretirement Benefit Increases – After the member has completed 12 full months of retirement, the member’s
benefit increases by the applicable percentage each January, inclusive of all other adjustments to the member’sbenefit:
◦ 3.00% for members hired prior to July 1, 2007 ◦ 1.50% for members hired between July 1, 2007 and June 30, 2013◦ Members hired on or after July 1, 2013:
▪ 1.50% for each year PERS is funded at or above 90%▪ 1.50% is reduced by 0.1% for each 2% PERS is funded below 90%; and▪ 0% whenever the amortization period for PERS is 40 years or more
• Mortality assumptions among contributing members, terminated vested members, service retired membersand beneficiaries are based on RP 2000 Combined Employee and Annuitant Mortality Tables projected to2020 using Scale BB, set back one year for males.
• Mortality assumptions among Disabled Retirees are based on RP 2000 Combined Employee and AnnuitantMortality Tables.
B-94

Discount Rate The discount rate used to measure the total pension liability was 7.65%. The projection of cash flows used to determinethe discount rate assumed that contributions from participating plan members, employers, and nonemployer contributingentities will be made based on the PERB’s funding policy, which establishes the contractually required rates underMCA. The State contributes 0.1% of salaries for local governments and 0.37% for school districts. In addition, theState contributes coal severance tax and interest money from the General Fund. The interest is contributed monthlyand the severance tax is contributed quarterly. Based on those assumptions, the PERS-DBRP’s fiduciary net positionwas projected to be adequate to make all the projected future benefit payments of current plan members through theyear 2121. Therefore, the long-term expected rate of return on pension plan investments was applied to all periods ofprojected benefit payments to determine the total pension liability. A municipal bond rate was not incorporated in thediscount rate.
Target Allocations The long-term expected return on pension plan assets is reviewed as part of the regular experience study prepared for the PERS-DBRP. The most recent analysis, performed for the six-year period ended June 30, 2016, is outlined in areport dated May 2017, and can be located on the MPERA website. The long-term expected rate of return on pensionplan investments was determined by considering information from various sources, including historical rates of return,rate of return assumptions adopted by similar public pension systems, and by using a building-block method in whichbest-estimate ranges of expected future real rates of return (expected returns, net of pension plan investment andinflation) are developed for each major asset class. These ranges were combined to produce the long-term expectedrate of return by weighing the expected future real rates of return by the target asset allocation percentage and by addingexpected inflation. Best estimates of the arithmetic real rates of return for each major asset class included in the PERS-DBRP’s target asset allocation as of June 30, 2017, is summarized in the table that follows:
Asset ClassTarget Asset
AllocationLong-term ExpectedReal Rate of Return
Cash Equivalents 2.60% 4.00%Domestic Equity 36.00% 4.55%Foreign Equity 18.00% 6.35%Fixed Income 23.40% 1.00%Private Equity 12.00% 7.75%Real Estate 8.00% 4.00%
Sensitivity AnalysisIn accordance with GASB 68 regarding the disclosure of the sensitivity of the net pension liability (NPL) to changesin the discount rate, the table below presents the net pension liability calculated using the discount rate of 7.65%, aswell as what the net pension liability would be if it were calculated using a discount rate that is 1.00% lower (6.65%)or 1.00% higher (8.65%) than the current rate.
(in thousands)1.0% Decrease
(6.65%)Current
Discount Rate1.0% Increase
(8.65%)State as an Employer in PERS-DBRP – Net
Pension Liability $ 1,504,767 $ 1,033,200 $ 637,355
State as a Nonemployer Contributing Entity toPERS-DBRP – Net Pension Liability 28,577 19,622 12,104
Net Pension LiabilityIn accordance with GASB 68, employers and the nonemployer contributing entities are required to recognize and reportcertain amounts associated with their participation in the PERS-DBRP. GASB 68 became effective June 30, 2015, andincludes requirements for participants to record and report their proportionate share of the collective net pension liability,pension expense, deferred inflows of resources and deferred outflows of resources associated with pensions. Theproportionate shares were determined based on contributions made to the plan by employers and the nonemployer
B-95
contributing entity special funding. The Coal Severance Tax collection and interest amounts were not considered indetermining proportionate shares as this is not a special funding situation component.
In accordance with GASB 68, the PERS-DBRP has a special funding situation where the State is legally responsiblefor making contributions directly to the PERS-DBRP on behalf of the employers. Due to the existence of this specialfunding situation, the State is required to report a proportionate share of a local government or school district’s collectivenet pension liability that is associated with the non-State employer.
The State also has a funding situation that is not considered a special funding situation whereby the General Fundprovides contributions received from the Coal Severance Tax collections and interest accrued on the Coal Tax PermanentTrust Fund. All employers are required to report the portion of Coal Severance Tax and interest attributable to theemployer as a grant revenue.
(dollars presented in thousands)Net Pension
Liability as of6/30/16
Net PensionLiability as of
6/30/17Percent of
Collective NPLState's Proportionate Share as an Employer Entity $ 906,880 $ 1,033,200 53.049189%State's Proportionate Share as a Nonemployer
Contributing Entity 16,287 19,622 1.007464%
State of Montana Totals $ 923,167 $ 1,052,822 54.056653%
At June 30, 2018, the State reported a liability of $1.1 billion for its proportionate share of the net pension liability asan employer and nonemployer contributing entity. The net pension liability was measured as of June 30, 2017, and thetotal pension liability used to calculate the net pension liability was determined by an actuarial valuation as of June 30,2016, with update procedures used to roll forward the total pension liability to June 30, 2017. The proportion of thenet pension liability is based on the employer’s and nonemployer's special funding contributions received by the PERS-DBRP during the measurement period of July 1, 2016, through June 30, 2017, relative to the total employer andnonemployer special funding contributions received from all PERS-DBRP participating employers.
Changes in actuarial assumptions and methods: The following changes in assumptions were identified:1. The discount rate was lowered from 7.75% to 7.65%2. The inflation rate was reduced from 3.00% to 2.75%3. The wage inflation rate was reduced from 4.00% to 3.50%4. The non-disabled mortality and withdrawal assumptions were updated.5. The salary merit scale was updated.6. Decreased administrative expense load from 0.27% to 0.26%.
The following changes in method was identified:1. Administrative expenses are recognized by an additional amount added to the normal cost contribution
rate for the plan. This amount will vary from year to year based on the prior year's actual expense.2. For consistency in changes of the base wage growth, the payroll growth assumption as a level percent
of pay was reduced from 4.00% to 3.50%.
Changes in benefit terms: The following benefit changes were identified:1. Interest credited to member accounts increased from 0.25% to 0.77%.2. Lump-sum payouts in all systems are limited to the member’s accumulated contributions rather than
the present value of the member’s benefit.
Changes in proportionate share: Between the measurement date of the collective net pension liabilityand the employer’s reporting date there were no changes in proportion that would have an effect on theemployer’s proportionate share of the collective net pension liability.
B-96
Employer Pension Expense and Nonemployer Contributing Entity Grant ExpensesAt June 30, 2018, the State as an employer recognized a pension expense of $127.8 million for its proportionate shareof the PERS-DBRP’s pension expense. The State as a nonemployer contributing entity recognized grant expense of$1.0 million for special funding support provided by the General Fund for its proportionate share of the PERS-DBRP’spension expense that is associated with other employer participants in the plan. Total pension related expenses at June30, 2018, were $128.8 million.
Support RevenueAs of the fiscal year ended June 30, 2018, the State as an employer recognized grant revenue of $14.8 million for itsproportionate share of total nonemployer entity contributions from the Coal Severance Tax and interest nonspecialfunding situation.
Deferred Outflows and InflowsAt June 30, 2018, the State as an employer recognized a beginning deferred outflow of resources for fiscal year 2017contributions of $55.6 million.
As of the fiscal year ended June 30, 2018, the State as an employer has the following proportionate shares of the PERS-DBRP’s deferred outflows of resources and deferred inflows of resources from the following sources:
(in thousands)Deferred Outflows
of ResourcesDeferred Inflows
of ResourcesActual versus expected experience $ 25,444 $ 1,495Net difference between projected and actual earnings on
pension plan investments — 6,939
Change of assumptions 141,228 —
Changes in proportion and differences between employercontributions and proportionate share of contributions 9,360 12,622
Contributions paid to PERS-DBRP subsequent to themeasurement date – FY 2018 Contributions 54,884 —
Totals $ 230,916 $ 21,056
Amounts reported as deferred outflows of resources related to pensions resulting from the employer’s contributionsmade subsequent to the June 30, 2017, measurement date will be recognized as a reduction of the net pension liabilityin the fiscal year ended June 30, 2019.
Other amounts reported as deferred outflows of resources and deferred inflows of resources related to pensions will berecognized in pension expense as follows:
(in thousands)
Year ended June 30:
Amount recognized in PensionExpense as an increase or
(decrease) to Pension Expense2019 $ 36,5982020 80,7922021 62,8382022 (21,990)2023 —Thereafter —
At June 30, 2018, the State as a nonemployer contributing entity recognized a beginning deferred outflow of resourcesfor fiscal year 2017 contributions of $28.8 million.
B-97

As of the fiscal year ended June 30, 2018, the State as a nonemployer contributing entity reported its proportionateshare of the PERS-DBRP’s deferred outflows of resources and deferred inflows of resources from the following sources:
(in thousands)Deferred Outflows
of ResourcesDeferred Inflows
of ResourcesActual versus expected experience $ 483 $ 28Net difference between projected and actual earnings
on pension plan investments — 132
Change of assumptions 2,682 —Changes in proportion and differences between
employer contributions and proportionate share ofcontributions
546 —
Contributions paid to PERS-DBRP subsequent to themeasurement date – FY 2018 Contributions 34,706 —
Totals $ 38,417 $ 160
Amounts reported as deferred outflows of resources related to pensions resulting from the nonemployer’s contributionsmade subsequent to the June 30, 2017, measurement date will be recognized as a reduction to its share of the net pensionliability in the fiscal year ended June 30, 2019.
Other amounts reported as deferred inflows of resources related to pensions will be recognized in grant expense asfollows:
(in thousands)
Year ended June 30:
Amount recognized in GrantExpense as an increase or
(decrease) to Grant Expense2019 $ 6952020 1,5342021 1,1932022 (417)2023 —Thereafter —
Sheriffs’ Retirement System – The SRS, administered by the MPERA, is a multiple-employer, cost-sharing definedbenefit plan established July 1, 1974, and governed by Title 19, chapters 2 & 7, MCA. This plan provides retirementbenefits to all Department of Justice criminal and gambling investigators hired after July 1, 1993, all detention officershired after July 1, 2005, and to all Montana sheriffs. Benefits are established by state law and can only be amended bythe Legislature. The SRS provides retirement, disability and death benefits to plan members and their beneficiaries.Benefits are based on eligibility, years of service and highest average compensation.
Summary of BenefitsMember’s highest average compensation (HAC) Hired prior to July 1, 2011 – highest average compensation during any consecutive 36 months; Hired on or after July 1, 2011 – highest average compensation during any consecutive 60 months. Hired on or after July 1, 2013 – 110% annual cap on compensation considered as a part of a member’sHAC.
Eligibility for benefit Service Retirement: 20 years of membership service, regardless of age. Early Retirement: Age 50, 5 years of membership service, actuarially reduced.
Vesting 5 years of membership service
B-98

Monthly benefit formula 2.5% of HAC per year of service
Guaranteed Annual Benefit Adjustment (GABA) After the member has completed 12 full months of retirement, the member’s benefit increases by theapplicable percentage (provided below) each January, inclusive of all other adjustments to the member’sbenefit.
◦ 3.0% for members hired prior to July 1, 2007 ◦ 1.5% for members hired on or after July 1, 2007
Contributions to the PlanRates are specified by state law for periodic employee and employer contributions and are a percentage of the member’scompensation. The Legislature has the authority to establish and amend contribution rates to the plan.
Member contributions to the system – Contributions are deducted from each member’s salary andremitted by participating employers. Plan members are required to contribute 10.495% of member’scompensation.
Employer contributions to the system – The employers are required to contribute 13.115% of membercompensation. Employer contributions are required to be paid on working retiree compensation. Membercontributions are not required for working retirees.
Actuarial AssumptionsThe total pension liability used to calculate the net pension liability was determined by an actuarial valuation as of June30, 2016, with update procedures used to roll forward the total pension liability to June 30, 2017. The actuarialassumptions used in the June 30, 2017, valuation were based on the results of the last actuarial experience study, datedMay 2017 for the six-year period ended June 30, 2016. There were several significant assumptions and other inputsused to measure the total pension liability. Among those assumptions were the following:
• Investment Return 7.65% • Administrative Expense as a % of Payroll 0.21%• General Wage Growth 3.50% • Inflation at 2.75%• Merit Increases 0.00% to 6.30% • Postretirement Benefit Increases – After the member has completed 12 full months of retirement, the member’s
benefit increases by the applicable percentage each January, inclusive of other adjustments to the member’sbenefit.
◦ 3.00% for members hired prior to July 1, 2007◦ 1.50% for members hired on or after July 1, 2007
• Mortality assumptions among contributing members, terminated vested members, service retired membersand beneficiaries are based on RP 2000 Combined Employee and Annuitant Mortality Tables projected to2020 using Scale BB, set back one year for males.
• Mortality assumptions among Disabled Retirees are based on RP 2000 Combined Employee and AnnuitantMortality Tables.
Discount Rate The discount rate used to measure the total pension liability was 7.65%. The projection of cash flows used to determinethe discount rate assumed that contributions from participating plan members, employers, and nonemployer contributingentities will be made based on the PERB’s funding policy, which establishes the contractually required rates underMCA. SRS’s fiduciary net position was projected to be adequate to make all the projected future benefit payments ofcurrent plan members through the year 2117. Therefore, the long-term expected rate of return on pension planinvestments was applied to all periods of projected benefit payments to determine the total pension liability. A municipalbond rate was not incorporated in the discount rate.
B-99

Target AllocationsThe long-term expected return on pension plan assets is reviewed as part of the regular experience study prepared for the SRS. The most recent analysis, performed for the six-year period ended June 30, 2016, is outlined in a report datedMay 2017, and can be located on the MPERA website. The long-term expected rate of return on pension plan investmentswas determined by considering information from various sources, including historical rates of return, rate of returnassumptions adopted by similar public pension systems, and by using a building-block method in which best-estimateranges of expected future real rates of return (expected returns, net of pension plan investment and inflation) aredeveloped for each major asset class. These ranges were combined to produce the long-term expected rate of returnby weighing the expected future real rates of return by the target asset allocation percentage and by adding expectedinflation. Best estimates of the arithmetic real rates of return for each major asset class included in the SRS’s targetasset allocation as of June 30, 2017, is summarized in the table that follows:
Asset ClassTarget Asset
AllocationLong-term ExpectedReal Rate of Return
Cash Equivalents 2.60% 4.00%Domestic Equity 36.00% 4.55%Foreign Equity 18.00% 6.35%Fixed Income 23.40% 1.00%Private Equity 12.00% 7.75%Real Estate 8.00% 4.00%
Sensitivity AnalysisIn accordance with GASB 68 regarding the disclosure of the sensitivity of the net pension liability to changes in thediscount rate, the table below presents the net pension liability calculated using the discount rate of 7.65%, as well aswhat the net pension liability would be if it were calculated using a discount rate that is 1.00% lower (6.65%) or 1.00%higher (8.65%) than the current rate.
(in thousands)1.0% Decrease
(6.65%)Current
Discount Rate1.0% Increase
(8.65%)Employer’s SRS Net Pension Liability $ 6,526 $ 3,696 $ 1,380
Net Pension LiabilityIn accordance with GASB 68, employers are required to recognize and report certain amounts associated with theirparticipation in the SRS. GASB 68 became effective June 30, 2015, and includes requirements for participants to recordand report their proportionate share of the collective net pension liability (NPL), pension expense, deferred inflows ofresources, and deferred outflows of resources associated with pensions.
(dollars presented in thousands)Net Pension Liability
as of 6/30/16Net Pension Liability
as of 6/30/17Percent of
Collective NPLEmployer Proportionate Share $ 9,582 $ 3,696 4.856692%
At June 30, 2018, the State as an employer reported a liability of $3.7 million for its proportionate share of net pensionliability. The net pension liability was measured as of June 30, 2017, and the total pension liability used to calculatethe net pension liability was determined by an actuarial valuation as of June 30, 2016, with update procedures used toroll forward the total pension liability to June 30, 2017. The employer’s proportion of the net pension liability wasbased on the employer’s contributions received by the SRS during the measurement period, July 1, 2016, through June30, 2017, relative to the total employer contributions received from all of SRS participating employers.
Changes in actuarial assumptions and methods: The following changes in assumptions were identified:
B-100

1. The discount rate was lowered from 7.75% to 7.65%2. The inflation rate was reduced from 3.00% to 2.75%3. The wage inflation rate was reduced from 4.00% to 3.50%4. The non-disabled mortality and withdrawal assumptions were updated.5. The salary merit scale was updated.6. Increased administrative expense load from 0.17% to 0.21%.
The following changes in method were identified:1. Administrative expenses are recognized by an additional amount added to the normal cost contribution
rate for the plan. This amount will vary from year to year based on the prior year's actual expense.2. For consistency in changes of the base wage growth, the payroll growth assumption as a level percent
of pay was reduced from 4.00% to 3.50%.
The following changes in contributions were identified:1. Employee contributions increased from 9.245% to 10.495% of a members' compensation.2. Employer additional contributions increased from 0.58% to 3.58% for a total rate of 13.115%3. Employee contributions will return to 9.245% and employer contributions will return to 9.535% when
reducing the employee rate and terminating additional employer contributions will not cause theamortization period to exceed 25 years.
Changes in benefit terms: The following benefit changes were identified:1. Interest credited to member accounts increased from 0.25% to 0.77%.2. Lump-sum payouts in all systems are limited to the member’s accumulated contributions rather than
the present value of the member’s benefit.
Changes in proportionate share: Between the measurement date of the collective net pension liability andthe employer’s reporting date there were no changes in proportion that are expected to have a significanteffect on the Employer’s proportionate share of the collective net pension liability.
Pension ExpenseAt June 30, 2018, the employer recognized a pension expense of $50.0 thousand for its proportionate share of the SRSpension expense.
Deferred Outflows and InflowsAt June 30, 2018, the State as an employer recognized a beginning deferred outflow of resources for fiscal year 2017contributions of $368.0 thousand.
As of the fiscal year ended June 30, 2018, the State, as an employer, reported its proportionate share of the SRS'sdeferred outflows of resources and deferred inflows of resources from the following sources:
(in thousands)Deferred Outflows
of ResourcesDeferred Inflows
of ResourcesDifference between actual and expected experience $ 24 $ 11Net difference between projected and actual earnings
on pension plan investments — 45
Changes of Assumptions 2,884 4,718Changes in proportion and differences between
employer contributions and proportionate shareof contributions
— 636
Contributions paid to SRS subsequent to themeasurement date – FY 2018 contributions 496 —
Totals $ 3,404 $ 5,410
B-101
Amounts reported as deferred outflows of resources related to pensions resulting from the employer’s contributionsmade subsequent to the measurement date of June 30, 2017, will be recognized as a reduction of the net pension liabilityin the fiscal year ended June 30, 2019.
Other amounts reported as deferred inflows of resources related to pensions will be recognized in pension expense asfollows:
(in thousands)
Year ended June 30:
Amount recognized in PensionExpense as an increase or
(decrease) to Pension Expense2019 $ (549)2020 (326)2021 (413)2022 (578)2023 —Thereafter —
Municipal Police Officers’ Retirement System – The MPORS, administered by the MPERA, is a multiple-employer,cost-sharing defined benefit plan that was established in 1974 and is governed by Title 19, chapters 2 & 9, MCA. Thisplan covers all municipal police officers employed by first- and second-class cities and other cities that adopt the plan.Benefits are established by state law and can only be amended by the Legislature. The MPORS provides retirement,disability, and death benefits to plan members and their beneficiaries. Benefits are based on eligibility, years of service,and final average compensation.
Deferred Retirement Option Plan (DROP)Beginning July 2002, eligible members of the MPORS can participate in the DROP by filing a one-time irrevocableelection with the PERB. The DROP is governed by Title 19, Chapter 9, Part 12, MCA. A member must have completedat least twenty years of membership service to be eligible. They may elect to participate in the DROP for a minimumof one month and a maximum of 60 months and may only participate in the DROP once. A participant remains a memberof the MPORS, but will not receive membership service or service credit in the system for the duration of the member’sDROP period. During participation in the DROP, all mandatory contributions continue to the retirement system. Amonthly benefit is calculated based on salary and years of service to the date of the beginning of the DROP period. Themonthly benefit is paid into the member’s DROP account until the end of the DROP period. At the end of the DROPperiod, the participant may receive the balance of the DROP account in a lump-sum payment or in a direct rollover toanother eligible plan, as allowed by the IRS. If the participant continues employment after the DROP period ends, theywill again accrue membership service and service credit. The DROP account cannot be distributed until employmentis formally terminated. As of June 30, 2018, the balance held by MPERA for DROP participants was approximately$14.5 million.
The State is not an employer participant in the MPORS plan. However, because the PERB is a fiduciary componentunit of the State, this CAFR presents certain information to help ensure compliance with GASB 67. In addition, theState provides nonemployer entity contributions classified as special funding in accordance with GASB 68. Disclosuresmade in this financial report for MPORS are meant to reflect the aforementioned relationships.
Summary of BenefitsMember’s final average compensation (FAC) Hired prior to July 1, 1977 – average monthly compensation of final year of service; Hired on or after July 1, 1977 – final average compensation (FAC) for last consecutive 36 months. Hired on or after July 1, 2013 – 110% annual cap on compensation considered as a part of a member’sFAC.
B-102

Eligibility for benefit Service Retirement: Age 50, with 5 years of membership service, or 20 years of membership service,regardless of age. Second Retirement: Age 50, reemployed in a MPORS position Vesting Death and disability rights are vested immediately.5 years of membership service.
Monthly benefit formula 2.5% of FAC per year of service credit.
Second retirement benefit formula for members re-employed in a MPORS position after July 1, 2017:1) If the member works more than 480 hours in a calendar year and accumulates less than 5
years of service credit before terminating again, the member:a. Is not awarded service credit for the period of reemployment;b. Is refunded the accumulated contributions associated with the period of reemployment;c. Starting the·first month following termination of service, receives the same retirement
benefit previously paid to the member; andd. Does not accrue post-retirement benefit adjustments during the term of reemployment
but receives a Guaranteed Annual Benefit Adjustment (GABA) in January immediatelyfollowing second retirement.
2) If the member works more than 480 hours in a calendar year and accumulates at least 5years of service credit before terminating again, the member:
a. Is awarded service credit for the period of reemployment;b. Starting the first month following termination of service, receives:
i. The same retirement benefit previously paid to the member, andii. A second retirement benefit for the period of reemployment calculated based on
the laws in effect as of the member's rehire date; andc. Does not accrue post-retirement benefit adjustments during the term of reemployment
but receives a GABA:i. On the initial retirement benefit in January immediately following second
retirement, andii. On the second retirement benefit starting in January after receiving that benefit
for at least 12 months.3) A member who returns to covered service is not eligible for a disability benefit.
Guaranteed Annual Benefit Adjustment (GABA) Hired on or after July 1, 1997, or those electing GABA – after the member has completed 12 full monthsof retirement, the member’s benefit increases by a maximum of 3% each January, inclusive of all otheradjustments to the member’s benefit.
Minimum benefit adjustment (non-GABA) If hired before July 1, 1997, and member did not elect GABA– the monthly retirement, disability or survivor’s benefit may not be less than 50% of the compensationof a newly confirmed officer of the employer where the member was last employed.
Contributions to the PlanRates are specified by state law for periodic employee, employer, and nonemployer entity contributions. The Legislaturehas the authority to establish and amend contribution rates to the plan.
B-103

Member contributions – Contribution rates are dependent upon date of hire as a police officer.Contributions are deducted from each member’s salary and remitted by the participating Employer. Forfiscal year 2018: • If hired prior to July 1, 1975, member contributions as a percentage of salary are 5.80%• If hired after June 30, 1975, and prior to July 1, 1979, member contributions as a percentage of salaryare 7.00%; • If hired after June 30, 1979, and prior to July 1, 1997, member contributions as a percentage of salaryare 8.50%; and, • If hired on or after July 1, 1997, and for members electing GABA, member contributions as apercentage of salary are 9.00%.
Employer Contributions – Employers are required to contribute 14.41% of a member’s compensation.
Nonemployer Entity Contributions – The State contributes 29.37% of a member’s compensation fromthe General Fund. These amounts are considered a special funding situation in accordance with GASB68.
Actuarial AssumptionsThe total pension liability used to calculate the net pension liability was determined by an actuarial valuation as of June30, 2016, with update procedures used to roll forward the total pension liability to June 30, 2017. The actuarialassumptions used in the June 30, 2017, valuation were based on the results of the last actuarial experience study, datedMay 2017 for the six-year period ended June 30, 2016. There were several significant assumptions and other inputsused to measure the total pension liability. Among those assumptions were the following:
• Investment Return 7.65% • Admin expense as a % of Payroll 0.24%• General Wage Growth 3.50% • Inflation at 2.75%• Merit Increases 0.00% to 6.60% • Postretirement Benefit Increases
◦ GABAHired on or after July 1, 1997, or those electing GABA – after the member has completed 12 fullmonths of retirement, the member’s benefit increases by a maximum of 3% each January, inclusiveof all other adjustments to the member’s benefit
◦ Minimum benefit adjustment (non-GABA)If hired before July 1, 1997 and member did not elect GABA – the monthly retirement, disability orsurvivor’s benefit may not be less than 50% the compensation of a newly confirmed officer in thecity that the member was last employed
• Mortality assumptions among contributing members, terminated vested members, service retired membersand beneficiaries are based on RP 2000 Combined Employee and Annuitant Mortality Tables projected to2020 using Scale BB, set back one year for males.
• Mortality assumptions among Disabled Retirees are based on RP 2000 Combined Employee and AnnuitantMortality Tables.
Discount RateThe discount rate used to measure the total pension liability was 7.65%. The projection of cash flows used to determinethe discount rate assumed that contributions from participating plan members, employers, and nonemployer contributingentities will be made based on the PERB’s funding policy, which establishes the contractually required rates underMCA. The State contributes 29.37% of salaries paid by employers. Based on those assumptions, the MPORS’s fiduciarynet position was projected to be adequate to make all the projected future benefit payments of current plan membersthrough the year 2124. Therefore, the long-term expected rate of return on pension plan investments was applied to
B-104

all periods of projected benefit payments to determine the total pension liability. A municipal bond rate was notincorporated in the discount rate.
Target AllocationsThe long-term expected return on pension plan assets is reviewed as part of the regular experience study prepared for the MPORS. The most recent analysis, performed for the six-year period ended June 30, 2016, is outlined in a reportdated May 2017, and can be located on the MPERA website. The long-term expected rate of return on pension planinvestments was determined by considering information from various sources, including historical rates of return, rateof return assumptions adopted by similar public pension systems, and by using a building-block method in which best-estimate ranges of expected future real rates of return (expected returns, net of pension plan investment and inflation)are developed for each major asset class. These ranges were combined to produce the long-term expected rate of returnby weighing the expected future real rates of return by the target asset allocation percentage and by adding expectedinflation. Best estimates of the arithmetic real rates of return for each major asset class included in the MPORS’s targetasset allocation as of June 30, 2017, is summarized in the table that follows:
Asset ClassTarget Asset
AllocationLong-term ExpectedReal Rate of Return
Cash Equivalents 2.60% 4.00%Domestic Equity 36.00% 4.55%Foreign Equity 18.00% 6.35%Fixed Income 23.40% 1.00%Private Equity 12.00% 7.75%Real Estate 8.00% 4.00%
Sensitivity AnalysisIn accordance with GASB 68, regarding the disclosure of the sensitivity of the net pension liability to changes in thediscount rate, the table below presents the net pension liability calculated using the discount rate of 7.65%, as well aswhat the net pension liability would be if it were calculated using a discount rate that is 1.00% lower (6.65%) or 1.00%higher (8.65%) than the current rate.
(in thousands)1.0% Decrease
(6.65%)Current
Discount Rate1.0% Increase
(8.65%)State as a Nonemployer Entity Net
Pension Liability $ 173,784 $ 119,354 $ 75,713
Net Pension LiabilityIn accordance with GASB 68, employers and nonemployer contributing entities are required to recognize and reportcertain amounts associated with their participation in the MPORS. GASB 68 became effective June 30, 2015, andincludes requirements for participants to record and report their proportionate share of the collective net pension liability,pension expense, deferred inflows of resources, and deferred outflows of resources associated with pensions.
In accordance with GASB 68, the MPORS has a special funding situation in which the State is legally responsible formaking contributions directly to the MPORS on behalf of the employers. Due to the existence of this special fundingsituation, the State is required to report a proportionate share of a local government’s collective net pension liabilitythat is associated with the non-State employer.
(dollars presented in thousands)Net Pension Liability
as of 6/30/16Net Pension Liability
as of 6/30/17Percent of
Collective NPLState as a Nonemployer Contributing
Entity – Proportionate Share $ 119,708 $ 119,354 67.085433%
B-105

At June 30, 2018, the State as a nonemployer contributing entity reported a liability of $119.4 million for its proportionateshare of the net pension liability. The net pension liability was measured as of June 30, 2017, and the total pensionliability used to calculate the net pension liability was determined by an actuarial valuation as of June 30, 2016, withupdate procedures used to roll forward the total pension liability to June 30, 2017. The nonemployer’s proportion ofthe net pension liability was based on the nonemployer’s special funding contributions received by the MPORS duringthe measurement period of July 1, 2016, through June 30, 2017, relative to total contributions received from all of theMPORS’s participating employers and the nonemployer contributing entity.
Changes in actuarial assumptions and methods: The following changes in assumptions were identified:1. The discount rate was lowered from 7.75% to 7.65%2. The inflation rate was reduced from 3.00% to 2.75%3. The wage inflation rate was reduced from 4.00% to 3.50%4. The non-disabled mortality and withdrawal assumptions were updated.5. The salary merit scale was updated.6. Increased administrative expense load from 0.20% to 0.24%.
The following changes in method were identified:1. Administrative expenses are recognized by an additional amount added to the normal cost contribution
rate for the plan. This amount will vary from year to year based on the prior year's actual expense.2. For consistency in changes of the base wage growth, the payroll growth assumption as a level percent
of pay was reduced from 4.00% to 3.50%.
Changes in benefit terms: The following changes to benefit terms were identified:1. Working Retiree Limitation applies to retirement system members who return on or
after July 1, 2017, to covered employment in the system from which they retired.2. Second Retirement Benefit applies to retirement system members who return on or after July 1, 2017,
to active service covered by the system from which they retired.3. Interest credited to member accounts increased from 0.25% to 0.77%.4. Lump-sum payouts in all systems are limited to the member’s accumulated contributions rather than
the present value of the member’s benefit.
Changes in proportionate share: Between the measurement date of the collective net pension liability and theemployer’s reporting date there were no changes in proportion that would have an effect on the employer’sproportionate share of the collective net pension liability.
Grant Expense Related to Special FundingThe State recognized grant expense of $14.5 million for special funding support provided by the General Fund for itsproportionate share of the MPORS’s pension expense that is associated with other employer participants in the plan.
Deferred Outflows and InflowsAt June 30, 2018, the State as a nonemployer contributing entity recognized a beginning deferred outflow of resourcesfor fiscal year 2017 contributions of $13.2 million.
B-106
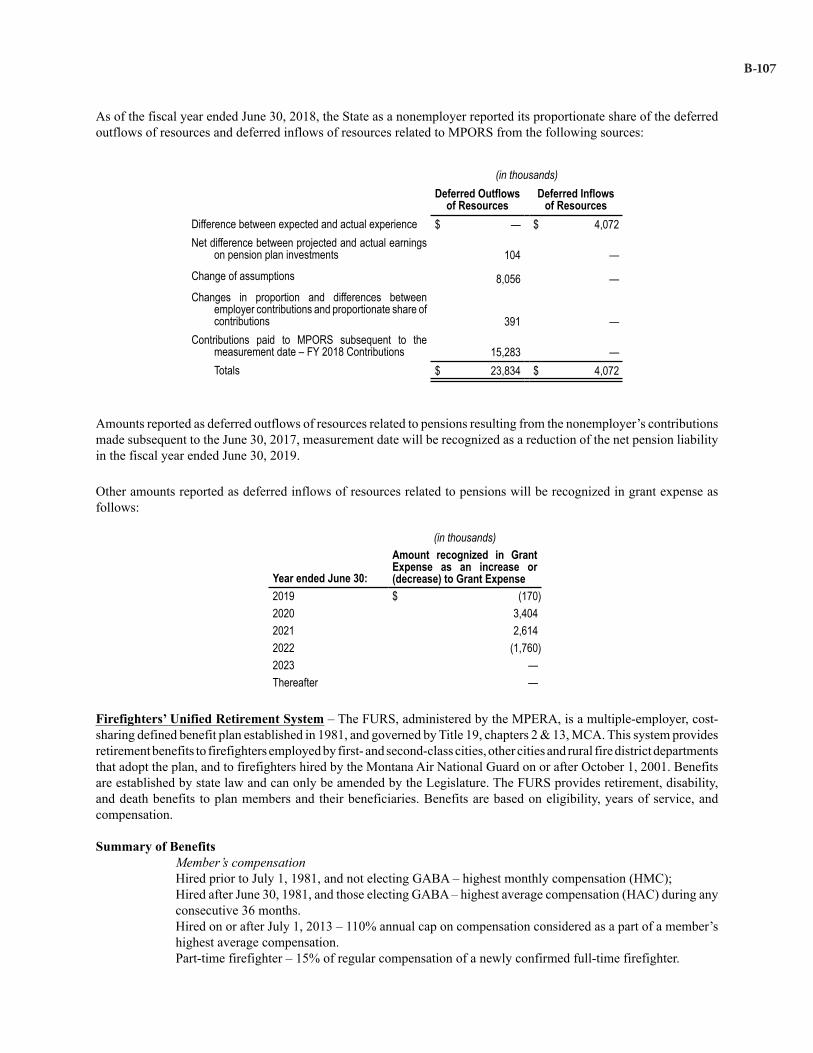
As of the fiscal year ended June 30, 2018, the State as a nonemployer reported its proportionate share of the deferredoutflows of resources and deferred inflows of resources related to MPORS from the following sources:
(in thousands)Deferred Outflows
of ResourcesDeferred Inflows
of ResourcesDifference between expected and actual experience $ — $ 4,072Net difference between projected and actual earnings
on pension plan investments 104 —
Change of assumptions 8,056 —Changes in proportion and differences between
employer contributions and proportionate share ofcontributions 391 —
Contributions paid to MPORS subsequent to themeasurement date – FY 2018 Contributions 15,283 —Totals $ 23,834 $ 4,072
Amounts reported as deferred outflows of resources related to pensions resulting from the nonemployer’s contributionsmade subsequent to the June 30, 2017, measurement date will be recognized as a reduction of the net pension liabilityin the fiscal year ended June 30, 2019.
Other amounts reported as deferred inflows of resources related to pensions will be recognized in grant expense asfollows:
(in thousands)
Year ended June 30:
Amount recognized in GrantExpense as an increase or(decrease) to Grant Expense
2019 $ (170)2020 3,4042021 2,6142022 (1,760)2023 —Thereafter —
Firefighters’ Unified Retirement System – The FURS, administered by the MPERA, is a multiple-employer, cost-sharing defined benefit plan established in 1981, and governed by Title 19, chapters 2 & 13, MCA. This system providesretirement benefits to firefighters employed by first- and second-class cities, other cities and rural fire district departmentsthat adopt the plan, and to firefighters hired by the Montana Air National Guard on or after October 1, 2001. Benefitsare established by state law and can only be amended by the Legislature. The FURS provides retirement, disability,and death benefits to plan members and their beneficiaries. Benefits are based on eligibility, years of service, andcompensation.
Summary of BenefitsMember’s compensationHired prior to July 1, 1981, and not electing GABA – highest monthly compensation (HMC);Hired after June 30, 1981, and those electing GABA – highest average compensation (HAC) during anyconsecutive 36 months.Hired on or after July 1, 2013 – 110% annual cap on compensation considered as a part of a member’shighest average compensation.Part-time firefighter – 15% of regular compensation of a newly confirmed full-time firefighter.
B-107
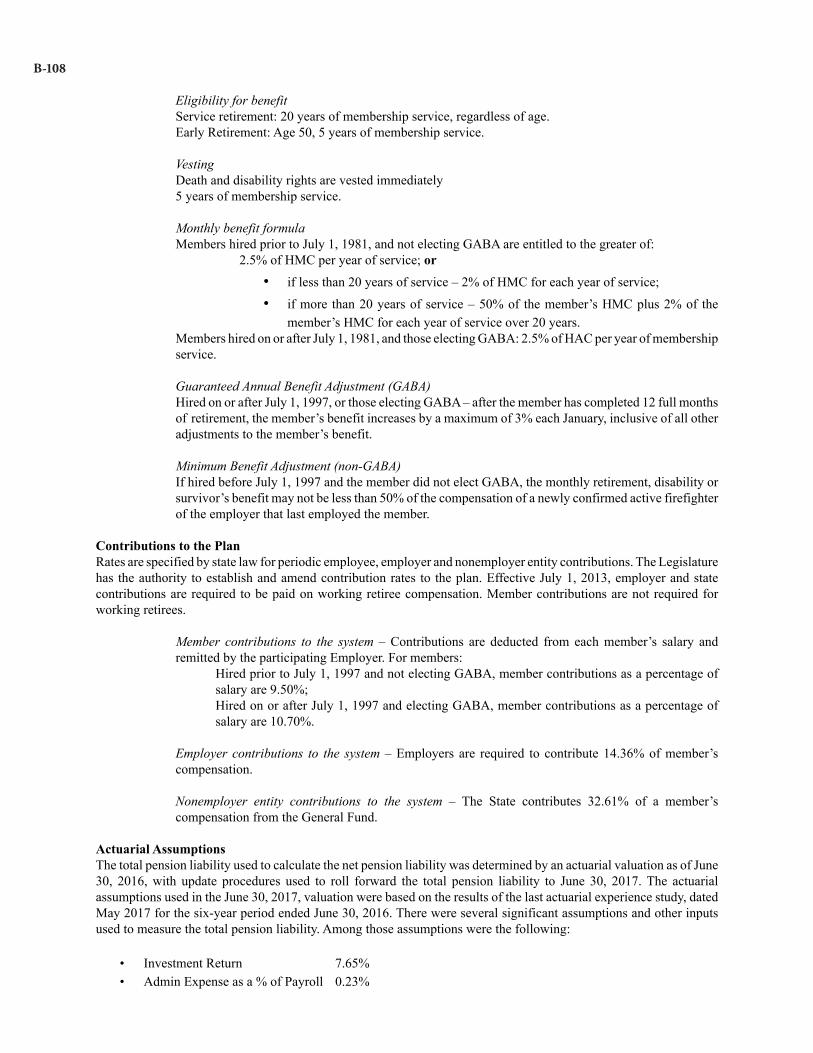
Eligibility for benefitService retirement: 20 years of membership service, regardless of age.Early Retirement: Age 50, 5 years of membership service.
VestingDeath and disability rights are vested immediately 5 years of membership service.
Monthly benefit formulaMembers hired prior to July 1, 1981, and not electing GABA are entitled to the greater of:
2.5% of HMC per year of service; or
• if less than 20 years of service – 2% of HMC for each year of service;
• if more than 20 years of service – 50% of the member’s HMC plus 2% of themember’s HMC for each year of service over 20 years.
Members hired on or after July 1, 1981, and those electing GABA: 2.5% of HAC per year of membershipservice.
Guaranteed Annual Benefit Adjustment (GABA)Hired on or after July 1, 1997, or those electing GABA – after the member has completed 12 full monthsof retirement, the member’s benefit increases by a maximum of 3% each January, inclusive of all otheradjustments to the member’s benefit.
Minimum Benefit Adjustment (non-GABA)If hired before July 1, 1997 and the member did not elect GABA, the monthly retirement, disability orsurvivor’s benefit may not be less than 50% of the compensation of a newly confirmed active firefighterof the employer that last employed the member.
Contributions to the PlanRates are specified by state law for periodic employee, employer and nonemployer entity contributions. The Legislaturehas the authority to establish and amend contribution rates to the plan. Effective July 1, 2013, employer and statecontributions are required to be paid on working retiree compensation. Member contributions are not required forworking retirees.
Member contributions to the system – Contributions are deducted from each member’s salary andremitted by the participating Employer. For members:
Hired prior to July 1, 1997 and not electing GABA, member contributions as a percentage ofsalary are 9.50%;Hired on or after July 1, 1997 and electing GABA, member contributions as a percentage ofsalary are 10.70%.
Employer contributions to the system – Employers are required to contribute 14.36% of member’scompensation.
Nonemployer entity contributions to the system – The State contributes 32.61% of a member’scompensation from the General Fund.
Actuarial AssumptionsThe total pension liability used to calculate the net pension liability was determined by an actuarial valuation as of June30, 2016, with update procedures used to roll forward the total pension liability to June 30, 2017. The actuarialassumptions used in the June 30, 2017, valuation were based on the results of the last actuarial experience study, datedMay 2017 for the six-year period ended June 30, 2016. There were several significant assumptions and other inputsused to measure the total pension liability. Among those assumptions were the following:
• Investment Return 7.65% • Admin Expense as a % of Payroll 0.23%
B-108

• General Wage Growth 3.50% • Inflation at 2.75% • Merit Increases 0% to 6.30% • Postretirement Benefit Increases
◦ GABAHired on or after July 1, 1997, or those electing GABA – after the member has completed 12 full monthsof retirement, the member’s benefit increases by a maximum of 3% each January, inclusive of all otheradjustment to the member’s benefit.
◦ Minimum Benefit Adjustment (non-GABA)Hired before July 1, 1997 and member did not elect GABA – the monthly retirement, disability or survivor’sbenefit may not be less than 50% the compensation of a newly confirmed firefighter employed by thecity that last employed the member.
• Mortality assumptions among contributing members, terminated vested members, service retired membersand beneficiaries are based on RP 2000 Combined Employee and Annuitant Mortality Tables projected to2020 using Scale BB, set back one year for males.
• Mortality assumptions among Disabled Retirees are based on RP 2000 Combined Employee and AnnuitantMortality Tables.
Discount RateThe discount rate used to measure the total pension liability was 7.65%. The projection of cash flows used to determinethe discount rate assumed that contributions from participating plan members, employers, and nonemployer contributingentities will be made based on the PERB’s funding policy, which establishes the contractually required rates underMCA. The State contributes 32.61% of salaries paid by employers. Based on those assumptions, the FURS’s fiduciarynet position was projected to be adequate to make all the projected future benefit payments of current plan membersthrough the year 2124. Therefore, the long-term expected rate of return on pension plan investments was applied toall periods of projected benefit payments to determine the total pension liability. A municipal bond rate was notincorporated in the discount rate.
Target AllocationsThe long-term expected return on pension plan assets is reviewed as part of the regular experience study prepared for the FURS. The most recent analysis, performed for the six-year period ended June 30, 2016, is outlined in a reportdated May 2017, and can be located on the MPERA website. The long-term expected rate of return on pension planinvestments was determined by considering information from various sources, including historical rates of return, rateof return assumptions adopted by similar public pension systems, and by using a building-block method in which best-estimate ranges of expected future real rates of return (expected returns, net of pension plan investment and inflation)are developed for each major asset class. These ranges were combined to produce the long-term expected rate of returnby weighing the expected future real rates of return by the target asset allocation percentage and by adding expectedinflation. Best estimates of the arithmetic real rates of return for each major asset class included in the FURS’s targetasset allocation as of June 30, 2017, is summarized in the table that follows:
Asset ClassTarget Asset
AllocationLong-term ExpectedReal Rate of Return
Cash Equivalents 2.60% 4.00%Domestic Equity 36.00% 4.55%Foreign Equity 18.00% 6.35%Fixed Income 23.40% 1.00%Private Equity 12.00% 7.75%Real Estate 8.00% 4.00%
Sensitivity AnalysisIn accordance with GASB 68 regarding the disclosure of the sensitivity of the net pension liability to changes in thediscount rate, the table below presents the net pension liability calculated using the discount rate of 7.65%, as well as
B-109

what the net pension liability would be if it were calculated using a discount rate that is 1.00% lower (6.65%) or 1.00%higher (8.65%) than the current rate.
(in thousands)1.0% Decrease
(6.65%)Current Discount
Rate1.0% Increase
(8.65%)State as an Employer in FURS – Net Pension
Liability $ 4,196 $ 2,525 $ 1,175
State as a Nonemployer Contributing Entityto FURS – Net Pension Liability 127,496 76,724 35,703
Net Pension LiabilityIn accordance with GASB 68, employers and nonemployer contributing entities are required to recognize and reportcertain amounts associated with their participation in the FURS. GASB 68 became effective June 30, 2015, and includesrequirements to record and report their proportionate share of the collective net pension liability, pension expense,deferred inflows of resources and deferred outflows of resources associated with pensions.
In accordance with GASB 68, the FURS has a special funding situation in which the State is legally responsible formaking contributions directly to the FURS on behalf of the employers. Due to the existence of this special fundingsituation, the State is required to report a proportionate share of a local government or fire district’s collective netpension liability that is associated with the non-State employer.
(dollars presented in thousands)Net Pension Liability
as of 6/30/16Net Pension Liability
as of 6/30/17Percent of
Collective NPLState's Proportionate Share as an
Employer Entity $ 2,583 $ 2,525 2.233929%
State's Proportionate Share as aNonemployer Contributing Entity 77,448 76,724 67.876338%
State of Montana Totals $ 80,031 $ 79,249 70.110267%
At June 30, 2018, the State reported a liability of $79.2 million for its proportionate share of the net pension liabilityas an employer and nonemployer contributing entity in relation to the FURS. The net pension liability was measuredas of June 30, 2017, and the total pension liability used to calculate the net pension liability was determined by anactuarial valuation as of June 30, 2016, with update procedures used to roll forward the total pension liability to June30, 2017. The proportion of the net pension liability was based on the all employer and nonemployer contributionsreceived by the FURS during the measurement period, July 1, 2016, through June 30, 2017, relative to the totalcontributions received from all FURS participating employers and the nonemployer contributing entity.
Changes in actuarial assumptions and methods: The following changes in assumptions were identified:1. The discount rate was lowered from 7.75% to 7.65%2. The inflation rate was reduced from 3.00% to 2.75%3. The wage inflation rate was reduced from 4.00% to 3.50%4. The non-disabled mortality and withdrawal assumptions were updated.5. The salary merit scale was updated.6. Increased administrative expense load from 0.19% to 0.23%.
The following changes in method were identified:1. Administrative expenses are recognized by an additional amount added to the normal cost contribution
rate for the plan. This amount will vary from year to year based on the prior year's actual expense.2. For consistency in changes of the base wage growth, the payroll growth assumption as a level percent
of pay was reduced from 4.00% to 3.50%.
Changes in benefit terms: The following changes to benefit terms were identified:1. Working Retiree Limitation applies to retirement system members who return on or
B-110

after July 1, 2017, to covered employment in the system from which they retired.2. Second Retirement Benefit applies to retirement system members who return on or after July 1, 2017,
to active service covered by the system from which they retired.3. Interest credited to member accounts increased from 0.25% to 0.77%.4. Lump-sum payouts in all systems are limited to the member’s accumulated contributions rather than
the present value of the member’s benefit.
Changes in proportionate share: Between the measurement date of the collective net pension liability and theemployer’s reporting date there were no changes in proportion that would have an effect on the employer’sproportionate share of the collective net pension liability.
Employer Pension Expense and Nonemployer Contributing Entity Special Funding Grant ExpenseAt June 30, 2018, the State as an employer recognized pension expense of $458.1 thousand for its proportionate shareof the FURS pension expense. The State also recognized grant expense of $11.5 million for special funding supportprovided by the General Fund for its proportionate share of the FURS’s pension expense that is associated with otheremployer participants in the plan. Total pension related expenses at June 30, 2018, was $12.0 million.
Deferred Outflows and InflowsAt June 30, 2018, the State, as an employer, recognized a beginning deferred outflow of resources for fiscal year 2017contributions of $472.0 thousand.
As of the fiscal year ended June 30, 2018, the State as an employer reported its proportionate share of deferred outflowsof resources and deferred inflows of resources related to the FURS from the following sources:
(in thousands)Deferred Outflows
of ResourcesDeferred Inflows
of ResourcesActual versus expected experience $ 17 $ 19Net difference between projected and actual earnings
on pension plan investments 2 —
Change of assumptions 315 —Changes in proportion and differences between
employer contributions and proportionate shareof contributions
199 —
Contributions paid to FURS subsequent to themeasurement date – FY 2018 Contributions 518 —
Totals $ 1,051 $ 19
Amounts reported as deferred outflows of resources related to pensions resulting from the employer’s contributionsmade subsequent to the measurement date of June 30, 2017, will be recognized as a reduction of the net pension liabilityin the fiscal year ended June 30, 2019.
Other amounts reported as deferred outflows of resources and deferred inflows of resources related to pensions will berecognized in pension expense as follows:
B-111

(in thousands)
Year ended June 30:
Amount recognized in PensionExpense as an increase or
(decrease) to Pension Expense2019 $ 262020 1342021 872022 22023 66Thereafter —
At June 30, 2018, the State recognized a beginning deferred outflow of resources as a nonemployer contributing entityfor fiscal year 2017 contributions of $14.0 million.
As of the fiscal year ended June 30, 2018, the State as a nonemployer contributing entity reported its proportionateshare of deferred outflows of resources and deferred inflows of resources related to FURS from the following sources:
(in thousands)Deferred Outflows
of ResourcesDeferred Inflows
of ResourcesDifference between expected and actual experience $ 505 $ 580Net difference between projected and actual
earnings on pension plan investments 63 —
Change in assumptions 9,568 —Changes in proportion and differences between
employer contributions and proportionate shareof contributions
5 —
Contributions paid to FURS subsequent to themeasurement date – FY 2018 Contributions 15,272 —
Totals $ 25,413 $ 580
Amounts reported as deferred outflows of resources related to pensions resulting from the nonemployer’s contributionsmade subsequent to the June 30, 2017, measurement date will be recognized as a reduction of the net pension liabilityin the fiscal year ended June 30, 2019.
Other amounts reported as deferred inflows of resources related to pensions will be recognized in grant expense asfollows:
(in thousands)
Year ended June 30:
Amount recognized in GrantExpense as an increase or(decrease) to Grant Expense
2019 $ 7752020 4,0652021 2,6472022 552023 2,014Thereafter —
Volunteer Firefighters’ Compensation Act – The VFCA, administered by the MPERA, is a statewide retirement anddisability plan established in 1965, and governed by Title 19, chapter 17, MCA. All members are unpaid volunteersand the State is the only contributor to the plan. Benefits are established by state law and can only be amended by theLegislature. The VFCA provides pension, disability, and survivorship benefits for all eligible volunteer firefighters whoare members of qualified volunteer fire companies in unincorporated areas, towns or villages, and includes volunteer
B-112

fire departments, fire districts, and fire service areas under the laws of the State. Benefits are based on eligibility andyears of service. Member rights are vested after ten years of credited service. The VFCA also provides limited benefitsfor death or injuries incurred in the line of duty. A member who chooses to retire and draw a pension benefit may returnto service with a volunteer fire department without loss of benefits. However, a returning retired member may not beconsidered an active member accruing credit for service.
Summary of BenefitsEligibility for benefitAge 55, 20 years of credited service;Age 60, 10 years of credited service.
Effective July 1, 2011, members who retire on or after July 1, 2011, and have greater than 30 years ofcredited service will receive $7.50 per month for each additional year of credited service over 30 yearsif the pension trust fund is actuarially sound, amortizing any unfunded liabilities in 20 years or less.This determination will be made annually and a member’s benefit will be capped at $250 a month (30years of credited service) if the amortization period grows to greater than 20 years.
Vesting10 years of credited service.
Monthly benefit formula (effective January 1, 2016)$8.75 per year of credited service up to 20 years;$7.50 per year of credited service after 20 years
Contributions to the PlanThe State, as a nonemployer contributing entity, is the only contributor to the VFCA. Contributions are 5% of fireinsurance premium taxes collected on certain fire risks. This requires the plan to be treated as a special funding situationin accordance with GASB 68. The State Auditor makes annual payments from the General Fund to the VFCA fund.Rates are specified by state law for contributions to the VFCA plan. The State legislature has the authority to establishand amend contribution rates to the plan.
Actuarial AssumptionsThe total pension liability used to calculate the net pension liability was determined by an actuarial valuation as of June30, 2016, with update procedures used to roll forward the total pension liability to June 30, 2017. There were severalsignificant assumptions and other inputs used to measure the total pension liability. The actuarial assumptions used inthe June 30, 2017, valuation were based on the results of the last actuarial experience study, dated May 2017 for thesix-year period ended June 30, 2016. Among those assumptions were the following:
• Investment Return 7.65% • Inflation at 2.75%• Mortality assumptions among contributing members, terminated vested members, service retired members
and beneficiaries are based on RP 2000 Combined Employee and Annuitant Mortality Tables projected to2020 using Scale BB, set back one year for males.
• Mortality assumptions among Disabled Retirees are based on RP 2000 Combined Employee and AnnuitantMortality Tables.
For VFCA, administrative expenses are assumed to equal $89.3 thousand. This dollar amount is added to normal costfor valuation purposes.
Discount RateThe discount rate used to measure the total pension liability was 7.65%. The projection of cash flows used to determinethe discount rate assumed that contributions from the nonemployer contributing entity will be made based on the PERB’sfunding policy, which establishes the contractually required rates under MCA. The State contributes 5% of fire insurancepremium taxes paid on certain fire risks. Based on those assumptions, the VFCA’s fiduciary net position was projected
B-113

to be adequate to make all the projected future benefit payments of current plan members through the year 2109. Amunicipal bond rate was not incorporated in the discount rate.
Target AllocationsThe long-term expected return on pension plan assets is reviewed as part of the regular experience study prepared for the VFCA. The most recent analysis, performed for the six-year period ended June 30, 2016, is outlined in a reportdated May 2017, and can be located on the MPERA website. The long-term expected rate of return on pension planinvestments was determined by considering information from various sources, including historical rates of return, rateof return assumptions adopted by similar public pension systems, and by using a building-block method in which best-estimate ranges of expected future real rates of return (expected returns, net of pension plan investment and inflation)are developed for each major asset class. These ranges were combined to produce the long-term expected rate of returnby weighing the expected future real rates of return by the target asset allocation percentage and by adding expectedinflation. Best estimates of the arithmetic real rates of return for each major asset class included in the VFCA’s targetasset allocation as of June 30, 2017, is summarized in the table that follows:
Asset ClassTarget Asset
AllocationLong-term ExpectedReal Rate of Return
Cash Equivalents 2.60% 4.00%Domestic Equity 36.00% 4.55%Foreign Equity 18.00% 6.35%Fixed Income 23.40% 1.00%Private Equity 12.00% 7.75%Real Estate 8.00% 4.00%
Sensitivity AnalysisIn accordance with GASB 68 regarding the disclosure of the sensitivity of the net pension liability to changes in thediscount rate, the above table presents the net pension liability calculated using the discount rate of 7.65%, as well aswhat the net pension liability would be if it were calculated using a discount rate that is 1.00% lower (6.65%) or 1.00%higher (8.65%) than the current rate.
(in thousands)1.0% Decrease
(6.65%)Current
Discount Rate1.0% Increase
(8.65%)State as a Nonemployer Entity
Net Pension Liability $ 14,675 $ 10,087 $ 6,202
Net Pension LiabilityIn accordance with GASB 68, employers and nonemployer contributing entities are required to recognize and reportcertain amounts associated with their participation in the VFCA. GASB 68 became effective June 30, 2015, and includesrequirements to record and report proportionate shares of the collective net pension liability, pension expense, deferredinflows of resources, and deferred outflows of resources associated with pensions.
In accordance with GASB 68, the VFCA has a special funding situation in which the State is legally responsible formaking contributions directly to the VFCA on behalf of volunteer employers. Due to the existence of this special fundingsituation, the State is required to report a proportionate share of a volunteer fire company’s collective net pensionliability that is associated with the non-State volunteer employer.
B-114

(dollars presented in thousands)Net Pension Liability
as of 6/30/16Net Pension Liability
as of 6/30/17Percent of
Collective NPLState as a Nonemployer
Proportionate Share $ 10,599 $ 10,087 100%
At June 30, 2018, the State reported a liability of $10.1 million for its proportionate share of the net pension liability.The total pension liability used to calculate the net pension liability was determined by an actuarial valuation as of June30, 2016, with update procedures used to roll forward the total pension liability to June 30, 2017. The nonemployer’sproportion of the net pension liability was based on the nonemployer’s contributions received by the VFCA during themeasurement period, July 1, 2016, through June 30, 2017, relative to total contributions received.
Changes in actuarial assumptions and methods: The following changes have been made to the actuarialassumptions:
1. The discount rate was lowered from 7.75% to 7.65%2. The inflation rate was reduced from 3.00% to 2.75%3. The non-disabled mortality and withdrawal assumptions were updated.
Changes in benefit terms: There have been no changes in benefit terms since the previous measurementdate.
Changes in proportionate share: There were no changes between the measurement date of the collectivenet pension liability and the nonemployer’s reporting date that are expected to have a significant effecton the nonemployer’s proportionate share of the collective net pension liability.
Grant Expense Related to Special FundingThe State as a nonemployer contributing entity recognized grant expense of $1.3 million for special funding supportprovided by a portion of fire tax premiums paid to the State and transferred to MPERA for its proportionate share ofthe VFCA pension expense that is associated with other employer participants in the plan.
Deferred Outflows and InflowsAt June 30, 2018, the State as a nonemployer contributing entity recognized a beginning deferred outflow of resourcesfor fiscal year 2017 contributions of $2.1 million.
As of the fiscal year ended June 30, 2018, the State as a nonemployer contributing entity reported its proportionateshare of deferred outflows of resources and deferred inflows of resources related to VFCA from the following sources:
(in thousands)Deferred Outflows
of ResourcesDeferred Inflows of
ResourcesDifference between expected and actual
experience $ — $ 908
Change of assumptions 1,521 —
Net difference between projected and actualearnings on pension plan investments 103 —
Contributions paid to VFCA subsequent to themeasurement date – FY 2018 Contributions 2,207 —
Totals $ 3,831 $ 908
Amounts reported as deferred outflows of resources related to pensions resulting from the State’s contributions madesubsequent to the June 30, 2017, measurement date will be recognized as a reduction of the net pension liability in thefiscal year ended June 30, 2019.
B-115
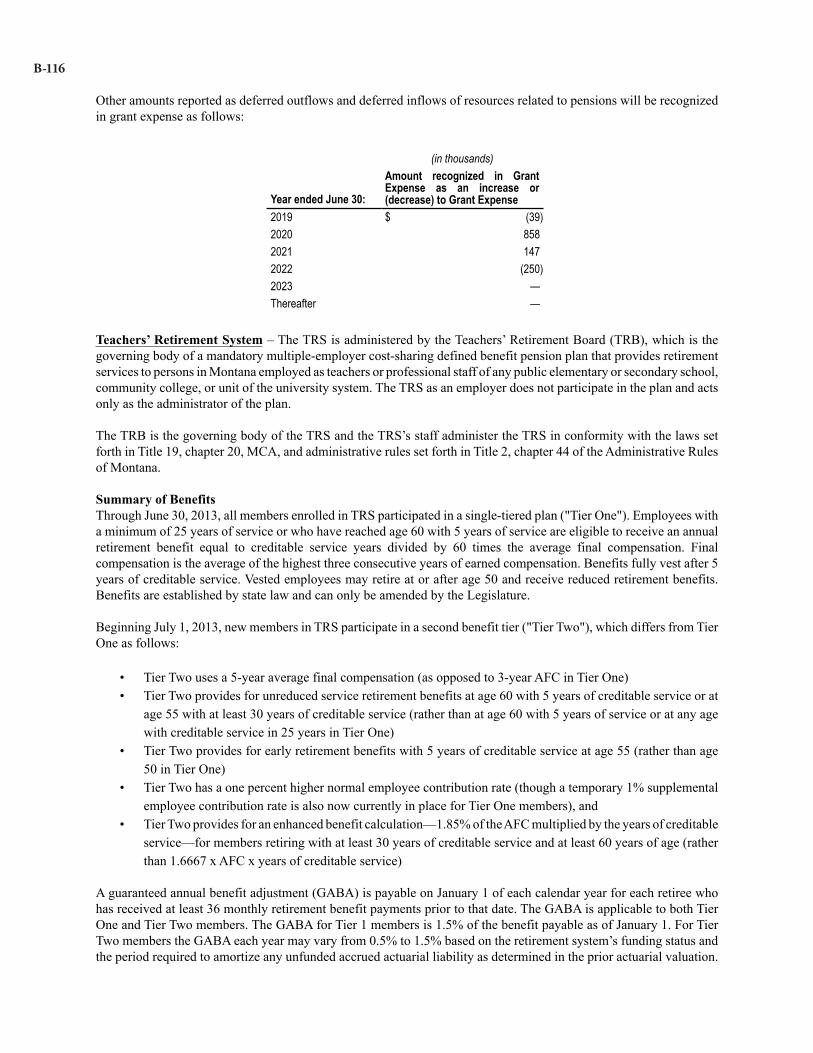
Other amounts reported as deferred outflows and deferred inflows of resources related to pensions will be recognizedin grant expense as follows:
(in thousands)
Year ended June 30:
Amount recognized in GrantExpense as an increase or(decrease) to Grant Expense
2019 $ (39)2020 8582021 1472022 (250)2023 —Thereafter —
Teachers’ Retirement System – The TRS is administered by the Teachers’ Retirement Board (TRB), which is thegoverning body of a mandatory multiple-employer cost-sharing defined benefit pension plan that provides retirementservices to persons in Montana employed as teachers or professional staff of any public elementary or secondary school,community college, or unit of the university system. The TRS as an employer does not participate in the plan and actsonly as the administrator of the plan.
The TRB is the governing body of the TRS and the TRS’s staff administer the TRS in conformity with the laws setforth in Title 19, chapter 20, MCA, and administrative rules set forth in Title 2, chapter 44 of the Administrative Rulesof Montana.
Summary of Benefits Through June 30, 2013, all members enrolled in TRS participated in a single-tiered plan ("Tier One"). Employees witha minimum of 25 years of service or who have reached age 60 with 5 years of service are eligible to receive an annualretirement benefit equal to creditable service years divided by 60 times the average final compensation. Finalcompensation is the average of the highest three consecutive years of earned compensation. Benefits fully vest after 5years of creditable service. Vested employees may retire at or after age 50 and receive reduced retirement benefits.Benefits are established by state law and can only be amended by the Legislature.
Beginning July 1, 2013, new members in TRS participate in a second benefit tier ("Tier Two"), which differs from TierOne as follows:
• Tier Two uses a 5-year average final compensation (as opposed to 3-year AFC in Tier One)• Tier Two provides for unreduced service retirement benefits at age 60 with 5 years of creditable service or at
age 55 with at least 30 years of creditable service (rather than at age 60 with 5 years of service or at any agewith creditable service in 25 years in Tier One)
• Tier Two provides for early retirement benefits with 5 years of creditable service at age 55 (rather than age50 in Tier One)
• Tier Two has a one percent higher normal employee contribution rate (though a temporary 1% supplementalemployee contribution rate is also now currently in place for Tier One members), and
• Tier Two provides for an enhanced benefit calculation— 1.85% of the AFC multiplied by the years of creditableservice— for members retiring with at least 30 years of creditable service and at least 60 years of age (ratherthan 1.6667 x AFC x years of creditable service)
A guaranteed annual benefit adjustment (GABA) is payable on January 1 of each calendar year for each retiree whohas received at least 36 monthly retirement benefit payments prior to that date. The GABA is applicable to both TierOne and Tier Two members. The GABA for Tier 1 members is 1.5% of the benefit payable as of January 1. For TierTwo members the GABA each year may vary from 0.5% to 1.5% based on the retirement system’s funding status andthe period required to amortize any unfunded accrued actuarial liability as determined in the prior actuarial valuation.
B-116

Contributions to the SystemAll active employees in the TRS, regardless of employer type, are required to provide a contribution equal to 8.15%of their compensation.
All State and University employers are required to contribute 11.25% of compensation provided to an active,nonreemployed member. All school district and other employers are required to contribute 8.87% of an active,nonreemployed, member's compensation to the System.
Section 19-20-605, MCA, requires each employer to contribute 9.85% of total compensation paid to all reemployedTRS retirees employed in a TRS reportable position. Pursuant to Section 19-20-609, MCA, this amount shall increaseby 1.00% for fiscal year 2014 and increase by 0.10% each fiscal year through 2024 until the total employer contributionis equal to 11.85% of reemployed retiree compensation.
The TRS receives a portion of the total required statutory contributions directly from the State for all employers. Theemployers are considered to be in a special funding situation and the State is treated as a nonemployer contributingentity in the TRS. The System receives 0.11% of reportable compensation from the General Fund for all TRS members.The TRS also receives 2.38% of reportable compensation from the General Fund for school districts and other employers.Finally, the State is also required to contribute $25 million in perpetuity payable July 1 of each year. The Legislaturehas the authority to establish and amend contribution rates to the plan.
Actuarial AssumptionsThe total pension liability as of June 30, 2017, is based on the results of an actuarial valuation date of July 1, 2017.There were several significant assumptions and other inputs used to measure the total pension liability. The actuarialassumptions used in the July 1, 2017, valuation were based on the results of the last actuarial experience study, datedMay 1, 2014. Among those assumptions were the following:
• Total wage increases 4.00% to 8.51% for non-university members(includes 4% general wage increase assumption) 5.00% for university members
• Investment Return 7.75%• Price Inflation 3.25% • Postretirement Benefit Increases (starting three years after retirement)
◦ Tier One members: If the retiree has received benefits for at least three years, the retirement allowancewill be increased by 1.5% on January 1.
◦ Tier Two members: The retirement allowance will be increased by an amount equal to or greater than .5%but no more than 1.5% if the most recent actuarial valuation shows the TRS to be at least 90% fundedand the provisions of the increase is not projected to cause the funded ratio to be less than 85%.
• Mortality among contributing members, service retired members, and beneficiaries◦ For Males: 1992 base rates from the RP 2000 Healthy Annuitant Mortality Table for ages 50 and above
and 1992 base rates from the RP 2000 Combined Healthy Annuitant Mortality Table for ages below 50,set back four years, with mortality improvements projected by Scale BB to 2018.
◦ For Females: 1992 base rates from the RP 2000 Healthy Annuitant Mortality Table for ages 50 and aboveand 1992 base rates from the RP 2000 Combined Healthy Annuitant Mortality Table for ages below 50,set back two years, with mortality improvements projected by Scale BB to 2018.
• Mortality among disabled members◦ For Males: RP 2000 Disabled Mortality Table for Males, set forward one year, with mortality improvements
projected by Scale BB to 2018.◦ For Females: RP 2000 Disabled Mortality Table for Females, set forward five years, with mortality
improvements projected by Scale BB to 2018.
Discount Rate The discount rate used to measure the total pension liability was 7.75%. The projection of cash flows used to determinethe discount rate assumed that contributions from participating TRS members, employers, and nonemployer contributingentities will be made based on the TRB’s funding policy, which establishes the contractually required rates under MCA.In addition to these contributions, the State General Fund will contribute $25 million annually to the TRS payable July1 of each year. Based on those assumptions, the TRS’s fiduciary net position was projected to be adequate to make allthe projected future benefit payments of current plan members through the year 2122. Therefore, the long-term expected
B-117

rate of return on pension plan investments was applied to all periods of projected benefit payments to determine thetotal pension liability. No municipal bond rate was incorporated in the discount rate.
Target AllocationsThe assumed long-term expected return on pension plan assets is reviewed as part of the regular experience studiesprepared for the TRS. The most recent analysis, performed for the period covering fiscal years 2009 through 2013, isoutlined in a report dated May 1, 2014. Several factors are considered in evaluating the long-term rate of returnassumption including long-term historical data, estimates inherent in current market data, and a log-normal distributionanalysis in which best-estimate ranges of expected future real rates of return (expected return, net of investment expenseand inflation) were developed by the investment consultant for each major asset class. These ranges were combined toproduce the long-term expected rate of return by weighting the expected future real rates of return by the target assetallocation percentage and then adding expected inflation. The capital market assumptions developed by the investmentconsultant are intended for use over a 10-year horizon and may not be useful in setting the long-term rate of return forfunding pension plans which covers a longer timeframe. The assumption is intended to be a long-term assumption andis not expected to change absent a significant change in the asset allocation, a change in the inflation assumption, or afundamental change in the market that alters expected returns in future years. Best estimates of arithmetic real rates ofreturn for each major asset class included in the TRS’s target asset allocation as of June 30, 2017, is summarized in thetable below:
Asset ClassTarget Asset
AllocationLong-Term ExpectedReal Rate of Return
Broad US Equity 36.00% 4.80%Broad International Equity 18.00% 6.05%Private Equity 12.00% 8.50%Intermediate Bonds 23.40% 1.50%Core Real Estate 4.00% 4.50%High Yield Bonds 2.60% 3.25%Non-Core Real Estate 4.00% 7.50%
Sensitivity AnalysisIn accordance with GASB 68 regarding the disclosure of the sensitivity of the net pension liability to changes in thediscount rate, the table below presents the net pension liability calculated using the discount rate of 7.75%, as well aswhat the net pension liability would be if it were calculated using a discount rate that is 1.00% lower (6.75%) or 1.00%higher (8.75%) than the current rate.
(in thousands)1.0% Decrease
(6.75%)Current Discount
Rate1.0% Increase
(8.75%)State as an Employer in TRS – Net
Pension Liability $ 66,458 $ 48,227 $ 32,872
State as a Nonemployer ContributingEntity to TRS – Net Pension Liability 886,016 642,958 438,252
B-118

Net Pension LiabilityIn accordance with GASB 68, employers and nonemployer contributing entities are required to recognize and reportcertain amounts associated with their participation in the TRS. GASB 68 became effective June 30, 2015, and includesrequirements for participants to record and report their proportionate share of the collective net pension liability, pensionexpense, deferred inflows of resources, and deferred outflows of resources associated with pensions. In accordancewith GASB 68, the TRS has a special funding situation in which the State is legally responsible for making contributionsdirectly to TRS that are used to provide pension benefits to the retired members of the TRS. Due to the existence ofthis special funding situation, the State is required to report a proportionate share of a local government or schooldistrict’s collective net pension liability that is associated with the non-State employer.
(dollars presented in thousands)Net Pension Liability
as of 6/30/16Net Pension Liability
as of 6/30/17Percent of
Collective NPLState's as an Employer Entity $ 57,016 $ 48,227 2.860298%State's as a Nonemployer Entity 707,527 642,958 38.133267%
State of Montana Totals $ 764,543 $ 691,185 40.993565%
At June 30, 2018, the State reported a liability of $691.2 million for its proportionate share of the net pension liabilityas an employer and nonemployer contributing entity. The net pension liability was measured as of June 30, 2017, andthe total pension liability used to calculate the net pension liability was determined by an actuarial valuation as of July1, 2017. The employer’s proportion of the net pension liability was based on the State’s contributions received by theTRS during the measurement period, July 1, 2016, through June 30, 2017, relative to the all contributions receivedfrom the TRS’s participating employers and the nonemployer contributing entity.
Changes in actuarial assumptions and methods: Since the previous measurement date, there have been nochanges in actuarial assumptions or methods.
Changes in benefit terms: There have been no changes in benefit terms since the previous measurement date.
Changes in proportionate share: There were no changes between the measurement date of the collective netpension liability and the employer’s reporting date.
Employer Pension Expense and Nonemployer Contributing Entity Special Funding Grant ExpenseAt June 30, 2018, the State as an employer recognized a pension expense of $12.1 million for its proportionate shareof the collective TRS pension expense. The State as a nonemployer contributing entity also recognized grant expenseof $31.5 million for special funding support provided by the State’s General Fund for its proportionate share of thecollective TRS pension expense that is associated with other employer participants in the TRS. Total pension relatedexpenses for fiscal year 2018 was $43.6 million.
Deferred Outflows and InflowsAt June 30, 2018, the State as an employer recognized a beginning deferred outflow of resources for fiscal year 2017contributions of $17.4 million.
B-119

As of the fiscal year ended June 30, 2018, the State as an employer reported its proportionate share of deferred outflowsof resources and deferred inflows of resources related to the TRS from the following sources:
(in thousands)Deferred Outflows
of ResourcesDeferred Inflows of
ResourcesDifference between expected and actual
experience $ 177 $ 72
Net difference between projected and actualearnings on pension plan investments — 191
Change of assumptions — 202Changes in proportion and differences between
employer contributions and proportionateshare of contributions
12,411 1,355
Contributions paid to TRS subsequent to themeasurement date – FY 2018 Contributions 17,298 —
Totals $ 29,886 $ 1,820
Amounts reported as deferred outflows of resources related to pensions resulting from the employer’s contributionsmade subsequent to the June 30, 2017, measurement date will be recognized as a reduction of the net pension liabilityin the fiscal year ended June 30, 2019.
Other amounts reported as deferred outflows of resources and inflows of resources related to pensions will be recognizedin pension expense as follows:
(in thousands)
Year ended June 30:
Amount recognized in PensionExpense as an increase or
(decrease) to Pension Expense2019 $ 4,9712020 4,6032021 2,0472022 (853)2023 —Thereafter —
At June 30, 2018, the State as a nonemployer contributing entity recognized a beginning deferred outflow of resourcesfor fiscal year 2017 contributions of $43.0 million.
B-120

As of the fiscal year ended June 30, 2018, the State as a nonemployer contributing entity reported its proportionateshare of deferred outflows of resources and deferred inflows of resources from the following sources:
(in thousands)Deferred Outflows
of ResourcesDeferred Inflows
of ResourcesDifference between expected and actual experience $ 2,365 $ 961Net difference between projected and actual
earnings on pension plan investments — 2,544
Changes of assumptions — 2,688Changes in proportion and differences between
employer contributions and proportionate shareof contributions
6,375 32,164
Contributions paid to TRS subsequent to themeasurement date – FY 2018 Contributions 43,718 —
Totals $ 52,458 $ 38,357
Amounts reported as deferred outflows of resources related to pensions resulting from the nonemployer’s contributionssubsequent to the June 30, 2017, measurement date will be recognized as a reduction of the net pension liability in thefiscal year ended June 30, 2019.
Other amounts reported as deferred outflows and inflows of resources related to pensions will be recognized in grantexpense as follows:
(in thousands)
Year ended June 30:
Amount recognized in GrantExpense as an increase or(decrease) to Grant Expense
2019 $ (23,280)2020 3,5702021 1,4412022 (11,348)2023 —Thereafter —
D. Legal Actuarial Status of Plans
The Montana Constitution, Article VIII, Section 15, states that public retirement systems shall be funded on an actuariallysound basis. To maintain a fund on an actuarially sound basis, the rate of contributions should fund the normal cost, inaddition to amortizing the unfunded liability over a period not to exceed 30 years.
The statutory funding rate is tested in the valuation of each public retirement plan to determine if it is sufficient to coverthe normal cost rate plus an amortization payment of the unfunded actuarial liability, if any, within 30 years. As of June30, 2018, the Game Warden & Peace Officers’ Retirement System (GWPORS), the Highway Patrol Officers’ RetirementSystem (HPORS), the Public Employees’ Retirement System-Defined Benefit Retirement Plan (PERS-DBRP), andthe Teachers’ Retirement System (TRS) were not in compliance and do not amortize within 30 years.
E. Public Employee Defined Contribution Retirement Plans
Public Employees’ Retirement System-Defined Contribution Retirement Plan – The Public Employees’ RetirementSystem - Defined Contribution Retirement Plan (PERS-DCRP) is a multiple Employer plan established July 1, 2002,and governed by Title 19, Chapters 2 & 3, MCA. This plan is available to eligible employees of the State, MontanaUniversity System, local governments, and school districts. All new PERS members are initially members of the PERS-DBRP and have a 12-month window during which they may choose to transfer to the PERS-DCRP, or remain in thePERS-DBRP, by filing an irrevocable election. If an election is not filed, the member remains in the PERS-DBRP.
B-121

Members may not be members of both the defined contribution and defined benefit retirement plans. The PERS-DBRCprovides retirement, disability and death benefits to plan members and their beneficiaries.
Member and Employer contribution rates are established by state law and may be amended only by the Legislature.Employees contribute at a rate of 7.90% of their compensation. Contributions made to the plan by an employee remain100% vested in their interest. Members who achieve 5 years of employment are vested in the plan. Should theyterminate prior to this 5-year period, all employer contributions are forfeited to the plan. Amounts forfeited are held ina separate plan forfeiture account and can only be used to pay the administrative expenses, including startup costs, ofthe plan. Total pension expense for the State as a PERS-DCRP employer for the year ended June 30, 2018, is $6.9million and contribution forfeitures were $746.1 thousand.
Local government entities contribute 8.47% of member compensation. School district employers contributed 8.20%of member compensation. The State contributes 0.10% of member compensation on behalf of local government entitiesand 0.37% of member compensation on behalf of school district entities. Each State agency and University employercontributed 8.57% of member compensation.
The total contribution rate of 8.57%, referenced in the preceding paragraph, is allocated as follows: 8.23% to themember’s retirement account; 0.04% to the defined contribution education fund; and 0.30% to the defined contributionOther Post Employment Benefit (OPEB) disability plan.
The PERS-DCRP also administers an OPEB disability plan. Refer to PERB's annual financial report for additionalinformation related to this portion of the plan.
457-Deferred Compensation Plan – The 457-Deferred Compensation Plan (457-Plan) is a voluntary supplementalretirement savings plan established in 1974. The Deferred Compensation Plan is governed by Title 19, Chapter 50,MCA, in accordance with Internal Revenue Code (IRC) Section 457. This plan is available to all employees of theState, Montana University System, and contracting political subdivisions. The State and 53 non-state entity employersparticipate in the 457-Plan.
Assets of the Deferred Compensation Plan are required to be held in trusts, custodial accounts or insurance companycontracts for the exclusive benefit of participants and their beneficiaries. Empower Retirement™ is the record keeperfor the plan. Participants elect to defer a portion of their salary, within IRC limits. The deferred salary is not availableto employees until separation from service, retirement, death, or upon an unforeseeable emergency while still employed,provided IRS-specified criteria are met.
F. Montana University System Retirement Program
Montana University System-Retirement Program (MUS-RP) – This system was established in January 1988 andis underwritten by the Teachers Insurance and Annuity Association (TIAA). Effective July 1, 1993, MUS-RP was madethe mandatory retirement plan for new faculty and administrative staff with contracts under the authority of the Boardof Regents, previously referred to as the Optional Retirement Program (ORP). The MUS-RP is a defined contributionretirement plan governed by Title 19, Chapter 21 of the MCA. Combined contributions to the faculty and professionalstaff plan cannot exceed 13% of the participant’s compensation per 19-21-203, MCA. Combined contributions to theclassified staff plan are 16.47% per 19-3-316, MCA.
The benefits at retirement depend upon the amount of contributions, amount of investment gains and losses, and theemployee life expectancy at retirement. Under the MUS-RP, each employee enters into an individual contract withTIAA. Individuals are immediately vested with all contributions. The Montana University System records employee/employer contributions, and remits monies to TIAA. Total contributions made to the plan by the employer were $16.9million and the total employee contributions were $19.5 million for the fiscal year ended June 30, 2018.
G. Method Used to Value Investments
The Montana Board of Investments (BOI) manages the investments, as authorized by state law, for the defined benefitretirement plans in two investment pools, the Consolidated Asset Pension Pool (CAPP) and the Short-Term InvestmentPool (STIP). CAPP is an internal investment pool and STIP is an external investment pool. Each retirement plan’s
B-122

ownership in the pools is based on the funds contributed. Individual investments in the pools are not specificallyidentified to the respective retirement plan. Investments are reported at either fair value or cost, depending on theunderlying investment type. Mortgages are valued on the basis of future principal and interest payments and arediscounted at prevailing interest rates for similar instruments. The fair value of direct real estate investments is basedon appraised value. Investments that do not have an established market are reported at estimated fair value. These valuesare based on market prices supplied to the BOI by its custodial bank, State Street Bank, and various brokerage services.Further detail related to investments is provided in Note 3.
H. Long-term Contracts for Contributions
The Montana Legislature enacted a provision of the Employee Protection Act (EPA) (Title 19, Chapter 2, Part 706,MCA) allowing state and university system employees who are eligible for a service retirement and whose positionshave been eliminated to have their Employer pay a portion of the total cost of purchasing up to three years of “1-for-5”additional service. In fiscal year 2018, there were 254 employees participating in the program.
The Employer has up to ten years to complete payment for the service purchases and is charged the actuarially requiredrate of return as established by the Montana Public Employee Retirement Administration (MPERA) on the unpaidbalance. Total contributions received (including interest) during fiscal year 2018 totaled $261.8 thousand. Theoutstanding balance at June 30, 2018, totaled $16.0 thousand.
I. Litigation
Tadman, et al. v. State. A retired member of the Sheriffs' Retirement System filed a class action against the State ofMontana on October 6, 2015, alleging the inappropriate payment of state and federal income tax on certain line-of-duty disability benefits. The plaintiff is represented by Lawrence A. Anderson, an attorney located in Great Falls,Montana. The State was served with the Complaint on November 25, 2015, and is represented by Eric Biehl and HannaWarhank from Church, Harris, Johnson & Williams PC, in Great Falls, Montana and MPERA legal counsel. The Stateresponded and filed an amended answer to the complaint before filing a motion and brief to change venue and/or todismiss the matter for lack of subject matter jurisdiction. Following a hearing on June 1, 2017, the State’s motionswere denied. Discovery requests and responses have been served by both parties. The plaintiff’s motion for classcertification was filed October 31, 2017. A third set of discovery requests resulted in plaintiff expanding the issues toinclude conversion of a disability benefit to a service retirement benefit at normal retirement age. A supplemental setof briefs were filed as of October 2018 and the parties await a ruling from Judge Pinski on plaintiff’s motion for classcertification.
B-123

NOTE 7. OTHER POSTEMPLOYMENT BENEFITS (OPEB)
A. General Information Non-trust Plans
The State of Montana (State) and the Montana University System (MUS) provide optional postemployment healthcarebenefits in accordance with Section 2-18-704, MCA to the following employees and dependents who elect to continuecoverage and pay administratively established contributions: (1) employees and dependents who retire under applicableretirement provisions and (2) surviving dependents of deceased employees. Medical, dental, and vision benefits areavailable through this plan. The State and MUS offer OPEB plans that are not administered through trusts; as such,there are no plan assets accumulated to offset the total OPEB liability.
In accordance with Section 2-18-704, MCA, the State provides post-retirement health insurance benefits to eligibleemployees who receive retirement benefits from the Public Employees’ Retirement System (PERS) or various otherState retirement systems, and elect to start medical coverage within 60 days of leaving employment. Retirementeligibility criteria differ by State retirement plan. Further detail on State Retirement Plans are provided in Note 6. MUSprovides post-retirement health insurance benefits to eligible employees who receive retirement benefits from theirplan, or an annuity under the MUS-RP, and have been employed by MUS for at least five years, are age 50, or haveworked 25 years with MUS. They must elect to start medical coverage within 60 days of leaving employment. Spouses,unmarried dependent children, and surviving spouses are also eligible for both plans.
Montana State Fund, a discretely presented component of the State and participant in the State OPEB plan, by statute,prepares separately issued financial statements on a calendar year-end basis. Due to the difference in reporting period,there will be a variance between the note disclosures and the financial statements for OPEB related information.
B. Plan Descriptions
Both healthcare OPEB plans for the State and MUS are reported as single employer plans. In addition to the primarygovernment, the participating employers under the State OPEB plan are: Facility Finance Authority, Montana Boardof Housing, Public Employees’ Retirement System, Montana State Fund, and Teachers’ Retirement System. Theparticipating employers under the MUS OPEB plan are: Office of Commissioner of Higher Education (OCHE), MontanaState University - Billings (MSU-Billings), Montana State University - Bozeman (MSU-Bozeman), Great Falls CollegeMSU, Montana State University - Northern (MSU-Northern), Montana Technological University, Helena College UM,University of Montana - Missoula (UM-Missoula), and University of Montana - Western (UM-Western). Participatingemployers under MUS, but excluded from the total OPEB liability due to not qualifying as component units, are:Dawson Community College (Dawson CC), Flathead Valley Community College (Flathead CC), and Miles CommunityCollege (Miles CC). Each participating employer is required to disclose additional information as required per GASBStatement No. 75, Accounting and Financial Reporting for Postemployment Benefits Other than Pensions (GASB 75).
The State and MUS pay for post employment healthcare benefits on a pay-as-you-go basis. Section 2-18-8, MCA givesauthority for establishing and amending the funding policy to the Department of Administration for the State grouphealth insurance plan. Section 20-25-13, MCA gives authority for establishing and amending the funding policy to theBoard of Regents for the MUS group health insurance plan. The healthcare OPEB plans allow retirees to participate,as a group, at a rate that does not cover all of the related costs. This results in reporting the total OPEB liability in therelated financial statements and note disclosures. Reported contributions are not a result of direct funding to the plansor for associated liabilities, but are a measure of the difference in retiree payments into the plans and actual medicalcosts associated with those individuals paid for by the plans. The healthcare OPEB plans are reported as agency funds.There are no assets or liabilities as only contributions collected and distributions made are reflected in these funds.
As of December 31, 2017, the State OPEB plan’s administratively established retiree medical premiums vary between$439.00 and $1,633.00 per month, depending on the medical plan selected, family coverage, and Medicare eligibility.Administratively established dental premiums vary between $41.10 and $70.00 and vision hardware premiums varybetween $7.64 and $22.26, depending on the coverage selected. The plan provides different coinsurance amounts anddeductibles depending on whether members use in-network or out-of-network providers. The plan automatically reducesclaim reimbursement for members eligible for Medicare, even if the member is not enrolled in Medicare.
B-124

NOTE 7. OTHER POSTEMPLOYMENT BENEFITS (OPEB)
A. General Information Non-trust Plans
The State of Montana (State) and the Montana University System (MUS) provide optional postemployment healthcarebenefits in accordance with Section 2-18-704, MCA to the following employees and dependents who elect to continuecoverage and pay administratively established contributions: (1) employees and dependents who retire under applicableretirement provisions and (2) surviving dependents of deceased employees. Medical, dental, and vision benefits areavailable through this plan. The State and MUS offer OPEB plans that are not administered through trusts; as such,there are no plan assets accumulated to offset the total OPEB liability.
In accordance with Section 2-18-704, MCA, the State provides post-retirement health insurance benefits to eligibleemployees who receive retirement benefits from the Public Employees’ Retirement System (PERS) or various otherState retirement systems, and elect to start medical coverage within 60 days of leaving employment. Retirementeligibility criteria differ by State retirement plan. Further detail on State Retirement Plans are provided in Note 6. MUSprovides post-retirement health insurance benefits to eligible employees who receive retirement benefits from theirplan, or an annuity under the MUS-RP, and have been employed by MUS for at least five years, are age 50, or haveworked 25 years with MUS. They must elect to start medical coverage within 60 days of leaving employment. Spouses,unmarried dependent children, and surviving spouses are also eligible for both plans.
Montana State Fund, a discretely presented component of the State and participant in the State OPEB plan, by statute,prepares separately issued financial statements on a calendar year-end basis. Due to the difference in reporting period,there will be a variance between the note disclosures and the financial statements for OPEB related information.
B. Plan Descriptions
Both healthcare OPEB plans for the State and MUS are reported as single employer plans. In addition to the primarygovernment, the participating employers under the State OPEB plan are: Facility Finance Authority, Montana Boardof Housing, Public Employees’ Retirement System, Montana State Fund, and Teachers’ Retirement System. Theparticipating employers under the MUS OPEB plan are: Office of Commissioner of Higher Education (OCHE), MontanaState University - Billings (MSU-Billings), Montana State University - Bozeman (MSU-Bozeman), Great Falls CollegeMSU, Montana State University - Northern (MSU-Northern), Montana Technological University, Helena College UM,University of Montana - Missoula (UM-Missoula), and University of Montana - Western (UM-Western). Participatingemployers under MUS, but excluded from the total OPEB liability due to not qualifying as component units, are:Dawson Community College (Dawson CC), Flathead Valley Community College (Flathead CC), and Miles CommunityCollege (Miles CC). Each participating employer is required to disclose additional information as required per GASBStatement No. 75, Accounting and Financial Reporting for Postemployment Benefits Other than Pensions (GASB 75).
The State and MUS pay for post employment healthcare benefits on a pay-as-you-go basis. Section 2-18-8, MCA givesauthority for establishing and amending the funding policy to the Department of Administration for the State grouphealth insurance plan. Section 20-25-13, MCA gives authority for establishing and amending the funding policy to theBoard of Regents for the MUS group health insurance plan. The healthcare OPEB plans allow retirees to participate,as a group, at a rate that does not cover all of the related costs. This results in reporting the total OPEB liability in therelated financial statements and note disclosures. Reported contributions are not a result of direct funding to the plansor for associated liabilities, but are a measure of the difference in retiree payments into the plans and actual medicalcosts associated with those individuals paid for by the plans. The healthcare OPEB plans are reported as agency funds.There are no assets or liabilities as only contributions collected and distributions made are reflected in these funds.
As of December 31, 2017, the State OPEB plan’s administratively established retiree medical premiums vary between$439.00 and $1,633.00 per month, depending on the medical plan selected, family coverage, and Medicare eligibility.Administratively established dental premiums vary between $41.10 and $70.00 and vision hardware premiums varybetween $7.64 and $22.26, depending on the coverage selected. The plan provides different coinsurance amounts anddeductibles depending on whether members use in-network or out-of-network providers. The plan automatically reducesclaim reimbursement for members eligible for Medicare, even if the member is not enrolled in Medicare.
As of June 30, 2018, the MUS OPEB plan’s administratively established retiree medical premiums vary between$327.00 and $2,403.00 per month. Retiree dental premiums vary between $52.00 and $156.00 per month while visionpremiums vary from $9.71 to $28.31, depending on the types and number of dependents enrolled. The plan providesdifferent coinsurance amounts and deductibles depending on whether members use in-network or out-of-networkproviders. The plan automatically reduces claim reimbursement for members eligible for Medicare, even if the memberis not enrolled in Medicare.
C. Basis of Accounting
Total OPEB liability is reported on an accrual basis on the proprietary and fiduciary fund financial statements, thegovernment-wide financial statements and the component unit financial statements. Total OPEB liability is not reportedon the governmental fund financial statements, as it is considered a long-term liability. Plan member contributions arerecognized in the period in which the contributions are made. Benefits and refunds are recognized when due and payablein accordance with the terms of each plan.
Both OPEB plans state, “An employee enrolled in the State OPEB plan who (a) at least meets the early retirementcriteria defined by Montana Public Employees’ Retirement Administration (MPERA); and (b) makes arrangementswith the Health Care and Benefits Division (HCBD), within 60 days of the date active employee coverage ends, tocontinue post-retirement coverage, may continue with the State OPEB plan on a self-pay basis, retroactive back to thedate active employee coverage was lost,” and adhere to these provisions. Therefore, each plan does not include terminatedemployees who have accumulated benefits but are not yet receiving them. There have been no significant changes inthe number covered or the type of coverage as of June 30, 2018.
The number of State Plan participants as of March 31, 2018, follows:
State Plan Participants
Enrollment State (1)
FacilityFinance
Authority (2)
MontanaBoard
of Housing (2)
Public EmployeeRetirement
Board (2)
MontanaState
Fund (2)
TeachersRetirementSystem (2) Total
Active employees 12,210 1 15 46 293 20 12,585Retired employees, spouses, and surviving spouses 2,846 2 3 1 14 7 2,873 Total 15,056 3 18 47 307 27 15,458
The number of MUS Plan participants as of March 31, 2018, follows:
MUS Plan Participants
EnrollmentMSU-
GFC (2)UM-
HC (2)MSU-
Billings (2)MSU-
Bozeman (2)MSU-
Northern (2) OCHE (1)UM-
Missoula (2)
UM-MT
Tech (2)
UM-Western (2) Total
Active employees 120 97 462 3,094 176 61 2,143 437 188 6,778Retired employees, spouses, and surviving spouses 7 20 136 578 42 23 579 102 61 1,548 Total 127 117 598 3,672 218 84 2,722 539 249 8,326
(1) Primary Government(2) Discrete Component Units of Primary Government
B-125

D. Schedule of Changes in Total OPEB liability
The following table presents the other items related to and changes in the Total OPEB liability:
Annual OPEB Cost & Changes in Total OPEB liability(in thousands)
State Plan MUS PlanPrimary
GovernmentOPEB
liability
DiscreteComponentUnit OPEB
liabilityTotal State
Plan
PrimaryGovernment
OPEBliability
DiscreteComponentUnit OPEB
liabilityTotal MUS
PlanBalances at 6/30/2017 (Restated) $ 48,914 $ 955 $ 49,869 $ 421 $ 33,837 $ 34,258Changes for the year:
Service Cost 1,775 114 1,889 (12) 1,966 1,954Interest 1,889 125 2,014 17 1,393 1,410Difference between Expected andActual Experience (4,430) (293) (4,723) (15) (1,308) (1,323)
Changes of assumptions or otherinputs (277) (18) (295) (2) (180) (182)
Benefit Payments 1,599 106 1,705 (8) (671) (679)Net Changes 556 34 590 (20) 1,200 1,180
Balances at 6/30/2018 $ 49,470 $ 989 $ 50,459 $ 401 $ 35,037 $ 35,438
E. Actuarial Methods and Assumptions
The total OPEB liability (TOL) measured under GASB 75 is based upon service cost and more standardized reportingassumptions than prior GASB Statements. As a pay-as-you-go public entity, GASB 75 requires a 20-year currentmunicipal bond discount rate to establish an Actuarially Determined Contribution (ADC). The GASB 75 valuation isfurther required to show both historical and projected future net changes in TOL, as well as sensitivity to changes inkey underlying assumptions. Actuarially determined amounts are subject to continual revisions being actual results arecompared with past expectations and new estimates are made about the future. Actuarial calculations reflect a long-term perspective. The projection of benefits for financial reporting purposes does not explicitly incorporate the potentialeffects of legal or contractual funding limitations on the pattern of cost sharing between the employer and plan membersin the future.
The schedule of changes in the State’s and MUS's TOL and related ratios, presented as required supplementaryinformation following the notes to the financial statements, is designed to present multi-year trend information aboutwhether the actuarial value of plan TOL is increasing or decreasing over time relative to the actuarial liabilities forbenefits. The schedule of changes in the State’s and MUS's TOL and related ratios are based on the substantive plan(the plan as understood by the employer and the plan members). This includes the types of benefits provided at thetime of each valuation and the historical pattern of sharing of benefit costs between the employer and plan membersto that point.
B-126

The State's OPEB Plan TOL in December 31, 2017, rolled forward to March 31, 2018, actuarial valuation was determinedusing the following actuarial assumptions and other inputs, applied to all periods included in the measurement, unlessotherwise specified:
Other Postemployment BenefitsState Single Employer Plan
Retiree/SurvivingSpouse Spouse
Contributions (in thousands): Before Medicare eligibility $ 13,572 $ 5,268 After Medicare eligibility 5,271 4,403
Actuarial valuation date December 31, 2017
Actuarial measurement date (1) March 31, 2018
Actuarial cost method Entry age normal funding method
Amortization method Open basis
Remaining amortization period 20 years
Asset valuation method Not applicable since no assets meet the definitionof plan assets under GASB 75
Actuarial assumptions: Discount rate 3.89% Projected payroll increases 4.00% Participation: Future retirees 55.00% Future eligible spouses 60.00% Marital status at retirement 70.00%
(1) Updated procedures were used to roll forward the total OPEB liability to the measurement date.
Mortality - Health: For TRS, healthy mortality is assumed to follow the RP-2000 Healthy Annuitant MortalityTable for ages 50 and above and the RP-2000 Combined Healthy Annuitant Mortality Table for ages below50, set back four years for males, set back two years for females, with mortality improvements projected byScale BB to 2018. For all other groups, healthy mortality is assumed to follow the RP-2000 Combined MortalityTable with improvements projected by Scale BB to 2020, set back one year for males.
Mortality - Disabled: For TRS, disabled mortality is assumed to follow the RP-2000 Disabled Mortality Table,set forward one year for males and set forward five years for females, with mortality improvements projectedby Scale BB to 2018. For all other groups, disabled mortality is assumed to follow the RP-2000 CombinedMortality Table with no projections.
Changes in actuarial assumptions and methods since last measurement date: Changes in actuarial methodsinclude adjustments to the amortization period and actuarial cost method to conform with GASB 75requirements. Changes in actuarial assumptions include revised rates per the retirement system pensionvaluations as of July 1, 2017 and interest rate based upon the March 31, 2018, 20-year municipal bond indexper GASB 75 requirements. Other changes include revised rates based on actual data and projected trend andupdated projected healthcare trend rates to follow the Getzen model.
Changes in benefit terms since last measurement date: Medical plans moved from Cigna to Allegiance as ofJanuary 1, 2016, the State implemented reference-based pricing hospital contracts effective July 1, 2016, andpharmacy moved from URx to Navitus as of January 1, 2017. The State implemented an Employer GroupWaiver Program for Medicare retirees effective January 1, 2017.
B-127

Additional information as of the latest actuarial valuation for MUS OPEB plan follows:
Other Postemployment BenefitsMUS Single Employer Plan
Retiree/SurvivingSpouse Spouse
Contributions (in thousands): Before Medicare eligibility $ 11,264 $ 4,728 After Medicare eligibility 4,806 3,620
Actuarial valuation date December 31, 2017
Actuarial measurement date (1) March 31, 2018
Actuarial cost method Entry age normal funding method
Amortization method Open basis
Remaining amortization period 20 year period
Asset valuation method Not applicable since no assets meet the definition ofplan assets under GASB 75
Actuarial assumptions: Discount rate 3.89% Projected payroll increases 4.00% Participation: Future retirees 55.00% Future eligible spouses 60.00% Marital status at retirement 70.00%
(1) Updated procedures were used to roll forward the total OPEB liability to the measurement date.
Mortality - Health: For TRS and MUS-RP, healthy mortality is assumed to follow the RP-2000 HealthyAnnuitant Mortality Table for ages 50 and above and the RP-2000 Combined Healthy Annuitant MortalityTable for ages below 50, set back four years for males, set back two years for females, with mortalityimprovements projected by Scale BB to 2018. For all other groups, healthy mortality is assumed to followthe RP-2000 Combined Mortality Table with improvements projected by Scale BB to 2020, set back one yearfor males.
Mortality - Disabled: For TRS and MUS-RP, disabled mortality is assumed to follow the RP-2000 DisabledMortality Table, set forward one year for males and set forward five years for females, with mortalityimprovements projected by Scale BB to 2018. For all other groups, disabled mortality is assumed to followthe RP-2000 Combined Mortality Table with no projections.
Changes in actuarial assumptions and methods since last measurement date: Changes in actuarial methodsinclude adjustments to the amortization period and actuarial cost method to conform with GASB 75requirements. Changes in actuarial assumptions include revised rates per the retirement system pensionvaluations as of July 1, 2017, and interest rate based upon the March 31, 2018, 20-year municipal bond indexper GASB 75 requirements, lapse rates were removed to reflect a return to standard retiree contribution levels,added employees covered by the MUS-RP, changes in revised rates based on actual data and projected trendand updated projected healthcare trend rates to follow the Getzen model.
Changes in benefit terms since last measurement date: Increased deductible, increased out-of-pocket limitsfor Medical and RX, increased visit copays, pharmacy moved from URx to Navitus as of July 1, 2017, employergroup waiver program for Medicare retirees became effective July 1, 2017, adopted combined annual visitmax of 30 for multiple therapy services and massage therapy moved into rehabilitation benefit.
B-128

Sensitivity of the TOL to changes in the discount rateThe following presents the TOL of the State and MUS OPEB plans, as well as what they would be if calculated usinga discount rate that is 1-percentage-point lower (2.89 percent) or 1-percentage-point higher (4.89 percent) than thecurrent discount rate:
State OPEB plan (in thousands)
1.0% Decrease (2.89%)Current Discount Rate
(3.89%) 1.0% Increase (4.89%)Primary Government $ 60,653 $ 49,470 $ 40,919Discrete Component Units 1,269 989 778
Total OPEB liability $ 61,922 $ 50,459 $ 41,697
MUS OPEB plan (in thousands)
1.0% Decrease (2.89%)Current Discount Rate
(3.89%) 1.0% Increase (4.89%)Primary Government $ 487 $ 401 $ 335Discrete Component Units 42,264 35,037 29,416
Total OPEB liability $ 42,751 $ 35,438 $ 29,751
Sensitivity of the TOL to changes in the healthcare cost trend ratesThe following presents the TOL of the State and MUS OPEB plans, as well as what they would be if calculated usinghealthcare cost trend rates that are 1-percentage-point lower (6.5 percent) or 1-percentage-point higher (8.5 percent)than the current healthcare cost trend rates:
State Plan (in thousands)
1.0% Decrease (6.5%)Current Healthcare Cost
Trend Rate (7.5%) 1.0% Increase (8.5%)Primary Government $ 40,684 $ 49,470 $ 61,332Discrete Component Unit 774 989 1,285
Total OPEB liability $ 41,458 $ 50,459 $ 62,617
MUS Plan (in thousands)
1.0% Decrease (6.5%)Current Healthcare Cost
Trend Rate (7.5%) 1.0% Increase (8.5%)Primary Government $ 330 $ 401 $ 495Discrete Component Unit 28,790 35,037 42,278
Total OPEB liability $ 29,120 $ 35,438 $ 42,773
B-129

OPEB Expense and Deferred Outflows of Resources and Deferred Inflows of Resources Related to OPEBFor the year ended June 30, 2018, the State OPEB plan's OPEB expense is $3.9 million and MUS OPEB plan's OPEBexpense is $3.3 million.
At June 30, 2018, the State OPEB plan deferred outflows and inflows of resources are from the following sources:
State Plan (in thousands)
Deferred Outflows ofResources
Deferred Inflows ofResources
Primary Government
Difference between expected and actual experience $ — $ 4,430Changes of assumptions or other inputs — 277Amounts associated with transactions subsequent to themeasurement date of the total OPEB liability 968 —
Total $ 968 $ 4,707Discrete Component Units
Difference between expected and actual experience $ 114 $ 407Changes of assumptions or other inputs 7 25Amounts associated with transactions subsequent to themeasurement date of the total OPEB liability 24 —
Total $ 145 $ 432
At June 30, 2018, MUS OPEB plan deferred outflows and inflows of resources are from the following sources:
MUS Plan (in thousands)
Deferred Outflows ofResources
Deferred Inflows ofResources
Primary Government
Difference between expected and actual experience $ — $ 15Changes of assumptions or other inputs — 2Amounts associated with transactions subsequent to themeasurement date of the total OPEB liability 1 —
Total $ 1 $ 17Discrete Component Units
Difference between expected and actual experience $ — $ 1,308Changes of assumptions or other inputs — 180Amounts associated with transactions subsequent to themeasurement date of the total OPEB liability 100 —
Total $ 100 $ 1,488
B-130
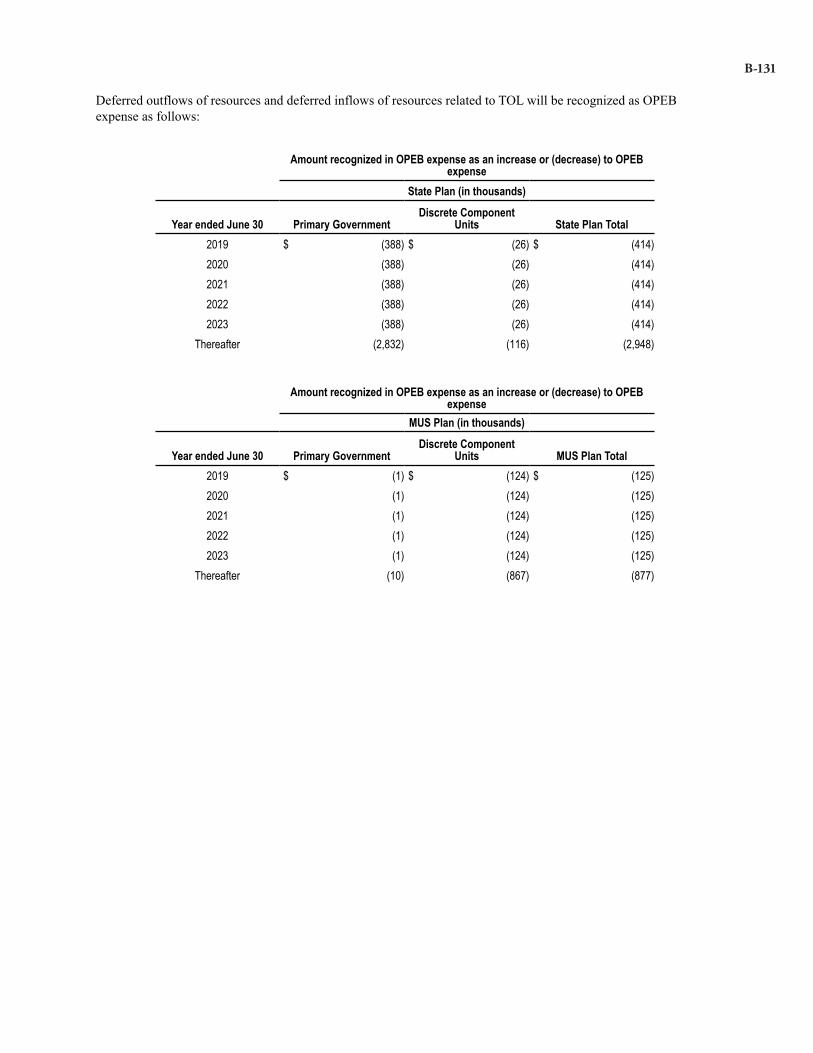
Deferred outflows of resources and deferred inflows of resources related to TOL will be recognized as OPEBexpense as follows:
Amount recognized in OPEB expense as an increase or (decrease) to OPEBexpense
State Plan (in thousands)
Year ended June 30 Primary GovernmentDiscrete Component
Units State Plan Total2019 $ (388) $ (26) $ (414)2020 (388) (26) (414)2021 (388) (26) (414)2022 (388) (26) (414)2023 (388) (26) (414)
Thereafter (2,832) (116) (2,948)
Amount recognized in OPEB expense as an increase or (decrease) to OPEBexpense
MUS Plan (in thousands)
Year ended June 30 Primary GovernmentDiscrete Component
Units MUS Plan Total2019 $ (1) $ (124) $ (125)2020 (1) (124) (125)2021 (1) (124) (125)2022 (1) (124) (125)2023 (1) (124) (125)
Thereafter (10) (867) (877)
B-131

F. General Information Trust Plan
General Information Section 19-3-2141, MCA, establishes a long-term disability plan trust fund (PERS-DCRP Disability) for all State ofMontana Employees that participate in the Public Employee Retirement System-Defined Contribution Retirement Plan(PERS-DCRP). All new PERS members are initially members of the Public Employee Retirement System-DefinedBenefit Retirement Plan (PERS-DBRP) and have a 12-month window during which they may choose to transfer to thePERS-DCRP or remain in the PERS-DBRP by filing an irrevocable election. If an election is not filed, the memberremains in the PERS-DBRP. Members may not be members of both the defined contribution and defined benefitretirement plans. Only those participants that choose the PERS-DCRP are covered by the PERS-DCRP Disability plan.
Plan DescriptionThe PERS-DCRP Disability is a multiple-employer cost sharing plan that covers employees of the State, localgovernments, and certain employees of the university system and school districts, who are not covered by a separateretirement system governed by Title 19, MCA. The PERS-DCRP Disability plan provides disability benefits to PERS-DCRP plan members who are vested in the plan and are currently ineligible for retirement.
A separate trust has been established for purposes of providing disability benefits to PERS-DCRP Disability planmembers and it is accounted for as a fiduciary fund. The assets are held in a trust capacity for the beneficiaries. ThePublic Employee Retirement System issues publicly available annual reports which include financial statements andrequired supplemental information for the plan. Those reports may be obtained online (http://mpera.mt.gov) or bycontacting the following:
Public Employees’ Retirement Board 100 North Park, Suite 200P.O. Box 200131Helena, MT 59620-0131
G. Termination Benefits
During the year ended June 30, 2018, the State made the following termination benefit arrangements: continued coverageof group health insurance benefits for fifty-two employees provided for up to eighteen months, one-time lump-sumincentive payments for fifty employees, and paid administrative leave for four employees. In determining the terminationbenefit liability related to the continued coverage of group health insurance benefits, it was assumed that these benefitswould be paid for the entire period of the arrangement.
During the year ended June 30, 2018, component units of the State made the following termination benefit arrangements:continued coverage of health insurance benefits and/or one-time incentive payments for one hundred fifteen employees.
During the year ended June 30, 2018, the cost of termination benefits for the fiscal year was $867.3 thousand and $6.1million for the State and its component units, respectively.
B-132

NOTE 8. RISK MANAGEMENT
There are three primary government public entity risk pools and one claims-servicing pool that are reported within theenterprise funds. These pools include Hail Insurance, the Montana University System (MUS) Group Insurance Plan,the MUS Workers Compensation Program, and the Subsequent Injury claims-servicing pool. The State of Montana(Old Fund) provides risk financing as an entity other than a public entity risk pool. The liability and payment of theworkers compensation claims for incidents occurring before July 1, 1990, are reported in the government-wide financialstatements within the primary government. Unpaid claims and claim adjustment expenses are estimated based on theultimate cost of settling the claims including the effects of inflation and other societal/economic factors. Additionally,the primary government reports its own risk management activity within two internal service funds: Employees GroupBenefits Plans and Administration Insurance Plans. In all of these funds, there are no significant reductions in insurancecoverage from the prior year. These funds use the accrual basis of accounting. By statute, these funds cannot invest incommon stock. Investments are recorded at fair value. Premiums and discounts are amortized using the straight-linemethod over the life of the securities.
A. Public Entity Risk Pools
(1) Hail Insurance – Any Montana producer engaged in growing crops subject to destruction or damage by hail mayparticipate in the Hail Insurance program. The Hail Insurance program issued 764 policies during the 2018 growingseason. This fund accounts for premium assessments paid by producers for crop acreage insured, investment and interestearnings, administrative costs, and claims paid for hail damage. Depending upon the actuarial soundness of the reservefund and the damage in a season, producers may receive a premium refund. Anticipated investment income is consideredin computing a premium deficiency, of which there is none.
A claim must be submitted to the State Board of Hail Insurance within 14 days of a loss occurrence. The claim mustindicate whether the grain is stemming, in the boot, heading out, in the milk, in the stiff dough, ready to bind, or combine.If beans, peas, or other crops are damaged, the growth-stage must also be indicated. Inspection of a crop will occur aspromptly as possible after claim receipt. The liability on all insured crops expires after October 1. The insurance onlycovers loss or damage to growing grain that exceeds 5% destruction by hail.
To reduce its exposure to large losses, the fund purchased Crop Hail Quota Share Reinsurance for the 2018 growingseason, with an 85% share of premiums and losses allotted to the Reinsurer and a 15% share of each allotted to theState Hail Insurance. The fund recorded a liability of $34.5 thousand which is 15% of the estimated claims ($209.0thousand) plus adjustment expenses through June 30, 2018. The amount deducted from the estimated claims as of June30, 2018, for reinsurance was $177.7 thousand (85% of estimated claims). The premiums ceded to the reinsurer throughJune 30, 2018 were $1.3 million which was 85% of total premiums of $1.6 million.
Any crop insurance liability is paid to the producers within one year of occurrence; therefore, liabilities are notdiscounted. The fund has no excess insurance or annuity contracts.
(2) Montana University System (MUS) Group Insurance Plan – This plan is authorized by the Regents and inSection 20-25-13, MCA. The Plan's purpose is to provide medical, dental, prescription drug, and related group benefitscoverage to employees of the Montana University System and affiliates, as well as their dependents, retirees, andCOBRA members. The MUS Group Benefits Plan is fully self-insured, except for life insurance, long-term care, long-term disability, and accidental death and dismemberment insurance. Delta Dental administers the dental plan, BlueCross and Blue Shield of Montana administers the vision plan, and Navitus is the administrator for the prescriptiondrug program. Allegiance Benefit Plan Management, Blue Cross and Blue Shield of Montana, and Pacific Source arethe three third-party claims administrators for the self-insured managed care plan. Allegiance Benefit Plan Management,Blue Cross and Blue Shield of Montana, and Pacific Source have contracts for utilization management. The utilizationmanagement program consists of hospital pre-authorization and medical necessity review as well as large casemanagement. Premiums are collected from employees through payroll deductions and recorded in the MUS GroupInsurance enterprise fund. The claims liability is calculated by Actuaries Northwest and estimated to be $10.2 millionas of June 30, 2018, based on prior year experience. A liability is reported in the accompanying financial statementsfor these estimated claims.
(3) Montana University System (MUS) Workers’ Compensation Program – This plan was formed to provide self-insured workers compensation coverage for employees of the MUS. The MUS Board of Regents provides workers’
B-133

compensation coverage under Compensation Plan Number One (Section 39-7-2101, MCA). The program is self-insuredfor workers’ compensation claims with losses in excess of $750.0 thousand per occurrence ($500.0 thousand for claimsoccurring prior to July 1, 2013) and $1.0 million per aircraft occurrence covered by reinsurance with a commercialcarrier. Employer’s liability claims are covered to a maximum of $1.0 million above the self-insured amount of $750.0thousand ($500.0 thousand for claims occurring prior to July 1, 2013). During fiscal year 2018, the program ceded$323.5 thousand in premiums to reinsurers.
Premium rates for all participating campuses are established by the MUS Workers’ Compensation Program Committeebased on actuarial calculations of premium need and composite premium rate. Premium rates are adjusted periodicallybased on inflation, claims experience, and other factors. Premiums are recorded as revenue in the MUS Workers’Compensation Program in the period for which coverage is provided. Members may be subject to supplementalassessments in the event of deficiencies. The program considers anticipated investment income in determining if apremium deficiency exists.
The fund recorded a liability of $5.8 million for estimated claims at June 30, 2018. The liability is based on the estimatedultimate cost of settling the reported and unreported claims, claims reserve development including the effects of inflation,and other societal and economic factors. Estimated amounts of subrogation and reinsurance recoverable on unpaidclaims are deducted from the liability for unpaid claims. Estimated claims liabilities are recomputed periodically basedon current review of claims information, experience with similar claims, and other factors. Adjustments to estimatedclaims liabilities are recorded as an increase or decrease in claims expense in the period the adjustments are made.
(4) Subsequent Injury – The purpose of the Subsequent Injury Fund (SIF) is to assist individuals with a permanentimpairment that may create an obstacle to employment by offering a financial incentive to employers to hire SIF-certified individuals. The program is funded through an annual assessment on Montana self-insured employers and asurcharge on premium for private insured and Montana State Fund policyholders.
The Employment Relations Division sets the assessment and surcharge rates annually. The rates are based on the totalamount of paid losses reimbursed by SIF in the preceding calendar year, plus the expenses of administration, less otherincome earned. Covered employers share in the reimbursement of SIF based on the percentage of the compensationand medical benefits paid in Montana by their insurers for April 1st, of the previous fiscal year, through March 31st ofthe recent year.
The SIF program reduces the liability of the employer (if self-insured) or insurer by placing a limit of 104 weeks onthe amount an employer (if self-insured), or the employer’s insurer, will have to pay for medical and wage loss benefitsin the event a worker who is SIF-certified becomes injured or re-injured on the job. SIF will assume liability for theclaim when the 104 weeks is reached. The benefit to an insured employer is that the insurer’s liability is limited to 104weeks on the claim. This can favorably impact the employer’s modification factor, which in turn can keep premiumslower than would otherwise be the case without SIF. For a self-insured employer, it provides a direct recovery ofexpenses paid for a workers’ compensation claim. If a certified worker does become injured on the job, the workerremains entitled to all benefits due under the Workers’ Compensation Act.
An estimated liability is recorded based on a projected cost analysis and total population of registered SIF participants.As of June 30, 2018, the amount of this liability was estimated to be $2.9 million.
(5) Changes in Claims Liabilities for the Past Two Years – As indicated above, these funds establish liabilities forboth reported and unreported insured events including estimates of future payments of losses and related claimadjustment expenses. The following tables present changes (in thousands) in those aggregate liabilities during the pasttwo years. All information in these tables is presented at face value and has not been discounted.
B-134

Hail InsuranceMUS Group
Insurance PlanMUS WorkersCompensation
2018 2017 2018 2017 2018 2017Unpaid claims and claim adjustment expenses at beginning of year $ 2 $ 134 $ 10,000 $ 9,100 $ 7,298 $ 7,764
Incurred claims and claim adjustment expenses: provision for insured events of the current year 120 819 86,485 84,186 2,794 3,096Less excess insurance reimbursement - - - - - -
Increase (decrease) in provision for insured events of prior years 12 434 - - (1,273) (1,368) Total incurred claims and claim adjustment expenses 132 1,253 86,485 84,186 1,521 1,728
Payments:Claims and claim adjustment expenses attributable to insured events of the current year (85) (817) (86,285) (83,286) (605) (940)
Claims and claim adjustment expenses attributable to insured events of prior years (14) (568) - - (2,383) (1,254)
Total payments (99) (1,385) (86,285) (83,286) (2,988) (2,194)
Total unpaid claims and claim adjustment expenses at end of year $ 35 $ 2 $ 10,200 $ 10,000 $ 5,831 $ 7,298
B. Entities Other Than Pools
(1) Administration Insurance Plans – This self-insurance plan provides coverage for general liability, automobileliability, automobile physical damage, foster care liability, and State-administered foreclosure of housing units. TheState self-insures the $2.0 million deductible per occurrence for most property insurance, as well as various deductibleamounts for other State property. The State also self-insures against losses of property below $2.0 million of value,with State agencies paying the first $1.0 thousand. Commercial property insurance protects approximately $5.5 billionof State-owned buildings and contents. The State’s property insurance includes separate earthquake and flood protectioncoverage, with deductibles of $2.0 million for earthquake and $2.0 million for flood per occurrence. Premiums arecollected from all state agencies, including component units, and recorded as revenue in the Administration InsuranceFund.
An annual actuarial study, prepared by Willis Towers Watson Company, and issued for the accident period July 1, 2008,through June 30, 2018, is the basis for estimating the liability for unpaid claims and is supported by historical loss data.As of June 30, 2018, estimated claims liability was $15.2 million.
(2) Employee Group Benefits Plans – The medical and dental health plans provided by the State are fully self-insuredwith the State assuming the risk for claims incurred by employees of the State, elected officials, retirees, formeremployees covered by COBRA benefits, and their dependents. The State contracted with Allegiance as the third-partyadministrator for medical coverage. Delta Dental is the administrator for dental coverage. Navitus is the administratorfor the pharmacy program. Contributions are collected through payroll deductions, deductions through the PublicEmployees Retirement Administration, the Legislative Branch, and self-payments. The contributions are recorded asrevenue in the Employee Group Benefits internal service fund. As of June 30, 2018, estimates for claims liabilities,which include both incurred but not reported claims and grandfathered claims resulting from a 1998 change in periodfor which the benefit coverage is available, as well as other actuarially determined liabilities, were $17.7 million as
B-135

provided by Actuaries Northwest, a consulting actuarial firm. In fiscal year 2019, $17.5 million of these claims liabilitiesare estimated to be paid.
(3) State of Montana (Old Fund) – State of Montana (Old Fund) covers workers’ compensation claims that wereincurred before July 1, 1990. Old Fund is a risk financing insurance entity; however, the participants within the poolare individuals outside of governmental entities.
An actuarial study prepared by Willis Towers Watson, as of June 30, 2018, estimated the cost of settling claims thathave been reported, but not settled, and claims that have been incurred, but not reported. At June 30, 2018, $31.1 millionof unpaid claims and claim adjustment expenses were reported at face value.
(4) Changes in Claims Liabilities for the Past Two Years – These funds establish liabilities for both reported andincurred, but not reported, claims. Grandfathered claims are not included as they relate to future claims not yet incurred.The following table presents changes in the balances of claims liabilities during the past two fiscal years (in thousands).
AdministrationInsurance Plans
Employers GroupBenefits Plan
State of Montana Old Fund
2018 2017 2018 2017 2018 2017Amount of claims liabilities at the beginning of each fiscal year $ 16,054 $ 15,444 $ 17,696 $ 17,873 $ 32,212 $ 38,410
Incurred claims:Provision for insured events of the current year 4,714 4,786 171,930 159,835 - -
Increase (decrease) in provision for insured events of prior years 11,070 17,592 (4,013) 518 6,002 1,554
Total incurred claims 15,784 22,378 167,917 160,353 6,002 1,554
Payments:Claims attributable to insured events of the current year (1,852) (1,681) (154,468) (142,173) - -
Claims attributable to insured events of prior years (14,806) (20,087) (13,422) (18,357) (7,105) (7,752)
Total payments (16,658) (21,768) (167,890) (160,530) (7,105) (7,752)
Total claims liability at end of each fiscal year $ 15,180 $ 16,054 $ 17,723 $ 17,696 $ 31,109 $ 32,212
B-136

NOTE 9. COMMITMENTS
A. Highway Construction
At June 30, 2018, the Department of Transportation had contractual commitments of approximately $280.1 million forconstruction of various highway projects. Funding for these highway projects is to be provided from federal grants andmatched with state special revenue funds.
B. Capital Construction
At June 30, 2018, the Department of Administration, Architecture & Engineering Division, had commitments ofapproximately $38.3 million for capital projects construction. The primary government will fund $7.7 million of theseprojects, with the remaining $30.6 million funding coming from the Montana University System.
At June 30, 2018, Fish, Wildlife, and Parks (FWP) had contractual commitments of approximately $4.5 million forengineering and construction of various capital projects. The majority of the funding for these projects is to be providedby federal grants and state special revenue funds.
C. Loan and Mortgage Commitments
The Montana Board of Investments (BOI) makes firm commitments to fund commercial loans and Veterans’ HomeLoan Mortgages (VHLM) from the Coal Severance Tax Permanent Trust Fund. These commitments have expirationdates and may be extended according to BOI policies. As of June 30, 2018, BOI had committed, but not yet purchased,$29.4 million in loans from Montana lenders. In addition to the above commitments, lenders had reserved $5.9 millionfor loans as of June 30, 2018. As of June 30, 2018, another $3.5 million represented lender reservations for the VHLMresidential mortgage purchases with no purchase commitments.
The BOI makes reservations to fund mortgages from the State’s pension funds. As of June 30, 2018, there were nomortgage reservations. All BOI residential mortgage purchases are processed by the Montana Board of Housing(MBOH). The MBOH does not differentiate between a mortgage reservation and a funding commitment.
The BOI makes firm commitments to fund loans from the INTERCAP loan program. The BOI’s outstandingcommitments to eligible Montana governments, as of June 30, 2018, totaled $38.0 million.
D. Department of Corrections Bond Commitments
At June 30, 2018, the outstanding tax-exempt bonds distributed by the Facility Finance Authority were issued in theamount of $14.3 million of which $1.9 million in principal payments are scheduled to be paid by June 30, 2019. Thesebonds have been issued to facilities operating treatment and prerelease centers. The Department of Corrections agreesto provide payment on behalf of the contractors for the total principal and interest regarding these outstanding bonds.
E. Department of Labor and Industry Commitments
At June 30, 2018, Department of Labor and Industry, had $3.2 million contractual commitments for Montana StateAmeriCorps Programs and a $0.8 million commitment for IT contracts. The funding for these programs is federal grantsand state special funds.
B-137

F. Proprietary Fund Commitments
Budgets are administratively established in the enterprise and internal service funds, excluding depreciation,compensated absences, and bad debt expense. Appropriations may be committed for goods/services that are not receivedas of fiscal year-end. These executory commitments are included in unrestricted net position in the accompanyingfinancial statements as follows (in thousands):
Enterprise Funds AmountHUD Section 8 $ 69Liquor Warehouse 25Other Enterprise 4Prison Industries 3West Yellowstone Air 18Subtotal - Enterprise funds $ 119
Internal Service FundsBuildings & Grounds $ 180Labor Central Services 628Print and Mail 1SABHRS Finance and Budget Bureau 19Warrant Processing 19Subtotal - Internal Service funds $ 847
G. Encumbrances
As of June 30, 2018, the State of Montana encumbered expenditures as presented in the table below (in thousands):
Federal SpecialRevenue Fund General Fund
NonmajorGovernmental
FundsState Special
Revenue Fund TotalEncumbrances $ 20,335 $ 7,998 $ 68 $ 51,126 $ 79,527
B-138

NOTE 10. LEASES/INSTALLMENT PURCHASES PAYABLE
The State has entered into various capital and operating leases for land, buildings, equipment, and computer software.Lease contracts are required by law to contain a clause indicating continuation of the lease is subject to funding by theLegislature. It is expected, in the normal course of operations, that most of these leases will be replaced by similarleases.
A. Capital Leases/Installment Purchases
Obligations under capital leases/installment purchases at June 30, 2018, were as follows (in thousands):
Fiscal Year Ending June 30:Governmental
ActivitiesBusiness-Type
Activities2019 $ 3,594 $ 2192020 3,406 182021 3,066 —2022 2,355 —2023 1,273 —2024 - 2028 570 —Total minimum payments 14,264 237Less: interest (566) (6)
Present value of minimum payments $ 13,698 $ 231
Assets acquired under capital leases for the primary government by asset class were as follows (in thousands):
Asset ClassBuildings $ 1,988Equipment 18,990Less: Accum Depreciation (5,025)Net Book Value $ 15,953
B. Operating Leases
Primary government rental payments for operating leases in fiscal year 2018 totaled $27.5 million. Future rentalpayments under operating leases are as follows (in thousands):
Fiscal Year Ending June 30:Governmental
ActivitiesBusiness-Type
Activities2019 $ 23,965 $ 7522020 19,240 5722021 15,228 4502022 14,189 4532023 12,001 4612024 - 2028 40,705 1,6722029 - 2033 17,613 —Thereafter 9,364 —
Total future rental payments $ 152,305 $ 4,360
B-139

NOTE 11. STATE DEBT
A. General Information
The State has no constitutional limit on its power to issue obligations or incur debt, other than a provision that no debtmay be created to cover deficits incurred because appropriations exceeded anticipated revenues. No State debt shallbe created unless authorized by a two-thirds vote of the members of each house of the Legislature or a majority of theelectors voting thereon. The Board of Examiners (consisting of the Governor, Secretary of State, and Attorney General)is authorized, pursuant to various enabling acts, to issue bonds and notes of the State.
B. Short-term Debt
The Board of Examiners, upon recommendation of the Department of Administration, may issue notes in anticipationof the receipt of taxes and revenues. Notes may not be issued to refund outstanding notes.
During fiscal year 2018, the State issued two bond anticipation notes. The proceeds of Water/Wastewater 2017B andDrinking Water 2017C will be used to fund water and wastewater system improvements and rehabilitation. As of June30, 2018, no bond anticipation notes have been authorized but not issued. The State issued three bond anticipationnotes during fiscal year 2016, two of which were paid off during fiscal year 2018 and one that is still active. The Stateissued one bond anticipation note in 2017 that is still active as of the end of fiscal year 2018. Drinking Water 2017Creplaced Drinking Water 2016D. The following schedule summarizes the activity for the year ended June 30, 2018 (inthousands):
BANS Beginning Balance Additions ReductionsEndingBalance
Coal Severance Tax – 2015A $ 1,250 $ — $ 1,250 $ —Drinking Water – 2015B 1,540 1,000 2,190 350Water/Wastewater – 2016C 825 1,000 1,825 —Coal Severance Tax – 2016E (1) 1,034 346 200 1,180Water/Wastewater – 2017B (1) — 1,900 1,450 450Drinking Water – 2017C (1) — 900 — 900
(1) These bond anticipation notes have not been fully drawn at fiscal year-end.
The Board of Investments (BOI) of the State is authorized to issue Intermediate Term Capital (INTERCAP) bondsunder the Municipal Finance Consolidation Act. These bonds may not aggregate more than $190.0 million as amendedby the 2007 Legislature. The purpose of the bonds is to provide funds for BOI to make loans to eligible governmentunits. The bonds are not a debt or liability of the State. The bonds are limited obligations of BOI, payable solely from(1) repayments of principal and interest on loans made by BOI to participating eligible governmental units, (2) investmentincome under the indenture, and (3) an irrevocable pledge by BOI. BOI has no taxing power. The bonds may beredeemed, at the bondholder's option, any March 1, prior to maturity. BOI did not enter into an arms-length financingagreement to convert the bonds "put," or tender, and were not resold into some other form of long-term obligation.Accordingly, these bonds, considered demand bonds, are included in short-term debt. The amounts issued andoutstanding at June 30, 2018, were as follows (in thousands):
B-140

Amount BalanceSeries Issued June 30, 20182000 $ 15,000 $ 14,2552003 15,000 14,3302004 18,500 18,0002007 15,000 14,6952010 12,000 11,9002013 12,000 11,9702017 20,000 19,960
$ 105,110
The following schedule summarizes the activity relating to the demand bonds during the year ended June 30, 2018 (inthousands):
BeginningBalance Additions Reductions Ending
BalanceDemand bonds $ 107,880 $ — $ 2,770 $ 105,110
B-141
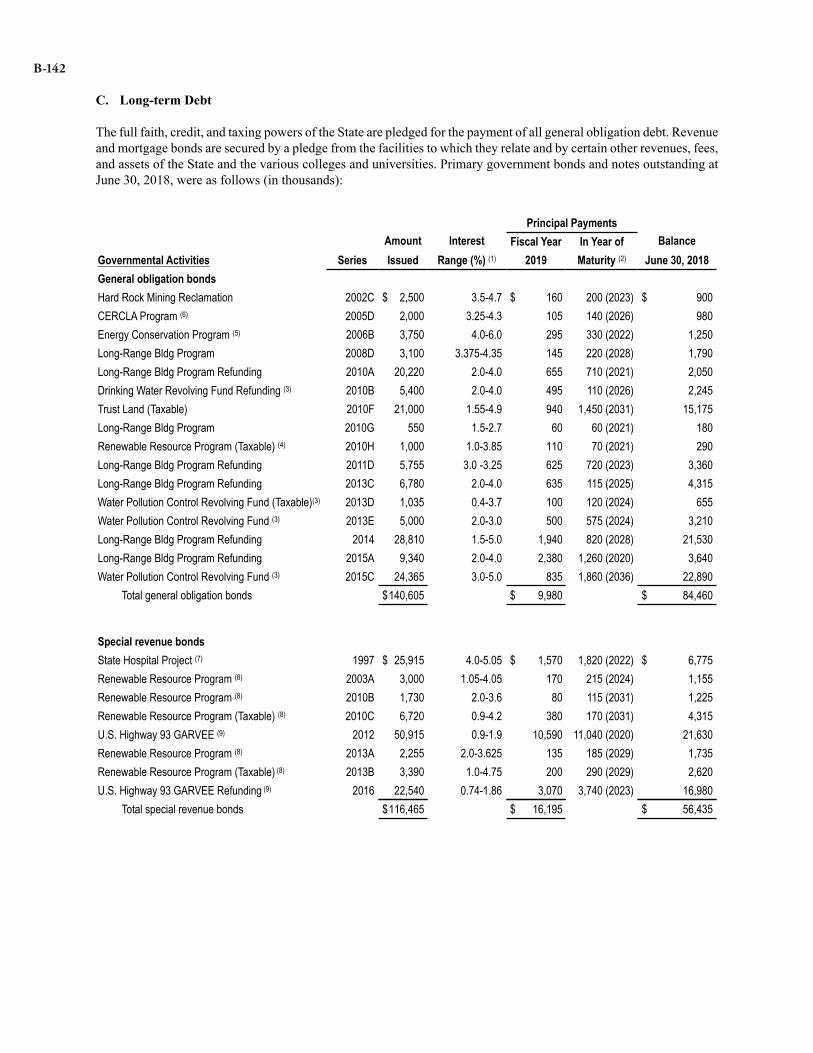
C. Long-term Debt
The full faith, credit, and taxing powers of the State are pledged for the payment of all general obligation debt. Revenueand mortgage bonds are secured by a pledge from the facilities to which they relate and by certain other revenues, fees,and assets of the State and the various colleges and universities. Primary government bonds and notes outstanding atJune 30, 2018, were as follows (in thousands):
Principal PaymentsAmount Interest Fiscal Year In Year of Balance
Governmental Activities Series Issued Range (%) (1) 2019 Maturity (2) June 30, 2018General obligation bondsHard Rock Mining Reclamation 2002C $ 2,500 3.5-4.7 $ 160 200 (2023) $ 900CERCLA Program (6) 2005D 2,000 3.25-4.3 105 140 (2026) 980Energy Conservation Program (5) 2006B 3,750 4.0-6.0 295 330 (2022) 1,250Long-Range Bldg Program 2008D 3,100 3.375-4.35 145 220 (2028) 1,790Long-Range Bldg Program Refunding 2010A 20,220 2.0-4.0 655 710 (2021) 2,050Drinking Water Revolving Fund Refunding (3) 2010B 5,400 2.0-4.0 495 110 (2026) 2,245Trust Land (Taxable) 2010F 21,000 1.55-4.9 940 1,450 (2031) 15,175Long-Range Bldg Program 2010G 550 1.5-2.7 60 60 (2021) 180Renewable Resource Program (Taxable) (4) 2010H 1,000 1.0-3.85 110 70 (2021) 290Long-Range Bldg Program Refunding 2011D 5,755 3.0 -3.25 625 720 (2023) 3,360Long-Range Bldg Program Refunding 2013C 6,780 2.0-4.0 635 115 (2025) 4,315Water Pollution Control Revolving Fund (Taxable)(3) 2013D 1,035 0.4-3.7 100 120 (2024) 655Water Pollution Control Revolving Fund (3) 2013E 5,000 2.0-3.0 500 575 (2024) 3,210Long-Range Bldg Program Refunding 2014 28,810 1.5-5.0 1,940 820 (2028) 21,530Long-Range Bldg Program Refunding 2015A 9,340 2.0-4.0 2,380 1,260 (2020) 3,640Water Pollution Control Revolving Fund (3) 2015C 24,365 3.0-5.0 835 1,860 (2036) 22,890
Total general obligation bonds $140,605 $ 9,980 $ 84,460
Special revenue bondsState Hospital Project (7) 1997 $ 25,915 4.0-5.05 $ 1,570 1,820 (2022) $ 6,775Renewable Resource Program (8) 2003A 3,000 1.05-4.05 170 215 (2024) 1,155Renewable Resource Program (8) 2010B 1,730 2.0-3.6 80 115 (2031) 1,225Renewable Resource Program (Taxable) (8) 2010C 6,720 0.9-4.2 380 170 (2031) 4,315U.S. Highway 93 GARVEE (9) 2012 50,915 0.9-1.9 10,590 11,040 (2020) 21,630Renewable Resource Program (8) 2013A 2,255 2.0-3.625 135 185 (2029) 1,735Renewable Resource Program (Taxable) (8) 2013B 3,390 1.0-4.75 200 290 (2029) 2,620U.S. Highway 93 GARVEE Refunding (9) 2016 22,540 0.74-1.86 3,070 3,740 (2023) 16,980
Total special revenue bonds $116,465 $ 16,195 $ 56,435
B-142

Principal PaymentsAmount Interest Fiscal Year In Year of Balance
Governmental Activities Issued Range (%) (1) 2019 Maturity (2) June 30, 2018Notes PayableMiddle Creek Dam Project (10) $ 3,272 8.125 $ 88 225 (2034) $ 2,033Tongue River Dam Project (11) 11,300 — 290 290 (2038) 5,795ITSD Software Licenses 2,890 2.41 494 494 (2019) 494ITSD IBM Mainframes Maintenance 500 1.07 126 127 (2020) 253ITSD IBM Professional Services 758 0.19 159 72 (2023) 732 Total notes payable $ 18,720 $ 1,157 $ 9,307 Subtotal governmental activities, before unamortized balances 150,202 Unamortized discount (8) Unamortized premium 9,095Total governmental activities $275,790 $ 27,332 $ 159,289
(1) The interest range is over the life of the obligation.(2) Year of maturity refers to fiscal year.(3) These bonds provide matching funds to enable the State to obtain capitalization grants from the U.S Environmental Protection Agency for water system
development loans to state political subdivisions.(4) The general obligation Renewable Resource Program Bonds are secured additionally by a pledge of, and payable from, certain coal severance taxes. The
bonds are also secured by a pledge of loan repayments from loans made from the bond proceeds.(5) Bonds issued for financing the design, construction, and installation of energy conservation projects at various state buildings.(6) The CERCLA (Comprehensive Environmental Response, Compensation, and Liability Act) Program Bonds were issued for the purpose of financing the costs
of State of Montana participation in the remedial actions under Section 104 of the CERCLA 42 United States Code Sections 9601-9657, and State of Montanacosts for maintenance of sites under CERCLA. The CERCLA Bonds are secured additionally by a pledge of monies received by the State as cost recoverypayments and revenues derived from the resource indemnity and groundwater assessment tax in the event cost recovery payments are insufficient.
(7) Facility Finance Authority loan to the Department of Public Health and Human Services for the Montana State Hospital Project.(8) Issued by the Department of Natural Resources and Conservation and backed by a pledge of coal severance taxes and project revenues.(9) The U.S. Highway 93 GARVEES (Grant Anticipation Revenue Vehicles) Bonds were issued for the purpose of improving a 44.8-mile stretch of U.S. Highway
93. Repayment of the bonds is secured by a pledge of certain federal aid revenues.(10) U.S. Bureau of Reclamation loan to the Department of Natural Resources & Conservation.(11) Northern Cheyenne Tribe loan to the Department of Natural Resources & Conservation. The loan will not accrue interest and will be repaid over 39 years.
Loan repayment is secured by the issuance of a coal severance tax bond to the tribe.
D. Debt Service Requirements
Primary government debt service requirements at June 30, 2018, were as follows (in thousands):
Governmental ActivitiesGeneral Obligation Bonds Special Revenue Bonds Notes Payable
Year Ended June 30: Principal Interest Principal Interest Principal Interest2019 $ 9,980 $ 3,350 $ 16,195 $ 2,234 $ 1,157 $ 632020 9,170 3,030 16,915 1,595 671 542021 8,120 2,735 6,160 947 552 482022 7,320 2,424 6,445 738 560 452023 7,085 2,117 4,860 518 466 412024 - 2028 25,975 6,772 4,575 756 2,041 2042029 - 2033 11,490 2,589 1,285 70 2,185 2042034 - 2038 5,320 408 — — 1,675 41
Total $ 84,460 $ 23,425 $ 56,435 $ 6,858 $ 9,307 $ 700
B-143

E. Summary of Changes in Long-term Liabilities
Primary government long-term liability activities for the year ended June 30, 2018, were as follows (in thousands):
BeginningBalance Additions Reductions
EndingBalance
AmountsDue WithinOne Year
AmountsDue In MoreThan One
YearGovernmental activitiesBonds/notes payable
General obligation bonds $ 98,625 $ — $ 14,165 $ 84,460 $ 9,980 $ 74,480Special revenue bonds 73,550 — 17,115 56,435 16,195 40,240Notes payable 10,004 1,258 1,955 9,307 1,157 8,150
182,179 1,258 33,235 150,202 27,332 122,870Unamortized discount (9) 1 — (8) — (8)Unamortized premium 11,202 — 2,107 9,095 — 9,095
Total bonds/notes payable (2) 193,372 1,259 35,342 159,289 27,332 131,957
Other liabilitiesLease/installment purchase payable 6,537 9,778 2,617 13,698 3,352 10,346Operating lease rent holiday 27 — 10 17 9 8Pension benefits payable 4 — — 4 2 2Compensated absences payable (1) 103,565 53,794 55,600 101,759 55,317 46,442Arbitrage rebate tax payable (1) 83 — — 83 — 83Estimated insurance claims (1) 65,962 189,703 191,652 64,013 29,396 34,617Pollution remediation 208,781 3,021 13,157 198,645 22,162 176,483Net pension liability 1,789,810 114,395 73,904 1,830,301 — 1,830,301Total OPEB liability (3) 48,403 527 — 48,930 — 48,930
Total other liabilities 2,223,172 371,218 336,940 2,257,450 110,238 2,147,212Total governmental activities long-term
liabilities $ 2,416,544 $ 372,477 $ 372,282 $ 2,416,739 $ 137,570 $ 2,279,169
Business-type activitiesLease/installment purchase payable $ 415 $ — $ 184 $ 231 $ 213 $ 18Compensated absences payable 2,047 1,029 1,034 2,042 1,033 1,009Arbitrage rebate tax payable 23 — 6 17 — 17Estimated insurance claims 20,242 88,138 89,420 18,960 13,877 5,083Net pension liability 14,293 2,686 521 16,458 — 16,458Total OPEB liability (3) 937 5 — 942 — 942
Total business-type activities long-termliabilities $ 37,957 $ 91,858 $ 91,165 $ 38,650 $ 15,123 $ 23,527
(1) The compensated absences liability attributable to the governmental activities will be liquidated by several of the governmental and internal service funds.The arbitrage rebate tax payable will be liquidated by debt service funds. The Employee Group Benefits and Administration Insurance internal service fundswill liquidate the estimated insurance claims liability.
(2) Deferred outflows, including those related to bonds payable, are reported separately on the Statement of Net Position based on GASB Statement No. 65.(3) The total OPEB liability beginning balances were restated due to the implementation of GASB Statement No. 75. For more detail, see Note 7.
F. Refunded and Early Retired Debt
PrepaymentsThe Department of Natural Resources and Conservation (DNRC) used current available resources to make twoprepayments: $350.0 thousand and $165.0 thousand on Series 2005F general obligation bonds resulting in a payoff.
B-144

G. No-Commitment Debt
Information is presented below for financing authorities participating in debt issues. The related debt issued does notconstitute a debt, liability, obligation, or pledge of faith and credit of the State. Accordingly, these bonds and notes arenot reflected on the accompanying financial statements.
Montana Board of Investments (BOI)BOI is authorized to issue Qualified Zone Academy Bonds (QZAB) under the Municipal Finance Consolidation Act,as conduit (no commitment) debt. The revenues, and in some cases, the taxing power of the borrower are pledged torepay the bonds. At June 30, 2018, QZAB debt outstanding aggregated $5.0 million.
BOI is also authorized to issue Qualified School Construction Bonds (QSCB) under the Municipal FinanceConsolidation Act, as conduit (no commitment) debt. The revenues of the borrower are pledged to repay the bonds. AtJune 30, 2018, QSCB debt outstanding aggregated $5.1 million.
Beginning Farm Loan ProgramThe Department of Agriculture is authorized to request issuance of bonds by BOI to finance projects for beginningfarmers within the state, if it appears, after a properly noticed public hearing, that the project is in the public interestof the state. These non-recourse, industrial development revenue bonds do not constitute a debt, liability, or obligationof the State. The amount issued and outstanding at June 30, 2018, was as follows: Hershberger Project, outstanding$27.6 thousand.
H. Estimated Pollution Remediation Obligation
Estimated pollution remediation obligations are obligations to address the current or potential detrimental effects ofexisting pollution by participating in pollution remediation activities such as site assessments and cleanups. Theestimates are derived using the expected cash flows method as well as technical estimates from record of decisions,consent decrees and/or settlement agreements. There may be factors influencing the estimates that are not known atthis time. Prospective recoveries from other responsible parties may reduce the State’s obligation.
The State’s estimated pollution remediation liability as of June 30, 2018, was $198.6 million. Of this liability, $11.7million resulted in settlement agreements to provide restoration of natural resources, water supplies and natural resource-based recreational opportunities up to the settlement amount; $181.2 million is based on decrees or settlements forremediation activities. Other estimated liabilities have been recorded for soil and PCB contamination, as well as removalof asbestos contamination. The estimated pollution remediation liability was recorded in compliance with accountingand reporting standards and does not constitute the State’s total acceptance of the liability or responsibility on thesematters.
B-145

I. Nonexchange Financial Guarantee
BOI provides loan guarantees from the Coal Severance Tax Fund to the Facility Finance Authority (FFA). BOI exposureto bond issues, surety bonds, and designated loans of the FFA totaled $81.5 million as of June 30, 2018. FFA is adiscretely presented component unit of the State of Montana. FFA guarantee requests are submitted to BOI for reviewand approval. BOI’s participation, either duration or any other consideration, to either purchase bonds or loans or tolend money for deposit into FFA’s statutorily allowed capital reserve account is explicitly limited by statute whichrequires BOI to act prudently. The guarantee requests from FFA pertain to bonds issued by FFA with a term of up to40 years. BOI receives a credit enhancement fee at FFA bond closing based on the term of the financing, the type ofbond, the rating of the borrower, and the type of reserve fund. BOI and FFA have entered into an agreement detailingrepayment to BOI. The credit enhancement fee received during the fiscal year was $449.0 thousand. BOI has not hadto perform on any loan guarantee in the past.
The following schedule summarizes the activity related to the non-exchange financial guarantee during the year endedJune 30, 2018 (in thousands):
BeginningBalance Additions Reductions
EndingBalance
$ 71,416 $ 36,470 $ 26,435 $ 81,451
B-146

NOTE 12. INTERFUND BALANCES AND TRANSFERS
A. Balances Due From/To Other Funds
Balances due from/to other funds arise when there is a time lag between the dates that reimbursable expenditures andinterfund services provided/used are recorded in the accounting system, and the dates on which payments are made.Balances also arise when there is a time lag between the dates that transfers between funds are recorded, and the dateson which payments are made. Balances due from/to other funds also include the current portion of balances related toamounts loaned by the Economic Development Bonds Fund to other funds, under the Board of Investments' INTERCAPloan program. Balances due from/to other funds are expected to be repaid within one year from origination.
Balances due from/to other funds at June 30, 2018, consisted of the following (in thousands):
Due to Other FundsCoal
SeveranceTax
FederalSpecial
RevenueGeneral
Fund
InternalServiceFunds
NonmajorEnterpriseFunds (3)
NonmajorGovernmental
Funds
StateSpecial
Revenue TotalDue from Other FundsCoal Severance Tax $ — $ — $ — $ — $ — $ 6 $ — $ 6Economic Development Bonds — — — 1,700 — 1,615 — 3,315Federal Special Revenue — — 1,917 — — — 663 2,580General Fund — 819 — 18 13,354 — 14,648 28,839Internal Service Funds 1 — 8 — — — 4 13Nonmajor Enterprise Funds — — — — — — 11 11Nonmajor GovernmentalFunds (1) — 197 — — — — 131 328State Special Revenue (2) — — 430 — — 562 — 992
Total $ 1 $ 1,016 $ 2,355 $ 1,718 $ 13,354 $ 2,183 $ 15,457 $ 36,084
(1) Total due from other funds to the non-major governmental funds on the financial statements is reported as $1.5 million. The difference of $1.2 millionbetween the amount reported above of $328.0 thousand and the amount reported in the fund financial statements relates to long-term receivables. Thereceivables are reported on the fund financial statement and the long-term liabilities are reported on the government-wide statement.
(2) Total due from other funds to the state special revenue fund on the fund financial statement is reported as $10.6 million. The difference of $9.6 millionbetween the amount reported above of $992.0 thousand and the amount reported in the fund financial statement relates to long-term receivables. Thereceivables are reported on the fund financial statement and the long-term liabilities are reported on the government-wide statement.
(3) Total due to other funds from the non-major enterprise funds on the fund financial statement is reported as $13.6 million. The difference of $291.3 thousandbetween the amount reported above of $13.4 million and the amount reported on the fund financial statement relates to loans payable. The receivablesare reported on the government-wide statement and the liabilities are reported on the fund financial statement.
B. Interfund Loans Receivable/Payable
Montana statutes include a provision for interfund loans when the expenditure of an appropriation is necessary and thecash balance in the account from which the appropriation was made is insufficient to pay the expenditure. Interfundloans receivable/payable are expected to be repaid within one year from the date of origination.
B-147

Interfund loans receivable/payable at June 30, 2018, consisted of the following (in thousands):
Interfund Loans PayableCoal
SeveranceTax
FederalSpecial
Revenue
InternalServiceFunds
NonmajorGovernmental
Funds
StateSpecial
Revenue Land Grant TotalInterfund Loans ReceivableGeneral Fund $ 1,689 $ 65,260 $ — $ 303 $ 5,215 $ — $ 72,467 Internal Service Funds — 35 — — — — 35State Special Revenue — 60,204 12 — — 6 60,222
Total $ 1,689 $ 125,499 $ 12 $ 303 $ 5,215 $ 6 $132,724
C. Advances To/From Other Funds
Advances to/from other funds represent the portion of interfund loans that are not expected to be repaid within oneyear from the date of origination. Advances to/from other funds also include the noncurrent portion of balances relatedto amounts loaned by the Economic Development Bonds Fund to other funds, under the Board of Investments'INTERCAP loan program. For more information on the INTERCAP loan program, refer to Note 11.
Advances to/from other funds at June 30, 2018, consisted of the following (in thousands):
Advances from Other FundsFederalSpecial
Revenue
InternalServiceFunds
NonmajorGovernmental
Funds
StateSpecial
Revenue TotalAdvances to Other FundsCoal Severance Tax $ — $ — $ 1,935 $ — $ 1,935Economic Development Bonds — 4,206 1,350 — 5,556General Fund 300 — — 189 489Nonmajor Governmental Funds — — — 7,471 7,471State Special Revenue 35,296 — 4,293 — 39,589
Total $ 35,596 $ 4,206 $ 7,578 $ 7,660 $ 55,040
Additional detail for certain advance balances at June 30, 2018, follows (in thousands):
Advances from the Economic DevelopmentBonds Fund under the INTERCAP Loan Program
Departmental Function BalanceNatural Resources and Conservation $ 1,350Transportation 4,206
Total $ 5,556
D. Interfund Transfers
Routine transfers between funds are recorded to (1) transfer revenues from the fund legally required to receive therevenue to the fund authorized to expend the revenue, (2) transfer resources from the General Fund and special revenuefunds to debt service funds to support principal and interest payments, (3) transfer resources from enterprise funds tothe General Fund to finance general government expenditures, and (4) provide operating subsidies.
B-148

Interfund transfers for the year ended June 30, 2018, consisted of the following (in thousands):
Transfers OutCoal
SeveranceTax
FederalSpecial
RevenueGeneral
Fund
InternalServiceFunds (1)
LandGrant
NonmajorEnterpriseFunds (2)
NonmajorGovernmental
Funds
StateSpecial
Revenue TotalTransfers InCoal Severance Tax $ — $ — $ — $ — $ — $ — $ 656 $ — $ 656Federal Special Revenue — — 81 — — — — 2,437 2,518General Fund 17,938 418 — — 5 45,118 5,450 73,513 142,442Internal Service Funds — — 1,194 — — — — 529 1,723Land Grant — — — — — — — 5 5Nonmajor Enterprise Funds — — — 69 — — — 693 762Nonmajor Governmental Funds 551 16,328 12,366 160 2,496 — 2,744 13,558 48,203State Special Revenue 25,700 15,635 45,514 3 59,634 7,318 21,908 — 175,712
Total $ 44,189 $ 32,381 $59,155 $ 232 $62,135 $ 52,436 $ 30,758 $ 90,735 $372,021
(1) Total transfers-out for internal service funds on the fund financial statements is reported as $904.0 thousand. The difference of $672.0 thousand betweenthe amount reported above of $232.0 thousand and the amount reported on the fund financial statements relates to the transfer of capital assets betweena governmental fund type and the internal service fund type. When capital assets are transferred between these fund types, the transferring fund reportsthe net book value of the capital asset as a transfer-out, and the receiving fund reports the net book value of the capital asset as a capital contribution.
(2) Total transfers-out for nonmajor enterprise funds on the fund financial statements is reported as $52.4 million. The difference of $3.0 thousand betweenthe amount reported above of $52.4 million and the amount reported on the fund financial statements relates to the transfer of capital assets betweena governmental fund type and the nonmajor enterprise fund type. When capital assets are transferred between these fund types, the transferring fundreports the net book value of the capital asset as a transfer-out, and the receiving fund reports the net book value of the capital asset as a capitalcontribution.
B-149

NOTE 13. FUND EQUITY DEFICITS
The following funds have a deficit net position remaining at June 30, 2018, as follows (in thousands):
Fund Type/Fund Deficit (1)
Governmental FundsFederal Special Revenue (2) $ (10,069)
Internal Service FundsInformation Tech Services $ (13,046)Admin Insurance (417)Building and Grounds (594)Admin Central Services (1,617)Labor Central Services (4,982)Commerce Central Services (1,280)OPI Central Services (2,070)DEQ Indirect Cost Pool (4,223)Payroll Processing (1,837)Investment Division (3,286)Aircraft Operation (309)Justice Legal Services (438)Personnel Training (257)Other Internal Services (469)
Enterprise FundState Lottery $ (1,877)Subsequent Injury (1,573)Local Government Audits (137)
(1) The allocation of net pension and OPEB liabilities is a significantfactor in creating these deficits. For more detail related to theseliabilities, see Notes 6 and 7 respectively.
(2) The primary reason causing fund deficit in Federal SpecialRevenue Fund is due to CY2017 fire season federallyreimbursable costs. The federal fund reimbursement wasunavailable to receive within 60 days of 6/30/2018, creating adeferred inflow and a fund deficit in the same amount.
B-150

NOTE 14. MAJOR PURPOSE PRESENTATION
Special Revenue and Fund Balances Classifications by Purpose – In the governmental fund financial statements,classifications of special revenue fund revenues and fund balances are presented in the aggregate. The tables presentedbelow further display the special revenue fund revenues and fund balances by major purpose for the year ending June30, 2018.
State Special Revenue By Source (in thousands)
GeneralGovernment
PublicSafety Transportation
Health andHuman
Services EducationNatural
Resources TotalLicenses/permits $ 73,544 $ 41,795 $ 22,009 $ 1,824 $ 159 $ 81,567 $ 220,898Taxes 219,789 4,289 258,926 — (1) 20,651 503,654Charges for services 39,658 13,878 4,299 32,194 1,882 17,935 109,846Investment earnings 554 1,287 206 134 186 7,215 9,582Securities lending income — 38 — 1 4 71 114Sale of documents/
merchandise/property 2,208 2,830 104 100 17 4,741 10,000Rentals/leases/royalties 317 20 438 48 5 406 1,234Contributions/premiums 27,471 — — — — — 27,471Grants/contracts/donations 1,705 693 561 11,896 5,378 4,041 24,274Federal 6,944 36 2 2,356 — — 9,338Federal indirect costrecoveries — — 43,953 62 — 4,992 49,007Other revenues 1,990 517 284 126 148 100 3,165Transfers in 48,932 4,207 1,564 7,132 543 113,334 175,712
Total State SpecialRevenue $ 423,112 $ 69,590 $ 332,346 $ 55,873 $ 8,321 $ 255,053 $ 1,144,295
Federal Special Revenue By Source (in thousands)
GeneralGovernment
PublicSafety Transportation
Health andHuman
Services EducationNatural
Resources TotalTaxes $ — $ — $ — $ — $ — $ 1 $ 1Charges for services 812 26 — 5,561 11,896 — 18,295Investment earnings 212 9 — — 127 99 447Grants/contracts/donations — — — 18 — — 18Federal 97,025 14,614 441,953 1,924,357 191,216 99,492 2,768,657Federal indirect cost
recoveries 9 — — 66,546 94 697 67,346Other revenues 3 6 — 499 3 5 516Transfers in 81 1,403 — 1,034 — — 2,518
Total Federal SpecialRevenue $ 98,142 $ 16,058 $ 441,953 $ 1,998,015 $ 203,336 $ 100,294 $ 2,857,798
B-151

Governmental Fund Balance By Function, June 30, 2018(in thousands)
Special Revenue Permanent
General State Federal
CoalSeverance
TaxLand
Grant Nonmajor TotalFund balances:
NonspendableInventory $ 3,798 $ 21,030 $ — $ — $ — $ — $ 24,828Permanent fund principal — 500 — 561,938 710,197 334,376 1,607,011Long-term notes/receivables 489 — — — — — 489Prepaid expense 327 346 57 — — — 730
Total nonspendable 4,614 21,876 57 561,938 710,197 334,376 1,633,058Restricted
General government — 18,273 — — — 5,942 24,215Public safety — 219,315 — — — 1 219,316Transportation — 85,046 — — — — 85,046Health and human services — 3,438 — — — 6,329 9,767Education — 13,040 — — — 20 13,060Natural resources — 703,893 — — — 8,986 712,879
Total restricted — 1,043,005 — — — 21,278 1,064,283Committed
General government — 122,732 — 528,012 — 40,481 691,225Public safety — 48,094 — — — — 48,094Transportation — 16,583 — — — — 16,583Health and human services — 40,628 — — — — 40,628Education — 16,094 — — — — 16,094Natural resources — 292,048 — — — 32,491 324,539
Total committed — 536,179 — 528,012 — 72,972 1,137,163Assigned
General government — — — — — 23 23Public safety — — — — — 592 592Encumbrance 7,998 — — — — — 7,998
Total assigned 7,998 — — — — 615 8,613Unassigned 186,707 — (10,126) — — — 176,581
Total fund balance $ 199,319 $ 1,601,060 $ (10,069) $ 1,089,950 $ 710,197 $ 429,241 $ 4,019,698
B-152

NOTE 15. RELATED PARTY TRANSACTIONS
The Montana Board of Regents, which governs the Montana Guaranteed Student Loan Program (MGSLP), guaranteesloans, prior to transferring its portfolio, owned by the Montana Higher Education Student Assistance Corporation(MHESAC), a nonprofit corporation operating exclusively for the purpose of acquiring student loans. MHESAC hasno employees and its business operations are managed by the Student Assistance Foundation (SAF). A Board of Regentsboard member is also a MHESAC Board of Directors member, an Office of the Commissioner of Higher Educationstaff member is a MHESAC officer, and the Commissioner of Higher Education is an Ex-Officio member of the board.
The Montana School for the Deaf and Blind is associated with a foundation, which is a nonprofit organization outsideof state government. The school’s foundation is governed by a board of directors that yearly approves a budget for thefinancial support to be provided to the school. This budget defines the allowable expense categories for the year. Aschool employee is the person approving the expenses to be paid by the foundation based on its budget. The employeesubmits the approved invoices to the foundation’s bookkeeper, who then prepares the checks and submits them to aboard member who reviews backup documentation and signs the checks.
The Department of Labor and Industry Workforce Services Division rents space in Libby, MT, from Mineral Plaza,LLC, in which one of the owners is a local job service manager. The term of the lease is July 1, 2013 and ending June30, 2021. The annual lease amount is currently set at $21.3 thousand.
The relative of a member of Montana Department of Transportation’s (MDT) Management Team is part owner of abusiness that holds a State term contract for supplies. A term contract is a contract in which a source for supplies isestablished for a specific period of time at a predetermined unit price. The term contracts are issued by the StateProcurement Bureau of the Department of Administration and state agencies are required to use the DOA issued termcontracts for such supplies. Statewide, MDT purchased supplies from this business in the amount of $112.6 thousandfor the fiscal year ended June 30, 2018.
A relative of a member of MDT’s Management Team is part owner of a business which has been granted the right bythe local airport to operate and provide related services. There is only one such operator at this airport. Given thisexclusivity, MDT had transactions with this business. Department-wide, MDT purchased services in the amount of$9.4 thousand for the fiscal year ended June 30, 2018.
MDT has proper conflict of interest procedures and internal controls in place for identified related party transactions.
Per Title 85, Chapter 1, part 6, MCA, Renewable Resource Grant and Loan Program, the department is eligible to issueGO bonds for the purpose of making private sale loans. Department of Natural Resources and Conservation has appliedand received “recycled loan funds” from the SRF program for the non-point source private loan program. The loansare GO private sale bonds. The balances for loans in repayment for fiscal year 2018 was $4.3 million. The loans haveinterest rates ranging from 3.0% to 4.3% and are repaid over 15 years. These loans are presented as Advances to OtherFunds on the balance sheets.
Per ARM 17.58.101, the Montana Petroleum Tank Release Compensation Board (Board) is an independent board thatis attached to Department of Environmental Quality (DEQ) for administrative purposes only. Board members arerequired to follow Montana's code of ethics, that includes recusing oneself in matters related to a conflict of interest.To ensure we are following state law, all contracts are required to go through a competitive bidding process.
Four Board members were identified as having related party transactions with DEQ. These relationships includemembers who are: 1) an employee of a company that had a release and is receiving funds; 2) an agent for an insurerthat covered a station tank release and is receiving funds; 3) a shareholder in a bank that receives funds; and 4) acontractor for DEQ, the agency responsible for clean-up oversite, who is also a shareholder of a separate company thatreceives funds. Total payments to all related parties were direct payments to the contractors in the amount of $164.5thousand with a matching Board amount of $9.0 thousand and indirect payments to the bank and insurance companyin the amount of $93.6 thousand and $15.9 thousand, respectively, for the fiscal year ended June 30, 2018.
B-153
NOTE 16. CONTINGENCIES
Litigation
The State is party to legal proceedings, which normally occur in government operations. The legal proceedings are not,in the opinion of the State's legal counsel and the Department of Administration, likely to have a material adverseimpact on the State's financial position, except where listed below.
In State of Montana v. Philip Morris, Inc., No. CDV 97-306 (Mont. 1st Jud. Dist. Lewis & Clark County), the State ofMontana filed various claims against six tobacco manufacturers seeking recovery of an unspecified amount of damages,penalties, and attorney’s fees. The lawsuit was resolved eventually through two settlements. The State first settled itsclaims against one of the manufacturers, Liggett & Meyers, Inc., for $1.0 million to be paid over a 20-year period.Next, Montana was among the Settling States that signed onto the 1998 Master Settlement Agreement (MSA) andsettled its claims against the remaining manufacturers for a settlement amount calculated annually on cigarette salesby Participating Manufacturers in perpetuity. The base amount was augmented by $90.0 million in 1999 for a strategiccontribution portion for those states instrumental in obtaining the settlement, with the additional amount to be paid inequal installments over a 10-year period beginning in 2007 and ending in 2017. Multiple other tobacco productmanufacturers joined the MSA after the initial signing period. Collectively, the signing manufacturers are known as“Participating Manufacturers.”
The settlement provides that the tobacco product manufacturers may potentially offset, against their payment in anyyear, certain amounts of money if it is found that the Participating Manufacturers have lost more than 2% of theirnational market share (from 1997) to non-settling manufacturers (known as NPMs), and that the disadvantages imposedby the settlement were a “significant factor” in the market share loss. The settlement further provides that the offset,known as the “NPM adjustment,” may not be taken against the payments to any state that has enacted a “QualifyingStatute” and diligently enforced the statute during the year in question. Montana enacted such a Qualifying Statute in1999, Section 16-11-401 to -404, MCA, and complimentary legislation in 2003, Section 16-11-501 to -512, MCA.
In March 2006, a determination was made (pursuant to the settlement) that the Participating Manufacturers had lostsufficient market share in 2003 to trigger an NPM adjustment analysis, and that disadvantages caused by the settlementwere a significant factor in the market share loss. Similar findings have been made or agreed to for years 2004 through2017. The State filed a motion in the Montana lawsuit seeking a declaration that it diligently enforced its QualifyingStatute during 2003. The Participating Manufacturers moved to compel arbitration of the question. The First JudicialDistrict Court ordered arbitration, but was overruled on appeal to the Montana Supreme Court. Virtually all of theother Settling States filed similar motions or new actions in their various court systems preferring to litigate their diligentenforcement disputes in court rather than in the tobacco companies’ proposed nationwide arbitration. Montana wasthe only state to prevail on its argument against arbitration before its highest state court. Montana then successfullydefended the favorable ruling from a petition for rehearing in Montana and ultimately a certiorari petition to the U.S.Supreme Court filed by tobacco companies which the Court rejected.
Simultaneously, arbitration between the other Settling States and the tobacco companies commenced and proceededto discovery. After the U.S. Supreme Court denied cert regarding Montana’s participation in the arbitration, the tobaccocompanies sought and received a stay of Montana’s litigation pending completion of the nationwide arbitration,effectively shutting Montana out of any opportunity for input or influence over standards for determining what constitutes“diligent enforcement,” and potentially subjecting Montana to whatever standards may ultimately result from theongoing nationwide arbitration for lack of any alternative interpretative precedent. Thereafter, the Montana SupremeCourt granted Montana’s writ for supervisory control, overturned the stay, and allowed the State’s district court actionto proceed to discovery.
The Montana litigation ended with entry of a stipulated consent decree on June 25, 2012, reflecting the tobaccocompanies’ determination after initial discovery that they would not contest Montana’s diligent enforcement during2003. In the nationwide arbitration, and as applied to Montana’s consent decree, a “no contest” determination for anindividual state means that state would not participate in the NPM Adjustment for 2003, (i.e., as a “no contest” stateMontana had no reduction to its annual OPM settlement payments for 2003).
B-154

However, the “no contest” for 2003 has no precedential effect in any subsequent year for Montana or any other state’scase. Accordingly, Montana was not subject to the 2003 NPM Adjustment, but the consent decree specifically articulatedthat Defendants’ consent to its terms “is not a factual concession that Montana, in fact, did or did not diligently enforcethe Montana Qualifying Statute in 2003 or any other year.”
Despite Montana’s successful defense of its 2003 and 2004 enforcement actions, no precedential protections exist, andthe State remains vulnerable to further expected, litigation regarding its diligent enforcement in 2005-2017, for whichyears the Participating Manufacturers have already received a determination that MSA terms were a “substantial factor”reducing their market share and triggering an NPM Adjustment analysis with the potential to reduce annual paymentsfor those Settling States which failed to diligently enforce their statutes.
The Participating Manufacturers conceded that Montana enacted a qualifying statute within the meaning of the MSA,which was in full force and effect during 2005-2016 and thereafter to date. Factual arguments exist to show that Montanadiligently enforced its Qualifying Statute during 2005-2017. However, legal and procedural uncertainties exist thatmake an adverse determination possible. An adverse determination on the diligent enforcement issue could result inthe loss of some or all of the MSA annual payments to the State for years 2005-2017, which would be recouped throughan offset of payments due to Montana in future years. The Participating Manufacturers will assert claims for NPMadjustments for future years as well. The outcome of these claims is also uncertain.
In 2015, certain Settling States and Participating Manufacturers commenced multi-state arbitration of the issue ofdiligent enforcement for calendar year 2004. Montana is not a party to this arbitration; this arbitration continues.
Montana filed a Declaratory Judgment Motion in 2017 for the 2004 NPM Adjustment to have its MSA Court (FirstJudicial District) declare that Montana had a qualifying statute in place and diligently enforced its Qualifying Statutefor the 2004 calendar year. The Participating Manufacturers conceded that Montana has a Qualifying Statute. As partof this action, Montana successfully obtained a ruling from its MSA Court on the burden of proof whereby theParticipating Manufacturers must prove that Montana did not diligently enforce its Qualifying Statute to succeed underthe NPM Adjustment. Montana is the only state party to the MSA with this ruling on the burden of proof. On the eveof trial, the Participating Manufacturers settled with Montana for all of the 2004 NPM Adjustment funds previouslywithheld plus interest and earnings. The settlement does not provide precedent for future NPM Adjustment proceedingswith the exception of the ruling on the burden of proof. A portion of tobacco litigation proceeds are to be receivedthrough an agreement made subsequent to the balance sheet date. Refer to Note 17 - Subsequent Events for additionalinformation.
PPL v. Montana involves ownership of sections of riverbed on the Missouri, Clark Fork and Madison rivers. The caseoriginated in 2003, when a group of parents of school age children sued PPL in Federal Court alleging that the companymust pay rent for the use of state owned riverbeds to generate hydroelectric power. After the Federal Court dismissedthe case for lack of jurisdiction, PPL filed an action in state district court seeking a declaration that the state could notcharge them rent for use of the riverbeds at issue. The state intervened in the case and counterclaimed for a declarationthat PPL and its co-plaintiffs unlawfully occupied state lands and must compensate the State land trust on behalf of itspublic beneficiaries for the use of those lands. The legal test for ownership of the riverbeds is whether the rivers atissue were navigable at the time of statehood. Based upon the historical record, the District Court granted the Statesummary judgment on the question of navigability and the case proceeded to trial on the issue of compensation for useof trust lands. In June of 2008, the Court issued its ruling and ordered that PPL owed the state almost $41.0 millionfor past use of the riverbeds.
PPL appealed the decision to the Montana Supreme Court. The case was briefed and argued before the Court, and inMarch of 2010, the Montana Supreme Court issued a decision upholding the district court’s finding of navigability anddetermination of compensation.
PPL appealed the case to the United States Supreme Court. The case was briefed and argued, and in February of 2012,the Court reversed the Montana Supreme Court’s decision. The United States Supreme Court concluded that theMontana courts had applied an incorrect legal standard for determining a river’s navigability. The Court clarified thatnavigability had to be determined on a segment-by-segment basis. The Court remanded the case for further proceedings,and the case currently is pending in the Montana First Judicial District, Lewis and Clark County, Judge Michael
B-155

McMahon presiding. The cause number is CDV 2004-846. Additional detail is provided below as the case has beenremanded to the United States District Court, District of Montana, Helena Division.
The most obvious impact of the Supreme Court’s decision is that the State is no longer entitled to the $41.0 millionjudgment. The monetary amount that the State may be entitled to depends on the navigability of the rivers, which willhave to be determined under the Supreme Court’s segment-by-segment approach. Going forward, the litigation willfocus on applying the Supreme Court’s segmentation approach to determine the navigable reaches of the Madison,Clark Fork, and Missouri Rivers. At this stage, it is difficult to predict an outcome on this litigation.
A less obvious financial impact is the bill of costs that PPL submitted to the district court following the remand. PPLrequested that the district court tax the State of Montana with $1.2 million for PPL’s costs relating to the appellateproceedings. All, but approximately $31.0 thousand, relate to premiums that PPL paid for a supersedeas bond in supportof staying the $41.0 million judgment. In May 2012, the State filed its response to PPL’s bill of costs and agreed tocosts for $31.3 thousand. However, the State moved the court to deny PPL’s request for costs related to the supersedeasbond. The parties stipulated to hold this issue in abeyance until the court is able to rule on all remaining matters in thecase. Counsel for the State has agreed to release the supersedeas bond. In the opinion of counsel, there are good legalarguments that support the State’s position that it should not be required to pay the supersedeas bond premiums; however,legal and procedural uncertainties exist that make an adverse determination reasonably possible.
This case, also known as State of Montana v. Talen Montana, LLC et al. (Cause No. CV 16-35-H-DLC-JCL), wasremanded to the United States District Court, District of Montana, Helena Division, and carries on with the HonorableDana L. Christensen, United State Judge, assigned to further proceedings and entry of judgement. Several proceduralmotions have taken place since the prior fiscal year-end, but none that require the State to revise its earlier held opinionthat no further potential liability to the State is expected relative to this action and no additional updates are necessaryin regard to the outstanding litigation.
Spoklie v. Montana Department of Fish, Wildlife and Parks (Spoklie), Sheridan County Docket No. 11013, is the finalpending case challenging the constitutionality of Initiative Measure 143 (I-143), which banned the issuance of newlicenses for game farms in Montana, prohibited the transfer of existing licenses, and prohibited game farm licensesfrom allowing the shooting of game farm animals on a game farm for a fee or other remuneration. The State movedfor summary judgment and that motion is still pending. In the opinion of counsel, good defenses exist to all claims,and the possibility of an outcome adverse to the state is very remote.
Spoklie is the last in a long line of cases that were filed after passage of I-143. The following cases have been concludedin favor of the state: Kafka v. Montana Department of Fish Wildlife, and Parks, Hill County Docket No. DV-02-059,Buhmann et al. v. State of Montana et al., Lewis and Clark Docket No. DV-2002-555, Royal Tine Ranch v. State,Flathead County Docket No. DV-02-606C, and Mesaros v. Department of Fish, Wildlife and Parks, Cascade CountyDocket No. BDV 03-0119. Wallace v. State of Montana, Ravalli County Docket No. 02-254, and Bowman v. MontanaFish, Wildlife and Parks, Fergus County Docket No. DV-2002-02, were previously dismissed without prejudice andhave not been refiled. No other updates in relation to this pending action are known at this time.
Diaz et al. v. Blue Cross and Blue Shield of Montana et al. (Diaz), was a lawsuit filed in the Montana First JudicialDistrict Court, Lewis and Clark County, Cause No. BVD-2008-956, in October 2008, by plaintiffs Jeanette Diaz, LeahHoffman-Bernhardt, and Rachel Laudon, individually, and on behalf of others similarly situated, naming Blue Crossand Blue Shield of Montana (BCBS), New West Health Services (New West), Montana Comprehensive HealthAssociation, State of Montana (State) as defendants. The complaint alleges that the defendants have violated the made-whole laws of Montana and illegally given themselves subrogation rights.
On June 12, 2009, Plaintiffs filed with the District court a motion for class certification. The District Court Judgedenied Plaintiffs’ motion for class certification on December 16, 2009. Plaintiffs appealed this decision to the MontanaSupreme Court. As part of the review of the underlying decision denying class certification, the Montana SupremeCourt remanded the case to the District Court to determine the question of whether the made-whole laws, codified inSection 2-18-902 and 33-30-1102, MCA, apply to the various types of third-party administrators (TPAs) at issue inDiaz. The District Court held that these laws do not apply to TPAs. Plaintiffs appealed this decision.
B-156

On December 21, 2011 the Supreme Court issued its decision, holding that the District Court abused its discretion indenying a class action and that BCBS and New West, as TPAs of the State’s health plan, are not subject to the made-whole laws as “insurers” under Section 2-18-901 to -902, MCA, or under a third party beneficiary theory.
On June 20, 2012, the District Court ruled on the State’s summary judgment motion seeking an order from the courtthat the State has not violated the made-whole laws in the administration of its health plan. The court denied the State’smotion, ruling that the State is an insurer for the purposes of the made-whole laws and that it must conduct a made-whole analysis before exercising and subrogation/coordination of benefits rights. The State filed with the District Courta motion requesting that the court certify its decision to the Montana Supreme Court. The District Court granted themotion, and the Montana Supreme Court, over Plaintiffs’ objection, ultimately agreed in a November 27, 2012, Orderto hear this issue. The Plaintiffs also appealed to the Montana Supreme Court the District Court’s definition of the classaction.
On August 6, 2013, the Montana Supreme Court issued its opinion, affirming the Montana First Judicial District Court’sdecision defining the class action to include only those State benefit plan members who had timely filed claims forcovered benefits within eight years before the filing of the Plaintiffs’ complaint.
On November 6, 2013, the Montana Supreme Court issued its opinion, affirming the District Court’s June 20, 2012,decision that the applicable made-whole laws apply to the State benefit plan.
On September 8, 2014, the District Court issued an order ruling on several motions that the parties had filed. Theprincipal rulings were: (i) the Court authorized Plaintiffs to proceed with additional discovery to determine if the classdefinition should be altered or amended; (ii) given its order to allow additional discovery, the Court held in abeyanceits decision on the State’s Motion for Summary Judgment requesting that the class be limited to those who timely filedclaims within the one-year filing restriction contained in the State’s policy; (iii) the Court granted the Plaintiffs’ motionsasking the Court to require the State conform its health plans, procedures, notices and practices to comply with theMontana Supreme Court’s rulings in this case and to pay covered medical expenses, await the resolution of claimsagainst liability carriers, and then conduct a made-whole determination before it can exercise subrogation or acceptreimbursements from its members or providers; and (iv) the Court ordered the parties to develop a class notice to besent to past and current plan members dated back to eight years before this suit was filed. The State and Plaintiffs’counsel are currently working on the notice.
On April 13, 2015, the District Court issued an Order on Interest to Be Paid, requiring the State to include in thepayments ultimately made to class members' interest at the rate of 10% per annum. For claims arising before December24, 2009, interest will begin 30 days following the Montana Supreme Court’s decision in Blue Cross and Blue Shieldof Montana, Inc. v. Montana State Auditor. For any claims arising after December 24, 2009, interest will begin startingon the day the underlying medical expenses were incurred.
On October 5, 2015, the Plaintiffs filed with the District Court a motion directing the State to pay attorney fees arisingfrom the class action suit. On November 9, 2015, the District Court issued an order denying Plaintiffs’ motion forattorney fees.
On December 14, 2015, the District Court issued an order certifying that its orders concerning interest and attorneyfees were final for purposes of an appeal to the Montana Supreme Court. On January 12, 2016, the Plaintiffs filed aNotice of Appeal with the Montana Supreme Court, appealing the interest and attorney fee orders.
Pursuant to the Montana Supreme Court’s mandatory mediation process, the parties reached a settlement on attorneyfee payments; however, the parties did not reach agreement on the interest issue. On October 25, 2016, the MontanaSupreme Court issued its ruling on the interest issue, finding that November 14, 2009, is the date that interest commences;and, for claims arising after November 14, 2009, interest will begin starting on the day the underlying medical expenseswere incurred.
As of June 30, 2016, the State booked an accrual of approximately $1.5 million, which includes a base payment plusinterest consistent with the District Court’s April 13, 2015, order. Interest will be recalculated based on the SupremeCourt's October 25, 2016, decision.
B-157

On April 28, 2017, the District Court appointed a Special Master to consider and resolve issues regarding expandingthe class to persons with unsubmitted claims; whether to include claims after 2009; whether the State must identifymembers from third party administrators other than Blue Cross/Blue Shield; whether, if at all, the State must reformits systematic practices; supervising the payment and notice process; which party or parties should pay the SpecialMaster for her time and expenses; whether the District Court should approve a partial payment of attorney fees; settinga time frame for making claims; setting a time for ending the class action; determining payment of residual funds; andany other issues as necessary to facilitate the swift and equitable resolution of the case. The Special Master has heldseveral hearings regarding these issues and a recommended decision is expected to be issued in early 2018.
On June 21, 2017, the Special Master issued a report and recommended order regarding the partial payment of Plaintiffs’counsels’ attorney fees. This recommendation was based on a stipulation the State and the Plaintiffs’ counsel hadreached, agreeing that the State would pay counsel $400.8 thousand for claims made by individuals that could bedocumented. The State has paid this amount to class counsel.
The Special Master issued a second report and recommended order expanding the class on August 8, 2018. The principalfindings of this recommendation are to expand the class definition to include those individuals who did not submitclaims to the State for processing; to expand the class to end June 30, 2016; and to redefine the class as (a) employees,employee dependents, retirees and retiree dependents who participate or participated in the State of Montana’s healthbenefit plan(s), administered or operated by the State and/or the third party administrators whose claims for coveredbenefits took place no earlier than eight years prior to the filing of the complaint in this action, which was October 23,2008; (b) who were injured through the legal fault of persons who have legal obligations to compensate them for alldamages sustained; and (c) who have not been made whole for their damages (or for whom the State and TPAs conductedno made whole analysis) because the State and the third party administrators programmatically failed to pay benefitsfor their covered medical costs. The District Court Judge has yet to approve these recommendations.
As of June 30, 2018, the State paid Plaintiffs $1.7 million in base payments plus interest. Since the case is ongoing,the State does not have sufficient information to determine the ultimate cost to the State.
Lair, et al. v. Mangan, et al. is a challenge to the State’s campaign contribution limits. The case has been ongoing forseveral years and the same case has been referred to as Lair v. Bullock and Lair v. Motl through its progression. Thestate won at the Ninth Circuit Court of Appeals, but the plaintiffs have petitioned for certiorari at the United StatesSupreme Court, which is pending. If the Court grants certiorari and the State were to ultimately lose the case, theplaintiffs’ claim for attorney fees would likely be over $1.0 million, although the State would contest that amount.
Langford v. Bullock (Cause # 93-CV-46) is a civil rights case over conditions of confinement at the Department ofCorrections’ (Department), Montana State Prison (MSP) in Deer Lodge, MT. The court imposed a consent decreeagainst the Department in 1994, with continued monitoring by the court until the Department is in full compliance.The consent decree obligates the State to come into full compliance with the Americans with Disabilities Act. Sinceabout 2014, the Department has assumed the additional responsibility to pay attorney’s fees for Plaintiffs’ counsel(ACLU), which have not been submitted since 2008. On June 19, 2018, the Federal District Court accepted the revisedClass Action Settlement Agreement, which includes the Department’s agreement to pay attorney’s fees. The parties arecurrently in the process of attempting to negotiate a resolution to the attorney’s fees requested. At the moment, theClass attorneys indicated they would be seeking in the neighborhood of $1.5 million in attorney’s fees for a periodspanning from 2008 until the present. The Department will likely contest that amount before the Court. That projectedsum does not include the anticipated two-year monitoring period as well. At this time, the Department can state thatit will have a financial obligation in excess of $700.0 thousand for past attorney's fees and costs, but cannot be morespecific about the anticipated amount of financial obligation.
Disability Rights Montana v. Batista (Cause # CV-15-22) is a civil rights case filed by the ACLU of Montana on behalfof Plaintiff, alleging deliberate indifference in the provision of mental health care to seriously mentally ill inmates atMontana State Prison. The District Court dismissed the case for failure to state a claim, which order has been appealedby Plaintiffs to the Ninth Circuit Court of Appeals. The Department of Corrections (Department) has exchangedsettlement proposals and has met with the Plaintiffs and their counsel to discuss potential settlement. The Plaintiff’schances of success of getting the lower court's decision overturned are fair, given the current political climate in theNinth Circuit as it relates to placing seriously mentally ill inmates in restrictive housing. The Plaintiff has made anumber of unreasonable demands that would cost the Department millions of dollars and at least $800.0 thousand in
B-158

attorney’s fees and undisclosed expert witness fees. At this time the Department cannot specify an anticipated amountof financial obligation.
Michael Jackson v. Montana Department of Corrections (Department), Montana State Prison (MSP) (Cause # DV-18-70)is a case pending in Powell County District Court. Mr. Jackson is a current employee, suing the Department for allowingrace discrimination at MSP and creating a hostile work environment. He is seeking lost wages, humiliation, andemotional distress damages as well as attorney’s fees and costs. The Human Rights Bureau found no reasonable causein his claims. His chances of success are poor to fair. The Department has hired outside legal counsel to represent itin this matter. At this time, the Department cannot specify an anticipated amount of financial obligation.
Kila Sheperd v. Montana Department of Corrections (Department) is a Step III Grievance proceeding, in accordancewith 2.21.8017, Administrative Rules of Montana (ARM), and the Department has hired outside counsel to representit regarding Ms. Sheperd's termination from her position at the Department. Ms. Sheperd seeks in excess of $1.0 millionfor punitive damages, lost wages, loss of benefits, emotional distress, and attorney's fees.
Montana Health Care Association, et al, v. Department of Public Health and Human Services (Cause # DDV-2018-565)is a case filed by a group of Medicaid nursing facility providers, alleging a violation of the Montana AdministrativeProcedure Act and other related allegations. The rules in question set Medicaid reimbursement rates at 2.99% less thanthe previously set rates. The potential liability for this case is estimated to be between $3.0 and $3.2 million. Anunfavorable outcome is reasonably possible. Smith, et al. v. State of Montana (Cause # BDV-2018-804) is a case filed by a group of Medicaid recipients as well asa group of Medicaid providers. The allegations include violations of the Montana Administrative Procedure Act andother related allegations. The complaint also includes an alleged violation of the Americans with Disabilities Act basedon a reduction in rates and resulting reductions in services. The rules in question set Medicaid reimbursement rates at2.99% less than the previously set rates, as well as a reduction in rates for targeted Case Management. The potentialliability in this case is estimated to be between $19.0 and $21.0 million. An unfavorable outcome is reasonably possible.
Moody's Market, Inc. et al. v. Montana State Fund, Montana Board of Investments, and State of Montana (Cause #DV-18-12) is a case filed by a group of Montana State Fund (MSF) policyholders, in Lake County District Court, inan effort to prevent the Board of Investments (BOI) from charging a 3% management fee on any single investor whoseaverage portfolio balance held by BOI is greater than $1.0 billion. This fee was allowed to be assessed in accordancewith Senate Bill 4 passed during the Special Legislative Session of November 2017. The legislation required the BOIfee to be deposited into the fire suppression fund of the State of Montana (State). As of June 30, 2018, a total of $14.7million in MSF assets had been transferred. No action beyond procedural activities have taken place in relation to thisproceeding and no additional updates are available at this time.
The Public Employee Retirement Board (PERB) has one item of outstanding litigation in relation to the Sheriffs’Retirement System (SRS). Refer to Note 6, section I for additional disclosure in relation to this legal proceeding.
The Montana State Fund, a discretely presented component unit of the State, has four items of litigation, in addition tothe case listed above, in relation to their operations and underlying statutory authority governing the program. Referto Note 18, section O for additional disclosure in relation to these legal proceedings.
Federal Contingencies
Food Distribution Program – The amount reported for Food Distribution programs (CFDA #10.555, #10.565, #10.567,#10.569, and #10.570) represents the dollar value of food commodities distributed to eligible recipients during the year.The U.S. Department of Agriculture provides the current value of the commodities used by the State to compute theamount reported. The amount of funds received to administer the program is also included in the reported amount.The State also distributes food commodities to other states in the western region of the United States, the value of whichis excluded from the reported amounts. During fiscal year 2018, the State distributed $1.1 million of food commoditiesunder CFDA #10.567 to other states.
B-159

The State of Montana distributed $10.4 million in commodities in fiscal year 2018. The value at June 30, 2018, ofcommodities stored at the State’s warehouse is $2.1 million for which the State is liable in the event of loss. The Statehas insurance to cover this liability.
Miscellaneous Contingencies
Loan Enhancements – As of June 30, 2018, the Board of Investments (BOI) had provided loan guarantees from theCoal Severance Tax Permanent Fund to the Economic Development Bonds Fund and the Facility Finance Authority(a component unit of the State of Montana), totaling $186.6 million. The BOI’s exposure to bond issues of the EconomicDevelopment Bonds Fund was $105.1 million, while exposure to bond issues, surety bonds, and designated loans ofthe Facility Finance Authority was $81.5 million. The BOI has not been held responsible on any loan guarantee in thepast.
Gain Contingencies – Certain natural resource and corporate tax assessments are not reported on the State's financialstatements because they are being protested administratively. As of June 30, 2018, the following assessments (by fundtype) were outstanding (in thousands):
Taxes General FundCorporate Tax $ 14,613
Collectability of these contingencies is dependent upon the decisions of the court, other authorities, or agreed uponsettlements. The corporate tax assessments include material estimates that could result in a significant reduction of thetax assessed once actual numbers are provided. Interest related to corporate tax assessments is distributed to the GeneralFund and is included in the assessment total above.
Loss Contingencies – Certain corporations have requested refunds that are not reported on the State’s financial statementsas of June 30, 2018. The corporations have appealed the department’s decision to deny or adjust the refund. As ofJune 30, 2018, these include $5.2 million of General Fund corporate tax refunds.
Certain companies have protested property taxes that have been included as revenue on the State’s financial statementsas of June 30, 2018. As of June 30, 2018, these include $1.9 million of protested property taxes recorded in the GeneralFund and $2.2 million recorded in the State Special Revenue Fund.
B-160

NOTE 17. SUBSEQUENT EVENTS
Investment Related Issues
Since June 30, 2018, the Board of Investments (BOI) made additional commitments to fund loans from the INTERCAPloan program in the amount of $5.9 million.
On July 6, 2018, the BOI terminated one manager in the Domestic Equity Asset within Consolidated Asset PensionPool (CAPP). The approximate market value of the transition was $80.0 million.
In August based on Board action, the BOI approved an additional loan guarantee from the Coal Severance Tax PermanentFund to Montana Facility Finance Authority totaling $11.0 million. The BOI also directed the Trust Fund InvestmentPool (TFIP) purchase of the Montana direct real estate owned within CAPP for $19.4 million.
On September 28, 2018, the BOI sold PEPAC limited partnerships to an outside 3rd party in a secondary sale. Theproceeds of these sales were $50.0 million.
The BOI’s Executive Director retired September 28, 2018 and a new Executive Director started September 29, 2018.
On October 16, 2018, the BOI reallocated assets in the Domestic Equity Asset Class within CAPP from a commingledfund to a new manager. The approximate market value of the transition was $500.0 million.
Since June 30, 2018, the BOI has committed an additional $200.0 million to alternative equity partnerships withinCAPP, including allocations of: $80.0 million within the Private Equity Asset Class; $40.0 million within the NaturalResource Asset Class; and $80.0 million within the Real Estate Asset Class.
Since June 30, 2018, the BOI has received an additional $16.7 million in loan reservations from Montana Lenders andcommitted to $435.0 thousand in loans from the Coal Severance Tax Permanent Fund.
During fiscal year 2017, the BOI requested a 100% redemption in the amount of $174.0 million from one manager,pertaining to investments from CAPP, TFIP, and Separately Manged Investments (SMI). Since June 30, 2017, totalredemptions in the amount of $116.4 million have been received, of which $10.6 million was received since June 30,2018. The BOI is confident that the full redemption will be received over a reasonable time period.
Since June 30, 2018, the BOI has received recovery payments associated with the recovery of previously written offlosses in the amount of $1.8 million and $270.0 thousand interest.
Other Subsequent Events
On July 18, 2018, the State and Participating Manufacturers, who are parties to the case of the State of Montana v.Phillip Morris, Inc. disclosed in Note 16 - Contingencies, have entered into a settlement agreement in the amount $27.0million, including $3.4 million in back payments and interest, in relation to the State’s 2004 NPM adjustment.
On October 15, 2018, the court, in relation to the Smith, et al. v. State of Montana disclosed in Note 16 - Contingencies,issued an order dismissing all counts as moot.
On October 29, 2018, another order was received by the parties in the Smith case vacating the previous order anddismissing most counts as moot. The remaining counts include an allegation that the Department of Health Humanand Human Services (DPHHS) failed to allow meaningful participation in the decision-making process. In addition,the court issued a separate order, in relation to the Montana Health Care Association, et al., v. DPHHS disclosed inNote 16, dismissing nearly all counts. The two remaining counts include an allegation that the DPHHS has failed touse a bed tax fee appropriately, reducing the reimbursement rate the Plaintiffs would otherwise be receiving, and anallegation that the DPHHS failed to allow meaningful participation in the decision-making process.
B-161

In accordance with 2017 Special Legislative Session Senate Bill 9 and based on fiscal year 2018 unaudited GeneralFund revenue totals, $45.7 million was transferred into the Budget Stabilization Reserve Fund during fiscal year 2019.In addition, $45.7 million was returned to State agency fiscal year 2019 budget appropriations and $21.3 million willremain in the General Fund.
B-162

NOTE 18. COMPONENT UNITS
A. Condensed Financial Statements
Below are the condensed financial statements of the component units for the State of Montana as of June 30, 2018 (inthousands):
Condensed Statement of Net PositionComponent Units
MontanaBoard ofHousing
FacilityFinance
Authority
MontanaState
Fund (1)
MontanaState
University
Universityof
Montana
TotalComponent
UnitsAssets:Cash, investments and other assets $ 617,012 $ 7,956 $ 1,664,968 $ 660,979 $ 542,772 $ 3,493,687Due from primary government — — — 393 790 1,183Due from component units — — — 1 270 271Capital assets (net) (Note 18C) 1 — 28,219 512,638 387,258 928,116
Total assets 617,013 7,956 1,693,187 1,174,011 931,090 4,423,257
Deferred Outflows of Resources 826 45 6,114 40,675 31,266 78,926
Liabilities:Accounts payable and other liabilities 9,106 22 116,294 72,797 67,264 265,483Due to primary government — 10 — 4,058 2,320 6,388Due to component units — — — 270 1 271Advances from primary government — — — 16,737 19,434 36,171Long-term liabilities (Note 18I) 455,133 214 1,043,687 384,652 245,451 2,129,137
Total liabilities 464,239 246 1,159,981 478,514 334,470 2,437,450
Deferred Inflows of Resources 81 37 229 2,406 8,622 11,375
Net Position:Net investment in capital assets 1 — 28,219 341,185 281,439 650,844Restricted 153,518 — — 307,122 335,535 796,175Unrestricted — 7,718 510,872 85,459 2,290 606,339
Total net position $ 153,519 $ 7,718 $ 539,091 $ 733,766 $ 619,264 $ 2,053,358
(1) Montana State Fund reports their financial statements on a calendar-year basis. The information provided is for the year ended December 31, 2017.
B-163

Condensed Statement of ActivitiesComponent Units
MontanaBoard ofHousing
FacilityFinance
Authority
MontanaState
Fund (1)
MontanaState
University
Universityof
Montana
TotalComponent
UnitsExpenses $ 20,996 $ 515 $ 227,078 $ 584,734 $ 447,609 $ 1,280,932
Program Revenues:Charges for services 1,516 613 166,768 280,592 189,675 639,164Operating grants and contributions 19,336 2,208 — 176,777 150,945 349,266Capital grants and contributions — — — 5,219 191 5,410
Total program revenues 20,852 2,821 166,768 462,588 340,811 993,840Net (expense) program revenues (144) 2,306 (60,310) (122,146) (106,798) (287,092)
General Revenues:Unrestricted grants and contributions — — — 111 — 111Unrestricted investment earnings — — 73,073 8,899 17,108 99,080Transfer from primary government — — — 126,803 101,843 228,646Gain (loss) on sale of capital assets — — (50) 378 — 328Miscellaneous — — 1,085 — — 1,085Contributions to term and permanent
endowments — — — 10,587 10,786 21,373Total general revenues and contributions — — 74,108 146,778 129,737 350,623
Change in net position (144) 2,306 13,798 24,632 22,939 63,531
Total net position – July 1 – as previouslyreported 153,328 5,270 525,304 663,615 560,251 1,907,768
Adjustments to beginning net position 335 142 (11) 45,519 36,074 82,059Total net position – July 1 – as restated 153,663 5,412 525,293 709,134 596,325 1,989,827Total net position – June 30 $ 153,519 $ 7,718 $ 539,091 $ 733,766 $ 619,264 $ 2,053,358
(1) Montana State Fund reports their financial statements on a calendar-year basis. The information provided is for the year ended December 31, 2017.
B. Cash/Cash Equivalents and Investments
Due to the integration of funds and combined financial information, component unit cash and cash equivalents, equityin pooled investments and investments are included with the primary government in Note 3.
B-164

C. Capital Assets
The following table summarizes net capital assets reported by the discretely presented component units (in thousands).All component units, other than higher education units, are included under the “Other” caption for this schedule:
MontanaState
UniversityUniversityof Montana Other Total
Capital assets not being depreciated:Land $ 8,323 $ 8,306 $ 1,139 $ 17,768Construction work in progress 52,380 26,503 1,385 80,268Capitalized collections 9,856 18,342 — 28,198Livestock for educational purposes 3,913 — — 3,913
Total capital assets not being depreciated 74,472 53,151 2,524 130,147
Capital assets being depreciated:Infrastructure 44,999 9,904 — 54,903Land improvements 26,048 16,370 — 42,418Buildings/Improvements 688,048 617,047 27,941 1,333,036Equipment 162,718 94,009 7,268 263,995Livestock — 255 — 255Library books 67,779 62,341 — 130,120Leasehold improvements 3,810 — — 3,810
Total capital assets being depreciated 993,402 799,926 35,209 1,828,537Total accumulated depreciation (570,732) (469,360) (9,633) (1,049,725)
Total capital assets being depreciated, net 422,670 330,566 25,576 778,812
Intangible assets 2,182 941 120 3,243MSU Component Unit capital assets, net 13,314 — — 13,314UM Component Unit capital assets, net — 2,600 — 2,600
Discretely Presented Component Unitscapital assets, net $ 512,638 $ 387,258 $ 28,220 $ 928,116
D. Other Postemployment Benefits (OPEB)
Non-university component units are included in the State of Montana benefit plan, whereas the Office of theCommissioner of Higher Education (included in the primary government otherwise) is included in the MontanaUniversity System benefit plan. For these reasons component unit OPEB information is included in Note 7.
Montana State Fund (MSF), prepares separately issued financial statements on a calendar year-end basis. Due to thedifference in reporting period, MSF is currently reporting the OPEB liability within GASB 45 valuation requirements.For note disclosure requirements for MSF under GASB 45, please refer to Note 1 for how to attain separately issuedfinancial statements.
E. Risk ManagementMontana State Fund (MSF or New Fund) is the only component unit risk pool. Unpaid claims and claim adjustmentexpenses are estimated based on the ultimate cost of settling the claims including the effects of inflation and othersocietal/economic factors. There are no significant reductions in insurance coverage from the prior year, nor anyinsurance settlements exceeding insurance coverage for the last three years for MSF. This fund uses the accrual basisof accounting. Montana State Fund investments are recorded at fair value, and the premiums and discounts are amortizedusing the scientific interest method over the life of the securities.
B-165

(1) Montana State Fund (MSF) – This fund provides liability coverage to employers for injured employees who areinsured under the Workers Compensation and Occupational Disease Acts of Montana and workers compensation claimsoccurring on or after July 1, 1990. MSF is a self-supporting, competitive State fund, and functions as the guaranteedmarket. At December 31, 2017, approximately 24,000 employers were insured with MSF. Anticipated investmentincome is considered for computing a premium deficiency, and employers must pay premiums to MSF within specifiedtime frames.
An actuarial study prepared by Willis Towers Watson, as of December 31, 2017, estimated the cost of settling claimsthat have been reported but not settled, and claims that have been incurred but not reported. Due to the fact that actualclaim costs depend on such complex factors as inflation and changes in the law, claim liabilities are recomputedperiodically using a variety of actuarial and statistical techniques in order to produce current estimates that reflect recentsettlements, claim frequency, and other economic and societal factors.
A provision for inflation is implicit in the calculation of estimated future claim costs because reliance is placed bothon actual historical data that reflect past inflation and on other factors that are considered to be appropriate modifiersof past experience. As of December 31, 2017, $919.7 million of unpaid claims and claim adjustment expenses werepresented at face value.
Section 39-71-2311, MCA, requires MSF to set premiums, at least annually, at a level sufficient to insure adequatefunding of the insurance program during the period the rates will be in effect. It also requires MSF to establish aminimum surplus above risk-based capital requirements to support MSF against risks inherent in the business ofinsurance.
For the year ended December 31, 2017, MSF ceded premiums to other reinsurance companies to limit the exposurearising from large losses. These arrangements consist of excess of loss contracts that protect against individualoccurrences over stipulated amounts, and an aggregate stop loss contract which protects MSF against the potential thataggregate losses will exceed expected levels expressed as a percentage of premium. The excess of loss contract providescoverage up to $100.0 million in which MSF retains the first $5.0 million for the first layer of reinsurance coverage.The excess of loss protection applies to an individual occurrence with the maximum of $5.0 million on any one life.
The term of the current aggregate stop loss contract is January 1, 2017 through December 31, 2019. The contractprovides coverage based on MSF’s premium levels not to exceed 15% of the subject net earned premium. In the eventreinsurers are unable to meet their obligations, under either the excess of loss contracts or the aggregate stop losscontract, MSF would remain liable for all losses, as the reinsurance agreements do not discharge MSF from its primaryliability to the policyholders.
Premium revenue was reduced by premiums paid for reinsurance coverage of $9.8 million during the year endedDecember 31, 2017.
Estimated claim reserves were reduced by $1.4 million as of December 31, 2017, for the amount of reinsurance estimatedto be ultimately recoverable on incurred losses due to the excess of loss reinsurance contract and an additional $12.0million for the amount of reinsurance estimated to be ultimately recoverable on incurred losses due to the aggregatestop loss contract.
(2) Changes in Claims Liabilities for the Past Two Years – As indicated above, this fund establishes liabilities forboth reported and unreported insured events including estimates of future payments of losses and related claimadjustment expenses. The following table presents changes (in thousands) in the aggregate liabilities for Montana StateFund net of estimated reinsurance recoverable. The information presented is at face value and has not been discounted.
B-166

Year EndedDecember 31, 2017
Year EndedDecember 31, 2016 (1)
Unpaid claims and claim adjustments expensesat beginning of year $ 921,532 $ 900,296
Incurred claims and claim adjustment expenses:Provision for insured event of the current
year 137,222 139,240Increase (decrease) in provision for insured
events of prior years (14,195) (7,986)Total incurred claims and claim adjustment
expenses 123,027 131,254Payments:
Claims and claim adjustment expensesattributable to insured events of thecurrent year (24,597) (23,086)
Claims and claim adjustment expensesattributable to insured events of prior years (100,272) (86,932)
Total payments (124,869) (110,018)Total unpaid claims and claim adjustment
expenses at end of year $ 919,690 $ 921,532
(1) Changes in claims liabilities for the year ended December 31, 2016 are restated. In prior years, they were providedon a statutory accounting basis rather than the governmental accounting basis.
F. Capital Leases/Installment Purchases
Obligations under capital leases/installment purchases at June 30, 2018, were as follows (in thousands):
Fiscal Year Ending June 30:
DiscretelyPresented
Component Units2019 $ 1982020 1342021 912022 472023 8
Total minimum payments 478Less: interest (42)
Present value of minimumpayments $ 436
B-167

G. Operating Leases
Future rental payments under operating leases at June 30, 2018, are as follows (in thousands):
Fiscal Year Ending June 30:Discretely Presented
Component Units2019 $ 4,5882020 4,7542021 4,0812022 3,1752023 7,950Thereafter 10,795
Total future rental payments $ 35,343
H. Debt Service Requirements
Debt service requirements of discretely presented component units at June 30, 2018, were as follows (in thousands):
Montana Board of Housing Montana State University University of MontanaYear Ended
June 30: Principal Interest Principal Interest Principal Interest2019 $ 14,265 $ 14,943 $ 11,880 $ 7,817 $ 9,350 $ 3,4292020 15,845 14,508 10,612 7,475 9,765 3,0582021 16,335 14,149 10,504 7,111 10,125 2,6562022 16,645 13,739 10,893 6,753 10,611 2,2382023 17,200 13,275 6,721 6,436 11,277 1,8112024 - 2028 96,885 57,655 36,108 27,870 29,787 4,6362029 - 2033 100,075 40,472 31,130 20,808 11,275 1,6702034 - 2038 81,955 23,329 30,477 13,878 3,645 3142039 - 2043 59,975 10,588 29,561 7,702 — —2044 - 2048 24,375 2,607 19,264 1,540 — —2049 - 2053 1,970 51 — — — — Total $ 445,525 $ 205,316 $ 197,150 $ 107,390 $ 95,835 $ 19,812
B-168

I. Summary of Changes in Long-term Liabilities Payable
Long-term liability activity of discretely presented component units for the year ended June 30, 2018, was as follows(in thousands):
BeginningBalance (3) Additions Reductions
EndingBalance
AmountsDue WithinOne Year
AmountsDue In MoreThan One
YearDiscretely presented component unitsBonds/notes payable
Montana Board of Housing $ 446,617 $ 80,004 $ 74,752 $ 451,869 $ 14,265 $ 437,604Montana State University (MSU) 160,167 58,601 11,903 206,865 11,880 194,985University of Montana (UM) 92,046 14,125 9,053 97,118 9,385 87,733
Total bonds/notes payable (1) 698,830 152,730 95,708 755,852 35,530 720,322
Other liabilitiesLease/installment purchase payable 456 93 113 436 173 263Compensated absences payable 63,868 30,557 31,342 63,083 31,257 31,826Arbitrage rebate tax payable 561 395 304 652 40 612Estimated insurance claims 921,531 123,029 124,870 919,690 124,359 795,331Due to federal government 32,509 260 951 31,818 — 31,818Derivative instrument liability 4,188 — 1,108 3,080 — 3,080Reinsurance funds withheld 75,739 11,969 1,838 85,870 — 85,870Unearned compensation 391 — — 391 — 391Net pension liability 206,646 30,850 14,704 222,792 — 222,792Total OPEB liability (2) 76,289 2,897 37,191 41,995 — 41,995
Total other liabilities 1,382,178 200,050 212,421 1,369,807 155,829 1,213,978
$ 2,081,008 $ 352,780 $ 308,129 $ 2,125,659 191,359 1,934,300
Long-term liabilities of Montana University System component units (4) (118) 3,596Total discretely presented component units’ long-term liabilities $ 191,241 $ 1,937,896
(1) When applicable, this amount includes unamortized discounts and unamortized premiums.(2) The total OPEB liability beginning balances were restated due to the implementation of GASB No. 75.(3) Beginning balances are taken from component unit financial statements.(4) Interentity transaction eliminations between Montana University System component units for debt shown in the component unit information can cause negative
balances in component unit information.
J. Refunded and Early Retired Debt
Refunded DebtOn July 25, 2017, Montana State University issued Series D 2017 bonds in the amount of $21.0 million, to refund $8.3million of the Series K 2006 and $12.7 million of the Series M 2011 bonds. As of June 30, 2018, the portion of theSeries M 2011 bonds not refunded totaled $0.9 million.
Defeased Debt OutstandingThe University of Montana has defeased certain bond issues by placing proceeds of new bonds in an irrevocable trust.The proceeds, together with interest earned thereon, will be sufficient for future debt service payments on the refundedissues. Accordingly, the trust account assets and the liability for the defeased bonds are not included in the University'sconsolidated financial statements. As of June 30, 2018, $85.2 million of bonds outstanding were considered defeased.
B-169

K. No-Commitment Debt
Information is presented below for financing authorities participating in debt issues. The State has no obligation forthis debt. Accordingly, these bonds and notes are not reflected in the accompanying financial statements.
Facility Finance Authority (FFA)FFA is authorized to issue bonds and notes to finance projects for qualifying health care and other community-basedservice providers. The revenue bonds are payable solely from loan repayments to be made by eligible facilities pursuantto loan agreements, and further, from the funds created by the indentures and investment earnings thereon. The notesare payable solely from loan repayments pursuant to loan agreements. The revenue bonds and notes payable issued byFFA do not constitute a debt, liability, obligation, or pledge of faith and credit of the State of Montana, with the exceptionof the Montana State Hospital Project included in Note 11. At June 30, 2018, revenue bonds and notes outstandingaggregated $995.0 million.
The Board of Investments and FFA have entered into a capital reserve account agreement for certain bond issues. SeeNote 16 for more information.
Montana Board of Housing (MBOH)MBOH is authorized to issue bonds and make mortgage loans in order to finance affordable housing for Montanaresidents. The bonds are special limited obligations, payable solely from pledged revenues and assets of the borrower,not general obligations of MBOH. These bonds issued by MBOH do not constitute a debt, liability, obligation, or pledgeof faith and credit of the State of Montana. At June 30, 2018, bonds outstanding aggregated $23.4 million.
L. Non-Exchange Financial Guarantee
BOI provides loan guarantees from the Coal Severance Tax Fund to the Facility Finance Authority (FFA). BOI exposureto bond issues, surety bonds, and designated loans of the FFA totaled $81.5 million as of June 30, 2018. FFA is adiscretely presented component unit of the State of Montana. FFA guarantee requests are submitted to BOI for reviewand approval. BOI’s participation, either duration or any other consideration, to either purchase bonds or loans or tolend money for deposit into FFA’s statutorily allowed capital reserve account is explicitly limited by statute whichrequires BOI to act prudently. The guarantee requests from FFA pertain to bonds issued by FFA with a term of up to40 years. BOI and FFA have entered into an agreement detailing repayment to BOI. BOI has not had to perform on anyloan guarantee in the past.
The following schedule summarizes the activity related to the non-exchange financial guarantee during the year endedJune 30, 2018 (in thousands):
BeginningBalance Additions Reductions
Ending Balance
$ 71,416 $ 36,470 $ 26,435 $ 81,451
M. Derivative Transactions Related to Long-term Debt
Montana State University (MSU) has two interest rate swaps as of June 30, 2018. Interest rate swaps are classified ashedging derivative instruments if the instruments meet the criteria of paragraphs 27 (a) and (b) of GASB StatementNo. 53 – Accounting and Financial Reporting for Derivative Instruments (GASB 53), or as investment derivativeinstruments if they do not.
Derivative DescriptionTrade Date
EffectiveDate
TerminationDate Terms Counterparty
$25.75 million fixed payer swap 3/10/2005 7/21/2005 11/15/2035 Pay 3.953%, Receive SIFMA Deutsche Bank AG$25.25 million basis swap 12/19/2006 11/15/2007 11/15/2035 Pay SIFMA, Receive 86.8%
of 10-year SIFMAMorgan Stanley Capital
Services Inc.
B-170

As of June 30, 2018, the fixed payer swap is classified as a hedging derivative instrument under GASB 53, whereasthe basis swap is an investment derivative instrument because there is no identified financial risk being hedged by thebasis swap that can be expressed in terms of exposure to adverse changes in cash flows or fair values. GASB 53 includesfour methods for evaluating hedge effectiveness; a governmental entity may use any of the evaluation methods outlinedin GASB 53 and is not limited to using the same method from period to period. The four methods described in GASB53 are: consistent critical terms, synthetic instrument, dollar-offset, and regression analysis. In addition, GASB 53permits a governmental entity to use other quantitative methods that are based on “established principles of financialeconomic theory.” The fixed payer swap passes the established criteria using the regression analysis methodology.
The fair values of the interest rate swaps were estimated using the zero-coupon method. This method calculates thefuture net settlement payments required by the swap, assuming that the current forward rates implied by the yield curvecorrectly anticipate future spot interest rates. These payments are then discounted using the spot rates implied by thecurrent yield curve for hypothetical zero-coupon bonds due on the date of each future net settlement on the swaps. Tomeasure non-performance risk for a derivative liability, credit spreads implied by the credit rating for debt issues byentities with similar credit characteristics were used. This is the best method available under current market conditionssince MSU has no credit default swaps that actively trade in the marketplace. For a derivative asset, the adjustment fornon-performance risk of counterparties was determined by analyzing counterparty-specific credit default swaps, ifavailable. If not available, credit default swaps in the market for entities of similar type and rating were used, alongwith information found in various public and private information services. This analysis is used to construct a creditcurve that is applied to the discount curve on the net settlement payments of the derivative.
The counterparty to the fixed payer swap had the right to terminate the swap at $0 on December 14, 2016 (a Europeanoption); this option was not exercised. As of the trade date, the option’s value included intrinsic value and time value.The option’s intrinsic value (calculated as the difference between the at-market rate of 4.11% and the off-market rateof 3.953%) is accounted for as a loan receivable and is repaid by the off-market portion of each swap payment. OnSeptember 10, 2010, the Series J bonds were converted to index bonds. While in index mode the interest rate is resetweekly at a rate of the Securities Industry and Financial Markets Association (SIFMA) rate plus a fixed spread. Thespread is based on the long-term, unenhanced rating assigned to the issuer; the current spread as of June 30, 2018, was0.65%. The dependent variable in the regression is the interest rates of the hedged cash flows; the independent variableis the floating rates due under the hedging derivative.
The fair value of the fixed payer swap liability as of June 30, 2018, is at fair value level 2, and was based on forwardSIFMA rates using the three month Libor Zero Curve, and the BMA Swaption Volatility on the AA Rated Muni RevenueCurve. The fair value of the nonhedging derivative investment is also at level 2, and was based on forward SIFMArates using the 10-year forward BMA constant maturity swap using the three month Libor Zero Curve, and the BMASwaption Volatility on the counterparty’s credit default swap.
The following table summarizes the reported balances as of, and the derivative instrument activity during, the yearended June 30, 2018 (in thousands):
Activity During 2018 Fair Values at June 30, 2018Cash flow hedges: Notional Classification Amount Classification AmountCash flow hedge –
Pay fixed interest rate swap $ 19,800 Interest expense $ 20 Loan receivable $ 230Investment income — Derivative liability 3,080Deferred outflow (1,108)
Investment derivative –
Basis swap $ 19,800 Investment loss $ 412Investment (excluding
interest accrued) $ 56
B-171

The objective and terms of MSU’s hedging derivative outstanding as of June 30, 2018, is as follows (in thousands):
Type ObjectiveNotional amount Effective Date
TerminationDate
Cash (Paid)/Received Terms
Pay fixed, cancelableinterest rate swap
Hedge interest rate riskon Series J 2005 Bonds $ 19,800 7/21/2005 11/15/2035 $ —
Pay 3.953%Receive SIFMA
Credit Risk
It is MSU’s policy to enter into derivative agreements with highly rated counterparties. As of June 30, 2018, counterpartyratings were A3 and Baa2 by Moody’s and A- and BBB+ by Standard and Poor’s (S&P). MSU manages credit risk byrequiring its counterparties to post collateral in certain events. MSU is entitled to collateral from its fixed payer swapcounterparty if the interest rate swap’s fair value is greater than $5.0 million and the counterparty is rated A+ or A, byS&P, or A1 or A2 by Moody’s. If the counterparty to the fixed payer swap is rated A- or below, by S&P, or A3 or belowby Moody’s, MSU is entitled to collateral up to 100% of the swap’s fair value. MSU is not required to post collateral.MSU will continue to monitor counterparty credit risk.
MSU enters into derivative agreements with multiple counterparties to limit concentration of credit risk. Currently,MSU has interest rate swaps with two different counterparties and each counterparty accounts for approximately 50%of outstanding notional. MSU monitors counterparty credit risk on an ongoing basis.
Interest Rate Risk
Interest payments on variable rate debt will typically increase as interest rates increase. MSU believes it has significantlyreduced interest rate risk by entering into a pay-fixed, receive floating interest rate swap. As interest rates increase, netswap payments decrease so that changes in hedged variable-rate debt interest payments, attributable to SIFMA, arelargely offset by the net swap payments.
Basis Risk
The variable-rate cash flows being hedged by the pay-fixed swap will increase or decrease as SIFMA rates increase ordecrease. Because the hedged cash flows are SIFMA based and the floating receipts of the pay-fixed swap are SIFMAbased, there is no basis risk.
Termination Risk
MSU or its counterparties may terminate a derivative instrument if the other party fails to perform under the terms ofthe contract. In addition, MSU’s fixed payer swap counterparty has the right to terminate the derivative if the creditrating of MSU’s unenhanced long-term revenue bond rating is withdrawn, suspended or reduced below BBB-, in thecase of S&P, or below Baa3 in the case of Moody’s. If such an event occurs, MSU could be forced to terminate thefixed payer swap in a liability position. As of June 30, 2018, MSU’s unenhanced long-term revenue bond rating wasAa3 by Moody’s and A+ by S&P.
Foreign Currency RiskAll hedging derivatives are denominated in US Dollars and therefore MSU is not exposed to foreign currency risk.
Market Access RiskMarket access risk is the risk that MSU will not be able to enter credit markets or that credit will become more costly.For example, to complete a derivative instrument’s objective, an issuance of refunding bonds may be planned in thefuture. If at that time MSU is unable to enter credit market, expected cost savings may not be realized.
B-172

N. Related Party Transactions
Private nonprofit organizations with relations to the University of Montana (UM) include the Alumni Association, theMontana Technology Enterprise Center (MonTEC), the Montana Tech Booster Club and the Montana Tech AlumniAssociation.
The associations and booster club operate exclusively for the purpose of encouraging, promoting and supportingeducational programs, research, scholarly pursuits and athletics at, or in connection with UM. For the years ended June30, 2018, $237.8 thousand was transferred from or expended by the Montana Tech Booster Club for scholarships andconstruction projects. In exchange, UM provides the associations and booster club with office space, staff and somerelated office expenses.
MonTEC was established as a nonprofit 501(c)3 corporation in fiscal year 2001 as a result of an agreement betweenUM and the Missoula Area Economic Development Foundation (MAEDF). MonTEC provides low cost lease spaceand business consulting to local “start-up” companies. The corporation’s board of directors is comprised equally ofmembers appointed by MAEDF and UM. UM does not provide office space or other services to MonTEC.
Private nonprofit organizations affiliated with Montana State University (MSU) include the MSU-Bozeman Bookstore,Friends of KUSM, and Friends of KEMC. Friends of Montana Public Television provided $1.2 million during 2018and Friends of KEMC Public Radio provided $848.6 thousand during 2018 in support of MSU’s television and radiostations.
O. Litigation Contingencies
Susan Hensley v. Montana State Fund is based on a Petition for Hearing filed before the Workers’ Compensation Courtin October 2013. The matter is Susan Hensley vs. Montana State Fund, WCC No. 2013-3235. Under House Bill 334,as passed by the legislature in 2011 and codified in section 39-71-703 (2), MCA, when a claimant receives a Class Iimpairment, it is not payable unless the claimant has an actual wage loss as a result of the compensable injury oroccupational disease. The law was effective July 1, 2011, and applicable to claims that occurred on or after that date.The petitioner in this matter is challenging the constitutionality of section 39-71-703 (2), MCA. State Fund anticipatesthe chances are remote, but as with any litigated matter there is the possibility of an adverse decision. Should the statutebe held unconstitutional, determined to be applicable to other claims and also determined to be retroactively applicable,potential liability is estimated to be at least $2.2 million per year, as based on NCCI initial pricing, and current estimatedbusiness volumes. However, based on experience, costs may be substantially higher than the estimate of $2.2 millionper year.
Montana State Fund received another Petition for Hearing that was filed before the Workers’ Compensation Court.The matter is Steven Hanson v. Montana State Fund, WCC No. 2014-3398. This is a companion case to Susan Hensleyv. Montana State Fund and has been held in abeyance pending a decision in Hensley.
Mak and Sons Concrete Construction Service v. Montana State Fund is a matter filed in the First Judicial District Courtand involves the issue of whether the Montana State Fund breached its contract to provide workers' compensationinsurance coverage. The Montana State Fund canceled Mak and Sons’ policy of insurance due to not receiving timelypayment of premium. During the uninsured period, several employees of Mak and Sons were involved in a motorvehicle accident. As a result, Mak and Sons sued the Montana State Fund seeking to have coverage for the injuries aswell as for breach of the contract of insurance and breach of the covenant of good faith and fair dealing.
P. Subsequent Events
In November 2017, the Board of Regents authorized the issuance of up to $4.5 million in Intercap debt to fund theconstruction of a student activity complex on the Montana State University (MSU) Bozeman campus that includes aturf field, lighting, and restrooms. A new student fee had previously been approved to service the debt. Funds had notyet been drawn as of June 30, 2018, but the University expects to draw $4.0 million during the year ending June 30,2019.
B-173

In July 2018, MSU received authorization to refinance the Series J 2005 bonds with the issuance of Series F variablerate debt in the same principal amount of $19.8 million.
In August 2018, Single Family Mortgage Bonds, 2018 Series B, were issued by the Board of Housing for $50.0 millionto be used for the purpose of acquiring additional mortgage loans in Montana.
On September 11, 2018, a resolution to issue Single Family Mortgage Bonds, Single Family Program Bonds, or SingleFamily Homeownership Bonds, in one or more series or subseries in an aggregate principle amount not to exceed $75.0million with fixed or variable rates was passed by the Board of Housing.
In September 2018, MSU Billings received revised authorization to expend up to $17.1 million for design, renovationand construction of its Yellowstone Science and Allied Health Building. The 63rd Legislature had appropriated $10.0million to the project dependent upon a $5.0 million match at the local level for a total authority of $15.0 million. The$5.0 million gift funding has now been committed by the MSU Billings Foundation, and a portion of the project willalso be funded with student fees as was approved by student resolution.
In September 2018, the Department of Education informed the University of Montana (UM) that it was imposing afine of $966.6 thousand for its failure to comply with the requirements of the Jeanne Clery Disclosure of CampusSecurity Policy and Campus Crime Statistics Act (the Clery Act) in Section 485 (f) of the Higher Education Act of1965, 20 U.S.C., Section 1092 (f). UM is appealing the imposed fine through the appeal process, outlined in 34 C.F.R.,Part 668, Subpart G.
In November 2018, MSU Bozeman notified the Board of Regents of its intent to plan for the construction of a newacademic facility, American Indian Hall, to create additional classrooms and student support space. In October 2018,the MSU Alumni Foundation announced an anonymous gift of $12.0 million, which, added to previous donations,totals nearly $16.0 million in private funds. The Associated Students of Montana State University also approved theuse of $2.0 million in student building fees for the project in October 2018. The University intends to request approvalboth to expend the $2.0 in student building fees and approval to expend a maximum of $20.0 million for the project asa whole at the May 2019 meeting.
On November 16, 2018, a loan in the amount of $300.0 thousand was made to Ouellette Place Limited Partnershipsfrom the Board of Housing’s Multifamily funds. The funds will be used for financing of a housing development inLewistown, Montana.
Q. Commitments
Montana State Fund (MSF or New Fund) is in the first phase of a multi-year project to replace its legacy policymanagement system. The total system replacement and change management cost is estimated to be almost $20.0 million.Vendor payments are based on successful completion of terms and an agreed payment schedule. Phase I payments areestimated to be about $10.0 million with milestones scheduled from January 2018 to September 2019. Costs duringthe application development phase will be capitalized and recorded as construction work in process until the system isdeployed.
As of June 30, 2018, Montana State University (MSU) had issued purchase orders committing the expenditure ofapproximately $9.1 million for equipment, supplies and services which had not yet been received.
B-174

NOTE 19. MATERIAL VIOLATIONS OF FINANCE-RELATED LEGAL PROVISIONS
Constitutionality of Retirement Plan Funding
The Montana Constitution, Article VIII, Section 15, states that public retirement systems shall be funded on an actuariallysound basis. Public pension plans are considered actuarially sound if the unfunded accrued actuarial liability amortizationperiod is within 30 years. As of June 30, 2018, the Game Warden & Peace Officers’ Retirement System (GWPORS),the Highway Patrol Officers’ Retirement System (HPORS), the Public Employees’ Retirement System - Defined BenefitRetirement Plan (PERS-DBRP), and the Teachers' Retirement System (TRS) plans were not in compliance and do notamortize within 30 years. The unfunded liabilities in the other state retirement systems amortize in 30 years or less asof the fiscal year ended June 30, 2018.
B-175

BUDGETARTY COMPARISON SCHEDULEGENERAL AND MAJOR SPECIAL REVENUE FUNDSFOR THE FISCAL YEAR ENDED JUNE 30, 2018 (amounts expressed in thousands)
GENERAL FUNDORIGINAL FINALBUDGET BUDGET ACTUAL VARIANCE
REVENUESLicenses/permits $ 126,502 $ 126,502 $ 126,637 $ 135Taxes:
Natural resource 68,268 68,268 86,090 17,822Individual income 1,320,808 1,320,808 1,285,132 (35,676)Corporate income 168,763 168,763 166,393 (2,370)Property 278,473 278,473 277,127 (1,346)Fuel — — — —Other 239,607 239,607 237,112 (2,495)
Charges for services/fines/forfeits/settlements 37,674 37,674 35,776 (1,898)Investment earnings — — 12,805 12,805Sale of documents/merchandise/property 337 337 334 (3)Rentals/leases/royalties 7 7 7 —Contributions/premiums 5,232 5,232 5,250 18Grants/contracts/donations 4,020 4,020 10,856 6,836Federal 21,068 21,068 21,154 86Federal indirect cost recoveries 186 186 257 71Other revenues 6,008 6,008 400 (5,608)
Total revenues 2,276,953 2,276,953 2,265,330 (11,623)
EXPENDITURESCurrent:
General government 361,887 361,887 350,591 11,296Public safety 321,098 321,098 311,184 9,914Transportation — — — —Health and human services 540,387 540,387 517,528 22,859Education 1,016,098 1,016,098 1,007,891 8,207Natural resources 33,290 33,290 31,394 1,896
Debt service (Note RSI-1):Principal retirement — — 22 (22)Interest/fiscal charges — — 283 (283)
Capital outlay (Note RSI-1) — — 1,381 (1,381)Total expenditures 2,272,760 2,272,760 2,220,274 52,486
Excess of revenue over (under) expenditures 4,193 4,193 45,056 40,863
OTHER FINANCING SOURCES (USES)Insurance proceeds — — — —General capital asset sale proceeds 110 110 96 (14)Energy conservation loans — — — —Transfers in (Note 12) 77,412 77,412 142,443 65,031Transfers out (Note 12) (251,893) (251,893) (59,155) 192,738
Total other financing sources (uses) (174,371) (174,371) 83,384 257,755Net change in fund balances
(Budgetary basis) (170,178) (170,178) 128,440 298,618
RECONCILIATION OF BUDGETARY/GAAP REPORTING1. Securities lending income — — 1 12. Securities lending costs — — — —3. Inception of lease/installment contract — — — —4. Adjustments for nonbudgeted activity — — — —
(GAAP basis) (170,178) (170,178) 128,441 298,619
Fund balance - July 1 — — 66,984 66,984Prior period adjustments — — 4,625 4,625Increase (decrease) in inventories — — (734) (734)
Fund balances - June 30 $ (170,178) $ (170,178) $ 199,316 $ 369,494
The notes to the required supplementary information are an integral part of this schedule. Budgetary data is not broken down to the same account level as actual financial statement data, which accounts for some of the larger variances.The original and final budget figures reflect adjustments to the original budget for various reasons, including legislative and executive changes.
B-176

STATE SPECIAL REVENUE FUND FEDERAL SPECIAL REVENUE FUNDORIGINAL FINAL ORIGINAL FINALBUDGET BUDGET ACTUAL VARIANCE BUDGET BUDGET ACTUAL VARIANCE
$ 215,742 $ 215,742 $ 220,889 $ 5,147 $ — $ — $ — $ —
73,861 73,861 82,085 8,224 — — — —— — — — — — — —— — — — — — — —
18,257 18,257 18,284 27 — — — —301,245 301,245 258,920 (42,325) — — — —144,681 144,681 146,245 1,564 7 7 1 (6)113,026 113,026 105,587 (7,439) 16,409 16,409 18,295 1,886
— — 6,775 6,775 — — 448 44813,123 13,123 9,899 (3,224) 2 2 — (2)
919 919 967 48 — — — —26,908 26,908 27,421 513 — — — —12,239 12,239 11,285 (954) 49 49 18 (31)7,646 7,646 7,859 213 2,811,215 2,811,215 2,768,657 (42,558)
52,032 52,032 48,945 (3,087) 65,362 65,362 67,345 1,9835,512 5,512 2,795 (2,717) 966 966 516 (450)
985,191 985,191 947,956 (37,235) 2,894,010 2,894,010 2,855,280 (38,730)
314,817 314,817 199,816 115,001 234,735 234,735 92,685 142,05090,542 90,542 72,333 18,209 42,070 42,070 15,824 26,246331,293 331,293 220,366 110,927 514,017 514,017 111,201 402,816171,562 171,562 153,331 18,231 2,237,129 2,237,129 1,997,224 239,90590,975 90,975 75,176 15,799 282,062 282,062 209,620 72,442367,883 367,883 220,970 146,913 167,567 167,567 92,184 75,383
— — 634 (634) — — 32 (32)— — 355 (355) — — 5 (5)— — 55,971 (55,971) — — 328,856 (328,856)
1,367,072 1,367,072 998,952 368,120 3,477,580 3,477,580 2,847,631 629,949(381,881) (381,881) (50,996) 330,885 (583,570) (583,570) 7,649 591,219
247 247 299 52 — — — —144 144 1,787 1,643 24 24 31 7— — 1,589 1,589 — — — —
277,830 277,830 171,578 (106,252) 17,379 17,379 2,517 (14,862)(87,410) (87,410) (85,206) 2,204 (70,148) (70,148) (32,381) 37,767190,811 190,811 90,047 (100,764) (52,745) (52,745) (29,833) 22,912
(191,070) (191,070) 39,051 230,121 (636,315) (636,315) (22,184) 614,131
— — 113 113 — — — —— — (65) (65) — — — —— — 312 312 — — — —— — (20,665) (20,665) — — — —
(191,070) (191,070) 18,746 209,816 (636,315) (636,315) (22,184) 614,131
— — 1,581,457 1,581,457 — — 12,078 12,078— — 1,691 1,691 — — 39 39— — (834) (834) — — — —
$ (191,070) $ (191,070) $ 1,601,060 $ 1,792,130 $ (636,315) $ (636,315) $ (10,067) $ 626,248
B-177

NOTES TO THE REQUIRED SUPPLEMENTARY INFORMATION
NOTE RSI – 1. BUDGETARY REPORTING
A. State Budget Process
The Montana Legislature meets in the odd-numbered years to prepare annual budgets for the next biennium. TheConstitution requires that legislative appropriations not exceed available revenues. The Legislature uses revenueestimates in the budgetary process to establish appropriation levels. Expenditures may not legally exceed budgetappropriations at the fund level. In addition, the State Constitution prohibits borrowing to cover deficits incurred becauseappropriations exceeded anticipated revenues. State law requires an appropriation for disbursements from the general,special revenue and capital projects funds, except for those special revenue funds from non-state and non-federal sourcesrestricted by law or by the terms of an agreement. The level of budgetary control is established by fund type, exceptcapital project funds, which are at project level. Budgets may be established in other funds for administrative purposes.
Agency budget requests are submitted to the Governor, and the Legislative Fiscal Division receives a copy. The Officeof Budget and Program Planning (OBPP) and the Governor analyze the requests, establish priorities, and develop therequests into the executive budget request submitted to the Legislature. Joint appropriations subcommittee hearingsare held, and an omnibus appropriation bill is reported in the House and subsequently sent to the Senate. The Legislaturegenerally enacts one bill to establish the majority of appropriations for the next two fiscal years. OBPP establishesappropriations for each program by accounting entity (fund) within an agency. The Legislature enacts otherappropriations, but only within the available revenue. Agencies must prepare and submit to the budget directoroperational plans showing the allocation of operating budgets by expenditure category (i.e., personal services, operatingexpenses, equipment, etc.). The budget director or other statutorily designated approving authority may authorizechanges among expenditure categories and transfers between program appropriations.
Appropriations may not be increased by amendment in the General Fund. However, a department, institution, or agencyof the executive branch desiring authorization to make expenditures from the General Fund during the first fiscal yearof the biennium from appropriations for the second fiscal year of the biennium may apply for authorization from theGovernor through the budget director. In the second year of the biennium, during the legislative session, the Legislaturemay authorize supplemental appropriations. The Governor, or designee, may approve budget amendments for non-general fund monies not available for consideration by the Legislature and for emergencies. In the accompanyingfinancial schedule, original and final budget amounts are reported. There were no expenditures in excess of totalauthorized appropriations in the State's budgeted funds for the fiscal year.
Appropriations for debt service activities are continuing through statutory authority until the obligation is extinguished.Because these non-operating budgets primarily serve a management control purpose, and related appropriations arecontinuing in nature, no comparison between budgeted and actual amounts for funds budgeted on this basis is provided.
Appropriations for capital projects funds are not made on an annual basis, but are adopted on a project-length basis.Because these non-operating budgets primarily serve a management control purpose, and related appropriations arecontinuing in nature, no comparison between budgeted and actual amounts for funds budgeted on this basis is provided.
Appropriations may be continued into the next fiscal year when authorized by the Legislature or the Governor's Office.After fiscal year-end, appropriations that are not continued are reverted. The reverted appropriations remain availablefor one fiscal year for expenditures that exceed the amount accrued or encumbered. Fund balances are not reserved forreverted appropriations. For fiscal year 2018, reverted governmental fund appropriations were as follows: $14.9 millionin the General Fund, $117.0 million in the State Special Revenue Fund, and $196.7 million in the Federal SpecialRevenue Fund. Agencies are allowed to carry forward 30% of their reverted operating appropriations into the next twofiscal years. This amount can be used for new expenditures at the request of the agency and upon approval of OBPP.
B. Budget Basis
The Legislature's legal authorization ("appropriations") to incur obligations is enacted on a basis inconsistent withGenerally Accepted Accounting Principles (GAAP). The budget basis differs from GAAP for encumbrances outstandingat fiscal year-end, compensated absences, capital assets and inventories purchased in proprietary funds, certain loansfrom governmental funds, and other miscellaneous nonbudgeted activity.
B-178

REQUIRED SUPPLEMENTARY INFORMATION
NOTE RSI – 2. PENSION PLAN INFORMATION
Required Supplementary Information State of Montana as an Employer Entity
Judges’ Retirement SystemSchedule of Changes in Net Pension Liability/(Asset) and Related Ratiosˡ
For the Fiscal Year Ended June 30(dollars in thousands)
2018 2017 2016 2015Total Pension Liability (TPL)Service costs $ 1,628 $ 1,578 $ 1,653 $ 1,594Interest 4,044 3,986 3,934 3,824Differences between expected and actual experience 862 (1,341) (1,032) —Changes of assumptions 3,865 — — —Benefit payments (3,554) (3,416) (3,041) (3,023)
Net change in total pension liability 6,845 807 1,514 2,395Total pension liability – beginning 53,953 53,146 51,632 49,237Total pension liability – ending $ 60,798 $ 53,953 $ 53,146 $ 51,632
Plan Fiduciary Net PositionContributions – employer $ 1,800 $ 1,806 $ 1,684 $ 1,651Contributions – member 488 729 534 481Net investment income 10,368 1,779 3,843 12,421Benefit payments (3,554) (3,416) (3,041) (3,023)Administrative expense (254) (197) (136) (100)Other — (3) — —
Net change in plan fiduciary net position 8,848 698 2,884 11,430Plan fiduciary net position - beginning 87,805 87,107 84,223 72,793Plan fiduciary net position - ending $ 96,653 $ 87,805 $ 87,107 $ 84,223
Net Pension (Asset) – Beginning $ (33,852) $ (33,961) $ (32,591) $ (23,556)Net Pension (Asset) – Ending $ (35,855) $ (33,852) $ (33,961) $ (32,591)
Plan fiduciary net position as a percentage of TPL 159% 163% 164% 163%Covered payroll $ 6,974 $ 6,920 $ 6,525 $ 6,355Net pension (asset) as a percentage of covered payroll (514)% (489)% (521)% (513)%
Schedule of Employer ContributionsˡFor the Fiscal Year Ended June 30
(in thousands)
2018 2017 2016 2015Contractually required contributions $ 1,085 $ 1,800 $ 1,786 $ 1,684Contributions made in relation to the contractually
required contributions 1,085 1,800 1,786 1,684Contribution deficiency/(excess) $ — $ — $ — $ —
Covered payroll $ 7,291 $ 6,974 $ 6,920 $ 6,525Contributions as a percentage of covered payroll 15% 26% 26% 26%
ˡ Schedules are intended to present information for 10 years. Additional years will be displayed as they become available.
B-179

Judges’ Retirement SystemNotes to Required Supplementary Information
For the Year Ended June 30, 2018
Method and assumptions used in calculations of contractually determined contributions: The contractually requiredcontribution rates are determined on an annual basis for the fiscal year beginning July 1, 2017, determined as of June30, 2017.
The following key methods and assumptions were used to determine the contractual contribution rates reported in thatschedule:
Actuarial cost method Entry age NormalAmortization method Level percentage of pay, openAsset valuation method 4-year smoothed marketWage inflation 3.50%, including inflationSalary increases 0% Inflation 2.75%Investment rate of return 7.65%, net of pension plan investment expense, including inflationMortality (healthy) RP-2000 Combined employee and annuitant mortality table projected
to 2020 using scale BB, males set back 1 yearMortality (disabled) RP-2000 Combined employee and annuitant mortality tableAdmin expense as a % of payroll 0.17%
Changes of assumptions: Amounts presented in reporting year 2016 reflect changes in eligibility for survivor's benefits.Assumptions in reporting year 2018 were updated in relation to refunds and related termination benefit amounts andfor economic/market trends.
B-180

Required Supplementary Information State of Montana as an Employer Entity
Highway Patrol Officers’ Retirement SystemSchedule of Changes in Net Pension Liability and Related Ratios ˡ
For the Fiscal Year Ended June 30(dollars in thousands)
2018 2017 2016 2015Total Pension Liability (TPL)Service costs $ 3,665 $ 3,799 $ 3,598 $ 3,464Interest 15,121 14,545 14,113 13,518Changes in benefits — — 1,856 —Difference between expected and actual experience 2,774 18 267 —Changes of assumptions 7,892 — — —Benefit payments (11,037) (10,482) (10,001) (9,443)Refunds of contributions (245) (94) — —
Net change in total pension liability 18,170 7,786 9,833 7,539Total pension liability – beginning 200,752 192,966 183,133 175,594Total pension liability – ending $ 218,922 $ 200,752 $ 192,966 $ 183,133
Plan Fiduciary Net PositionContributions – employer $ 5,782 $ 5,916 $ 5,840 $ 5,736Contributions – non-employer 263 243 — —Contributions – member 1,950 1,917 1,624 1,458Net investment income 15,099 2,605 5,738 18,677Benefit payments (11,037) (10,482) (10,001) (9,443)Administrative expense (248) (197) (144) (109)Refunds of Contributions (245) (94) — —Other — (2) — —
Net change in plan fiduciary net position 11,564 (94) 3,057 16,319Plan fiduciary net position – beginning 128,973 129,067 126,010 109,691Plan fiduciary net position – ending $ 140,537 $ 128,973 $ 129,067 $ 126,010
Net Pension Liability – Beginning $ 71,779 $ 63,899 $ 57,123 $ 65,903Net Pension Liability – Ending $ 78,385 $ 71,779 $ 63,899 $ 57,123
Plan fiduciary net position as a percentage of TPL 64% 64% 67% 69%Covered payroll $ 14,779 $ 15,276 $ 14,549 $ 14,149Net pension liability as a percentage of covered payroll 530% 470% 439% 404%
Schedule of Employer Contributions ˡFor the Fiscal Year Ended June 30
(dollars in thousands)
2018 2017 2016 2015Contractually required contributions $ 5,843 $ 5,706 $ 6,161 $ 5,782Contributions in relation to the contractually required
contributions 5,843 5,706 6,161 5,782Contribution deficiency/(excess) $ — $ — $ — $ —
Covered payroll $ 15,251 $ 14,779 $ 15,276 $ 14,549Contributions as a percentage of covered payroll 38% 39% 40% 40%
ˡ Schedules are intended to present information for 10 years. Additional years will be displayed as they become available.
B-181

Notes to Required Supplementary InformationHighway Patrol Officers’ Retirement System
For the Year Ended June 30, 2018
Method and assumptions used in calculations of contractually determined contributions: The contractually requiredcontribution rates are determined on an annual basis for the fiscal year beginning July 1, 2017, determined as of June30, 2017.
The following key methods and assumptions were used to determine the contractual contribution rates reported in thatschedule:
Actuarial cost method Entry age NormalAmortization method Level percentage of pay, openAsset valuation method 4-year smoothed marketWage inflation 3.50%, including inflationSalary increases 0% to 6.30%Inflation 2.75%Investment rate of return 7.65%, net of pension plan investment expense, including inflationMortality (healthy) RP-2000 Combined employee and annuitant mortality table projected
to 2020 using scale BB, males set back 1 yearMortality (disabled) RP-2000 Combined employee and annuitant mortality tableAdmin expense as a % of payroll 0.28%
Changes of assumptions: Amounts presented in reporting year 2016 reflect changes in DROP participation and relatedassumptions. Amounts for reporting year 2018 reflect changes in working retiree, second retirement benefit, and refundrequirements in addition to updates in underlying market and economic factors.
B-182

Required Supplementary Information State of Montana as an Employer Entity
Game Wardens’ and Peace Officers’ Retirement SystemSchedule of Changes in Net Pension Liability and Related Ratios ˡ
For the Fiscal Year Ended June 30 (dollars in thousands)
2018 2017 2016 2015Total Pension Liability (TPL)Service costs $ 8,623 $ 8,403 $ 8,008 $ 7,850Interest 14,269 12,911 12,398 11,258Difference between expected and actual experience 3,743 2,705 731 —Changes of assumptions 5,878 — — —Benefit payments (5,810) (5,068) (5,352) (5,229)Refunds of contributions (1,036) (1,066) — —
Net change in total pension liability 25,667 17,885 15,785 13,879Total pension liability – beginning 187,534 169,649 153,864 139,985Total pension liability – ending $ 213,201 $ 187,534 $ 169,649 $ 153,864
Plan Fiduciary Net PositionContributions - employer $ 4,464 $ 4,278 $ 4,088 $ 3,762Contributions - member 5,278 5,036 4,924 4,462Net investment income 18,590 3,167 6,435 20,069Benefit payments (5,810) (5,068) (5,352) (5,229)Administrative expense (329) (269) (200) (162)Refunds of contributions (1,036) (1,066) — —Other (1) (31) — —
Net change in plan fiduciary net position 21,156 6,047 9,895 22,902Plan fiduciary net position – beginning 154,685 148,638 138,743 115,841Plan fiduciary net position – ending $ 175,841 $ 154,685 $ 148,638 $ 138,743
Net Pension Liability – Beginning $ 32,849 $ 21,011 $ 15,121 $ 24,144Net Pension Liability – Ending $ 37,360 $ 32,849 $ 21,011 $ 15,121
Plan fiduciary net position as a percentage of TPL 82% 82% 87% 90%Covered payroll $ 49,381 $ 47,108 $ 44,885 $ 41,637Net pension liability as a percentage of covered payroll 76% 70% 47% 36%
Schedule of Employer ContributionsFor the Fiscal Year Ended June 30
(dollars in thousands)
2018 2017 2016 2015Contractually required contributions $ 4,574 $ 4,447 $ 4,240 $ 4,040Contributions in relation to the contractually required
contributions 4,574 4,447 4,240 4,040Contribution deficiency/(excess) $ — $ — $ — $ —
Covered payroll $ 50,823 $ 49,381 $ 47,108 $ 44,885Contributions as a percentage of covered payroll 9% 9% 9% 9%
ˡ Schedules are intended to present information for 10 years. Additional years will be displayed as they become available.
B-183

Notes to Required Supplementary InformationGame Wardens’ and Peace Officers’ Retirement System
For the Year Ended June 30, 2018
Method and assumptions used in calculations of contractually determined contributions: The contractually requiredcontribution rates are determined on an annual basis for the fiscal year beginning July 1, 2017, determined as of June30, 2017.
The following key methods and assumptions were used to determine the contractual contribution rates reported in thatschedule:
Actuarial cost method Entry age NormalAmortization method Level percentage of pay, openAsset valuation method 4-year smoothed marketWage inflation 3.50%, including inflationSalary increases 0% to 6.30%Inflation 2.75%Investment rate of return 7.65%, net of pension plan investment expense, including inflationMortality (healthy) RP-2000 Combined employee and annuitant mortality table projected
to 2020 using scale BB, males set back 1 yearMortality (disabled) RP-2000 Combined employee and annuitant mortality tableAdmin expense as a % of payroll 0.17%
Changes of assumptions: Amounts presented in reporting year 2016 reflect changes in survivor benefits from 2.0%to 2.5% of HAC, and requires membership election within 90 days. Amounts presented in reporting year 2018 reflectchanges to limitations on working retirees and their related second retirement benefit. Assumptions in reporting year2018 were also updated in relation to refunds and survivor benefit payment options.
B-184

Required Supplementary Information State of Montana as an Employer Entity
Public Employees’ Retirement System-Defined Benefit Retirement SystemSchedule of Proportionate Share of the Net Pension Liability ˡ
For the Year Ended June 30(dollars in thousands)
2018 2017 2016 2015Employer’s proportion of the net pension liability 53.049189% 53.241100% 53.611080% 53.223780%Employer’s proportionate share of the net pension liability $ 1,033,200 $ 906,880 $ 749,414 $ 663,174Employer’s covered payroll $ 648,671 $ 621,755 $ 620,286 $ 597,083Employer ’s proportionate share of the net pension liability
as a percentage of its covered payroll 159% 146% 121% 111 %Plan fiduciary net position as a percentage of the total
pension liability 74% 75% 78% 80%
Schedule of Employer Contributions ˡFor the Fiscal Year Ended June 30
(dollars in thousands)
2018 2017 2016 2015Contractually required contributions $ 54,844 $ 56,256 $ 59,073 $ 58,575Contributions in relation to the contractually required
contributions 54,844 56,256 59,073 58,575Contribution deficiency/(excess) $ — $ — $ — $ —
Covered payroll $ 640,177 $ 648,671 $ 621,755 $ 620,286Contributions as a percentage of covered payroll 9% 9% 10% 9%
ˡ Schedules are intended to present information for 10 years. Additional years will be displayed as they become available.
Notes to Required Supplementary InformationFor the Year Ended June 30, 2018
Method and assumptions used in calculations of contractually determined contributions: The contractually requiredcontribution rates are determined on an annual basis for the fiscal year beginning July 1, 2017, determined as of June30, 2017.
The following actuarial methods and assumptions were used to determine contractual contribution rates reported inthat schedule:
Actuarial cost method Entry age NormalAmortization method Level percentage of payroll, openAsset valuation method 4-year smoothed marketWage inflation 3.50%, includes inflationSalary increases 0% to 4.80%Inflation 2.75%Investment rate of return 7.65%, includes inflationMortality (healthy) RP-2000 Combined employee and annuitant mortality table projected
to 2020 using scale BB, males set back 1 yearMortality (disabled) RP-2000 Combined employee and annuitant mortality tableAdmin expense as a % of payroll 0.26%
Changes of assumptions: Since reporting year 2016, assumptions for GABA, second retirements, and definedcontribution (DC) law have been updated to match current law and plan provisions. Since reporting year 2018,assumptions for working retirees, terminations, refunds, disabled DC members, and special funding have been updatedto reflect changes in law and plan provisions.
B-185

Required Supplementary Information State of Montana as a Nonemployer Entity
Public Employees’ Retirement System-Defined Benefit Retirement SystemSchedule of Proportionate Share of the Net Pension Liability ˡ
For the Year Ended June 30(dollars in thousands)
2018 2017 2016 2015Nonemployer’s proportion of the net pension liability 1.007464% 0.956169% 0.956090% 0.961287%Nonemployer’s proportionate share of the net pension
liability $ 19,622 $ 16,287 $ 13,365 $ 11,978Plan fiduciary net position as a percentage of the total
pension liability 74% 75% 78% 80%
Schedule of Nonemployer ContributionsFor the Fiscal Year Ended June 30
(dollars in thousands)
2018 2017 2016 2015Contractually required contributions $ 34,706 $ 28,763 $ 30,800 $ 32,397Contributions in relation to the contractually required
contributions 34,706 28,763 30,800 32,397Contribution deficiency/(excess) $ — $ — $ — $ —
ˡ Schedules are intended to present information for 10 years. Additional years will be displayed as they become available.
Notes to Required Supplementary InformationFor the Year Ended June 30, 2018
Method and assumptions used in calculations of contractually determined contributions: The contractuallydetermined contribution rates are set forth by the Legislature and are contained within the Montana Code Annotated(MCA). The amounts used for the valuation as of the year ended June 30, 2017, are as follows:
Special Funding The State contributes 0.1% of member compensation on behalf of local government entities per Section19-3-319, MCA.The State contributes 0.37% of member compensation on behalf of school district entities per Section 19-3-319,MCA.
Changes of assumptions: Since the 2018 reporting date, assumptions related to special funding provided have changedand may affect trends.
B-186

Required Supplementary Information State of Montana as an Employer Entity
Sheriffs’ Retirement SystemSchedule of Proportionate Share of the Net Pension Liability ˡ
For the Year Ended June 30 (dollars in thousands)
2018 2017 2016 2015Employer’s proportion of the net pension liability 4.856692% 5.454386% 5.637055% 5.535%Employer’s proportionate share of the net pension liability $ 3,696 $ 9,582 $ 5,434 $ 2,304Employer’s covered payroll $ 3,634 $ 3,850 $ 3,836 $ 3,580Employer ’s proportionate share of the net pension liability
as a percentage of its covered payroll 102% 249% 141% 64%Plan fiduciary net position as a percentage of the total
pension liability 81% 63% 75% 87%
Schedule of Employer ContributionsFor the Fiscal Year Ended June 30
(dollars in thousands)
2018 2017 2016 2015Contractually required contributions $ 496 $ 368 $ 389 $ 388Contributions in relation to the contractually required
contributions 496 368 389 388Contribution deficiency/(excess) $ — $ — $ — $ —
Covered payroll $ 3,781 $ 3,634 $ 3,850 $ 3,836Contributions as a percentage of covered payroll 13% 10% 10% 10%
ˡ Schedules are intended to present information for 10 years. Additional years will be displayed as they become available.
Notes to Required Supplementary InformationFor the Year ended June 30, 2018
Method and assumptions used in calculations of contractually determined contributions: The contractually requiredcontribution rates are determined on an annual basis for the fiscal year beginning July 1, 2017, determined as of June30, 2017. The following actuarial methods and assumptions were used to determine contractual contribution ratesreported in that schedule:
Actuarial cost method Entry age NormalAmortization method Level percentage of payroll, openAsset valuation method 4-year smoothed marketWage Inflation 3.50%, includes inflationSalary increases 0% to 6.30%Inflation 2.75%Investment rate of return 7.65%, includes inflationMortality (healthy) RP-2000 Combined employee and annuitant mortality table projected
to 2020 using scale BB, set back 1 year for malesMortality (disabled) RP-2000 Combined employee and annuitant mortality tableAdmin expense as a % of payroll 0.21%
Changes of assumptions: Since the 2018 reporting date, assumptions related second retirement benefit payments,refund payment options to terminated employees, and funding requirements have been updated to reflect current planprovisions.
B-187

Required Supplementary InformationState of Montana as a Nonemployer Contributing Entity
Municipal Peace Officers’ Retirement SystemSchedule of Proportionate Share of the Net Pension Liability ˡ
For the Year Ended June 30 (dollars in thousands)
2018 2017 2016 2015Nonemployer’s proportion of the net pension liability 67.085433% 66.499650% 66.954111 % 66.888728%Nonemployer’s proportionate share of the net pension
liability $ 119,354 $ 119,708 $ 110,756 $ 105,106Plan fiduciary net position as a percentage of the total
pension liability 68% 66% 67% 67%
Schedule of Nonemployer Contributions ˡFor the Fiscal Year Ended June 30
(dollars in thousands)
2018 2017 2016 2015Contractually required contributions $ 15,283 $ 13,215 $ 13,752 $ 13,433Contributions in relation to the contractually required
contributions 15,283 13,215 13,752 13,433Contribution deficiency/(excess) $ — $ — $ — $ —
ˡ Schedules are intended to present information for 10 years. Additional years will be displayed as they become available.
Notes to Required Supplementary InformationFor the Year Ended June 30, 2018
Method and assumptions used in calculations of contractually determined contributions: The contractuallydetermined contribution rates are set forth by the Legislature and are contained within the Montana Code Annotated(MCA). The amounts used for the valuation as of the year ended June 30, 2017, are as follows:
The State contributes 29.37% of member compensation on behalf of all employer entities per Section 19-9-702,MCA.
Changes of assumptions: No changes in assumptions or other inputs that affected the measurement date have beenmade since the prior measurement date.
B-188

Required Supplementary InformationState of Montana as an Employer Entity
Firefighters’ Unified Retirement SystemSchedule of Proportionate Share of the Net Pension Liability ˡ
For the Year Ended June 30 (dollars in thousands)
2018 2017 2016 2015Employer’s proportion of the net pension liability 2.233929% 2.261523% 2.399255% 1.850026%Employer’s proportionate share of the net pension liability $ 2,525 $ 2,583 $ 2,454 $ 1,806Employer’s covered payroll $ 1,022 $ 974 $ 986 $ 735Employer ’s proportionate share of the net pension liability
as a percentage of its covered payroll 247% 265% 249% 245%Plan fiduciary net position as a percentage of the total
pension liability 78% 75% 77% 77%
Schedule of Employer Contributions ˡFor the Fiscal Year Ended June 30
(dollars in thousands)
2018 2017 2016 2015Contractually required contributions $ 518 $ 472 $ 475 $ 142Contributions in relation to the contractually required
contributions 518 472 475 142Contribution deficiency/(excess) $ — $ — $ — $ —
Covered payroll $ 1,103 $ 1,022 $ 974 $ 986Contributions as a percentage of covered payroll 47% 46% 49% 14%
ˡ Schedules are intended to present information for 10 years. Additional years will be displayed as they become available.
Notes to Required Supplementary InformationFor the Year Ended June 30, 2018
Method and assumptions used in calculations of contractually determined contributions: The contractually requiredcontribution rates are determined on an annual basis for the fiscal year beginning July 1, 2017, determined as of June30, 2017. The following actuarial methods and assumptions were used to determine contractual contribution ratesreported in that schedule:
Actuarial cost method Entry age NormalAmortization method Level percentage of payroll, openAsset valuation method 4-year smoothed marketWage inflation 3.50%, including inflationInflation 2.75%Salary increases 0% to 6.30%Investment rate of return 7.65%, including inflationMortality (healthy) RP-2000 Combined employee and annuitant mortality table projected
to 2020 using scale BB, males set back 1 yearMortality (disabled) RP-2000 Combined employee and annuitant mortality tableAdmin as a % of payroll 0.23%
Changes of assumptions: Since the 2018 reporting date, changes in assumptions for working retiree limitations andeffects on second retirement benefits, plan member election and participation, terminating employee provisions, andrefund assumptions have been updates to reflect current plan provisions.
B-189

Required Supplementary InformationState of Montana as a Nonemployer Contributing Entity
Firefighters’ Unified Retirement SystemSchedule of Proportionate Share of the Net Pension Liability ˡ
For the Year Ended June 30(dollars in thousands)
2018 2017 2016 2015Nonemployer’s proportion of the net pension liability 67.876338% 67.809541% 67.358196% 68.005182%Nonemployer’s proportionate share of the net pension
liability $ 76,724 $ 77,448 $ 68,892 $ 66,384Plan fiduciary net position as a percentage of the total
pension liability 78% 75% 77% 77%
Schedule of Nonemployer Contributions ˡFor the Fiscal Year Ended June 30
(dollars in thousands)
2018 2017 2016 2015Contractually required contributions $ 15,272 $ 14,042 $ 13,635 $ 13,573Contributions in relation to the contractually required
contributions 15,272 14,042 13,635 13,573Contribution deficiency/(excess) $ — $ — $ — $ —
ˡ Schedules are intended to present information for 10 years. Additional years will be displayed as they become available.
Notes to Required Supplementary InformationFor the Year Ended June 30, 2018
Method and assumptions used in calculations of statutorily determined contributions: The statutorily determinedcontribution rates are set forth by the Legislature and are contained within the Montana Code Annotated (MCA). Theamounts used for the valuation as of the year ended June 30, 2017, are as follows:
The State contributes 32.61% of member compensation on behalf of all employer entities per Section19-13-604, MCA.
Changes of assumptions: No changes in assumptions or other inputs that affected the measurement date have beenmade since the prior measurement date.
B-190

Required Supplementary InformationState of Montana as a Nonemployer Contributing Entity
Volunteer Firefighters’ Compensation ActSchedule of Proportionate Share of the Net Pension Liability ˡ
For the Year Ended June 30(dollars in thousands)
2018 2017 2016 2015Nonemployer’s proportion of the net pension liability 100% 100% 100% 100%Nonemployer’s proportionate share of the net pension
liability $ 10,087 $ 10,599 $ 10,504 $ 5,089Plan fiduciary net position as a percentage of the total
pension liability 78% 76% 76% 87%
Schedule of Nonemployer Contributions ˡFor the Fiscal Year Ended June 30
(dollars in thousands)
2018 2017 2016 2015Contractually required contributions $ 2,207 $ 2,054 $ 2,024 $ 1,913Contributions in relation to the contractually required
contributions 2,207 2,054 2,024 1,913Contribution deficiency/(excess) $ — $ — $ — $ —
ˡ Schedules are intended to present information for 10 years. Additional years will be displayed as they become available.
Notes to Required Supplementary InformationFor the Year Ended June 30, 2018
Method and assumptions used in calculations of actuarially determined contributions: The statutorily determinedcontribution rates are set forth by the Legislature and are contained within the Montana Code Annotated (MCA). Theamounts used for the valuation as of the year ended June 30, 2017, are as follows:
The State contributes 5% of certain fire tax insurance premiums paid per Section 19-17-301, MCA.
Changes of assumptions: Since the 2016 reporting year, benefit terms were updated to reflect plan provisions. Inreporting year 2018, discount, inflation, mortality, and withdrawal assumptions were updated to better reflect marketconditions and actual experience.
B-191

Required Supplementary InformationState of Montana as an Employer Entity
Teachers’ Retirement SystemSchedule of Proportionate Share of the Net Pension Liability ˡ
For the Year Ended June 30(dollars in thousands)
2018 2017 2016 2015Employer’s proportion of the net pension liability 2.860298% 3.121008% 3.422388% 4.689747%Employer’s proportionate share of the net pension liability $ 48,227 $ 57,016 $ 56,230 $ 72,168Employer’s covered payroll $ 26,944 $ 28,915 $ 31,252 $ 32,937Employer ’s proportionate share of the net pension liability
as a percentage of its covered payroll 179% 197% 179% 219%Plan fiduciary net position as a percentage of the total
pension liability 70% 67% 69% 70%
Schedule of Employer Contributions ˡFor the Fiscal Year Ended June 30
(dollars in thousands)
2018 2017 2016 2015Contractually required contributions $ 17,298 $ 17,396 $ 16,946 $ 16,234Contributions in relation to the contractually required
contributions 17,298 17,396 16,946 16,234Contribution deficiency/(excess) $ — $ — $ — $ —
Covered payroll $ 24,275 $ 26,944 $ 28,915 $ 31,252
Contributions as a percentage of covered payroll 71% 65% 58% 52%
ˡ Schedules are intended to present information for 10 years. Additional years will be displayed as they become available.
Notes to Required Supplementary InformationFor the Year Ended June 30, 2018
Changes of assumptions: Since reporting year 2015, assumptions about mortality, inflation, wage growth, andinvestment expenses were adjusted to more closely match actual experience and benefit statutes. Since reporting year2016, termination benefits, assumed rate of university member retirements, load factors for university members, andCOLA assumptions for Tier 2 members were updated to more closely reflect actual experience. Since reporting year2017, the normal cost method was updated to align the most appropriate allocation of plan costs.
Method and assumptions used in calculations of actuarially determined contributions: The actuarially determinedcontribution rates are determined on an annual basis for the fiscal year beginning July 1, 2017, determined as of June30, 2017.
The following actuarial methods and assumptions were used to determine actuarial contribution rates reported in thatschedule:
Actuarial cost method Entry ageAmortization method Level percentage of pay, openRemaining amortization period 22 yearsAsset valuation method 4-year smoothed marketInflation 3.25%Salary increase 4.00% to 8.51%, including inflation for non-University Members and
5.00% for University MembersInvestment rate of return 7.75%, net of pension plan investment expense, and including inflation
B-192

Required Supplementary InformationState of Montana as a Nonemployer Contributing Entity
Teachers’ Retirement SystemSchedule of Proportionate Share of the Net Pension Liability ˡ
For the Year Ended June 30(dollars in thousands)
2018 2017 2016 2015Nonemployer’s proportion of the net pension liability 38.133267% 38.729473% 39.384625% 38.777294%Nonemployer’s proportionate share of the net pension
liability $ 642,958 $ 707,527 $ 647,092 $ 596,724Plan fiduciary net position as a percentage of the total
pension liability 70% 67% 69% 70%
Schedule of Nonemployer Contributions ˡFor the Fiscal Year Ended June 30
(dollars in thousands)
2018 2017 2016 2015Contractually required contributions $ 43,718 $ 43,028 $ 42,400 $ 42,806Contributions in relation to the contractually required
contributions 43,718 43,028 42,400 42,806Contribution deficiency/(excess) $ — $ — $ — $ —
ˡ Schedules are intended to present information for 10 years. Additional years will be displayed as they become available.
Notes to Required Supplementary InformationFor the Year Ended June 30, 2018
Method and assumptions used in calculations of contractually determined contributions: The contractually requiredcontribution rates are set forth by the Legislature and are contained within the Montana Code Annotated (MCA). Theamounts used for the valuation as of the year ended June 30, 2017, are as follows:
The State contributes 0.11% of the compensation of members participating per Section 19-20-604, MCA.
The State contributes 2.38% of member compensation on behalf of school district and community collegeentities per Section 19-20-607, MCA.
The State contributes a $25 million payment from the General Fund per Section 19-20-607, MCA.
Changes of assumptions: No changes in assumptions or other inputs that affected the measurement date have beenmade since the prior measurement date.
B-193

REQUIRED SUPPLEMENTARY INFORMATION
NOTE RSI – 3. OTHER POSTEMPLOYMENT BENEFITS PLAN INFORMATION (OPEB)
The State of Montana and MUS OPEB plans allow retirees to participate, as a group, at a rate that does not cover allof the related costs. This results in the reporting of the Total OPEB Liability in the related financial statements and notedisclosures.
In accordance with GASB 75, the following information is presented to reflect the funding progress of the OtherPostemployment Benefits Plans for the State of Montana OPEB plan.
Total OPEB Liability and Related RatiosLast 10 Fiscal Years (1)
(in thousands)TotalOPEB
Liability 2018
Service cost $ 1,889Interest 2,014Changes of benefit terms —
Difference betweenexpected and actualexperience (4,723)Changes of assumptions orother inputs
(295)
Benefit payments 1,705Net change in total OPEBliability
590
Total OPEB liability -Beginning 49,869
Total OPEB Liability -Ending
$ 50,459
State and discretelypresented component units'proportion of the collectivetotal OPEB liability 100%
Covered employee payroll $ 675,661
Total OPEB liability as apercentage of coveredemployee payroll
7.47%
(1) Schedules are intended to present information for 10 years. Additional years will be displayed as they become available.
Note to Schedule: No assets are accumulated in a trust that meets the criteria of GASB 75.
Factors that significantly affect trends in the amounts reported:
Changes of benefit terms, the medical plan coverage moved from Cigna to Allegiance as of January 1, 2016, the Stateplan implemented reference-based pricing hospital contracts effective July 1, 2016, the pharmacy plan moved from
B-194

URx to Navitus as of January 1, 2017, and the State plan implemented an employer group waiver program for Medicareretirees effective January 1, 2017.
In accordance with GASB 75, the following information is presented to reflect the funding progress of the OtherPostemployment Benefits Plans for MUS plan.
Total OPEB Liability and Related RatiosLast 10 Fiscal Years (1)
(in thousands)TotalOPEB
Liability 2018
Service cost $ 1,954Interest 1,410Changes of benefit terms —
Difference between expectedand actual experience
(1,323)Changes of assumptions orother inputs
(182)
Benefit payments (679)Net change in total OPEBliability
1,180
Total OPEB liability -Beginning 34,258
Total OPEB liability -Ending
$ 35,438
State and discretelypresented component units'proportion of the collectivetotal OPEB liability 95.62%
Covered employee payroll (2) $ 434,243
Total OPEB liability as apercentage of coveredemployee payroll
8.53%
(1) Schedules are intended to present information for 10 years. Additional years will be displayed as they become available.(2) Amount reported is for the whole MUS plan, Community Colleges are included due to lack of ability to separate covered employee payroll.
Note to Schedule: No assets are accumulated in a trust that meets the criteria of GASB 75.
Factors that significantly affect trends in the amounts reported:
Changes of benefit terms, MUS plan increased the deductible, increased out-of pocket limits for Medical and Rx,increased visit copays, pharmacy moved from URx to Navitus as of July 1, 2017, employer group waiver program forMedicare retires became effective July 1, 2017, adopted combined annual visit max of 30 for multiple therapy services,and massage therapy moved into rehabilitation benefit.
B-195

REQUIRED SUPPLEMENTARY INFORMATION
NOTE RSI – 4. RISK MANAGEMENT TREND INFORMATION
The following tables present risk management trend information for the Hail Insurance Fund and the MUS GroupBenefits Fund. The Hail Insurance Fund pays claims within a calendar year cycle that parallels the growing seasonfrom spring planting to fall harvesting; therefore, it has no development cycle. The MUS Group Benefits Fund has athree to five-year development cycle.
The tables illustrate how the earned revenues (net of reinsurance) of the funds and their investment income compareto related costs of loss (net of loss assumed by reinsurers) and other expenses assumed by the funds as of the end ofthe fiscal year (in thousands). Section 3 shows the funds’ incurred claims and allocated claim adjustment expense (bothpaid and accrued) as originally reported at the end of the first year in which the event that triggered coverage under thecontract occurred. Section 4 shows the cumulative amounts paid as of the end of successive years for each policy year.Section 6 shows how each policy year's incurred claims increased or decreased as of the end of successive years. Thisannual re-estimation results from new information received on known claims, reevaluation of existing information onknown claims, as well as emergence of new claims not previously known. Section 7 compares the latest re-estimatedincurred claims amount to the amount originally established (Section 3) and shows whether this latest estimate of claimscost is greater or less than originally thought. As data for individual policy years mature, the correlation between originalestimates and re-estimated amounts is commonly used to evaluate the accuracy of incurred claims currently recognizedin less mature policy years. This table will be revised as data for successive policy years develops.
B-196

Stat
e of M
onta
na H
ail In
sura
nce P
rogr
amCl
aims D
evelo
pmen
t Inf
orm
atio
n20
1820
1720
1620
1520
1420
1320
1220
1120
1020
091.
Prem
ium
s and
inve
stm
ent r
even
ue E
arne
d$
4,320
$5,9
18$
7,446
$8,3
09$
8,029
$7,1
01$
7,034
$6,7
10$
6,866
$6,8
46 C
eded
3,255
4,771
6,346
2,049
——
——
——
Net
earn
ed1,0
651,1
471,1
006,2
608,0
297,1
017,0
346,7
106,8
666,8
462.
Unall
ocat
ed ex
pens
es in
cludi
ngov
erhe
ad$
448
$45
5$
424
$1,1
24$
1,033
$3,5
62$
2,308
$1,5
45$
2,637
$3,5
93
3. Es
timat
ed lo
sses
and
expe
nses
end
ofac
ciden
t yea
r$
120
$81
9$
324
$6,6
60$
13,51
1$
2,221
$4,6
08$
6,309
$3,9
61$
2,601
4. Ne
t paid
(cum
ulat
ive) a
s of:
End
of po
licy y
ear
$85
$81
7$
189
$6,6
43$
13,28
5$
1,881
$3,8
57$
6,144
$3,7
23$
2,248
One
year
later
——
——
——
— T
wo ye
ars l
ater
——
——
——
Thr
ee ye
ars l
ater
——
——
— F
our y
ears
later
——
——
Five
year
s late
r—
——
Six
year
s late
r—
— S
even
year
s late
r—
Eigh
t yea
rs lat
er N
ine ye
ars l
ater
5. Re
-est
imat
ed ce
ded
loss
es an
dex
pens
es$
—$
—$
—$
—$
—$
—$
—$
—$
—$
—
6. Re
-est
imat
ed n
et in
curre
d lo
sses
and
expe
nse:
End
of po
licy y
ear
$12
0$
819
$32
4$
6,660
$13
,511
$2,2
21$
4,608
$6,3
09$
3,961
$2,6
01 O
ne ye
ar la
ter—
——
——
——
Two
year
s late
r—
——
——
— T
hree
year
s late
r—
——
——
Fou
r yea
rs lat
er—
——
— F
ive ye
ars l
ater
——
— S
ix ye
ars l
ater
——
Sev
en ye
ars l
ater
— E
ight y
ears
later
Nine
year
s late
r7.
Incr
ease
(dec
reas
e) in
estim
ated
net
incu
rred
loss
es an
d ex
pens
es fr
omen
d of
pol
icy ye
ar$
—$
—$
—$
—$
—$
—$
—$
—$
—$
—
B-197

Mont
ana U
nive
rsity
Sys
tem
– Me
dica
l, Den
tal, V
ision
, Rx C
laim
sCl
aims D
evelo
pmen
t Inf
orm
atio
n20
1820
1720
1620
1520
1420
1320
1220
1120
1020
091.
Prem
ium
s and
inve
stm
ent R
even
ue$
99,36
9$
100,6
93$
84,29
7$
80,76
4$
79,25
7$
76,50
5$
75,91
1$
73,07
8$
62,85
1$
59,57
3
2. Un
alloc
ated
expe
nses
inclu
ding
over
head
$5,1
11$
5,196
$5,1
29$
5,198
$4,7
87$
3,938
$4,0
63$
4,663
$3,6
29$
3,123
3. Es
timat
ed lo
sses
and
expe
nses
end
ofac
ciden
t yea
r$
90,42
7$
85,80
2$
87,23
3$
87,35
3$
71,87
7$
69,32
5$
64,33
1$
64,91
9$
65,57
5$
60,92
8
4. Ne
t paid
(cum
ulat
ive) a
s of:
End
of po
licy y
ear
$80
,393
$75
,601
$76
,400
$79
,388
$63
,317
$61
,964
$56
,981
$57
,018
$58
,989
$54
,121
One
year
later
$84
,575
85,79
688
,943
69,07
367
,988
62,93
763
,495
66,99
160
,203
Two
year
s late
r85
,894
89,26
169
,074
68,02
462
,968
63,53
867
,022
60,26
0 T
hree
year
s late
r89
,264
69,07
668
,024
62,97
463
,539
67,04
160
,261
Fou
r yea
rs lat
er69
,076
68,02
462
,974
63,53
967
,041
60,26
1 F
ive ye
ars l
ater
68,02
462
,974
63,53
967
,042
60,26
2 S
ix ye
ars l
ater
62,97
463
,539
67,04
260
,262
Sev
en ye
ars l
ater
63,53
967
,042
60,26
2 E
ight y
ears
later
67,04
260
,262
Nine
year
s late
r60
,262
5. Re
-est
imat
ed ce
ded
loss
es an
dex
pens
es$
—$
—$
—$
—$
—$
—$
—$
—$
—$
—
6. Re
-est
imat
ed n
et in
curre
d lo
sses
and
expe
nse:
End
of po
licy y
ear
$90
,427
$85
,802
$87
,233
$87
,353
$71
,877
$69
,325
$64
,331
$64
,919
$65
,575
$60
,928
One
year
later
84,56
786
,148
88,82
471
,700
68,34
963
,446
63,94
167
,006
60,20
8 T
wo ye
ars l
ater
85,89
489
,261
69,07
468
,024
62,96
863
,538
67,02
260
,260
Thr
ee ye
ars l
ater
89,26
469
,076
68,02
462
,974
63,53
967
,041
60,26
1 F
our y
ears
later
69,07
668
,024
62,97
463
,539
67,04
160
,261
Five
year
s late
r68
,024
62,97
463
,539
67,04
260
,262
Six
year
s late
r62
,974
63,53
967
,042
60,26
2 S
even
year
s late
r63
,539
67,04
260
,262
Eigh
t yea
rs lat
er67
,042
60,26
2 N
ine ye
ars l
ater
60,26
2
7. In
crea
se (d
ecre
ase)
in es
timat
ed n
etin
curre
d lo
sses
and
expe
nses
from
end
of p
olicy
year
$—
$(1
,236)
$(1
,339)
$1,9
12$
(2,80
0)$
(1,30
2)$
(1,35
7)$
(1,38
0)$
1,467
$(6
66)
B-198

Mont
ana U
nive
rsity
Sys
tem
– Me
dica
l, Den
tal, V
ision
, Rx C
laim
sCl
aims D
evelo
pmen
t Inf
orm
atio
n20
1820
1720
1620
1520
1420
1320
1220
1120
1020
091.
Prem
ium
s and
inve
stm
ent R
even
ue$
99,36
9$
100,6
93$
84,29
7$
80,76
4$
79,25
7$
76,50
5$
75,91
1$
73,07
8$
62,85
1$
59,57
3
2. Un
alloc
ated
expe
nses
inclu
ding
over
head
$5,1
11$
5,196
$5,1
29$
5,198
$4,7
87$
3,938
$4,0
63$
4,663
$3,6
29$
3,123
3. Es
timat
ed lo
sses
and
expe
nses
end
ofac
ciden
t yea
r$
90,42
7$
85,80
2$
87,23
3$
87,35
3$
71,87
7$
69,32
5$
64,33
1$
64,91
9$
65,57
5$
60,92
8
4. Ne
t paid
(cum
ulat
ive) a
s of:
End
of po
licy y
ear
$80
,393
$75
,601
$76
,400
$79
,388
$63
,317
$61
,964
$56
,981
$57
,018
$58
,989
$54
,121
One
year
later
$84
,575
85,79
688
,943
69,07
367
,988
62,93
763
,495
66,99
160
,203
Two
year
s late
r85
,894
89,26
169
,074
68,02
462
,968
63,53
867
,022
60,26
0 T
hree
year
s late
r89
,264
69,07
668
,024
62,97
463
,539
67,04
160
,261
Fou
r yea
rs lat
er69
,076
68,02
462
,974
63,53
967
,041
60,26
1 F
ive ye
ars l
ater
68,02
462
,974
63,53
967
,042
60,26
2 S
ix ye
ars l
ater
62,97
463
,539
67,04
260
,262
Sev
en ye
ars l
ater
63,53
967
,042
60,26
2 E
ight y
ears
later
67,04
260
,262
Nine
year
s late
r60
,262
5. Re
-est
imat
ed ce
ded
loss
es an
dex
pens
es$
—$
—$
—$
—$
—$
—$
—$
—$
—$
—
6. Re
-est
imat
ed n
et in
curre
d lo
sses
and
expe
nse:
End
of po
licy y
ear
$90
,427
$85
,802
$87
,233
$87
,353
$71
,877
$69
,325
$64
,331
$64
,919
$65
,575
$60
,928
One
year
later
84,56
786
,148
88,82
471
,700
68,34
963
,446
63,94
167
,006
60,20
8 T
wo ye
ars l
ater
85,89
489
,261
69,07
468
,024
62,96
863
,538
67,02
260
,260
Thr
ee ye
ars l
ater
89,26
469
,076
68,02
462
,974
63,53
967
,041
60,26
1 F
our y
ears
later
69,07
668
,024
62,97
463
,539
67,04
160
,261
Five
year
s late
r68
,024
62,97
463
,539
67,04
260
,262
Six
year
s late
r62
,974
63,53
967
,042
60,26
2 S
even
year
s late
r63
,539
67,04
260
,262
Eigh
t yea
rs lat
er67
,042
60,26
2 N
ine ye
ars l
ater
60,26
2
7. In
crea
se (d
ecre
ase)
in es
timat
ed n
etin
curre
d lo
sses
and
expe
nses
from
end
of p
olicy
year
$—
$(1
,236)
$(1
,339)
$1,9
12$
(2,80
0)$
(1,30
2)$
(1,35
7)$
(1,38
0)$
1,467
$(6
66)
Stat
e of
Mon
tana
Sche
dule
of E
xpen
ditu
res o
f Fed
eral
Aw
ards
For t
he F
isca
l Yea
r End
ed Ju
ne 3
0, 2
018
Amou
nt to
Sub
reci
pien
tsEx
pend
iture
sCO
RPO
RATI
ON
FO
R N
ATIO
NAL
& C
OM
MU
NIT
Y SE
RVIC
E94
.003
Stat
e Co
mm
issio
ns
$2
74,0
7294
.006
Amer
iCor
ps
$2
,982
,207
$3,1
75,5
2794
.009
Trai
ning
and
Tec
hnic
al A
ssist
ance
$53,
750
94.0
13Vo
lunt
eers
in S
ervi
ce to
Am
eric
a
$7
85,7
51TO
TAL
$4,2
89,1
00
CORP
ORA
TIO
N F
OR
NAT
ION
AL &
CO
MM
UN
ITY
SERV
ICE
TOTA
L$4
,289
,100
DEPA
RTM
ENT
OF
AGRI
CULT
URE
10.0
01Ag
ricul
tura
l Res
earc
h Ba
sic a
nd A
pplie
d Re
sear
ch
Sou
th D
akot
a St
ate
Uni
vers
ity
3TG
612
($37
)10
.025
Plan
t and
Ani
mal
Dise
ase,
Pes
t Con
trol
, and
Ani
mal
Car
e
$1
,055
,632
10.0
93Vo
lunt
ary
Publ
ic A
cces
s and
Hab
itat I
ncen
tive
Prog
ram
$335
,770
10.1
62In
spec
tion
Grad
ing
and
Stan
dard
izatio
n
$3
5,55
310
.163
Mar
ket P
rote
ctio
n an
d Pr
omot
ion
$168
,540
10.1
70Sp
ecia
lty C
rop
Bloc
k Gr
ant P
rogr
am -
Farm
Bill
$325
,632
$1,2
92,0
2310
.200
Gran
ts fo
r Agr
icul
tura
l Res
earc
h, S
peci
al R
esea
rch
Gran
ts
$5
7,31
210
.227
1994
Inst
itutio
ns R
esea
rch
Prog
ram
F
ort B
elkn
ap C
olle
ge
200
2-38
424-
1243
3$2
0610
.310
Agric
ultu
re a
nd F
ood
Rese
arch
Initi
ativ
e (A
FRI)
$7,5
01$6
4,51
6
Uni
vers
ity o
f Ida
ho
BDK
489-
SB-0
01$8
,898
10.4
33Ru
ral H
ousin
g Pr
eser
vatio
n Gr
ants
$1,0
0010
.435
Stat
e M
edia
tion
Gran
ts
$2
4,98
310
.460
Risk
Man
agem
ent E
duca
tion
Part
ners
hips
$21,
656
10.4
64So
cial
ly D
isadv
anta
ged
Farm
ers a
nd R
anch
ers P
olic
y Re
sear
ch C
ente
r
F
ort P
eck
Com
mun
ity C
olle
ge
$3
8,01
310
.475
Coop
erat
ive
Agre
emen
ts w
ith S
tate
s for
Intr
asta
te M
eat a
nd P
oultr
y In
spec
tion
$906
,949
10.5
00Co
oper
ativ
e Ex
tens
ion
Serv
ice
$4,5
04$3
,095
,804
K
ansa
s Sta
te U
nive
rsity
S
1715
7$1
2,21
7
Kan
sas S
tate
Uni
vers
ity
S18
142
$3,8
75
Kan
sas S
tate
Uni
vers
ity
S17
115
$14,
802
U
nive
rsity
of M
issou
ri
C00
0558
73-6
$13,
765
U
nive
rsity
of M
issou
ri
C00
0593
81-8
$8,1
1910
.541
Child
Nut
ritio
n-Te
chno
logy
Inno
vatio
n Gr
ant
$5
2,91
510
.547
Prof
essio
nal S
tand
ards
for S
choo
l Nut
ritio
n Em
ploy
ees
$2
52,6
17
The
acco
mpa
nyin
g no
tes a
re a
n in
tegr
al p
art o
f thi
s sch
edul
e.
B-199

Stat
e of
Mon
tana
Sche
dule
of E
xpen
ditu
res o
f Fed
eral
Aw
ards
For t
he F
isca
l Yea
r End
ed Ju
ne 3
0, 2
018
Amou
nt to
Sub
reci
pien
tsEx
pend
iture
s10
.557
WIC
Spe
cial
Sup
plem
enta
l Nut
ritio
n Pr
ogra
m fo
r Wom
en, I
nfan
ts, a
nd C
hild
ren
$4,3
64,7
50$1
4,07
1,01
110
.558
Child
and
Adu
lt Ca
re F
ood
Prog
ram
$652
,051
$12,
008,
082
10.5
60St
ate
Adm
inist
rativ
e Ex
pens
es fo
r Chi
ld N
utrit
ion
$925
,950
10.5
67Fo
od D
istrib
utio
n Pr
ogra
m o
n In
dian
Res
erva
tions
$1,7
49,9
82$6
,100
,002
10.5
72W
IC F
arm
ers'
Mar
ket N
utrit
ion
Prog
ram
(FM
NP)
($66
9)$5
0,39
910
.576
Seni
or F
arm
ers M
arke
t Nut
ritio
n Pr
ogra
m
$8
3,91
1$9
5,86
010
.578
WIC
Gra
nts T
o St
ates
(WGS
)
$511
,598
10.5
79Ch
ild N
utrit
ion
Disc
retio
nary
Gra
nts L
imite
d Av
aila
bilit
y
$5
5,00
0$5
19,7
6010
.582
Fres
h Fr
uit a
nd V
eget
able
Pro
gram
$1,6
85,6
19$1
,771
,526
10.6
01M
arke
t Acc
ess P
rogr
am
U.S
. Liv
esto
ck G
enet
ics E
xpor
t, In
c.
$4
6,54
4
Wes
tern
U.S
. Agr
icul
tura
l Tra
de A
ssoc
iatio
n
$1
,886
10.6
05Q
ualit
y Sa
mpl
es P
rogr
am
$3
8,12
610
.652
Fore
stry
Res
earc
h
$1
,210
$622
,751
N
atio
nal W
ilder
ness
Ste
war
dshi
p Al
lianc
e
WI2
018
$1,8
2410
.664
Coop
erat
ive
Fore
stry
Ass
istan
ce
$2
,246
,720
$4,1
18,8
9710
.674
Woo
d U
tiliza
tion
Assis
tanc
e
$3
,500
$20,
000
10.6
76Fo
rest
Leg
acy
Prog
ram
$7,0
20,2
8210
.678
Fore
st S
tew
ards
hip
Prog
ram
$488
$488
10.6
80Fo
rest
Hea
lth P
rote
ctio
n
$8
5,45
0$1
38,3
4410
.683
Nat
iona
l Fish
and
Wild
life
Foun
datio
n
$4
,300
10.6
91Go
od N
eigh
bor A
utho
rity
$120
,496
10.6
99Pa
rtne
rshi
p Ag
reem
ents
$353
,719
10.8
55Di
stan
ce L
earn
ing
and
Tele
med
icin
e Lo
ans a
nd G
rant
s
$53,
850
10.9
02So
il an
d W
ater
Con
serv
atio
n
$3
08,6
01$3
91,9
8110
.912
Envi
ronm
enta
l Qua
lity
Ince
ntiv
es P
rogr
am
Ada
ms R
anch
2
014
MO
U$1
,224
M
ark
Mac
hler
2
014
MO
U$9
,544
10.9
24Co
nser
vatio
n St
ewar
dshi
p Pr
ogra
m
$1
2,46
310
.931
Agr
icul
tura
l Con
serv
atio
n Ea
sem
ent P
rogr
am
$1
,632
,283
10.U
XXM
iscel
lane
ous N
on-M
ajor
Gra
nts
$1
77,2
83TO
TAL
$58,
285,
601
Child
Nut
ritio
n Cl
uste
r10
.553
Scho
ol B
reak
fast
Pro
gram
$10,
228,
514
$10,
330,
749
10.5
55N
atio
nal S
choo
l Lun
ch P
rogr
am
$2
8,71
3,35
8$3
2,56
9,72
5
The
acco
mpa
nyin
g no
tes a
re a
n in
tegr
al p
art o
f thi
s sch
edul
e.
B-200

Stat
e of
Mon
tana
Sche
dule
of E
xpen
ditu
res o
f Fed
eral
Aw
ards
For t
he F
isca
l Yea
r End
ed Ju
ne 3
0, 2
018
Amou
nt to
Sub
reci
pien
tsEx
pend
iture
s10
.556
Spec
ial M
ilk P
rogr
am fo
r Chi
ldre
n
$8
,148
$8,1
4810
.559
Sum
mer
Foo
d Se
rvic
e Pr
ogra
m fo
r Chi
ldre
n
$2
,080
,951
$2,1
49,6
57TO
TAL
$45,
058,
279
Food
Dis
trib
utio
n Cl
uste
r10
.565
Com
mod
ity S
uppl
emen
tal F
ood
Prog
ram
$1,9
50,0
8310
.568
Emer
genc
y Fo
od A
ssist
ance
Pro
gram
(Adm
inist
rativ
e Co
sts)
$146
,026
$315
,928
10.5
69Em
erge
ncy
Food
Ass
istan
ce P
rogr
am (F
ood
Com
mod
ities
)
$1,3
49,4
76TO
TAL
$3,6
15,4
87Fo
rest
Ser
vice
Sch
ools
and
Roa
ds C
lust
er10
.665
Scho
ols a
nd R
oads
- Gr
ants
to S
tate
s
$15,
119,
644
$15,
119,
644
TOTA
L$1
5,11
9,64
4SN
AP C
lust
er10
.551
Supp
lem
enta
l Nut
ritio
n As
sista
nce
Prog
ram
$163
,015
,980
10.5
61St
ate
Adm
inist
rativ
e M
atch
ing
Gran
ts fo
r the
Sup
plem
enta
l Nut
ritio
n As
sista
nce
Prog
ram
$366
,830
$10,
961,
844
TOTA
L$1
73,9
77,8
24
DEPA
RTM
ENT
OF
AGRI
CULT
URE
TO
TAL
$296
,056
,835
DEPA
RTM
ENT
OF
COM
MER
CE11
.549
Stat
e an
d Lo
cal I
mpl
emen
tatio
n Gr
ant P
rogr
am
$4
4,74
411
.550
Publ
ic T
elec
omm
unic
atio
ns F
acili
ties P
lann
ing
and
Cons
truc
tion
C
orpo
ratio
n fo
r Pub
lic B
road
cast
ing
1
492
$103
,257
11.6
11M
anuf
actu
ring
Exte
nsio
n Pa
rtne
rshi
p
$5
61,6
2911
.620
Scie
nce,
Tec
hnol
ogy,
Bus
ines
s and
/or E
duca
tion
Out
reac
h
$1
60,5
53TO
TAL
$870
,183
Econ
omic
Dev
elop
men
t Clu
ster
11.3
07Ec
onom
ic A
djus
tmen
t Ass
istan
ce
$3
70,9
5811
.307
Econ
omic
Adj
ustm
ent A
ssist
ance
$2,6
77,3
70TO
TAL
$3,0
48,3
28
DEPA
RTM
ENT
OF
COM
MER
CE T
OTA
L$3
,918
,511
DEPA
RTM
ENT
OF
DEFE
NSE
12.0
02Pr
ocur
emen
t Tec
hnic
al A
ssist
ance
For
Bus
ines
s Firm
s
B
ig S
ky E
cono
mic
Dev
elop
men
t Cor
pora
tion
S
P480
0-17
-2-1
722
$67,
062
B
ig S
ky E
cono
mic
Dev
elop
men
t Cor
pora
tion
S
P480
0-16
-2-1
622
$6,1
2212
.112
Paym
ents
to S
tate
s in
Lieu
of R
eal E
stat
e Ta
xes
$5
,700
The
acco
mpa
nyin
g no
tes a
re a
n in
tegr
al p
art o
f thi
s sch
edul
e.
B-201

Stat
e of
Mon
tana
Sche
dule
of E
xpen
ditu
res o
f Fed
eral
Aw
ards
For t
he F
isca
l Yea
r End
ed Ju
ne 3
0, 2
018
Amou
nt to
Sub
reci
pien
tsEx
pend
iture
s12
.357
ROTC
Lan
guag
e an
d Cu
lture
Tra
inin
g Gr
ants
I
nstit
ute
of In
tern
atio
nal E
duca
tion
2
606-
UM
T-G-
5-GO
-051
-PO
7$3
08,2
62
Ins
titut
e of
Inte
rnat
iona
l Edu
catio
n
260
3-U
MT-
5-GO
-051
-PO
S$9
7,03
012
.400
Mili
tary
Con
stru
ctio
n, N
atio
nal G
uard
$2,8
66,9
2912
.401
Nat
iona
l Gua
rd M
ilita
ry O
pera
tions
and
Mai
nten
ance
(O&
M) P
roje
cts
$1
7,76
3,87
812
.404
Nat
iona
l Gua
rd C
halle
NGe
Pro
gram
$4,1
62,9
0212
.579
Lang
uage
Tra
inin
g Ce
nter
I
nstit
ute
of In
tern
atio
nal E
duca
tion
2
603-
UM
T-5-
LTC-
052-
PO8
$1,9
24,5
58
Ins
titut
e of
Inte
rnat
iona
l Edu
catio
n
260
3-U
MT-
5-LT
C-LT
5-PO
4$1
15,2
70
Ins
titut
e of
Inte
rnat
iona
l Edu
catio
n
260
3-U
MT-
5-LT
C-05
2-PO
6$3
31,7
9612
.620
Troo
ps to
Tea
cher
s Gra
nt P
rogr
am
$4
90,8
9812
.901
Mat
hem
atic
al S
cien
ces G
rant
s
N
atio
nal S
ecur
ity A
genc
y
H98
230-
17-1
-029
9$3
2,58
112
.UXX
Misc
ella
neou
s Non
-Maj
or G
rant
s
$109
,110
$1,9
87,2
94
Pac
ific
Stat
es M
arin
e Fi
sher
ies C
omm
issio
n
18-
128P
$43,
465
P
acifi
c St
ates
Mar
ine
Fish
erie
s Com
miss
ion
1
8-93
P$8
90,2
74
Pac
ific
Stat
es M
arin
e Fi
sher
ies C
omm
issio
n
17-
114G
$1,6
70,5
61
Pac
ific
Stat
es M
arin
e Fi
sher
ies C
omm
issio
n
18-
09G
$5,7
50$1
48,9
91TO
TAL
$32,
913,
573
DEPA
RTM
ENT
OF
DEFE
NSE
TO
TAL
$32,
913,
573
DEPA
RTM
ENT
OF
EDU
CATI
ON
84.0
02Ad
ult E
duca
tion
- Bas
ic G
rant
s to
Stat
es
$8
35,3
82$1
,038
,558
84.0
10Ti
tle I
Gran
ts to
Loc
al E
duca
tiona
l Age
ncie
s
$47,
651,
088
$48,
809,
739
84.0
11M
igra
nt E
duca
tion
Stat
e Gr
ant P
rogr
am
$9
10,1
71$1
,043
,698
84.0
13Ti
tle I
Stat
e Ag
ency
Pro
gram
for N
egle
cted
and
Del
inqu
ent C
hild
ren
and
Yout
h
$1
91,6
6384
.031
High
er E
duca
tion
Inst
itutio
nal A
id
$3
61,6
5884
.032
Fede
ral F
amily
Edu
catio
n Lo
ans
$5
9,46
6,25
584
.048
Care
er a
nd T
echn
ical
Edu
catio
n --
Basic
Gra
nts t
o St
ates
$435
,395
$5,6
38,1
7884
.126
Reha
bilit
atio
n Se
rvic
es V
ocat
iona
l Reh
abili
tatio
n Gr
ants
to S
tate
s
$8,0
82,2
8384
.144
Mig
rant
Edu
catio
n Co
ordi
natio
n Pr
ogra
m
$2
0,17
884
.177
Reha
bilit
atio
n Se
rvic
es In
depe
nden
t Liv
ing
Serv
ices
for O
lder
Indi
vidu
als W
ho a
re B
lind
$254
,022
84.1
81Sp
ecia
l Edu
catio
n-Gr
ants
for I
nfan
ts a
nd F
amili
es
$1
,869
,574
84.1
84Sc
hool
Saf
ety
Nat
iona
l Act
iviti
es
$1
02,2
67$5
66,3
35
The
acco
mpa
nyin
g no
tes a
re a
n in
tegr
al p
art o
f thi
s sch
edul
e.
B-202
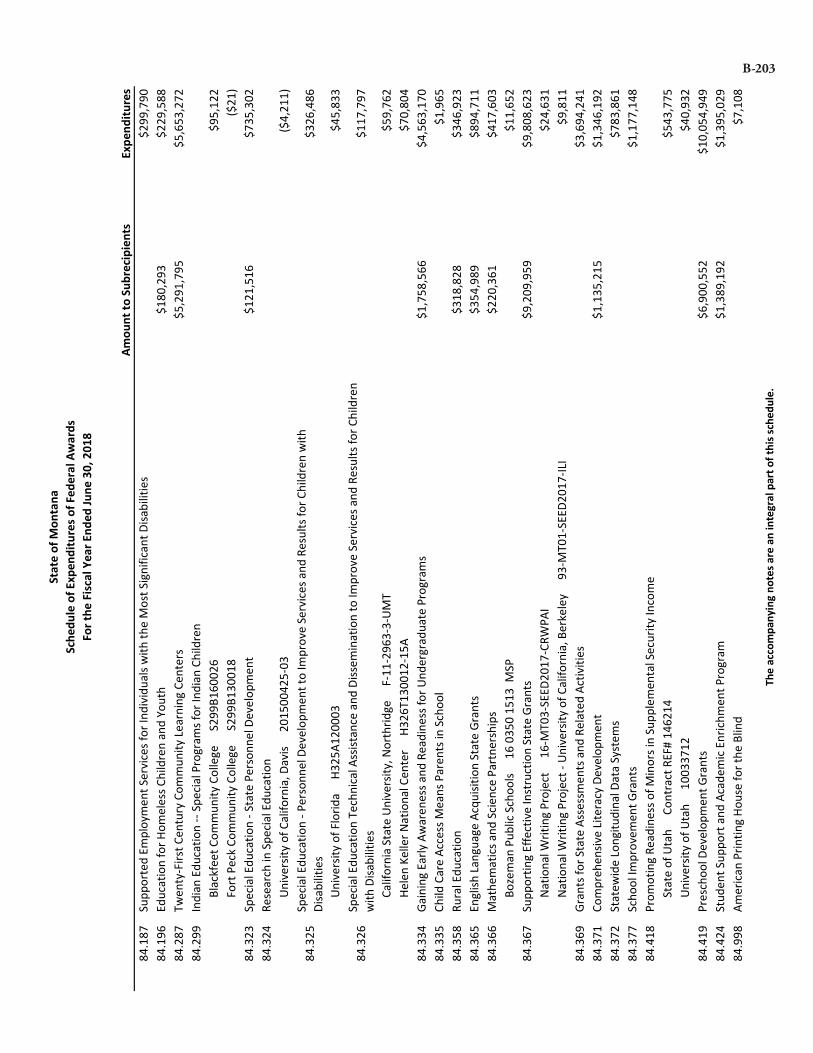
Stat
e of
Mon
tana
Sche
dule
of E
xpen
ditu
res o
f Fed
eral
Aw
ards
For t
he F
isca
l Yea
r End
ed Ju
ne 3
0, 2
018
Amou
nt to
Sub
reci
pien
tsEx
pend
iture
s84
.187
Supp
orte
d Em
ploy
men
t Ser
vice
s for
Indi
vidu
als w
ith th
e M
ost S
igni
fican
t Disa
bilit
ies
$2
99,7
9084
.196
Educ
atio
n fo
r Hom
eles
s Chi
ldre
n an
d Yo
uth
$180
,293
$229
,588
84.2
87Tw
enty
-Firs
t Cen
tury
Com
mun
ity L
earn
ing
Cent
ers
$5
,291
,795
$5,6
53,2
7284
.299
Indi
an E
duca
tion
-- Sp
ecia
l Pro
gram
s for
Indi
an C
hild
ren
B
lack
feet
Com
mun
ity C
olle
ge
S29
9B16
0026
$95,
122
F
ort P
eck
Com
mun
ity C
olle
ge
S29
9B13
0018
($21
)84
.323
Spec
ial E
duca
tion
- Sta
te P
erso
nnel
Dev
elop
men
t
$121
,516
$735
,302
84.3
24Re
sear
ch in
Spe
cial
Edu
catio
n
Uni
vers
ity o
f Cal
iforn
ia, D
avis
2
0150
0425
-03
($4,
211)
84.3
25Sp
ecia
l Edu
catio
n - P
erso
nnel
Dev
elop
men
t to
Impr
ove
Serv
ices
and
Res
ults
for C
hild
ren
with
Di
sabi
litie
s
$326
,486
U
nive
rsity
of F
lorid
a
H32
5A12
0003
$45,
833
84.3
26Sp
ecia
l Edu
catio
n Te
chni
cal A
ssist
ance
and
Diss
emin
atio
n to
Impr
ove
Serv
ices
and
Res
ults
for C
hild
ren
with
Disa
bilit
ies
$1
17,7
97
C
alifo
rnia
Sta
te U
nive
rsity
, Nor
thrid
ge
F-1
1-29
63-3
-UM
T$5
9,76
2
Hel
en K
elle
r Nat
iona
l Cen
ter
H3
26T1
3001
2-15
A$7
0,80
484
.334
Gain
ing
Early
Aw
aren
ess a
nd R
eadi
ness
for U
nder
grad
uate
Pro
gram
s
$1,7
58,5
66$4
,563
,170
84.3
35Ch
ild C
are
Acce
ss M
eans
Par
ents
in S
choo
l
$1,9
6584
.358
Rura
l Edu
catio
n
$3
18,8
28$3
46,9
2384
.365
Engl
ish L
angu
age
Acqu
isitio
n St
ate
Gran
ts
$3
54,9
89$8
94,7
1184
.366
Mat
hem
atic
s and
Sci
ence
Par
tner
ship
s
$220
,361
$417
,603
B
ozem
an P
ublic
Sch
ools
1
6 03
50 1
513
MSP
$11,
652
84.3
67Su
ppor
ting
Effe
ctiv
e In
stru
ctio
n St
ate
Gran
ts
$9
,209
,959
$9,8
08,6
23
Nat
iona
l Writ
ing
Proj
ect
16
-MT0
3-SE
ED20
17-C
RWPA
I$2
4,63
1
Nat
iona
l Writ
ing
Proj
ect -
Uni
vers
ity o
f Cal
iforn
ia, B
erke
ley
9
3-M
T01-
SEED
2017
-ILI
$9,8
1184
.369
Gran
ts fo
r Sta
te A
sses
smen
ts a
nd R
elat
ed A
ctiv
ities
$3,6
94,2
4184
.371
Com
preh
ensiv
e Li
tera
cy D
evel
opm
ent
$1
,135
,215
$1,3
46,1
9284
.372
Stat
ewid
e Lo
ngitu
dina
l Dat
a Sy
stem
s
$783
,861
84.3
77Sc
hool
Impr
ovem
ent G
rant
s
$1,1
77,1
4884
.418
Prom
otin
g Re
adin
ess o
f Min
ors i
n Su
pple
men
tal S
ecur
ity In
com
e
Sta
te o
f Uta
h
Con
trac
t REF
# 14
6214
$543
,775
U
nive
rsity
of U
tah
1
0033
712
$40,
932
84.4
19Pr
esch
ool D
evel
opm
ent G
rant
s
$6,9
00,5
52$1
0,05
4,94
984
.424
Stud
ent S
uppo
rt a
nd A
cade
mic
Enr
ichm
ent P
rogr
am
$1
,389
,192
$1,3
95,0
2984
.998
Amer
ican
Prin
ting
Hous
e fo
r the
Blin
d
$7
,108
The
acco
mpa
nyin
g no
tes a
re a
n in
tegr
al p
art o
f thi
s sch
edul
e.
B-203

Stat
e of
Mon
tana
Sche
dule
of E
xpen
ditu
res o
f Fed
eral
Aw
ards
For t
he F
isca
l Yea
r End
ed Ju
ne 3
0, 2
018
Amou
nt to
Sub
reci
pien
tsEx
pend
iture
s84
.UXX
Misc
ella
neou
s Non
-Maj
or G
rant
s
$135
,082
TOTA
L$1
70,2
29,0
71Sp
ecia
l Edu
catio
n Cl
uste
r (ID
EA)
84.0
27Sp
ecia
l Edu
catio
n Gr
ants
to S
tate
s
$36,
504,
953
$40,
377,
900
84.1
73Sp
ecia
l Edu
catio
n Pr
esch
ool G
rant
s
$1,1
12,1
27$1
,115
,103
TOTA
L$4
1,49
3,00
3St
uden
t Fin
anci
al A
ssis
tanc
e Cl
uste
r84
.007
Fede
ral S
uppl
emen
tal E
duca
tiona
l Opp
ortu
nity
Gra
nts
$1
,380
,961
84.0
33Fe
dera
l Wor
k-St
udy
Prog
ram
$2,0
76,9
2784
.038
Fede
ral P
erki
ns L
oan
Prog
ram
- Fe
dera
l Cap
ital C
ontr
ibut
ions
$38,
230,
216
84.0
63Fe
dera
l Pel
l Gra
nt P
rogr
am
$4
7,69
4,65
384
.268
Fede
ral D
irect
Stu
dent
Loa
ns
$1
73,7
20,7
5084
.379
Teac
her E
duca
tion
Assis
tanc
e fo
r Col
lege
and
Hig
her E
duca
tion
Gran
ts (T
EACH
Gra
nts)
$12,
413
TOTA
L$2
63,1
15,9
20TR
IO C
lust
er84
.042
TRIO
Stu
dent
Sup
port
Ser
vice
s
$1,8
76,7
7184
.044
TRIO
Tal
ent S
earc
h
$1
,086
,037
84.0
47TR
IO U
pwar
d Bo
und
$1,4
15,0
1784
.066
TRIO
Edu
catio
nal O
ppor
tuni
ty C
ente
rs
$1
56,9
9984
.217
TRIO
McN
air P
ost-
Bacc
alau
reat
e Ac
hiev
emen
t
$270
,359
TOTA
L$4
,805
,183
DEPA
RTM
ENT
OF
EDU
CATI
ON
TO
TAL
$479
,643
,177
DEPA
RTM
ENT
OF
ENER
GY81
.041
Stat
e En
ergy
Pro
gram
$293
,677
81.0
42W
eath
eriza
tion
Assis
tanc
e fo
r Low
-Inco
me
Pers
ons
$2
,736
,818
81.1
17En
ergy
Effi
cien
cy a
nd R
enew
able
Ene
rgy
Info
rmat
ion
Diss
emin
atio
n, O
utre
ach,
Tra
inin
g an
d Te
chni
cal
Anal
ysis/
Assis
tanc
e
$1
27,7
35
81.1
19St
ate
Ener
gy P
rogr
am S
peci
al P
roje
cts
$7
0,35
881
.138
Stat
e He
atin
g O
il an
d Pr
opan
e Pr
ogra
m
$8
,623
81.U
XXM
iscel
lane
ous N
on-M
ajor
Gra
nts
$4
0,94
5TO
TAL
$3,2
78,1
56
DEPA
RTM
ENT
OF
ENER
GY
TOTA
L$3
,278
,156
The
acco
mpa
nyin
g no
tes a
re a
n in
tegr
al p
art o
f thi
s sch
edul
e.
B-204

Stat
e of
Mon
tana
Sche
dule
of E
xpen
ditu
res o
f Fed
eral
Aw
ards
For t
he F
isca
l Yea
r End
ed Ju
ne 3
0, 2
018
Amou
nt to
Sub
reci
pien
tsEx
pend
iture
sDE
PART
MEN
T O
F HE
ALTH
AN
D HU
MAN
SER
VICE
S
93.0
41Sp
ecia
l Pro
gram
s for
the
Agin
g, T
itle
VII,
Chap
ter 3
, Pro
gram
s for
Pre
vent
ion
of E
lder
Abu
se, N
egle
ct,
and
Expl
oita
tion
$28,
761
$28,
761
93.0
42Sp
ecia
l Pro
gram
s for
the
Agin
g, T
itle
VII,
Chap
ter 2
, Lon
g Te
rm C
are
Om
buds
man
Ser
vice
s for
Old
er
Indi
vidu
als
$8
9,89
1$8
9,98
1
93.0
43Sp
ecia
l Pro
gram
s for
the
Agin
g, T
itle
III, P
art D
, Dise
ase
Prev
entio
n an
d He
alth
Pro
mot
ion
Serv
ices
$98,
349
$98,
349
93.0
51Al
zhei
mer
's Di
seas
e De
mon
stra
tion
Gran
ts to
Sta
tes
$2
3,73
093
.052
Nat
iona
l Fam
ily C
areg
iver
Sup
port
, Titl
e III
, Par
t E
$6
83,9
26$7
37,3
9993
.070
Envi
ronm
enta
l Pub
lic H
ealth
and
Em
erge
ncy
Resp
onse
$84,
000
$463
,965
93.0
71M
edic
are
Enro
llmen
t Ass
istan
ce P
rogr
am
$1
13,7
98$1
18,8
2393
.072
Life
span
Res
pite
Car
e Pr
ogra
m
$1
07,6
94$1
61,2
19
93.0
74Ho
spita
l Pre
pare
dnes
s Pro
gram
(HPP
) and
Pub
lic H
ealth
Em
erge
ncy
Prep
ared
ness
(PHE
P) A
ligne
d Co
oper
ativ
e Ag
reem
ents
$2,4
77,5
77$5
,339
,962
93.0
90Gu
ardi
ansh
ip A
ssist
ance
$1,7
15,9
7993
.092
Affo
rdab
le C
are
Act (
ACA)
Per
sona
l Res
pons
ibili
ty E
duca
tion
Prog
ram
$148
,576
$235
,308
93.1
03Fo
od a
nd D
rug
Adm
inist
ratio
n Re
sear
ch
$2
16,6
5793
.110
Mat
erna
l and
Chi
ld H
ealth
Fed
eral
Con
solid
ated
Pro
gram
s
$60,
633
93.1
13En
viro
nmen
tal H
ealth
$26,
786
93.1
16Pr
ojec
t Gra
nts a
nd C
oope
rativ
e Ag
reem
ents
for T
uber
culo
sis C
ontr
ol P
rogr
ams
$1
70,8
0193
.127
Emer
genc
y M
edic
al S
ervi
ces f
or C
hild
ren
$281
,287
93.1
29Te
chni
cal a
nd N
on-F
inan
cial
Ass
istan
ce to
Hea
lth C
ente
rs
Mon
tana
Prim
ary
Care
Ass
ocia
tion
($1,
579)
93.1
30Co
oper
ativ
e Ag
reem
ents
to S
tate
s/Te
rrito
ries f
or th
e Co
ordi
natio
n an
d De
velo
pmen
t of P
rimar
y Ca
re
Offi
ces
$3
0,86
7$1
79,8
29
93.1
36In
jury
Pre
vent
ion
and
Cont
rol R
esea
rch
and
Stat
e an
d Co
mm
unity
Bas
ed P
rogr
ams
$4
44,2
2293
.150
Proj
ects
for A
ssist
ance
in T
rans
ition
from
Hom
eles
snes
s (PA
TH)
$1
79,8
46$1
86,5
7493
.155
Rura
l Hea
lth R
esea
rch
Cent
ers
Nat
iona
l Rur
al H
ealth
Ass
ocia
tion
2
017
SRHA
TEC
HNIC
AL A
SSIS
TAN
CE$1
1,99
593
.165
Gran
ts to
Sta
tes f
or L
oan
Repa
ymen
t Pro
gram
$159
,950
$159
,950
93.1
84Di
sabi
litie
s Pre
vent
ion
$146
,183
$284
,122
93.2
17Fa
mily
Pla
nnin
g Se
rvic
es
$1
,458
,019
$1,9
99,9
7893
.236
Gran
ts to
Sta
tes t
o Su
ppor
t Ora
l Hea
lth W
orkf
orce
Act
iviti
es
$1
77,3
77$2
29,5
6093
.240
Stat
e Ca
paci
ty B
uild
ing
$178
,734
93.2
41St
ate
Rura
l Hos
pita
l Fle
xibi
lity
Prog
ram
$568
,569
$545
,713
93.2
43Su
bsta
nce
Abus
e an
d M
enta
l Hea
lth S
ervi
ces P
roje
cts o
f Reg
iona
l and
Nat
iona
l Sig
nific
ance
$4,1
34,9
55$7
,058
,233
The
acco
mpa
nyin
g no
tes a
re a
n in
tegr
al p
art o
f thi
s sch
edul
e.
B-205

Stat
e of
Mon
tana
Sche
dule
of E
xpen
ditu
res o
f Fed
eral
Aw
ards
For t
he F
isca
l Yea
r End
ed Ju
ne 3
0, 2
018
Amou
nt to
Sub
reci
pien
tsEx
pend
iture
s93
.251
Uni
vers
al N
ewbo
rn H
earin
g Sc
reen
ing
$174
,417
93.2
62O
ccup
atio
nal S
afet
y an
d He
alth
Pro
gram
$182
,506
U
nive
rsity
of C
olor
ado
F
Y18.
347.
003
$11,
380
U
tah
Stat
e U
nive
rsity
2
0064
4-00
001-
291
$15,
492
93.2
68Im
mun
izatio
n Co
oper
ativ
e Ag
reem
ents
$338
,619
$11,
973,
933
93.2
70Vi
ral H
epat
itis P
reve
ntio
n an
d Co
ntro
l
$37,
190
93.3
05PP
HF 2
018:
Offi
ce o
f Sm
okin
g an
d He
alth
-Nat
iona
l Sta
te-B
ased
Tob
acco
Con
trol
Pro
gram
s-Fi
nanc
ed in
pa
rt b
y 20
18 P
reve
ntio
n an
d Pu
blic
Hea
lth fu
nds (
PPHF
)
$805
,576
93.3
07M
inor
ity H
ealth
and
Hea
lth D
ispar
ities
Res
earc
h
$9
,885
,541
93.3
14Ea
rly H
earin
g De
tect
ion
and
Inte
rven
tion
Info
rmat
ion
Syst
em (E
HDI-I
S) S
urve
illan
ce P
rogr
am
($
2,46
0)93
.323
Epid
emio
logy
and
Lab
orat
ory
Capa
city
for I
nfec
tious
Dise
ases
(ELC
)
$1,9
86,6
2993
.324
Stat
e He
alth
Insu
ranc
e As
sista
nce
Prog
ram
$381
,460
$539
,204
93.3
36Be
havi
oral
Risk
Fac
tor S
urve
illan
ce S
yste
m
$3
33,0
8093
.369
ACL
Inde
pend
ent L
ivin
g St
ate
Gran
ts
$3
06,8
6493
.448
Food
Saf
ety
and
Secu
rity
Mon
itorin
g Pr
ojec
t
$120
,199
93.4
49Ru
min
ant F
eed
Ban
Supp
ort P
roje
ct
$1
6,75
993
.464
ACL
Assis
tive
Tech
nolo
gy
$3
79,6
0993
.500
Preg
nanc
y As
sista
nce
Fund
Pro
gram
$123
,205
$122
,938
93.5
16Pu
blic
Hea
lth T
rain
ing
Cent
ers P
rogr
am
Uni
vers
ity o
f Col
orad
o De
nver
1
0005
8720
3$4
0,11
393
.518
Affo
rdab
le C
are
Act -
Med
icar
e Im
prov
emen
ts fo
r Pat
ient
s and
Pro
vide
rs
$6
5,70
3$7
0,27
9
93.5
21Th
e Af
ford
able
Car
e Ac
t: Bu
ildin
g Ep
idem
iolo
gy, L
abor
ator
y, a
nd H
ealth
Info
rmat
ion
Syst
ems C
apac
ity in
th
e Ep
idem
iolo
gy a
nd L
abor
ator
y Ca
paci
ty fo
r Inf
ectio
us D
iseas
e (E
LC) a
nd E
mer
ging
Infe
ctio
ns P
rogr
am
(EIP
) Coo
pera
tive
Agre
emen
ts; P
PHF
$616
,623
93.5
56Pr
omot
ing
Safe
and
Sta
ble
Fam
ilies
$545
,326
$656
,476
93.5
63Ch
ild S
uppo
rt E
nfor
cem
ent
$1
0,92
8,20
693
.566
Refu
gee
and
Entr
ant A
ssist
ance
Sta
te/R
epla
cem
ent D
esig
nee
Adm
inist
ered
Pro
gram
s
$185
,135
$310
,884
93.5
68Lo
w-In
com
e Ho
me
Ener
gy A
ssist
ance
$1,0
26,9
02$1
9,56
4,07
693
.569
Com
mun
ity S
ervi
ces B
lock
Gra
nt
$3
,058
,076
93.5
86St
ate
Cour
t Im
prov
emen
t Pro
gram
$9,2
60$1
71,3
4093
.590
Com
mun
ity-B
ased
Chi
ld A
buse
Pre
vent
ion
Gran
ts
$1
35,3
94$2
02,6
7193
.597
Gran
ts to
Sta
tes f
or A
cces
s and
Visi
tatio
n Pr
ogra
ms
$9
7,65
3$9
9,51
393
.599
Chaf
ee E
duca
tion
and
Trai
ning
Vou
cher
s Pro
gram
(ETV
)
$226
,954
$228
,408
93.6
00He
ad S
tart
$4,0
00$1
16,9
5493
.603
Adop
tion
and
Lega
l Gua
rdia
nshi
p In
cent
ive
Paym
ents
$91,
748
The
acco
mpa
nyin
g no
tes a
re a
n in
tegr
al p
art o
f thi
s sch
edul
e.
B-206

Stat
e of
Mon
tana
Sche
dule
of E
xpen
ditu
res o
f Fed
eral
Aw
ards
For t
he F
isca
l Yea
r End
ed Ju
ne 3
0, 2
018
Amou
nt to
Sub
reci
pien
tsEx
pend
iture
s93
.630
Deve
lopm
enta
l Disa
bilit
ies B
asic
Sup
port
and
Adv
ocac
y Gr
ants
$437
,718
$437
,718
93.6
43Ch
ildre
n's J
ustic
e Gr
ants
to S
tate
s
$94,
607
93.6
45St
epha
nie
Tubb
s Jon
es C
hild
Wel
fare
Ser
vice
s Pro
gram
$671
,973
93.6
58Fo
ster
Car
e Ti
tle IV
-E
$3
,063
,349
$18,
043,
709
93.6
59Ad
optio
n As
sista
nce
$9,7
94,8
7193
.667
Soci
al S
ervi
ces B
lock
Gra
nt
$7
,126
,397
93.6
69Ch
ild A
buse
and
Neg
lect
Sta
te G
rant
s
$153
,900
93.6
71Fa
mily
Vio
lenc
e Pr
even
tion
and
Serv
ices
/Dom
estic
Vio
lenc
e Sh
elte
r and
Sup
port
ive
Serv
ices
$835
,289
$840
,502
93.6
74Ch
afee
Fos
ter C
are
Inde
pend
ence
Pro
gram
$709
,558
$737
,551
93.7
32M
enta
l and
Beh
avio
ral H
ealth
Edu
catio
n an
d Tr
aini
ng G
rant
s
$89,
069
93.7
33Ca
paci
ty B
uild
ing
Assis
tanc
e to
Str
engt
hen
Publ
ic H
ealth
Imm
uniza
tion
Infr
astr
uctu
re a
nd P
erfo
rman
ce -
finan
ced
in p
art b
y th
e Pr
even
tion
and
Publ
ic H
ealth
Fun
d (P
PHF)
$104
,794
93.7
47El
der A
buse
Pre
vent
ion
Inte
rven
tions
Pro
gram
$50,
900
93.7
52Ca
ncer
Pre
vent
ion
and
Cont
rol P
rogr
ams f
or S
tate
, Ter
ritor
ial a
nd T
ribal
Org
aniza
tions
fina
nced
in p
art
by P
reve
ntio
n an
d Pu
blic
Hea
lth F
unds
$112
,052
$375
,334
93.7
57St
ate
and
Loca
l Pub
lic H
ealth
Act
ions
to P
reve
nt O
besit
y, D
iabe
tes,
Hea
rt D
iseas
e an
d St
roke
(PPH
F)
$1
,212
,890
93.7
58Pr
even
tive
Heal
th a
nd H
ealth
Ser
vice
s Blo
ck G
rant
fund
ed so
lely
with
Pre
vent
ion
and
Publ
ic H
ealth
Fu
nds (
PPHF
)
$388
,555
$1,2
56,5
72
93.7
67Ch
ildre
n's H
ealth
Insu
ranc
e Pr
ogra
m
$9
7,56
3,10
493
.788
Opi
oid
STR
$815
,788
$1,0
10,1
4293
.791
Mon
ey F
ollo
ws t
he P
erso
n Re
bala
ncin
g De
mon
stra
tion
$292
,256
93.8
00O
rgan
ized
Appr
oach
es to
Incr
ease
Col
orec
tal C
ance
r Scr
eeni
ng
$4
54,5
10$6
67,3
5393
.815
Dom
estic
Ebo
la S
uppl
emen
t to
the
Epid
emio
logy
and
Lab
orat
ory
Capa
city
for I
nfec
tious
Dise
ases
(ELC
).
$4
09,7
8693
.817
Hosp
ital P
repa
redn
ess P
rogr
am (H
PP) E
bola
Pre
pare
dnes
s and
Res
pons
e Ac
tiviti
es
$2
,959
93.8
59Bi
omed
ical
Res
earc
h an
d Re
sear
ch T
rain
ing
$73,
468
93.8
98Ca
ncer
Pre
vent
ion
and
Cont
rol P
rogr
ams f
or S
tate
, Ter
ritor
ial a
nd T
ribal
Org
aniza
tions
$945
,665
$2,2
04,0
83
93.9
12Ru
ral H
ealth
Car
e Se
rvic
es O
utre
ach,
Rur
al H
ealth
Net
wor
k De
velo
pmen
t and
Sm
all H
ealth
Car
e Pr
ovid
er Q
ualit
y Im
prov
emen
t Pro
gram
$19,
319
$465
,876
93.9
17HI
V Ca
re F
orm
ula
Gran
ts
$7
49,6
93$2
,755
,385
93.9
38Co
oper
ativ
e Ag
reem
ents
to S
uppo
rt C
ompr
ehen
sive
Scho
ol H
ealth
Pro
gram
s to
Prev
ent t
he S
prea
d of
HI
V an
d O
ther
Impo
rtan
t Hea
lth P
robl
ems
$7
7,28
5
93.9
40HI
V Pr
even
tion
Activ
ities
Hea
lth D
epar
tmen
t Bas
ed
$4
31,0
04$8
61,8
1893
.944
Hum
an Im
mun
odef
icie
ncy
Viru
s (HI
V)/A
cqui
red
Imm
unod
efic
ienc
y Vi
rus S
yndr
ome
(AID
S) S
urve
illan
ce
$1
11,3
49
The
acco
mpa
nyin
g no
tes a
re a
n in
tegr
al p
art o
f thi
s sch
edul
e.
B-207

Stat
e of
Mon
tana
Sche
dule
of E
xpen
ditu
res o
f Fed
eral
Aw
ards
For t
he F
isca
l Yea
r End
ed Ju
ne 3
0, 2
018
Amou
nt to
Sub
reci
pien
tsEx
pend
iture
s93
.945
Assis
tanc
e Pr
ogra
ms f
or C
hron
ic D
iseas
e Pr
even
tion
and
Cont
rol
$3
,500
$1,1
90,7
98
93.9
46Co
oper
ativ
e Ag
reem
ents
to S
uppo
rt S
tate
-Bas
ed S
afe
Mot
herh
ood
and
Infa
nt H
ealth
Initi
ativ
e Pr
ogra
ms
$1
62,6
08
93.9
58Bl
ock
Gran
ts fo
r Com
mun
ity M
enta
l Hea
lth S
ervi
ces
$1
,818
,818
$2,5
01,9
0693
.959
Bloc
k Gr
ants
for P
reve
ntio
n an
d Tr
eatm
ent o
f Sub
stan
ce A
buse
$3,3
15,1
46$8
,862
,752
93.9
77Se
xual
ly T
rans
mitt
ed D
iseas
es (S
TD) P
reve
ntio
n an
d Co
ntro
l Gra
nts
$2
22,2
1993
.994
Mat
erna
l and
Chi
ld H
ealth
Ser
vice
s Blo
ck G
rant
to th
e St
ates
$1,1
89,4
40$2
,017
,347
93.U
XXM
iscel
lane
ous N
on-M
ajor
Gra
nts
$7
,031
$143
,182
TOTA
L$2
46,6
77,6
58
Agin
g Cl
uste
r93
.044
Spec
ial P
rogr
ams f
or th
e Ag
ing,
Titl
e III
, Par
t B, G
rant
s for
Sup
port
ive
Serv
ices
and
Sen
ior C
ente
rs
$1
,411
,743
$1,6
99,5
5093
.045
Spec
ial P
rogr
ams f
or th
e Ag
ing,
Titl
e III
, Par
t C, N
utrit
ion
Serv
ices
$2,9
29,5
30$3
,306
,125
93.0
53N
utrit
ion
Serv
ices
Ince
ntiv
e Pr
ogra
m
$8
17,7
06$1
,112
,104
TOTA
L$6
,117
,779
CCDF
Clu
ster
93.5
75Ch
ild C
are
and
Deve
lopm
ent B
lock
Gra
nt
$7
,183
,125
$16,
962,
928
93.5
96Ch
ild C
are
Man
dato
ry a
nd M
atch
ing
Fund
s of t
he C
hild
Car
e an
d De
velo
pmen
t Fun
d
$7
,591
,376
TOTA
L$2
4,55
4,30
4M
ater
nal,
Infa
nt, a
nd E
arly
Chi
ldho
od H
ome
Visi
ting
Clus
ter
93.5
05Af
ford
able
Car
e Ac
t (AC
A) M
ater
nal,
Infa
nt, a
nd E
arly
Chi
ldho
od H
ome
Visit
ing
Prog
ram
$8,2
75$8
,717
T
EAM
for W
est V
irgin
ia C
hild
ren
$2,0
1493
.870
Mat
erna
l, In
fant
and
Ear
ly C
hild
hood
Hom
e Vi
sitin
g Gr
ant P
rogr
am
$2
,331
,736
$3,2
68,4
13TO
TAL
$3,2
79,1
44M
edic
aid
Clus
ter
93.7
75St
ate
Med
icai
d Fr
aud
Cont
rol U
nits
$682
,198
93.7
77St
ate
Surv
ey a
nd C
ertif
icat
ion
of H
ealth
Car
e Pr
ovid
ers a
nd S
uppl
iers
(Titl
e XV
III) M
edic
are
$2,2
09,6
5993
.778
Med
ical
Ass
istan
ce P
rogr
am
$2
,807
,126
$1,4
68,5
45,9
07TO
TAL
$1,4
71,4
37,7
64St
uden
t Fin
anci
al A
ssis
tanc
e Cl
uste
r93
.264
Nur
se F
acul
ty L
oan
Prog
ram
(NFL
P)
$1
4,62
093
.342
Heal
th P
rofe
ssio
ns S
tude
nt L
oans
, Inc
ludi
ng P
rimar
y Ca
re L
oans
/Loa
ns fo
r Disa
dvan
tage
d St
uden
ts
$2
27,1
5093
.364
Nur
sing
Stud
ent L
oans
$2,7
98,1
57TO
TAL
$3,0
39,9
27
The
acco
mpa
nyin
g no
tes a
re a
n in
tegr
al p
art o
f thi
s sch
edul
e.
B-208

Stat
e of
Mon
tana
Sche
dule
of E
xpen
ditu
res o
f Fed
eral
Aw
ards
For t
he F
isca
l Yea
r End
ed Ju
ne 3
0, 2
018
Amou
nt to
Sub
reci
pien
tsEx
pend
iture
sTA
NF
Clus
ter
93.5
58Te
mpo
rary
Ass
istan
ce fo
r Nee
dy F
amili
es
$1
,945
,553
$39,
854,
621
TOTA
L$3
9,85
4,62
1
DEPA
RTM
ENT
OF
HEAL
TH A
ND
HUM
AN S
ERVI
CES
TOTA
L$1
,794
,961
,197
DEPA
RTM
ENT
OF
HOM
ELAN
D SE
CURI
TY97
.007
Hom
elan
d Se
curit
y Pr
epar
edne
ss T
echn
ical
Ass
istan
ce P
rogr
am
$4
97.0
12Bo
atin
g Sa
fety
Fin
anci
al A
ssist
ance
$569
,101
97.0
23Co
mm
unity
Ass
istan
ce P
rogr
am S
tate
Sup
port
Ser
vice
s Ele
men
t (CA
P-SS
SE)
$1
92,4
1597
.029
Floo
d M
itiga
tion
Assis
tanc
e
$2
00,5
0597
.036
Disa
ster
Gra
nts -
Pub
lic A
ssist
ance
(Pre
siden
tially
Dec
lare
d Di
sast
ers)
$2,7
82,8
74$2
,795
,640
97.0
39Ha
zard
Miti
gatio
n Gr
ant
$1
,310
,518
$1,7
37,0
1297
.041
Nat
iona
l Dam
Saf
ety
Prog
ram
$242
,204
97.0
42Em
erge
ncy
Man
agem
ent P
erfo
rman
ce G
rant
s
$1,7
95,6
69$3
,015
,363
97.0
43St
ate
Fire
Tra
inin
g Sy
stem
s Gra
nts
$7
,976
97.0
44As
sista
nce
to F
irefig
hter
s Gra
nt
$1
,535
97.0
45Co
oper
atin
g Te
chni
cal P
artn
ers
$2
,183
,756
97.0
46Fi
re M
anag
emen
t Ass
istan
ce G
rant
$12,
429,
754
97.0
47Pr
e-Di
sast
er M
itiga
tion
$1,0
90,7
00$1
,288
,467
97.0
67Ho
mel
and
Secu
rity
Gran
t Pro
gram
$3,6
22,9
82$4
,085
,778
K
alisp
ell P
olic
e De
part
men
t
14-S
PWSP
W-0
9-00
3$1
5,39
7TO
TAL
$28,
764,
907
DEPA
RTM
ENT
OF
HOM
ELAN
D SE
CURI
TY T
OTA
L$2
8,76
4,90
7DE
PART
MEN
T O
F HO
USI
NG
& U
RBAN
DEV
ELO
PMEN
T14
.228
Com
mun
ity D
evel
opm
ent B
lock
Gra
nts/
Stat
e's p
rogr
am a
nd N
on-E
ntitl
emen
t Gra
nts i
n Ha
wai
i
$1,6
75,9
31$1
,936
,852
14.2
31Em
erge
ncy
Solu
tions
Gra
nt P
rogr
am
$8
18,6
6114
.235
Supp
ortiv
e Ho
usin
g Pr
ogra
m
$7
7,17
514
.238
Shel
ter P
lus C
are
$146
,725
14.2
39Ho
me
Inve
stm
ent P
artn
ersh
ips P
rogr
am
$1
,273
,822
$1,5
05,7
2314
.241
Hous
ing
Opp
ortu
nitie
s for
Per
sons
with
AID
S
$9
74,4
8114
.251
Econ
omic
Dev
elop
men
t Ini
tiativ
e - S
peci
al P
roje
ct, N
eigh
borh
ood
Initi
ativ
e an
d M
iscel
lane
ous G
rant
s
$451
,252
14.2
75Ho
usin
g Tr
ust F
und
$24,
757
The
acco
mpa
nyin
g no
tes a
re a
n in
tegr
al p
art o
f thi
s sch
edul
e.
B-209

Stat
e of
Mon
tana
Sche
dule
of E
xpen
ditu
res o
f Fed
eral
Aw
ards
For t
he F
isca
l Yea
r End
ed Ju
ne 3
0, 2
018
Amou
nt to
Sub
reci
pien
tsEx
pend
iture
s
14.3
26Pr
ojec
t Ren
tal A
ssist
ance
Dem
onst
ratio
n (P
RA D
emo)
Pro
gram
of S
ectio
n 81
1 Su
ppor
tive
Hous
ing
for
Pers
ons w
ith D
isabi
litie
s
$134
,681
TOTA
L$6
,070
,307
Hous
ing
Vouc
her C
lust
er14
.871
Sect
ion
8 Ho
usin
g Ch
oice
Vou
cher
s
$22,
885,
198
TOTA
L$2
2,88
5,19
8Se
ctio
n 8
Proj
ect-
Base
d Cl
uste
r14
.195
Sect
ion
8 Ho
usin
g As
sista
nce
Paym
ents
Pro
gram
$22,
375,
164
14.8
56Lo
wer
Inco
me
Hous
ing
Assis
tanc
e Pr
ogra
m S
ectio
n 8
Mod
erat
e Re
habi
litat
ion
$1,8
63,1
91TO
TAL
$24,
238,
355
DEPA
RTM
ENT
OF
HOU
SIN
G &
URB
AN D
EVEL
OPM
ENT
TOTA
L$5
3,19
3,86
0DE
PART
MEN
T O
F JU
STIC
E16
.017
Sexu
al A
ssau
lt Se
rvic
es F
orm
ula
Prog
ram
$343
,484
$359
,072
16.5
28En
hanc
ed T
rain
ing
and
Serv
ices
to E
nd V
iole
nce
and
Abus
e of
Wom
en L
ater
in L
ife
$7
0,87
416
.540
Juve
nile
Just
ice
and
Delin
quen
cy P
reve
ntio
n
$2
53,8
71$3
25,9
5216
.550
Stat
e Ju
stic
e St
atist
ics P
rogr
am fo
r Sta
tistic
al A
naly
sis C
ente
rs
$1
40,6
4816
.554
Nat
iona
l Crim
inal
Hist
ory
Impr
ovem
ent P
rogr
am (N
CHIP
)
$1,3
12,4
5716
.560
Nat
iona
l Ins
titut
e of
Just
ice
Rese
arch
, Eva
luat
ion,
and
Dev
elop
men
t Pro
ject
Gra
nts
Boz
eman
Pub
lic S
choo
ls
201
4-M
U-0
017
(UM
#1)
$168
,485
16.5
75Cr
ime
Vict
im A
ssist
ance
$4,9
12,2
28$5
,382
,555
16.5
76Cr
ime
Vict
im C
ompe
nsat
ion
$62,
184
16.5
82Cr
ime
Vict
im A
ssist
ance
/Disc
retio
nary
Gra
nts
$5
88,5
6416
.585
Drug
Cou
rt D
iscre
tiona
ry G
rant
Pro
gram
$549
,067
16.5
88Vi
olen
ce A
gain
st W
omen
For
mul
a Gr
ants
$795
,629
$886
,893
16.5
89Ru
ral D
omes
tic V
iole
nce,
Dat
ing
Viol
ence
, Sex
ual A
ssau
lt, a
nd S
talk
ing
Assis
tanc
e Pr
ogra
m
Cou
nty
of M
issou
la
201
5-W
R-AX
-001
3$1
7,34
416
.590
Gran
ts to
Enc
oura
ge A
rres
t Pol
icie
s and
Enf
orce
men
t of P
rote
ctio
n O
rder
s Pro
gram
$158
,457
16.5
93Re
siden
tial S
ubst
ance
Abu
se T
reat
men
t for
Sta
te P
rison
ers
$4
2,70
8$4
6,78
516
.726
Juve
nile
Men
torin
g Pr
ogra
m
Nat
iona
l 4-H
Cou
ncil
4
-H U
NDE
R O
JJDP
201
5-JU
-FX-
001
($38
0)
Nat
iona
l 4-H
Cou
ncil
4
-H U
NDE
R O
JJDP
201
6-JU
-FX-
002
$34,
663
N
atio
nal 4
-H C
ounc
il
4-H
UN
DER
OJJ
DP 2
017J
UFX
0016
$18,
048
16.7
35PR
EA P
rogr
am: S
trat
egic
Sup
port
for P
REA
Impl
emen
tatio
n
$1
03,2
25
The
acco
mpa
nyin
g no
tes a
re a
n in
tegr
al p
art o
f thi
s sch
edul
e.
B-210

Stat
e of
Mon
tana
Sche
dule
of E
xpen
ditu
res o
f Fed
eral
Aw
ards
For t
he F
isca
l Yea
r End
ed Ju
ne 3
0, 2
018
Amou
nt to
Sub
reci
pien
tsEx
pend
iture
s16
.738
Edw
ard
Byrn
e M
emor
ial J
ustic
e As
sista
nce
Gran
t Pro
gram
$673
,413
$915
,650
16.7
41DN
A Ba
cklo
g Re
duct
ion
Prog
ram
$447
,313
16.7
42Pa
ul C
over
dell
Fore
nsic
Sci
ence
s Im
prov
emen
t Gra
nt P
rogr
am
$9
7,98
216
.745
Crim
inal
and
Juve
nile
Just
ice
and
Men
tal H
ealth
Col
labo
ratio
n Pr
ogra
m
$8
,715
$10,
013
16.7
51Ed
war
d By
rne
Mem
oria
l Com
petit
ive
Gran
t Pro
gram
$10,
296
16.7
54Ha
rold
Rog
ers P
resc
riptio
n Dr
ug M
onito
ring
Prog
ram
$93,
898
16.8
12Se
cond
Cha
nce
Act R
eent
ry In
itiat
ive
$80,
782
16.8
18Ch
ildre
n Ex
pose
d to
Vio
lenc
e
$2
55,3
95$4
93,9
3616
.833
Nat
iona
l Sex
ual A
ssau
lt Ki
t Ini
tiativ
e
$8
76,2
10TO
TAL
$13,
250,
973
DEPA
RTM
ENT
OF
JUST
ICE
TOTA
L$1
3,25
0,97
3DE
PART
MEN
T O
F LA
BOR
17.0
02La
bor F
orce
Sta
tistic
s
$729
,213
17.0
05Co
mpe
nsat
ion
and
Wor
king
Con
ditio
ns
$9
2,47
917
.201
Regi
ster
ed A
ppre
ntic
eshi
p
$8
8,12
6$1
17,4
5917
.225
Une
mpl
oym
ent I
nsur
ance
$124
,337
,518
17.2
35Se
nior
Com
mun
ity S
ervi
ce E
mpl
oym
ent P
rogr
am
$3
79,8
73$3
99,7
2617
.245
Trad
e Ad
just
men
t Ass
istan
ce
$1
97,7
3417
.268
H-1B
Job
Trai
ning
Gra
nts
Nor
ther
n W
yom
ing
Com
mun
ity C
olle
ge
011
717-
1$1
85,5
3817
.271
Wor
k O
ppor
tuni
ty T
ax C
redi
t Pro
gram
(WO
TC)
$6
6,00
017
.273
Tem
pora
ry L
abor
Cer
tific
atio
n fo
r For
eign
Wor
kers
$204
,362
17.2
77W
IOA
Nat
iona
l Disl
ocat
ed W
orke
r Gra
nts /
WIA
Nat
iona
l Em
erge
ncy
Gran
ts
$2
,778
$478
,283
17.2
82Tr
ade
Adju
stm
ent A
ssist
ance
Com
mun
ity C
olle
ge a
nd C
aree
r Tra
inin
g (T
AACC
CT) G
rant
s
$1,2
40,3
81$5
,166
,305
17.2
85Ap
pren
tices
hip
USA
Gra
nts
$5
56,8
9917
.504
Cons
ulta
tion
Agre
emen
ts
$4
95,9
6717
.600
Min
e He
alth
and
Saf
ety
Gran
ts
$2
00,4
46TO
TAL
$133
,227
,929
Empl
oym
ent S
ervi
ce C
lust
er17
.207
Empl
oym
ent S
ervi
ce/W
agne
r-Pe
yser
Fun
ded
Activ
ities
$4,7
65,2
1317
.801
Disa
bled
Vet
eran
s' O
utre
ach
Prog
ram
(DVO
P)
$5
73,4
6217
.804
Loca
l Vet
eran
s' Em
ploy
men
t Rep
rese
ntat
ive
Prog
ram
($4,
116)
TOTA
L$5
,334
,559
The
acco
mpa
nyin
g no
tes a
re a
n in
tegr
al p
art o
f thi
s sch
edul
e.
B-211

Stat
e of
Mon
tana
Sche
dule
of E
xpen
ditu
res o
f Fed
eral
Aw
ards
For t
he F
isca
l Yea
r End
ed Ju
ne 3
0, 2
018
Amou
nt to
Sub
reci
pien
tsEx
pend
iture
sW
IOA
Clus
ter
17.2
58W
IOA
Adul
t Pro
gram
$402
,713
$1,5
64,1
7417
.259
WIO
A Yo
uth
Activ
ities
$1,3
97,9
03$2
,168
,088
17.2
78W
IOA
Dislo
cate
d W
orke
r For
mul
a Gr
ants
$1,3
57$1
,418
,714
TOTA
L$5
,150
,976
DEPA
RTM
ENT
OF
LABO
R TO
TAL
$143
,713
,464
DEPA
RTM
ENT
OF
STAT
E19
.009
Acad
emic
Exc
hang
e Pr
ogra
ms -
Und
ergr
adua
te P
rogr
ams
$4
60,4
4119
.010
Acad
emic
Exc
hang
e Pr
ogra
ms -
Hub
ert H
. Hum
phre
y Fe
llow
ship
Pro
gram
I
nstit
ute
of In
tern
atio
nal E
duca
tion
II
E013
8_2.
22.1
8$6
5,35
0
Ins
titut
e of
Inte
rnat
iona
l Edu
catio
n
IIE0
138-
MO
NTA
NA-
1.1.
17$8
3,52
819
.021
Inve
stin
g in
Peo
ple
in T
he M
iddl
e Ea
st a
nd N
orth
Afr
ica
W
orld
Lea
rnin
g In
stitu
te
S04
-SIZ
-100
-16-
CA-0
08$5
8,70
219
.040
Publ
ic D
iplo
mac
y Pr
ogra
ms
$3
3,86
319
.401
Acad
emic
Exc
hang
e Pr
ogra
ms -
Sch
olar
s
$252
,889
19.4
15Pr
ofes
siona
l and
Cul
tura
l Exc
hang
e Pr
ogra
ms -
Citi
zen
Exch
ange
s
$51,
800
$626
,844
TOTA
L$1
,581
,617
DEPA
RTM
ENT
OF
STAT
E TO
TAL
$1,5
81,6
17DE
PART
MEN
T O
F TH
E IN
TERI
OR
15.0
25Se
rvic
es to
Indi
an C
hild
ren,
Eld
erly
and
Fam
ilies
$80,
771
15.0
34Ag
ricul
ture
on
Indi
an L
ands
F
ort B
elkn
ap C
omm
unity
Cou
ncil
A
10AV
0058
3$5
9,18
615
.224
Cultu
ral a
nd P
aleo
ntol
ogic
al R
esou
rces
Man
agem
ent
$8
2,91
015
.225
Recr
eatio
n an
d Vi
sitor
Ser
vice
s
$26,
936
15.2
30In
vasiv
e an
d N
oxio
us P
lant
Man
agem
ent
$4
,822
15.2
31Fi
sh, W
ildlif
e an
d Pl
ant C
onse
rvat
ion
Reso
urce
Man
agem
ent
$1
53,4
6115
.236
Envi
ronm
enta
l Qua
lity
and
Prot
ectio
n
$9
63,3
5415
.250
Regu
latio
n of
Sur
face
Coa
l Min
ing
and
Surf
ace
Effe
cts o
f Und
ergr
ound
Coa
l Min
ing
$2,0
26,8
3715
.252
Aban
done
d M
ine
Land
Rec
lam
atio
n (A
MLR
)
$4,0
81,1
5015
.427
Fede
ral O
il an
d Ga
s Roy
alty
Man
agem
ent S
tate
and
Trib
al C
oord
inat
ion
$437
,554
15.5
14Re
clam
atio
n St
ates
Em
erge
ncy
Drou
ght R
elie
f
$72,
543
15.5
17Fi
sh a
nd W
ildlif
e Co
ordi
natio
n Ac
t
$43,
867
15.5
24Re
crea
tion
Reso
urce
s Man
agem
ent
$4
8,86
8
The
acco
mpa
nyin
g no
tes a
re a
n in
tegr
al p
art o
f thi
s sch
edul
e.
B-212

Stat
e of
Mon
tana
Sche
dule
of E
xpen
ditu
res o
f Fed
eral
Aw
ards
For t
he F
isca
l Yea
r End
ed Ju
ne 3
0, 2
018
Amou
nt to
Sub
reci
pien
tsEx
pend
iture
s15
.608
Fish
and
Wild
life
Man
agem
ent A
ssist
ance
$84,
503
15.6
15Co
oper
ativ
e En
dang
ered
Spe
cies
Con
serv
atio
n Fu
nd
$2
,082
,345
15.6
26En
hanc
ed H
unte
r Edu
catio
n an
d Sa
fety
$79,
920
15.6
34St
ate
Wild
life
Gran
ts
$2
0,00
0$6
13,9
5415
.637
Mig
rato
ry B
ird Jo
int V
entu
res
$3
0,00
0$3
8,00
915
.657
Enda
nger
ed S
peci
es C
onse
rvat
ion
- Rec
over
y Im
plem
enta
tion
Fund
s
$186
,096
15.6
60En
dang
ered
Spe
cies
- Ca
ndid
ate
Cons
erva
tion
Actio
n Fu
nds
$3
48
Sta
te o
f Uta
h
186
103
$79,
059
15.6
66En
dang
ered
Spe
cies
Con
serv
atio
n-W
olf L
ives
tock
Los
s Com
pens
atio
n an
d Pr
even
tion
$48,
216
$135
,000
15.6
78Co
oper
ativ
e Ec
osys
tem
Stu
dies
Uni
ts
$2
8,41
615
.904
Hist
oric
Pre
serv
atio
n Fu
nd G
rant
s-In
-Aid
$73,
200
$773
,726
15.9
16O
utdo
or R
ecre
atio
n Ac
quisi
tion,
Dev
elop
men
t and
Pla
nnin
g
$2
41,7
86$4
41,7
8615
.944
Nat
ural
Res
ourc
e St
ewar
dshi
p
$1
0,07
915
.945
Coop
erat
ive
Rese
arch
and
Tra
inin
g Pr
ogra
ms -
Res
ourc
es o
f the
Nat
iona
l Par
k Sy
stem
$10,
632
15.9
81W
ater
Use
and
Dat
a Re
sear
ch
$5
5,60
415
.UXX
Misc
ella
neou
s Non
-Maj
or G
rant
s
$282
,990
TOTA
L$1
2,98
4,72
6Fi
sh a
nd W
ildlif
e Cl
uste
r15
.605
Spor
t Fish
Res
tora
tion
$7,0
89,8
1115
.611
Wild
life
Rest
orat
ion
and
Basic
Hun
ter E
duca
tion
$73,
568
$13,
530,
913
TOTA
L$2
0,62
0,72
4
DEPA
RTM
ENT
OF
THE
INTE
RIO
R TO
TAL
$33,
605,
450
DEPA
RTM
ENT
OF
TRAN
SPO
RTAT
ION
20.1
06Ai
rpor
t Im
prov
emen
t Pro
gram
($25
,507
)20
.200
High
way
Res
earc
h an
d De
velo
pmen
t Pro
gram
$173
,003
20.2
18M
otor
Car
rier S
afet
y As
sista
nce
$2,5
80,2
5320
.232
Com
mer
cial
Driv
er's
Lice
nse
Prog
ram
Impl
emen
tatio
n Gr
ant
$9
5,89
020
.237
Mot
or C
arrie
r Saf
ety
Assis
tanc
e Hi
gh P
riorit
y Ac
tiviti
es G
rant
s and
Coo
pera
tive
Agre
emen
ts
$1
5,26
420
.240
Fuel
Tax
Eva
sion-
Inte
rgov
ernm
enta
l Enf
orce
men
t Effo
rt
$1
5,14
020
.505
Met
ropo
litan
Tra
nspo
rtat
ion
Plan
ning
and
Sta
te a
nd N
on-M
etro
polit
an P
lann
ing
and
Rese
arch
$449
,363
$554
,365
20.5
09Fo
rmul
a Gr
ants
for R
ural
Are
as
$8
,607
,089
$9,6
01,7
9620
.608
Min
imum
Pen
altie
s for
Rep
eat O
ffend
ers f
or D
rivin
g W
hile
Into
xica
ted
$214
,324
$1,2
16,9
05
The
acco
mpa
nyin
g no
tes a
re a
n in
tegr
al p
art o
f thi
s sch
edul
e.
B-213

Stat
e of
Mon
tana
Sche
dule
of E
xpen
ditu
res o
f Fed
eral
Aw
ards
For t
he F
isca
l Yea
r End
ed Ju
ne 3
0, 2
018
Amou
nt to
Sub
reci
pien
tsEx
pend
iture
s
20.6
14N
atio
nal H
ighw
ay T
raffi
c Sa
fety
Adm
inist
ratio
n (N
HTSA
) Disc
retio
nary
Saf
ety
Gran
ts a
nd C
oope
rativ
e Ag
reem
ents
$88,
338
20.7
00Pi
pelin
e Sa
fety
Pro
gram
Sta
te B
ase
Gran
t
$174
,214
20.7
03In
tera
genc
y Ha
zard
ous M
ater
ials
Publ
ic S
ecto
r Tra
inin
g an
d Pl
anni
ng G
rant
s
$119
,990
$124
,091
TOTA
L$1
4,61
3,75
2Fe
dera
l Tra
nsit
Clus
ter
20.5
26Bu
s and
Bus
Fac
ilitie
s For
mul
a Pr
ogra
m
$8
68,8
99$8
68,8
99TO
TAL
$868
,899
High
way
Pla
nnin
g an
d Co
nstr
uctio
n Cl
uste
r20
.205
High
way
Pla
nnin
g an
d Co
nstr
uctio
n
$2
,294
,585
$419
,157
,310
20.2
19Re
crea
tiona
l Tra
ils P
rogr
am
$2
,071
,498
$2,1
81,9
49TO
TAL
$421
,339
,259
High
way
Saf
ety
Clus
ter
20.6
00St
ate
and
Com
mun
ity H
ighw
ay S
afet
y
$2
35,2
94$1
,796
,772
20.6
16N
atio
nal P
riorit
y Sa
fety
Pro
gram
s
$172
,051
$876
,227
TOTA
L$2
,672
,999
Tran
sit S
ervi
ces P
rogr
ams C
lust
er20
.513
Enha
nced
Mob
ility
of S
enio
rs a
nd In
divi
dual
s with
Disa
bilit
ies
$9
74,8
08$1
,054
,352
TOTA
L$1
,054
,352
DEPA
RTM
ENT
OF
TRAN
SPO
RTAT
ION
TO
TAL
$440
,549
,261
DEPA
RTM
ENT
OF
TREA
SURY
21.U
XXM
iscel
lane
ous N
on-M
ajor
Gra
nts
$8
78TO
TAL
$878
DEPA
RTM
ENT
OF
TREA
SURY
TO
TAL
$878
DEPA
RTM
ENT
OF
VETE
RAN
S AF
FAIR
S64
.014
Vete
rans
Sta
te D
omic
iliar
y Ca
re
$1
69,3
0264
.015
Vete
rans
Sta
te N
ursin
g Ho
me
Care
$6,3
67,1
6264
.124
All-V
olun
teer
For
ce E
duca
tiona
l Ass
istan
ce
$1
07,5
4264
.202
Proc
urem
ent o
f Hea
dsto
nes a
nd M
arke
rs a
nd/o
r Pre
siden
tial M
emor
ial C
ertif
icat
es
$1
2,64
964
.203
Vete
rans
Cem
eter
y Gr
ants
Pro
gram
$700
TOTA
L$6
,657
,355
DEPA
RTM
ENT
OF
VETE
RAN
S AF
FAIR
S TO
TAL
$6,6
57,3
55
The
acco
mpa
nyin
g no
tes a
re a
n in
tegr
al p
art o
f thi
s sch
edul
e.
B-214

Stat
e of
Mon
tana
Sche
dule
of E
xpen
ditu
res o
f Fed
eral
Aw
ards
For t
he F
isca
l Yea
r End
ed Ju
ne 3
0, 2
018
Amou
nt to
Sub
reci
pien
tsEx
pend
iture
sEN
VIRO
NM
ENTA
L PR
OTE
CTIO
N A
GEN
CY
66.0
34Su
rvey
s, St
udie
s, R
esea
rch,
Inve
stig
atio
ns, D
emon
stra
tions
, and
Spe
cial
Pur
pose
Act
iviti
es R
elat
ing
to
the
Clea
n Ai
r Act
$280
,269
66.0
40St
ate
Clea
n Di
esel
Gra
nt P
rogr
am
$1
28,0
1866
.204
Mul
tipur
pose
Gra
nts t
o St
ates
and
Trib
es
$1
29,3
7366
.419
Wat
er P
ollu
tion
Cont
rol S
tate
, Int
erst
ate,
and
Trib
al P
rogr
am S
uppo
rt
$6
8,82
966
.433
Stat
e U
nder
grou
nd W
ater
Sou
rce
Prot
ectio
n
$5
4,85
266
.454
Wat
er Q
ualit
y M
anag
emen
t Pla
nnin
g
$1
35,3
9266
.460
Non
poin
t Sou
rce
Impl
emen
tatio
n Gr
ants
$1,5
21,7
31
Soi
l and
Wat
er C
onse
rvat
ion
Dist
ricts
of M
onta
na
C9-
9983
3615
$1,9
8966
.461
Regi
onal
Wet
land
Pro
gram
Dev
elop
men
t Gra
nts
$9
5,94
066
.514
Scie
nce
To A
chie
ve R
esul
ts (S
TAR)
Fel
low
ship
Pro
gram
$8,8
5166
.516
P3 A
war
d: N
atio
nal S
tude
nt D
esig
n Co
mpe
titio
n fo
r Sus
tain
abili
ty
$3
3966
.605
Perf
orm
ance
Par
tner
ship
Gra
nts
$5
,417
,578
66.6
08En
viro
nmen
tal I
nfor
mat
ion
Exch
ange
Net
wor
k Gr
ant P
rogr
am a
nd R
elat
ed A
ssist
ance
$98,
375
66.7
08Po
llutio
n Pr
even
tion
Gran
ts P
rogr
am
$1
35,7
0566
.802
Supe
rfun
d St
ate,
Pol
itica
l Sub
divi
sion,
and
Indi
an T
ribe
Site
-Spe
cific
Coo
pera
tive
Agre
emen
ts
$1
,718
,399
66.8
04U
nder
grou
nd S
tora
ge T
ank
Prev
entio
n, D
etec
tion
and
Com
plia
nce
Prog
ram
$331
,846
66.8
05Le
akin
g U
nder
grou
nd S
tora
ge T
ank
Trus
t Fun
d Co
rrec
tive
Actio
n Pr
ogra
m
$4
92,7
2166
.809
Supe
rfun
d St
ate
and
Indi
an T
ribe
Core
Pro
gram
Coo
pera
tive
Agre
emen
ts
$1
73,5
7266
.817
Stat
e an
d Tr
ibal
Res
pons
e Pr
ogra
m G
rant
s
$753
,873
66.9
51En
viro
nmen
tal E
duca
tion
Gran
ts
$9
,451
$44,
986
TOTA
L$1
1,59
2,63
8Cl
ean
Wat
er S
tate
Rev
olvi
ng F
und
Clus
ter
66.4
58Ca
pita
lizat
ion
Gran
ts fo
r Cle
an W
ater
Sta
te R
evol
ving
Fun
ds
$2
79,3
75,8
56TO
TAL
$279
,375
,856
Drin
king
Wat
er S
tate
Rev
olvi
ng F
und
Clus
ter
66.4
68Ca
pita
lizat
ion
Gran
ts fo
r Drin
king
Wat
er S
tate
Rev
olvi
ng F
unds
$150
,318
,256
TOTA
L$1
50,3
18,2
56
ENVI
RON
MEN
TAL
PRO
TECT
ION
AG
ENCY
TO
TAL
$441
,286
,750
The
acco
mpa
nyin
g no
tes a
re a
n in
tegr
al p
art o
f thi
s sch
edul
e.
B-215

Stat
e of
Mon
tana
Sche
dule
of E
xpen
ditu
res o
f Fed
eral
Aw
ards
For t
he F
isca
l Yea
r End
ed Ju
ne 3
0, 2
018
Amou
nt to
Sub
reci
pien
tsEx
pend
iture
sEQ
UAL
EM
PLO
YMEN
T O
PPO
RTU
NIT
Y CO
MM
ISSI
ON
30.0
01Em
ploy
men
t Disc
rimin
atio
n Ti
tle V
II of
the
Civi
l Rig
hts A
ct o
f 196
4
$1
71,1
48TO
TAL
$171
,148
EQU
AL E
MPL
OYM
ENT
OPP
ORT
UN
ITY
COM
MIS
SIO
N T
OTA
L$1
71,1
48EX
ECU
TIVE
OFF
ICE
OF
THE
PRES
IDEN
T95
.001
High
Inte
nsity
Dru
g Tr
affic
king
Are
as P
rogr
am
$1
0,69
7TO
TAL
$10,
697
EXEC
UTI
VE O
FFIC
E O
F TH
E PR
ESID
ENT
TOTA
L$1
0,69
7GE
NER
AL S
ERVI
CES
ADM
INIS
TRAT
ION
39.0
03Do
natio
n of
Fed
eral
Sur
plus
Per
sona
l Pro
pert
y
$1
01,9
3739
.011
Elec
tion
Refo
rm P
aym
ents
$90,
569
TOTA
L$1
92,5
06
GEN
ERAL
SER
VICE
S AD
MIN
ISTR
ATIO
N T
OTA
L$1
92,5
06IN
STIT
UTE
OF
MU
SEU
M A
ND
LIBR
ARY
SERV
ICES
45.3
01M
useu
ms f
or A
mer
ica
$3,8
3945
.310
Gran
ts to
Sta
tes
$8
92,0
4745
.312
Nat
iona
l Lea
ders
hip
Gran
ts
$4
7,05
5$2
61,2
2345
.313
Laur
a Bu
sh 2
1st C
entu
ry L
ibra
rian
Prog
ram
$90,
999
TOTA
L$1
,248
,108
INST
ITU
TE O
F M
USE
UM
AN
D LI
BRAR
Y SE
RVIC
ES T
OTA
L$1
,248
,108
LIBR
ARY
OF
CON
GRES
S42
.UXX
Misc
ella
neou
s Non
-Maj
or G
rant
s
$15,
725
TOTA
L$1
5,72
5
LIBR
ARY
OF
CON
GRE
SS T
OTA
L$1
5,72
5N
ATIO
NAL
AER
ON
AUTI
CS A
ND
SPAC
E AD
MIN
ISTR
ATIO
N43
.001
Scie
nce
$126
,117
U
nive
rsity
of W
ashi
ngto
n
UW
SC89
87$7
7,55
443
.008
Educ
atio
n
Sci
ence
nter
2
016-
01-U
MT/
NN
X16A
M22
G$1
8,42
9TO
TAL
$222
,100
NAT
ION
AL A
ERO
NAU
TICS
AN
D SP
ACE
ADM
INIS
TRAT
ION
TO
TAL
$222
,100
The
acco
mpa
nyin
g no
tes a
re a
n in
tegr
al p
art o
f thi
s sch
edul
e.
B-216

Stat
e of
Mon
tana
Sche
dule
of E
xpen
ditu
res o
f Fed
eral
Aw
ards
For t
he F
isca
l Yea
r End
ed Ju
ne 3
0, 2
018
Amou
nt to
Sub
reci
pien
tsEx
pend
iture
sN
ATIO
NAL
ARC
HIVE
S AN
D RE
CORD
S AD
MIN
ISTR
ATIO
N89
.003
Nat
iona
l Hist
oric
al P
ublic
atio
ns a
nd R
ecor
ds G
rant
s
$17,
681
TOTA
L$1
7,68
1
NAT
ION
AL A
RCHI
VES
AND
RECO
RDS
ADM
INIS
TRAT
ION
TO
TAL
$17,
681
NAT
ION
AL E
NDO
WM
ENT
FOR
THE
ARTS
45.0
24Pr
omot
ion
of th
e Ar
ts G
rant
s to
Org
aniza
tions
and
Indi
vidu
als
$5
6,00
8
Art
s Mid
wes
t
0001
8001
$289
A
rts M
idw
est
00
0199
95$2
4,45
445
.025
Prom
otio
n of
the
Arts
Par
tner
ship
Agr
eem
ents
$369
,889
$779
,338
TOTA
L$8
60,0
89
NAT
ION
AL E
NDO
WM
ENT
FOR
THE
ARTS
TO
TAL
$860
,089
NAT
ION
AL E
NDO
WM
ENT
FOR
THE
HUM
ANIT
IES
45.1
29Pr
omot
ion
of th
e Hu
man
ities
Fed
eral
/Sta
te P
artn
ersh
ip
Hum
aniti
es M
onta
na
17R
064
$1,6
50
Hum
aniti
es M
onta
na
17R
057
$500
H
uman
ities
Mon
tana
1
7R02
5$6
,393
H
uman
ities
Mon
tana
1
8R02
1$1
,000
45.1
49Pr
omot
ion
of th
e Hu
man
ities
Div
ision
of P
rese
rvat
ion
and
Acce
ss
$5
9,87
8
Hum
aniti
es M
onta
na
16R
045
$1,2
27
Ida
ho S
tate
Hist
oric
al S
ocie
ty
$6
3,28
0TO
TAL
$133
,928
NAT
ION
AL E
NDO
WM
ENT
FOR
THE
HUM
ANIT
IES
TOTA
L$1
33,9
28N
ATIO
NAL
SCI
ENCE
FO
UN
DATI
ON
47.0
76Ed
ucat
ion
and
Hum
an R
esou
rces
$10,
359
S
alish
Koo
tena
i Col
lege
1
1023
62$5
,768
TOTA
L$1
6,12
7
NAT
ION
AL S
CIEN
CE F
OU
NDA
TIO
N T
OTA
L$1
6,12
7PE
ACE
CORP
S45
.400
Peac
e Co
rps'
Glob
al H
ealth
and
PEP
FAR
Initi
ativ
e Pr
ogra
m
$6
,725
TOTA
L$6
,725
PEAC
E CO
RPS
TOTA
L$6
,725
The
acco
mpa
nyin
g no
tes a
re a
n in
tegr
al p
art o
f thi
s sch
edul
e.
B-217

Stat
e of
Mon
tana
Sche
dule
of E
xpen
ditu
res o
f Fed
eral
Aw
ards
For t
he F
isca
l Yea
r End
ed Ju
ne 3
0, 2
018
Amou
nt to
Sub
reci
pien
tsEx
pend
iture
sSM
ALL
BUSI
NES
S AD
MIN
ISTR
ATIO
N59
.037
Smal
l Bus
ines
s Dev
elop
men
t Cen
ters
$668
,130
59.0
58Fe
dera
l and
Sta
te T
echn
olog
y Pa
rtne
rshi
p Pr
ogra
m
$5
5,67
159
.061
Stat
e Tr
ade
Expa
nsio
n
$3
53,3
02TO
TAL
$1,0
77,1
03
SMAL
L BU
SIN
ESS
ADM
INIS
TRAT
ION
TO
TAL
$1,0
77,1
03SO
CIAL
SEC
URI
TY A
DMIN
ISTR
ATIO
N96
.008
Soci
al S
ecur
ity -
Wor
k In
cent
ives
Pla
nnin
g an
d As
sista
nce
Prog
ram
$63,
224
$197
,972
TOTA
L$1
97,9
72Di
sabi
lity
Insu
ranc
e/SS
I Clu
ster
96.0
01So
cial
Sec
urity
Disa
bilit
y In
sura
nce
$6,9
55,4
96TO
TAL
$6,9
55,4
96
SOCI
AL S
ECU
RITY
ADM
INIS
TRAT
ION
TO
TAL
$7,1
53,4
68
The
acco
mpa
nyin
g no
tes a
re a
n in
tegr
al p
art o
f thi
s sch
edul
e.
B-218

Stat
e of
Mon
tana
Sche
dule
of E
xpen
ditu
res o
f Fed
eral
Aw
ards
For t
he F
isca
l Yea
r End
ed Ju
ne 3
0, 2
018
Rese
arch
and
Dev
elop
men
t Clu
ster
Amou
nt to
Sub
reci
pien
ts
Ex
pend
iture
s
AGEN
CY F
OR
INTE
RNAT
ION
AL D
EVEL
OPM
ENT
98.0
01U
SAID
For
eign
Ass
istan
ce fo
r Pro
gram
s Ove
rsea
s
I
nter
natio
nal F
ood
Polic
y Re
sear
ch In
stitu
te
201
6X17
9.M
SU$2
9,04
4$4
2,47
3
Uni
vers
ity o
f Flo
rida
U
FDSP
0001
1520
/P00
2348
3$4
,311
U
nive
rsity
of G
eorg
ia
RC2
82-3
92/4
9429
36$3
,820
Agen
cy fo
r Int
erna
tiona
l Dev
elop
men
t Tot
al$5
0,60
4
DEPA
RTM
ENT
OF
AGRI
CULT
URE
Agric
ultu
ral R
esea
rch
Serv
ice
10.0
01Ag
ricul
tura
l Res
earc
h Ba
sic a
nd A
pplie
d Re
sear
ch
$5
,000
$65,
686
S
outh
Dak
ota
Stat
e U
nive
rsity
3
TK61
2$5
,892
Anim
al a
nd P
lant
Hea
lth In
spec
tion
Serv
ice
10.0
25Pl
ant a
nd A
nim
al D
iseas
e, P
est C
ontr
ol, a
nd A
nim
al C
are
$363
,262
P
enns
ylva
nia
Stat
e U
nive
rsity
5
608-
MSU
-USD
A-01
69$1
1,87
2
Pen
nsyl
vani
a St
ate
Uni
vers
ity
536
3-M
SU-U
SDA-
0169
$2,8
84
Uta
h St
ate
Uni
vers
ity
200
592-
390
$25,
399
Econ
omic
Res
earc
h Se
rvic
e10
.250
Agric
ultu
ral a
nd R
ural
Eco
nom
ic R
esea
rch,
Coo
pera
tive
Agre
emen
ts a
nd C
olla
bora
tions
$31,
288
C
orne
ll Ce
nter
for B
ehav
iora
l Eco
nom
ics i
n Ch
ild N
utrit
ion
7
7867
-106
60$4
,975
Farm
Ser
vice
Age
ncy
10.4
06Fa
rm O
pera
ting
Loan
s
$24,
891
Fore
ign
Agric
ultu
ral S
ervi
ce10
.610
Expo
rt G
uara
ntee
Pro
gram
$18,
313
$124
,942
10.9
60Te
chni
cal A
gric
ultu
ral A
ssist
ance
R
utge
rs, T
he S
tate
Uni
vers
ity o
f New
Jers
ey
SA#
5566
; PO
566
945
$25,
716
Fore
st S
ervi
ce10
.652
Fore
stry
Res
earc
h
$7
2,58
2$4
,171
,917
H
ydro
Solu
tions
Inc
M
SA 2
017-
TO1
$21,
765
N
atio
nal W
ilder
ness
Ste
war
dshi
p Al
lianc
e
WI2
017
$15,
965
R
iver
Man
agem
ent S
ocie
ty
201
7RM
S-W
SR50
$29,
004
10.6
78Fo
rest
Ste
war
dshi
p Pr
ogra
m
Pen
nsyl
vani
a St
ate
Uni
vers
ity
551
8-U
M-U
SDA-
004
$1,3
30
The
acco
mpa
nyin
g no
tes a
re a
n in
tegr
al p
art o
f thi
s sch
edul
e.
B-219

Stat
e of
Mon
tana
Sche
dule
of E
xpen
ditu
res o
f Fed
eral
Aw
ards
For t
he F
isca
l Yea
r End
ed Ju
ne 3
0, 2
018
Rese
arch
and
Dev
elop
men
t Clu
ster
Amou
nt to
Sub
reci
pien
ts
Ex
pend
iture
s10
.680
Fore
st H
ealth
Pro
tect
ion
$167
,814
S
alish
Koo
teni
a Co
llege
2
015-
3842
4-24
031
$9,3
5810
.683
Nat
iona
l Fish
and
Wild
life
Foun
datio
n
Yel
low
ston
e to
Yuk
on C
onse
rvat
ion
Initi
ativ
e
15-
01-U
M$8
,480
10.6
84In
tern
atio
nal F
ores
try
Prog
ram
s
$134
,994
10.6
99Pa
rtne
rshi
p Ag
reem
ents
$142
,284
Mis
cella
neou
s10
.RD
Misc
ella
neou
s Res
earc
h an
d De
velo
pmen
t
$293
,995
U
nive
rsity
of W
iscon
sin
PO
# 00
0000
0666
($2,
379)
Nat
iona
l Ins
titut
e of
Foo
d an
d Ag
ricul
ture
10.2
00Gr
ants
for A
gric
ultu
ral R
esea
rch,
Spe
cial
Res
earc
h Gr
ants
N
orth
Dak
ota
Stat
e U
nive
rsity
F
AR00
2583
7$5
,166
U
nive
rsity
of C
alifo
rnia
, Dav
is
A18
-133
4-S0
01$7
,255
U
nive
rsity
of I
daho
B
JKP3
6-SB
-001
$10,
297
10.2
02Co
oper
ativ
e Fo
rest
ry R
esea
rch
$633
,926
10.2
03Pa
ymen
ts to
Agr
icul
tura
l Exp
erim
ent S
tatio
ns U
nder
the
Hatc
h Ac
t
$2,9
46,9
2210
.207
Anim
al H
ealth
and
Dise
ase
Rese
arch
$40,
586
10.2
15Su
stai
nabl
e Ag
ricul
ture
Res
earc
h an
d Ed
ucat
ion
$11,
397
U
nive
rsity
of I
daho
B
JKP8
5-SB
-001
/PO
0050
53$3
3,30
7
Uta
h St
ate
Uni
vers
ity
200
592-
395
$17,
488
U
tah
Stat
e U
nive
rsity
1
3067
6003
-66
$101
,855
$115
,402
U
tah
Stat
e U
nive
rsity
1
5089
3-00
001-
174
$100
,243
U
tah
Stat
e U
nive
rsity
1
4086
7026
-233
$5,0
33$5
5,23
5
Uta
h St
ate
Uni
vers
ity
150
893-
0000
1-20
7$4
3,48
6
Uta
h St
ate
Uni
vers
ity
200
592-
390
$41,
504
U
tah
Stat
e U
nive
rsity
2
0059
2-38
4$2
4,52
5
Uta
h St
ate
Uni
vers
ity
120
8330
11-2
38($
1,64
9)
Uta
h St
ate
Uni
vers
ity
200
592-
447
$11,
562
U
tah
Stat
e U
nive
rsity
1
5089
3-00
001-
270
$11,
017
U
tah
Stat
e U
nive
rsity
1
3067
6025
-277
$8,9
25
Uta
h St
ate
Uni
vers
ity
201
207-
504
$7,7
76
Uta
h St
ate
Uni
vers
ity
201
207-
554
$4,5
40
The
acco
mpa
nyin
g no
tes a
re a
n in
tegr
al p
art o
f thi
s sch
edul
e.
B-220

Stat
e of
Mon
tana
Sche
dule
of E
xpen
ditu
res o
f Fed
eral
Aw
ards
For t
he F
isca
l Yea
r End
ed Ju
ne 3
0, 2
018
Rese
arch
and
Dev
elop
men
t Clu
ster
Amou
nt to
Sub
reci
pien
ts
Ex
pend
iture
s
Uta
h St
ate
Uni
vers
ity
200
592-
385
$2,7
24
Uta
h St
ate
Uni
vers
ity
140
8670
38-3
46($
847)
U
tah
Stat
e U
nive
rsity
2
0059
2-00
001-
311
$15,
168
U
tah
Stat
e U
nive
rsity
1
4086
7034
-367
$34,
440
10.2
17Hi
gher
Edu
catio
n - I
nstit
utio
n Ch
alle
nge
Gran
ts P
rogr
am
$4
1310
.227
1994
Inst
itutio
ns R
esea
rch
Prog
ram
L
ittle
Big
Hor
n Co
llege
$9,4
27
Sal
ish K
oote
nai C
olle
ge
SAA
-16-
MSU
-001
$14,
500
S
alish
Koo
teni
a Co
llege
2
015-
3842
4-22
668
$13,
830
S
alish
Koo
teni
a Co
llege
2
016-
3842
4-25
58$3
3,49
810
.303
Inte
grat
ed P
rogr
ams
$2
86,7
7310
.304
Hom
elan
d Se
curit
y Ag
ricul
tura
l
K
ansa
s Sta
te U
nive
rsity
S
1704
5$3
1,81
410
.307
Org
anic
Agr
icul
ture
Res
earc
h an
d Ex
tens
ion
Initi
ativ
e
$4
29$5
3,41
1
Nat
iona
l Cen
ter f
or A
ppro
pria
te T
echn
olog
y
$18,
733
10.3
09Sp
ecia
lty C
rop
Rese
arch
Initi
ativ
e
Col
orad
o St
ate
Uni
vers
ity
G-1
363-
04$1
4,50
0
Cor
nell
Uni
vers
ity
739
99-1
0426
$79,
968
U
nive
rsity
of T
enne
ssee
8
5000
4273
9$1
6,30
910
.310
Agric
ultu
re a
nd F
ood
Rese
arch
Initi
ativ
e (A
FRI)
$24,
009
$1,2
13,9
96
Col
orad
o St
ate
Uni
vers
ity
G-9
1600
-3$1
12,1
82
Col
orad
o St
ate
Uni
vers
ity
G-9
1600
-2$1
53,9
92
Kan
sas S
tate
Uni
vers
ity
S15
184
$9,6
26
Nor
th C
arol
ina
Stat
e U
nive
rsity
2
015-
0097
-05
$35,
634
U
nive
rsity
of C
alifo
rnia
, Dav
is
201
6035
66-0
8$1
51,7
84
Uni
vers
ity o
f Neb
rask
a-Li
ncol
n
25-
6268
-000
5-00
4$6
9,02
4
Uni
vers
ity o
f Ver
mon
t
2903
4SU
B517
51$5
7,91
910
.312
Biom
ass R
esea
rch
and
Deve
lopm
ent I
nitia
tive
Com
petit
ive
Gran
ts P
rogr
am (B
RDI)
$68,
818
$339
,626
10.3
18W
omen
and
Min
oriti
es in
Sci
ence
, Tec
hnol
ogy,
Eng
inee
ring,
and
Mat
hem
atic
s Fie
lds
$1
9,54
510
.329
Crop
Pro
tect
ion
and
Pest
Man
agem
ent C
ompe
titiv
e Gr
ants
Pro
gram
$61,
729
$317
,988
U
nive
rsity
of C
alifo
rnia
, Dav
is
SA1
4-23
09-3
4$2
7,94
5
The
acco
mpa
nyin
g no
tes a
re a
n in
tegr
al p
art o
f thi
s sch
edul
e.
B-221

Stat
e of
Mon
tana
Sche
dule
of E
xpen
ditu
res o
f Fed
eral
Aw
ards
For t
he F
isca
l Yea
r End
ed Ju
ne 3
0, 2
018
Rese
arch
and
Dev
elop
men
t Clu
ster
Amou
nt to
Sub
reci
pien
ts
Ex
pend
iture
s10
.330
Alfa
lfa a
nd F
orag
e Re
sear
ch P
rogr
am
Uni
vers
ity o
f Cal
iforn
ia, D
avis
A
18-0
619-
S003
$2,6
9210
.500
Coop
erat
ive
Exte
nsio
n Se
rvic
e
$2
1,03
6$1
51,7
64
Was
hing
ton
Stat
e U
nive
rsity
1
0881
5_G0
0354
5$8
96N
atur
al R
esou
rces
Con
serv
atio
n Se
rvic
e10
.902
Soil
and
Wat
er C
onse
rvat
ion
$17,
047
$325
,917
P
heas
ants
For
ever
L
PCI 1
8-01
$69,
510
P
heas
ants
For
ever
6
8-3A
75-1
6-73
6$2
57,8
2310
.903
Soil
Surv
ey
$5
,284
10.9
12En
viro
nmen
tal Q
ualit
y In
cent
ives
Pro
gram
$62,
258
Rura
l Bus
ines
s Coo
pera
tive
Serv
ice
10.3
50Te
chni
cal A
ssist
ance
to C
oope
rativ
es
Nat
iona
l Ass
ocia
tion
of D
evel
opm
ent O
rgan
izatio
ns
800
.01
$130
,301
USD
A, O
ffice
of t
he C
hief
Eco
nom
ist
10.2
90Ag
ricul
tura
l Mar
ket a
nd E
cono
mic
Res
earc
h
$1
,218
DEPA
RTM
ENT
OF
AGRI
CULT
URE
TO
TAL
$13,
951,
829
DEPA
RTM
ENT
OF
COM
MER
CEN
atio
nal I
nstit
ute
of S
tand
ards
and
Tec
hnol
ogy
11.6
20Sc
ienc
e, T
echn
olog
y, B
usin
ess a
nd/o
r Edu
catio
n O
utre
ach
S
tone
& A
ssoc
iate
s
NIS
T-M
EP-S
A-01
$88,
586
Nat
iona
l Oce
anic
and
Atm
osph
eric
Adm
inis
trat
ion
11.4
31Cl
imat
e an
d At
mos
pher
ic R
esea
rch
$85,
930
11.4
38Pa
cific
Coa
st S
alm
on R
ecov
ery
Paci
fic S
alm
on T
reat
y Pr
ogra
m
Ber
ing
Sea
Fish
erm
an's
Asso
ciat
ion
A
C-16
09$4
2,36
311
.440
Envi
ronm
enta
l Sci
ence
s, A
pplic
atio
ns, D
ata,
and
Edu
catio
n
$1
,520
11.4
72U
nalli
ed S
cien
ce P
rogr
am
Nor
th P
acifi
c Re
sear
ch B
oard
1
718B
$10,
128
N
orth
Pac
ific
Rese
arch
Boa
rd
171
8A$8
4,48
3
DEPA
RTM
ENT
OF
COM
MER
CE T
OTA
L$3
13,0
10
The
acco
mpa
nyin
g no
tes a
re a
n in
tegr
al p
art o
f thi
s sch
edul
e.
B-222

Stat
e of
Mon
tana
Sche
dule
of E
xpen
ditu
res o
f Fed
eral
Aw
ards
For t
he F
isca
l Yea
r End
ed Ju
ne 3
0, 2
018
Rese
arch
and
Dev
elop
men
t Clu
ster
Amou
nt to
Sub
reci
pien
ts
Ex
pend
iture
sDE
PART
MEN
T O
F DE
FEN
SEAd
vanc
ed R
esea
rch
Proj
ects
Age
ncy
12.9
10Re
sear
ch a
nd T
echn
olog
y De
velo
pmen
t
$267
,121
N
orth
Car
olin
a St
ate
Uni
vers
ity
201
6-28
96-0
4$2
55,5
63De
fens
e Lo
gist
ics A
genc
y12
.002
Proc
urem
ent T
echn
ical
Ass
istan
ce F
or B
usin
ess F
irms
$1
54,7
84
Big
Sky
Eco
nom
ic D
evel
opm
ent A
utho
rity
S
P480
0-16
-2-1
622
$10,
765
B
ig S
ky E
cono
mic
Dev
elop
men
t Aut
horit
y
SP4
800-
17-2
-172
2$6
6,55
7De
part
men
t of t
he A
ir Fo
rce
12.8
00Ai
r For
ce D
efen
se R
esea
rch
Scie
nces
Pro
gram
$1,4
62,7
28$1
5,30
9,31
7
Uni
vers
ity o
f Min
neso
ta
A00
5720
602
$109
,334
Depa
rtm
ent o
f the
Arm
y12
.114
Colla
bora
tive
Rese
arch
and
Dev
elop
men
t
$104
,417
W
est P
oint
Mili
tary
Aca
dem
y
$1
0,30
112
.420
Mili
tary
Med
ical
Res
earc
h an
d De
velo
pmen
t
$29,
955
$717
,066
12.4
31Ba
sic S
cien
tific
Res
earc
h
$2
35,1
84$3
,137
,589
Depa
rtm
ent o
f the
Nav
y12
.300
Basic
and
App
lied
Scie
ntifi
c Re
sear
ch
$2
77,2
44
Gla
cige
n M
ater
ials,
Inc.
$26,
114
S
2 Co
rpor
atio
n
S2-
5504
-15-
01U
C$2
26,1
75
TPS
Ass
ocia
tes,
Inc.
P
O M
SU-4
631/
4Y01
-01
$49,
212
Mis
cella
neou
s12
.RD
Misc
ella
neou
s Res
earc
h an
d De
velo
pmen
t
$407
,883
$3,4
36,6
45
Bat
telle
Mem
oria
l Ins
titut
e
US0
01-0
0059
0859
$29,
041
B
lack
mor
e Se
nsor
and
Ana
lytic
s
USA
F AR
Z999
$1,6
87
Brid
ger P
hoto
nics
$37
D
uke
Uni
vers
ity
SU
BCO
NTR
ACT
NU
MBE
R 31
3-07
42$1
14,9
23
Lei
dos
PO
1016
9067
$27,
773
S
2 Co
rpor
atio
n
S2-
1954
-16-
01$1
8,96
9
S2
Corp
orat
ion
S
2-55
04-1
6-01
C$3
9,79
6
S2
Corp
orat
ion
S
2-17
-000
3-01
$231
,201
S
mar
tron
ix
18-
018P
O$1
,251
The
acco
mpa
nyin
g no
tes a
re a
n in
tegr
al p
art o
f thi
s sch
edul
e.
B-223

Stat
e of
Mon
tana
Sche
dule
of E
xpen
ditu
res o
f Fed
eral
Aw
ards
For t
he F
isca
l Yea
r End
ed Ju
ne 3
0, 2
018
Rese
arch
and
Dev
elop
men
t Clu
ster
Amou
nt to
Sub
reci
pien
ts
Ex
pend
iture
s
Spe
ctra
l Mol
ecul
ar Im
agin
g
$1
14,9
59
Tuf
ts U
nive
rsity
A
RM21
2-M
SU$4
2,97
6
Uni
vers
ity o
f Mar
ylan
d
312
36-Z
8409
102
$7,3
83
Wes
t Poi
nt M
ilita
ry A
cade
my
($7)
Offi
ce o
f the
Sec
reta
ry o
f Def
ense
12.6
30Ba
sic, A
pplie
d, a
nd A
dvan
ced
Rese
arch
in S
cien
ce a
nd E
ngin
eerin
g
Aca
dem
y of
App
lied
Scie
nce
$20,
174
T
echn
olog
y St
uden
t Ass
ocia
tion
2
018-
2019
UN
ITE
Sum
mer
Pro
gram
$17,
422
12.6
32Le
gacy
Res
ourc
e M
anag
emen
t Pro
gram
$852
DEPA
RTM
ENT
OF
DEFE
NSE
TO
TAL
$24,
826,
641
DEPA
RTM
ENT
OF
EDU
CATI
ON
Inst
itute
of E
duca
tion
Scie
nces
84.3
05Ed
ucat
ion
Rese
arch
, Dev
elop
men
t and
Diss
emin
atio
n
SRI
Inte
rnat
iona
l
51-0
0131
2$1
35,6
46O
ffice
of E
lem
enta
ry a
nd S
econ
dary
Edu
catio
n84
.299
Indi
an E
duca
tion
-- Sp
ecia
l Pro
gram
s for
Indi
an C
hild
ren
$477
,307
L
ittle
Big
Hor
n Co
llege
($
10,5
34)
84.3
67Su
ppor
ting
Effe
ctiv
e In
stru
ctio
n St
ate
Gran
ts
Nat
iona
l Writ
ing
Proj
ect
09
-MT0
2-SE
ED20
17 IL
I$1
0,52
4O
ffice
of P
osts
econ
dary
Edu
catio
n84
.116
Fund
for t
he Im
prov
emen
t of P
osts
econ
dary
Edu
catio
n
Wes
tern
Inte
rsta
te C
omm
issio
n fo
r Hig
her E
duca
tion
$393
DEPA
RTM
ENT
OF
EDU
CATI
ON
TO
TAL
$613
,336
DEPA
RTM
ENT
OF
ENER
GY81
.049
Offi
ce o
f Sci
ence
Fin
anci
al A
ssist
ance
Pro
gram
$1,0
67,4
47$2
,293
,008
A
erod
yne
Rese
arch
Inc
A
RI 1
1129
-2$2
9,84
7
Gla
cige
n M
ater
ials,
Inc.
$62,
424
M
onta
na E
mer
gent
Tec
hnol
ogie
s, In
c.
$6
1,67
8
San
dia
Nat
iona
l Lab
orat
orie
s
PO #
1779
428
$12,
464
U
nive
rsity
of W
yom
ing
D
E-SC
0012
671
$121
,562
W
ashi
ngto
n St
ate
Uni
vers
ity
132
345-
G003
797
$72,
193
The
acco
mpa
nyin
g no
tes a
re a
n in
tegr
al p
art o
f thi
s sch
edul
e.
B-224

Stat
e of
Mon
tana
Sche
dule
of E
xpen
ditu
res o
f Fed
eral
Aw
ards
For t
he F
isca
l Yea
r End
ed Ju
ne 3
0, 2
018
Rese
arch
and
Dev
elop
men
t Clu
ster
Amou
nt to
Sub
reci
pien
ts
Ex
pend
iture
s81
.086
Cons
erva
tion
Rese
arch
and
Dev
elop
men
t
$11,
500
$3,0
57,4
73
Koo
tena
i Trib
e of
Idah
o
200
2-01
1-00
-SU
-BPA
57-F
WP-
FY18
$73,
778
K
oote
nai T
ribe
of Id
aho
2
002-
011-
00-S
U-B
PA57
-FW
P-FY
17$1
38,2
44
Pac
ific
Stat
es M
arin
e Fi
sher
ies C
omm
issio
n
17.
54$5
3,64
3
Pac
ific
Stat
es M
arin
e Fi
sher
ies C
omm
issio
n
18-
50G
$108
,800
81.0
87Re
new
able
Ene
rgy
Rese
arch
and
Dev
elop
men
t
M
ichi
gan
Stat
e U
nive
rsity
R
C107
739
$75,
692
O
cean
Ren
ewab
le P
ower
Com
pany
$8,7
52
Uni
vers
ity o
f Tol
edo
F
-201
3-30
($10
,498
)81
.089
Foss
il En
ergy
Res
earc
h an
d De
velo
pmen
t
$440
,834
$2,4
36,1
63M
isce
llane
ous
81.R
DM
iscel
lane
ous R
esea
rch
and
Deve
lopm
ent
Bat
telle
Ene
rgy
Allia
nce
D
E-AC
07-0
5ID1
4517
$14,
425
L
awre
nce
Berk
eley
Nat
iona
l Lab
orat
ory
D
E-AC
02-0
5CH1
1231
$21,
087
$73,
209
S
andi
a N
atio
nal L
abor
ator
ies
PO
187
7920
$17,
790
S
andi
a N
atio
nal L
abor
ator
ies
16
6330
2$3
4,62
7
DEPA
RTM
ENT
OF
ENER
GY
TOTA
L$8
,735
,274
DEPA
RTM
ENT
OF
HEAL
TH A
ND
HUM
AN S
ERVI
CES
Adm
inis
trat
ion
for C
hild
ren
and
Fam
ilies
93.6
70Ch
ild A
buse
and
Neg
lect
Disc
retio
nary
Act
iviti
es
Fut
ures
With
out V
iole
nce
2
438
$8,3
00
Fut
ures
With
out V
iole
nce
2
190
$14,
579
Adm
inis
trat
ion
for C
omm
unity
Liv
ing
93.3
25Pa
raly
sis R
esou
rce
Cent
er
Chr
istop
her a
nd D
ana
Reev
e Fo
unda
tion
9
0PR3
001-
01-0
0$1
793
.433
ACL
Nat
iona
l Ins
titut
e on
Disa
bilit
y, In
depe
nden
t Liv
ing,
and
Reh
abili
tatio
n Re
sear
ch
$2
52,4
94$1
,626
,799
I
nstit
ute
for R
ehab
ilita
tion
and
Rese
arch
1
8-PD
R-01
$7,2
30
Ins
titut
e fo
r Reh
abili
tatio
n an
d Re
sear
ch
90I
F009
9-02
-00
$6,0
73
Ins
titut
e fo
r Reh
abili
tatio
n an
d Re
sear
ch
18-
MS2
-017
$31,
043
I
nstit
ute
for R
ehab
ilita
tion
and
Rese
arch
7
6-01
7$1
4,46
8
The
acco
mpa
nyin
g no
tes a
re a
n in
tegr
al p
art o
f thi
s sch
edul
e.
B-225

Stat
e of
Mon
tana
Sche
dule
of E
xpen
ditu
res o
f Fed
eral
Aw
ards
For t
he F
isca
l Yea
r End
ed Ju
ne 3
0, 2
018
Rese
arch
and
Dev
elop
men
t Clu
ster
Amou
nt to
Sub
reci
pien
ts
Ex
pend
iture
s
Uni
vers
ity o
f Kan
sas
H1
33B1
1000
6$9
,322
U
nive
rsity
of K
ansa
s
FY20
17-0
48$1
6,86
3$1
14,1
51
93.6
32U
nive
rsity
Cen
ters
for E
xcel
lenc
e in
Dev
elop
men
tal D
isabi
litie
s Edu
catio
n, R
esea
rch,
and
Se
rvic
e
$5
14,1
50
Cent
ers f
or D
isea
se C
ontr
ol a
nd P
reve
ntio
n93
.136
Inju
ry P
reve
ntio
n an
d Co
ntro
l Res
earc
h an
d St
ate
and
Com
mun
ity B
ased
Pro
gram
s
$154
,678
$208
,846
93.2
62O
ccup
atio
nal S
afet
y an
d He
alth
Pro
gram
U
nive
rsity
of C
olor
ado
F
Y18.
347.
004
$4,9
15
93.4
24N
ON
-ACA
/PPH
F - B
uild
ing
Capa
city
of t
he P
ublic
Hea
lth S
yste
m to
Impr
ove
Popu
latio
n He
alth
th
roug
h N
atio
nal N
onpr
ofit
Org
aniza
tions
A
ssoc
iatio
n of
Mat
erna
l & C
hild
Hea
lth P
rogr
ams
1U
38O
T000
140-
03$1
1,90
7
Ass
ocia
tion
of M
ater
nal &
Chi
ld H
ealth
Pro
gram
s
0327
18-3
6A$1
69
Nat
iona
l Ass
ocia
tion
of C
hron
ic D
iseas
e Di
rect
ors
13
1201
8$9
,122
93.5
24Bu
ildin
g Ca
paci
ty o
f the
Pub
lic H
ealth
Sys
tem
to Im
prov
e Po
pula
tion
Heal
th th
roug
h N
atio
nal,
Non
-Pro
fit O
rgan
izatio
ns- f
inan
ced
in p
art b
y Pr
even
tion
and
Publ
ic H
ealth
Fun
ds (P
PHF)
N
atio
nal A
ssoc
iatio
n of
Chr
onic
Dise
ase
Dire
ctor
s
0942
016
$6,2
32
93.9
44Hu
man
Imm
unod
efic
ienc
y Vi
rus (
HIV)
/Acq
uire
d Im
mun
odef
icie
ncy
Viru
s Syn
drom
e (A
IDS)
Su
rvei
llanc
e
Ass
ocia
tion
of U
nive
rsity
Cen
ters
on
Disa
bilit
ies
$1
,286
Food
and
Dru
g Ad
min
istr
atio
n93
.103
Food
and
Dru
g Ad
min
istra
tion
Rese
arch
$48,
048
Heal
th R
esou
rces
and
Ser
vice
s Adm
inis
trat
ion
93.1
07Ar
ea H
ealth
Edu
catio
n Ce
nter
s
$409
,377
$560
,405
93.1
10M
ater
nal a
nd C
hild
Hea
lth F
eder
al C
onso
lidat
ed P
rogr
ams
Uta
h St
ate
Uni
vers
ity
PO
3388
76-E
REV
2$4
0
Uta
h St
ate
Uni
vers
ity
PO
3690
26-E
$4,9
2793
.157
Cent
ers o
f Exc
elle
nce
$193
,799
93.1
78N
ursin
g W
orkf
orce
Div
ersit
y
$7
8,47
393
.301
Smal
l Rur
al H
ospi
tal I
mpr
ovem
ent G
rant
Pro
gram
$269
,081
$446
,560
93.3
58Ad
vanc
ed E
duca
tion
Nur
sing
Trai
nees
hips
$2,1
7093
.359
Nur
se E
duca
tion,
Pra
ctic
e Q
ualit
y an
d Re
tent
ion
Gran
ts
$7
3,65
1$1
85,1
07
The
acco
mpa
nyin
g no
tes a
re a
n in
tegr
al p
art o
f thi
s sch
edul
e.
B-226

Stat
e of
Mon
tana
Sche
dule
of E
xpen
ditu
res o
f Fed
eral
Aw
ards
For t
he F
isca
l Yea
r End
ed Ju
ne 3
0, 2
018
Rese
arch
and
Dev
elop
men
t Clu
ster
Amou
nt to
Sub
reci
pien
ts
Ex
pend
iture
s93
.732
Men
tal a
nd B
ehav
iora
l Hea
lth E
duca
tion
and
Trai
ning
Gra
nts
$3
29,9
1393
.884
Gran
ts fo
r Prim
ary
Care
Tra
inin
g an
d En
hanc
emen
t
$58,
252
$418
,906
93.9
12Ru
ral H
ealth
Car
e Se
rvic
es O
utre
ach,
Rur
al H
ealth
Net
wor
k De
velo
pmen
t and
Sm
all H
ealth
Ca
re P
rovi
der Q
ualit
y Im
prov
emen
t Pro
gram
$37
93.9
13Gr
ants
to S
tate
s for
Ope
ratio
n of
Sta
te O
ffice
s of R
ural
Hea
lth
$1
82,1
8893
.969
PPHF
Ger
iatr
ic E
duca
tion
Cent
ers
$1
37,3
42$7
39,1
35In
dian
Hea
lth S
ervi
ce93
.933
Dem
onst
ratio
n Pr
ojec
ts fo
r Ind
ian
Heal
th
Bla
ckfe
et C
omm
unity
Col
lege
2
014-
01-M
SU$3
,904
F
ort P
eck
Com
mun
ity C
olle
ge
$4
,251
93.9
70He
alth
Pro
fess
ions
Rec
ruitm
ent P
rogr
am fo
r Ind
ians
$482
,641
Mis
cella
neou
s93
.RD
Misc
ella
neou
s Res
earc
h an
d De
velo
pmen
t
$416
,890
$1,5
51,6
56
Cel
l Sig
nalin
g Te
chno
logy
K
-002
052
$3,3
73
ICF
Inte
rnat
iona
l
17RW
SK00
07$1
33,3
66N
atio
nal I
nstit
utes
of H
ealth
93.1
13En
viro
nmen
tal H
ealth
$1,0
79,4
72$2
,864
,496
M
eado
wla
rk S
cien
ce a
nd E
duca
tion,
LLC
U
M_E
S01A
1$1
00,8
74
Mic
higa
n St
ate
Uni
vers
ity
RC1
0730
7MO
N$4
3,36
8
Scr
ipps
Res
earc
h In
stitu
te
5-5
2774
($62
6)
Scr
ipps
Res
earc
h In
stitu
te
5-5
3234
$71,
342
U
nive
rsity
of N
ew M
exic
o
3RY
74$6
4,03
493
.143
NIE
HS S
uper
fund
Haz
ardo
us S
ubst
ance
s_Ba
sic R
esea
rch
and
Educ
atio
n
$9
,211
93.1
72Hu
man
Gen
ome
Rese
arch
U
nive
rsity
of A
lask
a Fa
irban
ks
UAF
-18-
0068
$15,
012
93.2
13Re
sear
ch a
nd T
rain
ing
in C
ompl
emen
tary
and
Inte
grat
ive
Heal
th
$1
93,5
3593
.242
Men
tal H
ealth
Res
earc
h Gr
ants
$166
,040
U
nive
rsity
of W
ashi
ngto
n
UW
SC10
191
(BPO
2807
6)$2
7993
.273
Alco
hol R
esea
rch
Prog
ram
s
$58,
440
93.2
79Dr
ug A
buse
and
Add
ictio
n Re
sear
ch P
rogr
ams
$9
,290
Y
ale
Uni
vers
ity
M16
A122
53 (C
ON
-800
0042
6)$3
0,48
093
.286
Disc
over
y an
d Ap
plie
d Re
sear
ch fo
r Tec
hnol
ogic
al In
nova
tions
to Im
prov
e Hu
man
Hea
lth
$1
63,5
53$3
78,9
98
The
acco
mpa
nyin
g no
tes a
re a
n in
tegr
al p
art o
f thi
s sch
edul
e.
B-227

Stat
e of
Mon
tana
Sche
dule
of E
xpen
ditu
res o
f Fed
eral
Aw
ards
For t
he F
isca
l Yea
r End
ed Ju
ne 3
0, 2
018
Rese
arch
and
Dev
elop
men
t Clu
ster
Amou
nt to
Sub
reci
pien
ts
Ex
pend
iture
s93
.307
Min
ority
Hea
lth a
nd H
ealth
Disp
ariti
es R
esea
rch
$192
,248
$410
,722
93.3
50N
atio
nal C
ente
r for
Adv
anci
ng T
rans
latio
nal S
cien
ces
Uni
vers
ity o
f Was
hing
ton
9
827
BPO
2408
5$2
0,00
0
Uni
vers
ity o
f Was
hing
ton
U
WSC
997
9$3
4,37
993
.351
Rese
arch
Infr
astr
uctu
re P
rogr
ams
$9
50,5
1193
.361
Nur
sing
Rese
arch
M
edic
al C
olle
ge o
f Wisc
onsin
P
O 1
7594
46$2
2,37
493
.393
Canc
er C
ause
and
Pre
vent
ion
Rese
arch
$409
,736
93.8
37Ca
rdio
vasc
ular
Dise
ases
Res
earc
h
$5
7,28
6
Mou
nt S
inai
Sch
ool o
f Med
icin
e
025
5-78
75-4
609
($72
,502
)
Mou
nt S
inai
Sch
ool o
f Med
icin
e
025
5-78
85-4
609
$129
,999
93.8
38Lu
ng D
iseas
es R
esea
rch
$156
,870
93.8
47Di
abet
es, D
iges
tive,
and
Kid
ney
Dise
ases
Ext
ram
ural
Res
earc
h
$4
39,3
9893
.853
Extr
amur
al R
esea
rch
Prog
ram
s in
the
Neu
rosc
ienc
es a
nd N
euro
logi
cal D
isord
ers
$5
38,1
62$2
,365
,856
T
he Jo
hn B
Pie
rce
Labo
rato
ry
SU
BAW
ARD
NO
. 243
-A($
48)
Y
ale
Uni
vers
ity
M17
A125
90-G
R101
226
(800
0101
1)$1
58,5
2393
.855
Alle
rgy
and
Infe
ctio
us D
iseas
es R
esea
rch
$919
,987
$5,6
69,6
66
Har
vard
Uni
vers
ity
114
487-
5109
468
$8,5
48
Ind
iana
Uni
vers
ity
PO
1464
301
$332
,092
O
hio
Stat
e U
nive
rsity
U
T182
09$1
6,70
8
Pro
mili
ad B
ioph
arm
a In
c
R41
AI11
8104
$54,
752
S
orre
nto
Ther
apeu
tics,
Inc.
4
R42A
I098
182-
04($
554)
U
nive
rsity
of C
onne
ctic
ut
500
74$6
1,53
9
Uni
vers
ity o
f Con
nect
icut
K
FS #
5619
100,
498
14$1
37,9
74
Uni
vers
ity o
f Flo
rida
U
FDSP
0001
1787
$26,
201
U
nive
rsity
of K
entu
cky
3
0481
1172
7-15
-011
($6)
U
nive
rsity
of L
ouisv
ille
Rese
arch
Fou
ndat
ion,
Inc.
U
LRF
17-0
750-
01$3
57
Uni
vers
ity o
f Not
re D
ame
2
0295
3MSU
$212
,731
93.8
59Bi
omed
ical
Res
earc
h an
d Re
sear
ch T
rain
ing
$3,1
22,0
57$1
6,77
4,69
1
Mea
dow
lark
Sci
ence
and
Edu
catio
n, L
LC
UM
-OD0
1$1
9,34
0
Nor
thw
est I
ndia
n Co
llege
N
WIC
-SA2
4226
-MSU
$1,5
38
Rut
gers
, The
Sta
te U
nive
rsity
of N
ew Je
rsey
P
O 6
6326
8/SU
BAW
ARD
NO
022
2$9
5,10
6
The
acco
mpa
nyin
g no
tes a
re a
n in
tegr
al p
art o
f thi
s sch
edul
e.
B-228

Stat
e of
Mon
tana
Sche
dule
of E
xpen
ditu
res o
f Fed
eral
Aw
ards
For t
he F
isca
l Yea
r End
ed Ju
ne 3
0, 2
018
Rese
arch
and
Dev
elop
men
t Clu
ster
Amou
nt to
Sub
reci
pien
ts
Ex
pend
iture
s
Uni
vers
ity o
f Nev
ada,
Las
Veg
as
16-
746Q
-UM
T-BS
10-0
1$2
72
Uni
vers
ity o
f Nev
ada,
Las
Veg
as
18-
22Q
R-U
MT-
PG81
$60,
950
U
nive
rsity
of N
evad
a, L
as V
egas
1
8-22
QN
-UM
T-05
-BS
$45,
115
U
nive
rsity
of N
evad
a, L
as V
egas
1
8-22
QN
-MSU
-05-
BS$3
3,28
1
Uni
vers
ity o
f Nev
ada,
Las
Veg
as
17-
746Q
-UM
-PG5
5-00
$10,
581
U
nive
rsity
of N
evad
a, L
as V
egas
1
6-74
6Q-M
SU-B
S13-
01$3
00
Uni
vers
ity o
f Nev
ada,
Las
Veg
as
14-
747X
-C-0
1$1
,377
U
nive
rsity
of S
outh
ern
Calif
orni
a
744
7890
0$2
3,04
5
Uni
vers
ity o
f Was
hing
ton
U
WSC
9319
$162
,902
U
nive
rsity
of W
iscon
sin
766
K942
$33,
954
93.8
65Ch
ild H
ealth
and
Hum
an D
evel
opm
ent E
xtra
mur
al R
esea
rch
$2,4
91$5
65,9
88
Sta
nfor
d U
nive
rsity
6
0595
107-
4968
6$3
9
Uni
vers
ity o
f Virg
inia
G
B103
25 1
5180
2$5
4,53
293
.866
Agin
g Re
sear
ch
$2
6,50
0$9
4,02
4
Joh
ns H
opki
ns U
nive
rsity
2
0030
5047
2$1
8,70
3
Uni
vers
ity o
f Was
hing
ton
U
WSC
1003
0/BP
O26
347
$28,
879
93.8
67Vi
sion
Rese
arch
$284
,695
U
nive
rsity
of C
alifo
rnia
, Ber
kele
y
BB0
0966
134
$56,
703
93.8
79M
edic
al L
ibra
ry A
ssist
ance
I
nstit
ute
for R
ehab
ilita
tion
and
Rese
arch
1
8-N
LM-0
1$4
,142
Subs
tanc
e Ab
use
and
Men
tal H
ealth
Ser
vice
s Adm
inis
trat
ion
93.2
43Su
bsta
nce
Abus
e an
d M
enta
l Hea
lth S
ervi
ces P
roje
cts o
f Reg
iona
l and
Nat
iona
l Sig
nific
ance
$20,
833
$1,0
48,6
23
Com
mun
ity C
onne
ctio
ns
$3
3,07
8
Com
mun
ity Im
pact
Coa
litio
n
$2
9,92
3
Har
rison
Cou
nty
Fam
ily R
esou
rce
Net
wor
k
$2
9,70
9
Pot
omac
Hig
hlan
ds G
uild
$30,
060
P
rest
era
Cent
er
$2
9,49
5
Wes
tbro
ok H
ealth
Ser
vice
s
$29,
764
DEPA
RTM
ENT
OF
HEAL
TH A
ND
HUM
AN S
ERVI
CES
TOTA
L$4
3,16
6,20
2
The
acco
mpa
nyin
g no
tes a
re a
n in
tegr
al p
art o
f thi
s sch
edul
e.
B-229

Stat
e of
Mon
tana
Sche
dule
of E
xpen
ditu
res o
f Fed
eral
Aw
ards
For t
he F
isca
l Yea
r End
ed Ju
ne 3
0, 2
018
Rese
arch
and
Dev
elop
men
t Clu
ster
Amou
nt to
Sub
reci
pien
ts
Ex
pend
iture
sDE
PART
MEN
T O
F JU
STIC
EO
ffice
of J
ustic
e Pr
ogra
ms
16.5
60N
atio
nal I
nstit
ute
of Ju
stic
e Re
sear
ch, E
valu
atio
n, a
nd D
evel
opm
ent P
roje
ct G
rant
s
$31,
823
DEPA
RTM
ENT
OF
JUST
ICE
TOTA
L$3
1,82
3DE
PART
MEN
T O
F ST
ATE
Bure
au o
f Nea
r Eas
tern
Affa
irs19
.500
Mid
dle
East
Par
tner
ship
Initi
ativ
e
($
336)
G
eorg
etow
n U
nive
rsity
M
SU-G
R205
338/
S/N
EAAC
-17-
CA10
16$1
65,0
8919
.600
Bure
au o
f Nea
r Eas
tern
Affa
irs
Geo
rget
own
Uni
vers
ity
MSU
-GR2
0576
9$2
1,87
6Bu
reau
of E
duca
tiona
l and
Cul
tura
l Affa
irs19
.022
Educ
atio
nal a
nd C
ultu
ral E
xcha
nge
Prog
ram
s App
ropr
iatio
n O
vers
eas G
rant
s
I
nter
natio
nal R
esea
rch
& E
xcha
nges
Boa
rd
FY1
7-TE
A-M
SU-0
2$3
7,27
419
.408
Acad
emic
Exc
hang
e Pr
ogra
ms -
Tea
cher
s
I
nter
natio
nal R
esea
rch
& E
xcha
nges
Boa
rd
FY1
6-TE
A-M
SU-0
1($
3)
Int
erna
tiona
l Res
earc
h &
Exc
hang
es B
oard
F
Y17-
TEA-
MSU
-01
$161
,887
DEPA
RTM
ENT
OF
STAT
E TO
TAL
$385
,787
DEPA
RTM
ENT
OF
THE
INTE
RIO
RBu
reau
of I
ndia
n Af
fairs
and
Bur
eau
of In
dian
Edu
catio
n15
.034
Agric
ultu
re o
n In
dian
Lan
ds
$1
0,00
0$7
3,19
4Bu
reau
of L
and
Man
agem
ent
15.2
24Cu
ltura
l and
Pal
eont
olog
ical
Res
ourc
es M
anag
emen
t
$73,
156
K
autz
Env
ironm
enta
l Con
sulta
nts,
Inc.
K
AUTZ
17-
18$6
5,66
7
Soc
iety
for C
alifo
rnia
Arc
haeo
logy
$18,
427
15.2
25Re
crea
tion
and
Visit
or S
ervi
ces
$2
4,62
4
Uni
vers
ity o
f Ala
ska
Fairb
anks
U
AF 1
7-00
45$1
5,87
615
.228
BLM
Wild
land
Urb
an In
terf
ace
Com
mun
ity F
ire A
ssist
ance
$5,3
0015
.230
Inva
sive
and
Nox
ious
Pla
nt M
anag
emen
t
$26,
083
15.2
31Fi
sh, W
ildlif
e an
d Pl
ant C
onse
rvat
ion
Reso
urce
Man
agem
ent
$3
35,0
97
Wes
tern
Ass
ocia
tion
of F
ish &
Wild
life
Agen
cies
$52,
582
W
yom
ing
Gam
e an
d Fi
sh D
epar
tmen
t
0026
70$1
3,05
4
The
acco
mpa
nyin
g no
tes a
re a
n in
tegr
al p
art o
f thi
s sch
edul
e.
B-230

Stat
e of
Mon
tana
Sche
dule
of E
xpen
ditu
res o
f Fed
eral
Aw
ards
For t
he F
isca
l Yea
r End
ed Ju
ne 3
0, 2
018
Rese
arch
and
Dev
elop
men
t Clu
ster
Amou
nt to
Sub
reci
pien
ts
Ex
pend
iture
s15
.232
Wild
land
Fire
Res
earc
h an
d St
udie
s
$265
,631
U
nive
rsity
of C
alifo
rnia
, Riv
ersid
e
S-0
0077
0$1
6,68
5
Uta
h St
ate
Uni
vers
ity
200
588-
0000
1-29
4$1
2,24
215
.236
Envi
ronm
enta
l Qua
lity
and
Prot
ectio
n
$2
89,4
9315
.238
Chal
leng
e Co
st S
hare
$51,
359
Bure
au o
f Rec
lam
atio
n15
.517
Fish
and
Wild
life
Coor
dina
tion
Act
$4
,104
15.5
30W
ater
Con
serv
atio
n Fi
eld
Serv
ices
(WCF
S)
Far
mer
s Can
al C
ompa
ny o
f Gal
latin
Cou
nty
R
17AP
0032
5$3
4,47
8M
isce
llane
ous
15.R
DM
iscel
lane
ous R
esea
rch
and
Deve
lopm
ent
$1
09,4
33N
atio
nal P
ark
Serv
ice
15.9
15Te
chni
cal P
rese
rvat
ion
Serv
ices
$174
,685
15.9
26Am
eric
an B
attle
field
Pro
tect
ion
$4,9
7515
.945
Coop
erat
ive
Rese
arch
and
Tra
inin
g Pr
ogra
ms -
Res
ourc
es o
f the
Nat
iona
l Par
k Sy
stem
$2,1
54$9
26,6
22
Uni
vers
ity o
f Wyo
min
g
100
3410
D-M
SU$8
9
Uni
vers
ity o
f Wyo
min
g-N
atio
nal P
ark
Serv
ice
(UW
-NPS
) Res
earc
h St
atio
n
100
3410
C-M
SU$5
,001
Offi
ce o
f Sur
face
Min
ing,
Rec
lam
atio
n an
d En
forc
emen
t15
.250
Regu
latio
n of
Sur
face
Coa
l Min
ing
and
Surf
ace
Effe
cts o
f Und
ergr
ound
Coa
l Min
ing
$238
,398
15.2
55Sc
ienc
e an
d Te
chno
logy
Pro
ject
s Rel
ated
to C
oal M
inin
g an
d Re
clam
atio
n
$5
9,76
4U
.S. F
ish
and
Wild
life
Serv
ice
15.6
05Sp
ort F
ish R
esto
ratio
n
$3
7,71
7
Wyo
min
g Ga
me
and
Fish
Dep
artm
ent
00
2243
$32,
422
15.6
08Fi
sh a
nd W
ildlif
e M
anag
emen
t Ass
istan
ce
$1
21,5
6515
.611
Wild
life
Rest
orat
ion
and
Basic
Hun
ter E
duca
tion
$1,3
98,7
07
Ida
ho D
epar
tmen
t of F
ish a
nd G
ame
ID
FG-M
A-20
1510
29-P
OP
$181
,572
I
daho
Dep
artm
ent o
f Fish
and
Gam
e
IDFG
-MA-
2015
1029
$44,
369
I
daho
Dep
artm
ent o
f Fish
and
Gam
e
IDFG
-MA-
2015
1029
SHE
EP$3
,822
I
daho
Dep
artm
ent o
f Fish
and
Gam
e
IDFG
-MA-
2015
1029
PRE
Y$2
3,89
7
Ken
tuck
y De
part
men
t of F
ish &
Wild
life
Reso
urce
s
PON
2 66
0 17
0000
1465
$73,
029
M
issou
ri De
part
men
t of C
onse
rvat
ion
3
77-B
$6,4
91
The
acco
mpa
nyin
g no
tes a
re a
n in
tegr
al p
art o
f thi
s sch
edul
e.
B-231

Stat
e of
Mon
tana
Sche
dule
of E
xpen
ditu
res o
f Fed
eral
Aw
ards
For t
he F
isca
l Yea
r End
ed Ju
ne 3
0, 2
018
Rese
arch
and
Dev
elop
men
t Clu
ster
Amou
nt to
Sub
reci
pien
ts
Ex
pend
iture
s
Miss
ouri
Depa
rtm
ent o
f Con
serv
atio
n
369
-B$9
1,22
6
Nor
th D
akot
a Ga
me
and
Fish
Dep
artm
ent
W
-68-
R-3
$15,
992
S
tate
of C
olor
ado
1
7-IG
A-94
119
$38,
615
U
nive
rsity
of M
issou
ri
C00
0477
58-1
$59,
777
U
nive
rsity
of M
issou
ri
C00
0524
12-1
$32,
751
15.6
15Co
oper
ativ
e En
dang
ered
Spe
cies
Con
serv
atio
n Fu
nd
$7
,636
15.6
34St
ate
Wild
life
Gran
ts
$6
7,46
615
.637
Mig
rato
ry B
ird Jo
int V
entu
res
$1
39,6
7115
.650
Rese
arch
Gra
nts (
Gene
ric)
$2
25,2
18
Uni
vers
ity o
f Cal
iforn
ia, S
anta
Cru
z
S018
3989
$415
.654
Nat
iona
l Wild
life
Refu
ge S
yste
m E
nhan
cem
ents
$284
15.6
55M
igra
tory
Bird
Mon
itorin
g, A
sses
smen
t and
Con
serv
atio
n
$6
8,42
215
.657
Enda
nger
ed S
peci
es C
onse
rvat
ion
- Rec
over
y Im
plem
enta
tion
Fund
s
$410
,568
15.6
60En
dang
ered
Spe
cies
- Ca
ndid
ate
Cons
erva
tion
Actio
n Fu
nds
$7
3,65
215
.663
Nat
iona
l Fish
and
Wild
life
Foun
datio
n
Nat
iona
l Fish
and
Wild
life
Foun
datio
n
010
3.13
.038
862
$53,
756
$72,
092
T
he N
atur
e Co
nser
vanc
y
MTF
O07
0117
_NK
$7,6
7615
.670
Adap
tive
Scie
nce
$7,2
87$8
8,97
615
.678
Coop
erat
ive
Ecos
yste
m S
tudi
es U
nits
$240
,391
U.S
. Geo
logi
cal S
urve
y15
.805
Assis
tanc
e to
Sta
te W
ater
Res
ourc
es R
esea
rch
Inst
itute
s
$95,
490
15.8
07Ea
rthq
uake
Haz
ards
Pro
gram
Ass
istan
ce
$1
4,12
715
.808
U.S
. Geo
logi
cal S
urve
y Re
sear
ch a
nd D
ata
Colle
ctio
n
$3
97,4
6515
.810
Nat
iona
l Coo
pera
tive
Geol
ogic
Map
ping
$199
,310
15.8
12Co
oper
ativ
e Re
sear
ch U
nits
$131
,799
V
irgin
ia T
ech
4
4600
7-19
890
$5,6
8315
.814
Nat
iona
l Geo
logi
cal a
nd G
eoph
ysic
al D
ata
Pres
erva
tion
$39,
915
15.8
15N
atio
nal L
and
Rem
ote
Sens
ing
Educ
atio
n O
utre
ach
and
Rese
arch
A
mer
icaV
iew
Inc
A
V13-
MT0
1$2
5,50
315
.819
Ener
gy C
oope
rativ
es to
Sup
port
the
Nat
iona
l Ene
rgy
Reso
urce
s Dat
a Sy
stem
$243
The
acco
mpa
nyin
g no
tes a
re a
n in
tegr
al p
art o
f thi
s sch
edul
e.
B-232

Stat
e of
Mon
tana
Sche
dule
of E
xpen
ditu
res o
f Fed
eral
Aw
ards
For t
he F
isca
l Yea
r End
ed Ju
ne 3
0, 2
018
Rese
arch
and
Dev
elop
men
t Clu
ster
Amou
nt to
Sub
reci
pien
ts
Ex
pend
iture
s15
.820
Nat
iona
l and
Reg
iona
l Clim
ate
Adap
tatio
n Sc
ienc
e Ce
nter
s
C
olor
ado
Stat
e U
nive
rsity
G
-521
23-0
1$7
4,98
0
Col
orad
o St
ate
Uni
vers
ity
G-0
6108
-1/G
14AP
0018
1$7
6,92
7
Col
orad
o St
ate
Uni
vers
ity
G-5
0003
-1$5
1,92
4
Uni
vers
ity o
f Was
hing
ton
U
WSC
1009
7/BP
#271
33$2
8,86
515
.980
Nat
iona
l Gro
und-
Wat
er M
onito
ring
Net
wor
k
$1
3,11
0
DEPA
RTM
ENT
OF
THE
INTE
RIO
R TO
TAL
$7,6
15,3
68DE
PART
MEN
T O
F TR
ANSP
ORT
ATIO
NFe
dera
l Avi
atio
n Ad
min
istr
atio
n20
.109
Air T
rans
port
atio
n Ce
nter
s of E
xcel
lenc
e
$3
1,16
1Fe
dera
l Hig
hway
Adm
inis
trat
ion
20.2
00Hi
ghw
ay R
esea
rch
and
Deve
lopm
ent P
rogr
am
$4
33,4
47$9
48,2
41
Cal
iforn
ia D
epar
tmen
t of T
rans
port
atio
n
65A
0604
$65,
265
C
alifo
rnia
Dep
artm
ent o
f Tra
nspo
rtat
ion
6
5A06
14$3
2,36
5
Cal
iforn
ia D
epar
tmen
t of T
rans
port
atio
n
65A
0550
$12,
809
C
alifo
rnia
Dep
artm
ent o
f Tra
nspo
rtat
ion
6
5A06
06$2
3,05
8
Cal
iforn
ia S
tate
Uni
vers
ity, L
ong
Beac
h
SG1
9941
6100
$101
,821
I
daho
Dep
artm
ent o
f Tra
nspo
rtat
ion
2
016-
01$8
,820
M
aine
Dep
artm
ent o
f Tra
nspo
rtat
ion
0
1758
2.18
$6,0
11
Min
neso
ta D
epar
tmen
t of T
rans
port
atio
n
100
3322
WO
RK O
RDER
NO
. 2$5
,988
M
inne
sota
Dep
artm
ent o
f Tra
nspo
rtat
ion
1
0033
22 W
ORK
ORD
ER N
O. 1
$10,
187
N
atio
nal A
cade
mie
s of S
cien
ce
HR
17-6
9 SU
B000
0545
$178
$75
N
ebra
ska
Depa
rtm
ent o
f Roa
ds
SPR
-1(1
6) 0
0730
G$1
,529
S
outh
Dak
ota
Depa
rtm
ent o
f Tra
nspo
rtat
ion
3
1128
0 SD
2016
-03
$19,
901
W
ashi
ngto
n St
ate
Depa
rtm
ent o
f Tra
nspo
rtat
ion
T
6737
TAS
K 07
$10,
231
W
ashi
ngto
n St
ate
Depa
rtm
ent o
f Tra
nspo
rtat
ion
T
6737
TAS
K 09
$10,
772
W
ashi
ngto
n St
ate
Depa
rtm
ent o
f Tra
nspo
rtat
ion
T
6737
TAS
K 10
$15,
690
W
ashi
ngto
n St
ate
Depa
rtm
ent o
f Tra
nspo
rtat
ion
T
6737
TAS
K 11
$26,
094
20.2
05Hi
ghw
ay P
lann
ing
and
Cons
truc
tion
$1,4
56,1
19
Iow
a De
part
men
t of T
rans
port
atio
n
TPF
-5(2
90) C
ON
TRAC
T 17
997
($2,
104)
($3,
029)
The
acco
mpa
nyin
g no
tes a
re a
n in
tegr
al p
art o
f thi
s sch
edul
e.
B-233

Stat
e of
Mon
tana
Sche
dule
of E
xpen
ditu
res o
f Fed
eral
Aw
ards
For t
he F
isca
l Yea
r End
ed Ju
ne 3
0, 2
018
Rese
arch
and
Dev
elop
men
t Clu
ster
Amou
nt to
Sub
reci
pien
ts
Ex
pend
iture
s
Mar
ylan
d De
part
men
t of T
rans
port
atio
n
P01
814
X-1
$22,
071
M
inne
sota
Dep
artm
ent o
f Tra
nspo
rtat
ion
1
0023
06$3
8,45
6$1
54,6
53
Sou
th D
akot
a De
part
men
t of T
rans
port
atio
n
SD2
014-
13($
111)
S
outh
ern
Illin
ois U
nive
rsity
7
6710
5-00
2 PO
120
118
($5,
462)
W
yom
ing
Depa
rtm
ent o
f Tra
nspo
rtat
ion
R
S102
16($
3,02
1)N
atio
nal H
ighw
ay T
raffi
c Sa
fety
Adm
inis
trat
ion
20.6
09Sa
fety
Bel
t Per
form
ance
Gra
nts
Virg
inia
Tec
h
451
263-
1906
0$1
8,26
920
.616
Nat
iona
l Prio
rity
Safe
ty P
rogr
ams
Was
hing
ton
Traf
fic S
afet
y Co
mm
issio
n
$1
74,3
94O
ffice
of t
he S
ecre
tary
20.7
01U
nive
rsity
Tra
nspo
rtat
ion
Cent
ers P
rogr
am
$5
91,7
42$1
,141
,708
U
nive
rsity
of A
lask
a Fa
irban
ks
UAF
14-
0098
FP4
2825
$5,5
00$1
17,4
87Pi
pelin
e an
d Ha
zard
ous M
ater
ials
Saf
ety
Adm
inis
trat
ion
20.7
24Pi
pelin
e Sa
fety
Res
earc
h Co
mpe
titiv
e Ac
adem
ic A
gree
men
t Pro
gram
(CAA
P)
Rut
gers
, The
Sta
te U
nive
rsity
of N
ew Je
rsey
0
0005
805
PO 4
4964
6$4
DEPA
RTM
ENT
OF
TRAN
SPO
RTAT
ION
TO
TAL
$4,4
03,1
00DE
PART
MEN
T O
F TR
EASU
RYCo
mm
unity
Dev
elop
men
t Fin
anci
al In
stitu
tions
21.0
20Co
mm
unity
Dev
elop
men
t Fin
anci
al In
stitu
tions
Pro
gram
$41,
687
DEPA
RTM
ENT
OF
TREA
SURY
TO
TAL
$41,
687
ENVI
RON
MEN
TAL
PRO
TECT
ION
AGE
NCY
66.2
02Co
ngre
ssio
nally
Man
date
d Pr
ojec
ts
Ida
ho D
epar
tmen
t of E
nviro
nmen
tal Q
ualit
y
K19
6$5
,422
I
daho
Dep
artm
ent o
f Env
ironm
enta
l Qua
lity
5
574
$18,
654
66.4
54W
ater
Qua
lity
Man
agem
ent P
lann
ing
C
lark
For
k Co
aliti
on
215
006
$11,
053
66.4
61Re
gion
al W
etla
nd P
rogr
am D
evel
opm
ent G
rant
s
$236
,099
66.5
00En
viro
nmen
tal P
rote
ctio
n: C
onso
lidat
ed R
esea
rch
P
egas
us T
echn
ical
Ser
vice
s, In
c.
MO
NTT
-18-
001
$5,9
20
The
acco
mpa
nyin
g no
tes a
re a
n in
tegr
al p
art o
f thi
s sch
edul
e.
B-234

Stat
e of
Mon
tana
Sche
dule
of E
xpen
ditu
res o
f Fed
eral
Aw
ards
For t
he F
isca
l Yea
r End
ed Ju
ne 3
0, 2
018
Rese
arch
and
Dev
elop
men
t Clu
ster
Amou
nt to
Sub
reci
pien
ts
Ex
pend
iture
s66
.509
Scie
nce
To A
chie
ve R
esul
ts (S
TAR)
Res
earc
h Pr
ogra
m
Litt
le B
ig H
orn
Colle
ge
$5
3,05
6
Uni
vers
ity o
f New
Mex
ico
3
RAW
5 / 8
3615
701
$30,
469
U
nive
rsity
of N
ew M
exic
o
3RA
W5
$7,4
55
66.5
10Su
rvey
s, S
tudi
es, I
nves
tigat
ions
and
Spe
cial
Pur
pose
Gra
nts w
ithin
the
Offi
ce o
f Res
earc
h an
d De
velo
pmen
t
P
egas
us T
echn
ical
Ser
vice
s, In
c.
#M
ON
TS-1
8-00
1$3
,042
66.7
16Re
sear
ch, D
evel
opm
ent,
Mon
itorin
g, P
ublic
Edu
catio
n, O
utre
ach,
Tra
inin
g, D
emon
stra
tions
, an
d St
udie
s
$14,
183
Mis
cella
neou
s66
.RD
Misc
ella
neou
s Res
earc
h an
d De
velo
pmen
t
$143
ENVI
RON
MEN
TAL
PRO
TECT
ION
AG
ENCY
TO
TAL
$385
,496
INST
ITU
TE O
F M
USE
UM
AN
D LI
BRAR
Y SE
RVIC
ES45
.312
Nat
iona
l Lea
ders
hip
Gran
ts
$2
,606
45.3
13La
ura
Bush
21s
t Cen
tury
Lib
raria
n Pr
ogra
m
$1
8,01
8
INST
ITU
TE O
F M
USE
UM
AN
D LI
BRAR
Y SE
RVIC
ES T
OTA
L$2
0,62
4N
ATIO
NAL
AER
ON
AUTI
CS A
ND
SPAC
E AD
MIN
ISTR
ATIO
N43
.007
Spac
e O
pera
tions
$14,
592
43.0
12Sp
ace
Tech
nolo
gy
$3
,290
43.0
01Sc
ienc
e
$5
53,5
96$3
,452
,432
A
rizon
a St
ate
Uni
vers
ity
16-
005
$67,
317
C
alifo
rnia
Inst
itute
of T
echn
olog
y - J
et P
ropu
lsion
Lab
1
5871
31$1
3,10
8
Geo
rgia
Inst
itute
of T
echn
olog
y
RH8
09-0
3$3
91,8
82
Gla
cige
n M
ater
ials,
Inc.
$25,
025
L
ockh
eed
Mar
tin C
orpo
ratio
n
810
0002
702
$326
,604
L
ockh
eed
Mar
tin C
orpo
ratio
n
PO
410
3399
182
$14,
562
N
atur
e Co
nser
vanc
y
SCI
NAS
A201
711
$30,
512
P
rince
ton
Uni
vers
ity
SU
B000
0148
$54,
656
S
ETI I
nstit
ute
S
C 31
18$4
3,44
7
The
acco
mpa
nyin
g no
tes a
re a
n in
tegr
al p
art o
f thi
s sch
edul
e.
B-235

Stat
e of
Mon
tana
Sche
dule
of E
xpen
ditu
res o
f Fed
eral
Aw
ards
For t
he F
isca
l Yea
r End
ed Ju
ne 3
0, 2
018
Rese
arch
and
Dev
elop
men
t Clu
ster
Amou
nt to
Sub
reci
pien
ts
Ex
pend
iture
s
Sm
ithso
nian
Ast
roph
ysic
al O
bser
vato
ry
GO
5-16
091B
$22,
468
S
mith
soni
an A
stro
phys
ical
Obs
erva
tory
G
O4-
1509
8B$2
8,92
0
Sm
ithso
nian
Ast
roph
ysic
al O
bser
vato
ry
SV7
-770
03$1
70,7
56
Sou
th D
akot
a St
ate
Uni
vers
ity
3TB
481
$2,0
00
Sou
thw
est R
esea
rch
Inst
itute
K
9908
1KJ
$37,
790
S
outh
wes
t Res
earc
h In
stitu
te
H99
053C
O$1
13,2
74
Spa
ce T
eles
cope
Sci
ence
Inst
itute
H
ST-G
O-1
4047
.005
-A$4
,564
S
pace
Tel
esco
pe S
cien
ce In
stitu
te
HST
-GO
-125
84.0
06A
$18,
334
S
tott
ler H
enke
Ass
ocia
tes,
Inc.
$36,
987
U
nive
rsity
Cor
pora
tion
for A
tmos
pher
ic R
esea
rch
S
UBA
WD0
0012
5$2
5,73
9
Uni
vers
ity o
f Ala
ska
U
AF 1
8-00
82$4
8,58
4
Uni
vers
ity o
f Cal
iforn
ia, B
erke
ley
S
A186
8-26
308P
G; B
B000
9055
5$2
5,46
7
Uni
vers
ity o
f Cal
iforn
ia, I
rvin
e
201
6-33
48$2
4,36
3
Uni
vers
ity o
f Col
orad
o De
nver
1
5526
10 /
NN
A15B
B02A
$66,
792
U
nive
rsity
of M
aryl
and
3
TB43
2$4
8
Uni
vers
ity o
f Sou
ther
n Ca
lifor
nia
5
5747
174
$128
,751
U
nive
rsity
of W
ashi
ngto
n
UW
SC88
79/B
PO13
182
$12,
980
U
nive
rsity
of W
ashi
ngto
n
UW
SC88
79/B
PA13
182
$133
,061
U
nive
rsity
of W
iscon
sin
756
K954
$63,
454
U
SDA
Rock
y M
ount
ain
Rese
arch
Sta
tion
1
5-JV
-112
2163
7-05
1$4
0,40
5
Wild
life
Cons
erva
tion
Soci
ety
S
ERDP
1105
15-2
17$1
95,8
6943
.008
Educ
atio
n
$6
6,03
0$1
,375
,188
43.0
09Cr
oss A
genc
y Su
ppor
t
$182
,871
Mis
cella
neou
s43
.RD
Misc
ella
neou
s Res
earc
h an
d De
velo
pmen
t
C
alifo
rnia
Inst
itute
of T
echn
olog
y - J
et P
ropu
lsion
Lab
1
4221
20$4
4,69
6
NAT
ION
AL A
ERO
NAU
TICS
AN
D SP
ACE
ADM
INIS
TRAT
ION
TO
TAL
$7,2
40,7
88N
ATIO
NAL
EN
DOW
MEN
T FO
R TH
E HU
MAN
ITIE
S45
.161
Prom
otio
n of
the
Hum
aniti
es R
esea
rch
$52,
096
NAT
ION
AL E
NDO
WM
ENT
FOR
THE
HUM
ANIT
IES
TOTA
L$5
2,09
6
The
acco
mpa
nyin
g no
tes a
re a
n in
tegr
al p
art o
f thi
s sch
edul
e.
B-236

Stat
e of
Mon
tana
Sche
dule
of E
xpen
ditu
res o
f Fed
eral
Aw
ards
For t
he F
isca
l Yea
r End
ed Ju
ne 3
0, 2
018
Rese
arch
and
Dev
elop
men
t Clu
ster
Amou
nt to
Sub
reci
pien
ts
Ex
pend
iture
sN
ATIO
NAL
SCI
ENCE
FO
UN
DATI
ON
47.0
41En
gine
erin
g Gr
ants
$6,8
69$1
,726
,924
Y
ale
Uni
vers
ity
GR1
0266
7 (C
ON
-800
0127
)$6
,358
47.0
49M
athe
mat
ical
and
Phy
sical
Sci
ence
s
$2,1
96,9
92
Ass
ocia
tion
of U
nive
rsiti
es fo
r Res
earc
h in
Ast
rono
my
N
8746
3C$1
43,7
58
S2
Corp
orat
ion
S
2-13
3088
0-13
-03
$24,
309
U
nive
rsity
of W
est G
eorg
ia
111
554A
UM
$8,2
08
Uni
vers
ity W
iscon
sin-M
ilwau
kee
1
5340
5537
$52,
472
47.0
50Ge
osci
ence
s
$154
,993
$2,7
62,0
63
Geo
rge
Was
hing
ton
Uni
vers
ity
14-
S17
$62,
517
S
outh
Dak
ota
Scho
ol o
f Min
es
MSU
17-
22$1
0,33
0
Uni
vers
ity o
f Col
orad
o De
nver
1
5553
38-P
O 1
0008
5693
1$1
8,71
5
Uni
vers
ity o
f Col
orad
o De
nver
1
5553
37/P
O#1
0008
5530
8$1
62,1
96
Uni
vers
ity o
f Haw
aii a
t Man
oa
MA1
3002
9/M
A113
1$6
0,61
8
Uni
vers
ity o
f Kan
sas
FY
2018
-050
$5,6
81
Uni
vers
ity o
f Ten
ness
ee
A17
-012
4-S0
01$7
,034
W
oods
Hol
e O
cean
ogra
phic
Inst
itutio
n
A10
1357
$58,
425
47.0
70Co
mpu
ter a
nd In
form
atio
n Sc
ienc
e an
d En
gine
erin
g
$4
,261
$479
,322
U
nive
rsity
of N
orth
Tex
as
GF3
0041
-1$1
3,71
047
.074
Biol
ogic
al S
cien
ces
$1
90,5
79$4
,791
,742
A
rizon
a St
ate
Uni
vers
ity
18-
450
$3,1
73
Car
y In
stitu
te o
f Eco
syst
em S
tudi
es
334
0-20
0201
873
$3,4
45
Uni
vers
ity o
f Col
orad
o
155
4533
$67,
553
U
nive
rsity
of F
lorid
a
UFO
ER00
0115
11($
16)
U
SDA
Rock
y M
ount
ain
Rese
arch
Sta
tion
1
6-JV
-112
2163
3-02
9$5
4,67
9
Was
hing
ton
Stat
e U
nive
rsity
1
1899
6_G0
0335
7$2
00,8
6747
.075
Soci
al, B
ehav
iora
l, an
d Ec
onom
ic S
cien
ces
$2
96,2
83
Ohi
o St
ate
Uni
vers
ity
600
5942
5, P
O R
F015
0071
2$2
0,38
8
Tuf
ts U
nive
rsity
A
1300
01$8
9447
.076
Educ
atio
n an
d Hu
man
Res
ourc
es
$1
37,7
11$3
,048
,567
A
aniii
h N
akod
a Co
llege
M
SU-3
753/
01$5
1,78
2
Chi
ef D
ull K
nife
Col
lege
1
3615
22$2
,355
The
acco
mpa
nyin
g no
tes a
re a
n in
tegr
al p
art o
f thi
s sch
edul
e.
B-237

Stat
e of
Mon
tana
Sche
dule
of E
xpen
ditu
res o
f Fed
eral
Aw
ards
For t
he F
isca
l Yea
r End
ed Ju
ne 3
0, 2
018
Rese
arch
and
Dev
elop
men
t Clu
ster
Amou
nt to
Sub
reci
pien
ts
Ex
pend
iture
s
Col
orad
o St
ate
Uni
vers
ity
967
02-5
$98,
106
G
eorg
e M
ason
Uni
vers
ity
E20
3319
1$4
3,92
2
Mat
hem
atic
al A
ssoc
iatio
n of
Am
eric
a
MAA
3-8
-710
-891
$110
,716
M
ichi
gan
Stat
e U
nive
rsity
R
C104
101M
ON
TAN
A$5
0,21
8
Sal
ish K
oote
nia
Colle
ge
SAG
-18-
UO
M-0
01$2
,884
S
alish
Koo
teni
a Co
llege
H
RD-1
2627
79$1
3,76
047
.078
Pola
r Pro
gram
s
$321
,731
U
nive
rsity
of C
olor
ado
Denv
er
SPO
100
0046
125/
1548
197
$1,8
0747
.079
Offi
ce o
f Int
erna
tiona
l Sci
ence
and
Eng
inee
ring
$264
,553
47.0
80O
ffice
of C
yber
infr
astr
uctu
re
$3
8,92
7$2
,834
,028
47.0
83O
ffice
of I
nteg
rativ
e Ac
tiviti
es
$1
,073
,363
$2,3
00,1
41
Sou
th D
akot
a Sc
hool
of M
ines
S
DSM
T-M
SU 1
8-04
$247
,094
T
rust
ees o
f Dar
tmou
th C
olle
ge
R89
6/R8
97/1
6327
38$1
64,3
49
Uni
vers
ity o
f Sou
ther
n Ca
lifor
nia
8
7383
750/
PO#1
0558
532
$46,
887
NAT
ION
AL S
CIEN
CE F
OU
NDA
TIO
N T
OTA
L$2
2,84
1,54
0SM
ALL
BUSI
NES
S AD
MIN
ISTR
ATIO
N59
.058
Fede
ral a
nd S
tate
Tec
hnol
ogy
Part
ners
hip
Prog
ram
D
efen
se A
llian
ce o
f Min
neso
ta
$1
0,12
1
SMAL
L BU
SIN
ESS
ADM
INIS
TRAT
ION
TO
TAL
$10,
121
RESE
ARCH
AN
D DE
VELO
PMEN
T CL
UST
ER T
OTA
L$1
34,6
85,3
26
SCHE
DULE
OF
EXPE
NDI
TURE
S O
F FE
DERA
L AW
ARDS
TO
TAL
$3,9
23,4
75,7
95
The
acco
mpa
nyin
g no
tes a
re a
n in
tegr
al p
art o
f thi
s sch
edul
e.
B-238

STATE OF MONTANA NOTES TO THE SCHEDULE OF EXPENDITURES OF FEDERAL AWARDS
FOR THE FISCAL YEAR ENDED JUNE 30, 2018 Note 1. Summary of Significant Accounting Policies
Basis of Presentation
The accompanying Schedule of Expenditures of Federal Awards includes the federal award activity of the state of Montana under programs of the federal government for the fiscal year ended June 30, 2018. The information in this schedule is presented in accordance with the requirements of Title 2 U.S. Code of Federal Regulations Part 200, Uniform Administrative Requirements, Cost Principles, and Audit Requirements for Federal Awards (referred to as the “Uniform Guidance”), and where applicable, Office of Management and Budget Circular A-133 requirements. Because this schedule presents only a selected portion of the operations of the state of Montana, it is not intended to, and does not present, the financial positions, change in net assets, or, where applicable, its cash flows for the fiscal year ended June 30, 2018.
Significant Accounting Policies
Expenditures shown on the Schedule of Expenditures of Federal Awards are reported on the modified accrual basis of accounting, except as noted below. Under the modified accrual basis of accounting, expenditures are generally recorded in the accounting period in which the liability is incurred. However, there are some payments, such as compensated absences, that are only recorded when the payment is due. Such expenditures are recognized following the cost principles contained in the Uniform Guidance, OMB Circular A-87, or other costs circulars wherein certain types of expenditures are not allowed or are limited as to reimbursement. Negative amounts shown on the schedule represent adjustments or credits made in the normal course of business to amounts reported as expenditures in prior years. The Montana University System uses full accrual accounting to report campus federal expenditure activity. The Unemployment Insurance, Section 8 Voucher, and Section 8 Project-Based programs are accounted for as enterprise fund activity. Enterprise funds also use the full accrual basis of accounting. Under the full accrual basis of accounting, expenditures are recorded when a liability is incurred, regardless of the timing of the related cash flows. Loan and Loan Guarantee Programs (Note 2), Federal Excess Personal Property (Note 7), and the Department of Defense Firefighting Property (Note 8) are presented using
B-239

the basis of accounting described in each note. The Books for the Blind and Physically Handicapped Program (Note 9) is not presented on the Schedule of Expenditures of Federal Awards but is provided as additional information regarding the types of other federal assistance received by the state as part of this federal program. The state of Montana did not elect to use the 10% de minimis indirect cost rate allowed under the Uniform Guidance. Food Distribution Program The amount reported for Food Distribution programs (CFDA #10.555, #10.565, #10.567, #10.569, and #93.053) represents the dollar value of food commodities distributed to eligible recipients during the year. The U.S. Department of Agriculture provides the current value of the commodities used by the state to compute the amount reported. The amount of funds received to administer the program is also included in the reported amount. Montana also distributes food commodities to other states in the western region of the United States. During fiscal year 2018, Montana distributed $1,065,199 of food commodities under CFDA #10.567 to other states.
The state of Montana distributed $10,377,199 in commodities in fiscal year 2018. The value at June 30, 2018 of commodities stored at the state’s warehouse is $2,125,151, for which the state is liable in the event of loss. The state has insurance to cover this liability. Minority Health and Health Disparities Research The amount reported for the Minority Health and Health Disparities Research Program (CFDA #93.307) includes endowment funds of $9,375,000, along with interest earned on the endowment. The entire endowment amount is reported as expended each year, as the funds are restricted for the life of the endowment. Immunization Cooperative Agreements
The amount reported for the Immunization Cooperative Agreements (CFDA #93.268) includes the dollar value of vaccine doses received during fiscal year 2018. The state used the Centers for Disease Control’s price list to calculate the value of doses received. During fiscal year 2018, Montana received 197,502 vaccine doses valued at $10,632,121.
Note 2. Loan and Loan Guarantee Programs
The following loan and loan guarantee programs are reported on the Schedule of Expenditures of Federal Awards at their July 1, 2017 beginning loan balance plus the amount of any interest subsidy, cash, or administrative cost allowance received during fiscal year 2018:
B-240

CFDA # Federal Loan/Loan Guarantee ProgramState Revolving Loans
FY 2018 Ending Balance
66.458 Capitalization Grants for Clean Water State Revolving Funds 276,904,783$
66.468 Capitalization Grants for Drinking Water State Revolving Funds 160,334,652$
Total State Revolving Loan Programs 437,239,435$
CFDA # Federal Loan/Loan Guarantee ProgramStudent Financial Assistance
FY 2018 Ending Balance
Guarantee Agency Loans
84.032 Federal Family Education Loans $0
University Loans
84.038 Federal Perkins Loan Program $32,876,467
93.364 Nursing Student Loans $2,401,844
93.264 Nurse Faculty Loan Program $11,249
93.342 Health Professions Student Loans $214,801
Total Student Financial Assistance Programs $35,504,361
Federal Family Education Loans
The Montana Guaranteed Student Loan Program (MGSLP) guaranteed no new loans for the Federal Family Education Loans Program (CFDA #84.032) during fiscal year 2018. At the beginning of fiscal year 2018, the loan balance was $59,296,580. Effective October 1, 2017, the loan servicing portion of the MGSLP was transferred to a federally approved national education loan servicing provider. The amount transferred at September 30, 2017 was $64,643,273, which included $53,516,103 in principal and interest and $11,127,170 in borrower collection costs. Because of this transfer, the outstanding loan balance (including principal, accrued interest, and collection costs) of loans guaranteed in previous years, for which the federal government has imposed continuing compliance requirements, was $0 at June 30, 2018. Perkins Loan Programs Under the Perkins Loan Extension Act of 2015, universities participating in this program are no longer permitted to make Perkins Loan disbursements after June 30, 2018. Institutions may choose to continue servicing their existing Perkins Loans until such
B-241

time the institution’s outstanding loans have been paid or full or otherwise retired. Both Montana State University and the University of Montana have chosen to continue to service their current loans. See also Note 14. Economic Adjustment Assistance Program
The Economic Adjustment Assistance Program (CFDA #11.307) consists of two separate awards which are reported on the Schedule of Expenditures of Federal Awards at their June 30, 2018 ending loan balances. The amount of loans outstanding as of June 30, 2018 is $370,958 for award number 05-19-02445 and $2,677,370 for award number 05-79-73005. The calculation for each of these loan balances is as follows:
Award Number: 05-19-02445State Name = EDA Revolving LoanFederal Grantor = US Department of CommerceFederal Program Name = Title IX SSED Revolving Loan FundFederal Catalog Number = 11.307
RLF Loan Balance FYE 2018 360,714$ Cash & Investments FYE 2018 64,911$ FY 2018 Admin paid out of RLF Income 11,311$ Unpaid Principal of loans written of during FY 85,540$
522,476$
Federal Percentage 71%
Federal Share of Revolving Loan Fund 370,958$
Award Number: 05-79-73005State Name = EDA Revolving LoanFederal Grantor = US Department of CommerceFederal Program Name = Economic Adjustment AssistanceFederal Catalog Number = 11.307
RLF Loan Balance FYE 2018 3,388,931$ Cash & Investments FYE 2018 1,631,811$ FY 2018 Admin paid out of RLF Income 334,831$ Unpaid Principal of loans written of during FY (833)$
5,354,740$
Federal Percentage 50%
Federal Share of Revolving Loan Fund 2,677,370$
B-242

Other Federal Loans The following loans, originally funded through federal programs, do not have any continuing federal compliance requirements imposed on the state, other than the loan repayments. These loans are not reported on the Schedule of Expenditures of Federal Awards:
Tongue River –Northern Cheyenne Tribal Loan The Northern Cheyenne Tribe and the Department of Natural Resources and Conservation entered into an agreement on July 1, 1994 in which the tribe agreed to loan the state of Montana $11,300,000 of federal funds appropriated as part of the Northern Cheyenne Indian Reserved Water Rights Settlement. The loan is to assist the state in financing costs of the Tongue River Dam project. No expenditures of tribal loan funds were incurred on project costs during fiscal year 2018. The amount of the loan outstanding as of June 30, 2018 is $5,794,872. Middle Creek Dam Rehabilitation Project Loan The Department of Natural Resources and Conservation and the U.S Department of the Interior, Bureau of Reclamation (BOR), entered into an agreement on September 21, 1990. The BOR agreed to loan the state of Montana “…a sum of money not to exceed the lesser of (1) $3,023,925 plus reimbursable interest during construction, or (2) the actual cost of the project, including reimbursable interest during construction...” The total loan repayable is $2,990,129, and reimbursable interest during construction is $281,857. As of June 30, 2018, the loan outstanding is $1,862,630, and reimbursable interest during construction is $170,640.
Note 3. Type A Federal Programs
The State of Montana issues a biennial single audit report. The Montana Single Audit report for the two fiscal years ended June 30, 2019 will be issued by March 31, 2020. The Type A program threshold will be determined based on actual expenditures incurred during the two fiscal years ended June 30, 2019.
Note 4. CFDA Number
The CFDA number assigned for each federal program listed in the Schedule of Expenditures of Federal Awards is based upon agency agreements with the federal government and the Catalog of Federal Domestic Assistance in effect during the audit period. The complete CFDA number is a five-digit number, where the first two digits represent the federal agency and the second three digits represent the program. Programs not assigned a CFDA number in the Catalog of Federal Domestic Assistance were assigned a CFDA number in the format **.UXX or **. RD. Also refer to Note 13.
B-243

Note 5. Program Clusters
As defined by 2 CFR section 200.17, a cluster of programs is a grouping of closely related programs that share common compliance requirements. Except for the Student Financial Assistance Cluster, clusters of programs are presented on the Schedule of Expenditures of Federal Awards either within their respective federal agency (for non-research and development programs) or by federal agency and major subdivision (for research and development programs.
Student Financial Assistance Cluster Amounts reported for the Student Financial Assistance Cluster include programs administered by both the Department of Education and the Department of Health and Human Services. These clusters are shown separately, within their respective federal agencies, on the Schedule of Expenditures of Federal Awards. The combined Student Financial Assistance Cluster includes the following programs: CFDA #' Student Financial Assistance Cluster FY 18
Expenditures
84.007 Federal Supplemental Educational Opportunity Grants $1,380,96184.033 Federal Work-Study Program $2,076,92784.038 Federal Perkins Loan Program - Federal Capital Contributions $38,230,21684.063 Federal Pell Grant Program $47,694,65384.268 Federal Direct Student Loans $173,720,750
84.379 Teacher Education Assistance for College and Higher Education Grants (TEACH Grants) $12,413
93.264 Nurse Faculty Loan Program (NFLP) $14,620
93.342 Health Professions Student Loans, Including Primary Care Loans/Loans for Disadvantaged Students $227,150
93.364 Nursing Student Loans $2,798,157
Total Student Financial Assistance Cluster $266,155,847 Note 6. Research and Development Grants
Research and Development includes all research activities, both basic and applied, and all development activities that are performed by a non-federal entity. Research is defined as a systematic study directed toward fuller scientific knowledge or understanding of the subject studied. The term research also includes activities involving the training of individuals in research techniques, where such activities utilize the same facilities as other research and development activities, and where such activities are not included in the instruction function. Development is the systematic use of knowledge and understanding gained from research directed toward the production of useful materials, devices, systems, or
B-244

methods, including design and development of prototypes and processes. Federal awards that meet the research and development criteria are listed in the Research and Development Cluster.
Note 7. Federal Excess Personal Property
The state of Montana receives Federal Excess Personal Property (FEPP). The title to this property remains with the federal agency. In accordance with General Services Administration guidelines, the amounts are presented at fair market value at the time of receipt by the state, which is determined to be 22.47% of the original acquisition cost of the property. Property received under CFDA #81.UXX, Miscellaneous Non-Major Grants, is shown at its fair market value at the time of receipt. The following is a list of the FEPP received by the state of Montana during fiscal year 2018. The negative amount reflects property sold (title transferred at public sale) or other disposition.
CFDA # Program FY 18 Amount
FY 18 Ending
Inventory 10.203 Payments to Agricultural Experiment Stations Under the Hatch Act
$0 $125,057
10.500 Cooperative Extension Service $0 $3,039 10.664 Cooperative Forestry Assistance ($132,947) $4,537,284 10.UXX Miscellaneous – Non-major Grants $0 $131,341 15.UXX Miscellaneous - Non-major Grants $3,420 $3,420 39.003 Donation of Federal Surplus Property $101,937 $153,712 81.UXX Miscellaneous Non-major Grants $0 $5,150 43.UXX Miscellaneous – Non-major Grants $0 $640,395 47.UXX Miscellaneous – Non-major Grants ($26,045) $151,923
Note 8. Department of Defense Firefighting Property
The Department of Natural Resources and Conservation (DNRC) receives Department of Defense Firefighting Property (FFP). The title to this property is transferred to the DNRC. In accordance with General Services Administration guidelines, the amounts are presented at fair market value at the time of receipt by DNRC, which is determined to be 22.47% of the original acquisition cost of the property. The following is the value of FFP received by the state of Montana during fiscal year 2018:
CFDA # Program FY 18
Amount FY 18 Ending
Inventory 12.UXX Miscellaneous – Non-major Grants $307,325 $2,454,412
B-245

Note 9. Books for the Blind and Physically Handicapped
The Montana State Library receives “talking book” machines, cassette books, accessories, and magazines from the federal government under the Books for the Blind and Physically Handicapped Program (CFDA #42.001). These items are then distributed to provide library services to blind and physically handicapped individuals. The federal government retains title to these items. The approximate value of the items in inventory (not distributed to individuals) at June 30, 2018 was $895,761. Since this program is considered a federal “use of equipment” agreement, the accompanying Schedule of Expenditures of Federal Awards does not include this amount.
Note 10. Unemployment Benefits
The unemployment compensation system is a federal-state partnership. State unemployment insurance laws must conform to certain provisions of the federal law. Federal funds are expended for administrative costs. State unemployment taxes must be deposited into a state account in the Federal Unemployment Trust Fund and are used only to pay benefits. State Unemployment Insurance (UI) funds, as well as federal funds, are included on the Schedule of Expenditures of Federal Awards. The following schedule provides a breakdown of the state and federal portions of the total expenditures recorded for the Unemployment Insurance Program (CFDA #17.225).
State UI Expenditures $106,243,557 Federal UI Expenditures 18,093,961 Total $124,337,518
Note 11. Subgrants to State Agencies
Federal assistance transferred from one Montana state agency or university to another Montana state agency or university is shown only once on the Schedule of Expenditures of Federal Awards. Federal assistance received from non-state sources, which are considered subgrants by the awarding agency, are treated as pass-through grants to the state. These pass-through awards are listed below the direct federal awards reported on the Schedule of Expenditures of Federal Awards. Pass-through grant numbers are included for those awards that were assigned an identifying number.
Note 12. Subgrants to Non-State Agencies
Federal assistance transferred from a Montana state agency or university to a non-state agency, such as a city, county, tribal government, or nonprofit organization, is identified
B-246

in the Amount to Subrecipients column shown in the Schedule of Expenditures of Federal Awards. These amounts are included in the expenditure totals shown on the report. The Amounts to Subrecipients does not include federal assistance transferred from a Montana state agency or university that was originally received as a subgrant from another Montana state agency or university. These amounts are not included in the expenditure totals shown on the report, since the original award is only shown once on the Schedule of Expenditures of Federal Awards, as described in Note 11 above. A summary of amounts that were subgranted to a non-state agency, such as a city, county, tribal government, or nonprofit organization, which were made from awards originally received from another Montana state agency or university, is shown below:
CFDA # Federal ProgramAmount to
Subrecipients
Non Research and Development43.008 Education $26,55684.048 Career and Technical Education -- Basic Grants to States $2,850,48884.334 Gaining Early Awareness and Readiness for Undergraduate Programs $30,14484.367 Supporting Effective Instruction State Grants $39,12384.419 Preschool Development Grants $615,64193.262 Occupational Safety and Health Program $3,726
Total - Non Research and Development $3,565,678
TANF Cluster93.558 Temporary Assistance for Needy Families $615,985
Total TANF Cluster $615,985
Research and Development Cluster20.205 Highway Planning and Construction $8,32347.079 Office of International Science and Engineering $16,36384.419 Preschool Development Grants $2,824
Total Research and Development Cluster $27,510
Note 13. Federal Awards not having a CFDA Number
The following schedules contain contract or grant numbers associated with awards that did not have a CFDA number and were assigned either a **.UXX or **.RD number in the Schedule of Expenditures of Federal Awards. Not all **.UXX or **.RD awards reported on the SEFA had a grant or contract number. Also refer to Note 4.
B-247

Federal Agency State Agency Contract or Grant Number Amount
DEPARTMENT OF AGRICULTURE10.U01 Montana State University - Bozeman Unknown $3,42110.U02 University of Montana - Montana Tech Unknown $2,52810.U03 University of Montana - Western 16-CS-11010200-021 $5,89710.U04 Department of Fish, Wildlife and Parks Unknown $60010.U05 Department of Natural Resources and Conservation 12-FI-11011100-049 $17,81710.U06 12-FI-11011200-022 $30,27010.U07 13-CS-11011000-047 $25,99110.U08 13-FI-11011600-045 $1,41110.U09 13-SA-11015600-063 $18,93610.U10 14-FI-11011400-011 $77010.U11 15-FI-11010200-001 $1,41110.U12 16-FI-11010200-019 $3,69010.U13 16-FI-11011100-060 $2,93210.U14 16-FI-11011500-026 $1,66510.U15 17-FI-11011000-042 $6,61010.U16 17-FI-11011600-013 $1,35910.U17 17-FI-11015200-003 $21,53310.U18 18-FI-11011600-026 $25,78310.U19 18-FI-11015200-008 $3,24310.U20 DNRC-BLM-PFP-16-001 $1,416
DEPARTMENT OF DEFENSE12.U01 University of Montana - Missoula H92236-17-P-5122 $498,54312.U02 W9128F-17-2-0028 $594,19112.U03 Department of Fish, Wildlife and Parks 17-114G $1,670,56112.U04 18-09G $148,99112.U05 18-128P $43,46512.U06 18-93P $890,27412.U07 W9128F-15-D-0015-0006 $56,59412.U08 W9128F-15-D-0015-0007 $99,10612.U09 W912DW-15-0001-0003 $178,74912.U10 W912DW-15-0001-0004 $252,78612.U11 Department of Natural Resources and Conservation Unknown $307,325
DEPARTMENT OF EDUCATION84.U01 Office of Public Instruction Contract # ED-IES-14-C-0086 $135,082
DEPARTMENT OF ENERGY81.U01 Department of Natural Resources and Conservation Unknown $40,945
DEPARTMENT OF HEALTH AND HUMAN SERVICES93.U01 Department of Public Health and Human Services Unknown $143,182
DEPARTMENT OF THE INTERIOR15.U01 Department of Fish, Wildlife and Parks 15-MU-11015600-039 $2,50015.U02 00-UGPR-34 $154,41815.U03 G17PX00725 $99,78115.U04 140G021890250 $22,87015.U05 Unknown $3,421
DEPARTMENT OF TREASURY21.U01 Department of Administration Unknown $878
LIBRARY OF CONGRESS42.U01 Montana Historical Society Unknown $15,725
Schedule of Unknown Federal CFDA Numbers (**.UXX)
B-248

Federal Agency State Agency Contract or Grant Number Amount
DEPARTMENT OF AGRICULTURE 10.RD Montana State University - Bozeman PO# 0000000666 ($2,379)
Unknown $274,589University of Montana - Montana Tech 65-0325-09-034 $8,684
07-CS-11015600-099 $10,722
DEPARTMENT OF DEFENSE 12.RD University of Montana - Missoula W9128F-14-2-0002 TO 0017 $47,443
W9128F-14-2-0002 TO 0011 $135,282W9128F-14-2-0002 TO 0012 $890,774W9128F-14-2-0002 TO 0013 $461,131W9128F-14-2-0002 TO 0016 $18,301W9128F-14-2-0002 TO 0018 $36,316W9128F-14-2-0002 TO 0019 $157,613W9128F-14-2-0002 TO 0020 $8,271W9128F-14-2-0002 TO 0021 $115,890W9128F-14-2-0002 TO 0022 $52,486W9128F-14-2-0002 TO 0024 $190,444W9128F-14-2-0002 TO 0025 $4,521W9128F-14-2-0002 TO 0026 $19,784W9128F-14-2-0002, TO 0001 $18,119W9128F-14-2-0002, TO 0027 $28,955W9128F-14-2-0002, TO 0028 $100,267W9128F-14-2-0002, TO 0029 $225,576W9128F-14-2-0002, TO 0030 $71,583
W912HZ-16-2-0023 $17,226Montana State University - Bozeman 18-018PO $1,251
31236-Z8409102 $7,383ARM212-MSU $42,976PO10169067 $27,773
S2-17-0003-01 $231,201S2-1954-16-01 $18,969
S2-5504-16-01C $39,796SUBCONTRACT NUMBER 313-0742 $114,923
USAF ARZ999 $1,687Unknown $951,652
University of Montana - Montana Tech US001-000590859 $29,041
DEPARTMENT OF ENERGY 81.RD University of Montana - Missoula PO 1877920 $17,790
University of Montana - Montana Tech 1663302 $34,627DE-AC02-05CH11231 $73,209DE-AC07-05ID14517 $14,425
DEPARTMENT OF HEALTH AND HUMAN SERVICES 93.RD University of Montana - Missoula HHSN27220140050C $1,275,784
K-002052 $3,373Montana State University - Bozeman 17RWSK0007 $133,366
University of Montana - Montana Tech 211-2014-59580 $119,391214-2017-M-93216 $31,200
Department of Public Health and Human Services HHSS283201600001C $125,281
DEPARTMENT OF THE INTERIOR 15.RD University of Montana - Missoula P13AC00618 $15,577
Unknown $1,524Montana State University - Bozeman Unknown $58,148
University of Montana - Montana Tech H1580070001 $34,184
ENVIRONMENTAL PROTECTION AGENCY 66.RD University of Montana - Missoula EP-16-8-000017 $143
NATIONAL AERONAUTICS AND SPACE ADMINISTRATION 43.RD University of Montana - Missoula 1422120 $44,696
Schedule of Unknown Federal CFDA Numbers for Research and Development Awards (XX.RD)
B-249

Note 14. Subsequent Event
Effective July 1, 2018, universities participating in the federal Perkins Loan Program (CFDA #84.032) are no longer authorized to make new loan distributions under the Perkins Loan Program Extension Act of 2015. See also Note 2.
B-250

Auditor’s Report & Findings
18-02


Auditor’s Report and FindingsTABLE OF CONTENTS
Independent Auditor’s Report On Compliance For Each Major Federal Program And On Internal Control Over Compliance Required by the Uniform Guidance.........................C-1
Section I–Summary of Auditor’s Results ............................................................................C-13Section II–Financial Statement Findings ............................................................................ C-15Section III–Federal Award Findings and Questioned Costs ............................................... C-21
VARIOUS FEDERAL AGENCIESFindings2019-1 ......................................................................................................................C-152019-2 ......................................................................................................................C-172019-3 ......................................................................................................................C-202019-4 ......................................................................................................................C-22
Section III–Federal Award Findings and Questioned Costs
U.S. DEPARTMENT OF AGRICULTUREFindings2019-008 .................................................................................................................C-452019-009 ................................................................................................................ C-482019-010 ..................................................................................................................C-502019-011 ..................................................................................................................C-522019-022 ..................................................................................................................C-762019-024 ................................................................................................................. C-822019-032 ................................................................................................................C-1012019-033 ................................................................................................................C-104
U.S. DEPARTMENT OF DEFENSEFindings2019-029 ..................................................................................................................C-95
U.S. DEPARTMENT OF THE INTERIORFindings2019-034 ................................................................................................................C-1062019-035 ................................................................................................................C-1082019-036 ................................................................................................................ C-110
U.S. DEPARTMENT OF TRANSPORTATIONFindings2019-026 ................................................................................................................. C-862019-027 ................................................................................................................. C-89
U.S. DEPARTMENT OF EDUCATIONFindings2019-030 ..................................................................................................................C-972019-031 ..................................................................................................................C-992019-032 ................................................................................................................C-1012019-033 ................................................................................................................C-104
C-i
18-02

U.S. DEPARTMENT OF HEALTH AND HUMAN SERVICESFindings2019-001 ..................................................................................................................C-242019-002 .................................................................................................................C-332019-003..................................................................................................................C-352019-004 .................................................................................................................C-372019-005 .................................................................................................................C-392019-006 ................................................................................................................ C-412019-008 .................................................................................................................C-452019-012 ..................................................................................................................C-552019-013 ..................................................................................................................C-572019-014 ..................................................................................................................C-592019-015 ..................................................................................................................C-612019-016 ................................................................................................................. C-632019-017 ................................................................................................................. C-652019-018 ................................................................................................................. C-682019-019 ..................................................................................................................C-702019-020 ..................................................................................................................C-722019-021 ..................................................................................................................C-742019-022 ..................................................................................................................C-762019-023 ................................................................................................................. C-802019-024 ................................................................................................................. C-822019-025 ................................................................................................................. C-84
U.S. DEPARTMENT OF HOMELAND SECURITYFindings2019-028 ..................................................................................................................C-92
VARIOUS FEDERAL AGENCIESFindings2019-007 ................................................................................................................ C-43
Appendix A–Research and Development Cluster Activity by CFDA# and Location .............................................................C-113
C-ii Montana Legislative Audit Division

Independent Auditor’s Report on Compliance for Each Major Federal Program and on Internal Control Over
Compliance Required by the Uniform Guidance
The Legislative Audit Committeeof the Montana State Legislature:
Report on Compliance for Each Major Federal ProgramWe have audited the state of Montana’s compliance with the types of compliance requirements described in the OMB Compliance Supplement that could have a direct and material effect on each of the state of Montana’s major federal programs for the two fiscal years ended June 30, 2019. The state of Montana’s major federal programs are identified in the summary of auditor’s results section of the accompanying Schedule of Findings and Questioned Costs.
Management’s Responsibility Management is responsible for compliance with federal statutes, regulations, and the terms and conditions of its federal awards applicable to its federal programs.
Auditor’s Responsibility Our responsibility is to express an opinion on compliance for each of the state of Montana’s major federal programs based on our audit of the types of compliance requirements referred to above. We conducted our audit of compliance in accordance with auditing standards generally accepted in the United States of America; the standards applicable to financial audits contained in Government Auditing Standards, issued by the Comptroller General of the United States; and the audit requirements of Title 2 U.S. Code of Federal Regulations Part 200, Uniform Administrative Requirements, Cost Principles, and Audit Requirements for Federal Awards (Uniform Guidance). Those standards, and the Uniform Guidance, require that we plan and perform the audit to obtain reasonable assurance about whether noncompliance with the types of compliance requirements referred to above that could have a direct and material effect on a major federal program occurred. An audit includes examining, on a test basis, evidence about the state of Montana’s compliance with those requirements and performing such other procedures as we considered necessary in the circumstances.
We believe that our audit provides a reasonable basis for our adverse, qualified, and unmodified opinions on compliance for each major federal program. However, our audit does not provide a legal determination of the state of Montana’s compliance.
LEGISLATIVE AUDIT DIVISION Angus Maciver, Legislative Auditor Deputy Legislative AuditorsDeborah F. Butler, Legal Counsel Cindy Jorgenson Joe Murray
Room 160 • State Capitol Building • PO Box 201705 • Helena, MT • 59620-1705Phone (406) 444-3122 • FAX (406) 444-9784 • E-Mail [email protected]
C-1

Basis for Adverse Opinion on Medicaid ClusterAs described in Findings #2019-001, 2019-002, 2019-004, 2019-005, 2019-022, and 2019-025 in the accompanying Schedule of Findings and Questioned Costs, the state of Montana did not comply with requirements regarding the following:
Finding # CFDA # Cluster Name Compliance Requirement
2019-001
93.77593.777 93.778
Medicaid Cluster
Activities Allowed or UnallowedAllowable Costs/Cost Principles
Eligibility
2019-002 Allowable Costs/Cost Principles
2019-005 Procurement, Suspension and Debarment
2019-022 Allowable Costs/Cost Principles
2019-0042019-025 Special Tests and Provisions
Compliance with such requirements is necessary, in our opinion, for the state of Montana to comply with the requirements applicable to that cluster.
Adverse Opinion on Medicaid ClusterIn our opinion, because of the significance of the matters described in the “Basis for Adverse Opinion on Medicaid Cluster” paragraph, the state of Montana did not comply, in all material respects, with the compliance requirements referred to above that could have a direct and material effect on the Medicaid Cluster for the two fiscal years ended June 30, 2019.
Basis for Adverse Opinion on SNAP Cluster As described in Findings #2019-008, 2019-009, 2019-010, and 2019-011 in the accompanying Schedule of Findings and Questioned Costs, the state of Montana did not comply with requirements regarding the following:
Finding # CFDA # Cluster Name Compliance Requirement
2019-008
10.551 10.561 SNAP Cluster
Special Tests and Provisions
2019-009 Special Tests and Provisions
2019-010 Cash Management
2019-011 ReportingSpecial Tests and Provisions
Compliance with such requirements is necessary, in our opinion, for the state of Montana to comply with the requirements applicable to that cluster.
Adverse Opinion on SNAP ClusterIn our opinion, because of the significance of the matters described in the “Basis for Adverse Opinion on SNAP Cluster” paragraph, the state of Montana did not comply, in all material respects, with the compliance requirements referred to above that could have a direct and material effect on the SNAP Cluster for the two fiscal years ended June 30, 2019.
C-2

Basis for Adverse Opinion on TANF Cluster As described in Findings #2019-012, 2019-013, 2019-014, and 2019-022 in the accompanying Schedule of Findings and Questioned Costs, the state of Montana did not comply with requirements regarding the following:
Finding # CFDA # Cluster Name Compliance Requirement
2019-012
93.558 TANF Cluster
Special Tests and Provisions
2019-013 Matching, Level of Effort, Earmarking
2019-014 Reporting
2019-022 Allowable Costs/Cost Principles
Compliance with such requirements is necessary, in our opinion, for the state of Montana to comply with the requirements applicable to that cluster.
Adverse Opinion on TANF ClusterIn our opinion, because of the significance of the matters described in the “Basis for Adverse Opinion on TANF Cluster” paragraph, the state of Montana did not comply, in all material respects, with the compliance requirements referred to above that could have a direct and material effect on the TANF Cluster for the two fiscal years ended June 30, 2019.
Basis for Qualified Opinion on Foster Care-Title IV-EAs described in Findings #2019-016, 2019-017, and 2019-022 in the accompanying Schedule of Findings and Questioned Costs, the state of Montana did not comply with requirements regarding the following:
Finding # CFDA # Program Name Compliance Requirement
2019-016
93.658 Foster Care-Title IV-E
Subrecipient Monitoring
2019-017Activities Allowed or UnallowedAllowable Costs/Cost Principles
Subrecipient Monitoring
2019-022 Allowable Costs/Cost Principles
Compliance with such requirements is necessary, in our opinion, for the state of Montana to comply with the requirements applicable to that program.
Qualified Opinion on Foster Care-Title IV-EIn our opinion, except for the noncompliance described in the “Basis for Qualified on Foster Care-Title IV-E” paragraph, the state of Montana complied, in all material respects, with the compliance requirements referred to above that could have a direct and material effect on the Foster Care-Title IV-E program for the two fiscal years ended June 30, 2019.
C-3

Basis for Qualified Opinion on Children's Health Insurance Program As described in Finding #2019-001 in the accompanying Schedule of Findings and Questioned Costs, the state of Montana did not comply with requirements regarding the following:
Finding # CFDA # Program Name Compliance Requirement
2019-001 93.767 Children’s Health Insurance Program
Activities Allowed or UnallowedAllowable Costs/Cost Principles
Eligibility
Compliance with such requirements is necessary, in our opinion, for the state of Montana to comply with the requirements applicable to that program.
Qualified Opinion on Children’s Health Insurance ProgramIn our opinion, except for the noncompliance described in the “Basis for Qualified Opinion on Children’s Health Insurance Program” paragraph, the state of Montana complied, in all material respects, with the compliance requirements referred to above that could have a direct and material effect on the Children’s Health Insurance Program for the two fiscal years ended June 30, 2019.
Basis for Qualified Opinion on National Guard Military Operations and Maintenance (O&M) ProjectsAs described in Finding #2019-029 in the accompanying Schedule of Findings and Questioned Costs, the state of Montana did not comply with requirements regarding the following:
Finding # CFDA # Program Name Compliance Requirement
2019-029 12.401 National Guard Military Operations and Maintenance (O&M) Projects Matching, Level of Effort, Earmarking
Compliance with such requirements is necessary, in our opinion, for the state of Montana to comply with the requirements applicable to that program.
Qualified Opinion on National Guard Military Operations and Maintenance (O&M) ProjectsIn our opinion, except for the noncompliance described in the “Basis for Qualified Opinion on National Guard Military Operations and Maintenance (O&M) Projects” paragraph, the state of Montana complied, in all material respects, with the compliance requirements referred to above that could have a direct and material effect on the National Guard Military Operations and Maintenance (O&M) Projects program for the two fiscal years ended June 30, 2019.
Basis for Qualified Opinion on Highway Planning and Construction ClusterAs described in Finding #2019-026 in the accompanying Schedule of Findings and Questioned Costs, the state of Montana did not comply with requirements regarding the following:
Finding # CFDA # Cluster Name Compliance Requirement
2019-02620.20520.21920.224
Highway Planning and Construction Cluster Special Tests and Provisions
C-4

Compliance with such requirements is necessary, in our opinion, for the state of Montana to comply with the requirements applicable to that cluster.
Qualified Opinion on Highway Planning and Construction ClusterIn our opinion, except for the noncompliance described in the “Basis for Qualified Opinion on Highway Planning and Construction Cluster” paragraph, the state of Montana complied, in all material respects, with the compliance requirements referred to above that could have a direct and material effect on the Highway Planning and Construction Cluster for the two fiscal years ended June 30, 2019.
Basis for Qualified Opinion on Special Education Cluster (IDEA)As described in Finding #2019-032 in the accompanying Schedule of Findings and Questioned Costs, the state of Montana did not comply with requirements regarding the following:
Finding # CFDA # Cluster Name Compliance Requirement
2019-032 84.02784.173 Special Education Cluster (IDEA) Subrecipient Monitoring
Compliance with such requirements is necessary, in our opinion, for the state of Montana to comply with the requirements applicable to that cluster.
Qualified Opinion on Special Education Cluster (IDEA)In our opinion, except for the noncompliance described in the “Basis for Qualified Opinion on Special Education Cluster (IDEA)” paragraph, the state of Montana complied, in all material respects, with the compliance requirements referred to above that could have a direct and material effect on the Special Education Cluster (IDEA) for the two fiscal years ended June 30, 2019.
Basis for Qualified Opinion on CCDF ClusterAs described in Findings #2019-019, 2019-020, and 2019-021, in the accompanying Schedule of Findings and Questioned Costs, the state of Montana did not comply with requirements regarding the following:
Finding # CFDA # Cluster Name Compliance Requirement
2019-01993.57593.596 CCDF Cluster
Period of Performance
2019-0202019-021 Special Tests and Provisions
Compliance with such requirements is necessary, in our opinion, for the state of Montana to comply with the requirements applicable to that cluster.
Qualified Opinion on CCDF ClusterIn our opinion, except for the noncompliance described in the “Basis for Qualified Opinion on CCDF Cluster” paragraph, the state of Montana complied, in all material respects, with the compliance
C-5
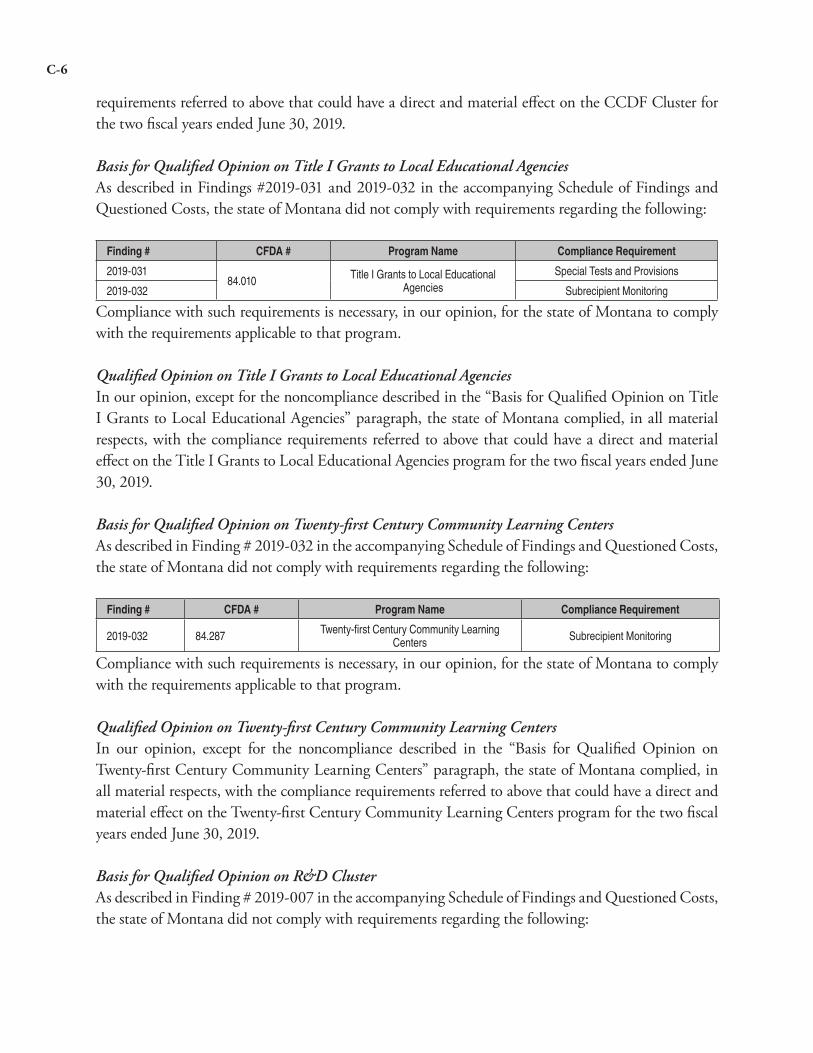
requirements referred to above that could have a direct and material effect on the CCDF Cluster for the two fiscal years ended June 30, 2019.
Basis for Qualified Opinion on Title I Grants to Local Educational AgenciesAs described in Findings #2019-031 and 2019-032 in the accompanying Schedule of Findings and Questioned Costs, the state of Montana did not comply with requirements regarding the following:
Finding # CFDA # Program Name Compliance Requirement
2019-03184.010 Title I Grants to Local Educational
AgenciesSpecial Tests and Provisions
2019-032 Subrecipient Monitoring
Compliance with such requirements is necessary, in our opinion, for the state of Montana to comply with the requirements applicable to that program.
Qualified Opinion on Title I Grants to Local Educational AgenciesIn our opinion, except for the noncompliance described in the “Basis for Qualified Opinion on Title I Grants to Local Educational Agencies” paragraph, the state of Montana complied, in all material respects, with the compliance requirements referred to above that could have a direct and material effect on the Title I Grants to Local Educational Agencies program for the two fiscal years ended June 30, 2019.
Basis for Qualified Opinion on Twenty-first Century Community Learning CentersAs described in Finding # 2019-032 in the accompanying Schedule of Findings and Questioned Costs, the state of Montana did not comply with requirements regarding the following:
Finding # CFDA # Program Name Compliance Requirement
2019-032 84.287 Twenty-first Century Community Learning Centers Subrecipient Monitoring
Compliance with such requirements is necessary, in our opinion, for the state of Montana to comply with the requirements applicable to that program.
Qualified Opinion on Twenty-first Century Community Learning CentersIn our opinion, except for the noncompliance described in the “Basis for Qualified Opinion on Twenty-first Century Community Learning Centers” paragraph, the state of Montana complied, in all material respects, with the compliance requirements referred to above that could have a direct and material effect on the Twenty-first Century Community Learning Centers program for the two fiscal years ended June 30, 2019.
Basis for Qualified Opinion on R&D ClusterAs described in Finding # 2019-007 in the accompanying Schedule of Findings and Questioned Costs, the state of Montana did not comply with requirements regarding the following:
C-6

Finding # CFDA # Cluster Name Compliance Requirement
2019-007 Various R&D Cluster Procurement, Suspension and Debarment
Compliance with such requirements is necessary, in our opinion, for the state of Montana to comply with the requirements applicable to that cluster.
Qualified Opinion on R&D ClusterIn our opinion, except for the noncompliance described in the “Basis for Qualified Opinion on R&D Cluster” paragraph, the state of Montana complied, in all material respects, with the compliance requirements referred to above that could have a direct and material effect on the R&D Cluster for the two fiscal years ended June 30, 2019.
Basis for Qualified Opinion on Low-Income Home Energy AssistanceAs described in Finding #2019-023 in the accompanying Schedule of Findings and Questioned Costs, the state of Montana did not comply with requirements regarding the following:
Finding # CFDA # Program Name Compliance Requirement
2019-023 93.568 Low-Income Home Energy Assistance Cash Management
Compliance with such requirements is necessary, in our opinion, for the state of Montana to comply with the requirements applicable to that program.
Qualified Opinion on Low-Income Home Energy AssistanceIn our opinion, except for the noncompliance described in the “Basis for Qualified Opinion on Low-Income Home Energy Assistance” paragraph, the state of Montana complied, in all material respects, with the compliance requirements referred to above that could have a direct and material effect on the Low-Income Home Energy Assistance program for the two fiscal years ended June 30, 2019.
Basis for Qualified Opinion on Special Supplemental Nutrition Program for Women, Infants, and Children (WIC)As described in Finding #2019-024 in the accompanying Schedule of Findings and Questioned Costs, the state of Montana did not comply with requirements regarding the following:
Finding # CFDA # Program Name Compliance Requirement
2019-024 10.557 Special Supplemental Nutrition Program for Women, Infants, and Children (WIC) Cash Management
Compliance with such requirements is necessary, in our opinion, for the state of Montana to comply with the requirements applicable to that program.
C-7

Qualified Opinion on Special Supplemental Nutrition Program for Women, Infants, and Children (WIC)In our opinion, except for the noncompliance described in the “Basis for Qualified Opinion on Special Supplemental Nutrition Program for Women, Infants, and Children (WIC)” paragraph, the state of Montana complied, in all material respects, with the compliance requirements referred to above that could have a direct and material effect on the Special Supplemental Nutrition Program for Women, Infants, and Children (WIC) program for the two fiscal years ended June 30, 2019.
Basis for Qualified Opinion on Child Support EnforcementAs described in Findings #2019-022 and 2019-024 in the accompanying Schedule of Findings and Questioned Costs, the state of Montana did not comply with requirements regarding the following:
Finding # CFDA # Program Name Compliance Requirement
2019-02293.563 Child Support Enforcement
Allowable Costs/Cost Principles
2019-024 Cash Management
Compliance with such requirements is necessary, in our opinion, for the state of Montana to comply with the requirements applicable to that program.
Qualified Opinion on Child Support EnforcementIn our opinion, except for the noncompliance described in the “Basis for Qualified Opinion on Child Support Enforcement” paragraph, the state of Montana complied, in all material respects, with the compliance requirements referred to above that could have a direct and material effect on the Child Support Enforcement program for the two fiscal years ended June 30, 2019.
Unmodified Opinion on Each of the Other Major Federal Programs In our opinion, the state of Montana complied, in all material respects, with the types of compliance requirements referred to above that could have a direct and material effect on each of its other major federal programs identified in the summary of auditor’s results section of the accompanying Schedule of Findings and Questioned Costs for the two fiscal years ended June 30, 2019.
Other MattersThe results of our auditing procedures disclosed other instances of noncompliance, which are required to be reported in accordance with the Uniform Guidance and which are described in the accompanying Schedule of Findings and Questioned Costs, as items 2019-006, 2019-015, 2019-018, 2019-022, 2019-025, 2019-027, 2019-028, and 2019-032. Our opinion on each major federal program is not modified with respect to these matters.
The state of Montana’s response to the noncompliance findings identified in our audit are described in the accompanying Corrective Action Plan. The state of Montana’s response was not subjected to the auditing procedures applied in the audit of compliance and, accordingly, we express no opinion on the response.
C-8

Report on Internal Control Over ComplianceManagement of the state of Montana is responsible for establishing and maintaining effective internal control over compliance with the types of compliance requirements referred to above. In planning and performing our audit of compliance, we considered the state of Montana’s internal control over compliance with the types of requirements that could have a direct and material effect on each major federal program to determine the auditing procedures that are appropriate in the circumstances for the purpose of expressing an opinion on compliance for each major federal program and to test and report on internal control over compliance in accordance with the Uniform Guidance, but not for the purpose of expressing an opinion on the effectiveness of internal control over compliance. Accordingly, we do not express an opinion on the effectiveness of the state of Montana’s internal control over compliance.
Our consideration of internal control over compliance was for the limited purpose described in the preceding paragraph and was not designed to identify all deficiencies in internal control over compliance that might be material weaknesses or significant deficiencies and therefore, material weaknesses or significant deficiencies may exist that were not identified. However, as discussed below, we identified certain deficiencies in internal control over compliance that we consider to be material weaknesses and significant deficiencies. A deficiency in internal control over compliance exists when the design or operation of a control over compliance does not allow management or employees, in the normal course of performing their assigned functions, to prevent, or detect and correct, noncompliance with a type of compliance requirement of a federal program on a timely basis. A material weakness in internal control over compliance is a deficiency, or combination of deficiencies, in internal control over compliance, such that there is reasonable possibility that material noncompliance with a type of compliance requirement of a federal program will not be prevented, or detected and corrected, on a timely basis. We consider the deficiencies in internal control over compliance described in the accompanying Schedule of Findings and Questioned Costs, and listed in the following table, to be material weaknesses.
Finding # CFDA # Program or Cluster Name Compliance Requirement
2019-00193.775, 93.777, 93.778
93.767
Medicaid Cluster
Children’s Health Insurance Plan
Activities Allowed or UnallowedAllowable Costs/Cost Principles
Eligibility
2019-003 93.775, 93.777, 93.778 Medicaid Cluster Special Tests and Provisions
2019-004 93.775, 93.777, 93.778 Medicaid Cluster Special Tests and Provisions
2019-005 93.775, 93.777, 93.778 Medicaid Cluster Procurement, Suspension and Debarment
2019-007 Various R&D Cluster Procurement, Suspension and Debarment
2019-008 10.551, 10.561 SNAP ClusterActivities Allowed or UnallowedAllowable Costs/Cost Principles
Special Tests and Provisions
2019-008 10.557Special Supplemental Nutrition
Program for Women, Infants, and Children (WIC)
Reporting
C-9

2019-009 10.551, 10.561 SNAP Cluster Special Tests and Provisions
2019-010 10.551, 10.561 SNAP Cluster Cash Management
2019-011 10.551, 10.561 SNAP Cluster Reporting Special Tests and Provisions
2019-012 93.558 TANF Cluster Special Tests and Provisions
2019-014 93.558 TANF Cluster Reporting
2019-016 93.658 Foster Care – Title IV-E Subrecipient Monitoring
2019-017 93.658 Foster Care – Title IV-EActivities Allowed or UnallowedAllowable Costs/Cost Principles
Subrecipient Monitoring
2019-019 93.575, 93.596 CCDF Cluster Period of Performance
2019-020 93.575, 93.596 CCDF Cluster Special Tests and Provisions
2019-021 93.575, 93.596 CCDF Cluster Special Tests and Provisions
2019-022
93.55893.56393.658
93.775, 93.777, 93.778
TANF ClusterChild Support Enforcement
Foster Care - Title IV - EMedicaid Cluster
Allowable Costs/Cost Principles
2019-023 93.568 Low-Income Home Energy Assistance Cash Management
2019-024
10.557
93.563
Supplemental Nutrition Program for Women, Infants and Children (WIC)
Child Support Enforcement
Cash Management
2019-025 93.775, 93.777, 93.778 Medicaid Cluster Special Tests and Provisions
2019-026 20.205, 20.219, 20.224 Highway Planning and Construction Cluster Special Tests and Provisions
2019-029 12.401 National Guard Military Operations and Maintenance (O&M) Matching, Level of Effort, Earmarking
2019-031 84.010 Title I Grants to Local Educational Agencies Special Tests and Provisions
2019-032
84.010
84.027, 84.173
84.287,
10.553, 10.555, 10.556, 10.559
Title I Grants to Local Educational Agencies
Special Education Cluster (IDEA)
Twenty-first Century Community Learning Centers
Child Nutrition Cluster
Subrecipient Monitoring
2019-033
84.010
84.027, 84.173
84.287
10.553, 10.555, 10.556, 10.559
Title I Grants to Local Educational Agencies
Special Education Cluster (IDEA)
Twenty-first Century Community Learning Centers
Child Nutrition Cluster
Procurement, Suspension and Debarment
A significant deficiency in internal control over compliance is a deficiency, or a combination of deficiencies, in internal control over compliance with a type of compliance requirement of a federal program that
C-10

is less severe than a material weakness in internal control over compliance, yet important enough to merit attention by those charged with governance. We consider the deficiencies in internal control over compliance described in the accompanying Schedule of Findings and Questioned Costs, and listed in the following table, to be significant deficiencies.
Finding # CFDA # Program or Cluster Name Compliance Requirement
2019-006 93.767 Children’s Health Insurance Program
Activities Allowed or UnallowedAllowable Costs/Cost Principles
2019-008
93.558
10.557
TANF Cluster
Special Supplemental Nutrition Program for
Women, Infants and Children (WIC)
Activities Allowed or UnallowedAllowable Costs/Cost Principles
2019-013 93.558 TANF Cluster Matching, Level of Effort, Earmarking
2019-018 93.658 Foster Care - Title IV-E Reporting
2019-025
93.56393.65893.65993.767
Child Support Enforcement Foster Care – Title IV-E
Adoption AssistanceChildren’s Health Insurance
Program
Other
2019-030 84.287 Twenty-first Century Community Learning Centers Allowable Costs/Cost Principles
2019-034 15.605, 15.611 Fish and Wildlife Cluster Activities Allowed or UnallowedAllowable Costs/Cost Principles
2019-035 15.605, 15.611 Fish and Wildlife Cluster Allowable Costs/Cost Principles
2019-036 15.605, 15.611 Fish and Wildlife Cluster Activities Allowed or UnallowedAllowable Costs/Cost Principles
The state of Montana’s response to the internal control over compliance findings identified in our audit are described in the accompanying Corrective Action Plan. The state of Montana’s response was not subjected to the auditing procedures applied in the audit of compliance and, accordingly, we express no opinion on the response.
The purpose of this report on internal control over compliance is solely to describe the scope of our testing of internal control over compliance and the results of that testing based on the requirements of the Uniform Guidance. Accordingly, this report is not suitable for any other purpose.
Respectfully submitted,
/s/ Cindy Jorgenson
Cindy Jorgenson, CPADeputy Legislative AuditorHelena, MT
March 26, 2020
C-11

C-12

State of MontanaSchedule of Findings and Questioned Costs
For the Two Fiscal Years Ended June 30, 2019
Section I – Summary of Auditor’s Results
Basic Financial StatementsFor Each of the Two Fiscal Years Ended June 30, 2019
2018 2019Type of report issued on whether the financial statements audited were prepared in accordancewith GAAP: Unmodified Qualified
Internal control over financial reporting: � Material Weakness identified? Yes Yes � Significant deficiencies identified? Yes Yes
Noncompliance material to the financial statements noted? Yes Yes
Federal AwardsFor the Two Fiscal Years Ended June 30, 2019
Internal control over major programs: 2018 and 2019 � Material Weakness identified? Yes � Significant deficiencies identified? Yes
Type of auditor’s report issued on compliance for Major federal programs:
Unmodified for all major programs except for Medicaid Cluster; SNAP Cluster; and TANF Cluster, which are adverse; and Foster Care – Title IV-E; Children’s Health Insurance Program; National Guard Military Operations and Maintenance (O&M); Highway Planning and Construction Cluster; Special Education Cluster (IDEA); CCDF Cluster; Title I Grants to Local Educational Agencies; Twenty-first Century Community Learning Centers; R&D Cluster; Low-Income Home Energy Assistance; Special Supplemental Nutrition Program for Women, Infants, and Children (WIC); and Child Support Enforcement, which are qualified.
C-13
18-02

Any audit findings disclosed that are required to be reported in accordance with federal regulation, 2 CFR 200.516(a)? Yes
Identification of major programs:CFDA Number(s) Name of Federal Program or Cluster10.551 & 10.561 SNAP Cluster10.553, 10.555, 10.556, & 10.559 Child Nutrition Cluster 10.557 Special Supplemental Nutrition Program for Women, Infants & Children (WIC)10.558 Child and Adult Care Food Program10.665 Forest Service Schools and Roads Cluster12.401 National Guard Military Operations and Maintenance Projects (O&M)14.195 & 14.856 Section 8 Project-Based Cluster14.871 Housing Voucher Cluster15.605 & 611 Fish & Wildlife Cluster17.225 Unemployment Insurance20.205, 20.219, & 20.224 Highway Planning and Construction Cluster84.010 Title I Grants to Local Educational Agencies84.027 & 84.173 Special Education Cluster (IDEA)84.287** Twenty-first Century Community Learning Centers93.268 Immunization Cooperative Agreements93.558 TANF Cluster93.563** Child Support Enforcement93.575 & 93.596 CCDF Cluster93.568 Low-Income Home Energy Assistance93.658 Foster Care-Title IV-E 93.767 Children’s Health Insurance Program (CHIP)93.775, 93.777, & 93.778 Medicaid ClusterVarious Research and Development Cluster** High-risk Type B programs
Dollar threshold used to distinguish between Type Aand Type B programs: $22,059,532
Auditee qualified as low-riskAuditee? No
C-14 Montana Legislative Audit Division

State of MontanaSchedule of Findings and Questioned Costs
For the Two Fiscal Years Ended June 30, 2019
Section II – Financial Statement Findings
Finding 2019-1: Various Federal Agencies CFDA #Various Grant #Not Applicable
Criteria: Montana Operations Manual Policy, 302, in part, states, “To help facilitate statewide compliance with GAAP, State agencies are responsible for implementing internal control procedures.”
Montana Operations Manual Policy, 399, defines internal control as a process effected by an entity’s oversight body, management, or other personnel, that provides reasonable assurance the objectives of an entity will be achieved. Policy further requires management to establish and maintain internal controls, including internal controls over financial reporting, and indicates “agency management is responsible for the extent of the efficiency and effectiveness of internal controls, as well as corrective action for any deficiencies.”
Condition: The Montana Board of Investments (board) administers the state’s Unified Investment Program (UIP), as well as the state’s Economic Development Bonds Act (EDB) and Municipal Finance Consolidation Act (MFC) programs. The EDB and MFC programs are collectively referred to by the board, and throughout this report section, as the Enterprise Fund (EF) program. The board is required to prepare separate financial statements and related note disclosures for the UIP and Enterprise Fund Program, in accordance with generally accepted accounting principles (GAAP). Portions of that information is incorporated into the state’s basic financial statements. Additionally, as the administrator of the UIP, the board records transactions in the state’s investment trust fund, related to local government participation in the state’s investment pools.
The board’s internal controls over financial reporting for the fiscal year ending June 30, 2018 were not sufficient to ensure complete and accurate financial reporting in accordance with GAAP. Questioned Costs: No questioned costs identified.
Context: The prior audit of the board for fiscal year ended June 30, 2017, identified material weaknesses in internal controls over financial reporting for both UIP and EF programs. The audit for the fiscal year ended June 30, 2018 noted very specific types of control deficiencies compared to the more broad-scale deficiency from the prior audit.
C-15
18-02

For fiscal year 2018, controls did not ensure accurate reporting of investment related cashflows; we found cash inflows and outflows to be overstated by approximately $696 million. Also for fiscal year 2018, controls did not ensure adequate disclosure of either credit risks or the change in valuation technique, from fair value to cost, for cash equivalents, or for both EF and UIP.
The audit for the fiscal year ended June 30, 2019, noted that the board fully implemented recommendations to correct the weaknesses in the internal controls and that audit did not contain any additional recommendations to the board. In the financial statements for the fiscal year ended June 30, 2019, the EF program is referred to as the Municipal Finance programs. Effect: The draft fiscal year 2018 financial statements contained errors, including a material misstatement for the Statement of Cash Flows.
Cause: Staff did not completely consider or apply all GAAP requirements when changes in program operations or in financial reporting were implemented.
Repeat Finding: This is a repeat finding, initially reported as 2017-2 in the Single Audit report for the two fiscal years ended June 30, 2017. Recommendation: We recommend the Montana Board of Investments enhance internal controls over financial reporting to ensure staff consider and apply all relevant Generally Accepted Accounting Principles when implementing changes with a financial reporting impact.
Views of Responsible Officials: The board concurred with this recommendation. For additional information regarding the board’s planned corrective action see the Corrective Action Plan starting on page D-1.
C-16 Montana Legislative Audit Division

State of MontanaSchedule of Findings and Questioned Costs
For the Two Fiscal Years Ended June 30, 2019
Section II– Financial Statement Findings
Finding 2019-2: Various Federal Agencies CFDA #Various Grant #Not Applicable
Criteria: Article VIII, Section 15, of the Constitution of the state of Montana requires public retirement systems to be funded on an actuarially sound basis. Actuarially sound basis means contributions to each retirement plan must be sufficient to pay full actuarial cost of the plan. For a defined benefit plan, the full actuarial cost includes both the normal cost of providing benefits as they accrue in the future and the cost of amortizing unfunded liabilities over a scheduled period. The period is defined as no more than 30 years by state law (Section 19-2-409, MCA) for each system administered by the Montana Public Retirement Employee’s Administration (MPERA) and by Teachers’ Retirement Board (TRB) policy.
Condition: As of June 30, 2018, actuarial valuations indicated that three defined benefit pension plans are actuarially unsound because they do not amortize within the 30-year time period. The Public Employees’ Defined Benefit Retirement System (PERS-DB), Highway Patrol Officers’ Retirement System (HPORS), and Game Wardens’ and Peace Officers’ Retirement System (GWPORS) do not amortize. As of June 30, 2019, actuarial valuations indicated that the same three defined benefit pension plans remained actuarially unsound because they do not amortize within 30 years.
The June 30, 2018 actuarial valuation indicated that the Teachers’ Retirement System (TRS) was not actuarially sound, because it amortized in 31 years, which is outside the 30-year amortization period required by the Montana Constitution. As of June 30, 2019, the actuarial valuation indicated the TRS is actuarially sound, as the system amortizes within 29 years.
Questioned Costs: No questioned costs were identified.
Context: The MPERA administers eight defined benefit retirement systems, two defined contribution plans, and an Other Post-Employment Benefits (OPEB) plan. The TRB administers one defined benefit retirement system, the TRS.
C-17
18-02

The amortization periods are summarized in the table below.
Retirement System Amortization Period as of June 30, 2019 Amortization Period as of June 30, 2018
PERS-DB 36 38
HPORS 42 40
GWPORS 53 72
TRS 29 31
The Public Employee’s Retirement Board (Board) continues to work with plan stakeholders and the Legislature to improve the funding status and decrease the amortization period for all three systems that are not actuarially sound. Board officials have put forth an effort to ensure all defined benefit plans are actuarially sound.
The decrease in the amortization period from 2018 to 2019 for the TRS is primarily due to the continued smoothing of gains and losses over four years and having more Tier II members in the system, whose projected cost is lower. Effect: The retirement systems are not actuarially sound, which is not in compliance with Montana Constitution and state law.
Cause: During the 2019 Legislative Session, the Board sought legislation increasing the contribution amounts for the Game Wardens’ and Peace Officers’ Retirement System. However, this legislation did not pass. The Board expected the improvements in the amortization period of the PERS.
The increase in the HPORS amortization period between fiscal year 2018 and 2019 is attributed mainly to a decrease in payroll, and related contributions in the system.
For the TRS, the increase in amortization period in fiscal year 2018 compared to fiscal year 2017 was primarily due to changes in the actuarial assumptions and methods adopted by the board as a result of the experience study completed for the five-year period ended June 30, 2018. The remaining increase was because the actuarial return on assets was less than the actuarial assumption due to the smoothing of gains and losses over four years.
Repeat Finding: Over the last six audits, including this one, various systems have been reported as actuarially unsound. It was reported as finding 2017-1 in the Single Audit report for the two fiscal years ended June 30, 2017, finding 2015-2 for the two fiscal years ended June 30, 2015, finding 2013-2 for the two fiscal years ended June 30, 2013, finding 1-1 for the two fiscal years ended June 30, 2011, and finding 1-2 for the two fiscal years ended June 30, 2009.
C-18 Montana Legislative Audit Division

Recommendation: We recommend: A. The Public Employees’ Retirement Board continue to take necessary actions to ensure
actuarial soundness of the Game Wardens’ and Peace Officers’ Retirement System, Highway Patrol Officers’ System, and Public Employees’ Defined Benefit System.
B. The Teachers’ Retirement Board continue to take necessary actions to ensure actuarial soundness of the Teachers’ Retirement System.
Views of Responsible Officials: MPERA concurs with this recommendation. For additional information regarding MPERA’s planned corrective action see Corrective Action Plan starting on page D-1.
The TRB concurs with this recommendation. For additional information regarding the Teachers’ Retirement Board’s planned corrective action see Corrective Action Plan starting on page D-1.
C-19
18-02

State of MontanaSchedule of Findings and Questioned Costs
For the Two Fiscal Years Ended June 30, 2019
Section II-Financial Statement Findings
Finding 2019-3: Various Federal Agencies CFDA #Various Grant #Not Applicable
Criteria: Montana Operations Manual Policy, 302, in part, states, “To help facilitate statewide compliance with GAAP, State agencies are responsible for implementing internal control procedures.”
Montana Operations Manual Policy, 399, defines internal control as a process effected by an entity’s oversight body, management, or other personnel, that provides reasonable assurance that the objectives of an entity will be achieved. Policy further requires management to establish and maintain internal controls, including internal controls over financial reporting, and indicates “agency management is responsible for the extent of the efficiency and effectiveness of internal controls, as well as corrective action for any deficiencies.”
Federal regulations, 42 CFR 435.10 and 42 CFR 457.305, require the Department of Public Health and Human Services (department) to determine client eligibility in accordance with eligibility requirements in the approved State Plan for the Medicaid Cluster and Children’s Health Insurance Program (CHIP) program.
Federal regulation, 42 CFR 435.914, requires the department to include facts in each applicant’s case record to support the eligibility decision.
Condition: The Department of Public Health and Human Services (department) did not design and maintain adequate internal control over eligibility determinations in the Medicaid and CHIP programs during fiscal year 2019. The department’s internal controls were not sufficiently designed to identify and remove participants from the Medicaid or CHIP programs when participants misrepresented their household composition, sources of income, and residency in order to circumvent the programs’ eligibility requirements.
In addition, our audit tests identified a significant number of clients who may not meet eligibility criteria for the Medicaid and CHIP programs. Results of our testing demonstrate that indications of ineligibility in the CHIP and Medicaid populations is isolated to Modified Adjusted Gross Income (MAGI) based eligibility groups.
Questioned Costs: For fiscal year 2019, the projected questioned costs were $40.5 and $1.1 million for the Medicaid and CHIP program, respectively. For additional information on questioned costs, refer to the underlying audit findings, Federal Award Finding and Questioned Costs 2019-001.
C-20 Montana Legislative Audit Division

Context: Total expenditures under the Medicaid and CHIP programs in fiscal year 2019 were $1.5 billion and $104 million, respectively. For additional context for this audit finding, refer to the underlying audit findings, Federal Award Finding and Questioned Costs 2019-001.
Effect: Without adequate controls to determine eligibility for Medicaid and CHIP recipients, the department cannot assure compliance with federal regulations and amounts recorded on the financial statements for benefits payments are accurate and do not include payments made to recipients who are not eligible based on federal regulations.
As of June 30, 2019, we believe an $84.1 million contingency exists for the state’s General Fund.
Cause: The department has chosen to apply different processes at application for individuals who preliminarily qualify for certain coverage groups under Medicaid as opposed to individuals who preliminarily qualify for the MAGI-based eligibility groups.
Recommendation: We recommend the Department of Public Health and Human Services, as it relates to Medicaid and CHIP federal programs:
A. Establish and maintain internal controls to timely verify client eligibility factors for all applicants and clients at application and redetermination.
B. Comply with federal regulations and state plan requirements by placing only eligible clients into correct eligibility categories.
Views of Responsible Officials: The department does not concur with this finding, and contends the audit work is flawed. For additional information regarding the department’s planned corrective action see the Corrective Action Plan starting on page D-1.
Rebuttal of Views of Responsible Officials: See Finding #2019-001 for rebuttal.
C-21
18-02

State of MontanaSchedule of Findings and Questioned Costs
For the Two Fiscal Years Ended June 30, 2019
Section II-Financial Statement Findings
Finding 2019-4: Various Federal Agencies CFDA #Various Grant #Not Applicable
Criteria: Montana Operations Manual Policy, 302, in part, states, “To help facilitate statewide compliance with GAAP, State agencies are responsible for implementing internal control procedures.”
Montana Operations Manual Policy, 399, defines internal control as a process effected by an entity’s oversight body, management, or other personnel, that provides reasonable assurance that the objectives of an entity will be achieved. Policy further requires management to establish and maintain internal controls, including internal controls over financial reporting, and indicates “agency management is responsible for the extent of the efficiency and effectiveness of internal controls, as well as corrective action for any deficiencies.”
Condition: The Department of Public Health and Human Services (department) does not have adequate internal controls to ensure system processing for SNAP benefits reported on the state’s financial statements are complete, accurate, timely, and authorized which are necessary for adequate internal controls. The department did not receive a System and Organization Controls (SOC)-1 Type 2 report of its Electronic Benefit Transaction (EBT) service provider that is responsible for settlement, or payment to retailers that have agreed to accept EBT cards for the purchase of food.
Questioned Costs: None identified.
Context: The EBT service provider is responsible for settlement, or payment, to retailers that have agreed to accept EBT cards to purchase food. Because the SNAP program provides cash assistance, EBT transactions are similar to those processed for any purchase made with a debit card. In fiscal year 2019, the amount of benefits processed by the EBT service provider was $149 million. During the period under audit, the department received a SOC-2 Type 2 report for its EBT service provider. The SOC-2 report received did not address the processing integrity trust principle, which considers whether system processing is complete, accurate, timely, and authorized.
For additional context, refer to the underlying audit Federal Award Findings and Questioned Costs 2019-008.
C-22 Montana Legislative Audit Division

Effect: Without updated EBT service provider assurances provided by a SOC-1 report, the department is unable to fully demonstrate it has established and maintained adequate internal controls to ensure amounts reported on the financial statements for SNAP payments are accurate and complete.
Cause: The department was unaware of the federal requirement to obtain an annual SOC-1 Type 2 examination by an independent auditor of the transaction processing of the EBT service provider. The department chose to obtain a SOC-2 Type 2 report for the EBT service provider, but overlooked the need to include the Processing Integrity Trust Principle relevant to system processing controls.
Recommendation: We recommend the Department of Public Health and Human Services establish and maintain adequate internal controls to ensure SNAP payments are reported accurately on the financial statements.
Views of Responsible Officials: The department concurs with this recommendation. For additional information regarding the department’s planned corrective action see the Corrective Action Plan starting on page D-1.
C-23
18-02

State of MontanaSchedule of Findings and Questioned Costs
For the Two Fiscal Years Ended June 30, 2019
Section III – Federal Award Findings and Questioned Costs
Finding 2019-001: U. S. Department of Health & Human Service CFDA # 93.775, 93.777, and 93.778, Medicaid Cluster Grant # 1705MT5MAP, 1805MT5MAP, 1905MT5MAP
CFDA # 93.767 Children’s Health Insurance Program (CHIP) Grant # 1705MT5021, 1705MT0301, 1805MT5R21, 1805MT5021, 1905MT5021
Criteria: Federal regulations, 42 CFR 435.10 and 42 CFR 457.305, require the Department of Public Health and Human Services (department) to determine client eligibility in accordance with eligibility requirements in the approved State Plan for the Medicaid Cluster and CHIP program.
Federal regulation, 42 CFR 435.914, requires the department to include facts in each applicant’s case record to support the eligibility decision.
Federal regulation, 42 CFR 435.945(a), specifies, in part, “…except where the law requires other procedures…, the agency may accept attestation of information needed to determine the eligibility of an individual for Medicaid… without requiring further information from the individual.”
Federal regulation, 42 CFR 435.952 (a), requires the department to promptly evaluate information received or obtained by it in accordance with regulations to determine whether such information may affect an individual’s eligibility.
Federal regulation, 42 CFR 435.952 (b) and (c)(1), specifies if information provided by an individual is reasonably compatible with information obtained through required data matches, the department must determine or renew eligibility based on such information. Income information obtained through an electronic data match shall be considered reasonably compatible with information provided by the applicant/client if both are either above, at, or below the applicable income standard or income threshold for eligibility. Only in circumstances when information is not reasonably compatible can the department request additional information.
The department’s State Plans for both the Medicaid and CHIP programs contain income, age, residency, and other eligibility criteria.
C-24 Montana Legislative Audit Division

For our audit period, as permitted by the verification plan, the department accepted self-attested information at enrollment for Modified Adjusted Gross Income (MAGI) based eligibility determinations. The information is verified against various electronic data sources after enrollment in a process referred to as post-enrollment verification (PEV). The PEV process is automated in the department’s Combined Healthcare Information and Montana Eligibility System (CHIMES) to occur within 3 months. For all eligibility groups, redeterminations of eligibility are required to occur annually.
In addition, 2 CFR 200.303 requires non-Federal entities to, among other things, establish and maintain effective internal control over the Federal award that provides reasonable assurance that the non-Federal entity is managing the Federal award in compliance with Federal statutes, regulations, and the terms and conditions of the Federal award.
Condition: The department’s internal control is not sufficiently designed to identify and remove participants from the Medicaid or CHIP programs when participants misrepresent their household composition, sources of income, or residency in order to circumvent the programs’ eligibility requirements. In addition, our audit tests identified a significant number of clients who may not meet eligibility criteria for the Medicaid and CHIP programs. Results of our testing demonstrate that indications of ineligibility in the CHIP and Medicaid populations are isolated to MAGI-based eligibility groups
Internal ControlsWe observed evidence of the following internal control deficiencies over eligibility determinations:
� Instances in which the interfaces between information in the department’s records with external data sources did not run.
� Instances when required redeterminations of eligibility did not occur. � Instances where the department received evidence of discrepancies in eligibility criteria
which were not followed up on. � Instances where department staff overrode information system controls to allow
ineligible individuals to remain in the Medicaid or CHIP programs.
We also observed situations where the department had evidence that a program participant was ineligible, but the department allowed them to remain in the program.
Questioned Costs: Known Questioned CostsFor the 17 case files with indications of ineligibility for all Medicaid and CHIP eligibility groups, and the 9 individuals placed into an incorrect eligibility group, the associated $216,630 in benefit payments do not meet the allowable cost criteria and are considered questioned costs. For the 16 cases where no tax data was available,
C-25
18-02

the department’s records do not demonstrate that the information used to make the eligibility determination is factual. As such, the associated $362,303 in benefits made on behalf of these individuals are considered questioned costs.
Projected Questioned CostsAssuming the same rate of ineligibility in the entire population of Medicaid and CHIP participants where state tax data is available, we projected questioned costs using the average annual claims for each eligibility group. Due to error isolation in the MAGI-based eligibility groups, we factored in a three-month time period to account for the time prior to department verification procedures. Using this methodology, we project likely federal questioned costs for the CHIP program are $1.1 million annually, and $41.3 million and $40.5 million for Medicaid in fiscal years 2018 and 2019, respectively.
Using the 5.8 percent error rate associated with the department’s reconsideration of eligibility determinations (see “Results of Department Conducted Review” in the Context section below), errors in eligibility could equate to as much as $99.2 million and $98.9 million in inappropriate benefit payments for the CHIP and Medicaid programs, in total, for fiscal years 2018 and 2019, respectively, when projected to the population as a whole.
Context: In state fiscal year 2018, expenditures totaled approximately $1.5 billion for Medicaid and $97 million for the CHIP program. At fiscal year-end of 2018, there were approximately 246,000 individuals enrolled in Medicaid and 23,000 individuals enrolled in the CHIP program. In state fiscal year 2019, expenditures totaled approximately $1.5 billion for Medicaid and $104 million for the CHIP program. At fiscal year-end of 2019, there were appropriately 236,000 individuals enrolled in Medicaid and 24,000 individuals enrolled in the CHIP program.
The department uses the CHIMES system to determine eligibility. All applications are uploaded into CHIMES which then determines eligibility based on established business rules and eligibility requirements. CHIMES interfaces with external data sources and utilizes case workers to follow up on discrepancies between the interfaces and reported information in the system.
Internal Control ObservationsAs discussed in the Condition section above, we concluded internal controls, as designed, are likely to be ineffective in preventing ineligible individuals from being determined eligible under the department’s processes. We concluded that limiting our review to information in the department’s records would not provide sufficient and appropriate audit evidence on which to base our conclusion over the department’s compliance with federal eligibility requirements for the Medicaid and CHIP programs.
C-26 Montana Legislative Audit Division

The inadequacies in the department’s Medicaid and CHIP client records is considered a restriction on the scope of the audit. By using only that data source, we were unable to obtain sufficient appropriate audit evidence to support a conclusion over compliance. Based on our observations of internal control deficiencies over Medicaid and CHIP eligibility determinations, at this point in the audit we had enough evidence to disclaim an opinion, and we considered whether this approach was most beneficial for our audit.
To avoid questioning over $4.02 billion in federal costs for the Medicaid and CHIP programs that would result from a disclaimer of opinion, we considered whether a third-party data source was available. State law allows us access to state tax records, a data source we consider relevant to both affirm the reliability of information in the department’s eligibility records and as the basis for redetermining eligibility in accordance with requirements in the State Plans using MAGI information. We chose to conduct a statistical sample as a means of testing eligibility, using state tax data.
Compliance TestingWe performed a statistical sample of 188 Medicaid and CHIP case files from a population of 571,862 unduplicated eligibility determinations from fiscal years 2018 and 2019. This population includes the number of applicants determined eligible for Medicaid or CHIP as well as the number of new applications and closed or denied cases that occurred within the audit period. If an individual’s Medicaid or CHIP eligibility was stopped, or if an individual changed eligibility groups during the audit period, the individual may have been included in the population more than one time.
Our sample was designed to achieve two objectives: 1) to affirm the reliability of information in the department’s eligibility records; and 2) to redetermine eligibility in accordance with requirements in the State Plans using additional sources of information, including state tax data. We stopped testing after 63 case files due to the significant number of errors identified in our sample.
Affirm the Reliability of Information in the Department’s Eligibility RecordsFor each sample item, we performed a comparison of key eligibility factors between the department’s case file information and state tax data. We considered the following eligibility factors:
� Household Size: For the MAGI-based groups, the use of tax filer status is critical because it drives whether the department should use CMS “tax file rules” or “non-tax filer rules” to determine household size. Household size is critical because it sets the allowable income level for both MAGI-based and non-MAGI-based applicants.
� Income: For MAGI-based groups, MAGI information available on tax records is the basis for income eligibility determinations. As mentioned above, while certain individuals may qualify for Medicaid regardless of income, for some non-MAGI-based eligibility categories, income remains a key eligibility factor.
� Residency: In order to qualify for Montana’s Medicaid or CHIP programs, an individual must reside within the state’s boundaries. State tax data includes evidence which supports state residency status.
C-27
18-02

The following table summarizes the results of our testing by key eligibility factor as well as whether or not we found the department’s case file information to be supported, or whether there was no state tax data available.
OutcomeKey Eligibility Factors
Household Factor: Income Factor: Residency Factor:
Case File Information Supported 44 26 53
Case File Information Not Supported 6 25 5
No State Tax Data Available 13 12 5
Redetermine Eligibility in Accordance with Requirements in the State Plans Using Additional Sources of InformationUsing all data gathered in our sample, we considered whether the eligibility determination made by the department was appropriate. In some cases, all individual eligibility factors were affirmed using state tax data (as discussed in the previous section); however, the eligibility determination made by the department was not consistent with eligibility criteria in the CMS-approved State Plan when state tax data was also considered.
Even when we found evidence in state tax data indicating a circumstance that could be an error under federal regulations, this does not necessarily mean the client should have been identified as categorically ineligible for coverage under any Medicaid enrollment category. A significant proportion of the sample errors we identified resulted in a client being placed in the wrong enrollment category. As shown in the table below, we also found additional errors that were not identified as a result of comparisons with state tax data, but were the results of internal control deficiencies or other errors on the part of the department.
C-28 Montana Legislative Audit Division

C-29
18-02

The table below summarizes the results of our testing by a greater level of detail regarding key eligibility factors and overall eligibility redetermination results.
Auditor Eligibility Redetermination Results for Medicaid and CHIPFiscal Years 2018 and 2019
Department’s Eligibility Determination Supported 21
Department’s Eligibility Determination Not Supported:
Incorrect Eligibility Category 9
Not Eligible Due to Income Limit 16
Not Eligible Due to Residency Requirement 1
No State Tax Data Available 16
Total 63
Of the 26 cases shown in the Department’s Eligibility Determination Not Supported lines above, 17 of them had indications of ineligibility for all eligibility groups. For the remaining 9 cases, the department placed the individual into an incorrect eligibility group.
For the 16 cases shown in the No State Tax Data Available line above, the auditor’s determination on the appropriateness of eligibility could not be made due to a lack information available to verify key eligibility factors. The payments made on behalf of these recipients are considered questioned costs because the case records did not include sufficient appropriate audit evidence to fully support the eligibility decision.
Results of Department Conducted ReviewThe department conducted its own review of eligibility determinations included in our sample. The department reviewed the 1,512 ‘member months’ associated with our 63 sample items. Based on results of its review, the department acknowledges a 5.8 percent error rate at the ‘member month’ eligibility level in the population tested in our sample. The department also determined a total of $13,546 in medical claims associated with the months when eligibility determinations were not supported.
Revisions to State LawThe department is taking steps to change the eligibility process, as the 2019 Montana Legislature passed revisions to state law which require the department to verify eligibility using allowed data sources at application. Changes to state law also provide the department access to state taxpayer return information for purposes of verifying the income reported by applicants for medical assistance. These changes will affect our next federal compliance testing cycle (fiscal years 2020 and 2021).
Effect: The results of our compliance testing indicate individuals who did not meet eligibility criteria outlined in the State Plan received Medicaid or CHIP benefits during the audit period, resulting in significant questioned costs for both federal programs.
C-30 Montana Legislative Audit Division

Cause: The department has chosen to apply different processes at application for individuals who preliminarily qualify for certain coverage groups under Medicaid as opposed to individuals who preliminarily qualify for the MAGI-based eligibility groups. For example, for non-MAGI-based Medicaid determinations the verification process takes place at application, while the verification process is delayed for applicants under MAGI-based Medicaid and CHIP determinations. The Verification Plan also includes a 10 percent threshold for reasonable compatibility for income, which means the department only follows up with the client when the information provided by external sources is higher than self-attested income by 10 percent or more. We considered whether the 10 percent threshold applied by the department could extend eligibility when a client does not meet the income criteria, and concluded the department’s Verification Plan could lead to instances where external data indicates the client income exceeds the threshold for an eligibility group but the client is permitted to remain on the program without further department review. For example, an adult with a household size of three who self-reports monthly income of $2,200 would qualify for Medicaid Expansion in the 133 percent Federal Poverty Level group. If the external data source indicates the client’s income is $2,400, the department would not conduct follow-up because the difference in self-reported income and the external data source information is within the 10 percent threshold. However, a monthly income of $2,400 would disqualify the adult from eligibility for all Medicaid Expansion groups. Additionally, the data matches are not designed to identify differences in reported versus actual household make-up or to confirm residency.
Recommendation: We recommend the Department of Public Health and Human Services, as it relates to the Children’s Health Insurance Program and Medicaid federal programs:
A. Revise its Verification Plan to require additional information from the client when income information received from external data sources exceeds the limitation for the client’s preliminarily authorized eligibility group, as required by federal regulations.
B. Revise its policies and procedures, including any necessary revisions in the State Plan, to ensure only eligible individuals receive benefits, as required by federal regulations.
C. Establish and maintain internal controls to timely verify client eligibility factors for all applicants and clients at application and redetermination.
D. Comply with federal regulations and state plan requirements by placing only eligible clients into correct eligibility categories.
Views of Responsible Officials: The department does not concur with this finding, and contends the audit work is flawed. For additional information regarding the department’s planned corrective action see the Corrective Action Plan starting on page D-1.
C-31
18-02

Rebuttal of Views of Responsible Officials: We considered the department’s noncurrence to this finding. Throughout the audit and in its written response to this finding, the department has continued to focus on its disagreement with our audit approach, and in doing so, has not been receptive to our communications and has failed respond to the audit evidence which supports:
1. Internal controls over eligibility determinations were not consistently and correctly applied to Medicaid and CHIP populations during the audit period.
2. The department’s internal controls were not sufficiently designed to identify and remove participants from the Medicaid or CHIP programs when participants misrepresent their household composition, sources of income, and residency in order to circumvent the programs’ eligibility requirements.
Additionally, the department’s own review of client records included in our sample supports a 5.8 percent error rate in ‘member month’ eligibility decisions. This means, for our sample population, eligibility verification or redetermination was not conducted timely and resulted in clients being determined (or remaining) eligible for Medicaid or CHIP benefits when in fact they were either not eligible or were placed into an incorrect eligibility category. As outlined in the finding, using the department determined error rate, errors in eligibility could equate to as much as $99.2 million and $98.2 million in inappropriate benefit payments for the CHIP and Medicaid programs, in total, for fiscal years 2018 and 2019, respectively, when projected to the population as a whole. As such, our recommendation stands.
C-32 Montana Legislative Audit Division

State of MontanaSchedule of Findings and Questioned Costs
For the Two Fiscal Years Ended June 30, 2019
Section III – Federal Award Findings and Questioned Costs
Finding 2019-002: U.S. Department of Health and Human Services CFDA # 93.775, 93.777, and 93.778, Medicaid Cluster Grant # 1705MT5MAP, 1805MT5MAP, 1905MT5MAP
Criteria: Federal regulation, 42 CFR 433.138(d)(1), requires the Department of Public Health and Human Services (department) to use the information from the state wage information collection agency (SWICA) and from the Social Security Administration (SSA) wage and earnings files data to identify Medicaid beneficiaries that are employed and their employers for purposes of identifying the legal liability of third parties.
Federal regulation, 42 CFR 433.138(g), requires follow-up on SWICA and SSA information within 45 days.
Federal regulation, 42 CFR 433.139, also requires the obligation of the third party be exhausted before Medicaid program costs are used, or if program costs are used, then reimbursement from the third party must be pursued so long as costs to seek reimbursement do not outweigh the total third party liability.
Attachment 4.22-A of the State of Montana Medicaid Plan states that the department conducts SWICA wage and earnings matches upon application and on a quarterly basis. The SSA match is conducted upon application and once a year thereafter.
Condition: During the audit period, the department did not conduct SWICA or SSA wage and earnings file data matches upon application for the Modified Adjusted Gross Income (MAGI)-based determination process. There is no amendment or waiver to Montana’s Medicaid Plan allowing these data matches or follow-up to be delayed for MAGI-based applicants.
Questioned Costs: None identified. However, questioned costs could exist for the MAGI-based applicants where third party obligor should have made payment prior to using Medicaid program funds.
Context: The practice of not conducting SWICA or SSA matches upon application is applicable to both state fiscal years 2018 and 2019.
C-33
18-02

Effect: By delaying the data matches for the MAGI-based applicants, the department has not complied with requirements of the State of Montana Medicaid Plan to identify potential third parties at application. Cause: For its MAGI-based applicants, the department follows its verification plan which indicates these same data matches are conducted within 90 days of application. Recommendation: We recommend the Department of Public Health and Human Services conduct State Wage Information Collection Agency and Social Security Administration data matches to identify potential liable third parties at application for all Medicaid applicants, as stated in the State of Montana Medicaid Plan.
Views of Responsible Officials: The department does not concur with this finding, stating, in part, it uses many methods to identify the legal liability of third parties and the auditors appear to take issue with the timing of one of the methods used. The department further indicates it follows its approved state plans with regards to SWICA interfaces. For additional information regarding the department’s planned corrective action see the Corrective Action Plan starting on page D-1.
Rebuttal of Views of Responsible Officials: We considered the department’s nonconcurrence to this finding. The department is correct that this finding takes issue with the timing of the SWICA and SSA interfaces. As outlined in the Condition, there is no amendment or waiver to Montana’s Medicaid Plan allowing these data matches or follow-up to be delayed for MAGI-based applicants. As such, the department has not followed its approved state plan in regard to TPL-related interfaces. Therefore, our recommendation stands.
C-34 Montana Legislative Audit Division

State of MontanaSchedule of Findings and Questioned Costs
For the Two Fiscal Years Ended June 30, 2019
Section III – Federal Award Findings and Questioned Costs
Finding 2019-003: U.S. Department of Health and Human Services CFDA # 93.775, 93.777, and 93.778, Medicaid Cluster Grant # 1705MT5MAP, 1805MT5MAP, 1905MT5MAP
Criteria: Per 42 CFR 455.14, if the Department of Public Health and Human Services (department) receives a complaint of Medicaid fraud or abuse from any sources or identifies any questionable practices, it must conduct a preliminary investigation. In accordance with 42 CFR 455.15, if a provider is suspected of fraud or abuse, the department must refer the case to the state Medicaid Fraud Control Unit (MFCU).
In addition, 2 CFR 200.303 requires non-Federal entities to, among other things, establish and maintain effective internal control over the Federal award that provides reasonable assurance that the non-Federal entity is managing the Federal award in compliance with Federal statutes, regulations, and the terms and conditions of the Federal award.
Condition: The department did not maintain adequate documentation of investigations of Medicaid providers, as required by federal regulation.
During the period under audit, new provider reviews made up over half of all provider investigations conducted by the department. Additionally, Chapter 82, Laws of 2017 Regular Session, established restrictions on overpayment audits including limiting records requests to a six-month period within three previous years, restricting follow-up audits to the same billing codes associated with the initial audit, requiring audits be completed in 90 days, and prohibiting projection of overpayments identified in the sample to a larger set of claims.
Questioned Costs: None identified.
Context: The department’s Surveillance Utilization Review Section (SURS) performs retrospective reviews of paid claims, recovers identified overpayments, and educates medical providers. The SURS unit closed 692 investigations during the audit period. From this list, we selected a sample of 40 closed case files. This was not a statistically valid sample. We reviewed the case file documentation for the 37 files provided and considered whether the department followed its guidelines which specify the basis for making a referral to MFCU. The department was unable to locate case files for the remaining three cases selected in our sample. For one of the 37 cases reviewed, the documentation in the case file was incomplete.
C-35
18-02

Effect: Absent complete documentation, the SURS unit decision on whether or not to make a referral to MFCU is not supported. Additionally, focusing on new provider reviews limits the department’s ability to identify potentially fraudulent or abusive billing practices by more established providers which make up a larger percentage of overall Medicaid claims and payments. Without changes in department policy and state law, the department’s ability to identify and fully investigate for provider fraud are hindered. During the 2019 Legislative session, Senate Bill 235 proposed such changes, but failed.
Cause: The department does not have adequate internal controls to ensure that documentation of provider investigations exists.
The department recognized its focus on new provider reviews required modification. Department management indicates quality improvement controls for record keeping were implemented by the SURS unit in May 2019. Additionally, the department claims it has improved new employee training to focus on record keeping, and has implemented internal reviews of new employee case files for completeness for a period of at least the first six months of employment.
Recommendation: We recommend the Department of Public Health and Human Services: A. Establish and maintain internal controls to ensure Surveillance Utilization Review Section
investigations for provider fraud are completely documented and retained, as required by federal regulations.
B. Implement changes in department policy and seek changes in legislation to remove restrictions on provider overpayment audits.
Views of Responsible Officials: The department partially concurs with this finding, and indicates, in part, “The ultimate responsibility for changes in legislation lies with the Legislative Branch, not the department.” The department’s response further states, “The department cannot implement policy that conflicts with state law.” The department’s complete response is included in the Corrective Action Plan starting on page D-1.
Rebuttal of Views of Responsible Officials: We considered the department’s partial concurrence to the finding. While the department agrees its documentation and retention of investigations can be strengthened, the department contends that seeking legislative change to remove restrictions on overpayment audits is outside the department’s control. While we agree the ultimate outcome of any change in statute is subject to the legislative process, the recommendation is that the department take action to begin the legislative process. Seeking legislation to change existing statute is routine agency-level activity. As such, our recommendation stands.
C-36 Montana Legislative Audit Division

State of MontanaSchedule of Findings and Questioned Costs
For the Two Fiscal Years Ended June 30, 2019
Section III – Federal Award Findings and Questioned Costs
Finding 2019-004: U.S. Department of Health and Human Services CFDA # 93.775, 93.777, and 93.778, Medicaid Cluster Grant # 1705MT5MAP, 1805MT5MAP, 1905MT5MAP
Criteria: Per 42 CFR 455.14, if the Department of Public Health and Human Services (department) receives a complaint of Medicaid fraud or abuse from any sources or identifies any questionable practices, it must conduct a preliminary investigation. In accordance with 42 CFR 455.15, if there is reason to believe that a beneficiary has defrauded the Medicaid program, the department must refer it to law enforcement. If there is reason to believe that a beneficiary has abused the Medicaid program, the department must conduct a full investigation of the abuse.
In addition, 2 CFR 200.303 requires non-Federal entities to, among other things, establish and maintain effective internal control over the Federal award that provides reasonable assurance that the non-Federal entity is managing the Federal award in compliance with Federal statutes, regulations, and the terms and conditions of the Federal award.
Condition: Internal controls to investigate referrals for Medicaid beneficiary fraud and abuse are not designed to ensure full investigations are conducted and referrals to law enforcement occur, as required by federal regulations.
Questioned Costs: None
Context: The Program Integrity Unit is responsible for investigating any case of alleged fraud and abuse by Medicaid beneficiaries. During the audit, we reviewed the department’s policies and procedures for investigations of Medicaid beneficiary fraud. Per department policy, Program Integrity Unit staff are directed to stop their investigation if fraud is not identified within the first 20 minutes of initial investigation. Additionally, department policy limits referrals of beneficiary fraud to law enforcement only if the established overpayment amount exceeds $10,000.
Department management indicated the policy was put into place in October 2018 as a time management tool to assist in addressing a backlog of referrals. Department management reported the policy limitations were removed in September 2019.
Effect: Absent the ability to conduct full investigations or to make complete referrals to law enforcement, the department is unable to demonstrate compliance with federal regulations.
C-37
18-02

Cause: Department policy does not allow for full investigation of fraud allegations or for referral to law enforcement of all instances where beneficiary fraud is reasonably possible, as required by federal regulation.
Recommendation: We recommend the Department of Public Health and Human Services:A. Update policies and procedures for Medicaid beneficiary fraud investigations to require full
investigations by department staff, andB. Make referrals to law enforcement when there is reason to believe a beneficiary has defrauded
the program, as required by federal regulations.
Views of Responsible Officials: The department does not concur with this finding, stating in part, “The auditors appear to take exception to time management guidelines included in desk level procedures. Those guidelines were removed in September 2019.” For additional information regarding the department’s planned corrective action see the Corrective Action Plan starting on page D-1.
Rebuttal of Views of Responsible Officials: We considered the department’s nonconcurrence to the finding. While the department represents the time restriction in its “desk level procedures” were a guideline for time management, as written, these procedures do not allow for a full investigation of fraud to be conducted. While the guidelines were removed in September 2019, the guidelines for initial review were in place during the audit period. As described in the finding, without adequate procedures, the department is unable to demonstrate compliance with federal regulations. As such, our recommendation stands.
C-38 Montana Legislative Audit Division

State of MontanaSchedule of Findings and Questioned Costs
For the Two Fiscal Years Ended June 30, 2019
Section III – Federal Award Findings and Questioned Costs
Finding 2019-005: U.S. Department of Health and Human Services CFDA # 93.775, 93.777, and 93.778, Medicaid ClusterGrants #1705MT5MAP, 1805MT5MAP, 1905MT5MAP, 1705MT5ADM, 1805MT5ADM, 1905MT5ADM, 1705MTIMPL, 1705MTINCT, 1805MTIMPL, 1805MTINCT, 1905MTIMPL, 1905MTINCT
Criteria: Per 2 CFR 200.326, contracts must contain applicable provisions for non-Federal entity contracts under federal awards. Appendix II to 2 CFR 200 lists those provisions including a provision that a contract award must not be made to parties listed on the governmentwide exclusions in the System for Award Management (SAM).
Federal regulation, 2 CFR 200.303, states that the Department of Public Health and Human Services (department) must establish and maintain effective internal control over the federal award that provides reasonable assurance that the non-federal entity is managing the federal award in compliance with federal statutes, regulations, and the terms and conditions of the award.
Condition: The department did not include the required language related to debarment and suspension in a contract for premium billing and collection services for the Medicaid program, and department internal controls did not identify or prevent the omission.
Questioned Costs: None identified.
Context: In an effort to modernize its Medicaid systems, the department is replacing its Medicaid Management Information System (MMIS). The replacement project is referred to as Montana’s Program for Automating and Transforming Healthcare (MPATH), with total estimated costs of $146 million for state fiscal years 2019 through 2021. As part of the audit, we obtained and reviewed 4 contracts related to this effort. We identified one contract in which the required language related to debarment and suspension was not included.
Department management provided the purchase order for the entity that bills and receives payments for these services. While the purchase order contains suspension and debarment language, we do not consider this to be a certification by the entity because the purchase order is not signed by the entity.
Effect: The department is not in compliance with federal regulations related to required contract language.
C-39
18-02

Cause: Department staff indicate that while the contractor was informed of the federal debarment requirements during the contracting process, the contract attachment relevant to suspension and debarment was inadvertently excluded from the final contract submitted to and signed by the contractor.
Recommendation: We recommend the Department of Public Health and Human Services: A. Establish and document internal controls to ensure all relevant contract disclosures and
attachments are included in the contract agreement prior to signature.B. Comply with federal regulations by including all applicable and required language in
Medicaid contracts with non-federal entities.
Views of Responsible Officials: The department does not concur with this finding, stating in part, “The auditor’s interpretation of what constitutes acceptance of contract terms and conditions is unnecessarily narrow.” The department indicates the Purchase Order contains a clause for debarment, and upon fulfilling the Purchase Order, the vendor has, in effect, made the representation. For additional information regarding the department’s planned corrective action see the Corrective Action Plan starting on page D-1.
Rebuttal of Views of Responsible Officials: We have considered the department’s nonconcurrence to the finding. The department’s response fails to address that its contract and Purchase Order are made with two different entities. At the time the contract was signed, the attachment relevant to debarment and suspension was omitted by the department. Subsequently providing a Purchase Order to a different entity does not eliminate the internal control weakness or noncompliance identified by the audit. As such, our recommendation stands.
C-40 Montana Legislative Audit Division

State of MontanaSchedule of Findings and Questioned Costs
For the Two Fiscal Years Ended June 30, 2019
Section III – Federal Award Findings and Questioned Costs
Finding 2019-006: U.S. Department of Health and Human ServicesCFDA # 93.767, Children’s Health Insurance Program (CHIP)Grant # 1705MT5021, 1705MT0301, 1805MT5R21, 1805MT5021, 1905MT5021
Criteria: Federal regulation, 42 CFR 457.310(b)(2), limits participation in the Children’s Health Insurance Program (CHIP) for targeted low-income children. Specifically, a targeted low-income child must be neither found eligible or potentially eligible for Medicaid under policies of the state plan, nor covered under a group health plan or health insurance coverage program, with certain exceptions.
Federal regulation, 2 CFR 200.303, states that the Department of Public Health and Human Services (department) must establish and maintain effective internal control over the federal award that provides reasonable assurance that the non-federal entity is managing the federal award in compliance with federal statutes, regulations, and the terms and conditions of the award.
Condition: Federal regulations permit one Medicaid eligibility group to receive CHIP funded health insurance premium payments. Department controls did not prevent other eligibility groups from receiving CHIP funded health insurance premium payments during the period under audit.
Questioned Costs: Payments totaling $30,310 are not an allowable use of CHIP funds, and are considered questioned costs. Using the error rate based on the transactions reviewed, total projected questioned costs are $3.5 million for the period under audit.
Context: Through its state plan, the department offers CHIP-funded Medicaid benefits for children six to eighteen years of age whose family income is between 101% and 143% of the federal poverty level. Because this group is covered by Medicaid, recipients may be members of the department’s Health Insurance Premium Payment (HIPP) program if the department determines it to be cost effective. Under the HIPP program, the department uses federal program dollars to pay the premiums for health insurance coverage for other insurance policies. Appropriate federal funds used for HIPP depend on the individual’s eligibility for either the Medicaid or CHIP programs.
When conducting a sample of CHIP benefit payments, we identified a portion of the transactions were health insurance premium payments. Because we did not expect this activity in our sample population, we isolated the HIPP transactions totaling $5.5 million to conduct a separate audit test. We selected and reviewed eleven of the 7,762 transactions for health insurance premiums. This was not
C-41
18-02

a statistically valid sample. Our review identified seven instances where the department should have used Medicaid funds instead of CHIP funds to pay the third-party health insurance premiums.
Effect: The department is not in compliance with federal regulations, and has expended CHIP monies for individuals who did not meet program requirements.
Cause: Department officials indicate the unallowable payments resulted from a lack of internal controls to ensure charging mechanisms used in the administration of HIPP payments were accurate and current. Additionally, department officials indicated the costs are allocated to a different department division whose staff is not aware of the specific details of the HIPP program, and is therefore unable to review the financial activity for accuracy.
Recommendation: We recommend the Department of Public Health and Human Services:A. Develop internal control procedures to ensure the appropriate funding source is used for its
Health Insurance Premium Payment program.B. Use federal Children’s Health Insurance Program funds to pay third-party health insurance
premiums only for those individuals who qualify, as required by federal regulations.
Views of Responsible Officials: The department concurs with this recommendation. For additional information regarding the department’s planned corrective action see the Corrective Action Plan starting on page D-1.
C-42 Montana Legislative Audit Division

State of MontanaSchedule of Findings and Questioned Costs
For the Two Fiscal Years Ended June 30, 2019
Section III – Federal Award Findings and Questioned Costs
Finding 2019-007: Various* Federal Agencies CFDA # Various*, Research and Development Cluster Grant # Not applicable
Criteria: Federal regulation, 2 CFR 200.303, requires non-Federal entities to, among other things, establish and maintain effective internal control over the Federal award that provides reasonable assurance that the non-Federal entity is managing the Federal award in compliance with Federal statutes, regulations, and the terms and conditions of the Federal award.
Federal regulation, 2 CFR 180.305, prohibits the University of Montana (university) from contracting with or making subawards under covered transactions to parties that are suspended and debarred.
Federal regulations, 2 CFR 180.210 and .220, state all nonprocurement transactions, irrespective of award amount, are considered covered transactions. Covered transactions include those procurement contracts for goods and services awarded under a nonprocurement transaction, a grant agreement for example, that are expected to equal or exceed $25,000 or meet certain other criteria.
Federal regulation, 2 CFR 180.300, requires the university to verify that entities with which it enters into a covered transaction with are not suspended and debarred or otherwise excluded from participating in the transaction.
Condition: The university enters into procurement transactions using research and development federal assistance funds. As part of the procurement process, vendors are selected from the university’s procurement system. The university did not have internal controls in place to verify if vendors were suspended and debarred as required by federal regulations.
Questioned Costs: No questioned costs identified.
Context: Per discussion with university staff, there was no process in place during the audit period. As part of our testing of federal compliance, we reviewed vendors who had entered into research and development transactions with the university. From a population of 342 transactions, we reviewed a sample of 39 vendors who had entered into research and development transactions during the audit period. We looked up the vendors on the System for Award Management, and none of the vendors were excluded. This was a statistically valid sample. In addition to this sample, we judgmentally tested an additional 46 items. None of the additional tested vendors were excluded.
C-43
18-02

Effect: The university was not in compliance with federal regulations and did not have sufficient internal controls in place to ensure transactions were not conducted with suspended and debarred vendors. Without internal control, there is risk the university will unknowingly enter into a transaction with an excluded party.
Cause: Per discussion with university staff in vendor maintenance, accounts payable, and procurement, they were not aware if or when the verification took place and they assumed a different office was completing the check.
Recommendation: We recommend the University of Montana comply with federal regulations by establishing internal controls to verify vendors are not suspended or debarred from federal procurement transactions.
Views of Responsible Officials: The university concurs with the recommendation and has contracted with a new supplier information management system which captures suspension and debarment alerts. These alerts are reviewed by the university’s vendor maintenance administrator. With the new system, suspended and debarred vendors will be excluded from the university’s procurement process. For additional information regarding the department’s planned corrective action see Corrective Action Plan starting on page D-1.
*-See Appendix A
C-44 Montana Legislative Audit Division

State of MontanaSchedule of Findings and Questioned Costs
For the Two Fiscal Years Ended June 30, 2019
Section III – Federal Award Findings and Questioned Costs
Finding 2019-008: U.S. Department of AgricultureCFDA # 10.551 and 10.561, SNAP ClusterGrant #: 201717S251443, 201818S251443, 201919S251443
CFDA #10.557, Special Supplemental Nutrition Program for Women, Infants and Children (WIC)
Grant #: 201818W100643, 201818W500343, 201818W100343, 201817W541243, 201818Y860743, 201818Y860443, 20919W100643, 201918W100643, 201919W500343, 201919W100343, 201918W100343, 201919Y860743, 201919Y860443
U.S. Department of Health and Human ServicesCFDA #93.558, TANF ClusterGrant #: 1701MTTANF, 1801MTTANF, 1901MTTANF
Criteria: Federal regulation, 7 CFR 274.1 (i), requires a yearly examination of the State Electronic Benefit Transfer (EBT) service provider for the SNAP Cluster. This is called a SOC-1 Type 2 examination, which is further defined and discussed below.
Federal regulations, 2 CFR 200.303 requires non-Federal entities to, among other things, establish and maintain effective internal control over the Federal award that provides reasonable assurance that the non-Federal entity is managing the Federal award in compliance with Federal statutes, regulations, and the terms and conditions of the Federal award. Effective internal controls should include establishing procedures to ensure eligibility determinations are performed in accordance with program requirements.
Condition: The Department of Public Health and Human Services (department) does not have adequate internal controls to ensure transactions were processed in compliance with federal SNAP, WIC and TANF program requirements. The department has not complied with federal requirements to obtain an examination of its EBT service provider for the SNAP program.
Questioned Costs: None identified.
C-45
18-02

Context: The department uses the same electronic benefit processing service provider (EBT service provider) for its SNAP, WIC and TANF federal programs. The EBT service provider is responsible for settlement, or payment, to retailers that have agreed to accept EBT cards for food (SNAP and WIC) or other (TANF) purchases. Because the TANF program provides cash assistance, EBT transactions are similar to those processed for any purchase made with a debit card.
The following table represents the total amount of benefits processed by the EBT service provider for fiscal years 2018 and 2019:
SNAP Cluster TANF Cluster WIC
FY 2018 $163 million $32 million $7.5 million
FY2019 $149 million $22 million $6.5 million
A System and Organization Controls (SOC) examination can be structured in various ways to meet the needs of intended users of information included in the SOC report. The following table outlines two types of SOC examinations:
SOC-1 Report SOC-2 Report
Relevant to Financial statements and complianceUsed to evaluate internal control over financial reporting and achieving compliance requirements.Focus is on controls at the service organization that would be useful to user entities or their auditors
Addresses risk and opportunity associated with information technology over the trust services framework which includes: security, availability, processing integrity confidentiality, or privacy
During the period under audit, the department received a SOC-2 Type 2 report for its EBT service provider. However, the SOC-2 report covered only the Security, Availability, and Confidentiality Trust Principles. The SOC-2 report did not address the Processing Integrity trust principle, which considers whether system processing is complete, accurate, timely and authorized.
While not required for the TANF and WIC programs, a SOC-1 Type 2 report provides the department and its auditors with assurances regarding proper design and operation of controls at the EBT service provider. The department did obtain a SOC-2 Type 2 report, but the report does not cover the Program Integrity trust principle which evaluates whether system processing is complete, accurate, timely, and authorized.
Prior to transitioning to the current EBT service provider in June 2017, the department conducted extensive testing and certification of system controls and processes for the SNAP program. Results of similar testing during the period prior to transition for the TANF and WIC programs, which were implemented in June 2017 and September 2017, respectively, were provided by the department. As a result, the department is able to demonstrate that the system was properly designed at the time of implementation for both the TANF and WIC programs.
Effect: Without the annual SOC-1 examination, the department is not in compliance with related SNAP program federal regulations. Additionally, without updated EBT service provider assurances
C-46 Montana Legislative Audit Division

provided by a SOC-1 report, the department is unable to fully demonstrate it has established and maintained adequate internal controls to ensure federal program requirements are met for its SNAP, TANF, and WIC programs for the entire audit period. Further, the department is at risk for reporting incomplete or inaccurate information to the federal government, providing incorrect benefit amounts to clients, and over- or under-drawing benefit reimbursements for its federal programs.
Cause: For the SNAP program, the department was unaware of the federal requirement to obtain an annual SOC-1 Type 2 examination by an independent auditor of the transaction processing of the EBT service provider. The department chose to obtain a SOC-2 Type 2 report for the EBT service provider, but overlooked the need to include the Processing Integrity Trust Principle relevant to system processing controls.
Recommendation: We recommend the Department of Public Health and Human Services:A. Obtain an annual SOC-1 Type 2 report over the Electronic Benefit Transfer service provider
for Supplemental Nutrition Assistance Program, as required by federal regulations.B. Establish and maintain adequate internal controls to ensure Supplemental Nutrition
Assistance Program, Temporary Assistance for Needy Families, and Special Supplemental Nutrition Program–Women, Infants and Children benefit transactions achieve applicable compliance requirements.
Views of Responsible Officials: The department partially concurs with this finding, citing that, in spite of the absence of SOC 1 Type 2 examination, it maintains there are significant controls in place to ensure benefit transactions achieve applicable compliance requirements. For additional information regarding the department’s planned corrective action see the Corrective Action Plan starting on page D-1.
Rebuttal of Views of Responsible Officials: We have reviewed the department’s partial concurrence with this finding. The department’s views do not contain any information not already considered during the audit. As such, we maintain our position as reported.
C-47
18-02

State of MontanaSchedule of Findings and Questioned Costs
For the Two Fiscal Years Ended June 30, 2019
Section III – Federal Award Findings and Questioned Costs
Finding 2019-009: U.S. Department of AgricultureCFDA #10.551 and 10.561, SNAP ClusterGrant #: 201717S251443, 201818S251443, 201919S251443
Criteria: Federal regulation, 2 CFR 200.303, states that the Department of Public Health and Human Services (department) must establish and maintain effective internal control over the federal award that provides reasonable assurance that the non-federal entity is managing the federal award in compliance with federal statutes, regulations, and the terms and conditions of the award.
Federal regulation, 7 CFR 274.4, requires a reconciliation comparing retailer credit activity as reported into the banking system to client transactions maintained by the processor to the funds drawn down by the state or contractor.
Condition: The department did not complete all required reconciliations over SNAP benefits information. Specifically, the department is required to compare the following three data sources to each other:
� Retailer transactions reported to the Electronic Benefit Transfer (EBT) banking system–these are transactions processed by the retailer (grocery store/vendor) on behalf of the SNAP client.
� Client transactions maintained by the EBT service provider–this is SNAP benefits redeemed. � Funds drawn for reimbursement from the federal treasury–as permitted by federal
regulations, the EBT service provider draws state benefit reimbursements directly from the federal government.
The two-way reconciliation completed by the department did not incorporate retailer transaction activity or the drawdown activity from the federal treasury. Consequently, department procedures do not cover the requirements set forth in federal regulations.
Questioned Costs: We believe questioned costs related to the SNAP program could exceed $25,000 for the audit period.
Context: A daily two-way reconciliation conducted by the department compares benefits issued per the department’s system to the benefits applied to client EBT cards according to EBT service provider reports. In our sample of 44 of these reconciliations, the department did not document the reason for the difference for 7 reconciliations. This was a statistically valid sample.
C-48 Montana Legislative Audit Division

While two-way reconciliations were conducted, the required three-way reconciliation was not completed. Additionally, when partial reconciliations were completed, the department did not consistently document its follow-up and resolution of differences identified.
Effect: Without all necessary reconciliations, the department is unable to confirm the accuracy of the SNAP benefits drawn by the EBT service provider on behalf of the State of Montana. Further, the department has no assurance that SNAP benefit draws were based on benefits redeemed by program participants at retailers.
Cause: For the required three-way reconciliations not completed, department staff believed there were adequate controls in place at the EBT service provider and relied on the EBT service provider to complete the reconciliations. However, the department was not able to provide evidence that required reconciliations were completed by the EBT service provider. Additionally, the department does not have evidence about the reliability of data or procedures, including reconciliations, involving procedures at the EBT service organization, as discussed in finding #2019-008.
Recommendation: We recommend the Department of Public Health and Human Services:A. Establish and maintain adequate internal controls to ensure reconciliations of SNAP benefits
issued, redeemed, and unredeemed are conducted, as required by federal regulations.B. Conduct and document follow-up on differences identified in required reconciliations.
Views of Responsible Officials: The department partially concurs with this finding, citing that necessary reconciliations required by FNS were conducted but not consistently documented to completion through follow-up of discrepancies identified. For additional information regarding the department’s planned corrective action see the Corrective Action Plan starting on page D-1.
Rebuttal of Views of Responsible Officials: We have reviewed the department’s partial concurrence with this finding. The department’s views do not contain any information not already considered during the audit. Absent documentation, the department is unable to fully demonstrate compliance with applicable federal compliance requirements. As such, we maintain our position as reported.
C-49
18-02

State of MontanaSchedule of Findings and Questioned Costs
For the Two Fiscal Years Ended June 30, 2019
Section III – Federal Award Findings and Questioned Costs
Finding 2019-010: U.S Department of AgricultureCFDA # 10.551 and #10.561, SNAP ClusterGrant #: 201717S251443, 201818S251443, 201919S251443
Criteria: Federal regulation, 31 CFR 205.6(b), specifies the Treasury State Agreement (TSA) is effective until terminated. Montana’s 2018 and 2019 TSAs described Modified Actual Clearance as the state requesting the amount of Electronic Benefit Transfer (EBT) benefits and fee payments processed the previous day. Per the TSA, the Department of Public Health and Human Services (department) should be completing the benefits draw process for the Supplemental Nutrition Assistance Program (SNAP).
The compliance supplement indicates states may authorize their Electronic Benefits Transfer (EBT) contractors to make benefit draws.
In addition, 2 CFR 200.303 requires non-Federal entities to, among other things, establish and maintain effective internal control over the Federal award that provides reasonable assurance that the non-Federal entity is managing the Federal award in compliance with Federal statutes, regulations, and the terms and conditions of the Federal award. Effective internal controls should include establishing procedures to ensure eligibility determinations are performed in accordance with program requirements.
Condition: The department has permitted the EBT service provider to execute over $300 million in federal cash draws for the SNAP program, which is contrary to the state’s TSA agreement. Additionally, the department did not provide an update to the TSA for changes in its processes.
Questioned Costs: To avoid duplication, questioned costs are reported in Finding 2019-009.
Context: Approximately $163 million and $149 million in reimbursement draws from the federal government for fiscal years 2018 and 2019, respectively, were executed directly by the EBT processor for the SNAP program.
Effect: Because the TSA specifies the department conducts the draws for SNAP benefits, permitting the EBT contractor to perform the draws results in noncompliance with the state’s TSA.
C-50 Montana Legislative Audit Division
Cause: Annually, the Department of Administration solicits input from state agencies regarding necessary changes to the TSA. The department overlooked the need to update the TSA when entering into the agreement with the EBT service provider.
Recommendation: We Recommend the Department of Public Health and Human Services:A. Work with the Department of Administration to properly update the Treasury State
Agreement for benefit draws related to the SNAP Cluster. B. Comply with the Treasury State Agreement by completing the SNAP Cluster benefit draws
from the federal government until such time as the Treasury State Agreement is revised.
Views of Responsible Officials: The department partially concurs with this finding, citing the administrative burden to conduct SNAP Cluster benefit draws is too significant to fully comply for the remainder of state fiscal year 2020. For additional information regarding the department’s planned corrective action see the Corrective Action Plan starting on page D-1.
Rebuttal of Views of Responsible Officials: We have reviewed the department’s partial concurrence with this finding. The department’s views do not contain any information not already considered during the audit. As such, we maintain our position as reported.
C-51
18-02

State of MontanaSchedule of Findings and Questioned Costs
For the Two Fiscal Years Ended June 30, 2019
Section III – Federal Award Findings and Questioned Costs
Finding 2019-011: U.S. Department of AgricultureCFDA #10.551 and 10.561, SNAP ClusterGrant #: 201717S251443, 201818S251443, 201919S251443
Criteria: Federal regulation, 2 CFR 200.303, states that the Department of Public Health and Human Services (department) must establish and maintain effective internal control over the federal award that provides reasonable assurance that the non-federal entity is managing the federal award in compliance with federal statutes, regulations, and the terms and conditions of the award.
Federal regulation, 7 CFR 272.10, requires the department to sufficiently automate its SNAP operations and computerize their systems for obtaining, maintaining, utilizing and transmitting information concerning SNAP. This includes:
� Determining eligibility, calculating benefits, or validating the eligibility worker’s calculations by processing and storing all information necessary for eligibility determination and benefit calculations, as well as identifying and alerting department staff and clients when eligibility or benefit changes occur.
� Providing an automatic cutoff of participation when annual renewal information and procedures are not provided.
� Generating data necessary to meet federal issuance and reconciliation reporting requirements. Specifically, the SNAP information system must produce data for the federal FNS-46 SNAP Issuance Reconciliation Report and the FNS-209 Status of Claims Against Households report.
Condition: The department’s internal controls related to use of the Automated Data Processing (ADP) systems for SNAP could be strengthened in the following areas: follow-up on results of the department’s eligibility audits, training for staff completing eligibility determinations, and adequate support for federal reports. Additionally, all portions of SNAP reporting are not automated by the ADP system, as required by federal regulation.
Questioned Costs: No questioned costs identified.
Context:
Eligibility Audits and Staff Training
We reviewed the top ten reasons for audit eligibility errors for each fiscal year 2018 and 2019 as reported by the department’s internal audits of SNAP eligibility determinations and
C-52 Montana Legislative Audit Division

benefits calculations because the department indicated these audits were a key control for the SNAP ADPA systems compliance requirement. Each of the ten reasons had underlying issues reported. We were testing to see if there were patterns to indicate the information in the department’s eligibility system (CHIMES) was inaccurate or that the system was not working effectively. In total, the department identified 9 instances where errors were the result of computer programming issues. Additionally, the department’s internal audits identified 48 errors due to incorrect case file information, and an additional 58 errors resulting from information being disregarded or not applied in eligibility determinations and benefit calculations. While the department shares results of the monthly eligibility audits with SNAP program staff, eligibility errors continued to remain high for the audit period. Our audit work did not include a sample.
Reporting
The department uses the Accounts Receivable Management System (ARMS) to track SNAP accounts receivable. While most of the information for the FNS-209 report is generated from ARMS, the beginning balance for the report must be manually adjusted. The department is able to retrieve accurate beginning balances from the federal system, but the beginning and ending balances are defined as key line items by federal regulations. As such, these balances should be automated in the department’s systems. While the department completes a daily reconciliation between the department’s eligibility system and the service organization’s system for newly issued SNAP benefits, the department does not complete and document a monthly reconciliation which supports the information included in the FNS-46 report.
Effect: The department is not in compliance with federal regulations. Additionally, the accuracy of information included in required federal reports is at risk due to identified deficiencies in internal controls.
Cause: The department cites staffing shortages and inadequate staff training as reasons for the increased eligibility errors.
The ARMS system does not is not designed to report beginning balances for the FNS-209 report.
The department contends the daily reconciliation is sufficient for purposes of the FNS- reports. The lack of System Organization Controls (SOC) assurances over its EBT service organization, as reported in #2019-008, also contributes to the internal control weakness.
Recommendation: We recommend the Department of Public Health and Human Services enhance internal control and compliance with federal regulations for the Supplemental Nutrition Assistance Program by:
A. Maintaining documentation to demonstrate consideration of the results of monthly Quality Assurance Division eligibility audits.
B. Conducting and documenting training for staff completing eligibility determinations to address common errors, when identified by monthly Quality Assurance Division eligibility audits.
C. Updating the Accounts Receivable Management System to automatically generate the beginning balances for the FNS-209 quarterly report, as required by federal regulations.
C-53
18-02

D. Ensure the FNS-46 report is supported by accurate information via an audit of the service organization or a monthly reconciliation.
Views of Responsible Officials: The department does not concur with this finding. The department suggests that the auditor has not addressed the “underlying issues associated with the error rate” in the recommendations. Finally, the department contends a daily reconciliation meets the federal requirements for the monthly FNS-46 report. For additional information regarding the department’s planned corrective action see the Corrective Action Plan starting on page D-1.
Rebuttal of Views of Responsible Officials: We have reviewed the department’s nonconcurrence with this finding. As discussed with the department throughout the audit, we reviewed the department-conducted audit results because the department noted these audits were an important control over the ADP system. In our review, trends identified indicate further training can assist department staff gather information and apply necessary corrections. Additionally, because the department’s monthly FNS-46 report is supported by the EBT contractor’s system over which the department has not obtained an independent SOC 1 Type 2 (as further discussed in Finding 2019-008), absent a documented monthly reconciliation, a daily undocumented visual check is insufficient to support the FNS-46 reports. We maintain our position as reported.
C-54 Montana Legislative Audit Division

State of MontanaSchedule of Findings and Questioned Costs
For the Two Fiscal Years Ended June 30, 2019
Section III – Federal Award Findings and Questioned Costs
Finding 2019-012: U.S. Department of Health and Human ServicesCFDA #93.558, TANF ClusterGrant # 1701MTTANF, 1801MTTANF, 1901MTTANF
Criteria: Federal regulation, 2 CFR 200.303, states that the Department of Public Health and Human Services (department) must establish and maintain effective internal control over the federal award that provides reasonable assurance that the non-federal entity is managing the federal award in compliance with federal statutes, regulations, and the terms and conditions of the award.
Federal regulations, 45 CFR 205.55 and 42 USC 1320b-7, require the department to twice annually coordinate data exchanges with other federally assisted benefit programs, to request and use income and benefit information when making eligibility determinations, and adhere to standardized formats and proceedings in exchanging information. One required data exchange is for unearned income information from the Internal Revenue Service (IRS).
Federal regulation, 45 CFR 205.56, directs the department to use the unearned information downloaded from the IRS, in conjunction with other information, for determining individuals’ eligibility for assistance under the State plan and determining the amount of assistance.
Condition: The department did not use information from the IRS in making eligibility determinations. Additionally, in some instances department procedures were insufficient to allow for IRS information obtained to be used.
Questioned Costs: None identified.
Context: Our prior audit reported the department obtained the required information but was not subsequently using the information in evaluating eligibility and assistance determinations. During the current audit, we determined the department was able to complete the IRS data comparison one of the four times it was required.
Repeat Finding: Montana’s prior Single Audit report for the two fiscal years ended June 30, 2017, included a recommendation (#2017-023) that the department comply with federal regulations by comparing income information obtained from the IRS to information contained in individual case records in order to determine the effect, if any, in individuals’ eligibility or amount of assistance.
C-55
18-02

Effect: The department did not comply with the required IRS data comparison for the audit period. Without fully using the IRS data to evaluate eligibility and assistance determinations, the department risks errors in benefit costs incurred for the TANF program.
Cause: In two instances where the data comparison was not completed, the department was unable to convert the IRS data into a usable format. In another instance, the department did not receive the file required from the IRS and did not follow-up to ensure data was received. Although the department requested information from the IRS, the department’s procedures did not instruct staff when or how to follow-up when a file was not returned from the IRS. Additionally, procedures documents did not instruct staff regarding the conversion of the IRS data. Department staff also suspect IRS files were not provided or were provided late due to the federal government shut downs.
Department management cites one section of United States Code which specifies no state shall be required to use the IRS information to verify the eligibility of all recipients. We agree the IRS information is not required to verify the eligibility of all recipients. However, other federal regulations require the IRS data be used in conjunction with other information for determining an individual’s eligibility and amount of assistance, as well as changes to eligibility.
Recommendation: We recommend, with respect to the Temporary Assistance for Needy Families program Income Eligibility and Verification System requirements, the Department of Public Health and Human Services:
A. Develop and maintain internal controls to ensure staff follow-up when the file from the IRS is not received timely, and properly convert the file to a usable format upon receipt.
B. Comply with federal regulations by comparing income information obtained from the Internal Revenue Service to information contained in the individual case records in order to determine the effect, if any, on individuals’ eligibility or amount of assistance.
Views of Responsible Officials: The department does not concur with this finding, and indicates the recommendations are not necessary, as the department is compliance with federal regulations with regard to use of the DIFSLA file. For additional information regarding the department’s planned corrective action see the Corrective Action Plan starting on page D-1.
Rebuttal of Views of Responsible Officials: We have reviewed the department’s nonconcurrence with this finding. As outlined in the finding, the department completed the required IRS data comparison one of the four times it was required. As such, the department has not complied with federal regulations with regard to the use of IRS information. Additionally, the department fails to fully recognize that IRS information is required by federal regulations in making eligibility determinations for individuals. We maintain our position as reported.
C-56 Montana Legislative Audit Division

State of MontanaSchedule of Findings and Questioned Costs
For the Two Fiscal Years Ended June 30, 2019
Section III – Federal Award Findings and Questioned Costs
Finding 2019-013: U.S. Department of Health and Human ServicesCFDA #93.558, TANF ClusterGrant # 1701MTTANF, 1801MTTANF, 1901MTTANF
Criteria: Federal regulation, 2 CFR 200.303, states that the Department of Public Health and Human Services (department) must establish and maintain effective internal control over the federal award that provides reasonable assurance that the non-federal entity is managing the federal award in compliance with federal statutes, regulations, and the terms and conditions of the award.
Federal regulations, 45 CFR 264.1 (c) and (e), specify the average number of families that include a head of household who has received assistance under any state program funded by federal Temporary Assistance for Needy Families (TANF) funds for more than 60 countable months may not exceed 20 percent of the average monthly number of all families to which the state has provided assistance during the current or immediately preceding fiscal year.
Condition: To ensure the limitation in federal regulation is achieved, the department uses a spreadsheet as its internal control to track clients receiving extended benefits. The department’s spreadsheet to track cases with extended benefits for the TANF program was incomplete.
Questioned Costs: None identified.
Context: The department maintains a spreadsheet to track the number of cases receiving TANF benefits beyond 60 months. During the audit, we compared the department’s tracking spreadsheet to a listing from the Combined Healthcare Information and Montana Eligibility System (CHIMES) system, and noted the department’s tracking spreadsheet was not complete. The spreadsheet listed 17 cases while the CHIMES report listed 35 cases.
Based on an average monthly TANF caseload of 3,614, the department may allow up to 723 TANF participants to exceed 60 countable months of assistance under the program. The prior year average monthly caseload was 4,355.
Effect: Although our audit did not identify an excess number of participants exceeding the 60-month limitation for TANF assistance, without maintaining an accurate tracking mechanism, the department is at risk of exceeding the limitation outlined in federal regulation.
C-57
18-02

Cause: The department cites human error as the reason the manual tracking spreadsheet was incomplete.
Recommendation: We recommend the Department of Public Health and Human Services develop and maintain internal controls, in accordance with federal regulations, to ensure its tracking spreadsheet for recipients of extended TANF Cluster benefits is complete.
Views of Responsible Officials:The department concurs with this recommendation. For additional information regarding the department’s planned corrective action see the Corrective Action Plan starting on page D-1.
C-58 Montana Legislative Audit Division

State of MontanaSchedule of Findings and Questioned Costs
For the Two Fiscal Years Ended June 30, 2019
Section III – Federal Award Findings and Questioned Costs
Finding 2019-014: U.S. Department of Health and Human ServicesCFDA #93.558, TANF ClusterGrant # 1701MTTANF, 1801MTTANF, 1901MTTANF
Criteria: Federal regulation, 2 CFR 200.303, states that the Department of Public Health and Human Services (department) must establish and maintain effective internal control over the federal award that provides reasonable assurance that the non-federal entity is managing the federal award in compliance with federal statutes, regulations, and the terms and conditions of the award.
Federal regulation, 45 CFR 265.3, require submission of quarterly Temporary Assistance for Needy Families (TANF) Financial Reports (ACF-196R).
Instructions for the ACF-196R reports specify: � A state should not revise unobligated funds in prior years once it liquidates the funds and
reports on them in future fiscal periods. � If a state revises an expenditure reported in a prior year which affects the amount of federal
unliquidated obligations, then it should revise the report.
Condition: Contrary to instructions for federal reporting, federal reports included expenditures which were incurred by the state after the reporting period ended.
Questioned Costs: None identified.
Context: We reviewed two of the eight ACF-196R reports required for the TANF program during the audit period. This was not a statistically valid sample. In the revised report submitted for the period ended September 30, 2018, which was revised in December 2018, we noted the department included expenditures which were not incurred by the state until after the reporting period had ended. Specifically, we noted total federal expenditures for the 2017 grant were over-stated by $2.2 million on the September 2018 report because the department had included costs incurred through December 2018.
Regarding the additional amounts reported by the department, because the costs were not incurred by the state until after September 30th, there is no impact on unliquidated obligations. Therefore, costs
C-59
18-02

incurred after September 30th should not be included on the report for the period ended September 30, 2018. Instead, these costs should be included on the appropriate federal award report for the federal fiscal year ending September 30, 2019.
Effect: The department has misrepresented federal expenditure activity in its reports to the federal government.
Cause: The department intentionally included adjustments in its September 30, 2018, federal report for costs incurred by the state after September 30, 2018.
Recommendation: We recommend the Department of Public Health and Human Services:A. Include only current cumulative expenditures in its federal Temporary Assistance for Needy
Families reports. B. Develop and implement internal controls to ensure only expenditures incurred during the
reporting period are included on federal Temporary Assistance for Needy Families reports.
Views of Responsible Officials:The department concurs with this recommendation. For additional information regarding the department’s planned corrective action see the Corrective Action Plan starting on page D-1.
C-60 Montana Legislative Audit Division

State of MontanaSchedule of Findings and Questioned Costs
For the Two Fiscal Years Ended June 30, 2019
Section III – Federal Award Findings and Questioned Costs
Finding 2019-015: U.S. Department of Health and Human ServicesCFDA #93.558, TANF ClusterGrant #: 1701MTTANF, 1801MTTANF, 1901MTTANF
CFDA #93.658, Foster Care–Title IV-EGrants #1701MTFOST, 1801MTFOST, 1901MTFOST
Criteria: Federal regulation, 2 CFR 200.317, requires the state to follow the same policies and procedures used for non-federal funds when procuring property and services under a federal award.
Federal regulation, 45 CFR 75.329, further specifies the type of procurement methods the Department of Public Health and Human Services (department) must follow for its public welfare programs.
Federal regulation, 2 CFR 200.88, requires a competitive process for all procurements in excess of $150,000.
The department is delegated certain purchasing authority from the Department of Administration’s Procurement Bureau. Under the delegation agreement, the department may use the following purchasing methods:
� Small Purchases – for total contract value of $5,000 or less, the department may choose a purchasing technique that best meets its needs.
� Limited Solicitations – for total contract value between $5,001 and $25,000, the department must obtain and document prices from a minimum of three viable sources.
� Formal Competition – for total contract value between $25,001 and $200,000, the department must use either an invitation for bid or request for proposal process.
� Sole Source – for total contract value up to $200,000, the department determines whether a purchase qualifies as sole source.
Condition: Contrary to state procurement policies and federal regulations, the department continues to make payments to vendors for services without having a contract in place.
Questioned Costs: We question $805,539 in costs for the Temporary Assistance for Needy Families (TANF) program for the audit period.
C-61
18-02

Context: The department can use a portion of its federal TANF funds to pay costs associated with children in Foster Care. During the audit period, the department did not follow federal regulations and state procurement policies when incurring over $6 million in total costs from all funding sources for nonmedical services for the Foster Care program. Our review was limited to service costs for one-on-one supervision of youth, chemical dependency evaluations, urine analyses, and support services for a child placed in the Foster Care program. This was not a statistically valid sample. Our prior audit determined these services did not meet the statutory exemption in state law for services from health care providers because these services are not provided by health care providers. We identified four vendors whose total annual payments exceeded the department’s delegation agreement level of $200,000, which requires approval from the Department of Administration. For these four vendors, the total annual payments exceeded the $150,000 federal threshold which requires a competitive procurement process.
Repeat Finding: Montana’s prior Single Audit report for the two fiscal years ended June 30, 2017, included a recommendation (#2017-024) that the department comply with state laws and federal regulations by following state procurement policies to obtain services for the TANF and Foster Care programs. The department disagreed with our recommendation as they believe the services in question are exempt from procurement requirements based on state statute. The federal Administration for Children and Families sustained the finding and recommendation, but did not pursue a monetary penalty against the department.
Effect: By not following applicable procurement procedures, payments to these vendors are not an allowable use of TANF funds.
Cause: The department believes the exclusions in law for medical services (section 18-4-132, Montana Code Annotated) apply to these services.
Recommendation: We recommend the Department of Public Health and Human Services comply with state law and federal regulations by following state procurement policies to obtain services for one-on-one supervision of youth, chemical dependency evaluations, urine analyses, and support serviced for a child placed in the Foster Care program using Temporary Assistance for Needy Families funds.
Views of Responsible Officials: The department does not concur with this finding, citing it complies with state procurement policies and federal regulations. For additional information regarding the department’s planned corrective action see the Corrective Action Plan starting on page D-1.
Rebuttal of Views of Responsible Officials: We have reviewed the department’s nonconcurrence with this finding. The department’s views do not contain any information not already considered during the audit. As such, we maintain our position as reported.
C-62 Montana Legislative Audit Division

State of MontanaSchedule of Findings and Questioned Costs
For the Two Fiscal Years Ended June 30, 2019
Section III – Federal Award Findings and Questioned Costs
Finding 2019-016: U.S. Department of Health and Human ServicesCFDA #93.658, Foster Care – Title IV-EGrants #1701MTFOST, 1801MTFOST, 1901MTFOST
Criteria: Federal regulation, 2 CFR 200.331 (a), requires the subrecipient be informed of the federal award information. Required disclosures include, but are not limited to:
� The federal award identification number, � Amount of federal fund obligated to the subrecipient, � Applicable indirect cost rates for the federal award, � CFDA title and number, � Federal awarding agency, � Award name and number, � Award year, � Permission for department officials and auditors to have access to the subrecipient’s records,
and � Terms and conditions concerning the closeout of the subaward.
Federal regulation, 2 CFR 200.303, states that the Department of Public Health and Human Services (department) must establish and maintain effective internal control over the federal award that provides reasonable assurance that the non-federal entity is managing the federal award in compliance with federal statutes, regulations, and the terms and conditions of the award.
Condition: Department procedures did not detect omissions from subrecipient agreements, and the department did not include the required subrecipient disclosures in newly signed subrecipient agreements with the state’s tribal organizations for the Foster Care program.
Questioned Costs: No questioned costs identified.
Context: In November 2017, the department signed new agreements with seven tribal organizations. None of these new agreements include the required subrecipient disclosures. In addition, the department’s agreements with two colleges/universities which provide services under the Foster Care program are also missing the required subrecipient disclosures.
C-63
18-02
Repeat Finding: In Montana’s Single Audit for the two fiscal years ended June 30, 2015, we recommended (#2015-014) the department properly classify its agreements with the state’s tribal organizations as subrecipients, and comply with all federal regulations regarding subrecipients. Because the department had incorrectly classified the tribal organizations as vendors rather than subrecipients, the related agreements with the tribal organizations were missing required subrecipient disclosures. In Montana’s Single Audit for the two fiscal years ended June 30, 2017, we concluded the recommendation was partially implemented and made no further recommendation because the department represented it intended to include the subrecipient language in the next tribal agreements which were due in fiscal year 2018.
Effect: The department has not complied with federal regulations regarding required subrecipient disclosures. Additionally, failure to provide subrecipients with the required federal award information increases the risk of subrecipient noncompliance with federal requirements.
Cause: Department staff overlooked the need to include the subrecipient disclosures for the newly signed Foster Care contracts.
Recommendation: We recommend the Department of Public Health and Human Services:A. Establish and document internal controls to ensure required subrecipient disclosures are
included in Foster Care contract agreements prior to signature.B. Ensure the required subrecipient disclosures are included in Foster Care contract agreements,
as required by federal regulations.
Views of Responsible Officials:The department concurs with this recommendation. However, the department indicates recommendations part A and B are redundant. For additional information regarding the department’s planned corrective action see the Corrective Action Plan starting on page D-1.
Rebuttal of Views of Responsible Officials: We have reviewed the department’s concurrence with this finding, and provide the following clarification. Recommendation part A addresses a material weakness in internal control over subrecipient monitoring. Recommendation part B addresses the absence of required subrecipient disclosures in subrecipient agreements, which is noncompliance with federal regulations. We maintain our position as reported.
C-64 Montana Legislative Audit Division

State of MontanaSchedule of Findings and Questioned Costs
For the Two Fiscal Years Ended June 30, 2019
Section III – Federal Award Findings and Questioned Costs
Finding 2019-017: U.S. Department of Health and Human ServicesCFDA #93.658, Foster Care – Title IV-EGrants #1701MTFOST, 1801MTFOST, 1901MTFOST
Criteria: Federal regulation, 2 CFR 200.403 (g), specifies costs must be adequately documented to be allowable under the award.
Federal regulation, 45 CFR 1356.60(b)(2), requires all training activities and costs funded under Title IV-E be included in the Department of Public Health and Human Service’s (department) training plan for Title IV-B.
Regarding training plans for the Foster Care program, federal regulation, 45 CFR 235.63, in part, specifies federal financial participation in costs are available when certain conditions are met. These conditions include, but are not limited to:
� Grants to educational institutions must be made for the purpose of developing, expanding, or improving training for personnel employed by the state or individuals preparing for employment by the state. Grants are made for an educational program (curriculum development, classroom instruction, field instruction, or any combination of these) that is directly related to the department’s training program.
� For stipends, persons preparing for employment are selected by the state agency and accepted by the school.
Federal regulation, 45 CFR 235.65, specifically disallows salaries of supervisors from participation in federal match.
Federal regulation, 2 CFR 200.303, requires non-Federal entities to, among other things, establish and maintain effective internal control over the Federal award that provides reasonable assurance that the non-Federal entity is managing the Federal award in compliance with Federal statutes, regulations, and the terms and conditions of the Federal award.
Condition: The department incurred training related costs without obtaining detailed documentation to support the costs were allowable under the federal Foster Care requirements. Additionally, department controls for certain Foster Care payments require strengthening.
Questioned Costs: We estimate questioned costs totaling $969,176 for the period under audit. Likely questioned costs could exceed $4 million, the value of college training contracts, if other services
C-65
18-02

billed by the college do not align with federal program requirements or do not directly benefit the department’s Foster Care training program.
Context: The department maintains Foster Care contracts with seven tribes and two colleges/universities (colleges). Foster Care IV-E funds are provided to these entities to either help administer the Foster Care program, provide stipends to college students studying social work, or to provide training to department staff.
We conducted a sample of 17 invoices from a total of 176 transactions totaling $4.1 million which were submitted by the tribes or the colleges. Our sample was not statistically valid. We identified 15 instances where supporting documentation did not exist or supporting documentation was not detailed enough to determine whether the costs were allowable. Examples for each a college and tribal payment are described below.
� Support for one college invoice consisted of a printout of monthly expenditures incurred by a college, but there were no supporting receipts or details to indicate what was purchased. The listing also showed payroll costs incurred, but supporting documentation was neither specific as to which employees were paid nor for what purpose. As such, we were unable to determine whether the costs incurred by the college were authorized under the contract and allowable for reimbursement via the Foster Care program.
� Support for one tribal payment consisted of a standardized billing invoice, which is utilized by all of the tribes, that outlined personnel positions under the contract, the individual salaries including fringe benefits of the personnel, and operating expenditures. Because no other support was provided by the tribe, we could not verify if the expenditures outlined on the invoice actually were incurred.
Of the 17 invoices tested, 8 were transactions related to training costs. Because the invoices did not specify which training task for which the department was being billed, we reviewed the entire contract in comparison to the associated training plan. Our review identified several costs outlined in the contract which were not included in the training plan as well as contract budget items which are specifically disallowed or only permitted under specific circumstances under federal regulations, as summarized in the following table:
Foster Care Contract Items Not Allowed Under Federal Regulations
Contract Budget Item Contract Budget Amount
Salaries for Directors/Supervisors $408,176
Stipends (basic living allowance paid to a student) $561,000
Total $969,176
Salaries for directors and supervisors are allowed at 50% of the associated costs if certain conditions are met. We noted in our review of both the contract budgets and associated payments that federal monies were the only source of funding planned and spent on these activities. For stipends, the department inappropriately delegated selection of stipend recipients to the college. Additionally, department
C-66 Montana Legislative Audit Division
management claims department staff actively participated in the selection process for stipend recipients. However, the department did not provide evidence to support this claim. As such, the costs associated with salaries and stipends are not allowable under federal regulations.
Effect: Without adequate supporting documentation, the department is unable to demonstrate compliance with internal control requirements in federal regulation. Additionally, for payments which lack adequate support, the department incurred costs for unallowable activities under the federal award.
Cause: For tribal subrecipient payments, the department believes the documentation it maintains is sufficient. Billing forms submitted to the department contain summarized information for wages, benefits, travel costs, and other administrative cost categories. We did not observe evidence where additional supporting documentation other than the billing form was obtained. Department staff indicate they do not review supporting documentation when performing site visits for the tribes. Additionally, the department contends its contract with colleges include directives on appropriate accounting and billing practices, as well as language which would allow for the acquisition of additional information if there is a billing question. However, during the audit period the department did not request such clarifying information to ensure the underlying activity was for allowed activities related to its training program.
Recommendation: We recommend the Department of Public Health and Human Services:A. Reimburse colleges and tribes only for activities allowed by federal regulation for the Foster
Care program.B. Design and implement internal control to ensure detailed support for college and tribal
invoices is obtained, reviewed, and approved prior to payment.
Views of Responsible Officials: The department concurs with this recommendation. For additional information regarding the department’s planned corrective action see the Corrective Action Plan starting on page D-1.
C-67
18-02

State of MontanaSchedule of Findings and Questioned Costs
For the Two Fiscal Years Ended June 30, 2019
Section III – Federal Award Findings and Questioned Costs
Finding 2019-018: U.S. Department of Health and Human ServicesCFDA #93.658, Foster Care – Title IV-EGrants #1701MTFOST, 1801MTFOST, 1901MTFOST
Criteria: Instructions for completion of the CB-496 report indicate the Federal Share of Child Support Collections includes child support collections on behalf of Title IV-E eligible children on whose behalf maintenance assistance payments have been reported in either Part 1 or Part 3 of the CB-496 report.
Federal regulation, 2 CFR 200.303, requires non-Federal entities to, among other things, establish and maintain effective internal control over the Federal award that provides reasonable assurance that the non-Federal entity is managing the Federal award in compliance with Federal statutes, regulations, and the terms and conditions of the Federal award.
Condition: The department lacks internal control to ensure all required information is included in Foster Care CB-496 reports, which resulted in incomplete and inaccurate reports submitted during the audit period.
Questioned Costs: None identified.
Context: Child support recoveries are required to be included in Line 1 of the CB-496 Foster Care reports. This information was not included in 4 out of 8 reports submitted for the period under audit.
Effect: The department is unable to demonstrate compliance with internal control requirements in federal regulation. Additionally, without adequate internal control, the department submitted and continues to risk submitting incorrect and incomplete information in its Foster Care reports.
Cause: Due to a change in the procedures document, internal control procedures did not direct department staff to include child support collections in Line 1 of the CB-496 report. Additionally, department staff indicate child support recoveries are less than $20,000 per quarter, and as such the variance between quarters was not significant enough to trigger additional follow-up prior to report submission.
C-68 Montana Legislative Audit Division

Recommendation: We recommend the Department of Public Health and Human Services: A. Design and implement internal control to ensure child support recoveries are properly
reported on its Foster Care CB-496 reports.B. Submit complete and accurate information in its Foster Care CB-496 reports.
Views of Responsible Officials:The department concurs with this recommendation. For additional information regarding the department’s planned corrective action see the Corrective Action Plan starting on page D-1.
C-69
18-02

State of MontanaSchedule of Findings and Questioned Costs
For the Two Fiscal Years Ended June 30, 2019
Section III – Federal Award Findings and Questioned Costs
Finding 2019-019: U.S. Department of Health and Human ServicesCFDA # 93.575 and 93.596, CCDF ClusterGrant #: 2017G996005, 2018G996005, 2019G996005, 2017G999004, 2018G999004, 2019G9990042017G999005, 2018G999005, 2019G999005
Criteria: Federal regulation, 2 CFR 200.303, states that the Department of Public Health and Human Services (department) must establish and maintain effective internal control over the federal award that provides reasonable assurance that the non-federal entity is managing the federal award in compliance with federal statutes, regulations, and the terms and conditions of the award.
Federal regulation, 45 CFR 98.60, requires Discretionary Funds to be obligated by the end of the 2nd fiscal year after the award, Mandatory Funds to be obligated by the end of the fiscal year in which the funds are granted (when Matching Funds are received), and both the Federal and non-Federal share of Matching Funds to be obligated in the fiscal year in which the funds are granted.
Federal regulation, 45 CFR 98.55(3), requires all Mandatory Funds for states to be obligated by the end of the fiscal year in which they are awarded prior to receiving Federal Matching Funds. This section also indicates federal matching funds are available for expenditures based on a formula, for allowable activities as described in the approved state plan.
Obligation is defined by federal regulation, 45 CFR 75.2, as orders placed for property and services, contracts and subawards made, and similar transactions during a given period that require payment by the non-Federal entity during the same or a future period. Federal regulation, 45 CFR 98.6, does allow for obligations of funds occurring upon entering into agreement through a subgrant with the third party issuing certificates to a family.
Condition: The department does not have internal controls in place to ensure CCDF funds are obligated as required by federal regulations, and complete evidence of such obligation has not been provided by the department. As such, we can only conclude the department has not obligated its Mandatory or Discretionary Funds. Additionally, because the department has not obligated its Mandatory Funds, it is not eligible to receive federal Matching Funds.
Questioned Costs: We question Matching Funds received by the department totaling $9,158,195. We also question unobligated Mandatory Funds of $3,166,460.
C-70 Montana Legislative Audit Division

Context: In both fiscal years under audit, the department received a Matching Fund grant for CCDF. The department must obligate its Mandatory Funds prior to being eligible to receive Matching Funds.
Under the CCDF program, the department contracts with entities around the state who evaluate needs and authorize certificates to families for reduced cost child care. In relation to these contracts, we requested support to confirm the Mandatory and Matching funds were obligated by the end of the fiscal year they were granted, as required by federal regulations. The department responded they obligate the Mandatory Funds through their certificate plans using historical data and projections based on caseload. Federal regulations allow for an obligation to occur when there is a contract with a third-party for determining eligibility and issuing child care certificates. While the department provided a chart to demonstrate expenditures tracking, the tracking mechanism lacked detail by individual federal grant award or by types of expenditure such as certificates or grant payments. As such, we have no evidence to confirm full obligation of each federal grant award occurred within the required time frame.
Effect: The department is not in compliance with federal regulations.
Cause: When we communicated a control issue related to period of performance, the department provided other controls related to the federal program but did not explain controls related to the period of performance by each funding type. The department noted they estimate obligations based on historical data and project based on caseload to determine and report obligation. Documentation provided by the department lacked sufficient detail to demonstrate compliance.
Recommendation: We recommend the Department of Public Health and Human Services:A. Develop internal controls to document the obligation of all funding types for the Child Care
Development Fund federal award.B. Ensure obligation for Mandatory, Discretionary, and Matching funds for federal Child Care
Development Fund awards occurs within the timelines required in federal regulation.
Views of Responsible Officials: The department does not concur with this finding. The department contends the obligation of child care funds are supported by documented historical data which,
“informs completion of the ACF 696 obligations.” The department further indicates if the ACF 696 report had not been done correctly, the federal matching funds could not have been released. For additional information regarding the department’s planned corrective action see the Corrective Action Plan starting on page D-1.
Rebuttal of Views of Responsible Officials: We have reviewed the department’s nonconcurrence with this finding. The department’s views do not contain any information not already considered during the audit. As described in the finding, the historical data provided by the department lacked sufficient detail to demonstrate compliance with the federal compliance requirements. As such, we maintain our position as reported.
C-71
18-02
State of MontanaSchedule of Findings and Questioned Costs
For the Two Fiscal Years Ended June 30, 2019
Section III – Federal Award Findings and Questioned Costs
Finding 2019-020: U.S. Department of Health and Human ServicesCFDA # 93.575 and 93.596, CCDF ClusterGrant # 2017G996005, 2018G996005, 2019G996005, 2017G999004, 2018G999004, 2019G999004, 2017G999005, 2018G999005, 2019G999005
Criteria: Federal regulation, 45 CFR 98.41, requires the Department of Public Health and Human Services (department) to ensure child care providers serving children who receive subsidies meet ten specific health and safety requirements, such as prevention and control of infectious diseases, prevention of sudden infant death syndrome and use of safe sleeping practices, and building and physical premises safety.
Federal regulation, 2 CFR 200.303, states that the department must establish and maintain effective internal control over the federal award that provides reasonable assurance that the non-federal entity is managing the federal award in compliance with federal statutes, regulations, and the terms and conditions of the award.
Condition: The department’s internal control did not ensure federally required elements were included in its health and safety inspections of day-care facilities which resulted in noncompliance with federal regulations.
Questioned Costs: No questioned costs identified.
Context: Beginning February 28, 2018, the date of the department’s extension provided by the federal government, ten health and safety requirements required for child care providers receiving subsidies became effective.
The department completes inspections of day-care facilities using a “Key Indicator Summary” or KIS for lower risk facilities. During the audit, we tested health and safety elements items against the KIS inspection template, because the KIS inspections include the least amount of testing by the department, they are therefore the riskiest in terms of not having all the required elements. Most of the health and safety elements were not being tested by the department via the KIS inspections during fiscal year 2018. Some, but not all, missing elements were incorporated to the KIS in fiscal year 2019. See the summary in the table below.
C-72 Montana Legislative Audit Division

Required Health and Safety Standard Required Elements Included on Monitoring Form or Desk Review Audit Observations for Items Omitted
Prevention and control of infectious diseases (including immunization) Partially included on Monitoring Form
State rules do not allow a grace period for homelessness or for children in Foster Care, as required by federal regulation
Prevention of sudden infant death syndrome and use of safe sleeping practices
Included in Desk ReviewFor four months of the audit period, the department did not test all required safe sleeping elements
Administration of medication consistent with standards for parental consent Yes
Prevention of and response to emergencies due to food and allergic reactions
Partially included on Monitoring Form
The requirement for facilities to have a plan for preventing and responding to food and allergic reaction emergencies is missing from the monitoring form
Building and physical premises safety YesElectrical hazards are omitted from the monitoring tool for four months of the audit period
Prevention of shaken baby syndrome and abusive head trauma Included in Desk Review Trainings have not been added to the
monitoring tool for fiscal year 2019
Emergency preparedness and response planning for emergencies No
State policy was added during the audit period, but emergency plans are missing from the monitoring tool
Handling and storage of hazardous materials and appropriate disposal of bio contaminants
Partially included on Monitoring Form
State policy was added during the audit period, but handling and storage of hazardous materials and disposal of bio contaminants are missing from the monitoring tool
Precautions in transporting children Yes
First aid and cardiopulmonary resuscitation Included in Desk Review Documentation of training is not included
on the monitoring form.
Effect: The department is not in compliance with federal regulations.
Cause: Department staff indicate they do not update the monitoring form each year. Additionally, department staff said they overlooked certain elements of the health and safety requirements because the department previously required the emergency plan and fire drill record be submitted and therefore not included in the checklist.
Recommendation: We recommend the Department of Public Health and Human Services:A. Ensure all health and safety standards are considered in its reviews of day-care facilities, as
required by federal regulation.B. Enhance internal control by updating its day-care monitoring form to ensure all health and
safety elements are included.
Views of Responsible Officials:The department concurs with this recommendation. For additional information regarding the department’s planned corrective action see the Corrective Action Plan starting on page D-1.
C-73
18-02

State of MontanaSchedule of Findings and Questioned Costs
For the Two Fiscal Years Ended June 30, 2019
Section III – Federal Award Findings and Questioned Costs
Finding 2019-021: U.S. Department of Health and Human ServicesCFDA #93.575, 93.596, CCDF Cluster Grant #: 2017G996005, 2018G996005, 2019G996005, 2017G999004, 2018G999004, 2019G999004, 2017G999005, 2018G999005, 2019G999005
Criteria: Federal regulation, 45 CFR 98.60, (i), requires the Department of Public Health and Human Services (department) to recover child care payments that are the result of fraud. These payments shall be recovered from the party responsible for committing the fraud.
Federal regulation, 2 CFR 200.303, requires non-Federal entities to, among other things, establish and maintain effective internal control over the Federal award that provides reasonable assurance that the non-Federal entity is managing the Federal award in compliance with Federal statutes, regulations, and the terms and conditions of the Federal award.
Condition: The department did not attempt to recover overpayments from recipients in 8 out of 11 cases identified as fraud by the department during the audit period.
Questioned Costs: We identified questioned costs totaling $20,014.
Context: In response to the prior audit, the department developed an internal control procedure to use a communication form to convey fraudulent overpayment information to Business and Financial Division (BFSD). The communication form was completed for 10 of 11 fraudulent overpayments identified during the audit. However, repayment was only sought for 3 of the 11 fraud cases.
Repeat Findings: Montana’s Single Audit for the two fiscal years ended June 30, 2017, included a recommendation (#2017-022) to the department to develop internal control procedures to ensure coordination between Child Care Development Fund (CCDF) program staff and BFSD staff for recovering overpayments resulting from fraud, and to seek timely recovery for all identified fraudulent child care overpayments.
Effect: The department did not comply with the requirements to recover fraudulent overpayments.
Cause: While overpayments were communicated to BFSD, the employee entering cases into the system which tracks overpayments was using an outdated procedure that indicated the cases should be
C-74 Montana Legislative Audit Division
marked with an indicator which prevents a recovery invoice from being generated.
Recommendation: We recommend the Department of Public Health and Human Services:A. Develop internal control procedures for the Child Care Development Fund program to
confirm letters have been sent and collections initiated when required for fraud cases. B. Comply with federal regulations by seeking timely recovery of all identified fraudulent child
care overpayments for the Child Care Development Fund program.
Views of Responsible Officials:The department concurs with this recommendation. For additional information regarding the department’s planned corrective action see the Corrective Action Plan starting on page D-1.
C-75
18-02

State of MontanaSchedule of Findings and Questioned Costs
For the Two Fiscal Years Ended June 30, 2019
Section III – Federal Award Findings and Questioned Costs
Finding 2019-022: U.S. Department of AgricultureCFDA #10.551 and 10.561, SNAP ClusterGrant #: 201717S251443, 201818S251443, 201919S251443
U.S. Department of Health and Human ServicesCFDA #93.558, TANF ClusterGrant # 1701MTTANF, 1801MTTANF, 1901MTTANF
CFDA #93.563, Child Support EnforcementGrants #17504MTCSES, 18504MTCSES, 1901MTCSES, 1704MTCSET, 1804MTCSET, 1904MTCSET
CFDA #93.575 and 93.596, CCDF ClusterGrants # 2017G996005, 2018G996005, 2019G996005, 2017G999004, 2018G999004, 2019G999004, 2017G999005, 2018G999005, 2019G999005
CFDA #93.658, Foster Care – Title IV-EGrants #1701MTFOST, 1801MTFOST, 1901MTFOST
CFDA # 93.767, Children’s Health Insurance Program (CHIP)Grant # 1705MT5021, 1705MT0301, 1805MT5R21, 1805MT5021, 1905MT5021
CFDA #93.775, 93.777, and 93.778, Medicaid ClusterGrants #1705MT5MAP, 1805MT5MAP, 1905MT5MAP, 1705MT5ADM, 1805MT5000, 1805MT5ADM, 1905MT5000, 1905MT5ADM, 1705MTIMPL, 1705MTINCT, 1805MTIMPL, 1805MTINCT, 1905MTIMPL, 1905MTINCT
Criteria: Federal regulation, 2 CFR Appendix VI, in part, requires the state public assistance agency to develop, document, and implement a public assistance cost allocation plan in accordance with federal regulations.
Federal regulation, 2 CFR 200.416, in part, requires there to be a process whereby central service costs can be identified and assigned to benefitted activities on a reasonable and consistent basis.
C-76 Montana Legislative Audit Division

Federal regulation, 2 CFR 200.303, states that the Department of Public Health and Human Services (department) must establish and maintain effective internal control over the federal award that provides reasonable assurance that the non-federal entity is managing the federal award in compliance with federal statutes, regulations, and the terms and conditions of the award.
Federal regulation, 45 CFR 95.517, specifies the department may claim federal financial participation costs associated with a program only in accordance with its approved cost allocation plan, or, at its option, the department may claim federal financial participation based on a proposed plan or plan amendment if the plan or plan amendment has been submitted to the federal government.
Condition: The department did not follow its federally approved plan to allocate costs among state and federal funding sources. Additionally, department internal controls did not identify these inconsistencies.
In our sample of costs allocated by the department, we noted the following exceptions to compliance with the applicable cost allocation plan:
� For the Operations Branch Manager Indirect Cost Pool, costs should be allocated by full-time equivalent (FTE) staff who are directly supervised by the Operations Services Branch Manager. We tested the November 2018 and December 2018 allocations, and noted in each month the department did not include all FTE which are directly supervised by the branch manager.
� For the Financial Technical Analyst Indirect Cost Pool, the department began using a new allocation method in June 2018, prior to its September 2018 submission to request an amendment to its Cost Allocation Plan.
� The Technology Services Division (TSD) Administrator Indirect Cost Pool is allocated by FTE directly supervised by the TSD Administrator. We reviewed the June 2019 allocation, and noted FTE not supervised by the TSD Administrator were included in the pool. For the September 2017 and July 2018 allocations, costs associated with one FTE were inappropriately excluded from the calculation.
� Costs associated with the County Use Allowance Indirect Cost Pool were allocated beginning in July 2017, but the pool was not included in the department’s Cost Allocation Plan until May 2018.
� The Reimbursement Travel Indirect Cost Pool was utilized by the department for at least nine months prior to its inclusion in the department’s Cost Allocation Plan in May 2018.
� The April 2018 allocation for the Office of the Medicaid and Health Services Branch Manager Indirect Cost Pool is considered an error because the department used time and effort reporting as its allocation method, rather than FTE directly supervised by the Medicaid and Health Services Branch Manager, as specified in the department’s Cost Allocation Plan.
Questioned Costs: We limited our questioned costs to federal programs with indirect cost activity exceeding or approaching $25,000 in the Operations Branch Manager Indirect Cost Pool, the Financial Technical Analyst Indirect Cost Pool, and the Technology Services Division Administrator Cost Pool. For the County Use Allowance Indirect Cost Pool and the Reimbursement Travel Indirect Cost Pool, allocation
C-77
18-02
changes were made prior to submitting a revised cost allocation plan to the federal government. Department management indicates these new cost pools did not result in changes to how costs were allocated among federal programs. As such, we have excluded these cost pools from our projection of questioned costs.
We question $48,960 for the TANF Cluster, $67,509 for the Child Support Enforcement program, $24,413 for Foster Care – Title IV-E, $373,551 for the Medicaid Cluster, $109,909 for the CCDF Cluster, $70,571 for the SNAP Cluster, and $29,745 for CHIP. Questioned costs total $724,658 for fiscal years 2018 and 2019 combined.
Based on the number of discrepancies between the approved cost allocation plan and the department’s allocation of indirect costs, additional discrepancies not identified in our sample likely exist. These likely additional discrepancies could include additional unallowable costs and could potentially impact all programs administered by the department.
Context: Our prior audit report contained a recommendation to the department regarding the internal controls over and administration of its cost allocation plan.
Through the cost allocation process, the department allocated $66.5 million and $80.6 million in costs to various federal programs in fiscal years 2018 and 2019, respectively.
During the period under audit, the department allocated costs under three different cost allocation plans. Monthly, there are approximately 140 cost pools for which the department allocates costs. We conducted a sample of 56 cost pool allocations. This was not a statistically valid sample.
Repeat Finding: Montana’s Single Audit report for the two fiscal years ended June 30, 2017, included a recommendation (#2017-014) to the department regarding the internal controls over and administration of its cost allocation plan.
Effect: The department is not in compliance with its federally approved cost allocation plan.
Cause: Department staff indicate human error or oversight, controls insufficient to detect variances in cost pools with an FTE based statistic, and costs associated with multiple staff being charged to a single task profile code as reasons for the allocation errors. One error identified by our audit was also identified by the department and corrected going forward when a new internal control process was implemented in May 2018. Department staff also indicate costs were claimed anticipating a back-dated approval, as requested, for the Financial Technical Analyst Indirect Cost Pool.
Recommendation: We recommend the Department of Public Health and Human Services:A. Conduct and document a review of all cost pools to ensure department procedures align
with the approved cost allocation plan.
C-78 Montana Legislative Audit Division

B. Implement changes to the cost allocation process only after receiving approval from, or submitting a plan revision to, the federal government.
C. Develop and implement internal control to detect variances in cost pools based on a full-time equivalent staff statistic.
D. Allocate costs as specified in the cost allocation pool, as required by federal regulations.
Views of Responsible Officials: The department partially concurs with this finding because it does not agree with the underlying findings related to two cost pools. The department’s Corrective Action Plan, beginning on page D-1, further indicates the department only implements changes to the cost allocation process after submitting plan revisions to the federal government, yet further cites it is not always feasible to submit or receive approval for cost allocation plans prior to claiming costs related to modified or amended cost pools.
Rebuttal of Views of Responsible Officials: We have reviewed the department’s partial concurrence with this finding. As outlined in the finding, the department did in fact implement changes to its cost allocation process prior to submitting plan revisions to the federal government. The department’s views do not contain any information not already considered during the audit. As such, we maintain our position as reported.
C-79
18-02

State of MontanaSchedule of Findings and Questioned Costs
For the Two Fiscal Years Ended June 30, 2019
Section III – Federal Award Findings and Questioned Costs
Finding 2019-023: U.S. Department of Health and Human ServicesCFDA #93.568, Low-Income Home Energy Assistance ProgramGrant # 17B1MTLIEA, 18B1MTLIEA, 19B1MTLIEA, 1701MTLIEA4, 1801MTLIEA4, 1901MTLIEA4
Criteria: Federal regulation, 31 CFR 205.33, requires the Department of Public Health and Human Services (department) minimize the time between the drawdown of federal funds and their disbursement for federal program purposes. The timing and amount of funds transferred must be as close as administratively feasible to the department’s cash outlay for direct and indirect program costs.
Federal regulation, 31 CFR Part 205, which implements the Cash Management Improvement Act of 1990, requires the State to enter into agreements Treasury State Agreements (TSA). The state’s TSA specifies warrants related to the Low-Income Home Energy Assistance program are on a 5 day clearance pattern.
Federal regulation, 2 CFR 200.303, states that the department must establish and maintain effective internal control over the federal award that provides reasonable assurance that the non-federal entity is managing the federal award in compliance with federal statutes, regulations, and the terms and conditions of the award.
Condition: The department has not conducted cash draws for the Low-Income Home Energy Assistance Program (LIHEAP) in accordance with the federal agreement. Additionally, department procedures were not sufficient to achieve compliance with the TSA.
Questioned Costs: None identified.
Context: For at least 18 months of the current audit period, we noted the department systemically recorded LIHEAP expenditures on a tracking spreadsheet the day after the costs were incurred, which caused the department to draw cash following a six-day clearance pattern for warrants. Total federal draws related to warrants were approximately $3 million for each year of the audit period.
Repeat Findings: Montana’s Single Audit for the two fiscal years ended June 30, 2017, noted the department used a four-day clearance pattern for LIHEAP warrants rather than the five-day clearance pattern specified in the TSA (#2017-015).
C-80 Montana Legislative Audit Division

Effect: The department is unable to demonstrate compliance with cash management requirements in federal regulation. Although the department has not drawn funds in advance of the timing permitted by the TSA for the current audit period, the five-day clearance pattern is considered revenue neutral and remains the requirements under the TSA.
Cause: Staff responsible for LIHEAP cash draws misunderstood department procedures and recorded expenditures in a way that delayed the federal draw by one day.
Recommendation: We recommend the Department of Public Health and Human Services:
A. Develop internal review processes to ensure staff apply the clearance pattern approved in the Treasury State Agreement for Low-Income Home Energy Assistance program cash draws.
B. Comply with the requirements of the Treasury State Agreement by drawing federal funds for Low-Income Home Energy Assistance program warrants on a five-day clearance pattern.
Views of Responsible Officials: The department does not concur with this finding, and indicates the clearance pattern error was identified by the department’s control process as designed, the internal draw spreadsheet was corrected, and the draw rectified. For additional information regarding the department’s planned corrective action see the Corrective Action Plan starting on page D-1.
Rebuttal of Views of Responsible Officials: We have considered the department’s nonconcurrence to the finding. As reported in the finding, for at least 18 months of the audit period the department systemically recorded program expenditures to the tracking spreadsheet incorrectly. This resulted in following a clearance pattern contrary to the clearance pattern specified in the TSA. Such long-term noncompliance cannot be corrected by retroactively modifying the tracking spreadsheet. Additionally, if the department’s control process detected the clearance pattern error after 18 months, we do not consider it to be timely. As such, we maintain our position as reported.
C-81
18-02

State of MontanaSchedule of Findings and Questioned Costs
For the Two Fiscal Years Ended June 30, 2019
Section III – Federal Award Findings and Questioned Costs
Finding 2019-024: U.S. Department of AgricultureCFDA #10.557, Special Supplemental Nutrition Program for Women, Infants
and Children (WIC)Grant #: 201818W100643, 201818W500343, 201818W100343, 201817W541243, 201818Y860743, 201818Y860443, 10919W100643, 201918W100643, 201919W500343, 201919W100343, 201918W100343, 201919Y860743, 201919Y860443
U.S. Department of Health and Human ServicesCFDA #93.563, Child Support Enforcement (CSE)Grant #: 17504MTCSES, 18504MTCSES, 19504MTCSES, 1704MTCSET, 1804MTCSET, 1904MTCSET
Criteria: Federal regulation, 31 CFR 205.33, requires the Department of Public Health and Human Services (department) minimize the time between the drawdown of federal funds and their disbursement for federal program purposes. The timing and amount of funds transferred must be as close as administratively feasible to the department’s cash outlay for direct and indirect program costs.
Federal regulation, 2 CFR 200.303, states that the department must establish and maintain effective internal control over the federal award that provides reasonable assurance that the non-federal entity is managing the federal award in compliance with federal statutes, regulations, and the terms and conditions of the award.
Condition: Contrary to federal regulations, the department carried excess cash during the audit period for multiple federal programs. Additionally, department controls were not sufficient to prevent such instances of excess cash.
Questioned Costs: No questioned costs identified.
Context: We analyzed cash balances for the department’s WIC and CSE programs for the period under audit and noted significant time periods when the department carried excess federal cash.
For the WIC program, we noted 10 instances of excess federal cash for time periods spanning between 2 and 19 days. The balance of excess WIC cash ranged from $1,000 to $360,000. These instances of excess cash are not related to monthly rebates received for the WIC program, as the department appropriately ceases federal cash draws until the program rebates have been used.
C-82 Montana Legislative Audit Division

For the CSE program, the department draws federal funds for the program, and also receives non-federal cash collections. The non-federal cash collections are mainly comprised of child support payments from the absent parent, which are supposed to be sent to the custodial parent within two days. During the audit, we noted nearly 50 instances of excess federal cash. Excess cash ranged from $1,000 to $525,000, and the overage often lasted for more than a week.
Effect: The department is unable to demonstrate compliance with cash management requirements in federal regulation.
Cause: Department staff claim most of the instances of WIC excess cash in question were times when extra cash was drawn in anticipation of a federal government shutdown. However, absent express permission from the federal government, the department is not permitted to draw in advance for the WIC program.
Department staff indicated the non-federal cash collections from the previous day are considered in its calculation of the CSE federal draw. However, by the time the federal funds are received, the department generally collects additional non-federal funds, which results in a positive cash balance in the CSE account.
Recommendation: We recommend the Department of Public Health and Human Services:A. Modify procedures for federal cash draws for the Supplemental Nutrition Program for
Women, Infants and Children, to eliminate instances of excess federal cash, as required by federal regulations.
B. Modify the calculation for federal cash draws for the Child Support Enforcement program to take into consideration anticipated cash collections from non-federal sources, and to eliminate instances of excess federal cash, as required by federal regulations.
C. Comply with federal regulations to minimize the time between the drawdown of cash for the federal Supplemental Nutrition Program for Women, Infants, and Children and Child Support Enforcement programs and disbursement for federal program purposes.
Views of Responsible Officials: The department partially concurs with this finding, and claims it may not be able to fully estimate cost collections from non-federal sources to completely eliminate excess federal cash. For additional information regarding the department’s planned corrective action see the Corrective Action Plan starting on page D-1.
Rebuttal of Views of Responsible Officials: We have reviewed the department’s partial concurrence with this finding. The department notes it, “may not be able to fully estimate collections from non-federal sources to completely eliminate excess cash.” As the independent auditor, we are prohibited from directing the department’s corrective action. However, we believe the department can explore options to establish a clearance pattern than accommodates the internal control and compliance issues identified in this finding. We maintain our position as reported.
C-83
18-02

State of MontanaSchedule of Findings and Questioned Costs
For the Two Fiscal Years Ended June 30, 2019
Section III – Federal Award Findings and Questioned Costs
Finding 2019-025: U.S. Department of Health and Human ServicesCFDA # 93.563, Child Support EnforcementGrant #17504MTCSES, 18504MTCSES, 1901MTCSES, 1704MTCSET, 1804MTCSET, 1904MTCSET
CFDA # 93.658, Foster Care – Title IV-EGrant #1701MTFOST, 1801MTFOST, 1901MTFOST
CFDA # 93.659, Adoption AssistanceGrant #1701MTADPT, 1801MTADPT, 1901MTADPT
CFDA # 93.767 Children’s Health Insurance Program (CHIP)Grant # 1705MT5021, 1705MT0301, 1805MT5R21, 1805MT5021, 1905MT5021
CFDA # 93.775, 93.777, 93.778, Medicaid ClusterGrant # 1705MT5MAP, 1805MT5MAP, 1905MT5MAP
Criteria: Federal regulation, 45 CFR 95.621, requires the Department of Public Health and Human Services (department) to review the Automated Data Processing (ADP) system security of installations involved in the administration of its federal Health and Human Services (HHS) programs on a biennial basis. At a minimum, the reviews shall include an evaluation of physical and data security operating procedures, and personal practices. This requirement is applicable to titles IV-B, IV-D, IV-E, XIX, or XXI of the Social Security Act.
In addition, federal regulation, 2 CFR 200.303, requires non-Federal entities to, among other things, establish and maintain effective internal control over the Federal award that provides reasonable assurance that the non-Federal entity is managing the Federal award in compliance with Federal statutes, regulations, and the terms and conditions of the Federal award.
Condition: The department did not complete the biennial review of ADP systems, as required by federal regulations. Additionally, department internal controls did not ensure APD system reviews were fully documented.
C-84 Montana Legislative Audit Division

Questioned Costs: None identified.
Context: HHS programs administered by the department include Medicaid, Child Support Enforcement, Foster Care, Adoption Assistance, and the Children’s Health Insurance program, which account for over 81 percent of federal program expenditures incurred by the department.
We performed a sample of 14 ADP systems of a population of 27 systems used in administering HHS programs. Of the 14 systems, we identified 2 for which a biennial review was not completed. We identified an additional 2 systems for which the review occurred, but the review was not fully documented. This was not a statistically valid sample.
Repeat Finding: Montana’s Single Audit reports for the two fiscal years ended June 30, 2017, and June 30, 2015, have included recommendations (#2017-019 and #2015-012, respectively) to the department regarding the internal controls over, and compliance with, required ADP system reviews.
Effect: The requirements related to ADP system risk analyses and security reviews are to ensure that appropriate, cost effective safeguards are incorporated into new and existing systems. Without the required biennial reviews, ADP systems could operate with undetected system inefficiencies and security weaknesses.
Cause: The department cites turnover as a contributing factor to incomplete and untimely reviews, and acknowledges the two system reviews which were not fully documented. However, the department contends the two reviews not conducted were completed after our audit test was conducted and within the biennium, as required by federal regulation. The prior ADP security reviews were completed in March and April 2017, while the subsequent reviews were completed in November 2019. Because more than two years passed since the completion of each of the prior reviews, the department has not complied with the biennial time frame required. Recommendation: We recommend the Department of Public Health and Human Services establish and maintain internal controls to ensure Automated Data Processing system reviews are completed and fully documented on a biennial basis, as required by federal regulations.
Views of Responsible Officials:The department concurs with this recommendation. For additional information regarding the department’s planned corrective action see the Corrective Action Plan starting on page D-1.
C-85
18-02

State of MontanaSchedule of Findings and Questioned Costs
For the Two Fiscal Years Ended June 30, 2019
Section III – Federal Award Findings and Questioned Costs
Finding 2019-026: U.S. Department of TransportationCFDA #20.205, 20.219, and 20.224, Highway Planning and Construction
ClusterGrant #Not Applicable
Criteria: Federal law, 40 USC 3142, requires contractors and subcontractors to pay prevailing wages to laborers and mechanics for work completed under federally funded contracts in excess of $2,000.
Federal regulation, 29 CFR 5.5, establishes contract language requiring contractors to submit payrolls to the department, along with a statement of compliance that all laborers and mechanics employed on the contract during the payroll period have been paid not less than the applicable wage rates for the classification of work performed, as specified in the applicable wage determination incorporated into the contract.
Federal regulation, 29 CFR 5.6, prohibits payment to contractors after construction begins unless there is certification by the contractor that the contractor and its subcontractors have complied with the provisions of 29 CFR 5.5.
In addition, 2 CFR 200.303 requires non-Federal entities to, among other things, establish and maintain effective internal control over the Federal award that provides reasonable assurance that the non-Federal entity is managing the Federal award in compliance with Federal statutes, regulations, and the terms and conditions of the Federal award.
Condition: The Montana Department of Transportation’s (department) internal controls were not effective in ensuring certified payrolls were received and reviewed for highway construction projects. Questioned Costs: No questioned costs were identified.
Context: In the prior audit, we determined the department’s internal controls did not ensure all payrolls were received prior to issuing payments to contractors. We also identified multiple projects for which the department did not receive all payrolls. In the current audit, we noted the department took steps to address this recommendation, including implementing a new electronic payroll submission module. Per department personnel, the electronic submission module will work with the department’s
C-86 Montana Legislative Audit Division

new project management information system and is designed to flag instances of missing payrolls as exception when contractor pay estimates are generated in the system.
This payroll submission module is intended to be used only on projects let from October 2019 forward, along with a small group of test projects let prior to October 2019. The module was only used on a limited basis during the audit period, and the department does not intend to convert pre-existing projects to the new system.
Based on review of department records, there were approximately 250 projects with construction occurring in fiscal year 2018 or 2019. Only two used the electronic payroll submission module. We also estimate there are a minimum of 45 projects that will have active construction into the next audit period, that will not use the electronic submission module.
Due to the continued control deficiency, and the resulting noncompliance identified in the prior audit, we anticipated noncompliance occurred in the current audit period and designed the nature, timing, and extent of our testing accordingly. Our testing to confirm noncompliance included reviewing payroll submissions for one project from each of the department’s five districts, and confirming known or likely noncompliance identified by the department’s internal audit function. This was not a statistically valid sample.
Through this testing, we considered a total of 10 projects, and identified 4 with untimely or incomplete payroll submissions.
� On one project, a subcontractor submitted one payroll late. The payroll was for a week in September 2018 and was not submitted until January 2019.
� On one project, a subcontractor did not submit certified payrolls until the project was in winter shut-down. The subcontractor performed work from April 2018 through October 2018. Department staff indicated a majority of the payrolls were not submitted until sometime after October 2018.
� On one project, one subcontractor did not submit any payrolls. The subcontractor performed work intermittently from May 2018 to August 2018 but had not submitted any payrolls as of October 2019.
� On one project, two subcontractors did not submit payrolls for one week each. Department staff were unaware of the missing payrolls.
Effect: The department is not in compliance with federal regulations requiring the receipt of certified payrolls prior to issuing payments to contractors. There is also a risk the department will not identify instances where contractors or subcontractors do not pay their employees prevailing wages.
Cause: Department staff indicated the timing of the implementation of the electronic submission model was tied to its implementation of a new project management system. The deficiency in internal
C-87
18-02

controls for which the submission module is designed to address contributed to the department not identifying the missing payrolls identified during the audit period.
Repeat Finding: This is a repeat finding, initially reported as 2017-028 in the Single Audit report for the two fiscal years ended June 30, 2017. Recommendation: We recommend the Montana Department of Transportation:
A. Enhance internal controls to ensure all required certified payrolls are received for projects not being managed through the electronic payroll submission module.
B. Obtain and review certified weekly payrolls from contractors and subcontractors for all active construction projects of the Highway Planning and Construction Program.
Views of Responsible Officials: The department concurs with this recommendation. For additional information regarding the department’s planned corrective action see the Corrective Action Plan starting on page D-1.
C-88 Montana Legislative Audit Division

State of MontanaSchedule of Findings and Questioned Costs
For the Two Fiscal Years Ended June 30, 2019
Section III – Federal Award Findings and Questioned Costs
Finding 2019-027: U.S. Department of TransportationCFDA #20.205, 20.219, and 20.224, Highway Planning and Construction
ClusterGrant #Not Applicable
Criteria: Federal law, 23 USC 112(1), requires construction for each project under CFDA #20.205 be performed by contract awarded by competitive bidding.
Federal regulation, 23 CFR 635.109, requires standard contract language be incorporated into each construction contract related to significant changes to the character of the work, and contains standard contract language defining a significant change as occurring when one or more of the following circumstances occurs:
� The character of the work differs materially in kind or nature from that involved or included in the original proposed construction.
� A major item of work, as defined in the contract, is increased or decreased in excess of 25 percent of the original quantity in the contract.
This regulation also requires an adjustment be made to the contract when a significant change has occurred.
Federal regulation, 2 CFR 200.403(a) and (g), requires that except where otherwise authorized by statute, costs must meet the following general criteria in order to be allowable under Federal Awards:
� Be necessary and reasonable for the performance of the Federal award � Be adequately documented
Condition: For projects with quantity overruns in excess of 25 percent on major items of work, the Montana Department of Transportation’s (department) documentation included in project files did not contain information to justify the reasonableness and necessity of quantity overruns and their associated costs.
Questioned Costs: We question approximately $36,000 of direct, and approximately $4,000 of associated indirect, costs inappropriately charged to CFDA #20.205 in state fiscal years 2018 and 2019. Additional questioned costs likely exist.
C-89
18-02

Context: In our prior audit, we determined the department did not always formally document adjustments to contracts when major items of work had quantity overruns in excess of 25 percent (or 125 percent of the initial quantity estimates). We also noted the department’s contract language associated with significant changes in the character of work was more restrictive than the language required by federal regulations. The contract language, as contained in the Standard Specifications for Road and Bridgework (spec book), also included quantity overruns and underruns in excess of 50 percent on nonmajor items of work within the definition of a significant change. We made a recommendation to the department to issue contract amendments for changes in contract quantities that were considered significant under the spec book and federal regulation, and to consider updating the definition of a significant change in the spec book to more closely align with federal regulation and actual business practices.
As part of their work to resolve the prior audit finding, Federal Highway Administration (FHWA) personnel and the department came to an agreement that quantity overruns in excess of 25 percent on major items of work would be in the form of change orders. In April 2019, the department updated established guidance for change orders to reflect agreement with FHWA. The department also worked with FHWA personnel and other interested parties to modify the spec book language regarding significant changes to more closely align with federal regulations. This new language was applicable for projects let after April 2019.
While the department began to take steps to address the recommendation in the current audit period, we also noted instances where the department did not issue change orders when major items of work had quantity overruns in excess of 25 percent. The documentation department personnel included in the project files to support not issuing a change order for the overruns did not contain information to justify the reasonableness and necessity of quantity overruns and their associated costs. This documentation was similar in form and general content to what was on file in the prior audit, which FHWA personnel indicated they did not consider to be sufficient to document the adjustment to the contract required by federal regulations to support federal participation in the costs.
From department data, we performed an analysis on projects with change order overrides in the department’s project management system. We selected three projects each having one major item of work with actual quantity overruns in excess of 25 percent. This was not a statistically valid sample. Based on our review, we estimate the amounts paid for actual quantities in excess of 125 percent of the contracted quantities to be approximately $200, $12,000, and $28,000 for these three instances of quantity overruns. We estimate the federal share of these costs to be approximately $36,000.
Effect: The department has not adequately documented the necessity and reasonableness of the additional costs incurred for projects, resulting in questioned costs.
Cause: As noted in the prior Single Audit finding, department management indicated they did not believe all quantity changes in excess of 25 percent resulted in actual significant changes in the kind or
C-90 Montana Legislative Audit Division

nature of work being performed. It took several months for the department and FHWA to determine the corrective action for the prior audit finding, and for the department to work with the contracting community to implement the resulting changes.
Repeat Finding: This is a repeat finding, initially reported as 2017-027 in the Single Audit report for the two fiscal years ended June 30, 2017. Recommendation: We recommend the Montana Department of Transportation continue to implement the directive of the Montana Division of the Federal Highway Administration to formally document adjustments to contracts through change orders when major items of work have quantity overruns in excess of 25 percent.
Views of Responsible Officials: The department concurs with this recommendation. For additional information regarding the department’s planned corrective action see the Corrective Action Plan starting on page D-1.
C-91
18-02

State of MontanaSchedule of Findings and Questioned Costs
For the Two Fiscal Years Ended June 30, 2019
Section III – Federal Award Findings and Questioned Costs
Finding 2019-028: U.S. Department of Homeland Security CFDA #97.042, Emergency Management Performance GrantsGrant # EMW-2015-EP-00004, EMD-2016-EP-00002, EMD-2017-EP-00003, EMD-2018-EP-00005
#97.067, Homeland Security Grant ProgramGrant # EMW-2014-SS-00019, EMW-2015-SS-00005, EMW-2016-SS-00006, EMW-2017-SS-00009, EMW-2018-SS-00021
#97.039, Hazard Mitigation GrantGrant # 1996DRMTP00000005, 4127DRMTP00000005, 4172DRMTP00000005, 4198DRMTP00000001, 4275DRMTP00000005, 4271DRMTP00000005
Criteria: Federal regulation, 2 CFR 200.303, requires the Department of Military Affairs (department) to establish and maintain effective internal control over the federal award that provides reasonable assurance that the non-federal entity is managing the federal award in compliance with statutes, regulations, and the terms and conditions of the federal award.
Federal regulations, 2 CFR 200.53 and 2 CFR 200.403, further state that improper payments include any payments where insufficient or lack of documentation prevents a reviewer from discerning whether a payment was proper and in order for costs to be allowable they must be adequately documented, respectively.
Condition: The department’s internal control procedures do not address the amount and detail of supporting documentation required for each grant reimbursement. As a result, the department’s supporting documentation did not contain enough detail to determine whether the expenditure reimbursements provided to the subrecipients were allowable under the grant. Additionally, department procedures did not prompt department personnel to request additional support.
Questioned Costs: We question $27,580 and $54,027 in grant reimbursement costs charged to CFDA #97.042, with potential questioned costs up to $1,416,431 and $994,388 in fiscal years 2017 and 2018, respectively. We question $48 and $627 in grant reimbursement costs charged to CFDA #97.067, with potential questioned costs up to $1,724,741 and $1,748,706 in fiscal years 2017 and 2018, respectively.
C-92 Montana Legislative Audit Division

We question $33,000 in grant reimbursement costs charged to CFDA #97.039 in fiscal year 2017, with potential questioned costs up to $556,072 and $717,593 in fiscal years 2017 and 2018, respectively. We did not perform testing for fiscal year 2019. However, questioned costs are likely to exceed $25,000 for each of the three programs for fiscal year 2019 because, as indicated in the department’s response from September 2019 included below, the department is unable to change its process to address the issue.
Context: The department issued payments totaling approximately $7.5 million and $7.0 million in fiscal years 2017 and 2018, respectively. In a total population of 714 items, we selected a sample of 78 payments. This was a statistically valid sample. However, we only sampled 46 payments because we stopped testing after finding 16 errors. Our sample identified five instances where the amount of the reimbursement was unsupported by subrecipient documents and 16 instances where the expenditures were unallowable under the grant award due to inadequate documentation. We did not perform testing for fiscal year 2019.
Repeat Finding: This is a repeat finding, initially reported as 2017-011 in Montana’s Single Audit report for the two fiscal years ended June 30, 2017.
Effect: Because the department does not have adequate internal controls in place over the DES grant reimbursement process, they are reimbursing subrecipients for unsupported and unallowable costs.
Cause: Department staff responsible for reviewing and approving reimbursement requests stated they believe their internal control processes are adequate because they have multiple levels of oversight for the reimbursements. Additionally, department staff noted two on-site monitoring visits are conducted for each subrecipient each year, for each grant.
Recommendation: We recommend the Department of Military Affairs implement internal controls in the Disaster & Emergency Services Division to ensure subrecipient reimbursements are supported and allowable under the grant awards at the time the reimbursement is made.
Views of Responsible Officials: The department conditionally concurred with the finding. They stated, “MT DES and the Department of Military Affairs strongly support internal controls and grant management oversight. The department is willing to improve internal controls for preparedness grants but is unable to develop additional measures without knowing what specific concern to address and what adequate control measures will pass future state audits. The audit does not provide specific examples of instances where unallowable expenditures were reimbursed.”
Rebuttal of Views of Responsible Officials: We considered the department’s conditionally concurring response to the finding. The response notes the department “…is unable to develop additional measures without knowing what specific concern to address…” and “…the audit does not provide specific examples of instances where unallowable expenditures were reimbursed.” As outlined
C-93
18-02

in the finding, the documents the department received and reviewed did not demonstrate that the expenditures the department ultimately paid were allowable under the program. The department’s response further states the department “…is unable to develop additional measures without knowing…what adequate control measures will pass future state audits.” As the independent auditor, we are prohibited from directing the department’s corrective action. We believe we provided sufficient information in this report and through conversations throughout the audit process to enable the department to independently complete a corrective action to address the underlying issue.
C-94 Montana Legislative Audit Division

State of MontanaSchedule of Findings and Questioned Costs
For the Two Fiscal Years Ended June 30, 2019
Section III – Federal Award Findings and Questioned Costs
Finding 2019-029: U.S. Department of DefenseCFDA #12.401 National Guard Military Operations and Maintenance (O&M)Grant # W9124V-16-2-1001, W9124V-18-2-1001
Criteria: Federal regulation, 2 CFR 200.303, requires the Department of Military Affairs (department) to establish and maintain effective internal control over the federal award that provides reasonable assurance that the non-federal entity is managing the federal award in compliance with federal statutes, regulations, and the terms and conditions of the federal award.
Federal regulation, 2 CFR 200.403(g), requires costs to be adequately documented in order to be allowable.
The Office of Management and Budget 2018 and 2019 Compliance Supplement, 4-12.401-6, also states that the recipient’s required matching percentage varies by Appendix and is listed in the Funding Limitation section of each Master Cooperative Agreement (MCA) Appendix. The National Guard Bureau (NGB) share of all authorized charges, unless expressly stated elsewhere in the Appendix, is based on the Facilities Inventory and Support Plan (FISP) support code for the facility generating the expenditure.
Appendix 1001 to the MCA provides support to the department for the operation and maintenance of authorized facilities coded on the FISP, and guidance prescribed in National Guard Regulation (NGR) 420-10. This appendix provides 3 different funding supports.
1. 100% federal funding for certain expenses for operating and maintaining facilities, 2. 75% federal funding of certain expenses for operating and maintaining licensed readiness
centers. 3. 50% federal funding of certain expenses for operating and maintaining state-owned
readiness centers.
Condition: The expenses for buildings that share state and federal use were split based on square footage of the use of the building and then split according to the FISP. However, there is no support for how these funding splits for square footage use was created. Department management stated they could recreate the documentation of the split calculation from underlying information contained on their computer system. We performed additional audit procedures over the recreated support and found it did not match the split used during the audit period for six of the buildings. Based on current usage, the funding splits are incorrect, which resulted in an understatement of the federal share.
C-95
18-02

Questioned Costs: The state share is overstated and the federal share is understated, therefore there are no questioned costs.
Context: We tested two samples of operations and maintenance transactions which covered July 1, 2017, through December 31, 2018. One of the samples was statistically valid and the other was not. In total, we tested 42 transactions and found 12 instances where the match rate was incorrect.
Additional testing over program expenditures was completed for the remainder of the audit period, January 1, 2019, through June 30, 2019. However, we did not include matching in our additional testing, given our previous testing indicated this was a systemic problem and because we knew the department had not made any changes to the splits through June 30, 2019.
Effect: Results of testing indicate there is non-compliance with the matching requirement for the entire audit period. For fiscal year 2018, we estimate the federal government was under charged $48,629. For fiscal year 2019, our testing estimate the federal government was under charged $48,382.
Cause: The match percentages based on square footage were determined prior to 2006 and documentation for the calculations could not be located by department officials. Additionally, since 2006, construction had been completed on a number of facilities that resulted in changes in allocations.
Recommendation: We recommend the Department of Military Affairs:A. Comply with federal requirements to match the percentages as required by the Funding
Limitation section of each Master Cooperative Agreement Appendix and the Facilities Inventory and Support Plan.
B. Establish internal controls to ensure the basis of the splits is supported.
Views of Responsible Officials: The department concurs with the recommendation. For additional information regarding the department’s planned corrective action see the Corrective Action Plan staring on page D-1.
C-96 Montana Legislative Audit Division

State of MontanaSchedule of Findings and Questioned Costs
For the Two Fiscal Years Ended June 30, 2019
Section III – Federal Award Findings and Questioned Costs
Finding 2019-030: U.S. Department of EducationCFDA #84.287, Twenty-First Century Community Learning CentersGrant # S287C180026, S287C190026
Criteria: Federal regulation, 2 CFR 200.303, requires the Office of Public Instruction (office) to establish and maintain effective internal control over the federal award that provides reasonable assurance that the non-federal entity is managing the federal award in compliance with statutes, regulations, and the terms and conditions of the federal award.
Condition: The office administers the 21st Century Community Learning Centers (21st CCLC) federal program. The 21st CCLC program provides 5-year subawards to subrecipients around the state to operate centers to provide students with academic enrichment opportunities during non-school hours or periods when school is not in session to complement the students’ regular academic program, including tutoring and mentoring, homework help, hands-on science and technology education programs, music, arts, sports and cultural activities.
When a subrecipient wants payment for this program, they submit a cash request via the office’s E-Grants system. This can happen as often as monthly; although many subrecipients only do it a few times a year depending on cash needs. The cash request contains the budget categories, budgeted amounts, amounts previously requested, and current amounts requested. The subrecipient enters the amounts requested and provides details of what the requests are for in a description for each budget category. These descriptions varied in detail between the different cash requests. There is also a place on the screen for the subrecipient to upload supporting documents. The office does not require any documentation from subrecipients beyond a cash request. This request is reviewed and approved by office fiscal staff. If there are any unusual items included in the request or the fiscal staff has questions, they work with 21st CCLC program staff to resolve them prior to approving the payment. Office staff also perform monitoring visits in the first year of each subrecipient’s grant award and at least once in the remaining years (years 2-5).
The office’s internal controls are not designed to ensure only allowable costs are charged to the grant. Office staff would only identify potentially unallowable costs during the payment approval process if the subrecipient included descriptions in the expenditure description that was inconsistent with the budget category.
C-97
18-02

Questioned Costs: No questioned costs identified.
Context: We intended to test a statistically valid sample of 49 payments out of the approximately 960 payments totaling approximately $10.5 million during the audit period, but based on testing the first four items in the sample, it was clear the support for these payments did not provide enough information to determine whether the amounts requested were for allowable costs under the grant. We instead focused our testing on the office’s monitoring process to determine whether any unallowable costs would have been detected by the office.
Office staff perform monitoring visits in the first year of each subrecipient’s grant award and at least once in the remaining years (years 2-5). These visits include reviews of financial records and supporting documents. However, this leaves three years of the 5-year grant period without any monitoring beyond the payment request review. If a subrecipient’s second monitoring visit does not occur until year five, the office could be paying for unallowable costs for three years before identifying it with a monitoring visit. Combined with the lack of supporting documentation for the payments, this time frame does not allow the office to timely identify if unallowable costs have been paid. Additionally, many of the program subrecipients are nonschool entities that do not receive as much scrutiny and monitoring as schools do.
Effect: Without more robust controls, there is risk that unallowable costs are being paid and would not be detected by office staff.
Cause: The office believes their current process provides them reasonable assurance the funds are expended as required by the federal regulations.
Recommendation: We recommend the Office of Public Instruction enhance their internal controls over the 21st Century Community Learning Centers program payments in order to ensure the expenditures charged are supported.
Views of Responsible Officials: The office partially concurs with the recommendation. For additional information regarding the office’s planned corrective action see the Corrective Action Plan staring on page D-1.
C-98 Montana Legislative Audit Division

State of MontanaSchedule of Findings and Questioned Costs
For the Two Fiscal Years Ended June 30, 2019
Section III – Federal Award Findings and Questioned Costs
Finding 2019-031: U.S. Department of EducationCFDA #84.010, Title I Grants to Local Education AgenciesGrant #S010A180026, S010A190026
Criteria: Federal regulation, 2 CFR 200.303(a), requires the Office of Public Instruction (office) to establish and maintain effective internal control over the federal award that provides reasonable assurance that the non-federal entity is managing the federal award in compliance with federal statutes, regulations, and the terms and conditions of the federal award.
The Elementary and Secondary Education Act, Section 1111(b)(2(B))(iii), requires the office to establish and maintain an assessment system which uses testing to provide data used to measure student achievement. Student testing must be valid, reliable, and consistent with relevant professional and technical standards. In order to ensure the tests are valid and reliable, the office must have policies and procedures in place to ensure local education agencies (LEAs) are maintaining test security.
Condition: In the prior audit, we found the office’s procedures for ensuring LEAs are maintaining test security were incomplete. Information regarding test security was distributed to Montana’s K-12 schools. However, the office had not yet developed a plan to monitor school level implementation of security procedures. We tested this requirement in the current audit and found the office took steps to address the issue but was unable to fully implement the recommendation during the audit period.
Questioned Costs: No questioned costs identified.
Context: There are six required assessments in Montana: the Smarter Balanced Assessment Test, the ACCESS for ELLS 2.0, the Science Criterion-Referenced Test, the Science Criterion-Referenced Test-Alternate, the Multi-State Alternate Assessment, and the American College Testing (ACT).
During fiscal year 2018, the office maintained its previous test security policy requiring schools to electronically certify they are abiding by the office’s policies, but performed no additional on-site monitoring, as it conducted best practices research and developed a new testing security monitoring process. In fiscal year 2019, the office began implementing the new monitoring process. The new process includes obtaining the certifications from the schools and following up on schools without the certifications or with incomplete certifications. The office began following up on the missing or incomplete certifications, but this extended beyond the audit period, meaning there were many schools
C-99
18-02

who had not implemented the required testing security in fiscal year 2019. The office also performed on-site test monitoring for 34 schools during fiscal year 2019, as required by the new process.
Even though the office developed and implemented the new testing security monitoring process during the audit period, they did not ensure the LEAs were maintaining test security while the new monitoring process was being developed in fiscal year 2018, which is an integral part of ensuring the tests are valid and reliable. This noncompliance extended into fiscal year 2019 because there were 58 schools with missing or incomplete certifications.
Repeat Finding: This is a repeat finding, initially reported as 2017-006 in Montana’s Single Audit report for the two fiscal years ended June 30, 2017. Effect: The office is not in compliance with the federal regulations. State assessments are important in securing federal funding like Title I. They also allow teachers and parents to identify needs for each individual student. Without oversight, there is the possibility of unfair testing or inaccurate data.
Cause: Office staff stated it took time to perform the best practices research and implement a new monitoring process. Recommendation: We recommend the Office of Public Instruction:
A. Continue to implement control procedures to monitor Montana’s schools’ implementation of the assessment security process.
B. Comply with federal assessment security requirements for the Title I, Grants to Local Education Agencies.
Views of Responsible Officials: The office concurs with the recommendation. For additional information regarding the office’s planned corrective action see the Corrective Action Plan starting on page D-1.
C-100 Montana Legislative Audit Division

State of MontanaSchedule of Findings and Questioned Costs
For the Two Fiscal Years Ended June 30, 2019
Section III – Federal Award Findings and Questioned Costs
Finding 2019-032: U.S. Department of EducationCFDA #84.010, Title I Grants to Local Education AgenciesGrant #S010A180026, S010A190026
CFDA #84.027, 84.173, Special Education Cluster (IDEA) Grant #H027A180096, H027A190096
CFDA #84.287, Twenty-First Century Community Learning CentersGrant #S287C180026, S287C190026
U.S. Department of AgricultureCFDA #10.553, 10.555, 10.556, and 10.559, Child Nutrition ClusterGrant #183MT306N1099, 193MT306N1099
Criteria: Federal regulation, 2 CFR 200.303(a), requires the Office of Public Instruction (office) to establish and maintain effective internal control over the federal award that provides reasonable assurance that the non-federal entity is managing the federal award in compliance with federal statutes, regulations, and the terms and conditions of the federal award.
Federal regulation, 2 CFR 200.331(b), requires the office to evaluate each subrecipient’s risk of noncompliance to determine the appropriate monitoring.
Federal regulation, 2 CFR 200.331(d), requires the office to monitor subrecipients’ audits, including following up on all deficiencies.
Federal regulation, 2 CFR 200.331(f), requires the office to verify that each subrecipient receives a Single Audit if required.
Federal regulation, 2 CFR 200.521, requires the office to issue management decisions for any deficiencies identified in subrecipients’ audit reports within six months of the Federal Audit Clearinghouse’s acceptance of the audit report. The regulation also requires these management decisions to contain specific elements.
Condition: The office’s controls over subrecipient monitoring are not sufficient to ensure compliance with the federal regulations, as outlined below:
C-101
18-02

� Subrecipient Audits: Review of subrecipient audit reports is performed centrally by office staff. The office does not have controls in place to verify its nonschool entity subrecipients receive a Single Audit and that school subrecipient audits are reviewed timely. The nonschool entities are not for profit organizations.
� Risk Assessments: As part of reviewing subrecipient audit reports, central office staff create a risk assessment for each subrecipient. Program staff for the Title I, Special Education, and Child Nutrition programs rely on this central risk assessment and do not perform their own. Thus, for these programs, the only subrecipients who are assessed for risk are those receiving a Single Audit. A Single Audit is not required for subrecipients expending less than $750,000 in federal awards each year, but a risk assessment is required for all subrecipients regardless of the amount of federal funds they expend. Office personnel indicated the program managers complete risk assessments in addition to the risk assessments completed by the central office. However, upon request, no documentation supporting this statement was provided by the office.
� Management Decisions: During design of the audit, office staff stated the letters issued to subrecipients who are put on high risk or watch status as part of the central risk assessment process serve as their management decisions. We reviewed these letters during fieldwork and determined many of the elements were not present. When we communicated this noncompliance, office staff stated audit acceptance letters issued by Local Government Services in the Department of Administration were in fact the management decisions. These letters contain none of the elements required by the federal regulations. In addition, we determined all of the letters the office issued to subrecipients tested in our sample were not issued within 6 months of the subrecipient audit report being accepted by the federal audit clearinghouse.
Questioned Costs: No questioned costs identified.
Context: Of the 413 local education entities receiving federal funds under the Title I, IDEA B, and Child Nutrition programs in fiscal year 2018 and 414 in fiscal year 2019, only 59 are included in the risk assessment for each year. Of the 47 entities awarded 21st CCLC funds in fiscal year 2018 and 29 in fiscal year 2019, 10 were non-school entities in each year.
We intended to review a statistically valid sample of 45 subrecipients out of the population of 827 subrecipients for the audit period for subrecipient monitoring activities. However, as we completed this testing we determined not all subrecipients should have received a management decision and did not complete the full sample for those requirements. Instead, we tested all 11 high-risk and watch letters issued by the office during the audit period. We also tested 6 of the audit acceptance letters issued by Local Government Services.
We also identified two school subrecipients as part of our testing who received a Single Audit report during the audit period, but the office had not reviewed it as of the date of testing, even though our testing occurred months after the audit reports were submitted.
C-102 Montana Legislative Audit Division

Effect: The office is not in compliance with federal regulations.
Cause: Office staff stated verifying nonschool entities receive a Single Audit has not become a high enough priority to be addressed. Office staff further stated their concept of risk has evolved over the last several years to go beyond just financial risk, but they are having trouble developing a risk assessment process to encompass all risks associated with the subrecipients. Office staff believe they were meeting the intent of the management decision federal regulations through other, less formal interactions with subrecipients.
Recommendation: We recommend the Office of Public Instruction:A. Implement internal controls to ensure compliance with federal subrecipient monitoring
requirements.B. Comply with federal subrecipient monitoring requirements for the Title I, Grants to Local
Education Agencies; Individuals with Disabilities Act, Part B; 21st Century Community Learning Centers; and Child Nutrition Cluster programs.
Views of Responsible Officials: The office concurs with the recommendation. For additional information regarding the office’s planned corrective action see the Corrective Action Plan staring on page D-1.
C-103
18-02
State of MontanaSchedule of Findings and Questioned Costs
For the Two Fiscal Years Ended June 30, 2019
Section III – Federal Award Findings and Questioned Costs
Finding 2019-033: U.S. Department of EducationCFDA #84.010, Title I Grants to Local Education AgenciesGrant #S010A180026, S010A190026
CFDA #84.027, 84.173, Special Education Cluster (IDEA)Grant #H027A180096, H027A190096
CFDA #84.287, Twenty-First Century Community Learning CentersGrant #S287C180026, S287C190026
U.S. Department of AgricultureCFDA #10.553, 10.555, 10.556, 10.559, Child Nutrition ClusterGrant #183MT306N1099, 193MT306N1099
Criteria: Per 2 CFR 180.300 and .305, participants are required to verify that the person they are doing business with is not excluded or disqualified, and they may not enter into a transaction with an excluded person.
Federal regulation, 2 CFR 200.303, requires the Office of Public Instruction (office) to establish and maintain effective internal control over the federal award that provides reasonable assurance that the non-federal entity is managing the federal award in compliance with federal statutes, regulations, and the terms and conditions of the federal award.
Condition: The office receives many federal awards it then subawards out to various subrecipients. The office performs a monthly check of subrecipients to determine whether any are suspended or debarred. This check is done centrally for all federal programs but was not documented for a portion of the audit period. This check only includes schools, but the office awards funds to nonschool entities in some of its programs.
Questioned Costs: There are no questioned costs.
Context: When we tested the monthly central suspended and debarred check performed by the office for schools, we found no evidence the suspended and debarred status of subrecipients was checked for 8 of the 24 months of the audit period. Six of the 8 months were consecutive, and payments made
C-104 Montana Legislative Audit Division

during these months constitute approximately 25 percent, or $63.8 million, of total payments made for the IDEA B, Title I, 21st CCLC, and Child Nutrition programs.
During our audit of the 21st CCLC program, we found the program had 14 nonschool subrecipients during the audit period. The office awarded these nonschool subrecipients approximately $1,400,000 and $2,000,000 in fiscal years 2018 and 2019, respectively. These awards comprised approximately 26 percent and 37 percent of the total amount awarded to subrecipients in fiscal years 2018 and 2019, respectively.
Effect: The office cannot demonstrate its compliance with federal regulations requiring that it confirm that the entities it is entering into transactions with are not suspended or debarred. This could result in the office conducting business with a suspended or debarred entity. Our audit testing did not identify any suspended or debarred subrecipients.
Cause: Office staff indicate there was a change in staff completing these checks during the audit period. Office staff could not locate documentation of those checks completed before the change occurred, but represented the checks were performed. Office staff stated the data used in the monthly check includes all entities, but their current process does not provide a listing of nonschool entities for the verification. Recommendation: We recommend the Office of Public Instruction strengthen internal controls related to checking suspended and debarred status for all subrecipients.
Views of Responsible Officials: The office partially concurs with the recommendation. For additional information regarding the office’s planned corrective action see the Corrective Action Plan staring on page D-1.
C-105
18-02

State of MontanaSchedule of Findings and Questioned Costs
For the Two Fiscal Years Ended June 30, 2019
Section III – Federal Award Findings and Questioned Costs
Finding 2019-034: U.S. Department of the InteriorCFDA #15.605 and 15.611, Fish and Wildlife ClusterGrants # F18AF00061, F18AF00195, F18AF00596, F18AF00631, F18AF00633, F18AF00634, F18AF00647, F18AF00751, F18AF00752, F18AF00860, F11AF01282, F15AF00490, F17AF00653, F18AF00581, F18AF00582, F18AF00593, F18AF00594, F18AF00622, F18AF00624, F18AF00635, F18AF01043, F18AF01066, F18AF01172, F19AF00301, F13AF00104, F13AF00116, F15AF01166, F16AF00234, F16AF00359, F16AF00970, F16AF01144, F17AF00455, F17AF00468, F17AF00474, F17AF00505, F17AF00506, F17AF00507, F17AF00549, F18AF0006, F18AF00099, F15AF00528, F11AF01282, F14AF00109, F15AF00010, F15AF00022, F15AF00490, F16AF00108, F16AF00109, F16AF00293, F16AF00294, F16AF00516, F16AF00865, F16AF01118, F16AF01202, F17AF00472, F17AF00477, F17AF00478, F17AF00479, F17AF00480, F17AF00508, F17AF00527, F17AF00652, F17AF00726, F17AF01222, F18AF00008, F18AF00393
Criteria: Federal regulation, 2 CFR 200.303, requires non-Federal entities to, among other things, establish and maintain effective internal control over the Federal award that provides reasonable assurance that the non-Federal entity is managing the Federal award in compliance with Federal statutes, regulations, and the terms and conditions of the Federal award.
Federal regulation, 2 CFR 200.403(a), states costs must be necessary and reasonable for the performance of the Federal award and be allocable thereto under these principles.
Condition: The Department of Fish, Wildlife, & Parks (department) requires all charges to a federal program to be reviewed by the program supervisor to ensure the costs are accurate and allowable. During the current audit, we identified expenditures related to the department’s vehicle and aircraft fleet that were not reviewed and approved by a program supervisor.
Questioned Costs: No questioned costs were identified.
Context: The department maintains a fleet of vehicles and aircraft for department personnel use. As of June 30, 2019, the department had 629 vehicles and 7 aircraft in its inventory. When department
C-106 Montana Legislative Audit Division

personnel use fleet vehicles or flight services, either the employee using the vehicle or the pilot of the aircraft subsequently submits a mileage or flight log to accounting staff. The logs contain the project codes used by accounting staff to record the expenditure on the state’s accounting system. In fiscal years 2018 and 2019, the department recorded $473,859 and $578,386, respectively, in vehicle fleet expenditures and $240,071 and $189,982, respectively, in aircraft fleet expenditures to federal funds.
We completed a statistical sample of 32 operating expenditures recorded to the Wildlife and Sport Fish Restoration (WSFR) grant programs in fiscal years 2018 and 2019. We found five vehicle and two aircraft fleet transactions, totaling $6,265, were not reviewed and approved by a program supervisor as required by department policy.
The department utilizes hundreds of project codes to identify the proper funding sources for expenditures and if an incorrect project code is used, it could result in unallowable costs being charged to a federal grant. The program supervisor’s review helps mitigate the risk of employees using incorrect project codes.
Effect: The department does not have controls in place to ensure fleet and aircraft expenditures are allowable costs of the Fish and Wildlife Cluster federal programs.
Cause: In relation to its vehicle fleet expenditures, department personnel stated they have tried to enforce the policy, but it frequently resulted in expenditures not being recorded timely due to delays in receiving the approved paperwork. In order to process the expenditures timely, the department stopped requiring a program supervisor’s signature for these expenditures.
Regarding the aircraft expenditures, department staff stated it was not feasible to obtain signatures from program supervisors. The project codes recorded on the flight logs are often given to the pilots via email or text message when the flight is requested, and pilots do not keep the paper flight log in the aircraft for safety reasons.
Recommendation: We recommend the Department of Fish, Wildlife & Parks either implement new procedures, or enforce its current procedures, to ensure the allowability of vehicle and aircraft expenditures charged to the Wildlife and Sport Fish Restoration grant programs.
Views of Responsible Officials: The department concurs with this recommendation. For additional information regarding the department’s planned corrective action see the Corrective Action Plan starting on page D-1.
C-107
18-02

State of MontanaSchedule of Findings and Questioned Costs
For the Two Fiscal Years Ended June 30, 2019
Section III – Federal Award Findings and Questioned Costs
Finding 2019-035: U.S. Department of the InteriorCFDA #15.605 and 15.611, Fish and Wildlife ClusterGrants # F18AF00061, F18AF00195, F18AF00596, F18AF00631, F18AF00633, F18AF00634, F18AF00647, F18AF00751, F18AF00752, F18AF00860, F11AF01282, F15AF00490, F17AF00653, F18AF00581, F18AF00582, F18AF00593, F18AF00594, F18AF00622, F18AF00624, F18AF00635, F18AF01043, F18AF01066, F18AF01172, F19AF00301, F13AF00104, F13AF00116, F15AF01166, F16AF00234, F16AF00359, F16AF00970, F16AF01144, F17AF00455, F17AF00468, F17AF00474, F17AF00505, F17AF00506, F17AF00507, F17AF00549, F18AF0006, F18AF00099, F15AF00528, F11AF01282, F14AF00109, F15AF00010, F15AF00022, F15AF00490, F16AF00108, F16AF00109, F16AF00293, F16AF00294, F16AF00516, F16AF00865, F16AF01118, F16AF01202, F17AF00472, F17AF00477, F17AF00478, F17AF00479, F17AF00480, F17AF00508, F17AF00527, F17AF00652, F17AF00726, F17AF01222, F18AF00008, F18AF00393
Criteria: Federal regulation, 2 CFR 200.303, requires non-Federal entities to, among other things, establish and maintain effective internal control over the Federal award that provides reasonable assurance that the non-Federal entity is managing the Federal award in compliance with Federal statutes, regulations, and the terms and conditions of the Federal award.
Federal regulation, 2 CFR 200.56, defines indirect costs as those costs incurred for a common or joint purpose benefitting more than one cost objective, and not readily assignable to the cost objectives specifically benefitted, without effort disproportionate to the results achieved. To facilitate equitable distribution of indirect expenses to the cost objectives served, it may be necessary to establish a number of pools of indirect (F&A) costs. Indirect (F&A) cost pools must be distributed to benefitted cost objectives on bases that will produce an equitable result in consideration of relative benefits derived. Condition: We estimate unallowed costs included in the Department of Fish, Wildlife & Parks (department) indirect cost rate calculations totaled $205,791 and $585,102 in fiscal years 2018 and 2019, respectively. The department does not have internal controls in place over the calculation of its indirect cost rate, resulting in noncompliance with federal regulations.
C-108 Montana Legislative Audit Division

Questioned Costs: No questioned costs were identified.
Context: We completed a basic recalculation of the indirect cost rates for both years, adjusting for the identified errors. For fiscal year 2018, despite the errors and unallowed costs we identified, due to how the rate is calculated, our calculation reflected the same indirect cost rate determined by the department. For fiscal year 2019, we determined the department’s rate was lower than it should have been, resulting in the department forfeiting $167,302 in federal indirect cost recoveries.
The department did not: � Have adequate documentation of underlying calculations and decisions such as the split in
technology expenses between direct and indirect. � Exclude unallowed items or document why they were allowable items. � Ensure the calculation was free of mathematical errors. � Calculate the rate consistently between years.
Effect: Because the department does not have controls in place over the calculation of its indirect cost rate, errors were made in the calculation of the indirect cost rates for fiscal years 2018 and 2019, resulting in noncompliance with federal regulations.
Cause: Department staff responsible for calculating the rate stated there were no written procedures when they took over the calculation several years ago but have been keeping notes over different aspects of the calculation each year, just not consistently.
Recommendation: We recommend the Department of Fish, Wildlife & Parks implement internal controls over the calculation of its indirect cost rate to comply with federal regulations.
Views of Responsible Officials: The department concurs with this recommendation. For additional information regarding the department’s planned corrective action see the Corrective Action Plan starting on page D-1.
C-109
18-02

State of MontanaSchedule of Findings and Questioned Costs
For the Two Fiscal Years Ended June 30, 2019
Section III – Federal Award Findings and Questioned Costs
Finding 2019-036: U.S. Department of InteriorCFDA #15.605 and 15.611, Fish and Wildlife Cluster Grants # F18AF00061, F18AF00195, F18AF00596, F18AF00631, F18AF00633, F18AF00634, F18AF00647, F18AF00751, F18AF00752, F18AF00860, F11AF01282, F15AF00490, F17AF00653, F18AF00581, F18AF00582, F18AF00593, F18AF00594, F18AF00622, F18AF00624, F18AF00635, F18AF01043, F18AF01066, F18AF01172, F19AF00301, F13AF00104, F13AF00116, F15AF01166, F16AF00234, F16AF00359, F16AF00970, F16AF01144, F17AF00455, F17AF00468, F17AF00474, F17AF00505, F17AF00506, F17AF00507, F17AF00549, F18AF0006, F18AF00099, F15AF00528, F11AF01282, F14AF00109, F15AF00010, F15AF00022, F15AF00490, F16AF00108, F16AF00109, F16AF00293, F16AF00294, F16AF00516, F16AF00865, F16AF01118, F16AF01202, F17AF00472, F17AF00477, F17AF00478, F17AF00479, F17AF00480, F17AF00508, F17AF00527, F17AF00652, F17AF00726, F17AF01222, F18AF00008, F18AF00393
Criteria: Federal regulation, 2 CFR 200.303, requires non-Federal entities to, among other things, establish and maintain effective internal control over the Federal award that provides reasonable assurance that the non-Federal entity is managing the Federal award in compliance with Federal statutes, regulations, and the terms and conditions of the Federal award.
Federal regulation, 2 CFR 200.405(a), states that for a cost to be allocable to a federal award, the services must be chargeable or assignable to that federal award in accordance with relative benefits received. This standard is considered met if a cost:
1. Is incurred specifically for the Federal award;2. Benefits both the Federal award and other work of the non-Federal entity and can be
distributed in proportions that may be approximated using reasonable methods; and3. Is necessary to the overall operation of the non-Federal entity and is assignable in part to the
Federal award in accordance with the principles in this subpart.
Federal regulation, 2 CFR 200.403, states, among other things, that costs must be necessary and reasonable for the performance of the Federal award and be allocable thereto under these principles.
C-110 Montana Legislative Audit Division

Federal regulation, 50 CFR 80.50, outlines the numerous activities eligible for funding under the Pittman-Robertson Wildlife Restoration Act. These allowed activities are centered around all aspects related to the management and restoration of wildlife.
Federal regulation, 50 CFR 80.51, outlines the numerous activities eligible for funding under the Dingell-Johnson Sport Fish Restoration Act. These activities are centered around all aspects related to the management and restoration of sport fish.
Condition: The Department of Fish, Wildlife, and Parks (department) does not have controls in place to determine the portion of its internal auditor’s time to be allocated to the Wildlife and Sport Fish Restoration (WSFR) grant program. The internal auditor’s job duties encompass multiple state and federal programs, but during fiscal years 2018 and 2019, 100% of the internal auditor’s time was charged to the WSFR.
Questioned Costs: We question costs totaling $49,362 and $49,855 for fiscal years 2018 and 2019, respectively.
Context: During our audit, we reviewed a list of employees who charged their time to the WSFR grant programs in fiscal years 2018 and 2019 to determine the reasonableness of the expenditures based on our outlined expectations. Because the internal auditor’s job duties encompass multiple state and federal programs, we would not expect all of the employee’s time to be recorded to the WSFR grant programs.
Effect: Because the department does not have internal control procedures established to determine the portion of the internal auditor’s time spent specifically on activities benefitting the WSFR grant programs, the department cannot demonstrate compliance with federal regulations, resulting in questioned costs in fiscal years 2018 and 2019.
Cause: Department management stated they requested and received specific approval in a grant award from the federal government to include the internal auditor position in the funding under the WSFR grant programs, so they believed it was allowable for the internal auditor to charge all of their time to the WSFR grant programs.
Recommendation: We recommend the Department of Fish, Wildlife & Parks implement procedures to ensure the internal auditor’s time is allocated to the Wildlife and Sport Fish Restoration grant in accordance with federal regulations.
Views of Responsible Officials: The department partially concurs with this finding, stating, “…we strongly believe the ineligible hours are minimal and still benefit the grant program as a whole.” For additional information regarding the department’s planned corrective action see the Corrective Action Plan starting on page D-1
C-111
18-02

Rebuttal of Views of Responsible Officials: We have reviewed the department’s partial concurrence with this finding. The department’s views do not contain any information not already considered during the audit. As such, we maintain our position as reported.
C-112 Montana Legislative Audit Division

Federal Agency and CFDA Information Location
CFDA # Title UM - Missoula* MSU - Bozeman
U.S Department of Agriculture
10.001 Agricultural Research Basic and Applied Research X X
10.025 Plan and Animal Disease, Pest Control, and Animal Care X
10.200 Grants for Agricultural Research, Special Research Grants X
10.202 Cooperative Forestry Research X
10.215 Sustainable Agriculture Research and Education X
10.217 Higher Education - Institution Challenge Grants Program X
10.227 1994 Institutions Research Program X X
10.250 Agricultural and Rural Economic Research, Cooperative Agreements and Collaborations X
10.290 Agricultural Market and Economic Research X
10.303 Integrated Programs X
10.304 Homeland Security Agricultural X
10.307 Organic Agriculture Research and Extension Initiative X
10.309 Specialty Crop Research Initiative X
10.310 Agriculture and Food Research Initiative (AFRI) X X
10.312 Biomass Research and Development Initiative Competitive Grants Program (BRDI) X
10.318 Women and Minorities in Science, Technology, Engineering, and Mathematics Fields X
10.329 Crop Protection and Pest Management Competitive Grants Program X
10.330 Alfalfa and Forage Research Program X
10.350 Technical Assistance to Cooperatives X
10.406 Farm Operating Loans X
10.460 Risk Management Education Partnerships X
10.500 Cooperative Extension Service X
10.610 Export Guarantee Program X
10.652 Forestry Research X X
10.664 Cooperative Forestry Assistance X
10.672 Rural Development, Forestry, and Communities X
10.678 Forest Stewardship Program X
10.680 Forest Health Protection X X
10.683 National Fish and Wildlife Foundation X
10.684 International Forestry Programs X
10.699 Partnership Agreements X X
10.902 Soil and Water Conservation X X
10.903 Soil Survey X
10.912 Environmental Quality Incentives Program X
10.960 Technical Agricultural Assistance X
U.S Department of Commerce
11.431 Climate and Atmospheric Research X
11.438 Pacific Coast Salmon Recovery Pacific Salmon Treaty Program X
11.440 Environmental Sciences, Applications, Data, and Education X
11.472 Unallied Science Program X
11.620 Science, Technology, Business and/or Education Outreach X
Appendix AResearch and Development Cluster Activity by CFDA # and Location
C-113

U.S Department of Defense
12.002 Procurement Technical Assistance for Business Firms X
12.114 Collaborative Research and Development X
12.300 Basic and Applied Scientific Research X X
12.420 Military Medical Research and Development X X
12.431 Basic Scientific Research X
12.632 Legacy Resource Management Program X
12.800 Air Force Defense Research Sciences Program X X
12.910 Research and Technology Development X
U.S Department of the Interior
15.034 Agriculture on Indian Lands X
15.224 Cultural and Paleontological Resources Management X X
15.225 Recreation and Visitor Services X X
15.228 BLM Fuels Management and Community Fire Assistance Program Activities X
15.230 Invasive and Noxious Plant Management X
15.231 Fish, Wildlife and Plant Conservation Resource Management X X
15.232 Joint Fire Science Program X X
15.236 Environmental Quality and Protection X
15.238 Challenge Cost Share X X
15.517 Fish and Wildlife Coordination Act X
15.605 Sport Fish Restoration X
15.608 Fish and Wildlife Management Assistance X X
15.611 Wildlife Restoration and Basic Hunter Education X
15.615 Cooperative Endangered Species Conservation Fund X
15.631 Partners for Fish and Wildlife X
15.637 Migratory Bird Joint Ventures X
15.650 Research Grants (Generic) X X
15.654 National Wildlife Refuge System Enhancements X
15.655 Migratory Bird Monitoring, Assessment and Conservation X
15.657 Endangered Species Conservation - Recovery Implementation Funds X X
15.660 Endangered Species - Candidate Conservation Action Funds X
15.663 NFWF - USFWS Conservation Partnership X
15.665 National Wetlands Inventory X
15.670 Adaptive Science X
15.678 Cooperative Ecosystem Studies Units X X
15.805 Assistance to State Water Resources Research Institutes X
15.808 U.S. Geological Survey Research and Data Collection X X
15.810 National Cooperative Geologic Mapping X X
15.812 Cooperative Research Units X X
15.815 National Land Remote Sensing Education Outreach and Research X
15.820 National and Regional Climate Adaption Science Centers X X
15.921 Rivers, Trails and Conservation Assistance X
15.926 American Battlefield Protection X
15.945 Cooperative Research and Training Programs - Resources of the National Park System X X
C-114

U.S Department of Justice
16.560 National Institute of Justice Research, Evaluation, and Development Project Grants X
U.S Department of State
19.022 Educational and Cultural Exchange Programs Appropriation Overseas Grants X
19.408 Academic Exchange Programs - Teachers X
19.415 Professional and Cultural Exchange Programs - Citizen Exchanges X
19.500 Middle East Partnership Initiative X
19.600 Bureau of Near Eastern Affairs X
U.S Department of Transportation
20.109 Air Transportation Centers of Excellence X
20.200 Highway Research and Development Program X
20.205 Highway Planning and Construction X
20.514 Public Transportation Research, Technical Assistance, and Training X
20.600 State and Community Highway Safety X
20.609 Safety Belt Performance Grants X
20.614 National Highway Traffic Safety Administration (NHTSA) Discretionary Safety Grants and Cooperative Agreements
X
20.616 National Priority Safety Programs X
20.701 University Transportation Centers Program X
20.724 Pipeline Safety Research Competitive Academic Agreement Program (CAAP) X
U.S Department of Treasury
21.020 Community Development Financial Institutions Program X
U.S National Aeronautics and Space Administration
43.001 Science X X
43.007 Space Operations X
43.008 Office of Stem Engagement (OSTEM) X
43.009 Cross Agency Support X
43.012 Space Technology X
U.S National Endowment for the Humanities
45.129 Promotion of the Humanities Federal/State Partnership X
45.161 Promotion of the Humanities Research X
45.312 National Leadership Grants X
45.313 Laura Bush 21st Century Librarian Program X
U.S National Science Foundation
47.041 Engineering X X
47.049 Mathematical and Physical Sciences X X
47.050 Geosciences X X
47.070 Computer and Information Science and Engineering X X
47.074 Biological Sciences X X
47.075 Social, Behavioral, and Economic Sciences X X
47.076 Education and Human Resources X X
47.078 Polar Program X X
47.079 Office of International Science and Engineering X X
47.080 Office of Cyberinfrastructure X
47.083 Integrative Activities X X
C-115

U.S Small Business Administration
59.058 Federal and State Technology Partnership Program X
U.S Department of Veterans Affairs
64.054 Research and Development X
U.S Environmental Protection Agency
66.202 Congressionally Mandated Projects X
66.454 Water Quality Management Planning X
66.461 Regional Wetland Program Development Grants X
66.466 Chesapeake Bay Program X
66.509 Science to Achieve Results (STAR) Research Program X
66.510 Surveys, Studies, Investigations and Special Purpose Grants within the Office of Research and Development
X
66.716 Research, Development, Monitoring, Public Education, Outreach, Training, Demonstrations, and Studies
X
66.951 Environmental Education Grants X
U.S Department of Energy
81.049 Office of Science Financial Assistance Program X X
81.087 Renewable Energy Research and Development X
81.089 Fossil Energy Research and Development X
81.121 Nuclear Energy Research, Development and Demonstration X
81.135 Advanced Research Projects Agency - Energy X
U.S Department of Education
84.217 TRIO McNair Post-Baccalaureate Achievement X
84.299 Indian Education - Special Programs for Indian Children X
84.305 Education Research, Development and Dissemination X
84.367 Supporting Effective Instruction State Grants (formerly Improving Teacher Quality State Grants)
X
U.S Department of Health and Human Services
93.001 Civil Rights and Privacy Rule Compliance Activities X
93.107 Area Health Education Centers X
93.110 Maternal and Child Health Federal Consolidated Programs X
93.113 Environmental Health X X
93.143 NIEHS Superfund Hazardous Substances - Basic Research and Education X
93.155 Rural Health Research Centers X
93.157 Centers of Excellence X
93.172 Human Genome Research X
93.173 Research Related to Deafness and Communication Disorders X
93.178 Nursing Workforce Diversity X
93.184 Disabilities Prevention X
93.213 Research and Training in Complementary and Integrative Health X
93.242 Mental Health Research Grants X X
93.243 Substance Abuse and Mental Health Services Projects of Regional and National Significance X X
93.262 Occupational Safety and Health Program X X
93.273 Alcohol Research Programs X
93.279 Drug Abuse and Addiction Research Programs X X
C-116

93.286 Discovery and Applied Research for Technological Innovations to Improve Human Health X
93.301 Small Rural Hospital Improvement Grant Program X
93.307 Minority Health and Health Disparities Research X
93.325 Paralysis Resource Center X
93.350 National Center for Advancing Translational Sciences X X
93.351 Research Infrastructure Programs X
93.358 Advanced Education Nursing Traineeships X
93.359 Nurse Education, Practice Quality and Retention Grants X
93.361 Nursing Research X
93.393 Cancer Cause and Prevention Research X X
93.424 Non-ACA/PPHF-Building Capacity of the Public Health System to Improve Population Health through National Nonprofit Organizations
X
93.433 ACL National Institute on Disability, Independent Living, and Rehabilitation Research X
93.504 Family to Family Health Information Centers X
93.524 Building Capacity of the Public Health System to Improve Population Health through National, Non-Profit Organizations-financed in part by Prevention and Public Health Funds (PPHF)
X
93.632 University Centers for Excellence in Developmental Disabilities Education, Research, and Service
X
93.670 Child Abuse and Neglect Discretionary Activities X
93.732 Mental and Behavioral Health Education and Training Grants X
93.822 Health Careers Opportunity Program X
93.837 Cardiovascular Diseases Research X
93.838 Lung Diseases Research X
93.846 Arthritis, Musculoskeletal and Skin Diseases Research X
93.847 Diabetes, Digestive, and Kidney Diseases Extramural Research X X
93.853 Extramural Research Programs in the Neurosciences and Neurological Disorders X X
93.855 Allergy and Infectious Diseases Research X X
93.859 Biomedical Research and Research Training X X
93.865 Child Health and Human Development Extramural Research X X
93.866 Aging Research X X
93.867 Vision Research X
93.879 Medical Library Assistance X X
93.884 Grants for Primary Care Training and Enhancement X
93.912 Rural Health Care Services Outreach, Rural Health Network Development and Small Health Care Provider Quality Improvement
X
93.913 Grants to State for Operation of State Offices of Rural Health X
93.933 Demonstration Projects for Indian Health X
93.944 Human Immunodeficiency Virus (HIV)/Acquired Immunodeficiency Virus Syndrome (AIDS) Surveillance
X
93.969 PPHF Geriatric Education Centers X
93.970 Health Professions Recruitment Program for Indians X X
U.S Social Security Administration
96.007 Social Security Research and Demonstration X
U.S Agency for International Development
98.001 USAID Foreign Assistance for Programs Overseas X
C-117


RECEIVED
March 26, 2020
LEGISLATIVE AUDIT DIV.
D-1

D-2

Find
ing
#C
FDA
#C
AP- C
orre
ctiv
e Ac
tion
Plan
Pers
on R
espo
nsib
le fo
r CAP
Targ
et D
ate
2019
-1Va
rious
Fina
ncia
l Sta
tem
ent P
repa
ratio
n, B
oard
of I
nves
tmen
ts -
For f
isca
l yea
r 201
9, th
e Le
gisl
ativ
e Au
dit D
ivis
ion
issu
ed a
n un
mod
ified
opi
nion
on
both
the
Uni
fied
Inve
stm
ent P
rogr
am's
and
the
Ente
rpris
e Pr
ogra
m's
fina
ncia
l st
atem
ents
. Fu
rther
mor
e, n
o re
com
men
datio
ns o
r int
erna
l con
trol f
indi
ngs
wer
e fo
und
in e
ither
aud
it re
port.
Dur
ing
fisca
l yea
r 201
9, th
e bo
ard
com
plet
ed th
e co
rrect
ive
actio
n st
eps
as p
revi
ousl
y de
taile
d.
Dan
Villa
, Exe
cutiv
e D
irect
orBo
ard
of In
vest
men
tsC
ompl
eted
2019
-2Va
rious
Amor
tizat
ion
of C
erta
in R
etire
men
t Sys
tem
s - T
each
ers'
Ret
irem
ent S
yste
m -
For t
he T
each
ers'
Ret
irem
ent
Syst
em (T
RS)
, if t
he a
mor
tizat
ion
perio
d is
gre
ater
than
30
year
s, th
e TR
S Be
nefit
and
Fun
ding
pol
icy
prov
ides
that
th
e bo
ard
will
dire
ct it
s co
ntra
cted
act
uary
to p
roje
ct fo
rwar
d th
e ac
tuar
ially
-reco
mm
ende
d co
ntrib
utio
n ra
te th
at c
an
be re
ason
ably
exp
ecte
d to
fully
am
ortiz
e th
e U
nfun
ded
Actu
aria
l Acc
rued
Lia
bilit
y ov
er a
clo
sed
30-y
ear p
erio
d ef
fect
ive
as o
f the
Jul
y 1
follo
win
g th
e ne
xt re
gula
r leg
isla
tive
sess
ion.
The
TRS
Bene
fit a
nd F
undi
ng p
olic
y al
so p
rovi
des
that
the
boar
d w
ill re
com
men
d to
the
gove
rnor
and
the
legi
slat
ure
that
fund
ing
be in
crea
sed,
and
/or l
iabi
litie
s be
redu
ced,
whe
neve
r the
mos
t rec
ent a
ctua
rial v
alua
tion
show
s th
at th
e am
ortiz
atio
n pe
riod
of th
e un
fund
ed li
abilit
ies
exce
eds
30 y
ears
and
the
boar
d ca
nnot
reas
onab
ly
antic
ipat
e th
at th
e am
ortiz
atio
n pe
riod
will
decl
ine,
or t
he fu
nded
ratio
will
impr
ove,
with
out a
n in
crea
se in
fund
ing
and/
or a
redu
ctio
n in
liab
ilitie
s.
In th
is c
ase,
the
actu
arie
s pr
ojec
ted
that
, with
no
cont
ribut
ion
rate
incr
ease
or l
iabi
lity
redu
ctio
n, th
e am
ortiz
atio
n pe
riod
wou
ld a
gain
be
30 y
ears
or l
ess
as o
f Jul
y 1,
201
9 (th
e Ju
ly 1
follo
win
g th
e en
d of
the
next
regu
lar l
egis
lativ
e se
ssio
n an
d th
e da
te o
f the
retir
emen
t sys
tem
’s n
ext a
ctua
rial v
alua
tion)
. The
refo
re, p
rovi
ded
that
the
actu
aria
l as
sum
ptio
ns a
re m
et, n
o co
ntrib
utio
n ra
te in
crea
se is
nec
essa
ry to
brin
g th
e am
ortiz
atio
n pe
riod
to 3
0 ye
ars
or
less
.
Shaw
n G
raha
m, E
xecu
tive
Dire
ctor
Teac
hers
' Ret
irem
ent S
yste
mC
ompl
eted
2019
-2Va
rious
Amor
tizat
ion
of C
erta
in R
etire
men
t Sys
tem
s - M
onta
na P
ublic
Em
ploy
ee R
etire
men
t Adm
inis
trat
ion
The
Mon
tana
Pub
lic E
mpl
oyee
Ret
irem
ent A
dmin
istra
tion
(MPE
RA)
, as
staf
f for
the
Mon
tana
Pub
lic E
mpl
oyee
s R
etire
men
t Boa
rd (M
PER
B), p
rovi
des
the
follo
win
g re
spon
se to
you
r fin
ding
of m
ater
ial n
onco
mpl
ianc
e fo
r the
ac
tuar
ial u
nsou
ndne
ss o
f the
Pub
lic E
mpl
oyee
s’ R
etire
men
t Sys
tem
(PER
S), H
ighw
ay P
atro
l Offi
cers
’ Ret
irem
ent
Syst
em (H
POR
S), a
nd th
e G
ame
War
dens
’ and
Pea
ce O
ffice
rs’ R
etire
men
t Sys
tem
(GW
POR
S).
As c
onst
itutio
nally
requ
ired
by A
rticl
e VI
II §
15 o
f the
Mon
tana
Con
stitu
tion,
MPE
RA
and
the
MPE
RB
mon
itors
and
co
nfro
nts
all d
efin
ed b
enef
it pl
an fu
ndin
g sh
ortfa
lls a
nd re
com
men
ds fu
ndin
g le
gisl
atio
n, w
hen
nece
ssar
y, fo
r pla
ns
that
will
not a
mor
tize
with
in 3
0 ye
ars.
MPE
RA,
on
beha
lf of
the
MPE
RB,
is m
onito
ring
clos
ely
the
fund
ing
stat
us o
f PE
RS,
HPO
RS
and
GW
POR
S an
d ha
s al
read
y se
en a
dec
reas
e in
fund
ing
for b
oth
PER
S an
d G
WPO
RS.
Bas
ed
upon
the
expe
rt op
inio
n fu
rnis
hed
to M
PER
A an
d M
PER
B by
its
actu
ary,
Cav
anau
gh M
acdo
nald
Con
sulti
ng L
LC,
durin
g th
e m
ost r
ecen
t val
uatio
n fo
r eac
h sy
stem
, MPE
RA
and
the
MPE
RB
expe
ct a
ctua
rial g
ains
on
inve
stm
ents
fo
r eac
h sy
stem
in fu
ture
fisc
al y
ears
. As
such
, if t
he a
dopt
ed a
ctua
rial a
ssum
ptio
ns o
f the
MPE
RB
are
met
for
each
of t
hese
sys
tem
s du
ring
thes
e ye
ars,
the
futu
re v
alua
tions
of P
ERS,
HPO
RS
and
GW
POR
S ar
e se
t to
reco
gniz
e m
ore
actu
aria
l gai
ns th
an lo
sses
.
Ahea
d of
the
2021
Leg
isla
tive
Sess
ion,
MPE
RA
and
the
MPE
RB
will
cont
inue
mon
itorin
g PE
RS,
HPO
RS,
and
G
WPO
RS
and
shou
ld it
bec
ome
nece
ssar
y, b
ased
upo
n th
e ex
pert
opin
ion
of it
s ac
tuar
y, M
PER
A w
ill pr
opos
e fu
ndin
g le
gisl
atio
n fo
r app
rova
l by
MPE
RB
for a
ny o
ne o
r all
of th
ese
plan
s.
Dor
e Sc
hwin
den,
Exe
cutiv
e D
irect
orPu
blic
Em
ploy
ees'
Ret
irem
ent A
dmin
istra
tion
Ong
oing
STAT
E O
F M
ON
TAN
AC
OR
REC
TIVE
AC
TIO
N P
LAN
FOR
TH
E TW
O F
ISC
AL Y
EAR
S EN
DED
JU
NE
30, 2
019
D-3

Find
ing
#C
FDA
#C
AP- C
orre
ctiv
e Ac
tion
Plan
Pers
on R
espo
nsib
le fo
r CAP
Targ
et D
ate
STAT
E O
F M
ON
TAN
AC
OR
REC
TIVE
AC
TIO
N P
LAN
FOR
TH
E TW
O F
ISC
AL Y
EAR
S EN
DED
JU
NE
30, 2
019
2019
-3Va
rious
Med
icai
d an
d C
hild
ren'
s H
ealth
Insu
ranc
e Pr
ogra
m E
ligib
ility
Det
erm
inat
ions
- Th
e D
epar
tmen
t of P
ublic
H
ealth
and
Hum
an S
ervi
ces
does
not
con
cur w
ith th
is a
udit
findi
ng.
The
depa
rtmen
t has
est
ablis
hed
and
mai
ntai
ned
cont
rols
to ti
mel
y ve
rify
clie
nt e
ligib
ility
fact
ors
for a
ll ap
plic
ants
and
clie
nts
at a
pplic
atio
n an
d re
dete
rmin
atio
n. F
urth
er, t
he d
epar
tmen
t doe
s co
mpl
y w
ith fe
dera
l reg
ulat
ions
and
sta
te p
lan
requ
irem
ents
, pl
acin
g el
igib
le c
lient
s in
to th
e co
rrect
elig
ibilit
y ca
tego
ries.
The
aud
itors
cho
se to
test
mem
ber e
ligib
ility
usin
g st
anda
rds
that
are
1) n
ot a
ppro
ved,
2) n
ot c
onsi
sten
t with
fede
ral r
egul
atio
n, a
nd 3
) not
per
mis
sibl
e un
der f
eder
al
law
.
The
audi
tors
cla
im in
elig
ibilit
y ba
sed
prim
arily
on
a da
ta s
ourc
e un
avai
labl
e to
the
agen
cy u
nder
sta
te la
w, a
nd
impe
rmis
sibl
e ac
cord
ing
to fe
dera
lly-a
ppro
ved
stat
e pl
ans.
Pur
suan
t to
fede
ral r
egul
atio
n, th
e St
ate
of M
onta
na is
m
anda
ted
to fo
llow
its
fede
rally
-app
rove
d st
ate
plan
s. E
xpec
ting
the
stat
e to
det
erm
ine
elig
ibilit
y un
der a
n un
appr
oved
, una
vaila
ble
rubr
ic p
lace
s th
e st
ate
at c
onsi
dera
ble
risk
of n
on-c
ompl
ianc
e w
ith it
s fe
dera
lly-a
ppro
ved
stat
e pl
ans.
The
audi
tors
”red
eter
min
ed” e
ligib
ility
base
d on
aud
itor-d
esig
ned
calc
ulat
ions
that
do
not c
ompl
y w
ith fe
dera
l law
an
d re
gula
tion.
Med
icai
d la
w s
tate
s th
at w
hen
usin
g th
e M
odifi
ed A
djus
ted
Gro
ss In
com
e (M
AGI)-
base
d in
com
e m
etho
dolo
gy to
det
erm
ine
elig
ibilit
y, th
e fin
anci
al e
ligib
ility
mus
t be
base
d on
the
curre
nt m
onth
ly in
com
e an
d fa
mily
siz
e. P
ursu
ant t
o re
gula
tory
requ
irem
ents
, inc
ome
can
and
shou
ld b
e do
cum
ente
d fro
m m
any
sour
ces,
not
ju
st ta
x re
turn
dat
a.
Eric
a Jo
hnst
on,
Chi
ef O
pera
ting
Offi
cer/C
hief
Fin
anci
al O
ffice
rO
pera
tions
Ser
vice
s Br
anch
Dep
artm
ent o
f Pub
lic H
ealth
and
Hum
an S
ervi
ces
N/A
Appl
icab
le R
equi
rem
ents
:
• Th
e So
cial
Sec
urity
Act
Sec
tion
1902
(e) 1
4 (H
) sta
tes
that
an
indi
vidu
al’s
inco
me
mus
t be
dete
rmin
ed a
t “th
e po
int i
n tim
e at
whi
ch a
n ap
plic
atio
n fo
r med
ical
ass
ista
nce…
is
proc
esse
d…”
Fede
ral r
egul
atio
ns re
quire
that
M
AGI-b
ased
fina
ncia
l elig
ibilit
y fo
r Med
icai
d “m
ust b
e ba
sed
on c
urre
nt m
onth
ly h
ouse
hold
inco
me
and
fam
ily
size
.” (4
2 C
FR 4
25.6
03 (h
))
• Fe
dera
l def
initi
on a
nd d
irect
ion
are
clea
r tha
t MAG
I-bas
ed c
alcu
latio
ns c
onst
itute
a re
quire
d m
etho
dolo
gy, n
ot a
nu
mbe
r on
a ta
x re
turn
. Th
is is
bec
ause
tax
retu
rn in
form
atio
n do
es n
ot re
pres
ent a
n in
divi
dual
’s c
urre
nt in
com
e at
th
e tim
e of
det
erm
inat
ion.
The
audi
tors
use
d st
ate
tax
data
to th
e ex
clus
ion
of c
urre
nt e
vide
nce
avai
labl
e in
the
mem
ber c
ase
files
. Th
is
flaw
ed a
ppro
ach
was
rein
forc
ed b
y im
plic
atio
ns in
the
audi
t rep
ort t
hat t
he in
crea
sed
use
of a
file
that
con
tain
ed
limite
d In
tern
al R
even
ue S
ervi
ce ta
x da
ta w
ould
resu
lt in
impr
oved
elig
ibilit
y de
term
inat
ions
. Th
ese
stat
emen
ts re
-co
nfirm
that
the
audi
tors
mis
unde
rsta
nd th
e M
AGI-b
ased
elig
ibilit
y de
term
inat
ion
requ
irem
ents
est
ablis
hed
in th
e So
cial
Sec
urity
Act
. Th
is re
sults
in a
n au
dit t
estin
g m
etho
dolo
gy th
at c
reat
es a
hyp
othe
tical
sta
ndar
d of
elig
ibilit
y th
at d
oes
not c
ompl
y w
ith th
e M
edic
aid
fede
ral r
egul
atio
ns.
The
audi
tors
use
lim
ited,
una
llow
able
info
rmat
ion
that
is n
ot c
urre
nt a
nd im
perm
issi
ble
met
hods
to c
oncl
ude
that
pa
rtici
pant
s ar
e in
elig
ible
. M
onta
na h
as a
lega
l obl
igat
ion
to p
rovi
de h
ealth
car
e co
vera
ge to
citi
zens
who
mee
t the
el
igib
ility
requ
irem
ents
of t
he le
gisl
ativ
ely-
appr
oved
Med
icai
d pr
ogra
m.
It w
ould
be
unla
wfu
l for
the
Dep
artm
ent o
f Pu
blic
Hea
lth a
nd H
uman
Ser
vice
s to
den
y or
revo
ke h
ealth
car
e co
vera
ge to
Mon
tana
ns w
ho a
re e
ligib
le fo
r the
pr
ogra
m a
s de
sign
ed a
nd a
ppro
ved.
D-4

Find
ing
#C
FDA
#C
AP- C
orre
ctiv
e Ac
tion
Plan
Pers
on R
espo
nsib
le fo
r CAP
Targ
et D
ate
STAT
E O
F M
ON
TAN
AC
OR
REC
TIVE
AC
TIO
N P
LAN
FOR
TH
E TW
O F
ISC
AL Y
EAR
S EN
DED
JU
NE
30, 2
019
The
calc
ulat
ion
of k
now
n an
d qu
estio
ned
cost
s is
bas
ed o
n se
vera
l inc
orre
ct fa
ctor
s, a
ssum
ptio
ns, a
nd
appr
oach
es.
Cla
ims
for a
ll 63
indi
vidu
als
in th
e sa
mpl
e se
t wer
e in
depe
nden
tly q
uerie
d an
d re
sear
ched
by
data
an
alys
ts in
thre
e di
stin
ct a
reas
in th
e de
partm
ent w
ho a
re s
ubje
ct m
atte
r exp
erts
in M
edic
aid
clai
ms
and
cost
an
alys
is.
Sign
ifica
nt e
rrors
and
dis
crep
anci
es w
ere
note
d an
d co
mm
unic
ated
to th
e au
dito
rs.
For e
xam
ple,
the
audi
tors
con
clud
ed th
at 2
6 of
63
indi
vidu
al m
embe
r sam
ples
had
"ind
icat
ions
of i
nelig
ibilit
y," b
ased
on
unap
prov
ed
elig
ibilit
y de
term
inat
ion
desi
gn.
The
depa
rtmen
t ide
ntifi
ed 5
of 6
3 in
divi
dual
mem
ber s
ampl
es in
erro
r usi
ng
requ
ired
elig
ibilit
y de
sign
. Th
ere
are
sign
ifica
nt e
rrors
in th
e id
entif
icat
ion
of k
now
n qu
estio
ned
cost
s, w
hich
form
s th
e ba
sis
of p
roje
cted
like
ly q
uest
ione
d co
sts.
The
dep
artm
ent i
s un
able
to c
oncl
ude,
with
any
leve
l of c
onfid
ence
, th
at e
ither
the
know
n or
like
ly q
uest
ione
d co
sts
are
wha
t a p
rude
nt p
erso
n w
ould
con
side
r rea
sona
ble.
2019
-4Va
rious
Supp
lem
enta
l Nut
ritio
n As
sist
ance
Pro
gram
Con
trol
s - T
he D
epar
tmen
t of P
ublic
Hea
lth a
nd H
uman
Ser
vice
s m
aint
ains
that
ther
e ar
e si
gnifi
cant
con
trols
in p
lace
(and
dem
onst
rate
d to
the
audi
tors
) to
ensu
re th
at th
e Su
pple
men
tal N
utrit
ion
Assi
stan
ce P
rogr
am (S
NAP
) pay
men
ts a
re re
porte
d ac
cura
tely
on
the
finan
cial
sta
tem
ents
. Th
e de
partm
ent o
nly
issu
es a
ssis
tanc
e to
elig
ible
Mon
tana
ns b
ased
on
the
cont
rols
bui
lt w
ithin
our
elig
ibilit
y pr
oces
s an
d sy
stem
, our
ben
efit
issu
ance
pro
cess
and
file
s, a
nd b
enef
it re
dem
ptio
n pr
oces
s. T
he d
epar
tmen
t ful
ly
reco
ncile
s th
e be
nefit
s is
sued
to th
e am
ount
of b
enef
its p
lace
d on
Ele
ctro
nic
Bene
fit T
rans
fer (
EBT)
car
ds.
The
depa
rtmen
t ack
now
ledg
es th
at th
e SN
AP fe
dera
l gui
delin
es a
re s
peci
fic a
s to
the
requ
irem
ents
of
inde
pend
ent a
udits
of E
BT s
ervi
ce o
rgan
izat
ions
and
will
be p
ursu
ing
the
appr
opria
te le
vel o
f aud
it be
yond
the
annu
al S
yste
m a
nd O
rgan
izat
ion
Con
trols
(SO
C) 2
Typ
e 2
audi
t cur
rent
ly c
ondu
cted
. H
owev
er, t
he d
epar
tmen
t is
not c
ompl
etel
y w
ithou
t con
trols
in p
lace
to p
rovi
de a
ssur
ance
ove
r the
ope
ratin
g ef
fect
iven
ess
and
appr
opria
te
desi
gn o
f con
trols
at t
he s
ervi
ce o
rgan
izat
ion.
The
depa
rtmen
t will
requ
est a
SO
C 1
Typ
e 2
audi
t be
cond
ucte
d, a
nd re
sults
sub
mitt
ed, t
o th
e de
partm
ent f
rom
its
EBT
vend
or.
The
depa
rtmen
t will
incl
ude
SOC
1 T
ype
2 au
dits
in b
ase
requ
irem
ents
for a
ll in
form
atio
n te
chno
logy
(IT
) sys
tem
s th
at p
rovi
de fi
nanc
ial p
roce
ssin
g se
rvic
es o
n be
half
of th
e de
partm
ent a
nd in
clud
e st
anda
rd la
ngua
ge
rega
rdin
g SO
C re
ports
in IT
sys
tem
con
tract
tem
plat
es
Dav
id C
row
son,
Chi
ef In
form
atio
n O
ffice
rIn
form
atio
n Te
chno
logy
Ser
vice
s D
ivis
ion
Dep
artm
ent o
f Pub
lic H
ealth
and
Hum
an S
ervi
ces
9/30
/202
0
2019
-001
93.7
7593
.777
93.7
7893
.767
Med
icai
d an
d C
hild
ren'
s H
ealth
Insu
ranc
e Pr
ogra
m E
ligib
ility
Det
erm
inat
ions
- Th
e D
epar
tmen
t of P
ublic
H
ealth
and
Hum
an S
ervi
ces
does
not
con
cur w
ith th
is a
udit
findi
ng.
The
depa
rtmen
t has
est
ablis
hed
and
mai
ntai
ned
cont
rols
to ti
mel
y ve
rify
clie
nt e
ligib
ility
fact
ors
for a
ll ap
plic
ants
and
clie
nts
at a
pplic
atio
n an
d re
dete
rmin
atio
n. F
urth
er, t
he d
epar
tmen
t doe
s co
mpl
y w
ith fe
dera
l reg
ulat
ions
and
sta
te p
lan
requ
irem
ents
, pl
acin
g el
igib
le c
lient
s in
to th
e co
rrect
elig
ibilit
y ca
tego
ries.
The
aud
itors
cho
se to
test
mem
ber e
ligib
ility
usin
g st
anda
rds
that
are
1) n
ot a
ppro
ved,
2) n
ot c
onsi
sten
t with
fede
ral r
egul
atio
n, a
nd 3
) not
per
mis
sibl
e un
der f
eder
al
law
.
The
audi
tors
cla
im in
elig
ibilit
y ba
sed
prim
arily
on
a da
ta s
ourc
e un
avai
labl
e to
the
agen
cy u
nder
sta
te la
w, a
nd
impe
rmis
sibl
e ac
cord
ing
to fe
dera
lly-a
ppro
ved
stat
e pl
ans.
Pur
suan
t to
fede
ral r
egul
atio
n, th
e St
ate
of M
onta
na is
m
anda
ted
to fo
llow
its
fede
rally
-app
rove
d st
ate
plan
s. E
xpec
ting
the
stat
e to
det
erm
ine
elig
ibilit
y un
der a
n un
appr
oved
, una
vaila
ble
rubr
ic p
lace
s th
e st
ate
at c
onsi
dera
ble
risk
of n
on-c
ompl
ianc
e w
ith it
s fe
dera
lly-a
ppro
ved
stat
e pl
ans.
The
audi
tors
”red
eter
min
ed” e
ligib
ility
base
d on
aud
itor-d
esig
ned
calc
ulat
ions
that
do
not c
ompl
y w
ith fe
dera
l law
an
d re
gula
tion.
Med
icai
d la
w s
tate
s th
at w
hen
usin
g th
e M
odifi
ed A
djus
ted
Gro
ss In
com
e (M
AGI)-
base
d in
com
e m
etho
dolo
gy to
det
erm
ine
elig
ibilit
y, th
e fin
anci
al e
ligib
ility
mus
t be
base
d on
the
curre
nt m
onth
ly in
com
e an
d fa
mily
siz
e. P
ursu
ant t
o re
gula
tory
requ
irem
ents
, inc
ome
can
and
shou
ld b
e do
cum
ente
d fro
m m
any
sour
ces,
not
ju
st ta
x re
turn
dat
a.
Eric
a Jo
hnst
on,
Chi
ef O
pera
ting
Offi
cer/C
hief
Fin
anci
al O
ffice
rO
pera
tions
Ser
vice
s Br
anch
Dep
artm
ent o
f Pub
lic H
ealth
and
Hum
an S
ervi
ces
N/A
D-5

Find
ing
#C
FDA
#C
AP- C
orre
ctiv
e Ac
tion
Plan
Pers
on R
espo
nsib
le fo
r CAP
Targ
et D
ate
STAT
E O
F M
ON
TAN
AC
OR
REC
TIVE
AC
TIO
N P
LAN
FOR
TH
E TW
O F
ISC
AL Y
EAR
S EN
DED
JU
NE
30, 2
019
Appl
icab
le R
equi
rem
ents
:
• Th
e So
cial
Sec
urity
Act
Sec
tion
1902
(e) 1
4 (H
) sta
tes
that
an
indi
vidu
al’s
inco
me
mus
t be
dete
rmin
ed a
t “th
e po
int i
n tim
e at
whi
ch a
n ap
plic
atio
n fo
r med
ical
ass
ista
nce…
is
proc
esse
d…”
Fede
ral r
egul
atio
ns re
quire
that
M
AGI-b
ased
fina
ncia
l elig
ibilit
y fo
r Med
icai
d “m
ust b
e ba
sed
on c
urre
nt m
onth
ly h
ouse
hold
inco
me
and
fam
ily
size
.” (4
2 C
FR 4
25.6
03 (h
))
• Fe
dera
l def
initi
on a
nd d
irect
ion
are
clea
r tha
t MAG
I-bas
ed c
alcu
latio
ns c
onst
itute
a re
quire
d m
etho
dolo
gy, n
ot a
nu
mbe
r on
a ta
x re
turn
. Th
is is
bec
ause
tax
retu
rn in
form
atio
n do
es n
ot re
pres
ent a
n in
divi
dual
’s c
urre
nt in
com
e at
th
e tim
e of
det
erm
inat
ion.
The
audi
tors
use
d st
ate
tax
data
to th
e ex
clus
ion
of c
urre
nt e
vide
nce
avai
labl
e in
the
mem
ber c
ase
files
. Th
is
flaw
ed a
ppro
ach
was
rein
forc
ed b
y im
plic
atio
ns in
the
audi
t rep
ort t
hat t
he in
crea
sed
use
of a
file
that
con
tain
s lim
ited
Inte
rnal
Rev
enue
Ser
vice
tax
data
wou
ld re
sult
in im
prov
ed e
ligib
ility
dete
rmin
atio
ns.
Thes
e st
atem
ents
re-
conf
irm th
at th
e au
dito
rs m
isun
ders
tand
the
MAG
I-bas
ed e
ligib
ility
dete
rmin
atio
n re
quire
men
ts e
stab
lishe
d in
the
Soci
al S
ecur
ity A
ct.
This
resu
lts in
an
audi
t tes
ting
met
hodo
logy
that
cre
ates
a h
ypot
hetic
al s
tand
ard
of e
ligib
ility
that
doe
s no
t com
ply
with
the
Med
icai
d fe
dera
l reg
ulat
ions
.
The
audi
tors
use
d lim
ited,
una
llow
able
info
rmat
ion
that
is n
ot c
urre
nt a
nd im
perm
issi
ble
met
hods
to c
oncl
ude
that
pa
rtici
pant
s ar
e in
elig
ible
. M
onta
na h
as a
lega
l obl
igat
ion
to p
rovi
de h
ealth
car
e co
vera
ge to
citi
zens
who
mee
t the
el
igib
ility
requ
irem
ents
of t
he le
gisl
ativ
ely
appr
oved
Med
icai
d pr
ogra
m.
It w
ould
be
unla
wfu
l for
the
Dep
artm
ent o
f Pu
blic
Hea
lth a
nd H
uman
Ser
vice
s to
den
y or
revo
ke h
ealth
car
e co
vera
ge to
Mon
tana
ns w
ho a
re e
ligib
le fo
r the
pr
ogra
m a
s de
sign
ed a
nd a
ppro
ved.
2019
-002
93.7
7593
.777
93.7
78
Med
icai
d Th
ird P
arty
Lia
bilit
y - T
he D
epar
tmen
t of P
ublic
Hea
lth a
nd H
uman
Ser
vice
s do
es n
ot c
oncu
r with
this
au
dit f
indi
ng.
The
depa
rtmen
t fol
low
s its
app
rove
d st
ate
plan
s w
ith re
gard
to th
e st
ate
wag
e in
form
atio
n co
llect
ion
agen
cy (S
WIC
A) in
terfa
ces
and
uses
man
y m
etho
ds to
iden
tify
the
lega
l lia
bilit
y of
third
par
ties
(TPL
). T
he
audi
tors
app
ear t
o ta
ke is
sue
with
the
timin
g of
one
of t
he m
etho
ds u
sed.
The
depa
rtmen
t has
the
follo
win
g pr
even
tive
cont
rols
in p
lace
for t
he S
WIC
A an
d So
cial
Sec
urity
Adm
inis
tratio
n In
terfa
ces:
a) F
or n
on-M
odifi
ed A
djus
ted
Gro
ss In
com
e (M
AGI)
appl
ican
ts, t
he in
terfa
ces
are
run
prio
r to
elig
ibilit
y de
term
inat
ion.
b) F
or M
AGI a
pplic
ants
, the
inte
rface
s ar
e ru
n w
ithin
90
days
of a
pplic
atio
n th
roug
h th
e po
st e
ligib
ility
verif
icat
ion
(PEV
) pro
cess
aut
horiz
ed b
y th
e C
ente
rs fo
r Med
icar
e an
d M
edic
aid
Serv
ices
(CM
S) v
ia th
e ve
rific
atio
n pl
an. T
he
depa
rtmen
t con
side
rs th
e PE
V pr
oces
s an
ext
ensi
on o
f app
licat
ion
and
elig
ibilit
y de
term
inat
ion
and
has
an
appr
oved
pla
n w
ith C
MS
to c
ondu
ct th
ese
mat
ches
on
the
MAG
I pop
ulat
ion
as a
par
t of t
hat p
roce
ss.
Eric
a Jo
hnst
on,
Chi
ef O
pera
ting
Offi
cer/C
hief
Fin
anci
al O
ffice
rO
pera
tions
Ser
vice
s Br
anch
Dep
artm
ent o
f Pub
lic H
ealth
and
Hum
an S
ervi
ces
N/A
D-6

Find
ing
#C
FDA
#C
AP- C
orre
ctiv
e Ac
tion
Plan
Pers
on R
espo
nsib
le fo
r CAP
Targ
et D
ate
STAT
E O
F M
ON
TAN
AC
OR
REC
TIVE
AC
TIO
N P
LAN
FOR
TH
E TW
O F
ISC
AL Y
EAR
S EN
DED
JU
NE
30, 2
019
2019
-003
93.7
7593
.777
93.7
78
Med
icai
d Pr
ovid
er F
raud
Doc
umen
tatio
n - T
he D
epar
tmen
t of P
ublic
Hea
lth a
nd H
uman
Ser
vice
s pa
rtial
ly
conc
urs
with
this
aud
it fin
ding
. In
tern
al c
ontro
ls re
gard
ing
case
file
mai
nten
ance
will
be s
treng
then
ed a
nd s
taff
will
be re
train
ed o
n th
e do
cum
enta
tion
requ
irem
ents
. H
owev
er, i
t is
not p
rude
nt fo
r the
dep
artm
ent t
o co
mm
it to
se
ekin
g ch
ange
s in
legi
slat
ion,
whe
n th
at a
ctiv
ity is
out
side
the
depa
rtmen
t's c
ontro
l.
The
depa
rtmen
t fee
ls th
at a
n in
crea
sed
focu
sed
on n
ew p
rovi
der r
evie
ws
offe
rs th
e op
portu
nity
for p
rope
r ed
ucat
ion
and
train
ing
on a
llow
able
billi
ng to
est
ablis
h be
st p
ract
ices
from
the
star
t of M
edic
aid
serv
ice
prov
isio
n.
Prio
r to
audi
tor r
evie
w, t
he d
epar
tmen
t's o
wn
inte
rnal
revi
ew o
f the
Sur
veilla
nce
Util
izat
ion
Rev
iew
Sec
tion
plan
id
entif
ied
an u
neve
n ra
tio o
f new
pro
vide
r rev
iew
s in
sta
te fi
scal
yea
r 201
8, a
nd a
djus
tmen
ts w
ere
mad
e to
ens
ure
an a
ppro
pria
te c
ross
-sec
tion
of p
rovi
ders
in re
view
. Th
e au
dito
rs id
entif
ied
inst
ance
s w
here
reco
rd k
eepi
ng
activ
ities
cou
ld b
e st
reng
then
ed.
The
depa
rtmen
t fol
low
s cu
rrent
sta
te la
w w
ith re
gard
to re
cord
s re
ques
ts a
nd a
llow
able
tim
e fra
mes
. Th
e st
atut
e th
at c
reat
es th
is c
riter
ia p
asse
d th
e 20
17 M
onta
na S
tate
Leg
isla
ture
with
an
over
whe
lmin
g m
ajor
ity v
ote
(49-
0 in
Se
nate
; 94-
2 in
Hou
se).
A b
ill re
vers
ing
the
limita
tions
in th
e 20
19 M
onta
na S
tate
Leg
isla
ture
did
not
mak
e it
out
of c
omm
ittee
. Th
e ul
timat
e re
spon
sibi
lity
for c
hang
es in
legi
slat
ion
lies
with
the
Legi
slat
ive
Bran
ch, n
ot th
e de
partm
ent.
The
dep
artm
ent c
anno
t im
plem
ent p
olic
y th
at c
onfli
cts
with
sta
te la
w.
Car
ter A
nder
son,
Adm
inis
trato
rQ
ualit
y As
sura
nce
Div
isio
nD
epar
tmen
t of P
ublic
Hea
lth a
nd H
uman
Ser
vice
s
6/30
/202
0
2019
-004
93.7
7593
.777
93.7
78
Med
icai
d B
enef
icia
ry F
raud
and
Abu
se C
ontr
ols
- The
Dep
artm
ent o
f Pub
lic H
ealth
and
Hum
an S
ervi
ces
does
no
t con
cur w
ith th
is a
udit
findi
ng.
The
depa
rtmen
t alre
ady
com
plie
s w
ith fe
dera
l reg
ulat
ions
rega
rdin
g in
vest
igat
ions
of M
edic
aid
fraud
and
refe
rral t
o la
w e
nfor
cem
ent.
The
depa
rtmen
t cur
rent
ly c
ondu
cts
inve
stig
atio
ns a
s re
quire
d by
fede
ral r
egul
atio
ns.
Prel
imin
ary
inve
stig
atio
ns a
re
cond
ucte
d on
all
refe
rrals
to th
e pr
ogra
m in
tegr
ity u
nit.
If fr
aud
or a
buse
is s
uppo
rted
in a
vaila
ble
info
rmat
ion,
a fu
ll in
vest
igat
ion
is c
ondu
cted
. Th
e au
dito
rs a
ppea
r to
take
exc
eptio
n to
tim
e m
anag
emen
t gui
delin
es in
clud
ed in
des
k le
vel p
roce
dure
s. T
hose
gui
delin
es w
ere
rem
oved
in S
epte
mbe
r 201
9. T
he d
epar
tmen
t mak
es re
ferra
ls to
law
en
forc
emen
t whe
n, a
fter t
he c
oncl
usio
n of
a fu
ll in
vest
igat
ion,
ther
e is
reas
on to
bel
ieve
frau
d ha
s oc
curre
d.
Eric
a Jo
hnst
on,
Chi
ef O
pera
ting
Offi
cer/C
hief
Fin
anci
al O
ffice
rO
pera
tions
Ser
vice
s Br
anch
Dep
artm
ent o
f Pub
lic H
ealth
and
Hum
an S
ervi
ces
N/A
D-7

Find
ing
#C
FDA
#C
AP- C
orre
ctiv
e Ac
tion
Plan
Pers
on R
espo
nsib
le fo
r CAP
Targ
et D
ate
STAT
E O
F M
ON
TAN
AC
OR
REC
TIVE
AC
TIO
N P
LAN
FOR
TH
E TW
O F
ISC
AL Y
EAR
S EN
DED
JU
NE
30, 2
019
2019
-005
93.7
7593
.777
93.7
78
Med
icai
d C
ontr
act L
angu
age
- The
Dep
artm
ent o
f Pub
lic H
ealth
and
Hum
an S
ervi
ces
does
not
con
cur w
ith th
is
audi
t fin
ding
. Th
e au
dito
rs' i
nter
pret
atio
n of
wha
t con
stitu
tes
acce
ptan
ce o
f con
tract
term
s an
d co
nditi
ons
is
unne
cess
arily
nar
row
, and
the
cond
ition
of n
on-c
ompl
ianc
e fo
r thi
s fin
ding
doe
s no
t exi
st.
The
depa
rtmen
t has
est
ablis
hed
and
docu
men
ted
inte
rnal
con
trols
to e
nsur
e al
l rel
evan
t con
tract
dis
clos
ures
are
co
nduc
ted
in a
man
ner c
onsi
sten
t with
fede
ral r
egul
atio
n. 2
CFR
180
.300
allo
ws
for t
hree
opt
ions
for v
erify
ing
the
entit
y w
ith w
hom
we
inte
nd to
do
busi
ness
is n
ot e
xclu
ded
or d
isqu
alifi
ed:
(a)
Che
ckin
g Sy
stem
for A
war
d M
anag
emen
t exc
lusi
ons;
(b
) C
olle
ctin
g a
certi
ficat
ion
from
that
per
son;
or
(c)
Add
ing
a cl
ause
or c
ondi
tion
to th
e co
vere
d tr
ansa
ctio
n w
ith th
at p
erso
n
The
requ
ired
lang
uage
rela
ted
to d
ebar
men
t and
sus
pens
ion
was
com
mun
icat
ed to
the
entit
y th
e de
partm
ent h
as
cont
ract
ed w
ith to
pro
vide
thes
e se
rvic
es th
roug
h a
stan
dard
pur
chas
e or
der.
The
pur
chas
e or
der (
whi
ch is
issu
ed
to v
endo
rs p
rior t
o th
e de
liver
y of
and
pay
men
t for
ser
vice
s) in
clud
es th
is s
tand
ard
lang
uage
, and
con
stitu
tes
the
cove
red
trans
actio
n w
ith th
e ve
ndor
:
The
Con
tract
or in
agr
eein
g to
eng
age
in th
e de
liver
y of
ser
vice
s in
acc
orda
nce
with
the
Pur
chas
e O
rder
to w
hich
th
is "S
tand
ard
Term
s an
d C
ondi
tions
" doc
umen
t is
atta
ched
and
inco
rpor
ated
furth
er a
gree
s to
acc
epta
nce
of th
e D
epar
tmen
t's fo
llow
ing
term
s an
d co
nditi
ons
and
any
othe
r pro
visi
ons
stat
ed in
any
oth
er a
ttach
men
ts to
the
Pur
chas
e O
rder
.
Eric
a Jo
hnst
on,
Chi
ef O
pera
ting
Offi
cer/C
hief
Fin
anci
al O
ffice
rO
pera
tions
Ser
vice
s Br
anch
Dep
artm
ent o
f Pub
lic H
ealth
and
Hum
an S
ervi
ces
N/A
Furth
er, t
he “S
tand
ard
Term
s an
d C
ondi
tions
” inc
lude
s th
e fo
llow
ing
stat
emen
t:
DE
BA
RM
EN
T: T
he C
ontra
ctor
cer
tifie
s th
at n
eith
er it
nor
its
prin
cipa
ls a
re p
rese
ntly
deb
arre
d, s
uspe
nded
, pr
opos
ed fo
r deb
arm
ent,
decl
ared
inel
igib
le, o
r vol
unta
rily
excl
uded
from
par
ticip
atio
n in
this
Pur
chas
e O
rder
by
any
gove
rnm
enta
l dep
artm
ent o
r age
ncy.
If C
ontra
ctor
can
not c
ertif
y th
is s
tate
men
t, at
tach
a w
ritte
n ex
plan
atio
n fo
r rev
iew
and
con
side
ratio
n by
the
Dep
artm
ent.
This
info
rmat
ion
was
pro
vide
d to
the
audi
tors
sev
eral
tim
es.
How
ever
, the
aud
itors
con
clud
ed th
at th
is e
vide
nce
is
insu
ffici
ent a
s it
does
not
incl
ude
a ph
ysic
al s
igna
ture
. Th
e au
dito
rs d
id n
ot id
entif
y an
inst
ance
in w
hich
the
fede
ral r
equi
rem
ents
wer
e no
t met
.
2019
-006
93.7
67C
hild
ren'
s H
ealth
Insu
ranc
e Pr
ogra
m -
Hea
lth In
sura
nce
Prem
ium
Pay
men
ts -
The
Dep
artm
ent o
f Pub
lic
Hea
lth a
nd H
uman
Ser
vice
s w
ill de
velo
p co
ntro
l pro
cedu
res
to e
nsur
e th
at th
e H
ealth
Insu
ranc
e Pr
emiu
m
Paym
ent p
rogr
am m
aint
ains
an
accu
rate
list
of c
harg
ing
mec
hani
sms
and
that
impa
cted
sta
ff un
ders
tand
thei
r use
.
Dar
ci W
iebe
, Adm
inis
trato
rH
ealth
Res
ourc
es D
ivis
ion
Dep
artm
ent o
f Pub
lic H
ealth
and
Hum
an S
ervi
ces
Car
ter A
nder
son,
Adm
inis
trato
rQ
ualit
y As
sura
nce
Div
isio
nD
epar
tmen
t of P
ublic
Hea
lth a
nd H
uman
Ser
vice
s
7/1/
2020
The
depa
rtmen
t has
iden
tifie
d in
appr
opria
te c
osts
cha
rged
to th
e C
hild
ren'
s H
ealth
Insu
ranc
e Pr
ogra
m a
s a
resu
lt of
this
find
ing
and
retu
rned
the
fund
s to
the
fede
ral g
over
nmen
t. K
im A
iken
, Adm
inis
trato
rBu
sine
ss &
Fin
anci
al S
ervi
ces
Div
isio
nD
epar
tmen
t of P
ublic
Hea
lth a
nd H
uman
Ser
vice
s
Com
plet
ed
2019
-007
Vario
usR
esea
rch
and
Dev
elop
men
t Sus
pens
ion
and
Deb
arm
ent C
ontr
ols
- The
Uni
vers
ity o
f Mon
tana
- M
isso
ula
star
ted
scre
enin
g ve
ndor
s au
tom
atic
ally
in J
une
2019
. The
scr
eeni
ng is
per
form
ed th
roug
h Pa
ymen
tWor
ks, a
cl
oud-
base
d su
pplie
r inf
orm
atio
n m
anag
emen
t sys
tem
. Sa
nctio
n al
erts
, inc
ludi
ng s
uspe
nsio
ns a
nd d
ebar
men
ts,
are
capt
ured
in P
aym
entW
orks
and
revi
ewed
by
the
vend
or m
aint
enan
ce a
dmin
istra
tor.
Sus
pend
ed o
r deb
arre
d ve
ndor
s ar
e re
porte
d to
the
acco
unts
pay
able
man
ager
and
exc
lude
d fro
m th
e pr
ocur
emen
t pro
cess
.
Dan
Jen
ko, C
ontro
ller
Busi
ness
Ser
vice
sU
nive
rsity
of M
onta
na -
Mis
soul
a
Com
plet
ed
D-8