Embed Size (px)
Citation preview

Analysts who prepared this report are registered as research analysts in Korea but not in any other jurisdiction, including the U.S. PLEASE SEE ANALYST CERTIFICATIONS AND IMPORTANT DISCLOSURES & DISCLAIMERS IN APPENDIX 1 AT THE END OF REPORT.
Hanssem(009240 KS)
Evolving beyond existing boundaries
Korea’s growing home interior market Korea’s home interior market is thriving on the back of an increasing number of aged homes, a buyer-driven real estate market, and a realignment in the construction materials industry. We forecast the home interior market to expand more than 10% YoY to W14tr in 2017, and expect average annual growth of 14% through 2020. Given such a robust growth outlook, we believe Korea’s home interior market, and Hanssem in particular, deserve attention.
Differentiated competitiveness to drive growth Hanssem enjoys a dominant position in the domestic construction materials market. In particular, the company boasts an 87% market share among domestic kitchen furnishings/fixtures players. We believe the company’s ability to achieve a near-monopoly in a small market (i.e., kitchen furnishings/fixtures) and then expand to other markets (i.e., other home interior elements) will be the driving force behind its strong growth in the broader home interior market.
Recently, Hanssem has been expanding its overall home interior business under the Rehouse brand, beefing up its logistics system and strengthening its network with small/mid-sized home furnishings/interior companies. We believe such moves are part of the company’s broader strategy to move beyond manufacturing and transform into a comprehensive furnishings retailer and service provider. In our view, Hanssem is poised for full-fledged growth as a consumer company.
During the growth period of Japan’s home interior market (2001-07), the Japanese furnishings retailer Nitori managed to achieve average annual revenue growth of roughly 20%, and saw its OP margin expand from 6% to 12%, by focusing on the retail/service side of its business. We believe this demonstrates that retailing, as opposed to manufacturing, is more critical to growth in the home interior industry.
Evolving beyond existing boundaries Hanssem, which started out as a manufacturer specialized in kitchen furnishings/fixtures, has broadened its presence beyond manufacturing and into retail and services. Notably, the manufacturing and service sectors have very different growth profiles. The company is also making moves into China, building upon its solid domestic business. Against this backdrop, we think it is time to change the way we look at Hanssem.
We initiate our coverage of Hanssem with a Buy recommendation and target price of W300,000. We forecast operating profit growth to average 23.4% over the next three years.
FY (Dec.) 12/14 12/15 12/16 12/17F 12/18F 12/19FRevenue (Wbn) 1,325 1,711 1,935 2,211 2,600 3,260OP (Wbn) 110 147 160 192 233 300OP margin (%) 8.3 8.6 8.3 8.7 9.0 9.2NP (Wbn) 87 115 128 152 186 236EPS (W) 3,682 4,872 5,419 6,475 7,884 10,009ROE (%) 28.8 29.7 26.1 25.0 24.5 24.8P/E (x) 31.1 47.5 36.7 36.1 29.7 23.4P/B (x) 6.9 11.2 7.9 7.6 6.2 5.0Dividend yield (%) 0.7 0.4 0.6 0.5 0.5 0.5Notes: All figures are based on consolidated K-IFRS; NP refers to net profit attributable to controlling interests Source: Company data, Mirae Asset Daewoo Research estimates
Construction Materials
Initiation Report April 18, 2017
(Initiate) Buy
Target Price (12M, W) 300,000
Share Price (04/17/17, W) 234,000
Expected Return 28%
OP (17F, Wbn) 192Consensus OP (17F, Wbn) 188
EPS Growth (17F, %) 19.5Market EPS Growth (17F, %) 31.8P/E (17F, x) 36.1Market P/E (17F, x) 9.4KOSPI 2,145.76
Market Cap (Wbn) 5,507Shares Outstanding (mn) 24Free Float (%) 41.9Foreign Ownership (%) 28.7Beta (12M) 1.2752-Week Low 142,00052-Week High 235,500
(%) 1M 6M 12MAbsolute 7.1 39.3 14.7Relative 8.0 31.6 7.7
Mirae Asset Daewoo Co., Ltd.
[Construction/Construction Materials]
Kwangsoo Lee +822-3774-1457 [email protected]
Myoungjoo Kim +822-3774-1458 [email protected]
60
70
80
90
100
110
120
4.16 8.16 12.16 4.17
Hanssem KOSPI
Hanssem
2
April 18, 2017
Mirae Asset Daewoo Research
I. Investment points
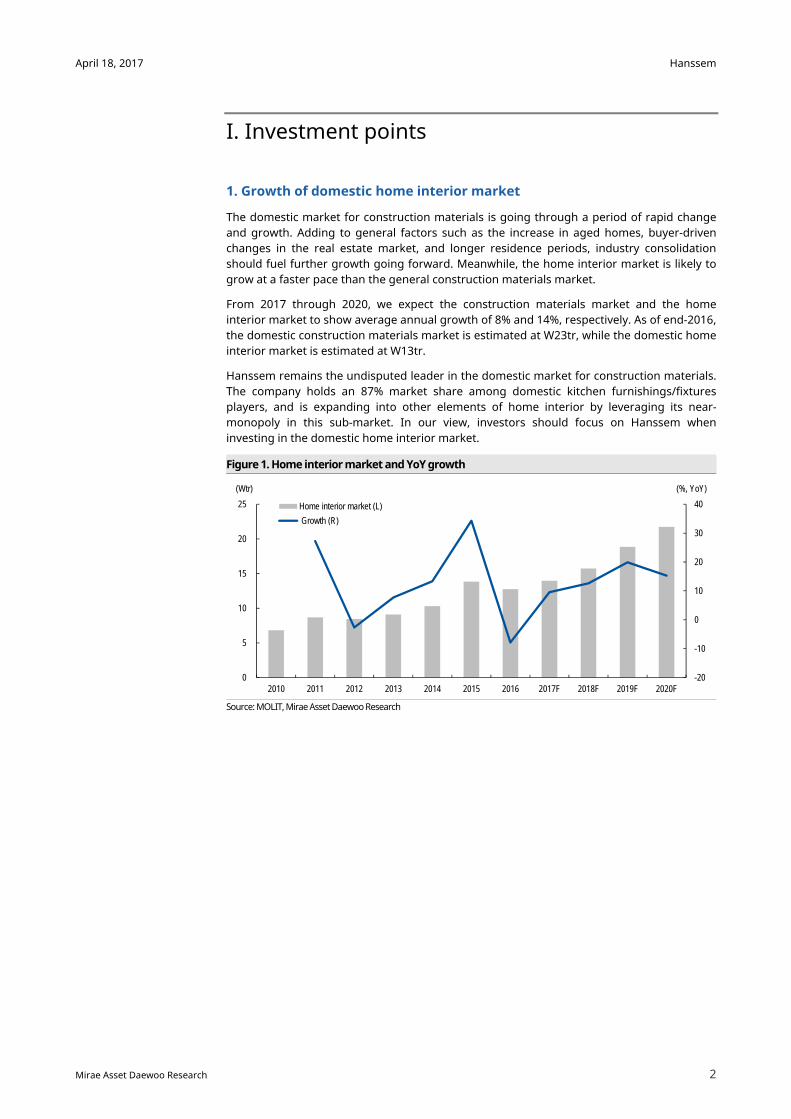
1. Growth of domestic home interior market
The domestic market for construction materials is going through a period of rapid change and growth. Adding to general factors such as the increase in aged homes, buyer-driven changes in the real estate market, and longer residence periods, industry consolidation should fuel further growth going forward. Meanwhile, the home interior market is likely to grow at a faster pace than the general construction materials market.
From 2017 through 2020, we expect the construction materials market and the home interior market to show average annual growth of 8% and 14%, respectively. As of end-2016, the domestic construction materials market is estimated at W23tr, while the domestic home interior market is estimated at W13tr.
Hanssem remains the undisputed leader in the domestic market for construction materials. The company holds an 87% market share among domestic kitchen furnishings/fixtures players, and is expanding into other elements of home interior by leveraging its near-monopoly in this sub-market. In our view, investors should focus on Hanssem when investing in the domestic home interior market.
Figure 1. Home interior market and YoY growth
Source: MOLIT, Mirae Asset Daewoo Research
-20
-10
0
10
20
30
40
0
5
10
15
20
25
2010 2011 2012 2013 2014 2015 2016 2017F 2018F 2019F 2020F
(Wtr) (%, YoY)
Home interior market (L)
Growth (R)

Hanssem
3
April 18, 2017
Mirae Asset Daewoo Research
2. Faster growth expected from retail/services than manufacturing
In order to take the lead in the home interior market, Hanssem has chosen to focus on retailing and services rather than manufacturing. The company has teamed up with small/mid-sized furnishings companies under the Rehouse banner, aiming to boost the growth of its broader home interior business. Hanssem invests in the creation of large showrooms, and in installation, sales, and after-sales service, while individual furnishings companies focus on attracting and securing customers. As of end-2016, six Rehouse stores are in operation. Hanssem plans to increase the number of Rehouse stores to 10 in 2017, and more than 14 in 2018.
Through Rehouse, Hanssem should be able to secure faster growth in the growing home interior market. Partnering with smaller home interior companies (of which there are more than 24,000 in Korea) should help to accelerate its penetration. Also, a growing revenue contribution from the high-margin Rehouse business should help to drive faster-than-expected growth in earnings. All in all, we expect steady earnings growth to continue, with YoY operating profit growth likely to average 23.4% over the next three years.
During the growth phase (2001-07) of Japan’s home interior market, Nitori was able to secure 20% average annual growth in revenue and raise its OP margin from 6% to 12% by focusing on retailing and services. In contrast, Toto, a bathroom furnishings/fixtures player, reported just 3% average annual growth in revenue over the same period (with its retail/services businesses outpacing manufacturing). As such, we expect Hanssem's focus on retail and services to lead to sharp growth in earnings going forward.
Figure 2. Rehouse business revenue forecasts
Source: Company data, Mirae Asset Daewoo Research
Figure 3. YoY revenue growth comparison: Nitori vs. Toto
Source: Bloomberg, Mirae Asset Daewoo Research
-15
-10
-5
0
5
10
15
20
25
30
02 03 04 05 06 07 08 09 10 11 12 13 14 15 16
(%, YoY)
Toto Nitori
0
50
100
150
200
250
300
350
400
2016 2017F 2018F 2019F 2020F
(Wbn)
Hanssem
4
April 18, 2017
Mirae Asset Daewoo Research
3. Expanding overseas through penetration of the Chinese market
Starting this year, Hanssem is increasing efforts to penetrate the Chinese market. The company plans to open a directly operated store in Shanghai in July and invest in a logistics center in Suzhou. While such efforts will likely have limited impact on overall revenue and profit in the near term, we nevertheless view them positively, given the ample growth potential of China’s home improvement and furnishings market. China's retail market for home improvement and furnishings is expected to grow to RMB3,416bn by 2019 on average annual growth of 10%, outpacing other consumer goods categories.
While political issues might put a damper on Hanssem's expansion into the Chinese market, the company’s global expansion efforts should nevertheless boost growth potential over the long run. With China's home interior market roughly 38 times the size of the domestic market, we urge investors to focus on the potential upside from penetration into the Chinese market.

Hanssem
5
April 18, 2017
Mirae Asset Daewoo Research
II. Earnings outlook
1. Recent earnings show increased sensitivity to real estate trends
Reviewing results from 2007-16, we find that Hanssem's revenue growth accelerated from 2013 through 2015. Revenue growth reached 30% on average, with kitchen furnishings/fixtures serving as the primary engine. Increased investment into the expansion of authorized dealers, flagship shops, and the IK business (retail) also fueled growth during that period. Moreover, we note that changes in the real estate market became one of the largest factors driving growth in earnings.
Apartment transactions rose markedly from 2013 to 2015, with nationwide transactions increasing by 37% YoY in 2013, 11% in 2014, and 10% in 2015. In particular, apartment transactions in Seoul and Gyeonggi-do exceeded the nationwide average.
Figure 4. Apartment real sales price YoY change trends
Source: Real Estate 114, , Mirae Asset Daewoo Research
The rise in apartment transactions and increase in household moves led to growth in demand for Hanssem's kitchen furnishings/fixtures. Meanwhile, the sharper growth in apartment transactions in Seoul and Gyeonggi-do drove up demand for higher-end furniture brands, adding a boost to Hanssem’s revenue growth. The increase in apartment presales also contributed to earnings improvement.
Figure 5. YoY change in Seoul apartment transaction volume and Hanssem revenue
Source: Company data, Real Estate 114, Mirae Asset Daewoo Research
-80
-60
-40
-20
0
20
40
60
80
07 08 09 10 11 12 13 14 15 16
(%, YoY)
Nationwide
Seoul
Gyeonggi-do
-60
-40
-20
0
20
40
60
80
08 09 10 11 12 13 14 15 16
(%, YoY)Seoul apartment transactions
Hanssem revenue YoY

Hanssem
6
April 18, 2017
Mirae Asset Daewoo Research
In addition to notable revenue growth, Hanssem enjoyed visible improvement in profitability, with its OP margin rising sharply to 8.6% in 2015 from 7.9% in 2013. Most of the improvement in profitability came from the company's mainstay kitchen furnishings/fixtures division, helped by the adoption of targeted approaches for different consumer groups using a variety of distribution networks.
For 2016, Hanssem booked revenue of W1.9tr (+13% YoY) and operating profit of W159.6bn (+8.8% YoY). A dip in apartment transactions led to slower growth in demand from moving households. In addition, aggressive competition from smaller companies offering lower-end products drove the company to trim product prices, causing a dip in OP margin. We find it positive that Hanssem's earnings stability remained solid, with both revenue and profit continuing on an uptrend through 2016, despite slower market growth and stiffening market competition.
Figure 6. Hanssem OP margin trend
Source: Company data, Mirae Asset Daewoo Research
0
1
2
3
4
5
6
7
8
9
10
07 08 09 10 11 12 13 14 15 16
(%)

Hanssem
7
April 18, 2017
Mirae Asset Daewoo Research
2. Earnings outlook
For 2017, we forecast Hanssem’s revenue at W2.21tr (+14% YoY), operating profit at W191.8bn (+20.2% YoY), and OP margin at 8.7%, with stronger B2C demand likely to drive operating profit growth. The company’s B2C business is comprised of interior and kitchen, the latter of which includes Rehouse earnings. We forecast kitchen revenue to jump 22% YoY to W994.3bn in 2017 (vs. W813.9bn in 2016). The Rehouse brand should propel the overall home interior business. All in all, rising high-margin Rehouse revenue should drive improvement in company-wide OP margin.
We expect Hanssem’s revenue to increase at a 19% CAGR from 2017 through 2019, driven mainly by rising kitchen revenue (including Rehouse revenue). Over the next three years, assuming the domestic home interior market’s annual growth at 14%, we project the company’s kitchen revenue to rise at a 29% CAGR.
As revenue growth should drive a pickup in profitability, we forecast the company’s OP margin at 9% for 2018 and 9.2% for 2019. Going forward, increases in the contribution of high-margin Rehouse revenue should lead to OP margin improvement. Increasing top line should also drive down the company-wide SG&A ratio. We expect Hanssem to deliver steady profit growth going forward, with operating profit CAGR forecast at 23.4% over the next three years.
Table 1. Earnings and forecasts (Wbn, %) Division 2012 2013 2014 2015 2016 2017F 2018F 2019F
Revenue
Interior 298 371 462 560 649 747 887 1,078 Kitchen 276 363 485 721 814 994 1,268 1,756 B2B 159 222 319 351 392 390 361 344 Total revenue 783 1,007 1,325 1,711 1,935 2,211 2,600 3,260
Revenue growth
Interior 2 25 24 21 16 15 19 22 Kitchen 21 32 34 49 13 22 28 38 B2B 1 39 44 10 12 0 -7 -5 Total revenue 10 29 32 29 13 14 18 25
COGS ratio
Interior 69 65 66 67 66 67 68 69 Kitchen 63 68 62 60 61 62 64 70 B2B 75 78 82 88 88 89 90 92 Total revenue 69 70 69 69 69 69 70 70
Operating profit 47 80 110 147 160 192 233 300OP margin 6.0 7.9 8.3 8.6 8.2 8.7 9.0 9.2OP growth -3.1 68.9 38.3 32.9 8.8 20.2 21.7 28.4Net profit 39 61 87 115 128 152 186 236Net profit growth 5.0 6.1 6.5 6.7 6.6 6.9 7.1 7.2Notes: All figures are based on consolidated K-IFRS; net profit refers to net profit attributable to controlling interests; Rehouse earnings are included in kitchen division earnings Source: Company data, Mirae Asset Daewoo Research

Hanssem
8
April 18, 2017
Mirae Asset Daewoo Research
III. Market and strategy
1. Korea’s construction materials market: Growth and evolution
We expect Korea’s construction materials market to display rapid growth going forward on the back of a buyer-driven real estate market and an increasing number of aged homes. Declining new home supply should also drive up remodeling demand (for aged homes), leading to the expansion of the broader home interior market.
Figure 7. Apartment presales
Source: Real Estate 114, Mirae Asset Daewoo Research
Figure 8. Sustained increase in aged homes over 10 years
Source: Real Estate 114, Mirae Asset Daewoo Research
0
50
100
150
200
250
300
350
400
450
500
2010 2011 2012 2013 2014 2015 2016 2017F 2018F 2019F 2020F
('000 units)
0
1,000
2,000
3,000
4,000
5,000
6,000
7,000
8,000
9,000
2010 2011 2012 2013 2014 2015 2016 2017F 2018F 2019F 2020F
('000 units)
Hanssem
9
April 18, 2017
Mirae Asset Daewoo Research
We have projected the size of Korea’s construction materials market and the value of Hanssem under the TAM/SAM/SOM model.
For reference, TAM, or total addressable market, refers to the total market for a product/service, while SAM, or serviceable available market, is the TAM segment directly targeted by a product/service. SOM or serviceable obtainable market refers to the portion of SAM that a company can actually capture in its early development stage. Thus, the SOM component is particularly important for early market entrants.
As of 2016, domestic TAM is estimated at W22.6tr—W9.8tr for basic materials (e.g., ready-mix concrete, rebar, etc.) and W12.7tr for home interior. We expect TAM to expand by only 1% YoY to W23tr in 2017 but resume solid growth starting in 2018.
Hanssem’s SAM is the market for home interior materials, including kitchen furnishings/fixtures, general furniture, and bathroom furnishings/flooring, which are all commonly used in the renovation of aged homes. We expect domestic SAM to grow by 10% from W12.7tr in 2016 to W14tr in 2017.
Hanssem’s SOM, which encompasses demand driven by pre-move-in remodeling (i.e., demand for kitchen furnishings/fixtures and flooring), is estimated at W1.6tr as of 2016. Of note, Hanssem’s earnings have moved largely in line with SOM growth. In 2013-15, SOM grew at a CAGR of 17.5%, while Hanssem’s annual average earnings growth reached 30%.
Table 2. Construction materials market breakdown (Wtr)
Market size (2016) Description Characteristics Key products
TAM 23 Basic materials for construction of new homes + home interior market
Construction materials market (B2B, B2C)
Cement, rebar, kitchen furnishings/fixtures, bathroom furnishings/fixtures
SAM 13 Home interior - apartment renovations B2C remodeling/furnishings market;main customers are small/mid-sized home interior companies and retail customers
Kitchen furnishings/fixtures, furniture, window treatments
SOM 2 Home interior - pre-move-in remodeling High correlation with apartment transaction volume
Kitchen furnishings/fixtures, flooring
Note: As of 2016; market breakdowns are based on Hanssem’s business areas Source: Mirae Asset Daewoo Research
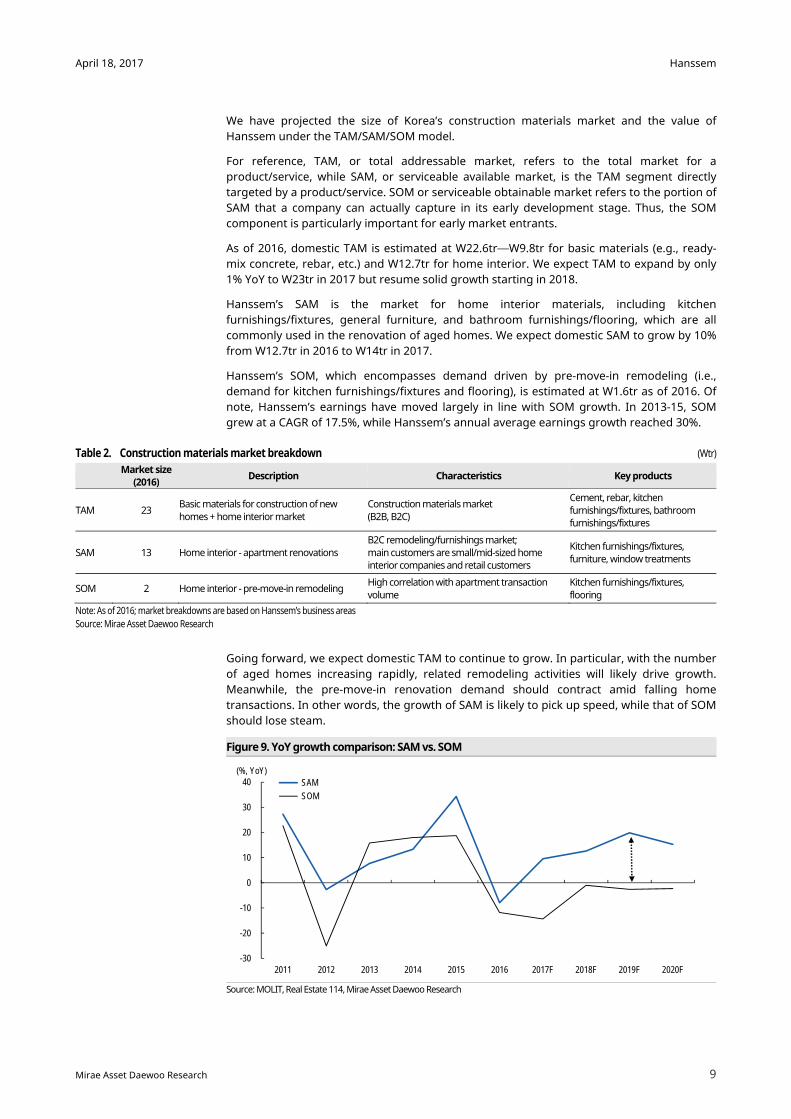
Going forward, we expect domestic TAM to continue to grow. In particular, with the number of aged homes increasing rapidly, related remodeling activities will likely drive growth. Meanwhile, the pre-move-in renovation demand should contract amid falling home transactions. In other words, the growth of SAM is likely to pick up speed, while that of SOM should lose steam.
Figure 9. YoY growth comparison: SAM vs. SOM
Source: MOLIT, Real Estate 114, Mirae Asset Daewoo Research
-30
-20
-10
0
10
20
30
40
2011 2012 2013 2014 2015 2016 2017F 2018F 2019F 2020F
(%, YoY) SAM
SOM

Hanssem
10
April 18, 2017
Mirae Asset Daewoo Research
Therefore, in order to achieve sustainable growth, Hanssem needs to shift its focus from pre-move-in-oriented kitchen furnishings/fixtures (SOM) and expand its exposure to demand arising from the renovation of aged homes (SAM).
The expansion of demand stemming from the renovation of aged homes will likely create a favorable environment for growth. Aided by the increase in aged homes, demand for renovation materials will likely grow by 10% YoY in 2017, 13% in 2018, 20% in 2019, and 15% in 2020, outpacing overall construction materials market growth. Meanwhile, demand related to pre-move-in renovations, which has been the driver of Hanssem’s flagship business, is likely to continue to shrink, falling 14% YoY in 2017, 1% in 2018, 3% in 2019, and 2% in 2020.
In conclusion, we expect Hanssem to deliver steady growth on the back of the growth of the broader domestic home interior market—if the company aggressively expands into the SAM rather than remaining complacent (i.e., focusing on the SOM). In this sense, the company’s recent moves to expand its overall home interior business under the Rehouse brand deserve attention.
Table 3. Major assumptions for construction materials market (Wtr, ‘000 units) Market size Apartments and homes
Construction materials Basic materials Home interior SOM New apartment
supply Apartment
transactions
Aged homes (over 10 years
old)
Aged homes (over 20 years
old)2010 10.6 3.8 6.8 1.1 156 800 2,191 2,813 2011 14.4 5.7 8.7 1.3 231 981 2,410 2,881 2012 14.1 5.7 8.4 1 241 735 2,616 2,944 2013 15.2 6.1 9.1 1.1 265 852 2,935 3,042 2014 17.6 7.3 10.3 1.3 313 1,005 3,247 3,138 2015 25.1 11.2 13.8 1.6 475 1,194 3,660 3,265 2016 22.6 9.8 12.7 1.4 413 1,053 3,689 3,466 2017F 22.8 8.8 14 1.2 329 902 3,734 3,783 2018F 24 8.2 15.7 1.2 299 893 3,777 4,076 2019F 27.1 8.2 18.8 1.2 306 870 3,818 4,361 2020F 30.2 8.5 21.7 1.1 334 850 3,863 4,673 Source: MOLIT, Real Estate 114, Hyundai E&C, Mirae Asset Daewoo Research
Hanssem
11
April 18, 2017
Mirae Asset Daewoo Research
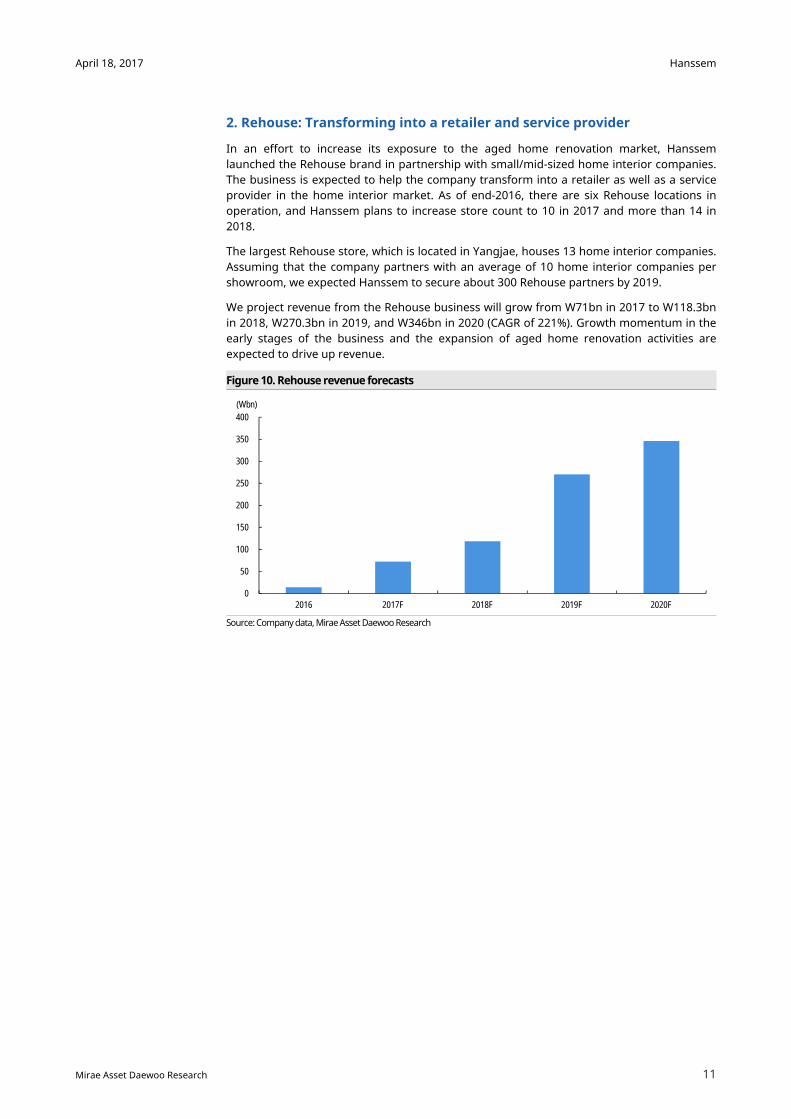
2. Rehouse: Transforming into a retailer and service provider
In an effort to increase its exposure to the aged home renovation market, Hanssem launched the Rehouse brand in partnership with small/mid-sized home interior companies. The business is expected to help the company transform into a retailer as well as a service provider in the home interior market. As of end-2016, there are six Rehouse locations in operation, and Hanssem plans to increase store count to 10 in 2017 and more than 14 in 2018.
The largest Rehouse store, which is located in Yangjae, houses 13 home interior companies. Assuming that the company partners with an average of 10 home interior companies per showroom, we expected Hanssem to secure about 300 Rehouse partners by 2019.
We project revenue from the Rehouse business will grow from W71bn in 2017 to W118.3bn in 2018, W270.3bn in 2019, and W346bn in 2020 (CAGR of 221%). Growth momentum in the early stages of the business and the expansion of aged home renovation activities are expected to drive up revenue.
Figure 10. Rehouse revenue forecasts
Source: Company data, Mirae Asset Daewoo Research
0
50
100
150
200
250
300
350
400
2016 2017F 2018F 2019F 2020F
(Wbn)

Hanssem
12
April 18, 2017
Mirae Asset Daewoo Research
Figure 11. Entrance of Hanssem’s Yangjae Rehouse location
Source: Mirae Asset Daewoo Research
Figure 12. Rehouse’s remodeling road map
Source: Mirae Asset Daewoo Research
Figure 13. Consultation areas in Hanssem’s Yangjae Rehouse location
Source: Mirae Asset Daewoo Research
In our view, the Rehouse business is likely to enhance Hanssem’s growth potential. The company has traditionally been highly dependent on pre-move-in demand, with kitchen furnishings/fixtures making a significant contribution to revenue; however, Rehouse should allow the company to tap into rapidly growing demand stemming from the remodeling of aged homes.
Furthermore, Hanssem should be able to enjoy higher operating leverage in line with growth in Rehouse revenue, as: 1) retail/services margins are generally stronger than manufacturing margins; and 2) the home interior business is characterized by a low COGS-to-revenue ratio.

Hanssem
13
April 18, 2017
Mirae Asset Daewoo Research
3. Visibility of overseas strategies increasing
We expect Hanssem to accelerate its advance into China in 2017, opening a directly operated store in Shanghai in July 2017 and investing in a logistics center in Suzhou. We think these efforts deserve attention, given the growth potential of the Chinese market.
The Chinese home improvement and furnishings industry was worth RMB3.376tr in 2014, 38 times more than its Korean counterpart. In China, the home improvement and furnishings industry is the largest consumer goods market, followed by food, apparel, packaged food, and beverage.
Figure 14. Chinese home improvement and furnishings market (vs. other consumer goods categories)
Note: As of 2014 Source: Frost & Sullivan, Redstar, Mirae Asset Daewoo Research
Like its Korean counterpart, the Chinese home improvement and furnishings market is made up of B2B and B2C segments. The B2B segment serves property developers and builders, whereas the B2C segment markets directly to consumers. In China, B2B makes up roughly 37.7% of the market, while B2C accounts for 62.3% (as of 2014).
Between 2009 and 2014, the Chinese home improvement and furnishings market grew at a robust CAGR of 15.3%, expanding from RMB1.04tr to RMB2.12tr. We expect the market to continue to expand, outpacing China’s economic growth rate.
0
500
1,000
1,500
2,000
2,500
3,000
3,500
4,000
Home improvement andfurnishings
Food Apparel Packaged food Beverages
(RMBbn)
Hanssem
14
April 18, 2017
Mirae Asset Daewoo Research
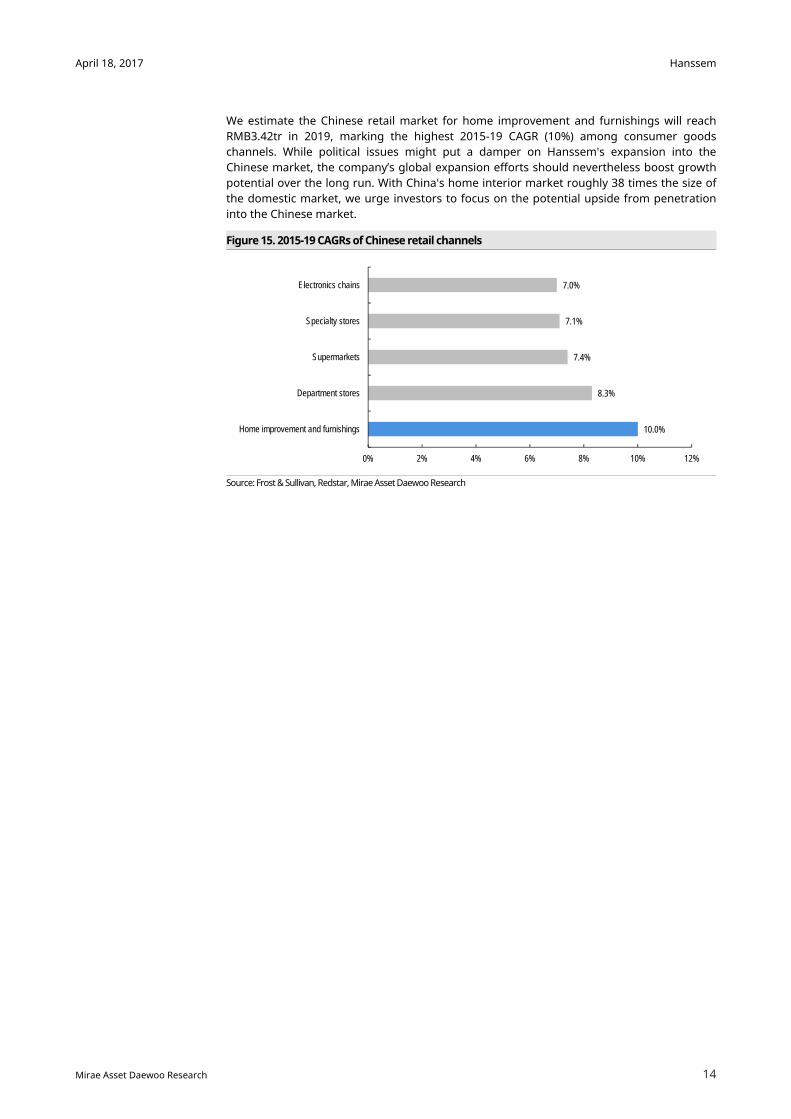
We estimate the Chinese retail market for home improvement and furnishings will reach RMB3.42tr in 2019, marking the highest 2015-19 CAGR (10%) among consumer goods channels. While political issues might put a damper on Hanssem's expansion into the Chinese market, the company’s global expansion efforts should nevertheless boost growth potential over the long run. With China's home interior market roughly 38 times the size of the domestic market, we urge investors to focus on the potential upside from penetration into the Chinese market.
Figure 15. 2015-19 CAGRs of Chinese retail channels
Source: Frost & Sullivan, Redstar, Mirae Asset Daewoo Research
10.0%
8.3%
7.4%
7.1%
7.0%
0% 2% 4% 6% 8% 10% 12%
Home improvement and furnishings
Department stores
Supermarkets
Specialty stores
Electronics chains
Hanssem
15
April 18, 2017
Mirae Asset Daewoo Research
4. Competitiveness and strategies
We believe that Hanssem is enhancing its competitiveness and growth potential by leveraging its near-monopoly in the kitchen furnishings/fixtures market to expand into other home interior categories.
Hanssem enjoys a dominant position in the kitchen furnishings/fixtures market. Indeed, the company estimates its market share among domestic players at over 87%.
Established in 1970, Hanssem has been the market share leader among domestic kitchen furnishings/fixtures brands since 1986, steadily making gains amid a lack of strong competitors.
We think Hanssem has been expanding its dominant presence beyond the kitchen furnishings/fixtures segment to the overall home interior market. And we expect the company to increase its foothold going forward, given that the market is largely populated by unbranded and small players.
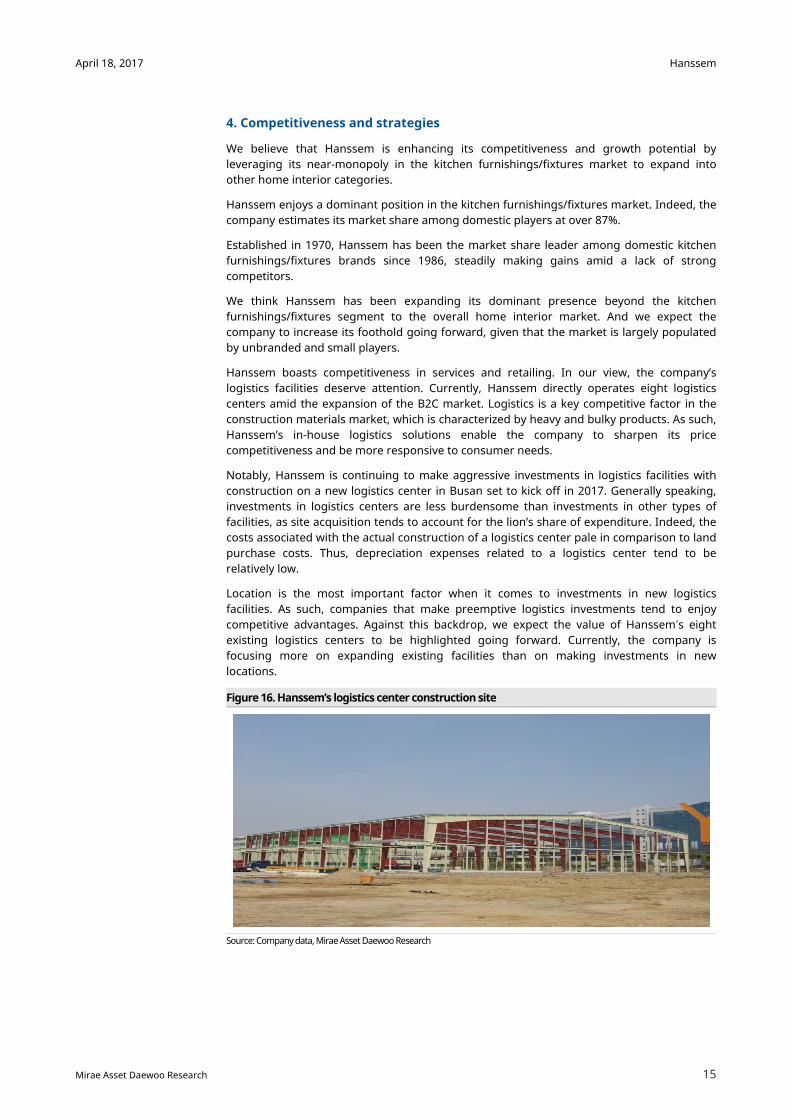
Hanssem boasts competitiveness in services and retailing. In our view, the company’s logistics facilities deserve attention. Currently, Hanssem directly operates eight logistics centers amid the expansion of the B2C market. Logistics is a key competitive factor in the construction materials market, which is characterized by heavy and bulky products. As such, Hanssem’s in-house logistics solutions enable the company to sharpen its price competitiveness and be more responsive to consumer needs.
Notably, Hanssem is continuing to make aggressive investments in logistics facilities with construction on a new logistics center in Busan set to kick off in 2017. Generally speaking, investments in logistics centers are less burdensome than investments in other types of facilities, as site acquisition tends to account for the lion’s share of expenditure. Indeed, the costs associated with the actual construction of a logistics center pale in comparison to land purchase costs. Thus, depreciation expenses related to a logistics center tend to be relatively low.
Location is the most important factor when it comes to investments in new logistics facilities. As such, companies that make preemptive logistics investments tend to enjoy competitive advantages. Against this backdrop, we expect the value of Hanssem’s eight existing logistics centers to be highlighted going forward. Currently, the company is focusing more on expanding existing facilities than on making investments in new locations.
Figure 16. Hanssem’s logistics center construction site
Source: Company data, Mirae Asset Daewoo Research
Hanssem
16
April 18, 2017
Mirae Asset Daewoo Research
5. Nitori’s success story
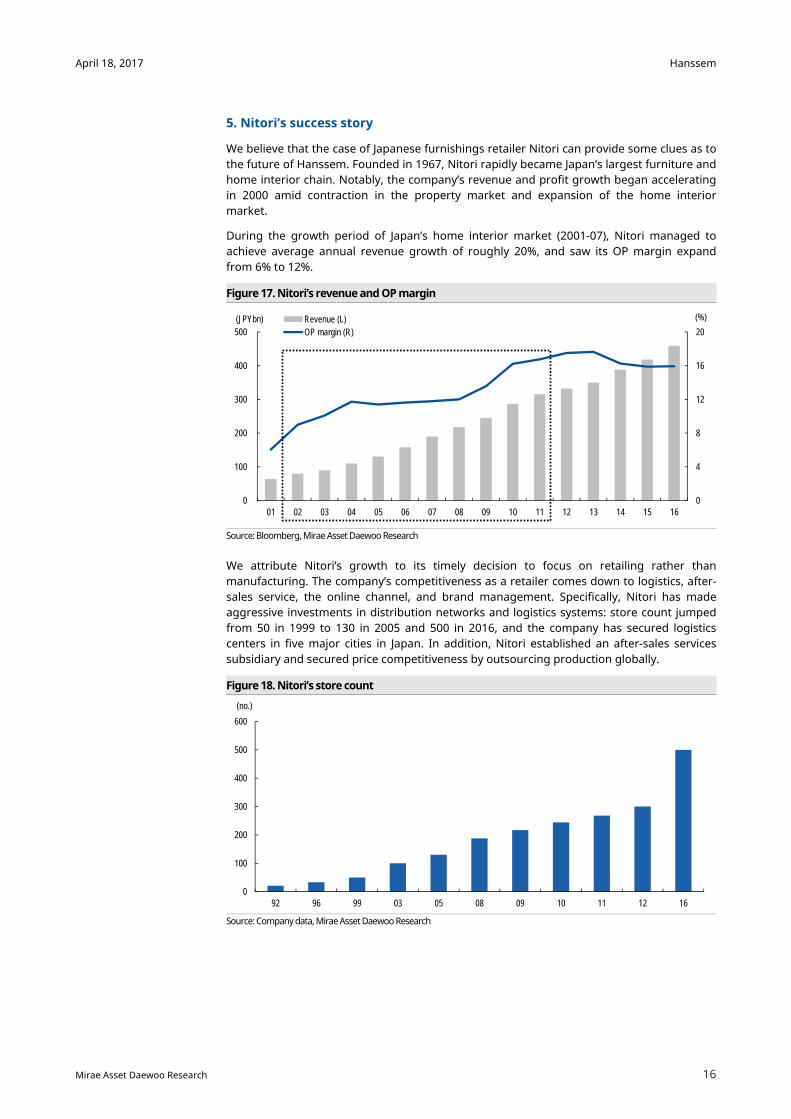
We believe that the case of Japanese furnishings retailer Nitori can provide some clues as to the future of Hanssem. Founded in 1967, Nitori rapidly became Japan’s largest furniture and home interior chain. Notably, the company’s revenue and profit growth began accelerating in 2000 amid contraction in the property market and expansion of the home interior market.
During the growth period of Japan’s home interior market (2001-07), Nitori managed to achieve average annual revenue growth of roughly 20%, and saw its OP margin expand from 6% to 12%.
Figure 17. Nitori’s revenue and OP margin
Source: Bloomberg, Mirae Asset Daewoo Research
We attribute Nitori’s growth to its timely decision to focus on retailing rather than manufacturing. The company’s competitiveness as a retailer comes down to logistics, after-sales service, the online channel, and brand management. Specifically, Nitori has made aggressive investments in distribution networks and logistics systems: store count jumped from 50 in 1999 to 130 in 2005 and 500 in 2016, and the company has secured logistics centers in five major cities in Japan. In addition, Nitori established an after-sales services subsidiary and secured price competitiveness by outsourcing production globally.
Figure 18. Nitori’s store count
Source: Company data, Mirae Asset Daewoo Research
0
4
8
12
16
20
0
100
200
300
400
500
01 02 03 04 05 06 07 08 09 10 11 12 13 14 15 16
(JPYbn) (%)Revenue (L)OP margin (R)
0
100
200
300
400
500
600
92 96 99 03 05 08 09 10 11 12 16
(no.)

Hanssem
17
April 18, 2017
Mirae Asset Daewoo Research
However, Toto, Japan’s leading supplier of bathroom furnishings/fixtures, went down a different path. Unlike Nitori, Toto displayed limited revenue growth during 2001-07 due to its focus on manufacturing rather than retailing. Indeed, during that critical period, Toto prioritized new product development and R&D investments over expansion of services and retailing. In our view, the differences between Nitori’s and Toto’s strategic directions led to the divergence in growth trajectories.
Figure 19. YoY revenue growth comparison: Nitori vs. Toto
Source: Bloomberg, Mirae Asset Daewoo Research
Figure 20. Nitori retail store
Source: Company materials, Mirae Asset Daewoo Research
-15
-10
-5
0
5
10
15
20
25
30
02 03 04 05 06 07 08 09 10 11 12 13 14 15 16
(%, YoY)
Toto Nitori

Hanssem
18
April 18, 2017
Mirae Asset Daewoo Research
IV. Valuation and share prices
1. TP of W300,000 suggests 28% upside
We initiate our coverage of Hanssem with a Buy call and target price of W300,000. Our target price is based on the sum of the company’s operating value of W5.17tr and net cash holdings of W130.1bn.
We derived our fair operating value estimate by applying a multiple of 24x to W212.6bn, the average of our 2017 and 2018 operating profit estimates. Our target multiple is based on the average market cap/EBIT of global building materials peers as of 2016. Given the growth potential of the domestic home interior market and Hanssem’s expansion into overseas markets such as China, we think the application of a global peer average multiple is justifiable.
Still, we do not believe that this multiple completely reflects Hanssem’s growth potential; as such, in deriving our target price, we used the average of our 2017 and 2018 operating profit forecasts. In other words, we believe that the company’s deserves a premium (i.e., the reflection of 2018F earnings), given the company’s high ROE of 25%.
Table 4. Target price calculation Value Notes
Operating value (Wbn) 5,166 EBIT (Wbn) 213 2017F and 2018F average
Target multiple (x) 24 Average multiple of global construction materialscompanies
Net cash 130 As of 2016
Corporate value (Wbn) 5,296
Shares outstanding (shares) 17,629,563 Excluding treasury stock
Target price (W) 300,420
Current price (W) 234,000
Upside (%) 28 Source: Mirae Asset Daewoo Research
Figure 21. Hanssem P/E chart Figure 22. Hanssem P/B chart
Source: QuantiWise, Mirae Asset Daewoo Research Source: QuantiWise, Mirae Asset Daewoo Research
0
50,000
100,000
150,000
200,000
250,000
300,000
350,000
2010 2011 2012 2013 2014 2015 2016 2017
50.0x
40.0x
30.0x
20.0x
10.0x
(w)Share price
0
50,000
100,000
150,000
200,000
250,000
300,000
350,000
2010 2011 2012 2013 2014 2015 2016 2017
(W)
11.0x
9.5x
8.0x
6.5x
5.0x
Share price

Hanssem
19
April 18, 2017
Mirae Asset Daewoo Research
2. Drivers: Growth potential, diversification, and overseas expansion
At present, Hanssem’s trading multiple—over 34x 2016 earnings—does not appear low. Still, we think a valuation premium is justifiable in light of the company’s robust growth potential. Going forward, however, earnings growth will be essential to keeping Hanssem shares on an uptrend. Notably, shares dropped in 1H16 due to a slowdown in earnings growth.
Should Hanssem’s earnings growth continue on the back of the expansion of the home interior market, we expect to see strong upside to shares. Changes in competitive dynamics and investments are likely to slow the pace of earnings growth, but only temporarily. We advise investors to put their faith in future market growth and Hanssem’s strategic direction. Other key share price variables include construction materials business’s diversification strategy and expansion into China.
Figure 23. Hanssem share price trend
Note: Share price trend is based on average share prices of each quarter Source: DataGuide, Mirae Asset Daewoo Research
0
50,000
100,000
150,000
200,000
250,000
300,000
350,000
1Q11 3Q11 1Q12 3Q12 1Q13 3Q13 1Q14 3Q14 1Q15 3Q15 1Q16 3Q16 1Q17
(W)
Expansion of kitchen division revenue thanks to increase in apartment transaction volume
Rise in stock price in line with with rapid earnings growth
Decline in stock price since 3Q15 due to slowdown in earnings growth
Earnings recovery in 2H16

Hanssem
20
April 18, 2017
Mirae Asset Daewoo Research
V. Risk factors
1. Competition with small/mid-sized players
We expect Hanssem to face fierce competition from small/mid-sized home interior companies in the near term. Should small/mid-sized players lower prices, Hanssem is likely to follow suit. For 1H16, Hanssem’s OP margin of 7% was lower than the full-year figure of 8.7%, due primarily to price competition with smaller players. According to NAVER Trend data, queries for ”Hanssem sale” surged in 1Q16, suggesting increasing price-cutting pressure.
Figure 24. Search frequency for “Hanssem sale” on NAVER
Source: NAVER Trend, Mirae Asset Daewoo Research
However, we think that Hanssem’s home interior brand, Rehouse, marks a meaningful paradigm shift in that it facilitates cooperation, not competition, with small/mid-sized players. Huge gaps in design quality and production costs keep Hanssem from forging partnerships with small/mid-sized players in the kitchen furnishings/fixtures market. However, as this is not the case with regard to other home interior elements, Hanssem is pushing forward with Rehouse.
According to Statistics Korea, there were over 24,000 home interior businesses nationwide in 2014. Small/mid-sized home interior companies reported average annual revenue of W108mn in 2014, bringing total revenue to W2.6tr. Should cooperation with small/mid-sized players help accelerate Hanssem’s market penetration, we expect both growth potential and profitability to receive boosts.
Figure 25. No. of registered home interior companies
Source: KOSTAT, Mirae Asset Daewoo Research
0
5,000
10,000
15,000
20,000
25,000
30,000
2010 2011 2012 2013 2014
(no.)

Hanssem
21
April 18, 2017
Mirae Asset Daewoo Research
2. New market entrants
With the expansion of the domestic home improvement and home interior markets, we are seeing an increase in new entrants, adding to competitive pressure. Should competition intensify further, Hanssem’s margins may be pressured in the near term. Eugene Corporation and KCC are two major new rivals in the home interior space.
Eugene Corporation, a ready-mix concrete supplier, entered the home interior market by opening its first Homeday store in Mokdong in September 2016. The store is larger than any Rehouse location, presenting a challenge to Hanssem. Eugene Corporation is set to open two more Homeday stores in 2017 to meet rising home interior demand. Unlike the Rehouse model, Homeday does not involve partnerships with smaller companies.
Figure 26. First Homeday store in Mokdong
Source: Eugene Corporation, Mirae Asset Daewoo Research
KCC, a major construction materials supplier, is expanding its home interior business. HomeCC Interior, directly run by KCC, provides a full-range of home interior services. HomeCC Interior has opened 16 showrooms in major cities around Korea including Seoul, Ilsan, Busan, and Daegu. KCC plans aggressive investments in the business going forward.
We think increasing forays by construction materials suppliers into the home interior market poses a competitive threat to Hanssem. However, despite intensifying competition, we expect Hanssem to achieve growth and market share gains on the back of its superior competitiveness and brand power honed in the kitchen furnishings/fixtures segment. In fact, we believe that Hanssem is poised to sharpen its competitive edges going forward.
Figure 27. Incheon HomeCC Interior store
Source: KCC, Mirae Asset Daewoo Research

Hanssem
22
April 18, 2017
Mirae Asset Daewoo Research
Hanssem (009240 KS/Buy/TP: W300,000)
Comprehensive Income Statement (Summarized) Statement of Financial Condition (Summarized) (Wbn) 12/16 12/17F 12/18F 12/19F (Wbn) 12/16 12/17F 12/18F 12/19FRevenue 1,935 2,211 2,600 3,260 Current Assets 554 676 816 1,007Cost of Sales 1,336 1,536 1,815 2,362 Cash and Cash Equivalents 150 217 289 360Gross Profit 599 675 785 898 AR & Other Receivables 127 144 165 203SG&A Expenses 439 484 551 599 Inventories 68 77 88 108Operating Profit (Adj) 160 192 233 300 Other Current Assets 209 238 274 336Operating Profit 160 192 233 300 Non-Current Assets 345 395 466 563Non-Operating Profit 10 12 15 15 Investments in Associates 26 29 33 41Net Financial Income 2 4 5 6 Property, Plant and Equipment 221 257 312 379Net Gain from Inv in Associates 6 7 9 8 Intangible Assets 11 11 10 10Pretax Profit 170 204 248 315 Total Assets 899 1,071 1,282 1,571Income Tax 43 51 63 80 Current Liabilities 338 373 415 483Profit from Continuing Operations 128 152 186 236 AP & Other Payables 223 245 273 311Profit from Discontinued Operations 0 0 0 0 Short-Term Financial Liabilities 17 16 15 15Net Profit 128 152 186 236 Other Current Liabilities 98 112 127 157Controlling Interests 128 152 186 236 Non-Current Liabilities 20 22 25 30Non-Controlling Interests 0 0 0 0 Long-Term Financial Liabilities 3 3 3 3Total Comprehensive Profit 124 152 186 236 Other Non-Current Liabilities 17 19 22 27Controlling Interests 124 152 186 236 Total Liabilities 358 395 441 513Non-Controlling Interests 0 0 0 0 Controlling Interests 542 676 841 1,057EBITDA 174 207 248 315 Capital Stock 24 24 24 24FCF (Free Cash Flow) 122 116 130 165 Capital Surplus 38 38 38 38EBITDA Margin (%) 9.0 9.4 9.5 9.7 Retained Earnings 529 664 829 1,045Operating Profit Margin (%) 8.3 8.7 9.0 9.2 Non-Controlling Interests 0 0 0 0Net Profit Margin (%) 6.6 6.9 7.2 7.2 Stockholders' Equity 542 676 841 1,057
Cash Flows (Summarized) Forecasts/Valuations (Summarized)
(Wbn) 12/16 12/17F 12/18F 12/19F 12/16 12/17F 12/18F 12/19FCash Flows from Op Activities 154 166 199 247 P/E (x) 36.7 36.1 29.7 23.4Net Profit 128 152 186 236 P/CF (x) 23.0 26.5 22.0 17.4
Non-Cash Income and Expense 76 56 65 82 P/B (x) 7.9 7.6 6.2 5.0Depreciation 13 14 14 15 EV/EBITDA (x) 25.1 24.6 20.1 15.4Amortization 1 1 1 1 EPS (W) 5,419 6,475 7,884 10,009
Others 62 41 50 66 CFPS (W) 8,646 8,846 10,639 13,475Chg in Working Capital -14 9 11 9 BPS (W) 25,206 30,913 37,952 47,130Chg in AR & Other Receivables 0 -16 -20 -35 DPS (W) 1,100 1,100 1,100 1,100Chg in Inventories -4 -9 -11 -20 Payout ratio (%) 15.6 12.8 10.5 8.3
Chg in AP & Other Payables 16 15 18 22 Dividend Yield (%) 0.6 0.5 0.5 0.5Income Tax Paid -39 -51 -63 -80 Revenue Growth (%) 13.1 14.3 17.6 25.4Cash Flows from Inv Activities -53 -82 -109 -155 EBITDA Growth (%) 10.8 19.0 19.8 27.0Chg in PP&E -28 -50 -69 -82 Operating Profit Growth (%) 8.8 20.0 21.4 28.8Chg in Intangible Assets -4 -1 -1 0 EPS Growth (%) 11.2 19.5 21.8 27.0Chg in Financial Assets -20 -35 -43 -77 Accounts Receivable Turnover (x) 16.3 17.5 18.0 19.0Others -1 4 4 4 Inventory Turnover (x) 29.5 30.6 31.5 33.2Cash Flows from Fin Activities -20 -20 -22 -21 Accounts Payable Turnover (x) 8.3 8.8 9.4 11.1Chg in Financial Liabilities -2 -1 -1 -1 ROA (%) 15.3 15.5 15.8 16.5
Chg in Equity 0 0 0 0 ROE (%) 26.1 25.0 24.5 24.8Dividends Paid -18 -18 -20 -20 ROIC (%) 76.8 83.8 81.7 81.5Others 0 -1 -1 0 Liability to Equity Ratio (%) 66.1 58.4 52.4 48.5Increase (Decrease) in Cash 82 67 72 71 Current Ratio (%) 164.2 181.5 196.4 208.7Beginning Balance 69 150 217 289 Net Debt to Equity Ratio (%) -59.3 -61.4 -61.8 -61.3Ending Balance 150 217 289 360 Interest Coverage Ratio (x) 144.0 222.3 269.2 318.3Source: Company data, Mirae Asset Daewoo Research estimates
Hanssem
23
April 18, 2017
Mirae Asset Daewoo Research
APPENDIX 1
Important Disclosures & Disclaimers 2-Year Rating and Target Price History
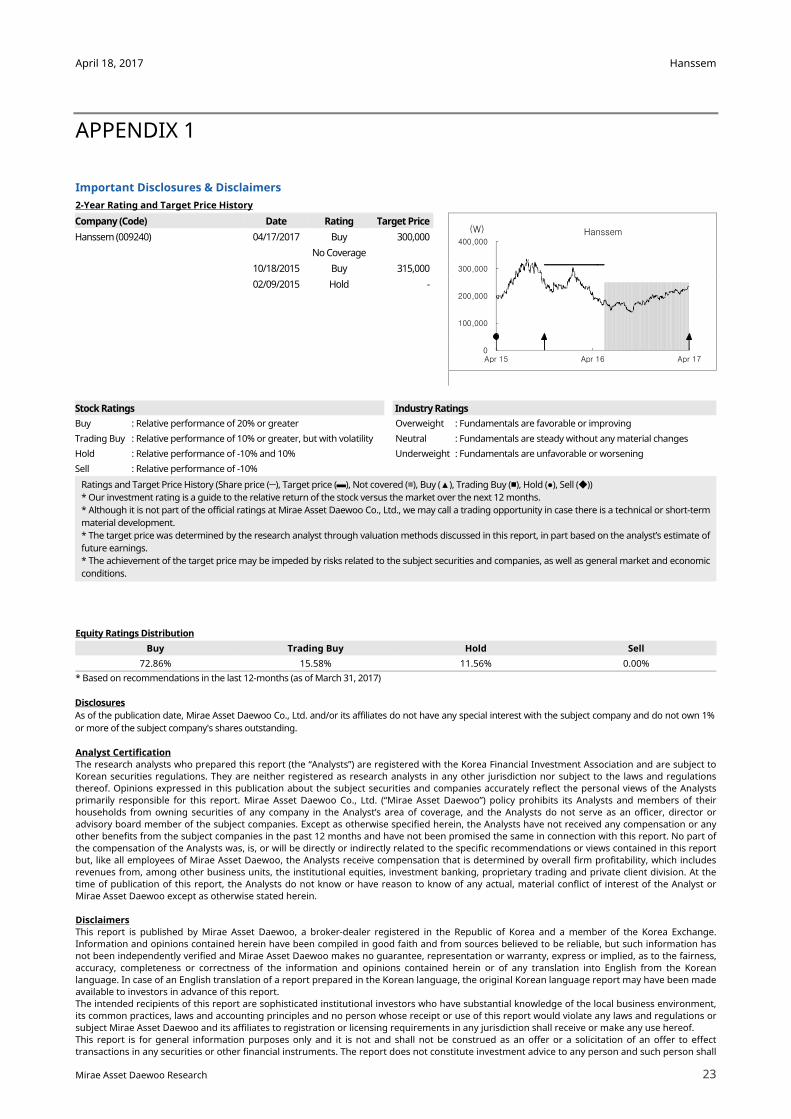
Company (Code) Date Rating Target Price
Hanssem (009240) 04/17/2017 Buy 300,000 No Coverage 10/18/2015 Buy 315,000 02/09/2015 Hold -
Equity Ratings Distribution
Buy Trading Buy Hold Sell 72.86% 15.58% 11.56% 0.00%
* Based on recommendations in the last 12-months (as of March 31, 2017) Disclosures As of the publication date, Mirae Asset Daewoo Co., Ltd. and/or its affiliates do not have any special interest with the subject company and do not own 1% or more of the subject company's shares outstanding. Analyst Certification The research analysts who prepared this report (the “Analysts”) are registered with the Korea Financial Investment Association and are subject to Korean securities regulations. They are neither registered as research analysts in any other jurisdiction nor subject to the laws and regulations thereof. Opinions expressed in this publication about the subject securities and companies accurately reflect the personal views of the Analysts primarily responsible for this report. Mirae Asset Daewoo Co., Ltd. (“Mirae Asset Daewoo”) policy prohibits its Analysts and members of their households from owning securities of any company in the Analyst’s area of coverage, and the Analysts do not serve as an officer, director or advisory board member of the subject companies. Except as otherwise specified herein, the Analysts have not received any compensation or any other benefits from the subject companies in the past 12 months and have not been promised the same in connection with this report. No part of the compensation of the Analysts was, is, or will be directly or indirectly related to the specific recommendations or views contained in this report but, like all employees of Mirae Asset Daewoo, the Analysts receive compensation that is determined by overall firm profitability, which includes revenues from, among other business units, the institutional equities, investment banking, proprietary trading and private client division. At the time of publication of this report, the Analysts do not know or have reason to know of any actual, material conflict of interest of the Analyst or Mirae Asset Daewoo except as otherwise stated herein. Disclaimers This report is published by Mirae Asset Daewoo, a broker-dealer registered in the Republic of Korea and a member of the Korea Exchange. Information and opinions contained herein have been compiled in good faith and from sources believed to be reliable, but such information has not been independently verified and Mirae Asset Daewoo makes no guarantee, representation or warranty, express or implied, as to the fairness, accuracy, completeness or correctness of the information and opinions contained herein or of any translation into English from the Korean language. In case of an English translation of a report prepared in the Korean language, the original Korean language report may have been made available to investors in advance of this report. The intended recipients of this report are sophisticated institutional investors who have substantial knowledge of the local business environment, its common practices, laws and accounting principles and no person whose receipt or use of this report would violate any laws and regulations or subject Mirae Asset Daewoo and its affiliates to registration or licensing requirements in any jurisdiction shall receive or make any use hereof. This report is for general information purposes only and it is not and shall not be construed as an offer or a solicitation of an offer to effect transactions in any securities or other financial instruments. The report does not constitute investment advice to any person and such person shall
Stock Ratings Industry Ratings Buy : Relative performance of 20% or greater Overweight : Fundamentals are favorable or improving Trading Buy : Relative performance of 10% or greater, but with volatility Neutral : Fundamentals are steady without any material changes Hold : Relative performance of -10% and 10% Underweight : Fundamentals are unfavorable or worsening Sell : Relative performance of -10%
Ratings and Target Price History (Share price (─), Target price (▬), Not covered (■), Buy (▲), Trading Buy (■), Hold (●), Sell (◆)) * Our investment rating is a guide to the relative return of the stock versus the market over the next 12 months. * Although it is not part of the official ratings at Mirae Asset Daewoo Co., Ltd., we may call a trading opportunity in case there is a technical or short-term material development. * The target price was determined by the research analyst through valuation methods discussed in this report, in part based on the analyst’s estimate of future earnings. * The achievement of the target price may be impeded by risks related to the subject securities and companies, as well as general market and economic conditions.
0
100,000
200,000
300,000
400,000
Apr 15 Apr 16 Apr 17
(W) Hanssem
Hanssem
24
April 18, 2017
Mirae Asset Daewoo Research
not be treated as a client of Mirae Asset Daewoo by virtue of receiving this report. This report does not take into account the particular investment objectives, financial situations, or needs of individual clients. The report is not to be relied upon in substitution for the exercise of independent judgment. Information and opinions contained herein are as of the date hereof and are subject to change without notice. The price and value of the investments referred to in this report and the income from them may depreciate or appreciate, and investors may incur losses on investments. Past performance is not a guide to future performance. Future returns are not guaranteed, and a loss of original capital may occur. Mirae Asset Daewoo, its affiliates and their directors, officers, employees and agents do not accept any liability for any loss arising out of the use hereof. Mirae Asset Daewoo may have issued other reports that are inconsistent with, and reach different conclusions from, the opinions presented in this report. The reports may reflect different assumptions, views and analytical methods of the analysts who prepared them. Mirae Asset Daewoo may make investment decisions that are inconsistent with the opinions and views expressed in this research report. Mirae Asset Daewoo, its affiliates and their directors, officers, employees and agents may have long or short positions in any of the subject securities at any time and may make a purchase or sale, or offer to make a purchase or sale, of any such securities or other financial instruments from time to time in the open market or otherwise, in each case either as principals or agents. Mirae Asset Daewoo and its affiliates may have had, or may be expecting to enter into, business relationships with the subject companies to provide investment banking, market-making or other financial services as are permitted under applicable laws and regulations. No part of this document may be copied or reproduced in any manner or form or redistributed or published, in whole or in part, without the prior written consent of Mirae Asset Daewoo. Distribution United Kingdom: This report is being distributed by Mirae Asset Securities (UK) Ltd. in the United Kingdom only to (i) investment professionals falling within Article 19(5) of the Financial Services and Markets Act 2000 (Financial Promotion) Order 2005 (the “Order”), and (ii) high net worth companies and other persons to whom it may lawfully be communicated, falling within Article 49(2)(A) to (E) of the Order (all such persons together being referred to as “Relevant Persons”). This report is directed only at Relevant Persons. Any person who is not a Relevant Person should not act or rely on this report or any of its contents. United States: This report is distributed in the U.S. by Mirae Asset Securities (USA) Inc., a member of FINRA/SIPC, and is only intended for major institutional investors as defined in Rule 15a-6(b)(4) under the U.S. Securities Exchange Act of 1934. All U.S. persons that receive this document by their acceptance thereof represent and warrant that they are a major institutional investor and have not received this report under any express or implied understanding that they will direct commission income to Mirae Asset Daewoo or its affiliates. Any U.S. recipient of this document wishing to effect a transaction in any securities discussed herein should contact and place orders with Mirae Asset Securities (USA) Inc., which accepts responsibility for the contents of this report in the U.S. The securities described in this report may not have been registered under the U.S. Securities Act of 1933, as amended, and, in such case, may not be offered or sold in the U.S. or to U.S. persons absent registration or an applicable exemption from the registration requirements. Hong Kong: This document has been approved for distribution in Hong Kong by Mirae Asset Securities (HK) Ltd., which is regulated by the Hong Kong Securities and Futures Commission. The contents of this report have not been reviewed by any regulatory authority in Hong Kong. This report is for distribution only to professional investors within the meaning of Part I of Schedule 1 to the Securities and Futures Ordinance of Hong Kong (Cap. 571, Laws of Hong Kong) and any rules made thereunder and may not be redistributed in whole or in part in Hong Kong to any person. All Other Jurisdictions: Customers in all other countries who wish to effect a transaction in any securities referenced in this report should contact Mirae Asset Daewoo or its affiliates only if distribution to or use by such customer of this report would not violate applicable laws and regulations and not subject Mirae Asset Daewoo and its affiliates to any registration or licensing requirement within such jurisdiction.
Hanssem
25
April 18, 2017
Mirae Asset Daewoo Research
Mirae Asset Daewoo International Network
Mirae Asset Daewoo Co., Ltd. (Seoul) Mirae Asset Securities (HK) Ltd. Mirae Asset Securities (UK) Ltd. Global Equity Sales Team Mirae Asset Center 1 Building 26 Eulji-ro 5-gil, Jung-gu, Seoul 04539 Korea
Suites 1109-1114, 11th FloorTwo International Finance Centre 8 Finance Street, Central Hong Kong China
41st Floor, Tower 42 25 Old Broad Street, London EC2N 1HQ United Kingdom
Tel: 82-2-3774-2124 Tel: 852-2845-6332 Tel: 44-20-7982-8000
Mirae Asset Securities (USA) Inc. Mirae Asset Wealth Management (USA) Inc. Mirae Asset Wealth Management (Brazil) CCTVM810 Seventh Avenue, 37th Floor New York, NY 10019 USA
555 S. Flower Street, Suite 4410, Los Angeles, California 90071 USA
Rua Funchal, 418, 18th Floor, E-Tower Building Vila Olimpia Sao Paulo - SP 04551-060 Brasil
Tel: 1-212-407-1000 Tel: 1-213-262-3807 Tel: 55-11-2789-2100
PT. Mirae Asset Sekuritas Indonesia Mirae Asset Securities (Singapore) Pte. Ltd. Mirae Asset Securities (Vietnam) LLCEquity Tower Building Lt. 50 Sudirman Central Business District Jl. Jend. Sudirman, Kav. 52-53 Jakarta Selatan 12190 Indonesia
6 Battery Road, #11-01Singapore 049909 Republic of Singapore
7F, Saigon Royal Building 91 Pasteur St. District 1, Ben Nghe Ward, Ho Chi Minh City Vietnam
Tel: 62-21-515-3281 Tel: 65-6671-9845 Tel: 84-8-3911-0633 (ext.110)
Mirae Asset Securities Mongolia UTsK LLC Mirae Asset Investment Advisory (Beijing) Co., Ltd Beijing Representative Office
#406, Blue Sky Tower, Peace Avenue 171 Khoroo, Sukhbaatar District Ulaanbaatar 14240 Mongolia
2401B, 24th Floor, East Tower, Twin TowersB12 Jianguomenwai Avenue, Chaoyang District Beijing 100022 China
2401A, 24th Floor, East Tower, Twin TowersB12 Jianguomenwai Avenue, Chaoyang District Beijing 100022 China
Tel: 976-7011-0806 Tel: 86-10-6567-9699 Tel: 86-10-6567-9699 (ext. 3300)
Shanghai Representative Office Ho Chi Minh Representative Office
38T31, 38F, Shanghai World Financial Center 100 Century Avenue, Pudong New AreaShanghai 200120 China
7F, Saigon Royal Building91 Pasteur St. District 1, Ben Nghe Ward, Ho Chi Minh City Vietnam
Tel: 86-21-5013-6392 Tel: 84-8-3910-7715