Embed Size (px)
Citation preview
FINANCIAL STATUS REPORT
FIVE YEAR FINANCIAL PLAN
CITY OF ATLANTA
KEISHA LANCE BOTTOMS
MAYOR
FISCAL YEAR 2020

TABLE OF CONTENTS
FIVE YEAR PLAN
PREFACE
CITY OFFICIALS 5
CITY ORGANIZATIONAL STRUCTURE 7
READER’S GUIDE 9
PURPOSE 10
INTRODUCTION
MAYOR’S LETTER 13
CFO’S LETTER 15
STRATEGIC INITIATIVES 17
FIVE YEAR REVENUE
NARRATIVE AND
PROJECTIONS
REVENUE FORECAST SUMMARY 21
FIVE YEAR
EXPENDITURE
OVERVIEW AND
PROJECTIONS
EXPENDITURE AND FORECAST SUMMARY 59
FUND AND DEPARTMENTAL PROJECTIONS 63
1

FUND BALANCES
GENERAL FUND BALANCE AND PROJECTIONS 113
THE PLAN TO ADDRESS DEFICIT FUND BALANCES 115 SUMMARY OF FUND BALANCE AND NET POSITION 117
DEBT MANAGEMENT
OVERVIEW 120
MUNICIPAL BOND RATINGS 121
DEBT FORECAST SUMMARIES 126
CAPITAL PROJECT
STATUS SUMMARIES
CAPITAL PROJECT STATUS OVERVIEW 139
APPENDIX
LEGISLATION 168
GLOSSARY 185
2
PREFACE
FIVE YEAR PLAN
CITY OFFICIALS
CITY ORGANIZATIONAL STRUCTURE
READER’S GUIDE
PURPOSE
3
4

CITY OFFICIALS
Keisha Lance Bottoms Mayor
Richard Cox
Chief Operating Officer
Marva Lewis Chief of Staff
Roosevelt Council, Jr. Chief Financial Officer
Nina Hickson City Attorney
MEMBERS OF CITY COUNCIL
Felicia A. Moore Council President
Carla Smith
District 1
Cleta Winslow District 4
Howard Shook
District 7
Andrea L. Boone District 10
Michael Julian Bond
Post 1, At-Large
Amir R. Farokhi District 2
Natalyn Mosby Archibong
District 5
J.P. Matzigkeit District 8
Marci Collier Overstreet
District 11
Matt Westmoreland Post 2, At-Large
District 3 District 3
Jennifer N. Ide
District 6
Dustin Hillis District 9
Joyce M. Sheperd
District 12
Andre Dickens Post 3, At-Large
Foris Webb III
Municipal Clerk
5

JUDICIAL OFFICERS
COURT OPERATIONS Christopher T. Portis Chief Judge
PUBLIC DEFENDER Kenneth Days, III Public Defender
SOLICITOR Raines F. Carter City Solicitor
BOARD OFFICERS
ATLANTA CITIZENS REVIEW DIRECTOR Samuel Lee Reid, III Executive Director
ETHICS OFFICER Jabu Sengova Ethics Officer
CITY INTERNAL AUDITOR Amanda Noble City Auditor
DEPARTMENT OFFICERS
AVIATION John Selden, Jr. General Manager
CORRECTIONS Patrick Labat Corrections Chief
CUSTOMER SERVICE Rocky Atkins Commissioner
ENTERPRISE ASSETS MANAGEMENT Jalal Slade Senior Policy Advisor
FINANCE Roosevelt Council, Jr. Chief Financial Officer
FIRE & RESCUE SERVICES Randall Slaughter Fire Chief
HUMAN RESOURCES Marian Y. Woods Commissioner
ATLANTA INFORMATION MANAGEMENT Gary Brantley Chief Information Officer
LAW Nina Hickson City Attorney
PARKS & RECREATION John Dargle, Jr. Commissioner
CITY PLANNING Tim Keane Commissioner
POLICE SERVICES Erika Shields
Police Chief
PROCUREMENT David L. Wilson, II Chief Procurement Officer
PUBLIC WORKS James A. Jackson, Jr. Interim Commissioner
WATERSHED MANAGEMENT Kishia L. Powell Commissioner
6

CITY ORGANIZATIONAL STRUCTURE
Judicial Agencies
Mayor
City Council
JUDICIAL AGENCIES
CITY COUNCIL MAYOR
CHIEF OF STAFF CHIEF OPERATING
OFFICER
ETHICS OFFICE
ATLANTA CITIZENS REVIEW BOARD
CITY AUDITOR’S OFFICE FIRE & RESCUE
SERVICES
AVIATION
ATLANTA INFORMATION
MANAGEMENT
CORRECTIONS
POLICE SERVICES
PARKS & RECREATION
CITY PLANNING
HUMAN RESOURCES
PROCUREMENT
PUBLIC WORKS
WATERSHED
MANAGEMENT
COURT
OPERATIONS
PUBLIC
DEFENDER
SOLICITOR
CHIEF FINANCIAL
OFFICER CITY ATTORNEY
FINANCE LAW
INVEST ATLANTA
ATLANTA HOUSING
AUTHORITY
ATLANTA BELTLINE
WORKSOURCE ATLANTA
MARTA
ENTERPRISE ASSETS
MANAGEMENT
CUSTOMER SERVICE
CITY ORGANIZATIONAL STRUCTURE
7

8

READER’S GUIDE
The City of Atlanta’s Five Year Plan document is intended to provide information in such a manner that the lay reader can understand the operations of the City. The Reader’s Guide describes the structure of the FY2020 City of Atlanta Five Year Plan and outlines its contents. The FY2020 Five Year Plan has overview sections and detail on the overall financial data of the City of Atlanta. The entire document will be posted on the City’s website at www.atlantaga.gov after it is adopted by City Council.
The Preface –provides an overview of the City officials, organizational structure, and purpose.
Introduction- provides the Mayor’s and CFO’s transmittal letter, which presents the framework
for the City operations and services for the next five years.
Five Year Revenue Overview and Projections –It includes detailed information on the City’s
economic outlook, which provides the basis for revenue projections and methodology as well as historical trends, account details of major revenue sources.
Five Year Expenditure Overview and Projections - provides expense budget summaries for all
operating funds and key performance plans for the next five years.
Fund Balances- includes the audited and projected fund balances of the various operating
funds.
Debt Management - provides a summary for the City’s general debt obligations, bond ratings
and debt coverage ratios.
Capital Project Status Summaries - provides the status of active capital projects that are new or
will continue from the previous fiscal year.
Appendix –includes legislation and other essential information.
9

PURPOSE
The City’s introduction of a five year planning process allows the City to identify future revenue and expense trends and proactively identify ways to improve financial viability. A five-year plan is a critical forecasting tool for the City. The refinement of assumptions, historical trends and policy decisions will have a direct impact on the City’s ability to address volatile economic conditions.
Ordinance 09-0-1406 was adopted on September 21, 2009, and it codifies the requirement to complete a five- year stabilization plan that is updated annually. The Ordinance directs the City to consider and present specific financial issues that are critical to the City’s financial future by October 15 of each year. It further requires that in subsequent years, the City Council will formally adopt a plan by the 3rd Monday in January.
The legislation was updated (11-O-1415) to allow the Chief Financial Officer to consider information from the prior year closeout and auditor’s recommendations.
The Mayor shall present to the governing body by February 15 of each year a five-year financial stabilization plan consisting of the following elements:
(1) A five-year projection of general fund revenues broken down by major category; the projection shall identify the economic trends and assumptions upon which such projection is based.
(2) A five-year projection of total general fund expenses on a departmental level; Such expense projection shall assume the continuation of department operations as they exist in the current general fund budget and shall take into account the following: i. The effect of inflation on general fund budgeted costs ii. A projection of pension costs as provided by the city's actuaries iii. Costs occurring in future years that the city is legally obligated to pay
(3) A calculation of the surplus or deficit produced by the projected revenues and expenditures described in (1) and (2) above
(4) A cost estimate of long-term initiatives of the city; such initiatives shall include, but are not limited to: long-term operating infrastructure and capital infrastructure needs and the elimination of deficit positions in funds that are subsidized or have historically been subsidized by the general fund. At any time the governing body of the city may, by resolution request specific long-term initiatives to be included in the five-year financial stabilization plan.
(5) A comprehensive list of revenue initiatives the city may pursue during the five years covered by the financial stabilization plan, including an estimate of the revenues to be produced by such initiatives.
(6) A comprehensive list of cost saving initiatives the city may pursue during the five years covered by the financial stabilization plan, including an estimate of costs saved by such initiatives.
The governing body shall adopt the financial stabilization plan by April 30 of each year. In no event shall the governing body adopt the budget for the upcoming fiscal year prior to consideration of the financial stabilization plan.
10

INTRODUCTION
MAYOR’S LETTER
CFO’S LETTER
STRATEGIC INITIATIVES
FIVE YEAR PLAN
11

12

CITY OF ATLANTA
KEISHA LANCE BOTTOMS
MAYOR
55 TRINITY AVENUE, S.W.
ATLANTA, GEORGIA 30303 - 0300
TEL (404) 330-6100
March 7, 2019
The Honorable Felicia A. Moore, President Members of City Council Atlanta City Council 55 Trinity Ave. SE Atlanta, GA 30303 Dear President Moore and Members of the Atlanta City Council: It is my honor to provide for your review and consideration the following Five-Year Financial Plan for the
City of Atlanta for Fiscal Years 2020 to 2024.
While we have made broad, positive strides in public safety, transparency, equity, and affordability over the past year, there is still much work to do. As our economic growth unfolds, my Administration and I remain committed to deliver exemplary municipal services to meet the needs of our citizens, while upholding our responsibility of fiscal stewardship. The Fiscal Year 2020 Five-Year Plan advances key initiatives and charters our course of direction on future investments for the City of Atlanta. Several of the more significant items addressed in this plan include:
• Compensation funding for the Atlanta Police Department; • Increase in the City’s minimum wage to $15 per hour; • Ongoing funding for the City’s Infrastructure Maintenance Program; • Continued support for the City’s investment in the Arts; and • Maintain funding provided for the Atlanta/Fulton County Pre-Arrest Diversion Initiative
We have worked hard to position ourselves as a world class city. Our financial position is strong, which is evident in our credit rating and investments in upgrading our aging infrastructure. We have instituted an open and inclusive culture to ensure equitable practices across all city departments and functions. Now is the time for us to remain diligent and continue to move Atlanta forward and into the future. I am confident that the plan before you strikes an appropriate balance, securing and improving the financial health of our city while making smart investments to elevate the quality of life for our employees and residents. As always, I am honored to work with you as we continue to make the necessary investments in our residents and community, ensuring Atlanta is an effective and efficient city that works for everyone. Sincerely, Keisha Lance Bottoms
13

14

CITY OF ATLANTA
DEPARTMENT OF FINANC E
68 MITCHELL STREET, S .W . SUITE 11100
ATLANTA, GEORGIA 30 303-0312
TEL (404) 330-6453 ∙ FAX (404) 546-2062
ROOSEVELT COUNCIL, JR.
CHIEF FINANCIAL OFFICER
KEISHA LANCE BOTTOMS
MAYOR
March 7, 2019 The Honorable Felicia A. Moore, President Members of City Council Atlanta City Council 55 Trinity Ave. SE Atlanta, GA 30303 Dear President Moore and Members of the Atlanta City Council: It is my pleasure to submit to you the City of Atlanta’s FY2020 Five-Year Financial Plan for Fiscal Years 2020 to 2024. This year’s plan assesses the City’s ability over the next five years to effectively provide services to our residents, meet established goals, and to ensure the City’s future vitality and economic stability. The five-year financial plan should be viewed as a component of a comprehensive effort to improve the City’s long-range financial management and planning. The FY2020 Five Year Plan takes aim at building the framework necessary through which to manage financial decisions. This includes efforts in forecasting and analyzing revenues and expenses for the next five years on a citywide basis, including changes in major service areas, departmental operations, facilities, debt management, capital and technology. The City’s financial position remains strong. Significant progress has occurred over the past year to deliver on initiatives that address public safety, transparency and economic opportunity. However, sustaining this momentum and our financial position will not occur without fiscal discipline and a long-term strategy requiring proactive decisions and actions over multiple years. The FY2020 Five Year Plan assumes modest revenue growth which is consistent with current trends in our more economically sensitive revenue sources. Property Tax, Sales Tax, and Hotel/Motel Tax revenues are expected to continue the favorable gains exhibited in the ongoing real estate rebound and burgeoning economic recovery. Property Tax revenues are projected to increase by an average of three percent annually over the next five years. Sales Tax revenues are projected to average two and a half percent growth annually over the five-year horizon. Hotel/Motel Tax revenues are projected to remain relatively stable over the next five-years due to a robust tourism and hospitality industry in the Atlanta area. Overall, the City’s economic outlook is promising.
15

Expenditure projections over the forecast period reflect critical expenses that will impact future plan years. Critical expenses are those that are contractually obligated, legislatively mandated, or considered as high priority funding needs. As depicted in the chart below, the cost of city services in the General Fund is projected to outpace revenues over the five-year forecast period. Although it is not uncommon to see budgetary shortfalls in a five-year plan, the imbalance must be addressed. Bridging the gap is part of the budget development process and every effort will be made to develop a well-aligned portfolio of revenue growth and expense reduction initiatives.
Fiscal Year 2020 Five-Year Financial Plan General Fund
As common with long-term planning efforts, the resulting forecast should be viewed as directional in nature. We received input from external and City subject matter experts to develop the financial projections included. This is a snapshot in time based on the information available during the development of the report. Please keep in mind it is a living document and subject to change. This Five-Year plan promotes a focus on the long-term health of the City, allowing us to better predict financial challenges and opportunities. We will continue to make every effort possible to provide a budgetary framework for the City to plan the management of its resources, revenues and expenditures, while upholding our responsibility of fiscal stewardship. Sincerely, Roosevelt Council, Jr.
FY2020 FY2021 FY2022 FY2023 FY2024PROJECTED PROJECTED PROJECTED PROJECTED PROJECTED
Projected Revenues $673.3 $688.7 $706.7 $725.1 $744.7
Projected Expenses $710.5 $723.8 $736.2 $748.9 $760.9
Net General Fund Impact ($37.2) ($35.1) ($29.5) ($23.8) ($16.2)
16

STRATEGIC INITIATIVES AND FINANCIAL PLANNING
In collaboration with the City Council and support from community, civic, and corporate leaders, Mayor Keisha Lance Bottoms will implement several initiatives that will target affordability and equity, ethics and transparency, education, transportation and mobility, public safety, criminal justice reform, job growth, and economic development. Some of the key initiatives are outlined below:
17

18

FIVE-YEAR
REVENUE
NARRATIVE AND
ESTIMATES
FIVE YEAR PLAN
REVENUE FORECAST SUMMARY
19

20

REVENUE FORECAST SUMMARY
FORECAST METHODOLOGY
The City’s Department of Finance-Office of Revenue continues a solid partnership with various academic entities including the Selig Center for Economic Growth and the Carl Vinson Institute of Government at the University of Georgia and with the Economic Forecasting Center and the Andrew Young School of Public Policy at Georgia State University. These partnerships have enabled City management to gain important independent economic analyses, metrics, and training which are integrated into our multi-year revenue model. Key metrics are S&P Case-Shiller Index, Atlanta Gross Metro Product, Atlanta Unemployment rate, Building Permits, Construction Activity, Jones, Lang, LaSalle Office Vacancy Rates, CBRE Hotel Occupancy Rates and Revenue Per Available Rooms, Atlanta Personal Income, U.S. & Atlanta Consumer Price Index (% Annualized), and Georgia State Product by Sector. The City Office of Revenue uses the Municast Financial modeling software by inputting the aforementioned key metrics into the tool as further enhancement in our multi-year forecasting.
CITY CHARTER REQUIREMENT
The responsibility for revenue anticipations and specified appropriations is fixed by law through the Budget Commission. The Budget Commission members approve revenue anticipations for all City operating funds in June of each year.
REVENUE ANTICIPATIONS
The FY 2019 General Fund Revenue forecast, as of the date of this Five-Year Plan, is $662.9 million and is pace to meet or
exceed the revenue amount adopted by the Budget Commission in June of 2018. The estimated FY 2020 General Fund Revenue Anticipation that is forecasted in the Five-Year Plan is $673.3 million.
The City Finance team expects that the
overall 2019 property tax revenues will continue to grow at a rate of 3.0% with the growth being attributed to new construction. As of publication of the Five-Year Plan, there is no available estimate from the Tax Assessor’s office on the 2019 tax digest. Therefore, the City relies on historic and other independent economic data including the Case-Shiller Index, which is a national housing price index, to determine City property valuation trends and estimates.
The City’s property tax base is a primary component of City General Fund revenues accounting for approximately thirty one percent of General Fund revenues. Property tax revenues have continued to increase, which began in 2014 due to an improved housing market. The City continues to demonstrate a measured response by continuing to estimate property tax revenue growth conservatively.
More discussion on Property Tax revenue assumptions is provided later in the trend narrative. Sales tax revenue is the next largest share of General Fund revenues accounting for approximately seventeen percent of General Fund revenues. Sales tax revenue is highly elastic and demonstrates significant peak and troughs in revenues due to changes in economic performance associated with Gross Metro Product indexes, income and unemployment levels. The lodging market,
21

which is the driver for hotel/motel tax revenues, is expected to be another constant contributor to the City’s economic condition. CBRE Consulting Research provides additional insight under the hotel/motel forecast narrative section.
The FY 2020 General Fund Revenue anticipations are consistent with the City Charter requirements and the City Finance
team continues to exercise fiscal discipline in the preparation of the revenue forecast.
Furthermore, City senior management monitors Budget versus Actual revenue performance on a monthly basis and makes timely forecast revisions as deemed appropriate.
22

PROJECTED REVENUES BY MAJOR CATEGORYGeneral Fund
FY18 FY19 FY20 FY21 FY22 FY23 FY24Actual Adopted Projected Projected Projected Projected Projected
Property Taxes 206,522,773 208,451,068 218,499,154 224,164,795 229,791,368 235,004,999 240,634,397Public Utility, Alcoholic Beverage and Other Taxes 106,442,797 106,923,683 107,712,019 111,966,359 116,659,508 121,855,681 127,630,290
Local Option Sales Taxes 110,183,776 108,730,000 115,427,417 117,787,084 122,311,414 127,006,627 131,879,178
Licenses and Permits Revenue 117,251,072 118,275,544 121,770,548 123,758,629 125,801,552 127,900,846 130,058,083
Other Revenue 26,664,277 7,332,494 6,287,573 6,322,138 6,357,236 6,392,955 6,429,408
Charges For Current Services 6,884,755 4,582,826 4,562,206 4,680,665 4,815,277 4,967,856 5,140,474
Federal Revenues 348,370 - - - - - -
State and Local Governments 354,711 - - - - - -
Fines, Forfeitures and Penalties 20,629,181 23,472,056 22,211,707 22,229,084 22,246,512 22,263,993 22,281,525
Building Rentals and Concessions 13,864,504 13,990,662 4,369,614 4,433,103 4,498,422 4,565,626 4,634,768
Indirect Costs Recovery 36,209,060 30,000,000 30,000,000 30,660,000 31,334,520 32,023,879 32,728,405
Hotel & Motel Tax Revenue 19,593,067 19,151,183 21,800,045 21,821,413 21,842,802 21,864,213 21,885,645
Pilot & Franchise Fees 20,483,276 20,483,276 20,677,178 20,872,918 21,070,510 21,269,973 21,471,324
Total $685,431,620 $661,392,792 $673,317,462 $688,696,189 $706,729,121 $725,116,649 $744,773,499
23

GENERAL FUND The General Fund is the chief operating governmental fund for the City of Atlanta, capturing revenues
and expenditures for general operations.
PROPERTY TAXES This major revenue category consists of various revenue sources including current and prior year property taxes, intangible recording & real estate transfer taxes, penalties and interest from delinquent property taxes, and payments in lieu of taxes.
Major Revenue Category
FY 2020 FY 2021 FY 2022 FY 2023 FY 2024
Property Tax $218,499,154 $224,164,795 $229,791,368 $235,004,999 $240,634,397
A summation of total revenues within this major category and a breakdown of some of the key revenue contributors within the category are as follows:
Current Year Property Taxes: FY 2020-24 Forecast:
FY2020 FY2021 FY2022 FY2023 FY2024
$207,913,200 $213,217,142 $218,464,529 $223,280,223 $228,491,539
The City of Atlanta imposes a tax on real and personal property. Revenues are derived from the millage rate and the tax digest assessed values. The first year of tax digest growth in five years following the Great Recession was in 2013. The 2014 through 2018 net tax digests have continued to grow at an average of about 7.4% over the period. The 2018 net tax digest increased by 17.2% with a net tax digest of $31.3 billion compared to $26.7 billion in 2017. However, this growth was inflated due to a ruling in 2017 to artificially roll-back the residential digest to 2016 levels by the Fulton County Commission, who concluded that the residential assessments were “erroneous”. The 2018 City’s tax digest is comprised as follows: 52% residential and 48% non-residential. The 2019 net tax digest is expected to grow at a normal pace and continue the positive trend reflective of the real estate rebound witness throughout the city of Atlanta.
The City’s current year five-year property tax forecast assumes a rollback of property taxes due to positive reassessment. The projected current year property tax revenue growth from new construction is estimated at 3.0% over the five-year forecast horizon. The 1999 Taxpayers Bill of Rights allows municipalities to retain new construction growth without any additional public hearing and tax notice requirements. The collection rate assumption is 99% and is consistent with historical collection rates. According to the Selig Center Economic Outlook, “Home prices have recovered relatively quickly in the Atlanta market. As of the third quarter of 2018, Atlanta’s home prices were 21 percent above their pre-recession peak levels. In terms of new single-family home construction, Atlanta’s housing recovery began in 2010 and gained traction in 2012-2018. The 2019 prospects for Atlanta’s single-family homebuilding outlook are good.”
Intangible Recording Taxes: FY 2020-24 Forecast:
FY2020 FY2021 FY2022 FY2023 FY2024
$4,635,535 $ 4,793,921 $ 4,959,965 $ 5,134,220 $ 5,317,295
24

The intangible recording tax is due and payable on each instrument securing one or more long-term notes at the rate of $1.50 per each $500 or fraction thereof of the face amount of all notes secured by real property. The maximum tax on a single instrument is $25,000. Examples include mortgages, deeds to secure debt bonds for title, or any other real estate security instrument that gives the lender a resource to be used if the principal obligation is not paid.
Real Estate Transfer Tax: FY 2020-24 Forecast:
FY2020 FY2021 FY2022 FY2023 FY2024
$ 2,781,822 $ 2,876,871 $ 2,976,515 $ 3,081,087 $ 3,190,952
The real estate transfer tax is levied on the sale or transfer of real estate located in Atlanta. The tax is at the rate of $1 for the first $1,000 or fractional part of $1,000 and at the rate of .10 cents for each additional $100 or fractional part of $100 on each deed, instrument, or other writing by which any lands, tenements, or other realty sold is granted, assigned, transferred, or otherwise conveyed to or vested in the purchaser(s). A transfer tax raises the price paid by real estate buyers and lowers the price received by real estate sellers. As a result, the overall level of real estate market activity is reduced. Ordinary property and sales taxes are paid by property owners and consumers. In contrast, only the buyers and sellers of real estate pay a transfer tax. For most arms’ length transactions, the tax is based on the actual price or consideration agreed to by the parties.
These two revenue sources are impacted by trends in the housing market. According to the GSU Economic Forecasting Center report dated November 2018, “Following an 8.4% drop in 2017, total housing permits in the Atlanta metro region are expected to grow by 10.8%, as multifamily permits rebound. Going forward, we expect moderate growth as the industry battles rising financing costs.” The projected Real Estate Transfer and Intangible Recording Tax revenue growth is estimated at 3.0%.
Other Taxes: FY 2020-24 Forecast:
FY2020 FY2021 FY2022 FY2023 FY2024
$3,168,597 $3,276,861 $3,390,359 $3,509,469 $3,634,611
This category consists of Prior Year Property Taxes, Penalties & Interest, and Payments In Lieu of Taxes (PILOT). The projected Other Taxes revenue growth is estimated to remain relatively stable and reflects current collection trends.
PUBLIC UTILITY, ALCOHOL BEVERAGE AND OTHER TAXES This major revenue category consists of various revenue sources including current and prior year public utility taxes, motor vehicle & title ad valorem taxes, state railroad ad valorem tax, public utility franchise tax, insurance premium tax, alcohol beverage and by the drink taxes and interest & penalties.
Major Revenue Category
FY 2020 FY 2021 FY 2022 FY 2023 FY 2024
Public Utility, Alcohol Beverage
& Other Taxes $107,712,019 $111,966,359 $116,659,508 $121,855,681 $127,630,290
A summation of total revenues within this major category and a breakdown of some of the key revenue contributors within the category are as follows:
25

Public Utility Franchise Fee: FY 2020-24 Forecast:
FY2020 FY2021 FY2022 FY2023 FY2024
$43,121,943 $ 44,825,146 $ 46,704,024 $ 48,784,284 $ 51,096,119
This category includes franchise fee assessments for electric, gas, cable and telecommunication companies. Georgia Power remits an annual payment in January of each year and the fee is based on 5% of gross receipts. The Telecommunications Act of 2008 (O.C.G.A. 46-5-1) invalidated existing municipal franchise agreements as of December 31, 2012 and streamlined the required compensation for a municipal authority from a percentage of gross receipts to a cap of 3% of actual local service revenues which reduced the City’s revenue stream in this category. Due to current population trends and utility rate increases, this revenue category has not been adversely impacted.
This revenue source correlates with Atlanta unemployment and real estate development trends and is projected to grow at an average annual growth rate of 4.0% over the five-year forecast horizon. The growth rate is minimal due to negotiated changes to the collection amounts for fiscal years 2018 to 2020. Under normal conditions, as unemployment declines and real estate development increases, the demand for public utility services increases which generates additional franchise revenue.
Alcohol Tax: FY 2020-24 Forecast:
FY2020 FY2021 FY2022 FY2023 FY2024
$19,130,653 $19,886,264 $20,719,810 $21,642,700 $22,668,324
Alcohol taxes are levied on wholesale distributors at the rate of .22 cents per liter. A 3% tax-by-the-drink is also assessed on patrons of eating and drinking alcohol establishments within the City limits. The forecast horizon reflects an average annual 4% growth estimate for current year accounts, which is tied to trends in taxable sales from food and drinking establishments. Alcohol consumption has tended to be inelastic or not sensitive to changes in price or income.
Insurance Premium Tax: FY 2020-24 Forecast:
FY2020 FY2021 FY2022 FY2023 FY2024
$ 31,257,076 $ 32,491,648 $ 33,853,559 $ 35,361,442 $ 37,037,183
The insurance premium tax is levied to every insurance company domestic or foreign, operating within the State of Georgia. Each insurance company is assessed a tax at the rate of 2.25% on the gross direct premiums. The insurance premium tax is remitted to the Georgia Department of Insurance. The City’s share is based on the population of the City relative to all incorporated cities and the State population. The forecast horizon reflects an average annual 4.0% growth estimate and is based on historical trends and correlation to population growth.
Other Taxes: FY 2020-24 Forecast:
FY2020 FY2021 FY2022 FY2023 FY2024
$14,202,347 $14,763,301 $15,382,115 $16,067,255 $16,828,664
This category consists of various revenue sources including the motor vehicle tax, other public utility taxes, and title ad valorem taxes. The modest growth in the forecast for this category in FY2020 through FY2024 reflects revenues related to the state railroad ad valorem taxes which are dispersed in alternating years. Also, declining revenue from the “birthday” motor vehicle tax is estimated from vehicles rolling off the phased-out motor vehicle tax.
26

LOCAL OPTION SALES TAX (LOST) Local option sales tax is a major revenue source for the City and is imposed on the purchase, sale, rental, storage, use, or consumption on tangible personal property and related services. Proceeds from this tax are collected by the Georgia Department of Revenue and disbursed to the county and municipalities based on a negotiated allocation between Fulton County and the cities within the county. The City of Atlanta’s share of the 1% LOST is 40.43%.
Major Revenue Category
FY 2020 FY 2021 FY 2022 FY 2023 FY 2024
Local Option Sales Tax
$115,427,417 $117,787,084 $122,311,414 $127,006,627 $131,879,178
FY 2020-24 Forecast: Sales tax is one of the most economically sensitive governmental revenue sources with a close correlation to Atlanta retail sales activity, employment, and personal income levels. Sales tax revenue over the five-year period is projected at an average of 4.0% annually and has seen significant increases over the last several years due to favorable employment and personal income statistics. According to the GSU Economic Forecasting Center report dated November 2018, “In Georgia, that spending evidence is in the states gross sales tax revenues, which have grown by 7.3% so far in calendar year 2018. We can also see evidence of this spending in our job figures. Retail trade job gains posted a better gain of 8,300 new jobs in the first nine months of this year, a complete turnaround from the 400 job losses in 2017.”
LICENSES AND PERMITS This major revenue category consists of various revenue sources including alcohol, professional, insurance, and financial institution licenses, general business (occupation) license tax, various parking & building permits, and occupancy certificates.
Major Revenue Category
FY 2020 FY 2021 FY 2022 FY 2023 FY 2024
Licenses and Permits
$121,770,548 $123,758,629 $125,801,552 $127,900,846 $130,058,083
A summation of total revenues within this major category and a breakdown of some of the major revenue contributors within this category are as follows:
General Business/License Tax: FY 2020-24 Forecast:
FY2020 FY2021 FY2022 FY2023 FY2024
$64,308,195 $65,358,192 $66,437,157 $67,545,896 $68,685,242
The general business/license tax also known as the occupational tax is levied on all entities conducting business in the City. The general business/license tax is computed on two separate criteria 1) estimated gross revenue and 2) number of employees. The estimated gross revenue amount filed in the prior year is adjusted by the actual gross amount when filing for the next year’s business/license tax. The general business/license tax is closely tied to corporate income and employment levels.
27
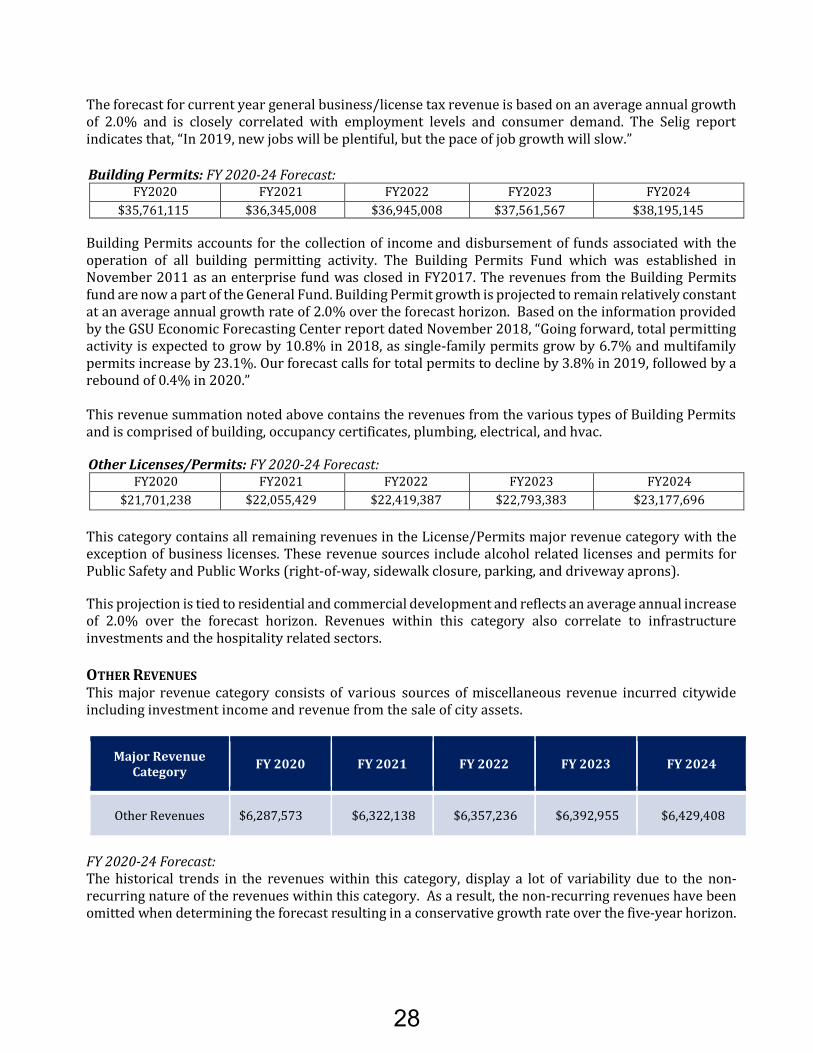
The forecast for current year general business/license tax revenue is based on an average annual growth of 2.0% and is closely correlated with employment levels and consumer demand. The Selig report indicates that, “In 2019, new jobs will be plentiful, but the pace of job growth will slow.”
Building Permits: FY 2020-24 Forecast:
FY2020 FY2021 FY2022 FY2023 FY2024
$35,761,115 $36,345,008 $36,945,008 $37,561,567 $38,195,145
Building Permits accounts for the collection of income and disbursement of funds associated with the operation of all building permitting activity. The Building Permits Fund which was established in November 2011 as an enterprise fund was closed in FY2017. The revenues from the Building Permits fund are now a part of the General Fund. Building Permit growth is projected to remain relatively constant at an average annual growth rate of 2.0% over the forecast horizon. Based on the information provided by the GSU Economic Forecasting Center report dated November 2018, “Going forward, total permitting activity is expected to grow by 10.8% in 2018, as single-family permits grow by 6.7% and multifamily permits increase by 23.1%. Our forecast calls for total permits to decline by 3.8% in 2019, followed by a rebound of 0.4% in 2020.”
This revenue summation noted above contains the revenues from the various types of Building Permits and is comprised of building, occupancy certificates, plumbing, electrical, and hvac.
Other Licenses/Permits: FY 2020-24 Forecast:
FY2020 FY2021 FY2022 FY2023 FY2024
$21,701,238 $22,055,429 $22,419,387 $22,793,383 $23,177,696
This category contains all remaining revenues in the License/Permits major revenue category with the exception of business licenses. These revenue sources include alcohol related licenses and permits for Public Safety and Public Works (right-of-way, sidewalk closure, parking, and driveway aprons).
This projection is tied to residential and commercial development and reflects an average annual increase of 2.0% over the forecast horizon. Revenues within this category also correlate to infrastructure investments and the hospitality related sectors.
OTHER REVENUES This major revenue category consists of various sources of miscellaneous revenue incurred citywide including investment income and revenue from the sale of city assets.
Major Revenue Category
FY 2020 FY 2021 FY 2022 FY 2023 FY 2024
Other Revenues $6,287,573 $6,322,138 $6,357,236 $6,392,955 $6,429,408
FY 2020-24 Forecast: The historical trends in the revenues within this category, display a lot of variability due to the non-recurring nature of the revenues within this category. As a result, the non-recurring revenues have been omitted when determining the forecast resulting in a conservative growth rate over the five-year horizon.
28

CHARGES FOR CURRENT SERVICES This major revenue category consists of various revenue sources including fees for police services, entertainment & film applications, towing, and registration and rezoning petitions.
Major Revenue Category
FY 2020 FY 2021 FY 2022 FY 2023 FY 2024
Charges For Current Services
$4,562,206 $4,680,665 $4,815,277 $4,967,856 $5,140,474
FY 2020-24 Forecast: Revenues in this category are projected to have an average annual growth rate of 3.0% and were derived using historical trend analysis and correlation techniques. The revenues in this category were found to be correlated to residential and commercial development.
FINES, FORFEITURES AND PENALTIES The Fines, Forfeitures and Penalties major revenue category is comprised primarily of traffic fines and forfeitures. Fines and forfeitures are administered through the City Municipal Court and the ATL Plus Atlanta contract guarantee. Case filing histories and trends are one of the key metrics in developing the City’s annual budget forecast. Case statistics are captured monthly by the corresponding case types.
Major Revenue Category
FY 2020 FY 2021 FY 2022 FY 2023 FY 2024
Fines/Forfeitures /Penalties
$22,211,707 $22,229,084 $22,246,512 $22,263,993 $22,281,525
FY 2020-24 Forecast: The FY 2020-2024 forecast reflects recent historical performance. Most major fine revenues within this category have declined and relate to Traffic, General, DUI, Drug, Housing, School Bus Safety Camera, and Failure to Appear. The FY 2020-2024 forecast also holds relatively constant the current guaranteed revenue assumption from outsourced parking received through the contract with the current vendor ATL Plus.
29

BUILDING RENTALS AND CONCESSIONS The Building rentals and concessions major revenue category consist of revenue received from cell towers, various parks and recreation rentals, and Corrections revenue from housing of federal inmates.
Major Revenue Category
FY 2020 FY 2021 FY 2022 FY 2023 FY 2024
Building Rentals & Concessions
$4,369,614 $4,433,103 $4,498,422 $4,565,626 $4,634,768
FY 2020-24 Forecast: Revenue from this category is heavily dependent on the availability of City of Atlanta property lease space, commercial development lease space and pricing. This revenue has been extremely negatively impacted by the Federal Government shut down and a change in the City of Atlanta’s policy to discontinue the housing of federal immigration inmates. The downturn in the FY 2020-2024 forecast is reflective of the impact of these recent events. INDIRECT COST RECOVERY The City allocates a portion of general services costs such as purchasing, accounting, budgeting, personnel administration, and certain other indirect costs based on allocation methodology determined by an independent cost allocation plan.
Major Revenue Category
FY 2020 FY 2021 FY 2022 FY 2023 FY 2024
Indirect Cost Recovery
$30,000,000 $30,660,000 $31,334,520 $32,023,879 $32,728,405
FY 2020-24 Forecast: The projection is based on historical trends and the City’s cost allocation plan.
30

HOTEL/MOTEL TAX The hotel/motel tax is shared between the City, Atlanta Conventions & Visitors Bureau, Georgia World Congress, and the Mercedes Benz Stadium project. The total below represents the City’s allocated share of the hotel/motel tax which is 24.99%, with the remaining 75.01% distributed by the City to the aforementioned entities. This tax is collected on the 20th day of every month by the City. The Hotel Motel Tax rate is 8.0% on rent for occupancy of a guestroom in a hotel in the City.
Major Revenue Category
FY 2020 FY 2021 FY 2022 FY 2023 FY 2024
Hotel/Motel Tax $21,800,045 $21,821,413 $21,842,802 $21,864,213 $21,885,645
FY 2020-24 Forecast: Revenues in this category are projected to be relatively stable and have a nominal average annual growth rate of less than 0.5% over the five-year forecast horizon. This is in line with projected occupancy levels by CBRE Consulting / Hospitality Research over the next couple of years of 0.5% or less. CBRE Consulting / Hospitality Research (CBRE-HR) is the industry leader in hospitality research econometrics. Its data is one of the primary resources used in developing the City’s hotel/motel forecast. CBRE manages an extensive database of hotel property income statements and sale prices. Occupancy Rates, Average Daily Room Rates, and Rev-Par Index (defined as Revenue Per Available Room) are all key metrics used in developing the forecast.
PILOT AND FRANCHISE FEES (WATERSHED) This major revenue category consists of Watershed Pilot and franchise fee revenues derived from a 5% franchise fee levied on gross water and sewer revenues on all active accounts and a city mill rate levied on Department of Watershed real property.
Major Revenue Category
FY 2020 FY 2021 FY 2022 FY 2023 FY 2024
Pilot & Franchise Fees
$20,677,178 $20,872,918 $21,070,510 $21,269,973 $21,471,324
FY 2020-24 Forecast: This forecast is based on historical trends in revenues received from a Department of Watershed computation derived from the gross revenue and capital assets of the Department of Watershed Management.
31

OVERALL GENERAL FUND FORECAST
Revenue Category
FY 2020 FY 2021 FY 2022 FY 2023 FY 2024
General Fund $673,317,462 $688,696,189 $706,729,121 $725,116,649 $744,773,499
The growth seen in the local economy over the last five years is expected to slow and be driven primarily by growth in the real estate market. The Selig report indicates that, “Business development, a revival of population growth – due to an upturn in domestic migration – and the housing recovery will strongly underpin Atlanta’s robust economic expansion. In 2019, new jobs will be plentiful, but the pace of job growth will slow. The slowdown mostly reflects the tighter labor market as well as strains on infrastructure.”
The estimated average annual growth rate for General Fund Revenue is 3.0% over the five-year forecast horizon. This is supported by the Selig report which estimates the Atlanta Gross Metro Product at -2.0% in 2020. As mentioned previously, much of the growth in the General Fund five-year forecast is driven by estimated property tax revenue growth resulting from rising property values from new construction within the city limits. The forecast reflects a conservative posture due to the uncertainty and volatility surrounding the general direction of the global, domestic, and local economies. An analysis of historical General fund revenues revealed that recurring or normal revenues over the last five years have grown at an average annual growth rate of approximately 4.0%.
The Fiscal Year 2020-24 General Fund revenue forecast assumes 3.0% new construction property tax digest growth and rollback of the current millage rate of 7.85 mills. The MuniCast financial model, the Selig Center and GSU economic reports have enabled the City team to better understand and respond to the changing economic conditions and underlying economic drivers of City revenues. All city revenues will be closely monitored by the City Finance team as we approach the ensuing fiscal years.
32

PROJECTED REVENUE BY MAJOR CATEGORYEmergency Telephone System
FY18 FY19 FY20 FY21 FY22 FY23 FY24Actual Adopted Projected Projected Projected Projected Projected
Taxes 105,974 - 42,147 42,147 42,147 42,147 42,147
Charges For Services 19,493,753 19,986,175 20,058,235 20,131,127 20,204,860 20,279,444 20,354,889
Revenues $19,599,727 $19,986,175 $20,100,382 $20,173,274 $20,247,007 $20,321,591 $20,397,036
33

EMERGENCY TELEPHONE SYSTEM FUND The E-911 Fund supports the E-911 call center operation.
Major Revenue Category
FY 2020 FY 2021 FY 2022 FY 2023 FY 2024
E-911 Revenue $20,100,382 $20,173,274 $20,247,007 $20,321,591
$20,397,036
FY 2020-24 Forecast: The City’s E-911 revenue forecast correlates to per capita and telecommunication subscriber trends. In the past, this fund has operated in a deficit position annually due to insufficient landline and wireless fees to cover operating expenses. In May of 2017 the City approved an increase to the Public Safety Access Assessment from $26 for residential to $34 and from $307 for commercial to $397 to cover increases in operating expenses. In May of 2018 the Georgia General Assembly passed HB 751 which increased the pre-paid wireless charge from $0.75 to $1.50.
34

PROJECTED REVENUE BY MAJOR CATEGORYHotel/Motel Tax Fund
FY18 FY19 FY20 FY21 FY22 FY23 FY24Actual Adopted Projected Projected Projected Projected Projected
Taxes 78,403,629 76,635,386 76,712,025 76,788,737 76,865,526 76,942,392 77,019,334
Revenues $78,403,629 $76,635,386 $76,712,025 $76,788,737 $76,865,526 $76,942,392 $77,019,334
35

HOTEL/MOTEL TAX FUND The Hotel/Motel Tax Fund revenue is derived from an 8% rate on rent for occupancy of a guestroom in a hotel in the City. The tax is shared between the City, Atlanta Conventions & Visitors Bureau, Georgia World Congress Center, and the Mercedes Benz Stadium project. The City’s allocated share of the hotel/motel tax is 24.99%, with the remaining 75.01% distributed by the City to the aforementioned parties.
Major Revenue Category
FY 2020 FY 2021 FY 2022 FY 2023 FY 2024
Hotel/Motel Tax
$ 76,712,025 $ 76,788,737 $ 76,865,526 $ 76,942,392 $ 77,019,334
FY 2020-24 Forecast: Revenues in this category are projected to be relatively stable and have a nominal average annual growth rate of less than 0.5% over the forecast horizon. This is in line with projected occupancy levels by CBRE Consulting / Hospitality Research over next couple of years of 0.5% or less. CBRE Consulting / Hospitality Research (CBRE-HR) is the industry leader in hospitality research econometrics. Its data is one of the primary resources used in developing the City’s hotel/motel forecast. CBRE manages an extensive database of hotel property income statements and sale prices. Occupancy Rates, Average Daily Room Rates, and Rev-Par Index (defined as Revenue Per Available Room) are all key metrics used in developing the forecast.
36

PROJECTED REVENUE BY MAJOR CATEGORYRental/Motor Vehicle Tax Fund
FY18 FY19 FY20 FY21 FY22 FY23 FY24Actual Adopted Projected Projected Projected Projected Projected
Taxes 1,414,467 1,379,138 1,380,516 1,381,897 1,383,279 1,384,662 1,386,046
Revenues $1,414,467 $1,379,138 $1,380,516 $1,381,897 $1,383,279 $1,384,662 $1,386,046
37

RENTAL/MOTOR VEHICLE TAX FUND The Rental/Motor Vehicle Fund contains revenue from transactions associated with a 3.0% excise tax levied on Car Rental Facilities within the City corporate limits. This Fund operates as a pass through fund with all of the revenues remitted to a Bank Trustee for debt service payments pursuant to the trust indenture.
Major Revenue
Category FY 2020 FY 2021 FY 2022 FY 2023 FY 2024
Rental/Motor Vehicle Tax $1,380,516 $1,381,897 $1,383,279 $1,384,662 $1,386,046
FY 2020-24 Forecast: The Car Rental Tax Fund revenues correlate with travel and tourism activity. The Atlanta hospitality industry forecast indicates sustained visitor activity, which has been factored into the modest forecast trend for the fund.
38

PROJECTED REVENUE BY MAJOR CATEGORYWater & Wastewater Revenue Fund
FY18 FY19 FY20 FY21 FY22 FY23 FY24Actual Adopted Projected Projected Projected Projected Projected
Water and Sewer Service Revenues 462,302,142 459,973,640 474,766,290 476,679,634 478,603,079 492,642,103 502,986,362
Charges for Services (471,750) 19,905,000 24,012,244 24,070,095 24,128,153 24,186,419 24,244,896
Intergovernmental Revenues 145,243,543 87,500,000 87,500,000 87,500,000 87,500,000 87,500,000 87,500,000
Investment Income 830,759 455,000 455,000 455,000 455,000 455,000 455,000
Other Financing Sources 2,708,629 2,500,000 2,500,000 2,500,000 2,500,000 2,500,000 2,500,000
Miscellaneous Revenues 79,296 120,000 120,000 120,000 120,000 120,000 120,000
Total $610,692,619 $570,453,640 $589,353,534 $591,324,729 $593,306,232 $607,403,522 $617,806,258
39

WATERANDWASTEWATERFUNDTheWater andWastewaterFundwas established to account for all transactions associatedwiththeoperation,development,andmaintenanceoftheCity'sexpansivewaterandwastewaterinfrastructuresystem.The system is financedbyusercharges forwaterandwastewaterservicesandtheMunicipalOptionSalesTax.WATERANDSEWERSERVICEREVENUEThiscategoryincludesWaterandWastewaterServiceCharges. Projectedrevenueof$474.8MforFY2020 is $22.6M higher than the FY 2019 Budget of $452.1M.The increase is due primarily to anexpectedincreaseinanticipatedcustomerconsumptionandincreaseinnumberofactiveaccounts.TheDepartmentdoesnotplantoincreaseitswaterandsewerratesinFY2020.
MajorRevenueCategory FY2020 FY2021 FY2022 FY2023 FY2024
Water and Sewer Service
Revenue
$474,766,290
$476,679,634
$478,603,079
$492,642,103
$502,986,362
CHARGESFORSERVICESThiscategory includes Inter‐jurisdictional revenue, industrialwaste, inspectionsandreviews,aswellas other selected revenue accounts. The FY 2020 projection of $24.0M is inlinewith theFY2019Budget of$24.2M.
MajorRevenueCategory FY2020 FY2021 FY2022 FY2023 FY2024
ChargesforServices $24,012,244 $24,070,095 $24,128,153 $24,186,419 $24,244,896
INTERGOVERNMENTALREVENUESThe FY 2019 anticipated revenues from the Municipal Option Sales Tax are $125M, which isconsistentwiththeamountanticipatedinFY2017. ForFY18$87.5MofthetotalwillbeallocatedintheWaterandWastewaterRevenueFundand$37.5MintheWater&WastewaterRenewal&ExtensionFund.The Municipal Option Sales Tax (MOST) was established under authorizing legislation by theStateandwasinitiallyplacedineffectforafour‐yeartermbeginningonOctober1,2004.InMarch2008andagaininMarch2012,respectively,CityofAtlantavoterselectedtorenewtheMOSTforanadditionalfour‐yearterm.
40

MajorRevenueCategory FY2020 FY2021 FY2022 FY2023 FY2024
Intergovernmental Revenue
$87,500,000 $87,500,000 $87,500,000
$87,500,000 $87,500,000
INVESTMENTINCOMEThiscategoryisforinterestearnedasaresultoftheDepartment'sFundequityintheCashPool.TheDepartmentdoesearninterestonitsFund5051equityintheInvestmentinCashPoolandasaresultoftheCashPoolMOU.
MajorRevenueCategory FY2020 FY2021 FY2022 FY2023 FY2024
InvestmentIncome
$455,000
$455,000 $455,000 $455,000
$455,000
OTHERFINANCINGSOURCESThis category includes the administrative fee charged to Fulton County for collecting the County’ssewer payments. Per Article IX Section 9.0 of the agreement, the County agrees to pay the City amonthlyfeecalculatedat8%ofthetotalCountymonthlycollections.TheFY2020feeof$2.5MisinlinewiththeFY2019amount.
MajorRevenueCategory FY2020 FY2021 FY2022 FY2023 FY2024
OtherFinancingSources $2,500,000 $2,500,000 $2,500,000 $2,500,000 $2,500,000
MISCELLANEOUSREVENUESThiscategoryincludesrevenueforrecoveriesofprioryeardelinquentaccounts/arrearagesandfeesforlandrentals.TheDepartmentbaseditsestimateonrevenuesgeneratedinpriorfiscalyears.
MajorRevenueCategory FY2020 FY2021 FY2022 FY2023 FY2024
MiscellaneousRevenues
$120,000 $120,000 $120,000
$120,000 $120,000
41

OVERALLWATER&WASTEWATERREVENUEFUNDFORECAST
MajorRevenueCategory FY2020 FY2021 FY2022 FY2023 FY2024
Water&WastewaterRevenueFund $589,353,534 $591,324,729 $593,306,232 $607,403,522 $617,806,258
42

PROJECTED REVENUE BY MAJOR CATEGORYSolid Waste Services Revenue Fund
FY18 FY19 FY20 FY21 FY22 FY23 FY24Actual Adopted Projected Projected Projected Projected Projected
Taxes 3,167,522 - 455,987 455,988 455,989 455,990 455,991
Intergovernmental Revenues 3,000 - - - - - -
Charges For Services 51,157,382 51,717,571 60,734,455 60,794,631 60,854,865 60,915,160 60,975,515
Investment Income (86) - 2,293 2,294 2,295 2,296 2,297
Other Financing Sources 1,590,000 - - - - - -
Revenues $55,917,819 $51,717,571 $61,192,735 $61,252,912 $61,313,149 $61,373,446 $61,433,803
43

SOLIDWASTESERVICESREVENUEFUNDThe Solid Waste Services Revenue Fund supports the operation of sanitary services activities,including collection and disposal of solid waste, recycling, yard waste and bulk rubbish, streetsweeping, de‐littering, debris removal, right‐of‐way‐cutting, dead animal removal, education, andenforcement. It also includes land post‐closure management and city‐wide emergency responseoperations.Revenueisgeneratedfromuserfeesorchargesfortheaforementionedservices.
MajorRevenueCategory
FY2020 FY2021 FY2022 FY2023 FY2024
SolidWasteServicesRevenue
$61,192,735
$61,252,912 $61,313,149 $61,373,446 $61,433,803
FY2020‐24Forecast:SolidWasteFundrevenuesareprimarilycomprisedofuserfeestocoverthecostofoperations.Afeeincreaseof approximately20%was approved inFY2019andwill be effective in theFY2020billingcycletofundequipmentpurchases.
44

PROJECTED REVENUE BY MAJOR CATEGORYAirport Revenue Fund
FY18 FY19 FY20 FY21 FY22 FY23 FY24Actual Adopted Projected Projected Projected Projected Projected
Aeronautical Revenues
Landing Fees 34,413,505 36,490,739 51,503,999 55,499,984 60,565,072 67,930,245 71,669,817Central Passenger Terminal Complex Rentals 214,486,891 248,888,430 238,194,398 302,723,704 303,819,296 333,337,982 355,534,904Airside Rentals 31,477,872 31,011,543 28,709,996 28,756,919 29,030,925 28,873,475 28,697,898Sup-Total Aeronautical Revenues 280,378,269 316,390,712 318,408,394 386,980,607 393,415,294 430,141,702 455,902,618
Non-Aeronautical RevenuesLandside Rentals 8,475,309 10,066,932 9,545,421 9,581,839 9,768,804 9,817,004 9,972,026Public Parking 147,609,046 145,376,736 146,125,135 134,936,523 136,866,621 137,664,220 155,375,251Concessions 115,989,917 120,355,456 124,394,711 128,103,126 131,953,434 135,950,811 141,278,640Concession Credits (108,254,922) (121,043,037) (125,942,644) (129,088,925) (94,869,556) (97,310,230) (100,422,189)Car Rental 42,010,127 40,760,176 43,175,371 44,064,754 44,967,043 46,818,777 48,741,000Other Commercial Revenues 9,267,130 8,566,217 8,130,661 8,195,769 8,262,830 8,331,902 8,403,048Ground Transportation 9,950,502 9,599,947 11,745,088 12,791,538 13,974,070 14,125,747 14,277,424Cost Recoveries: Non Airlines 22,834,305 11,933,255 14,745,894 15,356,785 15,991,058 16,649,567 17,333,195Sup-Total Non-Aeronautical Revenues $247,881,414 $225,615,682 $231,919,636 $223,941,409 $266,914,305 $272,047,798 $294,958,395
Total Projected Revenues $528,259,683 $542,006,394 $550,328,029 $610,922,016 $660,329,598 $702,189,500 $750,861,013
45

AVIATION REVENUE FUND The Department of Aviation was established to operate and maintain Hartsfield-Jackson Atlanta International Airport (ATL). Its mission is to provide the Atlanta region a safe, secure and cost-competitive gateway to the world that drives economic development and operates with the highest level of customer service and efficiency, while exercising fiscal and environmental responsibility. The Department classifies its revenues into two general categories: Aeronautical and Non-Aeronautical.
Aeronautical
Landing Fees The Department of Aviation collects landing fees from our signatory and non-signatory carriers. These fees are intended to recover the cost of operating and maintaining the airfield; including all capital improvement projects, debt service and debt service coverage.
Major Revenue Category
FY 2020 FY 2021 FY 2022 FY 2023 FY 2024
Landing Fees $51,503,999 $55,499,984 $60,565,072 $67,930,245 $71,669,817
FY2020-24 Forecast: Landing Fees are expected to increase, primarily due to the anticipated issuance of General Aviation Revenue Bonds (GARB) in the later part of FY19. Direct operating expenses will increase over the next five years due to inflation; landed weight will also increase due to an increase in passenger traffic. Central Passenger Terminal Complex (CPTC) Rentals The Department of Aviation charges each of its tenants rent for space occupied within the Central Passenger Terminal Complex (CPTC). These rents are intended to recover cost associated with the safety and security of the facilities, capital cost associated with the construction and upgrade of the CPTC's, as well as the debt service requirement and coverage.
Major Revenue Category
FY 2020 FY 2021 FY 2022 FY 2023 FY 2024
CPTC Rentals $238,194,398 $302,723,704 $303,819,296 $333,337,982 $355,534,904
FY2020-24 Forecast: These rents are expected to increase over the next five years, due to the anticipated issuance of General Airport Revenue Bonds (GARB) in the later part of FY19. These additional funds will be used for major capital improvement projects throughout the facility.
46

Airside Rentals Airside rentals are rental revenue collected for space occupied by the Airport's numerous airline and airline-support tenants.
Major Revenue Category
FY 2020 FY 2021 FY 2022 FY 2023 FY 2024
Airside Rentals $28,709,996 $28,756,919 $29,030,925 $28,873,475 $28,697,898
FY2020-24 Forecast: Minimal growth is expected from this revenue stream. Several leases will be escalated by 3%, in FY20, new appraisals will be obtained, and the rates will be recalculated.
Non-Aeronautical
Landside Rentals Landside rentals are revenues collected for space occupied in any of the Airport's off-airfield or landside properties.
Major Revenue Category
FY 2020 FY 2021 FY 2022 FY 2023 FY 2024
Landside Rentals $9,545,421 $9,581,839 $9,768,804 $9,817,004 $9,972,026
FY2020-24 Forecast: The current projections reflect no substantive growth. The base rent for some leases will experience standard escalations based on the lease agreement; however, this will have minimal impact on revenues. Public Parking These are revenues generated from the Airport’s parking facilities. The Airport provides various parking options including covered, park and ride at both the international and domestic terminals. A third-party vendor is responsible for the day-to-day management of these facilities.
Major Revenue Category
FY 2020 FY 2021 FY 2022 FY 2023 FY 2024
Public Parking $146,125,135 $134,936,523 $136,866,621 $137,664,220 $155,375,251
47

FY2020-24 Forecast: This revenue stream will increase slightly in FY20 but remain flat over the next several years. This is due to the deconstruction of the Southside Parking Deck, which will decrease capacity. The opening of the ATL Select Park & Ride is expected to offset some of the lost revenues. Efforts will be made to maximize the use of available capacity, and mitigate the impact of any potential loss... Concessions These revenues are collected from the Airport's various food & beverage, retail, service, duty-free, and advertising outlets.
Major Revenue Category
FY 2020 FY 2021 FY 2022 FY 2023 FY 2024
Inside Concessions
$124,394,711 $128,103,126 $131,953,434 $135,950,811 $141,278,640
FY2020-24 Forecast: Concessions revenue will continue to increase over the next five years. The projected increase in enplanements and concessionaires’ gross revenues will have a positive impact on concessions revenues. Concession Credits Seventy percent of all concessions revenues is shared with the contracting airlines and $0.60 per enplaned passengers. Additionally, the Airport’s portion of certain operational costs are reflected in this account.
Major Revenue Category
FY 2020 FY 2021 FY 2022 FY 2023 FY 2024
Airline Credits ($125,942,644) ($129,088,925) ($94,869,556) ($97,310,230) ($100,422,189)
FY2020-24 Forecast: These credits will reflect changes in direct correlation to Concessions and Enplaned Passengers. As Concessions revenue and traffic increase, so will the Concession credits. Rental Car The Airport maintains a consolidated rental car center (RCC) which houses 12 rental car companies and 8,700 parking spaces. Each of the rental car companies pays the Department of Aviation 10% of annual gross sales in return for occupying RCC space. The rental car companies are subject to a Minimum Annual Guarantee (MAG), and they reimburse the Airport for utilities.
48

Major Revenue Category
FY 2020 FY 2021 FY 2022 FY 2023 FY 2024
Rental Car $43,175,371 $44,064,754 $44,967,043 $46,818,777 $48,741,000
FY2020-24 Forecast: The Airport is anticipating some growth due to a projected increase in originating/destination passengers. Although, the origination and destination metric are a main driver for this revenue, Transportation Network Companies (TNC) is having an effect on this revenue stream.
Other Commercial Revenues Included in this category are distributed antennae fees collected from our cell phone providers, fees for security badges and security violations, revenue generated from our EMS services and non-recurring revenues.
Major Revenue Category
FY 2020 FY 2021 FY 2022 FY 2023 FY 2024
Other Commercial Revenues
$8,130,661 $8,195,769 $8,262,830 $8,331,902 $8,403,048
FY2020-24 Forecast: This category is expected to increase slightly. We will continue to recover the operating and maintenance cost from the cell phone providers, security charges will increase slightly due to BORN violations and new TSA fingerprinting regulations.
Ground Transportation This category captures revenues related to the Airport's numerous off-airport parking shuttles, limousine services, hotel shuttle services, Transportation Network Companies (TNC) and other ground transportation venues.
Major Revenue Category
FY 2020 FY 2021 FY 2022 FY 2023 FY 2024
Ground Transportation
$11,745,088 $12,791,538 $13,974,070 $14,125,747 $14,277,424
FY2020-24 Forecast: Revenues collected from ground transportation services will increase substantially due to the continued anticipated increase in Transportation Network Transactions (TNCs).
49

Cost Recoveries: Non-Airline Included in this category are reimbursements received from rental car companies and the Customer Facility Charge Fund for operation and maintenance costs of the RCC. This facility opened in December of 2009. These payments are set such that the Department is reimbursed for 100% of its RCC operating and maintenance expenses.
Major Revenue Category
FY 2020 FY 2021 FY 2022 FY 2023 FY 2024
Cost Recoveries: Non-Airline
$14,745,894 $15,356,785 $15,991,058 $16,649,567 $17,333,195
FY2020-24 Forecast: We continue to experience an increase in utilities, especially water and sewer, which is provided by the City of College Park. In addition, the facilities are now several years old and in need of periodic maintenance. These increases in cost translate to additional revenue since utilities and the maintenance are 100% reimbursable. Also, there will be some security improvement projects commencing in FY20; most of this cost will be recoverable as well.
OVERALL AVIATION REVENUE FUND FORECAST
Revenue Category
FY 2020 FY 2021 FY 2022 FY 2023 FY 2024
Aviation Operating
Revenue Fund $550,328,029 $610,922,016 $660,329,598 $702,189,500 $750,861,013
50
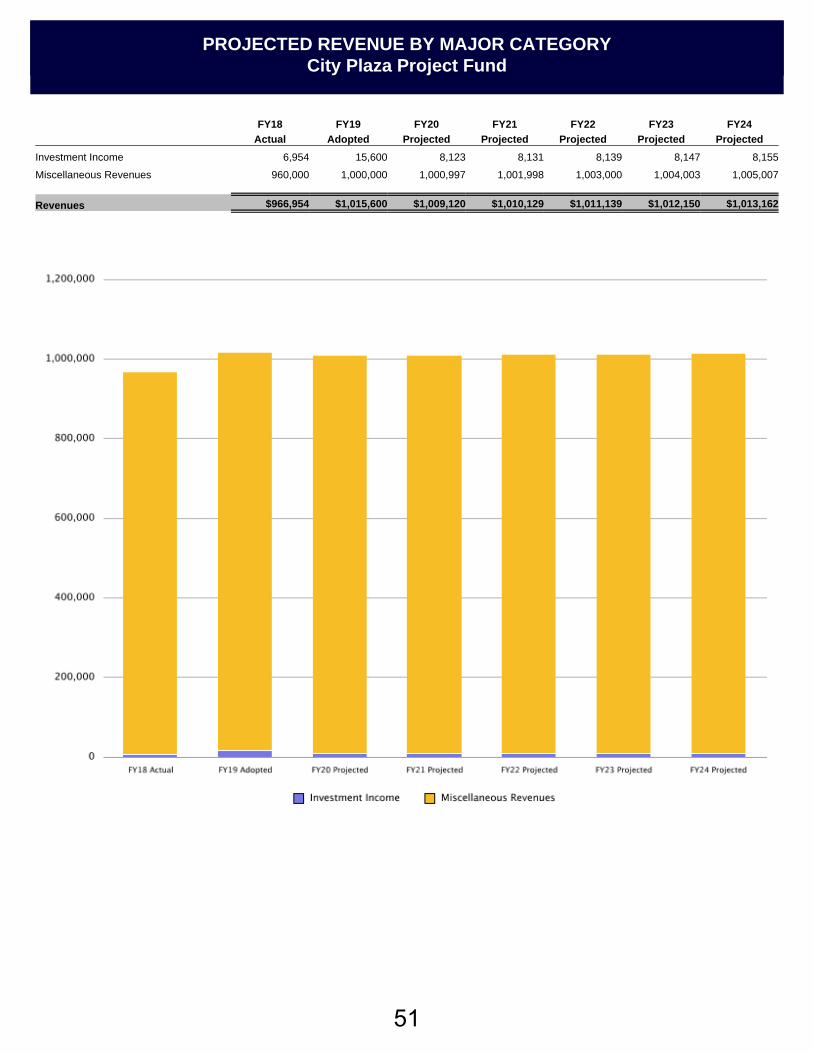
PROJECTED REVENUE BY MAJOR CATEGORYCity Plaza Project Fund
FY18 FY19 FY20 FY21 FY22 FY23 FY24Actual Adopted Projected Projected Projected Projected Projected
Investment Income 6,954 15,600 8,123 8,131 8,139 8,147 8,155
Miscellaneous Revenues 960,000 1,000,000 1,000,997 1,001,998 1,003,000 1,004,003 1,005,007
Revenues $966,954 $1,015,600 $1,009,120 $1,010,129 $1,011,139 $1,012,150 $1,013,162
51

CITYPLAZAOPERATINGFUND
TheCity PlazaOperating Fundwas established to track the revenues, expenses andbondproceedsincurredfromtheoperationoftheCityPlazaProject.Revenuesforthefundarederivedfromrentsfromresidents,tenants,andparkingfees.
MajorRevenueCategory FY2020 FY2021 FY2022 FY2023 FY2024
CityPlazaOperatingFund $1,009,120 $1,010,129 $1,011,139 $1,012,150 $1,013,162
FY2020‐24Forecast:TheCityPlazaOperatingFundincomeforecastisprimarilystableandisbasedonhistoricalrentsfromresidents,tenants,andparkingfees.
52

PROJECTED REVENUE BY MAJOR CATEGORYFleet Service Fund
FY18 FY19 FY20 FY21 FY22 FY23 FY24Actual Adopted Projected Projected Projected Projected Projected
Charges For Services 32,433,539 33,400,588 33,433,987 33,467,421 33,500,888 33,534,389 33,567,923
Miscellaneous Revenues 87,071 - 54,859 54,914 54,969 55,024 55,079
Revenues $32,520,611 $33,400,588 $33,488,846 $33,522,335 $33,555,857 $33,589,413 $33,623,002
53

FLEETSERVICESFUNDTheFleet ServicesFundwas established for accounting for theoperations andmaintenanceof theCityofAtlanta'sfleetofvehiclesandmotorizedequipment.TheFleetServicesFundsupportsfuelandmaintenanceservicestoCitydepartments.
MajorRevenueCategory
FY2020 FY2021 FY2022 FY2023 FY2024
FleetServicesRevenue $33,488,846 $33,522,335 $33,555,857 $33,589,413 $33,623,002
FY2020‐24Forecast:TheFleetServicesFund sourceof income isderived fromcharge‐back recovery to theparticipatingCitydepartments.Theforecastisstablewhichcoincideswiththeprojectedtrendinexpenditures.
54

PROJECTED REVENUE BY MAJOR CATEGORYGroup Insurance Fund
FY18 FY19 FY20 FY21 FY22 FY23 FY24Actual Adopted Projected Projected Projected Projected Projected
Charges For Services 143,270,429 153,396,292 150,433,941 154,946,959 159,595,368 164,383,229 169,314,726
Investment Income (39) 124,458 - - - - -
Miscellaneous Revenues 28,445 - - - - - -
Other Financing Sources (1,837) - - - - - -
Revenues $143,296,998 $153,520,750 $150,433,941 $154,946,959 $159,595,368 $164,383,229 $169,314,726
55

GROUPINSURANCEFUNDTheGroupInsuranceFundwasestablishedtoprovidequalityaffordableandaccessiblehealthcarebenefits in the most cost‐efficient manner while maintaining financial accountability for ourstakeholders.ThisfundcoversafullyinsuredHMO,self‐fundedPOS,andMedicareAdvantageplansforemployees,retireesanddependents.Thefund’srevenuevaluationisalsodrivenbyrateincreasesandactualutilization.
MajorRevenueCategory
FY2020 FY2021 FY2022 FY2023 FY2024
GroupInsurance
$150,433,941 $154,946,959 $159,595,368 $164,383,229 $169,314,726
FY2020‐24Forecast:TheGroupInsuranceFundsourceofincomeisderivedfromcitycontributionsof70percentofoverallhealthcarecost,aswellasemployeepayrolldeductionsandretireepensioncontributions.
56

EXPENDITURE
OVERVIEW AND
PROJECTIONS
EXPENDITURE AND FORECAST SUMMARY
FUND AND DEPARTMENTAL PROJECTIONS
FIVE YEAR PLAN
57

58

As mandated in Ordinance 09‐O‐1406, expenditures in the five‐year plan become the current services budget, which then serves as the baseline for the subsequent years. This year’s five-year plan considers contractual obligations, legislative mandates, and high priority funding needs. Listed below are the five year plan assumptions. All rates will be revisited during FY2020 budget development after receiving more up‐to‐date information. It is important to note that the five year plan funds current operating service levels based on FY2019 actual expenses through December and budget for the months of January to June. Personnel services are based on FY2019 actual expenses though December and assumes the same level of performance for the months of January to June. • Healthcare contribution increased citywide from the FY2019 Adopted budget amount of $66.1M
to $66.3M and increases by 3% each year thereafter.
• Citywide, the pension rates were adjusted for all Defined Benefit Plans to account for the Actuarially Determined Contribution (ADC).
Plan FY18 ADC FY19 ADC FY20 ADC YOY INCR Defined Benefit (General) $46.3M $42.9M $51.8M $8.9M Defined Benefit (Police) $30.8M $30.9M $35.0M $4.1M Defined Benefit (Fire) $22.5M $20.5M $22.0M
M $1.5M
Total $99.6M $94.3M $108.8M $14.5M M
• Citywide, the workers’ compensation requirement is projected to remain constant in FY2020, and thereafter trending downward for FY2021-FY2024. The City will continue its effort in safety programs and other citywide initiatives and monitor the impact on the number of projected workers’ compensation claims.
• Utilities (natural gas and electricity) are projected to remain constant for FY2020-FY2024; however, the City will continually monitor and communicate with the vendors to identify and plan for potential increases or capitalize on any rate reductions. Traffic signals and street lights budgets are projected to remain unchanged.
• Water and Sewer forecast is projected to remain constant for FY2020-FY2022 as the current rates have been deemed sufficient to support operations and capital needs. There are planned increases of 3% in FY2023 and 2% in FY2024 in anticipation of possible system requirements.
• Fuel and maintenance projections are based on FY2018 utilization. Fuel is projected to remain constant over the next five years. Repairs and maintenance is anticipated to increase approximately 2% for fiscal years 2021 to 2024. The Department will continue to work to determine how it can gain efficiencies through fleet replacement and quantity reductions.
EXPENDITURE ASSUMPTIONS AND FORECAST
59

TOTAL OPERATING FUNDS EXPENDITURE PROJECTION
The charts below depict the total operating and general fund budgets, which includes the assumptions previously listed. The five-year plan includes funding to address the City’s infrastructure, living wage increases, Pension, Worker’s Compensation Claims, Employee Health and Other Post-Employment Benefits (OPEB), sinking fund requirements, citywide fund reserves, and debt service related to various citywide projects.
TOTAL EXPENDITURE PROJECTION GRAPHOperating
FY15 FY16 FY17 FY18 FY19 FY20 FY21 FY22 FY23 FY24Actual Actual Actual Actual Adopted Projection Projection Projection Projection Projection
$2,003.5M $2,082.0M $2,146.3M $2,190.3M $2,111.5M $2,194.5M $2,275.2M $2,343.8M $2,417.6M $2,493.8M
60

TOTAL EXPENDITURE PROJECTION GRAPHGeneral Fund
FY15 FY16 FY17 FY18 FY19 FY20 FY21 FY22 FY23 FY24Actual Actual Actual Actual Adopted Projection Projection Projection Projection Projection
$582.2M $615.4M $669.8M $707.0M $661.4M $710.5M $723.9M $736.2M $749.0M $760.9M
61

GENERAL FUND FY2020 BASELINE EXPENDITURE PROJECTION
BY MAJOR DEPARTMENTAL CATEGORY
Sixty-five percent or 64.55% of the general fund costs are attributable to Public Safety and Non‐
Departmental, which includes debt service and other required obligations that must be funded
irrespective of the number of staff employed. All other activities of City government such as public
works, parks, code enforcement, planning, technology, and the support departments are funded with
the remaining 35.44%.
Sixty-three percent or 62.76% of the general fund budget is comprised of Personnel expenses, of which
Police Services is 41% and Fire & Rescue Services is 18% of the total. In addition to salaries, a large
portion of the personnel expenses is health insurance as well as the Defined Benefit pension plan and
other benefits paid by the City on behalf of the employees. The Defined Benefit pension plan was
overhauled during the FY2012 budget adoption for general, sworn police and firefighter employees to
address the growing pension crisis that had impacted the City’s fiscal stability.
62
FUND AND DEPARTMENTAL PROJECTIONS
Although the Five-Year Plan requires five‐year projections for the general fund only, fund‐wide projections have been included for the following operating funds: GENERAL FUND
ENTERPRISE AND OTHER FUNDS
Emergency 911 Fund
Hotel/Motel Tax Fund
Rental/Motor Vehicle Tax Fund (Car Rental)
Water & Wastewater Fund
Solid Waste Fund
Aviation Revenue Fund
City Plaza Fund
Fleet Services Fund
Group Insurance Fund
63

64

Fiscal Years FY20 - FY24__________________________________________________________________________________________________________________________________________________________________________________________________
General Fund - Five Year Plan by Major Account Group
FY18 FY19 FY20 FY21 FY22 FY23 FY24Total
Plan YearsProjected Revenues Actual Adopted
Property Taxes $206,522,773 $208,451,068 $218,499,154 $224,164,795 $229,791,368 $235,004,999 $240,634,397 $1,148,094,712
Public Utility, Alcoholic Beverage and Other $106,442,797 $106,923,683 $107,712,019 $111,966,359 $116,659,508 $121,855,681 $127,630,290 $585,823,857
Local Option Sales Taxes $110,183,776 $108,730,000 $115,427,417 $117,787,084 $122,311,414 $127,006,627 $131,879,178 $614,411,721
Licenses and Permits Revenue $117,251,072 $118,275,544 $121,770,548 $123,758,629 $125,801,552 $127,900,846 $130,058,083 $629,289,659
Other Revenue $26,664,277 $7,332,494 $6,287,573 $6,322,138 $6,357,236 $6,392,955 $6,429,408 $31,789,311
Charges For Current Services $6,884,755 $4,582,826 $4,562,206 $4,680,665 $4,815,277 $4,967,856 $5,140,474 $24,166,477
Federal Revenues $348,370 $0 $0 $0 $0 $0 $0 $0
State and Local Governments $354,711 $0 $0 $0 $0 $0 $0 $0
Fines, Forfeitures and Penalties $20,629,181 $23,472,056 $22,211,707 $22,229,084 $22,246,512 $22,263,993 $22,281,525 $111,232,821
Building Rentals and Concessions $13,864,504 $13,990,662 $4,369,614 $4,433,103 $4,498,422 $4,565,626 $4,634,768 $22,501,534
Indirect Costs Recovery $36,209,060 $30,000,000 $30,000,000 $30,660,000 $31,334,520 $32,023,879 $32,728,405 $156,746,804
Hotel & Motel Tax Revenue $19,593,067 $19,151,183 $21,800,045 $21,821,413 $21,842,802 $21,864,213 $21,885,645 $109,214,120
Pilot & Franchise Fees $20,483,276 $20,483,276 $20,677,178 $20,872,918 $21,070,510 $21,269,973 $21,471,324 $105,361,903Total Projected Revenues $685,431,620 $661,392,792 $673,317,462 $688,696,189 $706,729,121 $725,116,649 $744,773,499 $3,538,632,920
Projected Expenses
Personnel Services And Employee Benefits $428,200,794 $414,119,019 $445,883,409 $457,379,279 $468,803,531 $476,907,867 $487,414,684 $2,336,388,771
Purchased / Contracted Services $113,361,694 $105,838,106 $117,317,550 $117,662,240 $120,369,234 $121,071,995 $125,006,490 $601,427,509
Supplies $43,705,763 $38,786,044 $39,739,450 $39,845,116 $39,845,902 $40,106,928 $40,281,302 $199,818,697
Capital Outlays $1,145,961 $1,001,075 $2,235,546 $2,235,546 $2,300,721 $2,369,806 $2,443,036 $11,584,654
Interfund / Interdepartmental Charges $15,113,183 $15,165,321 $15,112,787 $15,399,879 $15,405,331 $15,410,891 $15,416,555 $76,745,444
Other Costs $39,024,214 $35,836,830 $37,572,319 $39,875,630 $37,497,061 $37,461,075 $37,427,941 $189,834,026
Debt Service $11,168,029 $9,826,876 $27,511,801 $27,532,922 $27,608,641 $29,861,218 $28,442,634 $140,957,217
Conversion / Summary - $4,650,754 $16,832,937 $17,217,405 $17,668,228 $18,127,916 $18,619,337 $88,465,823
Other Financing Uses $55,326,651 $36,168,768 $8,282,758 $6,714,041 $6,688,697 $7,648,857 $5,850,022 $35,184,377
Total Projected Expenses $707,046,288 $661,392,792 $710,488,556 $723,862,058 $736,187,347 $748,966,554 $760,902,001 $3,680,406,516
Revenues Over (Under) Expenses (21,614,669) 0 (37,171,094) (35,165,869) (29,458,226) (23,849,904) (16,128,503) (141,773,597)
Variance % (3%) 0% (6%) (5%) (4%) (3%) (2%) (4%)
65
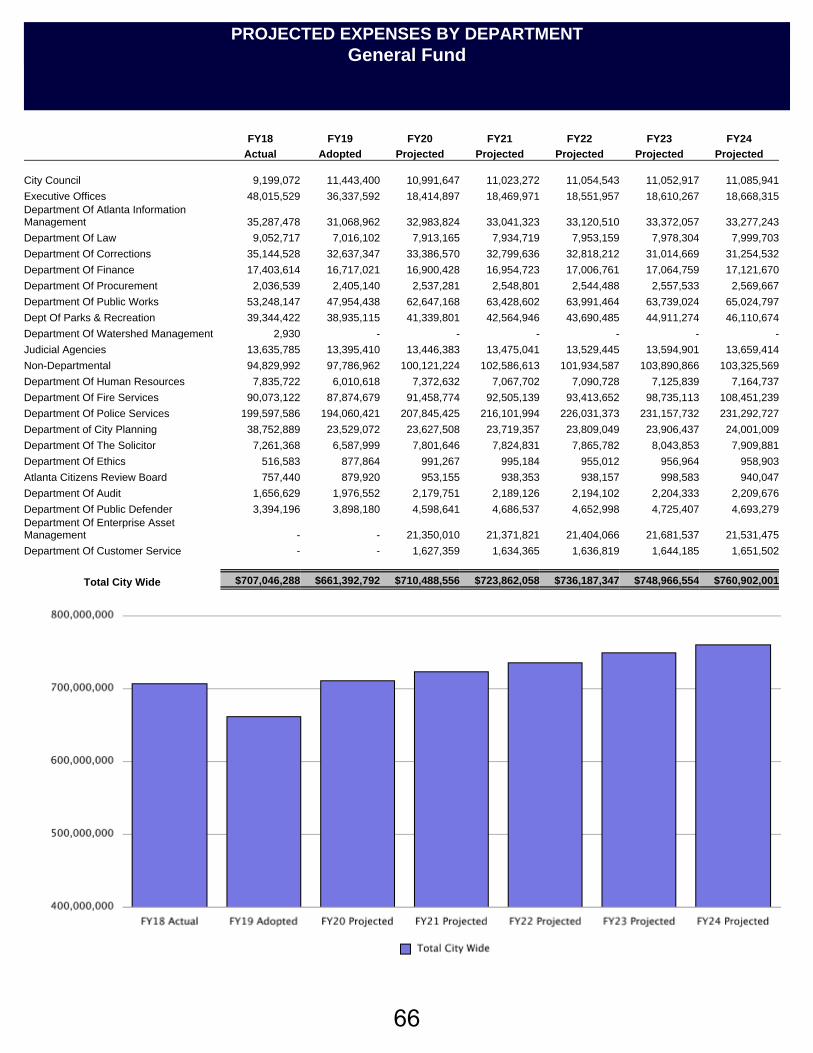
PROJECTED EXPENSES BY DEPARTMENTGeneral Fund
FY18 FY19 FY20 FY21 FY22 FY23 FY24Actual Adopted Projected Projected Projected Projected Projected
City Council 9,199,072 11,443,400 10,991,647 11,023,272 11,054,543 11,052,917 11,085,941
Executive Offices 48,015,529 36,337,592 18,414,897 18,469,971 18,551,957 18,610,267 18,668,315Department Of Atlanta Information Management 35,287,478 31,068,962 32,983,824 33,041,323 33,120,510 33,372,057 33,277,243
Department Of Law 9,052,717 7,016,102 7,913,165 7,934,719 7,953,159 7,978,304 7,999,703
Department Of Corrections 35,144,528 32,637,347 33,386,570 32,799,636 32,818,212 31,014,669 31,254,532
Department Of Finance 17,403,614 16,717,021 16,900,428 16,954,723 17,006,761 17,064,759 17,121,670
Department Of Procurement 2,036,539 2,405,140 2,537,281 2,548,801 2,544,488 2,557,533 2,569,667
Department Of Public Works 53,248,147 47,954,438 62,647,168 63,428,602 63,991,464 63,739,024 65,024,797
Dept Of Parks & Recreation 39,344,422 38,935,115 41,339,801 42,564,946 43,690,485 44,911,274 46,110,674
Department Of Watershed Management 2,930 - - - - - -
Judicial Agencies 13,635,785 13,395,410 13,446,383 13,475,041 13,529,445 13,594,901 13,659,414
Non-Departmental 94,829,992 97,786,962 100,121,224 102,586,613 101,934,587 103,890,866 103,325,569
Department Of Human Resources 7,835,722 6,010,618 7,372,632 7,067,702 7,090,728 7,125,839 7,164,737
Department Of Fire Services 90,073,122 87,874,679 91,458,774 92,505,139 93,413,652 98,735,113 108,451,239
Department Of Police Services 199,597,586 194,060,421 207,845,425 216,101,994 226,031,373 231,157,732 231,292,727
Department of City Planning 38,752,889 23,529,072 23,627,508 23,719,357 23,809,049 23,906,437 24,001,009
Department Of The Solicitor 7,261,368 6,587,999 7,801,646 7,824,831 7,865,782 8,043,853 7,909,881
Department Of Ethics 516,583 877,864 991,267 995,184 955,012 956,964 958,903
Atlanta Citizens Review Board 757,440 879,920 953,155 938,353 938,157 998,583 940,047
Department Of Audit 1,656,629 1,976,552 2,179,751 2,189,126 2,194,102 2,204,333 2,209,676
Department Of Public Defender 3,394,196 3,898,180 4,598,641 4,686,537 4,652,998 4,725,407 4,693,279Department Of Enterprise Asset Management - - 21,350,010 21,371,821 21,404,066 21,681,537 21,531,475
Department Of Customer Service - - 1,627,359 1,634,365 1,636,819 1,644,185 1,651,502
Total City Wide $707,046,288 $661,392,792 $710,488,556 $723,862,058 $736,187,347 $748,966,554 $760,902,001
66

PROJECTED EXPENSES BY MAJOR CATEGORYGeneral Fund
FY18 FY19 FY20 FY21 FY22 FY23 FY24Actual Adopted Projected Projected Projected Projected Projected
Personnel Services And Employee Benefits 428,200,794 414,119,019 445,883,409 457,379,279 468,803,531 476,907,867 487,414,684
Purchased / Contracted Services 113,361,694 105,838,106 117,317,550 117,662,240 120,369,234 121,071,995 125,006,490
Supplies 43,705,763 38,786,044 39,739,450 39,845,116 39,845,902 40,106,928 40,281,302
Capital Outlays 1,145,961 1,001,075 2,235,546 2,235,546 2,300,721 2,369,806 2,443,036
Interfund / Interdepartmental Charges 15,113,183 15,165,321 15,112,787 15,399,879 15,405,331 15,410,891 15,416,555
Other Costs 39,024,214 35,836,830 37,572,319 39,875,630 37,497,061 37,461,075 37,427,941
Debt Service 11,168,029 9,826,876 27,511,801 27,532,922 27,608,641 29,861,218 28,442,634
Conversion / Summary - 4,650,754 16,832,937 17,217,405 17,668,228 18,127,916 18,619,337
Other Financing Uses 55,326,651 36,168,768 8,282,758 6,714,041 6,688,697 7,648,857 5,850,022
Total $707,046,288 $661,392,792 $710,488,556 $723,862,058 $736,187,347 $748,966,554 $760,902,001
67

GENERAL FUND The General Fund is the City’s primary operating fund. It accounts for all financial transactions of the
City, except those required to be accounted for in another fund.
PERSONNEL SERVICES AND EMPLOYEE BENEFITS This major expenditure category accounts for all employer costs related to compensating employees of the City of Atlanta. This includes annual salaries paid to employees occupying authorized positions; including Regular, Permanent Part-Time, Sworn classifications as well as Extra Help and Overtime. Also captured are benefits such as Life, Health Insurance, Pension, Retiree and Medical Contributions as well as Unemployment Insurance and Worker’s Compensation.
Major Expense Category
FY 2020 FY 2021 FY 2022 FY 2023 FY 2024
Personnel Services And Employee
Benefits
$445,883,409 $457,379,279 $468,803,531 $476,907,867 $487,414,684
FY 2020-24 Forecast: Personnel costs for Fiscal Year 2020 reflect the City’s commitment via Ordinance 18-O-1629 to address police compensation through investments of approximately $10M annually from Fiscal Year 2019 to 2022. Also included is the minimum wage increase to $15 per hour, full cost allocations for active employees, and the transition of grant funded positions back to the general fund. More specifically, positions funded through the Fire Department’s Staffing for Adequate Fire and Emergency Response (SAFER) Grant and the Atlanta Police Department’s 2014 Community Oriented Police Services (COPS) Grant. FY2020 Group Health Insurance remained constant with an anticipated increase of 3% from Fiscal Year 2021 – 2024. Pension rates were adjusted for all Defined Benefit Plans to account for the Actuarially Determined Contribution (ADC). As a result, the General Employee, Police and Fire Benefit plans are expected to increase over the forecast period.
PURCHASED/CONTRACTED SERVICES This major expenditure category includes general and technical professional consulting services. Most of these consulting expenditures are contracted services with a small amount contributed to direct vendor disbursements. Also, within this major category are repair and maintenance agreements covering the upkeep of buildings and equipment, operating rental/lease contracts for equipment, vehicles, land and buildings and other expenditures related to advertising, travel and training.
Major Expense Category
FY 2020 FY 2021 FY 2022 FY 2023 FY 2024
Purchased/ Contracted
Services $117,317,550 $117,662,240 $120,369,234 $121,071,995 $125,006,490
68
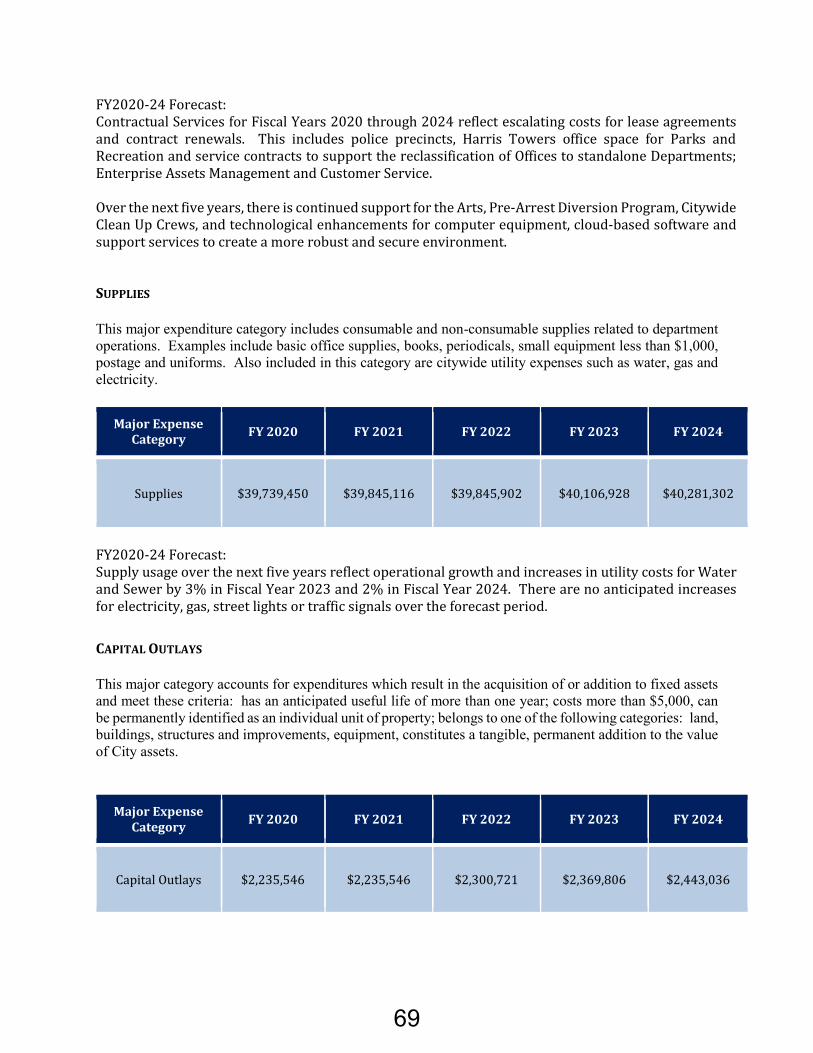
FY2020-24 Forecast: Contractual Services for Fiscal Years 2020 through 2024 reflect escalating costs for lease agreements and contract renewals. This includes police precincts, Harris Towers office space for Parks and Recreation and service contracts to support the reclassification of Offices to standalone Departments; Enterprise Assets Management and Customer Service. Over the next five years, there is continued support for the Arts, Pre-Arrest Diversion Program, Citywide Clean Up Crews, and technological enhancements for computer equipment, cloud-based software and support services to create a more robust and secure environment. SUPPLIES
This major expenditure category includes consumable and non-consumable supplies related to department operations. Examples include basic office supplies, books, periodicals, small equipment less than $1,000, postage and uniforms. Also included in this category are citywide utility expenses such as water, gas and electricity.
Major Expense Category
FY 2020 FY 2021 FY 2022 FY 2023 FY 2024
Supplies $39,739,450 $39,845,116 $39,845,902 $40,106,928 $40,281,302
FY2020-24 Forecast: Supply usage over the next five years reflect operational growth and increases in utility costs for Water and Sewer by 3% in Fiscal Year 2023 and 2% in Fiscal Year 2024. There are no anticipated increases for electricity, gas, street lights or traffic signals over the forecast period.
CAPITAL OUTLAYS
This major category accounts for expenditures which result in the acquisition of or addition to fixed assets and meet these criteria: has an anticipated useful life of more than one year; costs more than $5,000, can be permanently identified as an individual unit of property; belongs to one of the following categories: land, buildings, structures and improvements, equipment, constitutes a tangible, permanent addition to the value of City assets.
Major Expense Category
FY 2020 FY 2021 FY 2022 FY 2023 FY 2024
Capital Outlays $2,235,546 $2,235,546 $2,300,721 $2,369,806 $2,443,036
69

FY2020-24 Forecast: Fiscal Years 2020 through 2024 reflects anticipated increases in cost including legislatively mandated police body cameras and video storage for the Atlanta Police Department. Resolution 16-R-4096 authorized the purchase of 1,200 Police worn cameras to enforce greater transparency from law enforcement agencies. Upon the completion of this procurement, Capital Outlays will continue to trend as anticipated for small equipment purchases that support departmental operations. INTERFUND/ INTERDEPARTMENTAL CHARGES This major category includes city charge back expenditures related to fuel and maintenance for equipment used in the line of city business such as garbage trucks, fire trucks and police cars. Also, included in the category are indirect cost allocated to various departments based on a cost allocation study.
Major Expense Category
FY 2020 FY 2021 FY 2022 FY 2023 FY 2024
Interfund/ Interdepartmental
Charges
$15,112,787 $15,399,879 $15,405,331 $15,410,891 $15,416,555
FY2020-24 Forecast: Fuel and Maintenance projections are based on Fiscal Year 2018 utilization. Fuel is projected to remain constant over the next five years. Repairs and maintenance is anticipated to increase approximately 2% for fiscal years 2021 and maintain that trend through 2024. The Department will continue to work to determine how it can gain efficiencies through fleet replacement and quantity reductions. OTHER COSTS
This major category includes payments to other governmental and local agencies such as Fulton and Dekalb County. Other items in this category include debt and contingency reserves.
Major Expense Category
FY 2020 FY 2021 FY 2022 FY 2023 FY 2024
Other Costs $37,572,319 $39,875,630 $37,497,061 $37,461,075 $37,427,941
FY2020-24 Forecast: Over the next five years, Other Costs include payments to Fulton and Dekalb County (i.e. County taxes and Fire MOU) and Other Post-Employment Benefits (OPEB). These expenses are projected to remain constant with the exception of Fiscal Year 2021. The 6% escalation from Fiscal Year 2020 to 2021 is due to election expenses which are budgeted every four years with expenses incurred in the year prior to the election.
70

DEBT SERVICES Debt Service is a major expenditure that accounts for bond and other debt instruments. It includes principal and interest payments for debts issued.
Major Expense Category
FY 2020 FY 2021 FY 2022 FY 2023 FY 2024
Debt Service $27,511,801 $27,532,922 $27,608,641 $29,861,218 $28,442,634
FY2020-24 Forecast: Over the next five years, the City’s debt obligations will remain constant from Fiscal Year 2020 to 2022. The projected increase in Fiscal Year 2023 is primarily due to bond principal payments related to the 1998 Certificate of Participation (COPS). CONVERSION/ SUMMARY This major category accounts for the City’s budgetary reserve set aside for emergencies and unforeseen expenditures. This account sets aside a percentage of revenues as part of the annual adopted budgeted.
Major Expense Category
FY 2020 FY 2021 FY 2022 FY 2023 FY 2024
Conversion/ Summary
$16,832,937 $17,217,405 $17,668,228 $18,127,916 $18,619,337
FY2020-24 Forecast: The Conversion/Summary expenditure category accounts for Restricted Reserves budgeted in Non-Departmental at 2.5% of anticipated revenues. OTHER FINANCING USES Other Financing Uses are expenditures not accounted for by other major categories. It includes operating transfers out to other funds and sinking fund requirements.
Major Expense Category
FY 2020 FY 2021 FY 2022 FY 2023 FY 2024
Other Financing Uses
$8,282,758 $6,714,041 $6,688,697 $7,648,857 $5,850,022
FY2020-24 Forecast: Scheduled payments for equipment leased through the Georgia Municipal Association, Inc. (GMA) are reflected over the forecast period.
71

72

EXPENDITURES BY MAJOR CATEGORYEmergency Telephone System
FY18 FY19 FY20 FY21 FY22 FY23 FY24Actual Adopted Projected Projected Projected Projected Projected
Personal Services And Employee Benefits 11,444,116 11,671,599 10,237,692 10,297,970 10,353,024 10,416,625 10,478,833
Purchased / Contracted Services 5,302,226 8,168,632 9,385,276 7,972,890 8,019,569 8,030,553 8,043,790
Supplies 95,517 70,416 477,414 1,102,414 1,074,414 1,074,414 1,074,414
Capital Outlays 5,097 5,160 - 800,000 800,000 800,000 800,000
Other Costs 5,970 70,368 - - - - -
Total $16,852,925 $19,986,175 $20,100,382 $20,173,274 $20,247,007 $20,321,592 $20,397,037
73

EMERGENCY TELEPHONE SYSTEM (E911) FUND The 911 Communication Center receives, classifies and prioritize calls from the public and dispatches the calls that require police response and transfers and/or direct calls that do not require police response to the proper agency/unit. PERSONNEL SERVICES AND EMPLOYEE BENEFITS This major expenditure category accounts for all employer costs related to compensating employees of the City of Atlanta. This includes annual salaries paid to employees occupying authorized positions; including Regular, Permanent Part-time, Sworn classifications as well as extra help and overtime. Also captured are benefits such as Life, Health Insurance, Pension, Retiree and Medical Contributions as well as Unemployment Insurance and Worker’s Compensation.
Major Expense Category
FY 2020 FY 2021 FY 2022 FY 2023 FY 2024
Personnel Services And Employee
Benefits $10,237,692 $10,297,970 $10,353,024 $10,416,625 $10,478,833
FY 2020-24 Forecast: Personnel costs are projected to remain constant over the forecast period. Also included is the minimum wage increase to $15 per hour and associated employee benefits.
PURCHASED/CONTRACTED SERVICES This major expenditure category includes general and technical professional consulting services. Most of these consulting expenditures are contracted services with a small amount contributed to direct vendor disbursements. Also, within this major category are repair and maintenance agreements covering the upkeep of buildings and equipment, operating rental/lease contracts for equipment, vehicles, land and buildings and other expenditures related to advertising, travel and training.
Major Expense Category
FY 2020 FY 2021 FY 2022 FY 2023 FY 2024
Purchased/ Contracted
Services $9,385,276 $7,972,890 $8,019,569 $8,030,553 $8,043,790
FY2020-24 Forecast: Over the next five years, expenditures are expected to fluctuate due to the installation of a new Computer Aided Design System (CAD) Solution which will reduce the need for outside consultants. Fiscal Year 2021 funding will be reallocated for supplies and capital outlay purchases.
74

SUPPLIES This major expenditure category includes consumable and non-consumable supplies related to department operations. Examples include basic office supplies, books, periodicals, small equipment less than $1,000, postage and uniforms. Also included in this category are citywide utility expenses such as water, gas and electricity.
Major Expense Category
FY 2020 FY 2021 FY 2022 FY 2023 FY 2024
Supplies $477,414 $1,102,414 $1,074,414 $1,074,414 $1,074,414
FY2020-24 Forecast: Over the next five years, expenditures in this major category include general office supplies and internal AIM support for CAD and other E911 Systems.
CAPITAL OUTLAYS This major category accounts for expenditures which result in the acquisition of or addition to fixed assets and meet these criteria: has an anticipated useful life of more than one year; costs more than $5,000, can be permanently identified as an individual unit of property; belongs to one of the following categories: land, buildings, structures and improvements, equipment, constitutes a tangible, permanent addition to the value of City assets.
Major Expense Category
FY 2020 FY 2021 FY 2022 FY 2023 FY 2024
Capital Outlays $0 $800,000 $800,000 $800,000 $800,000
FY2020-24 Forecast: Capital Outlays expenses beginning in Fiscal Year 2021 reflect estimated costs of upgrading to the Emergency Severity Index (ESI) Network.
75

76

EXPENDITURES BY MAJOR CATEGORYHotel/Motel Tax Fund
FY18 FY19 FY20 FY21 FY22 FY23 FY24Actual Adopted Projected Projected Projected Projected Projected
Other Costs 58,810,562 57,484,203 57,541,690 57,599,232 57,656,831 57,714,488 57,772,202
Other Financing Uses 19,593,067 19,151,183 19,170,335 19,189,505 19,208,695 19,227,904 19,247,132
Total $78,403,629 $76,635,386 $76,712,025 $76,788,737 $76,865,526 $76,942,392 $77,019,334
77

HOTEL/MOTEL TAX FUND The hotel/motel tax fund budget accounts for the City’s allocated share of the hotel/motel tax, which is
24.99%, with the remaining 75.01% distributed by the City between the Atlanta Conventions &
Visitors Bureau, Georgia World Congress Center, and the Mercedes-Benz Stadium.
OTHER COST This major expense category budgets for the anticipated amount to be transferred to the Atlanta Conventions & Visitor’s Bureau, Georgia World Congress Center and the Mercedes-Benz Stadium.
Major Expense Category FY 2020 FY 2021 FY 2022 FY 2023 FY 2024
Other Cost $57,541,690 $57,599,232 $57,656,831 $57,714,488 $57,772,202
FY 2020-24 Forecast: Over the next five years, expenditures reflect the anticipated transfer amounts to the Atlanta Conventions & Visitors Bureau, Georgia World Congress Center and the Mercedes-Benz Stadium.
OTHER FINANCING USES This major expense category budgets for the anticipated amount to be transferred to the City’s General Fund.
Major Expense Category FY 2020 FY 2021 FY 2022 FY 2023 FY 2024
Other Financing Uses $19,170,335 $19,189,505 $19,208,695 $19,227,904 $19,247,132
FY2020-24 Forecast: Over the next five years, expenditures reflect the anticipated transfer amount to the general fund to support governmental operations.
78

EXPENDITURES BY MAJOR CATEGORYRental/Motor Vehicle Tax Fund
FY18 FY19 FY20 FY21 FY22 FY23 FY24Actual Adopted Projected Projected Projected Projected Projected
Other Costs 1,414,467 1,379,138 1,380,516 1,381,897 1,383,279 1,384,662 1,386,046
Total $1,414,467 $1,379,138 $1,380,516 $1,381,897 $1,383,279 $1,384,662 $1,386,046
79

RENTAL/MOTOR VEHICLE TAX FUND The Rental/Motor Vehicle Fund correlates with travel and tourism activity and contains revenue from
transactions associated with a 3% excise tax levied on Car Rental Facilities within the City corporate
limits. This Fund operates as a pass through fund with all of the revenues remitted to a Bank Trustee
for debt service payments pursuant to the trust indenture.
OTHER COST This major expense category budgets for the anticipated amount to be transferred to the other government debt administrations for investment payments.
Major Expense Category FY 2020 FY 2021 FY 2022 FY 2023 FY 2024
Other Cost $1,380,516 $1,381,897 $1,383,279 $1,384,662 $1,386,046
FY 2020-24 Forecast: Over the next five years, expenditures are projected to remain relatively stable for anticipated debt service payments.
80

EXPENDITURES BY MAJOR CATEGORYWater & Wastewater Revenue Fund
FY18 FY19 FY20 FY21 FY22 FY23 FY24Actual Adopted Projected Projected Projected Projected Projected
Personal Services And Employee Benefits 100,555,711 100,871,790 105,120,685 105,678,464 106,065,602 106,665,679 107,247,127
Purchased / Contracted Services 45,735,961 76,549,408 85,063,224 85,125,955 85,182,124 83,076,393 83,151,716
Supplies 38,966,464 46,291,499 43,734,995 43,729,995 43,729,995 43,864,447 43,910,882
Capital Outlays 675,078 612,000 13,870 13,870 13,870 13,870 13,870
Interfund / Interdepartmental Charges 15,726,093 17,409,266 17,131,468 17,337,322 17,396,254 17,456,171 17,517,154
Other Costs 17,229,938 30,174,440 31,506,008 31,592,109 31,678,664 32,310,420 32,775,911
Debt Service 12,242,448 29,079,499 28,984,637 28,984,637 28,984,637 28,984,637 28,984,637
Conversion / Summary - 21,544,514 10,800,578 11,864,308 13,257,017 28,033,837 37,206,893
Other Financing Uses 369,243,128 247,921,224 266,998,067 266,998,067 266,998,067 266,998,067 266,998,067
Total $600,374,821 $570,453,640 $589,353,534 $591,324,729 $593,306,232 $607,403,522 $617,806,258
81

WATER & WASTEWATER REVENUE FUND The Water and Wastewater Fund was established to account for all transactions associated with the operation, development, and maintenance of the City's expansive water and wastewater infrastructure system. Water and Wastewater expenditure forecast accounts for departmental O & M, Debt Service, Fund-wide reserves and funding of City Departments.
PERSONNEL SERVICES AND EMPLOYEE BENEFITS This major expenditure category accounts for all employer costs related to compensating employees of the City of Atlanta. This includes annual salaries paid to employees occupying authorized positions; including Regular, Permanent Part-time, Sworn classifications as well as extra help and overtime. Also captured are benefits such as Life, Health Insurance, Pension, Retiree and Medical Contributions as well as Unemployment Insurance and Worker’s Compensation.
Major Expense Category
FY 2020 FY 2021 FY 2022 FY 2023 FY 2024
Personnel Services And Employee
Benefits $105,120,685 $105,678,464 $106,065,602 $106,665,679 $107,247,127
FY 2020-24 Forecast: Personnel costs are projected to remain relatively constant over the forecast period. Also included is the minimum wage increase to $15 per hour and associated employee benefits.
PURCHASED/ CONTRACTED SERVICES This major expenditure category includes general and technical professional consulting services. Most of these consulting expenditures are contracted services with a small amount contributed to direct vendor disbursements. Also, within this major category are repair and maintenance agreements covering the upkeep of buildings and equipment, operating rental/lease contracts for equipment, vehicles, land and buildings and other expenditures related to advertising, travel and training.
Major Expense Category
FY 2020 FY 2021 FY 2022 FY 2023 FY 2024
Purchased/ Contracted
Services $85,063,224 $85,125,955 $85,182,124 $83,076,393 $83,151,716
FY2020-24 Forecast: Over the next five years, Purchased/Contracted Services reflect the continued support of service agreements, building leases, insurance coverages, and repair and maintenance of various Department of Watershed Management facilities.
82

SUPPLIES This major expenditure category includes consumable and non-consumable supplies related to department operations. Examples include basic office supplies, books, periodicals, small equipment less than $1,000, postage and uniforms. Also included in this category are citywide utility expenses such as water, gas and electricity.
Major Expense Category
FY 2020 FY 2021 FY 2022 FY 2023 FY 2024
Supplies $43,734,995 $43,729,995 $43,729,995 $43,864,447 $43,910,882
FY 2020-24 Forecast: Supply usage is projected to remain constant over the forecast period. This includes chemicals for water treatment, utilities, equipment and supplies to stock DWM Warehouses.
CAPITAL OUTLAYS This major category accounts for expenditures which result in the acquisition of or addition to fixed assets and meet these criteria: has an anticipated useful life of more than one year; costs more than $5,000, can be permanently identified as an individual unit of property; belongs to one of the following categories: land, buildings, structures and improvements, equipment, constitutes a tangible, permanent addition to the value of City assets.
Major Expense Category
FY 2020 FY 2021 FY 2022 FY 2023 FY 2024
Capital Outlays $13,870 $13,870 $13,870 $13,870 $13,870
FY2020-24 Forecast: Capital Outlay expenditures for Watershed Management were transferred from the Operating Fund to the Renewal and Extension Fund. Projected expenses reflect the purchase of small equipment within the Executive Offices -TV Production operations.
INTERFUND/ INTERDEPARTMENTAL CHARGES This major category includes city charge back expenditures related to fuel and maintenance for equipment used in the line of city business such as garbage trucks, fire trucks and police cars. Also, includes in the category are indirect cost allocated to various departments based on a cost allocation study.
83
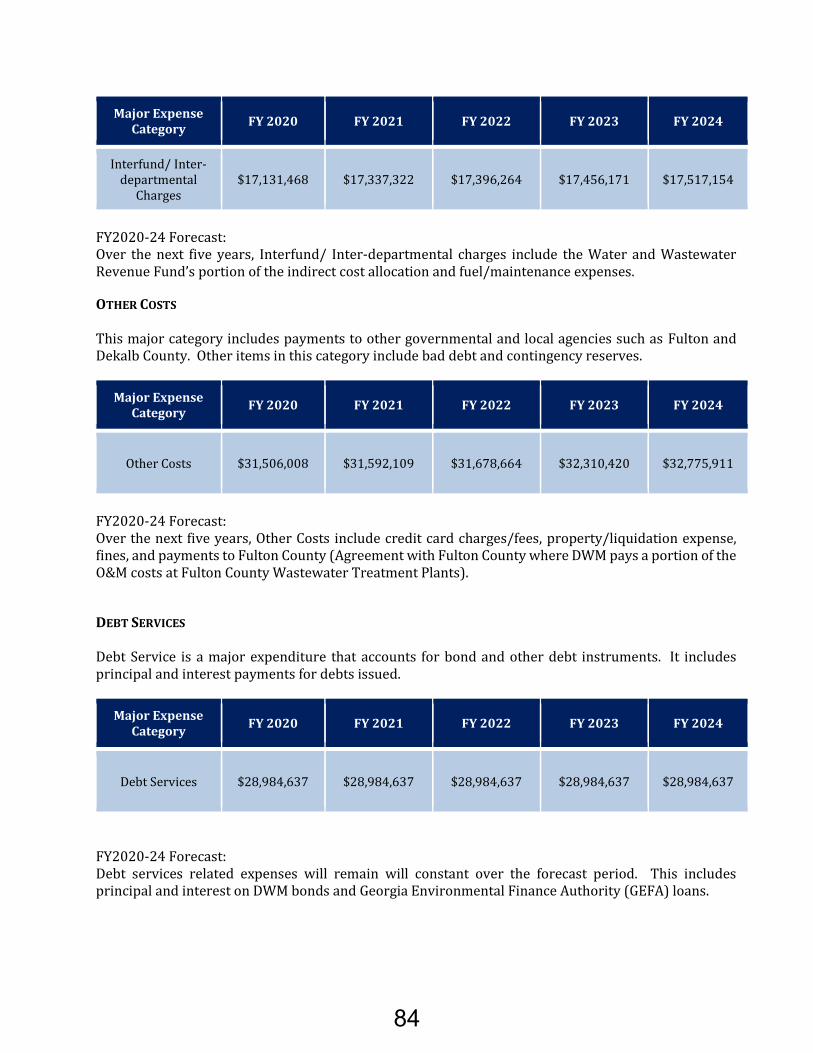
Major Expense Category
FY 2020 FY 2021 FY 2022 FY 2023 FY 2024
Interfund/ Inter-departmental
Charges
$17,131,468 $17,337,322 $17,396,264 $17,456,171 $17,517,154
FY2020-24 Forecast: Over the next five years, Interfund/ Inter-departmental charges include the Water and Wastewater Revenue Fund’s portion of the indirect cost allocation and fuel/maintenance expenses.
OTHER COSTS This major category includes payments to other governmental and local agencies such as Fulton and Dekalb County. Other items in this category include bad debt and contingency reserves.
Major Expense Category
FY 2020 FY 2021 FY 2022 FY 2023 FY 2024
Other Costs $31,506,008 $31,592,109 $31,678,664 $32,310,420 $32,775,911
FY2020-24 Forecast: Over the next five years, Other Costs include credit card charges/fees, property/liquidation expense, fines, and payments to Fulton County (Agreement with Fulton County where DWM pays a portion of the O&M costs at Fulton County Wastewater Treatment Plants).
DEBT SERVICES Debt Service is a major expenditure that accounts for bond and other debt instruments. It includes principal and interest payments for debts issued.
Major Expense Category
FY 2020 FY 2021 FY 2022 FY 2023 FY 2024
Debt Services $28,984,637 $28,984,637 $28,984,637 $28,984,637 $28,984,637
FY2020-24 Forecast: Debt services related expenses will remain will constant over the forecast period. This includes principal and interest on DWM bonds and Georgia Environmental Finance Authority (GEFA) loans.
84

CONVERSION/ SUMMARY This major category accounts for the budgetary reserve set aside for emergencies and unforeseen expenditures.
Major Expense Category
FY 2020 FY 2021 FY 2022 FY 2023 FY 2024
Conversion/ Summary
$10,800,578 $11,864,308 $13,257,017 $28,033,837 $37,206,893
FY2020-24 Forecast: The Conversion/Summary expenditure category accounts for Fund-Wide Reserves for the Department of Watershed Management. OTHER FINANCING USES Other Financing Uses are expenditures not accounted for by other major categories. It includes operating transfers out to other funds and sinking fund requirements.
Major Expense Category
FY 2020 FY 2021 FY 2022 FY 2023 FY 2024
Other Financing Uses
$266,998,067 $266,998,067 $266,998,067 $266,998,067 $266,998,067
FY2020-24 Forecast: Other financing uses over the next five years, will continue to support Department of Watershed Management debt service/sinking fund payments and PILOT/Franchise fee payments to the General Fund.
85

86

EXPENDITURES BY MAJOR CATEGORYSolid Waste Services Revenue Fund
FY18 FY19 FY20 FY21 FY22 FY23 FY24Actual Adopted Projected Projected Projected Projected Projected
Personal Services And Employee Benefits 27,521,014 29,958,332 30,463,231 30,582,197 30,088,019 30,233,433 30,360,408
Purchased / Contracted Services 10,044,230 5,108,928 13,414,129 13,239,836 13,731,466 13,574,565 13,430,480
Supplies 1,562,449 1,176,422 1,353,397 1,353,397 1,353,397 1,355,657 1,357,163
Capital Outlays 28,555 692,316 1,186,244 1,186,244 1,186,244 1,186,244 1,186,244
Interfund / Interdepartmental Charges 14,149,925 12,491,145 12,471,381 12,586,886 12,649,670 12,719,195 12,795,155
Other Costs (3,199,975) 1,398,392 1,515,397 1,515,397 1,515,397 1,515,397 1,515,397
Debt Service 165,151 - 0 0 0 0 0
Other Financing Uses 1,689,660 892,036 788,955 788,955 788,955 788,955 788,955
Total $51,961,008 $51,717,571 $61,192,735 $61,252,913 $61,313,149 $61,373,446 $61,433,803
87

������������ ���� ������������������������������� !��"! ���!##����������#������ ��$��� ����%��������������������&�� ��!�� '���������� �� �����#������$�������(����&����%��� '&�%����(������ ��)!�*��!))���&���������(��#� '&���+������� '&���)������,����&���'��+�$+(�%+�!��� '&������� �,�����,����&���!����� &�� ��� $����,� �-�.�������� ��!������ ��#���+����!���,� �'�,� ��� �����%+(�����,��'� �%����#� ����#������ �-������ !�����'� �������$��,�!����$�����������'���$��������$���,� ��� �����������-�� /��� ������0��� ��1/��2�3 ����������,�4����5#� ���!�������'��%�����! ���$��������,#��%����������������������,#� ���� '��,#��%�����$�����6��%��$�7��� ��-�������� ��!����� !������������#��������,#��%�������!#%� '��!�����8���#������ �9�� ��!�� '���'!���&�:��,� � ��:���+��,�&��(�� �������$������ �����(��������5�������#�� ��������,�-��7������#�!��������)� �$�����!������;�$�&�<������. �!�� ��&�:� ��� &���������� ��=>?@ABC�DEFGH@IJG@EFK�BK�L>CC�BK�MF>NOCEPN>FG�QFKJHBFA>�BF?�REHS>HTK�DENO>FKBG@EFU���1VWXY�Z[\]\�0V_\XYa� �2�bcbc� �2�bcbd� �2�bcbb� �2�bcbe� �2�bcbf�:���� �������������7 ��g,#��%���h� �$���� ijk&lmj&njo� ijk&pqn&ors� ijk&kqq&kor� ijk&njj&ljj� ijk&jmk&lkq��tu�vwvwxvy�tz{|}~����:���� �������������#��4�����������,�� ��� ��� �����������$��������#�����-��7����� ��!�����������,� �,!,�(�'��� ����������iop�#�����!��� ��������������,#��%���)� �$���-����������'������������� ��@KABC��>BH������@K�BGGH@IJG>?�GE�LEHS>HTK�AENO>FKBG@EF�ACB@NKU����� /��0�����0� ��0������0��������,�4����5#� ���!�������'��%�� ��!����'� ������ ������ �����#��$����� ����� �!��� '���������-�������$��������� �!��� '��5#� ���!���������� �����������������(�������,�����,�! ���� ���)!���������������� �������)!���,� ��-��7���&�(���� ������,�4�������'��%�������#����� ��,�� �� � ����'���,� ��������� '�����!#*��#��$�)!���� '��� ����!�#,� �&��#����� '��� ������������ �������$�����!�#,� �&���������&��� ��� ��)!���� '��� ���������5#� ���!������������������������ '&�������&�� ������ � '-��1VWXY�Z[\]\�0V_\XYa� �2�bcbc� �2�bcbd� �2�bcbb� �2�bcbe� �2�bcbf�:!���������6� ����������������� ioj&lol&onr� ioj&njr&qjm� ioj&sjo&lmm� ioj&psl&pmp� ioj&ljk&lqk�� tu�vwvwxvy�tz{|}~������������� �5��$����%����&�:!��������6� ���������������������#��4���������� ��������!�����������BKKEA@BG>?�L@G��G�>�D@GPTK�KBC�B�>�?@KOEKBC�BF?�H>APAC@F�&�6<��,�$���������&�� ������������� �� '�� ������������ ������-����88

�������������� ���������������� ��������������������� ���� ������������� ��������������� ���������� ����������� ��������� �������������� ���� ����������!����"�!������� ��!��� ����#������������� ��$%!&&&!����� ��� ����� �������'������������������ ������� ������(���������������������� ��( ���!�� �!� �����������������)*+,-��./0120�3*405,-6� 78�9:9:� 78�9:9;� 78�9:99� 78�9:9<� 78�9:9=�>������� $%!?@?!?AB� $%!?@?!?AB� $%!?@?!?AB� $%!?@@!C@B� $%!?@B!%C?�� DE�FGFGHFI�DJKLMNOPQ�R���� ��� �����������!��� ����� ���������� ������������������� ������� ����S������ ���� �������������3T��UT��V�U�T8������� ����� ������� �������� ���������������(�������������� �#������� ���� ��������� ���� ������ ������������������ W�� �� �� ���� ������� ���� ��� ������� �������� �X������������� ��$@!&&&!�� ��������� ����������� ��� �� ����S�� ������� ���������X����������������� ���� ����(���� �������W��� ��!��������!������������ �������S������!��#������!������������ �� �����!����� ����� ������������S ����� �Y��� ��������)*+,-��./0120�3*405,-6� 78�9:9:� 78�9:9;� 78�9:99� 78�9:9<� 78�9:9=�Y �� ��Z��� ��� $%!%[C!\]]� $%!%[C!\]]� $%!%[C!\]]� $%!%[C!\]]� $%!%[C!\]]�� DE�FGFGHFI�DJKLMNOPQ�ZS����������� S���� ��!�Y �� ��Z��� ����� ����� ���� �������� ���� ���S������ ����#���������� �����������89

���������������������� ��������������������������������� ��!�"#$������ ��������%��&��'(�!$��#������"���$����)#�"��!$����!��!�!���)����*#�(��!��#��$��!�����"�!���)���� �%#��!�����#���������%������#�&�+�)������#�&�+��!$�(�"��������,��-"��+��!�"#$����!������������ ������!$������������""�����$����.����#��$�(�����!���%���$��!���������""������!���#$ ,���� /012��345675��/85912:� �;�<=<=� �;�<=<>� �;�<=<<� �;�<=<?� �;�<=<@�A!���)#!$�B�A!���$�(�����!��"�C�������� DEF+GHE+IJE� DEF+KJL+JJL� DEF+LGM+LHN� DEF+HEM+EMK� DEF+HMK+EKK�� OP�QRQRSQT�OUVWXYZ[\�].�������!�'��)�.�� ����+�����A!���)#!$BA!���$�(�����!��"���������_abcd�efd�ghac�ijked�lb_cm��(�����!��)������!$������������""������!����n�""����)#�"��!$�(��.�!����.�����!��!�!����'(�!���,���o������o���������������������� ��!�"#$���(� ��!��������������.��!��!��"��!$�"���"����!������#������p#"��!��!$�q�&�"%�C�#!� ,�]������������!������������� ��!�"#$��$�%���!$���!��!��!� ������.��,�� /012��345675��/85912:� �;�<=<=� �;�<=<>� �;�<=<<� �;�<=<?� �;�<=<@�]�����C����� DE+KEK+IMH� DE+KEK+IMH� DE+KEK+IMH� DE+KEK+IMH� DE+KEK+IMH��OP�QRQRSQT�OUVWXYZ[\�]�����C������!�"#$���'(�!����)���r�������s�!�)���+�t��#(�u�)���!$�t��#(�v��"����.�������)��������(����$,�������������90

��������������� ������������������������������������������� ����� ������! ��"#� �����$�% ������� ����&��'�����(����� ��������������!���� ���� � �����!������������)����!������*����$����&��+,-./��012342��,526./7� �8�9:9:� �8�9:9;� �8�9:99� �8�9:9<� �8�9:9=���������������������� >?@@ABCC� >?@@ABCC� >?@@ABCC� >?@@ABCC� >?@@ABCC��DE�FGFGHFI�DJKLMNOPQ��R������������!�R��#����A������������������������� ����! ��������������STU�(�������#$���������!�������! ��������(���(������� %����&���
91

92
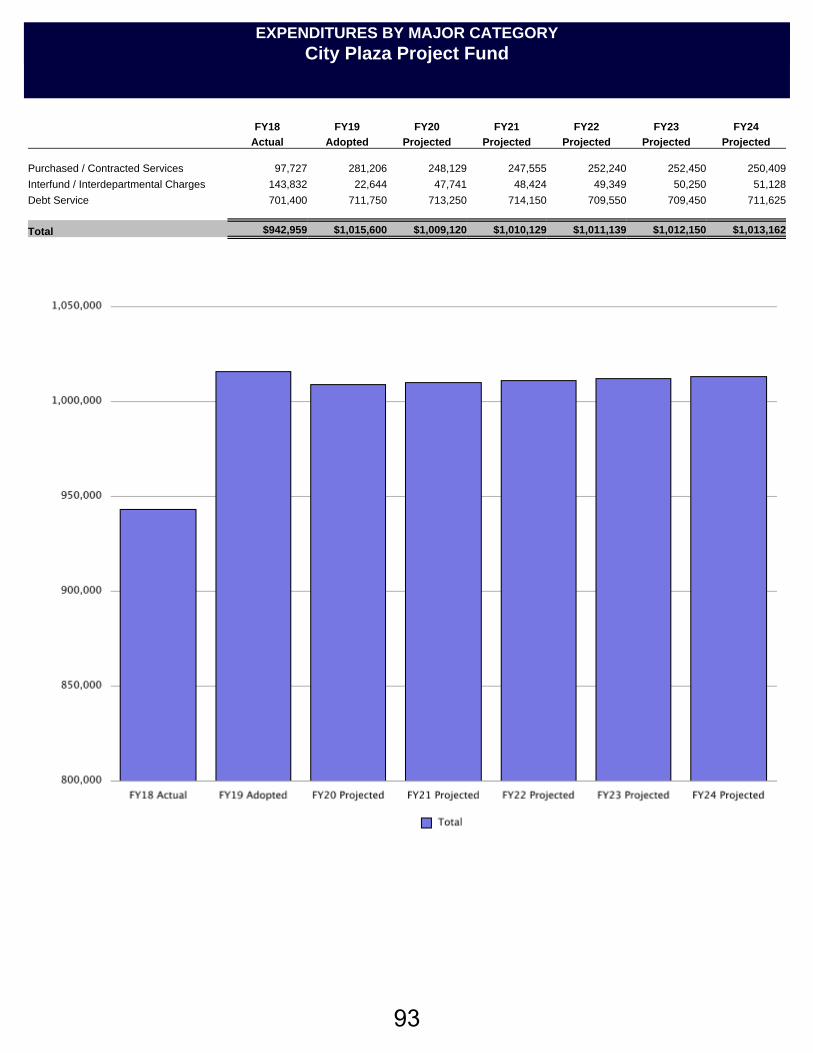
EXPENDITURES BY MAJOR CATEGORYCity Plaza Project Fund
FY18 FY19 FY20 FY21 FY22 FY23 FY24Actual Adopted Projected Projected Projected Projected Projected
Purchased / Contracted Services 97,727 281,206 248,129 247,555 252,240 252,450 250,409
Interfund / Interdepartmental Charges 143,832 22,644 47,741 48,424 49,349 50,250 51,128
Debt Service 701,400 711,750 713,250 714,150 709,550 709,450 711,625
Total $942,959 $1,015,600 $1,009,120 $1,010,129 $1,011,139 $1,012,150 $1,013,162
93

CITYPLAZAOPERATINGFUNDTheCityPlazaOperatingFundwasestablishedtotracktherevenues,expensesandbondproceedsincurredfromtheoperationoftheCityPlazaProject.Aportionofthebondproceedswillbeusedtoreimburse the City for the acquisition costs of the City Plaza Project. Revenues for the fund arederivedfromrentsfromresidents,tenants,andparkingfees.PURCHASED/CONTRACTEDSERVICESThismajorexpenditurecategoryincludesgeneralandtechnicalprofessionalconsultingservices.Mostoftheseconsultingexpendituresarecontractedserviceswithasmallamountcontributedtodirectvendordisbursements.Also,withinthismajorcategoryarerepairandmaintenanceagreementscoveringtheupkeepofbuildingsandequipment,operatingrental/leasecontractsforequipment,vehicles,landandbuildingsandotherexpendituresrelatedtoadvertising,travelandtraining.
MajorExpenseCategory FY2020 FY2021 FY2022 FY2023 FY2024
Purchased/ContractedServices
$248,129 $247,555 $252,240 $252,450 $250,409
FY2020‐24Forecast:Overthenextfiveyears,expensesincludefundingforoperationalrepairsandmaintenanceoftheCityPlazaBuilding.INTERFUND/INTERDEPARTMENTALCHARGESThis major category includes city charge back expenditures related to fuel and maintenance forequipmentused in the lineofcitybusinesssuchasgarbage trucks, fire trucksandpolicecars. Also,includedinthecategoryareindirectcostallocatedtovariousdepartmentsbasedonacostallocationstudy.
MajorExpenseCategory
FY2020 FY2021 FY2022 FY2023 FY2024
Interfund/Interdepartmental
Charges $47,741 $48,424 $49,349 $50,250 $51,128
FY2020‐24Forecast:Over the next five years, Interfund/Interdepartmental charges include City Plaza’s portion of theindirectcostallocation.
94

DEBTSERVICEDebt Service is amajor expenditure that accounts for bond andotherdebt instruments. It includesprincipalandinterestpaymentsfordebtsissued.
MajorExpenseCategory FY2020 FY2021 FY2022 FY2023 FY2024
DebtService $713,250 $714,150 $709,550 $709,450 $711,625
FY2020‐24Forecast:Over thenext fiveyears,expenditures includedebt servicepaymentsassociatedwith theCityPlazacapitalleasepurchase.
95

96

EXPENDITURES BY MAJOR CATEGORYAirport Revenue Fund
FY18 FY19 FY20 FY21 FY22 FY23 FY24Actual Adopted Projected Projected Projected Projected Projected
Personal Services And Employee Benefits 92,194,994 100,174,303 107,461,318 112,097,938 116,852,015 120,172,814 123,593,237
Purchased / Contracted Services 142,857,443 172,160,070 171,335,971 176,430,685 181,745,955 187,051,939 192,604,774
Supplies 16,429,449 18,280,372 18,920,977 19,481,706 20,064,406 20,664,588 21,282,775
Capital Outlays 560,695 1,328,865 1,384,100 1,441,455 1,501,008 1,562,839 1,638,814
Interfund / Interdepartmental Charges 14,685,926 12,474,792 12,333,373 12,557,981 13,048,651 13,539,678 14,032,735
Other Costs 8,110,832 6,584,597 7,003,914 7,142,355 7,437,163 7,743,234 8,060,974
Conversion / Summary - 89,908,388 82,127,376 75,710,896 130,308,399 126,611,409 151,539,703
Other Financing Uses 251,218,318 141,095,006 149,761,000 206,059,000 189,372,000 224,843,000 238,108,000
Total $526,057,656 $542,006,394 $550,328,029 $610,922,016 $660,329,598 $702,189,501 $750,861,012
97

AVIATION REVENUE FUND The Department of Aviation was established to operate and maintain Atlanta Hartsfield‐Jackson International Airport (ATL). Its mission is to provide the Atlanta region a safe, secure and cost ‐competitive gateway to the world that drives economic development and operates with the highest level of customer service and efficiency while exercising fiscal and environmental responsibility. Aviation expenditure forecast accounts for general departmental operations, Indirect Cost, Debt Service, Sinking Fund Requirements, Fund-Wide Reserves and funding of City Departments. PERSONNEL SERVICES AND EMPLOYEE BENEFITS This major expenditure category accounts for all employer costs related to compensating employees of the City of Atlanta. This includes annual salaries paid to employees occupying authorized positions; including Regular, Permanent Part-time, Sworn classifications as well as extra help and overtime. Also captured are benefits such as Life, Health Insurance, Pension, Retiree and Medical Contributions as well as Unemployment Insurance and Worker’s Compensation.
Major Expense Category
FY 2020 FY 2021 FY 2022 FY 2023 FY 2024
Personnel Services And Employee
Benefits
$107,461,318 $112,097,938 $116,852,015 $120,172,814 $123,593,237
FY 2020-24 Forecast: Over the next five years, Aviation is using an escalated rate of 3% based on the combined average of 2017, 2018 and 2019 forecast. The increase is due to anticipated Personnel Services and Employee Benefits including a minimum wage increase of $14 per hour in FY19, $15 per hour in FY20, and beyond.
PURCHASED/CONTRACTED SERVICES
This major expenditure category includes general and technical professional consulting services. Most of these consulting expenditures are contracted services with a small amount contributed to direct vendor disbursements. Also, within this major category are repair and maintenance agreements covering the upkeep of buildings and equipment, operating rental/lease contracts for equipment, vehicles, land and buildings and other expenditures related to advertising, travel and training.
Major Expense Category
FY 2020 FY 2021 FY 2022 FY 2023 FY 2024
Purchased/ Contracted
Services
$171,335,971 $176,430,685 $181,745,955 $187,051,939 $192,604,774
FY2020-24 Forecast: Over the next five years, Aviation included an escalation rate of 3% based on the combined average (3.45%) of GDP growth rates for 2017 and 2018 and a study conducted by the Federal Reserve for 2019’s GDP forecast equating to 2.4%. Aviation’s primary accounts in the Purchased Contract Services
98

account group include consulting professional services, consulting professional services technical, and repair/ maintenance accounts. These three accounts make up the bulk of the department’s contracts. Some of the larger agreements include contracts in Parking, AGTS Train System, Security – Access Control & Gate Guard Operations, CPTC Maintenance, Rental Car Center Operations, and Customer Service which collectively account for $95.9 million of the Airport revenue Fund Budget. All of these contracts have multi-year terms hence, the GDP growth factor was applied.
SUPPLIES
This major expenditure category includes consumable and non-consumable supplies related to department operations. Examples include basic office supplies, books, periodicals, small equipment less than $1,000, postage and uniforms. Also included in this category are citywide utility expenses such as water, gas and electricity.
Major Expense Category
FY 2020 FY 2021 FY 2022 FY 2023 FY 2024
Supplies $18,920,977 $19,481,706 $20,0647,406 $20,664,588 $21,282,775
FY2020-24 Forecast: Over the next five years, Aviation continued to use an escalation factor of 3% again using the average of the study on GDP Growth. The 2019 study reveals a downturn in forecast of 2.4% but has been tempered by Aviation Administration based off of such a strong performance in 2017 and 2018. While consumable and non-consumable supplies may experience a decrease, it is not likely that utilities will follow. In fact, utilities are subject to grow. Furthermore, Aviation has recently acquired the old Sheraton Hotel on Sullivan Road which will include an uptick in utility costs. Other type “supply accounts” (small equipment, computers, software, art, and uniforms) aren’t subject to experience a decrease and will either hold steady or slightly increase. These supply items along with utilities will over compensate for any downturn in consumable and non-consumable supplies.
CAPITAL OUTLAYS This major category accounts for expenditures which result in the acquisition of or addition to fixed assets and meet these criteria: has an anticipated useful life of more than one year; costs more than $5,000, can be permanently identified as an individual unit of property; belongs to one of the following categories: land, buildings, structures and improvements, equipment, constitutes a tangible, permanent addition to the value of City assets.
Major Expense Category
FY 2020 FY 2021 FY 2022 FY 2023 FY 2024
Capital Outlays $1,384,100 $1,441,455 $1,501,008 $1,562,839 $1,638,814
FY2020-24 Forecast: Over the next five years, there is a projected 4% annual increase in the anticipated Capital Outlays from the Aviation Fund. The increase in this major expense category is due to a need for furniture and fixtures to accommodate the current office updates in the C-4 Division.
99

INTERFUND/ INTERDEPARTMENTAL CHARGES
This major category includes city charge back expenditures related to fuel and maintenance for equipment used in the line of aviation cars, buses and trucks, fire trucks and police cars. Also, includes in the category are the City's chargeback/ allocation indirect cost allocated to various departments based on a cost allocation study.
Major Expense Category
FY 2020 FY 2021 FY 2022 FY 2023 FY 2024
Interfund/ Interdepartmental
Charges
$12,333,373 $12,557,981 $13,048,651 $13,539,678 $14,032,735
FY2020-24 Forecast: Over the next five years, there is a projected 4% annual increase in the anticipated Interfund/ Interdepartmental Charges from the Aviation Fund. The increase in this major expense category supports City's chargeback/ allocation and fuel and maintenance cost.
OTHER COSTS This major category includes payments to other governmental and local agencies such as the property taxes to the City of College Park and Clayton County. Other Operating Costs are anticipated an increase due to Retiree's Life and Health expenses extraction to regular.
Major Expense Category
FY 2020 FY 2021 FY 2022 FY 2023 FY 2024
Other Costs $7,003,41 $7,142,355 $7,437,163 $7,743,234 $8,060,974
FY2020-24 Forecast: Over the next five years, there is a projected 4% annual increase in the anticipated Other Costs from the Aviation Fund. The increase in this major expense category is due to Retiree's Life and Health and property taxes.
CONVERSION/ SUMMARY This major category accounts for the budgetary reserve set aside for emergencies and unforeseen expenditures.
Major Expense Category
FY 2020 FY 2021 FY 2022 FY 2023 FY 2024
Conversion/ Summary
$82,127,376
$75,710,896
$130,308,399
$126,611,409
$151,539,703
100

FY2020-24 Forecast: Over the next five years, there is a projected 20% annual increase in anticipated Conversion/ Summary expenditures from the Aviation Fund. The major driver causing the decrease and increase in reserves due to payoffs and new issuance of debt.
OTHER FINANCING USES
Other Financing Uses are expenditures not accounted for by other major categories. It includes operating transfers out to other funds and sinking fund requirements.
Major Expense Category
FY 2020 FY 2021 FY 2022 FY 2023 FY 2024
Other Financing Uses
$149,761,000 $206,059,000 $189,372,000 $224,843,000 $238,108,000
FY2020-24 Forecast: Over the next five years, there is a projected 14% annual increase in the anticipated Other Financing Uses from the Aviation Fund. The increase in this major expense category is due sinking fund requirements projected to decrease in FY22 due to debt pay-offs (2011 Series) and increases in FY23 due to new issuance of new debt.
101

102

EXPENDITURES BY MAJOR CATEGORYFleet Service Fund
FY18 FY19 FY20 FY21 FY22 FY23 FY24Actual Adopted Projected Projected Projected Projected Projected
Personal Services And Employee Benefits 11,575,912 12,307,195 12,298,480 12,365,724 12,411,620 12,485,592 12,556,378
Purchased / Contracted Services 4,745,647 4,663,438 4,654,652 4,544,112 4,490,146 4,401,731 4,313,333
Supplies 12,935,716 13,176,675 13,088,301 13,088,301 13,088,301 13,089,934 13,091,022
Capital Outlays 10,578 15,500 15,500 15,500 15,500 15,500 15,500
Interfund / Interdepartmental Charges 4,007,789 3,140,923 3,410,575 3,487,360 3,528,952 3,575,318 3,625,431
Debt Service 33,535 96,857 21,338 21,338 21,338 21,338 21,338
Total $33,309,177 $33,400,588 $33,488,846 $33,522,335 $33,555,857 $33,589,413 $33,623,003
103

���������������� ����������������������������������������� !�����!�����"� !������!#�����!�������$�����������! �����%��&�! �'������(�� �����! ��������������$!�!��)����*��#$���+���������������������������##!���� ��������$���������������������!�%��&���#���$����+���,���-������������.� ��/,�-0���1�������������$�2!���3#�������������"!�&����!����� !�������$#�!&����!�������������!��!$#�������"��$#�!&����! �����%��&�! �'������+��������������������������������#�����!��$#�!&����!���#&��"�����!��)���#!����!��4���������"�5�"����6�7��$������7���8��$�6���!��������� �����!���������������3�������#�����!�����$�+��'��!���#�������������� ������������9� �6�:������;��������6�7����!�6�5�����������<�������%!��������!������=>??�@A�BC>DE?FGD>CH�ICAJK@CL>�@CM�NFKO>KPA�QFDE������!�+��� /RSTU��VWXYZX�R[X\TU]� �0�__� �0�_ � �0�_ � �0�_a� �0�_b�7���!������������������c$#�!&���d��� ���� efg6ghi6jik� efg6lmn6ogj� efg6jff6mgk� efg6jin6nhg� efg6nnm6loi���pq�rsrstru�pvwxyz{|}�7���!������!��������#�!2�������!���$�����!�������!�������� !�������#���!�+��'��!�����������������$���$�$���"������������!�efn�#����!����������!��������$#�!&������� ���+���,��~.�� �-���.�� ��������������$�2!���3#�������������"!�&����������"���������������������#�! ����!�����!�������"���������+�<!���! ��������!�������"��3#���������������!��������������������������$�����$!�����!�����������!������������!����������$����+��'��!6�������������$�2!������"!�&�������#��������$������������"���$������!�����"������#���#�! ��������"�������*��#$���6�!#������"���������������!�������� !���*��#$���6���������6�����������������"������!������3#�������������������!�����������"6�������������������"+�� /RSTU��VWXYZX�R[X\TU]� �0�__� �0�_ � �0�_ � �0�_a� �0�_b�7���������%!������������������ ej6mnj6mng� ej6njj6ffg� ej6jhk6fjm� ej6jkf6olf� ej6lfl6lll��pq�rsrstru�pvwxyz{|}�5�#��������<������������!���� !������Q�HGPA��?>>H�F���>��L?>A�@CM�DFHFK��>M�>�J�ED>CH��A�EKF�>LH>M��!���������!�������� !�������#���!�+���������$����&������!�������#����$����! ��"��"� �����������*������!��! �����"&�� ���������������+����104

�������������� ���������������� ��������������������� ���� ������������� ��������������� ���������� ����������� ��������� �������������� ���� ����������!����"�!������� ��!��� ����#������������� ��$%!&&&!����� ��� ����� �������'������������������ ������� ������(���������������������� ��( ���!�� �� ����������������� )*+,-��./0120�3*405,-6� 78�9:9:� 78�9:9;� 78�9:99� 78�9:9<� 78�9:9=�>������� $%?!&@@!?&%� $%?!&@@!?&%� $%?!&@@!?&%� $%?!&@A!A?B� $%?!&A%!&CC��DE�FGFGHFI�DJKLMNOPQ�R����� ����!������ ���������!��� ����!� ����� ���� ���� ������ �� ���� ���� ���� ������������������� ������� ����S������ ���� ��������������3T��UT��V�U�T8������� ����� ������� �������� ���������������(�������������� �#������� ���� ��������� ���� ������ ������������������ W�� �� �� ���� ������� ���� ��� ������� �������� �X������������� ��$Y!&&&!�� ��������� ����������� ��� �� ����S�� ������� ���������X����������������� ���� ����(���� �������W��� ��!��������!������������ �������S������!��#������!������������ �� �����!����� ����� ������������S ����� �Z��� �������� )*+,-��./0120�3*405,-6� 78�9:9:� 78�9:9;� 78�9:99� 78�9:9<� 78�9:9=�Z �� ��[��� ��� $%Y!Y&&� $%Y!Y&&� $%Y!Y&&� $%Y!Y&&� $%Y!Y&&��DE�FGFGHFI�DJKLMNOPQ�[S����������� S���� ��!������������ ���� ��S��� ���� ������Z �� ��[��� ��������R�� ��\� ��C&C&�C&CB������������� ������������� ���� ��� ����#��������������������� ������ ������ �����������������105

�������������������� ���������������������������� �!�"#$����� ������%��&�'(�!$��#�����"���$��)#�"�!$���!��!�!��)���*#�(��!�#��$�!���"�!��)��� %#��!����#�������%�����#�&�+)�����#�&��!$(�"�������,-"��+�!�"#$�$�!���������� ����!$����������""�����$��.����#�$�(�����!��%���$�!������""������!��#$ , /012�345675�/85912: �;<=<= �;<=<> �;<=<< �;<=<? �;<=<@A!���)#!$BA!���$�(�����!��"C������ DE+FGH+IJI DE+FKJ+ELH DE+IMK+NIM DE+IJI+EGK DE+LMI+FEGOPQRQRSQTOUVWXYZ[\].�����!�'�)�.� ����+A!���)#!$BA!���$�(�����!��"C�������!�"#$����_abcdefghijkg(�����!�)����!$����������""������!,��l����m���n�%�o��.������������'(�!$��#����������#!��)��%�!$�!$�����$�%��!���#��!��,A��!�"#$��(��!��(�"�!$�!������(� ��!��)��$�%�����#�$, /012�345675�/85912: �;<=<= �;<=<> �;<=<< �;<=<? �;<=<@n�%�o��.��� DMG+EEK DMG+EEK DMG+EEK DMG+EEK DMG+EEKOPQRQRSQTOUVWXYZ[\].�����!�'�)�.� ����+n�%�o��.����'(�!����!�"#$���������$����(��"�!�������""������!�, 106

EXPENDITURES BY MAJOR CATEGORYGroup Insurance Fund
FY18 FY19 FY20 FY21 FY22 FY23 FY24Actual Adopted Projected Projected Projected Projected Projected
Personal Services And Employee Benefits 1,894,153 2,325,751 1,895,830 1,901,396 1,906,923 1,912,842 1,918,675
Purchased / Contracted Services 648,786 1,002,579 1,013,166 1,025,603 1,056,985 1,089,363 1,122,828
Supplies 30,938 13,559 3,561 3,561 3,561 3,561 3,561
Capital Outlays 101 - - - - - -
Interfund / Interdepartmental Charges 2,836,252 2,650,955 1,456,439 1,493,002 1,512,620 1,534,242 1,557,777
Other Costs 146,380,479 147,527,906 146,011,175 150,469,628 155,061,510 159,789,451 164,658,115
Debt Service 61,797 - 53,770 53,770 53,770 53,770 53,770
Other Financing Uses 287,579 - - - - - -
Total $152,140,086 $153,520,750 $150,433,941 $154,946,959 $159,595,368 $164,383,229 $169,314,725
107

GROUP INSURANCE FUND The Group Insurance Fund was established to provide quality affordable and accessible health care benefits in the most cost-efficient manner while maintaining financial accountability for our stakeholders. This fund covers a fully insured HMO, self- funded POS, and Medicare Advantage plans for employees, retirees and dependents. The fund’s revenue valuation is also driven by rate increases and actual utilization. PERSONNEL SERVICES AND EMPLOYEE BENEFITS This major expenditure category accounts for all employer costs related to compensating employees of the City of Atlanta. This includes annual salaries paid to employees occupying authorized positions; including Regular, Permanent Part-time, Sworn classifications as well as extra help and overtime. Also captured are benefits such as Life, Health Insurance, Pension, Retiree and Medical Contributions as well as Unemployment Insurance and Worker’s Compensation.
Major Expense Category
FY 2020 FY 2021 FY 2022 FY 2023 FY 2024
Personnel Services And Employee
Benefits $1,895,830 $1,901,396 $1,906,923 $1,912,842 $1,918,675
FY 2020-24 Forecast: Personnel costs are projected to remain constant over the forecast period. Also included is the minimum
wage increase to $15 per hour and associated employee benefits.
PURCHASED / CONTRACTED SERVICES This major expenditure category includes general and technical professional consulting services. Most of these consulting expenditures are contracted services with a small amount contributed to direct vendor disbursements. Also, within this major category are repair and maintenance agreements covering the upkeep of buildings and equipment, operating rental/lease contracts for equipment, vehicles, land and buildings and other expenditures related to advertising, travel and training.
Major Expense Category
FY 2020 FY 2021 FY 2022 FY 2023 FY 2024
Purchased / Contracted
Services
$1,013,166 $1,025,603 $1,056,985 $1,089,363 $1,122,828
FY2020-24 Forecast: Over the next five years, Purchased /Contracted Services expenditures include costs associated with Medical Service Provider fees and operational expenses for the Employee Wellness Center.
108

SUPPLIES This major expenditure category includes consumable and non-consumable supplies related to department operations. Examples include basic office supplies, books, periodicals, small equipment less than $1,000, postage and uniforms. Also included in this category are citywide utility expenses such as water, gas and electricity.
Major Expense Category
FY 2020 FY 2021 FY 2022 FY 2023 FY 2024
Supplies $3,561 $3,561 $3,561 $3,561 $3,561
FY2020-24 Forecast: Over the next five years, expenditures for copiers, printing and employee handbook binding are projected to remain constant over the forecast period.
INTERFUND / INTERDEPARTMENTAL CHARGES This major category includes city charge back expenditures related to fuel and maintenance for equipment used in the line of city business such as garbage trucks, fire trucks and police cars. Also, included in the category are indirect cost allocated to various departments based on a cost allocation study.
Major Expense Category
FY 2020 FY 2021 FY 2022 FY 2023 FY 2024
Interfund / Interdepartmental
Charges
$1,456,439 $1,493,002 $1,512,620 $1,534,242 $1,557,777
FY2020-24 Forecast: Over the next five years, the Interfund / Interdepartmental charges include the Group Insurance Fund’s portion of the indirect cost allocation. OTHER COSTS This major category includes payments for active and retiree health insurance premiums, disability
and various medical insurance claims.
Major Expense Category
FY 2020 FY 2021 FY 2022 FY 2023 FY 2024
Other Costs $146,011,175 $150,469,628 $155,061,510 $159,789,451 $164,658,115
109

FY2020-24 Forecast: Other Costs account for employee healthcare provider insurance expenses along with cost associated with incurred and anticipated insurance claims. DEBT SERVICES Debt Service is a major expenditure that accounts for bond and other debt instruments. It includes principal and interest payments for debts issued.
Major Expense Category
FY 2020 FY 2021 FY 2022 FY 2023 FY 2024
Debt Service $53,770 $53,770 $53,770 $53,770 $53,770
FY2020-24 Forecast: Over the next five years, the Debt Service expenses include cash pool interest allocations.
110

�
� �
����� ������������������������� �� ������������������� ������������������������ ����������������������� ����� ��������������������������������������������������������� ������� ������111

�
� �
������������������
112

�
� �
�� ����������������������� ��������������� ���������������� ����!!������ ����"�#������������������#� ����!���#��"���!!�!!���"�!����$�������%���&���'!�!$��� ��������&!�����!(�)�%�����#�!!��������� �����&&���!�������&���&�&�������������#*$��$�!����%���&���!��������#�!!�� �!�+��������$�����������!� �������#�$�#����!����������!�������� ����"�#��������������������#� �������"�����������#�!!�������������,�����&����!���-./(012���� ��������������#�����������#��� �������$�����������3$��������!(��4���������� �!��#������56.5�����7�������$������ ����"�#�����$�#����,�������##!� �����������!�������� ����"�#������������������#��������������� ��&����#�!!������.81����561�� �����!�"9:;<:=>�?:@A'9�B<CD:>:C��3$��������!������������������! ��!(� ��������&�����������!�������� ����"�#������!�,����������������� �.81����561�� �����!�"!����������A'9�"���������3$��������!������������������! ��!���$�������&&���������"������7��� ���������#�� ����������7����7�����#�&����������+�����������#�����! ��!������ ���������!���!���������<E�>F�@�G@HIG<G�FJ�KL�E:A�?:@A�FJ�>M:�9<B9:;<:=>�?:@A'9�B<CD:>:C�A:N:=<:9�I=�EA:E@A@>IF=�JFA�@CFE>IF=�FJ�>M:�<EOFGI=D�?:@A9'�"�����(���P ���������!�������� ����"�#����� �##!�"�#�,�����&���&�&�.81�� �����!�"!����������A'!�"���������3$��������!������������������! ��!����$#���!�&����� �!�������!Q�� ��������!�,�##�"��&����,������!$��� ������&��$�����!������$�����������&&���������� �����7��� ���������#�� ����(��R���#����������!�������� ����"�#������ �����������#�������3���������&�3�&�&�� �561��!����!��$#�!� ����"�#�����&���"�����!������� �������! �������� �����"�#����!���������� ���!����� ������*��&���3$��������!����������������������(� ��#��!��861�� �!��$#�!� ����"�#�����&�!��"���!������������������� ����� ����"�#�����$���������##�������� ����������*���&���3$��������(���STU��VWVTXY�VZ�[STY�\]�_] � ab\c]��d�_]_�eSfgWSh� \_\i]��STU��VWVTXY�VZ�[STY�\]�_]_� _ji_]��d_]\�eSfgWSh� ` bbb��STU��VWVTXY�VZ�[STY�\]�_]\� \k jb��d_]b�eSfgWSh� \k_��STU��VWVTXY�VZ�[STY�\]�_]b� b akc��d_]c�eSfgWSh� a]_a��STU��VWVTXY�VZ�[STY�\]�_]c� c ] b������������������d_]j�eSfgWSh� _ \c��STU��VWVTXY�VZ�[STY�\]�_]j� c\ ba�����������������d_]i�eSfgWSh� bja\\��STU��VWVTXY�VZ�[STY�\]�_]i� _]]]k_������������������d_]k�eSfgWSh� l_ _]_m��STU��VWVTXY�VZ�[STY�\]�_]k� ikkk]��� �� n��� �##�,�����!����������o�#������!�� �p����q6��56.r��!�$��!������������� ��&������������"��� Ro�8s(���e�cb��VZYtufv� �wuSTZ�)��*!$����"#����������������������������������������������������������������������������������8�5s0� .8.�xs/�7�&&�����������������������������������������������������������������������������������������q6�xss�y�!�������� 6� !!�����������������������������������������������������������������������������������������������.6�/5s�z��!!������ .q5�6/8�{uZVW� ikkk]�113

�
� �
������������ ������������������������������ �!"�#$%%&' �()*+,-*+'"!.,/ 00�12�23/"#45�&� �!"�%&'6�.-,'! 7&,7!.� �8�-3&'6�.-�(�� �!"�#7#'90:2�:�����������;<%�!#�#$%%&' �()*+'"!.,/ 00�12�23/"#45�(�%7&-=�!-%&'6�.-,'! 7&,7!.�>2??@ 00�12�28�-3&'6�.-�(;<%�!#�#7#'90:2�:���� 00�1�2A8�-;#-,=7-�(����B"&%/"#9&'=C%�&7-,'!# >2??@���������D��������� ��������E���FGHIG�� �JGHFIK $--L��!('9-L�9,#.7/*�7&1"!#%�!-&�#�& �#7!(7!*'-L�&#"&%/"#9"!(#M,//,!.&�7#�9"!()7/7!.�NOL�9'//'M,!P,#-L��"!(Q7/7!.�3&'6�.-,'!7#'9R"!�2�1����17#%&�#�!-�(,!-L�9'&=7-&�S",&�()*5$BQ4 DTU VW�������X TY����8'!#%�!(7)/� ?1�Z���#-&,.-�( �+'==,--�(2�1?[? Z[1$##,P!�( A1?2[\!7##,P!�( �2Z1�[Z]���� �JGHFIK\!&�#-&,.-�( �[?1�A0 114

�
� �
�� ������������������ ����� ������������������������������������ !������"�#��$���"%���&'(����$��$)���*�)$�"'+�"'�$�(��","��*��"�"�'-��.����/0���1�/2�)+�',#�3�4�*��'��5#���2�.����6'��)+�%�)'2�'�$4�7)$'���&'(��.����5�4"(�8$�����&'(�.�����4����5�)%",����&'(�.����7)�&*�6'�&)$',���&'(��3���4�+"�4$�"�'�()"%"'+���"���"%��#�$)�*4$'��$��"',4&(�(�$��$'��9:�,�"%����$���$,������������&'(��$)��$(()����(;�5*�,"�",$44#!�����4�+"�4$�"�'���$��������'��(����<�4"2"'$���$'#�(��","���"'��&'(���&**�)��(�9#�����7�'�)$4��&'(=>��������?"���(�9�4�@�$)��(��,)"*�"�'������$,���&'(�@"������")�)��*�,�"%���������(��","���$'(�*���"94����4&�"�'�����)�(&,���)��4"2"'$������")�9$4$',��;���ABBC�D��E���F�����������F���D��3���/2�)+�',#�3�4�*��'��5#���2��&'(�,�'�"�������,�44�,�"�'�����$'�/'�$',�(�0���G/0��H�����4�%"�(�$+$"'�����4�*��'���&9�"("���9�+"''"'+�"'��00�;�I'�"4��00J!�����,�44�,�"�'����������������@�)��$,,�&'��(���)�"'�����7�'�)$4��&'(�"'� �%�'&���)�2�������$)+�����)�5�)%",���,$��+�)#;���3���)$�����)&,�&)��2$'($��(�9#�����7��)+"$�7�'�)$4�����294#�("(�'���$(�K&$��4#�,�%�)�����,���������*�)$�"'+���"���&',�"�';��L&)"'+��������M�4�+"�4$�"%������"�'!�����7��)+"$�7�'�)$4�����294#�$**)�%�(�N�&���O"44�PM�����$&���)"Q�������"�#�����"R�$'(�,�44�,��$�*&94",��$���#�$�����2�'������@"��"'������"�#���)�����*)���,�"�'����*&94",���$4��!�@�4�$)�!�$'(�����,�'%�'"�',����������"�#!�$'(���)�����$(�K&$���*)���,�"�'����*�4",�!��")��$'(�����)��2�)+�',#���)%",��!�$��������)���"'��ST�UVWXYZ���$)��)�$��5�,�"�'��[���G,H�GP�H;�\'�]$#�!����M!������"�#�*$���(� ���4&�"�'��M[ [JM�P�$&���)"Q"'+�����]$#�)�����R�,&���$�,�'�)$,��@"��������&4��'���&'�#�3$R���22"��"�'�)���)�����9"44"'+�$'(�,�44�,�"�'��������/[0���_&94",�5$���#��,,����������2�'����)������"�#;�3���4�+"�4$�"�'�$&���)"Q�(������"�#����,�44�,��*&94",��$���#�$�����2�'�������"'�����$2�&'������a�*�)�)��"(�'�"$4�*$),�4�$'(�J�a�*�)�'�')��"(�'�"$4�*$),�4;�3���$''&$4�9"44"'+���)�������P����P;0]�"���R*�,��(����,�'�)"9&�����@$)(������(��","��"'�����/0����&'(;�5"',������!�����+�'�)$4��&'(��$���)$'���))�(��%�)� M�2"44"�'������"���&'(!�"',4&("'+���2"44"�'�"'��������$'(���2"44"�'�(&)"'+�������M;�3��)��@�)��'���&'(���)$'���))�(��)�2�����7�'�)$4��&'(��������/0����&'(�"'�������P�$'(�������a;�����������,4������������a�����$2�&'��(&���������7�'�)$4��&'(�"��M;��2"44"�'!�$��4"+���"',)�$�������M0b�2"44"�'��)�2�������P;��������,4��������������!�/2�)+�',#�3�4�*��'��5#���2��$(�$'�$,,&2&4$��(�(��","������;��2"44"�';��L&)"'+�����#�$)!�����(��","��(�,)�$��(�9#��;a�2"44"�'�(&���������$�����2�'��$'(�,�44�,�"�'����$�*&94",��$���#����;�6��"���R*�,��(���$�������&44�"2*$,���������$�����2�'�����"',)�$���)�%�'&��@"44��,,&)�"'�&*,�2"'+�#�$)��@�",��@"44�)�(&,������$2�&'��(&���������7�'�)$4��&'(;����������Ec���D������E����� �����6'��)+�%�)'2�'�$4�7)$'���&'(��"��$'����$94"���(�$,,�&'����)�����)�%�'&���$'(��R*�'("�&)�����)�2"�,�44$'��&��+)$'����R,�*����)�������)�,�)(�(�"'�����L�*$)�2�'������%"$�"�'!�L�*$)�2�'�����8$��)���(�]$'$+�2�'�!�$'(�������22&'"�#�L�%�4�*2�'���&'(�;��������,4��������������!�6'��)+�%�)'2�'�$4�7)$'���&'(���$(�$'�$,,&2&4$��(�(��","�����0;��2"44"�';�3�"��(��","��@$��*)"2$)"4#�����)��&4������"2"'+�("���)�',���9��@��'��R*�'����$'(�()$@"'+�(�@'�����+)$'���&'(�;�3����"�#�@"44��'�&)���"2�4#�9"44"'+����7)$'���R*�'����$'(�)���4%��&'$44�@$94���R*�'("�&)���"'�&*,�2"'+�#�$)�;�������d����� ����3���5�4"(�8$������44�,�"�'��&'(�,�'�"�������,�44�,�"�'������������)-�+$)9$+�!�)�,#,4"'+!�#$)(�@$����$'(�9&4e�)&99"��!���)�����@��*"'+!�(�[4"���)"'+!�(�9)"��)�2�%$4!�)"+��[��[@$#[,&��"'+!�(�$(�$'"2$4�)�2�%$4!��(&,$�"�'!�$'(��'��),�2�'�;�6��$4���"',4&(���4$'(�*���[,4��&)��2$'$+�2�'��$'(�)��*�'("'+����,"�#[@"(���2�)+�',#��*�)$�"�'�;�6'��������!�����)$����@�)��"',)�$��(����,�%�)�����,������)�*)�%"("'+���������)%",��;�����$�)��&4�!���"���&'(��$��9��'�,�%�)"'+�"����*�)$�"'+�,�����$'(��&'("'+�"���,$*"�$4�'��(�;�����������,4��������������!�����5$'"�$�"�'��&'(��$(�$'�$,,&2&4$��(�(��","������JP;M�2"44"�';�?$,e����$(�K&$���9"44"'+����,�%�)�,�����"��,�'�)"9&�"'+������"��(��","�;�3����"�#�$(2"'"��)$�"�'�"���%$4&$�"'+�$�����"',)�$���$4�'+�@"����"+���,����,�'�)�4�2�$�&)������$(()����$'(��4"2"'$��������*�)$�"'+�(��","�;�115
�
� �
������������������ ������������������������������������������������������������� ���������������!��������������������� ����������"#$�������!����%��#������!��������������������������� ����&���'(����)������ �������������&*������������ ����&����� �������������+���� ����������������!����%������������������������������ ��&������� �����+�� ���,�������� �������� ��� ���-�./01,������������������������������������!��������������� ��23%/�!���� �%��4����+��������*����./01,�����������������������&*����� 5�!����*�2/%1�!���� �%�������� ������ �������&�����+�� �������� �&��! ��� ����� ��������� ����������� ����������!�����+�����!���������������&*��������*����./06%��7�8�9�����:������ ������;� ���<������������������������������������������������� ������;� ���<������������������ ������������ ������� ���� ��� ������,���������,�����!�����������������&����������� �+�� ������������������ !�������� �����!�������!�� *����������������� ������"��*%�����;� ���<���������������������������� ��21%0�!���� �%���������������=������!����*������ �������������������%������"��*���!��������� �������������*����������+���������������� ��� ����*����+������&������������,���� ������ ����!�����������������%��������������������������������������������� 116

�
� �
����
���
��������������������� � ������������������������� �������������������������� ������������������������������ �� !��"#$�%��� �&$'�%�(#�)�*#�+����,�%*��-���.����� /00102/1344 52612071203 890:13:/15:2; 91:791/62 84010391:96; 47010:512:5 <5=0/>?@�����A�B��������CDEFGHFIJK�744�LMIN 8:165/1546; 47157716/6 849125/17/5; 0 /16:9120/ 8/1005164:; <56=20>OPEEMIQRK�SFT�UVPJW�XGYIR�LMIN 9:91034 210531:/: 86120916/6; 0 /:91976 27/16/2 32=47>Z[\][Z�LMIN 4/140:1237 491546 0 84/14401294; 84/107:13::; 401:75 400=00>_IRFGHPTFGIEFIRYV�XGYIR�LMIN 8451:04160:; :710021009 8:513691364; /10321033 519971992 87163/1039; <39=24>DE PaFGEFIR�bPIF�LMIN 0 0 0 0 0 0 0=00>cPd�ZGYQIQIH�XGYIR�LMIN 2671347 /15:919// 8319691/67; 410/21305 8404135/; 6661796 <44=53>ePEF�_ITFfREFIR�\YGRIFGfgQ�LMIN 3791423 92:14/: 8924120/; 0 /13/3 3721509 0=57>hFIRYV�hFgYdQVQRYRQPI�LMIN 903 0 0 0 0 903 0=00>[FJ�402�]PYI�ZGMfR�LMIN 314:71779 /:1707 0 0 /:1707 3146:170: 0=67>iRVYIRQJ�[RYRQPI�ZiS�LMIN 5013951765 /41/221322 87741740; 83015531952; 8401/561424; :01402167: </0=36>jFfRfQNF�ZiS�LMIN 6/1959124/ 4612091/:3 8616:01/27; 0 401095175: 2/16//1699 43=25>kj�iRVYIRY�ZiS�LMIN 616:/1:9/ 316561624 841472164:; 0 /15571099 40130415/2 33=05>\GQIJFRPI�]YWFf�ZiS�LMIN 51:6/1//3 4177:176: 8/1//61743; 0 8/3/1732; 51/371/2: <:=/9>DYfRfQNF�ZiS�LMIN 7/1:021233 4915901925 8/15251:/4; 0 4317651/9: 409132:1076 45=4/>iRVYIRY�UFVRVQIF�ZiS�LMIN 23196/1439 3:12791262 8/:1:991602; 0 401:301497 7:140/1305 4/=:6>OYE dFVVRPI�hPYN�ZiS�LMIN /12721662 41472130/ 84471:32; 0 41062129: 3176619:/ 36=//>ePVVPaFVVlm=]=�nQIH�ZiS�LMIN /17931702 3561669 8651226; 0 /241227 31/:51676 7=54>mFRGPPVQRYI�\YGWaYK�ZiS�LMIN 415351/02 46719:0 8291/33; 0 731:06 419/21945 9=02>[RYNQME�kFQHgdPGgPPNf�ZiS�LMIN 4::1072 8/120/; 8/31965; 0 8/91:66; 44619/4 <42=36>ePRFVlmPRFV�ZYo�LMIN 0 621:0319/7 8521240159/; 84715731096; 0 0 0=00>hFIRYVlmPRPG�pFgQJVF�ZYo 0 41:4:1:96 841:4:1:96; 0 0 0 0=00>iqqPGNYdVF�ePMfQIH�LMIN :616461363 57916/0 831067132:; 0 8/1:2/199:; :51/3:1607 <5=/0>/006�rhLi�ePMfQIH�UPIN�LMIN 89961545; 0 0 9961545 9961545 0 400=00>/046�iLOhi�bPP�\YGWQIH�\GPsFJR 0 40144/142: 8441/351690; 515001000 :13691:/: :13691:/: 400=00>/046�rhLi�hFqM�ePMfQIH�UPIN /51364 0 851/321926; 51/321926 0 /51364 400=00>Z[\][Z�OYQRYV�\GPsFJR�LMIN 0 5616321075 8:/19:41026; 4/14401294 /61/061297 /61/061297 400=00>\FGFRMYV�OYGF� /0/1::9 431592 82/1/4:; 0 89219:9; 4331200 <33=74>[FJQYV�4>�[YVFf�iIN�rfF�ZYo�LMIN 80; 4:51/:315:3 0 84:51/:315:3; 0 80; 0=00>ZGMfR�LMIN 301:461920 /01/361:92 84214221:25; 419631:70 316//1:63 3:14:0145: 4/=/:>[FJQYV�hFTFIMF�ZPRYV 37:15621536 :7416301299 8/5:19001732; 84671/::1/36; 5612251974 :5/1:9:1//2 4:=96>�@����t.uv���C����CiIIMYV�UPIN�LMIN 3:51740 41233 0 0 41233 3:616:3 0=53>4727�UPIN�\GPsFJR�LMIN 0 0 895; 0 895; 895; wS_pl0x4773�[JgPPV�_E GPTFEFIR�UPIN /013:3 /6/ 0 0 /6/ /01945 4=3:>477:�hFqFGFINME�X==�UPIN�LMIN 3971267 :175/ 0 0 :175/ 36:1234 4=3:>4779�X==�\MdVQJ�_E GPTFEFIR�UPIN�\YGR�U 3/1905 :36 0 y :36 3310:/ 4=3:>4776�X==�\MdVQJ�_E GPTFEFIR�UPIN�LMIN /541564 31392 0 y 31392 /5:1737 4=3:>/000�\YGW�_E GPTFEFIR�UPIN�LMIN 4/1007 494 0 y 494 4/1460 4=3:>/004�zMYVQRK�q�]QqF�LMIN 5912:5 264 0 {|}~���� 8391627; /01059 <9:=6/>/00:�zMYVQRK�q�]QqF�LMIN 31/0: 909 8310:3; y 8/1:36; 696 <69=09>/005�U�XP�\GPsFJR�LMIN 0 0 0 y 0 0 0=00>/005i�\YGW�_E GPTFEFIR�UPIN�LMIN 315651/7: 51:25 8:271://; {�~�yy~yyy� 8417231736; 415741359 <55=:7>\MdVQJ�[YqFRK�LYJQVQRK�LMIN /91223 4 0 �~��y~}|� 51:901636 51:261947 /0343=/6>/002i�zMYVQRK�q�]QqF�_E GPTFEFIR 4150317:6 21/37 0 {��~���� 8421569; 41:251364 <4=/:>/006i�U�iLOhi�bPP�UPIN�LMIN 4091352 84091352; 0 y 84091352; 0 400=00>X�hFqMINQIH�[FGQFf�/04:i 401072 0 0 {�y~y��� 8401072; 0 <400=00>X�hFqMINQIH�[FGQFf�/04:U 2124: 0 0 {�~���� 82124:; 0 <400=00>/04:i�\YGW�_E �hFTFIMF�hFqMINQIH�UPIN /17591470 0 8973140/; {�~�yy~yyy� 8/1473140/; 6931027 <6:=47>/045�_IqGYfRGMJRMGF�UPIN�LMIN 464155/1426 /17/31/27 8321//6155/; {�~|�y~|�}� 839194:1570; 43:17361576 </4=3:>/045�mMIQJQYV�LYJQVQRQFf�UPIN�LMIN 3312241925 2761507 871:051067; �y~|�} 821:761/:3; /5132:1::/ </5=02>/049�X�\GPsFJR�LMIN 8491907; 0 4721/7/ y 4721/7/ 4241923 400=00>\YGW�_E GPTFEFIR�LMIN /14:51//3 4/13651040 8431/3/1964; y 82561994; 41/261593 <37=72>XFIFGYV�XPTFGIEFIR�OYQRYV�LMIN :3162414/6 912591:/: 871:791:/2; y 8/19:01003; :414:414/: <9=03>OYQRYV�LQIYIJF�LMIN 47160:1:92 /3519:2 8/717061:70; ��~y|�~��� 32139312:6 5210921345 47:=60>[FJQYV�iffFffEFIR�LMIN 31/571360 41/001592 0 y 41/001592 :1:571732 39=23>[PVQN�jYfRF�mYIYHFEFIR�LYJ�OPIfR�LMIN /1:94155/ 615/3 8412661009; �~���~}�y :71/96 /15401247 /=00>OYQRYV�iffFR�<�LQIYIJF�LMIN 2172616// :691037 8312331657; �~���~��� 315921597 4/15591/74 37=60>OYQRYV�LQIYIJF�<�hFJPTFGK 8960; 6/ 55/ y 9/: 8:6; 0=00>/00/�ZGYqqQJ�OPMGR�LYJQVQRK�UPIN 4:21/26 41725 0 y 41725 4501/63 4=3:>/049�ZGYqqQJ�OPMGR�LYJQVQRK�hFqMINQIH�UPIN 3163714/7 61673 0 |~���~��� 3197/1907 61:341632 0=00>/042�\MdVQJ�[YqFRK�\GPsFJR 0 30194: 8:401572; ��~�y�~��� :71//71:52 :71//71:52 0=00>[Md�<�ZPRYV /7217/31:// /:173/13:4 840613661397; 4341/5/1339 :212061306 3:6163016/7 49=33>�����?�.B�������UPIN�[QIWQIH�LMIN 3/14041:4: :/132:1007 8:0:1230; �|~|�� :/109/1595 6:14931767 434=03>-uB�.������-.���u�� ����������� ������������� ������������� ������������ ����������� ������������� ������
[rmmih��L�LrkS�Ui]ikOD�
117

�
� �
��������������������
��������������������� � ������������������������� �������������������������� ������������������������������ �� !��"#$�%��� �&'�'!�%($#�)� �*$+�%�,#�(�-#�)����'�%-��./0 1234524672818 567279:26:; <:7929112816= <6;529:62;68= <162:752641= 6::2:::2;;3 1281;269428:5 9>34?.@A 92331286;2485 71729372891 <7782959281;= 6:52:812786 6623312114 6692637249; 924432;4523:5 1>:8?BCDEFGCH�IBJKFDLMFMLCD <6:12;572731= 792:1928;7 <7925352177= <1332:;7= <:23482347= <92964299;= <6:529492;66= :>:7?NFHOP�FDQ�RSTTHSFMLCDFU <8962159= ; <:125:6= ; 83:2487 8962159 ; V6;;>;;?NFHOLDW�.STO 627;32136 3332174 <9582786= <:5;219:= 6261;2434 62;542:;1 12737273: 3;>44?NSHELM�XYDQ 616 ; <644= ; <616= <:;8= <644= V177>::?ZL[LT�ZSDMSH <928962:48= 1512415 <586216:= 1927412::; <6821612777= 928962:48 ; V6;;>;;?ZLM\�NUF]F 6124432387 85;2;;; <62:572;79= <1362:;:= 6492813 <98629:6= 612:852:57 V:>46?DMSHDFU�KSH[LTSPXUSSM�PSH[LTSP <:215;26:6= :1271;2:65 <::21362617= <::219;= 82;;; <3372;98= <92;:7264;= 1:>33?_HCY�DPYHFDTSP 3432313 69:21352346 <67624;625;3= <96274;= <1432738= <4247:2847= <42;552178= V661:>88?
Ka00ARb�@X�XaB.�cAdABZI�
118

OVERVIEW
MUNICIPALBONDRATINGS
DEBTFORECASTSUMMARIES
DEBTMANAGEMENT
FIVE YEAR PLAN
119

OVERVIEW
TheCityofAtlantaDepartmentofFinanceisresponsibleforexecutingsoundfinancialmanagementpoliciestoprovidesufficientfundingtopermitnecessaryimprovementstotheCity’sinfrastructure,asgovernedbytheMayorandCityCouncilmembers.TheOfficeoftheTreasureroperatesundertheDepartmentofFinanceandisresponsibleforthemanagementoftheCity’scash,investmentanddebtportfolios.Specifically,wheredebtmanagementisconcerned,theOffice:
Manages the City’s bond program and facilitates the execution of bond sales, strategicplanningfordebtstructuringandissuance,andongoingportfoliomanagement;
Identifiestheappropriatefundingmechanismutilizinglongtermfinancinginstrumentssuchas general obligation bonds, revenue bonds, obligations issued through state and localauthorities,andotherappropriation‐backedsecurities;
Developsdebtpolicies,capitalimprovementplans,anddebtcapacitystudies;
Managesexternalconsultantsandagencies,includingfinancialadvisors,investmentbankers,bondcounselandratingsagencies;and
AdvisesCityleadershipwhichincludesmembersoftheCabinetandCityCouncilofitsdebtpositionandtransactions,asrequired.
Thisdocumentprovidesanoverviewof theCity’sdebtmanagementprogram’smethodologyandpracticesunderthemanagementoftheOfficeoftheTreasurer.
DebtManagementObjectives
Maintaincost‐effectiveaccesstothecapitalmarketsthroughprudentpolicies;
Maintain reasonable debt and debt service payments with effective planning andcoordinationwiththeCity’sdepartments;
Meet significant capital demands through debt financing and alternative financingmechanisms;
Definetheacceptableparametersandstructureforeachtypeofdebtorobligation;and
Achieve andmaintain the highest possible credit ratings within the context of the City’scapitalneedsandfinancingcapabilities.
120

CITYOFATLANTABONDSTYPE CREDITRATING
Moody’s Standard&Poor’s
Fitch
GeneralObligationBonds Aa1 AA+ AA+WaterandWastewaterRevenueBonds Aa2 AA‐ A+HartsfieldAtlantaInternationalAirportRevenueBonds‐ SeniorLienGARBs
Aa3 AA‐ AA‐
HartsfieldAtlantaInternationalAirportRevenueBonds‐PFC/SubordinateLienGARBs
Aa3 AA‐ A+
HartsfieldAtlantaInternationalAirportRevenueBondsSeniorLienCustomerFacilityCharge
A3 A‐ A
AtlantaDevelopmentAuthority Aa1 AA+ ‐‐DowntownDevelopmentAuthority Aa1 AA+ AA+SolidWasteManagementAuthority Aa1 AA+ ‐‐CityofAtlantaandFultonCountyRecreationAuthority Aa1 AA+ ‐‐UrbanResidentialFinanceAuthority Aa1 AA+TaxAllocationDistricts N/A N/A ‐‐
MUNICIPALBONDRATINGS
121
TotalDebtOutstanding
TheCityofAtlanta’slong‐termoutstandingdebt,includingcapitalleases,bondpremiums,andbonddiscountstotaled$7.62billionasofJune30,2018,ofwhich$7.03billionhasbeenincludedintheCity’sannualbudget.Totalbudgeteddebtconsistsof$1.21billioninGeneralObligationandotherdebt(GeneralFund,TAD,CapitalLeases,Other);$2.76billioninAviationRevenueBonds,and$3.06billion inWaterandWastewaterRevenueBonds.Totaldebt fromFiscalYear2018decreasedby$163.8million.
InFiscalYear2018,theCityissuedorwasaparticipanttothefollowingdebtandotherobligations:
Debto CityofAtlantaandFultonCountyRecreationAuthorityRevenueBonds(ZooAtlanta
Parking Facility Project), Series 2017 in the aggregate principal amount of $30.4million
o Reissuance of the City of Atlanta Tax Allocation Bonds (Westside Project), Series2001,2005A,2005B,and2008intheaggregateprincipalamountof$97.1million.
o CityofAtlantaandFultonCountyRecreationAuthorityTaxableRevenueRefundingBonds,Series2017AandTaxableRevenueImprovementBonds(DowntownArenaProject),Series2017Bintheaggregateprincipalamountof$149.8million
o City of Atlanta TaxAllocation Bonds (Atlantic Station Project), Series 2017 in theaggregateprincipalamountof$85.4million
o CityofAtlantaWaterandWastewaterRevenueRefundingBonds,Series2018Aintheaggregateprincipalamountof$51.2million
Leases/OtherObligationso Atlanta Development Authority Revenue Bonds (Homeless Opportunity Project),
TaxableSeries2017intheaggregateprincipalamountof$25.7milliono AtlantaDevelopmentAuthorityRevenueBonds–BeltLineT‐SPLOSTProject,Series
2017intheaggregateprincipalamountof$47milliono GeneralFund
JohnsonControlLeaseintheprincipalamountof$12.4milliono DepartmentofAviation
NORESCOLeaseintheprincipalamountof$9.3million AmerescoHarrisLeaseintheprincipalamountof$7.71million
o DepartmentofWatershedManagement GEFALoan#15‐010intheprincipalamountof$51.4million NORESCOLeaseintheprincipalamountof$78million Ostara(NutrientSystem)intheprincipalamountof$11million SchneiderLeaseintheprincipalamountof$36.3million
Inaddition,theCityofAtlantautilizesshort‐termcommercialpapertofundspecificprojectsfortheDepartmentofAviationand theDepartmentofWatershedManagement.Asof June30,2018, thecommercialpaperoutstandingwas$305.6millionand$0,respectively.
122

Overall, the City continues to generate enough cash from various revenue streams to cover itsoperatingcosts,makepaymentsonoutstandingdebtobligationsandbuildfuturereserves.
FY2018PrincipalandInterestPayments
InFiscalYear2018,approximately$612.1millioninrevenueswereusedtoservicetheoutstandinglong‐termdebtobligationsoftheCity‐$282.5millionofthistotalwasspentonprincipaland$329.6milliononinterestpayments.Thetotaldebtpaymentsbyissuecategoryareasfollows:
Aviation Water/Wastewater GeneralFund&Other
TADs GeneralObligation
$259.1M $218.5M $47.6M $46.7M $40.2M
$259 $219
$48 $47 $40 $‐
$50
$100
$150
$200
$250
$300
Department ofAviation
Department ofWatershed
General Fund &Other
TAD General Obligation
$ in
Millions
Total
123

DebtComparison
AttheendofFiscalYear2018,theCity’stotaldebtoutstandingexcludingpremiums,discounts,anddeferred insurancepremiumswas$7.21billion,ofwhich$7.03billionwas included in theCity’sannualbudget.
AllLong‐TermDebt–HistoricalPayments
Duringthelast10years,from2009to2018,theCityhasspent$5.4billioninprincipalandinterestpaymentsonall itsoutstandingdebtobligations. Thepaymentswere for theGObonds,Conduitbonds,GeneralFundbonds,IntergovernmentalAgreements,CapitalLeases,Aviationbonds,WaterandWastewater bonds, and Commercial Paper. The overall annual debt payment has increasedapproximately1.5timesfrom$415.7in2009to$611.8in2018.
$2,924 $2,881
$499 $542 $350
$3,060 $2,762
$479 $406 $325
$‐
$500
$1,000
$1,500
$2,000
$2,500
$3,000
$3,500
Department ofWatershedManagement
Department ofAviation
Conduit (TADs) General Fund &Other
GeneralObligation
$ in
Millions
Outstanding Par 6/30/2017 Outstanding Par 6/30/2018
$416 $464 $466
$545 $605
$557 $586 $633
$549 $612
$‐
$100
$200
$300
$400
$500
$600
$700
FY09 FY10 FY11 FY12 FY13 FY14 FY15 FY16 FY17 FY18
$ In
Millions
124
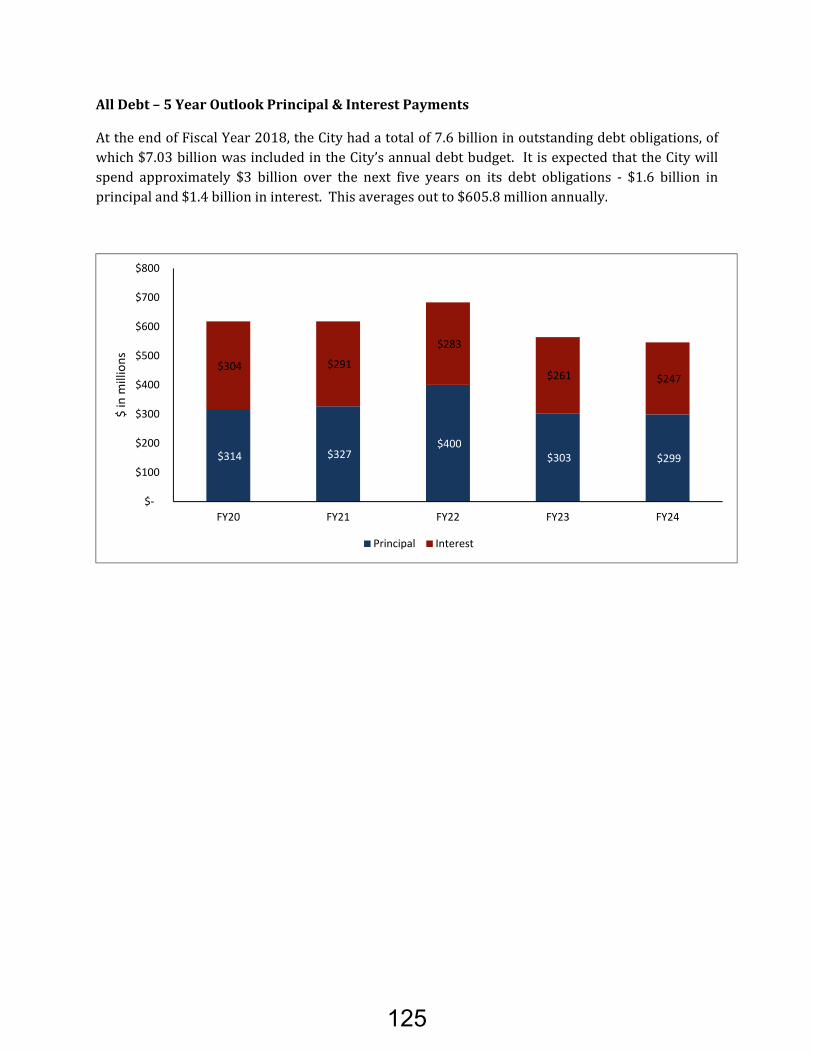
AllDebt–5YearOutlookPrincipal&InterestPayments
AttheendofFiscalYear2018,theCityhadatotalof7.6billioninoutstandingdebtobligations,ofwhich$7.03billionwasincludedintheCity’sannualdebtbudget. ItisexpectedthattheCitywillspend approximately $3 billion over the next five years on its debt obligations ‐ $1.6 billion inprincipaland$1.4billionininterest.Thisaveragesoutto$605.8millionannually.
$314 $327 $400
$303 $299
$304 $291
$283
$261 $247
$‐
$100
$200
$300
$400
$500
$600
$700
$800
FY20 FY21 FY22 FY23 FY24
$ in m
illions
Principal Interest
125
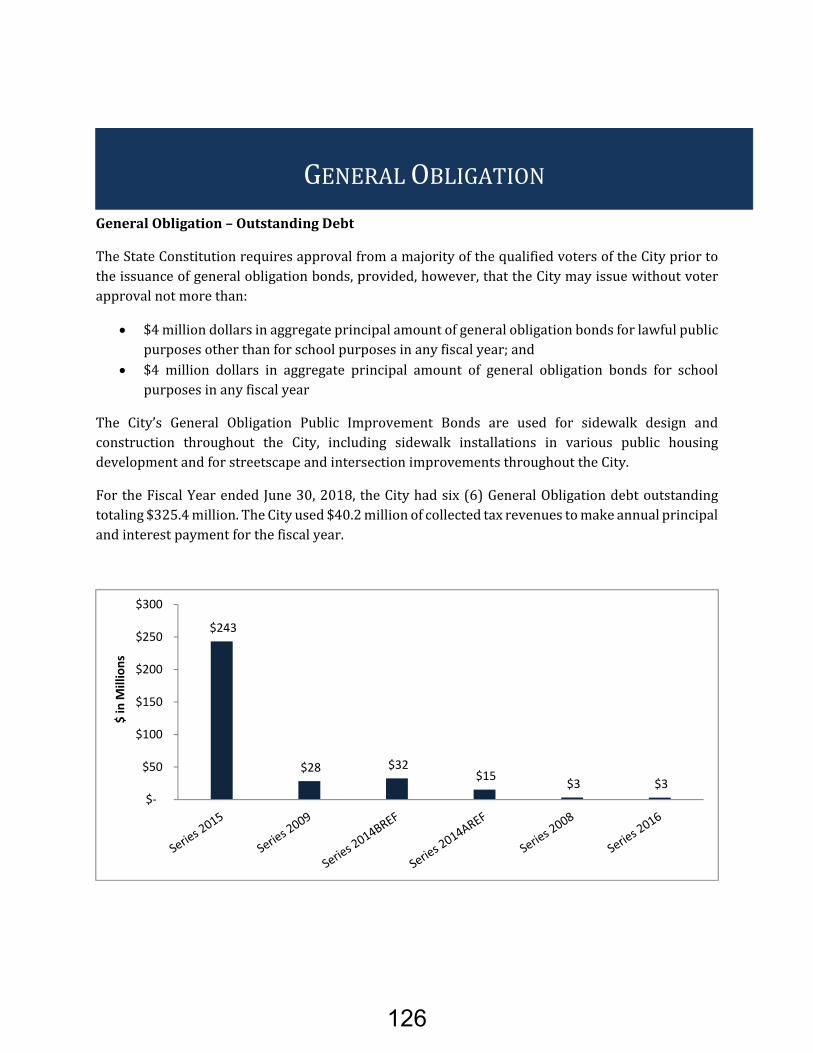
GeneralObligation–OutstandingDebt
TheStateConstitutionrequiresapprovalfromamajorityofthequalifiedvotersoftheCitypriortotheissuanceofgeneralobligationbonds,provided,however,thattheCitymayissuewithoutvoterapprovalnotmorethan:
$4milliondollarsinaggregateprincipalamountofgeneralobligationbondsforlawfulpublicpurposesotherthanforschoolpurposesinanyfiscalyear;and
$4 million dollars in aggregate principal amount of general obligation bonds for schoolpurposesinanyfiscalyear
The City’s General Obligation Public Improvement Bonds are used for sidewalk design andconstruction throughout the City, including sidewalk installations in various public housingdevelopmentandforstreetscapeandintersectionimprovementsthroughouttheCity.
FortheFiscalYearendedJune30,2018,theCityhadsix(6)GeneralObligationdebtoutstandingtotaling$325.4million.TheCityused$40.2millionofcollectedtaxrevenuestomakeannualprincipalandinterestpaymentforthefiscalyear.
$243
$28 $32 $15
$3 $3 $‐
$50
$100
$150
$200
$250
$300
$ in
Millions
GENERALOBLIGATION
126

GeneralObligation–HistoricalPayments
Duringthelast10yearsfrom2009to2018,theCityhasspent$352.2millioninprincipalandinterestpaymentson itsGObonddebt. DuringthisperiodGOannualdebtpaymentshasaveraged$35.2million.
GeneralObligationDebt–5YearOutlook‐Principal&InterestPayments
$187.6millionintotaltaxrevenueswillbeusedtomakeprincipalandinterestpaymentsontheCity’sGeneralObligationdebtoutstandinginthenext5years.$127.1millionor67.7%ofthetotalamountwillbeusedforprincipalpaymentsand$60.5millionor32.3%forinterest.
$31 $29 $27 $25 $26 $26
$63 $60
$24
$40
$0
$10
$20
$30
$40
$50
$60
$70
FY09 FY10 FY11 FY12 FY13 FY14 FY15 FY16 FY17 FY18
$ in
millions
$26 $28 $29 $26
$16
$14 $13 $12
$10
$10
$‐
$5
$10
$15
$20
$25
$30
$35
$40
$45
FY20 FY21 FY22 FY23 FY24
$ in m
illions
Principal Interest
127

TADs–OutstandingDebt
TheCityhasissuedbondstofundvariousCapitalImprovementProjects(CIP)inspeciallydesignatedtaxdistricts;thesebondissuancesaredeemedasconduitdebtobligationsoftheCity.Taxreceiptsfromthedesignateddistrictsareusedtomakeannualdebtservicepaymentswhendue.
ForFiscalYear2018,theCityhadsixteen(16)TADbonds/obligationsoutstandingwithatotalvalueof$478.9million.TheCityused$46.8millionoftaxreceiptsfromthevariousdesignateddistrictstomakeannualprincipalandinterestpayments.
TAD–HistoricalPayments
Between2009and2018theCityhasspent$364.9milliononprincipalandinterestpaymentsonitsconduitdebtoutstanding. During thisperiod theannualdebtpaymenthas increased from$29.5millionin2009to$46.8millionin2018.Theaverageannualdebtservicepamentsforthelast5yearswas$38.1million.
$85 $71
$48 $47 $37 $37 $34 $33 $27 $20 $17
$5 $6 $5 $4
$3 $‐ $20 $40 $60 $80
$100
$ In
Millions
$29
$38 $33 $35
$39 $31
$36 $42
$35
$47
$‐
$10
$20
$30
$40
$50
FY09 FY10 FY11 FY12 FY13 FY14 FY15 FY16 FY17 FY18
$ in
millions
TaxAllocationDistricts(TADs)
128

TADs‐5YearOutlook‐Principal&InterestPayments
In thenext5years it is expected that theCitywillmake$349.9million inprincipal and interestpaymentsonitsoutstandingConduitdebt.$272.9millionor78.0%ofthetotalamountwillbeusedtomakeannualprincipalpaymentsand$76.9millionor22.0%ininterest.
$45 $48
$112
$38 $30
$19 $18
$15
$13 $12
$‐
$20
$40
$60
$80
$100
$120
$140
FY20 FY21 FY22 FY23 FY24
$ in m
illions
Principal Interest
129

GeneralFund&OtherOutstandingDebt
TheGeneralFundandOtherdebtobligationsoftheCityconsistofbondsissuedforvariouspurposesandCapitalLeaseagreements.ForFiscalYear2018,$406.0millionoftheGeneralFundandOtherdebtobligationsincludingInter‐GovernmentalAgreements(IGA)remainedoutstandingforbudgetpurposes1
GeneralFund&Other‐HistoricalPayments
Between2009and2018theCitypaid$425.2onprincipalandinterestonitsgeneralfundandotherdebt outstanding recorded in its annual budget. During this period, the debt payments haveincreasedfrom$45.0millionin2009to$47.6millionin2018.
1 The annual debt budget excludes the following debt: Atlanta Development Authority Revenue Bonds (New Downtown Atlanta Stadium Project), Series 2015A‐1, Series 2015A‐2, and Series 2015B.
$60 $56
$43 $38
$32 $30 $27 $26 $25 $15 $15 $10 $9 $8
$7
$5 $‐ $10 $20 $30 $40 $50 $60 $70
$ In
Millions
$45 $45 $47 $47
$56 $51 $48 $51
$35
$48
$‐
$10
$20
$30
$40
$50
$60
FY09 FY10 FY11 FY12 FY13 FY14 FY15 FY16 FY17 FY18
$ In
Millions
GENERALFUND&OTHER
130

GeneralFund–5YearOutlook–Principal&InterestPayments
Inthenext5years,itisexpectedthat$198.2millionofGeneralFundandOtherrevenueswillbeusedtomakeannualdebtservicepayments.ThepaymentsincludeInter‐governmentalagreementsthattheCityhaswithotherauthorities.$133.2millionofthetotalamountwillbeusedtomakeprincipalpaymentsand$65.0millionforinterestpayments.
$29 $30 $27 $22 $25
$16 $14 $13
$12 $11
$‐
$5
$10
$15
$20
$25
$30
$35
$40
$45
$50
FY20 FY21 FY22 FY23 FY24
$ in m
illions
Principal Interest
131

DepartmentofAviation–OutstandingDebt
TheCityofAtlantaisoneof4citiesinthenationthatownsandoperatesaWorldClassInternationalairport. Tomaintain itsposition, theCity issuesbonds forongoingcapital improvementprojectswhicharepledgedagainst itsrevenuesandhaveequal lienparity. RevenuespledgedagainstthebondsissuedareeitherGeneralrevenues,PassengerFacilityChargesorCustomerFacilityChargesrevenues.
AttheendofFiscalYear2018,theDepartmentofAviationhad$2.76billioninoutstandinglong‐termdebtthatconsistsofGeneralAirportRevenueBonds(9),PassengerFacilityChargeBonds(2),andCustomerFacilityChargeBonds(2).AllthesebondswereeitherissuedasAlternativeMinimumTax(AMT)orNon‐AlternativeMinimumTax(Non‐AMT).Thedepartmentalsohas$300millioninBondAnticipation Notes (BANs) and $300 million in short‐term Commercial Paper notes that wereoutstandingattheendofthefiscalyear.
$524
$387
$244
$210
$172 $171 $160
$147 $136
$119 $110
$59
$14 $9
$‐
$100
$200
$300
$400
$500
$600
$ In
Millions
DEPARTMENTOFAVIATION
132
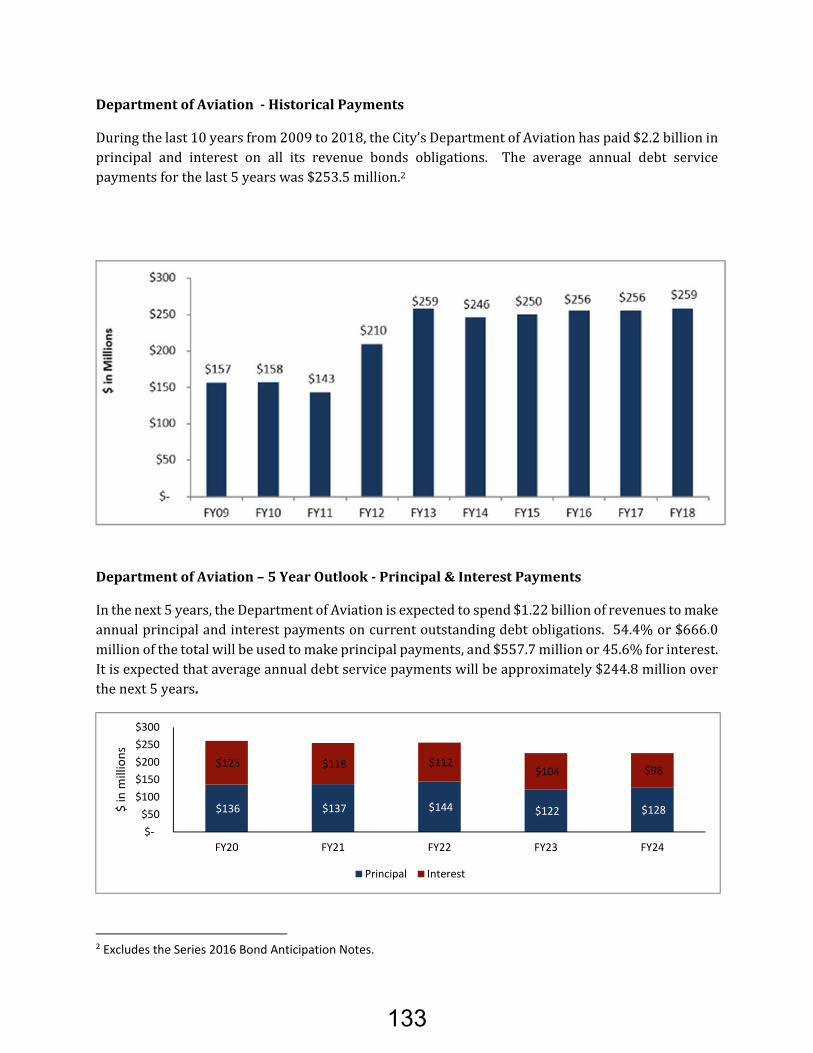
DepartmentofAviation‐HistoricalPayments
Duringthelast10yearsfrom2009to2018,theCity’sDepartmentofAviationhaspaid$2.2billioninprincipal and interest on all its revenue bonds obligations. The average annual debt servicepaymentsforthelast5yearswas$253.5million.2
DepartmentofAviation–5YearOutlook‐Principal&InterestPayments
Inthenext5years,theDepartmentofAviationisexpectedtospend$1.22billionofrevenuestomakeannualprincipalandinterestpaymentsoncurrentoutstandingdebtobligations.54.4%or$666.0millionofthetotalwillbeusedtomakeprincipalpayments,and$557.7millionor45.6%forinterest.Itisexpectedthataverageannualdebtservicepaymentswillbeapproximately$244.8millionoverthenext5years.
2 Excludes the Series 2016 Bond Anticipation Notes.
$136 $137 $144 $122 $128
$125 $118 $112 $104 $98
$‐
$50
$100
$150
$200
$250
$300
FY20 FY21 FY22 FY23 FY24
$ in m
illions
Principal Interest
133

DepartmentofWatershedManagement–OutstandingDebt
TheDepartmentofWatershedManagementisresponsibleforoperatingandmaintainingtheCity’sWaterandWastewatersystemincompliancewithfederalandstateregulations.Thedepartmenthasissued long‐termbonds, state revolving loans, commercial paper, andother financing vehicles toprovidefundingforitscapitalimprovementprojects.Thebondsandloansissuedarepledgedagainsttherevenuesgeneratedbythesystem.
ForFiscalYear2018,theDepartmenthad$3.06billionofoutstandinglong‐termdebtandobligationswhich consisted of $2.73 billion of senior‐lien debt, $201.7million of subordinate‐lien debt and$130.69millionofother long‐termobligations.TheDepartmentalso issueda$125millionshort‐termcommercialpaperprogram.
2015, $1,235,150
2009B, $185,825 1999A, $174,700
2017A, $226,175
2013B, $164,560
2013A‐1, $178,735
2004A, $134,110
2008, $106,795
2001A, $85,055
2009A, $38,270
2018A, $51,210
2013A‐2C, $50,000 2013A‐2B, $48,645
2013A‐2A, $48,630
Outstanding Senior Lien Debt
DEPARTMENTOFWATERSHEDMANAGEMENT
134

DepartmentofWatershedManagementDebt‐HistoricalPayments
DuringFiscalYears2009to2018,theCity’sDepartmentofWatershedManagement(DWM)haspaid$2.0billioninprincipalandinterestonallitsrevenuebondsandotherobligations,whichhasbeenrestated in the past five fiscal years to include swap, capital leases, installment purchases, andcommercialpaperpayments. Theannualdebt (includingother liabilitypayments)has increasedfrom$152.9millioninFiscalYear2009to$218.2millioninFiscalYear2018.TheaverageannualdebtforthelastfiveFiscalYearswas$206.4million.Itisexpectedthatoverallannualdebtincludingotherliabilitypaymentswillbeapproximately$214.0millionoverthenext5years.ThedecreaseinannualdebtfortheDepartmentistheresultofabondrefundingopportunitythattheDepartmentexecutedinFiscalYear2018whichprovidedanetpresentvaluesavingsof$.32million.
(1)InFiscalYear2017,FiscalYear2013through2017weremodifiedto includeOtherObligationswhichincludeswap,capitallease,installmentpurchase,andcommercialpaperpayments.
$78
$51
$36 $31
$23 $23 $23 $15 $14 $14 $11
$5 $4 $2 $2
0.0010.0020.0030.0040.0050.0060.0070.0080.0090.00
Millions
Outstanding SubordinateLien Debt and Other Obligations
135

DepartmentofWatershedManagement–Five‐YearOutlook‐Principal&InterestPayments
TheDepartmentofWatershedisexpectedtomakeapproximately$5.0billionintotalprincipalandinterestpayments throughmaturity.This represents anaverageof approximately$203.2millionannually.$3billionor60%ofthetotalamountwillbeusedtomakeannualprincipalpaymentsand$2billionor40%ininterest.
ItisexpectedthattheDepartmentwillexecutebothshort‐termandlong‐termfinancialopportunitiesastheybecomeavailablewhichwillimpactitsfive‐yearoutlook.
$78 $84 $87 $95 $100
$130 $128 $131 $121 $117
$‐
$50
$100
$150
$200
$250
FY20 FY21 FY22 FY23 FY24
$ in m
illions
Principal Interest
136

CAPITAL PROJECT
STATUS
SUMMARIES
FIVE YEAR PLAN
CAPITAL PROJECT STATUS OVERVIEW
137

138
CAPITALPROJECTSTATUSOVERVIEW
ThequalityoflifeforCityofAtlantaresidentsdependsonthereliabilityoftransportation,thedependabilityofwater,wastewater,andstormwatersystems,theabilitytosafelydisposeofwaste,theaccessibilitytocultureandrecreation,andmanyotheressentialpublicservices. Qualityservicelevelscanbeachievedbyproperenhancement, replacement, and maintenance of capital assets by implementing a Capital ImprovementProgram(CIP).
Inorder toqualify as aCapital ImprovementProject, the item inquestionmustmeetoneof the followingcriteria: Realpropertyacquisition(Land) Constructionofnewfacilities Addition(amodificationthatchangesthestructural“footprint”ofthefacility)toexistingfacilitiesgreater
thanorequalto$25,000 Remodeling/repair/preservationoftheinterior/exteriorofanyfacilitygreaterthanorequalto$25,000 Demolitionofexistingfacilitiesgreaterthanorequalto$25,000 Majorequipmentitemsorprojectsincludingcomputerinfrastructure,whichasawholearegreaterthan
orequalto$25,000(excludesvehiclesunless>=$50,000) Infrastructureprojects(aroad,bridge,intersection,drainagesystem,orsewerstructure,etc.) Planningandinventorystudiesinexcessof$25,000Projectcostsincludeallphasesofaproject,includingplanning,design,utilityrelocation,rightofwayacquisition,etc.AllphasesoftheprojectarebudgetedinaCapitalProjectsFund.
TheCityofAtlantadevelopsitscapitalprojectsbudgetbasedonitsCapitalImprovementsProgramprocess.Thisprocessisthemechanismforoperatingdepartmentstorequestprogrammingoffundsforfuturecapitalneeds,andisdesignedtocoordinatecapitalprojectsrequirementswithavailableresources.Acapitalprojectmaybedividedintovariouscostcentersforaccountingpurposes. Eachcenterrepresentsthebudgetingoffundsforaparticularprojectbyanorganizationalunitwithinafund.
TheFY2020toFY2024fiveyearplanprovidesthestatusofactivecapitalprojectsthatareneworwillcontinuefrom the previous fiscal year. All anticipated project costs are spread over the five year periodwith theexceptionofprojectsanticipatedtobeexpensedandclosed‐outinthecurrentyear.Fortheseprojects,fundingwillnotbeallocatedinfutureyears.
139
140

FY20-FY24 FIVE YEAR PLANCAPITAL PROJECT STATUSTsplost Capital Project Fund
FY20 FY21 FY22 FY23 FY24 Total
DEPARTMENT TOTALS
Department Of Public Works 48,272,386 46,757,542 42,908,504 14,121,023 $152,059,455
Total City Wide $48,272,386 $46,757,542 $42,908,504 $14,121,023 $152,059,455
PROJECT TOTALS BY DEPARTMENT FY20 FY21 FY22 FY23 FY24 Total
Department Of Public Works
Complete Streets - 112754 10,145,469 10,145,469 8,588,320 8,595,254 $37,474,512
Multi-Use Trails - 112755 734,837 734,837 0 0 $1,469,674
Sidewalks And Streetscapes - 112756 6,515,651 6,515,651 4,958,501 1,844,201 $19,834,004
Signal Coordination - 112759 4,420,453 4,420,453 4,420,453 1,306,153 $14,567,512
Partnership & Matching Funding - 112762 14,844 0 0 0 $14,844
Program Managemnet - 112763 2,604,750 2,604,750 2,604,750 0 $7,814,250
Atlanta Beltine - 112767 13,180,000 13,180,000 13,180,099 0 $39,540,099
Committed Project Contingency - 112768 3,000,000 3,000,000 3,000,000 0 $9,000,000
Default - 000000 7,656,382 6,156,382 6,156,382 2,375,415 $22,344,560
Sub-Total $48,272,386 $46,757,542 $42,908,504 $14,121,023 $152,059,455
Total City Wide $48,272,386 $46,757,542 $42,908,504 $14,121,023 $152,059,455
141

FY20-FY24 FIVE YEAR PLANCAPITAL PROJECT STATUS
Atlanta Beltline Tad
FY20 FY21 FY22 FY23 FY24 Total
DEPARTMENT TOTALS
Non-Departmental 1,100,000 1,100,000 1,100,000 1,100,000 $4,400,000
Total City Wide $1,100,000 $1,100,000 $1,100,000 $1,100,000 $4,400,000
PROJECT TOTALS BY DEPARTMENT FY20 FY21 FY22 FY23 FY24 Total
Non-Departmental
Default - 000000 1,100,000 1,100,000 1,100,000 1,100,000 $4,400,000
Sub-Total $1,100,000 $1,100,000 $1,100,000 $1,100,000 $4,400,000
Total City Wide $1,100,000 $1,100,000 $1,100,000 $1,100,000 $4,400,000
142

FY20-FY24 FIVE YEAR PLANCAPITAL PROJECT STATUS2015 Infrastructure Bond Fun
FY20 FY21 FY22 FY23 FY24 Total
DEPARTMENT TOTALS
Department Of Public Works 65,791,951 4,055,214 $69,847,165
Total City Wide $65,791,951 $4,055,214 $69,847,165
PROJECT TOTALS BY DEPARTMENT FY20 FY21 FY22 FY23 FY24 Total
Department Of Public Works
Transportation Infrastructure - 112184 48,651,122 0 $48,651,122
District 1 - 112203 1,315,832 299,186 $1,615,017
District 2 - 112204 1,601,921 391,659 $1,993,579
District 3 - 112205 1,624,133 403,471 $2,027,604
District 4 - 112206 1,574,401 377,899 $1,952,300
District 5 - 112207 1,620,799 401,800 $2,022,599
District 6 - 112208 1,623,404 403,074 $2,026,478
District 7 - 112209 1,639,493 407,226 $2,046,719
District 8 - 112210 1,624,924 404,530 $2,029,454
District 9 - 112211 1,546,225 366,851 $1,913,076
Council District 10 - 112212 723,946 138,794 $862,740
District 11 - 112213 1,011,264 229,671 $1,240,935
District 12 - 112214 1,234,487 231,054 $1,465,542
Sub-Total $65,791,951 $4,055,214 $69,847,165
Total City Wide $65,791,951 $4,055,214 $69,847,165
143

FY20-FY24 FIVE YEAR PLANCAPITAL PROJECT STATUS
2015 Municipal Facilites Bond Fund
FY20 FY21 FY22 FY23 FY24 Total
DEPARTMENT TOTALS
Executive Offices 18,213,816 $18,213,816
Total City Wide $18,213,816 $18,213,816
PROJECT TOTALS BY DEPARTMENT FY20 FY21 FY22 FY23 FY24 Total
Executive Offices
Municipal Facilities - 112217 13,104,456 $13,104,456
District 1-Facilities - 112221 397,583 $397,583
District 2-Facilities - 112223 471,120 $471,120
District 3-Facilities - 112224 474,905 $474,905
District 4-Facilities - 112225 476,457 $476,457
District 5-Facilities - 112226 448,833 $448,833
District 6-Facilities - 112227 483,368 $483,368
District 7-Facilities - 112228 473,858 $473,858
District 8-Facilities - 112229 463,547 $463,547
District 9-Facilities - 112230 466,017 $466,017
District 10-Facilities - 112231 470,262 $470,262
District 11-Facilities - 112232 483,410 $483,410
Sub-Total $18,213,816 $18,213,816
Total City Wide $18,213,816 $18,213,816
144
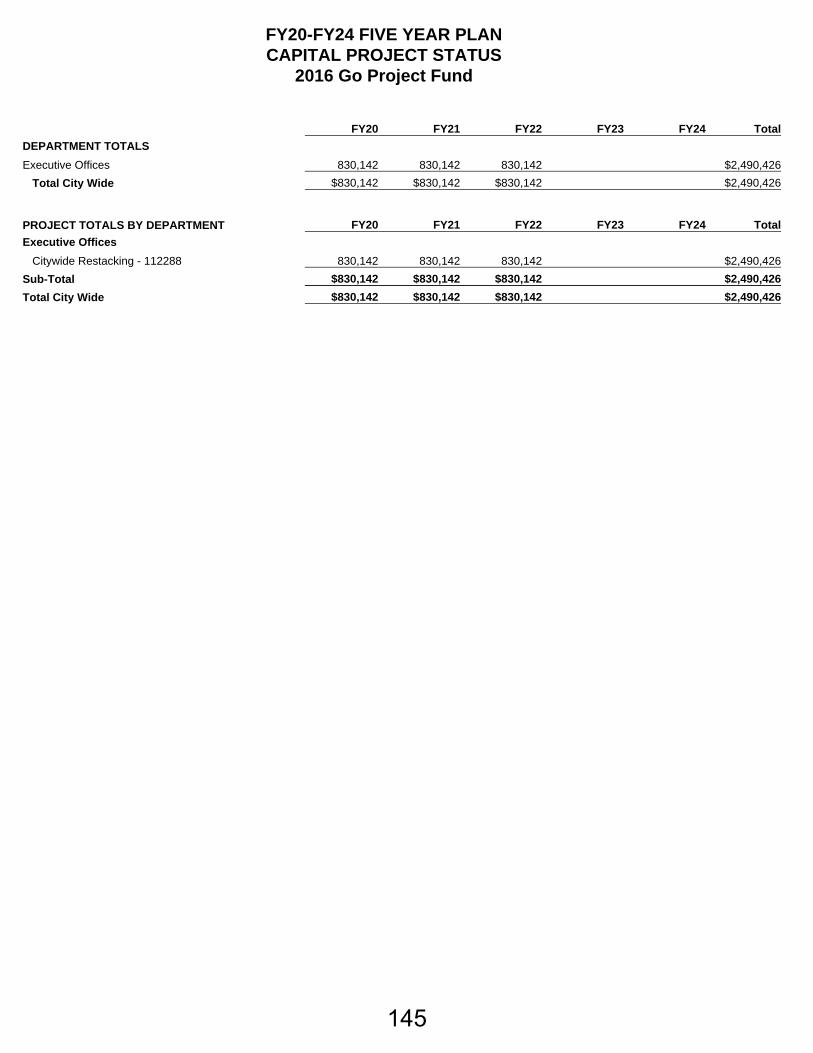
FY20-FY24 FIVE YEAR PLANCAPITAL PROJECT STATUS
2016 Go Project Fund
FY20 FY21 FY22 FY23 FY24 Total
DEPARTMENT TOTALS
Executive Offices 830,142 830,142 830,142 $2,490,426
Total City Wide $830,142 $830,142 $830,142 $2,490,426
PROJECT TOTALS BY DEPARTMENT FY20 FY21 FY22 FY23 FY24 Total
Executive Offices
Citywide Restacking - 112288 830,142 830,142 830,142 $2,490,426
Sub-Total $830,142 $830,142 $830,142 $2,490,426
Total City Wide $830,142 $830,142 $830,142 $2,490,426
145

FY20-FY24 FIVE YEAR PLANCAPITAL PROJECT STATUS
Park Improvement Fund
FY20 FY21 FY22 FY23 FY24 Total
DEPARTMENT TOTALS
Dept Of Parks & Recreation 550,281 1,062,028 1,573,778 2,075,327 $5,261,414
Total City Wide $550,281 $1,062,028 $1,573,778 $2,075,327 $5,261,414
PROJECT TOTALS BY DEPARTMENT FY20 FY21 FY22 FY23 FY24 Total
Dept Of Parks & Recreation
City Wide Park Furniture & Play Equip. - 100271 973 973 973 973 $3,893
Municipal Arts Reserve - 100282 26,481 26,481 26,481 26,481 $105,925
Default - 000000 521,948 1,033,695 1,545,445 2,046,995 $5,148,083
Southside Butler Street Ymca, Cd-220 - 200409 878 878 878 878 $3,514
Sub-Total $550,281 $1,062,028 $1,573,778 $2,075,327 $5,261,414
Total City Wide $550,281 $1,062,028 $1,573,778 $2,075,327 $5,261,414
146

FY20-FY24 FIVE YEAR PLANCAPITAL PROJECT STATUS
General Government Capital Fund
FY20 FY21 FY22 FY23 FY24 Total
DEPARTMENT TOTALS
Department Of Finance 10,108,068 10,662,468 11,034,358 0 $31,804,894
Department Of Public Works 15,162,394 15,595,380 14,678,380 0 $45,436,153
Dept Of Parks & Recreation 2,916,547 2,343,198 1,988,345 0 $7,248,090
Department Of Fire Services 2,056,875 2,017,448 2,000,000 0 $6,074,322
Department Of Police Services 78,169 78,169 78,169 0 $234,507
Department of City Planning 107,055 107,055 107,055 0 $321,165
Total City Wide $30,429,108 $30,803,717 $29,886,307 $0 $91,119,131
PROJECT TOTALS BY DEPARTMENT FY20 FY21 FY22 FY23 FY24 Total
Department Of Finance
Admin.Development Recoupment Fees - 201072 10,108,068 10,662,468 11,034,358 0 $31,804,894
Sub-Total $10,108,068 $10,662,468 $11,034,358 $0 $31,804,894
Department Of Public Works
Bakers Ferry Sidewalk, Cd-443 - 101205 40,715 40,715 40,715 $122,145
Greenbriar Parkway Reconstruction - 101231 161 161 161 $483
Bicycle Rack Project - 101491 19,546 19,546 19,546 0 $58,639
Cleveland Ave Sidewalk (Phase Ii) - 101631 2,295 2,295 2,295 $6,884
Custer Avenue Sidewalk - 101632 48,514 48,514 48,514 $145,542
North Highland Avenue Sidewalk - 101633 575 575 575 $1,725
Niskey Lake Road Sidewalk - 101634 13,638 13,638 13,638 $40,914
Northside Drive Sidewalk - 101635 49,703 49,703 49,703 $149,109
Wieuca Road Sidewalk (Phase Ii) - 101639 3,084 3,084 3,084 0 $9,251
Stewart Ave (Metropolitan Pkwy) Sidewalk - 101640 12,333 12,333 12,333 $36,999
Cleveland Avenue (Phase I) - 101657 12,553 12,553 12,553 $37,660
Pryor Road Streetscape - 101659 50,469 50,469 50,469 $151,408
Avon Avenue Sidewalk - 101660 499 499 499 $1,496
Bolton Road Sidewalk (Phase I) - 101662 654 654 654 $1,961
Bolton Road Sidewalk (Phase Ii) - 101663 42,088 42,088 42,088 $126,265
Benjamin E. Mayes Drive Sidewalk - 101798 3,315 3,315 3,315 $9,944
Forest Park Road Sidewalk - 101799 14,500 14,500 14,500 $43,500
Gilbert Road Sidewalk - 101800 685 685 685 $2,054
Glenwood Ave. Sidewalk - 101801 713 713 713 $2,139
Hank Aaron Dr. Sidewalk - 101802 7,191 7,191 7,191 $21,573
Jonesboro Rd. (Sr54) Sidewalk (Phase I) - 101803 1 1 1 0 $2
Jonesboro Rd. (Sr54) Sidewalk (Phase Ii) - 101804 2,830 2,830 2,830 $8,490
Morosgo Drive Sidewalk - 101805 2,596 2,596 2,596 $7,788
Peyton Road Sidewalk - 101806 45,500 45,500 45,500 $136,500
W. Paces Ferry/Paces Ferry Rd. Sidewalk - 101807 15,920 15,920 15,920 $47,760
Traffic Calming - 101841 4,424 4,424 4,424 $13,272
City Of Atl Schools Sidewalks Project B - 101844 12,845 12,845 12,845 $38,535
Fairburn Road Sidewalk & Bike Lane - 101845 43,090 43,090 43,090 $129,269
Ashby Street Sidewalk - 101850 2,355 2,355 2,355 $7,065
Castlewood Drive Sidewalk - 101852 2,671 2,671 2,671 $8,012
Defoors Avenue Sidewalk - 101854 37,403 37,403 37,403 0 $112,208
147

FY20-FY24 FIVE YEAR PLANCAPITAL PROJECT STATUS
General Government Capital Fund
FY20 FY21 FY22 FY23 FY24 Total
Grant Way Sidewalk - 101858 3,968 3,968 3,968 $11,905
Hank Aaron Avenue Sidewalk - 101859 3,867 3,867 3,867 $11,600
Hatcher Avenue Sidewalk - 101860 10,000 10,000 10,000 $30,000
Hemphill School Road Sidewalk - 101861 1,766 1,766 1,766 $5,299
Lakewood Trail - 101862 13,858 13,858 13,858 $41,573
Mcdonough Boulevard Sidewalk - 101863 10,552 10,552 10,552 $31,655
Monroe Drive Sidewalk - 101865 4,639 4,639 4,639 $13,918
Pine Street Sidewalk - 101867 9,470 9,470 9,470 $28,410
Violet Avenue Sidewalk - 101870 0 0 0 $1
Woodland Avenue Sidewalk - 101871 129 129 129 $386
Cheshire Bridge Road Streetscape - 101872 21,575 21,575 21,575 $64,725
Cherokee Avenue Pedestrian Improvements - 101873 181 181 181 $544
Westend Sidewalks, Cd-659 - 101955 6,177 6,177 6,177 $18,531
Lindbergh/Lavista/Cheshire Br. Imprvs - 101982 200,584 584 584 $201,753
Campbellton/Greenbriar/Langford Inter - 101983 5,793 5,793 5,793 $17,380
Airline St. & Ezzard St. Reconstruct - 101984 11 11 11 $33
Citywide Traffic Signal Improvement - 101985 600,018 200,004 167,004 0 $967,026
Roxboro Road Widening - 102000 4,405 4,405 4,405 $13,216
Perry Homes Sidewalks - 102102 20,004 20,004 20,004 $60,012
Ashby Street Streetscape - 102105 34,723 34,723 34,723 $104,169
Metropolitan Pkwy Streetscape - 102108 3,904 3,904 3,904 $11,711
Midtown Streetscape - 102109 55,084 55,084 55,084 $165,252
Moreland Avenue Streetscapes - 102110 328 328 328 $984
North Highland Ave Streetscapes - 102111 186,636 186,636 186,636 $559,907
Peachtree Road Streetscapes - 102112 250,554 250,554 250,554 $751,661
Ponce De Leon Ave Streetscapes - 102113 34,078 34,078 34,078 $102,233
Mlk, Jr., Dr. Corridor Improvements - 102281 0 0 0 0 $0
Perry Blvd/Hollywood - 102319 23,592 23,592 23,592 $70,776
Prior Road Streetscapes - 102321 15,000 15,000 15,000 $45,000
Lee Street Lci Grant - 102383 62,721 62,721 62,721 $188,164
Ralph David Abernathy Lci Grant - 102384 25,564 25,564 25,564 $76,693
Barge Rd./Campellton Lci Grant - 102385 50,250 50,250 50,250 0 $150,749
Greenbriar Pkwy-Langford Lci Grant - 102386 81 81 81 $244
Headland Dr. Streetscape Lci Grant - 102387 1,568 1,568 1,568 $4,704
Highland Corridor - 102390 65,941 65,941 65,941 $197,823
Landrum Drive Exit - 102391 175,000 175,000 0 $350,000
Piedmont/Lindbergh Transportation Improv - 102438 98 98 98 $293
Collier Rd Sidewalk Project - 102629 21 21 21 $63
City Wide Intersection Timing Loop - Det - 102642 63,725 63,725 63,725 0 $191,175
Hermi'S Bridge Project - 102730 23,309 23,309 23,309 0 $69,927
Citywide Greenway Trail Projects - 102847 60,820 40,820 20,820 0 $122,459
Piedmont Intersection Impr - 110253 18,000 18,000 18,000 0 $54,000
Memorial Dr Sidewalks - 110255 4,261 4,261 4,261 0 $12,783
Windemere Dr Sidewalks - 110256 564 564 564 0 $1,692
Freemont Ave Rd Constr - 110257 99,472 99,472 99,472 0 $298,416
City Hall Sidewalks - 110259 200,000 200,000 200,000 0 $600,000
148

FY20-FY24 FIVE YEAR PLANCAPITAL PROJECT STATUS
General Government Capital Fund
FY20 FY21 FY22 FY23 FY24 Total
Hollywood Road Impr - 110261 14,871 14,871 14,871 0 $44,614
Ada Ramps & Ada Sidewalk Imp, Cityw - 110262 218,507 218,507 218,507 0 $655,521
Buckhead Village Redevelopment - 110892 24,041 24,041 24,041 0 $72,124
Dl Hollowell/Westlake-Lci - 111105 114,601 114,601 114,601 0 $343,802
Glenwood/Moreland-Lci - 111106 4,403 4,403 4,403 0 $13,210Atlanta University Center Pedestrian Streetscape - 112170 7,500 7,500 7,500 0 $22,500
Cycle Atlanta Phase 1.0 Bucycle Mobility - 112172 2,000 2,000 2,000 0 $6,000
12Th Street Two-Way Conversion - 112174 30,000 30,000 30,000 0 $90,000
Sr260/Sr42 Intersection Realignment - 112176 868 868 868 0 $2,603
D.I.F.Admin-Transportation-City - 201053 11,880,447 12,933,447 12,244,447 0 $37,058,342
Sub-Total $15,162,394 $15,595,380 $14,678,380 $0 $45,436,153
Dept Of Parks & Recreation
Centennial Park Trail - 101643 250,000 0 0 0 $250,000
Green Space Pgm., Parks North - 201997 2,666,547 2,343,198 1,988,345 0 $6,998,090
Sub-Total $2,916,547 $2,343,198 $1,988,345 $0 $7,248,090
Department Of Fire Services
Fire Station 22 Construction - 100170 56,875 17,448 0 0 $74,322
Afr Facilities Repair & Maint. - 211200 2,000,000 2,000,000 2,000,000 $6,000,000
Sub-Total $2,056,875 $2,017,448 $2,000,000 $0 $6,074,322
Department Of Police Services
New Zone 3 Precinct - 111450 42,169 42,169 42,169 0 $126,507
Admin.Development Recoupment Fees - 201072 36,000 36,000 36,000 $108,000
Sub-Total $78,169 $78,169 $78,169 $0 $234,507
Department of City Planning
Admin.Development Recoupment Fees - 201072 107,055 107,055 107,055 0 $321,165
Sub-Total $107,055 $107,055 $107,055 $0 $321,165
Total City Wide $30,429,108 $30,803,717 $29,886,307 $0 $91,119,131
149

FY20-FY24 FIVE YEAR PLANCAPITAL PROJECT STATUS
Capital Finance Fund
FY20 FY21 FY22 FY23 FY24 Total
DEPARTMENT TOTALS
Department Of Atlanta Information Management 550,000 $550,000
Department Of Corrections 39,012 19,149 19,149 19,149 $96,459
Department Of Public Works 375,000 0 0 $375,000
Department of City Planning 185,000 $185,000
Total City Wide $1,149,012 $19,149 $19,149 $19,149 $1,206,459
PROJECT TOTALS BY DEPARTMENT FY20 FY21 FY22 FY23 FY24 Total
Department Of Atlanta Information Management
Itsm-It Service Mgt - 212713 550,000 $550,000
Sub-Total $550,000 $550,000
Department Of Corrections
Cor Upgrades 2017 - 112622 39,012 19,149 19,149 19,149 $96,459
Sub-Total $39,012 $19,149 $19,149 $19,149 $96,459
Department Of Public Works
District 8 - 112210 375,000 $375,000
Sub-Total $375,000 $0 $0 $375,000
Department of City Planning
Fy18 Planning Initiatives - 212709 185,000 $185,000
Sub-Total $185,000 $185,000
Total City Wide $1,149,012 $19,149 $19,149 $19,149 $1,206,459
150

FY20-FY24 FIVE YEAR PLANCAPITAL PROJECT STATUS
Capital Finance-Recovery Zone (Eco. Dev.) Fund
FY20 FY21 FY22 FY23 FY24 Total
DEPARTMENT TOTALS
Department Of Public Works 100,000 0 0 $100,000
Total City Wide $100,000 $0 $0 $100,000
PROJECT TOTALS BY DEPARTMENT FY20 FY21 FY22 FY23 FY24 Total
Department Of Public Works
Rec Zone Economic Dev Bond - 111318 100,000 0 0 $100,000
Sub-Total $100,000 $0 $0 $100,000
Total City Wide $100,000 $0 $0 $100,000
151

FY20-FY24 FIVE YEAR PLANCAPITAL PROJECT STATUS
Water & Wastewater Renewal & Extension Fund
FY20 FY21 FY22 FY23 FY24 Total
DEPARTMENT TOTALS
Department Of Watershed Management 260,915,019 152,731,518 120,133,080 9,499,869 $543,279,486
Non-Departmental 900,000 9,000,000 54,000,000 $63,900,000
Total City Wide $261,815,019 $161,731,518 $174,133,080 $9,499,869 $607,179,486
PROJECT TOTALS BY DEPARTMENT FY20 FY21 FY22 FY23 FY24 Total
Department Of Watershed Management
Water Mains, Various Locations - 100395 591,520 591,520 591,520 $1,774,559
Phosphorous Reduction Fac, Utoy Creek - 100736 221,822 221,822 221,822 $665,467
Phosphorous Reduction Fac, R.M. Clayton - 100737 1,034,598 1,034,598 1,034,598 $3,103,795
Lease/Pur-New Traffic Court Facility - 101681 303,388 303,388 303,388 $910,164
Program Management-Year 3 - 102335 12,400,000 5,400,000 5,400,000 $23,200,000
Public Health Security-Water - 102366 29,252 29,252 29,252 $87,756
Public Health Security- Wastewater - 102367 35,715 35,715 35,715 $107,145
Sewer Group 2 Rehabilitation - 102445 348,859 348,859 348,859 $1,046,576
Raw Water Transmission Mains - 102474 4,624,110 1,624,110 1,624,110 $7,872,329
Sanitary Sewer-Annual Contract - 102506 2,226,986 226,986 226,986 $2,680,959
Sses Sewer Groups - 102652 640,916 640,916 640,916 $1,922,749
Clean Water Atlanta, Flint River - 102675 157,227 157,227 157,227 $471,682
Clean Water Atlanta, R.M. Clayton - 102676 339,017 339,017 339,017 $1,017,050
Peachtree Basin Cap Relief - 110846 25,334,017 6,426,823 6,426,823 $38,187,662
Dwm Hazard Mitigation - 110874 632,267 632,267 632,267 $1,896,800
Utilities Gdot & Municipal - 110893 3,618,344 1,369,734 618,344 $5,606,421
Water Mains- Sw Quandrant - 111191 884,605 884,605 884,605 $2,653,815
East Atl Water Main Rpmt - 111193 167,105 167,105 167,105 $501,314
Custer Ave Cso Cap Relief - 111415 16,633,764 18,633,764 18,633,764 9,499,869 $63,401,160
Nw Quadrant Water System Imp. - 111441 160,000 160,000 160,000 $480,000
Ne Quadrant Water System Imp. - 111443 1,640,000 1,640,000 1,640,000 $4,920,000
Intrenchment Creek Wrc Dec S/S - 111468 9,438,380 9,438,380 9,438,380 $28,315,140
Hemphill Res #1 Embank Rep - 111469 436,008 436,008 436,008 $1,308,025
Lake Forrest Dam Improvement - 111605 1,049,936 216,656 216,656 $1,483,248
Wpp-Nancy Creek Basin - 111613 75,769 0 0 $75,769
W'Shed Impr Prog Plan & Des - 111614 210,104 210,104 210,104 $630,313
South River Wrc Various Grp 1 - 111635 87,472 87,472 87,472 $262,416
Hartsfield Manifold Improvements - 111636 812,585 812,585 812,585 $2,437,754
Dwm Fac & Struc.Site Impr - 111640 975,209 975,209 975,209 $2,925,628
Aeration Basin Equip - 111651 44,250 44,250 44,250 $132,751
Treatment Fac Various Projects - 111652 2,996,284 996,284 996,284 $4,988,851
W'Shed Impr Plan & Design Sccs - 111688 4,267,474 1,968,735 1,968,735 $8,204,943
Cso Various Projects - 111697 6,126 6,126 6,126 $18,377
Raw Water Delivery Program - 111736 22,047,709 2,658,827 2,658,827 $27,365,363
Design & Support Services - 111739 30,907 30,907 30,907 $92,721
Csos. Fac. Comp. Improv. Proj. - 111741 18,000,000 18,000,000 17,513,771 $53,513,771
Downtown H2O Storage Tanks & Pd - 111815 19,651,751 19,651,751 16,905,636 $56,209,138
Consent Decree Rehab Comp Sewer Group - 111881 599,673 599,673 599,673 $1,799,018
152

FY20-FY24 FIVE YEAR PLANCAPITAL PROJECT STATUS
Water & Wastewater Renewal & Extension Fund
FY20 FY21 FY22 FY23 FY24 Total
Sewer Capacity Relief - 111925 9,786,547 2,660,391 2,660,391 $15,107,328
Distribution System R & R - 111948 7,000,000 2,000,000 2,000,000 $11,000,000
Beckwith St.Trunk Cpacity - 111959 251,205 251,205 251,205 $753,614
Dwm Vehicle & Heavy Equipment - 112157 3,890,127 3,890,127 2,041,884 0 $9,822,139
Up Proctor Creek Cap Relief - 112164 10,080,162 2,208,830 2,208,830 $14,497,822
West Area Cso Outfalls - 112171 434,108 434,108 434,108 $1,302,323
Peyton Center - 112201 227,531 227,531 227,531 $682,593
Utoy Creek Cso Various Projects - 112253 268,546 268,546 268,546 $805,637
Sewer Group Ii - 112264 11,000,000 6,802,996 3,000,000 $20,802,996
Cip A&E & Cm Services - 112308 18,383,989 14,367,813 3,383,989 $36,135,792
Facility Capital Maintenance - 112309 1,066,754 1,066,754 1,066,754 $3,200,261
Distribution System Appurtenances - 112516 1,000,000 1,000,000 1,000,000 $3,000,000
Small Diameter Distribution System Rehad - 112517 6,540,000 9,015,572 1,540,000 $17,095,572
Sg3 Contracat C - 112530 10,840,000 6,144,069 2,840,000 $19,824,069
Most Phase 1 Stormwater - 112560 62,000 62,000 62,000 $186,000
Most Phase 2 Stormwater - 112561 2,543,000 2,543,000 2,543,000 $7,629,000
Proctor Creek Greenway - 112562 32,000 32,000 32,000 $96,000
Sg3 Contr. D Rehab - 112804 10,000,000 $10,000,000
Water Distribution System Rehab Impro. - 112966 10,000,000 $10,000,000
Atlanta Water Customer Rebate Program - 210059 319,685 319,685 119,685 $759,056
Dwm Water Surcharge - 210540 1,796,217 1,796,217 796,217 $4,388,651
Nancy Creek Assess & Odor Cnt. - 211775 600,000 600,000 600,000 $1,800,000
Small Business Development Program - 212270 40,000 40,000 40,000 $120,000
Asphaltic Concrete (Annual) - 212574 1,000,000 $1,000,000
Geo Tech Testing & Investigation - 212576 1,000,000 $1,000,000
Sub-Total $260,915,019 $152,731,518 $120,133,080 $9,499,869 $543,279,486
Non-Departmental
Restricted Reserves - 212591 900,000 9,000,000 54,000,000 $63,900,000
Sub-Total $900,000 $9,000,000 $54,000,000 $63,900,000
Total City Wide $261,815,019 $161,731,518 $174,133,080 $9,499,869 $607,179,486
153

FY20-FY24 FIVE YEAR PLANCAPITAL PROJECT STATUS
1999 Water And Wastewater Bond Fund
FY20 FY21 FY22 FY23 FY24 Total
DEPARTMENT TOTALS
Department Of Watershed Management 167,209 167,209 167,209 $501,628
Total City Wide $167,209 $167,209 $167,209 $501,628
PROJECT TOTALS BY DEPARTMENT FY20 FY21 FY22 FY23 FY24 Total
Department Of Watershed Management
Peachtree Basin Cap Relief - 110846 167,209 167,209 167,209 $501,628
Sub-Total $167,209 $167,209 $167,209 $501,628
Total City Wide $167,209 $167,209 $167,209 $501,628
154

FY20-FY24 FIVE YEAR PLANCAPITAL PROJECT STATUS
2001 Water & Wastewater Bond Fund
FY20 FY21 FY22 FY23 FY24 Total
DEPARTMENT TOTALS
Department Of Watershed Management 2,248,961 2,248,961 2,248,961 $6,746,884
Total City Wide $2,248,961 $2,248,961 $2,248,961 $6,746,884
PROJECT TOTALS BY DEPARTMENT FY20 FY21 FY22 FY23 FY24 Total
Department Of Watershed Management
Water Mains, Various Locations - 100395 613,979 613,979 613,979 $1,841,938
Sanitary Sewer-Annual Contract - 102506 167,063 167,063 167,063 $501,189
Rmc Compliance Upgrades 3 - 111674 1,467,919 1,467,919 1,467,919 $4,403,756
Sub-Total $2,248,961 $2,248,961 $2,248,961 $6,746,884
Total City Wide $2,248,961 $2,248,961 $2,248,961 $6,746,884
155

FY20-FY24 FIVE YEAR PLANCAPITAL PROJECT STATUS
2004 Water & Wastewater Bond Fund
FY20 FY21 FY22 FY23 FY24 Total
DEPARTMENT TOTALS
Department Of Watershed Management 648,799 648,799 8,565 $1,306,163
Total City Wide $648,799 $648,799 $8,565 $1,306,163
PROJECT TOTALS BY DEPARTMENT FY20 FY21 FY22 FY23 FY24 Total
Department Of Watershed Management
Sewer Group 2 Rehabilitation - 102445 158,127 158,127 0 $316,254
South River Basin Relief Projects - 102648 21,328 21,328 0 $42,656
Water Resources Mgt Plan - 111192 24,719 24,719 0 $49,438
Rmc Compliance Upgrades 3 - 111674 444,626 444,626 8,565 $897,816
Sub-Total $648,799 $648,799 $8,565 $1,306,163
Total City Wide $648,799 $648,799 $8,565 $1,306,163
156

FY20-FY24 FIVE YEAR PLANCAPITAL PROJECT STATUS
Ser. 2009A Water & Wastewater Rev Bd Fd
FY20 FY21 FY22 FY23 FY24 Total
DEPARTMENT TOTALS
Department Of Watershed Management 27,669,040 12,891,915 12,891,915 $53,452,871
Total City Wide $27,669,040 $12,891,915 $12,891,915 $53,452,871
PROJECT TOTALS BY DEPARTMENT FY20 FY21 FY22 FY23 FY24 Total
Department Of Watershed Management
Water Mains, Various Locations - 100395 600,051 600,051 600,051 $1,800,153
Development, North Area Treatment Plant - 100599 237,760 237,760 237,760 $713,279
H.T.P., Reservoir Expansion - 100897 40,423 40,423 40,423 $121,269
Small Diameter Sewer Rehab - 102350 414,616 414,616 414,616 $1,243,847
Sewer Group 2 Rehabilitation - 102445 1,452,170 1,452,170 1,452,170 $4,356,511
Rm Clayton- Compliance Upgrades - 102462 40,683 40,683 40,683 $122,048
Electrical Switchgear Replacement - 102482 362,668 362,668 362,668 $1,088,004
Sandy Creek Basin Relief Projects - 102646 53,059 53,059 53,059 $159,178
Sewer Group 1 - Rehabilitation - 102650 46,194 46,194 46,194 $138,583
Soil Remediation & Site Closure - 102656 35,204 35,204 35,204 $105,611
Small Meter Installation (New Meters) - 102658 465,205 465,205 465,205 $1,395,616
North Area Main Improvements - 102663 1,078,677 1,078,677 1,078,677 $3,236,030
Repair & Replace Large Water Meters - 102664 375,909 375,909 375,909 $1,127,728
South River Tunnel & Ps - 110345 469,203 469,203 469,203 $1,407,610
Peachtree Basin Cap Relief - 110846 825,038 825,038 825,038 $2,475,114
Utilities Gdot & Municipal - 110893 71,015 71,015 71,015 $213,044
Water Proj- Se Quadrant - 111093 495,504 495,504 495,504 $1,486,512
Custer Ave Cso Cap Relief - 111415 151,149 151,149 151,149 $453,448
Rmc Compliance Upgrades 3 - 111674 10,332,550 2,555,425 2,555,425 $15,443,400
Clear Creek Cso - 112156 8,121,962 3,121,962 3,121,962 $14,365,885
Ami Smart Valve Program - 112973 2,000,000 $2,000,000
Sub-Total $27,669,040 $12,891,915 $12,891,915 $53,452,871
Total City Wide $27,669,040 $12,891,915 $12,891,915 $53,452,871
157

FY20-FY24 FIVE YEAR PLANCAPITAL PROJECT STATUS
2015A Water Commerical Paper Program
FY20 FY21 FY22 FY23 FY24 Total
DEPARTMENT TOTALS
Department Of Watershed Management 71,177,662 71,177,662 71,177,662 35,588,831 $249,121,817
Total City Wide $71,177,662 $71,177,662 $71,177,662 $35,588,831 $249,121,817
PROJECT TOTALS BY DEPARTMENT FY20 FY21 FY22 FY23 FY24 Total
Department Of Watershed Management
Raw Water Delivery Program - 111736 71,177,662 71,177,662 71,177,662 35,588,831 $249,121,817
Sub-Total $71,177,662 $71,177,662 $71,177,662 $35,588,831 $249,121,817
Total City Wide $71,177,662 $71,177,662 $71,177,662 $35,588,831 $249,121,817
158

FY20-FY24 FIVE YEAR PLANCAPITAL PROJECT STATUS
Airport Renewal And Extension Fund
FY20 FY21 FY22 FY23 FY24 Total
DEPARTMENT TOTALS
Department Of Aviation 99,722,758 51,528,485 31,690,637 $182,941,879
Total City Wide $99,722,758 $51,528,485 $31,690,637 $182,941,879
PROJECT TOTALS BY DEPARTMENT FY20 FY21 FY22 FY23 FY24 Total
Department Of Aviation
Hapeville Easement Program - 100312 6,489,537 $6,489,537
Terminal & Atrium Projects - 111301 15,926,404 14,254,749 8,231,630 $38,412,782
Other Facility Projects - 111304 19,404,739 $19,404,739
Other Direct Costs Project - 111310 37,273,736 37,273,736 23,459,007 $98,006,479
Noise Insulation Program - 210816 20,594,034 $20,594,034
Non-Capital Projects - 211312 34,309 $34,309
Sub-Total $99,722,758 $51,528,485 $31,690,637 $182,941,879
Total City Wide $99,722,758 $51,528,485 $31,690,637 $182,941,879
159

FY20-FY24 FIVE YEAR PLANCAPITAL PROJECT STATUS
Airport Passenger Facility Charge Fund
FY20 FY21 FY22 FY23 FY24 Total
DEPARTMENT TOTALS
Department Of Aviation 63,538,016 23,419,801 3,300,000 $90,257,817
Total City Wide $63,538,016 $23,419,801 $3,300,000 $90,257,817
PROJECT TOTALS BY DEPARTMENT FY20 FY21 FY22 FY23 FY24 Total
Department Of Aviation
Airfield Projects - 111300 24,190,483 5,119,372 $29,309,855
Terminal & Atrium Projects - 111301 29,390,128 13,050,429 3,300,000 $45,740,557
Parking And Ground Transportation - 111306 5,250,000 5,250,000 $10,500,000
Noise Insulation Program - 210816 4,707,406 $4,707,406
Sub-Total $63,538,016 $23,419,801 $3,300,000 $90,257,817
Total City Wide $63,538,016 $23,419,801 $3,300,000 $90,257,817
160
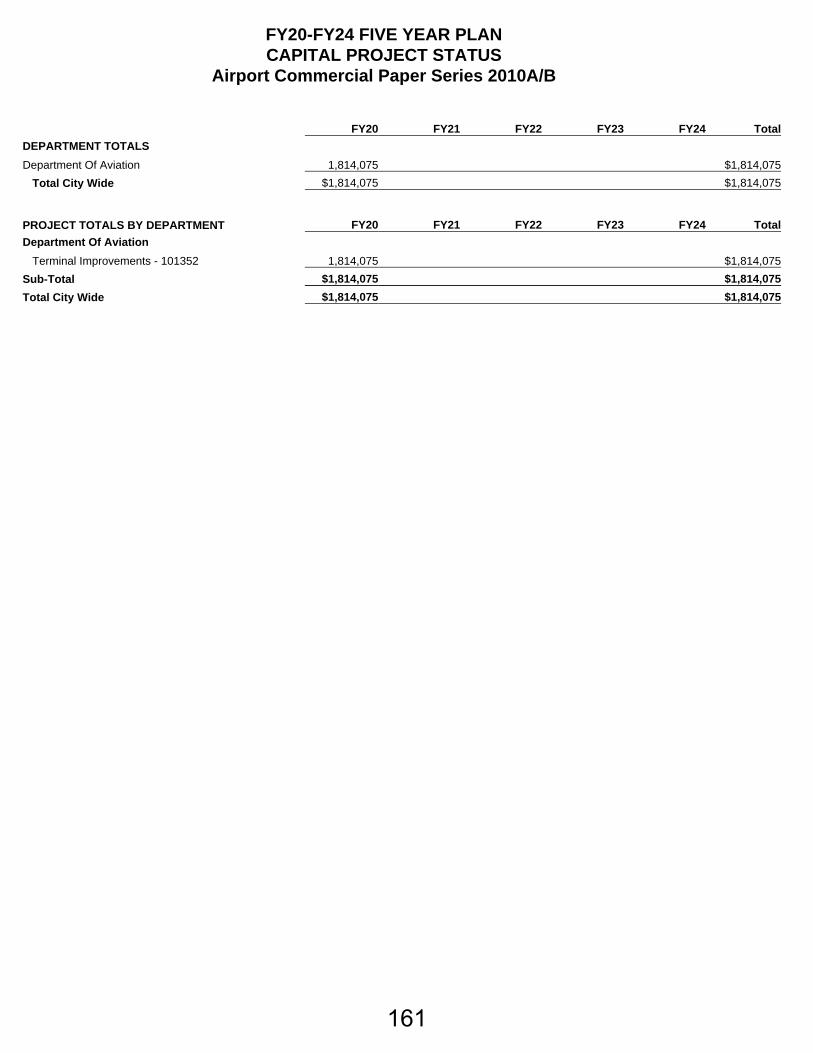
FY20-FY24 FIVE YEAR PLANCAPITAL PROJECT STATUS
Airport Commercial Paper Series 2010A/B
FY20 FY21 FY22 FY23 FY24 Total
DEPARTMENT TOTALS
Department Of Aviation 1,814,075 $1,814,075
Total City Wide $1,814,075 $1,814,075
PROJECT TOTALS BY DEPARTMENT FY20 FY21 FY22 FY23 FY24 Total
Department Of Aviation
Terminal Improvements - 101352 1,814,075 $1,814,075
Sub-Total $1,814,075 $1,814,075
Total City Wide $1,814,075 $1,814,075
161

FY20-FY24 FIVE YEAR PLANCAPITAL PROJECT STATUS
2012A Bond General Airport Revenue
FY20 FY21 FY22 FY23 FY24 Total
DEPARTMENT TOTALS
Department Of Aviation 499,136 $499,136
Total City Wide $499,136 $499,136
PROJECT TOTALS BY DEPARTMENT FY20 FY21 FY22 FY23 FY24 Total
Department Of Aviation
Concourse Projects - 111302 499,136 $499,136
Sub-Total $499,136 $499,136
Total City Wide $499,136 $499,136
162

FY20-FY24 FIVE YEAR PLANCAPITAL PROJECT STATUS
2012C Bond General Airport Revenue
FY20 FY21 FY22 FY23 FY24 Total
DEPARTMENT TOTALS
Department Of Aviation 1,206,789 $1,206,789
Total City Wide $1,206,789 $1,206,789
PROJECT TOTALS BY DEPARTMENT FY20 FY21 FY22 FY23 FY24 Total
Department Of Aviation
Concourse Projects - 111302 1,206,789 $1,206,789
Sub-Total $1,206,789 $1,206,789
Total City Wide $1,206,789 $1,206,789
163

FY20-FY24 FIVE YEAR PLANCAPITAL PROJECT STATUS
Doa Series 2016 Bond Anticipation Notes (Ban)
FY20 FY21 FY22 FY23 FY24 Total
DEPARTMENT TOTALS
Department Of Aviation 90,509,460 20,589,941 0 $111,099,401
Total City Wide $90,509,460 $20,589,941 $0 $111,099,401
PROJECT TOTALS BY DEPARTMENT FY20 FY21 FY22 FY23 FY24 Total
Department Of Aviation
Terminal & Atrium Projects - 111301 22,075,454 9,489,941 0 $31,565,395
Parking And Ground Transportation - 111306 68,434,006 11,100,000 0 $79,534,006
Sub-Total $90,509,460 $20,589,941 $0 $111,099,401
Total City Wide $90,509,460 $20,589,941 $0 $111,099,401
164

FY20-FY24 FIVE YEAR PLANCAPITAL PROJECT STATUS
Doa Series 2016 F-G Commerical Paper Program
FY20 FY21 FY22 FY23 FY24 Total
DEPARTMENT TOTALS
Department Of Aviation 117,560,000 $117,560,000
Total City Wide $117,560,000 $117,560,000
PROJECT TOTALS BY DEPARTMENT FY20 FY21 FY22 FY23 FY24 Total
Department Of Aviation
Airfield Projects - 111300 5,000,000 $5,000,000
Concourse Projects - 111302 112,560,000 $112,560,000
Sub-Total $117,560,000 $117,560,000
Total City Wide $117,560,000 $117,560,000
165

APPENDIX
LEGISLATION
GLOSSARY
FIVE YEAR PLAN
166

167

rt iN
TA CIT
Y CO
UN
CIL
PR
ESID
ENT
- -
A
rari
[13
It 4t 44
4
Ed 0
-7g 1 .'•C(.-`•
FEB
0 5
20 18
1:71=3
Li5r1
al 5
Fir
st R
ead
ing
Com
mitt
ee
Dat
e C
hair
Ref
erre
d T
o
Com
mit
tee
Com
mit
tee
^r)
.= E
7
rI o .1.... 1..
4.4" C44)
.., E
L,
4... o Fii =
--6- • 7, >
4.) _ %,..
"0 <
CCI>r. LI.
,,, 1... 1
7 Ref
er
To
,_ o
ai =
c-7, .z;; > <L)
— ae ...7, -0 f,
=
<
CI LI.
— 1 .
•-•-• 0 ,..,
>
= ,..... CV 7:-• •r) f,
•,c
5
1
.
1
1
' It tl"
L.' 4= o
i
.jr, o
•,7 ,
,.., ')
t
flu
L,
V) L. ,,z E 4,
v
•
....P
CI.)
V) 1
Q;
CIO
w w cg 4;
"
w LT4 E-,
w (^1 NI
Z W i• k -...4, et : 4 ..t • .ti, 4 Lt w
>,— 4 -t ce a.
0
.... mot ad = L. clt
is•J Ei ..tr, ''''' 0 [.." W '''" I:e
= =
----
\..J,
0
g w w
4. ce
w i.4
1:4 cg '4 G.TJ
g w ia4 0 Ce ce 0..,
cg ce w el ..j E''' 1:4 CI) #t
c...) ce ../. — A.
C1) 14 = (f)
• .
a) a)
' •
a.) ki
I' 4:i
a) a) L-
-.t
`.7. ---
168

18- R -3079 A RESOLUTION BY FINANCE/EXECUTIVE COMMITTEE ADOPTING THE 2019 UPDATE TO THE CITY OF ATLANTA FIVE YEAR FINANCIAL PLAN FOR YEARS 2019 TO 2023; AND FOR OTHER PURPOSES.
WHEREAS, pursuant to Resolution 09-R- I 213, the Administration and the Chief Financial Officer of the City of Atlanta are authorized to develop a strategic short and long-range planning and economic forecasting, or Financial Plan (the "Plan") which will assist in the allocation of the City's financial resources; and
WHEREAS, pursuant to Resolution 09-R-1213, following adoption of the 2009 through 2014
Financial Stabilization Plan, the Plan shall he updated annually by the Administration and the
Chief Financial Officer; and
WHEREAS, Article 6, Chapter 3, Section 6-312 of the City Charter establishes that the annual update of the Plan shall he presented to City Council by February 15 of each year by the Mayor; and
WHEREAS, on February 14, 2018, the Chief Financial Officer will present the annual update of the Plan to the Finance/Executive Committee of the City Council; and
WHEREAS, the City Council desires to adopt the annual update of the Plan as the guide by which the City shall move forward in stabilizing and improving the City's financial position.
NOW THEREFORE, THE CITY COUNCIL OF THE CITY OF ATLANTA, GEORGIA HEREBY RESOLVES, as follows:
SECTION 1: That the Five Year Financial Plan Update FY 2019-2023 be approved and adopted as an update of the guide by which the City shall move forward in stabilizing and improving the City's financial position.
SECTION 2: That all resolutions and parts of resolutions in conflict herewith are hereby waived to the extent of the conflict.
169

cnvcouNc L .- JJWffA.GEORGIA J•
09-0-1406 09-0-----
AN ORDINANCE TO Al\1END THE CHARTER OF THE CITY OF ATLANTA, GEORGIA, 1996 GA LAWS P. 4469, ET SEQ., UNDER AND BY VIRTUE OF THE AUTHORITY OF THE MUNICIPAL HOl\1E RULE ACT OF 1965, O.C.G.A. SECTION 36-35-1, ET SEQ., AS AMENDED, BY Al\1ENDING PART 1, SUBPART A, ARTICLE VI (REVENUE AND FUND ADMINISTRATION), CHAPTER III (FISCAL CONTROL) TO CREATE A NEW SECTION WHICH SHALL BE SECTION 6- 312 TO BE ENTITLED FINANCIAL STABILIZATION PLAN, WHICH NEW SECTION 6-312 SHALL PROVIDE FOR THE DEVELOPl\1ENT AND ADOPTION OF AN ANNUAL FINANCIAL STABILIZATION PLAN COVERING A PERIOD OF FIVE YEARS; TO REPEAL CONFLICTING ORDINANCES; AND FOR OTHER PURPOSES.
WHEREAS, the City of Atlanta (the "City") is facing unprecedented short and long-term budgetchallenges;a nd
WHEREAS, the Chief Financial Officer for the Department of Finance has stated that the City's financial recovery will span several years and that priorities will need to be established and considered before the City undertakes any new spending, which statements have been supported by recent audits and assessments and actions of the part of rating agencies; and
WHEREAS, on April 1, 2008, the City's Internal Auditor submitted a performance audit report on the 2008 General Fund Budget process, which, among other things, called for the establishment of policies to guide long and short-term financial planning and monitoring, including the maintenance of fund balances, the use of non-recurr ing and surplus revenues, the development of five-year financial forecasts and interim f inancial reporting; and
170

• .
. '. ;s
REAS, in January 2009, Deloitte Consulting conducted a pro-bono assessment of .,. ·vthe Department of Finance and provided recommendations for improvement of business
processes; and
WHEREAS, in March 2009, Moody's Investor Service downgraded the City's general obligation rating from "AI" to "Aa3" , which downgrade was based on the diminished financial position of the City's general fund, including the decline in fund balance levels, the prolonged trend of structural imbalance and the indefinite resolution of inter-fund receivables related to accumulated deficits in other operating funds; and
WHEREAS, in March 2009, Standard and Poor's Rating Service also lowered its standard long-term and underlying rating on the City's general obligation debt to "A" from "AA-" based on a trend of operating deficits and declining revenues during a period of strong economic growth, which has left the City with diminished revenues and a lack of financial flexibility as it enters the current economic downturn; and
WHEREAS, to address these issues the Council of the City of Atlanta desires to establish guidelines and priorities for long-term financial planning through the development of a comprehensive annual Financial Stabilization Plan; and
WHEREAS, the Charter of the City of Atlanta, Georgia, 1996 Ga. Laws P. 4469, et seq., Part I, Subpart A, Article VI, Chapter III entitled Fiscal Control sets forth certain provisions governing the budgetary process and other fiscal control policies of the City; and
WHEREAS, the Council of the City of Atlanta now desires to amend Part I, Subpart A, Article VI, Chapter III of the Charter of the City of Atlanta to provide for a new section 6-312 to be entitled "Financial Stabilization Plan"; and
WHEREAS, such new Section 6-312 shall provide for the annual preparation by the Mayor of a five-year Financial Stabilization Plan, which shall project general fund revenues and general fund expenses and shall provide a calculation of the surplus or deficit produced by the projected revenues and expenditures, a cost estimate of long term initiatives, a list of revenue initiatives, and a list of cost saving initiatives;
THE CITY COUNCIL OF THE CITY OF ATLANTA, GEORGIA, HEREBY
ORDAINS:
SECTION 1: That Part I, Subpart A, Article VI, Chapter III of the Charter of the City of Atlanta, Georgia, 1996 Ga. Laws P. 4469, et seq., be amended to add a new section 6- 312, which shall read as fol1ows:
Section 6-312. Financial Stabilization Plan
(a) The Mayor shall present to the governing body by October 15 of each year a
five-year Financial Stabilization Plan consisting of the following elements:
171

(1) A five-year projection of general fund revenues broken down by major
category. The projection shall identify the economic trends and assumptions upon which such projection is based.
(2) A five-year projection of total general fund expenses on a departmental level. Such expense projection shall assume the continuation of department operations as they exist in the current general fund budget and shall take into account the following:
1. The effect of inflation on general fund budgeted costs; 11. A projection of pension costs as provided by the City's
actuaries; and iii. Costs occurring in future years that the City is legally
obligated to pay. (3) A calculation of the surplus or deficit produced by the projected
revenues and expenditures described in (1) and (2) above. (4) A cost estimate of long-term initiatives of the City. Such initiatives
shall include, but are not limited to, long-term operating infrastructure and capital infrastructure needs and the elimination of deficit positions in funds that are subsidized or have historically been subsidized by the general fund. At any time the governing body of the City may, by resolution, request specific long-term initiatives to be included in the five-year Financial Stabilization Plan.
(5) A comprehensive list of revenue initiatives the City may pursue during the five years covered by the Financial Stabilization Plan, including an estimate of the revenues to be produced by such initiatives.
(6) A comprehensive list of cost saving initiatives the City may pursue during the five years covered by the Financial Stabilization Plan, including an estimate of costs saved by such initiatives.
(b) The governing body shall adopt the Financial Stabilization Plan by December 31 of each year.
SECTION 2. That a copy of this proposed amendment to the Charter of the City of Atlanta, Georgia, 1996 Ga. Laws P. 4469, et seq., as amended, shall be filed in the Office of the Municipal Clerk of the City of Atlanta and in the Offices of the Clerk of the Superior Courts of Fulton and DeKalb Counties and that the "Notice of Proposed Amendment to the Charter of the City of Atlanta, Georgia" attached hereto as Exhibit "A" and hereby made a part of this ordinance, be published in the official organ of the county of the legal situs of the City of Atlanta or in a newspaper of general circulation in the City of Atlanta once a week for three weeks within a period of 60 days immediately preceding the final adoption of this ordinance, and that a copy of said advertisement be attached to this ordinance prior to its final adoption by the Council of the City of Atlanta.
SECTION 3. That all ordinances and parts of ordinances in conflict herewith are hereby waived to the extent of the conflict.
py, ADOPTED by the Atlanta City Council APPROVED by Mayor Shirley Franklin
SEP 21, 2009 SEP 25,2009
172

Atlanta City Council
REGULAR SESSION
09-0-1406 AMEND PART1 SUBPART A ART.VI CHAPT.III
TO CREATE NEW SEC.6-312
FINAL ADOPT
YEAS: 12
NAYS: 0
ABSTENTIONS: 0 NOT VOTING: 3
EXCUSED: 0 ABSENT 1
Y Smith
Y Hall NV Young
Y Winslow
Y Archibong
Y Fauver Y Shook Y Muller
Y Moore
Y Martin B Maddox Y Sheperd
NV Mitchell
Y Norwood Y Willis NV Borders
173
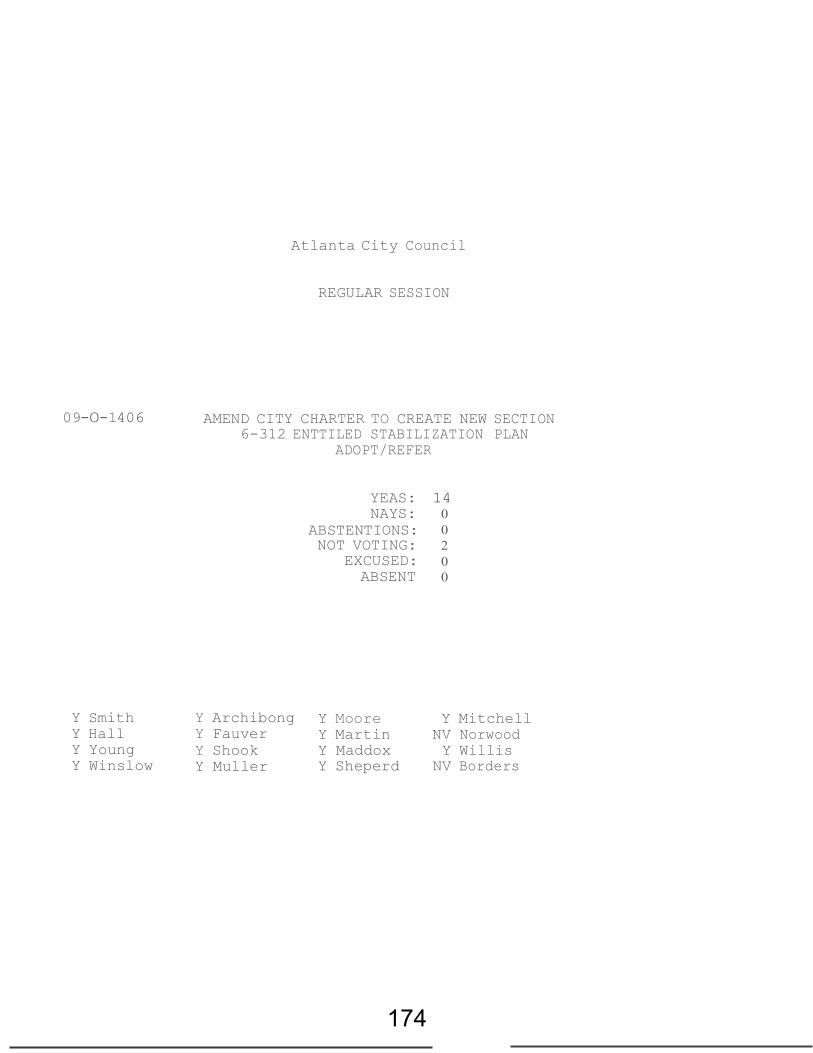
Atlanta City Council
REGULAR SESSION
09-0-1406 AMEND CITY CHARTER TO CREATE NEW SECTION 6-312 ENTTILED STABILIZATION PLAN
ADOPT/REFER
YEAS: 14 NAYS: 0
ABSTENTIONS: 0 NOT VOTING: 2
EXCUSED: 0 ABSENT 0
Y Smith
Y Hall Y Young Y Winslow
Y Archibong
Y Fauver Y Shook Y Muller
Y Moore
Y Martin Y Maddox Y Sheperd
Y Mitchell
NV Norwood Y Willis
NV Borders
174

assumptions upon which such projection is based. (2) A five-year projection of total general fund expenses on a
departmental level. Such expense projection shall assume the continuation of department operations as they exist in the current general fund budget and shall take into account the following:
1. The effect of inflation on general fund budgeted costs; 11. A projection of pension costs as provided by the City's
actuaries; and iii. Costs occurring in future years that the City is legally
obligated to pay. (3) A calculation of the surplus or deficit produced by the projected
revenues and expenditures described in (1) and (2) above. (4) A cost estimate of long-term initiatives of the City. Such initiatives
shall include, but are not limited to, long-term operating infrastructure and capital infrastructure needs and the elimination of deficit positions in funds that are subsidized or have historically been subsidized by the general fund. At any time the governing body of the City may, by resolution, request specific long-term initiatives to be included in the five-year Financial Stabilization Plan.
(5) A comprehensive list of revenue initiatives the City may pursue during the five years covered by the Financial Stabilization Plan, including an estimate of the revenues to be produced by such initiatives.
(6) A comprehensive list of cost saving initiatives the City may pursue during the five years covered by the Financial Stabilization Plan, including an estimate of costs saved by such initiatives.
(b) The governing body shall adopt the Financial Stabilization Plan by December 31 of each year.
SECTION 2. That a copy of this proposed amendment to the Charter of the City of Atlanta, Georgia, 1996 Ga. Laws P. 4469, et seq., as amended, shall be filed in the Office of the Municipal Clerk of the City of Atlanta and in the Offices of the Clerk of the Superior Courts of Fulton and DeKalb Counties and that the "Notice of Proposed Amendment to the Charter of the City of Atlanta, Georgia" attached hereto as Exhibit "A" and hereby made a part of this ordinance, be published in the official organ of the county of the legal situs of the City of Atlanta or in a newspaper of general circulation in the City of Atlanta once a week for three weeks within a period of 60 days immediately preceding the final adoption of this ordinance, and that a copy of said advertisement be attached to this ordinance prior to its final adoption by the Council of the City of Atlanta.
SECTION 3. That all ordinances and parts of ordinances in conflict herewith are hereby waived to the extent of the conflict.
175

I
e
li
g
09-0 -1406 FINAL COUNCIL ACTION
0 2nd a 1st & 2nd 0 3rd
Readings ,..,
AN ORDINANCE BY '\:OUNCILMEMBERS JOYC&$H EPERD, HOWARIYSHOOK, CLAIR ULLER, CARLA SMITH, C.T. MARTIN, MARY NORWOOD, IVORY LEE YOUNG, JR., ANNE FAUVER, CEASAR MITCHELL, KWANZA HALL,
'?/ _, Date
t-L...et\ Action
Committ,;e
Date
Chair
Action
0 Consent a V Vote aRC Vote CERTIFIED
:; ;
H. LAMAR WILLIS, JIM MADDOX AND NATALYN MOSBY ARCHIBONG
AN ORDINANCE TO AMEND THE CHARTER OF THE CITY OF ATLANTA, GEORGIA, 1996 GA LAWS P. 4469, ET SEQ., UNDER AND BY VIRTUE OF THE AUTHORITY OF THE MUNICIPAL HOME RULE ACT OF 1965, O.C.G.A. SECTION 36-35-1, ET SEQ., AS AMENDED, BY AMENDING PART I, SUBPART A, ARTICLE VI (REVENUE AND FUND ADMINISTRATION), CHAPTER Ill (FISCAL
@,:).etv, Hold (see rf1V. side)
:2-" ) P...J , J?)"?( ·t;_ ,!..rT"Ct Fav, Aftv, Hold (see rev. side)
Other
Members
SEP 2 1 2909 I
_.,./
CONTROL) TO CREATE A NEW SECTION WHICH SHALL BE SECTION 6-312 TO BE ENTITLED (f',', i ,·f-; ·- l;!- ; tl' ) FTNANCIAL STABILIZATION PLAN, WHICH NEW
- .._'"";;l · ' I \1
SECTION 6-312 SHALL PROVIDE FOR THE DEVELOPMENT AND ADOPTION OF AN ANNUAL
Refer To
Refer To
,, -- - ... . ·r.. . t · .):.:. / . . ! .".:' .
FINANCIAl. STABILIZATION PLAN COVERING A PERIOD OF FIVE YEARS; TO REPEAL CONFLICTING ORDTNANCES; AND FOR OTHER
Committee r.-'1/ I 1l / 'i'tI
il:. '.:- l:/Av-tl,<....._ --
PURPOSES. .
CJ CONSENT REFER
a REGULAR REPORT REFER
a 1
ADVERTISE & REFER
' fit ADOPT 2nd READ & REFER
tY PERSONAL PAPER REFER
Referred To:
Date Referred
Refferred To:
Date Referred
Refer To
Date
Chair
Action FAdv, Hold (see rf1V . side)
· Other
Members
Refer To
:;NI",.',"·1'A-
' ··..-...Llr..-..... . v
. ,,\.
176

11- -1415 (Do Not Write Above This Line}
Committee Date Chair
Referred To
First Reading FINAL COUNCIL ACTION
0 2nd 0 1st & 2nd 0 3rd
Readings
·/ lzfa, J. . NANCE f Clf'ARTER AMEN DMENT CILMEl\ J BERs'FELICJA MOORE AND
IAADREAN
0 Consent 0 V Vote 0"Rc Vote
CERTIFIED
ORDIN ANCE AI'ID CHARTER vfEI'IiT TO AMEND THE CHARTER OF ·y OF ATLANTA, GEORGIA, 1996 GA 4469, ET SEQ. ADOPTED U!'I.'DER AN D rUE OF THE AUTHORITY OF THE ?AL HOME RULE ACT OF 1965,
SECTION 36-35-1 ET SEQ., AS W , BY AMEI'''DING PART 1 (CHARTER llliLATED LAWS), SUBPART A ER), ARTICLE VI (REVENUE AN D ADMINISTRATION), CHAPTER 3
CONTROL), SECTION 6-312 :IAL STABILIZATION PLAN), SO AS lNGE THE DATES BY WHICH THE FINANCIAL STABlliZATION PLAN E PRESENTED TO AND ADOPTED BY )UNCIL; AND FOR OTHER PURPOSES.
.SL! ,
fx {)- z ReferTo
NOVo7
ONSENT REFER
ADOPTED'SV ov. (J1 zan 1 ....";..;-;; ...: ..;·..:::....:'...':..'!:. .......=.:=----
Commit1ee
·Date
Chair
EGULAR REPORT RGeUNCIL JVERTISE & REFER
;t ADOPT 2nd READ & REFER
i::RSONAL PAPER REFER
Referred
rred To:
Referred
rred To:
Referred
-----u , on
Fav. Add"'(see rev. s1de)
ther
Members
Refer To
Action
Fav, Adv, Hold (see rev. side) & I Other MAYOR'S ACTION
Members
Refer To
er d To: 177

AN ORDINANCE AND CHARTER AMENDMENT TO AMEND THE CHARTER OF THE CITY OF ATLANTA, GEORGIA, 1996 GA LAWS P. 4469, ET SEQ., ADOPTED UNDER AND BY VIRTUE OF THE AUTHORITY OF THE MUNICIPAL HOME RULE ACT OF 1965, O.C.G.A. SECTION 36-35-1 ET SEQ., AS AMENDED, BY AMENDING PART 1 (CHARTER AND RELATED LAWS), SUBPART A (CHARTER), ARTICLE VI (REVENUE AND FADMINISTRATION), CHAPTER 3 (FISCAL CONTROL), SECTION 6-312 (FINANCIAL STABILIZATION PLAN), SO AS TO CHANGE THE DATES BY WHICH THE CITY'S FINANCIAL STABILIZATION PLAN MUST BE PRESENTED TO AND ADOPTED BY CITY COUNCIL; AND FOR OTHER PURPOSES.
WHEREAS, Section 6-312(a) of the Cha1ter of the City of Atlanta, Georgia, 1996 Ga. Laws P. 4469, et seq. (''Charter,) requires that the Mayor present a five-year financial stabilization plan to the City Council of the City of Atlanta ("City Council,) by October 15 of each year; and
WHEREAS, Section 6-312(b) of the Charter requires that City Council adopt a fmancial stabilization plan by December 31 of each year; and
WHEREAS, by October 15 of each year, the Chief Financial Officer has not completed the necessary accounting adjustments for close-out purposes of the prior fiscal year; and
WHEREAS, by October 15 of each year, the City's external auditor has not presented the City with its findings and recommendations for the prior fiscal year; and
WHEREAS, information from the close-out of the prior fiscal year and the external auditor's recommendations should be utilized in the preparation of the City's financial stabilization plan; and
WHEREAS, in order to present a more comprehensive financial stabilization plan, it is the desire of the City to amend Section 6-312 (a) to change the deadline for presentation of the City's financial stabilization plan from October 15 of each year to February 15 of each year; and
WHEREAS, it is the desire of the City to amend Section 6-312 (b) to change the deadline for adoption of the City's financial stabilization plan from December 31 of each year to April 30 of each year.
WHEREAS, it is the desire ofthe City to an1end Section 6-312 (b) to require that City Council consider the financial stabilization plan prior to adoption of the budget for the upcoming fiscal year.
178

SECTION 1: That Prui I, Subpart A, Atiicle VT, Chapter 3, Section 6-312 of the Charter ofthe City of Atlanta, Georgia, Georgia, 1996 Ga. Laws P. 4469, et seq., which currently reads:
Sec. 6-312.- Financial stabilization plan.
(a) The Mayor shall present to the governing body by October 15 of each year a five-year financial stabilization plan consisting of the following elements:
(1) A five-year projection of general fund revenues broken down by major category. The projection shall identify the economic trends and assumptions upon which such projection is based.
(2) A five-year projection of total general fund expenses on a depruimental level. Such expense projection shall assume the continuation of department operations as they exist in the current general fund budget and shall take into account the following:
i.The effect of inflation on general fund budgeted costs;
ii.A projection of pension costs as provided by the city's actuaries; and
iii. Costs occurring in future years that the city is legally obligated to pay.
(3) A calculation of the surplus or deficit produced by the projected revenues and expenditures described in (1) and (2) above.
(4) A cost estimate of long-term initiatives of the city. Such initiatives shall include, but ru·e not limited to, long-term operating infrastructure and capital infrastructure needs and the elimination of deficit positions in funds that are subsidized or have historically been subsidized by the general fund. At any time the governing body of the city may, by resolution, request specific long-term initiatives to be included in the five-year financial stabilization plan.
(5) A comprehensive list of revenue initiatives the city may pursue during the five years covered by the financial stabilization plan, including an estimate of the revenues to be produced by such initiatives.
(6) A comprehensive list of cost saving initiatives the city may pursue during the five years covered by the financial stabilization plan, including an estimate of costs saved by such initiatives.
(b) The governing body shall adopt the financial stabilization plan by December 31 of each year.
179
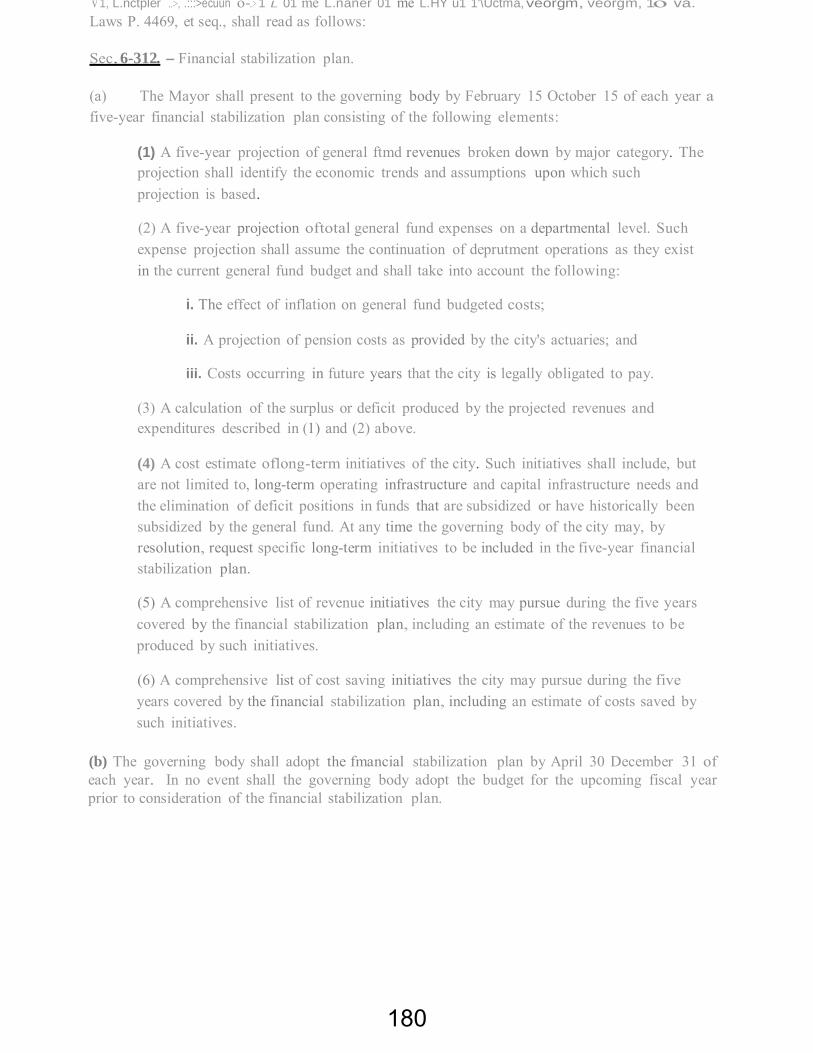
v 1, L.nctpler ..>, .:::>ecuun o-..> 1 L 01 me L.naner 01 me L.HY u1 1'\Uctma, veorgm, veorgm, 1o va.
Laws P. 4469, et seq., shall read as follows:
Sec. 6-312. - Financial stabilization plan.
(a) The Mayor shall present to the governing body by February 15 October 15 of each year a five-year financial stabilization plan consisting of the following elements:
(1) A five-year projection of general ftmd revenues broken down by major category. The projection shall identify the economic trends and assumptions upon which such projection is based.
(2) A five-year projection oftotal general fund expenses on a departmental level. Such expense projection shall assume the continuation of deprutment operations as they exist in the current general fund budget and shall take into account the following:
i. The effect of inflation on general fund budgeted costs;
ii. A projection of pension costs as provided by the city's actuaries; and
iii. Costs occurring in future years that the city is legally obligated to pay.
(3) A calculation of the surplus or deficit produced by the projected revenues and expenditures described in (1) and (2) above.
(4) A cost estimate oflong-term initiatives of the city. Such initiatives shall include, but are not limited to, long-term operating infrastructure and capital infrastructure needs and the elimination of deficit positions in funds that are subsidized or have historically been subsidized by the general fund. At any time the governing body of the city may, by resolution, request specific long-term initiatives to be included in the five-year financial stabilization plan.
(5) A comprehensive list of revenue initiatives the city may pursue during the five years covered by the financial stabilization plan, including an estimate of the revenues to be produced by such initiatives.
(6) A comprehensive list of cost saving initiatives the city may pursue during the five years covered by the financial stabilization plan, including an estimate of costs saved by such initiatives.
(b) The governing body shall adopt the fmancial stabilization plan by April 30 December 31 of each year. In no event shall the governing body adopt the budget for the upcoming fiscal year prior to consideration of the financial stabilization plan.
180

1u llL.t, ur rKuru,::,.r..u AlVlliJ urvlliJ1 TO THE CHARTER OF THE CITY OF ATLANTA
Notice is hereby given that an Ordinance has been introduced to amend the Charter of the
City of Atlanta (Ga. Laws, 1996, p. 4469, et seq.) approved April 15, 1996, as amended, said
Ordinance being captioned as follows:
AN ORDINANCE AND CHARTER AMENDMENT TO AMEND THE CHARTER OF THE CITY OF ATLANTA, GEORGIA, 1996 GALAWS P. 4469, ET SEQ., ADOPTED UNDER AND BY VIRTUE OF THE AUTHORITY OF THE MUNICIPAL HOME RULE ACT OF 1965, O.C.G.A. SECTION 36-35-1 ET SEQ., AS AMENDED, BY AMENDING PART 1 (CHARTER AND RELATED LAWS), SUBPART A (CHARTER), ARTICLE VI (REVENUE AND FUND ADMINISTRATION), CHAPTER 3 (FISCAL CONTROL), SECTION 6-312 (FINANCIAL STABILIZATION PLAN), SO AS TO CHANGE THE DATES BY WHICH THE CITY'S FINANCIAL STABILIZATION PLAN MUST BE PRESENTED TO AND ADOPTED BY CITY COUNCIL; AND FOR OTHER PURPOSES.
A copy of the proposed Ordinance and Chru1er Amendment is on file in the Office of the
Municipal Clerk of the City of Atlanta and in the Offices of the clerks of the Superior Courts of
Fulton and DeKalb Counties, Georgia for the purpose of examination and inspection by the
public.
This dayof .,2011.
Rhonda Dauphin Johnson Municipal Clerk City of Atlanta
181

DeKalb Counties and that a "Notice of Proposed Amendment to the Charter of the City of Atlanta, Georgia," attached hereto and marked "Exhibit A" and made a part of this ordinance, be published in the official organ of the cotmty of the legal situs of the City of Atlanta or in a newspaper of general circulation in the City of Atlanta once a week for three weeks within a period of 60 days immediately preceding its final adoption, and that a copy of said advertisement be attached to this ordinance prior to its final adoption by the Cmmcil of the City of Atlanta.
Section 3: That all ordinances and parts of ordinances in conflict herewith are hereby waived to the extent of the conflict.
Atruec p, d) ADOPTED by the Atlanta City Council APPROVED as per City Charter Section 2·403
Nov. 07,2011 Nov.16,2011
182

RCS# 1531
11/07/11
4: 01 PM
Atlanta City Council
REGULAR SESSION
11-0-1415 AMEND COA CHARTER PART IA/ART VI/CH3
SEC 6-312/CHANGE DATES FOR FSP
ADOPT
YEAS: 11 NAYS: 0
ABSTENTIONS: 0
NOT VOTING: 1
EXCUSED: 2
ABSENT 2
Y Smith
Y Hall B Young
Y Winslow
Y Archibong
Y Wan
Y Shook
Y Adrean
Y Moore
Y Martin
B Bottoms
E Sheperd
Y Bond
E Watson
Y Willis
NV Mitchell
11-0-1415
183

YEAS: 15 NAYS: 0
ABST::::NTIONS: 0 NOT VOTING: 1
EXC:.JSED: 0 ABSENT 0
lU/U..)/1.1. 2:59 PM
• ••• I
.... .
..·-o-1415
"' I •
., • I
Atlanta City Cou cil
REGOLAR SESSION
AMENDING CHARTER AND RELATED LAWS PART 1
ARTICLE IV, CH.3, SECTION 6-312
ADOPT
Y Smith
Y Hall Y Young Y Winslow
Y Archibong
Y Wan Y Shook
Y Adrean
Y Moore
Y Martin Y Bottoms Y Sheperci
Y Bond
Y Watson Y Willis
NV Mitchell 11-0-1415
184

GLOSSARY
Auction Rate Bond/Security – An auction rate bond or security is a long term maturity instrument
for which interest rates are regularly reset. The reset is normally done by a Dutch auction where
the security instrument begins at a high price and is then lowered until an investor is willing to
accept the auctioneer’s price.
Bond Insurance – An insurance policy that guarantees that the insurance company will make
principal and interest payments to a bond holder if the issuer cannot. This insurance policy usually
broadens the demand of the bond to retail investors.
Conduit Bond – A bond issued by a state or local authority on behalf of a non-profit organization
and business for projects to boost economic development.
Fixed Rate Bond – A fixed rate bond is a long-term debt instrument that carries a predetermined
interest rate. The interest rate is known as the coupon rate and is payable at specific dates until
the instruments maturity date(s). Most often fixed rate bonds pay interest semi-annually.
General Obligation Bonds – Bond issued by a local government for public purposes and require
voter approval. These bonds are secured by the issuer’s taxing power.
Letter of Credit/Standby (LOC) – Is a guarantee of payment issued by a bank on behalf of a client
as payment of last resort should the client fail to fulfill its commitment to a third party. This credit
facility is required when issuing auction rate bonds, variable rate bonds and commercial paper
notes. This letter is a contract between the bank and the client and usually has a 3 year expiration
date. The client is charged a quarterly fee by the bank for this service.
Municipal Bond – A debt or obligation of a public agency that bears interest and recognized by
specific maturity date(s).
Refunding Bonds – Issued to refinance a previous bond issue; usually to achieve a lower rate of
interest or restructure for lower payments. It uses the same security as the refunded debt (G.O.
Bonds, Revenue Bonds, Leases, etc.)
Revenue Bond - A municipal bond supported by revenues from a specific project or enterprise
system. Some examples of revenue bonds are water & w a s t e water bonds, airport bonds, public
utility bonds, tolls authority bonds. The fees and charges collected from the enterprise systems
are used to make the debt payments.
Serial Bonds – A bond issue in which portions of the bonds mature at intervals until eventually all
the bonds have matured. Serial bonds pay varying interest based on the yield at which they were
sold.
185

Term Bond – An issue of bonds that mature at the same time. The principal or outstanding
par amount of the bond becomes due at the same date.
Variable Rate Bonds – A method of interest rate assignment where the interest rate is reset after
a short period of time (e.g., weekly or 30-90 days). Essentially, the loan rolls over every time the
rate is reset and bondholders can request repayment of principal at each reset. In addition,
variable rate debt has the advantage of bearing the least expensive rates available in the market,
has the disadvantage of having exposure to large scale upward interest rate movements in the
market and bear additional costs from Letter of Credit protection and re-marketing fees, as a new
buyer may be needed with each reset.
186