Embed Size (px)
Citation preview

FAA Aerospace ForecastFiscal Years 2010-2030
AdministrationFederal Aviation
U.S. Department of Transportation Federal Aviation Administration Aviation Policy and Plans


1
FAA Aerospace Forecast Fiscal Years 2010–2030
MESSAGE FROM THE ADMINISTRATOR
This year’s forecast confirms what we already know: Aviation is a business subject to highly volatile and unpredictable external influences. Whether it is the economy, the global political climate or environmental concerns, our industry is affected at every level. The good news is that aviation has shown time and time again that it can adapt and meet those challenges while continuing to provide safe, efficient transportation. This year’s forecast anticipates that these challenges will remain for at least 20 more years. But it also shows our confidence this industry will not only face these challenges head on, but will thrive.
Aviation has been especially hard hit by the turbulence that has rocked our economy. As the economy dipped, airline demand fell sharply. Airlines have tightened their belts, passengers have modified their traveling habits, and our airports have had to adapt. But, economic growth will return along with passengers and increasing operations. We expect to see changes in the industry as it rebounds over the next several years, with international markets growing faster than domestic markets, and large airports growing faster than smaller ones. We also expect the trend toward larger regional jets to continue while most of the smaller regional jets will be retired from the fleet.
For the remainder of 2010, we expect that last year’s trends will continue before the industry turns the corner. But we do expect growth in the longer-term. For the short-term, we will continue to see declines in both domestic and international capacity as carriers respond to the impacts of the economic downturn. The airlines will continue to make adjustments to fleets and operations to match changing demand.
Although we find the industry dealing with issues no one would have predicted a decade ago, we also know those issues are here to stay, along with possibly new, unknown challenges. All of us in the industry must learn how to do business in this uncertain world. Factors such as oil price volatility, economic uncertainty, congestion concerns, security demands, and environmental issues are not going away.
This forecast will help the FAA and the aviation industry prepare for the future. In spite of the uncertain world in which we find ourselves, we know that a robust aviation industry is key to economic recovery and future continued growth. We will be ready.
Randy BabbittAdministrator

FAA Aerospace Forecast Fiscal Years 2010–2030
2

3
FAA Aerospace Forecast Fiscal Years 2010–2030
TABLE OF CONTENTS . . . . . . . . . . . . . . . . . . . . . . . . .PAGE
Forecast HigHligHts . . . . . . . . . . . . . . . . . . . . . . . . . . . . . . . . . . . . . . . . . . . . . . . . . . . . . . . . . . . . 5
review oF 2009 . . . . . . . . . . . . . . . . . . . . . . . . . . . . . . . . . . . . . . . . . . . . . . . . . . . . . . . . . . . . . . . . . . . 7
U.S. ECONOMIC ACTIvITy . . . . . . . . . . . . . . . . . . . . . . . . . . . . . . . . . . . . . . . . . . . . . . . . . . . . . . . . 8
WORLD ECONOMIC ACTIvITy . . . . . . . . . . . . . . . . . . . . . . . . . . . . . . . . . . . . . . . . . . . . . . . . . . . . 10
COMMERCIAL AvIATION . . . . . . . . . . . . . . . . . . . . . . . . . . . . . . . . . . . . . . . . . . . . . . . . . . . . . . . . . 10
World Travel Demand . . . . . . . . . . . . . . . . . . . . . . . . . . . . . . . . . . . . . . . . . . . . . . . . . . . . . . . . . 10
U.S. Travel Demand . . . . . . . . . . . . . . . . . . . . . . . . . . . . . . . . . . . . . . . . . . . . . . . . . . . . . . . . . . 14
Commercial Air Carriers - Passenger . . . . . . . . . . . . . . . . . . . . . . . . . . . . . . . . . . . . . . . . . . 15
Commercial Air Carriers - Cargo . . . . . . . . . . . . . . . . . . . . . . . . . . . . . . . . . . . . . . . . . . . . . . 19
U.S. Commercial Air Carriers 2009 Financial Results . . . . . . . . . . . . . . . . . . . . . . . . . . . . . . . . . 20
U.S. Commercial Air Carriers 2009 Aircraft Fleet . . . . . . . . . . . . . . . . . . . . . . . . . . . . . . . . . . . . 22
GENERAL AvIATION . . . . . . . . . . . . . . . . . . . . . . . . . . . . . . . . . . . . . . . . . . . . . . . . . . . . . . . . . . . . . . 23
FAA WORkLOAD . . . . . . . . . . . . . . . . . . . . . . . . . . . . . . . . . . . . . . . . . . . . . . . . . . . . . . . . . . . . . . . . 25
Faa aerospace Forecast Fiscal Years 2010 - 2030 . . . . . . . . . . . . . . . . . . . . . . . . . . . . . . . . 28
ECONOMIC FORECASTS . . . . . . . . . . . . . . . . . . . . . . . . . . . . . . . . . . . . . . . . . . . . . . . . . . . . . . . . . 29
World Economy . . . . . . . . . . . . . . . . . . . . . . . . . . . . . . . . . . . . . . . . . . . . . . . . . . . . . . . . . . . . . . 31
AvIATION TRAFFIC AND ACTIvITy FORECASTS . . . . . . . . . . . . . . . . . . . . . . . . . . . . . . . . . . . . . . 32
Commercial Aviation Forecasts . . . . . . . . . . . . . . . . . . . . . . . . . . . . . . . . . . . . . . . . . . . . . . . . . 33
Domestic Markets . . . . . . . . . . . . . . . . . . . . . . . . . . . . . . . . . . . . . . . . . . . . . . . . . . . . . . . . . 34
International Markets . . . . . . . . . . . . . . . . . . . . . . . . . . . . . . . . . . . . . . . . . . . . . . . . . . . . . . 37
Air Cargo . . . . . . . . . . . . . . . . . . . . . . . . . . . . . . . . . . . . . . . . . . . . . . . . . . . . . . . . . . . . . . . . 40
Commercial Aircraft Fleet . . . . . . . . . . . . . . . . . . . . . . . . . . . . . . . . . . . . . . . . . . . . . . . . . . . . . . 42
General Aviation . . . . . . . . . . . . . . . . . . . . . . . . . . . . . . . . . . . . . . . . . . . . . . . . . . . . . . . . . . . . . 43
FAA Workload Forecasts . . . . . . . . . . . . . . . . . . . . . . . . . . . . . . . . . . . . . . . . . . . . . . . . . . . . . . . 45
FAA and Contract Towers . . . . . . . . . . . . . . . . . . . . . . . . . . . . . . . . . . . . . . . . . . . . . . . . . . . 45
En Route Centers . . . . . . . . . . . . . . . . . . . . . . . . . . . . . . . . . . . . . . . . . . . . . . . . . . . . . . . . . 46
UNmaNNed aircraFt sYstems . . . . . . . . . . . . . . . . . . . . . . . . . . . . . . . . . . . . . . . . . . . . . . . . . . . 48
commercial space traNsportatioN . . . . . . . . . . . . . . . . . . . . . . . . . . . . . . . . . . . . . . . . . . . . . 49
risks to tHe Forecast . . . . . . . . . . . . . . . . . . . . . . . . . . . . . . . . . . . . . . . . . . . . . . . . . . . . . . . . . . 52
appeNdix a: alterNative Forecast sceNarios . . . . . . . . . . . . . . . . . . . . . . . . . . . . . . . . . . 55
appeNdix B: Forecast accUracY. . . . . . . . . . . . . . . . . . . . . . . . . . . . . . . . . . . . . . . . . . . . . . . . 65
appeNdix c: ackNowledgemeNts . . . . . . . . . . . . . . . . . . . . . . . . . . . . . . . . . . . . . . . . . . . . . . . 67
Forecast taBles . . . . . . . . . . . . . . . . . . . . . . . . . . . . . . . . . . . . . . . . . . . . . . . . . . . . . . . . . . . . . . . 69

FAA Aerospace Forecast Fiscal Years 2010–2030
4
5
FAA Aerospace Forecast Fiscal Years 2010–2030
FORECAST HIGHLIGHTS 2010-2030
Aviation will continue to grow over the long term, despite current global economic conditions. Since 2000, U.S. airlines have dealt with the impacts of 9/11, the bankruptcy of four network carriers, record high fuel prices, the most serious economic downturn since the Great Depression, and heightened concerns about a pandemic that turned into reality in 2009. In spite of these challenges, the number of passengers traveling continues to grow over the long term, demonstrating the value of air transportation to the public. There has been a slowdown in air travel growth, and the FAA now calls for one billion passengers to be flown in 2023, pushed back from last year’s 2021.
The 2010 forecast for commercial aviation calls for lackluster activity in the near term, with a return to growth over the long term. The level of activity and demand in the long term, however, is not expected to snap back to levels published in the previous FAA forecast. The most significant factor preventing recovery to prior forecast levels is the blow to the economy from the Great Recession. The recession led to an erosion of wealth, double-digit unemployment, declining corporate travel budgets, and close-fisted consumers, all of which contributed to a softening of demand for air travel. A bright spot is on the horizon, though. After four straight quarters of decline, the U.S. economy resumed growth in the fourth quarter of 2009, albeit driven by government stimulus packages that are winding down.
System capacity in available seat miles (ASMs) – the overall yardstick for how busy aviation is both domestically and internationally – will drop 1.6 percent this year, after posting a 7.4 percent decrease during 2009, and then grow at an average of 3.6 percent per year through 2030. In the domestic market, capacity drops 1.1 percent in 2010, after posting the largest percentage decline in ASMs (down 8.9 percent in Fy 2009) since deregulation of the industry. Domestic mainline carrier capacity will decline 1.6 percent (marking the third straight year of declines). For the regional carriers, domestic capacity will grow 1.9 percent from 2009 levels – resuming growth after shrinking in 2009 for the first time since deregulation. Commercial air carrier domestic revenue passenger miles (RPMs) are forecast to grow 0.4 percent in 2010, and then grow at an average of 3.2 percent per year through 2030; enplanements in 2010 will grow 0.4 percent for the year, and then grow at an average annual rate of 2.5 percent for the remainder of the forecast.
Following previous downturns (e.g. the recessions in 1991 and 2001) carriers stimulated passenger demand by reducing fares sharply. The industry’s initial response to the current economic downturn was to modestly cut fares and to better match supply (seats) and demand (passengers). It quickly became apparent that dramatic (not modest) cuts in fares would be the only way to stimulate passenger demand, and carriers responded with multiple sales throughout the year. In addition, to help minimize losses, carriers also reduced flying to hold the line on costs. With no evidence of pent up demand, we do not anticipate a return to previously forecasted passenger levels even when recovery takes hold.
The average size of domestic aircraft is expected to decline by 0.3 seats in Fy 2010 to 121.6 seats. Average seats per aircraft for mainline carriers are projected to fall by 0.8 seats as network carriers1
1 Alaska Airlines, American Airlines, Continental Airlines, Delta Airlines, Northwest Airlines, United Airlines, and US Airways (although Delta Airlines and Northwest Airlines merged, the carriers continued to report separate operating results through 2009 since they held separate operating certificates).

FAA Aerospace Forecast Fiscal Years 2010–2030
6
continue to reconfigure their domestic fleets. While demand for 70-90 seat aircraft continues to increase, we expect the number of 50 seat regional jets in service to fall, increasing the average regional aircraft size in 2010 by 1.2 seats to 56.2 seats per mile. Passenger trip length in domestic markets will remain relatively flat, decreasing by 0.7 miles.
The downturn in the economy has dampened the near-term prospects for the general aviation industry, but the long-term outlook remains favorable. We see growth in business aviation demand over the long term driven by a growing U.S. and world economy. As the fleet grows, the number of general aviation hours flown is projected to increase an average of 2.5 percent a year through 2030.
The shaky global economy that took hold in the latter part of 2008 is expected to continue its squeeze on air travel demand through 2010. Profitability for U.S. carriers will hinge on the return of demand for corporate air travel, the ability to pass along fare increases to leisure travelers, and a stable environment for fuel prices. To navigate the volatile operating environment, mainline carriers will continue to drive down their costs by better matching flight frequencies and/or aircraft gauge with demand, delaying deliveries of newer aircraft and/or grounding older aircraft, and pressuring regional affiliates to accept lower fees for contract flying. Over the long term, we see a competitive and profitable industry characterized by increasing demand for air travel and air fares growing more slowly than inflation.
7
FAA Aerospace Forecast Fiscal Years 2010–2030
REvIEW OF 2009Each passing month of 2009 saw the light on consumer confidence dim as housing foreclosures climbed, credit tightened, and unemployment surged. This chain of events led to listless demand for air travel during the year as corporate travel budgets were slashed and consumer spending dried up. In 20092 system revenue passenger miles (RPMs) decreased 7.1 percent as enplanements fell 7.3 percent. Commercial air carrier domestic enplanements were down 7.3 percent while international enplanements fell 6.6 percent. The system-wide load factor increased 0.2 points to 79.7 percent. Domestic enplanement market share for low-cost and regional carriers grew in 2009 while network and “other” carrier share decreased. Enplanement market share for the network carriers shrank 1.5 points to 47.6 percent while market share for “other” carriers shrank 0.5 points to 1.4 percent. Low cost carrier3 share rose 0.9 points to 26.6 percent and regional carrier market share rose 1.0 points to 24.4 percent.
System wide real yield dropped 9.8 percent during 2009 as the Great Recession led to reduction in demand for premium travel and carriers executed fare sales throughout the year to stimulate demand for leisure travel. In spite of the economic environment, the commercial air carrier industry posted an operating profit in 2009. Carrier operating losses during the first half of the year were replaced by operating profits during the second half for total operating profits of $755 million for the year (compared to a $2.0 billion operating loss posted for 2008). The network carriers reported operating losses for the three of the four quarters to total losses of $1.7 billion for the year. All six of the network carriers posted losses for the year, while eight out of nine of the low cost carriers posted operating profits. The net loss for U.S. commercial air carriers in 2009 was $8.1 billion, with the network, low cost, “other” and cargo carriers posting net losses of $7.6 billion, $145.6 million, $296.0 million, and $331.2 million, respectively. The regional carriers posted a net profit of $202.3 million.
The market for general aviation products and services declined sharply in 2009. U.S. manufacturer shipments declined for the 2nd year in a row, a whopping 48.5 percent decrease, while billings fell 32.1 percent compared to 2008. Single engine piston aircraft shipments fell 54.6 percent while turbine jet aircraft shipments decreased by 46.2 percent. The decline in shipments and billings seen in the jet fleet was a direct reflection of the downturn in the U.S. and world economy. Along with the fall in shipments and billings, general aviation activity at FAA and contract tower airports fell 11.7 percent in 2009.
Total operations at FAA and contract towers fell 10.4 percent to their lowest levels since 1982 as activity declined in all user categories. Although the number of flights fell, FAA’s workload didn’t. As the fleet mix changes with increasing numbers of regional and business jets in the nation’s skies, and as carriers consolidate operations in their large hubs, the complexity of activity in the airspace continues to grow, increasing our workload.
2 All stated years and quarters for U.S. economic and U.S. air carrier traffic and financial data and forecasts are on a fiscal year (FY) basis (October 1 through September 30). All stated years and quarters for international economic and world traffic and financial data are on a calendar year (CY) basis, unless otherwise stated.
3 Allegiant Air, AirTran Airways, Frontier Airlines, JetBlue Airways, Southwest Airlines, Spirit Airlines, USA3000, and Virgin America Airlines.

FAA Aerospace Forecast Fiscal Years 2010–2030
8
U.S. ECONOMIC ACTIvITy
In Fy 2009, the U.S. economy experienced the worst recession in the post war era. After growing 1.9 percent in Fy 2008, U.S. Gross Domestic Product (GDP) contracted 2.9 percent in fiscal year 2009. The story during the first part of the year was the sharp decline in output that accompanied the financial crisis brought on by the Lehman Bros bankruptcy in September 2008. Real GDP contracted 5.4 percent in the first quarter followed by an even steeper 6.4 percent contraction in the second quarter. As the economic downturn gathered momentum, the new Administration and Congress passed the American Recovery and Reinvestment Act (ARRA) in February 2009. The bill which included a combination of individual tax cuts, investment incentives, aid to people directly hurt by the recession, state fiscal relief, and direct government investment spending was estimated to have a total fiscal impact of $787 billion. While there has been significant debate about the effectiveness of ARRA, data show that the freefall in economic activity began to temper during the 3Q as output fell by just 0.7 percent. In the 4Q, buoyed by a variety of rebate programs (most notably “cash for clunkers”) the U.S. economy grew for first time in five quarters, with output increasing by 2.2 percent.
One of the most obvious impacts of the recession was the rise in the nation’s unemployment rate. In December 2007 when the recession began, the unemployment rate was 5.0 percent. As the recession intensified the unemployment rate rose and reached 7.4 percent in December 2008. The rate continued to rise throughout 2009 and stood at 9.8 percent in September 2009. All told from the beginning of the recession through the end of Fy 2009, approximately 6.9 million jobs have been lost.
U.S. GR O SS DO M ESTIC PR ODUC TSEASONALLY ADJ USTED ANNUAL GROW TH
FY 2008 AND 2009 BY QUART ER
(0 .7 )
(6 .4)
2.21.5
(0 .7 )
(2 .7)
(5.4 )
2.1
-7 .0
-6 .0
-5 .0
-4 .0
-3 .0
-2 .0
-1 .0
0 .0
1 .0
2 .0
3 .0
20 07 -0 4 2 00 8-01 20 08 -0 2 2 00 8-03 20 08 -0 4 200 9-0 1 2 009 -02 20 09-0 3
F isca l Y ear 2 008 F iscal Y ear 200 9
AN
NU
AL
PER
CEN
T G
RO
WTH

9
FAA Aerospace Forecast Fiscal Years 2010–2030
Another impact of the recession was the falling demand for oil and resulting lower oil prices. Oil prices, as measured by the U.S. Refiners’ Acquisition Cost, fell by 45.4 percent in Fy 2009 to $55.46. But, as in Fy 2008, the average price for the year fails to tell the whole story. Oil prices, which averaged $98.91 in September 2008, fell rapidly through January 2009, down to $37.45, then recovered back to $65.71 by June and remained in the mid $60 range for the balance of the fiscal year, averaging $67.74 in September 2009.
The combination of falling demand and falling energy prices resulted in the consumer price index (CPI) declining by 0.3 percent in Fy 2009, the first decline in the CPI since 1955. The 0.3 percent fall in the CPI in Fy 2009 was 4.7 percentage points lower than in Fy 2008.
U.S. UNEMPLOYMENT RATE
9.89.79.49.5
4.85.0 5.45.0
5.55.8
6.1 6.26.6 6.9
5.0
7.4 7.78.2
8.6 8.99.4
5.1
0.0
1.0
2.0
3.0
4.0
5.0
6.0
7.0
8.0
9.0
10.0
11.0
Dec-07 Mar-08 Jun-08 Sep-08 Dec-08 Mar-09 Jun-09 Sep-09
PCT
UNEM
PLO
YED
U.S. REFINERS’ ACQUISITION COST
$0
$20
$40
$60
$80
$100
$120
$140
2002-01 2003-01 2004-01 2005-01 2006-01 2007-01 2008-01 2009-01
$ PE
R B
AR
REL

FAA Aerospace Forecast Fiscal Years 2010–2030
10
WORLD ECONOMIC ACTIvITy
As the world’s largest economy, the U.S continues to have a prominent role in world economic growth. The slowdown that began in the U.S. in 2008 spread to all corners of the globe by the end of the year and led to the worst performance in the global economy since the Great Depression. In calendar year 2009, the world economy shrank by an estimated 2.4 percent as the advanced economies (U.S., Western Europe, Japan, Australia, New Zealand, and Canada) contracted 3.3 percent. Most regions saw their economies shrink but data coming out at the end of the year suggested that recovery had begun in most parts of the world with China and the U.S. leading the way.
On a calendar year basis, GDP in Canada contracted at the same rate of the U.S. in 2009, falling 2.5 percent. The combined economies of the Asian and Far East nations grew just 1.2 percent in 2009, down from 3.5 percent a year earlier. This region includes the world’s second largest economy, Japan (down 5.3 percent), and the world’s most vibrant economy, China (up 8.5 percent). The combined economies of Europe were hit particularly hard by the downturn with the economies of Western Europe shrinking 3.9 percent while the combined economies of Central Europe and the former Soviet Union contracted 6.1 percent. GDP in Latin America fell 2.1 percent with Brazil up just 0.2 percent while Mexico shrank by 7.5 percent as the U.S. recession resulted in sharp economic downturn in Mexico.
COMMERCIAL AvIATION
Commercial aviation suffered through a terrible year in 2009. Despite falling jet fuel prices, the downturn in passenger demand as a result of the global recession hurt the industry. Coming off of a year of record losses in 2008, the U.S. industry posted a smaller net loss in 2009, with a similar outcome predicted for foreign carriers. With the U.S., Europe and Japan in recession, global industry net losses for calendar year 2009 are expected to be $11.0 billion, with large losses in all global regions4. Although U.S. airlines had implemented large capacity reductions at the end of 2008, the downturn in demand resulted in a loss of pricing power and fares fell sharply in 2009.
4 IATA Financial Forecast, December 2009.
U.S. AND WORLD GDPCALENDAR YEARS 2002 - 2009
3.62.7
(2.5)
2.5
0.4
3.1
2.11.8 2.0
4.03.6
(2.4)
3.94.1
1.8
2.7
-3.0
-2.0
-1.0
0.0
1.0
2.0
3.0
4.0
5.0
2002 2003 2004 2005 2006 2007 2008 2009
U.S. World
AN
NU
AL
PER
CEN
T G
RO
WTH
11
FAA Aerospace Forecast Fiscal Years 2010–2030
world travel demaNd
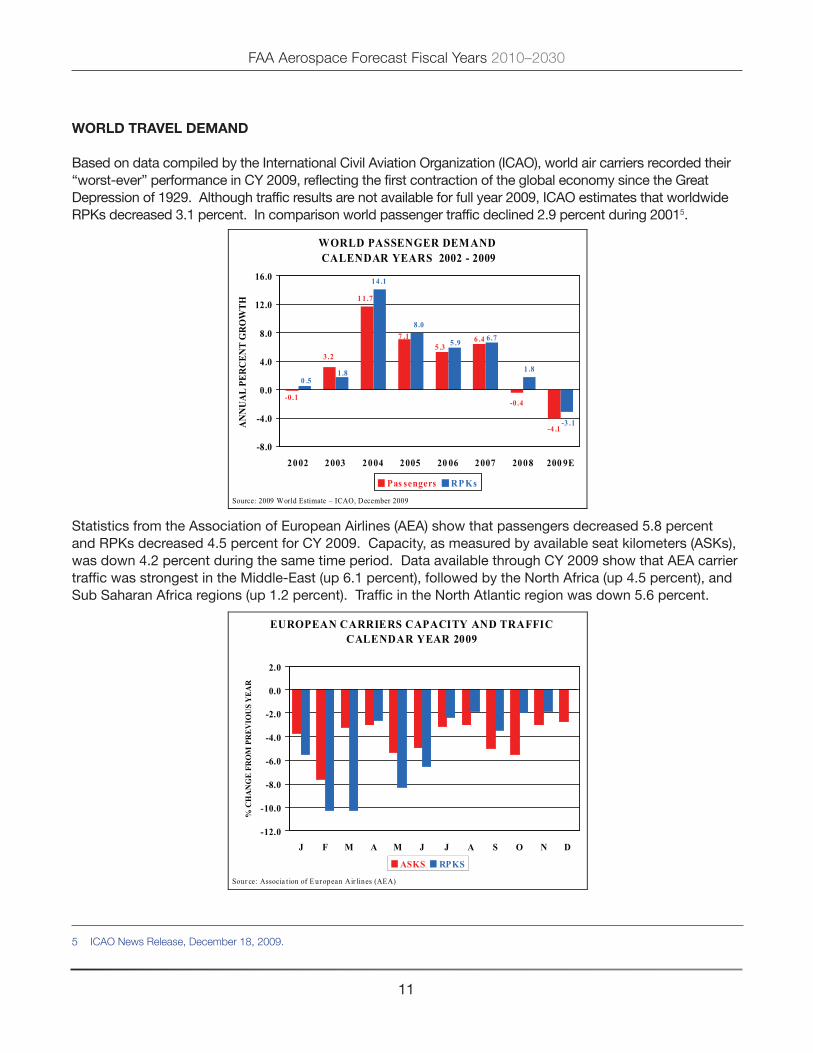
Based on data compiled by the International Civil Aviation Organization (ICAO), world air carriers recorded their “worst-ever” performance in Cy 2009, reflecting the first contraction of the global economy since the Great Depression of 1929. Although traffic results are not available for full year 2009, ICAO estimates that worldwide RPks decreased 3.1 percent. In comparison world passenger traffic declined 2.9 percent during 20015.
Statistics from the Association of European Airlines (AEA) show that passengers decreased 5.8 percent and RPks decreased 4.5 percent for Cy 2009. Capacity, as measured by available seat kilometers (ASks), was down 4.2 percent during the same time period. Data available through Cy 2009 show that AEA carrier traffic was strongest in the Middle-East (up 6.1 percent), followed by the North Africa (up 4.5 percent), and Sub Saharan Africa regions (up 1.2 percent). Traffic in the North Atlantic region was down 5.6 percent.
WORLD PASSENGER DEMAND CALENDAR YEARS 2002 - 2009
-0.4
-4 .1
14 .1
1 .8
1 1.7
6 .47 .1
-0.1
5 .33.2
-3 .1
6.75 .9
8.0
0 .51.8
-8.0
-4.0
0.0
4.0
8.0
12.0
16.0
2002 2003 2004 2005 20 06 2007 2008 200 9E
Pas sengers RP Ks
Source: 2009 World Estimate – ICAO, December 2009
AN
NU
AL
PER
CEN
T G
RO
WTH
EUROPEAN CARRIERS CAPACITY AND TRAFFICCALENDAR YEAR 2009
-12.0
-10.0
-8.0
-6.0
-4.0
-2.0
0.0
2.0
J F M A M J J A S O N D
ASKS RPKS
Sour ce: Associa t ion of E uropean Air lines (AEA)
% C
HA
NG
E FR
OM
PR
EVIO
US
YEA
R
5 ICAO News Release, December 18, 2009.
FAA Aerospace Forecast Fiscal Years 2010–2030
12
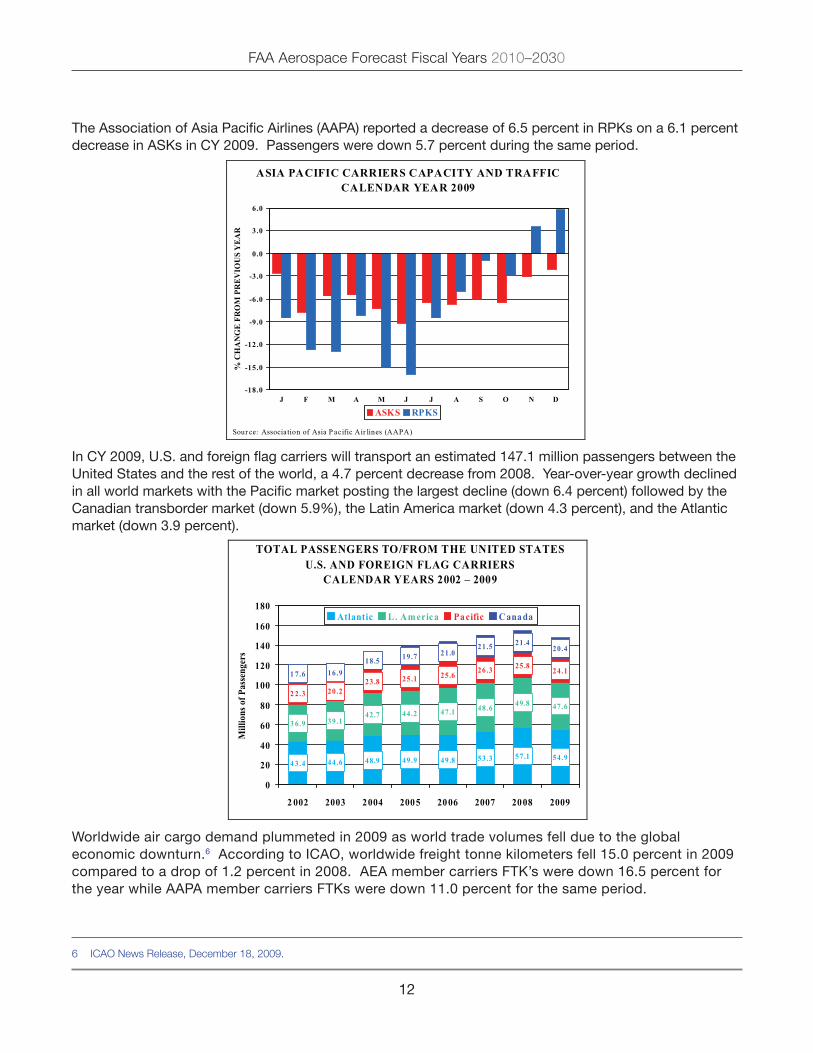
The Association of Asia Pacific Airlines (AAPA) reported a decrease of 6.5 percent in RPks on a 6.1 percent decrease in ASks in Cy 2009. Passengers were down 5.7 percent during the same period.
In Cy 2009, U.S. and foreign flag carriers will transport an estimated 147.1 million passengers between the United States and the rest of the world, a 4.7 percent decrease from 2008. year-over-year growth declined in all world markets with the Pacific market posting the largest decline (down 6.4 percent) followed by the Canadian transborder market (down 5.9%), the Latin America market (down 4.3 percent), and the Atlantic market (down 3.9 percent).
Worldwide air cargo demand plummeted in 2009 as world trade volumes fell due to the global economic downturn.6 According to ICAO, worldwide freight tonne kilometers fell 15.0 percent in 2009 compared to a drop of 1.2 percent in 2008. AEA member carriers FTk’s were down 16.5 percent for the year while AAPA member carriers FTks were down 11.0 percent for the same period.
6 ICAO News Release, December 18, 2009.
TOTAL PASSENGERS TO/FROM THE UNITED STATESU.S. AND FOREIGN FLAG CARRIERS
CALENDAR YEARS 2002 – 2009
4 3.4 44.6 48.9 49.9 49.8 53.3 57.1 54.9
3 6.9 39.142.7 44.2 47.1 48.6 49.8 47.6
2 2.3 20.223.8 25.1 25.6 26.3 25.8 24.11 7.6 16.918.5 19.7 21.0
21.5 21.420.4
0
20
40
60
80
100
120
140
160
180
2 002 2003 2004 2005 2006 2007 2008 2009
Atlantic L . Am erica Pacific Canada
Mill
ions
of P
asse
nger
s
ASIA PACIFIC CARRIERS CAPACITY AND TRAFFICCALENDAR YEAR 2009
-18.0
-15.0
-12.0
-9.0
-6.0
-3.0
0.0
3.0
6.0
J F M A M J J A S O N D
ASKS RPKS
Sour ce: Association of Asia P acific Air lines (AAPA)
% C
HA
NG
E FR
OM
PR
EVIO
US
YEA
R
13
FAA Aerospace Forecast Fiscal Years 2010–2030
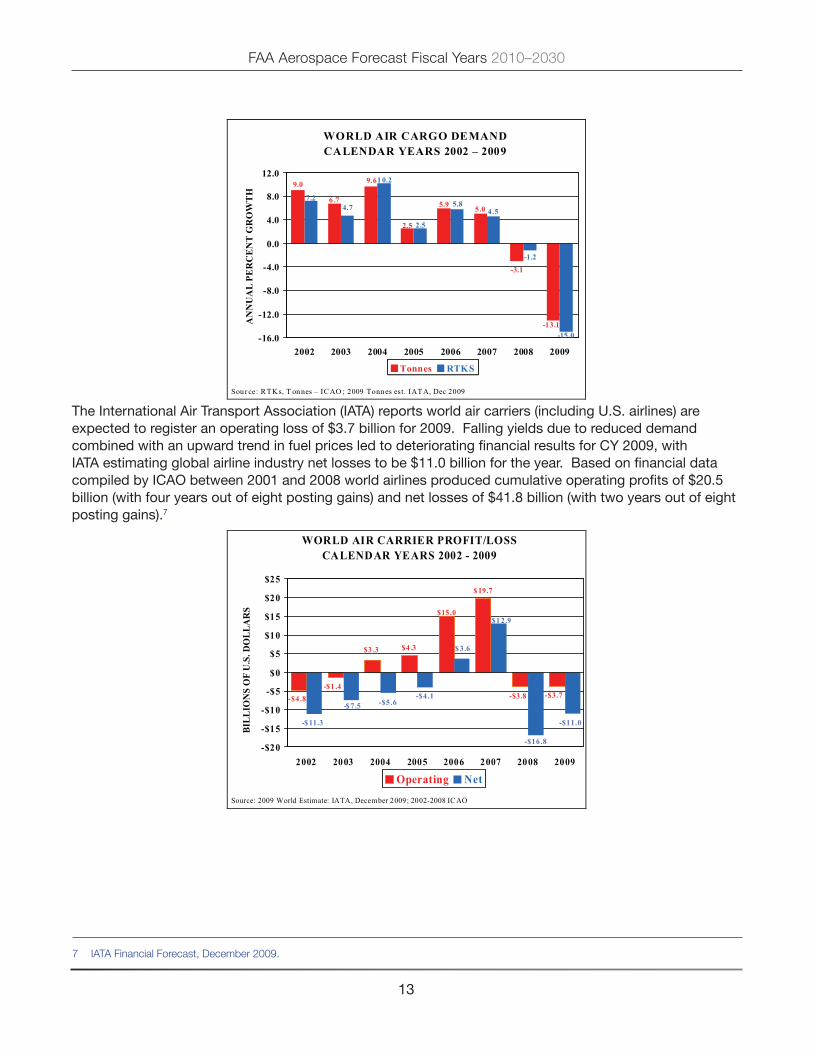
The International Air Transport Association (IATA) reports world air carriers (including U.S. airlines) are expected to register an operating loss of $3.7 billion for 2009. Falling yields due to reduced demand combined with an upward trend in fuel prices led to deteriorating financial results for Cy 2009, with IATA estimating global airline industry net losses to be $11.0 billion for the year. Based on financial data compiled by ICAO between 2001 and 2008 world airlines produced cumulative operating profits of $20.5 billion (with four years out of eight posting gains) and net losses of $41.8 billion (with two years out of eight posting gains).7
WORLD AIR CARGO DEMAND CALENDAR YEARS 2002 – 2009
-3.1
5.05.9
2.5
-13.1
9.69.0
6 .7
-15.0
4.7
-1.2
4.5
7.25.8
2.5
10.2
-16.0
-12.0
-8.0
-4.0
0.0
4.0
8.0
12.0
2002 2003 2004 2005 2006 2007 2008 2009
Tonnes RTKS
Sour ce: RTKs, T onnes – ICAO ; 2009 Tonnes est. IATA, Dec 2009
AN
NU
AL
PER
CE
NT
GR
OW
TH
WORLD AIR CARRIER PROFIT/LOSSCALENDAR YEARS 2002 - 2009
$ 19.7
-$5.6-$4.1 -$3.7-$4.8
$15.0
-$1 .4
$3 .3 $4 .3
-$3.8
-$16.8
$ 3.6
-$11.0-$ 11.3
-$ 7.5
$1 2.9
-$20
-$15
-$10
-$5
$0
$5
$10
$15
$20
$25
2002 2003 2004 2005 2006 2007 2008 2009
Operating Net
Source: 2009 World Estimate: IATA, December 2009; 2002-2008 IC AO
BILL
ION
S O
F U
.S. D
OLL
AR
S
7 IATA Financial Forecast, December 2009.

FAA Aerospace Forecast Fiscal Years 2010–2030
14
U.s. travel demaNd
By year end Fy 2009, the U.S. commercial aviation industry consisted of 18 scheduled mainline air carriers that use large passenger jets (over 90 seats) and 66 regional carriers that use smaller piston, turboprop, and regional jet aircraft (up to 90 seats) to provide connecting passengers to the larger carriers. Mainline and regional carriers provide domestic and international passenger service between the U.S. and foreign destinations, although regional carrier international service is confined to border markets in Canada, Mexico, and the Caribbean. There were no carriers that either started or ceased operations during 2009; however Republic airlines acquired Midwest Airlines in June 2009 and Frontier Airlines (and its wholly owned subsidiary Lynx Aviation) during August 2009. Twenty-seven all-cargo carriers were providing domestic and/or international air cargo service at the end 2009.
Three distinct trends have occurred over the past several years that are shaping today’s commercial air carrier industry: (1) convergence of the network and low cost carrier business models; (2) consolidation of activity at a small percentage of the nation’s airports, and (3) a delineation of markets served between mainline and regional carriers. The narrowing of the percentage share of domestic mainline capacity operated between network and low cost carriers resumed in 2009, signaling a trend toward convergence of their respective business models. After losing share in 2008, partially due to the cessation of operations by two low cost carriers during the year (American Trans Air and Skybus Airlines), low cost carrier share grew 1.5 percentage points in 2009. Since 2000, the share of capacity flown by the low cost carriers has more than doubled, going from 17.0 percent in 2000 to 35.8 percent in 2009.
Activity at over 400 airports offering commercial service in the 48 contiguous states is consolidated at a small percentage of the airports. Analysis of Department of Transportation origin and destination data for the period 2000 through 2008 shows the percent of originating passengers at the 35 Operational Evolution Partnership (OEP) airports as a share of total domestic originating passengers to be stable. During this period the OEP 35 share ranged from a low of 63.1 percent in 2001 to a high of 64.5 percent in 2006 (in 2008 the share was 63.9 percent). Taking a larger sample, looking at the top 100 airports ranked by O&D passengers, these airports share of total domestic originating passengers has ranged from a low of 91.6 percent to a high of 92.1 percent in 2006 (with the share in 2008 at 91.9 percent), highlighting the concentration of passengers in the system.
The number of city pairs less than 750 miles apart served by mainline carriers in the contiguous U.S. is shrinking, indicating a concentration of flying by this group of carriers in markets greater than 750 miles. Overall, between 2003 and 2008 the number of city pairs served by mainline carriers increased by 218, going from 3,044 to 3,262. In markets greater than 750 miles apart, city pairs for this carrier group increased by 268 and in markets less than 750 miles city pairs decreased by 50. In 2008, markets greater than 750 miles apart were 59.0 percent of all markets served by mainline carriers, up from a share of 54.4 percent in 2003. In comparison, between 2003 and 2008 the number of city pairs served by regional carriers increased in both distance categories. For distances less than 750 miles, regional carriers flew 182 more markets than in 2003, and for distances greater than 750 miles these carriers flew 380 more markets than in 2003.
15
FAA Aerospace Forecast Fiscal Years 2010–2030
commercial air carriers — passengers
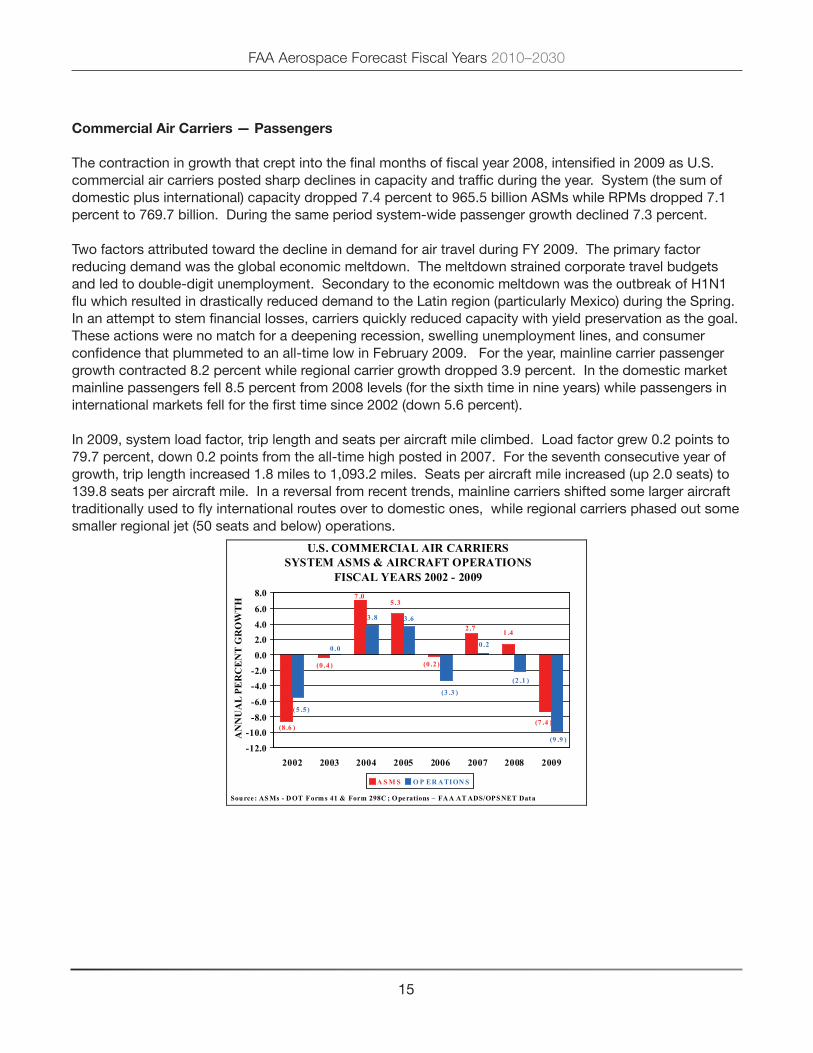
The contraction in growth that crept into the final months of fiscal year 2008, intensified in 2009 as U.S. commercial air carriers posted sharp declines in capacity and traffic during the year. System (the sum of domestic plus international) capacity dropped 7.4 percent to 965.5 billion ASMs while RPMs dropped 7.1 percent to 769.7 billion. During the same period system-wide passenger growth declined 7.3 percent.
Two factors attributed toward the decline in demand for air travel during Fy 2009. The primary factor reducing demand was the global economic meltdown. The meltdown strained corporate travel budgets and led to double-digit unemployment. Secondary to the economic meltdown was the outbreak of H1N1 flu which resulted in drastically reduced demand to the Latin region (particularly Mexico) during the Spring. In an attempt to stem financial losses, carriers quickly reduced capacity with yield preservation as the goal. These actions were no match for a deepening recession, swelling unemployment lines, and consumer confidence that plummeted to an all-time low in February 2009. For the year, mainline carrier passenger growth contracted 8.2 percent while regional carrier growth dropped 3.9 percent. In the domestic market mainline passengers fell 8.5 percent from 2008 levels (for the sixth time in nine years) while passengers in international markets fell for the first time since 2002 (down 5.6 percent).
In 2009, system load factor, trip length and seats per aircraft mile climbed. Load factor grew 0.2 points to 79.7 percent, down 0.2 points from the all-time high posted in 2007. For the seventh consecutive year of growth, trip length increased 1.8 miles to 1,093.2 miles. Seats per aircraft mile increased (up 2.0 seats) to 139.8 seats per aircraft mile. In a reversal from recent trends, mainline carriers shifted some larger aircraft traditionally used to fly international routes over to domestic ones, while regional carriers phased out some smaller regional jet (50 seats and below) operations.
U.S. COMMERCIAL AIR CARRIERSSYSTEM ASMS & AIRCRAFT OPERATIONS
FISCAL YEARS 2002 - 2009
(7 .4 )
1 .42 .7
(0 .2 )(0 .4 )
7 .0
(8 .6 )
5 .3
3 .8
(3 .3 )
0 .2
(5 .5 )
(2 .1 )
0 .0
(9 .9 )
3 .6
-12.0-10.0
-8.0-6.0
-4.0-2.00.02.04.06.0
8.0
2002 2003 2004 2005 2006 2007 2008 2009
A S M S O P ER ATION S
Source: ASMs - DOT Forms 41 & Form 298C ; Operations – FAA AT ADS/OPSNET Data
AN
NU
AL
PER
CE
NT
GR
OW
TH

FAA Aerospace Forecast Fiscal Years 2010–2030
16
Domestic Passenger Markets
Domestic capacity (50 states, Puerto Rico, and the U.S. virgin Islands) was down 8.9 percent in 2009 for the steepest decline since deregulation in 1978 (the second deepest decline occurred in 2002 after the terror attacks of 9/11, down 6.9 percent). Departures decreased by 8.7 percent after falling 1.9 percent in Fy 2008. year-over-year declines in capacity were posted each month of Fy 2009. After hitting double-digit declines in capacity during the first half of the year (down 11.0 in the first and second quarter of 2009) capacity dropped 8.3 percent and 6.0 percent in the third quarter and fourth quarter, respectively. Mainline carrier capacity was down 9.5 percent for the year, while regional carrier capacity was down 5.1 percent. At the end of 2009, domestic ASMs were 5.9 percent below pre-9/11 levels while departures were 14.6 percent below.
Domestic passenger enplanements and RPMs fell at a slower rate than ASMs in 2009. The decline in passenger growth accelerated from the first to the second quarter, going from down 8.1 percent to down
U.S. COMMERCIAL CARRIERSDOMESTIC CAPACITY
FISCAL YEAR 2009
-14.0
-12.0
-10.0
-8.0
-6.0
-4.0
-2.0
0.0
Oct Nov Dec Jan Feb Mar Apr May Jun Jul Aug Sep
ASMs DeparturesSou r ce: D O T F o r m 41
Year
/Yea
r % C
hang
e
U.S. COMMERCIAL AIR CARRIERSSYSTEM RPMS AND ENPLANEMENTS
FISCAL YEARS 2002 - 2009
0.8
7.0
0.4
(8.2)(7.3)
(0.8)
3.42.4
7.5
(7.1)
2.73.9
2.6
10.6
7.4
(8.6)-12.0
-9.0
-6.0
-3.0
0.0
3.0
6.0
9.0
12.0
2002 2003 2004 2005 2006 2007 2008 2009ENPLANEMENTS RPMS
Sour ce: DO T Form 41 & F or m 298C

17
FAA Aerospace Forecast Fiscal Years 2010–2030
11.0 percent. During the last half of the year, the decline in growth slowed to down 5.0 percent, with September 2009 posting a slight increase of 0.2 percent over the same 2008 period. Mainline carrier enplanements were down 8.5 percent for the year, while regional passengers fell 3.4 percent, marking the first decline in passenger growth for regional passengers during the post-deregulation era.
Similar to passengers, domestic RPMs dropped faster than ASMs with domestic RPMs down 7.7 percent in 2009. After falling dramatically during the first and second quarter of the year, down 9.9 percent and 11.8 percent, respectively, the last half of the year was only down 5.1 percent with September posting year-over-year growth of 0.5 percent. For the year, mainline carrier RPM growth was down 8.2 percent, while regional carrier growth was down 4.3 percent.
Domestic carrier load factor increased 1.0 points to 80.4 percent, setting an all-time high. Mainline carrier load factor increased 1.1 points to an all time high of 81.3 percent, while regional carrier load factor increased 0.6 points from 2008 to be 74.3 percent.
Since 2000, total domestic capacity has decreased by 5.9 percent. Mainline carriers have shrunk their domestic capacity by 14.4 percent with cutbacks by network carriers more than offsetting the growth of low-cost carriers. Making up the shortfall from network carrier capacity cuts during this time are the regional carriers. This segment of the industry has greatly increased capacity since 2000 (up 146.3 percent). During the same period, mainline carrier RPMs have decreased 2.2 percent, while enplanements have fallen by 14.9 percent. In comparison, regional carrier RPMs and enplanements have increased 207.5 and 93.04 percent, respectively. As a result, mainline carrier domestic capacity share has fallen from 94.7 percent in 2000 to 86.2 percent in 2009, while their share of RPMs has dropped from 95.5 percent to 87.2 percent during the same period. Regional carriers now carry 1 in every 4 passengers, up from 1 in every 7.8 in 2000.
U.S. COMMERCIAL CARRIERSDOMESTIC TRAFFICFISCAL YEAR 2009
-15.0
-12.0
-9.0
-6.0
-3.0
0.0
3.0
Oct Nov Dec Jan Feb M ar Apr May Jun Jul Aug Sep
R P M s Enpla ne m en tsSou r ce: D O T F o r m 41
Year
/Yea
r %
Cha
nge

FAA Aerospace Forecast Fiscal Years 2010–2030
18
International Passenger Markets
Reversing the recent trend of rapid growth by network carriers into international markets, U.S. carriers posted losses in international capacity and traffic in 2009. U.S. carrier ASMs and departures were down 3.5 and 5.4 percent, respectively, in 2009. ASM growth fell slower in the first half of the year (down 2.9 percent) and then accelerated a bit during the second half of the year (down 3.6 percent). ASMs decreased in all world travel regions—down 2.0, 3.0, and 6.7 percent, respectively, in Atlantic, Latin American, and Asia/Pacific markets.
International RPMs were down 5.6 percent and passenger enplanements were down 6.6 percent in 2009, with the growth declining faster in first half of the year (down 7.3 percent for the first half versus down 3.6 percent during the second half for RPMs; down 7.9 percent versus down 3.5 percent for enplanements). The Atlantic market posted the smallest decline, with RPMs down 3.4 percent and enplanements down 4.9 percent. RPMs and enplanements fell 5.9 and 7.0 percent, respectively, in the Latin American market, while RPMs dropped 9.4 percent as enplanements fell 8.7 percent in the Pacific market.
U.S. COMMERCIAL AIR CARRIERSDOMESTIC ENPLANEMENTS BY CARRIER GROUP
FISCAL YEARS 2002 – 2009
486.5 482.8 502.6 523.1 516.3 533.9 522.2 477.6
88.6 105.0125.9
146.4 152.2 156.2 159.1153.8
0
100
200
300
400
500
600
700
2 00 2 2 003 20 04 20 05 2 00 6 2 00 7 2 008 20 09
M ainline Regionals
Sou r ce: D O T F o r m 41 & F or m 298 C
MIL
LIO
NS
U.S. COMMERCIAL CARRIERSINTERNATIONAL CAPACITY
FISCAL YEAR 2009
-14 .0
-12 .0
-10 .0
-8 .0
-6 .0
-4 .0
-2 .0
0 .0
2 .0
Oc t N ov D e c J an F e b M ar A pr M a y Jun J ul A u g S e p
A S M s D ep a rturesSou r ce: DO T For m 41
Year
/Yea
r %
Cha
nge

19
FAA Aerospace Forecast Fiscal Years 2010–2030
The international load factor dropped 1.7 percentage points in 2009 to be 78.1 percent. Load factor fell in the Latin America market (down 2.5 points to 76.8 percent), the Pacific market (down 2.3 points to 78.3 percent) and in the North Atlantic market (down 1.1 points to 78.9 percent).
In 2009, 47.6 percent of the passengers flying abroad on U.S. flag carriers traveled to the Latin America market. The remaining 51.6 percent of international passengers was split between the Atlantic market (35.3 percent) and the Pacific market (17.1 percent).
commercial air carriers—cargo
Air cargo traffic contains both domestic and international revenue freight/express and mail. The demand for air cargo is a derived demand resulting from economic activity. Cargo moves in the bellies of passenger aircraft and in dedicated all-cargo aircraft, on both scheduled and nonscheduled service.
U.S. air carriers flew 30.8 billion revenue ton miles (RTMs) in 2009, down 21.0 percent from 2008, with domestic cargo RTMs declining by 17.7 percent (11.9 billion) and international RTMs decreasing by 23.0 percent (19.0 billion). The deep declines in domestic and international RTMs reflect many factors including the recession in the U.S. and other world regions, strong price competition from alternative shipping modes, and the global financial crisis.
U.S. COMMERCIAL CARRIERSINTERNATIONAL TRAFFIC
FISCAL YEAR 2009
-14 .0
-12 .0
-10 .0
-8 .0
-6 .0
-4 .0
-2 .0
0 .0
2 .0
O ct N ov D ec Jan F eb M a r A pr M ay J un Jul Aug S ep
R P M s Enpla ne mentsSou rce : DO T For m 41
Year
/Yea
r %
Cha
nge

FAA Aerospace Forecast Fiscal Years 2010–2030
20
Air cargo RTMs flown by all-cargo carriers was 72.3 percent of total RTMs in 2009, with passenger carriers flying the rest, or 27.7 percent of the total. Total RTMs flown by all-cargo carriers declined 20.0 percent in 2009, from 27.8 billion to 22.3 billion. Total RTMs flown by passenger carriers were 8.5 billion in 2009, 23.5 percent lower than in 2008.
On August 3, 2007, “Recommendations of the 9/11 Commission Act of 2007” was signed into law. Section 1602 of this Act states that air cargo placed on passenger aircraft will receive the same level of screening as passenger-checked baggage. The legislation calls for the establishment of a system by 2010 that will require 100 percent inspection of cargo transported on passenger aircraft. The Transportation Security Administration (TSA) is currently screening 50% of cargo that is transported by a passenger carrier. The law requires screening at the piece level. Because this screening requirement is not supplemented by congressional funding, it is the air cargo industry’s responsibility to bear all costs. Therefore, it is anticipated the law will continue to lead to increased cost and time requirements for shipment of cargo on passenger air carriers.
U.s. commercial air carriers 2009 FiNaNcial resUlts
After posting a record net loss of $18.6 billion in Fy 2008 (primarily due to $10.0 billion in losses at Delta and Northwest stemming from a reduction in the value of the airlines due to high fuel prices), U.S. commercial air carriers narrowed their losses to $8.1 billion in Fy 2009.
U.S. COMMERCIAL AIR CARRIERSCARGO REVENUE TON MILES
FISCAL YEARS 2002 – 2009 *
16.3 16.1 15.7 15 .8 14.411.9
1 4.8
18.520.1 23.1 24.0 24 .2 24.6
19.0
15.013.0
0
10
20
30
40
200 2 2003 2 004 2005 2006 2 00 7 2008 2009
D omestic In te rn ational
* Note: Fiscal years 2003 and beyond include changes in repor ting requirements
BILL
ION
S

21
FAA Aerospace Forecast Fiscal Years 2010–2030
Operating revenues (passenger and cargo) were down 16.1 percent in 2009. The reduction in passenger revenues underscored the necessity of fare sales used to fill aircraft by inducing business and leisure travelers to fly during the economic downturn. The demand for cargo services was adversely affected as consumers and business used slower, less expensive shipping methods or delayed purchases altogether.
Operating expenses declined 17.4 percent from Fy 2008. The reduction in operating expenses during Fy 2009 was driven by a 31.8 percent reduction from the record high fuel prices posted for Fy 2008, along with savings from lower variables costs due to reduced demand for passenger and cargo services.
In 2009, passenger carriers reported operating losses of $298 million and net losses of $7.8 billion, while air cargo carriers reported an operating profit of $1.1 billion and a net loss of $331.2 million. Passenger carriers reversed course from Fy 2008 to generate an operating profit ($180.3 million) in the domestic market, while international operations posted their first operating loss since Fy 2003 ($478.3 million). Net losses were reported for passenger carriers in both the domestic ($5.6 billion) and international market ($2.2 billion). Cargo carriers had stronger financial results than the passenger carriers. Domestically, cargo carriers posted an operating profit of $587.3 million and a net loss of $200.6 million. In international markets, these carriers reported operating profits of $511.3 million and net losses of $130.6 million.
The industry’s financial deterioration is largely due to the financial performance of the network carriers, which have reported two consecutive years of losses. After posting a net loss of $19.7 billion in Fy 2008, the seven network carriers reported an additional loss of $7.6 billion in Fy 2009. Most of the downturn occurred in domestic markets where the seven carriers accounted for 58.3 percent of capacity and 47.6 percent of passengers transported. Between 2000 and 2008, the domestic operations of these carriers reported combined operating and net losses of $30.7 and $52.7 billion, respectively. These losses widened in 2009, with the network carriers reporting operating losses of $1.7 billion and net losses of $5.3 billion. The nine reporting low-cost carriers reported operating profits of $765.4 million and net losses of $183.0 million in Fy 2009. During this period, the low cost carriers accounted for 26.3% and 26.6% of domestic capacity and passengers, respectively. Falling demand hindered profits for both carrier groups.
Declining leisure and business travel demand due to the economic downturn and the outbreak of H1N1 virus were responsible for mainline carrier passenger yield eroding throughout the year. Although carriers
U.S. COMMERCIAL AIR CARRIERSOPERATING AND NET PROFIT/LOSS
FISCAL YEARS 2002 - 2009
$5.6
$0.8
-$11.7
$5 .9
-$2.0
$10 .2
-$1.2
$0 .7
-$4.6
-$10.6
-$18 .6
-$8.1
-$0.2
-$4 .6-$5.7
-$10.9
-20.0
-16.0
-12.0
-8.0
-4.0
0.0
4.0
8.0
12.0
2002 2003 2004 2005 2006 2007 2008 2009
Operating Profit/LossNet Profit/Loss
Sou r ce: DO T For m 41 & F or m 298C
BIL
LIO
NS
OF
DO
LL
AR
S

FAA Aerospace Forecast Fiscal Years 2010–2030
22
responded to the reduction in demand for air travel with drastic capacity cutbacks, heavily discounted fares were necessary to fill aircraft. As a result, domestic mainline carrier passenger yield dropped 8.6 percent in 2009.
In 2009, regional carriers reported operating profits of $915.6 million and net profits of $202.3 million. The fortunes of regional carriers are closely tied to the success of the larger network carriers for whom they provide feed at mainline air carrier hub airports. These carriers are feeling the pinch as their mainline counterparts pass more financial risk for contract flying down to their regional partners. As a result, regional carrier passenger yield fell sharply in Fy 2009, down 11.2 percent as high-yield business travelers were either tethered to the office due to limited travel budgets or could “buy down” to less restrictive and less expensive fares when allowed to travel.
U.s. commercial air carriers 2009 aircraFt Fleet
The commercial passenger carrier fleet is undergoing transformation. The mainline carriers are retiring older, less fuel efficient aircraft (e.g. 737-300/400/500 and MD-80) and replacing them with more technologically advanced 737-700/800/900 aircraft. The regional carriers are growing their fleet of 70 to 90 seat regional jet aircraft and reducing their fleet of 50-seat jet aircraft.
The total number of aircraft in the U.S. commercial fleet (including regional carriers) is estimated at 7,132 for 2009, a decrease of 323 aircraft from 2008. This includes 3,666 mainline air carrier passenger aircraft (over 90 seats), 854 mainline air carrier cargo aircraft, and 2,612 regional carrier aircraft (jets, turboprops, and pistons).
U.S. COMMERCIAL AIR CARRIERSDOMESTIC PASSENGER YIELDS
FISCAL YEARS 2002 – 2009
0
5
10
15
20
25
30
2002 2003 2004 2005 2006 2007 2008 2009
Mainline Regionals
REV
ENU
E PE
R R
PM (C
ENTS
)

23
FAA Aerospace Forecast Fiscal Years 2010–2030
The mainline carriers’ passenger jet fleet decreased by 129 aircraft in 2009 as fuel inefficient aircraft continued to be grounded. With the cuts to the fleet, the mainline carrier fleet now stands at 18.3 percent below (822 aircraft) the level it was in 2000. Since reaching a peak of 2,830 aircraft in 2005, the regional fleet has shrunk by 218 aircraft.
GENERAL AvIATION
With the onset of the economic downturn, weakening of the general aviation industry became apparent in 2008. In 2009 the deterioration was even more pronounced with record declines by several measures of activity and double digit declines by most measures. According to numbers released by the General Aviation Manufacturers Association (GAMA), U.S. manufacturers of general aviation aircraft delivered 1587 aircraft in Cy 2009, 48.5 percent fewer than in Cy 2008. This translates into a second consecutive year of decline in shipments that was preceded by four years of sustained growth. The turbine categories, turbojets and turboprops, were down 46.2 and 19.2 percent, respectively. Overall piston deliveries declined 55.1 percent, with single-engine down 54.6 percent and the much smaller multi-engine category down 64.8 percent. Billings in Cy 2009 totaled $9.1 billion, down 32.1 percent compared with 2008 and the first reported decline since 2003.
U.S. COMMERCIAL AIR CARRIERSAIRCRAFT FLEET
CALENDAR YEARS 2002 – 2009
4,022 4,024 3,906 3,898 3,9833,666
1,056 993 993 1,001 1,012 974 960
2,549
4,118
3,795
854
2 ,4 992,784
2 ,787
2 ,6122 ,7002 ,7472,830
0
500
1,000
1,500
2,000
2,500
3,000
3,500
4,000
4,500
5,000
20 02 2003 2004 20 05 2006 2007 2 008 2009
Mainline-AC Cargo R egionals
NU
MB
ER
OF
AIR
CR
AFT

FAA Aerospace Forecast Fiscal Years 2010–2030
24
General aviation activity at FAA air traffic facilities in 2009 fell dramatically. Operations at combined FAA and contract towers declined 11.7 percent in 2009, one of the largest declines ever reported. General aviation activity at consolidated traffic facilities (FAA TRACONs) fell 10.4 percent, while the number of general aviation aircraft handled at FAA en route centers decreased by 17.7 percent. The FAA uses estimates of fleet size, hours flown and utilization from the General Aviation and Part 135 Activity Survey (GA Survey) as baseline figures upon which assumed growth rates can be applied. This survey has been conducted annually since 1977. Beginning with the Cy 2004 Survey there were significant improvements to the survey methodology. These improvements included conducting 100 percent samples for turboprops and turbojets, all rotorcraft, all aircraft in Alaska and all aircraft operating on-demand under Part 135. In addition, the sample design was revised to stratify by aircraft type (19 categories), FAA region (9 categories), and whether the aircraft was owned by an entity certified to fly Part 135 operations (2 categories). Furthermore, a large fleet reporting form was incorporated to allow owners/operators of multiple aircraft to report aggregate data for their entire fleet on a single form. In 2005 an additional aircraft category (light sport aircraft) was added. The result of these changes was the sample size nearly doubled. Between 2003 and 2005 large changes in both the number of aircraft (turbojets up by 22.8 percent, total rotorcraft up by 33.7 percent) and hours (single-engine piston down by 17.6 percent) in many categories occurred. The results of the 2008 Survey, the latest one available, are consistent with the results of past surveys since 2004. This reinforces our belief that methodological improvements have resulted in superior estimates relative to those in the past and they are used as the basis for our forecast.
Based on the latest FAA assumptions about fleet attrition and aircraft utilization along with GAMA aircraft shipment statistics, the active general aviation fleet is estimated to have increased 0.2 percent in 2009, to 229,149. Despite the increase in the active fleet, general aviation flight hours are estimated to have decreased 10.3 percent in 2009 to 23.3 million.
Student pilots are important to general aviation and the aviation industry as a whole. Although in decline for many years now, the economic recession experienced in 2009 seems to have had an especially significant impact on the number of student pilots. In 2009, according to statistics compiled by the FAA’s Mike Monroney Aeronautical Center, the number of student pilots decreased by 10.8 percent. This is the fifth consecutive year of decline in this category and the largest decline in recent history. The average age of a U.S. pilot in 2009 was 45.3 years old.
GENERAL AVIATION U.S. MANUFACTURERS SHIPMENTS AND BILLINGS
CALENDAR YEARS 2002 - 2009
0
500
1,000
1,500
2,000
2,500
3,000
3,500
2002 2003 2004 2005 2006 2007 2008 20090.0
2.0
4.0
6.0
8.0
10.0
12.0
14.0S H I P M E N T SB I L L I N G S
Sou rce: GA M A
SHIP
ME
NT
S

25
FAA Aerospace Forecast Fiscal Years 2010–2030
FAA WORkLOAD
In 2009, FAA facilities experienced the sharpest decline in activity since 1982. Despite lower fuel prices, air traffic activity fell in response to weak demand caused by the recession and the poor financial condition of the industry.
Total activity at combined FAA and contract tower airports was 52.9 million operations in 2009, down 10.4 percent from 2008 and 23.0 percent below the peak activity level recorded in 2000. Commercial activity (the sum of air carrier and commuter/air taxi) at combined FAA and contract towers declined by 9.9 percent in 2009. Air carrier operations were down 6.9 percent while commuter/air taxi operations fell 13.8 percent. Commercial operations in 2009 were 14.3 percent lower than their peak in 2005. Non-commercial activity (the sum of general aviation and military) at combined FAA and contract towers fell by 10.7 percent in 2009, with general aviation activity (28.0 million) down 11.7 percent and military activity (2.6 million) up 1.1 percent. General aviation activity has declined nine of the past ten years since 1999. At the end of 2009, non-commercial aircraft activity was 28.6 percent below the activity in 2000.
The FAA pays close attention to the trends occurring at the 35 Operational Evolution Partnership (OEP) airports. These airports represent the top 35 airports in the country in terms of passenger activity (except CLE and PIT) and account for about 74 percent of commercial passengers. Although commercial activity at the OEP airports exceeded pre-9/11 peak activity levels in 2005, subsequent industry restructuring has resulted in a drop in combined commercial activity at these airports since. In 2009, commercial activity at the OEP airports fell by 7.9 percent and was 11.2 percent below pre-9/11 activity levels. All of the OEP 35 airports recorded decreases in activity with the largest declines occurring at Cincinnati (down 23.8 percent) and Tampa (down 17.9 percent). As a result, only 12 airports exceeded 2000 peak activity levels during fiscal year 2009, down from 17 in the previous year.
AIRCRAFT ACTIVITY ATCOMBINED FAA AND CONTRACT TOWERS
FISCAL YEARS 2002 - 2009
40.738.5
34.230.5
37.937.0 35.935.8
22.324.825.325.226.125.224.224.2
0.0
10.0
20.0
30.0
40.0
50.0
2002 2003 2004 2005 2006 2007 2008 2009
NON-COMM ERCIAL COMMERCIAL
MIL
LIO
NS

FAA Aerospace Forecast Fiscal Years 2010–2030
26
Since 2000 there has been a pronounced shift in demand to low-cost carriers which is reflected in the relative growth of commercial operations across the OEP 35 airports. Commercial operations at New york kennedy (up 22.7 percent), Charlotte (up 22.3 percent), and Las vegas (up 20.8 percent), are up the greatest relative to their pre-September 11th activity levels. Commercial operations at Pittsburgh (down 69.5 percent) and St. Louis (down 55.5 percent) show the largest declines from pre-9/11 levels. These activity level shifts reflect the impact of the restructuring of the airline industry. American’s acquisition of TWA resulted in a consolidation of operations away from TWA’s St. Louis hub, while the merger of US Airways and America West has led to a dramatic shrinking of US Airways’ operations in Pittsburgh.
In 2009, total activity at FAA en route centers (40.1 million) fell 11.6 percent from the previous year. Commercial activity declined 9.6 percent, with air carrier operations down 6.8 percent and commuter/air taxi operations down 16.0 percent. Non-commercial activity was down 17.8 percent in 2009 as general aviation and military activity fell 17.7 and 18.0 percent, respectively. In 2009, air carrier operations were 11.1 percent below their 2000 activity levels while operations for the general aviation and military user groups were 27.9 and 28.6 percent below their 2000 activity levels, respectively.
12 OEP AIRPORTS EXCEEDED PRE-SEPTEMBER 11TH LEVELS DURING FY 2009
FY 2009 VS. FY 2000 COMMERCIAL ACTIVITY
80
90
100
110
120
130
JFK CLT LAS DEN IAH FLL SLC MSP ATL PHL DCA MEM
PER
CEN
T O
F FY
200
0 O
PS
23 OEP AIRPORTSARE BELOW PRE-SEPTEMBER 11TH LEVELS
FY 2009 VS. FY 2000 COMMERCIAL ACTIVITY
20
30
40
50
60
70
80
90
100
PER
CEN
T O
F FY
200
0 O
PS
SANLGA
ORDEWR
HNLMDW
BWISFOMCO
DTWPHX
MIATPADFW
IADPDXSEA
BOSLAX
CLECVG
STL PIT

27
FAA Aerospace Forecast Fiscal Years 2010–2030
AIRCRAFT HANDLED ATFAA EN ROUTE CENTERSFISCAL YEARS 2002 – 2009
30.833.8 34.735.1 34.033.8
31.931.6
9.311.312.112.312.412.411.912.1
0.0
5.0
10.0
15.0
20.0
25.0
30.0
35.0
40.0
2002 2003 2004 2005 2006 2007 2008 2009
COMMERCIAL NON-COMMERCIAL
MIL
LIO
NS

FAA Aerospace Forecast Fiscal Years 2010–2030
28
FAA AEROSPACE FORECAST FISCAL yEARS 2010 – 2030
Developing forecasts of aviation demand and activity levels continues to be challenging as the aviation industry evolves and prior relationships change. In times of amplified volatility, the process is filled with uncertainty, particularly in the short-term. Even though the highly cyclical U.S. aviation industry went into a downward spiral during 2009, history has shown the demand for air travel is resilient and growth will return. With the start of 2010, the lingering questions are 1) how much economic recovery will be required to jumpstart the industry back to a period of growth, and 2) when will the recovery occur? By the end of Fy 2009, carriers had executed 13 consecutive months of year over year reductions in domestic capacity. The capacity cutbacks were necessary to control costs in the face of plummeting demand for air travel. As the recession deepened carriers instituted fare sales to minimize financial losses. These fare sales led to record high load factors and record declines in yield. The capacity cuts that persisted through 2009 are expected to level off during 2010, with yields expected to turn positive by year end. Given the current instability in the global economy, there is much uncertainty as to the timing and strength of a recovery in aviation demand. Nevertheless, the FAA has developed a set of assumptions and forecasts consistent with the emerging trends and structural changes currently taking place within the aviation industry. The FAA is confident that these forecasts accurately predict future aviation demand, however due to the large uncertainty of the operating environment the variance around the forecasts is wider than in prior years.
The commercial aviation forecasts and assumptions are developed from econometric models that explain and incorporate emerging trends for the different segments of the industry. In addition the commercial aviation forecasts are considered unconstrained in that they assume there will be sufficient infrastructure to handle the projected levels of activity. These forecasts do not assume further contractions of the industry through bankruptcy, consolidation, or liquidation.
The commercial aviation forecast methodology is a blended one. The starting point for developing the commercial aviation forecasts (air carriers and regionals) is the future schedules published in the Official Airline Guide (OAG). To generate the short-term forecast (two years out) current monthly trends are used in conjunction with published monthly schedules to allow FAA forecasters to develop monthly capacity and demand forecasts for both mainline and regional carriers for fiscal and calendar years 2010-2011. The medium to long-term forecasts (2012-2030) are based on results of econometric models.
The general aviation forecasts rely heavily on discussions with industry experts and the results of the 2008 General Aviation and Part 135 Activity Survey. The assumptions have been updated by FAA analysts to reflect more recent data and developing trends, as well as further information from industry experts.
The FAA also presents the forecasts and assumptions to industry staff and aviation associations, who are asked to comment on the reasonableness of the assumptions and forecasts. Their comments and/or suggestions have been incorporated into the forecasts as appropriate.

29
FAA Aerospace Forecast Fiscal Years 2010–2030
ECONOMIC FORECASTS
For this year’s Aerospace Forecast, the FAA is using economic forecasts developed by Global Insight, Inc. to project domestic aviation demand. Furthermore, the FAA uses world and individual country economic projections provided by Global Insight, Inc. to forecast the demand for international aviation services. Annual historical data and economic forecasts are presented in tabular form in Tables 1 through 4. U.S. economic forecasts are presented on a U.S. government fiscal year (October through September) basis. International forecasts are presented on a calendar year basis.
Data suggest that the bottom of the recession was in June, 2009, and Global Insight expects the pace of the recovery to be slow and not strong enough to halt the decline in jobs until later in 2010. The recovery is not v-shaped, but instead is more W-shaped. It isn’t until 2011 that economic growth moves above 3% on a sustained basis.
There are a number of key issues surrounding the economy that remain a concern and how these are resolved will determine the future path of the recovery. Among these issues are the size of the federal deficit and taxes, when will the Federal Reserve begin to raise interest rates, when will housing prices begin to recover, and how long will households continue to rein in their spending. The forecast assumes that there will be no additional fiscal stimulus and that the Federal Reserve will continue to keep interest rates at or near zero for most of 2010. The forecast also assumes that the Fed will be able to successfully tighten monetary policy without sending the economy back into recession and that tax rates on both personal income and for corporations will gradually increase from current levels.
Global Insight’s economic forecast has the end of the U.S. recession in the 3Q of Fy 2009. The recovery that follows is a relatively weak recovery as credit remains tight and consumer spending is sluggish. On a quarter-by-quarter basis for the next two years U.S. economic growth is projected to range from a low of 1.8 percent in 2Q Fy 2010 to a high of 3.7 percent in 4Q Fy 2011.
U.S. GROSS DOMESTIC PRODUCTSEASONALLY ADJUSTED ANNUAL GROW TH
FY 2010 AND 2011 BY QUARTER
1.8
2.2
2.72.6 2.8
3.6 3.7
1.8
0.0
0.5
1.0
1.5
2.0
2.5
3.0
3.5
4.0
2009-04 2010-01 2010-02 2010-03 2010-04 2011-01 2011-02 2011-03Fiscal Year 2010 Fiscal Year 2011
AN
NU
AL
PER
CEN
T G
RO
WTH

FAA Aerospace Forecast Fiscal Years 2010–2030
30
Consumer spending is by far the largest component of the U.S. economy and one of the features of this recession has been the decline in consumer spending. Burdened by high debt and rising unemployment, consumer spending fell in 2009. The recovery in consumer spending is projected to be the weakest of the postwar era, as households struggle to reduce debt burdens and rebuild retirement assets.
In the medium term, between 2011 and 2015, U.S. economic growth is projected to average 3.0 percent per year with rates ranging between 2.6 and 3.6 percent. Consumption growth remains muted as households continue to rebuild their balance sheets and taxes are increased. Beyond 2015 U.S. real GDP growth slows to around 2.6 percent annually for the balance of the forecast period. The long-term stability of the U.S. economic growth is dependent on continued growth in the workforce, the capital stock, and improved productivity. Given the unprecedented amount of both fiscal and monetary support to the economy, a major risk to continued U.S. economic growth is inflation. These inflationary pressures, if unchecked, could force up inflation and bond yields and lessen domestic demand.
Global Insight projects the price of oil, as measured by Refiners’ Acquisition Cost, to increase by 14.2 percent after declining by 46.6 percent in 2009. Oil prices are projected to increase steadily to just over $90 per barrel by 2016 and then increase slightly less than inflation for the balance of the forecast period, reaching $104.45 per barrel by 2030.
U.S. GROSS DOMESTIC PRODUCT2009 - 2030
3.6
(2.9)
2.62.6
3.2
2.6
1.5
2.6
-4.0
-3.0
-2.0
-1.0
0.0
1.0
2.0
3.0
4.0
2009 2010 2011 2012 2013 2014 2015 2015-30
AN
NU
AL
PER
CE
NT
GR
OW
TH

31
FAA Aerospace Forecast Fiscal Years 2010–2030
After falling 0.3 percent in Fy 2009, the inflation rate (as measured by the CPI) is expected to rise 1.4 percent in 2010 and 1.9 percent in 2011 as the economy recovers and growth accelerates. After 2012 consumer price inflation is projected to remain in a narrow range between 1.7 and 2.0 percent percent a year for the balance of the forecast.
To reflect the uncertainty in the projection of economic growth, the FAA Aerospace Forecast uses high and low economic growth cases along with the base forecast. The high and low economic growth cases are based on Global Insight’s September 2009 long range optimistic and pessimistic forecasts. The high economic growth case incorporates higher population growth, capital spending, and productivity relative to the base case. Due to the higher productivity, inflation is lower than in the base case. Real GDP growth in the high case averages 3.2 percent annually compared to real GDP growth of 2.6 percent annually that is contained in the base case. The low economic growth case incorporates lower population growth, capital spending, and lower productivity than the base case. In contrast, in the low economic case, inflation is higher than in the base case due to lower productivity growth. Real GDP growth in the low case averages 1.7 percent annually over the forecast horizon. Further details about the high and low scenarios can be found in Appendix A.
world ecoNomY
Worldwide economic activity is estimated by Global Insight to have declined by 2.4 percent in 2009, marking the first contraction in global GDP since the Great Depression. The advanced economies (U.S., Canada, Europe, and Japan) posted declines in output ranging from -1.5 percent to -2.9 percent. The emerging market economies grew 0.8 percent, 4.8 points below what they grew in 2008. Many emerging market economies posted declines in real GDP including Mexico, Taiwan, Russia, Turkey, and Ukraine. In 2010, global economic growth is projected to resume (2.5 percent) as stimulus plans in the U.S. and in China provide the basis for recovery. Recovery in Europe is projected to be more gradual than in the U.S. as the housing market corrections have come later and policy actions are more cautious. Beyond 2010 through the balance of the forecast period, world real GDP is projected to increase an average of 3.2 percent per year.
REFINERS’ ACQUISITION COSTPERCENT CHANGE FISCAL YEARS 2009 - 2030
(46.6)
2.7
14.2
-50.0
-40.0
-30.0
-20.0
-10.0
0.0
10.0
20.0
2009 2010 2010-30
AN
NU
AL
PER
CEN
T G
RO
WTH

FAA Aerospace Forecast Fiscal Years 2010–2030
32
The Asia/Pacific and Latin America regions will continue to have the world’s highest economic growth rates. These regions are expected to see their economic activity grow at annual rates of 4.6 and 3.7 percent a year, respectively, over the forecast period. In Asia, China, with a population of 1.3 billion, is forecast to grow 7.4 percent a year, becoming the world’s second largest economy. India, with a population of 1.2 billion, is projected to see its GDP triple in size, growing at an average rate of 6.2 percent a year during the forecast period. In contrast, Japan (currently the world’s second largest economy) grows at just 0.9 percent a year over the forecast period as structural impediments and an aging population limit growth. Canadian and European GDP growth is anticipated to rise at more moderate rates of 2.4 and 1.7 percent a year, respectively, over the forecast period.
AvIATION TRAFFIC AND ACTIvITy FORECASTS
Total traffic and activity forecasts for commercial air carriers (the sum of mainline and regional carriers) are contained in Tables 5 through 9. These tables contain year-to-year historical data and forecasts.
Mainline air carrier traffic and activity forecasts and the forecast assumptions are contained in Tables 10 through 18, 20, and 22. These tables contain year-to-year historical data and forecasts.
Regional carrier forecasts and assumptions are found in Tables 23 through 26. These tables provide year-to-year historical and forecast data.
Table 19 provides year-to-year historical and forecast data for cargo activity. Table 21 provides year-to-year historical and forecast data for the cargo jet fleet.
General aviation forecasts are found in Tables 27 through 30. These tables provide year-to-year historical data and forecasts.
Tables 31 through 33 provide forecasts of aircraft activity at FAA and contract facilities.
GROSS DOMESTIC PRODUCTBY WORLD REGION
CALENDAR YEARS 2009 - 2030
(3.4)
2.3
1.2
3 .2
(3.0)
3.74.6 4.6
(0.1)
2.42.0
(2.6)
3.2
2.4
(2.4)
-4.0
-2.0
0.0
2.0
4.0
6.0
2009 20 10 201 0-30
Europe Latin America Pacific Canada World
AN
NU
AL
PER
CEN
T G
RO
WTH

33
FAA Aerospace Forecast Fiscal Years 2010–2030
commercial aviatioN Forecasts
System capacity is projected to shrink 1.6 percent in 2010. In the domestic market, mainline carrier capacity is forecast to shrink for the third consecutive year (down 1.6 percent) while capacity for the regional carriers grows from 2009 levels (up 1.9 percent). In the international sector, capacity is forecast to fall in the Atlantic and Pacific market as growth returns to the Latin market. Mainline carrier system capacity drops 2.0 percent, while regional carrier capacity grows 2.0 percent.
Passenger demand shows slight growth in 2010 with system RPMs forecast to grow 0.3 percent (flat for mainline carriers and up 4 percent for regional carriers) as passenger enplanements increase 0.5 percent (down 0.7 percent for mainline carriers and up 4.6 percent for regional carriers). Growth is projected to accelerate in 2011 with system RPMs and passengers increasing 2.6 and 2.1 percent, respectively, on a capacity increase of 2.5 percent. For the overall forecast period, system capacity is projected to increase an average of 3.4 percent a year. Supported by a growing U.S. economy and falling real yields, system RPMs are projected to increase 3.5 percent a year, with regional carriers (4.2 percent a year) growing faster than mainline carriers (3.4 percent a year). System passengers are projected to increase an average of 2.6 percent a year, with regional carriers growing faster than mainline carriers (3.0 versus 2.5 percent a year). By 2030, U.S. commercial air carriers are projected to fly 1.9 trillion ASMs and transport 1.2 billion enplaned passengers a total of 1.6 trillion passenger miles. Planes will remain crowded, with load factor projected to grow moderately during the early years of the forecast period and then tapering during the mid to latter years, growing by 2.7 points over the forecast period to 82.4 percent in 2030. Passenger trip length is also forecast to increase by more than 221 miles over the forecast to 1,314.5 miles (up 10.5 miles annually). The growth in passenger trip length reflects the faster growth in the relatively longer international and domestic trips as compared to shorter-haul flights.
U.S. COMMERCIAL AIR CARRIERSSYSTEM ENPLANEMENTS FISCAL YEARS 2009 - 2030
0
250
500
750
1,000
1,250
2009 2012 2015 2018 2021 2024 2027 2030
MAINLINE REGIONALS
MIL
LIO
NS
of P
ASS
ENG
ERS

FAA Aerospace Forecast Fiscal Years 2010–2030
34
domestic markets
After a dramatic decline during Fy 2009, domestic capacity in Fy 2010 is projected to fall slightly, down 1.1 percent. Following a record reduction of 9.5 percent in 2009, mainline carrier capacity drops 1.6 percent as these carriers show reluctance to increase capacity in a continuing environment of uncertainty. Regional carriers are slated to grow in Fy 2010, up 1.9 percent, after posting their first decline in capacity since deregulation during Fy 2009. Domestic commercial carrier capacity recovers modestly in 2011 (up 1.6 percent) with mainline carriers growing slower than regional carriers, 1.4 percent versus 2.6 percent, respectively, and then increases at an average annual rate of 3.2 percent for the balance of the forecast (2011-2030). For the entire forecast period (2009–2030), domestic capacity is projected to increase at an average annual rate of 2.9 percent, just slightly faster than economic growth, with mainline carriers growing slower (2.7 percent per year) than the regional carriers (4.0 percent per year).
The slow pace of the economic recovery in the U.S. inhibits RPM growth during the first year of the forecast (up 0.4 percent), with traffic projected to grow faster in the second half of the year. Mainline carrier RPMs are projected to contract 0.2 percent during 2010, while regional carrier RPMs grow 3.9 percent. By 2011, traffic growth improves with RPMs increasing 1.8 percent as consumer confidence improves and corporate travel budgets increase. Driven by continued economic growth and falling real yields, domestic RPM growth for the remainder of the forecast (2011-2030), averages 3.3 percent per year. For the overall forecast period (2009-2030) domestic RPMs are projected to grow an average of 3.1 percent a year. Mainline carriers are projected to grow more slowly than the regional carriers throughout the forecast period (averaging 2.9 versus 4.2 percent a year, respectively).
Enplanements are forecast to grow 0.4 percent in 2010, following a 7.3 percent decline in 2009. Similar to RPMs, passenger volume is expected to pick up in 2011 with the strengthening economy (up 1.8 percent), and then grow at an average rate of 2.6 percent per year for the period 2011-2030. Over the entire forecast period, domestic enplanements are projected to grow at an average annual rate of 2.4 percent with mainline carriers growing more slowly than regional carriers (2.2 versus 3.0 percent a year, respectively).
U.S. COMMERCIAL AIR CARRIERSDOMESTIC ASMS
2009 - 2030
(9.5)
3.0
(1.6)
1.9
4.1
(5.1)
-12.0
-8.0
-4.0
0.0
4.0
8.0
2009 2010 2010-30
Mainline Regionals
Ann
ual P
erce
nt G
row
th

35
FAA Aerospace Forecast Fiscal Years 2010–2030
In spite of record capacity cutbacks triggered by a steep drop in demand, carriers lost pricing power during 2009, with nominal yield falling 8.9 percent (down 8.6 percent in real terms). Despite continued capacity reductions, lackluster demand will keep fares in check in 2010, resulting in a modest increase in nominal yield of 3.9 percent (2.5 percent in real terms). For the entire forecast period, increases in nominal yields are projected to grow at a rate of 1.1 percent a year, while in real terms they are projected to decline an average of 0.8 percent a year. The decline in real yields over the forecast period assumes competition between carriers and convergence of cost structures between network carriers and their low-cost counterparts. The convergence arises from gains in productivity as network carriers retire fuel inefficient aircraft and hold the line on labor costs while low-cost carriers contend with aging fleets, maturing work forces, and unionization.
Domestic commercial carrier activity (departures) at FAA air traffic facilities is projected to grow more slowly than passenger traffic over the forecast period (1.9 percent per year for departures versus 3.1 percent for RPMs). This reflects increased carrier efficiencies in three operational measures—aircraft size, load factor, and trip length.
Domestic aircraft size8 increased in 2009 by 1.3 seats to 121.9 seats. The increase was partly driven by a large increase in aircraft size by the regional carriers (up 2.2 seats) and the grounding of older, fuel inefficient aircraft (i.e. MD-80’s and 737-300/400/500) by the mainline carriers (up 1.4 seats). The increase in regional aircraft size was caused by the retirement of 50-seat jet aircraft as larger 70-90 seat jet aircraft entered the fleet. Domestic seats per aircraft falls in 2010 (down 0.3 seats) as mainline carriers continue to cut capacity while their regional counterparts grow. Over the course of the forecast, domestic seats per aircraft are projected to gradually increase to 123.6 seats by 2030, an average of 0.1 seats per year.
The FAA’s projection of domestic carrier average aircraft size is greatly influenced by carrier fleet plans, publicly known aircraft order books and FAA’s expectations of the changing domestic competitive landscape. In the near-term (through 2011), the forecast incorporates several carrier assumptions: 1) mainline carriers desire to constrain ASM capacity growth; 2) network carrier “own metal” service on longer-haul routes; 3) the retirement of older inefficient aircraft (many of which are narrow-body);
U.S. COMMERCIAL AIR CARRIERSDOMESTIC RPMS
2009-2030
(8.2)
3.1
(0.2)
3 .9 4.2
(4.3)
-12.0
-8.0
-4.0
0.0
4.0
8.0
2009 2010 2010-30Mainline Regionals
Ann
ual P
erce
nt G
row
th
8 Defined as seats per mile flown and computed by dividing ASMs by miles flown.

FAA Aerospace Forecast Fiscal Years 2010–2030
36
4) the shifting of wide-body and larger narrow-body aircraft to international services, and 5) growing use of 70-90 seat regional jet aircraft.
In the longer-term, network carriers will replace their wide-body and larger narrow-body aircraft in their domestic route networks with smaller, next generation, narrow-body aircraft. In addition, some carriers, such as JetBlue and US Airways, are turning to smaller aircraft, like the 100-seat Embraer 190, to supplement their route structure. The use of smaller narrow-body aircraft allows mainline carriers to better serve their customers by boosting frequency, as well as improve profitability by more closely matching supply (the number of seats) with demand (the number of passengers).
Mainline carrier domestic aircraft size increased in 2009 by 1.4 seats to 151.4 seats, but is projected to fall 0.8 seats in 2010. Domestic aircraft size for mainline carriers is projected to fall to 150.4 seats in 2011 and then gradually increase thereafter for the balance of the forecast. Overall, average aircraft size for the mainline group will increase by only 0.5 seats between 2009 and 2030, going from 151.4 to 151.9.
Regional carrier aircraft size flown domestically is projected to grow at a much faster pace than their mainline counterparts. The faster growth in regional aircraft size is stimulated by the wave of 70-90 seat regional jet aircraft that are entering the fleet as well as reductions in the 50 seat and under jet fleet. Regional carriers are better equipped to support operations of their mainline partners by providing capacity that complements market demand. The greater number of the larger 70- and 90-seat regional jets in the fleet coupled with significant 50-seat jet retirements over the next few years increases the average seating capacity of the regional fleet from 55.0 seats in 2009 to 56.8 seats by 2011. Over the course of the forecast, average seats per aircraft for the regional carriers increases by 0.5 seats per year to 65.4 seats in 2030. The changing aircraft fleet mix is narrowing the gap between the size and aircraft types operated by the mainline and regional carriers. Commercial carrier domestic load factor increased 1.1 points during Fy 2009 to an all-time high of 80.4 percent. Pushing load factors to record levels was the mainline carrier group which posted a load factor of 81.3 percent. Load factors for the regional carriers increased 0.6 points to 74.3 percent. In 2010, domestic load factor is forecast to increase 1.2 points to 81.6 percent as mainline and regional carrier load factors rise 1.2 and 1.5 points, respectively. Thereafter, commercial carrier domestic load factor gradually rises to 83.2 percent by 2030.
In 2009 domestic passenger trip length fell 3.4 miles to 870.5 miles, after increasing 3.7 miles in 2008. Passenger trip length is forecast to decline by 0.7 miles in 2010 and by 0.3 miles in 2011 as carriers continue to restructure their networks and realign capacity. After 2011, trip length is projected to steadily increase for the balance of the forecast, reaching 997.2 miles by 2030. The increase in trip length reflects increases in both mainline and regional carrier trip length. Mainline carrier trip length increases as thinner, shorter haul markets are relinquished to regional partners and replaced with flying of longer domestic trips. Regional carrier trip length increases as flying in shorter haul markets is abandoned and/or reduced as more of the larger 70 and 90-seat regional jets penetrate thinner longer-haul markets previously only accessible with mainline equipment.
Another key factor in predicting aviation activity relative to passenger demand is the level of connecting versus non-stop (origin-destination) traffic. However, as the current cycle of U.S. airline industry restructuring unfolds and hub structures change, the impact on local communities and airport activity levels can vary significantly.

37
FAA Aerospace Forecast Fiscal Years 2010–2030
The FAA analyzes the ratio of passenger enplanements to origin-destination (O&D) passengers over time to identify changes in connecting versus non-stop traffic. This ratio is an indicator of the tendency of the average passenger to connect during a typical journey. The closer the ratio is to 1.0, the more passengers fly on a point-to-point routing. As the chart below shows, the overall ratio for the U.S. domestic industry varied within a narrow band between 1995 and 2002. After 2002, the ratio trailed downward until the end of 2008. The decline in the ratio during this six year period is characterized by a drop in connectivity by the network carriers and rising passenger share for the low-cost carriers. The uptick in the ratio during 2009 indicates an increase of hubbing by the carriers. The FAA’s forecast recognizes the changing pattern of domestic traffic connectivity and these trends are captured in the forecast’s passenger enplanement totals.
international markets
U.S. and Foreign Flag Carriers
FAA provides forecasts of total international passenger demand (the sum of U.S. and foreign flag carriers) for travel between the United States and three world travel areas--Atlantic, Latin America (including Mexico and the Caribbean), and Asia/Pacific--as well as for U.S./Canadian transborder traffic. These forecasts are based on historical passenger statistics from the United States Immigration and Naturalization Services (INS) and Transport Canada, and on regional world historical data and economic projections from Global Insight, Inc.
Total passenger traffic between the United States and the rest of the world is estimated to total 147.1 million in Cy 2009, 4.7 percent lower than in 2008. As the worldwide economy begins to recover from the recession of 2009, international passengers grow 3.3 percent in 2010. As the world economic recovery gains solid footing in 2011, passenger growth is up 5.0 percent. For the balance of the forecast period, stable worldwide economic growth leads international passenger growth to average 4.2 percent a year, and totaling 347.9 million in 2030.
Over the entire forecast period (2009-2030), high economic growth in the Asia-Pacific market drives passenger growth averaging 5.1 percent a year for this region. India, China, and Taiwan (passenger growth of 8.0, 7.9, and 7.8 percent a year, respectively) are forecast to be the fastest growing markets in the region. Growth in the Japan market (the largest and most mature in the region) is projected to be well below the
U.S. COMMERCIAL CARRIERSDOMESTIC ENPLANEMENTS PER OD PAX
1995-2009
1.37 1.37 1.38 1.37 1.36 1.361.38
1.351.34
1.32 1.32 1.321.34
1.38 1.38
1.20
1.25
1.30
1.35
1.40
1.45
Sou r ces: DOT T 100 an d O& D Sur vey
1995
1996
1997
1998
1999
2000
2001
2002
2003
2004
2005
2006
2007
2008
2009

FAA Aerospace Forecast Fiscal Years 2010–2030
38
regional average at 2.4 percent a year.
In the Atlantic region, open skies between the European Union and the United States and increasing non-stop service to Africa and the Middle East helps to fuel passenger growth of 3.9 percent a year over the forecast period. Over the 21-year forecast horizon, average annual passenger growth in the top three Atlantic markets-- the United kingdom, Germany, and France, is 4.2, 3.6, and 4.1 percent, respectively.
In the Latin America region, passenger growth between 2009 and 2030 is forecast to average 4.3 percent a year. The highest growth is projected for Brazil (average annual growth of 7.0 percent) while the largest market in the region, Mexico, grows at an average of 4.1 percent a year. The slowest rates of growth are projected to occur in the Bahamian and Jamaican markets (averaging growth of 0.5 and 2.6 percent a year, respectively).
Growth in the Canadian transborder market is forecast to be higher than that of the domestic U.S. market (2.4 percent), averaging 3.4 percent a year over the forecast period.
U.S. Flag Air Carriers
In 2009, international U.S. commercial air carrier capacity fell 3.5 percent from 2008 levels. Capacity falls an additional 2.8 percent in 2010 as carriers further cut capacity due to reduced demand for air travel. In the Atlantic and Pacific markets capacity decreases 5.5 and 2.2 percent, respectively, in 2010. Conversely, capacity in the Latin region during the same period grows 1.8 percent reflecting a rebound from the impact of H1N1 flu virus. With a strong economic recovery in the global economies expected for 2011, international capacity grows modestly at 4.7 percent, and averages 4.6 percent a year for the remainder of the forecast period. Strong growth in the medium to long-term portion of the forecast reflects favorable U.S. and world economic activity.
U.S. & FOREIGN FLAG CARRIERSPASSENGERS TO/FROM THE U.S.
2009 - 2030
3.94.3
5.1
3.4
0.0
2.0
4.0
6.0
Atlantic Latin America Asia/P acific CanadaTransborder
AVER
AG
E A
NN
UA
L PE
RC
ENT
GR
OW
TH
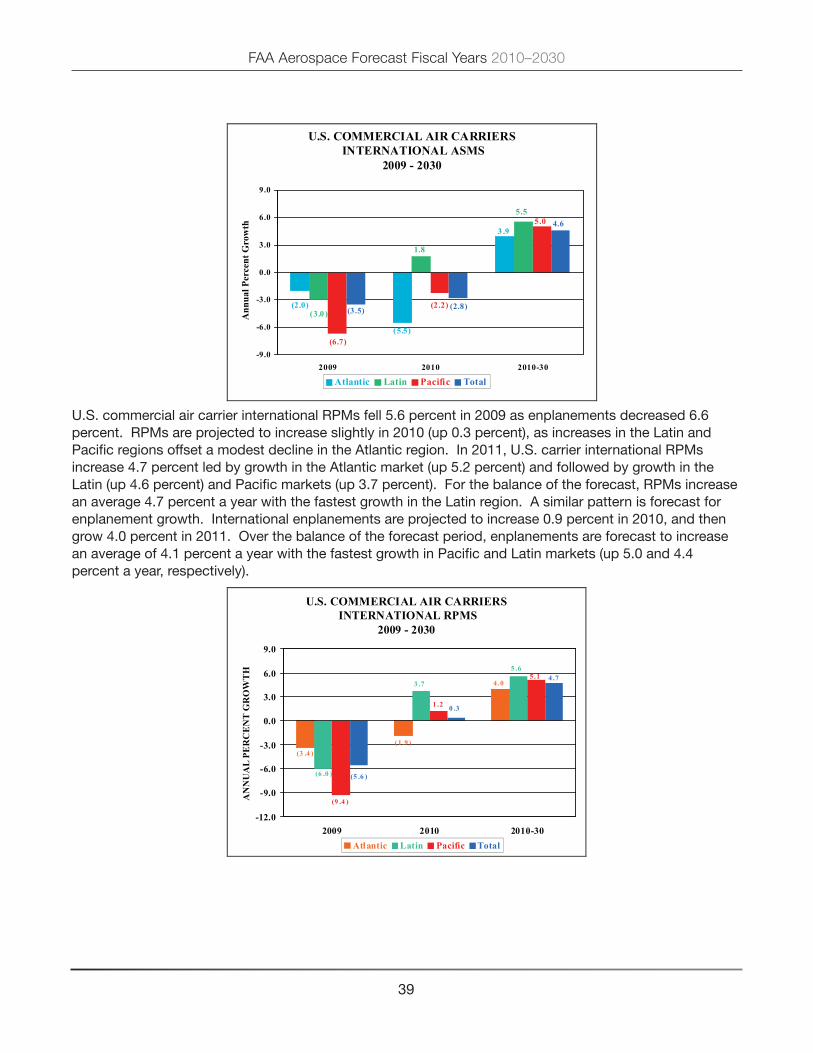
39
FAA Aerospace Forecast Fiscal Years 2010–2030
U.S. commercial air carrier international RPMs fell 5.6 percent in 2009 as enplanements decreased 6.6 percent. RPMs are projected to increase slightly in 2010 (up 0.3 percent), as increases in the Latin and Pacific regions offset a modest decline in the Atlantic region. In 2011, U.S. carrier international RPMs increase 4.7 percent led by growth in the Atlantic market (up 5.2 percent) and followed by growth in the Latin (up 4.6 percent) and Pacific markets (up 3.7 percent). For the balance of the forecast, RPMs increase an average 4.7 percent a year with the fastest growth in the Latin region. A similar pattern is forecast for enplanement growth. International enplanements are projected to increase 0.9 percent in 2010, and then grow 4.0 percent in 2011. Over the balance of the forecast period, enplanements are forecast to increase an average of 4.1 percent a year with the fastest growth in Pacific and Latin markets (up 5.0 and 4.4 percent a year, respectively).
U.S. COMMERCIAL AIR CARRIERSINTERNATIONAL ASMS
2009 - 2030
(5.5)
(2.0)
3 .9
(3.0 )
1.8
5.55.0
(6.7)
(2.2)(3.5) (2.8)
4.6
-9.0
-6.0
-3.0
0.0
3.0
6.0
9.0
2009 2010 2010-30
Atlantic Latin Pacific Total
Ann
ual P
erce
nt G
row
th
U.S. COMMERCIAL AIR CARRIERSINTERNATIONAL RPMS
2009 - 2030
4.0
(1 .9 )(3 .4 )
5 .6
3 .7
(6 .0 )
1 .2
5 .1
(9 .4 )
(5 .6 )
0 .3
4 .7
-12.0
-9.0
-6.0
-3.0
0.0
3.0
6.0
9.0
2009 2010 2010-30Atlantic Latin Pacific Total
AN
NU
AL
PER
CE
NT
GR
OW
TH
FAA Aerospace Forecast Fiscal Years 2010–2030
40
The slower growth in U.S. carrier international passengers over the period 2009-2030 (4.0 percent a year) compared to total international passengers (4.2 percent a year) reflects a small decline in market share for U.S. airlines over the forecast period. Forecasts of international demand assume U.S. and foreign flag carriers will benefit from the favorable economic activity in both the United States and world markets.
International load factor for U.S. commercial carriers was 78.1 percent in 2009. Load factor is expected to increase 2.5 points to be 80.6 percent in 2010 as capacity growth lags traffic growth in all three world markets. International load factor is projected to fall 0.1 points in 2011 and rise slowly for the remainder of the forecast to be 81.1 percent in 2030.
International passenger real yields for mainline carriers were down 12.6 percent in 2009. The largest decrease was in the Atlantic market (down 15.1 percent), followed by the Pacific (down 11.8 percent) and Latin market (down 7.8 percent) reflecting a lack of pricing power by U.S. carriers and the significant fall in demand resulting from the global recession. Buoyed by strengthening demand, international real yields are projected to increase 3.1 percent in 2010 and then increase by 4.7 percent in 2011. For the remainder of the forecast period, real yield decreases an average of 1.0 percent a year. In nominal terms, international yields are forecast to increase 4.6 percent in 2010, increase 6.7 percent in 2011 and then grow at an annual rate of 0.9 percent over the remainder of the forecast. The decline in real yields assumes competitive pressures will hold the line on fare increases. In international markets, this takes the form of expanded open sky agreements and global alliances.
commercial air carriers — air cargo
Historically, air cargo activity tracks with GDP. Additional factors that have affected the growth in air cargo traffic include the global financial crisis, declining real yields, and globalization. Significant structural changes have occurred in the air cargo industry. Among these changes are the following: air cargo security regulations by the FAA and TSA; market maturation of the domestic express market; modal shift from air to other modes (especially truck); increases in air fuel surcharges; growth in international trade from open skies agreements; use of all-cargo carriers (e.g., FedEx) by the U.S. Postal Service to transport mail; and increased use of mail substitutes (e.g., e-mail).
The forecasts of Revenue Ton Miles (RTMs) are based on several assumptions specific to the cargo industry. First, security restrictions on air cargo transportation will remain in place. Second, most of the shift from air to ground transportation has occurred. Finally, long-term cargo activity will be tied to economic growth.
The forecasts of RTMs were based mainly on models that link cargo activity to GDP. Forecasts of domestic cargo RTMs were developed with real U.S. GDP as the primary driver. Projections of international cargo RTMs were based on growth in world GDP, adjusted for inflation. The distribution of RTMs between passenger carriers and all-cargo carriers was forecast based on an analysis of historic trends in shares, changes in industry structure, and market assumptions.
Total RTMs are forecast to grow 3.4 percent in 2010 and again in 2011 by 4.9 percent. For the balance of the forecast period, driven by steady economic growth, total RTMs are forecast to increase at an average

41
FAA Aerospace Forecast Fiscal Years 2010–2030
annual rate of 5.1 percent. The forecast of 86.6 billion RTMs in 2030 represents an average annual increase of 5.0 percent over the entire forecast period.
Domestic cargo RTMs are forecast to grow 1.3 percent in 2010 and 2.0 percent in 2011, driven by a slow recovery in the U.S. economy. Between 2011 and 2030, domestic cargo RTMs are forecast to increase at an average annual rate of 2.2 percent. The forecast of 18.5 billion RTMs in 2030 represents an average annual increase of 2.1 percent over the entire forecast period.
The freight/express segment of domestic air cargo is highly correlated with capital spending. Thus, the growth of this segment in the future will be tied to growth in the economy. The mail segment of domestic air cargo will be affected by price and substitution (electronic mail).
The all-cargo carriers have increased their share of domestic cargo RTMs flown from 65.4 percent in 1997 to 86.2 percent in 2009. This is because of significant growth in express service by FedEx and United Parcel Service coupled with a lack of growth of domestic freight/express business for passenger carriers. The all-cargo share is forecast to increase to 90.4 percent by 2030 based on increases in wide-body capacity for all-cargo carriers and security considerations.
International cargo RTMs are forecasted to rise 4.7 percent in 2010 reflecting a recovery from the global economic downturn and grow 6.6 percent in 2011 as world economic growth rebounds and trade expands. For the balance of the forecast period, international cargo RTMs are forecast to increase an average of 6.3 percent a year based on projected growth in world GDP. The forecast 68.1 billion RTMs in 2030 represents an average annual increase of 6.3 percent over the entire forecast period.
The share of international cargo RTMs flown by all-cargo carriers increased from 63.3 percent in 2008 to 63.6 percent in 2009. Beyond 2009, the all-cargo share of RTMs flown is forecast to increase modestly to 69.9 percent by 2030.
U.S. COMMERCIAL AIR CARRIERSRTMS 2009 - 2030
2.2
(17.7)
1.3
4.7
(23.0 )
6.4
-27.0-24.0-21.0-18.0-15.0-12.0-9.0-6.0-3.00.03.06.09.0
2009 20 10 2010-30
Domestic Inter na tio nal
AN
NU
AL
PER
CEN
T G
RO
WTH

FAA Aerospace Forecast Fiscal Years 2010–2030
42
commercial aircraFt Fleet
The number of commercial aircraft is forecast to grow from 7,132 in 2009 to 10,274 in 2030, an average annual growth rate of 1.8 percent or 150 aircraft annually. The commercial fleet will shrink by a net 107 aircraft in 2010 after shrinking by 323 aircraft in 2009 as the dramatic fall off in demand and high fuel prices compelled carriers to prune their fleets. In comparison, the US commercial fleet contracted by 262 aircraft between 2000 and 2003, the last downturn in aviation.
The number of passenger jets in the mainline carrier fleet decreased by 129 aircraft in 2009 and is expected to fall another 17 aircraft in 2010 before increasing in 2011 by 40 aircraft. For the period 2010-2030, the mainline air carrier passenger fleet increases an average of 85 aircraft a year, totaling 5,342 aircraft in 2030. The narrow-body fleet (including E-190’s at JetBlue and US Airways) is projected to grow by 60 aircraft annually over the period 2010-2030; the wide-body fleet grows by 25 aircraft a year as the Boeing 787 and Airbus A350’s enter the fleet.
The regional carrier passenger fleet is forecast to decrease by 113 aircraft in 2010 as carriers remove large numbers of 50 seat and smaller regional jets. After 2010, the regional carrier fleet is expected to increase by an average of 45 aircraft (1.6 percent) over the remaining years of the forecast period, totaling 3,401 aircraft in 2030. The number of regional jets (90 seats or fewer) at regional carriers is projected to grow from 1,710 in 2009 to 2,441 in 2030, an average annual increase of 1.7 percent. All the growth in regional jets over the forecast period occurs in the larger 70 and 90-seat aircraft. During the forecast period, all regional jets of 50 or less seats are removed from the fleet, reflecting the relaxation of scope clauses. The turboprop/piston fleet is expected to grow from 902 units in 2009 to 960 in 2030. Turboprop/piston aircraft are expected to account for just 28.2 percent of the regional carrier passenger fleet in 2030, down from a 42.4 percent share in 2009.
Cargo large jet aircraft are forecast to increase by 55 aircraft over the next 2 years (from 854 to 909 aircraft in 2011), and total 1,531 aircraft in 2030. The narrow-body jet fleet is projected to increase by 10 aircraft a year over the 21-year forecast period as older 757’s and 737’s are converted to cargo service. The wide-body jet fleet is projected to increase by 22 aircraft yearly.
U.S. COMMERCIAL AIRCRAFT FLEETCALENDAR YEARS 2009 – 2030
(3.4)
(0.5)
1.92.7 2.8
(11.0)
(4.3)(3.3)
1.6
-12.0
-10.0
-8.0
-6.0
-4.0
-2.0
0.0
2.0
4.0
6.0
2009 2010 2010-30MAINLINE-AC CARGO REGIONAL
AN
NU
AL
PER
CE
NT
GR
OW
TH

43
FAA Aerospace Forecast Fiscal Years 2010–2030
geNeral aviatioN
The FAA forecasts the fleet and hours flown for single-engine piston aircraft, multi-engine piston, turboprops, turbojets, piston and turbine powered rotorcraft, light sport, experimental and other (which consists of gliders and lighter than air vehicles). The FAA forecasts “active aircraft,”9 not total aircraft. The FAA uses estimates of fleet size, hours flown, and utilization from the General Aviation and Part 135 Activity Survey (GA Survey) as baseline figures upon which assumed growth rates can be applied. Beginning with the 2004 GA Survey there were significant improvements to the survey methodology. Coinciding with the changed survey methodology, large changes in many categories were observed, both in the number of aircraft and hours flown. The results of the 2008 GA Survey are consistent with the results of surveys since 2004, reinforcing our belief that the methodological improvements have resulted in superior estimates relative to those in the past. Thus, they are used as the basis for our forecast. Because results from the GA Survey are not published until the following year, the 2008 statistics are the latest available. Figures for 2009 are estimated based on other activity indicators, and the forecasts of activity begin in 2010 and continue through 2030.
The demand for business jet aircraft has grown over the past several years. New product offerings, the introduction of very light jets, and increasing foreign demand have helped to drive this growth. In addition, corporate safety/security concerns for corporate staff, combined with increasing flight delays at some U.S. airports have made fractional, corporate, and on-demand charter flights practical alternatives to travel on commercial flights. Despite the hard impact of the recession felt in the business jet market, the forecast calls for robust growth in the long term outlook and predicts business usage of general aviation aircraft will expand at a faster pace than that for personal/recreational use.
The active general aviation fleet is projected to increase at an average annual rate of 0.9 percent over the 21-year forecast period, growing from an estimated 229,149 in 2009 to 278,723 aircraft by 2030. The more expensive and sophisticated turbine-powered fleet (including rotorcraft) is projected to grow at an average of 3.0 percent a year over the forecast period, with the turbine jet portion increasing at 4.2 percent a year.
ACTIVE GENERAL AVIATION AIRCRAFTCALENDAR YEARS 2009 – 2030
0.2
2.4
0.2
1.0
3.0
2.3
0.0
1.0
2.0
3.0
4.0
2009 2010 2010-30
TOTAL TURBINES
AN
NU
AL
PER
CEN
T G
RO
WTH
9 An active aircraft is one that flies at least one hour during the year.

FAA Aerospace Forecast Fiscal Years 2010–2030
44
With the advent of a relatively inexpensive twin-engine very light jet (vLJ), many questions have arisen as to the future impact they may have. The lower acquisition and operating costs of vLJs were believed to have the potential to revolutionize the business jet market, particularly by being able to sustain a true on-demand air-taxi service. While initial forecasts called for over 400 aircraft to be delivered a year, events such as the recession along with the bankruptcy of Eclipse and DayJet have led us to temper more recent forecasts. The worldwide delivery of vLJs this year has held up relatively well compared to the turbine jet market as a whole, helped in large part by the introduction of Embraer’s Phenom 100 to the market. Despite that, the impacts of the recession have led to dampened expectations. The current forecast calls for 440 vLJs to enter the US fleet over the next three years, with an average of 216 aircraft a year for the balance of the forecast period.
The number of active piston-powered aircraft (including rotorcraft) is projected to decrease from the 2008 total of 166,514 through 2017, with declines in both single and multi-engine fixed wing aircraft, but with the smaller category of piston-powered rotorcraft growing. Beyond 2017 active piston-powered aircraft are forecast to increase to 172,613 by 2030. Over the forecast period, the average annual increase in piston-powered aircraft is 0.2 percent. Although piston rotorcraft are projected to increase rapidly at 3.4 percent a year, they are a relatively small part of this segment of general aviation aircraft. Single-engine fixed-wing piston aircraft, which are much more numerous, are projected to grow at a much slower rate (0.2 percent respectively) while multi-engine fixed wing piston aircraft are projected to decline 0.8 percent a year. In addition, it is assumed that vLJs and new light sport aircraft could erode the replacement market for traditional piston aircraft at the high and low ends of the market respectively.
Starting in 2005, a new category of aircraft (previously not included in the FAA’s aircraft registry counts) was created: “light sport” aircraft. At the end of 2008 a total of 6,811 active aircraft were estimated to be in this category while the forecast assumes the fleet will increase approximately 825 aircraft per year until 2013. Thereafter the rate of increase in the fleet tapers considerably to about 335 per year. By 2030 a total of 16,311 light sport aircraft are projected to be in the fleet.
The number of general aviation hours flown is projected to increase by 2.5 percent yearly over the forecast period. A large portion of this growth will occur in the short term post recession period, where record low utilization rates experienced in 2009 will return to normal trends, particularly in the turbine jet category. As with previous forecasts, much of the long term increase in hours flown reflects strong growth in the rotorcraft and turbine jet category. Hours flown by turbine aircraft (including rotorcraft) are forecast to increase 4.1 percent yearly over the forecast period, compared with 1.1 percent for piston-powered aircraft. Jet aircraft are forecast to account for most of the increase, with hours flown increasing at an average annual rate of 6.1 percent over the forecast period. The large increases in jet hours result mainly from the increasing size of the business jet fleet, along with measured recovery in utilization rates from recession induced record lows. Rotorcraft hours, relatively immune to the economic downturn when compared to other categories, are projected to grow by 3.0 percent yearly. The light sport aircraft category is expected to see increases in hours flown on average of 5.9 percent a year, which is primarily driven by growth in the fleet.
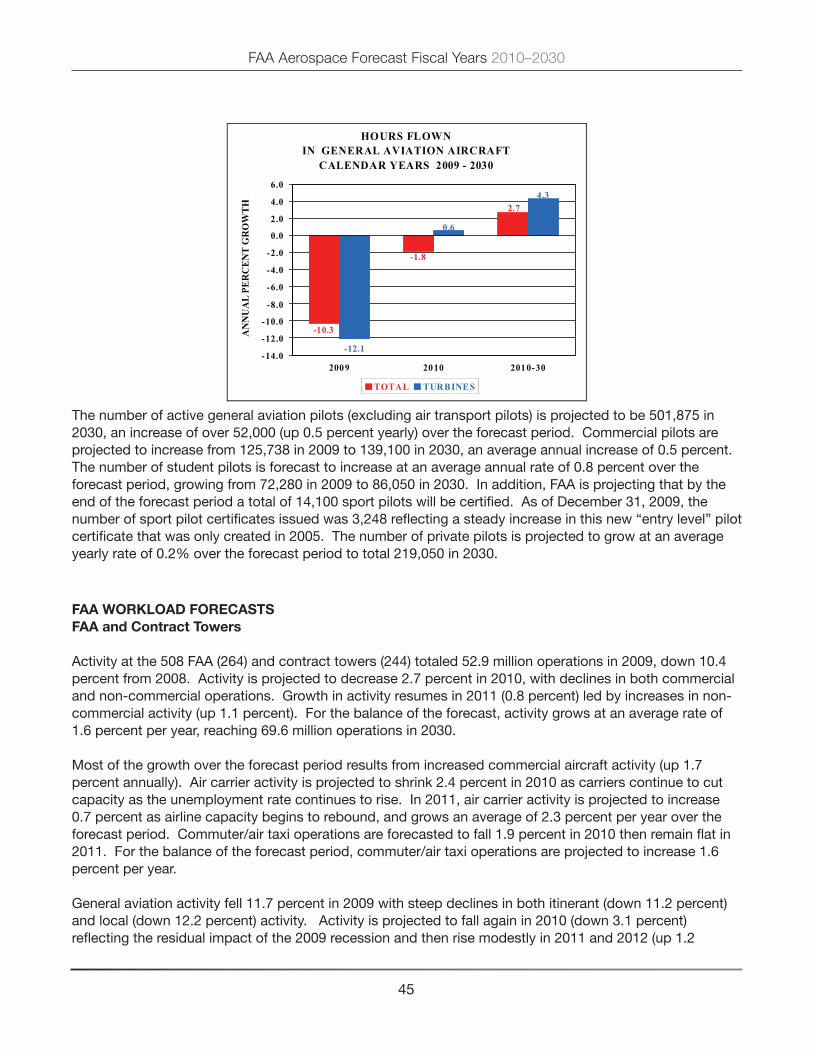
45
FAA Aerospace Forecast Fiscal Years 2010–2030
The number of active general aviation pilots (excluding air transport pilots) is projected to be 501,875 in 2030, an increase of over 52,000 (up 0.5 percent yearly) over the forecast period. Commercial pilots are projected to increase from 125,738 in 2009 to 139,100 in 2030, an average annual increase of 0.5 percent. The number of student pilots is forecast to increase at an average annual rate of 0.8 percent over the forecast period, growing from 72,280 in 2009 to 86,050 in 2030. In addition, FAA is projecting that by the end of the forecast period a total of 14,100 sport pilots will be certified. As of December 31, 2009, the number of sport pilot certificates issued was 3,248 reflecting a steady increase in this new “entry level” pilot certificate that was only created in 2005. The number of private pilots is projected to grow at an average yearly rate of 0.2% over the forecast period to total 219,050 in 2030.
Faa workload ForecastsFaa and contract towers
Activity at the 508 FAA (264) and contract towers (244) totaled 52.9 million operations in 2009, down 10.4 percent from 2008. Activity is projected to decrease 2.7 percent in 2010, with declines in both commercial and non-commercial operations. Growth in activity resumes in 2011 (0.8 percent) led by increases in non-commercial activity (up 1.1 percent). For the balance of the forecast, activity grows at an average rate of 1.6 percent per year, reaching 69.6 million operations in 2030.
Most of the growth over the forecast period results from increased commercial aircraft activity (up 1.7 percent annually). Air carrier activity is projected to shrink 2.4 percent in 2010 as carriers continue to cut capacity as the unemployment rate continues to rise. In 2011, air carrier activity is projected to increase 0.7 percent as airline capacity begins to rebound, and grows an average of 2.3 percent per year over the forecast period. Commuter/air taxi operations are forecasted to fall 1.9 percent in 2010 then remain flat in 2011. For the balance of the forecast period, commuter/air taxi operations are projected to increase 1.6 percent per year.
General aviation activity fell 11.7 percent in 2009 with steep declines in both itinerant (down 11.2 percent) and local (down 12.2 percent) activity. Activity is projected to fall again in 2010 (down 3.1 percent) reflecting the residual impact of the 2009 recession and then rise modestly in 2011 and 2012 (up 1.2
HOURS FLOWNIN GENERAL AVIATION AIRCRAFT
CALENDAR YEARS 2009 - 2030
-12.1
-1.8
-10.3
2.7
0.6
4.3
-14.0
-12.0
-10.0
-8.0
-6.0
-4.0
-2.0
0.0
2.0
4.0
6.0
2009 2010 2010-30
TOTAL TURBINES
AN
NU
AL
PER
CEN
T G
RO
WTH

FAA Aerospace Forecast Fiscal Years 2010–2030
46
percent both years) as falling unemployment promotes the growth of flight hours and operations despite slightly higher oil prices. For the entire forecast period, general aviation activity at towered airports is projected to increase an average of 1.1 percent a year, to 35.1 million operations in 2030. General aviation activity at combined FAA/contract towers grows in line with the modest increase forecasted for general aviation piston hours already cited. Most operations at the smaller towers are in piston aircraft, while those at the largest airports tend to be turbine operations. Military activity rose 1.1 percent in 2009.
Operations10 at FAA TRACONs (Terminal Radar Approach Control) fell 9.7 percent in 2009, the fifth year in a row. They are projected to decline again in 2010 (down 1.1 percent) as the effects of the recession continue to be felt with decreases in both commercial and non-commercial activity. TRACON operations are forecast to rise 1.0 percent in 2011 before increasing at an average annual rate of 1.7 percent for the balance of the forecast. For the entire forecast period, TRACON operations grow an average of 1.5 percent per year, totaling 54.4 million in 2030.
en route centers
The number of IFR aircraft handled at FAA en route traffic control centers decreased 11.6 percent to 40.1 million in 2009, with all user groups posting declines in activity. Activity at en route centers is forecast to decrease by 1.6 percent in 2010 in the wake of decreased commercial and general aviation activity. Growth in en-route activity resumes in 2011 (up 1.4 percent) led by increases in air carrier activity. After 2011, through the balance of the forecast period, en route activity increases 2.5 percent annually, reaching 64.1 million aircraft handled in 2030. Over the entire forecast period, commercial activity is projected to increase at an average annual rate of 2.7 percent, reflecting increases in the commercial fleet and aircraft stage lengths. During the same period, general aviation activity is projected to grow 0.7 percent per year, reflecting modest growth in business aviation. Military activity is held constant at the 2009 activity level throughout the forecast period.
TRACON OPERATIONS FISCAL YEARS 2009 - 2030
(9.7)
(1.1)
1.7
(1.7)
(10.1)
2.1
-12.0
-9.0
-6.0
-3.0
0.0
3.0
2009 2010 2010-30
TOTAL COMMERCIAL
AN
NU
AL
PER
CEN
T G
RO
WTH
10 TRACON operations consist of itinerant IFR and VFR arrivals and departures at all airports in the domain of the TRACON as well as IFR and VFR overflights.
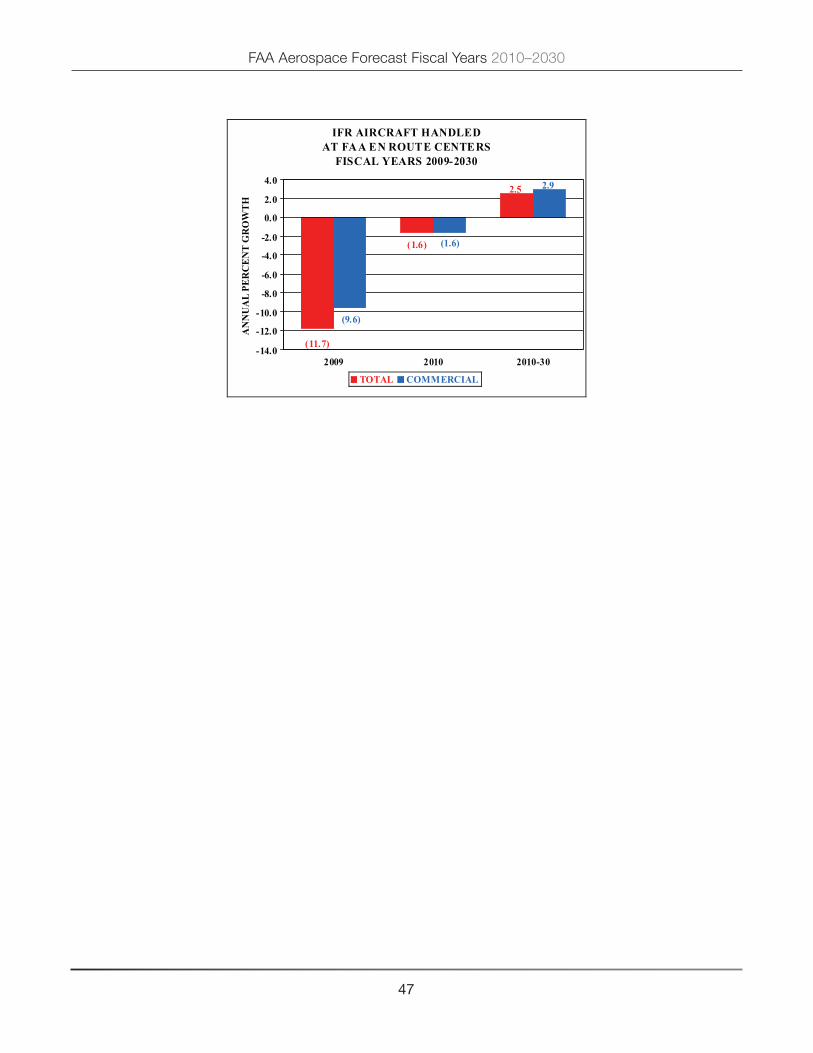
47
FAA Aerospace Forecast Fiscal Years 2010–2030
IFR AIRCRAFT HANDLED AT FA A EN ROUTE CENTERS
FISCAL YEARS 2009-2030
(11.7)
2.5
(1.6)
(9.6)
2.9
(1.6)
-14.0
-12.0
-10.0
-8.0
-6.0
-4.0
-2.0
0.0
2.0
4.0
2009 2010 2010-30
TOTAL COMMERCIAL
AN
NU
AL
PER
CEN
T G
RO
WTH
FAA Aerospace Forecast Fiscal Years 2010–2030
48
UNMANNED AIRCRAFT SySTEMSInternational industry development, growth, and investment over the past several years have allowed Unmanned Aircraft Systems (UAS) to evolve from remotely piloted vehicles with limited capabilities to semi and fully autonomous systems for commercial applications. There are some 100 U.S. companies, academic institutions, and government organizations developing over 300 UAS designs. Currently, the U.S. government uses unmanned aircraft for military combat, surveillance, and reconnaissance.
The UAS term is used because it includes the entire system (aircraft, data links, control station and other elements). UAS’s also vary widely in size, shape, and capabilities. Some unmanned aircraft weigh 1,900 pounds and can remain aloft for 30 hours or more, because there is no need for them to land to change pilots. Some are 6 inches long. Others can perform dangerous missions without risking loss of life.
In its broadest context, there are three major market segments: military, civil government, and commercial. While market drivers and dynamics among these segments differ significantly, they share common objectives: to provide a service that cannot be accomplished by manned aircraft and/or to perform an existing manned operation at a lower cost. Because of increased interest and activity, UAS have the potential to become a major part of the commercial aerospace industry within the United States.
Federal agencies are planning to increase their use of UAS’s. State and local governments envision using UAS’s to aid in law enforcement and firefighting. Potential commercial uses are also possible, for example, in real estate photography or pipeline inspection. UAS’s could perform some manned aircraft missions with less noise and fewer emissions.
Because the industry is in its infancy, forecasts of the number of units are relatively few and have considerable variation. Recent work by RTCA, Inc., has identified the drivers and impediments to future growth in the aforementioned three market segments and has included forecasts of the number of UAS units by market segment. The forecasts generally assumed that 1)commercial activities would not begin until 2018; 2) no significant technological or extraordinary demand would accelerate the introduction of UAS’s; 3) costs of UAS systems would decline as the technology matures and as the scale of operations increases. Currently, the majority of UAS systems are operated by the military and have little impact on the NAS. However as the technology matures, increasing numbers of units will be operated by civil and commercial users, and could have greater impacts on the NAS. However the volume of units is relatively small – approximately 15,000 units by 2020 and 30,000 units by 2030.
49
FAA Aerospace Forecast Fiscal Years 2010–2030
COMMERCIAL SPACE TRANSPORTATIONThe Federal Aviation Administration’s (FAA) Office of Commercial Space Transportation (AST) licenses and regulates U.S. commercial space launch activity including launch vehicles and non-federal launch sites authorized by Executive Order 12465 and 49 US Code, Subtitle IX, Chapter 701 (formerly the Commercial Space Launch Act). Title 49 and the Executive Order also direct the Department of Transportation (carried out by the FAA) to encourage, facilitate, and promote commercial launches. AST’s mission is to license and regulate commercial launch and reentry operations and non-federal launch sites to protect public health and safety, the safety of property, and the national security and foreign policy interests of the United States.
OvERvIEW
Commercial space transportation generally consists of the launch of satellites into orbit for either commercial or government customers by private, non-government entities, called launch services providers. Commercial space transportation also covers suborbital launches, where a payload or vehicle is launched on a trajectory that briefly goes into space but returns to Earth rather than going into orbit, as well as the reentry of objects from space to Earth.
The FAA licenses several expendable vehicles used for commercial orbital launches. The most active include the Pegasus and Taurus, two small vehicles built and operated by Orbital Sciences Corporation (OSC); the Delta Iv, a heavy-class vehicle and the Delta II, a medium-class vehicle, both built by United Launch Alliance (ULA), a joint venture between Boeing and Lockheed Martin, and marketed by Boeing Launch Services (BLS); the Zenit-3SL, a heavy-class vehicle built by the Ukrainian company kB yuzhnoye for the multinational Sea Launch venture; the Atlas v, a heavy-class vehicle built by ULA and marketed by Lockheed Martin Commercial Launch Services (LMCLS), and the Falcon 1, a small launch vehicle built and operated by SpaceX. Commercial vehicles under development include the heavy-class Falcon 9 vehicle by SpaceX and the medium-class Taurus II by OSC. From 1989 through the end of 2009, DOT/FAA has licensed 200 orbital and suborbital commercial launches.
Experimental Permits, for suborbital reusable vehicle development and test flights, were first granted by FAA in 2006 to Blue Origin and Armadillo Aerospace. Some permits have been granted for vehicles participating in the Lunar Lander Challenge, a competition to demonstrate technologies potentially applicable to both future lunar spacecraft and commercial suborbital vehicles, with $2 million in prizes offered by NASA’s Centennial Challenges program.
Six commercial spaceports, located in Alaska, California (vandenberg Air Force Base and Mojave Air and Space Port), New Mexico, Oklahoma, and virginia, currently have FAA launch site operator licenses. Several other commercial spaceports around the United States are under development.
REvIEW OF 2009
There were five FAA-licensed launches, all orbital, in 2009, down from 11 in 2008. BLS performed two launches, one Delta II launch of the Worldview 2 earth observation satellite, and a Delta Iv launch of a meteorological satellite. Sea Launch conducted one Zenit-3SL launch of a commercial communications

FAA Aerospace Forecast Fiscal Years 2010–2030
50
satellite. There was one Falcon 1 launch which orbited a Malaysian earth observation satellite. LMCLS performed one Atlas v launch of a commercial communications satellite. There were no suborbital permit flights during 2009.
Faa licensed and permitted launches, 2008-2010
2008 2009 2010 Forecast
Licensed Launches 11 5 4-7
Permitted Launches 5 0 2-4
Worldwide there were 24 orbital commercial launches in 2009, compared to 28 in 2008. In addition to the five FAA-licensed launches, Europe performed five commercial launches of its Ariane 5, Russia conducted ten launches of various vehicles, and Land Launch, a joint venture of Sea Launch and Space International Services, performed three launches of the Zenit-3SLB. There were 78 total worldwide commercial, civil, and military launches in 2009, with commercial launches representing about 30 percent of the total. For more details, see the year in Review report available online at:http://www.faa.gov/about/office_org/headquarters_offices/ast/reports_studies/year_review/.
GLOBAL FORECAST
In May 2009, the FAA and the Commercial Space Transportation Advisory Committee (COMSTAC) published their annual global forecast for commercial launch demand, the 2009 Commercial Space Transportation Forecasts. The report forecasts an average of 26.7 commercial orbital launches per year of geosynchronous orbit (GSO) and non-geosynchronous orbit (NGSO) payloads through 2018. That annual average includes 15.7 launches of medium-to-heavy vehicles to deploy GSO satellites, 8.3 launches of medium-to-heavy vehicles to NGSO, and 2.7 launches to NGSO by small vehicles.

51
FAA Aerospace Forecast Fiscal Years 2010–2030
Commercial GSO launches are used for communications satellites with masses ranging from 2,000 to over 6,000 kilograms; satellite masses have tended to grow over time although there is still interest in smaller satellites. Demand for commercial NGSO launches spans a number of markets, including commercial remote sensing, science and technology demonstration missions (often for nations without an indigenous launch capability), and the replenishment and replacement of low Earth orbit communications satellite systems first launched in the late 1990s.
The GSO and NGSO forecasts are not a prediction of what will actually be launched but instead represent the expected demand for launch services, based on a variety of inputs. The complete forecast report is available at: http://www.faa.gov/about/office_org/headquarters_offices/ast/reports_studies/forecasts/.

FAA Aerospace Forecast Fiscal Years 2010–2030
52
RISkS TO THE FORECAST The FAA is “cautiously optimistic” that its current outlook for aviation demand and activity can be achieved. However, this year’s forecast is driven, at least in the short-term, by a number of factors including security and pandemic illnesses, as well as the strength of the economic recovery and the weakened financial health of the commercial aviation industry. As the attempted bombing of a Northwest airliner on Christmas Day 2009 reminds us, terrorism remains among the greatest risks to achieving the forecast. Because of aviation’s high visibility and global reach, concerns remain about international terrorism. Any terrorist incident aimed at aviation would have an immediate and significant impact on the demand for aviation services.
During 2009 there was much discussion about the possible impacts of the H1N1 or swine flu virus. As of January 2010 there had not been a widespread serious outbreak of the virus in the U.S. However, events in Mexico during the spring of 2009 provide some evidence of the damaging impacts that such an event could inflict. When a severe outbreak of the H1N1 virus broke out in Mexico, authorities quickly moved to place severe limits on aviation. Airlines responded by slashing capacity in the face of falling demand, and not until well after the restrictions and warnings on travel were lifted did carriers begin to cautiously restore service to the region.
Although oil prices were considerably lower in 2009 than they were for much of 2008, there is still considerable uncertainty as to the level of oil prices once economic growth resumes. FAA’s baseline forecast (based on Global Insight’s Oct 2009 forecast) calls for steady increases in oil prices after 2009. The increases are relatively modest, with the price of oil only exceeding $100/barrel after 2025. Some forecasters are calling for a much sharper increase in the price of oil. The U.S. Energy Information Administration (EIA) in its 2010 Annual Energy Outlook is projecting oil prices to exceed $100/barrel by 2015-2016. While lower oil prices give consumers an impetus for additional spending, including air travel, and increases the chances for industry profitability, higher oil prices could lead to further shifts in consumer expenditures away from aviation, dampening a recovery in air transport demand. Furthermore, higher oil prices, especially in the near term, could wipe out any chance of industry profitability, continue to pressure airline costs, delay balance sheet improvement and discourage expansion plans or new orders for aircraft as carriers focus on maintaining and increasing cash balances.
Recent data suggests that the global economy has begun to grow again, but the data also indicate that the growth is concentrated in a relatively few countries. As a result, the ensuing economic recovery may not be a balanced one and there is considerable doubt about the strength and sustainability of the expansion. The baseline forecast assumes that growth in the U.S. and China will be significantly higher than in the other large economies – Japan and the European Union. Doubts remain over the strength of demand in both Japan and in the European Union as these areas continue to be constrained by structural economic problems, institutional constraints, and the authorities’ reluctance to take decisive action. Furthermore the steps that were taken to turn the global economy around may prove to be excessive, since the resulting surge in liquidity growth seems to be inflating asset bubbles and exacerbate existing global imbalances. Once the global economy recovers from the current downturn, there could be an increasing risk from asset bubbles and macroeconomic imbalances, which could end up in a deeper, more prolonged, and less manageable recession and financial crisis. The current forecasts assume strong passenger growth for travel between the United States and other world regions. Any slowing of global economic activity could seriously inhibit the growth in world passenger demand.

53
FAA Aerospace Forecast Fiscal Years 2010–2030
The outlook for further consolidation via mergers and acquisition (M&A) appears to be rather limited. Although there is still talk in the industry about the benefits of consolidation, aside from Delta/Northwest merger and the Continental/United alliance there appears to be little scope for further mergers in the US airline industry. Continued tightness in the credit markets has reduced the ability of the industry to finance additional mergers. However, US airlines are exploring other options including global alliances. Many of the major carriers in the US are members of global alliances that operate with some measure of anti-trust immunity from the US DOT. While anti-trust immunity may provide flexibility to airline operators across borders, it may create an anti-competitive environment in the marketplace. These market consolidating vehicles, particularly the anti-trust immunity provisions, may invite increased regulatory scrutiny. If such oversights are launched in the future, this will complicate the evolving structure of the airline industry and may impact demand via new regulations.
The forecast assumes the addition of sizable numbers of regional jets into the fleet of regional carriers. However, the regional carriers’ future is closely linked to those of the larger network carriers. As demand continues to slowly recover, increased financial pressures on regional operators have appeared. Furthermore, if a large network carrier should cease to exist (because of financial difficulties or merger), certain regional carriers could find themselves either saddled with excess capacity or lack of sufficient capacity, or lack of feed traffic. The experience of the Delta and Northwest bankruptcies saw opportunities for regional flying substantially reduced. Business and corporate aviation witnessed a significant downturn in 2009. The length of the slow down and the terms of a recovery are largely based upon the future prospects of economic growth and corporate profits. Future uncertainty in these leading indicators could pose a risk to the forecast, but the risk is not limited to these factors. Public perception of business and corporate aviation, potential environmental regulations and taxes, along with increased security measures placed on business jets, will place downward pressure on the forecast.
Other factors, such as new and more efficient product offerings and increased competition from new entrant manufacturers, serve to broaden the potential of the industry. Estimates show that a record number of new business jet deliveries are overseas and, with the potential of loosening regulations on the use of airspace in foreign countries, the scenario for business jet manufacturers looks all the more promising. Raising the amount of security restrictions, and subsequent travel hassles placed on airline passengers, could make corporate jet travel increasingly appealing. A combination of some of these favorable factors may reach a tipping point, leading to a large on-demand air taxi industry. Although acknowledging the possibility of such an outcome, given recent trends and the large amount uncertainty, the FAA takes a more conservative view on the future prospects of such an industry.
The mix of aircraft operating at most large hubs is also expected to become increasingly complex over the forecast period. The expected increases in the numbers of regional jets and business jets will increase the complexities of the national airspace system and make the FAA’s job more challenging. The increased complexity of the mix of aircraft serves to compound the increases in workload strictly due to the increasing demand for aviation services projected over the forecast period.
Although activity at most U.S. airports fell in 2009, delays remained at historically high levels at many U.S. airports and at four airports (ATL, CLT, DEN, and PHL) delays reached record levels. As demand recovers and workload increases, congestion and delays could become a critical limit to growth over the forecast period. FAA’s forecasts of both demand and workload are unconstrained in that they assume that there will be sufficient infrastructure to handle the projected levels of activity. Should the infrastructure be

FAA Aerospace Forecast Fiscal Years 2010–2030
54
inadequate and result in even more congestion and delays, it is likely that the forecasts of both demand and workload would not be achieved. The Department of Transportation and the FAA are examining a number of options to manage congestion, but the specific measures to be implemented and therefore their impact are unknown at this time.
There are concerns that aviation’s impact on the environment could potentially restrict the ability of the aviation sector to grow to meet national economic and mobility needs. Airport expansion or new construction is often a contentious issue because of noise, air quality, and water quality concerns. Concerns about the climate impacts of aviation emissions are also growing. Although aviation currently accounts for 2 to 3 percent of climate change impacts, greenhouse emissions from the sector are expected to grow unless aggressively mitigated with new technology, renewable fuels, operational improvements and market measures. Market measures intended to control emissions, e.g., various emissions trading systems and charges being discussed, would add significant costs to the aviation sector that could effectively reduce available funds for needed investments in new technology. Energy concerns are also rising, driven by spikes in fuel prices, supply and security issues, and the concerns about fossil fuel contributions to global climate change. Lack of progress on improving the environmental and energy outlook for the future fleet can drive more restrictions via standards or operating limitations on the fleet in service, which in turn can depress growth By contrast, breakthroughs in quieter, cleaner aircraft technologies and renewable fuels could reduce environmental and energy constraints on the forecast.

55
FAA Aerospace Forecast Fiscal Years 2010–2030
APPENDIX A ALTERNATIvE FORECAST SCENARIOS
Uncertainty abounds in all industries, but especially in the commercial air travel industry. Increasingly, the FAA has been requested to provide alternative scenarios to their baseline forecasts. These requests come from policy makers, private industry, associations, and consultants. This year, the FAA has responded to its customers, fully understanding that more information, not less, will help stakeholders to better prepare for the future.
To create the baseline forecast, economic assumptions for both U.S. and international regions from Global Insight’s October 2009 forecast were used to generate enplanements, mainline real yield, and nominal yield. The baseline forecast of passenger trip length (an input variable used to forecast mainline real yield) was derived from recent historical trends and analyst judgment. To develop the alternative scenarios, assumptions from the optimistic and pessimistic scenarios contained in the September 2009 edition of Global Insight’s U.S. long range forecast were used. Inputs from these scenarios were substituted for the baseline scenario inputs to create a “high” and “low” traffic, capacity, and yield forecast. The baseline forecast trip length was adjusted in the optimistic and pessimistic scenarios based on the movement of oil prices in Global Insight’s alternative forecasts relative to the baseline forecast.
International passengers and traffic are primarily determined by GDP Thus, the baseline forecast of GDP for both the U.S. and international regions is modified using the optimistic and pessimistic forecasts of GDP described above in order to create a high and low case.
SCENARIO ASSUMPTIONSFAA’s baseline forecast assumes that the economy recovers from the current downturn and suffers no major mishaps such as large oil price shocks, swings in macroeconomic policy, or financial meltdowns. In the alternative scenarios, the economy is postulated to proceed smoothly as well, however at a different pace than projected under the baseline forecast. Projections for economic growth in Global Insight’s alternative scenarios are rooted in demographics. In Global Insight’s optimistic forecast scenario, population grows more rapidly than in the baseline due to higher net immigration. The reverse is true for the pessimistic forecast; population grows more slowly than the baseline forecast due to slower net immigration.
FAA’s high case forecast uses Global Insight’s optimistic forecast. The optimistic forecast is characterized by lower inflation and faster growth in the labor force and capital stock than in the baseline forecast. In this scenario productivity growth is higher and potential output climbs more rapidly, with GDP (used as an input variable to the FAA’s base, high and low forecasts of enplanements) growing about 0.7 percentage points quicker per year than the baseline forecast. Conversely, FAA’s low case forecast is based on Global Insight’s pessimistic scenario. In the low case forecast, inflation runs higher and the labor force and capital stock growth run lower than in the baseline. As a result, the U.S. economy grows 0.7 percentage points slower per year than in the baseline due to slower productivity and lower potential output growth.

FAA Aerospace Forecast Fiscal Years 2010–2030
56
The level of oil prices are determinants in the supply of and demand for air travel and have a direct impact on the profitability of the industry. In all three forecast scenarios prices remain high by historical standards. In the baseline forecast, oil prices rise as the world economy recovers from the recession, but are kept in check as technological improvements act as a counterbalance to rising prices. In the baseline, the refiners acquisition cost (RAC) of oil almost doubles between 2009 and 2030, rising from $54 to $104 per barrel. In the high case, RAC increases at a slower pace landing at $87 per barrel at the end of the forecast period. The high case is characterized by availability of energy and gains in technology which help to temper prices compared to the baseline. In the low case forecast, scarcity of oil and lower productivity gains create upward pressure in oil prices. In this scenario, RAC rises to $141 by 2030.
The price of energy is one of the critical drivers in the growth of consumer prices over the forecast period. In the high case forecast the consumer price index (CPI) grows at an average rate of 1.7 percent per year (compared to growth of 1.9 percent annually in the baseline) as energy prices, wages, and import prices grow more slowly than in the baseline. In the low case forecast the opposite assumptions hold with energy prices, wages and import prices rising more rapidly compared to the baseline. In the low case, CPI grows an average of 2.8 percent annually over the forecast period.
REAL GROSS DOMESTIC PRODUCT FISCAL YEARS 2009 - 2030
1.9
3.3 3.5 3.3
1.9 1.9
2.72.6 2.6
0.0
1.0
2.0
3.0
4.0
2009-2030 2009-2015 2015-2030
Pessimistic Baseline Optimistic
ANNU
AL P
ERCE
NT G
ROW
TH
U.S. REFINERS’ ACQUISITION COST FISCAL YEARS 2009, 2015, 2030
56.148.3
72.786.6
93.9
140.6
86.9
54.2
104.4
0
25
50
75
100
125
150
2009 2015 2030
Pessimistic Baseline Optimistic
$ Pe
r Bar
rel
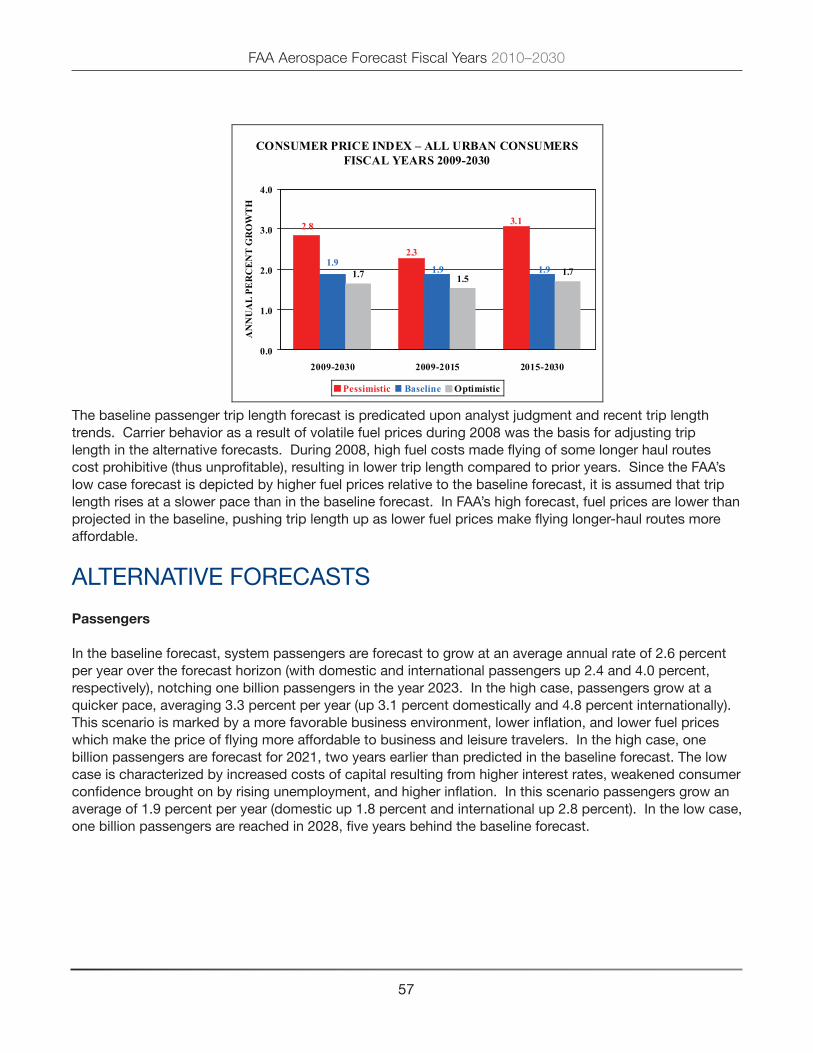
57
FAA Aerospace Forecast Fiscal Years 2010–2030
The baseline passenger trip length forecast is predicated upon analyst judgment and recent trip length trends. Carrier behavior as a result of volatile fuel prices during 2008 was the basis for adjusting trip length in the alternative forecasts. During 2008, high fuel costs made flying of some longer haul routes cost prohibitive (thus unprofitable), resulting in lower trip length compared to prior years. Since the FAA’s low case forecast is depicted by higher fuel prices relative to the baseline forecast, it is assumed that trip length rises at a slower pace than in the baseline forecast. In FAA’s high forecast, fuel prices are lower than projected in the baseline, pushing trip length up as lower fuel prices make flying longer-haul routes more affordable.
ALTERNATIvE FORECASTS
passengers
In the baseline forecast, system passengers are forecast to grow at an average annual rate of 2.6 percent per year over the forecast horizon (with domestic and international passengers up 2.4 and 4.0 percent, respectively), notching one billion passengers in the year 2023. In the high case, passengers grow at a quicker pace, averaging 3.3 percent per year (up 3.1 percent domestically and 4.8 percent internationally). This scenario is marked by a more favorable business environment, lower inflation, and lower fuel prices which make the price of flying more affordable to business and leisure travelers. In the high case, one billion passengers are forecast for 2021, two years earlier than predicted in the baseline forecast. The low case is characterized by increased costs of capital resulting from higher interest rates, weakened consumer confidence brought on by rising unemployment, and higher inflation. In this scenario passengers grow an average of 1.9 percent per year (domestic up 1.8 percent and international up 2.8 percent). In the low case, one billion passengers are reached in 2028, five years behind the baseline forecast.
CONSUMER PRICE INDEX – ALL URBAN CONSUMERS FISCAL YEARS 2009-2030
2.8
1.7 1.51.7
2.3
3.1
1.91.9
1.9
0.0
1.0
2.0
3.0
4.0
2009-2030 2009-2015 2015-2030
Pessimistic Baseline Optimistic
AN
NU
AL
PER
CE
NT
GR
OW
TH
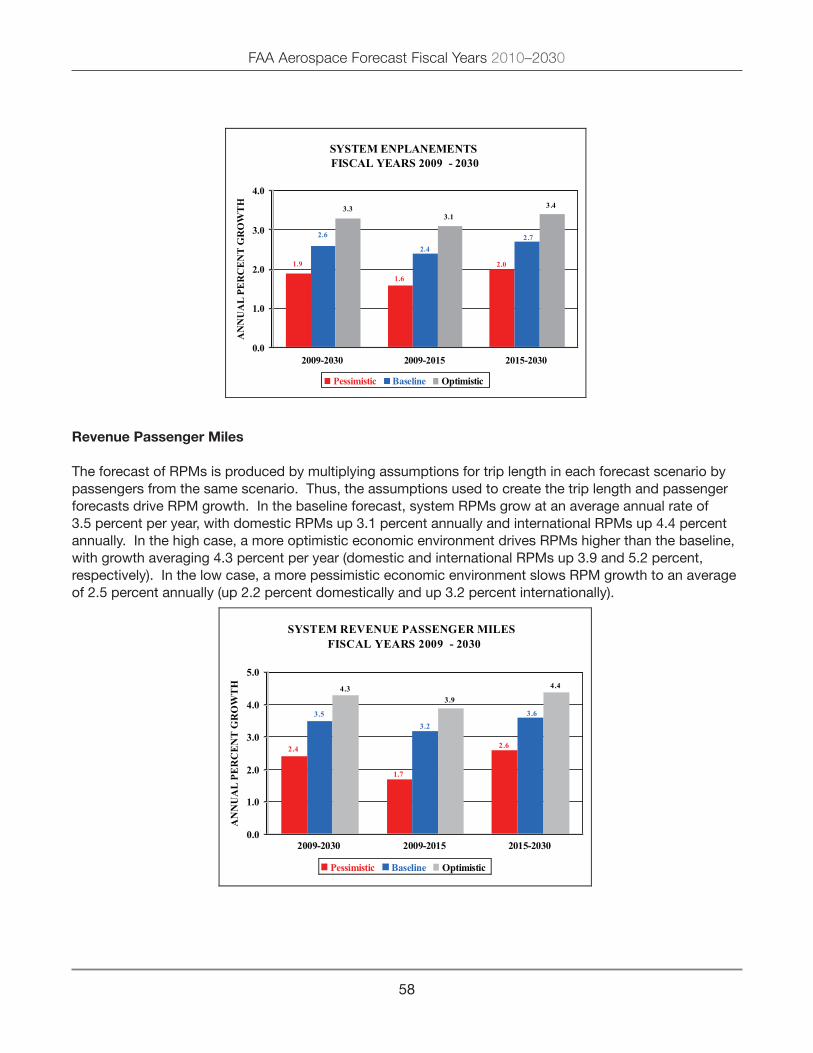
FAA Aerospace Forecast Fiscal Years 2010–2030
58
revenue passenger miles
The forecast of RPMs is produced by multiplying assumptions for trip length in each forecast scenario by passengers from the same scenario. Thus, the assumptions used to create the trip length and passenger forecasts drive RPM growth. In the baseline forecast, system RPMs grow at an average annual rate of 3.5 percent per year, with domestic RPMs up 3.1 percent annually and international RPMs up 4.4 percent annually. In the high case, a more optimistic economic environment drives RPMs higher than the baseline, with growth averaging 4.3 percent per year (domestic and international RPMs up 3.9 and 5.2 percent, respectively). In the low case, a more pessimistic economic environment slows RPM growth to an average of 2.5 percent annually (up 2.2 percent domestically and up 3.2 percent internationally).
SYSTEM ENPLANEMENTS FISCAL YEARS 2009 - 2030
1.9
3.33.1
3.4
1.6
2.0
2.4
2.6 2.7
0.0
1.0
2.0
3.0
4.0
2009-2030 2009-2015 2015-2030
Pessimistic Baseline Optimistic
AN
NU
AL
PER
CE
NT
GR
OW
TH
SYSTEM REVENUE PASSENGER MILESFISCAL YEARS 2009 - 2030
2.4
4.33.9
4.4
1.7
2.6
3.23.5 3.6
0.0
1.0
2.0
3.0
4.0
5.0
2009-2030 2009-2015 2015-2030
Pessimistic Baseline Optimistic
AN
NU
AL
PER
CE
NT
GR
OW
TH

59
FAA Aerospace Forecast Fiscal Years 2010–2030
available seat miles
The available seat miles (capacity) forecast is developed by multiplying revenue passenger miles by load factor. In the base case, system capacity is forecast to increase an average of 3.4 percent annually over the 21-year forecast horizon (with average growth of 2.9 percent domestically and 4.3 percent internationally). In the high case, capacity grows at a faster clip than in the baseline forecast, averaging growth of 4.1 percent annually (up 3.7 percent domestically and up 5.0 percent internationally). Carriers increase capacity compared to the baseline forecast to accommodate increased travel demand brought about by a more favorable economic environment. In the low case, demand for air travel is lower than in the baseline, thus system capacity grows at a slower pace of 2.4 percent annually (domestic up 2.1 percent annually and international up 3.0 percent annually).
load Factor
System load factors over the 21-year forecast period are relatively the same for all three forecast scenarios, rising from 79.7 percent in 2009 to 82.5 percent in 2030. In all three scenarios it is assumed that carriers will keep load factors on the high side by actively managing capacity (seats) to more precisely meet demand (passengers). The domestic load factor slowly grows from 80.4 percent to 83.2 percent over the forecast horizon, while the international load factor grows from 78.1 to just over 81.0 percent during the same period.
Yield
In the baseline forecast, nominal system yield increases 1.1 percent annually, going from 12.5 cents in 2009 to 15.9 cents in 2030. On a domestic basis, yield in the baseline forecast rises from 12.8 cents in 2009 to 16.1 cents in 2030, while international yield rises from 11.8 cents to 15.6 cents. System yield rises more
SY STEM A VA ILA BLE SEA T MILE SFISC AL Y EA RS 2009 - 2030
2.4
4.1
3.4
4.4
1.7
2.62.8
3.43.6
0.0
1.0
2.0
3.0
4.0
5.0
2009-2030 2009-2015 2015-2030
Pessimistic Baseline Optimistic
AN
NU
AL
PER
CE
NT
GR
OW
TH

FAA Aerospace Forecast Fiscal Years 2010–2030
60
slowly in the high case, up 0.7 percent annually to be 14.5 cents at the end of the forecast period (domestic and international yield increase to 14.7 cents and 13.9 cents, respectively). The slower growth in yield in the high case is due to advancements in technology, gains in productivity, more favorable fuel prices, and lower inflation. Increased competition is also assumed in this scenario. In the domestic market fares are driven lower than baseline levels due to increased market overlap between low cost and legacy carriers. In the international market, increased competition from growing liberalization puts downward pressure on fares. In the low case, nominal yields rise more rapidly than in the baseline, growing an average of 2.3 percent annually, reaching 20.3 cents by 2030 (21.0 cents domestically and 19.0 cents internationally). This scenario reflects higher inflation than in the baseline, forcing carriers to increase fares in order to cover the higher costs of fuel, labor, and capital.
passenger trip length
Over the 21-year forecast horizon, baseline system passenger trip length is assumed to grow an average of 10.5 miles per year. In the high case, passenger trip length grows 1.0 mile faster per year than in the base case at 11.5 miles per year. In the high case, fuel prices are lower than in the baseline which allows carriers to operate longer-haul routes more profitably. Conversely, the low forecast is characterized by fuel prices that are higher than the baseline forecast. Higher fuel costs makes flying longer-haul routes less affordable to the carriers; hence passenger trip length trails the baseline forecast by 3.0 miles per year, growing an average of 7.5 miles per year.
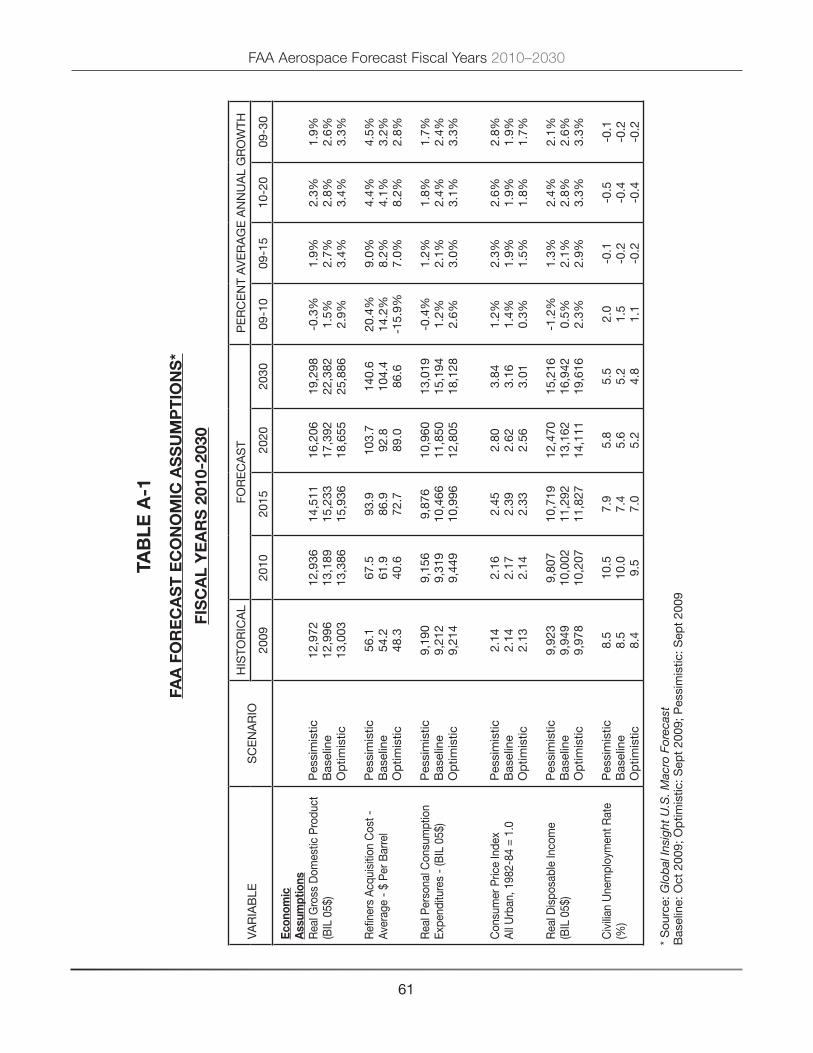
61
FAA Aerospace Forecast Fiscal Years 2010–2030
taB
le a
-1
Faa
Fo
re
ca
st
ec
oN
om
ic a
ss
Um
pt
ioN
s*
Fis
ca
l Y
ea
rs
201
0-20
30
vAR
IAB
LES
CE
NA
RIO
HIS
TOR
ICA
LFO
RE
CA
ST
PE
RC
EN
T A
vE
RA
GE
AN
NU
AL
GR
OW
TH
2009
2010
2015
2020
2030
09-1
009
-15
10-2
009
-30
econ
omic
ass
umpt
ions
Rea
l Gro
ss D
omes
tic P
rodu
ct(B
IL 0
5$)
Refi
ners
Acq
uisi
tion
Cos
t -Av
erag
e -
$ P
er B
arre
l
Rea
l Per
sona
l Con
sum
ptio
nEx
pend
iture
s -
(BIL
05$
)
Con
sum
er P
rice
Inde
xA
ll U
rban
, 198
2-84
= 1
.0
Rea
l Dis
posa
ble
Inco
me
(BIL
05$
)
Civ
ilian
Une
mpl
oym
ent R
ate
(%)
Pes
sim
istic
Bas
elin
eO
ptim
istic
Pes
sim
istic
Bas
elin
eO
ptim
istic
Pes
sim
istic
Bas
elin
eO
ptim
istic
Pes
sim
istic
Bas
elin
eO
ptim
istic
Pes
sim
istic
Bas
elin
eO
ptim
istic
Pes
sim
istic
Bas
elin
eO
ptim
istic
12,9
72
12,9
96
13,0
03
56.1
54
.2
48.3
9,19
0 9,
212
9,21
4
2.14
2.
14
2.13
9,92
3 9,
949
9,97
8
8.5
8.5
8.4
12,9
36
13,1
89
13,3
86
67.5
61
.9
40.6
9,15
6 9,
319
9,44
9
2.16
2.
17
2.14
9,80
7 10
,002
10
,207
10.5
10
.0
9.5
14,5
11
15,2
33
15,9
36
93.9
86
.9
72.7
9,87
6 10
,466
10
,996
2.45
2.
39
2.33
10,7
19
11,2
92
11,8
27
7.9
7.4
7.0
16,2
06
17,3
92
18,6
55
103.
7 92
.8
89.0
10,9
60
11,8
50
12,8
05
2.80
2.
62
2.56
12,4
70
13,1
62
14,1
11
5.8
5.6
5.2
19,2
98
22,3
82
25,8
86
140.
6 10
4.4
86.6
13,0
19
15,1
94
18,1
28
3.84
3.
16
3.01
15,2
16
16,9
42
19,6
16
5.5
5.2
4.8
-0.3
%1.
5%2.
9%
20.4
%14
.2%
-15.
9%
-0.4
%1.
2%2.
6%
1.2%
1.4%
0.3%
-1.2
%0.
5%2.
3% 2.0
1.5
1.1
1.9%
2.7%
3.4%
9.0%
8.2%
7.0%
1.2%
2.1%
3.0%
2.3%
1.9%
1.5%
1.3%
2.1%
2.9% -0.1
-0.2
-0.2
2.3%
2.8%
3.4%
4.4%
4.1%
8.2%
1.8%
2.4%
3.1%
2.6%
1.9%
1.8%
2.4%
2.8%
3.3% -0.5
-0.4
-0.4
1.9%
2.6%
3.3%
4.5%
3.2%
2.8%
1.7%
2.4%
3.3%
2.8%
1.9%
1.7%
2.1%
2.6%
3.3% -0.1
-0.2
-0.2
* S
ourc
e: G
lob
al In
sigh
t U
.S. M
acro
For
ecas
tB
asel
ine:
Oct
200
9; O
ptim
istic
: Sep
t 20
09; P
essi
mis
tic: S
ept
2009
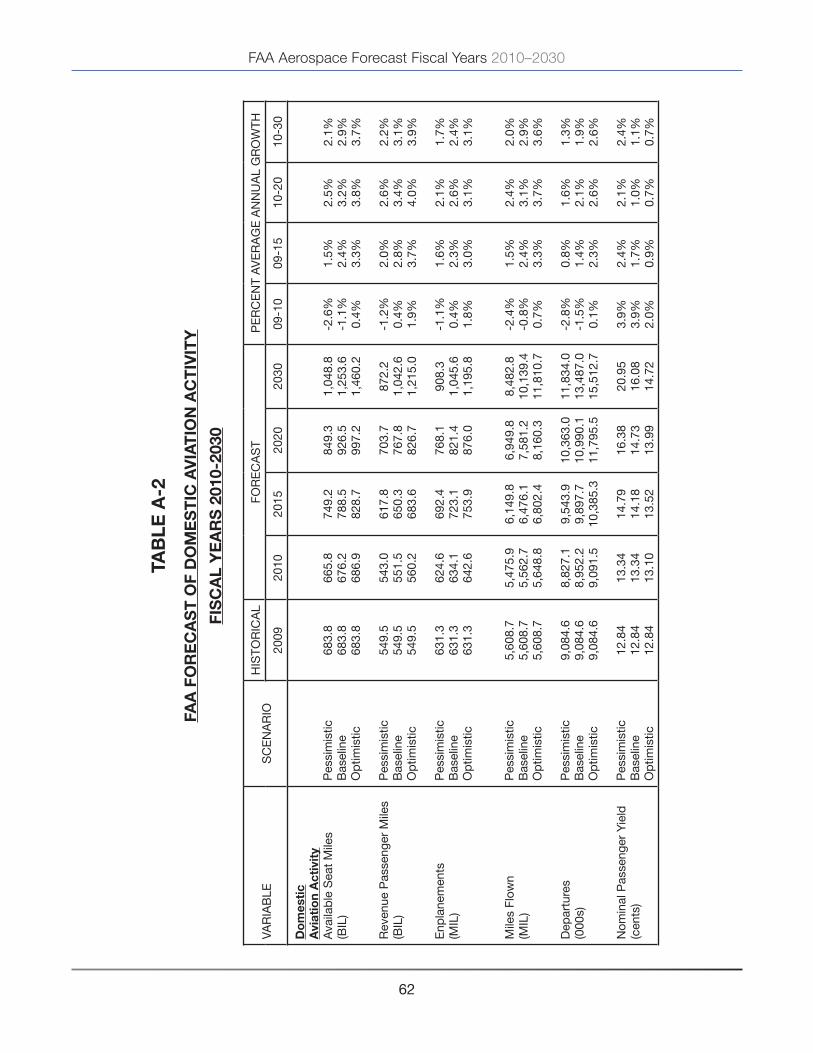
FAA Aerospace Forecast Fiscal Years 2010–2030
62
taB
le a
-2
Faa
Fo
re
ca
st
oF
do
me
st
ic a
via
tio
N a
ct
ivit
Y
Fis
ca
l Y
ea
rs
201
0-20
30
vAR
IAB
LES
CE
NA
RIO
HIS
TOR
ICA
LFO
RE
CA
ST
PE
RC
EN
T A
vE
RA
GE
AN
NU
AL
GR
OW
TH
2009
2010
2015
2020
2030
09-1
009
-15
10-2
010
-30
do
mes
tic
avi
atio
n a
ctiv
ity
Ava
ilab
le S
eat
Mile
s(B
IL)
Rev
enue
Pas
seng
er M
iles
(BIL
)
Enp
lane
men
ts(M
IL)
Mile
s Fl
own
(MIL
) D
epar
ture
s(0
00s)
Nom
inal
Pas
seng
er y
ield
(cen
ts)
Pes
sim
istic
Bas
elin
eO
ptim
istic
Pes
sim
istic
Bas
elin
eO
ptim
istic
Pes
sim
istic
Bas
elin
eO
ptim
istic
Pes
sim
istic
Bas
elin
eO
ptim
istic
Pes
sim
istic
Bas
elin
eO
ptim
istic
Pes
sim
istic
Bas
elin
eO
ptim
istic
683.
8 68
3.8
683.
8
549.
5 54
9.5
549.
5
631.
3 63
1.3
631.
3
5,60
8.7
5,60
8.7
5,60
8.7
9,08
4.6
9,08
4.6
9,08
4.6
12.8
4 12
.84
12.8
4
66
5.8
676.
2 68
6.9
543.
0 55
1.5
560.
2
624.
6 63
4.1
642.
6
5,47
5.9
5,56
2.7
5,64
8.8
8,
827.
1 8,
952.
2 9,
091.
5
13.3
4 13
.34
13.1
0
749.
2 78
8.5
828.
7
617.
8 65
0.3
683.
6
692.
4 72
3.1
753.
9
6,14
9.8
6,47
6.1
6,80
2.4
9,54
3.9
9,89
7.7
10,3
85.3
14.7
9 14
.18
13.5
2
849.
3 92
6.5
997.
2
703.
7 76
7.8
826.
7
768.
1 82
1.4
876.
0
6,94
9.8
7,58
1.2
8,16
0.3
10,3
63.0
10
,990
.1
11,7
95.5
16.3
8 14
.73
13.9
9
1,04
8.8
1,25
3.6
1,46
0.2
872.
2 1,
042.
6 1,
215.
0
908.
3 1,
045.
6 1,
195.
8
8,48
2.8
10,1
39.4
11
,810
.7
11,8
34.0
13
,487
.0
15,5
12.7
20.9
5 16
.08
14.7
2
-2.6
%-1
.1%
0.4%
-1.2
%0.
4%1.
9%
-1.1
%0.
4%1.
8%
-2.4
%-0
.8%
0.7%
-2.8
%-1
.5%
0.1%
3.9%
3.9%
2.0%
1.5%
2.4%
3.3%
2.0%
2.8%
3.7%
1.6%
2.3%
3.0%
1.5%
2.4%
3.3%
0.8%
1.4%
2.3%
2.4%
1.7%
0.9%
2.5%
3.2%
3.8%
2.6%
3.4%
4.0%
2.1%
2.6%
3.1%
2.4%
3.1%
3.7%
1.6%
2.1%
2.6%
2.1%
1.0%
0.7%
2.1%
2.9%
3.7%
2.2%
3.1%
3.9%
1.7%
2.4%
3.1%
2.0%
2.9%
3.6%
1.3%
1.9%
2.6%
2.4%
1.1%
0.7%

63
FAA Aerospace Forecast Fiscal Years 2010–2030
taB
le a
-3
Faa
Fo
re
ca
st
oF
iNt
er
Nat
ioN
al
av
iat
ioN
ac
tiv
itY
Fis
ca
l Y
ea
rs
201
0-20
30
vAR
IAB
LES
CE
NA
RIO
HIS
TOR
ICA
LFO
RE
CA
ST
PE
RC
EN
T A
vE
RA
GE
AN
NU
AL
GR
OW
TH
2009
2010
2015
2020
2030
09-1
009
-15
10-2
010
-30
inte
rnat
iona
la
viat
ion
act
ivity
Avai
labl
e S
eat M
iles
(BIL
)
Rev
enue
Pas
seng
er M
iles
(BIL
)
Enpl
anem
ents
(MIL
)
Mile
s Fl
own
(MIL
) D
epar
ture
s(0
00s)
Nom
inal
Pas
seng
er y
ield
(cen
ts)
Pes
sim
istic
Bas
elin
eO
ptim
istic
Pes
sim
istic
Bas
elin
eO
ptim
istic
Pes
sim
istic
Bas
elin
eO
ptim
istic
Pes
sim
istic
Bas
elin
eO
ptim
istic
Pes
sim
istic
Bas
elin
eO
ptim
istic
Pes
sim
istic
Bas
elin
eO
ptim
istic
281.
7 28
1.7
281.
7
220.
1 22
0.1
220.
1
72.7
72
.7
72.7
1,29
8.7
1,29
8.7
1,29
8.7
550.
9 55
0.9
550.
9
11.8
1 11
.81
11.8
1
26
9.1
274.
0 27
5.1
216.
9 22
0.7
221.
7
72.2
73
.4
74.3
1,24
4.0
1,26
6.1
1,27
1.7
534.
4 54
3.0
549.
7
12.3
4 12
.34
11.4
0
316.
1 34
7.3
353.
0
255.
4 28
0.5
285.
3
82.8
90
.6
93.1
1,44
3.4
1,58
5.8
1,61
1.2
595.
3 64
8.7
666.
9
13.9
8 13
.66
12.4
7
380.
2 43
6.8
456.
1
307.
9 35
3.2
369.
3
97.4
11
1.1
117.
4
1,71
5.9
1,96
8.8
2,05
6.4
679.
5 77
1.8
814.
9
15.2
7 14
.27
13.0
1
523.
6 67
5.6
787.
6
425.
5 54
7.9
639.
8
129.
4 16
4.5
193.
2
2,31
7.8
2,98
5.1
3,47
9.2
860.
2 1,
088.
2 1,
274.
2
19.0
1 15
.55
13.9
3
-4.5
%-2
.8%
-2.3
%
-1.5
%0.
3%0.
7%
-0.7
%0.
9%2.
2%
-4.2
%-2
.5%
-2.1
%
-3.0
%-1
.4%
-0.2
%
4.5%
4.5%
-3.5
%
1.9%
3.5%
3.8%
2.5%
4.1%
4.4%
2.2%
3.7%
4.2%
1.8%
3.4%
3.7%
1.3%
2.8%
3.2%
2.9%
2.5%
0.9%
3.5%
4.8%
5.2%
3.6%
4.8%
5.2%
3.0%
4.2%
4.7%
3.3%
4.5%
4.9%
2.4%
3.6%
4.0%
2.2%
1.5%
1.3%
3.0%
4.3%
5.0%
3.2%
4.4%
5.2%
2.8%
4.0%
4.8%
2.8%
4.0%
4.8%
2.1%
3.3%
4.1%
2.3%
1.3%
0.8%

FAA Aerospace Forecast Fiscal Years 2010–2030
64
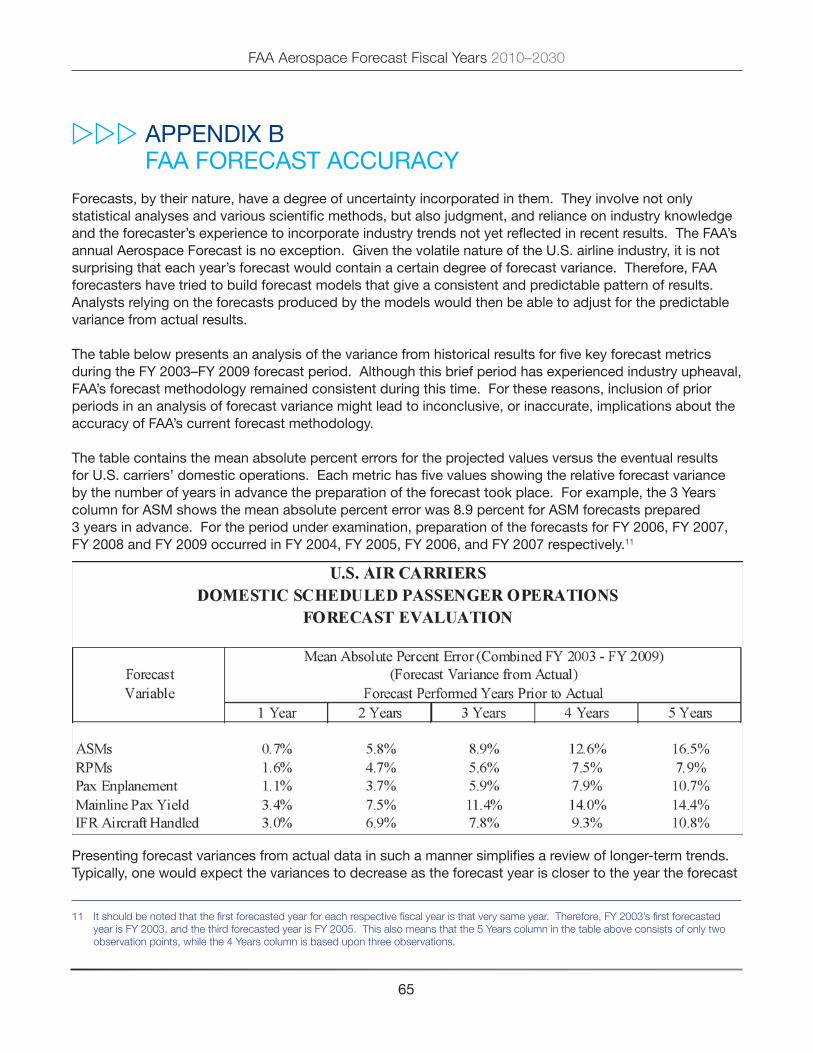
65
FAA Aerospace Forecast Fiscal Years 2010–2030
APPENDIX B FAA FORECAST ACCURACy
Forecasts, by their nature, have a degree of uncertainty incorporated in them. They involve not only statistical analyses and various scientific methods, but also judgment, and reliance on industry knowledge and the forecaster’s experience to incorporate industry trends not yet reflected in recent results. The FAA’s annual Aerospace Forecast is no exception. Given the volatile nature of the U.S. airline industry, it is not surprising that each year’s forecast would contain a certain degree of forecast variance. Therefore, FAA forecasters have tried to build forecast models that give a consistent and predictable pattern of results. Analysts relying on the forecasts produced by the models would then be able to adjust for the predictable variance from actual results.
The table below presents an analysis of the variance from historical results for five key forecast metrics during the Fy 2003–Fy 2009 forecast period. Although this brief period has experienced industry upheaval, FAA’s forecast methodology remained consistent during this time. For these reasons, inclusion of prior periods in an analysis of forecast variance might lead to inconclusive, or inaccurate, implications about the accuracy of FAA’s current forecast methodology.
The table contains the mean absolute percent errors for the projected values versus the eventual results for U.S. carriers’ domestic operations. Each metric has five values showing the relative forecast variance by the number of years in advance the preparation of the forecast took place. For example, the 3 years column for ASM shows the mean absolute percent error was 8.9 percent for ASM forecasts prepared 3 years in advance. For the period under examination, preparation of the forecasts for Fy 2006, Fy 2007, Fy 2008 and Fy 2009 occurred in Fy 2004, Fy 2005, Fy 2006, and Fy 2007 respectively.11
Presenting forecast variances from actual data in such a manner simplifies a review of longer-term trends. Typically, one would expect the variances to decrease as the forecast year is closer to the year the forecast
11 It should be noted that the first forecasted year for each respective fiscal year is that very same year. Therefore, FY 2003’s first forecasted year is FY 2003, and the third forecasted year is FY 2005. This also means that the 5 Years column in the table above consists of only two observation points, while the 4 Years column is based upon three observations.

FAA Aerospace Forecast Fiscal Years 2010–2030
66
is prepared. Presenting forecast variances in this way allows an examination of changes in the relative variances by time horizon, signaling when dramatic shifts in accuracy occur.
Examination of the forecast variances reveals several items. First, all the metrics examined, show declining variances as the forecast time horizon decreases, as expected. The largest variances were found in the forecasts of ASMs and yield, the two variables most directly affected by carrier business decisions. However, for both of these variables the largest declines in variance occur between year 3 and year 1. Second, the FAA’s forecast model produces relatively small variances for both of the passenger traffic metrics, Enplanements and RPMs, with none of the forecast variances exceeding 11.0 percent for any forecast time horizon examined. Third, the relative divergence in forecast variances between RPMs and ASMs suggests errors in forecasting load factor.
The examination of the forecast variances over time suggests two primary implications. First, added focus on load factor might improve the model. Currently, load factor is calculated by dividing the forecast RPMs by forecast ASMs. The large difference between the RPM forecast variance and ASM forecast variance beyond year 2, indicates a relatively large variance in the forecast of load factor, one of the critical elements in converting passenger demand into aviation activity. However, the difference between the RPM forecast variance and ASM forecast variance narrows as the time horizon shortens, suggesting that the near term load factor forecasts are coming closer to the mark. All other things being equal, large variances in forecasts of load factor will lead to large variances in the long-term forecasts of aviation activity, as can been seen in the variances of the IFR aircraft handled forecasts.
Furthermore, ASMs are becoming increasingly difficult to forecast beyond a relatively short time horizon, as carriers often react to changing market conditions. The relatively large variances in the ASM forecasts suggest that carriers have reacted by permanently removing capacity. Such capacity reductions can be identified in the short term by using advance schedule information. However, FAA’s longer-term forecasts rely on anticipated aircraft deliveries and retirements as well as historic relationships between economic activity and capacity deployed. Given the volatile nature of many of the factors that may influence longer term ASM forecasts, a simpler approach, such as RPMs divided by load factor, may improve the long run accuracy of the ASM forecasts.

67
FAA Aerospace Forecast Fiscal Years 2010–2030
APPENDIX C ACkNOWLEDGEMENTS
This document was prepared by the Forecasts and Performance Analysis Division (APO-100), Office of Aviation Policy and Plans, under the direction of Mr. Roger D. Schaufele, Jr. The following individuals were responsible for individual subject areas:
economic environment: Roger D. Schaufele, Jr. (202) 267-3306
commercial air carriers:– Passengers Roger D. Schaufele, Jr. (202) 267-3306 Cheryl L. Miner (202) 493-4236– Cargo Andrea Schandler (202) 267-3323
general aviation:– Forecasts Fahad Ahmad (202) 267-3285– Survey Data Fahad Ahmad (202) 267-3285
Faa workload measures:– Forecasts Roger D. Schaufele, Jr. (202) 267-3306– Data Information Systems Branch, APO-130
Unmanned aircraft systems: Roger D. Schaufele, Jr. (202) 267-3306
commercial space: John Sloan, Commercial Space Transportation, AST-100 (202) 267-7989
text and table preparation: Forecasts and Performance Analysis Division Staff
Forecast conference planner: Linda Baranovics (202) 267-7924
apo websites:– Forecasts/Statistical Publications http://www.faa.gov/data_statistics– APO Data System http://aspm.faa.gov
email:– APO staff first name.last [email protected]

FAA Aerospace Forecast Fiscal Years 2010–2030
68

69
FAA Aerospace Forecast Fiscal Years 2010–2030
FORECAST TABLES

FAA Aerospace Forecast Fiscal Years 2010–2030
70
taB
le 1
U.s
. sH
or
t-t
er
m e
co
No
mic
Fo
re
ca
st
s
EC
ON
OM
ICvA
RIA
BLE
FIS
CA
L y
EA
R 2
010
FIS
CA
L y
EA
R 2
011
1ST.
QTR
.2N
D Q
TR.
3RD
QTR
.4T
H Q
TR.
1ST
QTR
.2N
D Q
TR.
3RD
QTR
.4T
H Q
TR.
rea
l gd
p(B
illio
ns o
f 200
5$)
Sea
sona
lly A
dju
sted
Ann
ual R
ate
Refi
ners
’ Acq
uisi
tio
n C
ost
- A
vera
ge
(Dol
lars
)S
easo
nally
Ad
just
ed A
nnua
l Rat
e
co
nsum
er p
rice
ind
ex1
(198
2-84
eq
uals
100
)S
easo
nally
Ad
just
ed A
nnua
l Rat
e
13,0
97.9
2.6%
66.5
412
.2%
21
6.4
2.1%
13,1
55.3
1.8%
61.6
3-2
6.4%
216.
2-0
.3%
13
,214
.51.
8% 60
.68
-6.0
%
21
6.7
1.0%
13
,286
.62.
2% 63
.52
20.1
%
21
7.8
2.0%
13
,374
.62.
7% 66
.37
19.1
%
21
8.9
2.0%
13
,466
.72.
8% 69
.21
18.3
%
22
0.2
2.5%
13
,585
.43.
6% 72
.05
17.5
%
22
1.6
2.5%
13
,708
.83.
7% 74
.90
16.7
%
22
3.0
2.6%
Sou
rce:
Glo
bal I
nsig
ht, O
ctob
er 2
009.

71
FAA Aerospace Forecast Fiscal Years 2010–2030
taB
le 2
U.s
. lo
Ng
-te
rm
ec
oN
om
ic F
or
ec
as
ts
FIS
CA
Ly
EA
R
GR
OS
SD
OM
ES
TIC
PR
OD
UC
T(B
illio
ns 2
005$
)
CO
NS
UM
ER
PR
ICE
IND
EX
(198
2-84
=10
0)
RE
FIN
ER
S’ A
CQ
UIS
ITIO
N C
OS
TA
vE
RA
GE
(Dol
lars
per
bar
rel)
His
toric
al20
00
2005
2006
2007
2008
2009
E
Fore
cast
2010
2011
2012
2013
2014
2015
2016
2017
2018
2019
2020
2021
2022
2023
2024
2025
2026
2027
2028
2029
2030
Avg
Ann
ual G
row
th20
00-0
920
09-1
020
10-2
020
09-3
0
11,1
45.9
12,5
53.8
12,8
98.3
13,1
71.4
13,3
74.5
12,9
95.9
13,1
88.6
13,5
33.9
14,0
24.1
14,4
69.8
14,8
52.6
15,2
33.2
15,6
12.1
15,9
95.2
16,4
14.8
16,8
76.8
17,3
91.6
17,8
58.1
18,3
18.4
18,7
94.2
19,2
72.8
19,7
83.0
20,3
00.2
20,8
02.1
21,3
17.6
21,8
32.4
22,3
81.6
1.7%
1.5%
2.8%
2.6%
170.
74
193.
4820
0.62
205.
3021
4.42
213.
78
216.
75
220.
9322
5.74
229.
9523
4.38
238.
86
243.
6124
8.36
253.
1625
7.90
262.
39
266.
9527
1.60
276.
3428
1.42
286.
72
292.
1429
7.76
303.
4530
9.45
315.
71
2.5%
1.4%
1.9%
1.9%
26.7
0
47.2
059
.94
60.5
910
1.52
54.2
2
61.9
2
69.2
576
.47
80.2
183
.34
86.9
0
90.7
593
.02
94.7
494
.50
92.8
2
90.8
289
.58
88.4
289
.70
91.7
9
93.7
795
.70
98.4
510
1.47
104.
45
8.2%
14.2
%4.
1%3.
2%
Sou
rce:
200
9-20
30; G
loba
l Ins
ight
, US
Eco
nom
ic O
utlo
ok, O
ctob
er 2
009.
Ext
rapo
late
d to
203
0.

FAA Aerospace Forecast Fiscal Years 2010–2030
72
taB
le 3
iNt
er
Nat
ioN
al
gd
p F
or
ec
as
ts
BY
tr
av
el
re
gio
N
CA
LEN
DA
Ry
EA
R
GR
OS
S D
OM
ES
TIC
PR
OD
UC
T(In
Bill
ions
of 2
005
U.S
. Dol
lars
)
CA
NA
DA
EU
RO
PE
/A
FRIC
A/
MID
DLE
EA
ST
LATI
N A
ME
RIC
A/
ME
XIC
O
JAPA
N/P
AC
IFIC
BA
SIN
/CH
INA
/OTH
ER
AS
IA/A
US
TRA
LIA
/N
. ZE
ALA
ND
WO
RLD
His
toric
al20
00
2005
2006
2007
2008
2009
E
Fore
cast
2010
2011
2012
2013
2014
2015
2016
2017
2018
2019
2020
2021
2022
2023
2024
2025
2026
2027
2028
2029
2030
Avg
Ann
ual G
row
th20
00-0
920
09-1
020
10-2
020
09-3
0
1,00
0.2
1,13
4.1
1,16
6.5
1,19
6.0
1,20
0.9
1,17
0.2
1,19
5.4
1,23
6.6
1,28
0.8
1,32
1.7
1,35
9.2
1,39
3.7
1,42
7.0
1,45
9.8
1,49
3.4
1,52
7.5
1,56
0.2
1,59
3.1
1,62
5.6
1,65
9.7
1,69
3.7
1,72
8.3
1,76
4.3
1,80
0.6
1,83
9.7
1,87
8.8
1,91
8.4
1.8%
2.1%
2.7%
2.4%
15,2
80.3
17,0
61.5
17,7
09.7
18,2
91.9
18,5
41.8
17,9
10.5
18,1
44.7
18,5
13.8
18,9
78.4
19,4
92.9
20,0
35.1
20,5
50.8
21,0
63.7
21,5
76.6
22,0
94.9
22,6
23.6
23,1
56.3
23,6
90.7
24,2
23.8
24,7
62.8
25,3
14.7
25,8
73.7
26,4
42.0
27,0
18.5
27,6
04.9
28,1
98.4
28,8
03.2
1.8%
1.3%
2.5%
2.3%
2,16
2.7
2,45
4.0
2,58
7.0
2,72
6.9
2,83
3.2
2,75
9.6
2,84
8.8
2,97
2.2
3,10
1.9
3,22
9.3
3,35
6.3
3,48
2.3
3,61
1.5
3,74
4.7
3,88
1.0
4,02
2.4
4,16
6.4
4,31
5.1
4,46
7.9
4,62
5.8
4,78
8.1
4,95
6.2
5,13
0.1
5,30
8.4
5,49
1.8
5,68
1.1
5,87
6.3
2.7%
3.2%
3.9%
3.7%
8,83
7.1
10,7
43.3
11,3
27.3
12,0
14.0
12,3
79.0
12,3
84.7
12,9
66.2
13,5
79.7
14,2
84.6
15,0
69.3
15,9
03.4
16,7
60.8
17,5
99.5
18,4
25.1
19,2
66.7
20,1
30.3
21,0
11.6
21,9
23.0
22,8
52.1
23,8
12.9
24,8
19.3
25,8
66.8
26,9
38.7
28,0
54.7
29,1
92.3
30,3
58.4
31,5
51.9
3.8%
4.7%
4.9%
4.6%
39,7
02.4
45,6
12.1
47,4
68.3
49,3
10.9
50,1
86.1
49,0
40.5
50,2
86.6
51,8
97.7
53,8
35.8
55,8
06.2
57,8
17.1
59,8
21.8
61,8
08.9
63,7
93.8
65,8
45.8
67,9
86.4
70,1
88.6
72,3
76.5
74,5
95.3
76,8
77.7
79,2
36.8
81,6
84.4
84,1
64.7
86,6
96.8
89,2
81.2
91,9
15.8
94,6
39.4
2.4%
2.5%
3.4%
3.2%
Sou
rce:
Glo
bal
Insi
ght,
Oct
ober
200
9.

73
FAA Aerospace Forecast Fiscal Years 2010–2030ta
Ble
4
iNt
er
Nat
ioN
al
gd
p F
or
ec
as
ts
— s
ele
ct
ed
ar
ea
s/c
oU
Nt
rie
s
CA
LEN
DA
Ry
EA
R
GR
OS
S D
OM
ES
TIC
PR
OD
UC
T(In
Bill
ions
of 2
005
U.S
. Dol
lars
)
NO
RTH
AM
ER
ICA
(NA
FTA
)E
UR
OZ
ON
EU
NIT
ED
kIN
GD
OM
JAPA
NC
HIN
A
His
toric
al20
00
2005
2006
2007
2008
2009
E
Fore
cast
2010
2011
2012
2013
2014
2015
2016
2017
2018
2019
2020
2021
2022
2023
2024
2025
2026
2027
2028
2029
2030
Avg
Ann
ual G
row
th20
00-0
920
09-1
020
10-2
020
09-3
0
13,0
01.7
14,6
21.6
15,0
35.4
15,3
72.5
15,4
48.2
15,0
19.7
15
,346
.5
15,8
06.2
16,3
83.8
16,8
73.5
17,3
26.1
17,7
68.2
18,2
11.5
18,6
62.9
19,1
55.6
19,6
99.2
20,2
72.8
20,7
96.5
21,3
25.7
21,8
70.3
22,4
21.5
23,0
08.1
23,5
92.0
24,1
67.7
24,7
58.6
25,3
53.7
25,9
92.5
1.6%
2.2%
2.8%
2.6%
9,38
0.0
10,1
16.3
10,4
30.9
10,7
14.3
10,7
73.6
10,3
46.0
10,4
35.1
10,5
77.6
10,7
58.7
10,9
76.8
11,2
08.4
11,4
12.5
11,6
15.6
11,8
16.2
12,0
14.4
12,2
19.5
12,4
20.7
12,6
23.2
12,8
23.3
13,0
25.0
13,2
32.6
13,4
40.8
13,6
51.1
13,8
62.1
14,0
75.0
14,2
87.4
14,5
00.8
1.1%
0.9%
1.8%
1.6%
2,01
4.8
2,27
9.3
2,34
4.3
2,40
4.3
2,41
7.5
2,31
1.5
2,33
5.1
2,37
1.6
2,42
8.1
2,49
3.4
2,56
4.5
2,63
0.4
2,69
3.8
2,75
6.6
2,82
0.8
2,88
5.7
2,95
1.4
3,01
7.6
3,08
2.1
3,14
7.2
3,21
2.6
3,27
7.8
3,34
5.7
3,41
6.0
3,48
7.0
3,55
8.1
3,63
1.8
1.5%
1.0%
2.4%
2.2%
4,27
2.2
4,55
6.7
4,64
9.4
4,75
5.6
4,72
2.6
4,44
7.7
4,49
5.9
4,56
2.4
4,65
5.2
4,76
4.5
4,87
8.3
4,98
5.1
5,06
0.6
5,10
4.3
5,13
9.8
5,17
0.2
5,19
6.5
5,21
8.2
5,23
8.1
5,25
7.2
5,27
6.1
5,29
4.4
5,31
2.6
5,33
1.6
5,35
2.1
5,37
2.2
5,38
9.7
0.4%
1.1%
1.5%
0.9%
1,42
0.5
2,24
4.1
2,50
4.4
2,83
0.0
3,08
3.5
3,33
3.3
3,66
9.5
3,99
0.4
4,33
2.9
4,72
4.8
5,15
6.6
5,61
0.2
6,06
9.7
6,54
4.0
7,04
3.3
7,56
5.3
8,10
9.7
8,68
7.0
9,27
9.0
9,89
7.1
10,5
48.4
11,2
28.2
11,9
23.6
12,6
52.0
13,3
89.4
14,1
42.8
14,9
16.0
9.9%
10.1
%8.
3%7.
4% S
ourc
e: G
lob
al In
sigh
t, O
ctob
er 2
009.
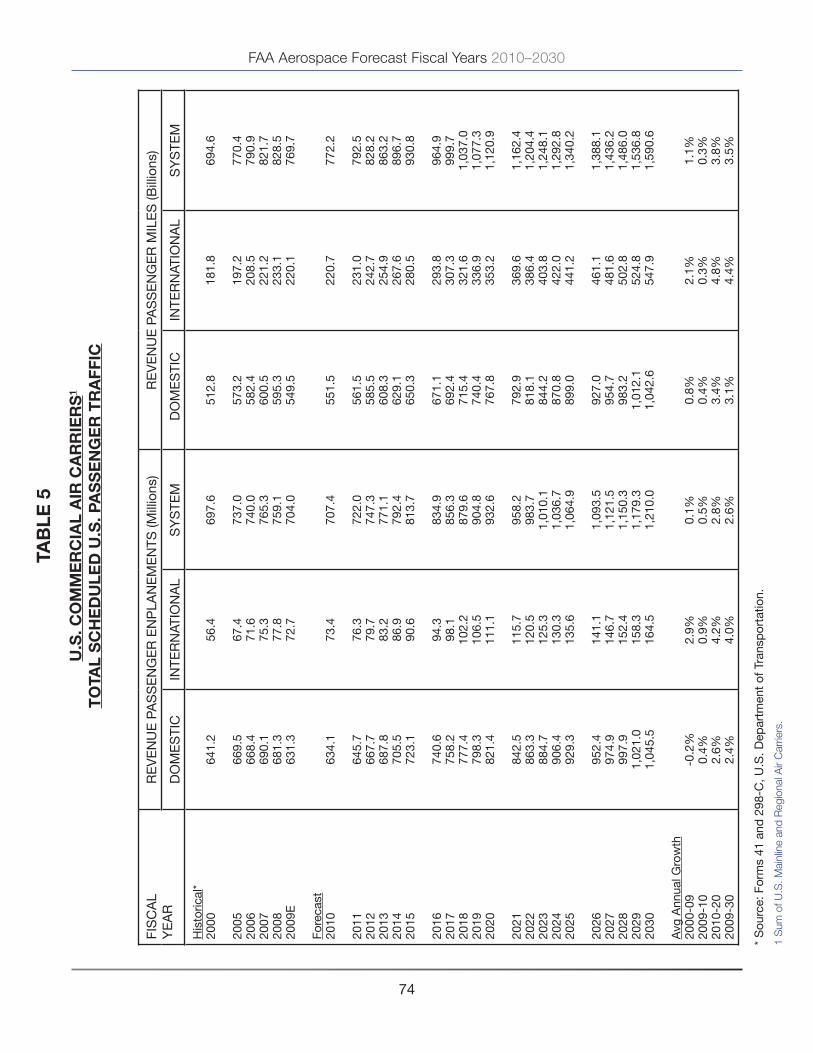
FAA Aerospace Forecast Fiscal Years 2010–2030
74
taB
le 5
U.s
. co
mm
er
cia
l a
ir c
ar
rie
rs
1
to
tal
sc
He
dU
led
U.s
. pa
ss
eN
ge
r t
ra
FFic
FIS
CA
Ly
EA
RR
Ev
EN
UE
PA
SS
EN
GE
R E
NP
LAN
EM
EN
TS (M
illio
ns)
RE
vE
NU
E P
AS
SE
NG
ER
MIL
ES
(Bill
ions
)
DO
ME
STI
CIN
TER
NAT
ION
AL
Sy
STE
M D
OM
ES
TIC
INTE
RN
ATIO
NA
L S
yS
TEM
His
toric
al*
2000
2005
2006
2007
2008
2009
E
Fore
cast
2010
2011
2012
2013
2014
2015
2016
2017
2018
2019
2020
2021
2022
2023
2024
2025
2026
2027
2028
2029
2030
Avg
Ann
ual G
row
th20
00-0
920
09-1
020
10-2
020
09-3
0
641.
2
669.
566
8.4
690.
168
1.3
631.
3
634.
1
645.
766
7.7
687.
870
5.5
723.
1
740.
675
8.2
777.
479
8.3
821.
4
842.
586
3.3
884.
790
6.4
929.
3
952.
497
4.9
997.
91,
021.
01,
045.
5
-0.2
%0.
4%2.
6%2.
4%
56.4
67.4
71.6
75.3
77.8
72.7
73.4
76.3
79.7
83.2
86.9
90.6
94.3
98.1
102.
210
6.5
111.
1
115.
712
0.5
125.
313
0.3
135.
6
141.
114
6.7
152.
415
8.3
164.
5
2.9%
0.9%
4.2%
4.0%
697.
6
737.
074
0.0
765.
375
9.1
704.
0
707.
4
722.
074
7.3
771.
179
2.4
813.
7
834.
985
6.3
879.
690
4.8
932.
6
958.
298
3.7
1,01
0.1
1,03
6.7
1,06
4.9
1,09
3.5
1,12
1.5
1,15
0.3
1,17
9.3
1,21
0.0
0.1%
0.5%
2.8%
2.6%
512.
8
573.
2 58
2.4
600.
5 59
5.3
549.
5
551.
5
561.
558
5.5
608.
362
9.1
650.
3
671.
169
2.4
715.
474
0.4
767.
8
792.
981
8.1
844.
287
0.8
899.
0
927.
095
4.7
983.
21,
012.
11,
042.
6
0.8%
0.4%
3.4%
3.1%
181.
8
197.
220
8.5
221.
223
3.1
220.
1
220.
7
231.
024
2.7
254.
926
7.6
280.
5
293.
830
7.3
321.
633
6.9
353.
2
369.
638
6.4
403.
842
2.0
441.
2
461.
148
1.6
502.
852
4.8
547.
9
2.1%
0.3%
4.8%
4.4%
694.
6
770.
479
0.9
821.
782
8.5
769.
7
772.
2
792.
582
8.2
863.
289
6.7
930.
8
964.
999
9.7
1,03
7.0
1,07
7.3
1,12
0.9
1,16
2.4
1,20
4.4
1,24
8.1
1,29
2.8
1,34
0.2
1,38
8.1
1,43
6.2
1,48
6.0
1,53
6.8
1,59
0.6
1.1%
0.3%
3.8%
3.5%
* S
ourc
e: F
orm
s 41
and
298
-C, U
.S. D
epar
tmen
t of
Tra
nsp
orta
tion.
1 S
um o
f U.S
. Mai
nlin
e an
d R
egio
nal A
ir C
arrie
rs.

75
FAA Aerospace Forecast Fiscal Years 2010–2030ta
Ble
6
U.s
. co
mm
er
cia
l a
ir c
ar
rie
rs
1
sc
He
dU
led
pa
ss
eN
ge
r c
apa
cit
Y, t
ra
FFic
, aN
d l
oa
d F
ac
to
rs
FIS
CA
Ly
EA
R
DO
ME
STI
CIN
TER
NAT
ION
AL
Sy
STE
MA
SM
s(B
IL)
RP
Ms
(BIL
)%
LO
AD
FAC
TOR
AS
Ms
(BIL
)R
PM
s(B
IL)
% L
OA
DFA
CTO
RA
SM
s(B
IL)
RP
Ms
(BIL
)%
LO
AD
FAC
TOR
His
toric
al*
2000
2005
2006
2007
2008
2009
E
Fore
cast
2010
2011
2012
2013
2014
2015
2016
2017
2018
2019
2020
2021
2022
2023
2024
2025
2026
2027
2028
2029
2030
Avg
Ann
ual G
row
th20
00-0
920
09-1
020
10-2
020
09-3
0
726.
6
755.
274
0.2
752.
575
0.5
683.
8
676.
2
686.
771
4.1
740.
276
4.0
788.
5
812.
783
7.6
864.
689
4.1
926.
5
956.
398
6.1
1,01
7.2
1,04
8.8
1,08
2.5
1,11
5.8
1,14
8.7
1,18
2.7
1,21
7.1
1,25
3.6
-0.7
%-1
.1%
3.2%
2.9%
512.
8
573.
258
2.4
600.
559
5.3
549.
5
551.
5
561.
558
5.5
608.
362
9.1
650.
3
671.
169
2.4
715.
474
0.4
767.
8
792.
981
8.1
844.
287
0.8
899.
0
927.
095
4.7
983.
21,
012.
11,
042.
6
0.8%
0.4%
3.4%
3.1%
70.6
75.9
78.7
79.8
79.3
80.4
81.6
81.8
82.0
82.2
82.3
82.5
82.6
82.7
82.7
82.8
82.9
82.9
83.0
83.0
83.0
83.1
83.1
83.1
83.1
83.2
83.2
239.
3
248.
526
1.3
275.
929
1.9
281.
7
274.
0
286.
930
1.2
316.
133
1.7
347.
6
363.
938
0.5
398.
041
6.8
436.
8
456.
947
7.6
499.
052
1.2
544.
7
569.
159
4.3
620.
364
7.2
675.
6
1.8%
-2.8
%4.
8%4.
3%
181.
8
197.
220
8.5
221.
223
3.1
220.
1
220.
7
231.
024
2.7
254.
926
7.6
280.
5
293.
830
7.3
321.
633
6.9
353.
2
369.
638
6.4
403.
842
2.0
441.
2
461.
148
1.6
502.
852
4.8
547.
9
2.1%
0.3%
4.8%
4.4%
76.0
79.4
79.8
80.2
79.9
78.1
80.6
80.5
80.6
80.6
80.7
80.7
80.7
80.8
80.8
80.8
80.9
80.9
80.9
80.9
81.0
81.0
81.0
81.0
81.1
81.1
81.1
965.
9
1,00
3.6
1,00
1.5
1,02
8.4
1,04
2.4
965.
5
950.
2
973.
71,
015.
21,
056.
31,
095.
81,
136.
1
1,17
6.6
1,21
8.1
1,26
2.6
1,31
0.9
1,36
3.3
1,41
3.2
1,46
3.7
1,51
6.2
1,57
0.1
1,62
7.2
1,68
4.9
1,74
3.0
1,80
3.0
1,86
4.3
1,92
9.2
0.0%
-1.6
%3.
7%3.
4%
694.
6
770.
479
0.9
821.
782
8.5
769.
7
772.
2
792.
582
8.2
863.
289
6.7
930.
8
964.
999
9.7
1,03
7.0
1,07
7.3
1,12
0.9
1,16
2.4
1,20
4.4
1,24
8.1
1,29
2.8
1,34
0.2
1,38
8.1
1,43
6.2
1,48
6.0
1,53
6.8
1,59
0.6
1.1%
0.3%
3.8%
3.5%
71.9
76.8
79.0
79.9
79.5
79.7
81.3
81.4
81.6
81.7
81.8
81.9
82.0
82.1
82.1
82.2
82.2
82.3
82.3
82.3
82.3
82.4
82.4
82.4
82.4
82.4
82.4
* S
ourc
e: F
orm
s 41
and
298
-C, U
.S. D
epar
tmen
t of
Tra
nsp
orta
tion.
1 S
um o
f U.S
. Mai
nlin
e an
d R
egio
nal A
ir C
arrie
rs.

FAA Aerospace Forecast Fiscal Years 2010–2030
76
taB
le 7
U.s
. co
mm
er
cia
l a
ir c
ar
rie
rs
1
to
tal
sc
He
dU
led
U.s
. iN
te
rN
atio
Na
l pa
ss
eN
ge
r t
ra
FFic
FIS
CA
Ly
EA
R
RE
vE
NU
E P
AS
SE
NG
ER
EN
PLA
NE
ME
NTS
RE
vE
NU
E P
AS
SE
NG
ER
MIL
ES
ATLA
NTI
CLA
TIN
AM
ER
ICA
PAC
IFIC
TOTA
LIN
TER
NAT
ION
AL
ATLA
NTI
CLA
TIN
AM
ER
ICA
PAC
IFIC
TOTA
LIN
TER
NAT
ION
AL
(Mil)
(Mil)
(Mil)
(Mil)
(Bil)
(Bil)
(Bil)
(Bil)
His
toric
al*
2000
2005
2006
2007
2008
2009
E
Fore
cast
2010
2011
2012
2013
2014
2015
2016
2017
2018
2019
2020
2021
2022
2023
2024
2025
2026
2027
2028
2029
2030
Avg
Ann
ual G
row
th20
00-0
920
09-1
020
10-2
020
09-3
0
20.9
21.6
22.5
24.1
26.0
24.7
24.1
25.3
26.3
27.3
28.3
29.3
30.2
31.2
32.3
33.4
34.6
35.8
36.9
38.1
39.4
40.7
42.0
43.3
44.6
46.0
47.5
1.9%
-2.5
%3.
7%3.
1%
24.3
32.5
35.2
37.6
38.7
35.9
37.1
38.5
40.2
42.0
43.9
45.8
47.7
49.7
51.8
54.1
56.6
59.1
61.7
64.3
67.0
69.9
72.9
75.9
79.0
82.2
85.6
4.4%
3.3%
4.3%
4.2%
11.2
13.2
13.9
13.6
13.2
12.0
12.1
12.5
13.2
13.9
14.6
15.5
16.3
17.2
18.1
19.0
19.9
20.9
21.9
22.9
23.9
25.1
26.2
27.5
28.7
30.1
31.4
0.8%
0.7%
5.1%
4.7%
56.4
67.4
71.6
75.3
77.8
72.7
73.4
76.3
79.7
83.2
86.9
90.6
94.3
98.1
102.
210
6.5
111.
1
115.
712
0.5
125.
313
0.3
135.
6
141.
114
6.7
152.
415
8.3
164.
5
2.9%
0.9%
4.2%
4.0%
87.1
89.5
93.9
102.
211
2.7
108.
9
106.
8
112.
411
7.7
122.
912
8.1
133.
0
138.
014
3.1
148.
615
4.6
160.
9
167.
017
3.2
179.
618
6.2
193.
1
200.
220
7.4
214.
722
2.2
230.
2
2.5%
-1.9
%4.
2%3.
6%
36.3
48.6
53.6
57.7
60.0
56.5
58.5
61.2
64.6
68.3
72.3
76.3
80.5
84.8
89.3
94.3
99.8
105.
611
1.5
117.
712
4.1
130.
9
138.
114
5.5
153.
116
1.1
169.
6
5.0%
3.7%
5.5%
5.4%
58.4
59.2
61.1
61.4
60.4
54.7
55.4
57.4
60.3
63.6
67.3
71.2
75.2
79.4
83.6
88.0
92.4
97.0
101.
710
6.6
111.
711
7.1
122.
812
8.7
135.
014
1.4
148.
1
-0.7
%1.
2%5.
3%4.
9%
181.
8
197.
220
8.5
221.
223
3.1
220.
1
220.
7
231.
024
2.7
254.
926
7.6
280.
5
293.
830
7.3
321.
633
6.9
353.
2
369.
638
6.4
403.
842
2.0
441.
2
461.
148
1.6
502.
852
4.8
547.
9
2.1%
0.3%
4.8%
4.4%
* S
ourc
e: F
orm
s 41
and
298
-C, U
.S. D
epar
tmen
t of
Tra
nsp
orta
tion.
1 S
um o
f U.S
. Mai
nlin
e an
d R
egio
nal A
ir C
arrie
rs.
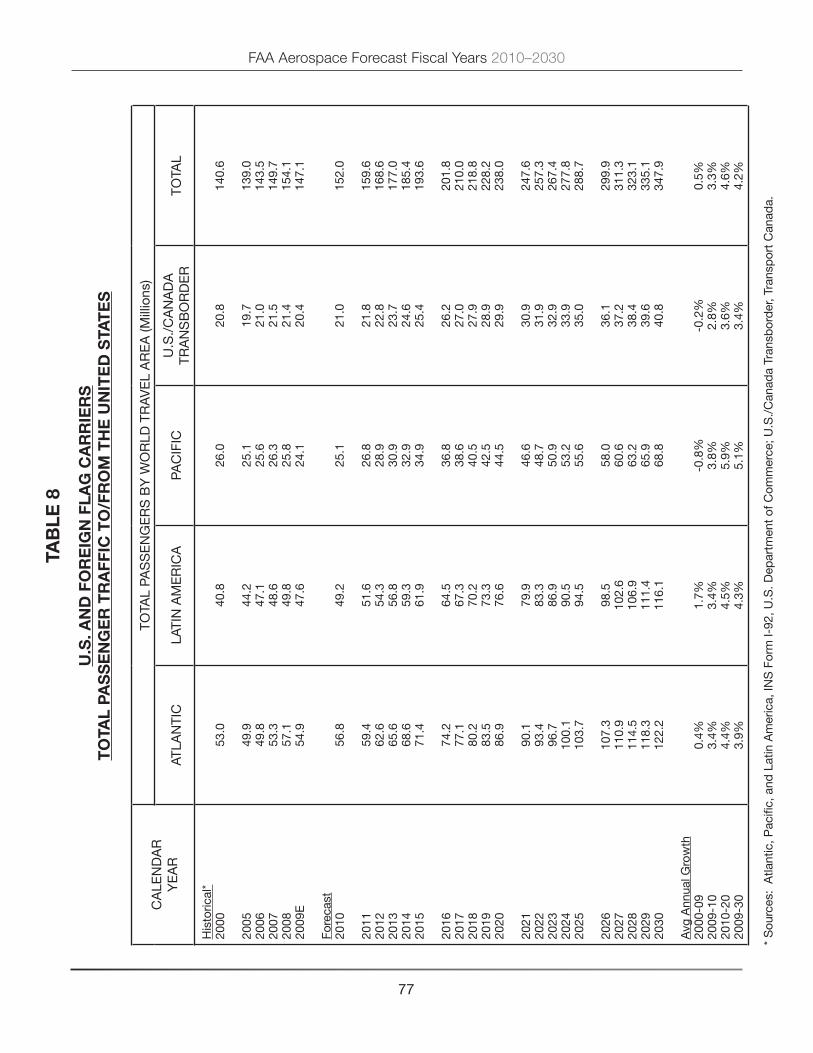
77
FAA Aerospace Forecast Fiscal Years 2010–2030ta
Ble
8
U.s
. aN
d F
or
eig
N F
lag
ca
rr
ier
st
ota
l pa
ss
eN
ge
r t
ra
FFic
to
/Fr
om
tH
e U
Nit
ed
sta
te
s
CA
LEN
DA
Ry
EA
R
TOTA
L PA
SS
EN
GE
RS
By
WO
RLD
TR
Av
EL
AR
EA
(Mill
ions
)
ATLA
NTI
CLA
TIN
AM
ER
ICA
PAC
IFIC
U.S
./C
AN
AD
ATR
AN
SB
OR
DE
RTO
TAL
His
toric
al*
2000
2005
2006
2007
2008
2009
E
Fore
cast
2010
2011
2012
2013
2014
2015
2016
2017
2018
2019
2020
2021
2022
2023
2024
2025
2026
2027
2028
2029
2030
Avg
Ann
ual G
row
th20
00-0
920
09-1
020
10-2
020
09-3
0
53.0
49.9
49.8
53.3
57.1
54.9
56.8
59.4
62.6
65.6
68.6
71.4
74.2
77.1
80.2
83.5
86.9
90.1
93.4
96.7
100.
110
3.7
107.
311
0.9
114.
511
8.3
122.
2
0.4%
3.4%
4.4%
3.9%
40.8
44.2
47.1
48.6
49.8
47.6
49.2
51.6
54.3
56.8
59.3
61.9
64.5
67.3
70.2
73.3
76.6
79.9
83.3
86.9
90.5
94.5
98.5
102.
610
6.9
111.
411
6.1
1.7%
3.4%
4.5%
4.3%
26.0
25.1
25.6
26.3
25.8
24.1
25.1
26.8
28.9
30.9
32.9
34.9
36.8
38.6
40.5
42.5
44.5
46.6
48.7
50.9
53.2
55.6
58.0
60.6
63.2
65.9
68.8
-0.8
%3.
8%5.
9%5.
1%
20.8
19.7
21.0
21.5
21.4
20.4
21.0
21.8
22.8
23.7
24.6
25.4
26.2
27.0
27.9
28.9
29.9
30.9
31.9
32.9
33.9
35.0
36.1
37.2
38.4
39.6
40.8
-0.2
%2.
8%3.
6%3.
4%
140.
6
139.
014
3.5
149.
715
4.1
147.
1
152.
0
159.
616
8.6
177.
018
5.4
193.
6
201.
821
0.0
218.
822
8.2
238.
0
247.
625
7.3
267.
427
7.8
288.
7
299.
931
1.3
323.
133
5.1
347.
9
0.5%
3.3%
4.6%
4.2%
* S
ourc
es:
Atla
ntic
, Pac
ific,
and
Lat
in A
mer
ica,
INS
For
m I-
92, U
.S. D
epar
tmen
t of
Com
mer
ce; U
.S./
Can
ada
Tran
sbor
der
, Tra
nsp
ort
Can
ada.
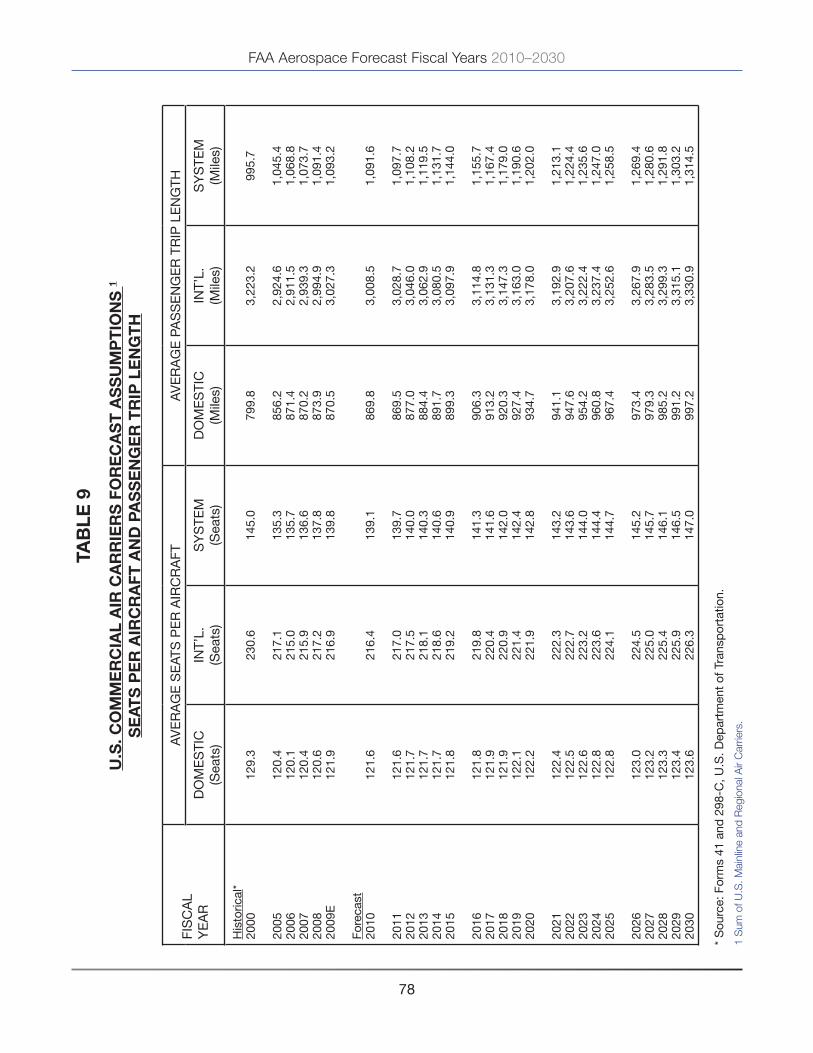
FAA Aerospace Forecast Fiscal Years 2010–2030
78
taB
le 9
U.s
. co
mm
er
cia
l a
ir c
ar
rie
rs
Fo
re
ca
st
as
sU
mp
tio
Ns
1
se
ats
pe
r a
irc
ra
Ft a
Nd
pa
ss
eN
ge
r t
rip
le
Ng
tH
FIS
CA
Ly
EA
R
Av
ER
AG
E S
EAT
S P
ER
AIR
CR
AFT
Av
ER
AG
E P
AS
SE
NG
ER
TR
IP L
EN
GTH
DO
ME
STI
C(S
eats
)IN
T’L.
(Sea
ts)
Sy
STE
M(S
eats
)D
OM
ES
TIC
(Mile
s)IN
T’L.
(Mile
s)S
yS
TEM
(Mile
s)
His
toric
al*
2000
2005
2006
2007
2008
2009
E
Fore
cast
2010
2011
2012
2013
2014
2015
2016
2017
2018
2019
2020
2021
2022
2023
2024
2025
2026
2027
2028
2029
2030
129.
3
120.
412
0.1
120.
412
0.6
121.
9
121.
6
121.
612
1.7
121.
712
1.7
121.
8
121.
812
1.9
121.
912
2.1
122.
2
122.
412
2.5
122.
612
2.8
122.
8
123.
012
3.2
123.
312
3.4
123.
6
230.
6
217.
121
5.0
215.
921
7.2
216.
9
216.
4
217.
021
7.5
218.
121
8.6
219.
2
219.
822
0.4
220.
922
1.4
221.
9
222.
322
2.7
223.
222
3.6
224.
1
224.
522
5.0
225.
422
5.9
226.
3
145.
0
135.
313
5.7
136.
613
7.8
139.
8
139.
1
139.
714
0.0
140.
314
0.6
140.
9
141.
314
1.6
142.
014
2.4
142.
8
143.
214
3.6
144.
014
4.4
144.
7
145.
214
5.7
146.
114
6.5
147.
0
799.
8
856.
287
1.4
870.
287
3.9
870.
5
869.
8
869.
587
7.0
884.
489
1.7
899.
3
906.
391
3.2
920.
392
7.4
934.
7
941.
194
7.6
954.
296
0.8
967.
4
973.
497
9.3
985.
299
1.2
997.
2
3,22
3.2
2,92
4.6
2,91
1.5
2,93
9.3
2,99
4.9
3,02
7.3
3,00
8.5
3,02
8.7
3,04
6.0
3,06
2.9
3,08
0.5
3,09
7.9
3,11
4.8
3,13
1.3
3,14
7.3
3,16
3.0
3,17
8.0
3,19
2.9
3,20
7.6
3,22
2.4
3,23
7.4
3,25
2.6
3,26
7.9
3,28
3.5
3,29
9.3
3,31
5.1
3,33
0.9
995.
7
1,04
5.4
1,06
8.8
1,07
3.7
1,09
1.4
1,09
3.2
1,09
1.6
1,09
7.7
1,10
8.2
1,11
9.5
1,13
1.7
1,14
4.0
1,15
5.7
1,16
7.4
1,17
9.0
1,19
0.6
1,20
2.0
1,21
3.1
1,22
4.4
1,23
5.6
1,24
7.0
1,25
8.5
1,26
9.4
1,28
0.6
1,29
1.8
1,30
3.2
1,31
4.5
* S
ourc
e: F
orm
s 41
and
298
-C, U
.S. D
epar
tmen
t of
Tra
nsp
orta
tion.
1 S
um o
f U.S
. Mai
nlin
e an
d R
egio
nal A
ir C
arrie
rs.

79
FAA Aerospace Forecast Fiscal Years 2010–2030ta
Ble
10
U. s
. ma
iNli
Ne
air
ca
rr
ier
ss
cH
ed
Ule
d p
as
se
Ng
er
tr
aFF
ic
FIS
CA
Ly
EA
RR
Ev
EN
UE
PA
SS
EN
GE
R E
NP
LAN
EM
EN
TS(M
illio
ns)
RE
vE
NU
E P
AS
SE
NG
ER
MIL
ES
(Bill
ions
)
DO
ME
STI
CIN
TER
NAT
ION
AL
Sy
STE
MD
OM
ES
TIC
INTE
RN
ATIO
NA
LS
yS
TEM
His
toric
al*
2000
2005
2006
2007
2008
2009
E
Fore
cast
2010
2011
2012
2013
2014
2015
2016
2017
2018
2019
2020
2021
2022
2023
2024
2025
2026
2027
2028
2029
2030
Avg
Ann
ual G
row
th20
00-0
920
09-1
020
10-2
020
09-3
0
561.
5
523.
151
6.2
533.
952
2.2
477.
6
473.
3
479.
549
5.7
510.
252
2.6
535.
1
547.
656
0.1
573.
758
8.6
605.
1
620.
063
4.6
649.
666
4.8
680.
7
696.
871
2.3
728.
274
4.1
760.
9
-1.8
%-0
.9%
2.5%
2.2%
53.3
64.2
68.1
71.9
74.3
70.2
70.7
73.5
76.8
80.3
83.8
87.4
91.1
94.9
98.8
103.
010
7.5
112.
111
6.7
121.
412
6.3
131.
5
136.
814
2.3
147.
915
3.7
159.
8
3.1%
0.8%
4.3%
4.0%
614.
8
587.
358
4.4
605.
759
6.5
547.
7
544.
0
553.
057
2.5
590.
460
6.4
622.
6
638.
765
5.0
672.
569
1.7
712.
7
732.
075
1.2
771.
179
1.1
812.
2
833.
685
4.6
876.
289
7.8
920.
7
-1.3
%-0
.7%
2.7%
2.5%
490.
0
509.
651
3.9
529.
952
2.0
479.
4
478.
6
485.
850
5.9
524.
654
1.4
558.
6
575.
659
2.8
611.
563
1.8
654.
1
674.
569
4.8
716.
073
7.4
760.
0
782.
680
4.9
827.
885
0.9
875.
4
-0.2
%-0
.2%
3.2%
2.9%
181.
0
195.
820
6.8
219.
523
1.3
218.
8
219.
4
229.
624
1.2
253.
326
6.0
278.
8
292.
030
5.5
319.
733
4.9
351.
1
367.
538
4.2
401.
641
9.6
438.
7
458.
547
8.9
500.
152
2.0
545.
0
2.1%
0.2%
4.8%
4.4%
670.
9
705.
472
0.7
749.
475
3.3
698.
2
697.
9
715.
474
7.1
777.
980
7.4
837.
4
867.
689
8.3
931.
296
6.8
1,00
5.2
1,04
1.9
1,07
9.0
1,11
7.5
1,15
7.0
1,19
8.7
1,24
1.1
1,28
3.8
1,32
7.9
1,37
2.9
1,42
0.4
0.4%
0.0%
3.7%
3.4%
* S
ourc
e: F
orm
41,
U.S
. Dep
artm
ent
of T
rans
por
tatio
n.

FAA Aerospace Forecast Fiscal Years 2010–2030
80
taB
le 1
1
U.s
. ma
iNli
Ne
air
ca
rr
ier
ss
cH
ed
Ule
d p
as
se
Ng
er
ca
pac
itY,
tr
aFF
ic, a
Nd
lo
ad
Fa
ct
or
s
FIS
CA
Ly
EA
R
DO
ME
STI
CIN
TER
NAT
ION
AL
Sy
STE
M
AS
Ms
(BIL
)R
PM
s(B
IL)
% L
OA
DFA
CTO
RA
SM
s(B
IL)
RP
Ms
(BIL
)%
LO
AD
FAC
TOR
AS
Ms
(BIL
)R
PM
s(B
IL)
% L
OA
DFA
CTO
R
His
toric
al*
2000
2005
2006
2007
2008
2009
E
Fore
cast
2010
2011
2012
2013
2014
2015
2016
2017
2018
2019
2020
2021
2022
2023
2024
2025
2026
2027
2028
2029
2030
Avg
Ann
ual G
row
th20
00-0
920
09-1
020
10-2
020
09-3
0
688.
3
665.
164
8.7
659.
065
1.0
589.
4
579.
9
588.
061
0.3
631.
164
9.8
669.
1
688.
470
8.1
729.
675
3.1
779.
0
802.
682
6.3
851.
087
5.9
902.
4
928.
895
4.8
981.
61,
008.
71,
037.
3
-1.7
%-1
.6%
3.0%
2.7%
490.
0
509.
651
3.9
529.
952
2.0
479.
4
478.
6
485.
850
5.9
524.
654
1.4
558.
6
575.
659
2.8
611.
563
1.8
654.
1
674.
569
4.8
716.
073
7.4
760.
0
782.
680
4.9
827.
885
0.9
875.
4
-0.2
%-0
.2%
3.2%
2.9%
71.2
76.6
79.2
80.4
80.2
81.3
82.5
82.6
82.9
83.1
83.3
83.5
83.6
83.7
83.8
83.9
84.0
84.0
84.1
84.1
84.2
84.2
84.3
84.3
84.3
84.4
84.4
238.
0
246.
325
8.9
273.
428
9.3
279.
9
272.
0
284.
929
9.0
314.
032
9.5
345.
3
361.
537
8.0
395.
541
4.2
434.
1
454.
147
4.7
496.
051
8.2
541.
6
565.
959
0.9
616.
964
3.6
671.
9
1.8%
-2.8
%4.
8%4.
3%
181.
0
195.
820
6.8
219.
523
1.3
218.
8
219.
4
229.
624
1.2
253.
326
6.0
278.
8
292.
030
5.5
319.
733
4.9
351.
1
367.
538
4.2
401.
641
9.6
438.
7
458.
547
8.9
500.
152
2.0
545.
0
2.1%
0.2%
4.8%
4.4%
76.0
79.5
79.9
80.3
79.9
78.2
80.6
80.6
80.6
80.7
80.7
80.8
80.8
80.8
80.8
80.9
80.9
80.9
80.9
81.0
81.0
81.0
81.0
81.1
81.1
81.1
81.1
926.
2
911.
490
7.6
932.
494
0.3
869.
2
852.
0
872.
990
9.3
945.
097
9.3
1,01
4.4
1,04
9.9
1,08
6.2
1,12
5.1
1,16
7.3
1,21
3.1
1,25
6.8
1,30
1.0
1,34
7.0
1,39
4.1
1,44
4.0
1,49
4.7
1,54
5.7
1,59
8.5
1,65
2.3
1,70
9.2
-0.7
%-2
.0%
3.6%
3.3%
670.
9
705.
472
0.7
749.
475
3.3
698.
2
697.
9
715.
474
7.1
777.
980
7.4
837.
4
867.
689
8.3
931.
296
6.8
1,00
5.2
1,04
1.9
1,07
9.0
1,11
7.5
1,15
7.0
1,19
8.7
1,24
1.1
1,28
3.8
1,32
7.9
1,37
2.9
1,42
0.4
0.4%
0.0%
3.7%
3.4%
72.4
77.4
79.4
80.4
80.1
80.3
81.9
82.0
82.2
82.3
82.4
82.6
82.6
82.7
82.8
82.8
82.9
82.9
82.9
83.0
83.0
83.0
83.0
83.1
83.1
83.1
83.1
* S
ourc
e: F
orm
41,
U.S
. Dep
artm
ent
of T
rans
por
tatio
n.

81
FAA Aerospace Forecast Fiscal Years 2010–2030ta
Ble
12
U.s
. ma
iNli
Ne
air
ca
rr
ier
ss
cH
ed
Ule
d iN
te
rN
atio
Na
l pa
ss
eN
ge
r e
Np
laN
em
eN
ts
FIS
CA
Ly
EA
RR
Ev
EN
UE
PA
SS
EN
GE
R E
NP
LAN
EM
EN
TS (M
IL)
ATLA
NTI
CLA
TIN
AM
ER
ICA
PAC
IFIC
TOTA
LH
isto
rical
*20
00
2005
2006
2007
2008
2009
E
Fore
cast
2010
2011
2012
2013
2014
2015
2016
2017
2018
2019
2020
2021
2022
2023
2024
2025
2026
2027
2028
2029
2030
Avg
Ann
ual G
row
th20
00-0
920
09-1
020
10-2
020
09-3
0
20.9
21.6
22.5
24.1
26.0
24.7
24.1
25.3
26.3
27.3
28.3
29.3
30.2
31.2
32.3
33.4
34.6
35.8
36.9
38.1
39.4
40.7
42.0
43.3
44.6
46.0
47.5
1.9%
-2.5
%3.
7%3.
1%
21.2
29.3
31.7
34.2
35.1
33.4
34.5
35.7
37.3
39.1
40.9
42.7
44.5
46.4
48.4
50.6
53.0
55.4
57.9
60.4
63.0
65.8
68.6
71.6
74.6
77.6
80.9
5.2%
3.2%
4.4%
4.3%
11.2
13.2
13.9
13.6
13.2
12.0
12.1
12.5
13.2
13.9
14.6
15.5
16.3
17.2
18.1
19.0
19.9
20.9
21.9
22.9
23.9
25.1
26.2
27.5
28.7
30.1
31.4
0.8%
0.7%
5.1%
4.7%
53.3
64.2
68.1
71.9
74.3
70.2
70.7
73.5
76.8
80.3
83.8
87.4
91.1
94.9
98.8
103.
010
7.5
112.
111
6.7
121.
412
6.3
131.
5
136.
814
2.3
147.
915
3.7
159.
8
3.1%
0.8%
4.3%
4.0%
* S
ourc
e: F
orm
41,
U.S
. Dep
artm
ent
of T
rans
por
tatio
n.
Not
e: D
etai
l may
not
add
to to
tal b
ecau
se o
f rou
ndin
g.

FAA Aerospace Forecast Fiscal Years 2010–2030
82
taB
le 1
3
U.s
. ma
iNli
Ne
air
ca
rr
ier
s
sc
He
dU
led
pa
ss
eN
ge
r c
apa
cit
Y, t
ra
FFic
, aN
d l
oa
d F
ac
to
rs
BY
iNt
er
Nat
ioN
al
tr
av
el
re
gio
Ns
FIS
CA
Ly
EA
R
ATLA
NTI
CLA
TIN
AM
ER
ICA
PAC
IFIC
INTE
RN
ATIO
NA
LA
SM
s(B
IL)
RP
Ms
(BIL
)%
LO
AD
FAC
TOR
AS
Ms
(BIL
)R
PM
s(B
IL)
% L
OA
DFA
CTO
RA
SM
s(B
IL)
RP
Ms
(BIL
)%
LO
AD
FAC
TOR
AS
Ms
(BIL
)R
PM
s(B
IL)
% L
OA
DFA
CTO
R
His
toric
al*
2000
2005
2006
2007
2008
2009
E
Fore
cast
2010
2011
2012
2013
2014
2015
2016
2017
2018
2019
2020
2021
2022
2023
2024
2025
2026
2027
2028
2029
2030
Avg
Ann
ual G
row
th20
00-0
920
09-1
020
10-2
020
09-3
0
109.
9
108.
611
5.8
126.
614
1.0
138.
2
130.
6
137.
614
4.1
150.
315
6.5
162.
5
168.
517
4.6
181.
218
8.4
196.
0
203.
321
0.7
218.
322
6.2
234.
5
242.
925
1.4
260.
226
9.1
278.
7
2.6%
-5.5
%4.
1%3.
4%
87.1
89.5
93.9
102.
211
2.7
108.
9
106.
8
112.
411
7.7
122.
912
8.1
133.
0
138.
014
3.1
148.
615
4.6
160.
9
167.
017
3.2
179.
618
6.2
193.
1
200.
220
7.4
214.
722
2.2
230.
2
2.5%
-1.9
%4.
2%3.
6%
79.2
82.4
81.1
80.7
80.0
78.9
81.8
81.7
81.7
81.8
81.8
81.9
81.9
82.0
82.0
82.1
82.1
82.2
82.2
82.3
82.3
82.4
82.4
82.5
82.5
82.6
82.6
51.4
65.4
69.4
72.7
73.4
71.8
73.1
76.2
80.4
85.1
89.9
95.0
100.
210
5.6
111.
311
7.6
124.
5
131.
713
9.1
146.
915
5.0
163.
5
172.
518
1.8
191.
520
1.5
212.
1
3.8%
1.7%
5.5%
5.3%
35.5
47.2
51.9
55.9
58.2
55.2
57.2
59.8
63.1
66.8
70.6
74.6
78.7
83.0
87.5
92.4
97.8
103.
410
9.3
115.
412
1.7
128.
5
135.
514
2.8
150.
415
8.3
166.
7
5.0%
3.6%
5.5%
5.4%
69.0
72.2
74.9
76.9
79.3
76.8
78.2
78.4
78.5
78.5
78.6
78.6
78.6
78.6
78.6
78.6
78.6
78.6
78.6
78.6
78.6
78.6
78.6
78.6
78.6
78.6
78.6
76.6
72.3
73.7
74.1
74.9
69.9
68.3
71.0
74.6
78.6
83.0
87.8
92.8
97.8
103.
010
8.3
113.
7
119.
212
4.9
130.
913
7.1
143.
6
150.
515
7.7
165.
217
3.0
181.
1
-1.0
%-2
.2%
5.2%
4.6%
58.4
59.2
61.1
61.4
60.4
54.7
55.4
57.4
60.3
63.6
67.3
71.2
75.2
79.4
83.6
88.0
92.4
97.0
101.
710
6.6
111.
711
7.1
122.
812
8.7
135.
014
1.4
148.
1
-0.7
%1.
2%5.
3%4.
9%
76.2
81.8
82.8
82.9
80.6
78.3
81.0
80.9
80.9
80.9
81.0
81.0
81.1
81.2
81.2
81.3
81.3
81.3
81.4
81.5
81.5
81.6
81.6
81.7
81.7
81.8
81.8
238.
0
246.
325
8.9
273.
428
9.3
279.
9
272.
0
284.
929
9.0
314.
032
9.5
345.
3
361.
537
8.0
395.
541
4.2
434.
1
454.
147
4.7
496.
051
8.2
541.
6
565.
959
0.9
616.
964
3.6
671.
9
1.8%
-2.8
%4.
8%4.
3%
181.
0
195.
820
6.8
219.
523
1.3
218.
8
219.
4
229.
624
1.2
253.
326
6.0
278.
8
292.
030
5.5
319.
733
4.9
351.
1
367.
538
4.2
401.
641
9.6
438.
7
458.
547
8.9
500.
152
2.0
545.
0
2.1%
0.2%
4.8%
4.4%
76.0
79.5
79.9
80.3
79.9
78.2
80.6
80.6
80.6
80.7
80.7
80.8
80.8
80.8
80.8
80.9
80.9
80.9
80.9
81.0
81.0
81.0
81.0
81.1
81.1
81.1
81.1
* S
ourc
e: F
orm
41,
U.S
. Dep
artm
ent
of T
rans
por
tatio
n.

83
FAA Aerospace Forecast Fiscal Years 2010–2030ta
Ble
14
U.s
. ma
iNli
Ne
air
ca
rr
ier
Fo
re
ca
st
as
sU
mp
tio
Ns
se
ats
pe
r a
irc
ra
Ft m
ile
FIS
CA
Ly
EA
RD
OM
ES
TIC
INTE
RN
ATIO
NA
L
Sy
STE
MAT
LAN
TIC
LATI
N A
ME
RIC
APA
CIF
ICTO
TAL
(Sea
ts)
(Sea
ts)
(Sea
ts)
(Sea
ts)
(Sea
ts)
(Sea
ts)
His
toric
al*
2000
2005
2006
2007
2008
2009
E
Fore
cast
2010
2011
2012
2013
2014
2015
2016
2017
2018
2019
2020
2021
2022
2023
2024
2025
2026
2027
2028
2029
2030
148.
8
150.
415
0.5
150.
615
0.0
151.
4
150.
6
150.
415
0.5
150.
615
0.7
150.
8
150.
915
1.0
151.
015
1.1
151.
1
151.
215
1.2
151.
315
1.4
151.
4
151.
515
1.6
151.
615
1.7
151.
9
233.
7
230.
822
9.4
229.
222
9.2
230.
0
230.
5
231.
023
1.5
232.
023
2.5
233.
0
233.
523
4.0
234.
523
5.0
235.
5
236.
023
6.5
237.
023
7.5
238.
0
238.
523
9.0
239.
524
0.0
240.
5
179.
5
175.
517
5.2
176.
217
7.8
172.
0
172.
5
173.
017
3.5
174.
017
4.5
175.
0
175.
517
6.0
176.
517
7.0
177.
5
178.
017
8.5
179.
017
9.5
180.
0
180.
518
1.0
181.
518
2.0
182.
5
307.
8
278.
727
4.4
279.
628
0.6
285.
4
286.
2
286.
928
7.7
288.
428
9.2
289.
9
290.
729
1.4
292.
229
2.9
293.
7
294.
429
5.2
295.
929
6.7
297.
4
298.
229
8.9
299.
730
0.4
301.
2
236.
6
223.
422
1.4
222.
322
3.4
221.
5
221.
3
221.
922
2.3
222.
822
3.3
223.
8
224.
322
4.8
225.
222
5.6
226.
0
226.
422
6.7
227.
122
7.5
227.
9
228.
322
8.7
229.
122
9.5
229.
9
164.
5
165.
016
5.7
166.
316
6.9
168.
6
167.
7
168.
116
8.4
168.
716
9.2
169.
6
170.
017
0.5
170.
817
1.1
171.
4
171.
917
2.2
172.
517
2.9
173.
2
173.
617
4.0
174.
417
4.8
175.
2
* S
ourc
e: F
orm
41,
U.S
. Dep
artm
ent
of T
rans
por
tatio
n.

FAA Aerospace Forecast Fiscal Years 2010–2030
84
taB
le 1
5
U.s
. ma
iNli
Ne
air
ca
rr
ier
Fo
re
ca
st
as
sU
mp
tio
Ns
av
er
ag
e p
as
se
Ng
er
tr
ip l
eN
gt
H
FIS
CA
Ly
EA
RD
OM
ES
TIC
INTE
RN
ATIO
NA
L
Sy
STE
MAT
LAN
TIC
LATI
N A
ME
RIC
APA
CIF
ICTO
TAL
(Mile
s)(M
iles)
(Mile
s)(M
iles)
(Mile
s)(M
iles)
His
toric
al*
2000
2005
2006
2007
2008
2009
E
Fore
cast
2010
2011
2012
2013
2014
2015
2016
2017
2018
2019
2020
2021
2022
2023
2024
2025
2026
2027
2028
2029
2030
872.
6
974.
199
5.5
992.
799
9.7
1,00
3.8
1,01
1.0
1,01
3.1
1,02
0.7
1,02
8.3
1,03
6.1
1,04
3.8
1,05
1.1
1,05
8.5
1,06
5.9
1,07
3.3
1,08
0.9
1,08
7.9
1,09
5.0
1,10
2.1
1,10
9.2
1,11
6.5
1,12
3.2
1,12
9.9
1,13
6.7
1,14
3.5
1,15
0.4
4,16
8.1
4,13
3.1
4,17
5.4
4,24
7.8
4,33
2.7
4,40
2.4
4,42
7.0
4,44
8.5
4,47
4.9
4,49
9.4
4,52
2.2
4,54
4.1
4,56
4.6
4,58
4.6
4,60
4.6
4,62
5.4
4,64
7.4
4,66
9.3
4,68
9.9
4,71
0.2
4,73
0.6
4,75
1.0
4,77
1.7
4,79
2.1
4,81
2.1
4,83
2.1
4,85
2.1
1,67
5.2
1,61
1.1
1,63
7.0
1,63
4.3
1,65
4.8
1,65
2.3
1,65
8.7
1,67
3.9
1,68
9.5
1,70
8.1
1,72
7.8
1,74
7.7
1,76
7.3
1,78
6.7
1,80
6.0
1,82
5.6
1,84
6.0
1,86
7.4
1,88
8.9
1,91
0.1
1,93
1.4
1,95
2.6
1,97
4.2
1,99
5.9
2,01
7.5
2,03
9.1
2,06
0.6
5,21
9.9
4,46
6.1
4,39
0.4
4,51
5.1
4,58
3.5
4,55
0.0
4,57
1.7
4,57
9.0
4,58
5.9
4,59
2.2
4,59
8.0
4,60
3.7
4,60
9.6
4,61
5.8
4,62
2.3
4,62
9.1
4,63
6.1
4,64
3.3
4,65
0.6
4,65
8.0
4,66
5.4
4,67
2.8
4,68
0.2
4,68
7.6
4,69
5.0
4,70
2.5
4,71
0.1
3,39
7.3
3,05
1.2
3,03
7.0
3,05
4.2
3,11
1.0
3,11
8.8
3,10
2.5
3,12
2.8
3,13
9.6
3,15
5.8
3,17
2.7
3,18
9.1
3,20
5.1
3,22
0.7
3,23
5.9
3,25
0.8
3,26
5.2
3,27
9.3
3,29
3.2
3,30
7.2
3,32
1.6
3,33
6.1
3,35
0.8
3,36
5.7
3,38
0.7
3,39
5.9
3,41
1.1
1,09
1.4
1,20
1.1
1,23
3.4
1,23
7.3
1,26
2.8
1,27
4.7
1,28
2.9
1,29
3.6
1,30
5.0
1,31
7.5
1,33
1.4
1,34
5.1
1,35
8.4
1,37
1.6
1,38
4.7
1,39
7.7
1,41
0.5
1,42
3.4
1,43
6.3
1,44
9.4
1,46
2.5
1,47
5.8
1,48
8.9
1,50
2.2
1,51
5.6
1,52
9.1
1,54
2.7
* S
ourc
e: F
orm
41,
U.S
. Dep
artm
ent
of T
rans
por
tatio
n.

85
FAA Aerospace Forecast Fiscal Years 2010–2030ta
Ble
16
U.s
. ma
iNli
Ne
air
ca
rr
ier
Fo
re
ca
st
as
sU
mp
tio
Ns
pas
se
Ng
er
Yie
lds
FIS
CA
Ly
EA
R
RE
vE
NU
E P
ER
PA
SS
EN
GE
R M
ILE
DO
ME
STI
CIN
TER
NAT
ION
AL
Sy
STE
M
CU
RR
EN
T $
(Cen
ts)
Fy 2
009
$(C
ents
)C
UR
RE
NT
$(C
ents
)Fy
200
9 $
(Cen
ts)
CU
RR
EN
T $
(Cen
ts)
Fy 2
009
$(C
ents
)
His
toric
al*
2000
2005
2006
2007
2008
2009
E
Fore
cast
2010
2011
2012
2013
2014
2015
2016
2017
2018
2019
2020
2021
2022
2023
2024
2025
2026
2027
2028
2029
2030
Avg
Ann
ual G
row
th20
00-0
920
09-1
020
10-2
020
09-3
0
14.0
3
11.4
512
.36
12.4
513
.09
11.9
6
12.3
2
12.6
912
.81
12.8
912
.98
13.0
7
13.1
813
.29
13.4
013
.50
13.5
8
13.6
713
.76
13.8
613
.97
14.0
8
14.2
114
.35
14.4
814
.63
14.7
8
-1.8
%3.
0%1.
0%1.
0%
17.5
6
12.6
513
.17
12.9
613
.05
11.9
6
12.1
5
12.2
712
.13
11.9
911
.84
11.7
0
11.5
711
.44
11.3
111
.19
11.0
6
10.9
510
.83
10.7
210
.61
10.5
0
10.4
010
.30
10.2
010
.10
10.0
1
-4.2
%1.
6%-0
.9%
-0.8
%
10.4
6
10.8
711
.63
12.4
513
.42
11.6
9
12.2
2
13.0
413
.19
13.3
013
.42
13.5
5
13.6
813
.80
13.9
314
.05
14.1
6
14.2
614
.37
14.4
714
.60
14.7
3
14.8
614
.99
15.1
315
.28
15.4
3
1.2%
4.6%
1.5%
1.3%
13.0
9
12.0
112
.40
12.9
713
.38
11.6
9
12.0
5
12.6
212
.49
12.3
712
.24
12.1
2
12.0
011
.88
11.7
611
.65
11.5
3
11.4
211
.31
11.2
011
.09
10.9
8
10.8
710
.76
10.6
610
.55
10.4
5
-1.3
%3.
1%-0
.4%
-0.5
%
13.0
6
11.2
912
.15
12.4
513
.19
11.8
8
12.2
9
12.8
012
.93
13.0
313
.13
13.2
3
13.3
513
.47
13.5
813
.69
13.7
8
13.8
813
.98
14.0
814
.20
14.3
2
14.4
514
.59
14.7
314
.87
15.0
3
-1.1
%3.
5%1.
1%1.
1%
16.3
6
12.4
712
.95
12.9
613
.15
11.8
8
12.1
2
12.3
812
.25
12.1
111
.97
11.8
4
11.7
211
.59
11.4
711
.35
11.2
3
11.1
111
.00
10.8
910
.78
10.6
8
10.5
710
.47
10.3
710
.28
10.1
8
-3.5
%2.
1%-0
.8%
-0.7
%
* S
ourc
e: F
orm
41,
U.S
. Dep
artm
ent
of T
rans
por
tatio
n.

FAA Aerospace Forecast Fiscal Years 2010–2030
86
taB
le 1
7
U.s
. ma
iNli
Ne
air
ca
rr
ier
Fo
re
ca
st
as
sU
mp
tio
Ns
iNt
er
Nat
ioN
al
pas
se
Ng
er
Yie
lds
BY
re
gio
N
FIS
CA
Ly
EA
R
RE
vE
NU
E P
ER
PA
SS
EN
GE
R M
ILE
ATLA
NTI
CLA
TIN
AM
ER
ICA
1PA
CIF
ICTO
TAL
INTE
RN
ATIO
NA
L
CU
RR
EN
T $
Fy 2
009
$C
UR
RE
NT
$Fy
200
9 $
CU
RR
EN
T $
Fy 2
009
$C
UR
RE
NT
$Fy
200
9 $
(Cen
ts)
(Cen
ts)
(Cen
ts)
(Cen
ts)
(Cen
ts)
(Cen
ts)
(Cen
ts)
(Cen
ts)
His
toric
al*
2000
2005
2006
2007
2008
2009
E
Fore
cast
2010
2011
2012
2013
2014
2015
2016
2017
2018
2019
2020
2021
2022
2023
2024
2025
2026
2027
2028
2029
2030
Avg
Ann
ual G
row
th20
00-0
920
09-1
020
10-2
020
09-3
0
9.73
10.7
511
.64
12.4
613
.29
11.2
5
12.1
0
12.9
513
.10
13.2
113
.33
13.4
5
13.5
813
.70
13.8
313
.95
14.0
5
14.1
514
.25
14.3
614
.47
14.6
0
14.7
314
.86
14.9
915
.14
15.2
9
1.6%
7.6%
1.5%
1.5%
12.1
8
11.8
812
.40
12.9
713
.25
11.2
5
11.9
3
12.5
312
.40
12.2
812
.16
12.0
4
11.9
211
.80
11.6
811
.56
11.4
5
11.3
311
.22
11.1
111
.00
10.8
9
10.7
810
.67
10.5
610
.46
10.3
5
-0.9
%6.
1%-0
.4%
-0.4
%
13.0
0
12.1
612
.68
13.3
714
.19
13.0
5
13.3
5
14.0
314
.19
14.3
114
.44
14.5
7
14.7
114
.85
14.9
815
.11
15.2
2
15.3
315
.44
15.5
515
.68
15.8
2
15.9
516
.10
16.2
416
.40
16.5
6
0.0%
2.3%
1.3%
1.1%
16.2
8
13.4
413
.52
13.9
214
.15
13.0
5
13.1
7
13.5
713
.44
13.3
013
.17
13.0
4
12.9
112
.78
12.6
512
.53
12.4
0
12.2
812
.15
12.0
311
.91
11.7
9
11.6
711
.56
11.4
411
.33
11.2
1
-2.4
%0.
9%-0
.6%
-0.7
%
9.99
10.0
410
.73
11.6
112
.73
11.2
0
11.3
0
12.1
812
.32
12.4
312
.54
12.6
5
12.7
712
.89
13.0
113
.12
13.2
2
13.3
113
.41
13.5
113
.62
13.7
4
13.8
513
.98
14.1
014
.24
14.3
8
1.3%
0.9%
1.6%
1.2%
12.5
1
11.0
911
.43
12.0
912
.69
11.2
0
11.1
4
11.7
911
.67
11.5
511
.44
11.3
2
11.2
111
.10
10.9
910
.88
10.7
7
10.6
610
.55
10.4
510
.34
10.2
4
10.1
410
.04
9.94
9.84
9.74
-1.2
%-0
.5%
-0.3
%-0
.7%
10.4
6
10.8
711
.63
12.4
513
.42
11.6
9
12.2
2
13.0
413
.19
13.3
013
.42
13.5
5
13.6
813
.80
13.9
314
.05
14.1
6
14.2
614
.37
14.4
714
.60
14.7
3
14.8
614
.99
15.1
315
.28
15.4
3
1.2%
4.6%
1.5%
1.3%
13.0
9
12.0
112
.40
12.9
713
.38
11.6
9
12.0
5
12.6
212
.49
12.3
712
.24
12.1
2
12.0
011
.88
11.7
611
.65
11.5
3
11.4
211
.31
11.2
011
.09
10.9
8
10.8
710
.76
10.6
610
.55
10.4
5
-1.3
%3.
1%-0
.4%
-0.5
%
1 M
ainl
ine
Air
Car
rier
Onl
y
* S
ourc
e: F
orm
41,
U.S
. Dep
artm
ent
of T
rans
por
tatio
n.

87
FAA Aerospace Forecast Fiscal Years 2010–2030ta
Ble
18
U.s
. ma
iNli
Ne
air
ca
rr
ier
Fo
re
ca
st
as
sU
mp
tio
Ns
Jet
FU
el
pr
ice
s
FIS
CA
Ly
EA
R
DO
ME
STI
CIN
TER
NAT
ION
AL
Sy
STE
M
CU
RR
EN
T $
Fy 2
009
$C
UR
RE
NT
$Fy
200
9 $
CU
RR
EN
T $
Fy
200
9 $
(Cen
ts)
(C
ents
)(C
ents
)
(Cen
ts)
(Cen
ts)
(Cen
ts)
His
toric
al*
2000
2005
2006
2007
2008
2009
E
Fore
cast
2010
2011
2012
2013
2014
2015
2016
2017
2018
2019
2020
2021
2022
2023
2024
2025
2026
2027
2028
2029
2030
Avg
Ann
ual G
row
th20
00-0
920
09-1
020
10-2
020
09-3
0
71.4
9
149.
3919
4.69
194.
1729
2.56
202.
31
212.
19
225.
9024
7.43
261.
4227
2.36
283.
88
296.
3030
4.66
310.
8131
1.31
306.
96
300.
8129
6.35
292.
4429
5.10
301.
17
307.
5731
3.89
322.
3733
2.00
341.
73
12.3
%4.
9%3.
8%2.
5%
89.5
1
165.
0620
7.46
202.
1929
1.69
202.
31
209.
28
218.
5923
4.32
243.
0424
8.42
254.
07
260.
0226
2.24
262.
4625
8.06
250.
09
240.
9023
3.27
226.
2422
4.17
224.
55
225.
0722
5.36
227.
1122
9.36
231.
40
9.5%
3.4%
1.8%
0.6%
79.3
5
157.
2620
4.69
203.
3131
4.57
208.
41
228.
15
242.
9026
6.05
281.
0929
2.85
305.
24
318.
5932
7.58
334.
2033
4.74
330.
05
323.
4431
8.65
314.
4531
7.30
323.
82
330.
7133
7.50
346.
6335
6.97
367.
44
11.3
%9.
5%3.
8%2.
7%
99.3
5
173.
7621
8.12
211.
7031
3.64
208.
41
225.
02
235.
0425
1.95
261.
3326
7.11
273.
19
279.
5828
1.97
282.
2127
7.47
268.
90
259.
0225
0.81
243.
2624
1.04
241.
44
242.
0124
2.32
244.
2024
6.61
248.
81
8.6%
8.0%
1.8%
0.8%
73.5
7
151.
5819
7.72
197.
0029
9.67
204.
44
217.
35
231.
3925
3.45
267.
7827
8.98
290.
78
303.
5031
2.06
318.
3731
8.88
314.
42
308.
1230
3.55
299.
5530
2.27
308.
49
315.
0432
1.51
330.
2134
0.06
350.
03
12.0
%6.
3%3.
8%2.
6%
92.1
1
167.
4821
0.70
205.
1329
8.78
204.
44
214.
36
223.
9124
0.02
248.
9525
4.46
260.
25
266.
3426
8.61
268.
8426
4.33
256.
17
246.
7523
8.93
231.
7422
9.62
230.
01
230.
5423
0.84
232.
6323
4.93
237.
02
9.3%
4.9%
1.8%
0.7%
* S
ourc
e: F
orm
41,
U.S
. Dep
artm
ent
of T
rans
por
tatio
n.
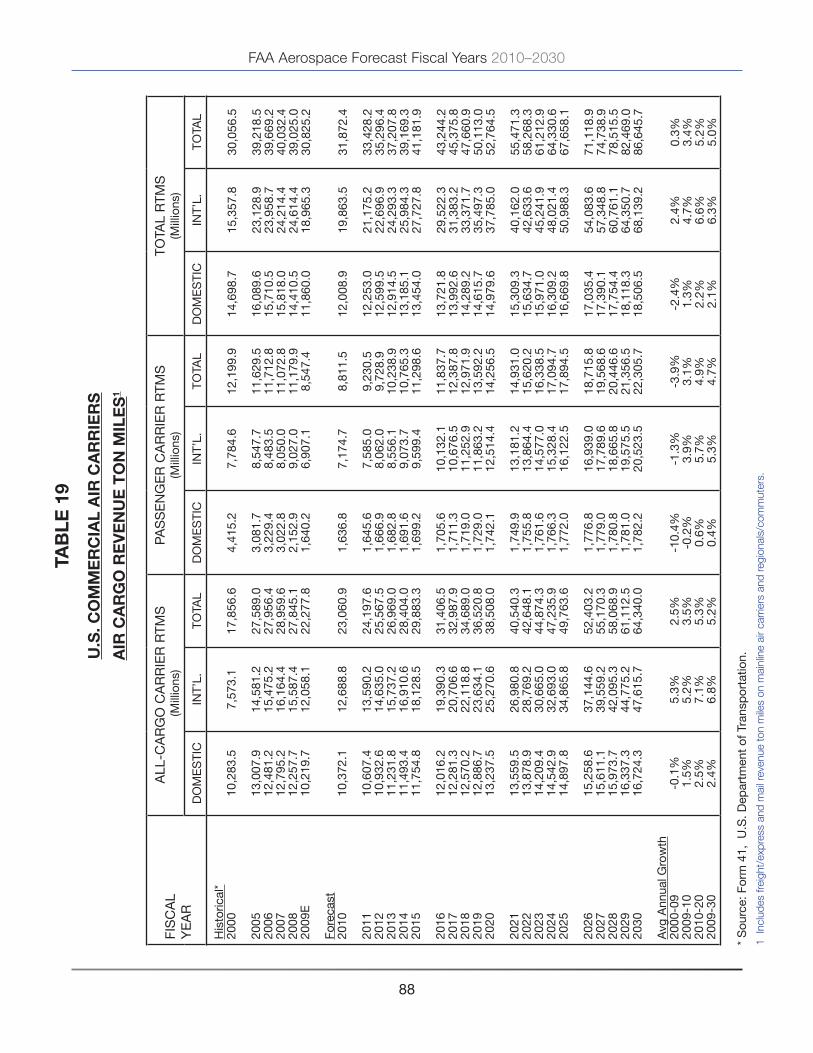
FAA Aerospace Forecast Fiscal Years 2010–2030
88
taB
le 1
9
U.s
. co
mm
er
cia
l a
ir c
ar
rie
rs
air
ca
rg
o r
ev
eN
Ue
to
N m
ile
s1
FIS
CA
Ly
EA
R
ALL
-CA
RG
O C
AR
RIE
R R
TMS
(M
illio
ns)
PAS
SE
NG
ER
CA
RR
IER
RTM
S(M
illio
ns)
TOTA
L R
TMS
(Mill
ions
)
DO
ME
STI
CIN
T’L.
TOTA
LD
OM
ES
TIC
INT’
L.TO
TAL
DO
ME
STI
CIN
T’L.
TOTA
L
His
toric
al*
2000
2005
2006
2007
2008
2009
E
Fore
cast
2010
2011
2012
2013
2014
2015
2016
2017
2018
2019
2020
2021
2022
2023
2024
2025
2026
2027
2028
2029
2030
Avg
Ann
ual G
row
th20
00-0
920
09-1
020
10-2
020
09-3
0
10,2
83.5
13,0
07.9
12,4
81.2
12,7
95.2
12,2
57.7
10,2
19.7
10,3
72.1
10,6
07.4
10,9
32.6
11,2
31.8
11,4
93.4
11,7
54.8
12,0
16.2
12,2
81.3
12,5
70.2
12,8
86.7
13,2
37.5
13,5
59.5
13,8
78.9
14,2
09.4
14,5
42.9
14,8
97.8
15,2
58.6
15,6
11.1
15,9
73.7
16,3
37.3
16,7
24.3
-0.1
%1.
5%2.
5%2.
4%
7,57
3.1
14,5
81.2
15,4
75.2
16,1
64.4
15,5
87.4
12,0
58.1
12,6
88.8
13,5
90.2
14,6
35.0
15,7
37.2
16,9
10.6
18,1
28.5
19,3
90.3
20,7
06.6
22,1
18.8
23,6
34.1
25,2
70.6
26,9
80.8
28,7
69.2
30,6
65.0
32,6
93.0
34,8
65.8
37,1
44.6
39,5
59.2
42,0
95.3
44,7
75.2
47,6
15.7
5.3%
5.2%
7.1%
6.8%
17,8
56.6
27,5
89.0
27,9
56.4
28,9
59.6
27,8
45.1
22,2
77.8
23,0
60.9
24,1
97.6
25,5
67.5
26,9
69.0
28,4
04.0
29,8
83.3
31,4
06.5
32,9
87.9
34,6
89.0
36,5
20.8
38,5
08.0
40,5
40.3
42,6
48.1
44,8
74.3
47,2
35.9
49,7
63.6
52,4
03.2
55,1
70.3
58,0
68.9
61,1
12.5
64,3
40.0
2.5%
3.5%
5.3%
5.2%
4,41
5.2
3,08
1.7
3,22
9.4
3,02
2.8
2,15
2.9
1,64
0.2
1,63
6.8
1,64
5.6
1,66
6.9
1,68
2.8
1,69
1.6
1,69
9.2
1,70
5.6
1,71
1.3
1,71
9.0
1,72
9.0
1,74
2.1
1,74
9.9
1,75
5.8
1,76
1.6
1,76
6.3
1,77
2.0
1,77
6.8
1,77
9.0
1,78
0.8
1,78
1.0
1,78
2.2
-10.
4%-0
.2%
0.6%
0.4%
7,78
4.6
8,54
7.7
8,48
3.5
8,05
0.0
9,02
7.0
6,90
7.1
7,17
4.7
7,58
5.0
8,06
2.0
8,55
6.1
9,07
3.7
9,59
9.4
10,1
32.1
10,6
76.5
11,2
52.9
11,8
63.2
12,5
14.4
13,1
81.2
13,8
64.4
14,5
77.0
15,3
28.4
16,1
22.5
16,9
39.0
17,7
89.6
18,6
65.8
19,5
75.5
20,5
23.5
-1.3
%3.
9%5.
7%5.
3%
12,1
99.9
11,6
29.5
11,7
12.8
11,0
72.8
11,1
79.9
8,54
7.4
8,81
1.5
9,23
0.5
9,72
8.9
10,2
38.9
10,7
65.3
11,2
98.6
11,8
37.7
12,3
87.8
12,9
71.9
13,5
92.2
14,2
56.5
14,9
31.0
15,6
20.2
16,3
38.5
17,0
94.7
17,8
94.5
18,7
15.8
19,5
68.6
20,4
46.6
21,3
56.5
22,3
05.7
-3.9
%3.
1%4.
9%4.
7%
14,6
98.7
16,0
89.6
15,7
10.5
15,8
18.0
14,4
10.5
11,8
60.0
12,0
08.9
12,2
53.0
12,5
99.5
12,9
14.5
13,1
85.1
13,4
54.0
13,7
21.8
13,9
92.6
14,2
89.2
14,6
15.7
14,9
79.6
15,3
09.3
15,6
34.7
15,9
71.0
16,3
09.2
16,6
69.8
17,0
35.4
17,3
90.1
17,7
54.4
18,1
18.3
18,5
06.5
-2.4
%1.
3%2.
2%2.
1%
15,3
57.8
23,1
28.9
23,9
58.7
24,2
14.4
24,6
14.4
18,9
65.3
19,8
63.5
21,1
75.2
22,6
96.9
24,2
93.3
25,9
84.3
27,7
27.8
29,5
22.3
31,3
83.2
33,3
71.7
35,4
97.3
37,7
85.0
40,1
62.0
42,6
33.6
45,2
41.9
48,0
21.4
50,9
88.3
54,0
83.6
57,3
48.8
60,7
61.1
64,3
50.7
68,1
39.2
2.4%
4.7%
6.6%
6.3%
30,0
56.5
39,2
18.5
39,6
69.2
40,0
32.4
39,0
25.0
30,8
25.2
31,8
72.4
33,4
28.2
35,2
96.4
37,2
07.8
39,1
69.3
41,1
81.9
43,2
44.2
45,3
75.8
47,6
60.9
50,1
13.0
52,7
64.5
55,4
71.3
58,2
68.3
61,2
12.9
64,3
30.6
67,6
58.1
71,1
18.9
74,7
38.9
78,5
15.5
82,4
69.0
86,6
45.7
0.3%
3.4%
5.2%
5.0%
* S
ourc
e: F
orm
41,
U.S
. Dep
artm
ent
of T
rans
por
tatio
n.
1 In
clud
es fr
eigh
t/ex
pres
s an
d m
ail r
even
ue to
n m
iles
on m
ainl
ine
air
carr
iers
and
regi
onal
s/co
mm
uter
s.

89
FAA Aerospace Forecast Fiscal Years 2010–2030ta
Ble
20
U.s
. ma
iNli
Ne
air
ca
rr
ier
s
pas
se
Ng
er
Je
t a
irc
ra
Ft
CA
LEN
DA
Ry
EA
R
LAR
GE
NA
RR
OW
BO
Dy
LAR
GE
WID
EB
OD
yLA
RG
EJE
TSR
EG
ION
AL
JETS
TOTA
LJE
TS2
EN
GIN
E3
EN
GIN
E4
EN
GIN
ETO
TAL
2 E
NG
INE
3 E
NG
INE
4 E
NG
INE
TOTA
L
His
toric
al20
00
2005
2006
2007
2008
2009
E
Fore
cast
2010
2011
2012
2013
2014
2015
2016
2017
2018
2019
2020
2021
2022
2023
2024
2025
2026
2027
2028
2029
2030
Avg
Ann
ual G
row
th20
00-0
920
09-1
020
10-2
020
09-3
0
3,36
4
3,30
83,
302
3,35
43,
170
3,04
0
3,00
3
3,02
23,
075
3,16
03,
186
3,25
9
3,31
03,
372
3,45
73,
537
3,58
0
3,58
93,
670
3,70
63,
798
3,82
2
3,85
83,
914
3,97
24,
034
4,09
3
-1.1
%-1
.2%
1.8%
1.4%
385
37 26 29 10 9 9 8 7 6 5 4 4 3 1 1 0 0 0 0 0 0 0 0 0 0 0
-34.
1%0.
0%-1
00.0
%-1
00.0
%
0 0 0 0 1 1 1 1 1 1 0 0 0 0 0 0 0 0 0 0 0 0 0 0 0 0 0 NA
0.0%
-100
.0%
-100
.0%
3,74
9
3,34
53,
328
3,38
33,
181
3,05
0
3,01
3
3,03
13,
083
3,16
73,
191
3,26
3
3,31
43,
375
3,45
83,
538
3,58
0
3,58
93,
670
3,70
63,
798
3,82
2
3,85
83,
914
3,97
24,
034
4,09
3
-2.3
%-1
.2%
1.7%
1.4%
424
466
463
477
470
466
477
484
490
517
533
564
578
604
622
648
676
705
745
773
804
840
873
912
945
990
1,02
6
1.1%
2.4%
3.5%
3.8%
169
29 19 12 9 10 10 10 10 8 6 4 2 0 0 0 0 0 0 0 0 0 0 0 0 0 0
-27.
0%0.
0%-1
00.0
%-1
00.0
%
120
54 49 47 44 40 40 40 40 40 40 38 28 18 8 6 4 2 0 0 0 0 0 0 0 0 0
-11.
5%0.
0%-2
0.6%
-20.
6%
713
549
531
536
523
516
527
534
540
565
579
606
608
622
630
654
680
707
745
773
804
840
873
912
945
990
1,02
6
-3.5
%2.
1%2.
6%3.
3%
4,46
2
3,89
43,
859
3,91
93,
704
3,56
6
3,54
0
3,56
53,
623
3,73
23,
770
3,86
9
3,92
23,
997
4,08
84,
192
4,26
0
4,29
64,
415
4,47
94,
602
4,66
2
4,73
14,
826
4,91
75,
024
5,11
9
-2.5
%-0
.7%
1.9%
1.7%
26 12 39 64 91 100
109
124
134
146
166
182
192
196
201
206
198
198
203
203
208
208
213
213
218
218
223
16.1
%9.
0%6.
2%3.
9%
4,48
8
3,90
63,
898
3,98
33,
795
3,66
6
3,64
9
3,68
93,
757
3,87
83,
936
4,05
1
4,11
44,
193
4,28
94,
398
4,45
8
4,49
44,
618
4,68
24,
810
4,87
0
4,94
45,
039
5,13
55,
242
5,34
2
-2.2
%-0
.5%
2.0%
1.8%
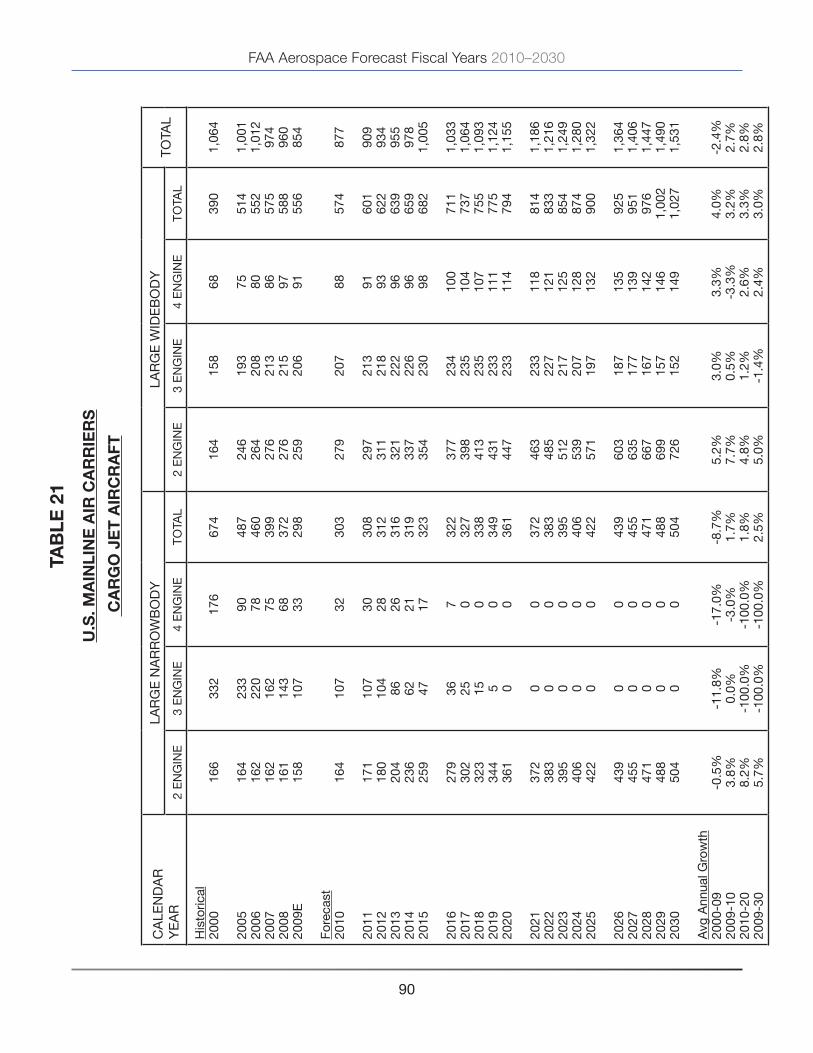
FAA Aerospace Forecast Fiscal Years 2010–2030
90
taB
le 2
1
U.s
. ma
iNli
Ne
air
ca
rr
ier
s
ca
rg
o J
et
air
cr
aFt
CA
LEN
DA
Ry
EA
RLA
RG
E N
AR
RO
WB
OD
yLA
RG
E W
IDE
BO
Dy
TOTA
L2
EN
GIN
E3
EN
GIN
E4
EN
GIN
ETO
TAL
2 E
NG
INE
3 E
NG
INE
4 E
NG
INE
TOTA
L
His
toric
al20
00
2005
2006
2007
2008
2009
E
Fore
cast
2010
2011
2012
2013
2014
2015
2016
2017
2018
2019
2020
2021
2022
2023
2024
2025
2026
2027
2028
2029
2030
Avg
Ann
ual G
row
th20
00-0
920
09-1
020
10-2
020
09-3
0
166
164
162
162
161
158
164
171
180
204
236
259
279
302
323
344
361
372
383
395
406
422
439
455
471
488
504
-0.5
%3.
8%8.
2%5.
7%
332
233
220
162
143
107
107
107
104
86 62 47 36 25 15 5 0 0 0 0 0 0 0 0 0 0 0
-11.
8%0.
0%-1
00.0
%-1
00.0
%
176
90 78 75 68 33 32 30 28 26 21 17 7 0 0 0 0 0 0 0 0 0 0 0 0 0 0
-17.
0%-3
.0%
-100
.0%
-100
.0%
674
487
460
399
372
298
303
308
312
316
319
323
322
327
338
349
361
372
383
395
406
422
439
455
471
488
504
-8.7
%1.
7%1.
8%2.
5%
164
246
264
276
276
259
279
297
311
321
337
354
377
398
413
431
447
463
485
512
539
571
603
635
667
699
726
5.2%
7.7%
4.8%
5.0%
158
193
208
213
215
206
207
213
218
222
226
230
234
235
235
233
233
233
227
217
207
197
187
177
167
157
152
3.0%
0.5%
1.2%
-1.4
%
68 75 80 86 97 91 88 91 93 96 96 98 100
104
107
111
114
118
121
125
128
132
135
139
142
146
149
3.3%
-3.3
%2.
6%2.
4%
390
514
552
575
588
556
574
601
622
639
659
682
711
737
755
775
794
814
833
854
874
900
925
951
976
1,00
21,
027
4.0%
3.2%
3.3%
3.0%
1,06
4
1,00
11,
012
974
960
854
877
909
934
955
978
1,00
5
1,03
31,
064
1,09
31,
124
1,15
5
1,18
61,
216
1,24
91,
280
1,32
2
1,36
41,
406
1,44
71,
490
1,53
1
-2.4
%2.
7%2.
8%2.
8%

91
FAA Aerospace Forecast Fiscal Years 2010–2030ta
Ble
22
to
tal
Jet
FU
el
aN
d a
via
tio
N g
as
oli
Ne
FU
el
co
Ns
Um
pt
ioN
U.s
. civ
il a
via
tio
N a
irc
ra
Ft(M
illio
ns o
f Gal
lons
)
FIS
CA
Ly
EA
R
JET
FUE
LA
vIA
TIO
N G
AS
OLI
NE
TOTA
LFU
EL
CO
NS
UM
ED
U.S
. AIR
CA
RR
IER
S1
GE
NE
RA
LA
vIA
TIO
NTO
TAL
AIR
CA
RR
IER
GE
NE
RA
LA
vIA
TIO
NTO
TAL
DO
ME
STI
CIN
T’L.
TOTA
L
His
toric
al*
2000
2005
2006
2007
2008
2009
E
Fore
cast
2010
2011
2012
2013
2014
2015
2016
2017
2018
2019
2020
2021
2022
2023
2024
2025
2026
2027
2028
2029
2030
Avg
Ann
ual G
row
th20
00-0
920
09-1
020
10-2
020
09-3
0
14,7
46
13,9
7813
,461
13,5
3813
,179
11,4
78
11,1
82
11,1
8911
,462
11,7
0511
,904
12,1
04
12,2
9112
,480
12,6
9312
,931
13,2
02
13,4
2513
,639
13,8
6114
,081
14,3
18
14,5
4014
,748
14,9
6015
,168
15,3
92
-2.7
%-2
.6%
1.7%
1.4%
5,29
7
5,37
85,
851
6,04
56,
289
5,76
7
5,52
5
5,70
05,
895
6,09
76,
303
6,50
7
6,71
16,
914
7,12
57,
352
7,59
0
7,82
38,
055
8,29
28,
533
8,78
6
9,04
59,
304
9,56
99,
836
10,1
15
0.9%
-4.2
%3.
2%2.
7%
20,0
43
19,3
5619
,313
19,5
8319
,468
17,2
44
16,7
07
16,8
8917
,357
17,8
0218
,207
18,6
11
19,0
0219
,394
19,8
1820
,283
20,7
92
21,2
4721
,694
22,1
5322
,615
23,1
04
23,5
8524
,053
24,5
2925
,004
25,5
07
-1.7
%-3
.1%
2.2%
1.9%
972
1,52
71,
643
1,48
61,
706
1,36
4
1,35
6
1,56
71,
807
2,04
62,
120
2,19
5
2,27
02,
342
2,40
72,
476
2,54
8
2,62
12,
693
2,77
02,
849
2,92
8
3,00
83,
090
3,17
43,
263
3,35
4
3.8%
-0.6
%6.
5%4.
4%
21,0
15
20,8
8320
,955
21,0
6921
,174
18,6
09
18,0
63
18,4
5619
,164
19,8
4820
,327
20,8
06
21,2
7221
,736
22,2
2522
,759
23,3
41
23,8
6824
,387
24,9
2325
,464
26,0
32
26,5
9227
,143
27,7
0328
,268
28,8
61
-1.3
%-2
.9%
2.6%
2.1%
2 2 2 2 2 2 2 2 2 2 2 2 2 2 2 2 2 2 2 2 2 2 2 2 2 2 2
0.0%
0.0%
0.0%
0.0%
333
295
283
274
248
225
220
233
235
235
233
232
231
231
232
233
235
237
238
240
244
248
252
256
261
265
269
-4.2
%-2
.3%
0.6%
0.8%
335
297
285
276
250
227
222
235
237
237
235
234
233
233
234
235
237
239
240
242
246
250
254
258
263
267
271
-4.2
%-2
.2%
0.6%
0.8%
21,3
50
21,1
8021
,241
21,3
4421
,424
18,8
36
18,2
86
18,6
9119
,401
20,0
8620
,562
21,0
40
21,5
0421
,969
22,4
5822
,994
23,5
78
24,1
0724
,627
25,1
6625
,709
26,2
82
26,8
4627
,401
27,9
6528
,535
29,1
32
-1.4
%-2
.9%
2.6%
2.1%
* S
ourc
e: A
ir ca
rrie
r je
t fu
el, F
orm
41,
U.S
. Dep
artm
ent
of T
rans
por
tatio
n; a
ll ot
hers
, FA
A A
PO
est
imat
es.
1 In
clud
es b
oth
pass
enge
r (m
ainl
ine
and
regi
onal
air
carr
ier)
and
carg
o ca
rrie
rs.
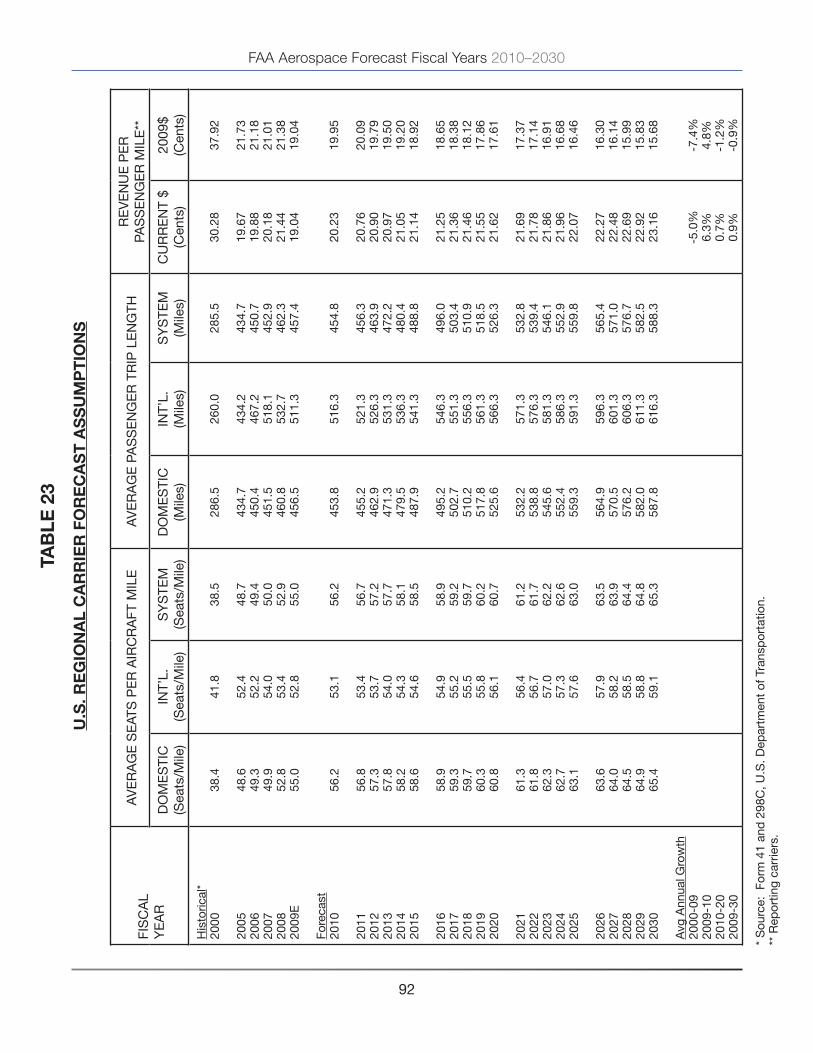
FAA Aerospace Forecast Fiscal Years 2010–2030
92
taB
le 2
3
U.s
. re
gio
Na
l c
ar
rie
r F
or
ec
as
t a
ss
Um
pt
ioN
s
FIS
CA
Ly
EA
R
Av
ER
AG
E S
EAT
S P
ER
AIR
CR
AFT
MIL
EA
vE
RA
GE
PA
SS
EN
GE
R T
RIP
LE
NG
THR
Ev
EN
UE
PE
RPA
SS
EN
GE
R M
ILE
**
DO
ME
STI
C(S
eats
/Mile
)IN
T’L.
(Sea
ts/M
ile)
Sy
STE
M(S
eats
/Mile
)D
OM
ES
TIC
(Mile
s)IN
T’L.
(Mile
s)S
yS
TEM
(Mile
s)C
UR
RE
NT
$(C
ents
)20
09$
(Cen
ts)
His
toric
al*
2000
2005
2006
2007
2008
2009
E
Fore
cast
2010
2011
2012
2013
2014
2015
2016
2017
2018
2019
2020
2021
2022
2023
2024
2025
2026
2027
2028
2029
2030
Avg
Ann
ual G
row
th20
00-0
920
09-1
020
10-2
020
09-3
0
38.4
48.6
49.3
49.9
52.8
55.0
56.2
56.8
57.3
57.8
58.2
58.6
58.9
59.3
59.7
60.3
60.8
61.3
61.8
62.3
62.7
63.1
63.6
64.0
64.5
64.9
65.4
41.8
52.4
52.2
54.0
53.4
52.8
53.1
53.4
53.7
54.0
54.3
54.6
54.9
55.2
55.5
55.8
56.1
56.4
56.7
57.0
57.3
57.6
57.9
58.2
58.5
58.8
59.1
38.5
48.7
49.4
50.0
52.9
55.0
56.2
56.7
57.2
57.7
58.1
58.5
58.9
59.2
59.7
60.2
60.7
61.2
61.7
62.2
62.6
63.0
63.5
63.9
64.4
64.8
65.3
286.
5
434.
745
0.4
451.
546
0.8
456.
5
453.
8
455.
246
2.9
471.
347
9.5
487.
9
495.
250
2.7
510.
251
7.8
525.
6
532.
253
8.8
545.
655
2.4
559.
3
564.
957
0.5
576.
258
2.0
587.
8
260.
0
434.
246
7.2
518.
153
2.7
511.
3
516.
3
521.
352
6.3
531.
353
6.3
541.
3
546.
355
1.3
556.
356
1.3
566.
3
571.
357
6.3
581.
358
6.3
591.
3
596.
360
1.3
606.
361
1.3
616.
3
285.
5
434.
745
0.7
452.
946
2.3
457.
4
454.
8
456.
346
3.9
472.
248
0.4
488.
8
496.
050
3.4
510.
951
8.5
526.
3
532.
853
9.4
546.
155
2.9
559.
8
565.
457
1.0
576.
758
2.5
588.
3
30.2
8
19.6
719
.88
20.1
821
.44
19.0
4
20.2
3
20.7
620
.90
20.9
721
.05
21.1
4
21.2
521
.36
21.4
621
.55
21.6
2
21.6
921
.78
21.8
621
.96
22.0
7
22.2
722
.48
22.6
922
.92
23.1
6
-5.0
%6.
3%0.
7%0.
9%
37.9
2
21.7
321
.18
21.0
121
.38
19.0
4
19.9
5
20.0
919
.79
19.5
019
.20
18.9
2
18.6
518
.38
18.1
217
.86
17.6
1
17.3
717
.14
16.9
116
.68
16.4
6
16.3
016
.14
15.9
915
.83
15.6
8
-7.4
%4.
8%-1
.2%
-0.9
%
* S
ourc
e: F
orm
41
and
298
C, U
.S. D
epar
tmen
t of
Tra
nsp
orta
tion.
** R
epor
ting
carr
iers
.

93
FAA Aerospace Forecast Fiscal Years 2010–2030ta
Ble
24
U.s
. re
gio
Na
l c
ar
rie
rs
sc
He
dU
led
pa
ss
eN
ge
r t
ra
FFic
(In M
illio
ns)
FIS
CA
Ly
EA
R R
Ev
EN
UE
PA
SS
EN
GE
RS
RE
vE
NU
E P
AS
SE
NG
ER
MIL
ES
DO
ME
STI
CIN
TER
NAT
ION
AL
Sy
STE
MD
OM
ES
TIC
INTE
RN
ATIO
NA
LS
yS
TEM
His
toric
al*
2000
2005
2006
2007
2008
2009
E
Fore
cast
2010
2011
2012
2013
2014
2015
2016
2017
2018
2019
2020
2021
2022
2023
2024
2025
2026
2027
2028
2029
2030
Avg
Ann
ual G
row
th20
00-0
920
09-1
020
10-2
020
09-3
0
79.7
146.
415
2.2
156.
215
9.1
153.
8
160.
8
166.
217
2.0
177.
718
2.9
188.
0
193.
019
8.1
203.
720
9.7
216.
3
222.
522
8.7
235.
124
1.6
248.
6
255.
626
2.6
269.
727
6.9
284.
6
7.6%
4.6%
3.0%
3.0%
3.1
3.3
3.5
3.4
3.5
2.6
2.7
2.8
2.9
2.9
3.0
3.1
3.2
3.3
3.4
3.5
3.6
3.7
3.8
3.9
4.0
4.1
4.2
4.4
4.5
4.6
4.7
-2.2
%4.
6%3.
0%3.
0%
82.8
149.
715
5.7
159.
616
2.6
156.
3
163.
4
168.
917
4.8
180.
618
6.0
191.
1
196.
220
1.4
207.
021
3.1
219.
9
226.
223
2.5
239.
024
5.6
252.
7
259.
926
6.9
274.
228
1.5
289.
3
7.3%
4.6%
3.0%
3.0%
22,8
25
63,6
5468
,532
70,5
2873
,305
70,1
88
72,9
53
75,6
4179
,596
83,7
3287
,725
91,7
17
95,5
7799
,578
103,
900
108,
574
113,
692
118,
417
123,
233
128,
266
133,
462
139,
025
144,
398
149,
803
155,
417
161,
163
167,
265
13.3
%3.
9%4.
5%4.
2%
814
1,41
71,
634
1,77
21,
867
1,30
4
1,37
7
1,43
71,
502
1,56
61,
628
1,68
8
1,75
01,
812
1,88
01,
953
2,03
3
2,10
92,
187
2,26
82,
351
2,43
9
2,52
92,
620
2,71
32,
809
2,91
0
5.4%
5.6%
4.0%
3.9%
23,6
39
65,0
7170
,166
72,3
0075
,172
71,4
92
74,3
30
77,0
7881
,098
85,2
9889
,353
93,4
06
97,3
2710
1,39
010
5,78
011
0,52
711
5,72
5
120,
526
125,
420
130,
534
135,
812
141,
464
146,
928
152,
423
158,
130
163,
972
170,
175
13.1
%4.
0%4.
5%4.
2%
* S
ourc
e: F
orm
41
and
298
C, U
.S. D
epar
tmen
t of
Tra
nsp
orta
tion.

FAA Aerospace Forecast Fiscal Years 2010–2030
94
taB
le 2
5
U.s
. re
gio
Na
l c
ar
rie
rs
sc
He
dU
led
pa
ss
eN
ge
r c
apa
cit
Y, t
ra
FFic
, aN
d l
oa
d F
ac
to
rs
FIS
CA
Ly
EA
R
DO
ME
STI
CIN
TER
NAT
ION
AL
Sy
STE
M
AS
Ms
(MIL
)R
PM
s(M
IL)
% L
OA
DFA
CTO
RA
SM
s(M
IL)
RP
Ms
(MIL
)%
LO
AD
FAC
TOR
AS
Ms
(MIL
)R
PM
s(M
IL)
% L
OA
DFA
CTO
R
His
toric
al*
2000
2005
2006
2007
2008
2009
E
Fore
cast
2010
2011
2012
2013
2014
2015
2016
2017
2018
2019
2020
2021
2022
2023
2024
2025
2026
2027
2028
2029
2030
Avg
Ann
ual G
row
th20
00-0
920
09-1
020
10-2
020
09-3
0
38,3
32
90,0
2891
,458
93,4
5299
,469
94,4
21
96,2
58
98,7
3410
3,81
010
9,12
011
4,24
211
9,36
1
124,
307
129,
435
134,
979
140,
979
147,
553
153,
615
159,
793
166,
253
172,
920
180,
062
186,
957
193,
890
201,
093
208,
466
216,
296
10.5
%1.
9%4.
4%4.
0%
22,8
25
63,6
5468
,532
70,5
2873
,305
70,1
88
72,9
53
75,6
4179
,596
83,7
3287
,725
91,7
17
95,5
7799
,578
103,
900
108,
574
113,
692
118,
417
123,
233
128,
266
133,
462
139,
025
144,
398
149,
803
155,
417
161,
163
167,
265
13.3
%3.
9%4.
5%4.
2%
59.5
70.7
74.9
75.5
73.7
74.3
75.8
76.6
76.7
76.7
76.8
76.8
76.9
76.9
77.0
77.0
77.1
77.1
77.1
77.2
77.2
77.2
77.2
77.3
77.3
77.3
77.3
1,33
8
2,21
32,
387
2,55
02,
632
1,87
3
1,96
4
2,03
52,
111
2,18
72,
257
2,32
5
2,39
22,
461
2,53
62,
617
2,70
5
2,78
92,
873
2,95
93,
048
3,14
2
3,24
83,
353
3,46
23,
572
3,69
6
3.8%
4.8%
3.3%
3.3%
814
1,41
71,
634
1,77
21,
867
1,30
4
1,37
7
1,43
71,
502
1,56
61,
628
1,68
8
1,75
01,
812
1,88
01,
953
2,03
3
2,10
92,
187
2,26
82,
351
2,43
9
2,52
92,
620
2,71
32,
809
2,91
0
5.4%
5.6%
4.0%
3.9%
60.8
64.0
68.5
69.5
70.9
69.6
70.1
70.6
71.1
71.6
72.1
72.6
73.1
73.6
74.1
74.6
75.1
75.6
76.1
76.6
77.1
77.6
77.9
78.1
78.4
78.6
78.7
39,6
70
92,2
4093
,845
96,0
0210
2,10
196
,294
98,2
22
100,
769
105,
922
111,
306
116,
499
121,
686
126,
699
131,
896
137,
515
143,
596
150,
259
156,
404
162,
666
169,
212
175,
967
183,
204
190,
205
197,
243
204,
555
212,
038
219,
993
10.4
%2.
0%4.
3%4.
0%
23,6
39
65,0
7170
,166
72,3
0075
,172
71,4
92
74,3
30
77,0
7881
,098
85,2
9889
,353
93,4
06
97,3
2710
1,39
010
5,78
011
0,52
711
5,72
5
120,
526
125,
420
130,
534
135,
812
141,
464
146,
928
152,
423
158,
130
163,
972
170,
175
13.1
%4.
0%4.
5%4.
2%
59.6
70.5
74.8
75.3
73.6
74.2
75.7
76.5
76.6
76.6
76.7
76.8
76.8
76.9
76.9
77.0
77.0
77.1
77.1
77.1
77.2
77.2
77.2
77.3
77.3
77.3
77.4
* S
ourc
e: F
orm
41
and
298
C, U
.S. D
epar
tmen
t of
Tra
nsp
orta
tion.

95
FAA Aerospace Forecast Fiscal Years 2010–2030ta
Ble
26
U.s
. re
gio
Na
l c
ar
rie
rs
pas
se
Ng
er
air
cr
aFt
AS
OF
JAN
UA
Ry
1
RE
GIO
NA
L A
IRC
RA
FT
LES
S
THA
N9
SE
ATS
10 T
O 1
9S
EAT
S20
TO
30
SE
ATS
31 T
O 4
0 S
EAT
SO
vE
R 4
0 S
EAT
STO
TAL
FLE
ET
PR
OP
JET
TOTA
LP
RO
PJE
T**
TOTA
LN
ON
JE
TJE
TTO
TAL
His
toric
al*
2000
2005
2006
2007
2008
2009
E
Fore
cast
2010
2011
2012
2013
2014
2015
2016
2017
2018
2019
2020
2021
2022
2023
2024
2025
2026
2027
2028
2029
2030
Avg
Ann
ual G
row
th20
00-0
920
09-1
020
10-2
020
09-3
0
470
449
453
453
451
466
454
444
393
418
405
391
376
363
347
346
346
343
341
341
338
337
334
332
331
331
330
-0.1
%-2
.6%
-2.7
%-1
.6%
470
449
453
453
451
466
454
444
393
418
405
391
376
363
347
346
346
343
341
341
338
337
334
332
331
331
330
-0.1
%-2
.6%
-2.7
%-1
.6%
262
99 88 79 68 65 65 65 65 65 65 64 64 64 63 63 63 62 62 62 61 61 60 60 59 59 58
-14.
3%0.
0%-0
.3%
-0.5
%
474
253
224
228
180
153 145
138
103
121
113
104
95 87 78 77 77 77 77 77 77 77 77 77 77 77 77
-11.
8%-5
.2%
-6.1
%-3
.2%
74 98 96 98 43 6 0 0 0 0 0 0 0 0 0 0 0 0 0 0 0 0 0 0 0 0 0
-24.
4%N
/AN
/A-9
9.9%
548
351
320
326
223
159
145
138
103
121
113
104
95 87 78 77 77 77 77 77 77 77 77 77 77 77 77
-12.
8%-8
.8%
-6.1
%-3
.4%
155
81 87 101
121
115
129
143
156
169
183
197
209
222
235
250
265
276
292
306
320
334
345
358
373
388
403
-3.3
%12
.2%
7.5%
6.2%
496
1,63
01,
632
1,65
61,
730
1,70
4
1,60
3
1,66
91,
705
1,74
31,
748
1,72
3
1,70
41,
708
1,70
61,
722
1,76
6
1,78
71,
852
1,91
21,
976
2,06
0
2,12
52,
200
2,28
02,
360
2,44
1
14.7
%-5
.9%
1.0%
1.7%
651
1,71
11,
719
1,75
71,
851
1,81
9
1,73
2
1,81
21,
861
1,91
21,
931
1,92
0
1,91
31,
930
1,94
11,
972
2,03
1
2,06
32,
144
2,21
82,
296
2,39
4
2,47
02,
558
2,65
32,
748
2,84
4
12.1
%-4
.8%
1.6%
2.2%
1,70
4
1,10
21,
056
1,03
392
790
2
896
893
820
875
867
857
844
835
821
834
849
855
868
882
891
903
909
919
932
947
960
-6.8
%-0
.7%
-0.5
%0.
3%
570
1,72
81,
728
1,75
41,
773
1,71
0
1,60
3
1,66
91,
705
1,74
31,
748
1,72
3
1,70
41,
708
1,70
61,
722
1,76
6
1,78
71,
852
1,91
21,
976
2,06
0
2,12
52,
200
2,28
02,
360
2,44
1
13.0
%-6
.3%
1.0%
1.7%
2,27
4
2,83
02,
784
2,78
72,
700
2,61
2
2,49
9
2,56
22,
525
2,61
82,
615
2,58
0
2,54
82,
543
2,52
72,
556
2,61
5
2,64
22,
720
2,79
42,
867
2,96
3
3,03
43,
119
3,21
23,
307
3,40
1
1.6%
-4.3
%0.
5%1.
3%
*Sou
rce:
The
vel
ocity
Gro
up fo
r th
e R
egio
nal A
irlin
e A
ssoc
iatio
n.**
Ind
epen
den
ce A
ir A
319
airc
raft
are
incl
uded
in T
able
20
- U
.S. M
ainl
ine
Air
Car
riers
Pas
seng
er J
et A
ircra
ft.

FAA Aerospace Forecast Fiscal Years 2010–2030
96
taB
le 2
7
ac
tiv
e g
eN
er
al
av
iat
ioN
aN
d a
ir t
ax
i air
cr
aFt
AS O
FDE
C. 3
1
FIXE
D W
ING
ROTO
RCRA
FTEX
PERI
-M
ENTA
LSP
ORT
AIRC
RAFT
OTHE
R
TOTA
LGE
NERA
LAv
IATI
ONFL
EET
TOTA
L PI
STON
STO
TAL
TURB
INES
PIST
ONTU
RBIN
E
SING
LEEN
GINE
MUL
TI-
ENGI
NETO
TAL
TURB
OPR
OPTU
RBO
JET
TOTA
LPI
STON
TURB
INE
TOTA
L
His
toric
al*
2000
2005
2006
2007
2008
2009
E
Fore
cast
2010
2011
2012
2013
2014
2015
2016
2017
2018
2019
2020
2021
2022
2023
2024
2025
2026
2027
2028
2029
2030
Avg
Ann
ual G
row
th20
00-0
920
09-1
020
10-2
020
09-3
0
149,
422
148,
102
145,
033
147,
571
145,
497
144,
745
144,
104
143,
502
142,
996
142,
581
142,
240
141,
955
141,
748
141,
613
141,
594
141,
727
142,
052
142,
550
143,
084
143,
696
144,
438
145,
323
146,
143
147,
078
148,
139
149,
319
150,
646
-0.4
%-0
.4%
-0.1
%0.
2%
21,0
91
19,5
04
18,7
0819
,335
17,5
1917
,351
17,1
77
17,0
4116
,916
16,7
9116
,656
16,5
20
16,3
8416
,241
16,0
9815
,955
15,8
15
15,6
8115
,552
15,4
2415
,299
15,1
76
15,0
5914
,941
14,8
2714
,711
14,5
97
-2.1
%-1
.0%
-0.8
%-0
.8%
170,
513
167,
606
163,
741
166,
906
163,
016
162,
096
161,
281
160,
543
159,
912
159,
372
158,
896
158,
475
158,
132
157,
854
157,
692
157,
682
157,
867
158,
231
158,
636
159,
120
159,
737
160,
499
161,
202
162,
019
162,
966
164,
030
165,
243
-0.6
%-0
.5%
-0.2
%0.
1%
5,76
2
7,94
2 8,
063
9,51
48,
907
9,01
0
9,10
0
9,21
49,
349
9,50
09,
650
9,79
9
9,94
310
,085
10,2
2710
,370
10,5
16
10,6
6510
,812
10,9
5911
,108
11,2
59
11,4
1111
,564
11,7
1711
,870
12,0
23
5.1%
1.0%
1.5%
1.4%
7,00
1
9,82
3 10
,379
10,3
8511
,042
11,4
18
11,7
79
12,1
8412
,657
13,2
1713
,827
14,4
66
15,1
2215
,798
16,4
8617
,191
17,9
25
18,6
9119
,487
20,3
1521
,175
22,0
69
22,9
9623
,957
24,9
5225
,979
27,0
35
5.6%
3.2%
4.3%
4.2%
12,7
63
17,7
65
18,4
42
19,8
99
19,9
49
20,4
28
20,8
79
21,3
98
22,0
06
22,7
18
23,4
77
24,2
65
25,0
65
25,8
83
26,7
13
27,5
61
28,4
42
29,3
57
30,2
99
31,2
74
32,2
83
33,3
28
34,4
07
35,5
20
36,6
69
37,8
49
39,0
59
5.4%
2.2%
3.1%
3.1%
2,68
0
3,03
9 3,
264
2,76
93,
498
3,66
6
3,83
0
4,00
54,
180
4,36
04,
550
4,75
5
4,94
55,
125
5,29
05,
455
5,62
5
5,79
55,
970
6,14
56,
320
6,49
5
6,67
06,
845
7,02
07,
195
7,37
0
3.5%
4.5%
3.9%
3.4%
4,47
0
5,68
9 5,
895
6,79
86,
378
6,54
0
6,71
5
6,92
07,
125
7,33
57,
555
7,79
5
8,01
58,
225
8,41
58,
605
8,80
0
9,00
09,
200
9,40
09,
600
9,80
0
10,0
0510
,210
10,4
1510
,620
10,8
25
4.3%
2.7%
2.7%
2.4%
7,15
0
8,72
8 9,
159
9,56
7 9,
876
10,2
06
10,5
45
10,9
25
11,3
05
11,6
95
12,1
05
12,5
50
12,9
60
13,3
50
13,7
05
14,0
60
14,4
25
14,7
95
15,1
70
15,5
45
15,9
20
16,2
95
16,6
75
17,0
55
17,4
35
17,8
15
18,1
95
4.0%
3.3%
3.2%
2.8%
20,4
07
23,6
27
23,0
4723
,228
23,3
6423
,435
23,6
05
24,3
2025
,030
25,6
8026
,325
26,9
65
27,5
5028
,125
28,6
9529
,260
29,7
70
30,2
7530
,775
31,2
7031
,760
32,2
45
32,6
7533
,100
33,5
2033
,935
34,3
50
1.5%
0.7%
2.3%
1.8%
NA
170
1,27
3 6,
066
6,81
1 7,
311
7,71
1
8,71
1 9,
711
10,6
1111
,111
11,6
11
12,0
1112
,411
12,7
1113
,011
13,3
11
13,6
1113
,911
14,2
1114
,511
14,8
11
15,1
1115
,411
15,7
1116
,011
16,3
11
N/A
5.5%
5.6%
3.9%
6,70
0
6,45
46,
277
5,94
05,
652
5,67
3
5,67
9
5,68
45,
677
5,67
05,
663
5,65
7
5,65
05,
644
5,63
75,
631
5,62
5
5,61
85,
612
5,60
65,
600
5,59
4
5,58
85,
582
5,57
65,
571
5,56
5
-1.8
%0.
1%-0
.1%
-0.1
%
217,
533
224,
350
221,
939
231,
606
228,
668
229,
149
229,
699
231,
581
233,
642
235,
746
237,
577
239,
522
241,
369
243,
267
245,
153
247,
206
249,
440
251,
888
254,
404
257,
026
259,
812
262,
772
265,
658
268,
688
271,
877
275,
210
278,
723
0.6%
0.2%
0.8%
0.9%
173,
193
170,
645
167,
005
169,
675
166,
514
165,
762
165,
111
164,
548
164,
092
163,
732
163,
446
163,
230
163,
077
162,
979
162,
982
163,
137
163,
492
164,
026
164,
606
165,
265
166,
057
166,
994
167,
872
168,
864
169,
986
171,
225
172,
613
-0.5
%-0
.4%
-0.1
%0.
2%
17,2
33
23,4
54
24,3
37
26,6
97
26,3
27
26,9
68
27,5
94
28,3
18
29,1
31
30,0
53
31,0
32
32,0
60
33,0
80
34,1
08
35,1
28
36,1
66
37,2
42
38,3
57
39,4
99
40,6
74
41,8
83
43,1
28
44,4
12
45,7
30
47,0
84
48,4
69
49,8
84
5.1%
2.3%
3.0%
3.0%
* S
ourc
e: 2
000-
2008
, FA
A G
ener
al A
viat
ion
and
Air
Taxi
Act
ivity
(and
Avi
onic
s) S
urve
ys.
Not
e: A
n ac
tive
airc
raft
is o
ne th
at h
as a
cur
rent
regi
stra
tion
and
was
flow
n at
leas
t one
hou
r du
ring
the
cale
ndar
yea
r.

97
FAA Aerospace Forecast Fiscal Years 2010–2030ta
Ble
28
ac
tiv
e g
eN
er
al
av
iat
ioN
aN
d a
ir t
ax
i Ho
Ur
s F
low
N(In
Tho
usan
ds)
CALE
NDAR
yEAR
FIXE
D W
ING
ROTO
RCRA
FTEX
PERI
-M
ENTA
LSP
ORT
AIRC
RAFT
OTH
ER
TOTA
LG
ENER
ALAv
IATI
ON
HOUR
S
TOTA
L PI
STO
NSTO
TAL
TURB
INES
PIST
ON
TURB
INE
SING
LEEN
GIN
EM
ULTI
-EN
GIN
ETO
TAL
TURB
OPR
OP
TURB
OJE
TTO
TAL
PIST
ON
TURB
INE
TOTA
L
His
toric
al*
2000
2005
2006
2007
2008
2009
E
Fore
cast
2010
2011
2012
2013
2014
2015
2016
2017
2018
2019
2020
2021
2022
2023
2024
2025
2026
2027
2028
2029
2030
Avg
Ann
ual G
row
th20
00-0
920
09-1
020
10-2
020
09-3
0
18,0
89
13,7
3913
,976
13,5
7112
,746
11,4
36
11,0
04
11,7
0511
,856
11,9
6511
,855
11,8
39
11,7
4711
,788
11,8
6811
,994
12,1
27
12,3
5012
,459
12,6
1312
,842
13,1
34
13,4
2613
,739
14,0
4614
,320
14,6
13
-5.0
%-3
.8%
1.0%
1.2%
3,40
0
2,67
72,
550
2,68
62,
328
2,13
2
2,10
5
2,13
72,
122
2,07
12,
019
1,98
5
1,94
61,
924
1,91
11,
900
1,88
7
1,86
71,
862
1,87
11,
883
1,90
0
1,92
81,
953
1,98
82,
027
2,05
1
-5.1
%-1
.3%
-1.1
%-0
.2%
21,4
89
16,4
16
16,5
25
16,2
57
15,0
74
13,5
68
13,1
09
13,8
42
13,9
78
14,0
36
13,8
75
13,8
23
13,6
92
13,7
13
13,7
79
13,8
94
14,0
14
14,2
17
14,3
21
14,4
84
14,7
25
15,0
34
15,3
54
15,6
93
16,0
34
16,3
47
16,6
63
-5.0
%-3
.4%
0.7%
1.0%
1,98
6
2,16
02,
162
2,66
12,
457
2,24
1
2,27
2
2,45
82,
537
2,60
92,
650
2,68
8
2,71
42,
740
2,77
62,
812
2,84
2
2,86
32,
898
2,93
52,
963
2,98
6
3,01
53,
054
3,09
73,
138
3,18
0
1.4%
1.4%
2.3%
1.7%
2,75
5
3,76
74,
077
3,93
83,
600
2,90
2
2,90
4
3,48
74,
196
4,92
45,
170
5,42
5
5,69
75,
957
6,19
76,
463
6,73
9
7,02
17,
311
7,61
67,
933
8,25
7
8,58
88,
930
9,28
39,
662
10,0
51
0.6%
0.1%
8.8%
6.1%
4,74
1
5,92
7 6,
240
6,60
0 6,
057
5,14
3
5,17
6
5,94
5 6,
733
7,53
3 7,
821
8,11
3
8,41
1 8,
697
8,97
3 9,
275
9,58
1
9,88
4 10
,209
10
,551
10
,896
11
,243
11,6
03
11,9
84
12,3
80
12,8
00
13,2
32
0.9%
0.7%
6.4%
4.6%
530
678
918
704
751
709
726
761
796
832
871
912
951
988
1,02
21,
057
1,09
3
1,12
81,
165
1,20
31,
240
1,27
7
1,31
51,
353
1,39
11,
429
1,46
8
3.3%
2.4%
4.2%
3.5%
1,66
1
2,43
82,
528
2,54
12,
470
2,35
6
2,37
1
2,45
52,
541
2,62
82,
721
2,82
1
2,91
53,
007
3,09
23,
177
3,26
5
3,35
63,
448
3,54
13,
634
3,72
8
3,82
53,
923
4,02
24,
122
4,22
2
4.0%
0.6%
3.3%
2.8%
2,19
1
3,11
6 3,
446
3,24
5 3,
222
3,06
5
3,09
6
3,21
6 3,
336
3,46
1 3,
591
3,73
3
3,86
6 3,
995
4,11
4 4,
234
4,35
8
4,48
5 4,
614
4,74
3 4,
874
5,00
6
5,14
0 5,
276
5,41
3 5,
551
5,69
0
3.8%
1.0%
3.5%
3.0%
1,30
7
1,34
01,
218
1,27
51,
155
1,03
1
1,00
0
1,08
81,
198
1,30
31,
403
1,48
0
1,52
01,
560
1,59
91,
639
1,67
6
1,71
31,
750
1,78
71,
824
1,86
2
1,89
61,
930
1,96
51,
999
2,03
4
-2.6
%-3
.0%
5.3%
3.3%
NA 9 66
260
293
314
332
382
435
484
517
551
582
613
641
669
698
728
759
791
824
857
892
928
965
1,00
31,
043
N/A
5.5%
7.7%
5.9%
374
271
211
215
209
208
208
209
210
210
211
212
213
214
214
215
216
217
218
219
219
220
221
222
223
224
225
-6.3
%-0
.4%
0.4%
0.4%
30,1
02
27,0
78
27,7
05
27,8
52
26,0
09
23,3
30
22,9
21
24,6
81
25,8
89
27,0
27
27,4
18
27,9
13
28,2
84
28,7
91
29,3
20
29,9
26
30,5
43
31,2
44
31,8
70
32,5
75
33,3
62
34,2
22
35,1
07
36,0
34
36,9
80
37,9
25
38,8
86
-2.8
%-1
.8%
2.9%
2.5%
22,0
19
17,0
94
17,4
43
16,9
62
15,8
25
14,2
77
13,8
35
14,6
02
14,7
74
14,8
68
14,7
45
14,7
35
14,6
43
14,7
01
14,8
02
14,9
51
15,1
07
15,3
45
15,4
86
15,6
87
15,9
65
16,3
12
16,6
69
17,0
46
17,4
25
17,7
76
18,1
31
-4.7
%-3
.1%
0.9%
1.1%
6,40
2
8,36
5 8,
767
9,14
1 8,
527
7,49
9
7,54
7
8,40
0 9,
273
10,1
62
10,5
41
10,9
34
11,3
26
11,7
04
12,0
64
12,4
52
12,8
46
13,2
40
13,6
57
14,0
92
14,5
30
14,9
71
15,4
28
15,9
07
16,4
02
16,9
22
17,4
54
1.8%
0.6%
5.5%
4.1%
* S
ourc
e: 2
000-
2008
, FA
A G
ener
al A
viat
ion
and
Air
Taxi
Sur
veys
.N
ote:
An
activ
e ai
rcra
ft is
one
that
has
a c
urre
nt re
gist
ratio
n an
d w
as fl
own
at le
ast o
ne h
our
durin
g th
e pr
evio
us c
alen
dar
year
.

FAA Aerospace Forecast Fiscal Years 2010–2030
98
taB
le 2
9
ac
tiv
e p
ilo
ts
BY
tY
pe
oF
ce
rt
iFic
ate
AS O
FD
EC. 3
1ST
UD
ENTS
REC
REA
-TI
ON
ALSP
OR
TPI
LOT
PRIv
ATE
CO
MM
ERC
IAL
AIR
LIN
ETR
ANSP
ORT
RO
TOR
-C
RAF
TO
NLy
GLI
DER
ON
LyTO
TAL
PILO
TS
TOTA
LLE
SSAT
PIL
OTS
INST
RU
MEN
TR
ATED
PI
LOTS
1
His
toric
al*
2000
2005
2006
2007
2008
2009
E
Fore
cast
2010
2011
2012
2013
2014
2015
2016
2017
2018
2019
2020
2021
2022
2023
2024
2025
2026
2027
2028
2029
2030
Avg
Ann
ual G
row
th20
00-0
920
09-1
020
10-2
020
09-3
0
93,0
64
87,2
1384
,866
84,3
3980
,989
72,2
80
70,7
00
69,0
5071
,400
73,1
5073
,850
74,3
00
74,7
0074
,950
75,3
5075
,500
75,8
00
76,2
0076
,800
77,4
0078
,100
79,0
00
80,1
0081
,400
82,8
5084
,450
86,0
50
-2.8
%-2
.2%
0.7%
0.8%
340
278
239
239
252
234
235
235
235
235
235
235
235
235
235
235
235
235
235
235
235
235
235
235
235
235
235
-4.1
%0.
4%0.
0%0.
0%
NA
134
939
2,03
12,
623
3,24
8
4,06
0
4,87
25,
846
6,15
06,
500
6,85
0
7,20
07,
600
8,00
08,
400
8,85
0
9,25
09,
700
10,1
5010
,650
11,1
50
11,7
0012
,250
12,8
5013
,450
14,1
00
N/A
25.0
%8.
1%7.
2%
251,
561
228,
619
219,
233
211,
096
222,
596
211,
619
206,
400
202,
000
200,
500
200,
550
201,
000
201,
600
202,
250
202,
850
203,
500
204,
050
204,
600
205,
200
205,
950
206,
800
207,
800
209,
000
210,
450
212,
200
214,
250
216,
550
219,
050
-1.9
%-2
.5%
-0.1
%0.
2%
121,
858
120,
614
117,
610
115,
127
124,
746
125,
738
124,
950
125,
150
123,
900
119,
850
119,
750
119,
650
121,
250
122,
650
123,
650
124,
550
125,
450
126,
300
127,
300
128,
400
129,
600
130,
900
132,
350
133,
850
135,
450
137,
200
139,
100
0.3%
-0.6
%0.
0%0.
5%
141,
596
141,
992
141,
935
143,
953
146,
838
144,
600
142,
650
142,
750
142,
800
143,
750
145,
100
145,
750
146,
700
147,
300
148,
200
149,
100
150,
300
151,
250
151,
900
153,
450
154,
550
156,
050
157,
350
158,
550
160,
000
161,
400
162,
900
0.2%
-1.3
%0.
5%0.
6%
7,77
5
9,51
8 10
,690
12,2
9014
,647
15,2
98
15,3
80
15,5
4016
,250
17,0
1017
,700
18,3
00
18,8
6019
,420
19,8
8020
,240
20,4
00
20,3
9020
,270
20,1
4020
,010
20,0
60
20,2
1020
,420
20,6
7021
,000
21,3
80
7.8%
0.5%
2.9%
1.6%
9,38
7
21,3
69
21,5
9721
,274
21
,055
21
,268
21,2
70
21,3
50
21,3
80
21,4
10
21,4
40
21,4
70
21,5
10
21,5
40
21,5
70
21,6
00
21,6
30
21,6
70
21,7
00
21,7
30
21,7
60
21,8
00
21,8
30
21,8
60
21,8
90
21,9
30
21,9
60
9.5%
0.0%
0.2%
0.2%
625,
581
609,
737
597,
109
590,
349
613,
746
594,
285
585,
645
580,
947
582,
311
582,
105
585,
575
588,
155
592,
705
596,
545
600,
385
603,
675
607,
265
610,
495
613,
855
618,
305
622,
705
628,
195
634,
225
640,
765
648,
195
656,
215
664,
775
-0.6
%-1
.5%
0.4%
0.5%
483,
985
467,
745
455,
174
446,
396
466,
908
449,
685
442,
995
438,
197
439,
511
438,
355
440,
475
442,
405
446,
005
449,
245
452,
185
454,
575
456,
965
459,
245
461,
955
464,
855
468,
155
472,
145
476,
875
482,
215
488,
195
494,
815
501,
875
-0.8
%-1
.5%
0.3%
0.5%
311,
944
311,
500
309,
333
309,
865
325,
247
323,
495
322,
300
321,
100
322,
800
324,
500
326,
200
327,
900
329,
600
332,
100
334,
600
337,
200
339,
800
343,
200
346,
700
350,
200
353,
800
357,
400
361,
000
364,
700
368,
400
372,
100
375,
900
0.4%
-0.4
%0.
5%0.
7%
* S
ourc
e: F
AA
U.S
. Civ
il A
irmen
Sta
tistic
s.
1 In
stru
men
t rat
ed p
ilots
sho
uld
not b
e ad
ded
to o
ther
cat
egor
ies
in d
eriv
ing
tota
l.
Not
e: A
n ac
tive
pilo
t is
a pe
rson
with
a p
ilot c
ertif
icat
e an
d a
valid
med
ical
cer
tific
ate.

99
FAA Aerospace Forecast Fiscal Years 2010–2030ta
Ble
30
ge
Ne
ra
l a
via
tio
N a
irc
ra
Ft F
Ue
l c
oN
sU
mp
tio
N(In
Mill
ions
of G
allo
ns)
CA
LEN
DA
Ry
EA
R
FIX
ED
WIN
GR
OTO
RC
RA
FTE
XP
ER
I-M
EN
TAL/
OTH
ER
SP
OR
TTO
TAL
FUE
L C
ON
SU
ME
DP
ISTO
NTU
RB
INE
SIN
GLE
EN
GIN
EM
ULT
I-E
NG
INE
TUR
BO
-P
RO
PTU
RB
O-
JET
Av
GA
SJE
T FU
EL
TOTA
LP
ISTO
NTU
RB
INE
His
toric
al20
00
2005
2006
2007
2008
2009
E
Fore
cast
2010
2011
2012
2013
2014
2015
2016
2017
2018
2019
2020
2021
2022
2023
2024
2025
2026
2027
2028
2029
2030
Avg
Ann
ual G
row
th20
00-0
920
09-1
020
10-2
020
09-3
0
200.
8
173.
116
4.9
157.
614
3.0
129.
0
124.
7
133.
313
3.7
133.
613
1.0
129.
5
127.
912
7.7
127.
912
8.6
129.
4
131.
113
1.6
132.
613
4.3
136.
7
139.
014
1.5
144.
014
6.1
148.
3
-4.8
%-3
.3%
0.4%
0.7%
108.
4
89.7
79.9
83.0
69.5
64.0
63.5
64.8
63.7
61.5
59.4
57.8
56.3
55.5
54.8
54.2
53.6
52.7
52.3
52.3
52.4
52.6
53.1
53.5
54.2
55.0
55.4
-5.7
%-0
.8%
-1.7
%-0
.7%
176.
3
196.
119
0.1
205.
223
0.4
210.
2
211.
0
228.
223
5.6
239.
824
3.6
247.
2
247.
024
9.4
252.
625
3.3
256.
1
258.
025
8.5
261.
826
4.3
266.
4
268.
927
2.4
276.
327
9.9
283.
7
2.0%
0.4%
2.0%
1.4%
736.
7
1,18
1.3
1,30
3.9
1,14
8.0
1,31
3.2
1,01
4.1
1,00
4.6
1,19
4.4
1,42
2.8
1,65
3.2
1,71
8.4
1,78
4.9
1,85
5.8
1,92
0.9
1,97
8.3
2,04
2.8
2,10
8.7
2,17
4.9
2,24
2.0
2,31
2.2
2,38
4.4
2,45
6.9
2,53
0.0
2,60
4.5
2,68
0.1
2,76
1.9
2,84
4.3
3.6%
-0.9
%7.
7%5.
0%
8.4
14.6
16.7
9.3
10.7
10.1
10.3
10.8
11.3
11.8
12.3
12.8
13.4
13.9
14.3
14.8
15.3
15.8
16.3
16.8
17.3
17.8
18.3
18.9
19.4
19.9
20.5
2.1%
2.4%
4.0%
3.4%
59.0
149.
214
8.6
132.
416
2.1
140.
0
140.
2
144.
414
8.7
153.
115
7.7
162.
7
167.
317
1.7
175.
617
9.6
183.
6
187.
819
2.0
196.
120
0.3
204.
5
208.
821
3.0
217.
322
1.6
225.
8
10.1
%0.
1%2.
7%2.
3%
15.2
17.7
21.6
22.6
23.3
20.7
20.1
21.9
24.0
26.1
28.1
29.4
30.2
31.0
31.7
32.5
33.2
33.9
34.5
35.2
35.9
36.7
37.4
38.0
38.7
39.4
40.1
3.5%
-3.0
%5.
1%3.
2%
NA
0.0
0.3
1.2
1.5
1.6
1.6
1.9
2.1
2.3
2.5
2.6
2.8
2.9
3.1
3.1
3.3
3.4
3.5
3.6
3.8
3.9
4.1
4.3
4.4
4.6
4.8
N/A
3.4%
7.3%
5.5%
332.
8
295.
028
3.4
273.
624
8.1
225.
3
220.
2
232.
623
4.7
235.
223
3.2
232.
2
230.
623
1.0
231.
823
3.2
234.
7
237.
023
8.1
240.
524
3.7
247.
7
251.
925
6.2
260.
726
5.0
269.
0
-4.2
%-2
.3%
0.6%
0.8%
972.
0
1,52
6.7
1,64
2.6
1,48
5.6
1,70
5.7
1,36
4.3
1,35
5.8
1,56
7.1
1,80
7.1
2,04
6.1
2,11
9.7
2,19
4.8
2,27
0.1
2,34
2.0
2,40
6.6
2,47
5.7
2,54
8.4
2,62
0.6
2,69
2.5
2,77
0.2
2,84
9.0
2,92
7.8
3,00
7.7
3,08
9.9
3,17
3.7
3,26
3.4
3,35
3.8
3.8%
-0.6
%6.
5%4.
4%
1,30
4.8
1,82
1.7
1,92
6.0
1,75
9.2
1,95
3.8
1,58
9.6
1,57
6.0
1,79
9.7
2,04
1.8
2,28
1.3
2,35
2.9
2,42
7.0
2,50
0.7
2,57
3.0
2,63
8.3
2,70
8.9
2,78
3.1
2,85
7.6
2,93
0.7
3,01
0.7
3,09
2.8
3,17
5.5
3,25
9.6
3,34
6.1
3,43
4.4
3,52
8.4
3,62
2.8
2.2%
-0.9
%5.
9%4.
0%
Sou
rce:
FA
A A
PO
Est
imat
es.
Not
e: D
etai
l may
not
add
to to
tal b
ecau
se o
f ind
epen
dent
roun
ding
.
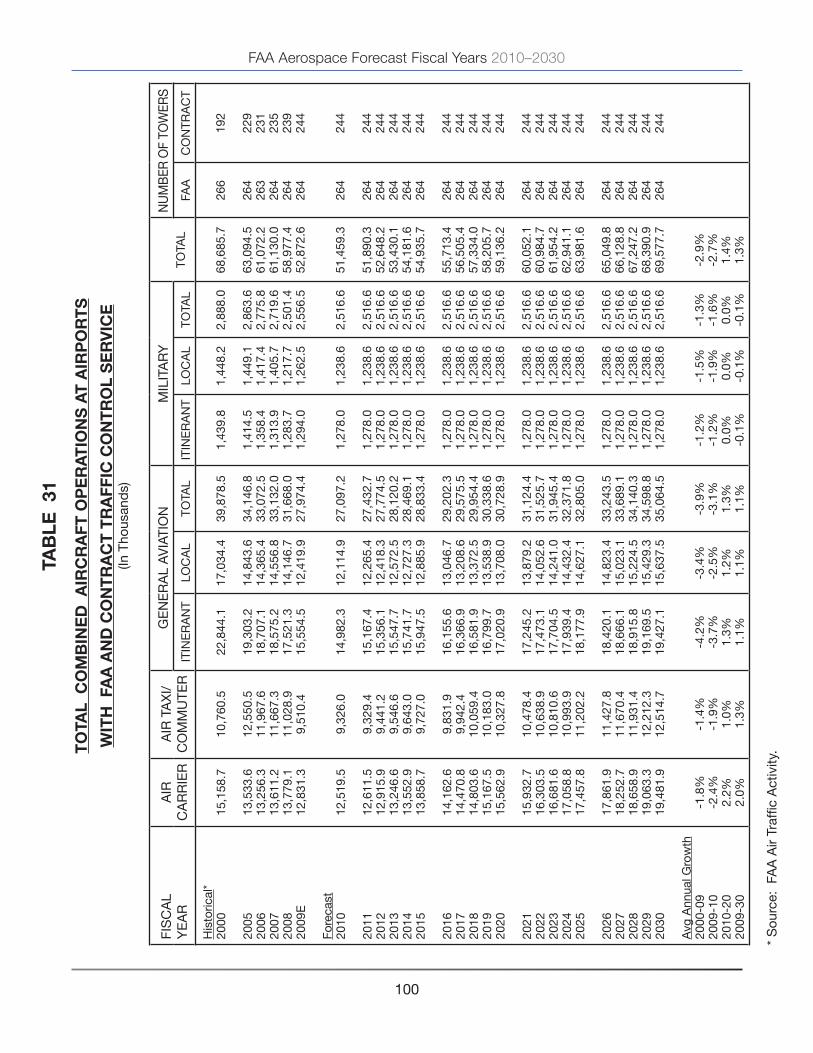
FAA Aerospace Forecast Fiscal Years 2010–2030
100
taB
le 3
1
to
tal
co
mB
iNe
d a
irc
ra
Ft o
pe
rat
ioN
s a
t a
irp
or
ts
wit
H F
aa
aN
d c
oN
tr
ac
t t
ra
FFic
co
Nt
ro
l s
er
vic
e(In
Tho
usan
ds)
FIS
CA
Ly
EA
RA
IRC
AR
RIE
RA
IR T
AX
I/
CO
MM
UTE
RG
EN
ER
AL
Av
IATI
ON
MIL
ITA
Ry
TOTA
LN
UM
BER
OF
TOW
ERS
ITIN
ER
AN
TLO
CA
LTO
TAL
ITIN
ER
AN
TLO
CA
LTO
TAL
FAA
CO
NTR
AC
T
His
toric
al*
2000
2005
2006
2007
2008
2009
E
Fore
cast
2010
2011
2012
2013
2014
2015
2016
2017
2018
2019
2020
2021
2022
2023
2024
2025
2026
2027
2028
2029
2030
Avg
Ann
ual G
row
th20
00-0
920
09-1
020
10-2
020
09-3
0
15,1
58.7
13,5
33.6
13,2
56.3
13,6
11.2
13,7
79.1
12,8
31.3
12,5
19.5
12,6
11.5
12,9
15.9
13,2
46.6
13,5
52.9
13,8
58.7
14,1
62.6
14,4
70.8
14,8
03.6
15,1
67.5
15,5
62.9
15,9
32.7
16,3
03.5
16,6
81.6
17,0
58.8
17,4
57.8
17,8
61.9
18,2
52.7
18,6
58.9
19,0
63.3
19,4
81.9
-1.8
%-2
.4%
2.2%
2.0%
10,7
60.5
12,5
50.5
11,9
67.6
11,6
67.3
11,0
28.9
9,51
0.4
9,32
6.0
9,32
9.4
9,44
1.2
9,54
6.6
9,64
3.0
9,72
7.0
9,
831.
99,
942.
410
,059
.410
,183
.010
,327
.8
10,4
78.4
10,6
38.9
10,8
10.6
10,9
93.9
11,2
02.2
11,4
27.8
11,6
70.4
11,9
31.4
12,2
12.3
12,5
14.7
-1.4
%-1
.9%
1.0%
1.3%
22,8
44.1
19,3
03.2
18,7
07.1
18,5
75.2
17,5
21.3
15,5
54.5
14,9
82.3
15,1
67.4
15,3
56.1
15,5
47.7
15,7
41.7
15,9
47.5
16,1
55.6
16,3
66.9
16,5
81.9
16,7
99.7
17,0
20.9
17,2
45.2
17,4
73.1
17,7
04.5
17,9
39.4
18,1
77.9
18,4
20.1
18,6
66.1
18,9
15.8
19,1
69.5
19,4
27.1
-4.2
%-3
.7%
1.3%
1.1%
17,0
34.4
14,8
43.6
14,3
65.4
14,5
56.8
14,1
46.7
12,4
19.9
12,1
14.9
12,2
65.4
12,4
18.3
12,5
72.5
12,7
27.3
12,8
85.9
13,0
46.7
13,2
08.6
13,3
72.5
13,5
38.9
13,7
08.0
13,8
79.2
14,0
52.6
14,2
41.0
14,4
32.4
14,6
27.1
14,8
23.4
15,0
23.1
15,2
24.5
15,4
29.3
15,6
37.5
-3.4
%-2
.5%
1.2%
1.1%
39,8
78.5
34,1
46.8
33,0
72.5
33,1
32.0
31,6
68.0
27,9
74.4
27,0
97.2
27,4
32.7
27,7
74.5
28,1
20.2
28,4
69.1
28,8
33.4
29,2
02.3
29,5
75.5
29,9
54.4
30,3
38.6
30,7
28.9
31,1
24.4
31,5
25.7
31,9
45.4
32,3
71.8
32,8
05.0
33,2
43.5
33,6
89.1
34,1
40.3
34,5
98.8
35,0
64.5
-3.9
%-3
.1%
1.3%
1.1%
1,43
9.8
1,41
4.5
1,35
8.4
1,31
3.9
1,28
3.7
1,29
4.0
1,27
8.0
1,27
8.0
1,27
8.0
1,27
8.0
1,27
8.0
1,27
8.0
1,27
8.0
1,27
8.0
1,27
8.0
1,27
8.0
1,27
8.0
1,27
8.0
1,27
8.0
1,27
8.0
1,27
8.0
1,27
8.0
1,27
8.0
1,27
8.0
1,27
8.0
1,27
8.0
1,27
8.0
-1.2
%-1
.2%
0.0%
-0.1
%
1,44
8.2
1,44
9.1
1,41
7.4
1,40
5.7
1,21
7.7
1,26
2.5
1,23
8.6
1,23
8.6
1,23
8.6
1,23
8.6
1,23
8.6
1,23
8.6
1,23
8.6
1,23
8.6
1,23
8.6
1,23
8.6
1,23
8.6
1,23
8.6
1,23
8.6
1,23
8.6
1,23
8.6
1,23
8.6
1,23
8.6
1,23
8.6
1,23
8.6
1,23
8.6
1,23
8.6
-1.5
%-1
.9%
0.0%
-0.1
%
2,88
8.0
2,86
3.6
2,77
5.8
2,71
9.6
2,50
1.4
2,55
6.5
2,51
6.6
2,51
6.6
2,51
6.6
2,51
6.6
2,51
6.6
2,51
6.6
2,51
6.6
2,51
6.6
2,51
6.6
2,51
6.6
2,51
6.6
2,51
6.6
2,51
6.6
2,51
6.6
2,51
6.6
2,51
6.6
2,51
6.6
2,51
6.6
2,51
6.6
2,51
6.6
2,51
6.6
-1.3
%-1
.6%
0.0%
-0.1
%
68,6
85.7
63,0
94.5
61,0
72.2
61,1
30.0
58,9
77.4
52,8
72.6
51,4
59.3
51,8
90.3
52,6
48.2
53,4
30.1
54,1
81.6
54,9
35.7
55,7
13.4
56,5
05.4
57,3
34.0
58,2
05.7
59,1
36.2
60,0
52.1
60,9
84.7
61,9
54.2
62,9
41.1
63,9
81.6
65,0
49.8
66,1
28.8
67,2
47.2
68,3
90.9
69,5
77.7
-2.9
%-2
.7%
1.4%
1.3%
266
264
263
264
264
264
264
264
264
264
264
264
264
264
264
264
264
264
264
264
264
264
264
264
264
264
264
192
229
231
235
239
244
244
244
244
244
244
244
244
244
244
244
244
244
244
244
244
244
244
244
244
244
244
* S
ourc
e: F
AA
Air
Traf
fic A
ctiv
ity.

101
FAA Aerospace Forecast Fiscal Years 2010–2030ta
Ble
32
to
tal
tr
ac
oN
op
er
atio
Ns
(In T
hous
and
s)
FIS
CA
Ly
EA
RA
IRC
AR
RIE
RA
IR T
AX
I/C
OM
MU
TER
GE
NE
RA
LA
vIA
TIO
NM
ILIT
AR
yTO
TAL
His
toric
al*
2000
2005
2006
2007
2008
2009
E
Fore
cast
2010
2011
2012
2013
2014
2015
2016
2017
2018
2019
2020
2021
2022
2023
2024
2025
2026
2027
2028
2029
2030
Avg
Ann
ual G
row
th20
00-0
920
09-1
020
10-2
020
09-3
0
16,3
95.0
14,1
23.4
13,9
63.3
14,3
66.0
14,4
38.8
13,2
95.7
13,1
31.2
13,3
66.0
13,7
67.3
14,1
60.4
14,5
15.8
14,8
76.9
15,2
37.7
15,6
05.8
16,0
06.5
16,4
47.2
16,9
24.0
17,3
61.2
17,8
07.6
18,2
63.3
18,7
18.5
19,2
07.8
19,6
99.6
20,1
75.8
20,6
76.3
21,1
73.7
21,6
92.7
-2.3
%-1
.2%
2.6%
2.4%
11,1
97.7
12,7
51.1
12,0
35.7
11,6
75.8
11,0
43.1
9,60
4.8
9,37
2.3
9,37
5.7
9,48
4.0
9,58
6.1
9,67
9.4
9,76
0.8
9,86
2.3
9,96
9.2
10,0
82.3
10,2
01.9
10,3
41.8
10,4
87.2
10,6
42.1
10,8
07.7
10,9
84.5
11,1
85.2
11,4
02.4
11,6
35.8
11,8
86.7
12,1
56.6
12,4
46.8
-1.7
%-2
.4%
1.0%
1.2%
20,7
99.2
17,3
88.9
17,0
05.3
16,7
47.4
15,7
56.5
14,1
16.3
14,0
74.9
14,2
30.3
14,3
93.5
14,5
59.0
14,7
26.6
14,9
01.7
15,0
78.7
15,2
58.3
15,4
41.0
15,6
26.1
15,8
13.9
16,0
04.3
16,1
97.7
16,3
93.9
16,5
79.5
16,7
95.2
17,0
00.3
17,2
08.6
17,4
20.0
17,6
34.5
17,8
52.3
-4.2
%-0
.3%
1.2%
1.1%
3,46
6.9
2,79
8.7
2,66
9.9
2,49
8.7
2,39
8.8
2,38
5.8
2,38
3.4
2,38
3.4
2,38
3.4
2,38
3.4
2,38
3.4
2,38
3.4
2,38
3.4
2,38
3.4
2,38
3.4
2,38
3.4
2,38
3.4
2,38
3.4
2,38
3.4
2,38
3.4
2,38
3.4
2,38
3.4
2,38
3.4
2,38
3.4
2,38
3.4
2,38
3.4
2,38
3.4
-4.1
%-0
.1%
0.0%
0.0%
51,8
58.8
47,0
62.1
45,6
74.2
45,2
88.0
43,6
37.2
39,4
02.6
38,9
61.8
39,3
55.4
40,0
28.2
40,6
88.9
41,3
05.2
41,9
22.8
42,5
62.1
43,2
16.7
43,9
13.3
44,6
58.5
45,4
63.1
46,2
36.0
47,0
30.8
47,8
48.3
48,6
65.9
49,5
71.6
50,4
85.7
51,4
03.5
52,3
66.4
53,3
48.1
54,3
75.3
-3.0
%-1
.1%
1.6%
1.5%
* S
ourc
e: F
AA
Air
Traf
fic A
ctiv
ity.

FAA Aerospace Forecast Fiscal Years 2010–2030
102
taB
le 3
3
iFr
air
cr
aFt
Ha
Nd
led
at F
aa
air
ro
Ut
e t
ra
FFic
co
Nt
ro
l c
eN
te
rs
(In T
hous
and
s)
FIS
CA
Ly
EA
R
IFR
AIR
CR
AFT
HA
ND
LED
AIR
CA
RR
IER
AIR
TA
XI/
CO
MM
UTE
RG
EN
ER
AL
Av
IATI
ON
MIL
ITA
Ry
TOTA
L
His
toric
al*
2000
2005
2006
2007
2008
2009
E
Fore
cast
2010
2011
2012
2013
2014
2015
2016
2017
2018
2019
2020
2021
2022
2023
2024
2025
2026
2027
2028
2029
2030
Avg
Ann
ual G
row
th20
00-0
920
09-1
020
10-2
020
09-3
0
24,9
87.0
25,0
04.6
24,3
94.5
25,0
06.2
23,8
47.3
22,2
16.7
22,0
51.3
22,5
42.5
23,4
00.4
24,2
88.0
25,1
35.6
25,9
99.9
26,8
67.2
27,7
57.1
28,7
21.5
29,7
57.4
30,8
55.7
31,9
27.4
33,0
14.8
34,1
30.2
35,2
64.1
36,4
82.2
37,7
00.4
38,9
18.5
40,1
85.9
41,4
76.3
42,8
19.8
-1.3
%-0
.7%
3.4%
3.2%
8,10
0.9
10,0
53.9
9,43
6.7
9,65
2.9
10,1
74.1
8,54
3.9
8,22
2.7
8,24
5.5
8,36
0.0
8,48
2.6
8,60
1.3
8,69
4.4
8,80
2.1
8,92
1.3
9,03
8.2
9,15
1.6
9,27
0.4
9,40
2.3
9,54
3.8
9,68
9.7
9,84
3.4
10,0
09.2
10,1
84.5
10,3
70.3
10,5
63.0
10,7
67.3
10,9
82.6
0.6%
-3.8
%1.
2%1.
2%
8,74
4.3
8,36
7.7
8,19
7.0
8,29
4.3
7,66
4.7
6,30
5.8
6,13
8.2
6,19
4.0
6,25
1.2
6,30
8.3
6,36
5.1
6,42
3.6
6,48
1.9
6,54
0.5
6,59
9.5
6,65
8.7
6,71
8.3
6,77
8.3
6,83
8.8
6,89
9.8
6,95
7.2
7,02
3.4
7,08
6.1
7,14
9.4
7,21
3.4
7,27
8.0
7,34
3.2
-3.6
%-2
.7%
0.9%
0.7%
4,19
2.5
4,05
2.0
4,14
9.7
3,80
3.3
3,64
8.8
2,99
1.7
2,99
1.1
2,99
1.1
2,99
1.1
2,99
1.1
2,99
1.1
2,99
1.1
2,99
1.1
2,99
1.1
2,99
1.1
2,99
1.1
2,99
1.1
2,99
1.1
2,99
1.1
2,99
1.1
2,99
1.1
2,99
1.1
2,99
1.1
2,99
1.1
2,99
1.1
2,99
1.1
2,99
1.1
-3.7
%0.
0%0.
0%0.
0%
46,0
24.8
47,4
78.1
46,1
77.8
46,7
56.7
45,3
34.9
40,0
58.1
39,4
03.2
39,9
73.1
41,0
02.6
42,0
69.9
43,0
93.1
44,1
08.9
45,1
42.3
46,2
09.9
47,3
50.2
48,5
58.8
49,8
35.4
51,0
99.0
52,3
88.4
53,7
10.8
55,0
55.8
56,5
05.8
57,9
62.1
59,4
29.2
60,9
53.3
62,5
12.6
64,1
36.7
-1.5
%-1
.6%
2.4%
2.3%
* S
ourc
e: F
AA
Air
Traf
fic A
ctiv
ity.


HQ-1
0107
6


![Air Traffic Management 2030 Strategy: Scoping StudyAir Traffic Management 2030 Strategy ± Scoping Study Final Report Author [Redacted1], Helios Aerospace Boulevard ... An airport](https://img.pdfslide.net/doc/110x75/5e7b9e914567854e9d6599b7/air-traffic-management-2030-strategy-scoping-air-traffic-management-2030-strategy.jpg)


![Design of a Single Pilot Cockpit for Airline Operations · [2] FAA Aerospace Forecast Fiscal Years 2013-2033, Washington, DC: FAA, 2013. [3] "US Air Carrier Traffic Statistics Through](https://img.pdfslide.net/doc/110x75/5bfca18d09d3f297368b90d9/design-of-a-single-pilot-cockpit-for-airline-operations-2-faa-aerospace-forecast.jpg)