Embed Size (px)
Citation preview
The Pennsylvania State University
The Graduate School
College of Engineering
FABRICATION AND PURIFICATION OF SELF-MOTILE NOBLE
METAL-SEMICONDUCTOR ACTIVE COLLOIDAL DEVICES
A Dissertation in
Chemical Engineering
by
Joseph J. McDermott
2011 Joseph J. McDermott
Submitted in Partial Fulfillment
of the Requirements
for the Degree of
Doctor of Philosophy
December 2011
The dissertation of Joseph J. McDermott was reviewed and approved* by the following:
Darrell Velegol
Professor of Chemical Engineering
Dissertation Advisor
Chair of Committee
Michael Janik
Assistant Professor of Chemical Engineering and Chair of the Brennan Clean
Energy Early Career Professorship
Themis Matsoukas
Professor of Chemical Engineering
Ayusman Sen
Distinguished Professor of Chemistry
Andrew L. Zydney
Walter L. Robb Chair and Professor of Chemical Engineering
Head of the Department of Chemical Engineering
*Signatures are on file in the Graduate School
iii
ABSTRACT
Colloidal assembly is a field of scientific research that can be found at the intersection of
many fields and disciplines. As a result, chemists, physicists, materials scientists, and chemical
engineers are all active in assembly research. However, most assemblies currently being
fabricated are of model systems (such as assemblies of inert polymer microparticles) and are
assembled using material-specific techniques that produce only lab scale quantities of product.
In this work, the chemical engineering aspects of colloidal assembly are explored. The
primary question being: how can we design, build, and purify a functional colloidal assembly,
using techniques that are generalized and scalable, envisioning the entire colloidal assembly
process as one might picture a chemical plant. The two most important steps in this process, both
the assembly of the product from component particles and the separation and purification of the
product, are considered.
The functional colloidal assembly produced here is a three-component colloidal ‗trimer‘
consisting of three micron-sized particles attached in a specific order, i.e., gold – cadmium sulfide
– silver, but without a specific orientation. The assembly process used to form these trimers is
developed and characterized in this work. It is a diffusion-limited, selective, controlled
aggregation process called ‗Quenched Electrostatic Assembly‘.
When placed into a solution of hydrogen peroxide, these trimers act as photoresponsive
catalytic motors. Through selective decomposition of the peroxide and other
photoelectrochemical reactions, the motor induces a localized ionic concentration gradient which
moves the motor and other particles around it through electro- or diffusiophoresis. Other systems
explored using similar principles are gold-silver heterodoublet motors, calcium carbonate
diffusion-induced micropumps and motors, and flows in microchannels due to dissolution and
passivation of disturbed geologic samples.
iv
Because colloidal assembly is such a broad field, this work encompasses many different
fields: interparticle forces, diffusion and aggregation kinetics, catalysis, photoelectrochemistry,
geology, and solution electrodynamics, along with many types of colloidal functionalization and
analysis.
v
TABLE OF CONTENTS
LIST OF FIGURES ................................................................................................................. xi
LIST OF TABLES ................................................................................................................... xvii
ACKNOWLEDGEMENTS ..................................................................................................... xviii
Chapter 1: Motivation and Research Goals ............................................................................ 1
1.1 Motivation and Background for the Work ................................................................. 1
1.1.1 Colloids and Commercialization ..................................................................... 1
1.1.2 Colloidal Motors are Ideal as Complex, Functional Assemblies ..................... 3
1.2 Research Goals ........................................................................................................... 6
1.3 Dissertation Outline .................................................................................................... 7
1.3.1 General Overview ............................................................................................ 7
1.3.2 Chapter 2: Colloidal Assembly as a Chemical Engineering Process ............... 7
1.3.3 Chapter 3: Effective Density Sorting of Soft Colloidal Spheres ...................... 8
1.3.4 Chapter 4: Simple Fabrication of Gold-Silver Heterodoublet Motors ............. 8
1.3.5 Chapter 5: Colloidal Trimers Fabricated Through Quenched Electrostatic
Assembly ........................................................................................................... 9
1.3.6 Chapter 6: Dissolution-Induced Fluid Pumping in Disturbed Geologic
Formations ........................................................................................................ 9
1.3.7 Chapter 7: Photoresponsive Metal - Cadmium Sulfide Colloidal
Micromotor Assemblies .................................................................................... 10
1.3.8 Chapter 8: Conclusions and Future Work ........................................................ 11
1.4 References ................................................................................................................... 11
Chapter 2: Colloidal Assembly as a Chemical Engineering Process ....................................... 14
2.1 Introduction ................................................................................................................. 14
2.2 Background ................................................................................................................. 15
2.2.1 Colloidal Assemblies are High-Value Products ............................................... 15
vi
2.2.2 Control of Interparticle Forces Enables ―Bottom-Up‖ Processes .................... 16
2.2.3 Microfactories Have Quickly-Adaptable, Batch Unit Operations ................... 18
2.2.4 Conclusions and Outlook ................................................................................. 23
2.3 Microfactories in the Context of this Dissertation ...................................................... 24
2.4 Acknowledgements and Copyright Information ......................................................... 26
2.5 References ................................................................................................................... 27
Chapter 3: Effective Density Sorting of Soft Colloidal Spheres.............................................. 30
3.1 Introduction & Background ........................................................................................ 30
3.2 Experimental Methods and Materials ......................................................................... 31
3.2.1 Sedimentation Sample Preparation and Materials ........................................... 31
3.2.2 Experimental .................................................................................................... 32
3.2.3 Confocal Microscope Sample Preparation ....................................................... 32
3.2.4 SEM Sample Preparation and Imaging ............................................................ 33
3.3 Results and Discussion ................................................................................................ 34
3.3.1 Preliminary Macroscopic Observations and Results........................................ 34
3.3.2 Proposed Model for Separation: Effective Density Sorting ............................. 37
3.3.3 Comprehensive Experimental Results for Effective Density Sorting .............. 40
3.3.4 Sediment Structure and Observed Packed Particle Mobility ........................... 42
3.4 Conclusions ................................................................................................................. 47
3.5 Acknowledgements and Permissions .......................................................................... 49
3.6 References ................................................................................................................... 50
Chapter 4: Simple Fabrication of Gold-Silver Heterodoublet Motors .................................... 53
4.1 Introduction & Background ........................................................................................ 53
4.1.1 Introduction ...................................................................................................... 53
4.1.2 Literature Review............................................................................................. 53
vii
4.1.3 Chapter Aims & Overview .............................................................................. 55
4.2 Experimental Methods & Materials ............................................................................ 57
4.2.1 Materials .......................................................................................................... 57
4.2.2 Gold and Silver Colloid Synthesis and Characterization ................................. 58
4.2.3 Doublet Formation and Purification ................................................................ 59
4.2.4 Electrical Connectivity of Doublets ................................................................. 61
4.2.5 Stability of Doublets Under Sonication ........................................................... 61
4.3 Results & Discussion .................................................................................................. 62
4.3.1 Doublet Formation and Aggregate Distribution .............................................. 62
4.3.2 Doublet Purification ......................................................................................... 65
4.3.3 Doublet and Aggregate Stability ...................................................................... 66
4.3.4 Motility of Gold-Silver Doublets .................................................................... 67
4.4 Conclusions ................................................................................................................. 69
4.5 Acknowledgements and Permissions .......................................................................... 69
4.6 References ................................................................................................................... 70
Chapter 5:Colloidal Trimers Fabricated Through Quenched Electrostatic Assembly ............. 73
5.1 Introduction & Background ........................................................................................ 73
5.1.1 Introduction ...................................................................................................... 73
5.1.2 Literature Review............................................................................................. 74
5.1.3 Chapter Aims & Overview .............................................................................. 74
5.2 Experimental Methods & Materials ............................................................................ 76
5.2.1 Materials ......................................................................................................... 76
5.2.2 Instrumentation ................................................................................................ 76
5.2.3 Silicon Microparticle Preparation: .................................................................. 77
5.2.4 Synthesis of Gold and Silver Particles: ............................................................ 77
viii
5.2.5 Functionalization of Silicon and Silica Particles with a Positively-Charged
Polyelectrolyte. ................................................................................................ 78
5.2.6 Zeta Potentials. ................................................................................................ 78
5.2.7 Trimer Fabrication. ......................................................................................... 79
5.2.8 SEM Sample Preparation. ................................................................................ 79
5.2.9 Mechanical Stability Testing / Nanoparticle ―Glue‖ Fusing. .......................... 80
5.2.10 Functionality of Trimers as Catalytic Motors. .............................................. 80
5.3 Results and Discussion ................................................................................................ 81
5.3.1 Description of the QEA Technique .................................................................. 81
5.3.2 Analysis of Trimers Formed Using the QEA Technique ................................. 82
5.3.3 Purification and Stability of the Assemblies .................................................... 85
5.3.4 Three-component Motors Fabricated Using QEA ........................................... 87
5.3.5 Optimization of Trimer Yield: Diffusion-Limited Aggregation of
Core/Satellite Assemblies ................................................................................. 88
5.4 Conclusion .................................................................................................................. 92
5.5 Acknowledgements &Permissions .............................................................................. 93
5.6 References ................................................................................................................... 94
Chapter 6: Dissolution-Induced Fluid Pumping in Disturbed Geologic Formations ............... 96
6.1 Introduction & Background ........................................................................................ 96
6.2 Experimental Methods & Materials ............................................................................ 97
6.2.1 Materials .......................................................................................................... 97
6.2.2 Calcium and Barium Carbonate Microparticle Synthesis ................................ 98
6.2.3 Observation of Pumping Behavior of Carbonate Microparticles ..................... 98
6.2.4 Observation of Pumping Behavior of Natural Rock Samples ......................... 99
6.2.5 Fabrication and Characterization of Calcium Carbonate Heterodoublet
Micromotors ...................................................................................................... 99
ix
6.3 Results and Discussion ................................................................................................ 100
6.3.1 Analysis of Calcium Carbonate Micropumps .................................................. 100
6.3.2 Aqueous Equilibrium of Calcium Carbonate ................................................... 104
6.3.3 Concentration Profile and Diffusiophoretic Velocity Profile for a Calcium
Carbonate Sphere Dissolving into an Infinite Bath ........................................... 106
6.3.4 Flows Generated by Other Geologic Systems ................................................. 112
6.3.5 Calcium Carbonate – sPSL Heterodoublet Motors .......................................... 113
6.4 Conclusions ................................................................................................................. 114
6.5 Acknowledgements & Permissions ............................................................................. 115
6.6 References ................................................................................................................... 116
Chapter 7: Photoresponsive Metal - Cadmium Sulfide Colloidal Micromotor Assemblies .... 117
7.1 Introduction & Background ........................................................................................ 117
7.2 Experimental & Materials ........................................................................................... 119
7.2.1 Materials: ......................................................................................................... 119
7.2.2 Instrumentation: ............................................................................................... 119
7.2.3 Two-Component Motor Fabrication ................................................................ 120
7.2.4 Three Component Motor Fabrication .............................................................. 120
7.2.5 Optical Microscopy / Blue Light Stimulation of Motor Assemblies ............... 121
7.3 Results and Discussion ................................................................................................ 121
7.3.1 Autoelectro- and Autodiffusio-phoretic Flowfields ......................................... 121
7.3.2 Flowfield Mechanics of Three Selected Motors .............................................. 123
7.3.3Reaction Identification and Future Experiments .............................................. 126
7.4 Conclusion .................................................................................................................. 127
7.5 Acknowledgements ..................................................................................................... 128
7.6 References ................................................................................................................... 128
x
Chapter 8: Conclusions and Future Work ................................................................................ 130
8.1 Research Goals: a Retrospective ................................................................................. 130
8.2 Future Work ................................................................................................................ 133
8.2.1 Crafting ‗Intelligent‘ Motors ............................................................................ 133
8.2.2 Effective Density Sorting of Colloidal Aggregates and Continuous
Distributions ...................................................................................................... 134
8.2.3 Engineering Flows in Mineral Systems ........................................................... 135
xi
LIST OF FIGURES
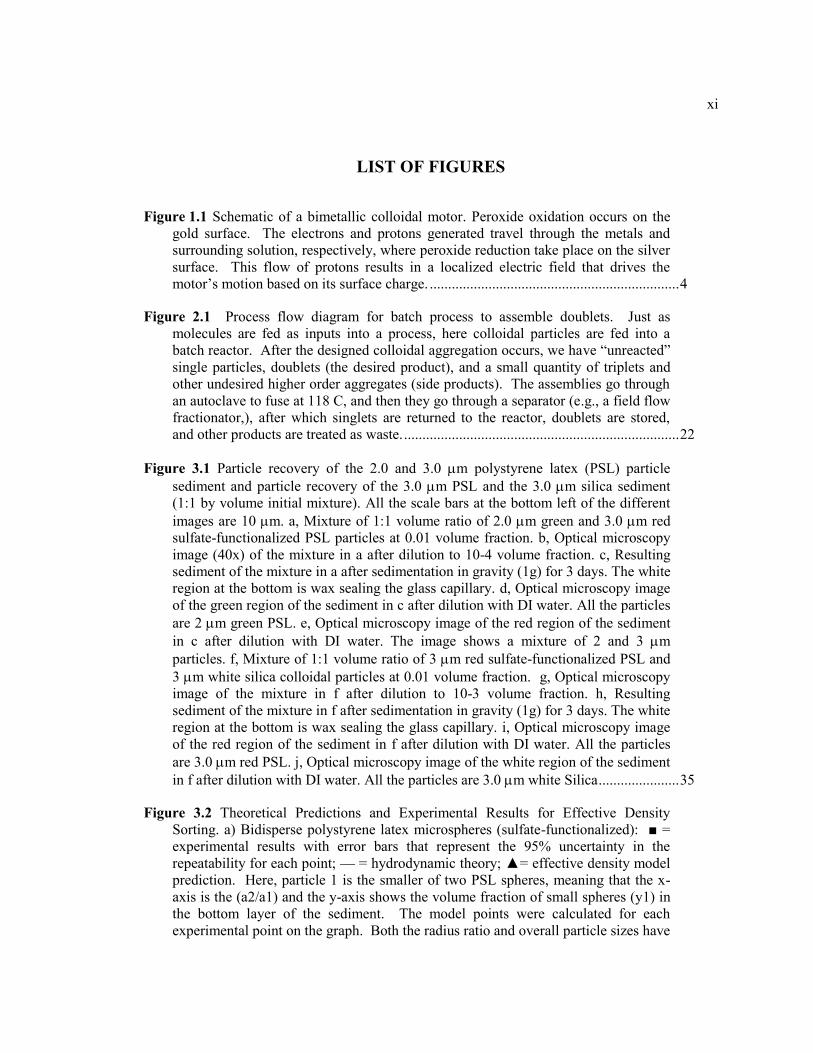
Figure 1.1 Schematic of a bimetallic colloidal motor. Peroxide oxidation occurs on the
gold surface. The electrons and protons generated travel through the metals and
surrounding solution, respectively, where peroxide reduction take place on the silver
surface. This flow of protons results in a localized electric field that drives the
motor‘s motion based on its surface charge. .................................................................... 4
Figure 2.1 Process flow diagram for batch process to assemble doublets. Just as
molecules are fed as inputs into a process, here colloidal particles are fed into a
batch reactor. After the designed colloidal aggregation occurs, we have ―unreacted‖
single particles, doublets (the desired product), and a small quantity of triplets and
other undesired higher order aggregates (side products). The assemblies go through
an autoclave to fuse at 118 C, and then they go through a separator (e.g., a field flow
fractionator,), after which singlets are returned to the reactor, doublets are stored,
and other products are treated as waste. ........................................................................... 22
Figure 3.1 Particle recovery of the 2.0 and 3.0 m polystyrene latex (PSL) particle
sediment and particle recovery of the 3.0 m PSL and the 3.0 m silica sediment
(1:1 by volume initial mixture). All the scale bars at the bottom left of the different
images are 10 m. a, Mixture of 1:1 volume ratio of 2.0 m green and 3.0 m red
sulfate-functionalized PSL particles at 0.01 volume fraction. b, Optical microscopy
image (40x) of the mixture in a after dilution to 10-4 volume fraction. c, Resulting
sediment of the mixture in a after sedimentation in gravity (1g) for 3 days. The white
region at the bottom is wax sealing the glass capillary. d, Optical microscopy image
of the green region of the sediment in c after dilution with DI water. All the particles
are 2 m green PSL. e, Optical microscopy image of the red region of the sediment
in c after dilution with DI water. The image shows a mixture of 2 and 3 m
particles. f, Mixture of 1:1 volume ratio of 3 m red sulfate-functionalized PSL and
3 m white silica colloidal particles at 0.01 volume fraction. g, Optical microscopy
image of the mixture in f after dilution to 10-3 volume fraction. h, Resulting
sediment of the mixture in f after sedimentation in gravity (1g) for 3 days. The white
region at the bottom is wax sealing the glass capillary. i, Optical microscopy image
of the red region of the sediment in f after dilution with DI water. All the particles
are 3.0 m red PSL. j, Optical microscopy image of the white region of the sediment
in f after dilution with DI water. All the particles are 3.0 m white Silica ...................... 35
Figure 3.2 Theoretical Predictions and Experimental Results for Effective Density
Sorting. a) Bidisperse polystyrene latex microspheres (sulfate-functionalized): ■ =
experimental results with error bars that represent the 95% uncertainty in the
repeatability for each point; — = hydrodynamic theory; ▲= effective density model
prediction. Here, particle 1 is the smaller of two PSL spheres, meaning that the x-
axis is the (a2/a1) and the y-axis shows the volume fraction of small spheres (y1) in
the bottom layer of the sediment. The model points were calculated for each
experimental point on the graph. Both the radius ratio and overall particle sizes have
xii
an effect on the final sediment composition, which is why there are two model /
experimental data points given for a certain radius ratios (e.g., systems of 2.0 and 4.0
μm spheres will have the same x-value as systems of 2.5 and 5.0 μm spheres but
have different y-values due to different bottom sediment configurations). b)
Polystyrene latex / poly- methylmethacrylate microspheres (sulfate functionalized):
■ = experimental results with error bars; — = hydrodynamic theory; X = effective
density prediction. Here, particle 1 is the PSL, meaning that the y-axis shows the
volume fraction of PSL spheres (y1) in the top layer of the sediment. ............................ 41
Figure 3.3 Confocal microscopy images of a sediment formed by an initial mixture of
1:1 volume ratio of 4.0 μm red fluorescence and 2.0 μm yellow-green fluorescence
PSL particles and evidence of particle mobility in the packed state. See description
in the text. a, Top layer of the sediment composed exclusively of small particles. b,
Transition zone of the sediment. c, Asederotrope proportion at the lower layers of
the sediment. d, Asederotrope proportion at the bottom of the sediment. The two
images in e were taken at the same point in the sediment 5 seconds apart. Notice that
there is a significant amount of particle movement, especially of the small green
particles, which move in and out of the focal plane. The particles with the highest
mobility have been highlighted to guide the reader. ........................................................ 43
Figure 3.4. Structure of bidisperse packed particle sediments: 1.7 and 2.5 μm sulfate-
functionalized PSL. Details of fixing the particles for electron microscopy imaging
can be found in the section ―SEM Analysis of Packed Sediments‖ in the
Supplementary Discussion. a) Top region of sediment. b) Transition region of
sediment. c) Upper part of bottom region of sediment. d) Lower part of bottom
region of sediment. Note the lack of crystallization of the particles in both the top
and bottom regions of the sediment, and the sharpness of the transition region in b). .... 44
Figure 3.5 Influence of the ―freezing effect‖ on the final state of the sediment. a, 100 mL
of 2.0 μm blue sulfate PSL particles at 0.01 volume fraction were loaded into a glass
Pasteur pipette sealed with wax. b, A sediment was formed after sedimentation of
the sample in a at 1g for 3 days. c, Similarly, another sediment was formed by
centrifuging the sample in a at 1000g for 30 minutes. d, 100 ml of 3.0 μm green
sulfate PSL particles at 0.01 volume fraction were loaded on top of the resulting
sediment (either b or c). e, Final configuration of the system after the 3.0 μm green
particles were settled at 1g for 5 days on top of the sediment produced on b. At the
end, the 2.0 μm blue particles rose to the top. f, Final configuration of the system
after the 3.0 μm green particles were centrifuged at 1000g for 30 minutes on top of
the sediment produced in c. The 2.0 μm blue particles had been ―frozen into place‖
by the high g value, and the system remained unchanged for over 12 months. ............... 46
Figure 3.6 Layers of sorted particles. a, Original mixture of 150 nm gold, 3.0 μm white
Silica, 3.0 μm red Sulfate PSL, 2.0 μm green Sulfate PSL and 0.99 μm Sulfate PSL
at 0.01 volume fraction. b, Front view of the 5 layer cake after centrifugation at
1000g for 30 minutes, with the gold on the bottom; the particles layer according to
the order given in (a). The white region at the bottom is wax sealing the glass
capillary. c, Back view of the 5 layer cake after centrifugation at 1000g for 30
minutes. ............................................................................................................................ 48
xiii
Figure 4.1 FESEM images of synthesized metallic colloids. (a) Gold and (b) silver. The
scale bar at the bottom right of the images is 1 μm. Note that the gold particles are
typically smoother than the silver particles. ..................................................................... 59
Figure 4.2 FESEM images of synthesized metallic colloidal doublets. (a) gold−gold from
the gold-only solution, (b) silver−silver from the silver-only solution, (c) gold−silver
from the gold−silver solution, and (d) gold−gold and silver−silver from the
gold−silver solution images. ............................................................................................ 63
Figure 4.3 Statistics of doublet formation. (a) Statistical results for the original gold
particle stock (before SQ process), doublets after the SQ process but before
sonication, and doublets after sonication of the suspensions. (b) Statistical results for
silver stock, doublets after SQ but before sonication, and doublets after sonication.
(c) Statistical results for gold−silver stock, doublets after SQ but before sonication,
and doublets after sonication. ........................................................................................... 64
Figure 4.4 Optical images of purified gold aggregates. (a) Purified gold singlets, 20×
magnification, roughly 90% purity. (b) Purified gold doublets at 20×, roughly 85%
purity. (c) Purified triplets at 20×, roughly 85% purity. (d) Purified small aggregates
at 40×, with a fairly narrow size distribution. We note that the clarity of the images
is diminished due to the presence of the sucrose. Nevertheless, singlets, doublets,
triplets, and higher aggregates are still discernible. ......................................................... 66
Figure 4.5 Optical time lapse image (20×) of gold−silver and other doublets and
aggregates moving in a 3% hydrogen peroxide solution. Approximate time between
frames is 1/8 s. ................................................................................................................. 68
Figure 4.6 Optical time lapse image (20×) of gold−silver doublet (indicated inside circle)
before (a) and after (b) breakup of the two component particles in 1% peroxide.
Scale bar is 20 μm. Approximate time between frames is 1/2 s, total elapsed time in
each panel is 3 s. Before breakup, the doublet moves in a directed circle. After
breakup, there is no significant non-Brownian movement of either gold or silver
particle. ............................................................................................................................. 68
Figure 5.1 Quenched Electrostatic Assembly Schematic. a) Positive core and negative
satellite particles are mixed. b) and c) The satellites begin to aggregate to the cores
in a diffusion-limited matter due to short-range electrostatic and van der Waals
forces. d) After a particular time, when the desired number of satellites have
aggregated to each core, negatively charged polymer nanoparticles are added to the
solution. e) Due to their high diffusion coefficients, the nanoparticles
electrostatically adhere to and completely cover the core particles, preventing further
satellite aggregation. f) The nanoparticle coating is fused in an autoclave to enhance
the mechanical stability of the assemblies. ...................................................................... 82
Figure 5.2 Colloidal Trimers Produced Using QEA Technique. a), b), and c) consist of
sulfated polystyrene satellites attached to a) amidine-functionalized polystyrene
cores; b) PAH-coated silica cores and c) PAH-coated silicon cores. d), e) and f)
consist of gold and silver satellites attached to these same cores, respectively. The
xiv
aggregation was quenched with 20 nm sulfate-functionalized polystyrene
nanoparticles. Yields were typically around 15% for the two-component trimers (a,
b, c) and around 8% for the three-component trimers (d, e, f). Images captured using
SEM. Images are typical for each sample, which also contained bare core particles,
heterodoublets, and higher-order aggregates. Scale bars are 1 μm. ................................ 84
Figure 5.3 Confocal Fluorescence Microscopy of Quenched Trimers. Fluorescent
yellow-green nanoparticles are visible on the core of each trimer. a) Polystyrene-
silica-polysytrene trimers (Fig. 2b). b) Gold-silica-silver trimer (Fig. 2e). c)
Polystyrene-silicon-polystyrene trimer (Fig. 2c). All images taken with a 60x oil
objective. Scale bars are 5 μm. ........................................................................................ 85
Figure 5.4 Mechanical Stability of Silica-Core Trimers. Two- and three-component
silica-core trimers were sonicated with and without 15 minutes of fusing of the
nanoparticle coatings in an autoclave. Compared to the original sample, nearly all
satellites broke apart from the cores after sonication without fusing the assemblies.
However, there was little to no statistically significant change in the average number
of satellites per core after sonication when the assemblies were fused. Note that the
gold-silica-silver assemblies contained no polymeric components other than the
nanoparticle coating, but still benefitted from considerably enhanced stability upon
fusing. ............................................................................................................................... 87
Figure 5.5 Autoelectrophoresis of Gold-Silicon-Silver Trimer in 3% Hydrogen Peroxide.
Optical microscopy image taken at 20x magnification. Time-lapse image, overlays
are 2 seconds apart. Scale bar is 10 μm. ......................................................................... 88
Figure 5.6 Theoretical Distributions For Three-Component Systems. Each distribution
maximizes a particular configuration, and shows the expected fraction of core
particles with the number of each of two satellites. a) One of each satellite per core
(three-component trimers), theoretical maximum yield 13.5%. b) Two of the first
satellite, one of the second, theoretical maximum yield 10.0%. c) Two of each
satellite particle, theoretical maximum yield 7.3%. d) Two of the first satellite, three
of the second, theoretical maximum yield 6.1%. ............................................................. 92
Figure 6.1 Time-lapse (a,d), vector field (b, e) and radial speed plots (c, f) for one single
pump and two interacting pumps, respectively. These systems contain only calcium
carbonate pumps and 1.4 μm sulfate-functionalized polystyrene latex tracer particles
(sPSL) in DI water, and are filmed on a bare glass substrate using an inverted
microscope. Optical microscopy time-lapse images were taken at 40x magnification
with overlays every 0.2 s. Scale bars in these images are 10 μm. In the vector field
plots, axes are distance in μm. The black circles represent the location of the
micropumps, and the vector arrows represent the tracer particle direction and speed
in μm/s at the substrate surface. The plots were generated by tracking the movement
of 750-1000 particles over 0.3 seconds. In (c), the radial speeds of all sPSL tracers
sampled in (b) are plotted against the distance of those tracers from the center of the
lone calcium carbonate micropump. In (f), the radial speed of tracer particles within
6 microns of the line between the two micropumps in (e) (boxed area shown) is
xv
plotted against the distance of those tracers from the midpoint between the two
pumps. In both cases, curves have been added to guide the eye. .................................... 102
Figure 6.2 Contributing diffusiophoretic effects in the micropump system. The calcium
carbonate particle dissociates into three ions in DI water. Due to difference in
diffusion coefficients of these ions, an electric field arises in the same vector
direction as the radial concentration gradient in order to maintain electroneutrality.
The electric field generates an electroosmotic flow along the charged substrate (in
this work, bare glass in water). Charged tracer particles in the solution have an
electrophoretic velocity either up or down the gradient, depending on the sign of
their charge. The overall flow profile of the tracers is the superposition of their
electrophoretic flow and the electroosmotic flow of the surrounding solution. .............. 103
Figure 6.3 Effect of surface concentration of calcium carbonate micropumps on tracer
particle speed (circle) and length of transport decay (x). By fitting exponential
decay functions to tracer velocity data sampled from optical microscope videos of
the micropumps, the speed of the tracers at the surface of each pump (the theoretical
maximum) and the radial distance at which the tracer speed decays to its half-
maxiumum can be determined. As the surface fraction of calcium carbonate
micropumps in a given sample increases, the speed of the tracer particles sharply
decreases, while the length over which the speed decays grows larger. These
systems were similar to the systems examined in Figures 6.2, containing only
micropumps and sPSL tracers in DI water on bare glass substrates. ............................... 111
Figure 6.4 Time-lapse optical microscopy images of diffusiophoretic pumping of sPSL
tracer particles in mineral systems. a) Barium carbonate microparticle pumping 1.4
μm sPSL tracer particles outward, overlays are 0.33 sec apart, scale bar is 20 μm. b)
Gypsum (calcium sulfate) crystal attracting 3.0 μm sPSL particles inward, overlays
are 2 sec apart, scale bar is 50 μm. d) Large natural calcite rock slice pumping 3.0
μm sPSL tracers outward in a 0.9 mm square glass capillary, individual captures are
66.7 seconds apart, scale bar is 200 μm ........................................................................... 113
Figure 6.5 Time-lapse optical microscopy of a diffusiophoretic sPSL-CaCO3
heterodoublet micromotor. Overlays are 2 s apart, 16 s total. Inset identifies
heterodoublet components. Scale bar is 10 μm. The CaCO3 particle is creating a
diffusiophoretic concentration gradient that drives the sPSL particle to move, pulling
the CaCO3 along with it. ................................................................................................. 114
Figure 7.1: Autoelectrophoretic (a) and autodiffusiophoretic (b) field lines surrounding a
three-component motor. In the autoelectrophoresis case, the electric field is
localized, resulting in a motor that only affects the movement of fluid or other
particles that are near to its surface. In the autodiffusiophoresis case, the field lines
spread outward from the motor into solution, affecting large regions of the system. ...... 123
Figure 7.2 Time-lapse optical microscopy of a various motor systems. a) Au-Ag
aggregate motor in 0.1% H2O2, overlays are 2 s apart, scale bar is 10 μm. b) Ag-
CdS motor in 100% intensity blue light, DI water, overlays are 5 s apart, scale bar is
20 μm. c)Au-CdS-Ag trimer motor in 0.1% H2O2, 25% intensity blue light applied,
xvi
overlays are 2 s apart, scale bar is 10 μm. d) Same Au-CdS-Ag trimer motor as in
(c), in 0.1% H2O2, 100% intensity blue light applied, overlays are 2 s apart, scale
bar is 10 μm. ................................................................................................................... 125
xvii
LIST OF TABLES
Table 4.1: Aggregation Conditions for SQ Metallic Doublet Formation ............................... 60
Table 5.1: Experimental Conditions for Six Trimer Systems ................................................. 79
Table 6.1: Effect of KCl Ions on Zeta Potentials and Micropump Flow ................................ 110
Table 7.1 Motor Systems Fabricated Using In-Solution Assembly ........................................ 124
xviii
ACKNOWLEDGEMENTS
I think in my heart I always knew I‘d end up at Penn State. That‘s what happens when
you‘re born and raised Blue and White. My father, having grown up in Clearfield just 45 minutes
west of State College, got both his Bachelors and his Masters degrees here, and even after he
moved to Pittsburgh he made nearly every home game when I was growing up. At least once a
season, he‘d take me with him. We‘d stay with my grandparents on Friday night, then wake up
early on Saturday and join the caravan of cars trekking east along Rt 322, backed up for miles,
from the Stadium Lot to Port Matilda. I wasn‘t the biggest football fan when I was younger, but I
knew that those games I attended were something special. Penn State was something special.
Even as I proudly and arbitrarily announced to my parents in middle school that I was
going to Carnegie Mellon (which I somehow managed to accomplish several years later), a little
voice in the back of my head told me that I would find my way back to State College eventually.
I remember attending the 2005 Ohio State game with my dad, cousin, and college roommate. At
that point, I was still unsure if graduate school was the right place for me. After that game, I
knew that if any grad school was indeed a part of my future, it was Penn State. And so here I am.
I‘m happy to say, almost 6 years later, that Penn State was absolutely the right place for
me, even if it was for reasons completely different than the ones running through my head as a
college senior. I may have been entranced by the football community back then, but I leave here
knowing it is the scientific community that made these past 5 years so special. That community,
really more of a family for me, is naturally based around my lab group. Their friendship, support,
and collaboration have made me into the scientist – and person – that I am today, and for that they
have my heartfelt thanks.
xix
I‘ll start by thanking the senior lab members, Dr. Allison Yake and Dr. Charles Snyder,
who always made the time and effort to be a mentor to the three incoming first-year students
Darrell heaped on them as they were trying to graduate. I now understand how difficult it can be
to be active in the lab during such a frantic time. Dr. Huda Jerri always pushed me to be a better
grad student and scientist (even when it was out of spite), and our long list of mostly unsuccessful
collaborations managed to eventually bear fruit: without her, calcium carbonate would have never
entered the lab. Each one of my fellow students and collaborators, Dr. Neetu Chaturvedi, Dr. Li-
Ju Wang, Cesar Gonzalez Serrano, Laura Mely Ramirez, and Tso-Yi Chiang have all made a big
impact on the work that I have done. The work I present in this dissertation is stitched together
from the fabric of a thousand conversations and ideas gained by their presence, and I must thank
them all for that. I‘ve also been blessed with so many excellent undergraduate researchers and
collaborators: Erin, Chris, Dave, Kristin, Majd, Steve, and Nick, and many others have helped me
become a better teacher and mentor – skills that I know will be important to me in the future – as
well as accomplishing mountains of research.
Finally, the Velegol lab is what it has been for me solely on the efforts, dreams, and
vision of one person: my advisor Professor Darrell Velegol. Darrell is an excellent scientist –
I‘ve rarely seen anyone‘s face light up so much in the middle of an ‗exciting‘ derivation. He is
also a great writer and thinker, always knowing how to ask the right questions to frame the work
we‘ve done. However, where Darrell excels the most is in his abilities as a mentor. I have
honestly never met anyone so dedicated to serving the individual needs of the people in his
charge. He is capable of being entirely different from person to person and from day to day,
tirelessly working to serve the needs of each individual at each moment. Through his help and
support, I have decided to pursue a career in academic, in no small part due to the inspiring figure

xx
of a leader I have worked with these past five years. For that, and for so many other things, I owe
Darrell my deepest gratitude and respect.
My time in grad school has not always been easy (for reasons that have nothing to do
with work), but the Chemical Engineering department here at Penn State, all of its staff and
faculty, and especially my fellow graduate students, have been there for me in ways to numerous
to count. I also must thank my thesis committee, Profs. Michael Janik, Themis Matsoukas, and
Ayusman Sen, for all their time and effort throughout the years, and especially these last few
weeks given the rushed nature of this thesis and defense. In particular, Prof. Sen has been an
outstanding collaborator to our group, involving us in so many new projects and ideas, and
always willing to listen to the ‗Chemical Engineering‘ perspective. His guidance, especially in
the past year, has been truly invaluable, and he has always pushed us to shoot higher and be better
in everything we do.
Outside of the crazy world of graduate school, in fact, outside of this crazy town of State
College, lies the city of Rochester, NY. There in that city, for the past five years, has been the
love of my life, my beautiful fiancée, Ashley Anderson. Our relationship hasn‘t always been
easy, with 3.5 hours of distance, but it has been essential. Everything we have done, together or
apart, since college, has continued to bring us closer to our goal: finally being together (in the
same place!) - now hopefully less than a year away. Ash brings out the best in me, keeps me in
check, handles my stress, and lets me return the favor. I can‘t wait to start my life with her.
Finally, at the end of all these acknowledgements, I find myself back at the beginning:
thanking my family, especially my parents. I thank my mother, Michele McDermott, for her
guidance and support, but more importantly for her compassion and kindness. She has set an
example for me to live by every day, and will always have a place in my heart (and in the back of
mind), helping me to do what is good and what is right. And lastly, I am a very lucky person: a
xxi
love of Penn State wasn‘t the only legacy my father, Joseph M. McDermott, gave to me. I don‘t
really have the words for how big of an impact my father has had on me, so this will have to
suffice: I will spend a lifetime following in his footsteps, and if I end up just a fraction of the
person he was, I will consider myself truly blessed.
xxii
“The really important kind of freedom involves attention, and awareness, and discipline, and
effort, and being able truly to care about other people and to sacrifice for them, over and over, in
myriad petty little unsexy ways, every day. That is real freedom. The alternative is
unconsciousness.”
-David Foster Wallace
“Destiny is what we work toward. The future doesn't exist yet. Fate is for losers”
-Douglas Coupland
Chapter 1
Motivation and Research Goals
1.1 Motivation and Background for the Work
1.1.1 Colloids and Commercialization
Colloidal assembly is undergoing a renaissance of sorts. What began as a means to an end
for individual applications has become an independent field with equal contributions from
physicists, chemists, chemical engineers and materials scientists. Both the colloidal systems
being studied and the assembly techniques being developed are increasingly diverse and complex.
With progressively more control over particle functionalization, the development of template- and
field-driven assembly techniques, and novel manipulation of solution conditions, model
assemblies of colloidal particles can be found in all shapes, sizes, and material types.
As-synthesized colloidal particles have found many uses in industry, from historic
applications in inks, paints, and food additives,1,2,3
to more recent applications in displays4,
microfluidics5, photonics
6, chemical-
7 and bio- sensing
8 and capsule fabrication for delivery and
transport9. While synthesis of multimetallic colloidal particles can be difficult, synthesis of single
metal particles is much easier. Gold nanoparticle sols were synthesized by Faraday in the 1800s2.
Expanding on the basic chemistry of this synthesis, many types of metallic dispersions with
individual particle sizes from nanometers to microns have been formed in recent years. In fact,
recipes for colloidal dispersions of various sizes and materials are readily available in field-
specific journals such as Langmuir and Journal of Colloid and Interface Science as well as more
general publications such as Journal of the American Chemical Society and Physical Review
2
Letters. In many cases, these syntheses can be scaled to create large volumes of particles within
tight specifications. As a result, commercialization of specialty colloid products has begun, with
companies such as Interfacial Dynamics Corporations selling polystyrene latex particles with
buyer-dictated sizes and functionalities10
.
Commercialization of assembled or fabricated colloidal particles (i.e., particles made of
two or more preexisting component particles assembled into a single structure and held together
by interparticle forces), however, is considerably more rare. To promote commercialization, one
of the primary challenges on the horizon for all scientists studying colloidal assembly is the
development of useful and functional assemblies. In other words, while we have the bin full of
individual Legos and we understand how they fit together, we don‘t know if we‘re building a
house, a spaceship, or just a random pile of bricks. This problem is compounded by the fact that
many assembly techniques work only with very specific colloidal systems. For example,
complex assemblies of particles in alternating electric or magnetic fields may exhibit their unique
behavior only for particles of a certain size and material type11,12
. Other physical assembly
techniques, such as microfluidic cojetting13
or monomer swelling and dewetting14
, rely on specific
particle-solution interactions to induce phase separation. In addition to the restrictive specificity
of these assembly techniques, there is also the problem of scale. Techniques such as assembly in
microfabricated templates15,16
often cannot produce a useful number of particles to have any
realistic industrial applications.
Fabrication techniques that are both scalable and general enough to show promise for
producing large numbers of functional colloidal assemblies are control of aggregation17,18
,
assembly in microfluidic networks,19
and assembly at interfaces20
. The expertise of the Velegol
lab group is in the manipulation and control of colloidal aggregation, by controlling dispersion
thermodynamics18
and through site-specific functionalization of individual particles21
. Our
assembly techniques are designed to be specific enough to build functional assemblies with
3
desired structures or particle orders, but generalized enough to be used for a large number of
systems. Additionally, we strive to take the scalability of our techniques into account, although
this work does not demonstrate any experimental attempts made at scale-up.
1.1.2 Colloidal Motors are Ideal as Complex, Functional Assemblies
The chemistry behind the colloidal motor systems built in this work was initially
developed by Professors Ayusman Sen and Tom Mallouk in the Department of Chemistry at Penn
State University22,23,24
. Transition metals have long been known to catalyze the decomposition of
hydrogen peroxide. When two transition metals with different work functions and thus different
catalytic activities are placed into electrical contact in a peroxide solution, the two half reactions
of the catalyzed decomposition reaction will take place preferentially on the two different
metals24
. The metal functioning as the anode oxidizes a peroxide molecule into protons,
electrons, and oxygen gas. The proton and electron reaction products then travel to the metal
functioning as the cathode, where they reduce another peroxide molecule to form water. Figure
1.1 shows a schematic of this system. While the oxidation and reduction reactions are necessary
parts of the motor‘s chemistry, it is the transport step of protons and electrons moving from the
anode to the cathode that drives the autoelectrophoresis of the assembly. The electron moves
easily through the assembly, travelling in conduction bands from one metal to the other,
overcoming a slight diode potential in the process (trivial as the overall cell potential for the
decomposition reaction is 1.094 V vs. SHE25
). The proton, however, must move through solution
to reach the anode. Of course, protons are readily available in water, so it is easier to think of the
solution surrounding the anode as proton-rich and the area surrounding the cathode as a proton-
depleted. The ionic gradient of protons in the solution surrounding the motor acts as a localized
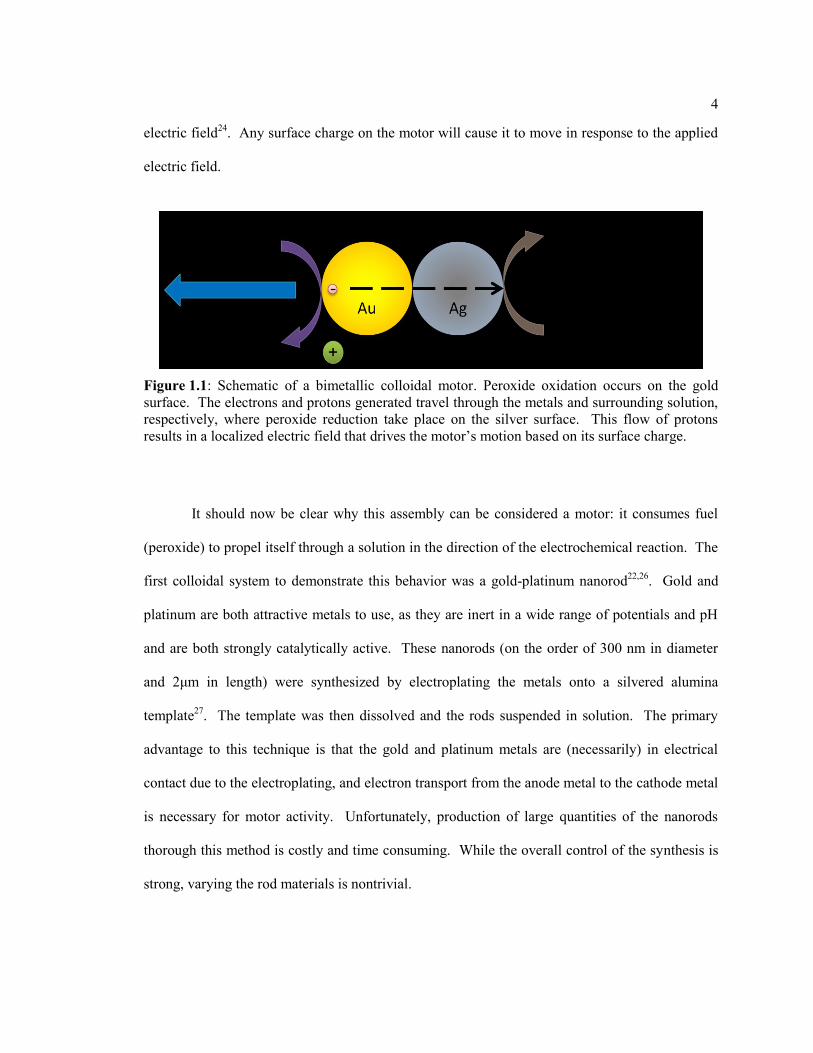
4
electric field24
. Any surface charge on the motor will cause it to move in response to the applied
electric field.
It should now be clear why this assembly can be considered a motor: it consumes fuel
(peroxide) to propel itself through a solution in the direction of the electrochemical reaction. The
first colloidal system to demonstrate this behavior was a gold-platinum nanorod22,26
. Gold and
platinum are both attractive metals to use, as they are inert in a wide range of potentials and pH
and are both strongly catalytically active. These nanorods (on the order of 300 nm in diameter
and 2μm in length) were synthesized by electroplating the metals onto a silvered alumina
template27
. The template was then dissolved and the rods suspended in solution. The primary
advantage to this technique is that the gold and platinum metals are (necessarily) in electrical
contact due to the electroplating, and electron transport from the anode metal to the cathode metal
is necessary for motor activity. Unfortunately, production of large quantities of the nanorods
thorough this method is costly and time consuming. While the overall control of the synthesis is
strong, varying the rod materials is nontrivial.
Figure 1.1: Schematic of a bimetallic colloidal motor. Peroxide oxidation occurs on the gold
surface. The electrons and protons generated travel through the metals and surrounding solution,
respectively, where peroxide reduction take place on the silver surface. This flow of protons
results in a localized electric field that drives the motor‘s motion based on its surface charge.
5
Colloidal motors are excellent examples of complex, functional assemblies. They are
typically multicomponent particles or assemblies made of specific materials arranged in a specific
way. They perform a task (autonomous movement) in response to a stimulus (here, hydrogen
peroxide), and therefore have a definite function. In this work, I work to expand on existing
motor technology in two ways: First, by integration of a third material (which I will term the
‗gate‘ material) between the anode and cathode metals of the motor, I will attempt to regulate the
flow of electrons in the motor and therefore control the motor‘s activity. The obvious choice for
a generalized gate material is an undoped semiconductor. By choosing a material, cadmium
sulfide, that has inherently low conductivity (i.e., fully insulating) at ambient conditions I can
assure the motors are not initially active. Because CdS has a bandgab in the shortwave visible
light region, I can increase the conductivity of the gate material by exposing it to blue/green light,
activating the motor. Ideally by varying the intensity of the light, I can externally control the
speed of the motor.
By assembling this improved motor setup rather than synthesizing it outright, the
opportunity arises to craft a generalized assembly technique that allows for rapid prototyping of
various gate, anode and cathode materials. This is the second improvement on the existing motor
design. This assembly is more complex than many previous assemblies my lab has fabricated,
but it also represents the next logical step in assembly work in the Velegol lab. We have made
homodoublets18
, heterodoublets18,21
, site-specific functionalized particles and capsules21,28
, and
even a colloidal ‗water‘ molecule made of two different materials29
. The motor is essentially a
‗trimer‘ of three different materials. These materials must be assembled in a specific fashion
(anode touching gate touching cathode), and the assembly technique must be as general as
possible. The accomplishment of this task gives us a quick, inexpensive way to assemble motors
of many different materials that can be tested against the idealized gold-platinum nanorods on
which the work was founded.
6
1.2 Research Goals
In this dissertation, I look at the process of colloidal assembly, specifically in the context
of catalytic motor particles, from start to finish, and set forth the following research goals:
1) Assemble a „traditional‟ bimetallic catalytic motor from component metal
microparticles, and assess its motility in hydrogen peroxide.
2) Work to analyze the movement of assembled motors and surrounding particles
owing to localized, self-generated electroosmotic and diffusioosmotic flowfields.
3) Craft a generalized, flexible assembly technique that allows for the fabrication
of three-component, ordered „trimer‟ particles.
4) With the knowledge gained from goals (1) and (2), and the assembly technique
developed in goal (3), design and fabricate a three-component, photoactive
catalytic motor.
5) Explore separation techniques capable of separating colloidal particles by size,
shape, or other distinguishing factors that take advantage of the singular
complexities of concentrated distributions of colloids.
These goals encompass a large number of scientific disciplines and make use of a wide
variety of experimental and analytical techniques. In exploring the science behind colloidal
assembly, I have come to appreciate the complexity and beauty behind this truly interdisciplinary
field.
7
1.3 Dissertation Outline
1.3.1 General Overview
This dissertation documents the research involved in the assembly and purification of
complex, functional colloidal devices. Chapters 2 through 7 are taken directly from, or are
expanded versions of published, submitted, or in preparation technical research manuscripts.
Additionally, Chapter 2 gives an analysis of colloidal assembly as a chemical engineering
process, and discusses how this analysis relates to the work in this dissertation. Assembly
techniques found in Chapters 4 and 5 are used throughout the dissertation. Each chapter contains
an introductory section that reviews the relevant literature and discusses the main ideas of that
chapter, and the experimental chapters (3 through 7) contain experimental sections discussing
techniques and materials used. Chapter 8 contains conclusions and possible future work.
Relevant permissions are given at the end of each chapter, along with a list of references.
1.3.2 Chapter 2: Colloidal Assembly as a Chemical Engineering Process
In this chapter, clear parallels are drawn between bulk chemical production processes and
colloidal assembly, which is termed as taking place in ‗micro-factories.‘ Just as a chemical
synthesis process has clear inputs and outputs around traditional unit operations, colloidal
assembly has the metaphorical flow of particles in and out of assembly, surface modification,
separation and sonication processes, even including options such as recycle and waste streams. A
simple diffusion-limited aggregation process is described in detail. A process flow diagram for
this process is shown, various unit operations are discussed. The chapter concludes by applying
the analogy to the various assembly and separation processes specifically used in this dissertation.
8
1.3.3 Chapter 3: Effective Density Sorting of Soft Colloidal Spheres
In this chapter, we examine the phenomenon of ‗effective density sorting‘ where a close-
packed but mobile sediment of heterogeneous colloidal particles spontaneously separates into
layers with constant particle volume fractions. This behavior can be explained and modeled by
analyzing and minimizing the gravitational potential energy of the system, taking into account
both the effective density of each mobile colloidal particle + double layer, and the effective
density of each layer due to the change in random packing fraction as a function of particle
composition. This sorting phenomenon is unique because it occurs specifically because of
gravity – not in spite of it – and works best for high concentrations or solids loadings of particles
(up to and beyond the random close packing limit of 0.64) and may eventually lead to both high-
throughput colloidal separation techniques and new ways to measure bulk interparticle forces.
1.3.4 Chapter 4: Simple Fabrication of Gold-Silver Heterodoublet Motors
In this chapter, the stimulate-quench-fuse (SQF) method of colloidal assembly is used to
fabricate heterodoublets of micron-sized gold and silver particles. The aggregation statistics and
stability of the motors are analyzed. Due to the high Hamaker constants of the materials, the
metal doublets withstand long-term sonication much better than polymer or oxide aggregates.
The particle motility is also studied, by observing the movement of heterdoublet motors in
hydrogen peroxide. It is shown that there is enough electrical contact across the gold-silver
interface between the two aggregated particles to allow the motor to function normally. In one
case, a motor is observed breaking apart in solution, after which all motion ceases.

9
1.3.5 Chapter 5: Colloidal Trimers Fabricated Through Quenched Electrostatic Assembly
Three-component assemblies are constructed, having a specific order (particle 1 – particle
2 – particle 3) but no specific orientation (‗bond angle‘). The technique used to do this is
developed in this chapter – Quenched Electrostatic Assembly. In QEA, the central ‗core‘ particle
is functionalized to have one sign of charge, while the other two ‗satellite‘ particles have the
opposite sign of charge. Aggregation is done in low ionic strength, so all electrostatic forces are
present. These experimental conditions prevent satellite-satellite aggregation, although
considerations must be made for core and satellite number densities to prevent bridging two cores
with a single satellite, leading to higher ordered aggregation. The aggregation is ‗quenched‘ but
addition of a charged nanoparticle or polyelectrolyte with the same sign as the satellites. This
quickly coats the core and restores stability to the system. The QEA technique is tested on six
different trimer systems (both 2- and 3- component). Statistics are performed to understand how
to optimize the QEA technique for any given satellite/core/satellite configuration.
It is shown that fusing the nanoparticle / polyelectrolyte quench coatings leads to a large
increase in mechanical stability in the trimer – the fused trimers hold up significantly better under
sonication than those that have not been fused. One ‗active‘ three-component trimer is
fabricated: a gold-silicon-silver trimer that functions as a catalytic motor in hydrogen peroxide.
Unfortunately, this trimer lacks the ability to be controlled by light due to the overly high native
conductivity of the silicon core.
1.3.6 Chapter 6: Dissolution-Induced Fluid Pumping in Disturbed Geologic Formations
In addition to peroxide decomposition-based electrophoresis, auto-diffusiophoretic
motors have been studied. In order to fully understand the mechanisms inherent to the complex
10
three-component motors fabricated in Chapter 7, we must first understand how ionic gradient
diffusiophoresis and –osmosis can effect flows in charged colloidal systems. Calcium carbonate,
a material ubiquitous in nature and commonly used in biocolloidal systems, is shown to generate
localized ion gradients around its surface when suspended in CaCO3-unsaturated water, due to
partial dissolution of the material. Calcium carbonate microparticles are synthesized. Although
not mobile themselves, the particles slowly dissolve into solution and, owing to the difference in
diffusion coefficients of the resulting ions, set up powerful electric fields surrounding them that
drive flow both of individual tracer particles and at bulk charged interfaces, such as glass
substrates. In this chapter, the diffusiophoretic ‗pumps‘ are compared with diffusiophoretic
heterdoublet motors of polystyrene latex colloids and CaCO3 microparticles fabricated using the
QEA techinque, as well as flows generated by large natural rock samples of dolomite, calcite,
barium carbonate, and gypsum. By better understanding the mechanistic differences between
autodiffusiophoresis (Chapter 6) and autoelectrophoresis (Chapter 4), we can run more informed
experiments with the three-component motors from Chapters 5 and 7.
1.3.7 Chapter 7: Photoresponsive Metal - Cadmium Sulfide Colloidal Micromotor Assemblies
In this chapter, three-component, photoresponsive noble metal-semiconductor motors are
fabricated using the QEA technique. The use of cadmium sulfide as a ‗core‘ semiconductor gate
material between a gold and a silver satellite is shown to be highly effective at controlling motor
activity as a function of incident light. In the absence of any strong blue light, the particles are
motionless, even in 0.1% hydrogen peroxide solution. At lower light intensities, the motors
become active, moving in a very similar manner to gold-silver heterodoublets. Comparison are
made by observing both the motion of the motor and the motion of polystyrene tracer particles
within the localized flowfield of the motor. At higher light intensities, however, a strange
11
phenomenon occurs: the motors tend to adhere themselves to the glass substrate, and start
diffusiophoretically pumping particles, similar to the calcium carbonate pumps in Chapter 6.
Even more unusual is that this behavior does not seem to be limited to peroxide solutions – it
occurs in DI water as well. By combining our understanding of autoelectro- and autodiffusio-
phoresis from previous chapters, we comment on possible explanations for this observation.
1.3.8 Chapter 8: Conclusions and Future Work
This chapter summarizes the dissertation with respect the research goals and discusses
possible future work in three distinct areas: separations, ‗intelligent‘ motor development, and
engineering diffusiophoretic flows in mineral systems for enhanced particle and transport in
pores.
1.4 References
1 Sharp, T.A.; Jones, F.L. Non-printing indicia ink US Patent #2936241, May 1960.
2 Russel, W. B.; Saville, D. A.; Schowalter, W. R., Colloidal dispersions. Cambridge University
Press: 1992.
3 Hiemenz, P.C.; Rajagopalan, R. Principles of Colloid and Surface Chemistry, Marcel Dekker,
New York, 3rd
edn, 1997, pp. 592-604.
4 Joannopoulos, J. D.; Villeneuve, P. R.; Fan, S., Nature 1997, 386, (6621), 143-149.
5 Terray, A.; Oakey, J.; Marr, D. W. M. Science 2002, 296, (5574), 1841-1844.
6 Aguirre, C. I.; Reguera, E.; Stein, A. Advanced Functional Materials 2010, 20, (16), 2565-2578.

12
7 Holtz, J. H.; Holtz, J. S. W.; Munro, C. H.; Asher, S. A. Analytical Chemistry 1998, 70, (4),
780-791.
8 Velev, O. D.; Kaler, E. W., Langmuir 1999, 15, (11), 3693-3698.
9 Volodkin, D.V.; Petrov, A.I.; Prevot, M.; Sukhorukov, G. B. Langmuir, 2004, 20 (8), 3398–
3406.
10 ―Interfacial Dynamics Corporation‖ <http://www.idclatex.com/>; retrieved December 20,
2009; corporate website selling custom-made latex microspheres
11 Hermanson K.D.; Lumsdon S.O.; Williams J.P.; Kaler E.W.; Velev O.D. Science. 2001, 294
(5544), 1082-1086.
12 Furst EM, Suzuki C, Fermigier M, Gast AP. Langmuir. 1998; 14(26), 7334-7336.
13 Roh K, Yoshida M, Lahann J. Langmuir. 2007; 23(10), 5683–5688.
14 Kim JW, Larsen RJ, Weitz DA. J. Am. Chem Soc. 2006; 128(44), 14374-14377.
15 Xia Y, Yin Y, Lu Y, McLellan J. Adv. Funct. Mater. 2003; 13(12), 907-918.
16 Hernandez CJ, Mason TG. J. Phys.Chem. C. 2007; 111(12), 4477-4480.
17 Johnson PM, van Kats CM, van Blaaderen A. Langmuir. 2005; 21(24), 11510-11517.
18 Yake AM, Panella RA, Snyder CE, Velegol D. Langmuir. 2006; 22(22), 9135-9141.
19 Shah, R. K.; Shum, H. C.; Rowat, A. C.; Lee, D.; Agresti, J. J.; Utada, A. S.; Chu, L.-Y.; Kim,
J.-W.; Fernandez-Nieves, A.; Martinez, C. J.; Weitz, D. A.,. Materials Today 2008, 11, (4),
18-27.
20 Manoharan VN, Elsesser MT, Pine DJ. Science. 2003; 301(5632), 483-487.
21 Snyder CE, Yake AM, Feick JD, Velegol D. Langmuir. 2005; 21(11), 4813-4815.
22 Paxton WF, Kistler KC, Olmeda CC, Sen A, St. Angelo SK, Cao Y, Mallouk TE, Lammert PE,
Crespi VH. J. Am. Chem. Soc. 2004; 126(41), 13424–13431
13
23 Kline TR, Paxton WF, Wang Y, Velegol D, Mallouk TE, Sen A. JACS. 2005; 127, 17150.
24 Paxton WF, Baker PT, Kline TR, Wang Y, Mallouk TE, Sen A. JACS. 2006; 128, 14881.
25 ―H2O2Thermodynamic Properties‖
<http://www.h2o2.com/intro/properties/thermodynamic.html>; retrieved December 20, 2009;
industrial hydrogen peroxide website with specifications.
26 Hong Y, Blackman NMK, Kopp ND, Sen A, Velegol, D. Phys. Rev. Lett. 2007; 99, 172103.
27 Martin BR, Dermody DJ, Reiss BD, Fang M, Lyon LA, Natan MJ, Mallouk TE. Adv. Mater.
1999; 11, 1021.
28 Jerri HA, Dutter RA, Velegol D. Soft Matter. 2009; 5, 827-834.
29 Snyder CE, Ong M, Velegol D. Soft Matter. 2009; 5, 1263-1268.
Chapter 2
Colloidal Assembly as a Chemical Engineering Process
2.1 Introduction
Niche markets are often well-served by small producers able to adapt quickly to
localized demand. America‘s brewing industry provides one example through its recent history.1
Currently about 90% of the domestic market share for beer – roughly 200 million barrels or 6
billion gallons – is in the hands of Anheuser-Busch, Miller, and Coors. And yet, the number of
specialty brewers grew from 10 in 1980 to more than 1300 by the year 2000.1 Microbrewers and
brewpubs produce less than 15,000 barrels per year, but they focus on high-quality products
adapted to particular customers. By having prices 50% higher than usual pale lagers, requiring
far less advertising, and even taking advantage of local tax laws, a specialty brewer can produce a
gross revenue of a few million dollars per year.
This chapter explores the development of processes for another category of niche
markets: colloidal assemblies. Although colloidal particles have been used for millennia, the
concept of assembling nano-scale or micro-scale particles into small ―colloidal devices‖ or
―colloidal machines‖ is a rather recent development.2 Simple devices, such as colloidal motors
3,4
or colloidal barcodes5, have already been fabricated and studied, at least at the research level.
Rather than producing 1 million metric tons per year of commodity vinylacetate or styrene
butadiene particles, like BASF or Dow, we explore how companies can develop processes that
fabricate specialty colloidal assemblies, perhaps in batches of 10 to 100 grams with a rapid
turnaround time, by designing colloidal micro-factories. Initially such specialty producers of
colloidal assemblies might primarily serve research needs for other small or large companies;
15
however, with time, commercial markets might emerge for a greater number of specialized
products. The over-arching question in this chapter is this: Can small, nimble, smart businesses
carve out niches in producing specialized colloidal assemblies? In examining this question, we
explore four main points:
1) Colloidal assemblies are high-value specialty products.
2) Control of interparticle forces enables ―bottom-up‖ processes for making
assemblies.
3) Micro-factory processes are adaptable, small, and have low capital investment.
4) Chemical Engineers are well-positioned to design and operate colloidal micro-
factories.
As entrepreneurs become willing to engage in these small ventures, the micro-factory
approach for producing assemblies can add significant value, especially for initial research and
development operations, and later in aiding the commercialization of technologies that result
from the R&D.
2.2 Background
2.2.1 Colloidal Assemblies are High-Value Products
Synthetic rubber demand during World War II caused an enormous scaleup of polymer
colloid production.6 Worldwide there are now more than 500 companies that produce and sell
polymer colloids.7 The three leading suppliers, BASF, Dow, and Rohm and Haas, each has the
capacity to produce more than 1 million metric tons (wet) per year, accounting for 20% of
polymer colloids produced annually. The particles are typically sold as commodities: a gallon of
paint costs roughly $20, while a bottle of wood glue might cost $5. Common polymer colloids,
16
such as styrene-butadiene copolymers, polyacrylates and vinyl acetate homopolymers and
copolymers, are used in applications from leather finishing to printing inks.6,7
In contrast to these bulk markets, small companies such as Polysciences, Invitrogen
(through Interfacial Dynamics), Bangs Laboratories, Duke Scientific, and other manufacturers
produce particles primarily for research purposes.8 These particles have tight specifications (e.g.,
size distribution) and good quality control, and they are high-value; our lab typically purchases a
dozen 15 mL bottles of 8% solid monodisperse polystyrene nano and microparticles per year,
each of them costing more than $150. By mass, the cost for the polymer particles is 3 to 4 times
that of gold. Particles with specialized functionalities such as ligands or fluorescent groups cost
even more, and the demand for small amounts of the customized particles remains significant.
Colloidal assemblies that function as ―colloidal devices‖ will in general be even more
complex than their constituent particles. As a result, they will have even higher value added. In
1998 Jacobson and co-workers published their work concerning a capsule, in which tiny dark or
light particles could be moved electrically.9 This research has now turned into E Ink, the
Cambridge, Massachusetts-based company that produces the display technology for the Amazon
Kindle and the Barnes & Noble Nook. There are many more types of smart particles on the way,
including the mobile microscale and nanoscale motors mentioned earlier3,4
which are
environmentally responsive, and can perform chemotaxis in the manner of motile bacteria.10,11
2.2.2 Control of Interparticle Forces Enables “Bottom-Up” Processes
In recent years the concept of colloidal molecules12
has emerged, in which colloidal
particles are treated analogously to atoms and molecules in molecular chemistry. Glotzer and
Solomon established a ―periodic table‖ concept13
, in which the constituents are not atoms, but
nanoscale or microscale particles with various morphologies, size, material composition, and
17
other defining characteristics. Many unique assemblies have already been fabricated, including
doublets,14,15,16
―colloidal water‖,14,17
and grape-like clusters.18
Most of these have been produced
using bottom-up assembly, at least in some steps, which usually corresponds to less expensive
processes. In bottom-up assembly, a chemistry is patterned onto the particle surfaces so that the
particles are ―chemically programmed‖ thermodynamically to favor specific assembly. The
potential combinations for assembly are immense in number, and many of these particles have in
fact been comprehensively reviewed.19
Two key barriers remain in using bottom-up techniques to fabricate colloidal assemblies.
First, most techniques allow only a limited number of particle materials to be used, for instance
certain polymer types or certain metal types. The challenge here is that sophisticated colloidal
assemblies or devices might often require combinations of various polymers, oxides, metals,
semiconductors, or hydrogels. Additionally, specific applications sometimes require that various
materials be compared for performance in a given application. In contrast to molecular
chemistry, in which covalent bonds dominate, colloidal assembly is usually governed by physical
interactions20,21
and these forces are readily manipulated. Van der Waals forces, hydrophobic
forces, electrostatic forces, and similar physical phenomena – many of which are readily
controlled by changing the solution or ambient conditions, provide an enormous toolset by which
to assemble a broad range of particles.
Although there are differences between molecular synthesis and colloidal fabrication,
numerous analogies may also be made. For example, template-based assembly may be
considered a type of heterogeneous catalysis which combines some aspects of bottom-up and top-
down assembly. Controlled assembly, occurring either when ―patchy particles‖ bond at specific
sites or when bare particles bond during a certain time period, may be considered a type of
homogeneous reaction.
18
The second key challenge is that most assembly techniques produce only small quantities
of particles, say milligrams at present. While this is sufficient to publish a high-impact image in a
journal, it is considerably less than the 10 to 100 grams or more required even at a niche
commercial level. As assemblies used for research lead entrepreneurs to assemblies with
potential application in broader commercial uses, even larger quantities will need to be produced.
This requires that we consider colloidal assembly in a manner beyond traditional methods. We
will need to start considering entire processes for producing the assemblies.
2.2.3 Microfactories Have Quickly-Adaptable, Batch Unit Operations
Continuous processes have little merit for the small-scale fabrication of assemblies. The
primary costs will be in rapid engineering and prototyping, rather than in equipment capital
investment or sometimes even raw materials. Small batch or semi-batch unit operations will
likely prevail, many of which are already used in laboratories around the world. As a result,
capital expenses for the equipment will be low and the operations will require minimal
commissioning time. Moreover, the small batch process enables users to morph a process
quickly, in order to produce custom particles and assemblies. Thus, sophisticated process control
schemes can often be avoided, and if product quality is insufficient, the next batch can be
optimized and processed.
As an example of a micro-factory design, consider the ―stimulus-quenching-fusion‖
method for producing doublets.15
This process is used to form the heterodoublet motors in
Chapter 4. A process flow diagram (PFD) of the process is shown in Figure 2.1. Spherical
particles with diameters (2a) from several micrometers down to less than 100 nm are fed into a
batch reactor. The particles might be negatively-charged in aqueous solution, with a surface
potential (0). Ordinarily, we seek colloidal suspensions in which the particles do not aggregate
19
(i.e., they are ―stable‖), with a large magnitude of 0 (corresponding to highly negatively charged
particles due to dissociating carboxyl, sulfate or other groups on the particle surface). Such
particles have significant repulsive electrostatic forces, which maintain a gap () between the
particles. The electrostatic forces work against the attractive van der Waals forces, which are
stronger for material systems with a higher Hamaker constant (A). A simplified version of the
interaction potential between two particles, commonly known as the Derjaguin-Landau-Verwey-
Overbeek (DLVO) potential energy, is
12
exp2 2
0
aAa
Eq. 2.1
where ε is the permittivity for water and κ-1
is the Debye screening length. The Debye
length, which is readily calculated from the solution conditions,21
serves as the characteristic
length scale over which particles interact electrostatically in an ionic solution. A plot of Equation
2.1 for () reveals a potential energy barrier between particles, analogous to an activation
energy barrier in transition state theory.
Using Equation 1 as a guide, we can manipulate the potential energy between particles.
By increasing the ionic strength, we can decrease the Debye length and lower the potential
barrier, allowing particles to aggregate together.20
We could solve for the case when the potential
energy barrier indicated by Eq 2.1 (or more complicated and accurate expressions20,22
for the
energy) is small enough to allow aggregation, but in practice, we know that having 1.0 M KCl
solution gives a Debye length of 0.3 nm, which is small enough to allow rapid, diffusion-limited
aggregation of the particles. The particles do not, however, simply clump up instantaneously.
Their aggregation is diffusion-limited, like many reactions. Singlets form doublets; doublets

20
combine with singlets to form triplets; doublets combine with doublets to form 4-lets, and higher
order aggregates continue to form.
If we have a volume fraction () of particles, we could solve the population balances to
determine the entire range of aggregates as a function of time. On the other hand, we can treat
the aggregation of singlets as a binary reaction given by the usual rate expression
2
111 / kndtdnr , and then use several equations from colloid science to find that the rate
constant is given by 3/8 Tkk B , where kB is the Boltzmann constant, T is the absolute
temperature, and is the viscosity of the suspending solution. Using these equations, we can
estimate a time constant () for diffusion-limited aggregation as21
Tk
a
B
3
Eq 2.2
By decreasing the ionic strength or other stimulus, we can increase this time scale to
many times this diffusion-limited result, usually in a controllable manner. Thus, a few simple
estimates from colloid science have given us an equation to relate parameters easily controlled in
solution, and this equation is often sufficient as a starting point to predict and reliably scale up the
aggregation step.
In continuing the process, we ―quench the reaction‖ after the rapid aggregation time by
diluting with water to decrease the ionic strength. This increases the repulsion between the
particles. In some ways the high ionic strength has served as a catalyst for the reaction. If one of
the particle types is polymeric, we can make the doublets very mechanically stable by raising the
temperature above the glass transition temperature of the polymer, allowing the particles to fuse.
Finally, since the random aggregation step has given un-aggregated singlets, the desired doublets,
and some side products (triplets and higher order aggregates), we require a sorting or separation

21
step. Techniques such as hydrodynamic chromatography and field flow fractionation can sort
singlets (which are recycled to aggregate again) from doublets (which are stored for use) from
side products (treated as waste). Currently these sorting operations are done at a very small scale.
We have discussed the design of a micro-factory for producing a simple type of colloidal
assembly (i.e. doublets), using a process flow diagram. Similar process flow diagrams can in
principle be designed for the formation of more complex types of assemblies, thereby creating
micro-factories for the fabrication processes.
Colloidal micro-factories can fit in a single room, and perhaps even on a tabletop, since
the ―unit operations‖ are small. Furthermore, the equipment can be assembled quickly, with
sufficient design knowledge. For companies wanting rapid prototyping of an idea, these factories
will serve an important purpose, as a process can transition from conception of the idea to
reception of the assemblies within two months, by contracting a niche company. Currently, many
particle assemblies are produced using the beakers and flasks on a laboratory bench, or a small
microfluidic network created at a nanofabrication facility. To a Chemical Engineer, however,
that same beaker resting on a bench top serves as a ―batch reactor‖; a centrifuge or rack of test
tubes for settling is an effective separator; a microfluidic network or syringe pump acts as the
transport system, while an autoclave or water bath functions as a heat exchanger. Both the
materials and methods scale down for micro-factories, although in addition to the usual design
parameters like viscosity, heat capacity, and diffusivity, colloidal processes involve parameters
such as zeta potentials (surface potentials on particles in solution), ionic strengths and double
layer thicknesses, surface tension, surface adsorption, and Hamaker constants.21
When optimizing yields of the colloidal assemblies, one of the most critical yet daunting
unit operations is sorting or separations. There is no equivalent of a distillation column for
micron-size particles. Although small-scale, analytical sorting techniques such as field flow
fractionation and hydrodynamic chromatography exist, the ability to sort 1 to 100 kg per year of
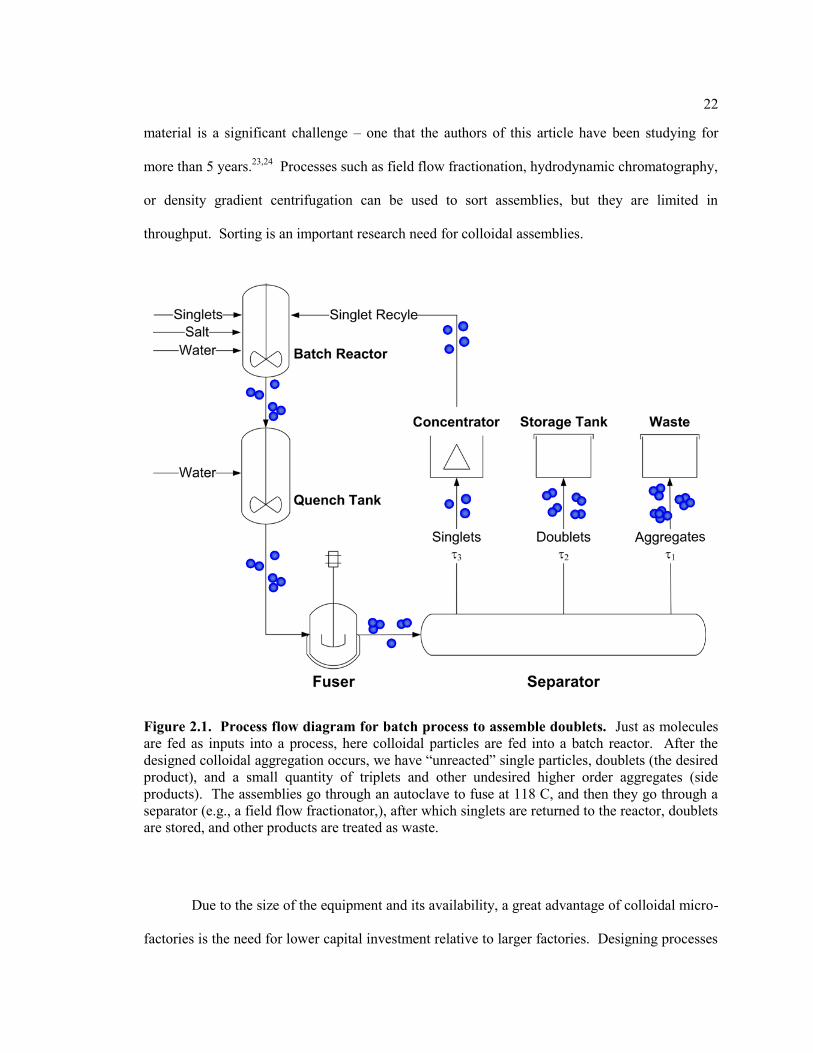
22
material is a significant challenge – one that the authors of this article have been studying for
more than 5 years.23,24
Processes such as field flow fractionation, hydrodynamic chromatography,
or density gradient centrifugation can be used to sort assemblies, but they are limited in
throughput. Sorting is an important research need for colloidal assemblies.
Due to the size of the equipment and its availability, a great advantage of colloidal micro-
factories is the need for lower capital investment relative to larger factories. Designing processes
Figure 2.1. Process flow diagram for batch process to assemble doublets. Just as molecules
are fed as inputs into a process, here colloidal particles are fed into a batch reactor. After the
designed colloidal aggregation occurs, we have ―unreacted‖ single particles, doublets (the desired
product), and a small quantity of triplets and other undesired higher order aggregates (side
products). The assemblies go through an autoclave to fuse at 118 C, and then they go through a
separator (e.g., a field flow fractionator,), after which singlets are returned to the reactor, doublets
are stored, and other products are treated as waste.
23
at the nanoscale or microscale opens up possibilities for integrating unit operations in new ways,
for instance using some surface techniques for both assembly and sorting. Moreover, the small
size of the micro-factories translates to a greater potential for safer processes, as many assembly
techniques are performed in aqueous solution at ambient temperature and pressure. Still, it is
imperative that a thorough safety analysis be performed, and HAZOPs and operability guidelines
be generated regardless of the size of the micro-factory. Although waste product volume is
minimal, that material must be handled responsibly.
2.2.4 Conclusions and Outlook
An irony of colloidal micro-factories is that while the materials being synthesized –
colloidal particles instead of molecules – are individually larger than molecules, the factories used
to produce them will be much smaller than for most molecular processes. Some of the
organizations mentioned earlier that produce specialty particles might well be interested in
incorporating new sections into their factories … in rooms in already existing facility. That is,
already-small factory buildings can house even smaller colloidal micro-factories.
Micro-factories need not address only niche commercial markets. Multifunctional
colloidal assemblies can be designed for water remediation, drug delivery and other meaningful
applications as a result of the tremendous design flexibility characteristic of micro-factories. An
additional benefit of the smaller footspace is portability, such that microfactories can be
inexpensively built or delivered to various parts the world. Delivery speed, both locally and
internationally, is important, and requires a reduction in specialization so that one person (or a
small team) can effectively identify the need, rapidly develop relationships, design and build the
micro-factory, and sell quality products that generate profit.
24
Several critical barriers have been addressed in this section, concerning the advancement
of colloidal micro-factories. Technical issues in colloidal fabrication and sorting are currently
being addressed in research labs around the world. Important engineering challenges exist in
rapid design and scaleup of not just fabrication techniques, but entire processes for producing
assemblies. Building teams who understand outside technical issues, including molecular
biology, medical applications, or polymeric applications, is crucial. Addressing local, niche
markets requires a detailed knowledge of local contexts as well as specialized science and
technology and implementation with integrity.
2.3 Microfactories in the Context of this Dissertation
As a colloid scientist, I have often found myself thinking on a very small scale – much
smaller than the towering diffusion columns and voluminous CSTRs of my college courses.
However, by treating the colloidal assembly process as a Chemical Engineering process,
analogues, I have always been able to frame my work in the context of that process. This has
proven especially useful when communicating my ideas to scientists and engineers without
formal colloidal science training. While it might be difficult explaining the SQF process as a
research idea, it becomes much easier when you can frame it as a ‗micro-factory‘ process, as
discussed above.
This dissertation, and, indeed, much of the work in the Velegol lab, focuses on two
specific steps of the PFD found in Figure 2.1: the batch reactor / quench tank, and the separator.
The reactor and quench tank, as mentioned earlier, is analogous to any colloidal assembly
process. I have developed and implement two assembly processes in this work: the SQF
aggregation process described here and used in Chapter 4; and a more complex diffusion-limited
process called ‗quenched electrostatic assembly‘ (QEA), which is developed in Chapter 5, and
25
used in Chapters 6 and 7. These assembly processes are not complex in principle – they require
very little specifics – but they are also uncontrolled, akin to chemical reactions that do not always
go to completion and that produce unwanted by-products. In the case of diffusion-limited
assembly, the ‗product‘ particles tend to be more of a distribution than a single entity, owing to
the statistical nature of aggregation kinetics.
The complexity of any given diffusion-limited assembly process can typically be
increased through the addition of surface functionalizations and anisotropy to the ‗reactant‘
particles, leading to localized interparticle forces2
and a more directed approach to the assembly.
In some sense, the QEA technique is a ‗next-level‘ process that arises from SQF, i.e., through the
addition of specific electrostatic forces, we can build ordered assemblies and prevent unwanted
particle aggregation. The cost of added complexities is not just a material cost. More complex
particles may lose some component of their functionality (e.g., particles with catalytic surfaces
may be hindered by surface modification), and the more complex processes often take longer and
are harder to scale-up. Therefore, a strong motivation for all the work in this dissertation is
balancing assembly complexity with practicality, working to retain flexibility and scalability
throughout.
The second part of the Fig. 2.1 PFD this dissertation addresses is the separator. As
mentioned above, colloidal particles are much more difficult to separate than molecular
compounds, due to both the inherent physics (colloids are much more likely to be affected by
gravity, have much smaller diffusion coefficients, and can act as complex fluids at moderate
volume fractions), and due to a lack of current technologies for high-throughput sorting of
distributions of colloidal particles and assemblies.
Chapter 3 discusses a colloidal separation technique that I have developed with my
labmate Cesar Gonzalez Serrano called effective density sorting. The primary appeal in this
technique is that it can be used in concentrated suspensions of colloidal particles. In fact, the
26
underlying phenomenon is only observable at high solids loadings and in the presence of
gravitational forces. In addition to the relevant underlying science behind effective density
sorting, the technique offers a key component to this dissertation: the possibility of high-
throughput sorting of assembled colloids from their component particles and other unwanted
structures.
2.4 Acknowledgements and Copyright Information
Chapter 2 contains modified text from the author‘s publication:
Darrell Velegol, Huda A. Jerri, Joseph M. McDermott, Neetu Chaturvedi. Micro-
factories for Colloidal Assembly AICHE Journal 2010, 56(3), 564-569.
Used with permission from John Wiley & Sons, 2011.
We thank many colleagues for stimulating discussions, including Bob Nedwick,
Ayusman Sen, Tom Mallouk, Milton Cole, Jim Adair, Jack Matson, Ted Alter, Orlin Velev, and
Ilona Kretzschmar. We also thank those who have funded our research in colloidal assembly and
interparticle forces, especially the National Science Foundation and the Department of Energy.
Although this work was originated by Darrell, many of the central ideas and framing
came from prolonged discussion between all the authors and the writing and figure preparation
was split between us. I thank Darrell for including me in this work and all my fellow authors for
their contributions and enlightening discussions.
27
2.5 References
1 Tremblay V.J.; Tremblay C.H. The U.S. Brewing Industry: Data and Economic Analysis. The
MIT Press. 2005.
2 Velegol D. J. Nanophotonics. 2007, 1: 012502.
3 Kline T.R.; Paxton W.F.; Wang Y.; Velegol D.; Mallouk T.E.; Sen A. J. Am. Chem. Soc. 2005
127(49), 17150-17151.
4 Mallouk T.E.; Sen A.; Sci. Am. 2009, 74-79.
5 Nicewarner-Pena S.R.; Freeman R.G.; Reiss B.D.; He L.; Pena D.J.; Walton I.D.; Cromer R.;
Keating C.D.;, Natan M.J.; Science. 2001, 294 137-141.
6 Urban D, Distler D. Ch 01: Introduction. In: Urban D, Takamura K. Polymer Dispersions and
Their Industrial Applications. Germany: Wiley-VCH. 2002; 1-14.
7 Kirk-Othmer. Polymer Colloids. In: Kirk-Othmer Encyclopedia of Chemical Technology (5th
edition). New York: Wiley. This encyclopedia contains full descriptions of many types of
colloidal processes and system, including paint, glue, and latex.
8 Interfacial Dynamics Corporation (www.idclatex.com), Polysciences (www.polysciences.com),
Duke Scientific (www.dukescientific.com), Bangs Laboratories (www.bangslabs.com).
9 Comiskey B, Albert JD, Yoshizawa H, Jacobson J. An electrophoretic ink for all-printed
reflective electronic displays. Nature. 1998; 394:253-255.
10 Hong Y, Blackman NMK, Kopp ND, Sen A, Velegol D. Chemotaxis of Nonbiological
Colloidal Rods. Phys. Rev. Lett. 2007; 99(17):178103-178106.
28
11 Chaturvedi N, Hong Y, Sen A, Velegol D. Magnetic Enhancement of Phototaxing Catalytic
Motors. Accepted to Langmuir. 2009.
12 van Blaaderen A. CHEMISTRY: Colloidal Molecules and Beyond. Science. 2003;
301(5632):470-471.
13 Glotzer SC, Solomon MJ. Anisotropy of building blocks and their assembly into complex
structures. Nature Materials. 2007; 6:557-562.
14 Yin Y, Lu Y, Gates B, Xia Y. Template-Assisted Self-Assembly: A Practical Route to
Complex Aggregates of Monodispersed Colloids with Well-Defined Sizes, Shapes, and
Structures. J. Am. Chem. Soc. 2001; 123(36):8718-8729.
15 Yake AM, Panella RA, Snyder CE, Velegol D. Fabrication of Colloidal Doublets by a Salting
Out-Quenching-Fusing Technique. Langmuir. 2006; 22(22):9135-9141.
16 McDermott JJ, Velegol D. Simple Fabrication of Metallic Colloidal Doublets Having
Electrical Connectivity. Langmuir. 2008; 24(8):4335-4339.
17 Snyder CE, Ong M, Velegol D. In-Solution Assembly of Colloidal Water. Soft Matter. 2009;
5:1263-1268.
18 Manoharan VN, Elsesser MT, Pine DJ. Dense Packing and Symmetry in Small Clusters of
Microspheres. Science. 2003; 301(5632):483-487.
19 Glotzer SC, Solomon MJ, Kotov NA. Self Assembly: From Nanoscale to Microscale Colloids.
AIChE J. 2004; 50(12):2978-2985.
20 Israelachvili JN. Intermolecular and Surface Forces (2nd edition). New York: Academic Press.
1991.
21 Russel WB, Saville DA, Schowalter WR, Colloidal Dispersions. New York: Cambridge
University Press. 1989.

29
22 Kim, H-Y, JO Sofo, D Velegol, MW Cole, AA Lucas. Van der Waals forces between
dielectric nanoclusters. Langmuir 2007; 23: 1735-1740.
23 Velegol D, Shori S, Snyder CE. Rayleigh-Benard Instability in Sedimentation. Ind. Eng.
Chem. Res. 2009; 48(5):2414-2421.
24 Jerri HA, Sheehan WP, Snyder CE, Velegol D. Prolonging Density Gradient Stability.
Accepted to Langmuir. 2009.
Chapter 3
Effective Density Sorting of Soft Colloidal Spheres
3.1 Introduction & Background
Colloidal suspensions often contain mixtures of particles that must be sorted by size or
density. One route to sorting gram-size quantities of particles is sedimentation, which has been
studied for decades from both dynamic and thermodynamic perspectives. Dynamic predictions
for settling account for hydrodynamic1, colloidal
2, and electrophoretic
3,4 interactions at finite
volume fractions (), but in the final sediments the particles are usually non-mobile.
Thermodynamic studies have examined colloidal crystals, 5,6,7
but primarily for the case of mono-
disperse particles settling at low Peclet number.8,9,10,11
An important question remains
unanswered: What sediment structure results when bi-disperse or poly-disperse particles settle
rapidly, forming amorphous and mobile sediments? Here we show that bi-disperse colloids
having soft-sphere interactions spontaneously arrange into two macroscopic layers after a
sedimentation process, even at Peclet number greater than order unity. The layering can be
explained without appealing to complex hydrodynamic or thermodynamic arguments; rather, the
layering is readily explained simply by minimizing the free energy of the system, which is
primarily the gravitational energy for our cases. Furthermore, minimizing the energy of the
system leads one to expect an ―asederotrope‖, an azeotrope-like mixture of particles in one or
both of the layers that is seen in our experiments. Our results may lead to designs for preventing
de-mixing of colloidal products during shipment, for improving sorting or size-refinement
operations for colloidal particles of different size or density, for sorting mixtures of biological
components, or for purifying mixtures of colloidal assemblies.
31
3.2 Experimental Methods and Materials
3.2.1 Sedimentation Sample Preparation and Materials
1 ml of particle suspensions at 0.01 volume fraction was prepared for the following
particles: 0.99 µm white Sulfate (CV: 2.5%, Batch No. 8890) PSL 2.0 µm green Sulfate PSL
(CV: 2.6%, Batch No. 1-GN-2K. 1, DI water is ξ = -43.81 ± 3.11 mV) and 3.0 µm red Sulfate
PSL (Coefficient of variation: 3.5%, Batch No. 1-GN-2K. 1, -potential in DI water is -57 ± 4.2
mV) bought from Interfacial Dynamics Corporation (Portland, OR); 3.0 µm Silica (Batch No.
5411, -potential in DI water is -62 ± 6.6 mV) bought from Bangs Laboratories, Inc (Fishers, IN)
and 150 nm gold particles produced from the reduction in solutions of gold ions with gum arabic
over 1 hour as described by Handley12
. The measurements of -potential were taken using a Zeta
Potential Utilizing Phase Analysis Light Scattering instrument (ZetaPALS) from Brookhaven
Instruments Corporation. The particles suspensions were prepared in an Eppendorf tube by
diluting the original concentration of the bottle to 0.010 volume fraction adding DI water
(Millipore Corp. Milli-Q system). Then 200 ml of 2.0 µm Sulfate PSL were poured together with
200 ml of 3 µm Sulfate PSL into another Eppendorf tube, mixed for 5 minutes using a VM-3000
mini vortexer bought from VWR International and placed in an ultrasonicator from VWR
International (model 550T) for 15 minutes to break any possible aggregate. The same procedure
was used for all other mixtures of particles.
32
3.2.2 Experimental
The mixture was transferred into a Pasteur pipette from VWR International (West
Chester, PA) whose bottom had been previously sealed with wax. A Pasteur pipette was used
instead of a capillary tube because it provides a narrow capillary in order to study the sediment
and a large reservoir at the top to load a larger amount of suspension. The Pasteur pipette was
mounted into a centrifuge tube BLUE MAXTM
Jr. 15ml Polypropylene Conical Tubes bought
from BD Falcon™ (Franklin Lakes, NJ) in order to keep the Pasteur pipette straight along its
vertical axis. Then the centrifuge tube was either kept settling at normal gravity or introduced into
a Sorvall® Biofuge Primo Centrifuge in order to increase the centrifugal force up to 1000 times
the normal gravity (1000g). In order to recover the sediment and analyze it, the Pasteur pipette
was removed from the centrifuge tube and the sediment was extracted with a needle in layers of 3
mm thickness. The layers were resuspended in DI water and placed in the ultrasonicator for 15
minutes to break any aggregates. Then particles were analyzed with a Nikon Eclipse TE2000-U
inverted optical microscope with a 40 air objective.
3.2.3 Confocal Microscope Sample Preparation
60 l of a mixture with equal volumes of 4.0 m red fluorescent PSL (CV: 2.3%, Lot No.
646220, -potential in DI water is -81.40 ± 1.21 mV) and 2.0 m yellow-green fluorescent PSL
particles (CV: 1.3%, Lot No. 21515W, -potential in DI water is -52 ± 3.1 mV) bought from
Interfacial Dynamics Corporation (Portland, OR) at 2% solids is placed in a rectangular capillary
tube 0.202.050 mm RT3520 bought from VitroCom (Mt. Lakes, NJ). The capillary tube is
sealed with optical resin and let it rest on the 2.0 mm side slightly tilted respect to the gravity
vector. The particles were allowed to settle for 2 weeks. Confocal images of sediment at different
33
positions of the capillary were taken with an Olympus Fluoview 1000 Confocal Laser Scanning
Confocal Microscope with a 60 oil objective at the Huck Institute of the Life Sciences Center
for Quantitative Cell Analysis.
3.2.4 SEM Sample Preparation and Imaging
Sediments of polystyrene latex spheres can be analyzed in an SEM by using a novel
fusing procedure. After the sediments had formed and reorganized, they were placed in a
centrifuge at 1000 g and in the presence of 100 mM KCl for 5 minutes. The addition of salt and
increased gravitational force allowed the particles in the sediment to overcome repulsive
electrostatic forces, aggregating into a solid, frozen sediment. After centrifugation, the samples
were removed and heated in a pressurized vessel at 120 C for 20 min. Because this temperature
is above the glass transition temperature of the PSL particles, the sediments ‗fused‘ into a
continuous solid. This solid was extracted from the vessel / pipette, sectioned with a razor blade,
and mounted for analysis in a Hitachi S-3000H Scanning Electron Microscope (SEM) at the Penn
State Material Characterization Laboratory. The main benefit to this procedure is that it can show
the internal structures of each layer, whereas the confocal microscopy performed (Fig. 3.3) only
shows particles at the capillary wall. The lab hopes to make use of this procedure in the future to
better understand the structural changes with time in our sediments.
34
3.3 Results and Discussion
3.3.1 Preliminary Macroscopic Observations and Results
We first saw a surprising, spontaneous layering behavior during experiments that
included two different colloidal particles: green sulfate functionalized polystyrene latex (PSL) of
2.0 m diameter and red sulfate functionalized PSL of 3.0 m diameter. Using different colors
enabled us to make quick evaluations by eye, so that we could process more samples. By using
de-ionized water in equilibrium with air, we have systems with a pH of 5.6, giving a bulk double-
layer thickness of roughly 200 nm. As a result, a sizable fluid layer remains between the
particles, even in the sediment, allowing particle mobility and re-arrangement, in contrast to the
hard sphere case13
. We examined one set of sedimenting systems that were held for 18 hours in
Pasteur pipettes in de-ionized water. We discovered that the particles had spontaneously sorted
by size, with the large red particles on the bottom (Fig. 3.1a&c). The experiments with PSL
particles were fully reproducible with particles ranging in size from 1.0 m to 5.0 m.
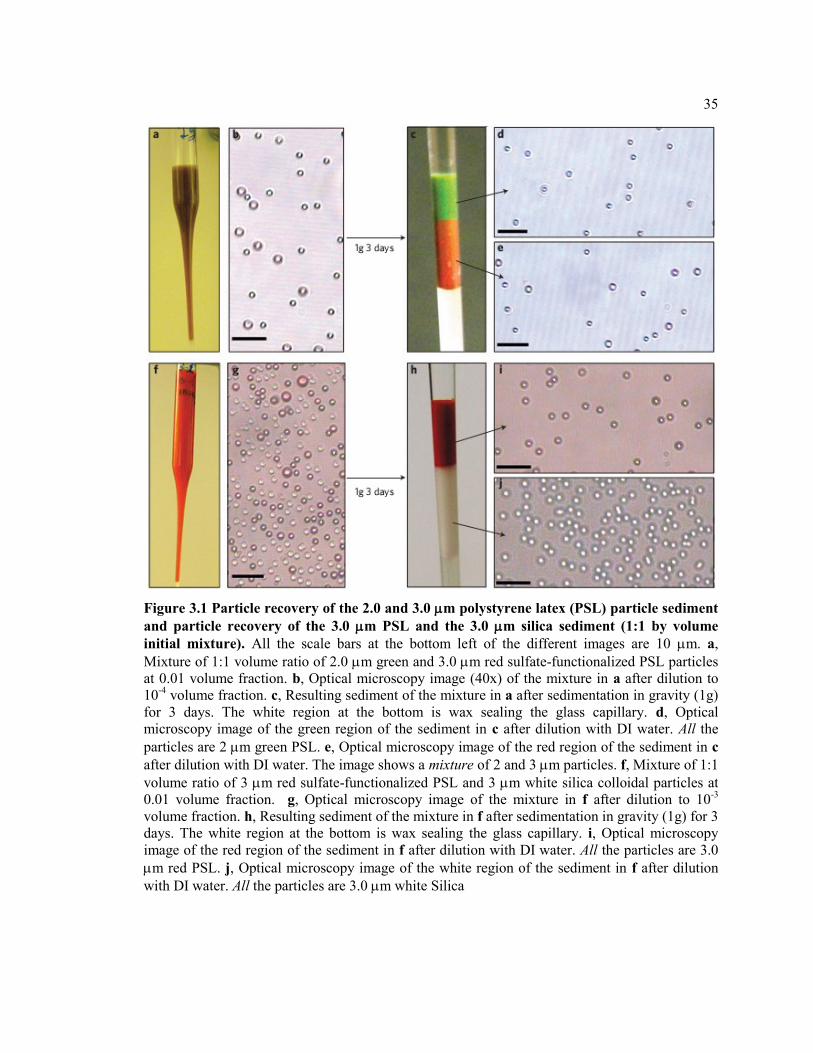
35
Figure 3.1 Particle recovery of the 2.0 and 3.0 m polystyrene latex (PSL) particle sediment
and particle recovery of the 3.0 m PSL and the 3.0 m silica sediment (1:1 by volume
initial mixture). All the scale bars at the bottom left of the different images are 10 m. a,
Mixture of 1:1 volume ratio of 2.0 m green and 3.0 m red sulfate-functionalized PSL particles
at 0.01 volume fraction. b, Optical microscopy image (40x) of the mixture in a after dilution to
10-4
volume fraction. c, Resulting sediment of the mixture in a after sedimentation in gravity (1g)
for 3 days. The white region at the bottom is wax sealing the glass capillary. d, Optical
microscopy image of the green region of the sediment in c after dilution with DI water. All the
particles are 2 m green PSL. e, Optical microscopy image of the red region of the sediment in c
after dilution with DI water. The image shows a mixture of 2 and 3 m particles. f, Mixture of 1:1
volume ratio of 3 m red sulfate-functionalized PSL and 3 m white silica colloidal particles at
0.01 volume fraction. g, Optical microscopy image of the mixture in f after dilution to 10-3
volume fraction. h, Resulting sediment of the mixture in f after sedimentation in gravity (1g) for 3
days. The white region at the bottom is wax sealing the glass capillary. i, Optical microscopy
image of the red region of the sediment in f after dilution with DI water. All the particles are 3.0
m red PSL. j, Optical microscopy image of the white region of the sediment in f after dilution
with DI water. All the particles are 3.0 m white Silica
36
Microscopic examination of the layers revealed another interesting finding. Upon
extracting samples from each layer using a needle, we found that the upper region contained only
2.0 μm particles – not a single larger particle (Fig. 3.1d). However, in the lower region, which
appeared macroscopically to consist entirely of the red 3.0 m particles (Fig. 3.1c), a mixture of
particles existed (Fig. 3.1e). Initially we hypothesized that this configuration could be explained
by the infinite-dilution sedimentation rate, visualizing that whenever any particle reached the
interface, it remained frozen in place. If this were true, then the number ratio of particles in the
lower sediment region should be 0
22
0
1121 nunuxx , where 1u and 2u are the settling
speeds of particles 1 and 2 respectively and 0
1n and 0
2n are the initial number fractions. This
result was not observed for any PSL system we studied, indicating that simplistic hydrodynamic
arguments do not explain our observations.
When sedimentations were repeated with particles of significantly different
densities but the same size, another unusual sediment configuration resulted. A suspension
having 1:1 volume ratio mixture of 3.0 μm sulfate-functionalized PSL and 3.0 μm silica particles
was allowed to settle at 1g in water (Fig. 3.1f-h). After 24 hours, the sediment again consisted of
two regions: an upper region composed exclusively of PSL particles (Fig. 3.1i), and a lower
region composed exclusively of silica particles (Fig. 3.1j). Importantly, the same exclusive
arrangement was found even with an initial mixture of 90% PSL and 10% silica by volume. If
the particles had simply settled and become non-mobile in the sediment, there should certainly
have been a mixture at the bottom for the 90-10 case.
37
3.3.2 Proposed Model for Separation: Effective Density Sorting
The precise sorting, both with the PSL / PSL and PSL / silica layering, suggests a more
complex dynamic mechanism for ordering. However, the precise nature of the sorting led us to
an alternative approach for predicting the composition of the sediment layers: We hypothesized
that the particles were arranging so that they minimized the system‘s free energy, which for our
systems is dominated by the gravitational energy (i.e., density and height). That is, the sediment
composition is readily explained by thermodynamics – not settling rate – for our systems.
Colloidal interaction energies and entropic mixing can be neglected for the systems present in this
work, since they contribute less than 1% to the total free energy.
Upon examining the gravitational potential energy for our systems, we recognized two
factors: 1) individual particles have a lower effective density due to the electrical double layer
around them, and 2) collectively, mixtures of particles have a higher density due to enhanced
packing. Let's first examine factor 1. For a single charged sphere in an ionic liquid, the effective
density is not simply the mass of the particle divided by its volume. Rather, it is the mass of the
particle plus its electrical double layer (EDL), divided by the volume of the particle plus its EDL.
The thickness of the EDL is a small factor times the Debye length (-1), given by
kTezn 222 2 . Thus, -1 depends upon the ion concentration on the solvent ( n ), ion
valence ( z ), temperature (T) and solution permittivity ( ). Universal constants in the equation
are e = 1.602210-19
C (proton charge) and k = 1.3806510-23
J/K (Boltzmann‘s constant). The
EDL will be somewhat smaller at high particle volume fractions14
, or it might be compressed for
particles with small surface potentials or surface charge, but at low ionic strength the EDL will
remain thicker relative to the particle size, lowering the effective density of the individual
particles. Since the fluid in the double layer has roughly the same density as the bulk fluid, we
here approximate the effective buoyant density of a single soft sphere as
38
ffpeffa
a
3
2
Eq. 3.3
where p and f represent the particle and fluid densities respectively. The
parameter δ is the separation distance between spheres in a sediment, and typically, κδ ≈ 1 to 5
for our systems. In cases where the particles have the same density, the larger spheres have a
higher individual particle effective density (when the particles are more dense than the fluid),
since the ratio of particle volume to fluid volume is higher.
The second factor, concerning the packing of two sizes of particles, is often the
dominant effect. When multiple sizes of particles pack, packing densities increase. Studies have
been performed to examine the random packing fractions of ellipsoids15
, octahedra16
, linear and
cyclic chains17
, and many other shapes16,18
. Of particular interest to us is the finding that
monodisperse spheres have a random packing fraction19
of = 0.64, and that bi-disperse spheres20
can randomly pack from = 0.64 up to 0.87.21
When a collection of spheres at a total volume
fraction () exists, then the density of a packed region can be calculated as:
f
effeff
packing yy )1()1( 2111 Eq. 3.2
where y 1 represents the ratio of the volume occupied by particle 1 divided by the total
volume occupied by all particles. Furthermore, eff
1 and eff
2 are the effective densities of the
soft spheres formed by the two particles respectively, using Eq. 3.1. Because is dependent on
the size ratio of the two particles, mixtures of spheres have effective complex fluid densities
greater than that of mono-disperse spheres. It is important to note that the effective densities of
the individual particles may change within a sediment layer (top or bottom), since larger
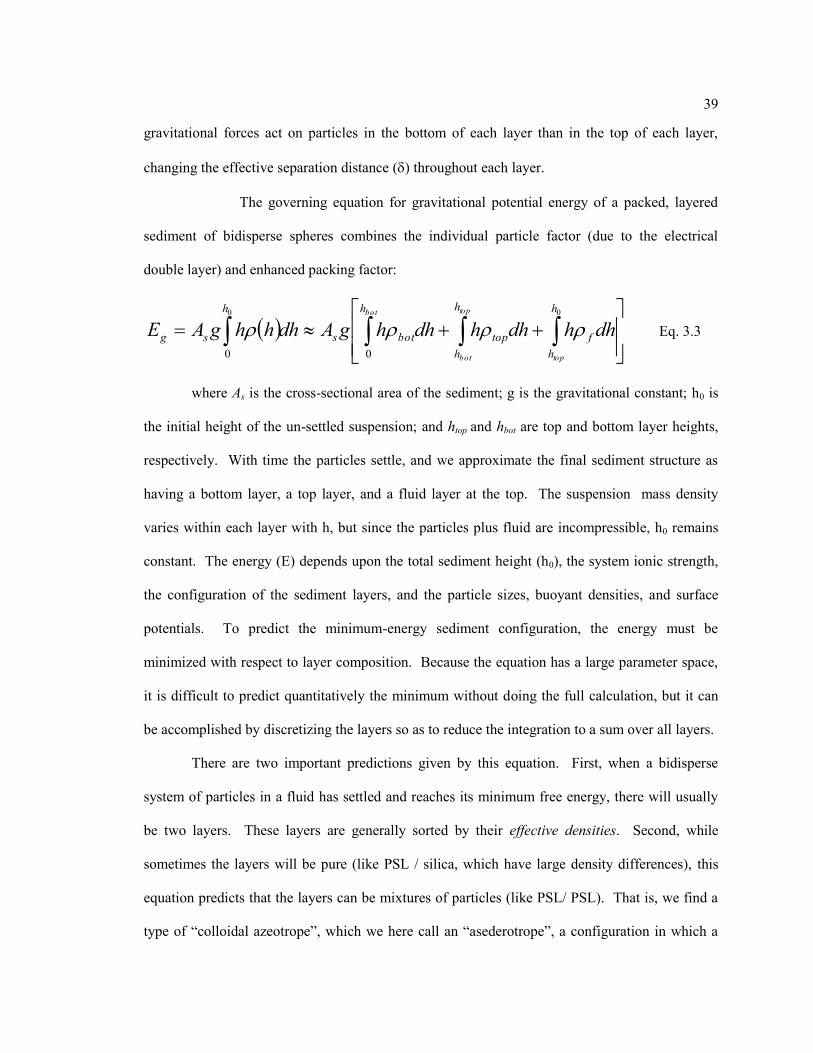
39
gravitational forces act on particles in the bottom of each layer than in the top of each layer,
changing the effective separation distance () throughout each layer.
The governing equation for gravitational potential energy of a packed, layered
sediment of bidisperse spheres combines the individual particle factor (due to the electrical
double layer) and enhanced packing factor:
dhhdhhdhhgAdhhhgAE
h
h
f
h
h
top
h
bots
h
sg
top
top
bot
bot 00
00
Eq. 3.3
where As is the cross-sectional area of the sediment; g is the gravitational constant; h0 is
the initial height of the un-settled suspension; and htop and hbot are top and bottom layer heights,
respectively. With time the particles settle, and we approximate the final sediment structure as
having a bottom layer, a top layer, and a fluid layer at the top. The suspension mass density
varies within each layer with h, but since the particles plus fluid are incompressible, h0 remains
constant. The energy (E) depends upon the total sediment height (h0), the system ionic strength,
the configuration of the sediment layers, and the particle sizes, buoyant densities, and surface
potentials. To predict the minimum-energy sediment configuration, the energy must be
minimized with respect to layer composition. Because the equation has a large parameter space,
it is difficult to predict quantitatively the minimum without doing the full calculation, but it can
be accomplished by discretizing the layers so as to reduce the integration to a sum over all layers.
There are two important predictions given by this equation. First, when a bidisperse
system of particles in a fluid has settled and reaches its minimum free energy, there will usually
be two layers. These layers are generally sorted by their effective densities. Second, while
sometimes the layers will be pure (like PSL / silica, which have large density differences), this
equation predicts that the layers can be mixtures of particles (like PSL/ PSL). That is, we find a
type of ―colloidal azeotrope‖, which we here call an ―asederotrope‖, a configuration in which a
40
mixture of particles is in the minimum energy state and there is no driving force for further
separation. The asederotrope composition of the two layers varies with different particle sizes,
particle densities, surface potentials, and Debye lengths.
3.3.3 Comprehensive Experimental Results for Effective Density Sorting
To confirm that our minimum energy hypothesis was correct, a number of further
experiments were run for two particle systems. Some systems contained particles that had the
same density but different diameters, while other systems contained particles with different
densities and diameters. Figure 3.2 shows the results of these studies. Figure 3.2a clearly shows
both the large effect that double-layer thickness plays on the predicted asederotrope, and how
different our observed configurations were from the purely hydrodynamic prediction (which
trends in the opposite direction entirely). Furthermore, our data show the same trend as the
model: at low radius ratios, we expect a more complete separation, with a general trend of
increasing concentration of small particles in the bottom (y10) with higher radius ratios. Our
model contains no fitted parameters; it is derived using first-principles, and the only inputs for
each point are the particle and solution conditions for that experiment. Deviations between our
model and experimental data are in part due to sample polydispersity (~5% for each particle
type), which affects the packing fractions, thus giving more small particles in the bottom. Thus,
our model provides a lower bound for the data. Variations in the calculated y10 at particular
radius ratios occur because we are mapping systems with multiple parameters onto a 2-D graph;
however, this graph conveys the essential concept.
41
Figure 3.2: Theoretical Predictions and Experimental Results for Effective Density Sorting.
a) Bidisperse polystyrene latex microspheres (sulfate-functionalized): ■ = experimental results
with error bars that represent the 95% uncertainty in the repeatability for each point; — =
hydrodynamic theory; ▲= effective density model prediction. Here, particle 1 is the smaller of
two PSL spheres, meaning that the x-axis is the (a2/a1) and the y-axis shows the volume fraction
of small spheres (y1) in the bottom layer of the sediment. The model points were calculated for
each experimental point on the graph. Both the radius ratio and overall particle sizes have an
effect on the final sediment composition, which is why there are two model / experimental data
points given for a certain radius ratios (e.g., systems of 2.0 and 4.0 μm spheres will have the same
x-value as systems of 2.5 and 5.0 μm spheres but have different y-values due to different bottom
sediment configurations).
b) Polystyrene latex / poly- methylmethacrylate microspheres (sulfate functionalized): ■ =
experimental results with error bars; — = hydrodynamic theory; X = effective density prediction.
Here, particle 1 is the PSL, meaning that the y-axis shows the volume fraction of PSL spheres
(y1) in the top layer of the sediment.
42
Figure 3.2b shows an additional layering phenomenon we observed, following a
prediction from the minimum energy sorting model. In systems of PSL (specific gravity SG =
1.055) and PMMA (poly-methylmethacrylate) (SG = 1.19), the top layer of the sediment was
always comprised of mostly or all PSL particles, even in cases when the PSL particles had a
considerably higher settling rate. In contrast, the hydrodynamics of the system suggest that the
top layer should be composed solely of whatever particle settles slowest. For large particle ratios,
some PMMA is found in the top layer, consistent with the asederotrope predicted by our model.
Although it is energetically favorable for the heavier PMMA individual particles to be at the
bottom, a small number of PMMA in the top layer of the sediment enable a higher packing
fraction, which reduces the overall sediment height and therefore reduces the system energy.
3.3.4 Sediment Structure and Observed Packed Particle Mobility
The results up to this point have focused on the composition of the layers, but two
imaging techniques were used to confirm the sediment structure. Confocal fluorescence
microscopy of a sediment was performed for a suspension of 4.0 μm red fluorescent and 2.0 μm
yellow-green fluorescence sulfate PSL particles. We prepared a sample with a 1:1 volume ratio
of the particles and allowed them to settle in a capillary tube slightly slanted to one side for 3
weeks. Because the particles were settled at an angle, images taken along the length of the
capillary tube showed the sediment at different heights. The top of the sediment became
composed exclusively of small particles (Fig 3.3a), then there was a small transition region of
roughly 100 μm (Fig. 3.3b), and finally there was a lower layer with a roughly uniform
composition of mixed particles (Fig 3.3c&d). These observations were confirmed using scanning
electron microscopy.
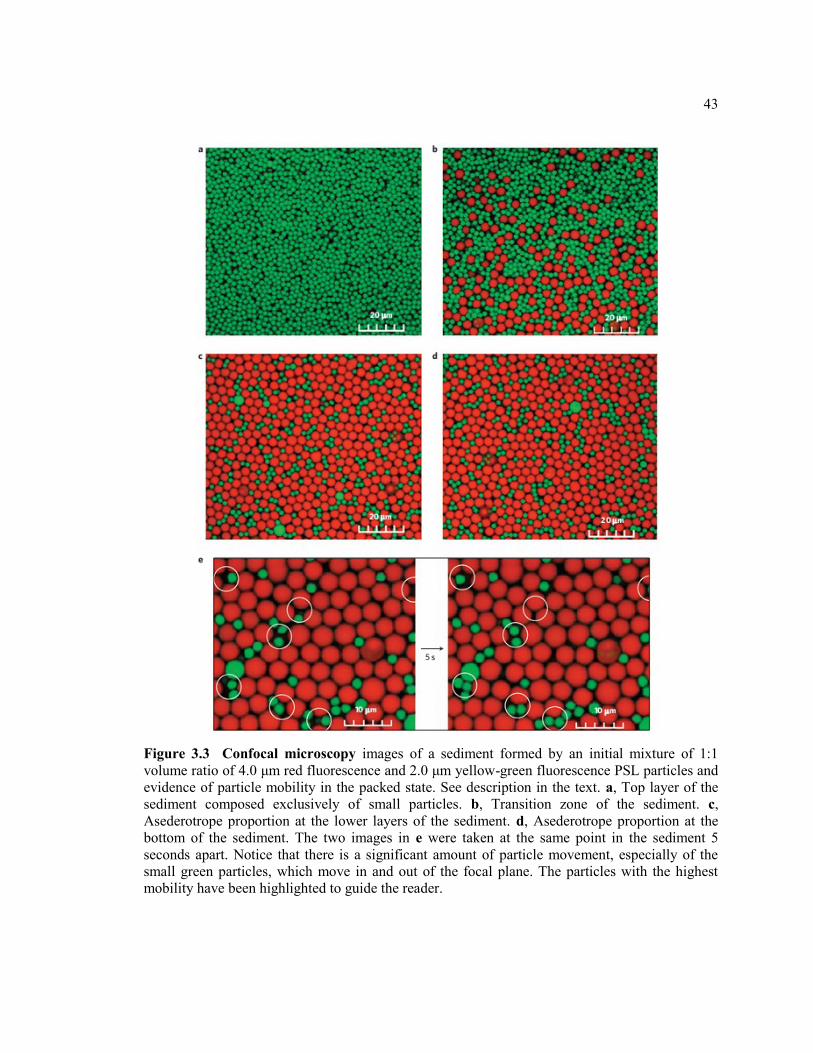
43
Figure 3.3 Confocal microscopy images of a sediment formed by an initial mixture of 1:1
volume ratio of 4.0 μm red fluorescence and 2.0 μm yellow-green fluorescence PSL particles and
evidence of particle mobility in the packed state. See description in the text. a, Top layer of the
sediment composed exclusively of small particles. b, Transition zone of the sediment. c,
Asederotrope proportion at the lower layers of the sediment. d, Asederotrope proportion at the
bottom of the sediment. The two images in e were taken at the same point in the sediment 5
seconds apart. Notice that there is a significant amount of particle movement, especially of the
small green particles, which move in and out of the focal plane. The particles with the highest
mobility have been highlighted to guide the reader.
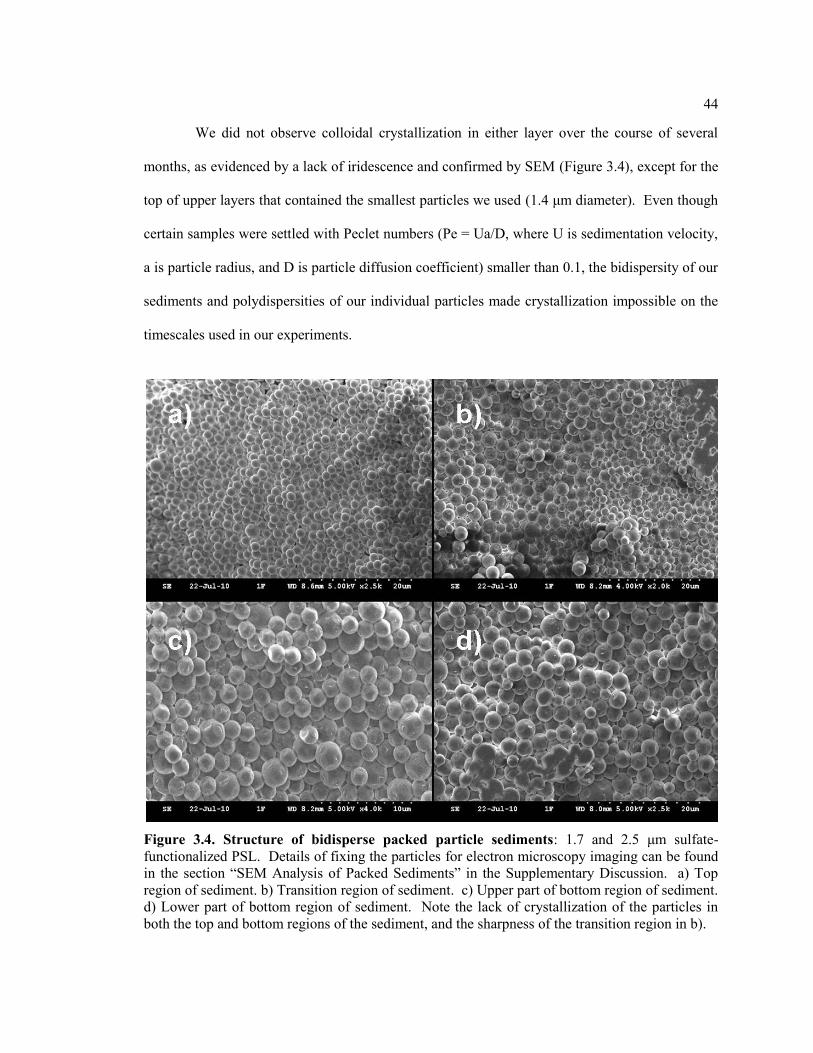
44
We did not observe colloidal crystallization in either layer over the course of several
months, as evidenced by a lack of iridescence and confirmed by SEM (Figure 3.4), except for the
top of upper layers that contained the smallest particles we used (1.4 μm diameter). Even though
certain samples were settled with Peclet numbers (Pe = Ua/D, where U is sedimentation velocity,
a is particle radius, and D is particle diffusion coefficient) smaller than 0.1, the bidispersity of our
sediments and polydispersities of our individual particles made crystallization impossible on the
timescales used in our experiments.
Figure 3.4. Structure of bidisperse packed particle sediments: 1.7 and 2.5 μm sulfate-
functionalized PSL. Details of fixing the particles for electron microscopy imaging can be found
in the section ―SEM Analysis of Packed Sediments‖ in the Supplementary Discussion. a) Top
region of sediment. b) Transition region of sediment. c) Upper part of bottom region of sediment.
d) Lower part of bottom region of sediment. Note the lack of crystallization of the particles in
both the top and bottom regions of the sediment, and the sharpness of the transition region in b).
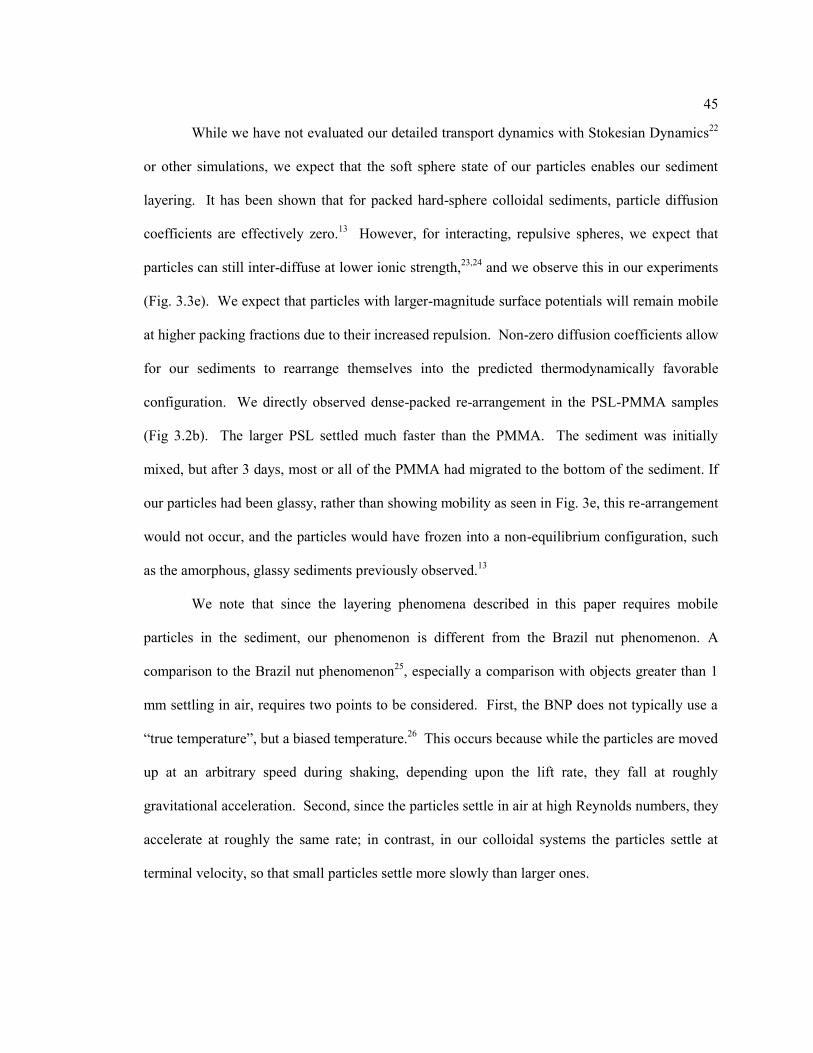
45
While we have not evaluated our detailed transport dynamics with Stokesian Dynamics22
or other simulations, we expect that the soft sphere state of our particles enables our sediment
layering. It has been shown that for packed hard-sphere colloidal sediments, particle diffusion
coefficients are effectively zero.13
However, for interacting, repulsive spheres, we expect that
particles can still inter-diffuse at lower ionic strength,23,24
and we observe this in our experiments
(Fig. 3.3e). We expect that particles with larger-magnitude surface potentials will remain mobile
at higher packing fractions due to their increased repulsion. Non-zero diffusion coefficients allow
for our sediments to rearrange themselves into the predicted thermodynamically favorable
configuration. We directly observed dense-packed re-arrangement in the PSL-PMMA samples
(Fig 3.2b). The larger PSL settled much faster than the PMMA. The sediment was initially
mixed, but after 3 days, most or all of the PMMA had migrated to the bottom of the sediment. If
our particles had been glassy, rather than showing mobility as seen in Fig. 3e, this re-arrangement
would not occur, and the particles would have frozen into a non-equilibrium configuration, such
as the amorphous, glassy sediments previously observed.13
We note that since the layering phenomena described in this paper requires mobile
particles in the sediment, our phenomenon is different from the Brazil nut phenomenon. A
comparison to the Brazil nut phenomenon25
, especially a comparison with objects greater than 1
mm settling in air, requires two points to be considered. First, the BNP does not typically use a
―true temperature‖, but a biased temperature.26
This occurs because while the particles are moved
up at an arbitrary speed during shaking, depending upon the lift rate, they fall at roughly
gravitational acceleration. Second, since the particles settle in air at high Reynolds numbers, they
accelerate at roughly the same rate; in contrast, in our colloidal systems the particles settle at
terminal velocity, so that small particles settle more slowly than larger ones.
46
Usually, when the particles start as a mixture and are centrifuged at 1000g, they sort into
the expected minimum energy configuration, but this is not always the case. The importance of
packed particle mobility can be examined by immobilizing a sediment using centrifugation. In
one experiment we settled 2.0 m blue PSL particles at 1 g, and then we settled 3.0 m green PSL
Figure 3.5 Influence of the “freezing effect” on the final state of the sediment. a, 100 mL of
2.0 μm blue sulfate PSL particles at 0.01 volume fraction were loaded into a glass Pasteur pipette
sealed with wax. b, A sediment was formed after sedimentation of the sample in a at 1g for 3
days. c, Similarly, another sediment was formed by centrifuging the sample in a at 1000g for 30
minutes. d, 100 ml of 3.0 μm green sulfate PSL particles at 0.01 volume fraction were loaded on
top of the resulting sediment (either b or c). e, Final configuration of the system after the 3.0 μm
green particles were settled at 1g for 5 days on top of the sediment produced on b. At the end, the
2.0 μm blue particles rose to the top. f, Final configuration of the system after the 3.0 μm green
particles were centrifuged at 1000g for 30 minutes on top of the sediment produced in c. The 2.0
μm blue particles had been ―frozen into place‖ by the high g value, and the system remained
unchanged for over 12 months.
47
particles at 1g on top. With time the particles began to re-arrange into the expected minimum-
energy configuration. However, when this same experiment was run at 1000g, the particles did
not invert (Figure 3.5). In the 1000g case, the gravitational forces overcame the colloidal
repulsion, causing the particles to aggregate irreversibly and stop diffusing. This freezing effect
has been used to measure maximum repulsive colloidal forces.27,28
3.4 Conclusions
Traditionally, characterization of particle sediments has relied primarily on a single
dimensionless quantity: the Peclet number (Pe). By comparing the rate of particle sedimentation
to that of particle diffusion, sediments could be predicted to form glassy sediments (where
sedimentation dominates, high Pe) or colloidal crystals (where diffusion dominates, low Pe). In
this work, we observed a third type of sediment, mobile layered sediments. Knowing the Peclet
number alone does not enable us to predict this phenomenon. Instead, we propose two essential
conditions that must be met to form layered sediments: 1) the particles must settle fast enough to
prevent crystallization, but 2) must remain mobile once settled. Condition (1) typically requires
Pe > 0.01 (i.e., faster settling), but can also be met for bidisperse / polydisperse samples with
lower Peclet numbers (where crystallization can be hindered or made impossible by the particle
inhomogeneity). Second, particle mobility also requires that the repulsive forces between
particles be sufficient to prevent direct contact of the particles, since hard sphere repulsions do
not allow for sufficient mobility, especially for large particles.7,13
It is interesting to note that in
our systems, having 1/a from 0.008 to 0.45 is sufficient to provide particle mobility. We note
that these conditions for particle mobility are frequently met in aqueous systems where the
particles are highly-charged, and so our systems represent a common case. We expect that in the
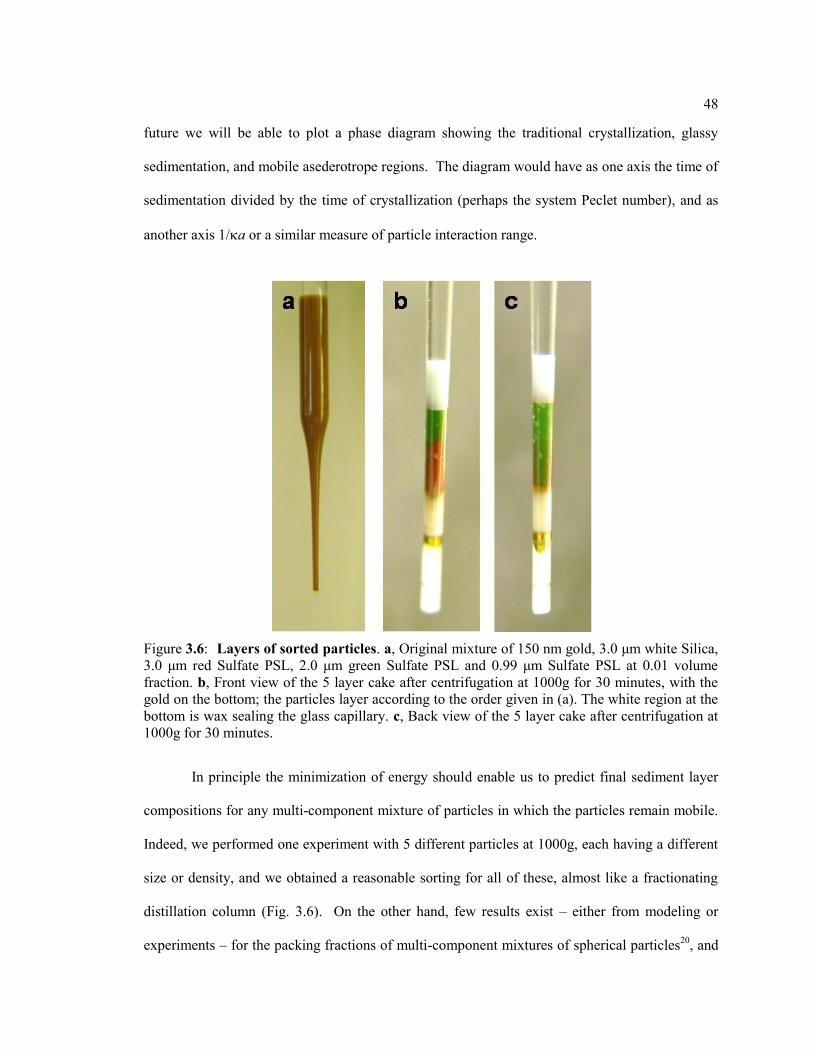
48
future we will be able to plot a phase diagram showing the traditional crystallization, glassy
sedimentation, and mobile asederotrope regions. The diagram would have as one axis the time of
sedimentation divided by the time of crystallization (perhaps the system Peclet number), and as
another axis 1/a or a similar measure of particle interaction range.
In principle the minimization of energy should enable us to predict final sediment layer
compositions for any multi-component mixture of particles in which the particles remain mobile.
Indeed, we performed one experiment with 5 different particles at 1000g, each having a different
size or density, and we obtained a reasonable sorting for all of these, almost like a fractionating
distillation column (Fig. 3.6). On the other hand, few results exist – either from modeling or
experiments – for the packing fractions of multi-component mixtures of spherical particles20
, and
Figure 3.6: Layers of sorted particles. a, Original mixture of 150 nm gold, 3.0 μm white Silica,
3.0 μm red Sulfate PSL, 2.0 μm green Sulfate PSL and 0.99 μm Sulfate PSL at 0.01 volume
fraction. b, Front view of the 5 layer cake after centrifugation at 1000g for 30 minutes, with the
gold on the bottom; the particles layer according to the order given in (a). The white region at the
bottom is wax sealing the glass capillary. c, Back view of the 5 layer cake after centrifugation at
1000g for 30 minutes.
49
even less so for mixtures of say singlet and doublet particles. Such studies require great care. It
is possible that such mixed packing fractions might be measurable by using the predictions from
this work.
3.5 Acknowledgements and Permissions
Chapter 3 is a modified version of the author‘s publication:
César González Serrano, Joseph J. McDermott, Darrell Velegol. Sediments of Soft Spheres
Arranged by Effective Density Nature Materials 2011 advance online publication
We thank the Department of Energy (Grant No. DE-FG02-07ER46414) for funding this
project. We also thank Penn State‘s Huck Institute of Life Sciences Center for Qualitative Cell
Analysis for their assistance and use of their Olympus Fluoview 1000 confocal laser scanning
microscope, and Mathew Boland and David Palm for their contribution to the initial stages of the
research.
I would like to thank César González Serrano and Darrell Velegol for pulling me (kicking
and screaming at first) into this fascinating work. Cesar originated the work and conducted the
preliminary experiments, while my role began primarily as a theoretical consultant. Over time,
we began to work together on both the experimental and modeling results. After Cesar departed
from the Velegol lab, I headed up the final experimental results (Fig 3.2, Fig 3.4) and worked
collaboratively with Darrell and Cesar to finalize our model for publication, writing a
considerable portion of the manuscript, of which I am a corresponding author.
50
3.6 References
1 Bachelor, G. K. Sedimentation in a dilute polydisperse system of interacting spheres. J. Fluid
Mech. 1982, 119, 379-408.
2 Vesaratchanon, S., Nikolov, A., Wasan, D. T. Sedimentation in nano-colloidal dispersions:
Effects of collective interactions and particle charge. Adv. Colloid Interfac. 2007, 134, 268-
278.
3 Rasa, M., Philipse, A. P. Evidence for a macroscopic electric field in the sedimentation profiles
of charged colloids. Nature 2004, 429, 857-860.
4 Wang, T., Li, H., Sheng, Y., Tsao, H. Equilibrium sedimentation profile of dilute, salt-free
charged colloids. 2008, J. Chem. Phys. 129, 204504.
5 Pusey, P. N., Van Megen, W. Phase behavior of concentrated suspensions of nearly hard
colloidal spheres. 1986, Nature, 320, 340-342.
6 Rastogi, V., Melle, S., Calderón, O. G., Garcıá, A. A., Marquez, M., Velev, O. D. Synthesis of
Light-Diffracting Assemblies from Microspheres and Nanoparticles in Droplets on a
Superhydrophobic Surface. 2008, Adv. Mater. 20, 4263–4268.
7 Cheng, Z.; Russel, W.B.; Chaikin, P.M. Controlled growth of hard-sphere colloidal crystals.
Nature 1999, 401, 893-895.
8 Hoogenboom, J. P., Derks, D., Vergeer, P., van Blaaderen, A. Stacking faults in colloidal
crystals grown by sedimentation. J. Chem. Phys. 2002, 117, 11320.
9 Yethiraj, A., van Blaaderen, A. A colloidal model system with an interaction tunable from hard
sphere to soft and dipolar. Nature 421, 2003, 513-517.
51
10 Chu, J., Lee, M., Royers, R., Mayer, W., Ottewill, R. H., S.T.S.-73 Shuttle Crew, Russel, W.
B., Chaikin, P. M. Crystallization of hard-sphere colloids in microgravity. Nature 1997, 387,
883-885.
11 Monovoukas, Y., Gast, A.P. The experimental phase diagram of charged colloidal suspensions.
J. Colloid Interf. Sci. 1989, 128, 533-548.
12 Handley, D. A., Hayat, M. A. Colloidal Gold: Principles, Methods and Applications Ed.
(Academic Press, San Diego, 1989), vol. 1.
13 Kegel, W. K., van Blaaderen, A. Direct Observation of Dynamical Heterogeneities in Colloidal
Hard-Sphere Suspensions. Science 2000, 287, 290-293.
14 Russel, W. B., Schowalter, W. R. & Saville, D. A. Colloidal Dispersions (Cambridge Univ.
Press, Cambridge, 1999).
15 Donev, A., Cisse, I., Sachs, D., Variano, E. A., Stillinger, F. H., Connelly, R., Torquato, S.,
Chaikin, P. M. Improving the Density of Jammed Disordered Packings Using Ellipsoids.
Science 2004, 303, 990–993.
16 Torquato, S., Jiao, Y. Dense packings of the Platonic and Archimedean solids. Nature 2009,
460, 876-879.
17 Zou, L., Cheng, X., Rivers, M. L., Jaeger, H. M., Nagel, S. R. The Packing of Granular
Polymer Chains. Science 2009, 326, 408-410.
18 Jiao, Y., Stillinger, F. H., Torquato, S. Optimal packings of superballs. Physical Review E
2009, 79, 041309.
19 Berryman, J. G. Random close packing of hard spheres and disks. Phys. Rev. A 1982, 27, 1053-
1061.
52
20 Visscher, W. M., Bolsterli, M. Random packing of equal and unequal spheres in 2 and 3
dimensions. Nature 1972, 239, 504.
21 McGeary, R.K., Mechanical Packing of Spherical Particles Vibratory Compacting: Principles
and Methods (Plenum Press, New York, 1967). See Fig. 3 on p. 220, which shows the
packing fractions, with data that support the calculations in Ref. 19.
22 Brady, J. F., Bossis, G. Stokesian Dynamics Ann. Rev. Fluid Mech. 1988, 20, 111-157.
23 Nagele, Gerhard. On the dynamics and structure of charge-stabilized suspensions. Physics
Reports, 1996, 272, 215-372. See especially section 4 for changes in long-time self-diffusion
coefficients.
24 Anderson, J. L., Rauh, F., Morales, K. Particle diffusion as a function of concentration and
ionic strength. J. Phys. Chem. 1978, 82, 608-616. The gradient diffusion coefficient increases
with volume fraction, but the self-diffusion coefficient is more relevant.
25 Hong, D. C., Quinn, P. V., Luding, S. Reverse Brazil Nut Problem: Competition between
Percolation and Condensation Phys. Rev. Lett. 2001, 86, 3423-3426.
26 Rosato, A., Strandburg, K. J., Prinz, F., Swendsen, R. H. Why the Brazil nuts are on top: Size
segregation of particulate matter by shaking. Phys. Rev. Lett. 1987, 58, 1038-1040.
27 Meijer, A. E. J., van Megen, W. J., Lyklema, J. Pressure-induced Coagulation of polystyrene
Latices. J. Colloid Interface Sci. 1978, 66, 99-104.
28 Bensley, C. N., Hunter, R. J. The coagulation of concentrated colloidal dispersions at low
electrolyte concentrations II. Experimental coagulation pressures. J. Colloid Interface Sci.
1983, 92, 448-462.
Chapter 4
Simple Fabrication of Gold-Silver Heterodoublet Motors
4.1 Introduction & Background
4.1.1 Introduction
Metallic colloidal doublets have a number of potential applications, including sensing,1,2,3
colloidal robotics,4,5
colloidal antennae,6,7
and surface-enhanced Raman spectroscopy.1,8
The
point contact of two metallic spheres has a region around it where the surfaces are nearly
touching, which enables the exploitation of surface plasmon resonance in that region, or in the
case of different metals, even a slight diode function.9 The purpose of this chapter is to describe a
simple and inexpensive method for fabricating metallic homodoublets or heterodoublets (and
even triplets), with electrical connectivity between the two spheres in the doublet. We
demonstrate gold−gold, silver−silver, and gold−silver doublets of roughly micrometer size.
4.1.2 Literature Review
Homodoublets and heterodoublets of colloidal particles have been previously synthesized
using a variety of techniques. Most work in the field has been done using polymeric or metal-
oxide colloids. The most common technique for the production of colloidal doublets has been
templating, in which a glass or silicon substrate is chemically patterned, typically using a
photoresist, creating a series of pits.10,11
These pits allow for specific assemblies of particles,
based on for instance the size of both the particles and the templates.11
These studies have been
54
performed generally on only polymer and silica colloids with sizes on the scale of 500−1000 nm.
Silica doublets (with sphere diameters ranging from 174 nm to 2.3 μm) have been formed from
shear-induced aggregation using ammonia and ethanol to cause destabilization in solution.12
Additionally, doublets of silica particles (with sphere diameters on the order of 300 nm) were
formed by adding tetraethylorthosilicate to a suspension of silica colloids.13
The
tetraethylorthosilicate condenses on the silica surface, ‗fixing' aggregated silica doublets in place.
A heat-assisted convective assembly technique was used to produce ZnS14
or polystyrene15
doublets; in this technique, the temperature is raised to increase Brownian motion (and possibly
buoyant convection) and then cooled to reduce the motion. Binary colloidal structures of
polystyrene have also been assembled by functionalizing two different sizes of polystyrene
colloid (0.94 and 5.5 μm, respectively) with interacting proteins that biomolecularly cross-link
the colloids together.16
Finally, clusters of silica, polystyrene, or polymethylmethacrylate on the
order of a micrometer were formed by the slow evaporation of an organic solvent in water and in
the presence of a stabilizing block copolymer.17
The synthesis of doublets of metallic colloids has also been accomplished through a
variety of methods. Gold nanoparticles of size 150 nm have been deposited next to each other on
a substrate using electron beam lithography.6 Similarly, simple gold aggregates can be grown in
2-D arrays on organosilane-coated substrates.18
Gold−iron oxide nanoparticle doublets have been
synthesized by decomposition of Fe(CO)5 on the surfaces of gold nanoparticles,19
while
silver−iron oxide nanoparticle doublets were formed by the reduction of silver on the surface of
iron oxide nanoparticles.20
Likewise, a method of forming silver−iron oxide nanoparticle doublets
by nucleating a silver nanoparticle on a Fe3O4 nanoparticle at a liquid−liquid interface has been
described.21
Doublets of 1.4 nm colloidal gold were prepared by attaching the nanoparticles to
single-stranded DNA oligonucleotides and assembled by adding the complementary DNA
template to solution.22
Asymmetric doublets of spherical oxide particles and gold half-shells were
55
formed by coating an array of 600 nm oxide particles with a thin gold film, which dewetted into
half-shells after thermal annealing.23
In addition to traditional doublets, the formation of structures similar to metallic
heterodoublets, yet lacking two distinct particles, has also been accomplished. A typical example
is the synthesis of gold−platinum nanorods by vapor deposition and electroplating of the two
metals on an alumina membrane.24
Gold−silica−gold nanodisks have been formed by electron
beam lithography and evaporation onto quartz substrates.25
Silica spheres were capped with gold
and titanium through a pattering procedure involving the e-beam sputtering of the metals onto the
silica spheres, which were partially obscured by a photoresist blocking film.26
Cobalt−palladium
nano-‗acorns' (showing clear phase separation) were produced when precursor cobalt and
palladium complexes were reduced in di-n-octyl ether and in the presence of 1-octadecanethiol.27
4.1.3 Chapter Aims & Overview
Two challenges with most of the previously mentioned techniques for fabricating
doublets are that they either (a) are limited to particular materials (e.g., polymers or oxides or
metals) or (b) are difficult to scale up in production. Recently, a robust technique for fabricating
colloidal doublets has been published by our group. The salting out/quenching/fusing (SQF)
technique28
uses the reliance of colloidal stability in aqueous solutions on the ionic strength (or
other stimulus, such as pH) of that solution. By increasing the ionic strength greatly, a suspension
of colloidal particles will usually aggregate in a diffusion-limited manner due to the increased
ionic shielding of electrostatic repulsive forces. Particles that aggregate are held together by their
attractive van der Waals forces. We then halt aggregation by diluting the ionic strength, thus
restoring stability due to restored electrostatic repulsion. The solution of aggregates is usually
quenched early enough in the aggregation process to yield primarily doublets and unreacted
56
singlets in solution, although sometimes it is desirable to also form a fraction of triplets, which we
test in the present research. Finally, in order to better stabilize the doublets after aggregation and
quenching, a fusing step is often added in which polymer particles are brought above their glass
transition temperature, allowing doublets to fuse together. Previously, the SQF technique was
performed on polymer colloids and silica colloids.28
The primary advantages of the SQF
technique are simplicity (requiring few steps, few materials, and little time) and flexibility
(allowing for a wide range of degrees of aggregation and allowing for the use of mixed
materials).
In the present research, we combine the salting out and quenching steps described above
with known techniques for synthesizing micrometer size metal particles33
in order to fabricate
gold−gold, silver−silver, or gold−silver doublets. The advances relative to our previous doublet
fabrication were several for the metal doublets. (1) For polymer−polymer or polymer−silica
doublets, the mechanical stability is greatly enhanced by fusing the doublet above the glass
transition temperature of the polymer. With their high melting points, the fusing step is not
feasible for our metal−metal doublets; however, we hypothesized that since the metals have such
high Hamaker constants29
in aqueous solution, that attractive van der Waals forces might
maintain the mechanical integrity of the doublets. Thus, we conducted analyses of mechanical
stability (with sonication) to determine the fraction of doublets that remained as doublets. (2)
Many of the interesting and important properties of metallic colloidal doublets require that the
spheres in the doublet have electrical connectivity. However, measuring the connectivity of these
doublets is a significant challenge. Recently, it has been shown that heterogeneous nanorods
synthesized from gold and platinum in hydrogen peroxide solutions show a movement that is 10×
or more faster than the movement predicted by Brownian motion alone over 10 s or more.4,5,30
This movement, which works by autoelectrophoresis31
resulting from the electrochemical
decomposition of H2O2, requires electrical connectivity of the two metals across their interface.32
57
This process is discussed in more detail in Chapter 5. Here we use this result analytically to test
gold−silver heterodoublets for electrical connectivity. Our findings open the door to detailed
studies of electron transport between the spheres in the doublet. (3) A more advanced colloidal
assembly that can be fabricated using the SQ process is a triplet of particles. Also, it is sometimes
useful (or required) to form doublets at a rate less than the rapid aggregation rate. In this research,
we demonstrate practically that the SQF (or SQ) process is readily generalized to operate at
slower rates, and to form triplets of particles.
4.2 Experimental Methods & Materials
4.2.1 Materials
To synthesize the gold particles, HAuCl4 was purchased from Strem Chemicals (lot no.
B7817045). For the silver particles, AgNO3 was purchased from Sigma (lot no. 124K3640). In
both cases, reduction of the metal ions was done by l-ascorbic acid (C6H8O6, Sigma, lot no.
07908BD). The steric stabilizer used in both syntheses was gum arabic, a blend of galactose,
rhamnose, arabinose, and glucuronic acid, with a molecular weight around 250 000 (Sigma).
Solutions of KCl (EM Science, lot no. PX14051) were used in the aggregation steps. Deionized
(DI) water used in all aqueous solutions came from a Millipore Corporation MilliQ system, with
specific resistance greater than 1 MΩ·cm (due to equilibration with CO2 in air).
58
4.2.2 Gold and Silver Colloid Synthesis and Characterization
A robust technique for the synthesis of micrometer-scale colloidal metal particles has
been previously described in detail for both gold and silver.33,34,35
In this technique, gold or silver
ions are reduced in solution with gum arabic over 1−2 days. The resulting metal nanoparticles are
initially solvated but eventually drop out of solution, forming seed particles. These seed particles
grow over time as the reduction reaction continues, until large particles formed by the clustering
of nanoparticles remain. The gum arabic acts as a steric stabilizer, preventing aggregation of these
larger particles due to the high ionic strength of the reaction solutions.
For the synthesis of the colloidal gold, two 75 mL solutions were prepared. The first
contained 25 mM HAuCl4 and 3 wt % gum arabic. The second contained 50 mM l-ascorbic acid
and 3 wt % gum arabic. The solutions were combined in a 250 mL covered reaction flask and
stirred rapidly for 48 h. After stirring, the newly formed gold particles were allowed to settle for 3
h. The supernatant was drawn off, and the gold particles were rinsed twice and finally
resuspended in DI water.
The colloidal silver was formed using a similar procedure. Again, two 75 mL solutions
were prepared. The first contained 167 mM silver nitrate and 7 wt % gum arabic. The second
contained 333 mM l-ascorbic acid and 7 wt % gum arabic. The solutions were again combined in
a 250 mL covered reaction flask and stirred for 48 h. The resulting silver particles were settled for
3 h, rinsed twice, and resuspended in DI water.
The particles were imaged and sized using a JEOL 6700F field emission scanning
electron microscope (FESEM) with accelerating voltages of 3 and 5 keV and an operating current
of 20 μA, allowing for magnifications from 1300 to 150 000×. Optical images were taken using a
Nikon Eclipse TE2000-U inverted optical microscope with magnifications of 20, 40, and 100×.
Zeta potentials of the particles were measured with a Brookhaven Instruments PALS (phase
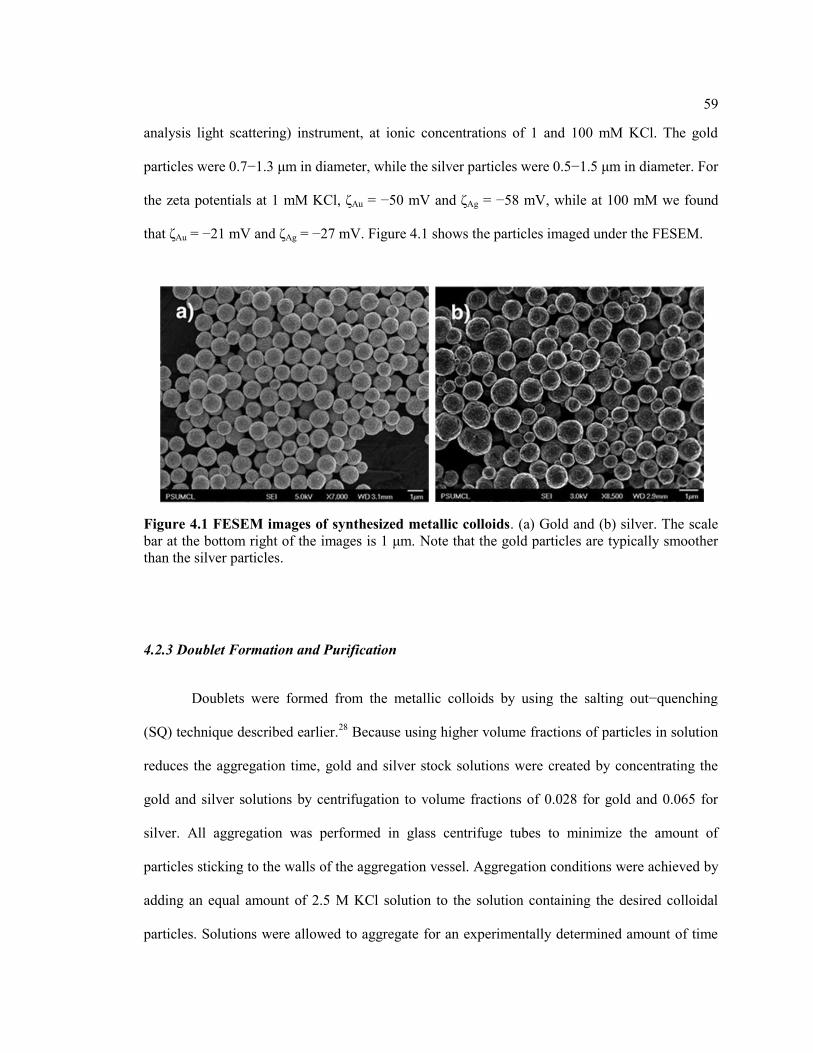
59
analysis light scattering) instrument, at ionic concentrations of 1 and 100 mM KCl. The gold
particles were 0.7−1.3 μm in diameter, while the silver particles were 0.5−1.5 μm in diameter. For
the zeta potentials at 1 mM KCl, ζAu = −50 mV and ζAg = −58 mV, while at 100 mM we found
that ζAu = −21 mV and ζAg = −27 mV. Figure 4.1 shows the particles imaged under the FESEM.
4.2.3 Doublet Formation and Purification
Doublets were formed from the metallic colloids by using the salting out−quenching
(SQ) technique described earlier.28
Because using higher volume fractions of particles in solution
reduces the aggregation time, gold and silver stock solutions were created by concentrating the
gold and silver solutions by centrifugation to volume fractions of 0.028 for gold and 0.065 for
silver. All aggregation was performed in glass centrifuge tubes to minimize the amount of
particles sticking to the walls of the aggregation vessel. Aggregation conditions were achieved by
adding an equal amount of 2.5 M KCl solution to the solution containing the desired colloidal
particles. Solutions were allowed to aggregate for an experimentally determined amount of time
Figure 4.1 FESEM images of synthesized metallic colloids. (a) Gold and (b) silver. The scale
bar at the bottom right of the images is 1 μm. Note that the gold particles are typically smoother
than the silver particles.
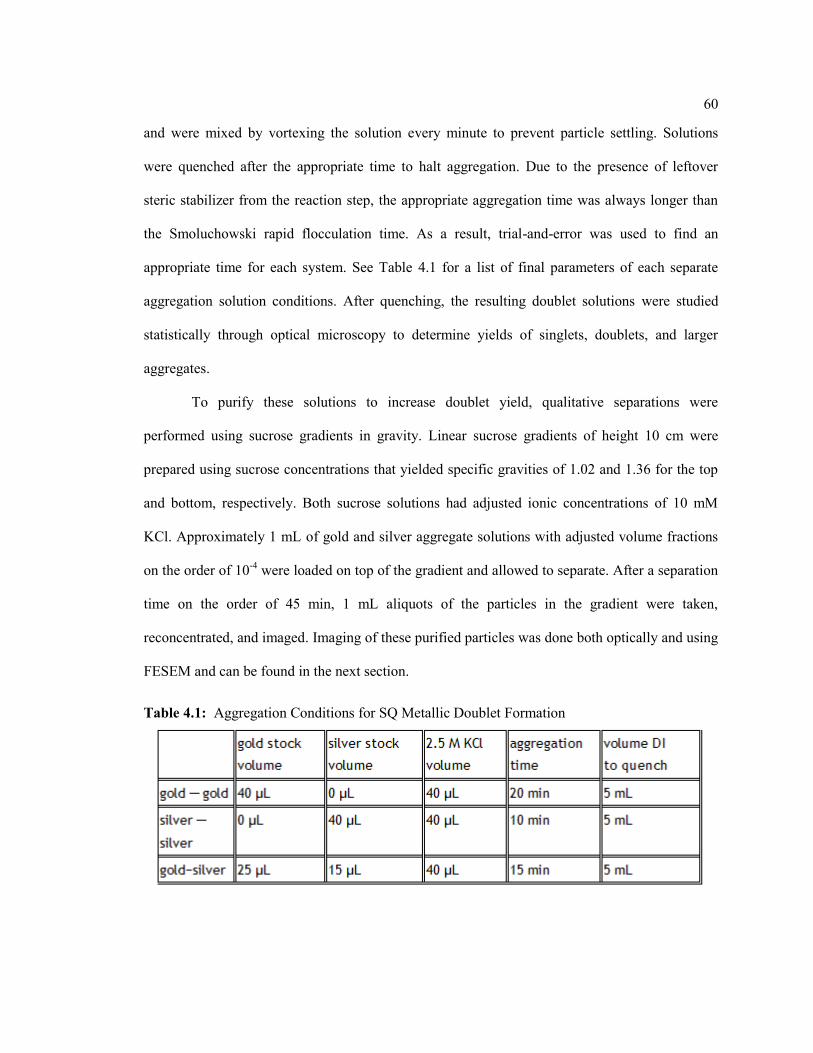
60
and were mixed by vortexing the solution every minute to prevent particle settling. Solutions
were quenched after the appropriate time to halt aggregation. Due to the presence of leftover
steric stabilizer from the reaction step, the appropriate aggregation time was always longer than
the Smoluchowski rapid flocculation time. As a result, trial-and-error was used to find an
appropriate time for each system. See Table 4.1 for a list of final parameters of each separate
aggregation solution conditions. After quenching, the resulting doublet solutions were studied
statistically through optical microscopy to determine yields of singlets, doublets, and larger
aggregates.
To purify these solutions to increase doublet yield, qualitative separations were
performed using sucrose gradients in gravity. Linear sucrose gradients of height 10 cm were
prepared using sucrose concentrations that yielded specific gravities of 1.02 and 1.36 for the top
and bottom, respectively. Both sucrose solutions had adjusted ionic concentrations of 10 mM
KCl. Approximately 1 mL of gold and silver aggregate solutions with adjusted volume fractions
on the order of 10-4
were loaded on top of the gradient and allowed to separate. After a separation
time on the order of 45 min, 1 mL aliquots of the particles in the gradient were taken,
reconcentrated, and imaged. Imaging of these purified particles was done both optically and using
FESEM and can be found in the next section.
Table 4.1: Aggregation Conditions for SQ Metallic Doublet Formation
61
4.2.4 Electrical Connectivity of Doublets
To test for electrical connectivity, the doublets were observed in a 3% hydrogen peroxide
solution under an optical microscope at 20× magnification. The H2O2 solution was first placed in
a Petri dish, and 8 μL of the doublet solutions (after quenching) was added. The movement of the
doublets was observed and recorded. When the two spheres of the doublet are electrically
connected, a spontaneous autoelectrophroesis occurs. This technique has only recently been
developed and does not yet give quantitative information about conductivity but is used for
qualitative analytical purposes to examine electrical connectivity.4,5
Previous literature has shown
that if no electrical connectivity exists between the gold and silver, no autoelectrophoresis of the
particle occurs.4,5,32
4.2.5 Stability of Doublets Under Sonication
Sonication of colloidal aggregates is a simple and effective test of the aggregates'
mechanical stability. It has been used in previous studies of the SQF technique as a way to break
apart unstable doublets.28
For the metallic doublet solutions, a sample of each was sonicated for
30 min and its composition of aggregates was statistically analyzed again through optical
microscopy. Sonication was performed using a VWR International ultrasonicator (model 550T).
62
4.3 Results & Discussion
4.3.1 Doublet Formation and Aggregate Distribution
Metallic doublets form readily under the conditions described previously, and they
remain stable both in solution (i.e., do not aggregate) and in sonication (i.e., doublets do not split
back into singlets). Figure 4.2 shows FESEM images of the doublets. A key question concerns the
fraction of the particles that become doublets or triplets or other aggregates. Figure 4.3 shows
statistics of the SQF procedure for forming metallic doublets, as well as the stability results for
each system as tested through sonication. Figure 4.4 shows doublets that have been purified using
the density gradient sedimentation technique. After fabricating aggregates of various size using
the quick and inexpensive SQ process, we are readily able to separate aggregates of various size,
as has been done previously in the literature for more complex assemblies.36
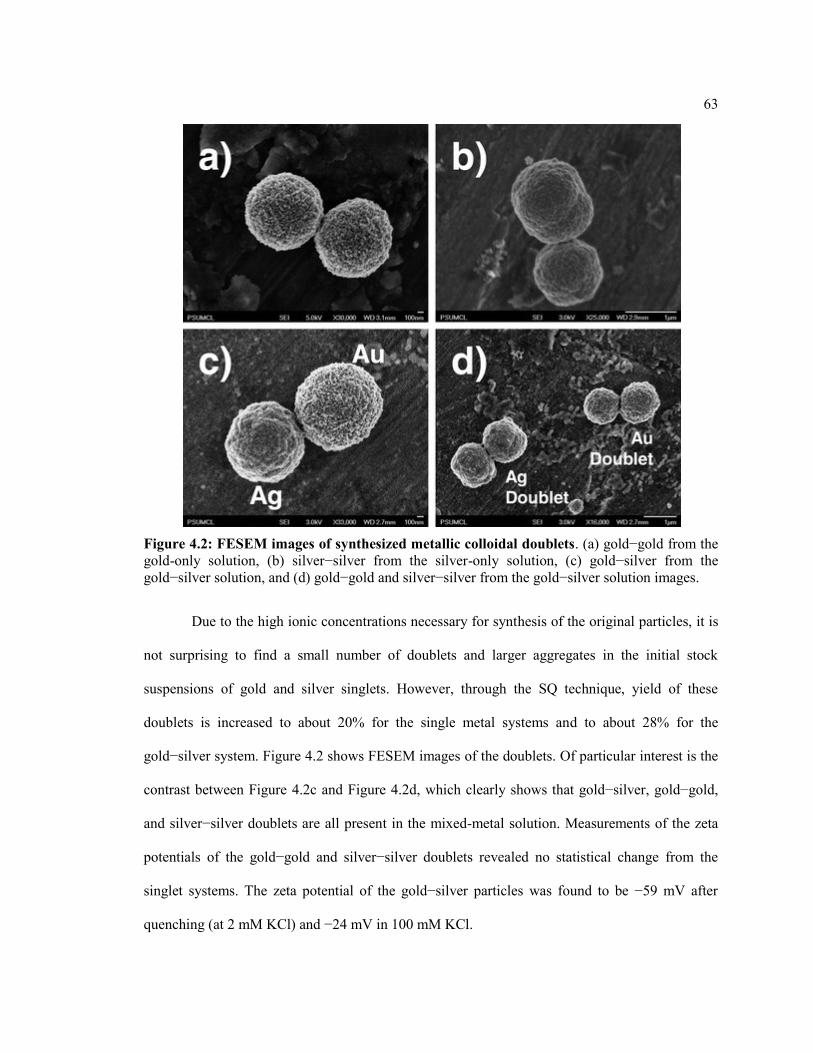
63
Due to the high ionic concentrations necessary for synthesis of the original particles, it is
not surprising to find a small number of doublets and larger aggregates in the initial stock
suspensions of gold and silver singlets. However, through the SQ technique, yield of these
doublets is increased to about 20% for the single metal systems and to about 28% for the
gold−silver system. Figure 4.2 shows FESEM images of the doublets. Of particular interest is the
contrast between Figure 4.2c and Figure 4.2d, which clearly shows that gold−silver, gold−gold,
and silver−silver doublets are all present in the mixed-metal solution. Measurements of the zeta
potentials of the gold−gold and silver−silver doublets revealed no statistical change from the
singlet systems. The zeta potential of the gold−silver particles was found to be −59 mV after
quenching (at 2 mM KCl) and −24 mV in 100 mM KCl.
Figure 4.2: FESEM images of synthesized metallic colloidal doublets. (a) gold−gold from the
gold-only solution, (b) silver−silver from the silver-only solution, (c) gold−silver from the
gold−silver solution, and (d) gold−gold and silver−silver from the gold−silver solution images.
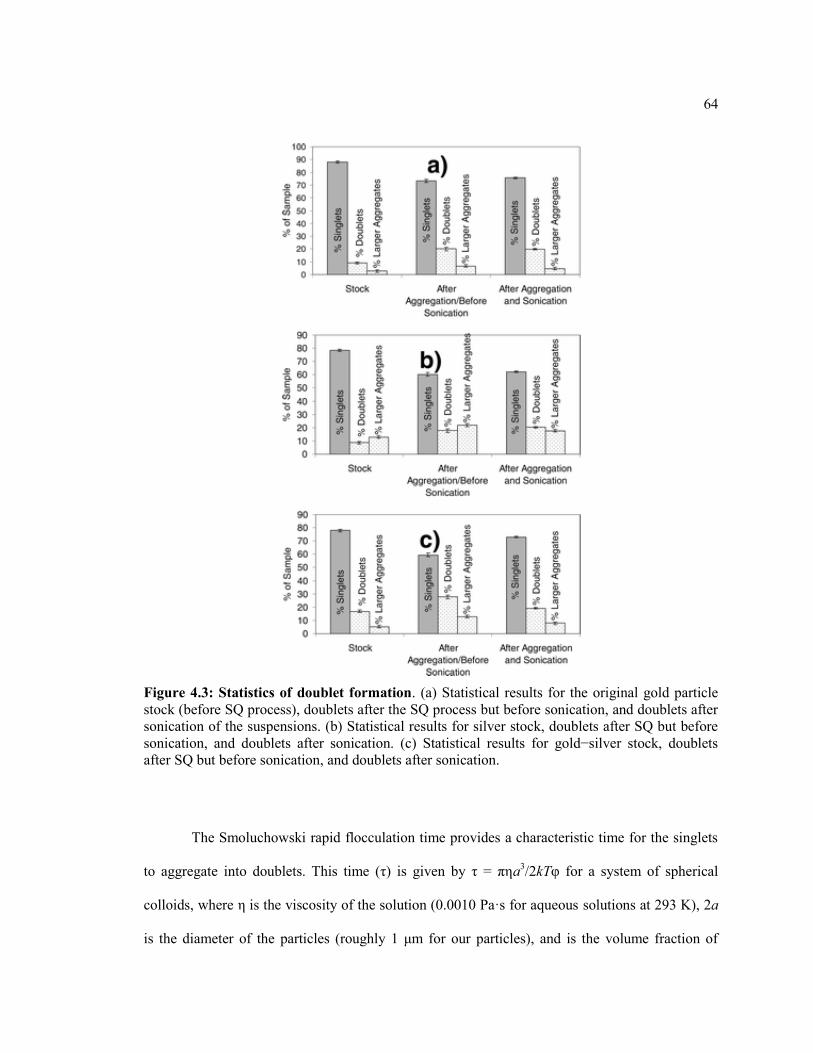
64
The Smoluchowski rapid flocculation time provides a characteristic time for the singlets
to aggregate into doublets. This time (τ) is given by τ = πηa3/2kTφ for a system of spherical
colloids, where η is the viscosity of the solution (0.0010 Pa·s for aqueous solutions at 293 K), 2a
is the diameter of the particles (roughly 1 μm for our particles), and is the volume fraction of
Figure 4.3: Statistics of doublet formation. (a) Statistical results for the original gold particle
stock (before SQ process), doublets after the SQ process but before sonication, and doublets after
sonication of the suspensions. (b) Statistical results for silver stock, doublets after SQ but before
sonication, and doublets after sonication. (c) Statistical results for gold−silver stock, doublets
after SQ but before sonication, and doublets after sonication.
65
particles in solution.28
For our metallic systems, τ would be on the order of seconds at high ionic
strength. However, we did not see any significant aggregation on this time scale. The delay is
explained by the presence of sterically stabilizing gum arabic that is leftover from the synthesis of
each metallic colloid. Significant aggregation was not seen for any of the three systems until a
time of 10 min. This suggests that the stability ratio for these colloidal systems is on the order of
500, even at a very high ionic strength of 1.25 M.
Although the presence of a sterically stabilizing polymer was originally not a desirable
facet of the SQ experiment, the experiments do show a useful consequence. For systems that are
difficult to control - for example, nanoparticles often have rapid aggregation times of less than a
microsecond - we simply manipulate the stability ratio to allow aggregation at slower rates,
giving more control over the state of the system when quenched. By drawing out the aggregation,
it becomes possible to freeze the system in a more precise configuration. This result is a simple
consequence of colloidal stability theory, and we have demonstrated it experimentally.
4.3.2 Doublet Purification
Purification of the doublets was achieved using density gradient separation, as described
earlier. As shown in Figure 4.4, gold singlets (a), doublets (b), triplets (c), and n-aggregates with
3 ≤ n ≤ 5 (d) were all successfully purified to a purity of 85% or greater. Of particular interest are
the separated triplets. While it is reasonable to expect the singlets and doublets to separate out
from the larger aggregates, it is promising to see a layer of fairly pure triplets as well. This
separations behavior, combined with the control granted by the presence of a steric stabilizer,
shows that it would be possible to use the SQ technique to assemble and purify a high yield of
colloidal triplets in addition to the doublets shown here. We envision instances where having a

66
quick and cheap method for fabricating triplets would be quite useful, especially if the precise
final structure were less important than simply having three particles together.
4.3.3 Doublet and Aggregate Stability
The homodoublet suspensions of gold−gold and silver−silver were found to be
mechanically stable since the relative concentrations of singles, doublets, and larger aggregates
were practically unchanged after sonication (save for some small breakup of the larger
Figure 4.4: Optical images of purified gold aggregates.
(a) Purified gold singlets, 20× magnification, roughly 90% purity. (b) Purified gold doublets at
20×, roughly 85% purity. (c) Purified triplets at 20×, roughly 85% purity. (d) Purified small
aggregates at 40×, with a fairly narrow size distribution. We note that the clarity of the images is
diminished due to the presence of the sucrose. Nevertheless, singlets, doublets, triplets, and
higher aggregates are still discernible.
67
aggregates). In the heterodoublet gold−silver solution, significant breakup was seen of both the
doublets and the larger aggregates. The homodoublet stability is readily explained by the large
Hamaker constants (A) that govern attractive van der Waals forces for gold−water−gold (A ≈ 90
kT) and silver−water−silver (A ≈ 100 kT) systems,29
between 1 and 2 orders of magnitude higher
than most polymers or ceramics in water. The breakup of the silver−gold heterodoublets after 30
min of sonication is not so readily explained, at least with our current techniques. However, we
note that no significant change in the aggregation percentages of any of the unsonicated solutions
was seen over the course of 4 months. This suggests that both the gold and silver are
mechanically stable and that doublets of the gold, silver, and gold−silver do not break up over
time. Additionally, qualitative studies have been performed suggesting that all types of the
doublets can withstand low-to-moderate shear forces, as well as shorter sonication times of a few
minutes.
4.3.4 Motility of Gold-Silver Doublets
In the testing of doublets for electrical connectivity, only a small amount of Brownian
motion was detected when the gold−gold or silver−silver homodoublet systems were placed in
H2O2 aqueous solution. On the other hand, for the gold−silver suspension, significant movement
of many doublets (and larger aggregates) was seen at speeds much faster than given by Brownian
motion. A time-lapse image of one typical set of particles is shown in Figure 4.5. Particles were
observed moving at speeds between 2 and 15 μm/s, depending on size and number of aggregates,
and were often seen moving in circles, or in some cases, rotating quickly in one direction while
otherwise staying in place. In one especially interesting case, a doublet moved quickly due to the
autoelectrophoresis, and for an unknown reason broke during its movement (Figure 4.6). The
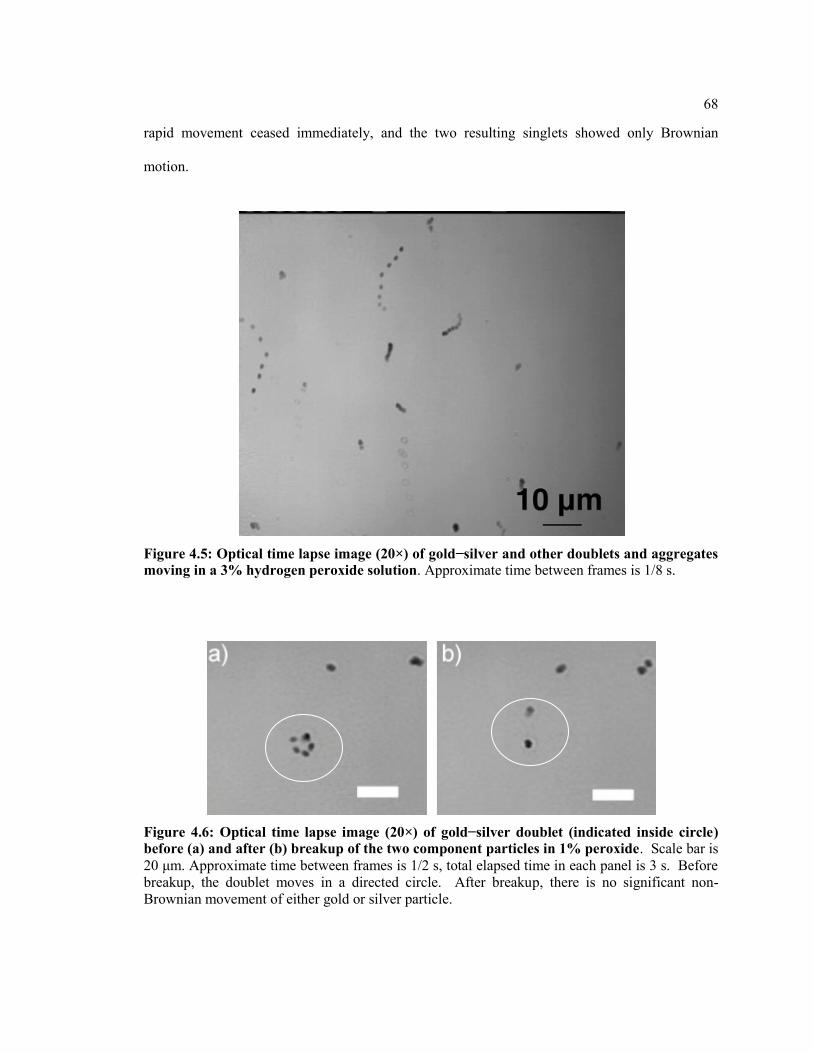
68
rapid movement ceased immediately, and the two resulting singlets showed only Brownian
motion.
Figure 4.5: Optical time lapse image (20×) of gold−silver and other doublets and aggregates
moving in a 3% hydrogen peroxide solution. Approximate time between frames is 1/8 s.
Figure 4.6: Optical time lapse image (20×) of gold−silver doublet (indicated inside circle)
before (a) and after (b) breakup of the two component particles in 1% peroxide. Scale bar is
20 μm. Approximate time between frames is 1/2 s, total elapsed time in each panel is 3 s. Before
breakup, the doublet moves in a directed circle. After breakup, there is no significant non-
Brownian movement of either gold or silver particle.
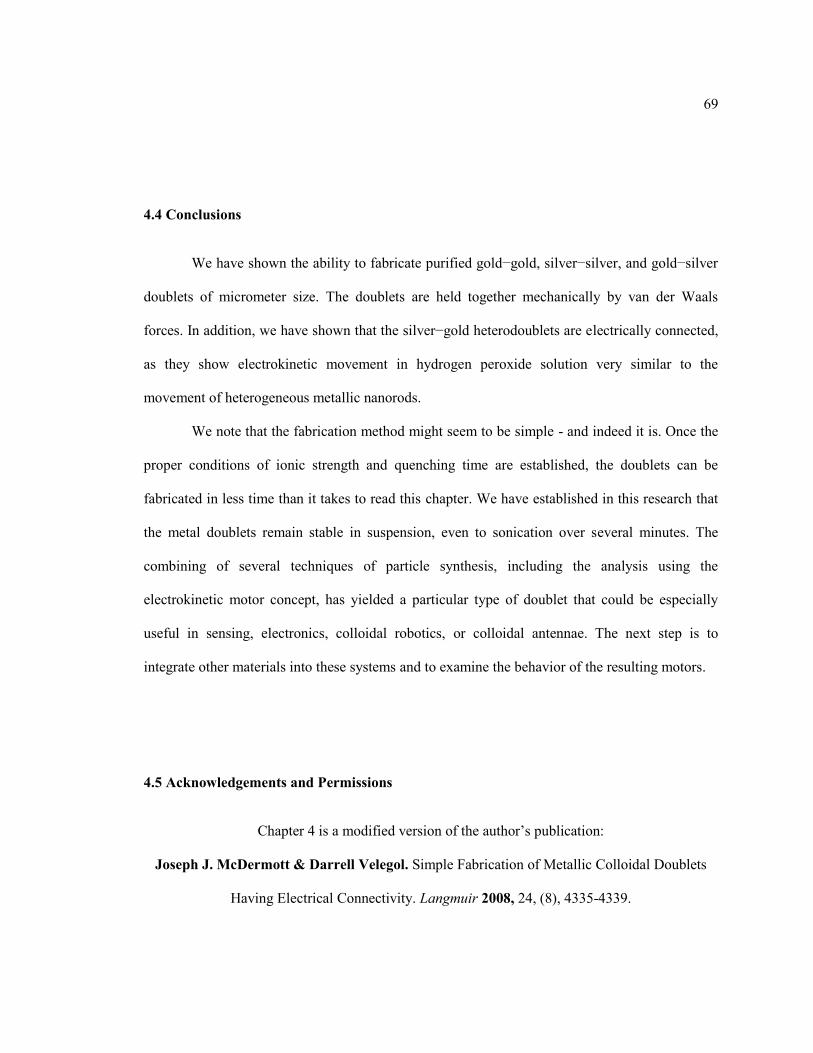
69
4.4 Conclusions
We have shown the ability to fabricate purified gold−gold, silver−silver, and gold−silver
doublets of micrometer size. The doublets are held together mechanically by van der Waals
forces. In addition, we have shown that the silver−gold heterodoublets are electrically connected,
as they show electrokinetic movement in hydrogen peroxide solution very similar to the
movement of heterogeneous metallic nanorods.
We note that the fabrication method might seem to be simple - and indeed it is. Once the
proper conditions of ionic strength and quenching time are established, the doublets can be
fabricated in less time than it takes to read this chapter. We have established in this research that
the metal doublets remain stable in suspension, even to sonication over several minutes. The
combining of several techniques of particle synthesis, including the analysis using the
electrokinetic motor concept, has yielded a particular type of doublet that could be especially
useful in sensing, electronics, colloidal robotics, or colloidal antennae. The next step is to
integrate other materials into these systems and to examine the behavior of the resulting motors.
4.5 Acknowledgements and Permissions
Chapter 4 is a modified version of the author‘s publication:
Joseph J. McDermott & Darrell Velegol. Simple Fabrication of Metallic Colloidal Doublets
Having Electrical Connectivity. Langmuir 2008, 24, (8), 4335-4339.
70
Reprinted with permission from Langmuir 2008, 24, (8), 4335-4339. Copyright 2008
American Chemical Society. The contents of this chapter are protected under the copyrights of
the American Chemical Society and should not be reproduced or used in any manner without
proper citation or express permission of the publisher when necessary. We thank the National
Science Foundation for funding this research through CBET grant 0651611 and NIRT grant
CCR-0303976. We also thank Dr. Allison Yake for her help in getting this work started.
4.6 References
1 Brandl, D. W.; Oubre, C.; Nordlander, P. J. Chem. Phys. 2005, 123, 024701.
2 Xu, H.; Bjerneld, E. J.; Käll, M.; Börjesson, L. Phys. Rev. Lett. 1999, 83, 4357.
3 Moskovits, M.; Jeong, D.H. Chem. Phys. Lett. 2004, 397, 91.
4 Kline, T. R.; Paxton, W. F.; Wang, Y.; Velegol, D.; Mallouk, T. E.; Sen, A. J. Am. Chem. Soc.
2005, 127, 17150.
5 Paxton, W. F.; Baker, P. T.; Kline, T. R.; Wang, Y.; Mallouk, T. E.; Sen, A. J. Am. Chem. Soc.
2006, 128, 14881.
6 Rechberger, W.; Hohenau, A.; Leitner, A.; Krenn, J. R.; Lamprecht, B.; Aussenegg, F. R. Opt.
Commun. 2003, 220, 137.
7 Pack, A.; Hietschold, R.; Wannemacher, R. Opt. Commun. 2001, 194, 277.
8 Haynes, C. L.; Van Duyne, R.P. J. Phys. Chem. B 2003, 107, 7426.
9 Sullivan, T.E.; Cutler, P.H.; Lucas, A.A. Surf. Sci. 1977, 62(2), 455.
10 Yin, Y.; Lu, Y.; Xia, Y. J. Am. Chem. Soc. 2001, 123, 8718.
11 Xia, Y.; Yin, Y.; Lu, Y.; McLellan, J. Adv. Funct. Mater. 2003, 13, 907.
71
12 Johnson, M;, P., van Kats, C. M.; van Blaaderen, A. Langmuir 2005, 21, 11510.
13 Ibisate, M.; Zou, Z.; Xia, Y. Adv. Funct. Mater. 2006, 16, 1627.
14 Liddell, M;, C.; Summers, C. J. Adv. Mater. 2003, 15, 1715.
15 Hosein, I. D.; Liddell, C. M. Langmuir 2007, 23, 10479.
16 Hiddeson, A. H.; Rodgers, S. D.; Weitz, D. A.; Hammer, D. A. Langmuir 2000, 16, 9744.
17 Yi, G.; Manoharan, V. N.; Michel, E.; Elsesser, M. T.; Yang, S.; Pine, D. J. Adv. Mater. 2004,
16, 1204.
18 Grabar, K. C.; Allison, K. J.; Baker, B. E.; Bright, R. M.; Brown, K. R.; Freeman, R. G.; Fox,
A. P.; Keating, C. D.; Musick, M. D.; Natan, M. J. Langmuir 1996, 12, 2353.
19 Yu, H.; Chen, M.; Rice, P.M.; Wang, S.X.; White, R.L.; Sun, S. Nano Lett. 2005, 5(2), 379.
Zhang, L.; Dou, Y.; Gu, H. JCIS 2006, 297, 660.
20 Zhang, L.; Dou, Y.; Gu, H. JCIS 2006, 297, 660.
21 Gu, H.; Yang, Z.; Gao, J.; Chang, C. K.; Xu, B. J. Am. Chem. Soc. 2004, 127, 35.
22 Alivisatos, A. P.; Johnsson, K. P.; Peng, X.; Wilson, T. E.; Loweth, C. J.; Bruchez, M. P.;
Schultz, P. G. Nature 1996, 382, 609.
23 Lu, Y.; Xiong, H.; Jiang, X.; Xia, Y.; Prentiss, M.; Whitesides, G. M. J. Am. Chem. Soc. 2003,
125, 12725.
24 Martin, B. R.; Dermody, D. J.; Reiss, B. D.; Fang, M.; Lyon, L. A.; Natan, M. J.; Mallouk, T.
E. Adv. Mater. 1999, 11, 1021.
25 Su, K. H.; Wei, Q. H.; Zhang, X. App. Phys. Lett. 2006, 88, 063118.
26 Bao, Z.; Chen, L.; Weldon, M.; Chandross, E.; Cherniavskaya, O.; Dai, Y.; Tok, J. B. H. Chem.
Mater. 2002, 14, 24.
27 Teranishi, T.; Inoue, Y.; Nakaya, M.; Oumi, Y.; Sano, T. J. Am. Chem. Soc. 2004, 126, 9915.
72
28 Yake. A. M.; Panella, R. A.; Snyder, C. E.; Velegol, D. Langmuir 2006, 22, 9135.
29 Israelachvili, J. Intermolecular and Surface Forces; Academic Press: New York, 1985.
30 Hong, Y.; Blackman, N. M. K.; Kopp, N. D.; Sen, A.; Velegol, D. Phys. Rev. Lett. 2007, 99,
172103.
31 Prieve, D. C.; Gerhart, H. L.; Smith, R.E. Ind. Eng. Chem. Prod. Res. Dev., 1978, 17, 32. One
difference between the technique in the Prieve paper and the technique in the present research
is that the source of ions producing the electric field is from a surrounding ―fuel‖ (H2O2), and
the particle catalyzes the decomposition to give the ions. See also a patent referenced in the
Prieve paper, U.S. Patent 3,585,084 (Lester Steinbrecher, issued 1971).
32 Kline, T.R.; Iwata, J.; Lammert, P.E.; Mallouk, T.E.; Sen, A.; Velegol, D J. Phys. Chem. B
2006, 110, 24513.
33 Goya, D.V.; Matijevic, E. New J. Chem. 1998, 1203−1215.
34 Goya, D. V.; Matijevic, E. Colloids Surf., A 1999, 146, 139.
35 Velikov, K. P.; Zegers, G. E.; van Blaaderen, A. Langmuir 2003, 19, 1384.
36 Manoharan, V. N.; Elsesser, M. T.; Pine, D. J. Science 2003, 301, 483.
Chapter 5
Colloidal Trimers Fabricated Through Quenched Electrostatic Assembly
5.1 Introduction & Background
5.1.1 Introduction
As the designs for colloidal assemblies become more sophisticated, they will increasingly
require multiple component particles, sometimes placed in a particular order. The ability to
create complex, ordered assemblies will allow for the creation of functional colloidal devices.
For example, when a gold and a silver sphere are assembled together into a doublet and that
doublet is placed in a aqueous solution of hydrogen peroxide, the resulting assembly acts as a
catalytic motor, moving about rapidly in solution.1,2,3,4
One way to increase the complexity of
these motor assemblies would be the addition of a third ―switch‖ particle – a particle that enables
externally controllable on/off manipulation of the motor. This switch particle would be placed
between the gold and silver particles, such that this ―trimer‖ assembly (trimer here denotes three
distinct precursor particles assembled into one stable assembly) has the particle order of gold-
switch-silver. Although the particle material components and their order of placement are thus
constrained, the precise orientation of the assembly – whether the ―bond angle‖ of the three
particles is 90 or 180 or 137 degrees – is less important. The question we tackle in this section is
how to assemble such a device, which 1) is composed of up to three different materials, 2) has a
particular sequence (1-2-3 or 2-1-3 or 2-3-1), and 3) possesses sufficient mechanical stability that
it remains assembled.
74
5.1.2 Literature Review
Before describing the assembly method introduced in this section – we call it ―Quenched
Electrostatic Assembly‖ (QEA) – we look at what has come before. In short, we have not been
able to identify any instances of colloidal trimers made from three different colloidal components
in the literature. There are numerous techniques described for assembling two colloidal particles
together,5,6,7,8,9,10,11,12
and perhaps several of these have the capability to assemble three different
materials. Specifically, both template-directed assembly in physical templates9,13
,
and in
―templates‖ formed using acoustic traps14
or solution micelles15
; and ―patchy‖ particle assembly,
utilizing one, two, or more regions of differing particle surface functionality10,16,17,18
, could
potentially be used to form three-component assemblies. The biggest drawback to these
techniques is that any path to scaled-up production would be difficult and costly. Other
techniques, such as multistep seeded polymerization19,20
and particle ―buckling‖8,21
exist to give
colloidal particles the necessary shape morphology for multicomponent assembly, but are limited
to specific materials.
5.1.3 Chapter Aims & Overview
Here we make an important advance on a technique previously-used in our lab, the
stimulate-quench-fuse (SQF) method, that makes the method capable of producing colloidal
trimers.2,7,22
In our past work, we have used the SQF method to produce low-order colloidal
aggregates, especially homo- and heterodoublets. While the SQF technique is not material-
specific, it has had difficulty in producing colloidal trimers in which the three components have a
particular sequence. By modifying the SQF method, we have developed a technique for the
controlled aggregation of multiple colloidal particles: Quenched Electrostatic Assembly (QEA).
75
The QEA technique builds on the SQF technique, providing a general assembly technique for
producing heterodoublets, trimers, and higher-order aggregates of two or more distinct, charged
colloidal particles. In the QEA method, larger ―core‖ particles and smaller, oppositely-charged
―satellite‖ particles are allowed to aggregate in solution. But whereas the quenching might be
done by diluting the solution ionic strength with SQF, here the quenching step uses the addition
of charged nanoparticles to coat the core particle. The nanoparticles thus make both the cores and
the satellites have the same sign of charge, halting further aggregation with electrostatic
repulsion. Since the nanoparticles have a large diffusion coefficient and a high number density,
when they are added to the solution, they adhere to the core particles very quickly, typically
within a few seconds, quenching the aggregation.
The nanoparticles also serve another important function. After fabricating our
assemblies, we want them to maintain mechanical integrity. During processing steps involving
sonication or high shear rates, or at some point during transport or shipping, the particles will
encounter mechanical stresses that can break them apart.7 In non-polymeric systems, we must
rely on van der Waals attractive forces to keep particles assembled, which works fairly well for
metals with high Hamaker constants2 but not for many other materials
7. We promote the
mechanical stability of our assemblies by bringing the polymeric nanoparticle quench coating
above its glass transition temperature (Tg) for an appropriate time, allowing the particles to ―fuse‖
into one another.23
In this section, we show that the QEA technique leads to stability in both the
colloidal aggregation and mechanical integrity senses
76
5.2 Experimental Methods & Materials
5.2.1 Materials
Monodisperse 3.3 µm amidine functionalized polystyrene latex (PSL) microspheres
(4.1% w/v), monodisperse 0.81 µm sulfate-functionalized polystyrene latex microspheres (8.1%
w/v) and monodisperse 20 nm sulfate-functionalized fluorescent polystyrene latex microspheres
(2% w/v) were purchased from Interfacial Dynamics Corporation (Portland, OR). Monodisperse
3.01 µm (9.8% w/v) silica microspheres were purchased from Bang‘s Laboratories (Fishers, IN).
Undoped silicon metal powder with a purity of 99.999% was purchased from Atlantic Equipment
Engineers (NJ). Gold and Silver microparticles were synthesized using the recipe developed by
Goia and Matijevic24
and modified by Velikov25
. The cationic polyelectrolyte poly(allylamine
hydrochloride) (PAH, Mw 70,000), silver nitrate for colloidal silver synthesis, L-ascorbic acid
(C6H8O6), gum Arabic and potassium chloride (KCl) were purchased from Sigma-Aldrich
Chemicals, USA. To synthesize the gold particles, gold chloride (HAuCl4) was purchased from
Strem Chemicals. Deionized (DI) water used in all aqueous solutions came from a Millipore
Corporation MilliQ system, with specific resistance greater than 1 M.cm (due to equilibration
with CO2 in air). Hydrogen peroxide, filter papers, and glassware were obtained from VWR
International.
5.2.2 Instrumentation
The optical microscopy images were obtained on a Nikon Eclipse TE2000-U inverted
optical microscope. The electron microscopy images were obtained on a Hitachi S-3000H
Scanning Electron Microscope (SEM) at the Penn State Material Characterization Laboratory.
77
The confocal and DIC optical microscopy images were captured using an Olympus Fluoview
1000 laser scanning confocal microscope (Olympus America Inc, Melville, NY) at the Huck
Institute of the Life Sciences Center for Quantitative Cell Analysis. The Sorvall Biofuge Primo
Centrifuge was from Kendro Laboratory Products, and it was equipped with a swing-bucket rotor.
The Ultrasonicator was from VWR International (model 550T). The heat treatments took place
in an autoclave oven set to 120 °C.
5.2.3 Silicon Microparticle Preparation:
Undoped silicon powder was ground in a mortar and pestle in the presence of DI water.
The resulting crushed particle slurry was suspended in 50 mL DI water in test tubes and allowed
to stand under gravity for 17 hours after which the top 45 mL of the supernatant (containing
smaller silicon particles) was drawn off. We repeat this step to clear most of the smaller than
desired silicon particles from solution. The remaining suspension of silicon was filtered through
an 8 µm filter; the residue containing bigger silicon particles was discarded and the filtrate
containing mostly 1-8 µm silicon particles was collected.
5.2.4 Synthesis of Gold and Silver Particles:
Silver (Ag) and Gold (Au) microparticles were synthesized using the recipe developed
by Goia and Matijevic24 and modified by Velikov25, involving the reduction of metal ions to
metallic silver and gold by ascorbic acid, as described in Section 4.2.2. The diameter of the silver
particles ranged from 0.5 µm to 1.5 µm. The diameter of the gold particles ranged from 0.7 µm to
1.3 µm. The silver and gold particle suspensions, with volume fractions as synthesized of 0.0005
and 0.00016 respectively, were used in all later assembly experiments.
78
5.2.5 Functionalization of Silicon and Silica Particles with a Positively-Charged
Polyelectrolyte.
Silicon and silica particles were made positively charged by coating them with a
positively charged polyelectrolyte, PAH. 40 mL of 20 µM of PAH solution was prepared in 30
mM KCl and 20 mL of silicon/silica solution (prepared with a volume fraction 0.0005) was added
to it. The resultant solution was incubated for 1 hour and then rinsed twice; finally obtaining 10
mL solution of PAH coated silicon/silica particles in DI water (volume fraction 0.001). The
PAH-coated positively-charged silicon and silica particles were used in all later assembly
experiments.
5.2.6 Zeta Potentials.
The particle potentials were measured on a Brookhaven Instruments ZetaPALS (phase
analysis light scattering) potential analyzer. For the 3.3 µm amidine functionalized PSL
microspheres, = 48.81.2 mV; for the 3.01 µm silica microspheres, = -55.91.1 mV; for the
PAH coated 3.01 µm silica microspheres, = 57.52.4 mV; for the 0.81 µm sulfate-
functionalized PSL, = -68.71.2 mV; for the 20 nm sulfate-functionalized fluorescent yellow-
green PSL, = -64.12.4 mV; for the gold particles, = -501.3 mV; and for the silver particles,
= -431.6 mV. For the crushed silicon particles, = -45.81.4 mV and for the PAH coated
silicon particles, = 60.00.4 mV. All the above potential measurements were taken in 10 mM
KCl solution at pH between 5 and 6.
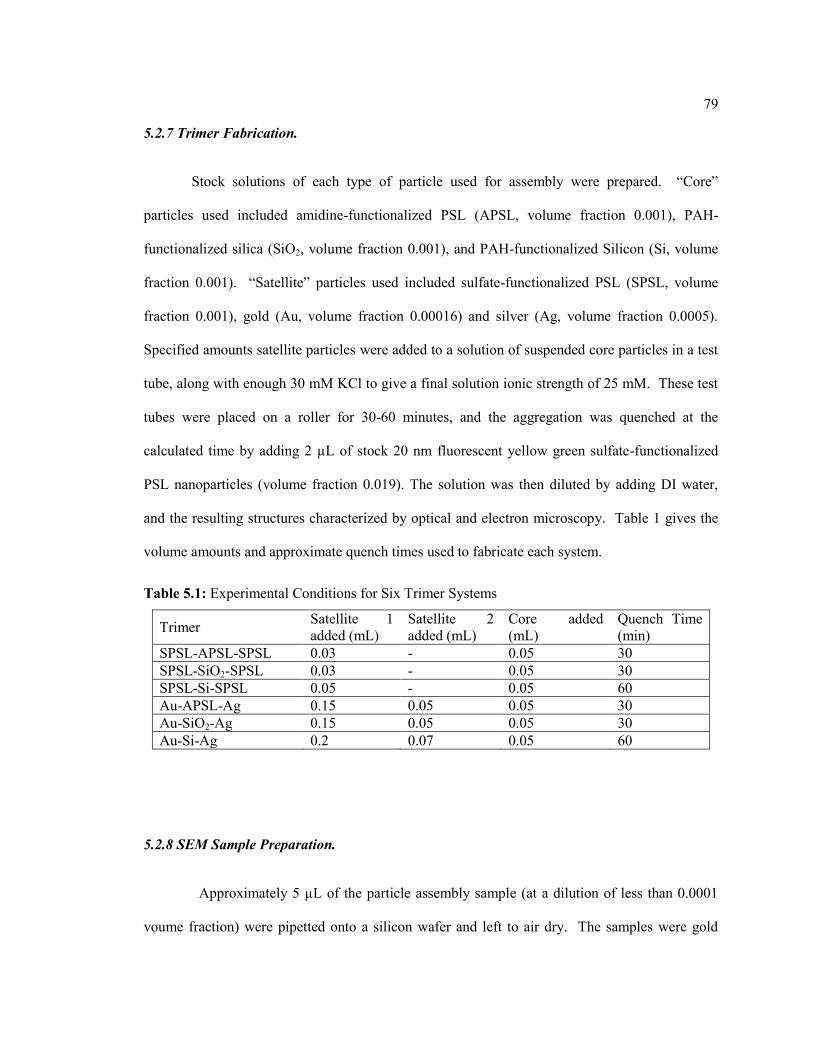
79
5.2.7 Trimer Fabrication.
Stock solutions of each type of particle used for assembly were prepared. ―Core‖
particles used included amidine-functionalized PSL (APSL, volume fraction 0.001), PAH-
functionalized silica (SiO2, volume fraction 0.001), and PAH-functionalized Silicon (Si, volume
fraction 0.001). ―Satellite‖ particles used included sulfate-functionalized PSL (SPSL, volume
fraction 0.001), gold (Au, volume fraction 0.00016) and silver (Ag, volume fraction 0.0005).
Specified amounts satellite particles were added to a solution of suspended core particles in a test
tube, along with enough 30 mM KCl to give a final solution ionic strength of 25 mM. These test
tubes were placed on a roller for 30-60 minutes, and the aggregation was quenched at the
calculated time by adding 2 µL of stock 20 nm fluorescent yellow green sulfate-functionalized
PSL nanoparticles (volume fraction 0.019). The solution was then diluted by adding DI water,
and the resulting structures characterized by optical and electron microscopy. Table 1 gives the
volume amounts and approximate quench times used to fabricate each system.
5.2.8 SEM Sample Preparation.
Approximately 5 µL of the particle assembly sample (at a dilution of less than 0.0001
voume fraction) were pipetted onto a silicon wafer and left to air dry. The samples were gold
Table 5.1: Experimental Conditions for Six Trimer Systems
Trimer Satellite 1
added (mL)
Satellite 2
added (mL)
Core added
(mL)
Quench Time
(min)
SPSL-APSL-SPSL 0.03 - 0.05 30
SPSL-SiO2-SPSL 0.03 - 0.05 30
SPSL-Si-SPSL 0.05 - 0.05 60
Au-APSL-Ag 0.15 0.05 0.05 30
Au-SiO2-Ag 0.15 0.05 0.05 30
Au-Si-Ag 0.2 0.07 0.05 60
80
sputtered for 30 seconds to allow for better sample conductivity. Scanning Electron Microscopy
(SEM) images were taken at an accelerating voltage of 5 kV and working distances between 6
and 7 mm.
5.2.9 Mechanical Stability Testing / Nanoparticle “Glue” Fusing.
The polymer nanoparticle coating of these trimer constructions can be fused by heating
them in an autoclave oven, increasing the mechanical stability of the assembly.7 In order to study
the stability of the final construction upon fusing, ultrasonication of the trimer sample, before and
after fusing, was performed. Two samples of two different types of assemblies were taken. The
first sample of each trimer assembly was sonicated without any fusing for 15 minutes. The
second was fused by placing the solution in a test tube and heating the sample in an autoclave
oven at 120 oC for 30 minutes. This fused sample was then also sonicated for 15 minutes. The
degree of aggregation in each sample was then analyzed using optical microscopy. The satellites
adhered to a set number of core particles in each sample were counted, giving an average
―number of satellites per core‖ for each sample.
5.2.10 Functionality of Trimers as Catalytic Motors.
To test for catalytic activity, each trimer sample containing gold and silver satellites was
observed in a 3% hydrogen peroxide solution under an optical microscope at 20 magnification.
The H2O2 solution was first placed in a Petri dish, and 100 µL of the trimer solution (after
quenching) was added. Any movement of the trimer assemblies was observed and recorded by a
video camera attached to the microscope. To prepare the time lapse image (Figure 5), a frame of
video was captured every 2 seconds and each frame overlaid into a single image.
81
5.3 Results and Discussion
5.3.1 Description of the QEA Technique
The QEA technique is a controlled aggregation technique with an important random
aspect. Two or three types of particles are used in the technique: ―core‖ particles, which are
larger, and in our work have a positive surface charge; and one or two types of ―satellite‖
particles, which are smaller and have the opposite (here, negative) surface charge of the core
particles. The particles we use in this chapter are 3-5 μm in diameter for the core and 0.8-1.5 μm
in diameter for the satellites. Additionally, polymer nanoparticles having a diameter of 20 nm
and having the same sign surface charge as the satellites are used for quenching and fusion. A
schematic of the technique can be found in Figure 5.1
With the QEA technique, the key is to control the interparticle forces temporally. Instead
of destabilizing and restabilizing a stable colloidal system to induce desired aggregation, as is
done in the SQF technique, the QEA technique starts with an initially unstable system, since the
core particles and satellite particles have opposite charge (Fig 5.1a). The particles do not
aggregate to form large clumps immediately, because the aggregation time is diffusion-limited
and can be controlled by carefully adjusting the concentrations of the particles in solution. After
sufficient satellite-to-core aggregation has occurred (Fig 5.1c), we then stabilize the system (Fig
5.1d-e) by functionalizing the remaining core particle surfaces with the polymer nanoparticles.
The nanoparticles quickly cover the remaining core particle surfaces, preventing further satellite-
to-core aggregation. The use of electrostatic attractive and repulsive forces is key, as it allows us
to selectively aggregate the core particles to the satellites, and prevents satellite-satellite
aggregation in solution or on the core particle surface. The specificity of the particle ordering can
be contrasted with the randomness of the satellite orientations on the core. In allowing the

82
satellites to interact freely with the entirety of each core (and not a functionalized patch), we
sacrifice the ability to orient the satellites with respect to each other.
5.3.2 Analysis of Trimers Formed Using the QEA Technique
Figure 5.2 shows scanning electron microscope (SEM) images of trimers formed from six
different colloidal systems, highlighting the flexibility and non-material specificity of the QEA
technique. We chose three core materials to use in trimer assembly: polystyrene latex spheres,
silica spheres, and silicon shards obtained by grinding and filtering silicon powder to size. In
these systems, we used positively charged core particles and negatively charged satellites. The
polystyrene latex was purchased with an amidine surface functionalization, giving it a native
positive surface charge in water. The silica and silicon (which had a thin native oxide passivation
Figure 5.7: Quenched Electrostatic Assembly Schematic. a) Positive core and negative
satellite particles are mixed. b) and c) The satellites begin to aggregate to the cores in a diffusion-
limited matter due to short-range electrostatic and van der Waals forces. d) After a particular
time, when the desired number of satellites have aggregated to each core, negatively charged
polymer nanoparticles are added to the solution. e) Due to their high diffusion coefficients, the
nanoparticles electrostatically adhere to and completely cover the core particles, preventing
further satellite aggregation. f) The nanoparticle coating is fused in an autoclave to enhance the
mechanical stability of the assemblies.
83
layer) were natively negatively charged in water, and were functionalized with a cationic
polyelectrolyte before assembly. The two negatively charged satellite systems we used were
sulfate-functionalized polystyrene latex spheres, used to form two-component trimers with each
core; and a binary distribution of gold and silver particles of roughly the same size and surface
charge, used to form three-component trimers with each core. Because the gold and silver were
synthesized and not purchased, they had a considerably larger polydispersity, but even in non-
ideal systems, we were able to form three-component trimers with ease. This suggests that the
QEA technique is robust: able to handle a large variety of materials, shapes, and sizes. Finally,
the technique appears scalable, as the assembly happens in solution and not near any interface or
in any special equipment. The importance and ease of scalability in free-solution assembly is
something the authors hold in high regard.6
Quenching the aggregation is a key step in the QEA process (Fig 5.1d-e). We used
negatively charged, sulfate-functionalized polystyrene latex nanoparticles with an embedded
fluorescent yellow-green dye to do this. Because the diffusion coefficient of a colloidal particle is
inversely proportional to its radius (Stokes-Einstein) the nanoparticles have diffusion coefficients
more than an order of magnitude higher than the satellites. Also, because of their size, they have
a much higher number density. The nanoparticles flood the system and quickly diffuse to the
bare spots on each core. We could use polyelectrolytes to halt the aggregation, although the
nanoparticles have an advantage in giving the final assembly mechanical stability, which we will
describe later. We did not observe any further aggregation of our systems over the course of days
after assembly, and confirmed that the addition of the nanoparticles in the beginning of the
experiment did not allow for any satellite-core aggregation. To confirm the presence of the
nanoparticles on the cores, we examined the completed assemblies in a confocal microscope
(Figure 5.3).
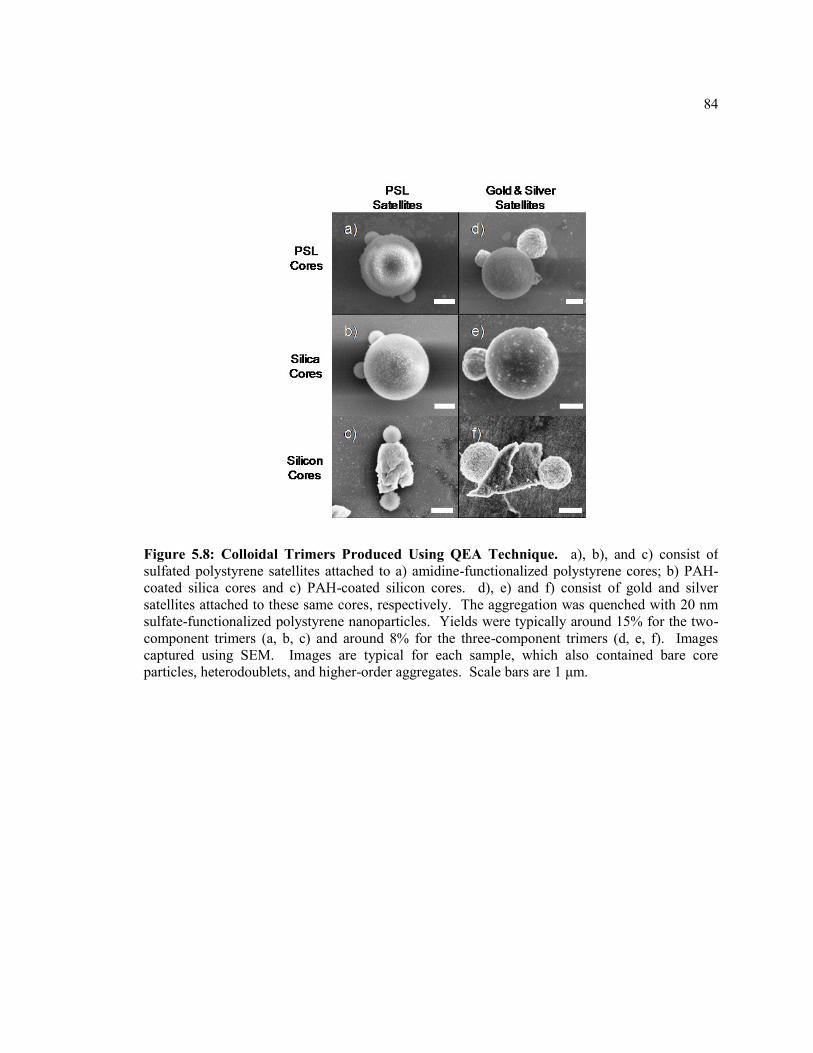
84
Figure 5.8: Colloidal Trimers Produced Using QEA Technique. a), b), and c) consist of
sulfated polystyrene satellites attached to a) amidine-functionalized polystyrene cores; b) PAH-
coated silica cores and c) PAH-coated silicon cores. d), e) and f) consist of gold and silver
satellites attached to these same cores, respectively. The aggregation was quenched with 20 nm
sulfate-functionalized polystyrene nanoparticles. Yields were typically around 15% for the two-
component trimers (a, b, c) and around 8% for the three-component trimers (d, e, f). Images
captured using SEM. Images are typical for each sample, which also contained bare core
particles, heterodoublets, and higher-order aggregates. Scale bars are 1 μm.
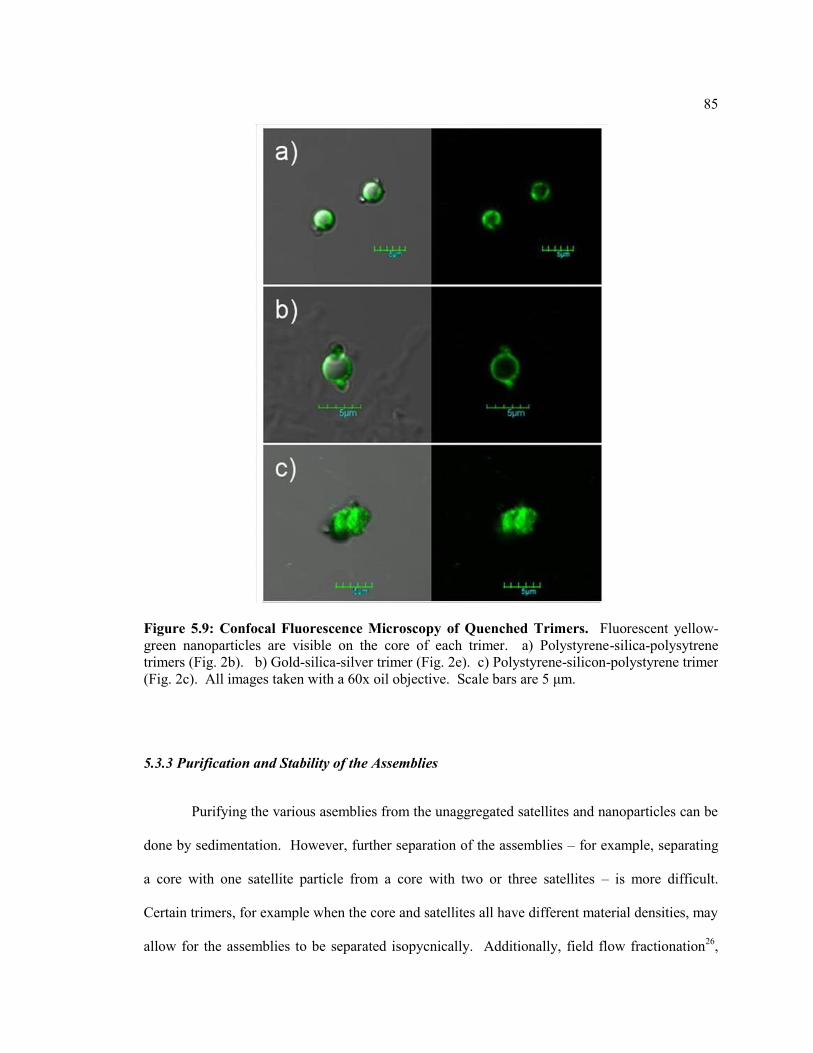
85
5.3.3 Purification and Stability of the Assemblies
Purifying the various asemblies from the unaggregated satellites and nanoparticles can be
done by sedimentation. However, further separation of the assemblies – for example, separating
a core with one satellite particle from a core with two or three satellites – is more difficult.
Certain trimers, for example when the core and satellites all have different material densities, may
allow for the assemblies to be separated isopycnically. Additionally, field flow fractionation26
,
Figure 5.9: Confocal Fluorescence Microscopy of Quenched Trimers. Fluorescent yellow-
green nanoparticles are visible on the core of each trimer. a) Polystyrene-silica-polysytrene
trimers (Fig. 2b). b) Gold-silica-silver trimer (Fig. 2e). c) Polystyrene-silicon-polystyrene trimer
(Fig. 2c). All images taken with a 60x oil objective. Scale bars are 5 μm.
86
density gradient sedimentation27
, and hydrodynamic chromatography28
are techniques shown to
provide clean separations of colloidal systems, although the throughput on these methods makes
them limited. Purification of the final assemblies remains a challenge.
A final result of the QEA technique that needs discussion is the mechanical stability of
fused assemblies. As discussed earlier, assembled particles that rely only on van der Waals or
electrostatic attractive forces to hold them together are not generally stable and will break up
under stresses such as vortexing or bath sonication.7 Fusing of polymeric components is an easy
and reliable way to enhance the mechanical stability of the assemblies. As expected, we found
that for trimers consisting entirely of polystyrene (Fig. 5.2a), fusing the assemblies protected
them from breakup in a bath sonciator. However, even when the trimers contained only non-
polymeric components, fusing the polymer nanoparticle coating was enough to hold the
assemblies together. Figure 5.4 shows the results of a stability study performed on silica-core
trimers (Fig. 5.2b and 5.2e). In both the two- and three-component cases, fusing the nanoparticle
coating before 15 minutes of bath sonication prevented statistically significant breakup of the
assemblies.
The polymer nanoparticles that cover each core particle are adhered in an ionic strength
of 25 mM. The Debye screening length of the solution, which gives a measure of the expected
distance between nanoparticles on the cores, is less than 2 nm. Mechanistically, it is reasonable
that the nanoparticles are softening and spreading during the fusion process, adhering strongly to
the core and perhaps to each other. Additionally, nanoparticles near a satellite particle may
spread up onto the satellite as well. Thus, after heating, the nanoparticles are acting like glue,
sticking to all parts of the assembly and to themselves, creating a strong physical bond that holds
the assemblies together.
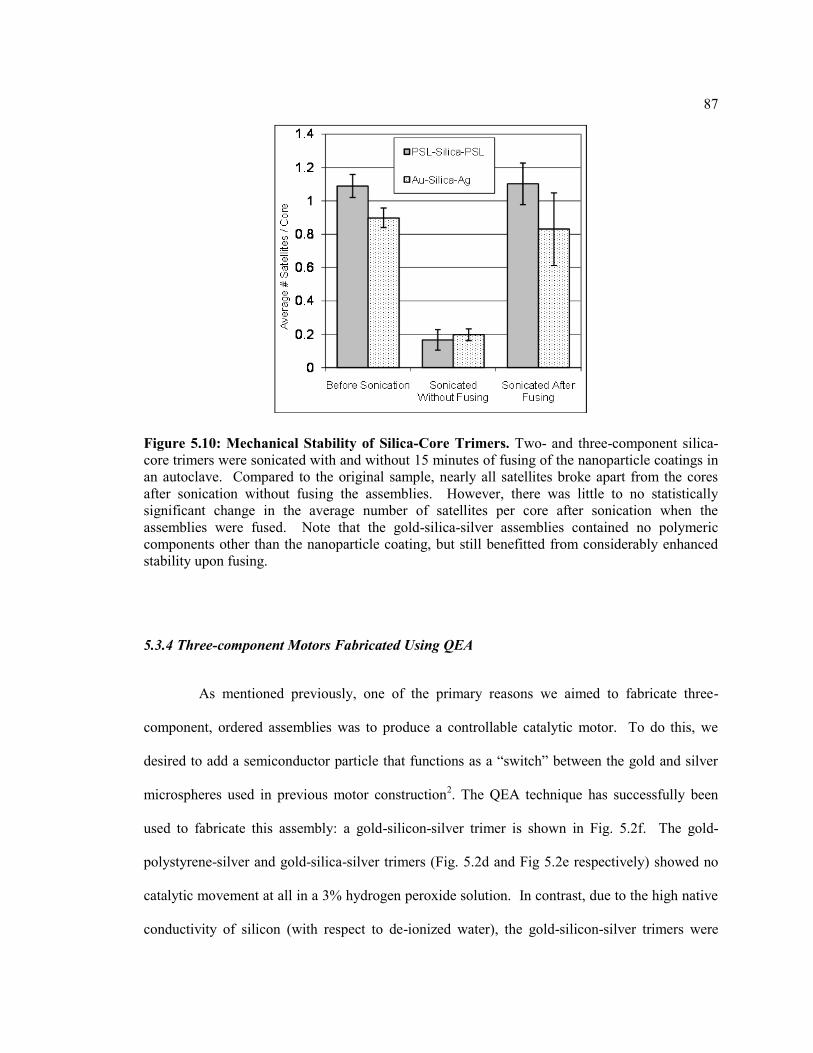
87
5.3.4 Three-component Motors Fabricated Using QEA
As mentioned previously, one of the primary reasons we aimed to fabricate three-
component, ordered assemblies was to produce a controllable catalytic motor. To do this, we
desired to add a semiconductor particle that functions as a ―switch‖ between the gold and silver
microspheres used in previous motor construction2. The QEA technique has successfully been
used to fabricate this assembly: a gold-silicon-silver trimer is shown in Fig. 5.2f. The gold-
polystyrene-silver and gold-silica-silver trimers (Fig. 5.2d and Fig 5.2e respectively) showed no
catalytic movement at all in a 3% hydrogen peroxide solution. In contrast, due to the high native
conductivity of silicon (with respect to de-ionized water), the gold-silicon-silver trimers were
Figure 5.10: Mechanical Stability of Silica-Core Trimers. Two- and three-component silica-
core trimers were sonicated with and without 15 minutes of fusing of the nanoparticle coatings in
an autoclave. Compared to the original sample, nearly all satellites broke apart from the cores
after sonication without fusing the assemblies. However, there was little to no statistically
significant change in the average number of satellites per core after sonication when the
assemblies were fused. Note that the gold-silica-silver assemblies contained no polymeric
components other than the nanoparticle coating, but still benefitted from considerably enhanced
stability upon fusing.
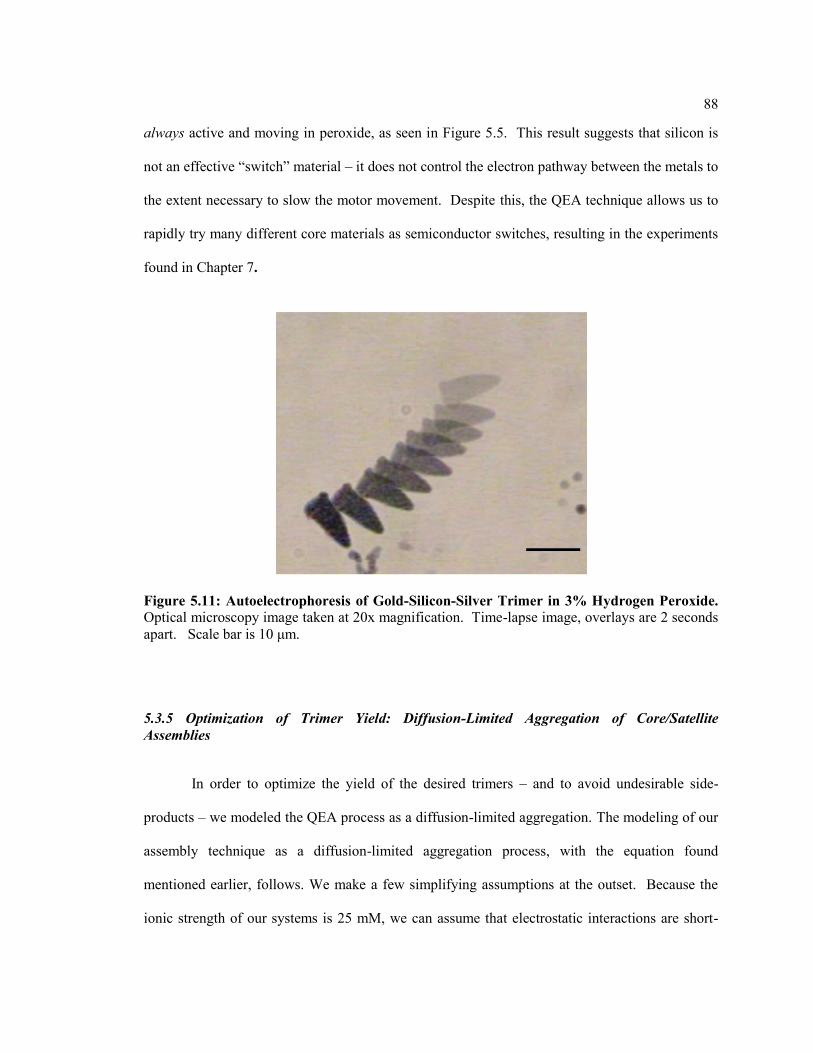
88
always active and moving in peroxide, as seen in Figure 5.5. This result suggests that silicon is
not an effective ―switch‖ material – it does not control the electron pathway between the metals to
the extent necessary to slow the motor movement. Despite this, the QEA technique allows us to
rapidly try many different core materials as semiconductor switches, resulting in the experiments
found in Chapter 7.
5.3.5 Optimization of Trimer Yield: Diffusion-Limited Aggregation of Core/Satellite
Assemblies
In order to optimize the yield of the desired trimers – and to avoid undesirable side-
products – we modeled the QEA process as a diffusion-limited aggregation. The modeling of our
assembly technique as a diffusion-limited aggregation process, with the equation found
mentioned earlier, follows. We make a few simplifying assumptions at the outset. Because the
ionic strength of our systems is 25 mM, we can assume that electrostatic interactions are short-
Figure 5.11: Autoelectrophoresis of Gold-Silicon-Silver Trimer in 3% Hydrogen Peroxide.
Optical microscopy image taken at 20x magnification. Time-lapse image, overlays are 2 seconds
apart. Scale bar is 10 μm.
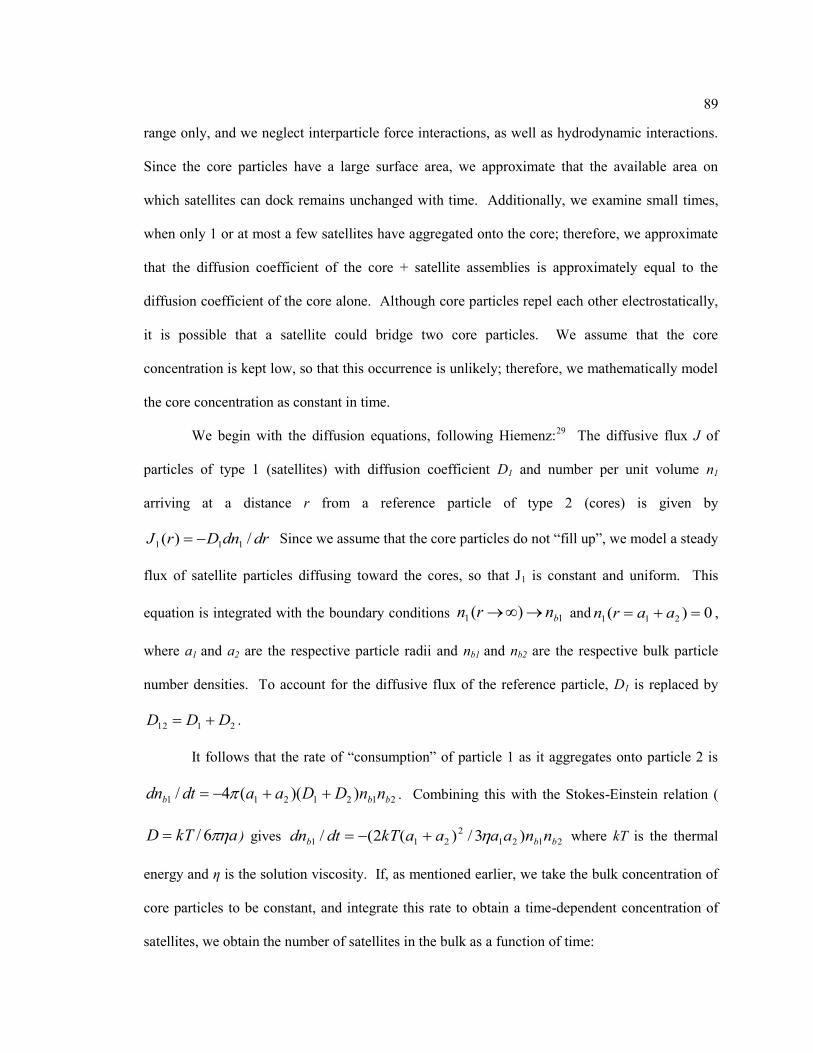
89
range only, and we neglect interparticle force interactions, as well as hydrodynamic interactions.
Since the core particles have a large surface area, we approximate that the available area on
which satellites can dock remains unchanged with time. Additionally, we examine small times,
when only 1 or at most a few satellites have aggregated onto the core; therefore, we approximate
that the diffusion coefficient of the core + satellite assemblies is approximately equal to the
diffusion coefficient of the core alone. Although core particles repel each other electrostatically,
it is possible that a satellite could bridge two core particles. We assume that the core
concentration is kept low, so that this occurrence is unlikely; therefore, we mathematically model
the core concentration as constant in time.
We begin with the diffusion equations, following Hiemenz:29
The diffusive flux J of
particles of type 1 (satellites) with diffusion coefficient D1 and number per unit volume n1
arriving at a distance r from a reference particle of type 2 (cores) is given by
drdnDrJ /)( 111 Since we assume that the core particles do not ―fill up‖, we model a steady
flux of satellite particles diffusing toward the cores, so that J1 is constant and uniform. This
equation is integrated with the boundary conditions 11 )( bnrn and 0)( 211 aarn ,
where a1 and a2 are the respective particle radii and nb1 and nb2 are the respective bulk particle
number densities. To account for the diffusive flux of the reference particle, D1 is replaced by
2112 DDD .
It follows that the rate of ―consumption‖ of particle 1 as it aggregates onto particle 2 is
2121211 ))((4/ bbb nnDDaadtdn . Combining this with the Stokes-Einstein relation (
akTD 6/ ) gives 2121
2
211 )3/)(2(/ bbb nnaaaakTdtdn where kT is the thermal
energy and η is the solution viscosity. If, as mentioned earlier, we take the bulk concentration of
core particles to be constant, and integrate this rate to obtain a time-dependent concentration of
satellites, we obtain the number of satellites in the bulk as a function of time:
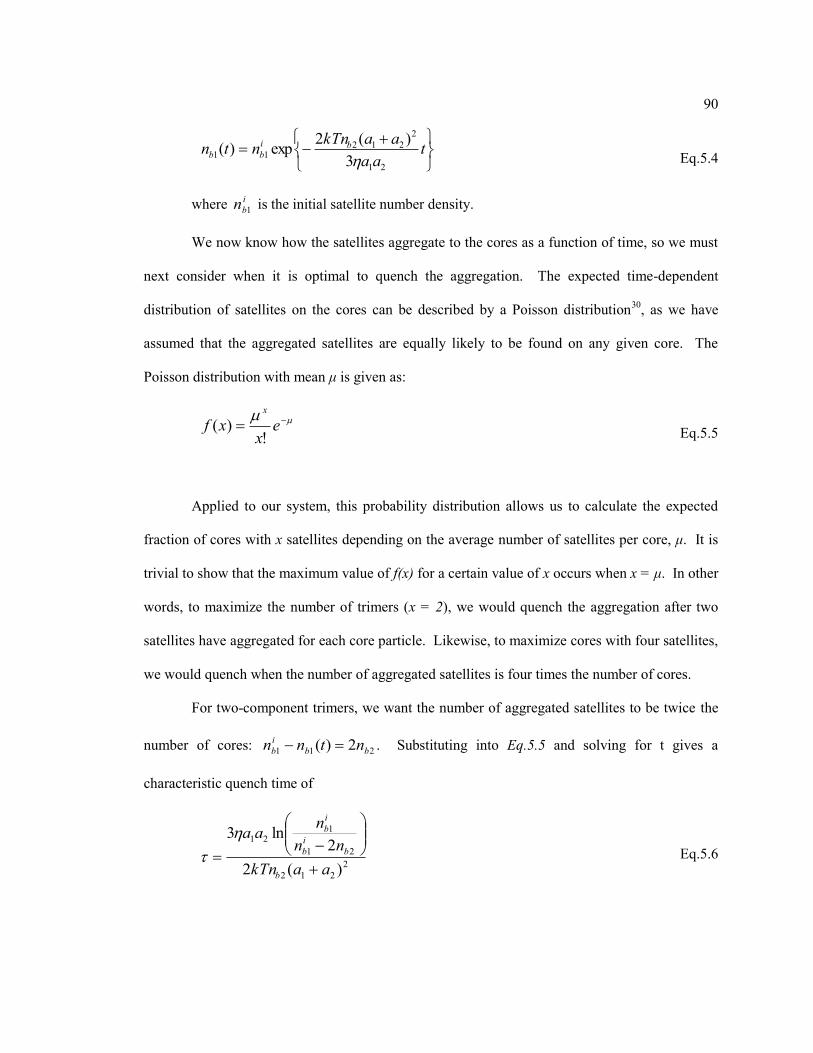
90
t
aa
aakTnntn bi
bb
21
2
21211
3
)(2exp)(
Eq.5.4
where i
bn 1 is the initial satellite number density.
We now know how the satellites aggregate to the cores as a function of time, so we must
next consider when it is optimal to quench the aggregation. The expected time-dependent
distribution of satellites on the cores can be described by a Poisson distribution30
, as we have
assumed that the aggregated satellites are equally likely to be found on any given core. The
Poisson distribution with mean μ is given as:
ex
xfx
!)(
Eq.5.5
Applied to our system, this probability distribution allows us to calculate the expected
fraction of cores with x satellites depending on the average number of satellites per core, μ. It is
trivial to show that the maximum value of f(x) for a certain value of x occurs when x = μ. In other
words, to maximize the number of trimers (x = 2), we would quench the aggregation after two
satellites have aggregated for each core particle. Likewise, to maximize cores with four satellites,
we would quench when the number of aggregated satellites is four times the number of cores.
For two-component trimers, we want the number of aggregated satellites to be twice the
number of cores: 211 2)( bb
i
b ntnn . Substituting into Eq.5.5 and solving for t gives a
characteristic quench time of
2
212
21
121
)(2
2ln3
aakTn
nn
naa
b
b
i
b
i
b
Eq.5.6
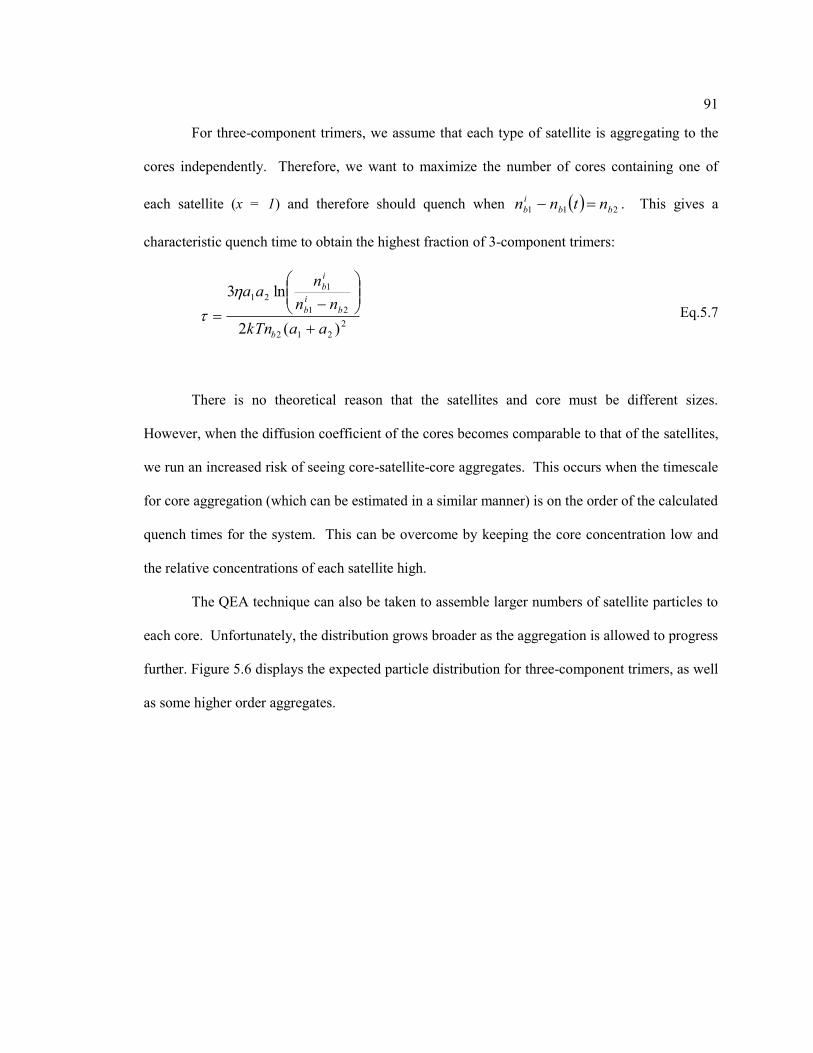
91
For three-component trimers, we assume that each type of satellite is aggregating to the
cores independently. Therefore, we want to maximize the number of cores containing one of
each satellite (x = 1) and therefore should quench when 211 bb
i
b ntnn . This gives a
characteristic quench time to obtain the highest fraction of 3-component trimers:
2
212
21
1
21
)(2
ln3
aakTn
nn
naa
b
b
i
b
i
b
Eq.5.7
There is no theoretical reason that the satellites and core must be different sizes.
However, when the diffusion coefficient of the cores becomes comparable to that of the satellites,
we run an increased risk of seeing core-satellite-core aggregates. This occurs when the timescale
for core aggregation (which can be estimated in a similar manner) is on the order of the calculated
quench times for the system. This can be overcome by keeping the core concentration low and
the relative concentrations of each satellite high.
The QEA technique can also be taken to assemble larger numbers of satellite particles to
each core. Unfortunately, the distribution grows broader as the aggregation is allowed to progress
further. Figure 5.6 displays the expected particle distribution for three-component trimers, as well
as some higher order aggregates.
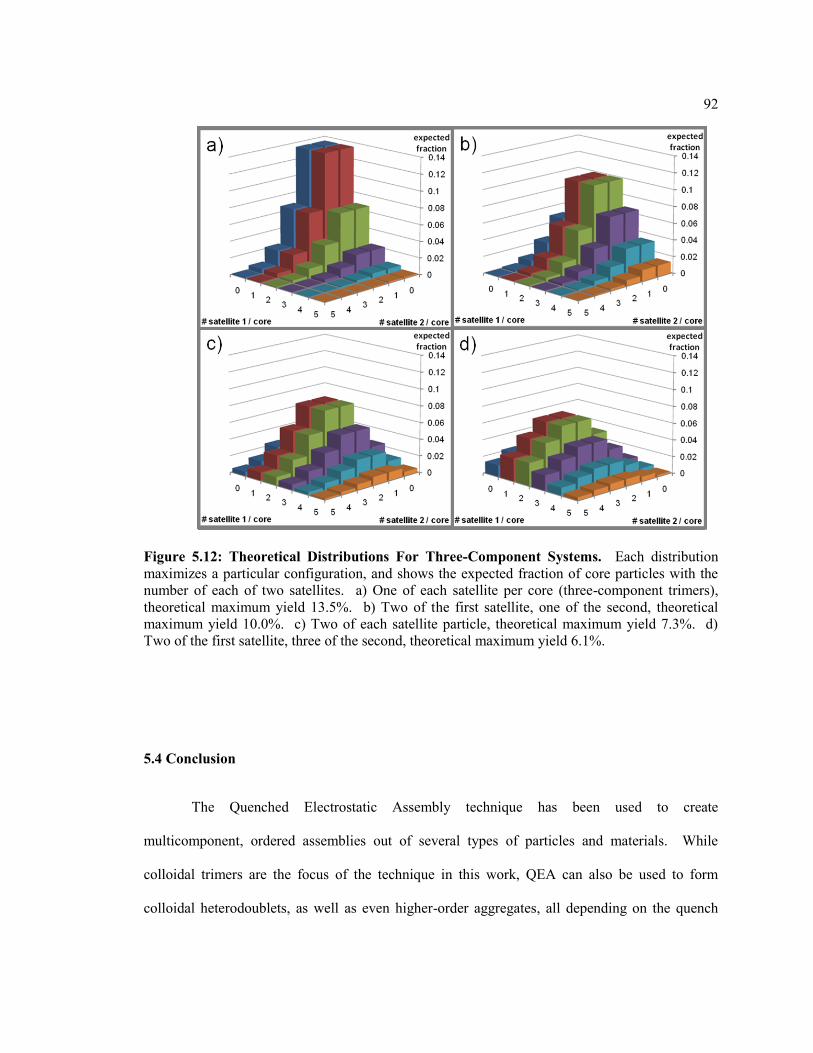
92
5.4 Conclusion
The Quenched Electrostatic Assembly technique has been used to create
multicomponent, ordered assemblies out of several types of particles and materials. While
colloidal trimers are the focus of the technique in this work, QEA can also be used to form
colloidal heterodoublets, as well as even higher-order aggregates, all depending on the quench
Figure 5.12: Theoretical Distributions For Three-Component Systems. Each distribution
maximizes a particular configuration, and shows the expected fraction of core particles with the
number of each of two satellites. a) One of each satellite per core (three-component trimers),
theoretical maximum yield 13.5%. b) Two of the first satellite, one of the second, theoretical
maximum yield 10.0%. c) Two of each satellite particle, theoretical maximum yield 7.3%. d)
Two of the first satellite, three of the second, theoretical maximum yield 6.1%.
93
time and initial fractions of core and satellite particles. The technique is not material specific, is
scalable, and forms assemblies that are both colloidally and mechanically stable.
Several types of trimer assemblies containing functional materials have been built. These
include gold-polystyrene-silver (Fig 5.2d) and gold-silica-silver trimers (Figs 5.2e), neither of
which showed any activity as a colloidal motor. This lack of activity was expected, since both
the polystyrene and silica cores are far too insulating to allow for any electron transport between
the metals. We have also created gold-silicon-silver trimer assemblies, which do undergo auto-
electrophoresis (Fig 5.5). Because the un-doped silicon has a high native conductivity relative to
the surrounding solution, it is not effective as an on/off switch. Therefore, a current aim is to
prototype a semiconductor particle that can be switched on/off by an external light source.
Armed with the QEA technique, this is further explored in Chapter 7.
5.5 Acknowledgements &Permissions
Chapter 5 is a modified version of the author‘s publication:
Joseph J. McDermott, Neetu Chaturvedi, & Darrell Velegol Functional Colloidal Trimers by
Quenched Electrostatic Assembly. Physical Chemistry Chemical Physics 2010, 12, (38), 11930-
11937. Reproduced by permission of the PCCP Owner Societies
http://pubs.rsc.org/en/content/articlelanding/2010/cp/c0cp00254b
We would like to thank the Department of Energy (Grant No. DE-FG02-07ER46414) and
the Penn State MRSEC under National Science Foundation grant DMR-0820404, Center for
Nanoscale Science, for funding this project. We also thank Penn State‘s Huck Institute of Life
Sciences Center for Qualitative Cell Analysis for their assistance and use of their Olympus
94
Fluoview 1000 confocal laser scanning microscope, and Erin Golden for her contribution to the
initial stages of the research.
5.6 References
1 Paxton, W. F.; Sundararajan, S.; Mallouk, T. E.; Sen, A. Angew. Chem. Int. Ed 2006, 45, 5420–
5429.
2 McDermott, J.J.; Velegol, D.; Langmuir 2008 24, 4335-4339.
3 Paxton, W.F.; Baker, P. T.; Kline, T. R.; Wang, Y.; Mallouk, T. E.; Sen, A. J. Am. Chem. Soc.
2006, 128, 14881–14888.
4 Hong, Y.; Blackman, N. M. K.; Kopp, N. D.; Sen, A.; Velegol, D. Phys. Rev. Lett. 2007, 99,
178103-178106.
5 Glotzer, S. C.; Solomon. M. J.; Nat. Mater. 2007, 6, 557-562.
6 Velegol, D.; Jerri, H. A.; McDermott, J. J.; Chaturvedi, N. AIChE J. 2010, 56, 564-569.
7 Yake. A. M.; Panella, R. A.; Snyder, C. E.; Velegol, D. Langmuir 2006, 22, 9135.
8 Sacanna, S.; Irvine, W. T. M.; Chaikin, P. M.; Pine, D. J.; Nature, 2010, 464, 575-578.
9 Xia, Y.; Yin, Y.; Lu Y.; McLellan, J.; Adv. Funct. Mater, 2003, 13, 907-918.
10 Snyder, C. E.; Yake, A. M.; Feick, J. D.; Velegol, D. Langmuir, 2005, 21, 4813–4815.
11 Johnson, P. M.; van Kats, C. M; van Blaaderen, A. Langmuir, 2005, 21, 11510-11517.
12 Hosein, I. D.; Liddell, C. M. Langmuir, 2007, 23, 10479-10485.
13 Yin,Y.; Lu, Y.; Gates, B.; Xia, Y. J. Am. Chem. Soc., 2001, 123, 8718-8729.
14 Shi, J.; Mao, X.; Ahmed, D.; Colletti, A.; Huang, T. J. Lab Chip, 2008, 8, 221-223.
15 Manoharan, V. N.; Elsesser, M. T.; Pine, D. J. Science, 2003, 301, 483-4.
95
16 Yake, A. M.; Snyder, C. E.; Velegol, D. Langmuir, 2007, 23, 9069–9075.
17 Snyder, C. E.; Ong M.; Velegol, D. Soft Matter, 2009, 5, 1263-1268.
18 Pawar, A. B.; Kretzschmar, I. Langmuir, 2008, 24, 355–358.
19 Kim, J. W.; Larsen, R. J.; Weitz, D. A. J. Am. Chem Soc., 2006, 128, 14374-14377.
20 Park, J. G.; Forster, J. D.; Dufresne, E. R Langmuir, 2009, 25, 8903-8906.
21 Giersig, M.; Ung, T.; Liz-Marzan, L.M.; Mulvaney, P. Adv. Mater. 1997, 9, 570–575.
22 Chaturvedi, N.; Hong, Y.; Sen, A.; Velegol, D., Magnetic Enhancement of Phototaxing
Catalytic Motors. Langmuir 2010, 26, (9), 6308-6313.
23 Ramrez, L. M.; Milner, S. T.; Snyder, C. E.; Colby, R. H.; Velegol, D. Langmuir, 2010, 26, 10,
7644-7649.
24 Goia D. V.; Matijevic, E. New J. Chem., 1998, 22, 1203-1215.
25 Velikov, K. P.; Zegers, G. E.; van Blaaderen, A. Langmuir, 2003, 19, 1384-1389.
26 Barman, B. N.; Giddings, J. C. Langmuir, 1992, 8, 51-58.
27 Price, C.A. Centrifugation in Density Gradients, Academic Press, New York, 1982.
28 DosRamos J. G.; Silebi, C. A. J. Colloid Interface Sci., 1989, 133, 302-320.
29 Hiemenz, P.C.; Rajagopalan, R. Principles of Colloid and Surface Chemistry, Marcel Dekker,
New York, 3rd
edn, 1997, pp. 592-604.
30 Kreyszig, E. Advanced Engineering Mathematics, John Wiley & Sons. Hoboken, 8
th edn.,
1999, pp. 1081-1083.
Chapter 6
Dissolution-Induced Fluid Pumping in Disturbed Geologic Formations
6.1 Introduction & Background
In closed geologic formations, thermodynamic equilibrium has been established between
the rock and the surrounding water over millions of years.1 However, when the formation is
disturbed, further dissolution of the minerals will occur. This physical phenomenon results in the
formation of local ion gradients that originate at the rock surface. The gradients can in turn drive
microflows and particle movement along the mineral surfaces and in pores by the mechanism of
diffusiophoresis.2,3
Diffusiophoresis is a well-understood flow mechanism; however,
experimentally, this mechanism has been studied primarily using imposed salt gradients.4 Here,
we describe how, through the dissolution and passivation of geologic materials, self-generated
ionic gradients can produce phoretic microflows that are quite efficient, even in micro and
nanochannels that are ubiquitous in rocks. Because of the extensive occurrence of calcium
carbonate in geologic formations, it was used as the model system. Other materials (barium
carbonate, dolomite, and calcium sulfate) show similar behavior. Unlike pressure-driven
convective fluid flow, diffusiophoretic flows can easily penetrate micro/nanoscale pores, and the
flows persist as long as the gradient of ionic strength persists. Our research therefore has major
implications for both natural and artificial processes that result in disturbed geologic systems,
such as earthquakes, mining, building construction, and oil and gas extraction involving
fracturing of the rock and/or injection of water. The introduction of air, water, acid mine
drainage, or fracking fluids can amplify the effects of the flows.
97
As a simple test case, we used calcium carbonate (CaCO3) microparticles to drive
localized microflows both in open fluid and close channels. CaCO3 can be produced using a
simple aqueous precipitation synthesis of Na2CO3 with CaCl2.5 Saturated solutions of roughly
spherical calcium carbonate particles (initial radii a = 1.5 to 3 m) were diluted with DI water.
Individual CaCO3 particles were settled onto bare glass substrates. Sulfated polystyrene latex
(sPSL) particles with a = 0.7-1.5 m were added as tracers to observe the resulting flows.
6.2 Experimental Methods & Materials
6.2.1 Materials
For calcium and barium carbonate microparticle synthesis, sodium carbonate Na2CO3,
calcium chloride CaCl2, and barium chloride BaCl2 were obtained from Sigma-Aldrich
Chemicals, USA. Solutions of 0.33 M Na2CO3, CaCl2, and BaCl2 were prepared. Two sizes of
sulfate-functionalized polystyrene latex microparticles (d = 1.4 μm ± 2.1%, and d = 3.0 ± 2.4%,
both had w/v = 4.0%) were purchased from Interfacial Dynamics Corporation, Portland, OR. For
particle surface functionalization, sodium polystyrene sulfonate (MW ~70,000) was obtained
from Sigma. Calcite and dolomite shale samples (~1 mm square) were obtained from Petrobras
(Rio de Janeiro, Brazil). Local gypsum crystal (10x2x2 cm, broken into 50 μm shards) was
obtained from Creekside Rocks and Gems, Bellefonte, PA. Deionized (DI) water used in all
aqueous solutions came from a Millipore Corporation MilliQ system, with specific resistance
greater than 1 MΩ·cm (due to equilibration with CO2 in air).
98
6.2.2 Calcium and Barium Carbonate Microparticle Synthesis
A simple precipitation synthesis5
was used to synthesize the calcium and barium
carbonate microparticles. In both cases, 25 mL of a 0.33 M solution of CaCl2 or BaCl2 was
stirred at high velocity on a magnetic stirrer. An additional 25 mL of 0.33 M Na2CO3 was then
rapidly added to the solution, which turned a milky white as the carbonate particles precipitated.
The solution was stirred for an additional 1 – 2 min., and then quenched with 50 mL of DI water.
To remove the remaining Na+ and Cl
- ions, the particle solutions were rinsed by repeated
centrifugation and resuspension in DI water using a Sorvall Biofuge Primo Centrifuge from
Kendro Laboratory Products. The rinsing procedure was typically repeated 2-4 times, with
additional rinsing steps significantly affecting the microparticle size through carbonate
dissolution. The CaCO3 particles were found to be roughly spherical, with a polydispersity of
~50% and average radius ~3.5 μm. The BaCO3 particles were found to be smaller (a ~.75 μm,
polydispersity ~50%), and more shard-like.
6.2.3 Observation of Pumping Behavior of Carbonate Microparticles
To observe the pumping behavior, the carbonate microparticles particles were imaged
using a Nikon Eclipse TE2000-U inverted optical microscope, typically at 40x magnification.
First, the concentrated carbonate particle solution was diluted to the desired concentration using
DI water and 500 μL was quickly pipetted into a glass-bottomed petri dish. An additional 500
μL 0.1% w/v solution of tracer sPSL particles was then added to the dish and the solutions mixed
and observed.
99
6.2.4 Observation of Pumping Behavior of Natural Rock Samples
Similar to the procedure in section 6.2.3, calcite, dolomite, and gypsum rock samples
were placed in DI water in a glass bottomed petri dish. Then, 0.1% w/v tracer particle solutions
were added and the resulting movement observed using optical microscopy. In certain cases, the
experiments were performed in open capillaries that contained the tracer particle solution, to
simulate the effect of dissolution into a microchannel or pore.
6.2.5 Fabrication and Characterization of Calcium Carbonate Heterodoublet Micromotors
Calcium carbonate microparticles have nearly no zeta potential in DI water solutions.6
As a result, they easily aggregate with themselves and with polystyrene microspheres. The QEA
technique described in Chapter 5 was used to form CaCO3-sPSL heterodoublet micromotors. A
solution was prepared with CaCO3 microparticles (volume fraction φ = 0.001), 3.0 μm diameter
sPSL particles (φ = 0.001), and in the presence of saturated calcium carbonate salt (~0.1 mM)
was allowed to aggregate for 15 min. Then, a solution of 20 μM sodium polystyrene sulfonate
was added to the particles, quenching the aggregation by adsorbing to and giving the calcium
carbonate particles a negative surface charge. The solution of stable aggregates, which included
sPSL-CaCO3 heterodoublets was rinsed, resuspended in DI water, and observed using optical
microscopy on bare glass substrates.
100
6.3 Results and Discussion
6.3.1 Analysis of Calcium Carbonate Micropumps
In this case of a solitary calcium carbonate ―micropump‖ settled onto glass in DI water
and surrounded by sPSL tracer particles, the particle flowfield is readily described. Tracer
particles are pulled in from above the plate to the micropump surface. They collect at and move
down the surface of the micropump, until, upon reaching the substrate, they are ejected radially
outward into solution. Figure 6.1a shows both a time lapse optical image and a vector field plot of
the tracers being pumped along the glass substrate. Movement away from the micropump is
rapid, and then decays with distance until Brownian motion dominates the particle movement 10s
of m away. Interestingly, tracers that approach the pump at shallow angles are ejected without
ever reaching the pump surface.
The observed flows are neither pressure-driven nor density-driven. We know this
because as discussed later, the direction of the tracer movement depends on the surface properties
of the particle and can be reversed by altering particle zeta potentials. Additionally, in high ionic
strengths (> 50 mM), the flows disappear. Rather, the microflows that we observed are
diffusiophoretic flows resulting from the dissolution of CaCO3, which is ubitiquous in shales and
other formations. Phoretic movements like electrophoresis and diffusiophoresis – and similarly,
electroosmosis and diffusioosmosis – are known to be highly efficient even in micro and
nanoscale pores and channels. This is in stark contrast to pressure-driven flows, which by the
Hagen-Poisseuille equation become vanishingly small in micro or nanoscale channels. The
streamlines in bulk solution resulting from the electrophoretic movement of a sphere are
somewhat complex but known. The electroosmotic flow around a lone sphere attached to a flat,
charged plate is also known.7 By combining the electroosmotic flow of the fluid with the
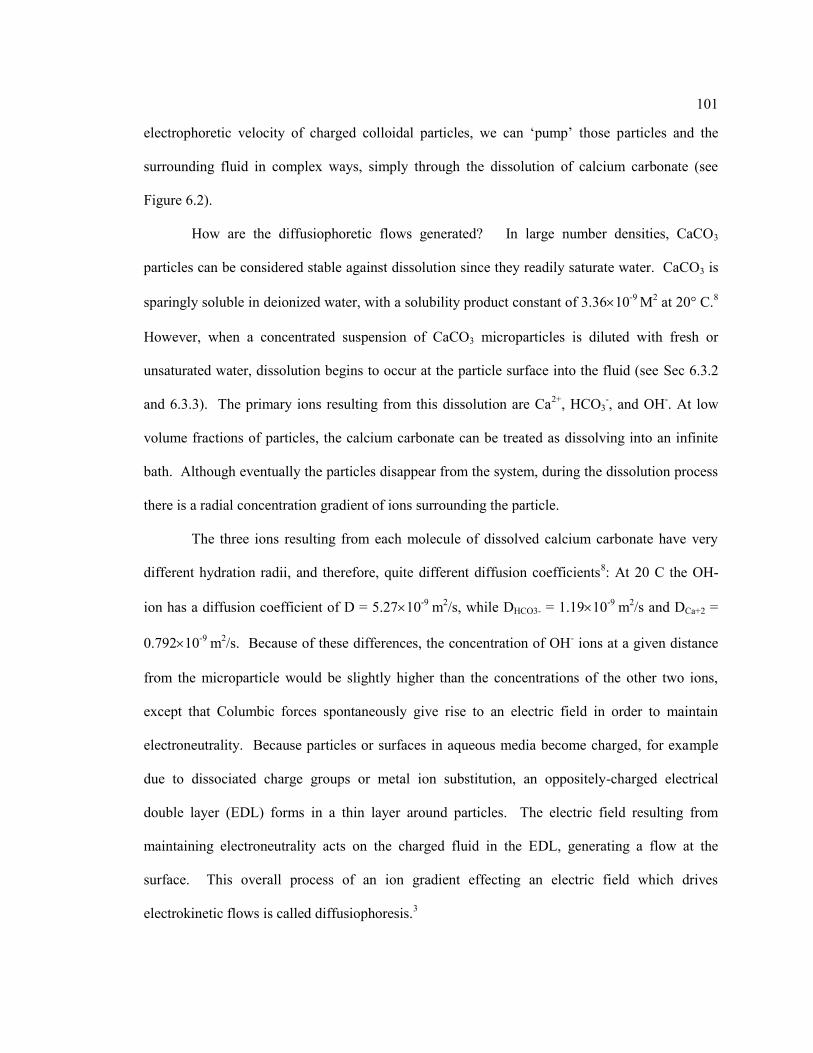
101
electrophoretic velocity of charged colloidal particles, we can ‗pump‘ those particles and the
surrounding fluid in complex ways, simply through the dissolution of calcium carbonate (see
Figure 6.2).
How are the diffusiophoretic flows generated? In large number densities, CaCO3
particles can be considered stable against dissolution since they readily saturate water. CaCO3 is
sparingly soluble in deionized water, with a solubility product constant of 3.3610-9
M2 at 20° C.
8
However, when a concentrated suspension of CaCO3 microparticles is diluted with fresh or
unsaturated water, dissolution begins to occur at the particle surface into the fluid (see Sec 6.3.2
and 6.3.3). The primary ions resulting from this dissolution are Ca2+
, HCO3-, and OH
-. At low
volume fractions of particles, the calcium carbonate can be treated as dissolving into an infinite
bath. Although eventually the particles disappear from the system, during the dissolution process
there is a radial concentration gradient of ions surrounding the particle.
The three ions resulting from each molecule of dissolved calcium carbonate have very
different hydration radii, and therefore, quite different diffusion coefficients8: At 20 C the OH-
ion has a diffusion coefficient of D = 5.2710-9
m2/s, while DHCO3- = 1.1910
-9 m
2/s and DCa+2 =
0.79210-9
m2/s. Because of these differences, the concentration of OH
- ions at a given distance
from the microparticle would be slightly higher than the concentrations of the other two ions,
except that Columbic forces spontaneously give rise to an electric field in order to maintain
electroneutrality. Because particles or surfaces in aqueous media become charged, for example
due to dissociated charge groups or metal ion substitution, an oppositely-charged electrical
double layer (EDL) forms in a thin layer around particles. The electric field resulting from
maintaining electroneutrality acts on the charged fluid in the EDL, generating a flow at the
surface. This overall process of an ion gradient effecting an electric field which drives
electrokinetic flows is called diffusiophoresis.3
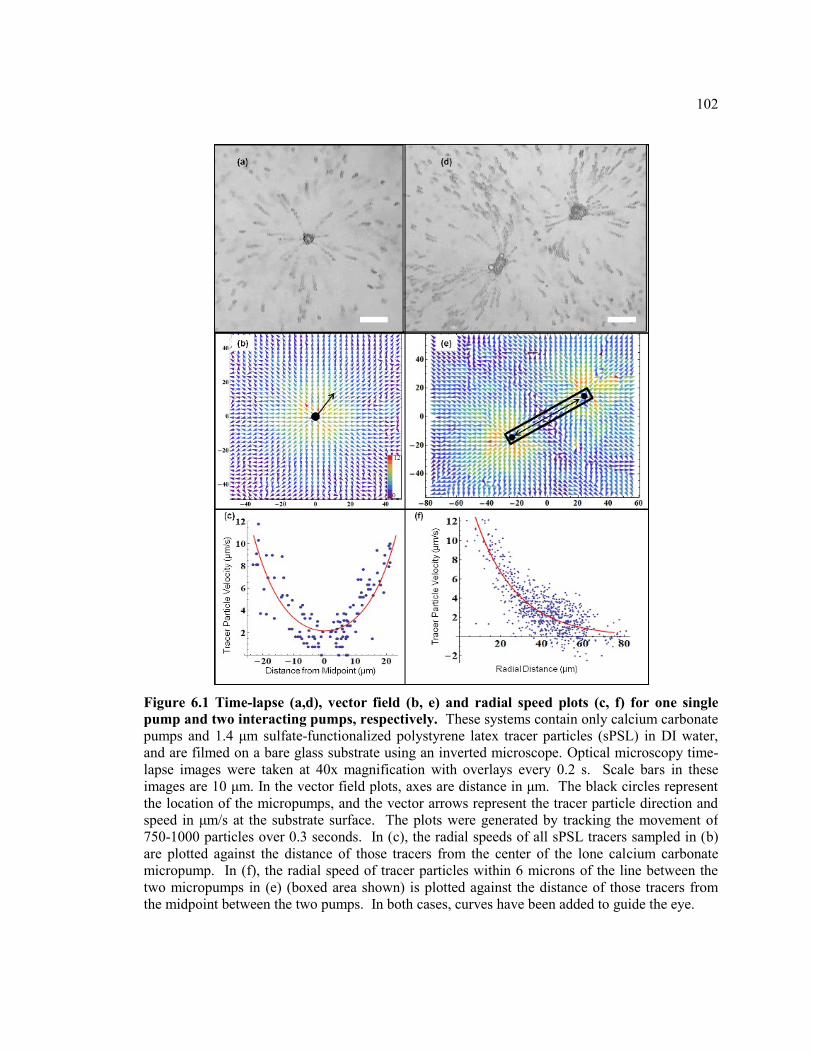
102
Figure 6.1 Time-lapse (a,d), vector field (b, e) and radial speed plots (c, f) for one single
pump and two interacting pumps, respectively. These systems contain only calcium carbonate
pumps and 1.4 μm sulfate-functionalized polystyrene latex tracer particles (sPSL) in DI water,
and are filmed on a bare glass substrate using an inverted microscope. Optical microscopy time-
lapse images were taken at 40x magnification with overlays every 0.2 s. Scale bars in these
images are 10 μm. In the vector field plots, axes are distance in μm. The black circles represent
the location of the micropumps, and the vector arrows represent the tracer particle direction and
speed in μm/s at the substrate surface. The plots were generated by tracking the movement of
750-1000 particles over 0.3 seconds. In (c), the radial speeds of all sPSL tracers sampled in (b)
are plotted against the distance of those tracers from the center of the lone calcium carbonate
micropump. In (f), the radial speed of tracer particles within 6 microns of the line between the
two micropumps in (e) (boxed area shown) is plotted against the distance of those tracers from
the midpoint between the two pumps. In both cases, curves have been added to guide the eye.
103
In the case when two pumps are near enough that their flowfields interact, a stagnation
point exists at the midpoint between the pumps. Tracers ejected from one particle toward the
other move slowly and often come to a stop before escaping in a direction orthogonal to their
initial movement. Figure 6.1c shows two pumps interacting in such a manner. Additionally, the
pump on the lower left demonstrates another unusual phenomenon. In this case, two large tracer
particles (anomalous to the purchased sPSL suspension) have attached themselves to the pump
surface, likely due to van der Waals forces. Once there, these large tracers began to ‗direct the
flow‘ of the other tracers like a type of micro-nozzle. The presence of additional fixed, charged
surfaces generates additional local electroosmotic flow in the solution. As a result, the smaller,
mobile tracers favor movement along these surfaces. Further experiments confirm the nozzling
phenomenon: by adding additional fixed charged surfaces, the flow of tracers can be focused or
directed in the solution around our pumps. This opens the possibility for designing complex flow
patterns in dissolving mineral systems as well as mechanisms for microparticle motility, as
observed later in this chapter.
Figure 6.2 Contributing diffusiophoretic effects in the micropump system. The calcium
carbonate particle dissociates into three ions in DI water. Due to difference in diffusion
coefficients of these ions, an electric field arises in the same vector direction as the radial
concentration gradient in order to maintain electroneutrality. The electric field generates an
electroosmotic flow along the charged substrate (in this work, bare glass in water). Charged
tracer particles in the solution have an electrophoretic velocity either up or down the gradient,
depending on the sign of their charge. The overall flow profile of the tracers is the superposition
of their electrophoretic flow and the electroosmotic flow of the surrounding solution.
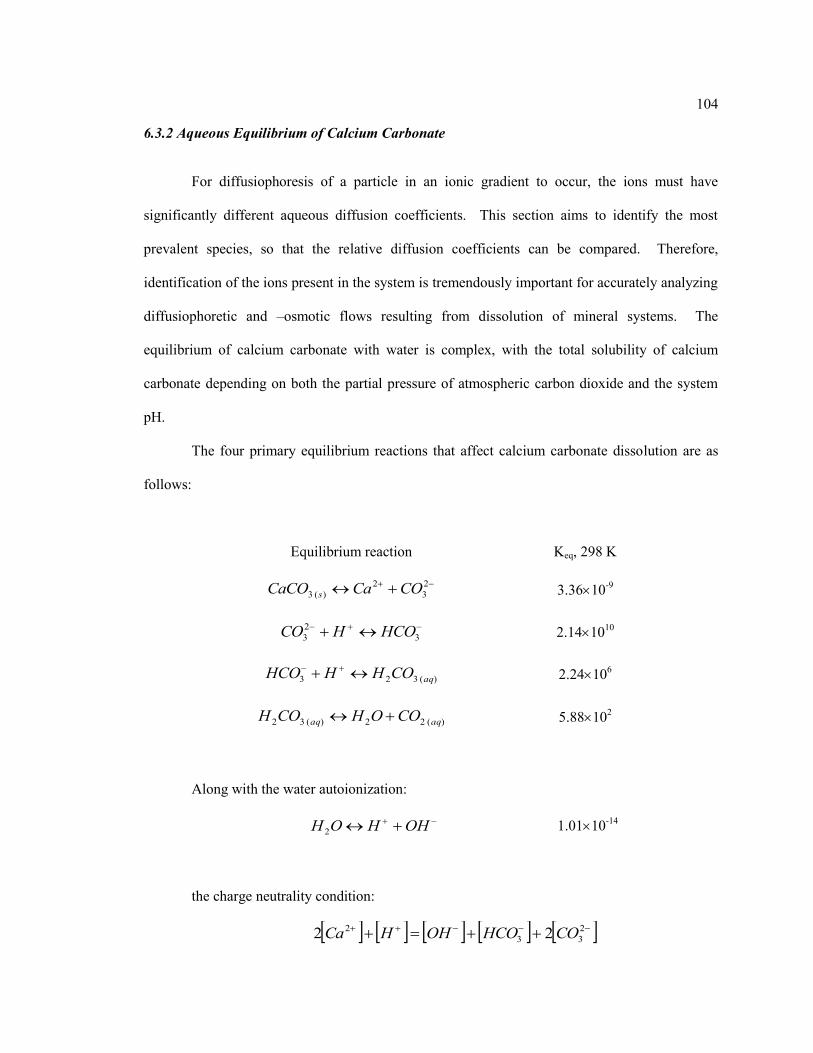
104
6.3.2 Aqueous Equilibrium of Calcium Carbonate
For diffusiophoresis of a particle in an ionic gradient to occur, the ions must have
significantly different aqueous diffusion coefficients. This section aims to identify the most
prevalent species, so that the relative diffusion coefficients can be compared. Therefore,
identification of the ions present in the system is tremendously important for accurately analyzing
diffusiophoretic and –osmotic flows resulting from dissolution of mineral systems. The
equilibrium of calcium carbonate with water is complex, with the total solubility of calcium
carbonate depending on both the partial pressure of atmospheric carbon dioxide and the system
pH.
The four primary equilibrium reactions that affect calcium carbonate dissolution are as
follows:
Equilibrium reaction Keq, 298 K
2
3
2
)(3 COCaCaCO s 3.3610
-9
3
2
3 HCOHCO
2.141010
)(323 aqCOHHHCO
2.2410
6
)(22)(32 aqaq COOHCOH
5.88102
Along with the water autoionization:
OHHOH2 1.0110-14
the charge neutrality condition:
2
33
2 22 COHCOOHHCa
105
and with the Henry‘s Law, which determines the concentration of dissolved CO2 from the
partial pressure of atmospheric CO2:
2
2
)(2 CO
CO
Haq pkCO
Where kHCO2
is the temperature-dependent Henry‘s Law constant for CO2 in water (for
our system at 25 deg C, kHCO2
= 3.410-2
M/atm)9. In fact, many of our normally-simple
equations used for equilibrium would be modified at the enormous pressures, temperatures, and
ionic strengths prevalent in geologic formations; further thermodynamic experiments and
modeling might be required to understand the activity coefficients and other modeling features.
Because any CO2 evolution from small amounts of dissolving calcium carbonate is not expected
to increase the local CO2 pressure (0.0314 atm), Henry‘s Law serves as a starting point for
determining the overall solubility of CaCO3 in our systems as it fixes the concentration of
dissolved CO2 at 1.0710-5
M. Now, the degrees of freedom in the system is 0, (5 equilibrium
equations + 1 charge neutrality condition – 6 concentrations: Ca2+
, CO32-
, HCO3-, H2CO3, H
+, OH
-
), and the final concentrations of each species can be determined for when the system reaches
saturation:
Species Concentration (M)
Ca2+
1.1110-4
CO32-
3.0110-5
HCO3- 7.2410
-5
H2CO3 1.8210-8
H+ 1.1210
-10
OH- 9.0010
-5
At concentrations lower than saturation, the ratio of bicarbonate to carbonate ion is calculated to
106
be even higher. Thus, the three primary ions present in the system during dissolution are Ca2+
HCO3-, and OH
-.
6.3.3 Concentration Profile and Diffusiophoretic Velocity Profile for a Calcium Carbonate
Sphere Dissolving into an Infinite Bath
Concentration Profile:
To fully understand and analyze the velocity profile of fluid and tracer particles moved
through diffusioosmotic and diffusiophoretic pumping of a dissolving mineral microsphere, we
must first understand the concentration gradient of the ions in the system. An appropriate model
of the calcium carbonate microsphere system is that of a sphere dissolving into an infinite bath.
We make the assumptions that the microsphere has radius a with a non-moving solid-
liquid interface, that there is a constant surface ionic concentration Cs equal to the saturation
concentration of calcium carbonate at r = a, the overall diffusion coefficient of the ions is a
constant, D, and that the sphere is dissolving into an infinite bath with concentration Cb.
Fick‘s Second Law describes this situation (unsteady-state diffusion):
CDt
C
with boundary conditions:
b
s
CtrC
CtarC
),(
),(
And initial condition:
bCtrC )0,(
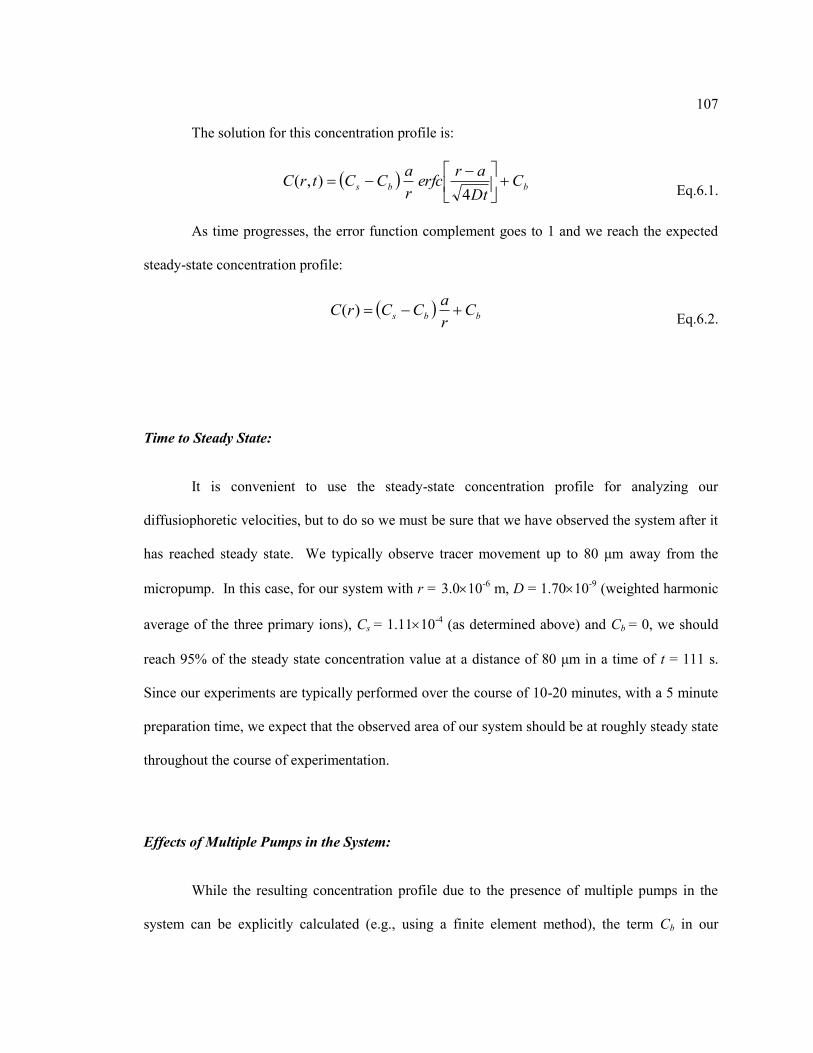
107
The solution for this concentration profile is:
bbs CDt
arerfc
r
aCCtrC
4),(
Eq.6.1.
As time progresses, the error function complement goes to 1 and we reach the expected
steady-state concentration profile:
bbs Cr
aCCrC )(
Eq.6.2.
Time to Steady State:
It is convenient to use the steady-state concentration profile for analyzing our
diffusiophoretic velocities, but to do so we must be sure that we have observed the system after it
has reached steady state. We typically observe tracer movement up to 80 μm away from the
micropump. In this case, for our system with r = 3.010-6
m, D = 1.7010-9
(weighted harmonic
average of the three primary ions), Cs = 1.1110-4
(as determined above) and Cb = 0, we should
reach 95% of the steady state concentration value at a distance of 80 μm in a time of t = 111 s.
Since our experiments are typically performed over the course of 10-20 minutes, with a 5 minute
preparation time, we expect that the observed area of our system should be at roughly steady state
throughout the course of experimentation.
Effects of Multiple Pumps in the System:
While the resulting concentration profile due to the presence of multiple pumps in the
system can be explicitly calculated (e.g., using a finite element method), the term Cb in our
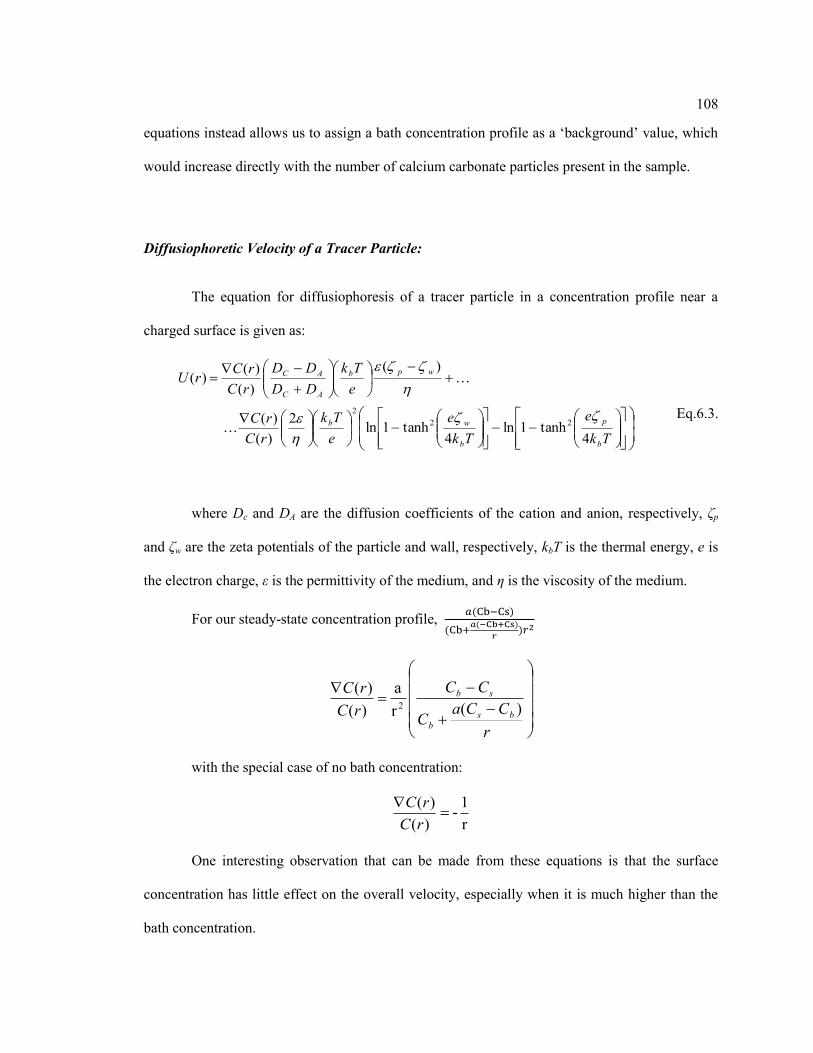
108
equations instead allows us to assign a bath concentration profile as a ‗background‘ value, which
would increase directly with the number of calcium carbonate particles present in the sample.
Diffusiophoretic Velocity of a Tracer Particle:
The equation for diffusiophoresis of a tracer particle in a concentration profile near a
charged surface is given as:
Tk
e
Tk
e
e
Tk
rC
rC
e
Tk
DD
DD
rC
rCrU
b
p
b
wb
wpb
AC
AC
4tanh1ln
4tanh1ln
2
)(
)(
)(
)(
)()(
22
2
Eq.6.3.
where Dc and DA are the diffusion coefficients of the cation and anion, respectively, ζp
and ζw are the zeta potentials of the particle and wall, respectively, kbT is the thermal energy, e is
the electron charge, ε is the permittivity of the medium, and η is the viscosity of the medium.
For our steady-state concentration profile,
r
CCaC
CC
rC
rC
bsb
sb
)(r
a
)(
)(2
with the special case of no bath concentration:
r
1-
)(
)(
rC
rC
One interesting observation that can be made from these equations is that the surface
concentration has little effect on the overall velocity, especially when it is much higher than the
bath concentration.
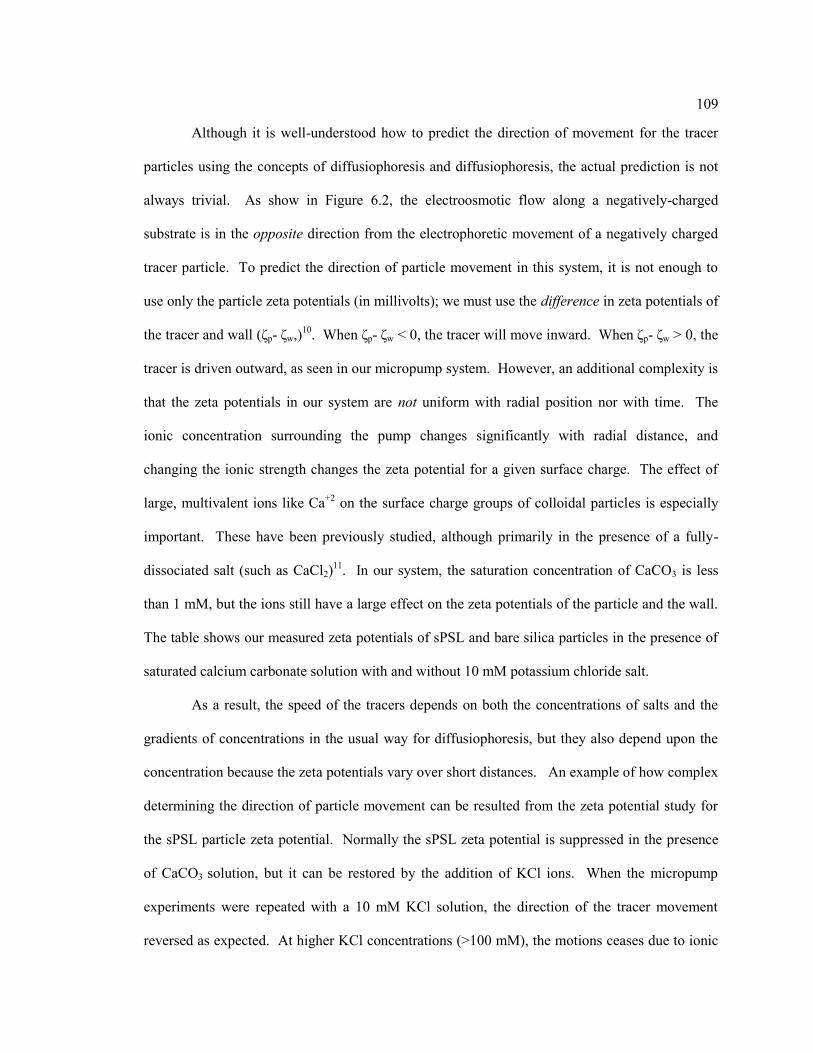
109
Although it is well-understood how to predict the direction of movement for the tracer
particles using the concepts of diffusiophoresis and diffusiophoresis, the actual prediction is not
always trivial. As show in Figure 6.2, the electroosmotic flow along a negatively-charged
substrate is in the opposite direction from the electrophoretic movement of a negatively charged
tracer particle. To predict the direction of particle movement in this system, it is not enough to
use only the particle zeta potentials (in millivolts); we must use the difference in zeta potentials of
the tracer and wall (ζp- ζw,)10
. When ζp- ζw < 0, the tracer will move inward. When ζp- ζw > 0, the
tracer is driven outward, as seen in our micropump system. However, an additional complexity is
that the zeta potentials in our system are not uniform with radial position nor with time. The
ionic concentration surrounding the pump changes significantly with radial distance, and
changing the ionic strength changes the zeta potential for a given surface charge. The effect of
large, multivalent ions like Ca+2
on the surface charge groups of colloidal particles is especially
important. These have been previously studied, although primarily in the presence of a fully-
dissociated salt (such as CaCl2)11
. In our system, the saturation concentration of CaCO3 is less
than 1 mM, but the ions still have a large effect on the zeta potentials of the particle and the wall.
The table shows our measured zeta potentials of sPSL and bare silica particles in the presence of
saturated calcium carbonate solution with and without 10 mM potassium chloride salt.
As a result, the speed of the tracers depends on both the concentrations of salts and the
gradients of concentrations in the usual way for diffusiophoresis, but they also depend upon the
concentration because the zeta potentials vary over short distances. An example of how complex
determining the direction of particle movement can be resulted from the zeta potential study for
the sPSL particle zeta potential. Normally the sPSL zeta potential is suppressed in the presence
of CaCO3 solution, but it can be restored by the addition of KCl ions. When the micropump
experiments were repeated with a 10 mM KCl solution, the direction of the tracer movement
reversed as expected. At higher KCl concentrations (>100 mM), the motions ceases due to ionic
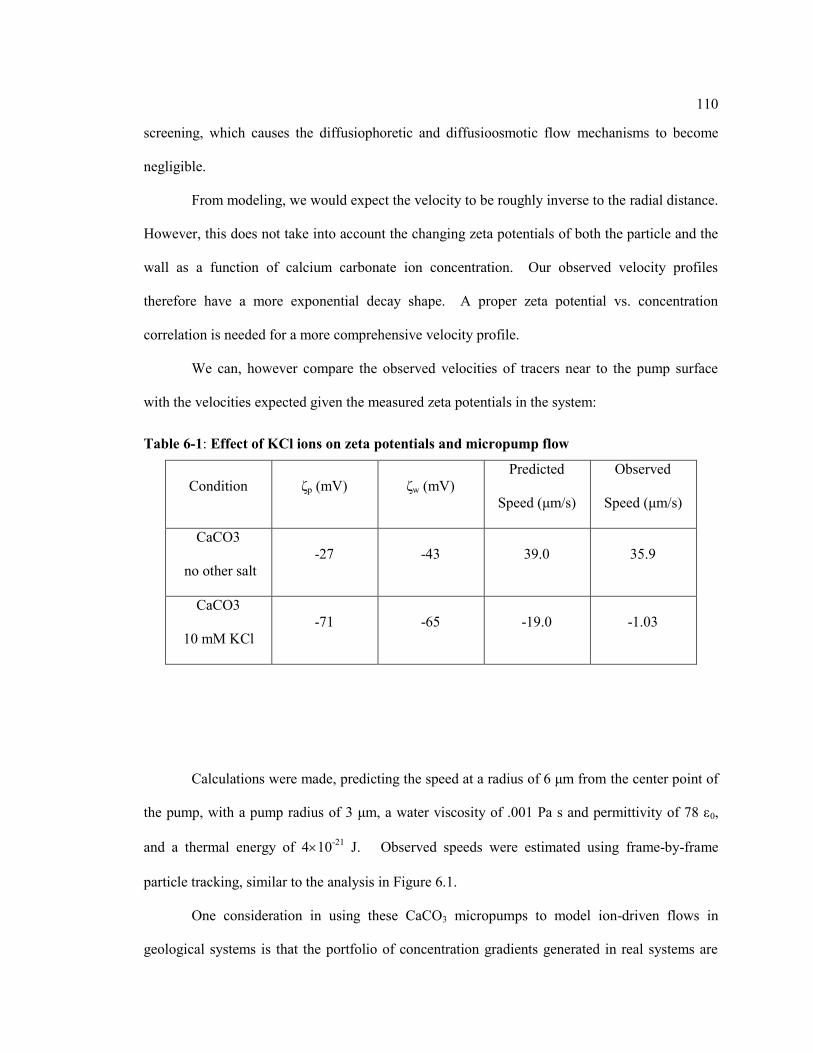
110
screening, which causes the diffusiophoretic and diffusioosmotic flow mechanisms to become
negligible.
From modeling, we would expect the velocity to be roughly inverse to the radial distance.
However, this does not take into account the changing zeta potentials of both the particle and the
wall as a function of calcium carbonate ion concentration. Our observed velocity profiles
therefore have a more exponential decay shape. A proper zeta potential vs. concentration
correlation is needed for a more comprehensive velocity profile.
We can, however compare the observed velocities of tracers near to the pump surface
with the velocities expected given the measured zeta potentials in the system:
Calculations were made, predicting the speed at a radius of 6 μm from the center point of
the pump, with a pump radius of 3 μm, a water viscosity of .001 Pa s and permittivity of 78 ε0,
and a thermal energy of 410-21
J. Observed speeds were estimated using frame-by-frame
particle tracking, similar to the analysis in Figure 6.1.
One consideration in using these CaCO3 micropumps to model ion-driven flows in
geological systems is that the portfolio of concentration gradients generated in real systems are
Table 6-1: Effect of KCl ions on zeta potentials and micropump flow
Condition ζp (mV) ζw (mV)
Predicted
Speed (μm/s)
Observed
Speed (μm/s)
CaCO3
no other salt
-27 -43 39.0 35.9
CaCO3
10 mM KCl
-71 -65 -19.0 -1.03
111
much more complex than around our pumps. The velocity field between two pumps in close
proximity can be approximated by the addition of the individual velocity fields around each pump
(see Figure 6.1d). When many pumps interact, the overall speed of the tracer particles decreases,
but the motion can be seen over even millimeter-scale distances, likely due to the increasingly
complex ion gradient profile. Figure 6.3 shows these results, studied by varying the surface
fraction of pumps on the glass substrate.
Figure 6.3 Effect of surface concentration of calcium carbonate micropumps on tracer
particle speed (circle) and length of transport decay (x). By fitting exponential decay
functions to tracer velocity data sampled from optical microscope videos of the micropumps, the
speed of the tracers at the surface of each pump (the theoretical maximum) and the radial distance
at which the tracer speed decays to its half-maxiumum can be determined. As the surface fraction
of calcium carbonate micropumps in a given sample increases, the speed of the tracer particles
sharply decreases, while the length over which the speed decays grows larger. These systems
were similar to the systems examined in Figures 6.2, containing only micropumps and sPSL
tracers in DI water on bare glass substrates.
112
6.3.4 Flows Generated by Other Geologic Systems
Calcium carbonate microparticles have served as a model system to study
diffusiophoretic microflows, but they are not the only mineral that drives flow. Indeed, we have
found that the dissolution of several different minerals drive diffusiophoretic flows, as shown in
Figure 6.4. Barium carbonate microparticles (Fig. 6.4a) synthesized in a similar manner to the
CaCO3 particles show nearly identical behavior. In fact, the pumping of the tracers is even faster
for comparable particle surface fractions, due to the greater disparity in ionic diffusion
coefficients between the Ba+2
and OH-. Dissolution of naturally occurring gypsum (hydrated
calcium sulfate) crystals (Fig 6.4b) also drives tracer particle motion. Interestingly, although
calcium sulfate is much more soluble than calcium carbonate (Ksp = 3.4110-5
), the tracers move
more slowly due to a smaller difference in the ion diffusion coefficients of Ca2+
(D = 0.79210-9
)
and SO42-
(D = 1.0710-9
).8 It is not the magnitude of the solubility of the ions that determines the
speed of the flow, but the difference in diffusion coefficients of the ions, in keeping with the
diffusioosmotic mechanism. Finally, both naturally-occurring calcite and dolomite, both obtained
from an oil reservoir, behaves identically to the calcium carbonate micropumps, except for acting
on a much large length scale (Fig 6.4c) due its larger size.
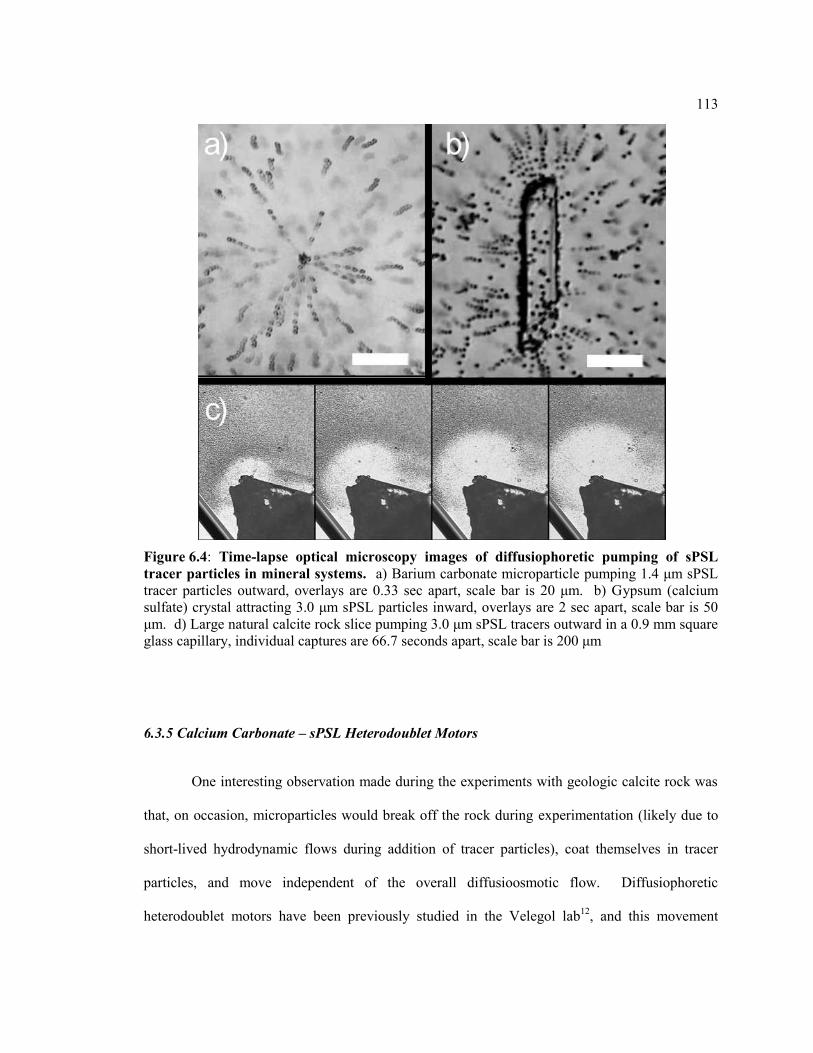
113
6.3.5 Calcium Carbonate – sPSL Heterodoublet Motors
One interesting observation made during the experiments with geologic calcite rock was
that, on occasion, microparticles would break off the rock during experimentation (likely due to
short-lived hydrodynamic flows during addition of tracer particles), coat themselves in tracer
particles, and move independent of the overall diffusioosmotic flow. Diffusiophoretic
heterodoublet motors have been previously studied in the Velegol lab12
, and this movement
Figure 6.4: Time-lapse optical microscopy images of diffusiophoretic pumping of sPSL
tracer particles in mineral systems. a) Barium carbonate microparticle pumping 1.4 μm sPSL
tracer particles outward, overlays are 0.33 sec apart, scale bar is 20 μm. b) Gypsum (calcium
sulfate) crystal attracting 3.0 μm sPSL particles inward, overlays are 2 sec apart, scale bar is 50
μm. d) Large natural calcite rock slice pumping 3.0 μm sPSL tracers outward in a 0.9 mm square
glass capillary, individual captures are 66.7 seconds apart, scale bar is 200 μm
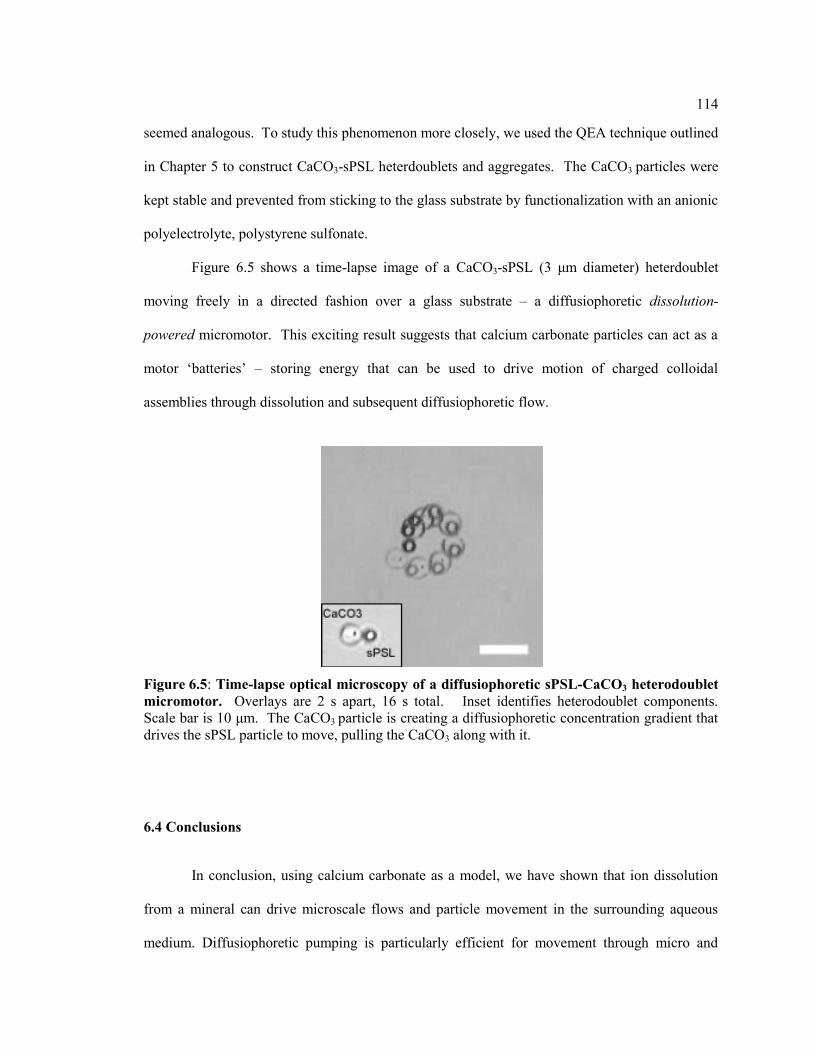
114
seemed analogous. To study this phenomenon more closely, we used the QEA technique outlined
in Chapter 5 to construct CaCO3-sPSL heterdoublets and aggregates. The CaCO3 particles were
kept stable and prevented from sticking to the glass substrate by functionalization with an anionic
polyelectrolyte, polystyrene sulfonate.
Figure 6.5 shows a time-lapse image of a CaCO3-sPSL (3 μm diameter) heterdoublet
moving freely in a directed fashion over a glass substrate – a diffusiophoretic dissolution-
powered micromotor. This exciting result suggests that calcium carbonate particles can act as a
motor ‗batteries‘ – storing energy that can be used to drive motion of charged colloidal
assemblies through dissolution and subsequent diffusiophoretic flow.
6.4 Conclusions
In conclusion, using calcium carbonate as a model, we have shown that ion dissolution
from a mineral can drive microscale flows and particle movement in the surrounding aqueous
medium. Diffusiophoretic pumping is particularly efficient for movement through micro and
Figure 6.5: Time-lapse optical microscopy of a diffusiophoretic sPSL-CaCO3 heterodoublet
micromotor. Overlays are 2 s apart, 16 s total. Inset identifies heterodoublet components.
Scale bar is 10 μm. The CaCO3 particle is creating a diffusiophoretic concentration gradient that
drives the sPSL particle to move, pulling the CaCO3 along with it.
115
nanochannels.13
Other flow mechanisms such do not work well in these narrow channels; for
example, the Hagen–Poiseuille fluid speed for a pressure-driven flow in a channel depends upon
the radius squared, and typical numbers indicate speeds less than 1 nm/s.14
Water injection and
rock fracturing are commonly practiced in oil wells15,16
and now in gas shales, and ion gradients
will occur as a result. While the overall flows involve millions of gallons of water, the
mechanism of obtaining the desired petroleum or gas out of dense rocks might depend
significantly on mineral-driven microflows. Furthermore, in geologic events like earthquakes,
microflows might bleed chemical species from micro or nanochannels in rock to larger-scale bulk
flows.
6.5 Acknowledgements & Permissions
Chapter 6 is a modified version of the author‘s publication:
Joseph J. McDermott, Majd Daher, Steve S. Klara, Ayusman Sen & Darrell Velegol.
Dissolution-Induced Fluid Pumping in Disturbed Geologic Formations, submitted to Science.
We would like to thank the Department of Energy (Grant No. DE-FG02-07ER46414) and
the Penn State MRSEC under National Science Foundation grant DMR-0820404, Center for
Nanoscale Science, for funding this project, Huda Jerri for the inspiration behind the original
idea, and Lauren Rae McCullough for her help with calcium carbonate microparticle synthesis in
the initial stages of the research.
116
6.6 References
1 Krauskopf, K.B.; Bird, D.K. Introduction to Geochemistry McGraw-Hill, 1995.
2 Prieve, D. C.; Anderson J. L.; Ebel, J. P.; Lowell M.E.
J. Fluid Mech. 1984, 148, 247-269.
3 Anderson, J.L. Ann. Rev. Fluid Mech. 1989 21 61-99.
4 Ebel, J. P.; Anderson, J.L.; Prieve, D.C. Langmuir 1988, 4(2), 396–406
5 Volodkin, D.V.; Petrov, A.I.; Prevot, M.; Sukhorukov, G. B. Langmuir, 2004, 20 (8), 3398–
3406.
6 Moulin, P.; Roques, H. Journal of Colloid and Interface Science 2003, 261, (1), 115-126.
7 Langmuir, 1997, 13 (23), pp 6058–6068 Yuri Solomentsev,*
† Marcel Böhmer,
‡ and John L.
Anderson†
8 Lide, D. R., CRC handbook of chemistry and physics: a ready-reference book of chemical and
physical data. CRC Press 2004.
9 Lelieveld, J.; Crutzen, P.J. J. Atmos. Chem., 1991, 12, 229–267.
10 Chaturvedi, N.; Hong, Y.; Sen, A.; Velegol, D. Langmuir 2010, 26, (9), 6308-6313.
11 Elimelech, M.; O'Melia, C.R. Colloids and Surfaces 1990, 44, 165-178.
12 Sen, A.; Ibele, M.; Hong, Y.; Velegol, D. Faraday Discussions 2009, 143, 15-27.
13 Prieve, D.C. Nature Materials 2008, 7(10), 769-770
14 Welty, J. R.; Wicks, C. E.; Rorrer, G.; Wilson, R. E., Fundamentals Of Momentum, Heat, And
Mass Transfer, 4Th Ed. Wiley India Pvt. Ltd. 2009.
15 Morrow, N.R.; Tang, G.; Valat, M; Xie, X. J. Pet. Sci. Eng. 1998, 20, 267-276.
16 Morgan, N. BP Global Frontiers 2009, 25, 6-9.
Chapter 7
Photoresponsive Metal - Cadmium Sulfide Colloidal Micromotor Assemblies
7.1 Introduction & Background
Autonomous colloidal micromotors are growing increasingly complex. These motor
particles respond to the presence of electrochemical species in their local environment by creating
localized electric fields1, ionic concentration gradients
2, or even pressure differences (through
bubble nucleation)3 that drive both autonomous motion of each motor and of the surrounding
fluid. Recently, motor mechanisms have been developed that respond to ultraviolet light, i.e., in
addition to4,5
or instead of6 converting electrochemical energy to mechanical motion, they utilize
light to perform chemical reactions to drive localized gradient formation. By using light, control
of the speed and collective behavior of the motor particles can be exercised. In this work,
micron-sized particles of the semiconductor cadmium sulfide are added to both existing motor
systems and are used to develop new motor mechanism. Because CdS has a band gap of 2.4 eV7
(corresponding to blue-green light), it responds to light in the visible spectrum, and therefore
allows the motor assemblies to be manipulated using a mercury arc lamp used for simple
fluorescence microscopy experiments.
Bimetallic colloidal rods, synthesized using a templated electrodeposition technique,
were among the first colloidal motor systems.1 When placed in solutions of water - hydrogen
peroxide, these nanorods of platinum-gold or gold-silver catalytically decompose the peroxide,
with each half reaction occurring selectively on each metallic end. The flow of electrons through
the rod (from one metal to the other) is accompanied by a flow of protons through the
118
surrounding solution, creating an electric field. If the rods have a surface charge, they move
through the process of autoelectrophoresis. In addition to bimetallic rods, similar movement has
been observed by the authors in systems of gold and silver colloids that are assembled in solution
into heterodoublets.8
The electron flux from one metal into the other is an essential part of the
autoelectrophoretic movement. If the metals are not in electrical contact, the individual peroxide
decomposition half-reactions cannot selectively occur on each metal; this lack of a reaction dipole
prevents proton transport through solution and therefore autoelectrophoresis does not occur. This
observation led to the initial goal of this work: using a semiconductor particle as a photoresistor
between the two metals in a bimetallic peroxide motor. This would allow for control of the
electron flux (and therefore particle motility) using incident light. Indeed, the authors have
fabricated three-component metal-semiconductor-metal trimers in the past, (specifically, gold-
silicon-silver), but the high native conductivity of silicon prevented these trimers from responding
to light.9
CdS looked to be an excellent semiconductor for use in our motor systems: it has a very
low solubility (< 10-7
M10
), a bandgap of 2.4 eV and therefore low native conductivity but still
visible-light-responsive, and can be synthesized or purchased as a micron-sized powder. In fact,
CdS is one of the most common and simple semiconductors used as a photoresistor. Through its
use in our motor assemblies, however, we have observed complex autoelectro- and
autodiffusiophoretic movement that suggest the CdS is actively participating in the
electrochemical processes, either through direct interaction with electrochemical species or
though indirect photodiodic effects with one or both of the metal components. In this work, we
demonstrate a variety of metal-CdS motor systems that respond to blue light, both with and
119
without presence of hydrogen peroxide. It is only through observation of many different motor
assembles that we can gain a full understanding of the fundamental processes taking place that
drive the autonomous motion.
7.2 Experimental & Materials
7.2.1 Materials:
Gold and silver microparticles were synthesized using the recipe developed by Goia and
Matijevic11
. The cationic polyelectrolyte poly(allylamine hydrochloride) (PAH, Mw 70,000),
silver nitrate for colloidal silver synthesis, CdS micropowder (1 μm), L-ascorbic acid, gum
Arabic and potassium chloride (KCl) were purchased from Sigma-Aldrich Chemicals, USA. To
synthesize the gold particles, gold chloride (HAuCl4) was purchased from Strem Chemicals.
Deionized (DI) water used in all aqueous solutions came from a Millipore Corporation MilliQ
system, with specific resistance greater than 1 MΩ.cm (due to equilibration with CO2 in air).
Hydrogen peroxide, filter papers, and glassware were obtained from VWR International.
Monodisperse 19 nm sulfate-functionalized polystyrene latex nanoparticles (2% w/v) and 1.4 μm
sulfate-functionalized microspheres (4% w/v) were purchased from Interfacial Dynamics
Corporation (Portland, OR). Monodisperse 1.0 μm silica microspheres (10% w/v) were
purchased from Bangs Laboratories.
7.2.2 Instrumentation:
The optical microscopy images were obtained on a Nikon Eclipse TE2000-U inverted
optical microscope. High-intensity blue light was injected into the sample using a mercury arc
120
lamp and a Nikon B-2E/C filter cube with excitation wavelengths of 465-495 nm, and a cutoff
wavelength of 505 nm. A Sorvall Biofuge Primo Centrifuge from Kendro Laboratory Products
was employed, and it was equipped with a swing-bucket rotor. The Ultrasonicator was from
VWR International (model 550T).
7.2.3 Two-Component Motor Fabrication
Because the CdS surface has little to no zeta potential in solution below pH 712
, we can
form CdS-X heterodoublets using the procedure outlined in Chapter 6 for the fabrication of PSL-
calcium carbonate hetrodoublets. A solution was prepared with CdS microparticles (volume
fraction φ = 0.001), and the other material (φ = 0.001), and in the presence of 10 mM KCl salt
was allowed to aggregate for 15 min. Then, a solution of 20 μM sodium polystyrene sulfonate
was added to the particles, quenching the aggregation by adsorbing to and giving the calcium
carbonate particles a negative surface charge. The solution of stable aggregates, which included
CdS-X heterodoublets was rinsed, resuspended in DI water, and observed using optical
microscopy on bare glass substrates.
7.2.4 Three Component Motor Fabrication
Trimers of Au-CdS-Ag and Au-SiO2-Ag were fabricated using the QEA technique as
outlined in Chapter 5. Stock solutions of each type of particle used for assembly were prepared.
Core particles used included PAH-functionalized CdS and SiO2 (volume fraction .0005) Satellite
particles were gold (volume fraction 0.001) and silver (volume fraction 0.001). The satellite
particles were added to a solution of suspended core particles in a test tube, along with enough
30 mM KCl to give a final solution ionic strength of 25 mM. These test tubes were placed on a
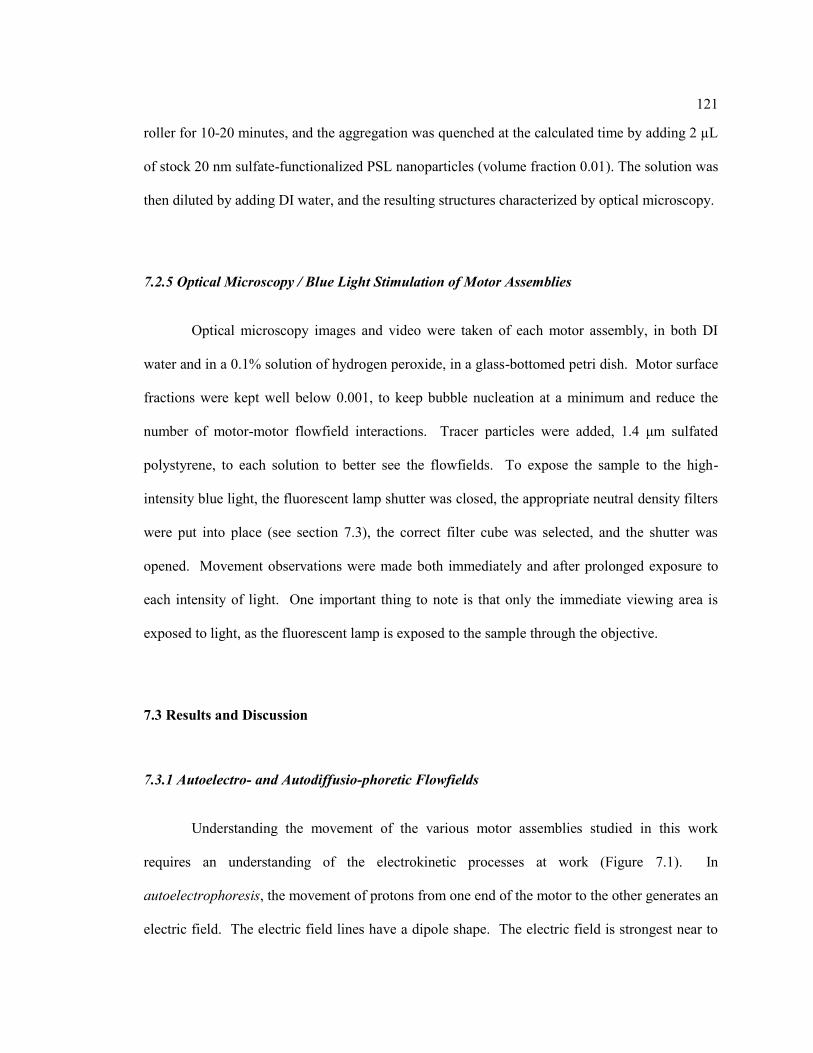
121
roller for 10-20 minutes, and the aggregation was quenched at the calculated time by adding 2 µL
of stock 20 nm sulfate-functionalized PSL nanoparticles (volume fraction 0.01). The solution was
then diluted by adding DI water, and the resulting structures characterized by optical microscopy.
7.2.5 Optical Microscopy / Blue Light Stimulation of Motor Assemblies
Optical microscopy images and video were taken of each motor assembly, in both DI
water and in a 0.1% solution of hydrogen peroxide, in a glass-bottomed petri dish. Motor surface
fractions were kept well below 0.001, to keep bubble nucleation at a minimum and reduce the
number of motor-motor flowfield interactions. Tracer particles were added, 1.4 μm sulfated
polystyrene, to each solution to better see the flowfields. To expose the sample to the high-
intensity blue light, the fluorescent lamp shutter was closed, the appropriate neutral density filters
were put into place (see section 7.3), the correct filter cube was selected, and the shutter was
opened. Movement observations were made both immediately and after prolonged exposure to
each intensity of light. One important thing to note is that only the immediate viewing area is
exposed to light, as the fluorescent lamp is exposed to the sample through the objective.
7.3 Results and Discussion
7.3.1 Autoelectro- and Autodiffusio-phoretic Flowfields
Understanding the movement of the various motor assemblies studied in this work
requires an understanding of the electrokinetic processes at work (Figure 7.1). In
autoelectrophoresis, the movement of protons from one end of the motor to the other generates an
electric field. The electric field lines have a dipole shape. The electric field is strongest near to
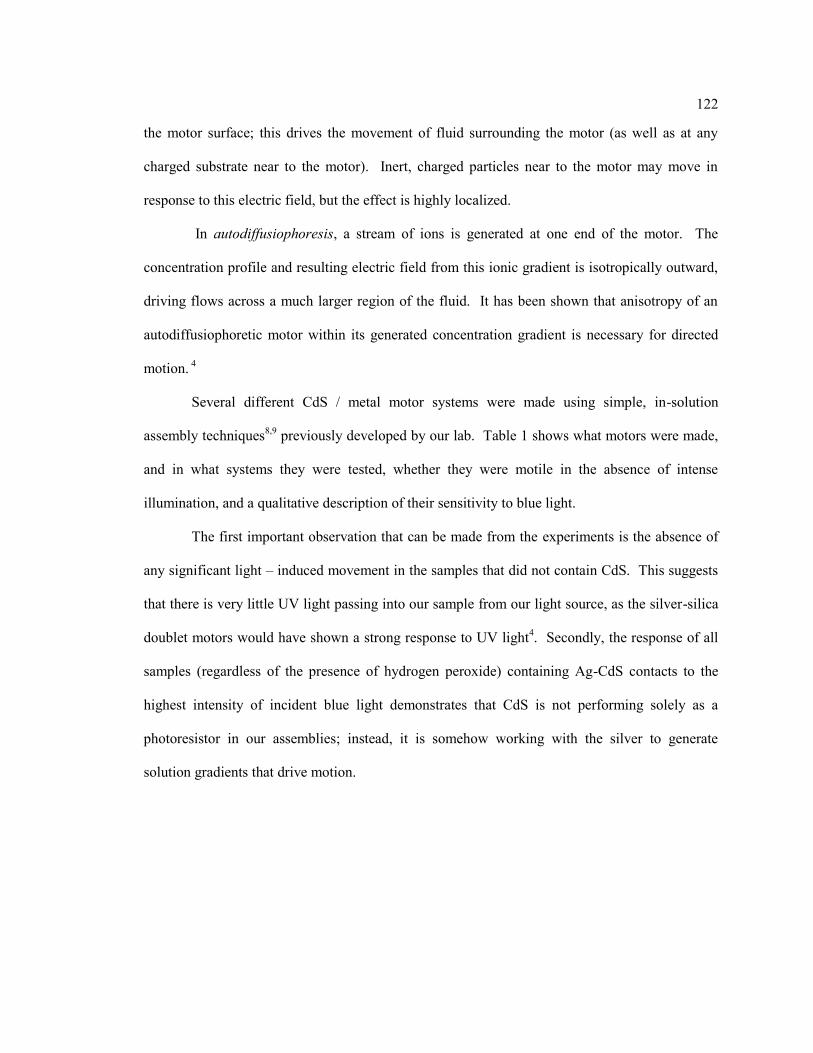
122
the motor surface; this drives the movement of fluid surrounding the motor (as well as at any
charged substrate near to the motor). Inert, charged particles near to the motor may move in
response to this electric field, but the effect is highly localized.
In autodiffusiophoresis, a stream of ions is generated at one end of the motor. The
concentration profile and resulting electric field from this ionic gradient is isotropically outward,
driving flows across a much larger region of the fluid. It has been shown that anisotropy of an
autodiffusiophoretic motor within its generated concentration gradient is necessary for directed
motion. 4
Several different CdS / metal motor systems were made using simple, in-solution
assembly techniques8,9
previously developed by our lab. Table 1 shows what motors were made,
and in what systems they were tested, whether they were motile in the absence of intense
illumination, and a qualitative description of their sensitivity to blue light.
The first important observation that can be made from the experiments is the absence of
any significant light – induced movement in the samples that did not contain CdS. This suggests
that there is very little UV light passing into our sample from our light source, as the silver-silica
doublet motors would have shown a strong response to UV light4. Secondly, the response of all
samples (regardless of the presence of hydrogen peroxide) containing Ag-CdS contacts to the
highest intensity of incident blue light demonstrates that CdS is not performing solely as a
photoresistor in our assemblies; instead, it is somehow working with the silver to generate
solution gradients that drive motion.
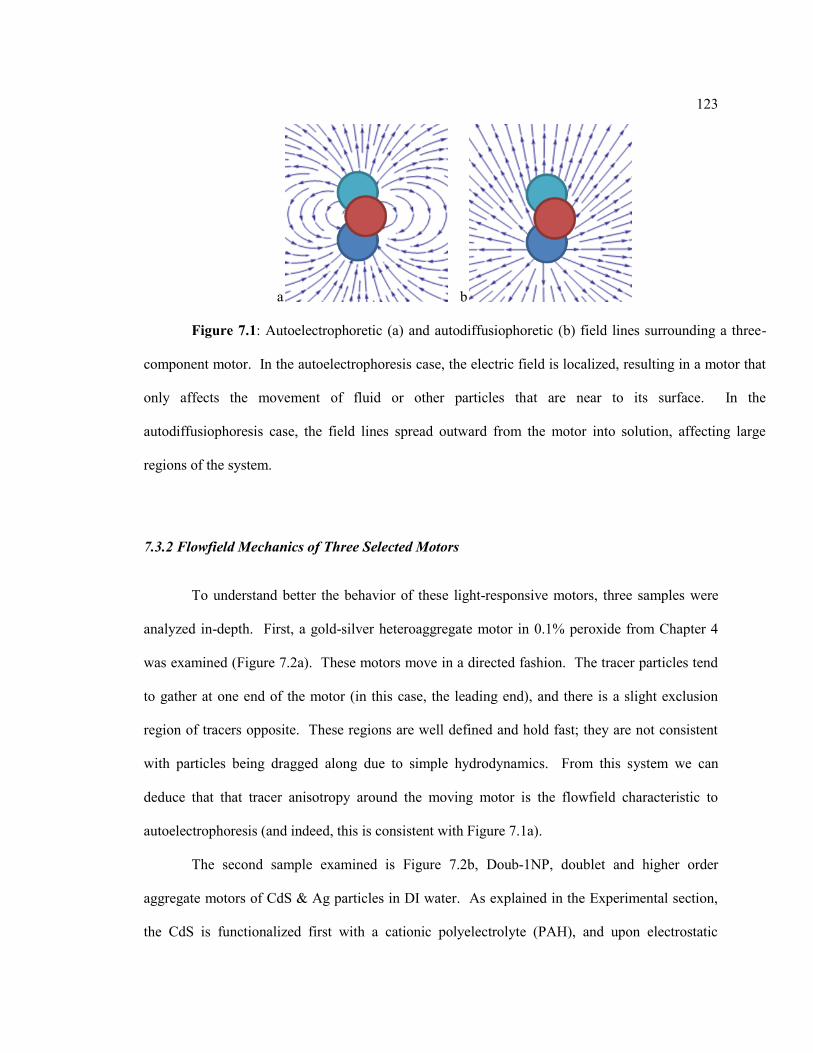
123
a b
Figure 7.1: Autoelectrophoretic (a) and autodiffusiophoretic (b) field lines surrounding a three-
component motor. In the autoelectrophoresis case, the electric field is localized, resulting in a motor that
only affects the movement of fluid or other particles that are near to its surface. In the
autodiffusiophoresis case, the field lines spread outward from the motor into solution, affecting large
regions of the system.
7.3.2 Flowfield Mechanics of Three Selected Motors
To understand better the behavior of these light-responsive motors, three samples were
analyzed in-depth. First, a gold-silver heteroaggregate motor in 0.1% peroxide from Chapter 4
was examined (Figure 7.2a). These motors move in a directed fashion. The tracer particles tend
to gather at one end of the motor (in this case, the leading end), and there is a slight exclusion
region of tracers opposite. These regions are well defined and hold fast; they are not consistent
with particles being dragged along due to simple hydrodynamics. From this system we can
deduce that that tracer anisotropy around the moving motor is the flowfield characteristic to
autoelectrophoresis (and indeed, this is consistent with Figure 7.1a).
The second sample examined is Figure 7.2b, Doub-1NP, doublet and higher order
aggregate motors of CdS & Ag particles in DI water. As explained in the Experimental section,
the CdS is functionalized first with a cationic polyelectrolyte (PAH), and upon electrostatic
124
attachment to the negatively charged silver particles, is ‗quenched‘ using a negatively charged
latex nanoparticle (containing a sulfate functionalization). Therefore, the actual CdS – Ag
doublet contains a both amine and sulfate groups near the metal – semiconductor junction.
The fluorescent lamp used to expose the motor sample to high intensity blue light has two
neutral-density filters that transmit 25% and 15% of the incoming light, respectively. This allows
for 5 levels of light exposure: off, 3.75%, 15%, 25%, and 100% of the maximum. In the CdS-Ag
motor system in DI water, no movement was observed without light exposure, and little
movement was observed until 100% intensity. Tracer studies of the CdS-Ag system (Figure 7.2b)
show the tracers forming strong exclusion regions around each motor, indicative of an
autodiffusiophoretic mechanism (and consistent with Figure 7.1b).
Table 7.1 Motor Systems Fabricated Using In-Solution Assembly .
Sample # Particle 1 Particle 2 Particle 3
(if
applicable)
Peroxide
Conc.
(% vol)
Initial
Move-
ment?
Light
Responsiveness
?
Sil-1P CdS Silica --- 0.1 None None
Sil-1NP CdS Silica --- --- None None
Sil-2P Ag Silica --- 0.1 Some Slight
Sil-2NP Ag Silica --- --- None None
Sil-3P Ag Silica Au 0.1 Slight None
Sil-3NP Ag Silica Au --- None None
Doub-1P Ag CdS --- 0.1 Some Strong
Doub-1NP Ag CdS --- --- None Moderate
Doub-2P Au CdS --- 0.1 None None
Doub-2NP Au CdS --- --- None None
Tri-P Au CdS Ag 0.1 Slight Strong
Tri-NP Au CdS Ag --- None Moderate
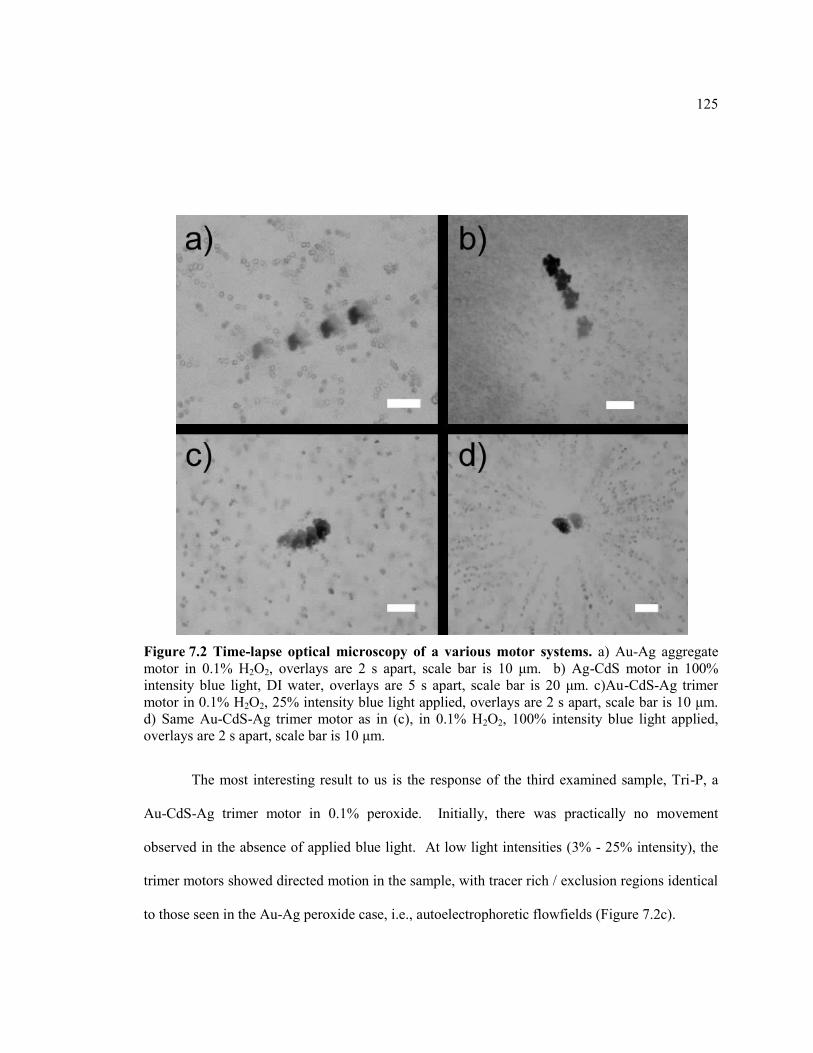
125
The most interesting result to us is the response of the third examined sample, Tri-P, a
Au-CdS-Ag trimer motor in 0.1% peroxide. Initially, there was practically no movement
observed in the absence of applied blue light. At low light intensities (3% - 25% intensity), the
trimer motors showed directed motion in the sample, with tracer rich / exclusion regions identical
to those seen in the Au-Ag peroxide case, i.e., autoelectrophoretic flowfields (Figure 7.2c).
Figure 7.2 Time-lapse optical microscopy of a various motor systems. a) Au-Ag aggregate
motor in 0.1% H2O2, overlays are 2 s apart, scale bar is 10 μm. b) Ag-CdS motor in 100%
intensity blue light, DI water, overlays are 5 s apart, scale bar is 20 μm. c)Au-CdS-Ag trimer
motor in 0.1% H2O2, 25% intensity blue light applied, overlays are 2 s apart, scale bar is 10 μm.
d) Same Au-CdS-Ag trimer motor as in (c), in 0.1% H2O2, 100% intensity blue light applied,
overlays are 2 s apart, scale bar is 10 μm.
126
However, at the highest blue light intensity (100%), the trimer motors began to move
very quickly until they inevitably adhered to the glass after a short time. Throughout this
movement, as well as after, tracer particles streamed away from the motor (Figure 7.2d). This
flowfield looks very similar to the Doub-1NP sample (7.2b), suggesting a transition from an
autoelectrophoretic to an autodiffusiophoretic flow mechanism at the higher light intensity.
Indeed, the tracer rich / exclusion region is maintained during the first few seconds of the new
motion. After this time, however, the tracers break away from the motor surface and are pushed
out with the others.
The Au-CdS-Ag trimer motors in peroxide and blue light appear to be active using two
different mechanisms of action, depending on light intensity. At lower intensities, the CdS acts as
a photoresistor, throttling electron flow from the gold to the silver, allowing for directed
autoelectrophoretic motion due to peroxide decomposition. At higher light intensities, the CdS-
silver junction begins some sort of photochemical reaction or catalysis (remember, these
junctions are active in and out of peroxide). This motion is autodiffusiophoretic in nature and is
powerful enough to overcome and mask out the lower-intensity mechanism.
7.3.3Reaction Identification and Future Experiments
While we can get a good sense of the type of movement the trimer motors in this chapter
exhibit by observing flowfields using tracer particles, determining the cause of that movement is
much more difficult. The photoresistive mechanism is a reasonable assumption for the lower-
intensity movement, but we are not sure what reaction is causing the diffusiophoretic gradient at
higher light intensities, both in and out of peroxide. SEM analysis of the silver and CdS surfaces
before and after light exposure as well as gas evolution and solution pH tests should help
127
determine the source of the ions; these experiments are in progress and will be added to this
document / my defense soon.
7.4 Conclusion
At low to moderate light intensities, the gold-CdS-silver trimer motor seems to be
functioning as designed: the CdS acts as a photoresistor that throttles electron transport. In the
absence of light, the motor is ‗off.‘ With an increase in blue light intensity, the motor begins to
gradually increase its speed. However, at the highest intensities, a secondary mechanism is
occurring due to the presence of silver-CdS junctions that changes the characteristics of the motor
movement. Exploration of this mechanism is essential to the full understanding of our system,
and experiments to accomplish this are ongoing.
One exciting thought is that the CdS is acting as a conduit for electrons (or electron
holes) into the silver, which normally needs UV light to be photoactive. Perhaps the CdS is
acting like a dye molecule in a dye-sensitized solar cell, converting lower energy into usable
electric potential inside the motor. This is a potentially big discovery, as it raises the level of
complexity in the particles we can fabricate, giving us more flexibility to create functional, active
assemblies
128
7.5 Acknowledgements
Chapter 6 is a modified version of the manuscript:
Joseph J. McDermott, Tso-Yi Chiang, Nicholas Karkar, & Darrell Velegol.
Photoactive Noble Metal-Semiconductor Trimer Motors In preparation.
This work was supported by the National Science Foundation (Grant # IRD-1014673).
7.6 References
1 Paxton, W. F.; Baker, P. T.; Kline, T. R.; Wang, Y.; Mallouk, T. E.; Sen, A., Catalytically
Induced Electrokinetics for Motors and Micropumps. Journal of the American Chemical
Society 2006, 128, (46), 14881-14888.
2 Kagan, D.; Balasubramanian, S.; Wang, J., Chemically Triggered Swarming of Gold
Microparticles. Angewandte Chemie International Edition 2010, 50, (2), 503-506.
3 Manesh, K. M.; Cardona, M.; Yuan, R.; Clark, M.; Kagan, D.; Balasubramanian, S.; Wang, J.,
Template-Assisted Fabrication of Salt-Independent Catalytic Tubular Microengines. ACS
Nano 2010, 4, (4), 1799-1804.
4 Chaturvedi, N.; Hong, Y.; Sen, A.; Velegol, D., Magnetic Enhancement of Phototaxing
Catalytic Motors. Langmuir 2010, 26, (9), 6308-6313.
129
5 Ibele, M.; Mallouk, T. E.; Sen, A., Schooling Behavior of Light-Powered Autonomous
Micromotors in Water. Angewandte Chemie 2009, 121, (18), 3358-3362.
6 Hong, Y.; Diaz, M.; Córdova-Figueroa, U. M.; Sen, A., Light-Driven Titanium-Dioxide-Based
Reversible Microfireworks and Micromotor/Micropump Systems. Advanced Functional
Materials 2010, 20, (10), 1568-1576.
7 Fonash, Stephen J. Solar Cell Device Physics Academic Press, New York, 1981.
8 McDermott, J. J.; Velegol, D., Simple Fabrication of Metallic Colloidal Doublets Having
Electrical Connectivity. Langmuir 2008, 24, (8), 4335-4339.
9 McDermott, J. J.; Chaturvedi, N.; Velegol, D., Functional colloidal trimers by quenched
electrostatic assembly. Physical Chemistry Chemical Physics 2010, 12, (38), 11930-11937.
10 Lide, D. R., CRC handbook of chemistry and physics: a ready-reference book of chemical and
physical data. CRC Press 2004.
11 V. Goia, D.; Matijevic, E., Preparation of monodispersed metal particles. New Journal of
Chemistry 1998, 22, (11), 1203-1215.
12 Guindo, M. C.; Zurita, L.; Durán, J. D. G.; Delgado, A. V., Electrokinetic behavior of spherical
colloidal particles of cadmium sulfide. Materials Chemistry and Physics 1996, 44, (1), 51-
58.
Chapter 8
Conclusions and Future Work
8.1 Research Goals: a Retrospective
At the start of this dissertation, I listed five research goals, driven by the motivating
factors of the commercialization of colloidal assembly and the chemical engineering process
design, fabrication, and purification of a complex & functional colloidal assembly. At the end of
this work, externally controllable, photoactive, three-component catalytic trimer motors were
fabricated using a generalized, scalable assembly technique. Additionally, the resulting
assembly, a gold-cadmium sulfide-silver trimer, displayed additional mechanisms of action than
predicted, including what was possibly a ‗dye-sensitized‘ silver photochemical reaction.
I hope it is clear how flexible and generalized the Quenched Electrostatic Assembly
technique is. After rejecting silicon as a poor photoresistive material in Chapter 5, I was able to
substitute cadmium sulfide microspheres – which was smaller and had a completely different
shape and surface functionality – into my trimer assemblies with very little effort. Similarly, the
calcium carbonate heterodoublet motors featured in Chapter 6 were easily made using a modified
form of the QEA technique.
The only drawback to ‗statistical‘ assembly techniques such as SQF and QEA is the
resulting distribution of product particles, including singlets of the component particles and
higher order aggregates. However, preliminary results from Chapter 3 suggest, at least, that there
are thermodynamic ways to separate distributions of particles and assemblies. This will be
discussed further in the future work.
131
Revisiting the research goals, it is clear how the work done in this dissertation satisfies
those goals:
1) Assemble a „traditional‟ bimetallic catalytic motor from component metal microparticles,
and assess its motility in hydrogen peroxide.
Gold-silver heterodoublets were synthesized using the SQF technique, found to be
thermodynamically and mechanically stable, and were active in hydrogen peroxide, moving
similar to the bimetallic nanorods previously produced (Chapter 4).
2) Work to analyze the movement of assembled motors and surrounding particles owing to
localized, self-generated electroosmotic and diffusioosmotic flowfields.
Electroosmotic and –phoretic flowfields were studied in Chapter 4 and Chapter 7, by
examining the movement of the bimetallic heterdoublet motors mentioned in goal (1).
Diffusioosmotic and –phoretic flowfields were studied in Chapter 6, by examining the dissolution
and diffusion of mineral systems into non-equilibrium aqueous solutions. In Chapter 7, these
flowfields are juxtaposed, showing how two very similar movement mechanisms for motors in
solution can have drastically different flow patterns.
3) Craft a generalized, flexible assembly technique that allows for the fabrication of three-
component, ordered „trimer‟ particles.
The Quenched Electrostatic Assembly technique developed in Chapter 5 has proven to be
a very versatile technique for producing ordered trimes out of polymer, oxide, semiconductor and
metallic particles with varying sizes and surface functionalities.
132
4) With the knowledge gained from goals (1) and (2), and the assembly technique developed
in goal (3), design and fabricate a three-component, photoactive catalytic motor.
In Chapter 7, gold-CdS-silver trimer motors were fabricated using the QEA technique.
These motors were found to be strongly photorresponsive to blue light in the presence of
hydrogen peroxide, with little to no motility until light exposure. The fabrication process was
made easy by the flexibility of the QEA technique, and due to operation in the visible spectrum,
the resulting assembly has opened the doors for many new photosensitive applications for
catalytic motors.
5) Explore separation techniques capable of separating colloidal particles by size, shape, or
other distinguishing factors that take advantage of the singular complexities of concentrated
distributions of colloids.
In Chapter 3, Effective Density Sorting was applied to bimodal and other distributions of
concentrated colloidal suspensions to separate particles of different sizes and densities. Rather
than be a hindrance, the complex fluid behavior of concentrated colloidal suspensions was a
contributor in the mechanistic of separation. This is the only research goal that has gone
somewhat unfinished; while there is theoretical evidence for thermodynamic separations based on
particle shape and packing behavior, no empirical evidence of such separations was
demonstrated, in large part due to difficult diffusion dynamics of oddly-shaped particles within
the packed sediment.
The main contribution of this work to the field of colloidal assembly was the design and
fabrication of a complex and functional colloidal assembly using a new, generalized assembly
technique. By approaching the assembly process as a chemical engineering process, the design,
fabrication, and separation of the final product each led to new results and techniques with an
133
emphasis on scalable, general and flexible processes that can be applied to many systems in the
future.
8.2 Future Work
There are three concepts and ideas arising from this work, in particular, that I feel have
rich and detailed research futures. First, the complexity of self-generated motors and pumps in
this document is well beyond much of the previous work, and certainly beyond our current
capabilities to analyze deterministically. Second, while the groundwork is laid within this
dissertation for separations of distributions of particles using effective density sorting, the
technique is in its infancy and must be applied to increasingly complex systems. Finally, the
prospect of diffusiophoretic flows in mineral systems is particularly attractive because of the
difficulty of using pressure driven flows in micropourous systems.
8.2.1 Crafting „Intelligent‟ Motors
One of the advantages of self-propelled micromotors is that they can be engineered to
change the local environment. For example, in Chapter 6, the CaCO3-PSL heterodoublet motor
leaves a trail of dissolved Ca2+
, HCO3- and OH
- ions in its wake. This change in environment not
only affects local inert particles, it may affect other motors in the area by changing the local bath
concentration, or even the surface charges of substrates. Similarly, combinations of
diffusiophoretic motors that release ions that can precipitate new particles when the gradients
meet allows for a large degree of flexibility within the system. Photoactive motors can respond to
patterns or flashes of light, perhaps by releasing ions that trigger other events. This idea of
cascading reactions that drive local osmotic flows can lead to emergent behavior of collections of
134
these particles. One clear avenue to further the work of this dissertation is determining in what
ways individual and collective motors can interact with and react to each other.
On the other side of things, by integrating the complex mechanics of, for example, the
gold-CdS-silver trimer motor into simple motor systems, we can add levels of control to that
motor system, perhaps even solving the biggest problem with directed motion: Brownian rotation.
8.2.2 Effective Density Sorting of Colloidal Aggregates and Continuous Distributions
The simples effective density sorting experiments are finished. We know bi- and multi-
modal size and density distributions of spherical colloidal particles can be sorted based on
gravitational potential. However, the sorting technique will be especially valuable if it can
accomplish one of two tasks: sorting colloidal aggregates (doublets, triplets, etc) from single
particles, which would be immediately useful for purifying simple colloidal assesmblies; or,
sorting continuous size distributions of particles in such a way that the polydispersity of various
portions of the sediment are decreased. This second task is relevant not just to colloidal assembly
but to any company or lab wishing to purify a monodisperse sample of a high-value colloid.
Additionally, effective density sorting of particles with various shapes is intriguing,
because it may reveal valuable results about the physics of 3D, mobile packed configurations of
shapes. Interparticle forces are also easily studied using effective density sorting, because
particle interaction distances are highly relevant to the final sediment configuration.
There are many elementary steps to take next with regards to the effective density
sorting, but I believe the ultimate direction for the research need to be heading for a high-
throughput separation technique that is flexible enough to be employed in the purification of
many different colloidal assemblies.
135
8.2.3 Engineering Flows in Mineral Systems
Geologic systems, such as in oil shale, are porous, but it is often difficult to get proper
penetration of nanoparticles or fluids into these porous structures using pressure driven flows.
Because movement from electro- and diffuiso- osmotic flows generates a slip velocity on charged
walls, it is much easier to drive flows in narrow channels using electrokinetics than pressure.
Additionally, these mineral systems are already ripe for manipulation, as they tend to
contain partially soluble materials, such as gypsum and limestone. The dissolution of these
minerals can produce strong electric fields that are localized to the wall surfaces.
In a lab environment, it would be interesting to engineerin complex flowfields by surface
zeta potential patterning. By patterning surfaces with different zeta potentials through particle
deposition, micropatterned templates or e-beam lithography, the flowfields generated at those
surfaces in the presence of electric fields or ionic gradients can be carefully directed and
controlled. This will hopefully lead to a better understanding of how to optimize transport of
micro- and nano- particles (and emulsion droplets) in to – and out of - more complex geologic
systems.
VITA
Joseph J. McDermott
Education Ph.D. in Chemical Engineering
Pennsylvania State University, State College, PA
Dec. 2011
B.S. Degree in Chemical Engineering
Carnegie Mellon University, Pittsburgh, PA
Minors in Physics and in Colloids, Polymers and Surfaces
Graduated with University Honors and College of Engineering Honors
May. 2006
Publications, Presentations & Patents Publications
McDermott, Joseph J.; Chiang, Tso-Yi; Karkar, Nicholas; Velegol, Darrell. ―Photoactive Noble
Metal-Semiconductor Trimer Motors‖ In preparation.
Ramirez, Laura M.; Kar, Abhishek; McDermott, Joseph J.; Velegol, Darrell. ―A Simple Method
for Determining Zeta Potentials Through Electrophoresis in Capillaries‖ In preparation.
McDermott, Joseph J.; Daher, Majd; Klara, Steve S.; Sen, Ayusman; Velegol, Darrell.
―Dissolution-Induced Fluid Pumping in Disturbed Geologic Formations‖ Submitted to Science.
Gonzalez Serrano, Cesar; McDermott, Joseph J. (Corresponding Author); Velegol, Darrell.
―Sediments of Soft Spheres Arraigned by Effective Density.‖ Accepted by Nature Materials (2011).
McDermott, Joseph J.; Chaturvedi, Neetu; Velegol, Darrell. ―Functional Colloidal Trimers by
Quenched Electrostatic Assembly.‖ Phys. Chem. Chem. Phys., 12, 11930 (2010).
Velegol, Darrell; Jerri, Huda A.; McDermott, Joseph J.; Chaturvedi, Neetu. ―Microfactories for
Colloidal Assemblies.‖ AICHE Journal, 56, 564-569 (2010).
McDermott, Joseph J.; Velegol, Darrell. ―Simple Fabrication of Metallic Colloidal Doublets
Having Electrical Connectivity.‖ Langmuir, 24, 4335-4339 (2008).
Conference Presentations
McDermott, Joseph J.; Chaturvedi, Neetu; Velegol, Darrell; ―Quenched Electrostatic Assembly of
Photoactive Electrophoretic Trimer Motors‖ AICHE National Meeting (Nov. 2011)
McDermott, Joseph J.; Gonzalez Serrano, Cesar; and Velegol, Darrell; ―Effective Density Sorting
of Soft Colloidal Spheres‖ AICHE National Meeting (Nov. 2011)
McDermott, Joseph J. and Velegol, Darrell ―Fabrication of Catalytically Active Gold-Silicon Silver
Trimers‖ ACS Colloids Annual Meeting (Jun. 2009).
McDermott, Joseph J. and Velegol, Darrell ―Fabricating Doublets Showing Electrical Connectivity‖
ACS Colloids Annual Meeting (Jun. 2008) & AICHE National Meeting (Nov. 2008)
Patents
Velegol, Darrell; Yake, Allison M.; McDermott, Joseph J. ―Particle doublets and n-mers and
methods for fabrication thereof‖ US Patent Application 20080072402.
Honors & Awards
Selected as one of seventy-five Young Researcher participants in the
American delegation to the 59th Meeting of Nobel Laureates in
Lindau, Germany
MRSEC Fellowship, Penn State University
Top-Up Award, Penn State University, Fall 2006 & Spring 2007.
July 2009
Fall 2007-Fall 2010
Fall 2006-Spring 2007
Career History & Accomplishments
Research Intern, Photoreceptor Coating Technology Group Xerox Corporation, Webster, NY
Summers 2005
& 2006
Research Intern, Center for Bio/Molecular Science and Engineering Naval Research Lab, Washington D.C.
Summer 2004