Embed Size (px)
Citation preview
Fabrication of Spheroidal Microparticles from Biodegradable
Polymers for Drug Delivery Applications
by
Michael J. Heslinga
A dissertation submitted in partial fulfillment
of the requirements for the degree of
Doctor of Philosophy
(Chemical Engineering)
in The University of Michigan
2012
Doctoral Committee:
Assistant Professor Lola Eniola-Adefeso, Chair
Professor J. Brian Fowlkes
Professor Erdogan Gulari
Professor Michael J. Solomon
ii
TABLE OF CONTENTS
LIST OF FIGURES ........................................................................................................... iv
LIST OF TABLES ............................................................................................................ vii
CHAPTER I Introduction ................................................................................................... 1
Motivation ....................................................................................................................... 1
Vascular targets ............................................................................................................... 4
Vascular-targeted drug carrier design ............................................................................. 7
A case for non-spherical particles ................................................................................. 11
Current methods for non-spherical polymer particle fabrication .................................. 14
CHAPTER II A novel fabrication of prolate spheroids from biodegradable polymers via
the oil-in-water emulsion solvent evaporation method ..................................................... 30
Introduction ................................................................................................................... 30
Materials and methods .................................................................................................. 33
Results and Discussion ................................................................................................. 35
Aqueous phase parameters ................................................................................... 35
Physical setup parameters .................................................................................... 40
Oil phase parameters ............................................................................................ 41
Polydispersity of fabricated microparticles .................................................................. 46
Summary ....................................................................................................................... 48
CHAPTER III Loading therapeutics into prolate spheroids made from biodegradable
polymers via the oil-in-water emulsion solvent evaporation technique ........................... 70
Introduction ................................................................................................................... 70
Experimental methods .................................................................................................. 74
Results and Discussion ................................................................................................. 75
Paclitaxel-loaded PLGA microparticles ............................................................... 75
Lovastatin-loaded PLGA Spheroids ..................................................................... 80
PLGA spheroids for imaging – loading 6-carboxyfluorescein (6-CF) ................. 81
Nanosphere-loaded spheroids ............................................................................... 84

iii
Summary ....................................................................................................................... 86
CHAPTER IV Loading protein therapeutics via the water-in-oil-in-water (W/O/W)
emulsion solvent evaporation technique ......................................................................... 104
Introduction ................................................................................................................. 104
Experimental methods ................................................................................................ 106
Results and Discussion ............................................................................................... 107
The effect of polyvinyl alcohol on bovine serum albumin-loaded PLGA particles
............................................................................................................................. 107
The effect of aqueous phase pH on bovine serum albumin-loaded PLGA particles
............................................................................................................................. 108
Summary ..................................................................................................................... 110
CHAPTER V Therapeutic release from loaded PLGA spheroids .................................. 117
Introduction ................................................................................................................. 117
Experimental methods ................................................................................................ 119
Results and Discussion ............................................................................................... 120
Release of paclitaxel from loaded PLGA spheres and spheroids ....................... 120
Release of 6-carboxyfluorescein from loaded PLGA spheres and spheroids .... 122
Summary ..................................................................................................................... 125
CHAPTER VI Major contributions and future work ...................................................... 132
Major contributions ..................................................................................................... 132
Predicting droplet deformation and breakup ............................................................... 134
Future work ................................................................................................................. 137
iv
LIST OF FIGURES
Figure
1.1: Normal and atherosclerotic arteries: deposits of plaque accumulate at the site of
injury on the inner lining of the artery due to uncontrolled chronic inflammation at that
site. .................................................................................................................................... 16
1.2: The leukocyte adhesion cascade showing the natural inflammation response to tissue
damage .............................................................................................................................. 17
1.3: Potential targets in atherosclerotic plaque lesions for imaging or delivery of
therapeutic treatments ....................................................................................................... 18
1.4: Soluble, polymer- and lipid-based particles proposed for use as drug delivery
carriers. .............................................................................................................................. 19
1.5: Adhesion of spherical polymer particles targeted to inflamed endothelial cells from
blood flow in a parallel plate flow chamber .................................................................... 20
1.6: Margination of nanospheres and microspheres to the endothelium from bulk blood
flow in medium-to-large blood vessels. ............................................................................ 21
2.1: Interfacial tension between water phases containing varied tris concentrations in
deionized water and oil phases containing dichloromethane. ........................................... 50
2.2: (A) Aspect ratio and (B) spheroid fraction of fabricated particles as functions of the
aqueous phase tris concentration for microparticles fabricated from polymer A. ............ 51
2.3: (A) Unloaded PLGA particles fabricated from the oil-in-water emulsion solvent
evaporation method made from polymer A. ..................................................................... 52
2.4: Aspect ratio of fabricated particles as a function of aqueous phase pH for
microparticles fabricated from polymer A. ....................................................................... 53
2.5: Spheroid fraction of fabricated particles as a function of aqueous phase pH for
microparticles fabricated from polymer A ........................................................................ 54
2.6: Kinematic viscosity of the aqueous phase as a function of PVA concentration ........ 55
2.7: (A) Aspect ratio, (B) spheroid fraction and (C) volume of fabricated particles as
functions of the aqueous phase PVA concentration for microparticles fabricated from
polymer A.. ....................................................................................................................... 56
2.8: (A) Aspect ratio, (B) spheroid fraction and (C) volume of fabricated particles as
functions of the stir rate for microparticles fabricated from polymer A. .......................... 57
v
2.9: (A) Aspect ratio, (B) spheroid fraction and (C) volume of fabricated particles as
functions of the oil phase fraction for microparticles fabricated from polymer A.. ......... 58
2.10: (A) Aspect ratio, (B) spheroid fraction and (C) volume of fabricated particles as
functions of PLGA polymer end group for microparticles fabricated from polymers A, H
& I (Table 2.1).. ................................................................................................................ 59
2.11: Aspect ratio and spheroid fraction as functions of stir rate for particles fabricated
from PLGA-PEG (polymer H, Table 2.1).. ...................................................................... 60
2.12: (A) Aspect ratio and (B) volume of fabricated particles as functions of the PLGA
polymer molecular weight for microparticles fabricated from polymers B-D (Table 2.1)
........................................................................................................................................... 61
2.13: (A) Aspect ratio and (B) spheroid fraction as functions of the PLGA concentration
in the oil phase for microparticles fabricated from polymers A.. ..................................... 62
2.14: (A) Aspect ratio and (B) volume as functions of mole percent lactic acid monomer
in the PLGA backbone for microparticles fabricated from polymers A, E, F & G (Table
2.1).. .................................................................................................................................. 63
2.15: (A) Aspect ratio, (B) spheroid fraction and (C) volume of fabricated particles as
functions of the acetone fraction in the oil phase for microparticles fabricated from
polymer A. PVA concentration = 1.0% w/V.. .................................................................. 64
2.16: (A) Volume and (B) aspect ratio polydispersity of fabricated particles as functions
of tris concentration in the aqueous phase for microparticles fabricated from polymer A.
PVA concentration = 2.0% w/V. Aqueous phase pH = 8.4. Stir rate = 1800 rpm ........... 65
3.1: Paclitaxel-loaded PLGA prolate spheroids fabricated using the oil-in-water emulsion
solvent evaporation technique. .......................................................................................... 88
3.2: (A) Aspect ratio, (B) spheroid fraction, (C) volume and (D) paclitaxel encapsulation
efficiency as functions of the aqueous phase tris concentration for microparticles
fabricated from polymer C (Table 2.1). ............................................................................ 89
3.3: (A) Aspect ratio, (B) spheroid fraction, (C) volume and (D) paclitaxel encapsulation
efficiency as functions of the aqueous phase pH for microparticles fabricated from
polymer C.......................................................................................................................... 90
3.4: (A) Aspect ratio, (B) spheroid fraction, (C) volume and (D) paclitaxel encapsulation
efficiency as functions of the aqueous phase PVA concentration for microparticles
fabricated from polymer C.. .............................................................................................. 91
3.5: (A) Aspect ratio, (B) spheroid fraction, (C) volume and (D) paclitaxel encapsulation
efficiency as functions of the acetone volume fraction in the oil phase for microparticles
fabricated from polymer C. ............................................................................................... 92
3.6: (A) Aspect ratio, (B) spheroid fraction, (C) volume and (D) paclitaxel encapsulation
efficiency as functions of the oil phase fraction for microparticles fabricated from
polymer C.......................................................................................................................... 93
3.7: Scanning electron microscopy image of lovastatin-loaded prolate spheroids
fabricated from PLGA polymer C using the oil-in-water emulsion solvent evaporation
technique. .......................................................................................................................... 94
vi
3.8: Molecular structure of 6-carboxyfluorescein (6CF) for different environment pH
values. The pK values of 6CF are 4.5 and 6.3.. ................................................................ 95
3.9: (A) Aspect ratio, (B) spheroid fraction, (C) volume and (D) 6-carboxyfluorescin
encapsulation efficiency as functions of the aqueous phase tris concentration for
microparticles fabricated from polymer C ........................................................................ 96
3.10: Confocal microscope images of 6-carboxyfluorescein-loaded spheres and rods. ... 97
3.11: Prolate spheroids loaded with 5 nm cadmium sulfide (CdS) fluorescent
nanoparticles made from PLGA polymer C using the oil-in-water emulsion solvent
evaporation system............................................................................................................ 99
4.1: Bovine serum albumin-loaded PLGA particles fabricated using the water-in-oil-in-
water (W/O/W) emulsion solvent evaporation technique. .............................................. 111
4.2: (A) Aspect ratio, (B) spheroid fraction, (C) volume and (D) encapsulation efficiency
as functions of the PVA concentration for microparticles fabricated from polymer C .. 112
4.3: (A) Aspect ratio, (B) spheroid fraction, (C) volume and (D) encapsulation efficiency
as functions of the aqueous phase pH for microparticles fabricated from polymer C .... 113
4.4: Bovine serum albumin isometric forms depend on environmental pH ................... 114
5.1: Diffusion-controlled release model based on Fick’s second Law from spheres and
spheroids of different aspect ratios. Spheres and spheroids have equivalent volumes.. . 126
5.2: Paclitaxel release from PLGA (polymer A, Table 2.1) prolate spheroids fabricated
from the oil-in-water emulsion solvent evaporation technique compared to a diffusion-
controlled release model. ................................................................................................ 127
5.3: Release of paclitaxel from PLGA (polymer C, Table 2.1) spheres and prolate
spheroids of the same volume and drug load manufactured using the oil-in-water
emulsion solvent evaporation method. ........................................................................... 128
5.4: Release of 6-carboxyfluorescein from PLGA (polymer C, Table 2.1) spheres and
prolate spheroids of the same volume and drug load manufactured using the oil-in-water
emulsion solvent evaporation method. ........................................................................... 129
vii
LIST OF TABLES
2.1: Poly(lactic-co-glycolide) polymers used in fabricating prolate spheroid particles.
Polymer A was purchased from Birmingham Polymer while all other polymers were
purchased from Lakeshore Biomaterials. ......................................................................... 49
2.2: Summary of the effects of fabrication parameters on volume and aspect ratio
polydispersity of unloaded particles fabricated using the oil-in-water emulsion solvent
evaporation technique. ...................................................................................................... 66
2.3: Summary of the effects of fabrication parameters on spheroid fraction, aspect ratio
and volume of unloaded particles fabricated using the oil-in-water emulsion solvent
evaporation technique Biomaterials. ................................................................................. 67
3.1: 6-carboxyfluorescein loading efficiencies of prolate spheroids and spheres made
from PLGA polymer C in the presence or absence of tris base. ....................................... 98
1
CHAPTER I
Introduction
Motivation
Cardiovascular diseases (CVDs) encompass a wide range of disorders affecting
the heart and blood vessels. CVDs are widely prevalent in all societies, particularly
western societies, and the costs associated with the treatment of these diseases continue to
climb; in the United States alone, the treatment of nearly fourteen million patients costs
nearly half a trillion dollars per annum [1]. These conditions include angina, arrhythmias,
atherosclerosis, cardiomyopathy, stroke, hypertension, myocarditis and pericarditis, but
the most serious cardiovascular disease is coronary artery disease (CAD), a narrowing of
the blood vessels supplying blood and oxygen to the heart stemming from plaque buildup
in atherosclerosis, that is responsible for about one sixth of deaths in the United States
[2]. Atherosclerosis involves a hardening of the arteries over time due to the buildup of
plaques consisting of fat, cholesterol, macrophages and other substances in blood vessel
walls. Atherosclerosis typically affects the medium-sized arteries throughout the heart,
neck, brain and kidneys; however, it can also be found in the aorta [3]. It occurs most
frequently in areas of turbulent blood flow that occurs near branching points on the
2
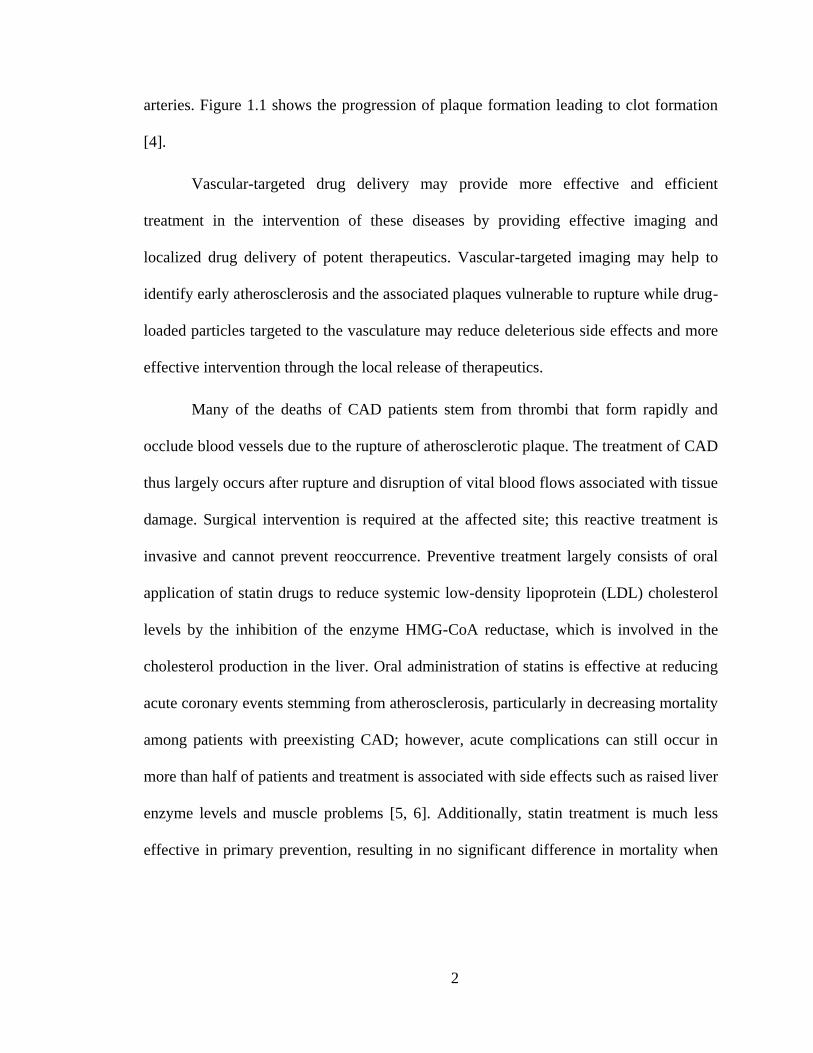
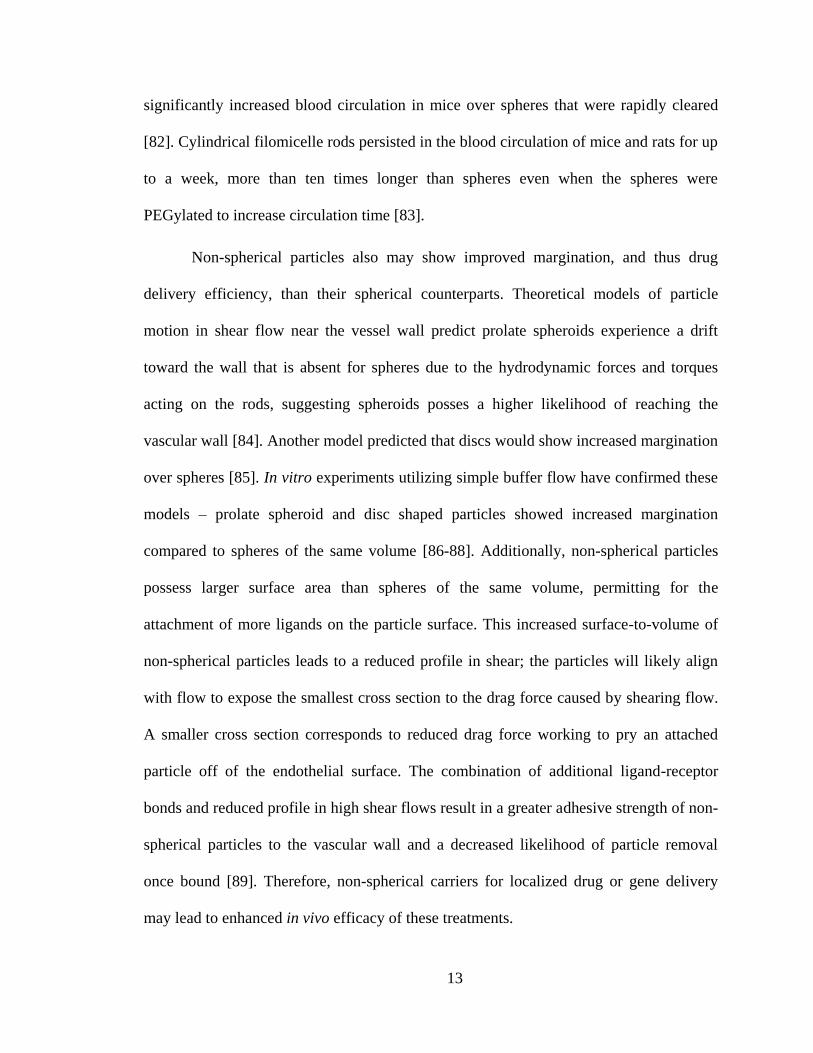
arteries. Figure 1.1 shows the progression of plaque formation leading to clot formation
[4].
Vascular-targeted drug delivery may provide more effective and efficient
treatment in the intervention of these diseases by providing effective imaging and
localized drug delivery of potent therapeutics. Vascular-targeted imaging may help to
identify early atherosclerosis and the associated plaques vulnerable to rupture while drug-
loaded particles targeted to the vasculature may reduce deleterious side effects and more
effective intervention through the local release of therapeutics.
Many of the deaths of CAD patients stem from thrombi that form rapidly and
occlude blood vessels due to the rupture of atherosclerotic plaque. The treatment of CAD
thus largely occurs after rupture and disruption of vital blood flows associated with tissue
damage. Surgical intervention is required at the affected site; this reactive treatment is
invasive and cannot prevent reoccurrence. Preventive treatment largely consists of oral
application of statin drugs to reduce systemic low-density lipoprotein (LDL) cholesterol
levels by the inhibition of the enzyme HMG-CoA reductase, which is involved in the
cholesterol production in the liver. Oral administration of statins is effective at reducing
acute coronary events stemming from atherosclerosis, particularly in decreasing mortality
among patients with preexisting CAD; however, acute complications can still occur in
more than half of patients and treatment is associated with side effects such as raised liver
enzyme levels and muscle problems [5, 6]. Additionally, statin treatment is much less
effective in primary prevention, resulting in no significant difference in mortality when
3
used in patients with no prior CAD [7]. Since 50%-70% of patients still experience acute
coronary complications while on statin drugs, there remains a need for more effective
treatment [6].
Identification of vulnerable plaque by traditional imaging methods such as X-ray
angiography and intravascular ultrasound can be difficult since it is often the case that
plaques that rupture cause less than half luminal narrowing and are thus non-stenotic [8-
12]. Visual differentiation between vulnerable and non-vulnerable plaque is not practical
via these traditional methods and requires more sophisticated imaging systems. The
development of imaging methods for early detection and subsequent treatment of
vulnerable plaques is necessary for improved treatment of cardiovascular diseases. Drug
carrier systems targeted to the vasculature may provide a means to identify and
effectively treat such diseased tissues, eliminating the need for invasive surgical
interventions.
Plaque formation and destabilization that lead to rupture are preceded by
physiochemical changes in the tissue. Identification of the presence of proteins associated
with these biological processes may allow doctors to discern which vulnerable non-
stenotic plaques are in danger of rupture, thus permitting preventive treatment of the
underlying plaque destabilization causes. Molecular imaging utilizes these proteins
associated with vulnerable plaque to detect early stage atherosclerosis, such as the
activity of matrix metalloproteinases involved in plaque destabilization [13-15].
Treatment can be localized to the plaques exhibiting such protein activity through the
active targeting of the proteins themselves, allowing specific plaque treatment and
increasing effectiveness while reducing adverse side effects [16].
4
Vascular targets
Targeted drug delivery carriers fall into two categories – passive and active
targeting. Passive targeting utilizes particle characteristics (eg. size or shape) in order to
find the endothelial target from flow, most typically using nanoparticles to pass through
the leaky endothelium that exists in the vasculature surrounding tumors [17, 18]. Active
targeting allows for greater specificity of treatment and consists of the attachment of
ligands to the carrier surface that is specific to a protein uniquely expressed on the
endothelial surface during the disease state [19-22]. The endothelial monolayer lines the
lumen of blood vessels throughout the body, serving as a barrier to selectively control
which materials pass between the blood and surrounding tissue. The endothelium plays a
vital role in the regulation of several biological processes including the clotting cascade,
angiogenesis and inflammation.
Inflammation is the normal process by which the body responds to tissue damage
or infection; it involves the recruitment of leukocytes from the bloodstream to the site of
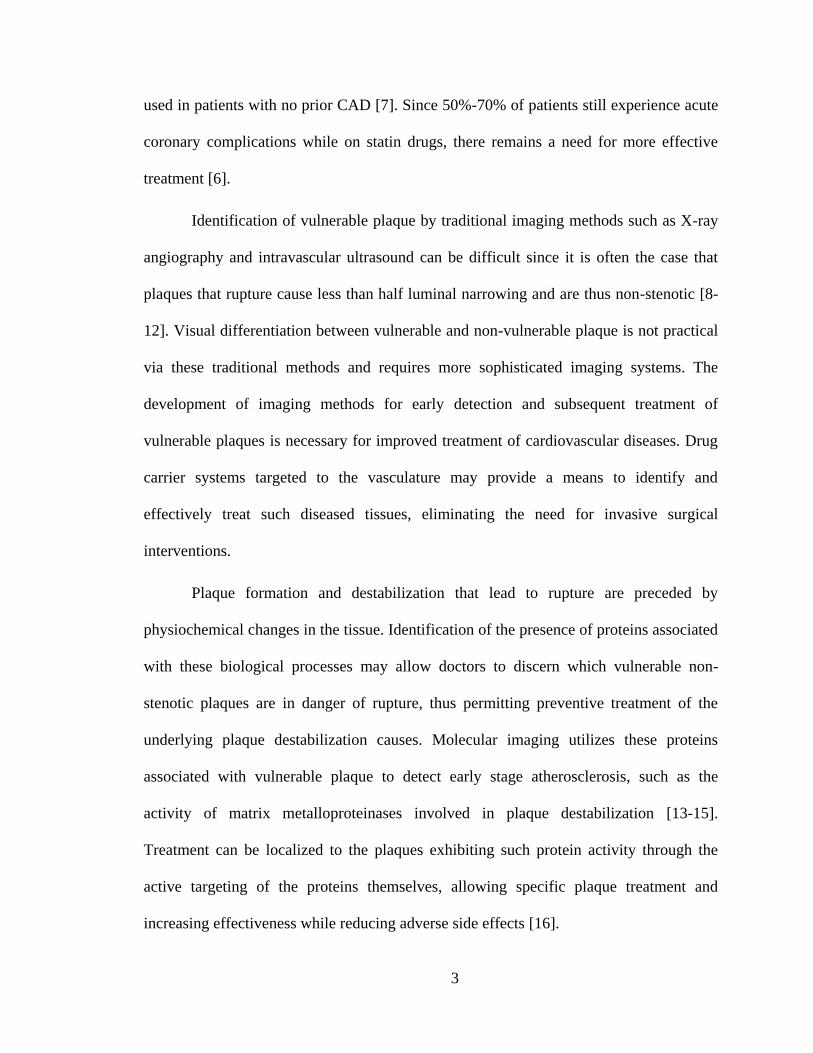
injury where they eliminate the source of inflammation. The leukocyte adhesion cascade,
outlined in Figure 1.2, is the mechanism by which leukocytes adhere to the endothelium
and work their way to site of damage [23]. White blood cells are recruited to the site of
injury through a cascade comprised of distinct steps: initial transient adhesion (rolling),
firm adhesion, diapedesis and migration into the tissue along a chemotactic gradient [24].
Rolling adhesion involves the interaction of endothelial-expressed E- and P-selectins with
their corresponding carbohydrate ligands on the leukocytes such as sialyl-Lewisx (sLex)
[25]. P-selectin is rapidly expressed in response to acute inflammation, while E-selectin is
expressed during chronic, or prolonged, inflammation. Leukocytes are activated during
5
rolling adhesion by cytokines released from the endothelium, leading to firm arrest which
occurs through activated integrins on the leukocyte binding to intercellular and vascular
cell adhesion molecules (I- and V-CAM-1) on the endothelial cells [26]. Once firmly
adherent, leukocytes migrate through the endothelium and underlying tissue to the site of
injury.
Inflammation is a normal, necessary body response to injury, but under certain
conditions a disruption of the shut-off mechanism can lead to the continuous expression
of inflammation molecules on the endothelium and the corresponding recruitment of
leukocytes. This chronic inflammation leads to the pathogenesis of several diseases,
including atherosclerosis [27]. The specific set of protein markers on the endothelium
responsible for the recruitment of white cells during chronic inflammation may be of use
for drug delivery. In particular, markers exhibited on endothelial cell surfaces during
chronic inflammation can be utilized as targets in the imaging and treatment of several
diseases due to the selectivity of markers and access to the tissue [28]. Drug carriers that
could mimic this behavior of leukocytes in the recruitment to chronically inflamed
endothelium might be made by coating their surfaces with ligands specific to chronic
inflammation. Such vascular targeting has been examined for several types of
cardiovascular inflammatory diseases where chronic inflammation is present [29-34].
The major stages of atherosclerosis include plaque initiation, growth and rupture
and chronic inflammation is expressed on the vascular endothelium at each stage of
atherosclerosis, causing it to be classified as an inflammatory disease [35]. Plaque
initiation is associated with the accumulation of LDL cholesterol in the intima of the
artery, causing chemical changes in the intima and resulting in the upregulation of
6
adhesion molecules on the endothelium (inflammation). This chronic inflammation
triggers the adhesion cascade of leukocyte, monocytes and T-cells to the vessel intima
where monocytes differentiate into macrophages, ingest LDL cholesterol and change into
foam cells [36]. Plaque growth is marked by the migration of basal smooth muscle cells
(SMCs) into the vessel intima where they form a protective fibrous cap over the lipid
core. This protective cap is weakened by inflammatory molecule secreted by entrapped
foam cells in the intima, reducing the SMC and increasing the recruitment of leukocytes
and, finally, resulting in the plaque rupture.
Chronic inflammation is expressed on the vascular endothelium at each stage of
atherosclerosis, making these endothelium-expressed molecules such as the selectins, the
leukocyte adhesion molecules ICAM-1 and VCAM-1, as well as vascular endothelial
growth factor viable targets for drug delivery [29-34]. Targeting the selectins is attractive
due to their very specific and well-understood expression in inflammation. Literature has
shown the ability of microspheres decorated with selectin antibodies to recognize
inflammation [37].
Fibrin clots formed on the atherosclerotic plaques when blood contacts exposed
tissue offer another means of targeting [38]. Other cells recruited into atherosclerotic
plaques such as monocytes, T-cells, and foam cells as well as materials including lipids,
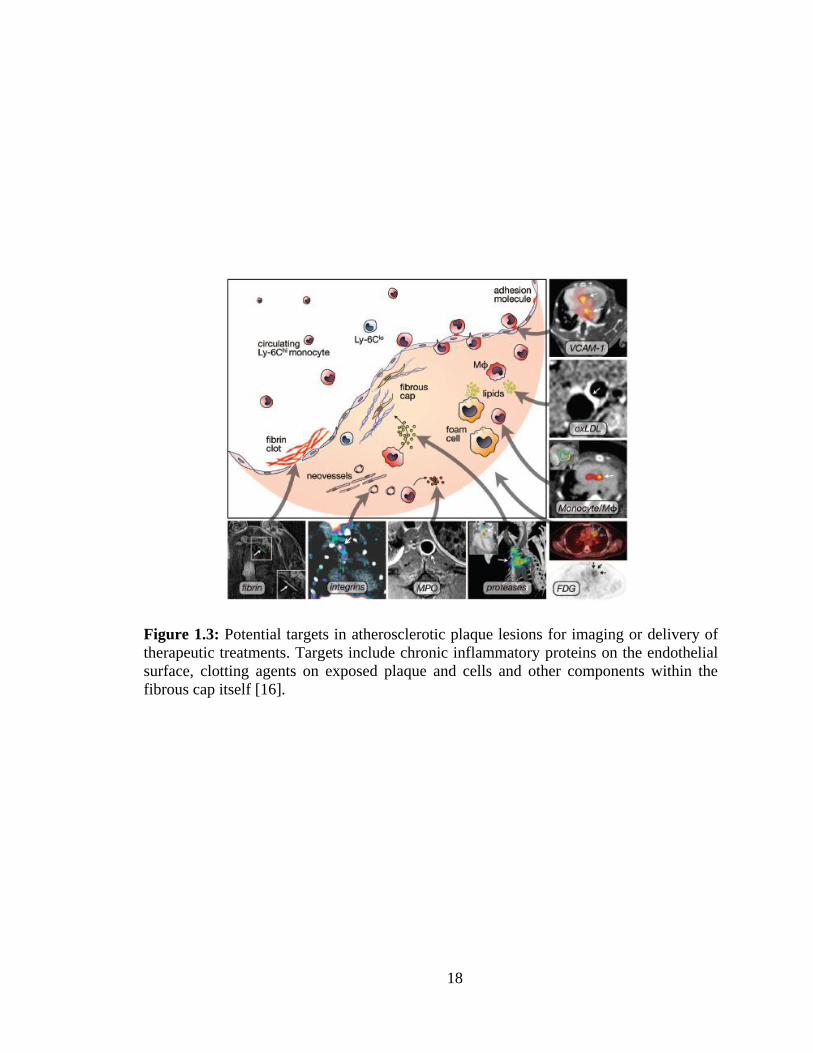
proteases and myeloperoxidase may also be considered as targets (Figure 1.3) [16]. The
presence of inflammation during atherosclerosis also provides a possible approach to
therapeutic intervention through localized delivery of anti-inflammatory drugs. For
example, animal models of atherosclerosis (ApoE- or LDLR-deficient) with added
deficiency in P- or E-selectin, I- or VCAM-1 have reduced plaque formation [39].
7
Additionally, there is evidence that the benefit to statin treatment is partially due to their
anti-inflammatory activity in addition to lowering cholesterol levels [40, 41].
Vascular-targeted drug delivery may offer better treatment of CAD, utilizing
highly potent therapeutics delivered at minimal system drug dosages due to the precise
targeting to the site of disease. This could provide a non-surgical alternate with an
opportunity for preventative treatment more effective than systemic statin therapy and
without its deleterious side effects. Several benefits to such therapy include decreased
health care costs due to smaller drug dosages and surgeries required, as well as decreased
mortality rates and improved quality of life for patients with CAD and other chronic
inflammatory diseases.
Vascular-targeted drug carrier design
The design of drug carriers for vascular-targeting must account for several factors
from particle material and size to targeting ligand attachment. In all cases, the goal of the
drug delivery system is to arrive at the intended target intact and facilitate the appropriate
release of therapeutic. Accordingly, there are three major capabilities required from any
designed system: (1) efficient encapsulation of therapeutics, (2) efficient localization and
binding to the intended site with protection of loaded cargo and (3) suitable, effective
drug release once in place. The efficiency of drug carrier localization to diseased tissue is
paramount, particularly for highly potent therapeutics that may cause adverse side effects
in systemic circulation. Carriers must navigate through the dense cell population in the
bloodstream to the cell-free layer near the endothelial wall, avoiding immune clearance
along the way, and attach to the endothelium at the appropriate location. Blood

8
hemodynamics and the natural immune system clearance of foreign particles tend to
decrease the circulation time and decrease successful interactions with the vascular wall.
Drug carriers must avoid rapid immune clearance in order to increase blood
circulation time and consequent binding efficiency to the endothelium. Synthesizing
vectors that can avoid immune clearance is a challenge as foreign particles are rapidly
removed from blood circulation. One approach often utilized is the modification of the
carrier surface through the addition of ligands, such as PEG, that mask the particles from
immune clearance [42, 43].
Design considerations that impact the effectiveness of these drug vectors include
the fabrication material, particle size and shape, and modification of particle surface with
ligands both for targeting and increasing blood circulation times. Biocompatible materials
must be utilized in the formation of drug carriers such that vectors do not trigger immune
cascades in the bloodstream, adversely affect contacted blood components and must be
ultimately removable through degradation by the body. Vectors for drug delivery have
utilized several classes of materials including soluble proteins, viruses, lipids, inorganic
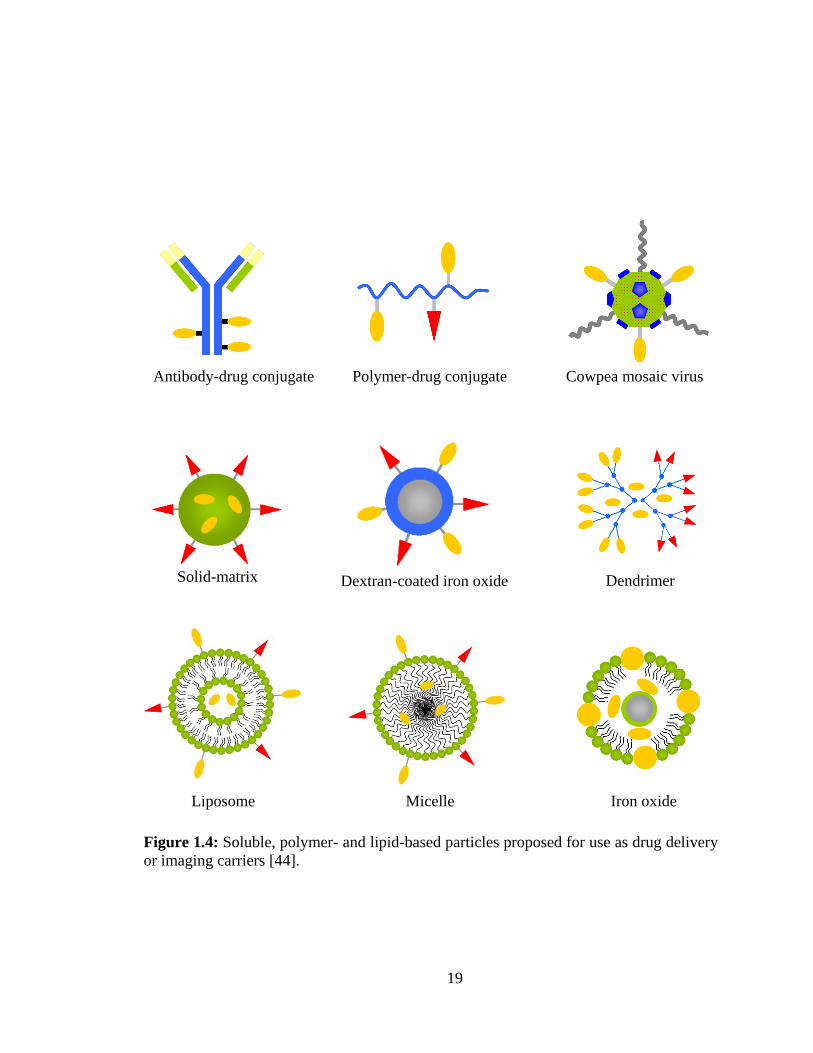
molecules and polymers (Figure 1.4) [44]. Each type of particle has its own advantages
and drawbacks for drug loading, drug release, interaction with blood components and
ultimate fate within the body.
Soluble carriers include several classes of small molecules including antibodies,
biopolymers such as chitosan and dextran, and modified plasma proteins. For example,
albumin has been conjugated to therapeutics or contrast agents such as gadolinium for
use with MRI [45]. Soluble carriers are desirable for their ability to exit the bloodstream
and enter the surrounding tissues, yet they are limited in their loading capacity and
9
require covalent linkage to therapeutics, possibly altering drug efficiency and exposing
bound therapeutics directly to the bloodstream. Therefore, their use may be limited to
gene delivery or imaging applications.
Altered viral particles are attractive as drug delivery carriers in their natural
ability to avoid clearance from the bloodstream, their innate targeting ability and in that
they can enter cells. Viruses such as the cowpea mosaic virus have potential for use in
vascular targeting due to their specific binding to vimentin, which is present on the
endothelium during the neovascularization of the vasa vasorum in atherosclerosis, and
have been shown to bind to inflamed endothelial cells [46-48]. The addition of secondary
molecules has been explored as well to permit their use for other targets [49]. Viral drug
carriers require complex design due to the need for genetic engineering and growth in
bioreactors in order for them to gain desired functionality and reduce potential toxicity.
Lipid-based vectors including liposomes, lipoproteins and micelles have been
widely proposed as drug delivery and imaging carriers. Liposomes are attractive in their
ease of fabrication, low toxicity and versatility in the wide range of therapeutics that can
be loaded into them. Contrast agents can be incorporated into the liposome; for example
perfluorocarbons have been entrapped within the core of a lipid shell containing
gadolinium for imaging. This paramagnetic nanoemulsion was used for the MRI imaging
of atherosclerotic plaques; a similar nanoemulsion has been utilized for ultrasound-based
molecular imaging [15, 50, 51]. A disadvantage to liquid nanoemulsions is the
incompressibility of the liquid core, which requires a large concentration of the emulsion
in order to produce the required image contrast. Gas-filled cores are more echogenic due
to their compressibility which may mitigate this issue. Indeed, gas- and liquid-filled

10
liposomes have been utilized in ultrasound-based imaging targeting adhesion molecules
and fibrin [52, 53]. Additionally, ultrasound may be used to trigger the release of
entrapped agents from echogenic liposomes, allowing their use in targeted drug delivery
in image-guided therapy [54-56]. Lipoproteins and micelles are limited to hydrophobic
drugs and their drug loading is difficult relative to other materials. Synthetic high density
lipoproteins (HDL) may be decorated with contrast agents such as gadolinium and
targeted to HDL receptors, for example on macrophages entrapped in plaques [57].
Additionally, iron oxide can be entrapped within an HDL core for use with MRI imaging
[58]. Micelles include multifunctional complexes with polymers with the attachment of
targeting ligands or contrast agents for imaging [38].
Several inorganic materials have been fashioned into particles for drug delivery
including gold, silver, silicon, carbon and iron oxides. For example, iron oxide particles
coated with polymer have been explored for MRI imaging of cardiovascular systems [59,
60]. These particles are potentially imaged via both magnetic resonance and x-ray,
allowing for the overlapping of images and providing detailed information about the
tissue. Achieving desired loading and release profiles from these particles is difficult,
however, requiring the tuning of fabricated pore sizes to achieve the desired release
profile.
Polymer particles including solid matrix particles, polymersomes and dendrimers
have been widely proposed for targeted drug delivery due to their flexibility in materials,
particle size and particle shape. Several biodegradable polymers have been utilized to this
end, including poly(lactide), poly(glycolide), their copolymer poly(lactide-co-glycolide),
poly(caprolactone) and poly(ethylene glycol). Polymersomes are made from amphipathic

11
polymers with polar and non-polar ends like the structure of liposomes. They are
attractive as they maintain membrane flexibility like liposomes, yet they maintain their
membrane integrity. Dendrimers are tiny polymers branched outwards in successive
generations that have been proposed as targeted drug delivery and imaging carriers [45,
61]. Dendrimers have the drawbacks of low loading capacity and toxicity when used in
high concentrations; therefore may be only suited for gene delivery or imaging
applications [62-64].
Solid matrix polymer particles are perhaps the most versatile of carriers due to
their flexibility in particle size and shape, as well as available biodegradable polymers.
The surface of these particles can be decorated with a wide variety of targeting ligands
and contrast agents with large loading capacities for therapeutics incorporated into the
matrix [65]. One disadvantage to some of these biodegradable polymers is the acidic
environment they create upon degradation that may damage loaded drug; however, this
acidic environment may be improved with the co-encapsulation of trehalose or poorly
soluble bases [66-68]. Overall, particles made from biodegradable polymers seem to offer
the most flexibility in size and shape, as well as loadable therapeutics and contrast agents.
A case for non-spherical particles
Spherical particles made from biodegradable polymers ranging in size from the
nanometer to micron size range have been proposed as drug carriers due to their ease of
fabrication [69-75]. Increasingly, however, there is evidence that spherical carriers may
not be efficient at targeting the blood vessel wall and that non-spherical particles may be
more effective as targeted drug delivery carriers. Limited works in literature address the
12
role of particle size and shape on the effectiveness of carrier localization to the vessel
wall from blood flow.
Nanospheres are attractive as carriers due to the likelihood that they will avoid
immune clearance compared to micron-sized carriers. However, recent literature has
shown that nanospheres display minimal margination (localization and binding)
compared to micron-sized spheres to endothelial cells from blood flows representative of
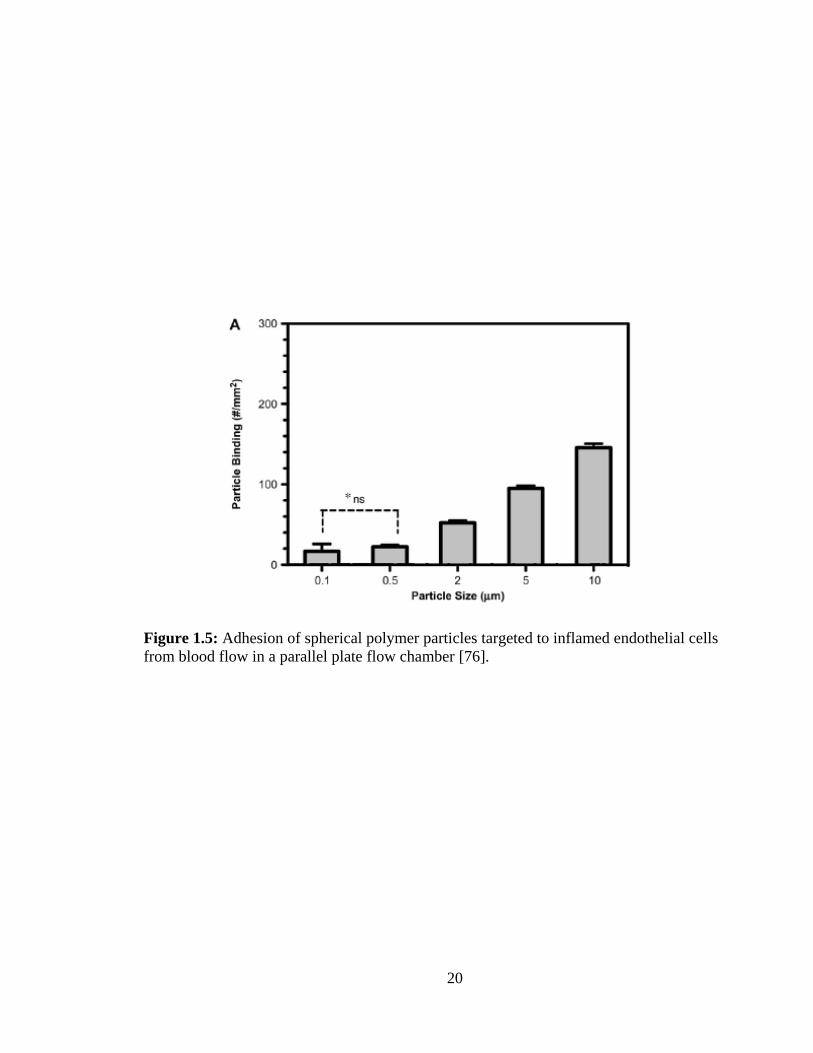
medium to large blood vessels relevant in atherosclerosis (Figure1.5) [76, 77]. This may
be due to the fact that spheres smaller than two microns have difficulty navigating to the
vessel wall because of their interactions with red blood cells while larger particles might
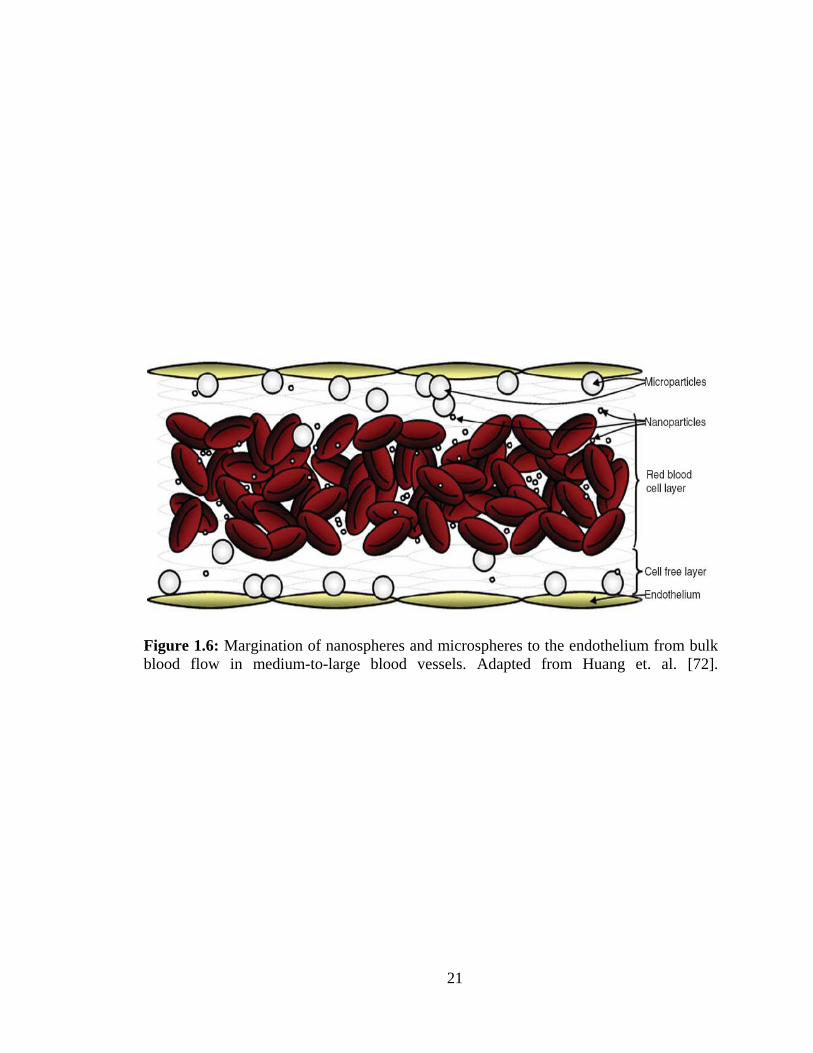
be excluded to a red blood cell-free layer near the vessel wall (Figure 1.6) [72, 77, 78].
On the other hand, microspheres are readily internalized by macrophages and cleared
from circulation [79]. Additionally, the smaller human capillaries are on the order of five
microns in diameter; occlusion of these vessels by rigid particles may render larger
microspheres impractical for use as drug delivery carriers.
Since nanospheres are inefficient at marginating to the vessel wall in blood flow
and microspheres are readily cleared, there is a need for deviation from spherical shape in
the design of optimum drug carriers. Non-spherical geometries may provide advantages
in immune clearance and margination to the endothelium. Macrophages quickly
internalize spheres up to fifteen microns in diameter, yet are unable to phagocytose
prolate spheroids when attacking along the major axis of the rod [80]. Long, worm-like
spheroids were shown to be internalized up to twenty times less by macrophages than
spheres of the same volume [81]. In vivo studies have also shown benefits of non-
spherical particles in avoiding immune clearance; disk-shaped carriers showed
13
significantly increased blood circulation in mice over spheres that were rapidly cleared
[82]. Cylindrical filomicelle rods persisted in the blood circulation of mice and rats for up
to a week, more than ten times longer than spheres even when the spheres were
PEGylated to increase circulation time [83].
Non-spherical particles also may show improved margination, and thus drug
delivery efficiency, than their spherical counterparts. Theoretical models of particle
motion in shear flow near the vessel wall predict prolate spheroids experience a drift
toward the wall that is absent for spheres due to the hydrodynamic forces and torques
acting on the rods, suggesting spheroids posses a higher likelihood of reaching the
vascular wall [84]. Another model predicted that discs would show increased margination
over spheres [85]. In vitro experiments utilizing simple buffer flow have confirmed these
models – prolate spheroid and disc shaped particles showed increased margination
compared to spheres of the same volume [86-88]. Additionally, non-spherical particles
possess larger surface area than spheres of the same volume, permitting for the
attachment of more ligands on the particle surface. This increased surface-to-volume of
non-spherical particles leads to a reduced profile in shear; the particles will likely align
with flow to expose the smallest cross section to the drag force caused by shearing flow.
A smaller cross section corresponds to reduced drag force working to pry an attached
particle off of the endothelial surface. The combination of additional ligand-receptor
bonds and reduced profile in high shear flows result in a greater adhesive strength of non-
spherical particles to the vascular wall and a decreased likelihood of particle removal
once bound [89]. Therefore, non-spherical carriers for localized drug or gene delivery
may lead to enhanced in vivo efficacy of these treatments.
14
Current methods for non-spherical polymer particle fabrication
Increasing interest in utilizing non-spherical particles as injectable drug carriers
highlights a need for practical methods of fabricating such particles from biocompatible
polymers efficiently loaded with a wide range of therapeutics. A number of methods have
recently emerged in the literature for fabricating non-spherical particles, each with
advantages and drawbacks. One method involves the stretching of prefabricated spheres
within a polymer film, requiring monodisperse feedstock spheres, but producing equally
monodisperse particles in several possible non-spherical shapes [90]. However, the heat
or solvent required to soften precursor spheres may lead to leaching or degradation of
loaded therapeutics and the stretching procedure is not easily scalable. Template-based
methods, including imprint lithography and hydrogel templates, offer great flexibility in
particle shape; however, these methods are complex in setup and require exposure to
solvents to separate particles from their molds, possibly leaching their loads [91, 92].
Electrohydrodynamic co-spinning can create polymer cylinders with several
compartments, permitting the utilization of multiple drugs, polymers and even surface
ligands [93]. Nevertheless, this method is complex in setup and produces long fibers that
must be sectioned cryogenically, using intense sonication and washing to separate the
particles, possibly leaking drug loads. The sectioning process is also limited in the
dimension of each cut, constraining produced particle length to the order of a few
microns. Microfluidic devices generate monodisperse non-spherical particles, but are
difficult to scale up and as yet have not shown the ability to load a variety therapeutics
[94, 95].
15
There is a clear need for a method to fabricate non-spherical drug carriers from
biodegradable polymers that is simple in setup and operation to allow for quick access to
prolate spheroid particles. Additionally, the fabrication method needs to be adaptable to a
wide variety of biodegradable polymers and therapeutics, as well as allowing the efficient
attachment of ligands for targeting and avoiding blood clearance. Oil-in-water emulsion
solvent evaporation (O/W ESE) fabrication techniques are advantageous in their
inexpensive, simple setup and operation, have been reported for a wide range of
therapeutics and biodegradable polymers, are easy to scale up (yielding a sufficient
particle mass), and provide favorable surface characteristics for ligand attachment [96-
98]. Utilizing knowledge of droplet deformation in such mechanically mixed emulsions,
it was possible to utilize this technique to fabricate prolate spheroids from biodegradable
poly(lactic-co-glycolic acid) (PLGA) polymers. Specifically, manipulation of droplet
dynamics and the diffusion process during the emulsification and solidification phases of
particle formation was used to form stretched particles for use in drug delivery
applications.
16
Figure 1.1: Normal and atherosclerotic arteries: deposits of plaque accumulate at the site
of injury on the inner lining of the artery due to uncontrolled chronic inflammation at that
site. As these plaques grow and harden, they may occlude blood flow or break off and
cause a clot leading to infarct, stroke or embolism [4].

17
Figure 1.2: The leukocyte adhesion cascade showing the natural inflammation response
to tissue damage. Proteins specific to inflammation such as the selectins and ICAM-1
decorate the surface of the endothelium near the site of injury, capturing passing
leukocytes from the bloodstream and directing them into the tissue [23].
18
Figure 1.3: Potential targets in atherosclerotic plaque lesions for imaging or delivery of
therapeutic treatments. Targets include chronic inflammatory proteins on the endothelial
surface, clotting agents on exposed plaque and cells and other components within the
fibrous cap itself [16].
19
Figure 1.4: Soluble, polymer- and lipid-based particles proposed for use as drug delivery
or imaging carriers [44].
Polymer-drug conjugate Antibody-drug conjugate
Dextran-coated iron oxide Dendrimer
Micelle Iron oxide
HDL
Cowpea mosaic virus
Liposome
Solid-matrix
20
Figure 1.5: Adhesion of spherical polymer particles targeted to inflamed endothelial cells
from blood flow in a parallel plate flow chamber [76].
21
Figure 1.6: Margination of nanospheres and microspheres to the endothelium from bulk
blood flow in medium-to-large blood vessels. Adapted from Huang et. al. [72].
22
References
[1] D. Lloyd-Jones, R.J. Adams, T.M. Brown, M. Carnethon, S. Dai, G. De Simone,
T.B. Ferguson, E. Ford, K. Furie, C. Gillespie, A. Go, K. Greenlund, N. Haase, S.
Hailpern, P.M. Ho, V. Howard, B. Kissela, S. Kittner, D. Lackland, L. Lisabeth,
A. Marelli, M.M. McDermott, J. Meigs, D. Mozaffarian, M. Mussolino, G.
Nichol, V.L. Roger, W. Rosamond, R. Sacco, P. Sorlie, T. Thom, S. Wasserthiel-
Smoller, N.D. Wong, J. Wylie-Rosett, Heart disease and stroke statistics--2010
update: a report from the American Heart Association. Circulation 121(7) e46-
e215.
[2] D.L. Hoyert, H.C. Kung, B.L. Smith, Deaths: preliminary data for 2003. Natl
Vital Stat Rep 53(15) (2005) 1-48.
[3] D. Weisenberg, Y. Sahar, G. Sahar, Y. Shapira, Z. Iakobishvili, B.A. Vidne, A.
Sagie, Atherosclerosis of the aorta is common in patients with severe aortic
stenosis: an intraoperative transesophageal echocardiographic study. J Thorac
Cardiovasc Surg 130(1) (2005) 29-32.
[4] N. NHLBI, What Is Atherosclerosis? , Vol. 2011, NIH Heart, Lung and Blood
Institute, 2011.
[5] A.M. Gotto, Jr., Risks and benefits of continued aggressive statin therapy. Clin
Cardiol 26(4 Suppl 3) (2003) III3-12.
[6] P. Libby, M. Aikawa, Stabilization of atherosclerotic plaques: new mechanisms
and clinical targets. Nat Med 8(11) (2002) 1257-1262.
[7] K.K. Ray, S.R. Seshasai, S. Erqou, P. Sever, J.W. Jukema, I. Ford, N. Sattar,
Statins and all-cause mortality in high-risk primary prevention: a meta-analysis of
11 randomized controlled trials involving 65,229 participants. Arch Intern Med
170(12) 1024-1031.
[8] J.A. Ambrose, M.A. Tannenbaum, D. Alexopoulos, C.E. Hjemdahl-Monsen, J.
Leavy, M. Weiss, S. Borrico, R. Gorlin, V. Fuster, Angiographic progression of
coronary artery disease and the development of myocardial infarction. J Am Coll
Cardiol 12(1) (1988) 56-62.
[9] J.A. Ambrose, S.L. Winters, R.R. Arora, J.I. Haft, J. Goldstein, K.P. Rentrop, R.
Gorlin, V. Fuster, Coronary angiographic morphology in myocardial infarction: a
link between the pathogenesis of unstable angina and myocardial infarction. J Am
Coll Cardiol 6(6) (1985) 1233-1238.
[10] E. Falk, P.K. Shah, V. Fuster, Coronary plaque disruption. Circulation 92(3)
(1995) 657-671.
[11] D. Giroud, J.M. Li, P. Urban, B. Meier, W. Rutishauer, Relation of the site of
acute myocardial infarction to the most severe coronary arterial stenosis at prior
angiography. Am J Cardiol 69(8) (1992) 729-732.
[12] D. Hackett, G. Davies, A. Maseri, Pre-existing coronary stenoses in patients with
first myocardial infarction are not necessarily severe. Eur Heart J 9(12) (1988)
1317-1323.

23
[13] V. Amirbekian, J.G. Aguinaldo, S. Amirbekian, F. Hyafil, E. Vucic, M. Sirol,
D.B. Weinreb, S. Le Greneur, E. Lancelot, C. Corot, E.A. Fisher, Z.S. Galis, Z.A.
Fayad, Atherosclerosis and matrix metalloproteinases: experimental molecular
MR imaging in vivo. Radiology 251(2) (2009) 429-438.
[14] J. Chen, C.H. Tung, J.R. Allport, S. Chen, R. Weissleder, P.L. Huang, Near-
infrared fluorescent imaging of matrix metalloproteinase activity after myocardial
infarction. Circulation 111(14) (2005) 1800-1805.
[15] P.M. Winter, A.M. Morawski, S.D. Caruthers, R.W. Fuhrhop, H. Zhang, T.A.
Williams, J.S. Allen, E.K. Lacy, J.D. Robertson, G.M. Lanza, S.A. Wickline,
Molecular imaging of angiogenesis in early-stage atherosclerosis with
alpha(v)beta3-integrin-targeted nanoparticles. Circulation 108(18) (2003) 2270-
2274.
[16] F. Leuschner, M. Nahrendorf, Molecular imaging of coronary atherosclerosis and
myocardial infarction: considerations for the bench and perspectives for the clinic.
Circ Res 108(5) 593-606.
[17] G. Kaul, M. Amiji, Tumor-targeted gene delivery using poly(ethylene glycol)-
modified gelatin nanoparticles: in vitro and in vivo studies. Pharm Res 22(6)
(2005) 951-961.
[18] F. Yuan, M. Dellian, D. Fukumura, M. Leunig, D.A. Berk, V.P. Torchilin, R.K.
Jain, Vascular permeability in a human tumor xenograft: molecular size
dependence and cutoff size. Cancer Res 55(17) (1995) 3752-3756.
[19] M.V. Backer, T.I. Gaynutdinov, V. Patel, A.K. Bandyopadhyaya, B.T.
Thirumamagal, W. Tjarks, R.F. Barth, K. Claffey, J.M. Backer, Vascular
endothelial growth factor selectively targets boronated dendrimers to tumor
vasculature. Mol Cancer Ther 4(9) (2005) 1423-1429.
[20] J.D. Byrne, T. Betancourt, L. Brannon-Peppas, Active targeting schemes for
nanoparticle systems in cancer therapeutics. Adv Drug Deliv Rev 60(15) (2008)
1615-1626.
[21] A.O. Eniola, E.F. Krasik, L.A. Smith, G. Song, D.A. Hammer, I-domain of
lymphocyte function-associated antigen-1 mediates rolling of polystyrene
particles on ICAM-1 under flow. Biophys J 89(5) (2005) 3577-3588.
[22] A.O. Eniola, S.D. Rodgers, D.A. Hammer, Characterization of biodegradable
drug delivery vehicles with the adhesive properties of leukocytes. Biomaterials
23(10) (2002) 2167-2177.
[23] C. Janeway, P. Travers, M. Walport, M. Shlomchik, Immunobiology, Garland
Science, New York, 2004.
[24] B.A. Imhof, M. Aurrand-Lions, Adhesion mechanisms regulating the migration of
monocytes. Nat Rev Immunol 4(6) (2004) 432-444.
[25] S.D. Rodgers, R.T. Camphausen, D.A. Hammer, Sialyl Lewis(x)-mediated,
PSGL-1-independent rolling adhesion on P-selectin. Biophys J 79(2) (2000) 694-
706.
[26] A. Peled, V. Grabovsky, L. Habler, J. Sandbank, F. Arenzana-Seisdedos, I. Petit,
H. Ben-Hur, T. Lapidot, R. Alon, The chemokine SDF-1 stimulates integrin-
24
mediated arrest of CD34(+) cells on vascular endothelium under shear flow. J
Clin Invest 104(9) (1999) 1199-1211.
[27] P. Libby, P.M. Ridker, G.K. Hansson, Inflammation in atherosclerosis: from
pathophysiology to practice. J Am Coll Cardiol 54(23) (2009) 2129-2138.
[28] J.S. Pober, W.C. Sessa, Evolving functions of endothelial cells in inflammation.
Nat Rev Immunol 7(10) (2007) 803-815.
[29] M. Aikawa, P. Libby, The vulnerable atherosclerotic plaque: pathogenesis and
therapeutic approach. Cardiovasc Pathol 13(3) (2004) 125-138.
[30] R.A. Brekken, P.E. Thorpe, Vascular endothelial growth factor and vascular
targeting of solid tumors. Anticancer Res 21(6B) (2001) 4221-4229.
[31] J.M. Kiely, M.I. Cybulsky, F.W. Luscinskas, M.A. Gimbrone, Jr.,
Immunoselective targeting of an anti-thrombin agent to the surface of cytokine-
activated vascular endothelial cells. Arterioscler Thromb Vasc Biol 15(8) (1995)
1211-1218.
[32] A. Omolola Eniola, D.A. Hammer, In vitro characterization of leukocyte mimetic
for targeting therapeutics to the endothelium using two receptors. Biomaterials
26(34) (2005) 7136-7144.
[33] D. Ribatti, A. Vacca, Novel therapeutic approaches targeting vascular endothelial
growth factor and its receptors in haematological malignancies. Curr Cancer Drug
Targets 5(8) (2005) 573-578.
[34] G. Molema, Drug targeting: Organ-specific Strategies, WILEY-VCH, Weinheim,
Germany, 2001.
[35] R. Ross, Atherosclerosis--an inflammatory disease. N Engl J Med 340(2) (1999)
115-126.
[36] D. Siegel-Axel, K. Daub, P. Seizer, S. Lindemann, M. Gawaz, Platelet lipoprotein
interplay: trigger of foam cell formation and driver of atherosclerosis. Cardiovasc
Res 78(1) (2008) 8-17.
[37] J.B. Dickerson, J.E. Blackwell, J.J. Ou, V.R. Shinde Patil, D.J. Goetz, Limited
adhesion of biodegradable microspheres to E- and P-selectin under flow.
Biotechnol Bioeng 73(6) (2001) 500-509.
[38] D. Peters, M. Kastantin, V.R. Kotamraju, P.P. Karmali, K. Gujraty, M. Tirrell, E.
Ruoslahti, Targeting atherosclerosis by using modular, multifunctional micelles.
Proc Natl Acad Sci U S A 106(24) (2009) 9815-9819.
[39] B.A. Kaufmann, C.L. Carr, J.T. Belcik, A. Xie, Q. Yue, S. Chadderdon, E.S.
Caplan, J. Khangura, S. Bullens, S. Bunting, J.R. Lindner, Molecular imaging of
the initial inflammatory response in atherosclerosis: implications for early
detection of disease. Arterioscler Thromb Vasc Biol 30(1) 54-59.
[40] S.F. Chen, T.H. Hung, C.C. Chen, K.H. Lin, Y.N. Huang, H.C. Tsai, J.Y. Wang,
Lovastatin improves histological and functional outcomes and reduces
inflammation after experimental traumatic brain injury. Life Sci 81(4) (2007)
288-298.
25
[41] R. Lin, J. Liu, N. Peng, G. Yang, W. Gan, W. Wang, Lovastatin reduces nuclear
factor kappaB activation induced by C-reactive protein in human vascular
endothelial cells. Biol Pharm Bull 28(9) (2005) 1630-1634.
[42] M.L. Schipper, G. Iyer, A.L. Koh, Z. Cheng, Y. Ebenstein, A. Aharoni, S. Keren,
L.A. Bentolila, J. Li, J. Rao, X. Chen, U. Banin, A.M. Wu, R. Sinclair, S. Weiss,
S.S. Gambhir, Particle size, surface coating, and PEGylation influence the
biodistribution of quantum dots in living mice. Small 5(1) (2009) 126-134.
[43] J.K. Gbadamosi, A.C. Hunter, S.M. Moghimi, PEGylation of microspheres
generates a heterogeneous population of particles with differential surface
characteristics and biological performance. FEBS Lett 532(3) (2002) 338-344.
[44] M. Heslinga, T. Porter, O. Eniola-Adefeso, Design of nanovectors for therapy and
imaging of cardiovascular diseases. Methodist DeBakey Cardiovascular (In print).
[45] K. Nwe, D. Milenic, L.H. Bryant, C.A. Regino, M.W. Brechbiel, Preparation,
characterization and in vivo assessment of Gd-albumin and Gd-dendrimer
conjugates as intravascular contrast-enhancing agents for MRI. J Inorg Biochem
105(5) 722-727.
[46] M.K. Jones, R.M. Itani, H. Wang, M. Tomikawa, I.J. Sarfeh, S. Szabo, A.S.
Tarnawski, Activation of VEGF and Ras genes in gastric mucosa during
angiogenic response to ethanol injury. Am J Physiol 276(6 Pt 1) (1999) G1345-
1355.
[47] K.J. Koudelka, G. Destito, E.M. Plummer, S.A. Trauger, G. Siuzdak, M.
Manchester, Endothelial targeting of cowpea mosaic virus (CPMV) via surface
vimentin. PLoS Pathog 5(5) (2009) e1000417.
[48] L.P. Shriver, K.J. Koudelka, M. Manchester, Viral nanoparticles associate with
regions of inflammation and blood brain barrier disruption during CNS infection.
J Neuroimmunol 211(1-2) (2009) 66-72.
[49] N.F. Steinmetz, M. Manchester, PEGylated viral nanoparticles for biomedicine:
the impact of PEG chain length on VNP cell interactions in vitro and ex vivo.
Biomacromolecules 10(4) (2009) 784-792.
[50] G.M. Lanza, K.D. Wallace, S.E. Fischer, D.H. Christy, M.J. Scott, R.L. Trousil,
W.P. Cacheris, J.G. Miller, P.J. Gaffney, S.A. Wickline, High-frequency
ultrasonic detection of thrombi with a targeted contrast system. Ultrasound Med
Biol 23(6) (1997) 863-870.
[51] P.M. Winter, S.D. Caruthers, X. Yu, S.K. Song, J. Chen, B. Miller, J.W. Bulte,
J.D. Robertson, P.J. Gaffney, S.A. Wickline, G.M. Lanza, Improved molecular
imaging contrast agent for detection of human thrombus. Magn Reson Med 50(2)
(2003) 411-416.
[52] S.M. Demos, H. Alkan-Onyuksel, B.J. Kane, K. Ramani, A. Nagaraj, R. Greene,
M. Klegerman, D.D. McPherson, In vivo targeting of acoustically reflective
liposomes for intravascular and transvascular ultrasonic enhancement. J Am Coll
Cardiol 33(3) (1999) 867-875.
26
[53] A.J. Hamilton, S.L. Huang, D. Warnick, M. Rabbat, B. Kane, A. Nagaraj, M.
Klegerman, D.D. McPherson, Intravascular ultrasound molecular imaging of
atheroma components in vivo. J Am Coll Cardiol 43(3) (2004) 453-460.
[54] S.T. Laing, M. Moody, B. Smulevitz, H. Kim, P. Kee, S. Huang, C.K. Holland,
D.D. McPherson, Ultrasound-enhanced thrombolytic effect of tissue plasminogen
activator-loaded echogenic liposomes in an in vivo rabbit aorta thrombus model--
brief report. Arterioscler Thromb Vasc Biol 31(6) 1357-1359.
[55] G.J. Shaw, J.M. Meunier, S.L. Huang, C.J. Lindsell, D.D. McPherson, C.K.
Holland, Ultrasound-enhanced thrombolysis with tPA-loaded echogenic
liposomes. Thromb Res 124(3) (2009) 306-310.
[56] S.D. Tiukinhoy-Laing, S. Huang, M. Klegerman, C.K. Holland, D.D. McPherson,
Ultrasound-facilitated thrombolysis using tissue-plasminogen activator-loaded
echogenic liposomes. Thromb Res 119(6) (2007) 777-784.
[57] D.P. Cormode, R. Chandrasekar, A. Delshad, K.C. Briley-Saebo, C. Calcagno, A.
Barazza, W.J. Mulder, E.A. Fisher, Z.A. Fayad, Comparison of synthetic high
density lipoprotein (HDL) contrast agents for MR imaging of atherosclerosis.
Bioconjug Chem 20(5) (2009) 937-943.
[58] T. Skajaa, D.P. Cormode, P.A. Jarzyna, A. Delshad, C. Blachford, A. Barazza,
E.A. Fisher, R.E. Gordon, Z.A. Fayad, W.J. Mulder, The biological properties of
iron oxide core high-density lipoprotein in experimental atherosclerosis.
Biomaterials 32(1) 206-213.
[59] N.K. Devaraj, E.J. Keliher, G.M. Thurber, M. Nahrendorf, R. Weissleder, 18F
labeled nanoparticles for in vivo PET-CT imaging. Bioconjug Chem 20(2) (2009)
397-401.
[60] M. Nahrendorf, P. Waterman, G. Thurber, K. Groves, M. Rajopadhye, P. Panizzi,
B. Marinelli, E. Aikawa, M.J. Pittet, F.K. Swirski, R. Weissleder, Hybrid in vivo
FMT-CT imaging of protease activity in atherosclerosis with customized
nanosensors. Arterioscler Thromb Vasc Biol 29(10) (2009) 1444-1451.
[61] S.M. Janib, A.S. Moses, J.A. MacKay, Imaging and drug delivery using
theranostic nanoparticles. Adv Drug Deliv Rev 62(11) 1052-1063.
[62] R. Duncan, L. Izzo, Dendrimer biocompatibility and toxicity. Adv Drug Deliv
Rev 57(15) (2005) 2215-2237.
[63] C.U. Herborn, J. Barkhausen, I. Paetsch, P. Hunold, M. Mahler, K. Shamsi, E.
Nagel, Coronary arteries: contrast-enhanced MR imaging with SH L 643A--
experience in 12 volunteers. Radiology 229(1) (2003) 217-223.
[64] S. Theoharis, U. Krueger, P.H. Tan, D.O. Haskard, M. Weber, A.J. George,
Targeting gene delivery to activated vascular endothelium using anti E/P-Selectin
antibody linked to PAMAM dendrimers. J Immunol Methods 343(2) (2009) 79-
90.
[65] N.K. Varde, D.W. Pack, Microspheres for controlled release drug delivery. Expert
Opin Biol Ther 4(1) (2004) 35-51.
27
[66] H.R. Costantino, L. Firouzabadian, C. Wu, K.G. Carrasquillo, K. Griebenow, S.E.
Zale, M.A. Tracy, Protein spray freeze drying. 2. Effect of formulation variables
on particle size and stability. J Pharm Sci 91(2) (2002) 388-395.
[67] T. Estey, J. Kang, S.P. Schwendeman, J.F. Carpenter, BSA degradation under
acidic conditions: a model for protein instability during release from PLGA
delivery systems. J Pharm Sci 95(7) (2006) 1626-1639.
[68] G. Zhu, S.R. Mallery, S.P. Schwendeman, Stabilization of proteins encapsulated
in injectable poly (lactide- co-glycolide). Nat Biotechnol 18(1) (2000) 52-57.
[69] M.D. Bhavsar, M.M. Amiji, Development of novel biodegradable polymeric
nanoparticles-in-microsphere formulation for local plasmid DNA delivery in the
gastrointestinal tract. AAPS PharmSciTech 9(1) (2008) 288-294.
[70] E. Fattal, C. Vauthier, I. Aynie, Y. Nakada, G. Lambert, C. Malvy, P. Couvreur,
Biodegradable polyalkylcyanoacrylate nanoparticles for the delivery of
oligonucleotides. J Control Release 53(1-3) (1998) 137-143.
[71] S. Giovagnoli, P. Blasi, M. Ricci, A. Schoubben, L. Perioli, C. Rossi,
Physicochemical characterization and release mechanism of a novel prednisone
biodegradable microsphere formulation. J Pharm Sci 97(1) (2008) 303-317.
[72] R.B. Huang, S. Mocherla, M.J. Heslinga, P. Charoenphol, O. Eniola-Adefeso,
Dynamic and cellular interactions of nanoparticles in vascular-targeted drug
delivery (review). Mol Membr Biol 27(4-6) 190-205.
[73] D.H. Kempen, L. Lu, C. Kim, X. Zhu, W.J. Dhert, B.L. Currier, M.J. Yaszemski,
Controlled drug release from a novel injectable biodegradable
microsphere/scaffold composite based on poly(propylene fumarate). J Biomed
Mater Res A 77(1) (2006) 103-111.
[74] A. Muvaffak, I. Gurhan, U. Gunduz, N. Hasirci, Preparation and characterization
of a biodegradable drug targeting system for anticancer drug delivery:
microsphere-antibody conjugate. J Drug Target 13(3) (2005) 151-159.
[75] Q. Wang, T. Uno, Y. Miyamoto, Y. Hara, Y. Kitazawa, F.Z. Lu, N. Funeshima,
M. Fujino, H. Yamamoto, H. Takenaka, Y. Kawashima, X.K. Li, Biodegradable
microsphere-loaded tacrolimus enhanced the effect on mice islet allograft and
reduced the adverse effect on insulin secretion. Am J Transplant 4(5) (2004) 721-
727.
[76] P. Charoenphol, R.B. Huang, O. Eniola-Adefeso, Potential role of size and
hemodynamics in the efficacy of vascular-targeted spherical drug carriers.
Biomaterials 31(6) 1392-1402.
[77] P. Charoenphol, S. Mocherla, D. Bouis, K. Namdee, D.J. Pinsky, O. Eniola-
Adefeso, Targeting therapeutics to the vascular wall in atherosclerosis--carrier
size matters. Atherosclerosis 217(2) 364-370.
[78] E.C. Eckstein, A.W. Tilles, F.J. Millero, 3rd, Conditions for the occurrence of
large near-wall excesses of small particles during blood flow. Microvasc Res
36(1) (1988) 31-39.
[79] J.A. Champion, A. Walker, S. Mitragotri, Role of particle size in phagocytosis of
polymeric microspheres. Pharm Res 25(8) (2008) 1815-1821.
28
[80] J.A. Champion, S. Mitragotri, Role of target geometry in phagocytosis. Proc Natl
Acad Sci U S A 103(13) (2006) 4930-4934.
[81] J.A. Champion, S. Mitragotri, Shape induced inhibition of phagocytosis of
polymer particles. Pharm Res 26(1) (2009) 244-249.
[82] S. Muro, C. Garnacho, J.A. Champion, J. Leferovich, C. Gajewski, E.H.
Schuchman, S. Mitragotri, V.R. Muzykantov, Control of endothelial targeting and
intracellular delivery of therapeutic enzymes by modulating the size and shape of
ICAM-1-targeted carriers. Mol Ther 16(8) (2008) 1450-1458.
[83] Y. Geng, P. Dalhaimer, S. Cai, R. Tsai, M. Tewari, T. Minko, D.E. Discher,
Shape effects of filaments versus spherical particles in flow and drug delivery.
Nat Nanotechnol 2(4) (2007) 249-255.
[84] E. Gavze, M. Shapiro, Motion of inertial spheroidal particles in a shear flow near
a solid wall with special application to aerosol transport in microgravity. J. Fluid
Mech 371 (1998) 59-79.
[85] S.Y. Lee, M. Ferrari, P. Decuzzi, Shaping nano-/micro-particles for enhanced
vascular interaction in laminar flows. Nanotechnology 20(49) (2009) 495101.
[86] P. Decuzzi, R. Pasqualini, W. Arap, M. Ferrari, Intravascular delivery of
particulate systems: does geometry really matter? Pharm Res 26(1) (2009) 235-
243.
[87] N. Doshi, B. Prabhakarpandian, A. Rea-Ramsey, K. Pant, S. Sundaram, S.
Mitragotri, Flow and adhesion of drug carriers in blood vessels depend on their
shape: a study using model synthetic microvascular networks. J Control Release
146(2) 196-200.
[88] F. Gentile, C. Chiappini, D. Fine, R.C. Bhavane, M.S. Peluccio, M.M. Cheng, X.
Liu, M. Ferrari, P. Decuzzi, The effect of shape on the margination dynamics of
non-neutrally buoyant particles in two-dimensional shear flows. J Biomech 41(10)
(2008) 2312-2318.
[89] P. Decuzzi, M. Ferrari, The adhesive strength of non-spherical particles mediated
by specific interactions. Biomaterials 27(30) (2006) 5307-5314.
[90] J.A. Champion, Y.K. Katare, S. Mitragotri, Making polymeric micro- and
nanoparticles of complex shapes. Proc Natl Acad Sci U S A 104(29) (2007)
11901-11904.
[91] G. Acharya, C.S. Shin, M. McDermott, H. Mishra, H. Park, I.C. Kwon, K. Park,
The hydrogel template method for fabrication of homogeneous
nano/microparticles. J Control Release 141(3) 314-319.
[92] S.E. Gratton, P.D. Pohlhaus, J. Lee, J. Guo, M.J. Cho, J.M. Desimone,
Nanofabricated particles for engineered drug therapies: a preliminary
biodistribution study of PRINT nanoparticles. J Control Release 121(1-2) (2007)
10-18.
[93] S. Bhaskar, J. Hitt, S.W. Chang, J. Lahann, Multicompartmental microcylinders.
Angew Chem Int Ed Engl 48(25) (2009) 4589-4593.
29
[94] R. Haghgooie, M. Toner, P.S. Doyle, Squishy non-spherical hydrogel
microparticles. Macromol Rapid Commun 31(2) 128-134.
[95] S. Xu, Z. Nie, M. Seo, P. Lewis, E. Kumacheva, H.A. Stone, P. Garstecki, D.B.
Weibel, I. Gitlin, G.M. Whitesides, Generation of monodisperse particles by using
microfluidics: control over size, shape, and composition. Angew Chem Int Ed
Engl 44(5) (2005) 724-728.
[96] A.O. Eniola, D.A. Hammer, Artificial polymeric cells for targeted drug delivery. J
Control Release 87(1-3) (2003) 15-22.
[97] S. Freitas, H.P. Merkle, B. Gander, Microencapsulation by solvent
extraction/evaporation: reviewing the state of the art of microsphere preparation
process technology. J Control Release 102(2) (2005) 313-332.
[98] J.W. McGinity, P.B. O'Donnell, Preparation of microspheres by the solvent
evaporation technique. Adv Drug Deliv Rev 28(1) (1997) 25-42.
30
CHAPTER II
A novel fabrication of prolate spheroids from biodegradable polymers
via the oil-in-water emulsion solvent evaporation method
Introduction
Oil-in-water emulsion solvent evaporation techniques employ mechanical mixing
to create an emulsion consisting of oil droplets (the dispersed phase) within an aqueous
phase (the continuous phase) in the presence of an emulsifying agent that stabilizes
formed droplets. The shear forces imparted by the impeller cause the dispersion of the oil
phase into droplets coated with the surfactant at the interface between the phases. Within
O/W emulsions, the oil phase contains polymer that the particles will be formed from
along with therapeutics to be encapsulated dissolved in an organic solvent that has
limited solubility in water. The aqueous phase contains the emulsifier, often a surface
active agent (surfactant) that coats the oil droplets, providing thermodynamic stability.
Particle formation in mechanically mixed emulsions can be divided into three
stages: (1) droplet formation (emulsification), (2) solvent removal (solidification) and (3)
drying. The solvent removal, or solidification, stage is the critical stage for
controlling particle size and shape within such emulsions and can be further broken down
into three states: (i) solvent, (ii) gel and (iii) glass. In the emulsification, or droplet

31
formation, stage, the mechanical shear forces disperse the oil phase into droplets that
break into smaller droplets and coalesce into larger droplets as they bump into each other,
eventually reaching an equilibrium and characteristic size for the emulsion. The
solidification stage involves the diffusion of the organic solvent, which is often volatile,
into the surrounding aqueous phase. During the solvent removal stage, the oil droplet is in
either a solvent, gel or glass state. In the solvent state, the oil droplet largely consists of
the organic solvent with dissolved polymer and drug. The solvent diffuses from the oil
phase into the continuous phase, leaving the polymer behind; after a significant portion of
the solvent has diffused into the continuous phase, the polymer-rich oil phase is in a
deformable, semisolid state containing a mix of polymer and solvent. Once enough
solvent has diffused out of the droplet, the remaining polymer is in a glass state that can
no longer change in size or shape. Removal of any residual solvent in the newly formed
polymer particle occurs in the drying stage.
Deformation and/or breakup of the droplets from a spherical shape into a
stretched spheroid or smaller sphere occur depending on the conditions of the
mechanically stirred emulsion. The continuous and oil phases can be manipulated such
that high-shear stirring during the solvent and gel states of solvent removal causes
deformation of the oil droplets from spheres to prolate spheroids that remain as solvent
diffusion solidifies the particles into glass states that retain their stretched character and
will not relax into spheres. The deformation and breakup of the oil droplets can be
characterized by two dimensionless numbers: (1) the viscosity ratio, a ratio of the droplet
phase viscosity to that of the continuous phase:

32
s
dM
Eqn. (2.1)
where ηd is the droplet phase viscosity and ηs is the continuous phase viscosity,
and (2) the capillary number, a ratio of viscous forces pulling the droplet apart to
capillary forces holding the droplet together:
aCa s
Eqn. (2.2)
where γ is the shear rate, ηs is the viscosity of the continuous phase, a is the
droplet size and Γ is the interfacial tension between the droplet and the continuous phases
[1]. Typically, a low viscosity ratio and high capillary number (high viscous forces or low
interfacial tension forces) result in conditions that favor droplet deformation. Low
viscosity ratios (M«1) favor large droplet deformation (large aspect ratios) before
breakup, intermediate viscosity ratios (M~1) lead to less deformation prior to breakup
and high viscosity ratios (M>4) allow for minimal droplet deformation and breakup.
Increasing the capillary number results in increased deformation up to the point of droplet
breakup at the critical capillary number for a given viscosity ratio [1].
Prolate spheroids can be produced using this O/W ESE for a certain range of
viscosity ratios and capillary numbers. If the right conditions exist during the
emulsification and solidification stages, oil droplets stretched by the viscous shear forces
will facilitate faster diffusion of the organic solvent into the continuous phase, solidify
the droplets faster and lock them in a stretched conformation. Spheroids (unloaded and
drug loaded) can be fabricated at a high rate of up to 109 particles per hour (per 50 mg
batch of PLGA polymer) using the O/W ESE through the manipulation of the viscosity
33
ratio and capillary number via variation of components the aqueous and oil phases as well
as the physical setup of the system.
Aqueous phase parameters varied included surfactant (polyvinyl alcohol)
concentration, the addition of tris(hydroxymethyl)aminomethane (tris) to reduce
interfacial tension and the aqueous phase pH through the addition of hydrochloric acid or
sodium hydroxide. The physical setup of the system was modified by varying mechanical
stir rate and oil-to-aqueous phase volume ratio. For all experiments, the reactor vessel,
temperature, agitator diameter and position, and the reaction volume remained constant.
Several characteristics of the oil phase were varied including the addition of co-solvents,
the concentration of dissolved polymer and PLGA polymer characteristics including
molecular weight, co-monomer ratio and end group.
Materials and methods
Microparticle fabrication
Microparticles were fabricated from PLGA polymer via the oil-in-water emulsion
solvent evaporation method as previously described [2, 3] with high surfactant
concentration and the presence of tris base. PLGA polymer was dissolved in
dichloromethane to form the oil phase. The relevant characteristics of the different types
of PLGA polymers utilized are summarized in Table 2.1. The aqueous phase consisted of
the surfactant polyvinyl alcohol (MW 30,000 – 70,000) with the surface-active molecule
tris base dissolved in deionized water and maintained at a constant pH via titration with
either hydrochloric acid or sodium hydroxide. The oil phase containing the polymer was
injected into the aqueous phase under continuous stirring using a Lightnin’ mixer (model
L1U08F) fitted with a glass propeller (Beckman Coulter – shaft diameter = 2.8 cm). The
34
resultant mechanically mixed emulsion was stirred for a minimum of one hour in order to
facilitate solvent removal via evaporation. The resulting microparticles were collected via
centrifugation at 750 rpm and washed three times with deionized water prior to freeze-
drying in a Labconco lyophilizer. The resultant particulate powder was stored at -20°C
until use.
Unless otherwise stated, the following base conditions were present during the
fabrication process: 50 mg PLGA polymer (polymer A – Table 2.1) were dissolved in 10
ml dichloromethane to form the oil phase. The aqueous phase consisted of deionized
water at pH 8.4 (titrated with hydrochloric acid) with 1.0% w/V PVA and 1.2% w/V tris.
The 10 ml oil phase was injected over thirty seconds into 100 ml of the aqueous phase
while stirred at 1800 rpm for one hour. This composition permitted the formation of
stretchable oil droplets and solvent evaporation necessary for droplets to solidify in the
stretched conformation.
Microparticle characterization
The physical characteristics including size and shape of fabricated microparticles
were studied using a Nikon TE 2000-S optical microscope and a Philips XL30FEG
scanning electron microscope (SEM). Samples were prepared for light and scanning
electron microscopy by suspending powdered (freeze-dried) microparticles in deionized
water and pipetting the suspension onto either a microscope slide or double-sided carbon
tape affixed to an SEM stub. The particle suspension was air-dried on the SEM stub and
subsequently gold-coated using a SPI-Module sputter coater prior to analysis via SEM.
Particle sizes and aspect ratios were obtained from light and scanning electron
microscopy via Metamorph analysis software. All data is reported as an average of a

35
minimum of three fabrication batches with standard error between batches. Significance
in data between different process variables was assessed using all data points obtained
through multiple batches via student’s t-test and one-way Anova with post-test. A p value
of 0.05 was considered significant.
Results and Discussion
Aqueous phase parameters
Tris(hydroxymethyl)aminomethane (tris base) concentration in the aqueous phase
Tris(hydroxymethyl)aminomethane is a base often used as a pH buffer,
particularly in biochemistry due to its buffer range (pH 7-9) coinciding with
physiological pH [4]. Herein it is used both as a pH buffer and to decrease the interfacial
tension between the discontinuous and continuous phases. Polyvinyl alcohol was utilized
as the surfactant in this system in order to stabilize the emulsion; however, without the
presence of tris base in the aqueous phase, only spheres were produced regardless of
PVA concentration. A small concentration (0.3% w/V) of tris base considerably reduced
interfacial tension between the oil and aqueous phases as is shown in Figure 2.1,
significantly increasing the capillary number for a given viscosity ratio and providing the
environment needed for droplet deformation. Further addition of tris base up to a
concentration of 4.0% w/V resulted in a further reduction of interfacial tension; however,
the effect diminished as tris concentration increased.
The effect of tris base concentration ranging from 0.3% to 2.0% w/V in the
aqueous phase on particle size and shape was studied at a constant PVA concentration of
2.0% w/V. All other process parameters did not vary from the base conditions. Increasing
tris concentration resulted in decreased droplet deformation (aspect ratio) and spheroid
36
fraction as shown in Figure 2.2; however, particle volume was unchanged. As the
concentration of tris base increased from 0.3% to 2.0% w/V, the spheroid fraction
decreased from 90% to 42% and the particle aspect ratio decreased from 7.2 to 3.9. At a
decreased PVA concentration (1.0% w/V), the spheroid fraction remained high (greater
than 90%) for greater tris concentrations (up to 1.2% w/V), but still decreased to 60%
with 2.0% w/V tris base.
Particles fabricated in the presence of at least 1.0% w/V tris base displayed
smooth surface characteristics for all PVA concentrations tested while those fabricated in
low tris base (<1.0% w/V) and high PVA concentrations (>1.2% w/V) aqueous buffers
displayed a rough surface morphology (Figure 2.3). PVA is the system surfactant that
provides droplet stability, yet without tris base in the buffer, only spheres were produced
regardless of PVA concentration. Tris base is not a surfactant, but provides the interfacial
environment required for droplet deformation to occur through the hydrophilic groups of
the tris molecule (Figure 2.3) that interact with the hydrophilic end groups of the polymer
chain in the oil phase to decrease interfacial tension [5]. High concentrations of PVA at a
given tris base concentration seem to diminish the interfacial effect of tris base, perhaps
by occupying the interface and crowding out tris, blocking its effect.
The reduction of droplet deformation with increased tris concentration is likely
the result of the increased electrolytes due to the increased hydrochloric acid (HCl)
concentration required to maintain the aqueous buffer pH at 8.4 with increasing tris base.
Increased electrolytes in the aqueous phase decrease the concentration of PVA at the
phase interface and decrease the solubility of the oil phase in the water phase [5]. This
hypothesis was tested through variation of HCl concentration; particles were fabricated at
37
2.0% w/V tris base concentration with no pH adjustment (pH 9.7) and with half HCl
concentration (pH 9.1). Particle aspect ratio and spheroid fraction increased significantly
with decreased HCl concentration as shown in Figure 2.4, confirming the hypothesis.
Aqueous phase pH
The aqueous phase pH, controlled by the addition of acid or base, is of interest
due to its influence on the interfacial effect of tris base and its potential impacts on drug
encapsulation. In order to study the potential effect of aqueous phase pH on the physical
characteristics of fabricated particles, the aqueous buffer pH was varied between 5.0 and
10.0 for buffers containing 1.0%, 1.8% and 2.5% w/V PVA concentrations at a fixed tris
base concentration of 1.2% w/V by the addition of hydrochloric acid. At the most acidic
pH tested (5.0), no spheroidal particles were formed – only spheres were produced. As
the aqueous phase pH increased from 5.0 to 8.4, the fraction of produced particles that
were spheroids increased as shown in Figure 2.5; likewise, the elongation (aspect ratio)
of the spheroid particles increased significantly for all PVA concentrations examined.
Further increase in pH beyond 8.4 up to 10.0 did not significantly alter spheroid fraction
or aspect ratio.
Spheroidal particles are preferentially produced at basic pH at constant PVA and
tris concentrations; this is likely due to the effects of decreased interfacial tension (and
thus increased capillary number) at higher aqueous phase pH, either through tris or PVA.
Since the pK of tris is about 8.1, buffer pH below this value will result in the lone
electron pair on the tris base amine group being largely protonated, possibly reducing the
interaction between tris and the polymer end groups in the oil phase. Additionally,
polyvinyl alcohol has been shown to have lower interfacial tension at higher pH [6, 7]

38
and the pH of the aqueous phase in emulsion solvent evaporation fabrication techniques
can impact the loading of therapeutics [8, 9].
Polyvinyl alcohol concentration in the aqueous phase
Polyvinyl alcohol is the surfactant used to emulsify the oil phase within the
aqueous phase, working to stabilize the oil droplets and cause their deformation.
Additionally, PVA concentration can be used to manipulate the viscosity of the aqueous
phase such that PVA plays a dual role in this system as both a surfactant and a means to
influence buffer viscosity. PVA concentrations were varied from 0.3% to 4.0% w/V,
resulting in an increase in buffer viscosity from 1.1 to 5.5 millipascal-seconds (mPa-s) as
measured by a Cannon-Fenske viscometer (size 50) and shown in Figure 2.6.
PVA concentrations between 0.3% and 4% w/V in the aqueous phase were
examined at constant tris base concentration (1.2% w/V), pH (8.4), stir rate (1800 rpm),
polymer concentration (5 mg/ml) and oil phase fraction (0.09). As shown in Figure 2.7,
increasing PVA concentration up to 1.0% w/V resulted in larger droplet deformation
(aspect ratio) and a larger fraction of spheroids as expected due to the increase in aqueous
phase viscosity. There was no significant difference in spheroid fraction (>95%) or aspect
ratio (~7) for PVA concentrations between 1.0% and 2.0% w/V, while further increase in
PVA beyond 2.0% w/V resulted in a smaller spheroid fraction and reduced aspect ratios
corresponding to reduced droplet deformation.
Increasing the concentration of PVA served a dual role through the corresponding
increase in aqueous phase viscosity and as the system surfactant. First, the high viscosity
of the continuous aqueous phase slowed the oil solvent removal rate via diffusion,
allowing the droplet to persist in the gel phase long enough for droplet deformation.
39
Second, an increased continuous phase viscosity directly lowers the viscosity ratio and
increases the capillary number, favoring droplet deformation and, ultimately, forming
spheroidal particles.
This decrease in droplet deformation and fraction spheroids beyond 2.0% w/V
PVA is due to competing effects of increasing buffer viscosity: (1) increased shear forces
acting on the oil droplets due to increased viscosity that favor droplet deformation
through decreased viscosity ratio and increased capillary number and (2) smaller initial
oil droplet diameters formed during emulsification that resist deformation through a
decreased capillary number. A critical capillary number exists for a given viscosity ratio
such that increased viscous forces beyond this results in droplet breakup, producing
smaller droplets that resist deformation [1]. This decrease in particle volume with PVA
concentration, a direct result of smaller droplet diameter, is shown in Figure 2.7. The
consistent aspect ratio and spheroid particle fraction seen between 1.0% and 2.0% w/V
PVA is due to a balance between these competing effects of decreasing droplet size and
increasing shearing forces. Beyond 2.0% w/V PVA the smaller droplet size begins to
dominate and this results in decreased droplet deformation, as observed in the average
aspect ratio as well as decreased spheroid fraction due to the droplets falling below the
critical droplet diameter required for stretching at constant interfacial tension.
Additionally, it is likely that the reduced droplet deformation and low spheroid fraction
observed at high PVA concentrations is a result of the PVA interfering with the
interfacial effect of the tris base. PVA acts as a surfactant and although it is necessary for
droplet stability and stretching, the presence of tris base in the aqueous phase is necessary
for the fabrication of spheroids.
40
Physical setup parameters
Mechanical stir speed
The mechanical stir speed in a stirred emulsion proportionally affects the shear
rate, increasing the viscous shear forces acting on the oil droplets. The effect of
mechanical stir speed on particle size and shape was studied at 1200 and 1800 rpm for
aqueous phases containing 0.3%, 1.0%, 2.5% and 4.0% w/V PVA concentrations and
base conditions for other process parameters. The volume of fabricated particles
decreased at the faster stir rate for each PVA concentration as shown in Figure 2.8. In
general, particle elongation decreased with increasing stir rate. Spheroid fraction
decreased with increasing stir rate at all PVA concentrations except 1.0% w/V where
there was no difference in spheroid fraction. Likewise, spheroid aspect ratio decreased
with increasing stir rate for all PVA concentrations apart from 2.5% w/V where aspect
ratio was not significantly different.
The impacts of shear rate on the size of the oil droplets and resultant particles
have been widely studied in the literature – increasing stir rate results in decreased
particle size as particle breakup increases with increasing shear [10-13]. In this
mechanically mixed oil-in-water emulsion solvent evaporation system, however, the
effects of shear rate on not only droplet size but droplet deformation as well were
unknown since increased shear increases the capillary number (Eqn. 2.2) and increased
capillary number results in both increased droplet deformation and droplet breakup,
which precludes further elongation.
Droplet breakup due to increased shear forces (and increased capillary number) at
the higher stir rate was the dominant effect at all PVA concentrations studied. The larger
41
oil droplets produced during initial emulsification at lower stir speeds allowed for greater
droplet deformation in the solvent removal phase. While stir speeds greater than 1800
rpm were not studied due to equipment limitations, it is likely that the system would
move further towards spherical particles due to the larger initial droplet breakup in the
emulsification phase.
Oil-to-Aqueous Volume Ratio
The ratio of oil phase volume to aqueous phase volume has been shown to modify
the average particle volume in mechanically mixed emulsions due to the increase in
solution viscosity with increasing droplet phase volumes [14]. The effect of the phase
volume ratio was studied for oil phase volume fractions between 0.045 and 0.182 on the
resultant particle shape and size at a constant fabrication volume (sum of the oil and
aqueous volumes) of 110 ml. An increase in the oil phase volume fraction resulted in a
corresponding decrease in the particle volume as shown in Figure 2.9. However, droplet
deformation as measured by fraction spheroids and aspect ratio showed no significant
difference with increasing oil phase volume fraction. An increase in solution viscosity
with increasing oil phase fraction leads to greater shear forces on the particles; in the
range of volume ratios studied, the larger shear forces increasing the capillary number led
to droplet breakup rather than further droplet deformation, similar to the effect seen with
increasing PVA concentration and stir speed.
Oil phase parameters
PLGA polymer chain end group
Polymer chains terminate in end groups that have large effects on the
characteristics of the polymer as a whole [15-17]. Varying polymer end group impacts
42
polymer behavior not only in the fabrication of polymeric particles, but also on their
characteristics in their application whether in vitro or in vivo; additionally, they offer
opportunities for the chemical addition to the polymer post particle fabrication, such as
the addition of ligands for use in targeted drug delivery. PLGA polymer with three
different end groups: carboxylic acid (PLGA-acid), poly(ethylene-glycol) (PLGA-PEG)
and ester (PLGA-ester) (polymers A, H and I, respectively, Table 2.1), were utilized to
study the effects that polymer end group have on fabricated particle size and shape.
Particles were fabricated at base formulation conditions. Particles fabricated from PLGA-
acid formed nearly all spheroids while those made from PLGA-PEG were mostly spheres
and particles made from PLGA-ester showed no elongation (Figure 2.10). Formed
spheroid particle aspect ratios followed accordingly; PLGA-acid particles had an average
aspect ratio of 7.0 ± 1.0, PLGA-PEG 4.0 ± 0.2 while PLGA-ester showed no elongation.
Unsurprisingly, the hydrophobic ester end group polymer showed no elongation
as the increased interfacial tension between the oil and aqueous phases due to the
increased hydrophobicity of the polymer decreased the capillary number such that shear
forces could not overcome capillary forces to induce deformation. Increased interfacial
tension forces in PLGA-ester systems has been previously documented and has shown to
produce larger particles than PLGA-acid polymer of similar molecular weight due to
increased capillary forces decreasing droplet breakup [18]. Conversely, the acid end
groups of PLGA-acid that are hydrophilic in nature interact with tris and PVA in the
aqueous buffer, lowering the interfacial tension between the phases and favoring droplet
deformation. The PEG end groups are similarly hydrophilic nature; however, droplet
breakup dominated in this case, causing reduced elongation compared to PLGA-acid
43
(Figure 2.10). When the stir speed was decreased to 1200 rpm, particles fabricated from
PLGA-PEG increased in spheroid fraction and aspect ratio due to the larger initial droplet
diameter (Figure 2.11). Particles fabricated from PLGA-ester remained spherical at
conditions tested.
PLGA polymer molecular weight
The effect of polymer molecular weight on fabricated microparticle
characteristics was studied at 1.0% w/V PVA with three PLGA polymers varying in
inherent viscosities and corresponding molecular weights (Polymers B-D, Table 2.1).
Particle elongation decreased as the polymer molecular weight increased, resulting in a
smaller fraction of spheroids and lower particle aspect ratios (Figure 2.12).
Polymer molecular weight is one characteristic of polymers that directly impacts
oil phase viscosity and has been shown to affect the physical characteristics of fabricated
particles as well as the drug load [19, 20]. Increasing polymer molecular weight increases
its chain length, resulting in an increased chain interaction and entanglement.
Furthermore, longer chains equate to fewer chains for a given mass and results in a lower
concentration of hydrophilic end groups available to interact with the aqueous phase,
reducing droplet deformation. The observed experimental results show that increased
molecular weight decreases droplet deformation due to both increased oil phase viscosity
and increased interfacial tension.
PLGA polymer concentration in the oil phase
Oil phase viscosity is dependent on the concentration of PLGA polymer dissolved
in the organic solvent. Additionally, polymer concentration in the oil phase has been
shown to impact particle characteristics as well as drug loading [21]. The effect of
44
increasing PLGA polymer concentrations in the oil phase were studied at the base
process parameter formulation for 2.5, 5.0 and 10.0 mg/ml PLGA polymer to
dichloromethane. Polymer concentration was increased by increasing the mass of
polymer dissolved while maintaining the base formulation volumes of the oil and
aqueous phases, that is, 10 and 100 ml, respectively. Increasing polymer concentration in
the oil phase resulted in increasing spheroid fraction and aspect ratios of fabricated
particles as shown in Figure 2.13, indicating a net increase in droplet deformation with
increasing polymer concentration over the range examined.
Increasing oil phase polymer concentration results in further chain entanglement
and interaction, increasing viscosity and likely lowering droplet deformation. Conversely,
increasing polymer concentration proportionally increases the number of polymer chain
end groups available for interaction with the aqueous phase, tending to increase droplet
deformation. The greater number of hydrophilic end groups decreases interfacial tension
between the phases, leading to an increase in aspect ratio as droplet deformation
increases.
PLGA co-monomer ratio
The co-monomer ratio is the ratio of lactic to glycolic acid monomers forming the
backbone of the PLGA chain and is known to affect the physical characteristics of
fabricated particles, particle degradation and encapsulation efficiency of loaded drugs
[18, 21]. Particles were fabricated from PLGA polymers containing co-monomer ratios
ranging from 50 to 85 mol% lactic acid with equivalent molecular weights at the base
process parameter formulation (polymers A, E, F & G – Table 2.1). As expected due to
the relatively increased hydrophobic nature of lactic versus glycolic acid, fabricated
45
particles exhibited a decrease in aspect ratio with increasing lactic acid mole fraction
(Figure 2.14). Additionally, particle size increased significantly with increasing amounts
of lactic acid in the PLGA backbone as observed previously in literature [21] even though
there was no appreciable difference in oil phase viscosity.
Lactic and glycolic acid are similar in structure except that lactic acid has an
additional methyl side group that causes an increased hydrophobicity in the lactic
monomer. PLGA polymers with larger fractions of lactic acid in their backbone will
therefore be more hydrophobic and will cause increased interfacial tension between the
oil and aqueous phases, likely leading to less droplet deformation. This was observed as
the particle aspect ratio decreased and particle volume increased with increasing lactic
acid monomer.
Oil phase co-solvent: Acetone
The organic solvent used in the dispersed oil phase impacts the particle size and
droplet deformation in the oil-in-water emulsion systems. Unloaded PLGA particles were
fabricated with dichloromethane and acetone as co-solvents in varying ratios while
keeping all other variables constant, including total oil phase volume (10 ml). As the
volume fraction acetone increased from 0% to 50% in the oil phase, the aspect ratio of
fabricated spheroids increased from 7.0 to 11.6 while there was no significant change in
either fraction spheroids (94% to 92%) or particle volume (205 to 190 µm3) as shown in
Figure 2.15. No particles were formed at 80% volume fraction acetone, which is
unsurprising since the solubility of PLGA in acetone is limited. The increased oil phase
solubility and corresponding diffusion rate into the aqueous phase does not necessarily
correlate to a change in particle volume; literature has reported a decrease, no change or
46
increase in particle volume with increasing co-solvent volume fractions depending on the
system studied [22-24].
The solubility both of the polymer in the organic solvent it is dissolved in and of
the solvent in the aqueous phase will determine the speed of solvent removal into the
water phase. This has implications not only for the resultant particle size, but also for the
loading efficiency of encapsulated therapeutics. Dichloromethane, the organic solvent
utilized in this fabrication technique, has low solubility in the aqueous phase, yet is much
more water-soluble than many other organics, offering relatively fast diffusion compared
to other organics [25]. Similarly, the addition of water-soluble co-solvent, such as
methanol or acetone, increases the diffusion between both phases, increasing water
diffusion into the oil phase as well as solvent diffusion into the aqueous phase.
Acetone does two things as a co-solvent; it lowers the oil phase viscosity and
increases the solubility of the oil phase in the water phase. Decreasing the oil phase
viscosity directly lowers the viscosity ratio, allowing for greater droplet deformation prior
to breakup and likely resulting in larger aspect ratios. Increased solvent solubility in the
water phase increases the solvent removal rate and lowers the interfacial tension between
the two phases, increasing the capillary number and leading to greater stretching. This
was observed experimentally as the aspect ratio increased with increasing acetone
volume fraction due to the decreased viscosity ratio and the increased capillary number.
Polydispersity of fabricated microparticles
Particles fabricated from oil-in-water emulsion systems are non-uniform in size
due to the variability of droplet volumes created when the dispersed phase separates into
individual droplets upon emulsification. Additionally, the deformation of individual

47
droplets, as measured by the aspect ratio of the resultant hardened spheroids, may differ
due to non-uniform forces of the forced and free vortices caused by the agitator. The
uniformity of created particles is important for the efficiency of targeted drug delivery;
some particle volumes and aspect ratios may be more effective at marginating to the
blood vessel wall from flow than others. Therefore, a monodisperse population of
particles is desired to ensure the efficiency of targeting and thus the effectiveness of
overall treatment. The polydispersity of the fabricated particle population can be
measured by the square of the standard deviation divided by the square of the
measurement:
2
2
xPI
Eqn. (2.3)
where σ is the standard deviation in the variable x. A smaller PI indicates a
smaller spread of values and is therefore desirable. The polydispersity of both volume
and aspect ratio were examined for particles fabricated using the oil-in-water emulsion
solvent evaporation technique.
Figure 2.16 shows the effect of tris base in the aqueous phase on the volume and
aspect ratio polydispersity indexes for fabricated particles; aspect ratio polydispersity
increased with increasing tris concentrations. The effects of each fabrication parameter on
aspect ratio and volume polydispersities are shown in Table 2.2. Aspect ratio
polydispersity decreased significantly with increasing stir rate, increasing lactic acid co-
monomer fraction, decreasing tris concentration and decreasing pH. Volume
polydispersity decreased significantly with increasing stir rate, increasing PLGA
concentration and decreasing tris concentration. Thus, it is possible that a combination of
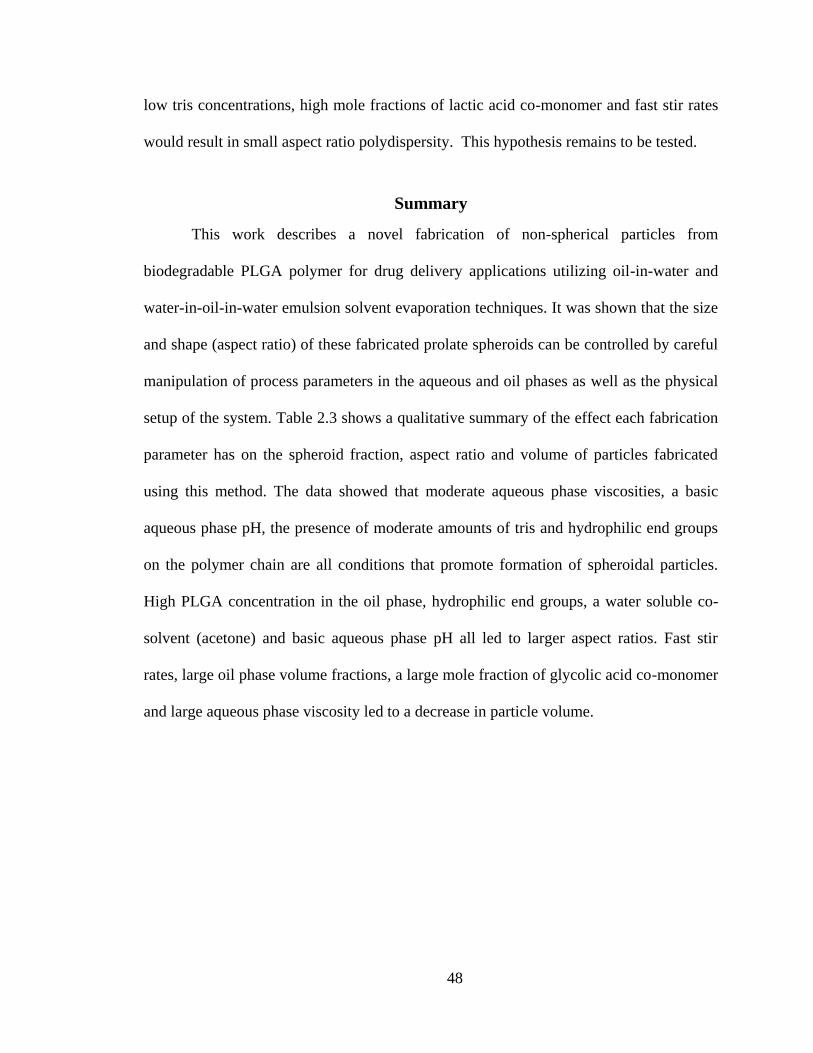
48
low tris concentrations, high mole fractions of lactic acid co-monomer and fast stir rates
would result in small aspect ratio polydispersity. This hypothesis remains to be tested.
Summary
This work describes a novel fabrication of non-spherical particles from
biodegradable PLGA polymer for drug delivery applications utilizing oil-in-water and
water-in-oil-in-water emulsion solvent evaporation techniques. It was shown that the size
and shape (aspect ratio) of these fabricated prolate spheroids can be controlled by careful
manipulation of process parameters in the aqueous and oil phases as well as the physical
setup of the system. Table 2.3 shows a qualitative summary of the effect each fabrication
parameter has on the spheroid fraction, aspect ratio and volume of particles fabricated
using this method. The data showed that moderate aqueous phase viscosities, a basic
aqueous phase pH, the presence of moderate amounts of tris and hydrophilic end groups
on the polymer chain are all conditions that promote formation of spheroidal particles.
High PLGA concentration in the oil phase, hydrophilic end groups, a water soluble co-
solvent (acetone) and basic aqueous phase pH all led to larger aspect ratios. Fast stir
rates, large oil phase volume fractions, a large mole fraction of glycolic acid co-monomer
and large aqueous phase viscosity led to a decrease in particle volume.
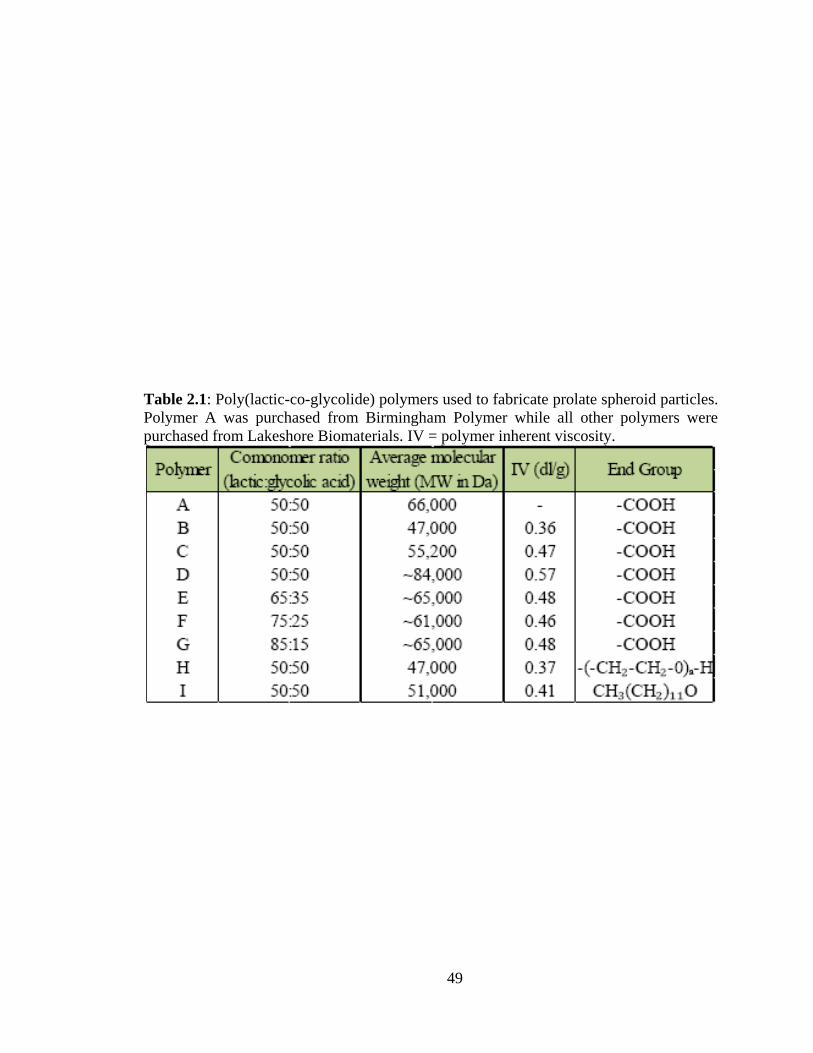
49
Table 2.1: Poly(lactic-co-glycolide) polymers used to fabricate prolate spheroid particles.
Polymer A was purchased from Birmingham Polymer while all other polymers were
purchased from Lakeshore Biomaterials. IV = polymer inherent viscosity.

50
0
5
10
15
20
25
30
0.0% 1.0% 2.0% 3.0% 4.0% 5.0%
Tris Concentration (w/V)
IT (
dyn
es/c
m)
Figure 2.1: Interfacial tension between water phases containing varied tris concentrations
in deionized water and oil phases containing dichloromethane. Measurements were made
using a Du Noüy ring force tensiometer between 20 ml of each phase.
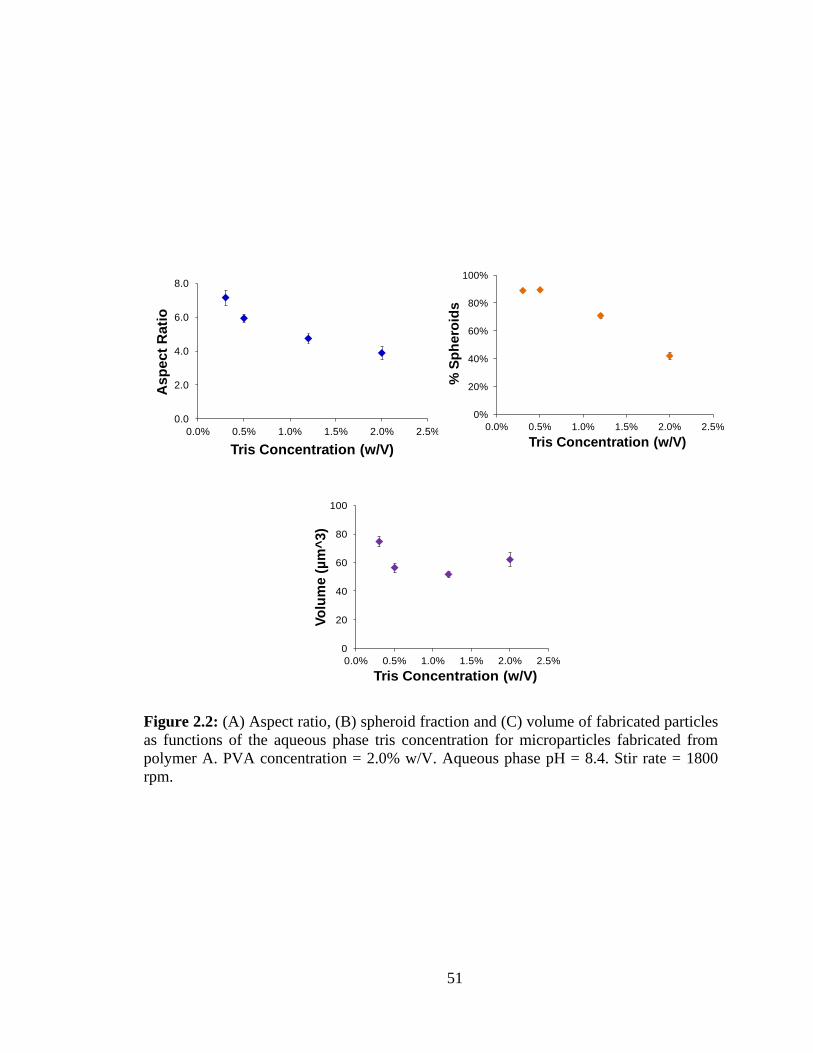
51
0.0
2.0
4.0
6.0
8.0
0.0% 0.5% 1.0% 1.5% 2.0% 2.5%
As
pect
Rati
o
Tris Concentration (w/V)
0
20
40
60
80
100
0.0% 0.5% 1.0% 1.5% 2.0% 2.5%
Vo
lum
e (
µm
^3)
Tris Concentration (w/V)
Figure 2.2: (A) Aspect ratio, (B) spheroid fraction and (C) volume of fabricated particles
as functions of the aqueous phase tris concentration for microparticles fabricated from
polymer A. PVA concentration = 2.0% w/V. Aqueous phase pH = 8.4. Stir rate = 1800
rpm.
0%
20%
40%
60%
80%
100%
0.0% 0.5% 1.0% 1.5% 2.0% 2.5%
% S
ph
ero
ids
Tris Concentration (w/V)
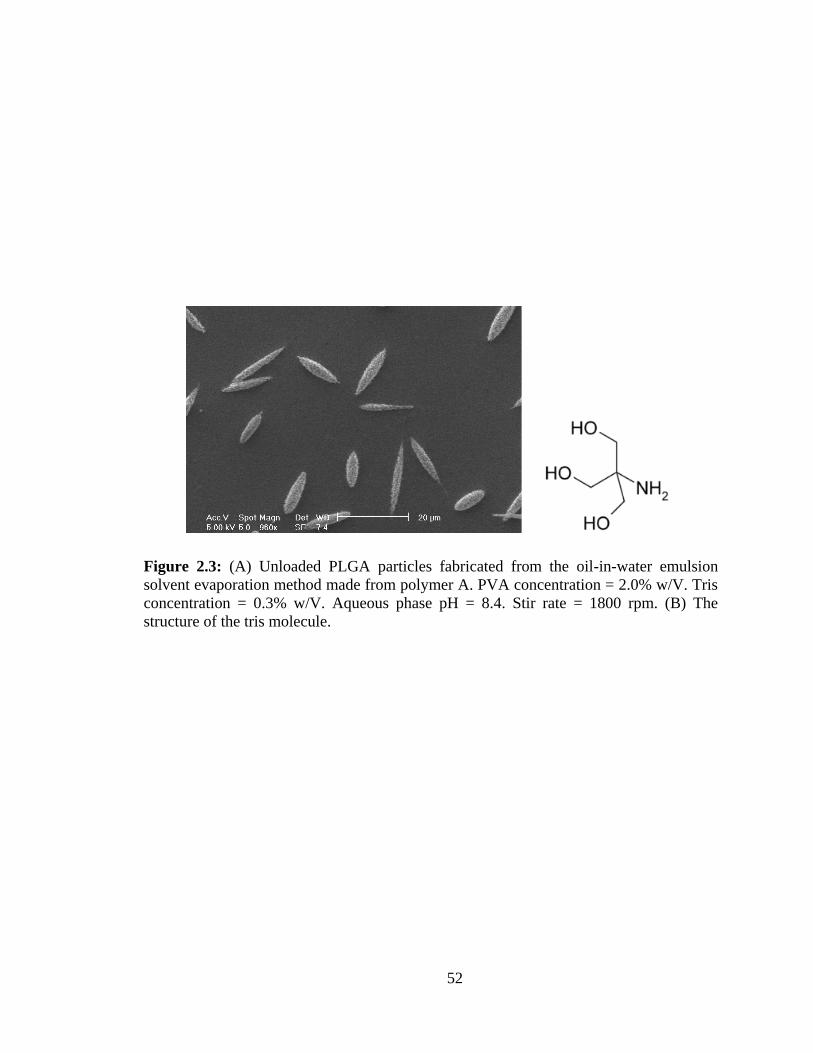
52
Figure 2.3: (A) Unloaded PLGA particles fabricated from the oil-in-water emulsion
solvent evaporation method made from polymer A. PVA concentration = 2.0% w/V. Tris
concentration = 0.3% w/V. Aqueous phase pH = 8.4. Stir rate = 1800 rpm. (B) The
structure of the tris molecule.

53
0.0
1.0
2.0
3.0
4.0
5.0
6.0
7.0
8.0 8.5 9.0 9.5 10.0
As
pect
Rati
o
Aqueous Phase pH
Figure 2.4: Aspect ratio of fabricated particles as a function of aqueous phase pH for
microparticles fabricated from polymer A. PVA concentration = 2.0% w/V. Tris
concentration = 2.0% w/V. Stir rate = 1800 rpm. Aqueous phase pH 8.4 corresponds to
0.02 M hydrochloric acid, pH 9.1 corresponds to 0.01 M HCl and pH 9.7 has no acid
added.
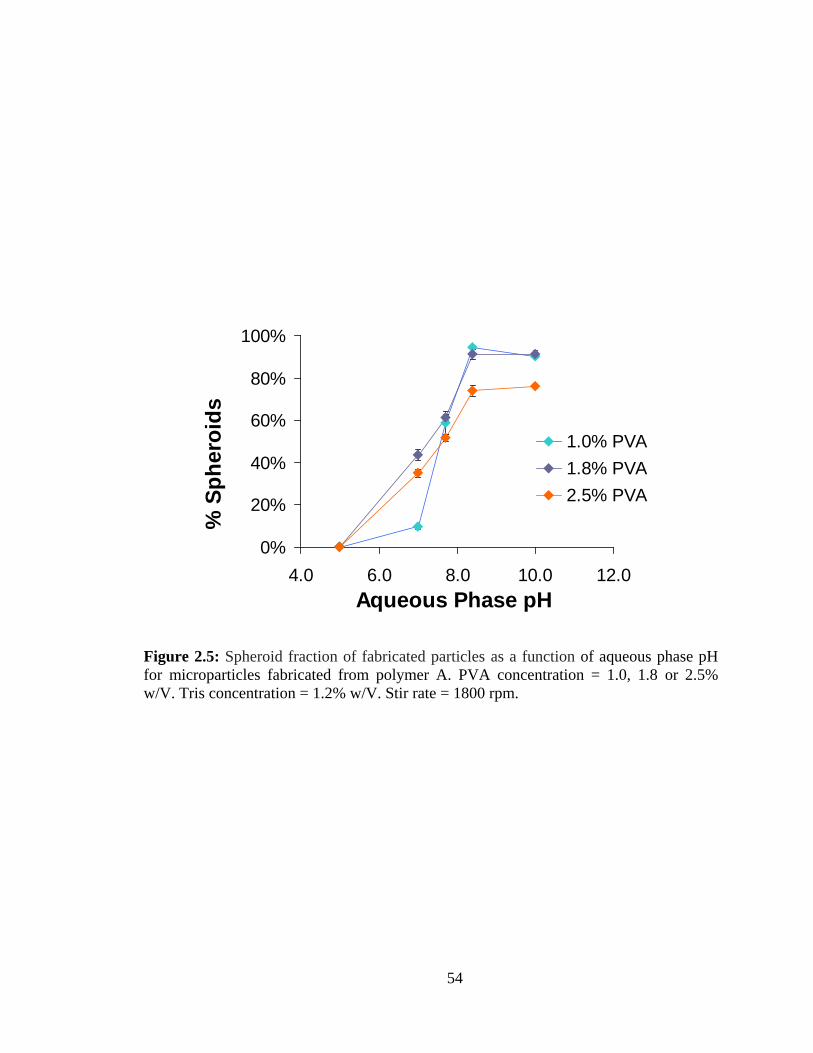
54
0%
20%
40%
60%
80%
100%
4.0 6.0 8.0 10.0 12.0
Aqueous Phase pH
% S
ph
ero
ids
1.0% PVA
1.8% PVA
2.5% PVA
Figure 2.5: Spheroid fraction of fabricated particles as a function of aqueous phase pH
for microparticles fabricated from polymer A. PVA concentration = 1.0, 1.8 or 2.5%
w/V. Tris concentration = 1.2% w/V. Stir rate = 1800 rpm.
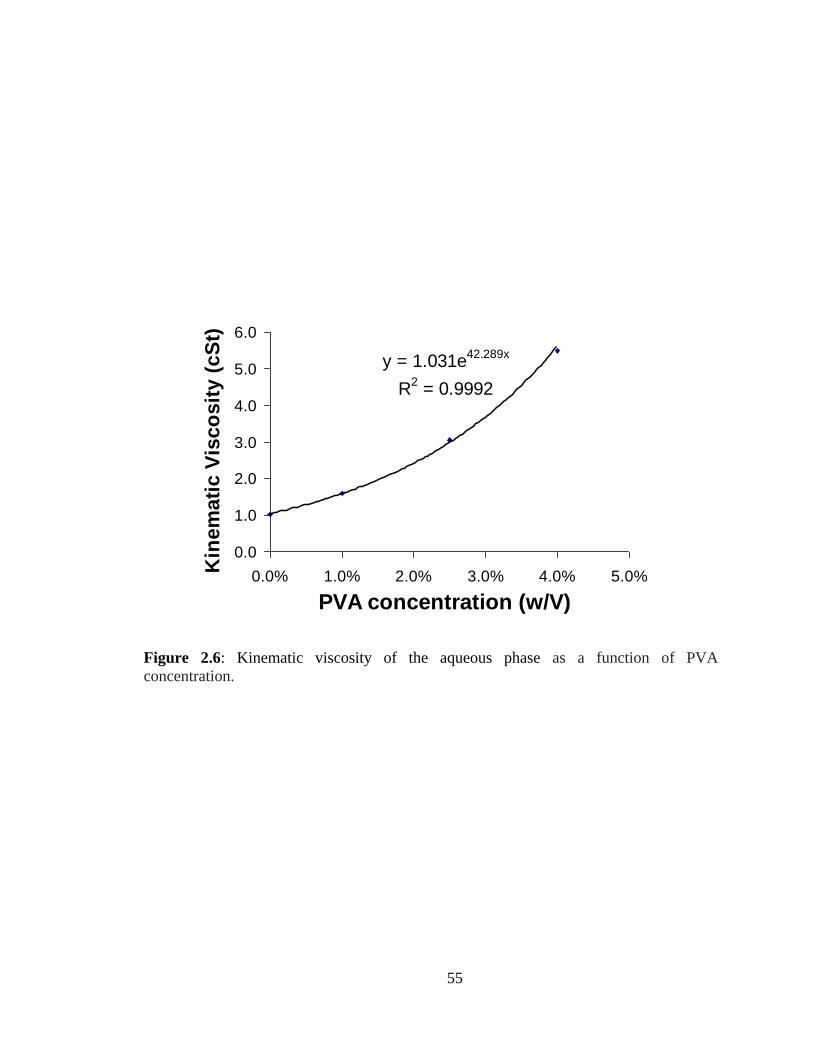
55
y = 1.031e42.289x
R2 = 0.9992
0.0
1.0
2.0
3.0
4.0
5.0
6.0
0.0% 1.0% 2.0% 3.0% 4.0% 5.0%
PVA concentration (w/V)
Kin
em
ati
c V
isco
sit
y (
cS
t)
Figure 2.6: Kinematic viscosity of the aqueous phase as a function of PVA
concentration.
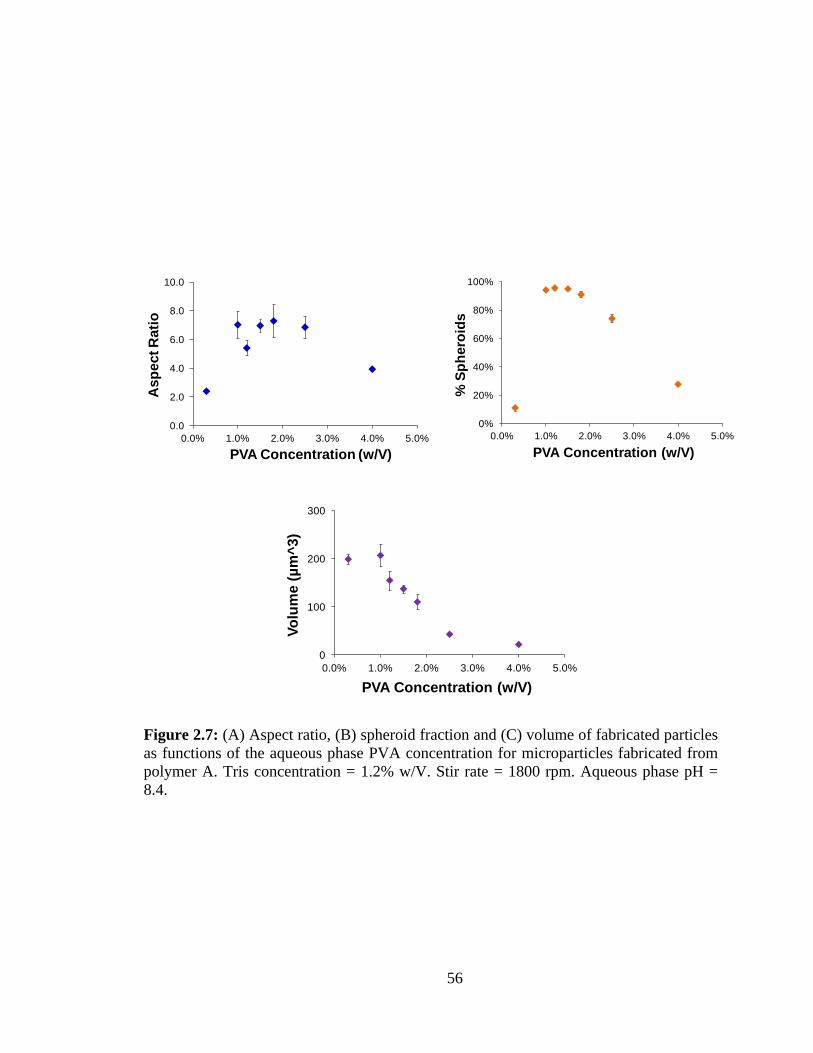
56
0.0
2.0
4.0
6.0
8.0
10.0
0.0% 1.0% 2.0% 3.0% 4.0% 5.0%
Asp
ect R
ati
o
PVA Concentration (w/V)
0
100
200
300
0.0% 1.0% 2.0% 3.0% 4.0% 5.0%
Vo
lum
e (
µm
^3
)
PVA Concentration (w/V)
Figure 2.7: (A) Aspect ratio, (B) spheroid fraction and (C) volume of fabricated particles
as functions of the aqueous phase PVA concentration for microparticles fabricated from
polymer A. Tris concentration = 1.2% w/V. Stir rate = 1800 rpm. Aqueous phase pH =
8.4.
0%
20%
40%
60%
80%
100%
0.0% 1.0% 2.0% 3.0% 4.0% 5.0%
% S
ph
ero
ids
PVA Concentration (w/V)
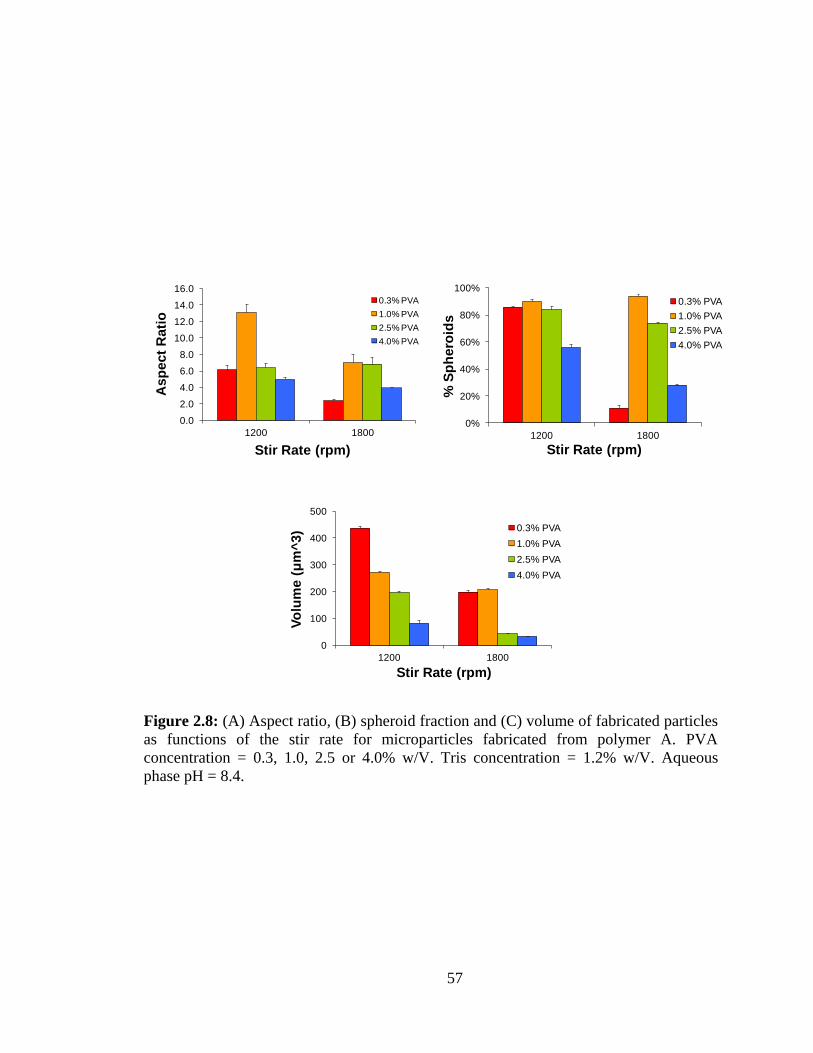
57
0.0
2.0
4.0
6.0
8.0
10.0
12.0
14.0
16.0
1200 1800
Asp
ect
Rati
o
Stir Rate (rpm)
0.3% PVA
1.0% PVA
2.5% PVA
4.0% PVA
0
100
200
300
400
500
1200 1800
Vo
lum
e (μ
m^
3)
Stir Rate (rpm)
0.3% PVA
1.0% PVA
2.5% PVA
4.0% PVA
Figure 2.8: (A) Aspect ratio, (B) spheroid fraction and (C) volume of fabricated particles
as functions of the stir rate for microparticles fabricated from polymer A. PVA
concentration = 0.3, 1.0, 2.5 or 4.0% w/V. Tris concentration = 1.2% w/V. Aqueous
phase pH = 8.4.
0%
20%
40%
60%
80%
100%
1200 1800
% S
ph
ero
ids
Stir Rate (rpm)
0.3% PVA
1.0% PVA
2.5% PVA
4.0% PVA
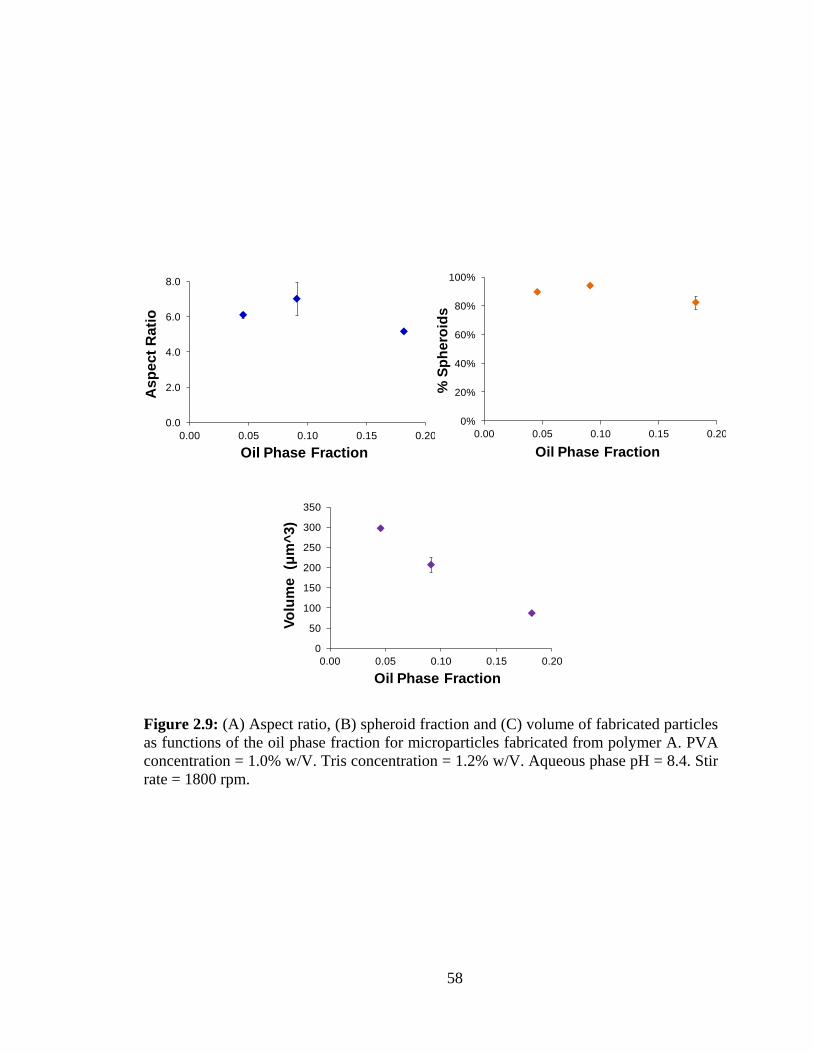
58
0.0
2.0
4.0
6.0
8.0
0.00 0.05 0.10 0.15 0.20
As
pe
ct
Ra
tio
Oil Phase Fraction
0
50
100
150
200
250
300
350
0.00 0.05 0.10 0.15 0.20
Vo
lum
e
(μm
^3)
Oil Phase Fraction
Figure 2.9: (A) Aspect ratio, (B) spheroid fraction and (C) volume of fabricated particles
as functions of the oil phase fraction for microparticles fabricated from polymer A. PVA
concentration = 1.0% w/V. Tris concentration = 1.2% w/V. Aqueous phase pH = 8.4. Stir
rate = 1800 rpm.
0%
20%
40%
60%
80%
100%
0.00 0.05 0.10 0.15 0.20%
Sp
hero
ids
Oil Phase Fraction

59
0.0
2.0
4.0
6.0
8.0
Acid PEG Ester
Asp
ect
Rati
o
End Group
0
100
200
300
400
500
600
Acid PEG Ester
Vo
lum
e (μ
m^
3)
End Group
Figure 2.10: (A) Aspect ratio, (B) spheroid fraction and (C) volume of fabricated
particles as functions of PLGA polymer end group for microparticles fabricated from
polymers A, H & I (Table 2.1). PVA concentration = 1.0% w/V. Tris concentration =
1.2% w/V. Aqueous phase pH = 8.4. Stir rate = 1800 rpm.
0%
20%
40%
60%
80%
100%
Acid PEG Ester%
Sp
hero
ids
End Group
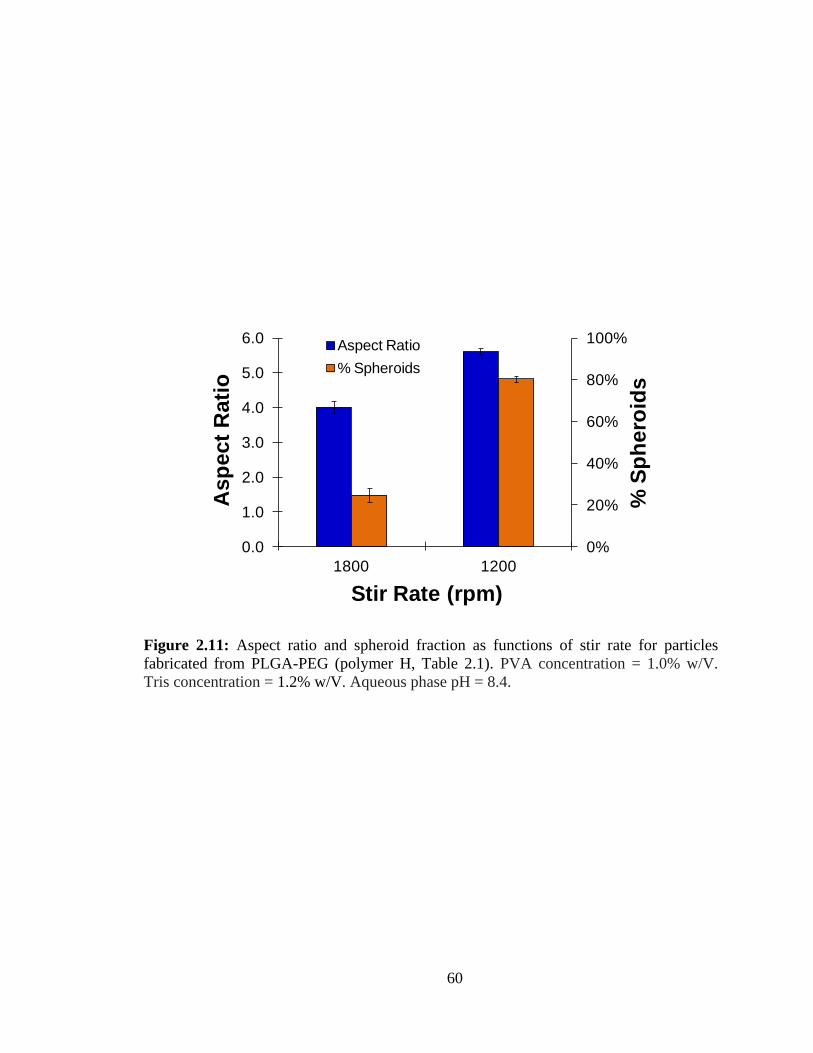
60
0%
20%
40%
60%
80%
100%
0.0
1.0
2.0
3.0
4.0
5.0
6.0
1800 1200
% S
ph
ero
ids
Asp
ect
Ra
tio
Stir Rate (rpm)
Aspect Ratio
% Spheroids
Figure 2.11: Aspect ratio and spheroid fraction as functions of stir rate for particles
fabricated from PLGA-PEG (polymer H, Table 2.1). PVA concentration = 1.0% w/V.
Tris concentration = 1.2% w/V. Aqueous phase pH = 8.4.

61
0.0
2.0
4.0
6.0
8.0
40 50 60 70 80 90
Asp
ect
Rati
o
Polymer Molecular Weight (kDa)
0
50
100
150
200
40 50 60 70 80 90
Vo
lum
e (
µm
^3
)
Polymer Molecular Weight (kDa)
Figure 2.12: (A) Aspect ratio (B) spheroid fraction and (C) volume of fabricated particles
as functions of the PLGA polymer molecular weight for microparticles fabricated from
polymers B-D (Table 2.1). PVA concentration = 1.0% w/V. Tris concentration = 1.2%
w/V. Aqueous phase pH = 8.4. Stir rate = 1800 rpm.
0%
20%
40%
60%
80%
100%
40 50 60 70 80 90
% S
ph
ero
ids
Polymer Molecular Weight (kDa)
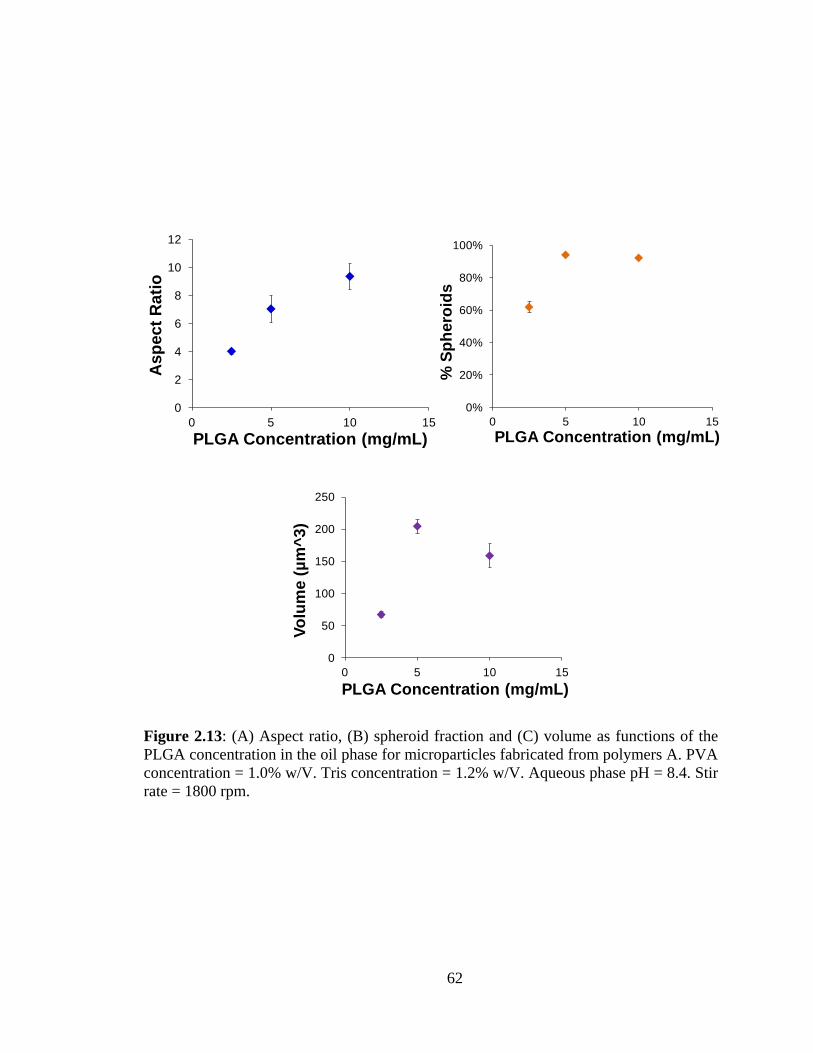
62
0
2
4
6
8
10
12
0 5 10 15
Asp
ect
Rati
o
PLGA Concentration (mg/mL)
0
50
100
150
200
250
0 5 10 15
Vo
lum
e (
µm
^3)
PLGA Concentration (mg/mL)
Figure 2.13: (A) Aspect ratio, (B) spheroid fraction and (C) volume as functions of the
PLGA concentration in the oil phase for microparticles fabricated from polymers A. PVA
concentration = 1.0% w/V. Tris concentration = 1.2% w/V. Aqueous phase pH = 8.4. Stir
rate = 1800 rpm.
0%
20%
40%
60%
80%
100%
0 5 10 15
% S
ph
ero
ids
PLGA Concentration (mg/mL)

63
0.0
2.0
4.0
6.0
8.0
40% 60% 80% 100%
As
pe
ct
Ra
tio
% Lactic Acid Monomer
0
50
100
150
200
250
300
40% 50% 60% 70% 80% 90%
Vo
lum
e (μ
m^
3)
% Lactic Acid Monomer
Figure 2.14: (A) Aspect ratio, (B) spheroid fraction and (C) volume as functions of mole
percent lactic acid monomer in the PLGA backbone for microparticles fabricated from
polymers A, E, F & G (Table 2.1). PVA concentration = 1.0% w/V. Tris concentration =
1.2% w/V. Aqueous phase pH = 8.4. Stir rate = 1800 rpm.
0%
20%
40%
60%
80%
100%
40% 60% 80% 100%
% S
ph
ero
ids
% Lactic Acid Monomer
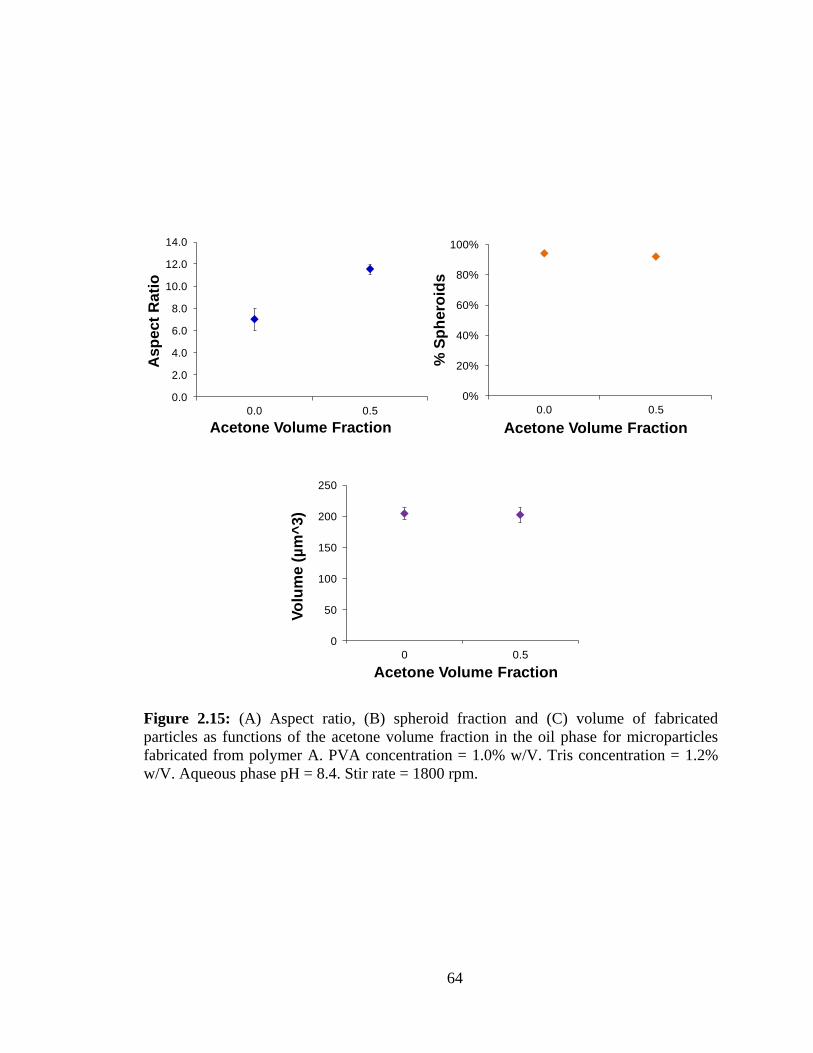
64
0.0
2.0
4.0
6.0
8.0
10.0
12.0
14.0
0.0 0.5
Asp
ect
Rati
o
Acetone Volume Fraction
0
50
100
150
200
250
0 0.5
Vo
lum
e (
µm
^3)
Acetone Volume Fraction
Figure 2.15: (A) Aspect ratio, (B) spheroid fraction and (C) volume of fabricated
particles as functions of the acetone volume fraction in the oil phase for microparticles
fabricated from polymer A. PVA concentration = 1.0% w/V. Tris concentration = 1.2%
w/V. Aqueous phase pH = 8.4. Stir rate = 1800 rpm.
0%
20%
40%
60%
80%
100%
0.0 0.5
% S
ph
ero
ids
Acetone Volume Fraction
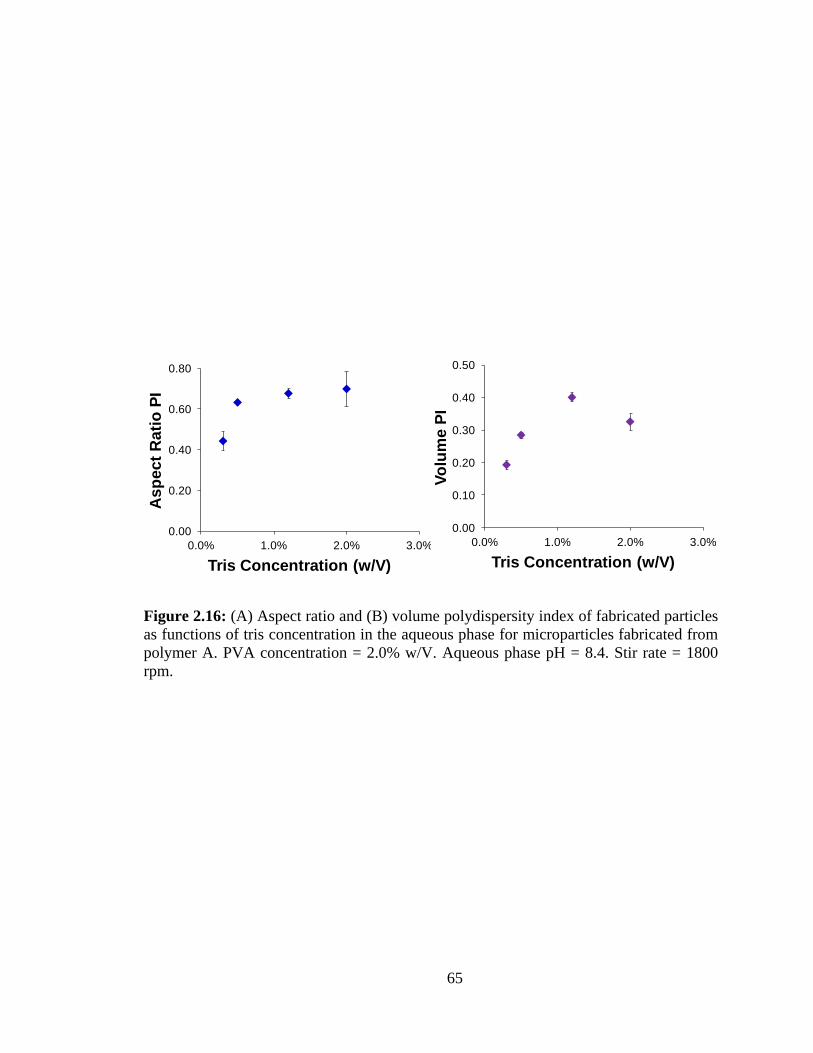
65
0.00
0.20
0.40
0.60
0.80
0.0% 1.0% 2.0% 3.0%
As
pect
Ra
tio
PI
Tris Concentration (w/V)
Figure 2.16: (A) Aspect ratio and (B) volume polydispersity index of fabricated particles
as functions of tris concentration in the aqueous phase for microparticles fabricated from
polymer A. PVA concentration = 2.0% w/V. Aqueous phase pH = 8.4. Stir rate = 1800
rpm.
0.00
0.10
0.20
0.30
0.40
0.50
0.0% 1.0% 2.0% 3.0%
Vo
lum
e P
I
Tris Concentration (w/V)
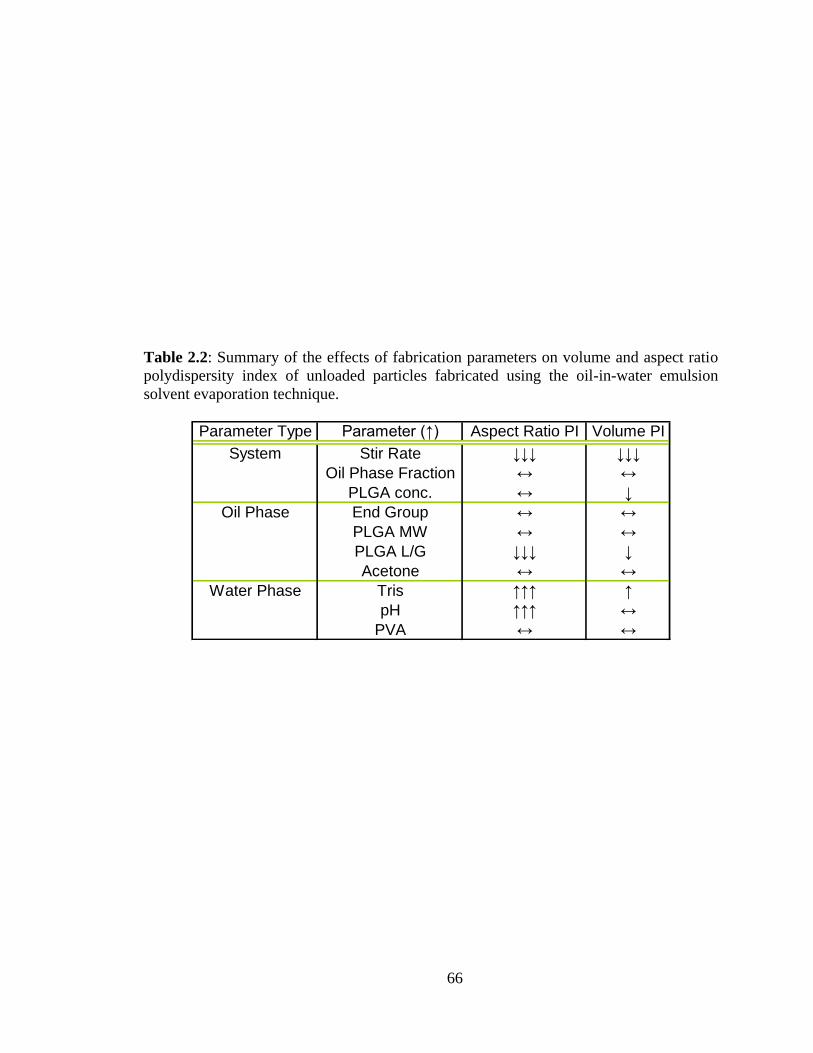
66
Table 2.2: Summary of the effects of fabrication parameters on volume and aspect ratio
polydispersity index of unloaded particles fabricated using the oil-in-water emulsion
solvent evaporation technique.
Parameter Type Parameter (↑) Aspect Ratio PI Volume PI
System Stir Rate ↓↓↓ ↓↓↓
Oil Phase Fraction ↔ ↔
PLGA conc. ↔ ↓
Oil Phase End Group ↔ ↔
PLGA MW ↔ ↔
PLGA L/G ↓↓↓ ↓
Acetone ↔ ↔
Water Phase Tris ↑↑↑ ↑
pH ↑↑↑ ↔
PVA ↔ ↔

67
Table 2.3: Summary of the effects of fabrication parameters on spheroid fraction, aspect
ratio and volume of unloaded particles fabricated using the oil-in-water emulsion solvent
evaporation technique.
Parameter Type Parameter (↑) % Spheroids Aspect Ratio Volume
System Stir Rate ↓ ↓ ↓↓↓
Oil Phase Fraction ↔ ↔ ↓↓↓
PLGA conc. ↑ ↑↑↑ ↔
Oil Phase End Group ↑↑↑ ↑↑↑ ↓
PLGA MW ↓ ↓ ↑
PLGA L/G ↔ ↓ ↑↑↑
Acetone ↔ ↑↑↑ ↔
Water Phase Tris ↓ ↓ ↔
pH ↑↑↑ ↑↑↑ ↔
PVA ↑↓ ↑↓ ↓↓↓

68
References
[1] R.G. Larson, The Structure and Rheology of Complex Fluids, Oxford University
Press, New York, 1999.
[2] A.O. Eniola, D.A. Hammer, Artificial polymeric cells for targeted drug delivery. J
Control Release 87(1-3) (2003) 15-22.
[3] M.J. Heslinga, E.M. Mastria, O. Eniola-Adefeso, Fabrication of biodegradable
spheroidal microparticles for drug delivery applications. J Control Release 138(3)
(2009) 235-242.
[4] G. Gomori, Preparation of Buffers for Use in Enzyme Studies. Methods
Enzymology 1 (1955) 138-146.
[5] K. Holmberg, B. Jonsson, B. Kronberg, B. Lindman, Surfactants and Polymers in
Aqueous Solution, Wiley, West Sussex, 2002.
[6] W.B. Chu, J.W. Yang, T.J. Liu, C. Tiu, J. Guo, The effects of pH, molecular
weight and degree of hydrolysis of poly(vinyl alcohol) on slot die coating of PVA
suspensions of TiO2 and SiO2. Colloids and Surfaces A: Physicochemical and
Engineering Aspects 302 (2007) 1-10.
[7] T. Ishijima, Y. Mizumori, K. Kikuchi, A. Suzuki, T. Okaya, Polymerization of
vinyl acetate in fatty acids and properties of poly(vinyl alcohols) derived from the
poly (vinyl acetates). Colloid and Polymer Science 283 (2005) 799–804.
[8] S. Mao, Y. Shi, L. Li, J. Xu, A. Schaper, T. Kissel, Effects of process and
formulation parameters on characteristics and internal morphology of poly(d,l-
lactide-co-glycolide) microspheres formed by the solvent evaporation method.
Eur J Pharm Biopharm 68(2) (2008) 214-223.
[9] L.Y. Wang, G.H. Ma, Z.G. Su, Preparation of uniform sized chitosan
microspheres by membrane emulsification technique and application as a carrier
of protein drug. J Control Release 106(1-2) (2005) 62-75.
[10] M.D. Bhavsar, S.B. Tiwari, M.M. Amiji, Formulation optimization for the
nanoparticles-in-microsphere hybrid oral delivery system using factorial design. J
Control Release 110(2) (2006) 422-430.
[11] F. Cui, M. Yang, Y. Jiang, D. Cun, W. Lin, Y. Fan, Y. Kawashima, Design of
sustained-release nitrendipine microspheres having solid dispersion structure by
quasi-emulsion solvent diffusion method. J Control Release 91(3) (2003) 375-
384.
[12] J.W. McGinity, P.B. O'Donnell, Preparation of microspheres by the solvent
evaporation technique. Adv Drug Deliv Rev 28(1) (1997) 25-42.
[13] C. Sturesson, P. Artursson, R. Ghaderi, K. Johansen, A. Mirazimi, I. Uhnoo, L.
Svensson, A.C. Albertsson, J. Carlfors, Encapsulation of rotavirus into
poly(lactide-co-glycolide) microspheres. J Control Release 59(3) (1999) 377-389.
[14] L. Kong, J.K.Beattie, R.J.Hunter, Electroacoustic determination of size and
charge of sunflower oil-in –water emulsions made by high -pressure
69
homogenising. Chemical Engineering and Processing: Process Intensification
40(5) (2001) 421-429.
[15] S.M. Butler, M.A. Tracy, R.D. Tilton, Adsorption of serum albumin to thin films
of poly(lactide-co-glycolide). J Control Release 58(3) (1999) 335-347.
[16] X.M. Lam, E.T. Duenas, A.L. Daugherty, N. Levin, J.L. Cleland, Sustained
release of recombinant human insulin-like growth factor-I for treatment of
diabetes. J Control Release 67(2-3) (2000) 281-292.
[17] M.A. Tracy, K.L. Ward, L. Firouzabadian, Y. Wang, N. Dong, R. Qian, Y.
Zhang, Factors affecting the degradation rate of poly(lactide-co-glycolide)
microspheres in vivo and in vitro. Biomaterials 20(11) (1999) 1057-1062.
[18] J. Panyam, D. Williams, A. Dash, D. Leslie-Pelecky, V. Labhasetwar, Solid-state
solubility influences encapsulation and release of hydrophobic drugs from
PLGA/PLA nanoparticles. J Pharm Sci 93(7) (2004) 1804-1814.
[19] S.B. Murty, D.H. Na, B.C. Thanoo, P.P. DeLuca, Impurity formation studies with
peptide-loaded polymeric microspheres Part II. In vitro evaluation. Int J Pharm
297(1-2) (2005) 62-72.
[20] S.B. Murty, B.C. Thanoo, Q. Wei, P.P. DeLuca, Impurity formation studies with
peptide-loaded polymeric microspheres Part I. In vivo evaluation. Int J Pharm
297(1-2) (2005) 50-61.
[21] L. Mu, S.S. Feng, A novel controlled release formulation for the anticancer drug
paclitaxel (Taxol): PLGA nanoparticles containing vitamin E TPGS. J Control
Release 86(1) (2003) 33-48.
[22] W. Chaisri, W.E. Hennink, S. Okonogi, Preparation and characterization of
cephalexin loaded PLGA microspheres. Curr Drug Deliv 6(1) (2009) 69-75.
[23] T.G. Park, H. Yong Lee, Y. Sung Nam, A new preparation method for protein
loaded poly(D, L-lactic-co-glycolic acid) microspheres and protein release
mechanism study. J Control Release 55(2-3) (1998) 181-191.
[24] G. Ruan, S.S. Feng, Preparation and characterization of poly(lactic acid)-
poly(ethylene glycol)-poly(lactic acid) (PLA-PEG-PLA) microspheres for
controlled release of paclitaxel. Biomaterials 24(27) (2003) 5037-5044.
[25] R. Bodmeier, J.W. McGinity, Polylactic acid microspheres containing quinidine
base and quinidine sulphate prepared by the solvent evaporation method. III.
Morphology of the microspheres during dissolution studies. J Microencapsul 5(4)
(1988) 325-330.
70
CHAPTER III
Loading therapeutics into prolate spheroids made from biodegradable
polymers via the oil-in-water emulsion solvent evaporation technique
Introduction
The pharmacodynamics, the effect of the drug on the body, and pharmacokinetics,
the distribution and elimination from the body, of a given drug determines its
effectiveness of that therapeutic in the treatment of a disease. The route of administration
plays a vital role in the effectiveness of the drug; uptake and systemic bioavailability of
the therapeutic depends on the administration. There are many ways to deliver a drug to
the intended site; typical routes include oral, nasal, dermal, rectal, ocular, intramuscular
and intravenous delivery. Each route has its own advantages and disadvantages in
bioavailability, convenience and cost. Oral administration through the swallowing of pills
offers convenience, but many drugs are poor absorbed in the intestines or may be
degraded in the low pH of the stomach. Intravenous delivery offers complete
bioavailability as well as fast action, making it widely used in hospitals, but typically
requires a medical professional to administer the treatment. The appropriate route of
administration often depends on the type of therapeutic, disease and patient status.
71
Whatever the route of administration, drug delivery via controlled release offers
several advantages in the treatment of a wide range of diseases. Controlled release forms
can be made for most methods of drug delivery including oral [1, 2], nasal [3, 4],
intramuscular and intravenous routes [5-8]. The controlled release of therapeutics utilizes
the encapsulation of drugs into particles or devices from which the release lasts from
hours to months. Slow, sustained release permits a lower frequency of dosing, control
over systemic drug concentrations and protection of fragile drugs.
Sustained release over time allows for a lower dosing frequency, offering
increased patient compliance by increasing convenience through decreasing the
frequency of medication or the number of painful injections. Extended, uniform release
also provides control over blood concentrations of the drug through designed release
rates, making it easier to maintain the concentration in the therapeutic window above the
minimum effective concentration (MEC) yet below the minimum toxic concentration
(MTC) [9]. Maintaining the drug concentration in the therapeutic window through
sustained release rather than frequent spikes in and out of this window with traditional
delivery methods provides more effective treatment as well as reduced side effects.
Encapsulation of fragile therapeutics in drug delivery carriers can protect the drug load en
route to its intended destination. Biodegradable polymer microparticles offer promise in
drug delivery applications due to their biocompatibility, tunable release and flexibility in
loadable therapeutics. Injectable drug carriers are desirable due to the bioavailability of
released therapeutics and possibility of targeted, local delivery.
Many diseases are confined to a small area or organ of the body, making these
ideal candidates for localized delivery. Additionally, several drugs have a narrow
72
therapeutic window where the MTC is close to the MEC such that these drugs may not be
effective without targeted delivery. For example, several chemotherapy drugs are highly
potent, including paclitaxel, which leads to a high incidence of side effects and low
administered dosages, causing reduced efficacy [10]. Another example are statin drugs
typically used to lower blood cholesterol levels; studies show statins have anti-
inflammatory effects at dosages higher than systemic MTC, but might be useful if applied
locally [11, 12].
Cardiovascular diseases such as CAD are potential candidates for targeted
delivery due to the unique markers on the vascular wall at the site of diseased tissues due
to the chronic inflammation present at all disease stages [13]. Targeted drug delivery may
lower health care costs with smaller, less frequent required dosages with a possible
reduction in required surgeries in addition to decreasing mortality for CAD and
improving the quality of life for patients.
The possible advantages of non-spherical particles for targeted drug delivery
include more efficient localization to diseased tissues with increased blood circulation
times as was discussed in detail in Chapter I. The fabrication of biodegradable PLGA
prolate spheroids by means of the oil-in-water emulsion solvent evaporation method was
discussed in Chapter II. The loading of therapeutics into polymer particles fabricated
using the method is vital in the design of optimal drug carriers. Drug load, the mass of
entrapped drug per total drug carrier mass, and encapsulation efficiency, the ratio of the
entrapped mass fraction to that of the drug mass fraction present during fabrication, are
important in the fabrication and effectiveness of drug carriers. Encapsulation efficiency is
a function of the parameters of the system during fabrication; in general, faster particle
73
solidification during fabrication results in greater encapsulation efficiency since the drug
has less opportunity to diffuse into the continuous phase [14].
Several parameters impact the rate of solvent removal and subsequent particle
solidification rate. Generally, low solubility of polymer in the dispersed phase, high
solubility of the dispersed phase in the continuous phase, high polymer concentration and
a low ratio of dispersed phase to continuous phase result in fast solvent removal [15].
Increasing the solubility of the polymer in the dispersed oil phase causes slower diffusion
of the oil phase into the continuous phase, increasing diffusion of the drug and decreasing
encapsulation efficiency [16-18]. Conversely, increased solubility of the oil phase in the
water phase causes faster diffusion of the solvent and increases encapsulation efficiency
[14]. However, addition of a water-soluble co-solvent such as acetone or DMSO may
increase, decrease or not affect encapsulation depending on the therapeutic characteristics
[15, 19-22]. The oil phase fraction has been shown to increase encapsulation efficiency
[23, 24]. Increasing the viscosity of the continuous phase by raising PVA concentration
slows solvent removal and decreases encapsulation efficiency [25]. Continuous phase pH
may or may not impact encapsulation efficiency depending on whether or not the
therapeutic solubility changes with pH [14, 25].
PLGA prolate spheroids loaded with several therapeutics were manufactured
using the O/W ESE method to demonstrate the utility of these particles as imaging and
drug delivery carriers. Therapeutics with potential application in cardiovascular diseases
were loaded, including paclitaxel as a model hydrophobic drug with potential treatment
of cancer and to prevent arterial restenosis, lovastatin as an inflammation-reducer in the
treatment of atherosclerosis, 6-carboxyfluorescein as a fluorescent dye for cardiovascular
74
imaging and cadmium sulfide nanoparticles for fluorescent cardiovascular imaging and to
demonstrate the loading of nanoparticles into spheroid carriers. The dependence of
encapsulation efficiency, particle size and particle shape on fabrication parameters,
including several mentioned above, were examined for paclitaxel-loaded particles.
Experimental methods
Microparticle fabrication and characterization
Drug-loaded microparticles were fabricated from PLGA polymer using the oil-in-
water emulsion solvent evaporation method described in Chapter 2. Drug loading was
achieved in the O/W ESE through the addition of the desired therapeutic or nanoparticle
suspension to the oil phase. For paclitaxel and lovastatin loading, 2.5 mg paclitaxel or
lovastatin were dissolved with 47.5 mg PLGA polymer in 10 ml dichloromethane. For 6-
carboxyfluorescein loading, 1.0 mg 6-CF was dissolved in 1.0 ml ethanol and the
suspension was added to 9 ml dichloromethane to form the oil phase. For cadmium
sulfide (CdS) nanoparticle loading, 0.2 mg CdS nanoparticle were suspended in 0.1 ml
toluene (stock solution) and the mixture combined with 9.9 ml dichloromethane to form
the oil phase. PLGA polymer A from Table 2.1 was used for all drug loading studies
unless stated otherwise. The same base conditions as for unloaded particles were utilized
for drug-loaded particles – the aqueous phase consisted of deionized water at pH 8.4
(titrated with hydrochloric acid) containing 1.0% w/V PVA and 1.2% w/V tris. The 10 ml
oil phase was injected over 30 seconds into 100 ml of the aqueous phase while stirred at
1800 rpm for one hour. Particle size and shape were characterized via light and scanning
electron microscopy as described in Chapter II.
75
Characterization of drug load and encapsulation efficiency
Drug load and encapsulation efficiency for all drug-loaded microparticles were
determined by dissolving dried microparticles in dichloromethane. One mg of freeze-
dried particles loaded with the therapeutic of interest was dissolved in 5 ml
dichloromethane over 30 minutes and evaluated for concentration. In the case of each
loaded therapeutic, the measured data was converted into concentration through
comparison with a calibration curve generated from solutions with known concentrations
of the drug. The concentration of paclitaxel in the polymer-drug solution was measured
via UV absorption at 232 nm. Lovastatin-loaded particle drug load was evaluated by UV
absorption at 237 nm. The concentration of 6-carboxyfluorescein was measured via
fluorescence with excitation and emission wavelengths of 492/517 nm, respectively.
Background absorbance or fluorescence of PLGA was subtracted using a similar
calibration curve. Drug loading was calculated to be the mass of entrapped therapeutic
divided by the mass of freeze-dried microparticles. Encapsulation efficiency was
calculated as the ratio of entrapped drug mass to that of the drug mass present in the oil
phase during fabrication.
Results and Discussion
Paclitaxel-loaded PLGA microparticles
Paclitaxel is a mitotic inhibitor commonly utilized in cancer chemotherapy
treatments, typically of ovarian, breast and some lung cancers [26-28]. Recent literature
has shown that paclitaxel can prevent arterial restenosis after percutaneous coronary
intervention, and thus may be relevant for treatment in cardiovascular disease [29]. The
loading and release of paclitaxel into microspheres made of biodegradable polymers via
76
oil-in-water emulsion solvent evaporation methods has been previously explored in the
literature and thus was attractive as a model hydrophobic drug [30-33]. Prolate PLGA
spheroids loaded with paclitaxel at 5.0% (w/w) theoretical load were fabricated using the
O/W ESE technique as described above. Particles fabricated at the base conditions with
PLGA polymer A had a spheroid fraction greater than 90% and exhibited drug loading of
2.7 wt%. These particles were approximately the same volume as unloaded particles and
showed slightly more deformation with an average aspect ratio of 8.2 (7.0 unloaded).
These spheroids displayed smooth particle surfaces as shown in Figure 3.1.
Effect of tris concentration on paclitaxel-loaded spheroids
The effect of tris base concentration ranging from 0.0% to 1.2% w/V at constant
PVA concentration (1.0% w/V), aqueous phase pH (8.4), and 5.0% (w/w) theoretical
paclitaxel load was observed on particle deformation, size and encapsulation efficiency.
Similar to unloaded particles, only spheres were produced in the absence of tris base
whereas small concentrations (0.3 – 0.6% w/V) of tris resulted in 90% spheroids with an
average aspect ratio of 9.6. Further increases in tris base concentration up to 1.2% w/V
resulted in a decrease in both the average particle aspect ratio and fraction spheroids as
shown in Figure 3.2. As in the case of unloaded particles, the aqueous phase was held at a
constant pH via the addition of hydrochloric acid. Increasing concentrations of tris base
led to a decrease in interfacial tension that was counteracted by the corresponding
increase in electrolytes required to maintain pH 8.4 in the aqueous phase. Increased
electrolyte concentration decreased the PVA concentration at the interface and also
decreased the solubility of the oil phase in the water phase as discussed in Chapter 2 [34].
77
Varying tris base concentration over this range showed no effect on the
encapsulation efficiency of paclitaxel (Figure 3.2), unsurprising since paclitaxel is poorly
soluble in the water phase due to its hydrophobic nature. Increasing electrolyte
concentrations required to maintain constant pH at increasing tris concentrations does not
significantly alter the solubility of paclitaxel and thus has little impact on the loading
efficiency of the encapsulated drug.
Effect of aqueous phase pH on paclitaxel-loaded spheroids
Paclitaxel-loaded particles were fabricated from buffers varying in aqueous phase
pH between 7 and 10 for constant PVA and tris base concentrations (1.0% and 1.2% w/V,
respectively) at 5.0% w/w theoretical load. As seen with unloaded particles, paclitaxel-
loaded particles formed spheroids only at basic aqueous phase pH. Figure 3.3 shows that
as the water phase pH increased from 7 to 9, the fraction of particles that were spheroids
increased from 1% to 91% with an average aspect ratio of 7.4. Further increase to water
phase pH 10 resulted in decreased particle elongation with a reduction in spheroid
fraction to 62% and spheroid aspect ratios to 5.1. Again, lower pH at a fixed
concentration of tris was achieved via the addition of hydrochloric acid which increased
the electrolyte concentration, resulting in decreased droplet deformation and resultant
particle elongation through decreased surface concentration of PVA and decreased oil
phase solubility [34]. Aqueous buffers containing 1.0% w/V PVA and 1.2% w/V tris with
no acid added exhibited pH 9.3. Reduction in pH was achieved through acid addition
while an increase to pH 10.0 was attained via sodium chloride addition; electrolyte
concentration increased in both cases.
78
Encapsulation efficiency of paclitaxel was unchanged with the variation of
aqueous phase pH (Figure 3.3) as observed with the variation of tris base concentration.
Since paclitaxel is highly hydrophobic, it is not sensitive to the change in electrolyte
concentration and its solubility is not aqueous phase pH dependent.
Effect of polyvinyl alcohol concentration on paclitaxel-loaded spheroids
Particles loaded with paclitaxel were fabricated from aqueous phases containing
PVA concentrations varying from 0.5% to 2.0% w/V at constant tris base (1.2% w/V),
aqueous phase pH (8.4), and 5.0% w/w theoretical drug load. Particle shape and volume
showed the same trend with PVA concentration as with unloaded particles; as the PVA
concentration increased to 1.5% (w/V), the particle aspect ratio increased from 3.9 to 4.8
and then decreased to 4.0 with further PVA increase to 2.0% (w/V) (Figure 3.4). There
was no significant difference in the spheroid fraction over this PVA range. The average
particle volume decreased from 140 um3 to 60 um
3 and drug encapsulation efficiency
decreased from 54% to 26% as PVA concentration increased from 0.5% to 2.0% w/V
(Figure 3.4).
PVA is a surface active polymer that not only acts as the emulsifier, but also
increases aqueous phase viscosity. This directly increases the capillary number and
decreases the viscosity ratio, leading to increased droplet deformation. However, as in the
case of unloaded particles, increasing the capillary number also leads to increased droplet
breakup and smaller particle volumes. High concentrations of PVA in the aqueous phase
led to the crowding of the interface between the phases. The combination of a high
aqueous phase viscosity and crowded interface slow the solvent diffusion rate into the
water phase. This slowed solidification and increased surfactant concentration permit
79
more paclitaxel leakage and a corresponding decrease in the encapsulation efficiency as
has been previously observed [25].
Effect of acetone co-solvent on paclitaxel-loaded spheroids
The organic solvent used in the dispersed oil phase impacts the particle size and
deformation as well as the loading efficiency of therapeutics in oil-in-water emulsion
systems. Particles loaded with paclitaxel were fabricated with oil phases composed of 0%
or 50% volume fraction acetone as a co-solvent with dichloromethane while holding the
total volume of the oil phase constant at 10 ml. When the acetone volume fraction was
increased from 0% to 50%, the particle aspect ratio increased slightly from 7.5 to 9.0 and
the fraction spheroids remained unchanged (85% to 92%) (Figure 3.5). However, the
particle volume increased significantly, jumping from 110 µm3
with no acetone co-
solvent to 200 µm3 at 50% acetone by volume. This differs significantly from the
unloaded particles where volume was unchanged and aspect ratio almost doubled with
acetone used as co-solvent. Paclitaxel is sparingly soluble in acetone and highly soluble
in dichloromethane such that acetone diffuses into the water phase quickly upon injection
and little paclitaxel is carried with it. The remaining oil phase consists almost entirely of
dichloromethane and behaves as if the oil phase fraction has been reduced. This leads to
an increase in particle volume as observed with low oil phase fractions with unloaded
particles. The encapsulation efficiency was unaffected by the use of acetone as a co-
solvent as has been observed in literature [19-21]. Paclitaxel is poorly soluble in water
and acetone and therefore mostly remains within the dichloromethane in the oil phase.
80
Effect of oil volume fraction on paclitaxel-loaded spheroids
Prolate spheroids loaded with paclitaxel were fabricated at two different oil-to-
aqueous phase volume ratios while keeping all other process parameters constant. As the
volume fraction of oil phase doubled from 0.09 to 0.18 at constant total volume (water
plus oil phases) of 110 ml, the particle volume decreased slightly from 110 to 100 μm3,
following the same trend observed with unloaded particles (Figure 3.6). Increased
dispersed phase fraction changes the average particle volume due to an increase in
viscosity of the solution [35]. Particle aspect ratio decreased with increasing oil phase
volume fraction as shown in Figure 3.6. Greater solution viscosity due to higher
dispersed phase volume fraction led to greater shear forces and an increased capillary
number; the decrease in particle volume due to breakup led to a net decrease in droplet
deformation as the smaller droplets decrease the capillary number. Decreasing particle
size with increasing oil phase volume fraction has been previously observed for oil-in-
water emulsions [36]. Drug load and encapsulation efficiency increased with larger oil
phase volume fraction (Figure 3.6), most likely due to the decreased particle size
observed at the higher ratio as previously reported in the literature [19-21].
Lovastatin-loaded PLGA Spheroids
Oral dosing of statins is currently utilized to reduce systemic low-density
lipoprotein (LDL) cholesterol concentrations in the preventative treatments of coronary
artery disease in an effort to decrease the amount of plaque buildup in the patient’s
arteries during atherosclerosis, the precursor to coronary artery disease. Statins have also
been shown to have potent anti-inflammatory effects on human umbilical vein
endothelial cells (HUVECs) in cell culture and in inflammation models in animals [11,

81
12]. Such anti-inflammatory treatments may offer additional benefits in the treatment of
chronic inflammatory diseases, such as atherosclerosis, yet these effects are only realized
at concentrations too high for systemic delivery due to the deleterious side effects.
Localized delivery of such therapeutics through inflammation-targeting may offer an
opportunity to utilize the anti-inflammatory effects of statin drugs by locally producing
elevated concentrations while keeping systemic blood concentrations low, thereby
limiting side effects [12].
PLGA particles loaded with 5.0% w/w lovastatin (theoretical load) were
fabricated with aqueous buffers containing 1.0% w/V PVA and 0.6% w/V tris base at pH
8.4. The resultant spheroids (Figure 3.7) had an average aspect ratio of 7.4 with an
average volume of 163 µm3. These particles exhibited an encapsulation efficiency of
42%, corresponding to a lovastatin load of 2.1% w/w. Targeted drug delivery from
lovastatin-loaded spheroids offer potential treatments for chronic inflammatory diseases
such as atherosclerosis.
PLGA spheroids for imaging – loading 6-carboxyfluorescein (6-CF)
Vascular-targeted imaging particles may prove useful in the identification of
cardiovascular diseases and their subsequent treatment. For example, such particles may
permit the early identification of atherosclerosis and help in the discrimination between
stable and vulnerable plaques, yielding information critical in the treatment of such
diseases [37]. Sensitive imaging capabilities may guide surgeons as they repair vascular
injuries and improve understanding of the underlying causes of coronary artery as well as
other cardiovascular diseases. Spheroids loaded with contrast agents for imaging offer
potential for improving treatments options through efficient disease imaging. Fluorescent
82
dyes are easily measured and quantified, allowing for in vitro and in vivo evaluation of
binding to inflammation models. 6-carboxyfluorescein (6-CF) is a fluorescent derivative
of fluorescein often used to quantify ion movement across cell membranes [38]. 6-CF is
attractive as a fluorescent dye for both imaging experiments and for evaluating the
release of loaded therapeutics from biodegradable polymer particles [39].
The effect of tris base concentration on 6-CF-loaded spheroids
The effect of tris concentration in the aqueous phase on 6-CF-loaded particles was
examined for tris concentrations between 0.0% and 1.2% w/V at 1.0% w/V PVA
concentration, aqueous phase pH 8.4, and 1.0% w/w theoretical 6-CF load. 6-CF is
anionic at neutral (and basic) pH through the donation of the hydrogen from its alcohol
group with a pK of 6.3. Accordingly, its solubility in dichloromethane is sparing at
neutral and basic pH while its solubility drastically increases below pH 6.3 (pK for the
alcohol group) and pH 4.5 where the terminal carboxyl forms a ring structure as shown in
Figure 3.8 [38]. The partition coefficient therefore drastically decreases at pH greater
than 6.3. In order to increase solubility in the oil phase, the drug was initially dissolved in
ethanol prior to addition to dichloromethane at a ratio of 10:90 ethanol:dichloromethane,
utilizing ethanol as a co-solvent.
Fabricated particles followed a similar trend as unloaded and paclitaxel-loaded
particles; a minimum tris concentration of 0.3% w/V was required for particle elongation
due to the decrease in interfacial tension between the oil and aqueous phases with the
addition of tris. Further increases in tris concentration up to 1.2% w/V led to a decrease in
the fraction spheroids and spheroid aspect ratio as shown in Figures 3.9. As stated before
for unloaded and paclitaxel-loaded particles, this is a result of increasing acid
83
concentration with increasing tris concentration required to hold the water phase pH at
8.4. The result is decreased surface activity and concentration of PVA and decreased oil
phase solubility in the water phase.
As seen with the loading of paclitaxel, changing tris concentration did not
significantly alter the loading efficiency of 6-CF for particles fabricated with any amount
of tris in the aqueous buffer. However, unlike with paclitaxel, particles fabricated in the
absence of tris showed very low loading efficiencies (Figure 3.9). It took twelve times the
original 6-CF load (12% w/w theoretical load) to increase the actual drug load of loaded
particles made in the absence of tris to a level comparable to those made with 1% w/w 6-
CF in any tris concentration (Table 3.1). Particles made in the absence of tris were
spheres while those fabricated in the presence of a small tris concentration were nearly all
rods. In order to verify that particle geometry was not solely responsible for the
difference in drug loading efficiency, tris concentration was increased to 6.0% w/V in the
aqueous buffer where the high electrolyte concentration increased the interfacial tension
enough to show no particle elongation (spheres). Table 3.1 shows that insensitivity of
encapsulation efficiency to tris concentration – spheres produced at 6.0% w/V tris and pH
8.4 displayed similar drug loading efficiency as rods made at low tris concentrations and
the same pH.
Tris is a surface active base that interacts with the polymer end groups, lowering
the interfacial tension between the oil and water phases in this emulsion system. Due to
its relatively high solubility in water when compared to that of dichloromethane, the
ethanol in the oil phase diffuses rapidly into the water phase upon emulsification. Since
the 6-CF is also water soluble and has a low partition coefficient at neutral pH, it too will
84
diffuse rapidly in comparison to DCM into the water phase resulting in low encapsulation
efficiencies in the absence of tris base as seen with other highly water soluble drugs
encapsulated using O/W ESE methods [15]. When tris is present in the water phase, the
interfacial tension is lowered and increases the diffusion of DCM into the water phase as
well as water into the oil phase. Tris enters along with the small volume of water and is
protonated upon contact with 6-CF within the oil phase, making the drug anionic in the
presence of the base and drastically changing its solubility in the remaining DCM within
the droplet. Thus the 6-CF likely precipitates within the oil phase due to the change in
solubility and cannot pass the interface, increasing the encapsulation efficiency. Even a
low concentration of tris is enough to cause ionization and precipitation of 6-CF,
rendering loading efficiency insensitive to tris concentration. This hypothesis was tested
using confocal microscopy to observe the 6-CF distribution within the particles. Figure
3.10 shows the fluorescent dye loading of spheres and spheroids; the spheres were
manufactured in the absence of tris while loaded spheroids were made with tris in the
aqueous phase. Spheroids show non-uniform loading due to the precipitation of 6-CF in
the oil phase while spheres show uniform loading in the absence of tris.
Nanosphere-loaded spheroids
Successful targeted drug delivery or imaging systems must reach their target in
functional form. This requires navigating blood flow by avoiding the natural clearance
processes, finding the target on the vessel wall from flow and binding specifically at the
objective. Nanospheres are much less likely to be phagocytosed than larger, micron-sized
particles, likely resulting in longer circulation times [40]. Increased blood circulation
time is likely due to a decreased opsonization rate with decreasing particle size [41].
85
Opsonization refers to the absorption of serum proteins onto foreign particles as the
primary step in clearance from the body [41, 42]. However, nanospheres have been
shown to be inefficient in vascular targeting as the localization and binding to inflamed
human umbilical vein endothelial cells (HUVECs) from blood flow was significantly
lower for nanospheres from 100 – 500 nm compared to that of micron-sized spheres [43,
44]. The final destination of the drug delivery or imaging system may not be the vascular
endothelium, but rather the underlying tissue. It is possible that loaded drug/imaging
agents may not be able to permeate the endothelial cell layer lining the vessel wall; in this
case nanoparticles may be designed for internalization or transcytosis of the endothelium
[45, 46]. However, the low binding efficiency of nanoparticles remains problematic.
One possible approach to solving this problem may be the embedding of
nanovectors within micron-sized spheroids that have high efficiency in traveling to the
vessel wall and improved circulation times due to their size and geometry. The
microspheroids would bind to the endothelium and release the loaded nanocarriers at the
vessel wall where they could transmigrate through the endothelium to diseased tissues.
This requires microcarrier design appropriate to release their load over the desired time
frame, perhaps utilizing fast degrading polymers for fast release. Imaging systems may
include either loaded nanovectors for release or remain within the microspheroids at the
endothelial surface; for example, nano-sized gadolinium contrast agents loaded into
porous silicon microspheres showed enhanced contrast due to their geometrical
confinement [47]. Iron oxide nanoparticles might be of particular interest for imaging due
to their application in magnetic resonance imaging (MRI) applications for use in humans.
MRI is more attractive than fluorescence due to its visibility through deep tissue.

86
One unique approach for treating atherosclerosis may be the targeting of the
neovascularization of the vasa vasorum, a network of small arteries penetrating the vessel
wall providing blood flow to the tissue, which is correlated with atherosclerotic plaque
growth and rupture [48]. Inflammation and angiogenesis associated with atherosclerosis
may provide an avenue for targeting; however, only circumstantial evidence exists for
nanoparticles localizing to the vasa vasorum [49]. Additionally, the orientation of the
vasa vasorum is important for targeting as some of these vessels originate from the lumen
of arteries [50].
Spheroids loaded with cadmium sulfide nanospheres
Cadmium sulfide (CdS) nanospheres are fluorescent with excitation wavelengths
between 430 and 450 nm and emission wavelengths 445 – 470 nm. PLGA particles were
loaded with 5 nm CdS nanospheres in order to demonstrate the concept of loading
nanoparticles into micron-sized spheroids and their potential use for cardiovascular
imaging or drug delivery (Figure 3.11). CdS-loaded particles were fabricated from
aqueous buffers containing 3.0% w/V PVA and 0.6% w/V tris base at pH 9.0. Stock CdS
particles were dissolved in toluene at 2 mg/ml concentration and oil phases containing
0.2% w/w CdS consisted of 0.1 ml toluene in 9.9 ml dichloromethane. Particles
fabricated at these concentrations consisted of 93% spheroids with an average aspect ratio
of 11.9 ± 1.1 and an average particle volume of 292 ± 12 µm3.
Summary
Spheroids loaded with a range of therapeutics and imaging agents were fabricated
utilizing the oil-in-water emulsion solvent evaporation technique. Encapsulated drugs and
imaging agents included hydrophobic (paclitaxel and lovastatin) and water-soluble (6-
87
carboxyfluorescein) drugs as well as nanoparticles (cadmium sulfide). The loaded
therapeutics show the ability of these particles to act as drug delivery carriers while the
loaded imaging agents allow these particles to be useful as contrast agents. Regardless of
the loaded molecule or nanoparticles, all loaded particles displayed similar dependences
on system parameters for particle size and shape as with unloaded particles.
Encapsulation efficiency was drug-dependent, however, as each loaded agent responded
differently to loading conditions. Paclitaxel showed loading consistent with that reported
in literature by hydrophobic chemical drugs while 6-carboxyfluoroscein loading
efficiency depended largely on the presence of tris base in the aqueous phase, which
changed the dye solubility in the oil phase and caused precipitation within the oil phase.
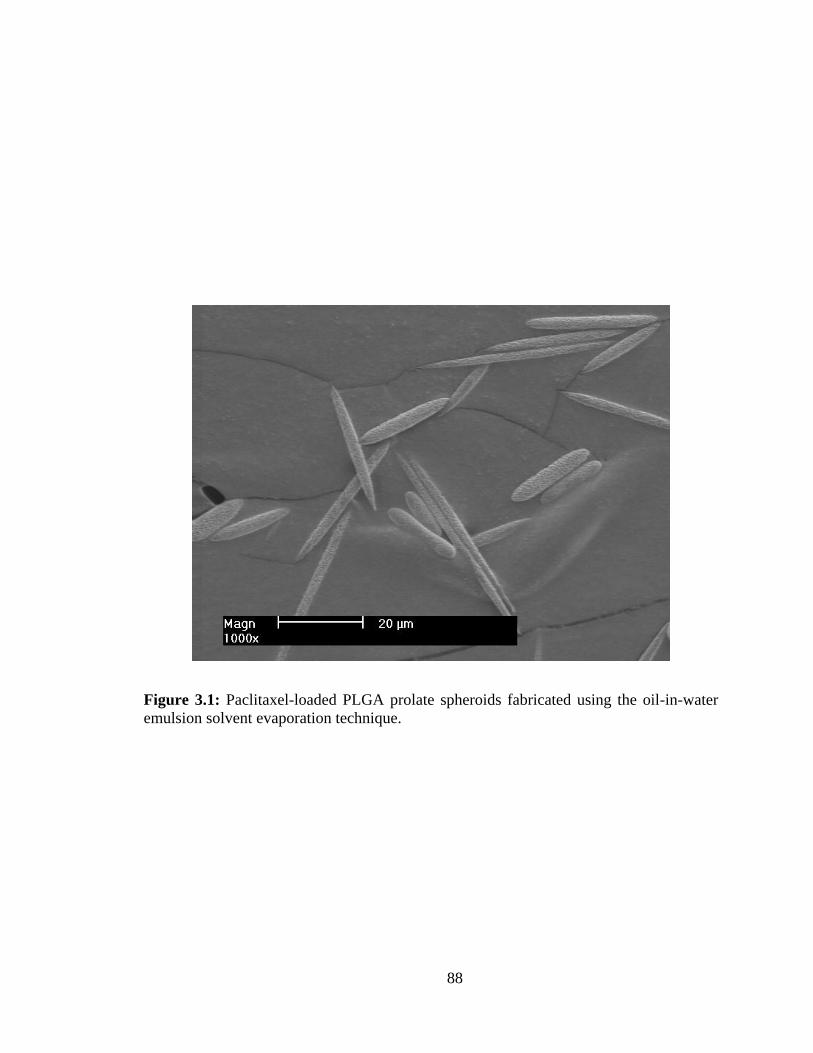
88
Figure 3.1: Paclitaxel-loaded PLGA prolate spheroids fabricated using the oil-in-water
emulsion solvent evaporation technique.
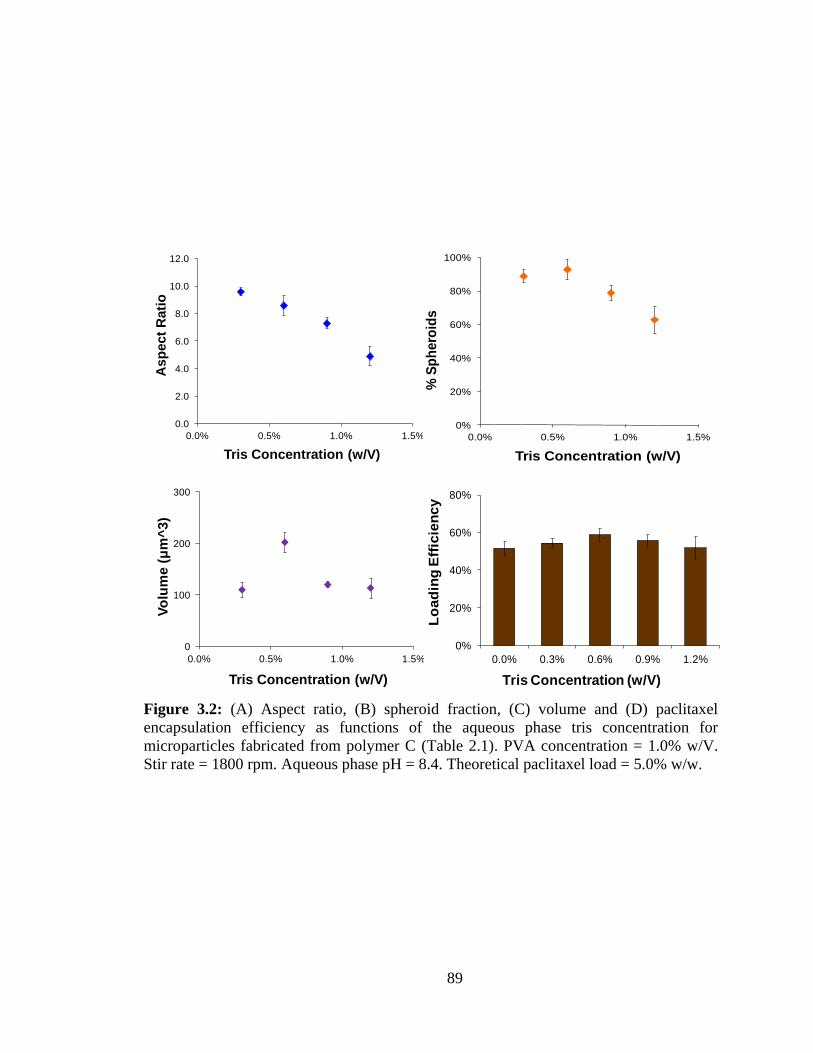
89
0.0
2.0
4.0
6.0
8.0
10.0
12.0
0.0% 0.5% 1.0% 1.5%
As
pect
Rati
o
Tris Concentration (w/V)
0
100
200
300
0.0% 0.5% 1.0% 1.5%
Vo
lum
e (μ
m^
3)
Tris Concentration (w/V)
Figure 3.2: (A) Aspect ratio, (B) spheroid fraction, (C) volume and (D) paclitaxel
encapsulation efficiency as functions of the aqueous phase tris concentration for
microparticles fabricated from polymer C (Table 2.1). PVA concentration = 1.0% w/V.
Stir rate = 1800 rpm. Aqueous phase pH = 8.4. Theoretical paclitaxel load = 5.0% w/w.
0%
20%
40%
60%
80%
0.0% 0.3% 0.6% 0.9% 1.2%
Lo
ad
ing
Eff
icie
ncy
Tris Concentration (w/V)
0%
20%
40%
60%
80%
100%
0.0% 0.5% 1.0% 1.5%%
Sp
hero
ids
Tris Concentration (w/V)

90
0.0
2.0
4.0
6.0
8.0
6 7 8 9 10 11
Asp
ect
Rati
o
Aqueous Phase pH
0
50
100
150
200
250
6 7 8 9 10 11
Vo
lum
e (μ
m^
3)
Aqueous Phase pH
Figure 3.3: (A) Aspect ratio, (B) spheroid fraction, (C) volume and (D) paclitaxel
encapsulation efficiency as functions of the aqueous phase pH for microparticles
fabricated from polymer C. PVA concentration = 1.0% w/V. Tris concentration = 1.2%
w/V. Stir rate = 1800 rpm. Theoretical paclitaxel load = 5.0% w/w.
0%
20%
40%
60%
80%
7 8 8 9 10
Lo
ad
ing
Eff
icie
ncy
Aqueous Phase pH
0%
20%
40%
60%
80%
100%
6 7 8 9 10 11
% S
ph
ero
ids
Aqueous Phase pH
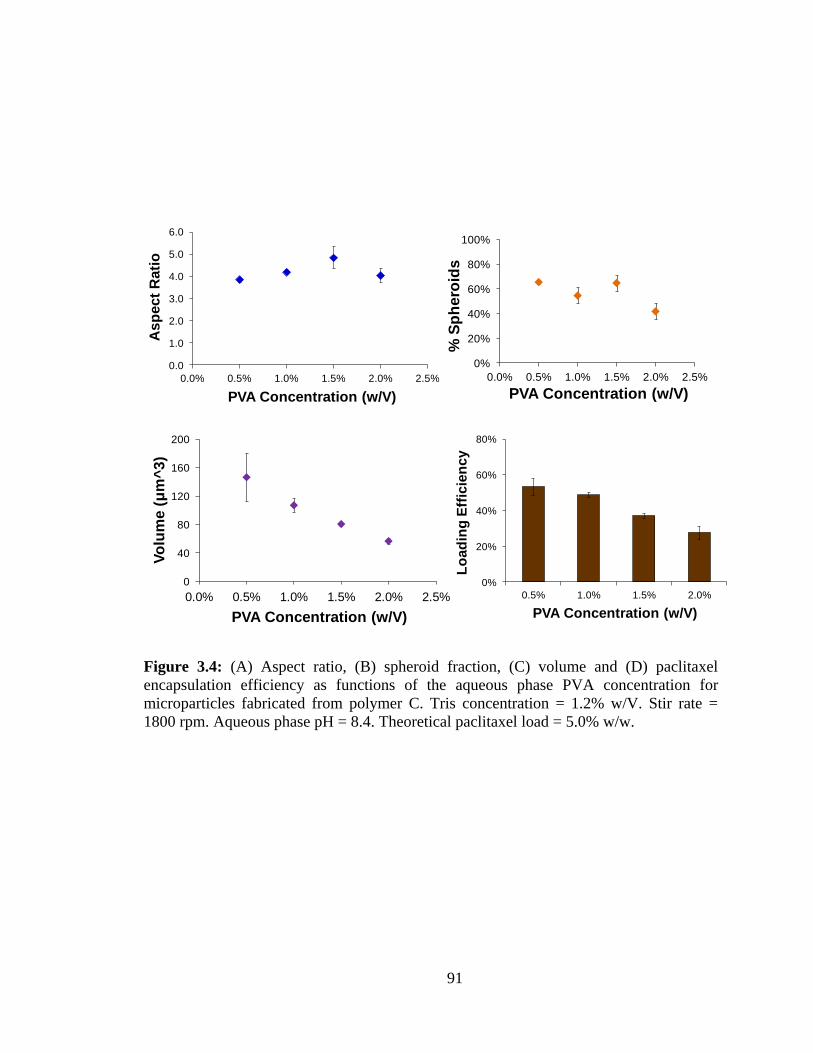
91
0.0
1.0
2.0
3.0
4.0
5.0
6.0
0.0% 0.5% 1.0% 1.5% 2.0% 2.5%
As
pect
Rati
o
PVA Concentration (w/V)
0
40
80
120
160
200
0.0% 0.5% 1.0% 1.5% 2.0% 2.5%
Vo
lum
e (μ
m^
3)
PVA Concentration (w/V)
Figure 3.4: (A) Aspect ratio, (B) spheroid fraction, (C) volume and (D) paclitaxel
encapsulation efficiency as functions of the aqueous phase PVA concentration for
microparticles fabricated from polymer C. Tris concentration = 1.2% w/V. Stir rate =
1800 rpm. Aqueous phase pH = 8.4. Theoretical paclitaxel load = 5.0% w/w.
0%
20%
40%
60%
80%
0.5% 1.0% 1.5% 2.0%
Lo
ad
ing
Eff
icie
ncy
PVA Concentration (w/V)
0%
20%
40%
60%
80%
100%
0.0% 0.5% 1.0% 1.5% 2.0% 2.5%
% S
ph
ero
ids
PVA Concentration (w/V)
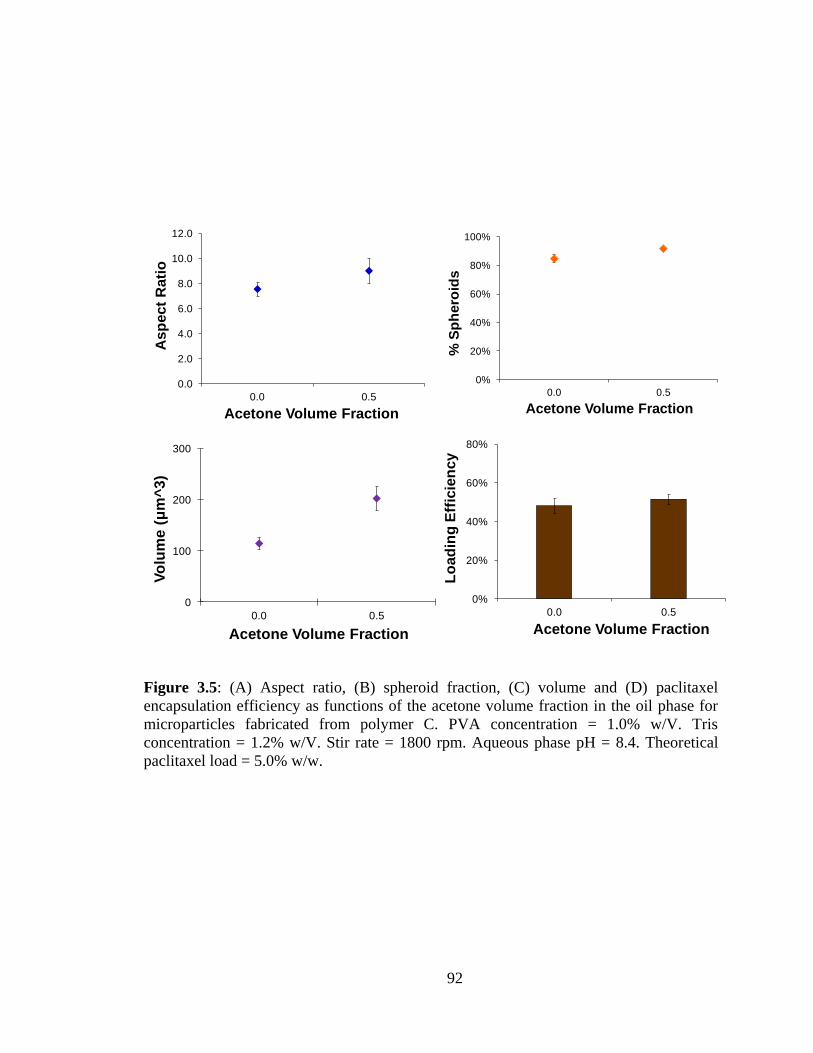
92
0.0
2.0
4.0
6.0
8.0
10.0
12.0
0.0 0.5
Asp
ect
Rati
o
Acetone Volume Fraction
0
100
200
300
0.0 0.5
Vo
lum
e (μ
m^
3)
Acetone Volume Fraction
Figure 3.5: (A) Aspect ratio, (B) spheroid fraction, (C) volume and (D) paclitaxel
encapsulation efficiency as functions of the acetone volume fraction in the oil phase for
microparticles fabricated from polymer C. PVA concentration = 1.0% w/V. Tris
concentration = 1.2% w/V. Stir rate = 1800 rpm. Aqueous phase pH = 8.4. Theoretical
paclitaxel load = 5.0% w/w.
0%
20%
40%
60%
80%
0.0 0.5
Lo
ad
ing
Eff
icie
ncy
Acetone Volume Fraction
0%
20%
40%
60%
80%
100%
0.0 0.5
% S
ph
ero
ids
Acetone Volume Fraction

93
0.0
2.0
4.0
6.0
8.0
10.0
12.0
0 0.09 0.18
Asp
ect
Rati
o
Oil Phase Fraction
0
50
100
150
200
250
0 0.09 0.18
Vo
lum
e (μ
m^
3)
Oil Phase Fraction
Figure 3.6: (A) Aspect ratio, (B) spheroid fraction, (C) volume and (D) paclitaxel
encapsulation efficiency as functions of the oil phase fraction for microparticles
fabricated from polymer C. PVA concentration = 1.0% w/V. Tris concentration = 1.2%
w/V. Stir rate = 1800 rpm. Aqueous phase pH = 8.4. Theoretical paclitaxel load = 5.0%
w/w.
0%
20%
40%
60%
80%
0.09 0.18
Lo
ad
ing
Eff
icie
ncy
Oil Phase Fraction
0%
20%
40%
60%
80%
100%
0 0.09 0.18
% S
ph
ero
ids
Oil Phase Fraction
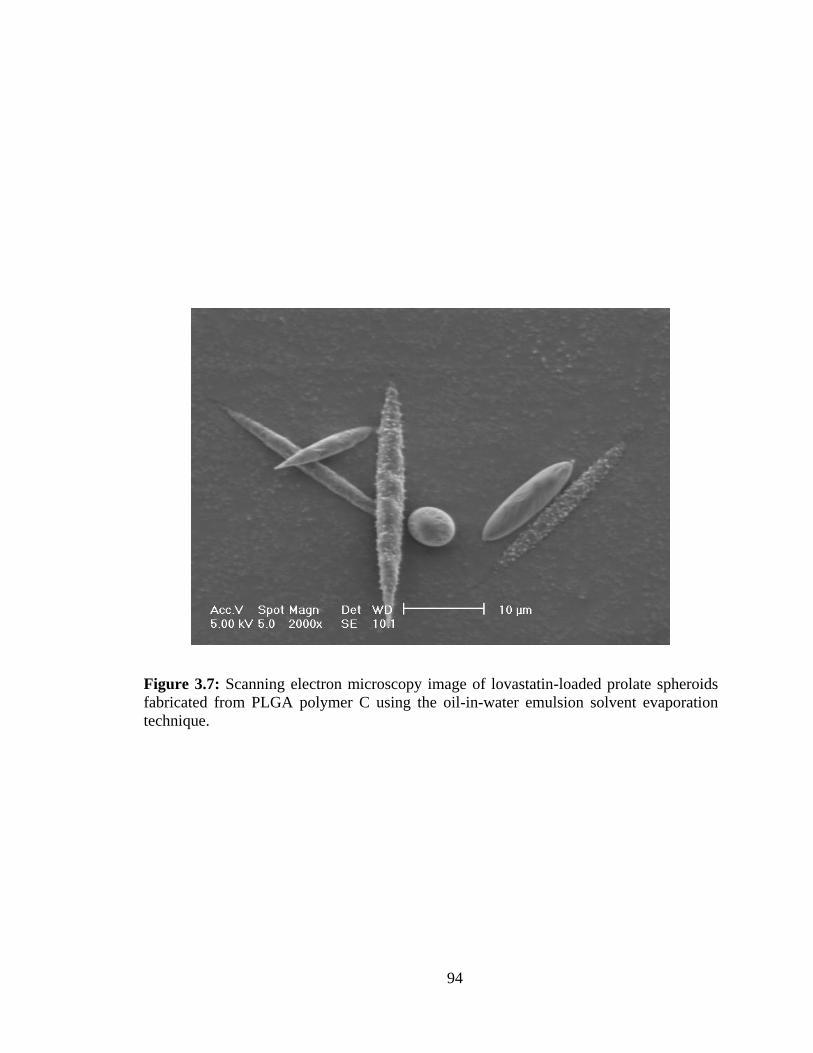
94
Figure 3.7: Scanning electron microscopy image of lovastatin-loaded prolate spheroids
fabricated from PLGA polymer C using the oil-in-water emulsion solvent evaporation
technique.
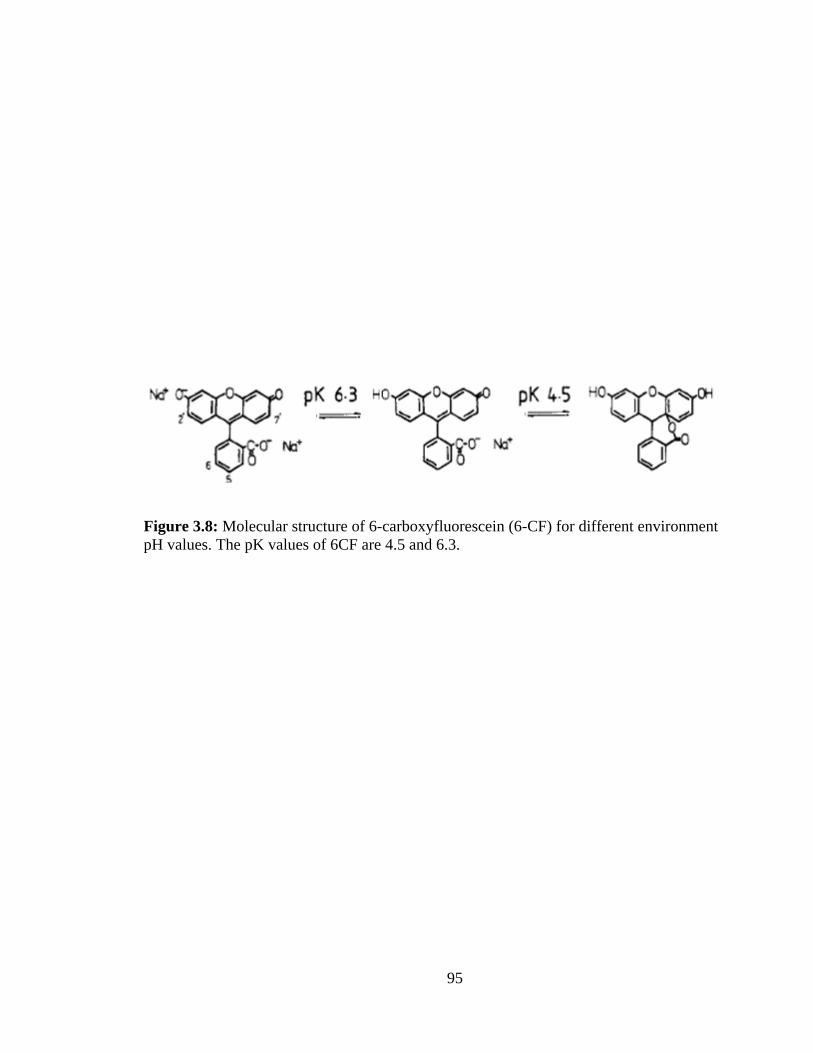
95
Figure 3.8: Molecular structure of 6-carboxyfluorescein (6-CF) for different environment
pH values. The pK values of 6CF are 4.5 and 6.3.
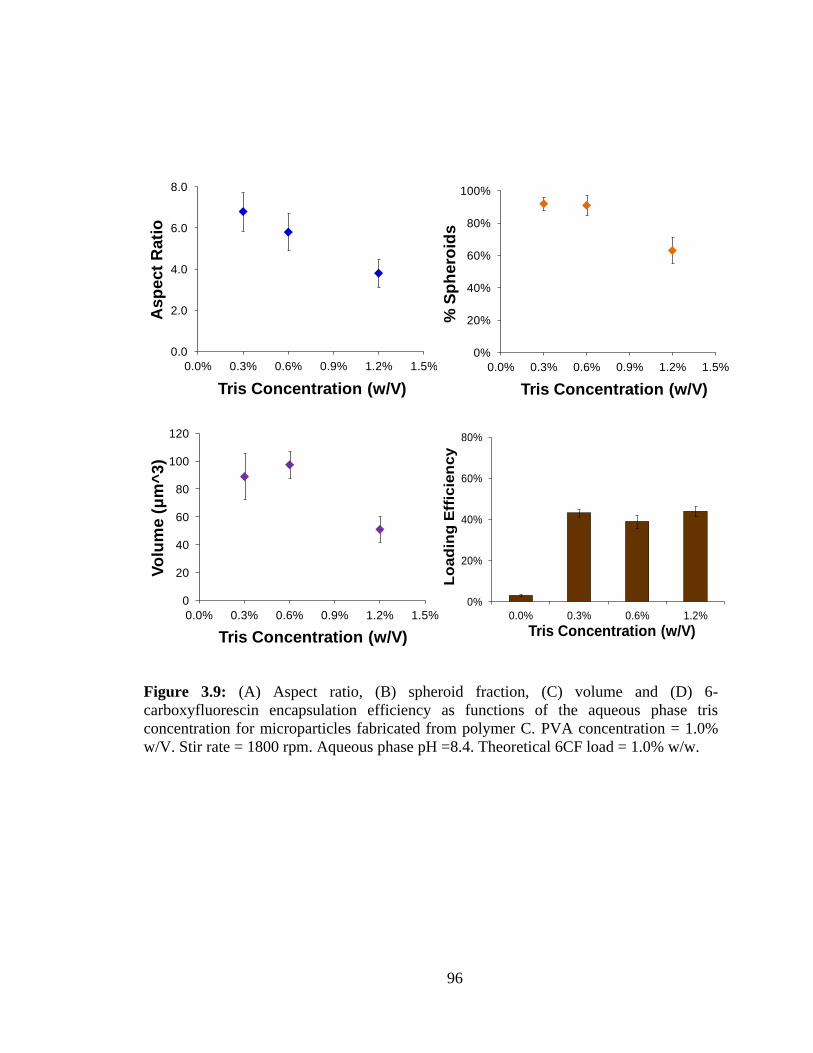
96
0.0
2.0
4.0
6.0
8.0
0.0% 0.3% 0.6% 0.9% 1.2% 1.5%
As
pect
Rati
o
Tris Concentration (w/V)
0
20
40
60
80
100
120
0.0% 0.3% 0.6% 0.9% 1.2% 1.5%
Vo
lum
e (μ
m^
3)
Tris Concentration (w/V)
Figure 3.9: (A) Aspect ratio, (B) spheroid fraction, (C) volume and (D) 6-
carboxyfluorescin encapsulation efficiency as functions of the aqueous phase tris
concentration for microparticles fabricated from polymer C. PVA concentration = 1.0%
w/V. Stir rate = 1800 rpm. Aqueous phase pH =8.4. Theoretical 6CF load = 1.0% w/w.
0%
20%
40%
60%
80%
0.0% 0.3% 0.6% 1.2%
Lo
ad
ing
Eff
icie
nc
y
Tris Concentration (w/V)
0%
20%
40%
60%
80%
100%
0.0% 0.3% 0.6% 0.9% 1.2% 1.5%
% S
ph
ero
ids
Tris Concentration (w/V)

97
Figure 3.10: Confocal microscope images of 6-carboxyfluorescein-loaded spheres and
rods. Loaded spheroids were fabricated with tris in the aqueous phase while loaded
spheres contained no tris in the aqueous phase. Spheres show an even distribution of 6CF
while spheroids show non-uniform 6CF loading due to the precipitation of the drug
within the oil phase due to the presence of tris.
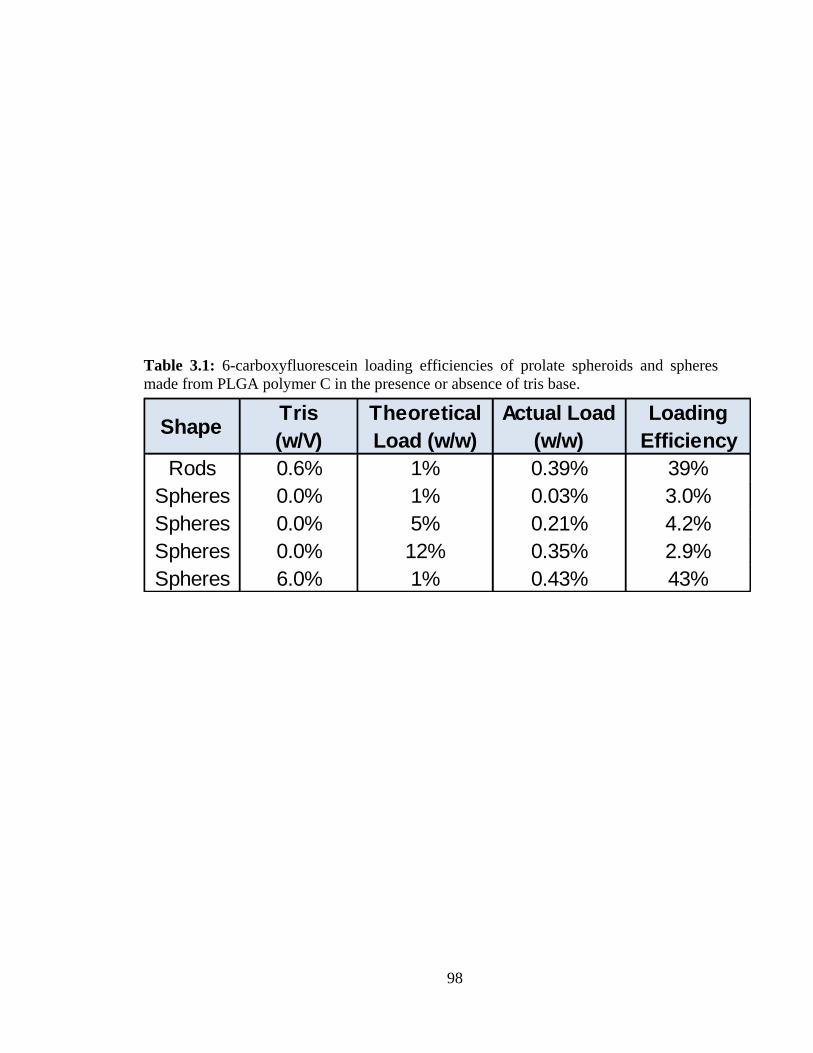
98
Table 3.1: 6-carboxyfluorescein loading efficiencies of prolate spheroids and spheres
made from PLGA polymer C in the presence or absence of tris base.
ShapeTris
(w/V)
Theoretical
Load (w/w)
Actual Load
(w/w)
Loading
Efficiency
Rods 0.6% 1% 0.39% 39%
Spheres 0.0% 1% 0.03% 3.0%
Spheres 0.0% 5% 0.21% 4.2%
Spheres 0.0% 12% 0.35% 2.9%
Spheres 6.0% 1% 0.43% 43%
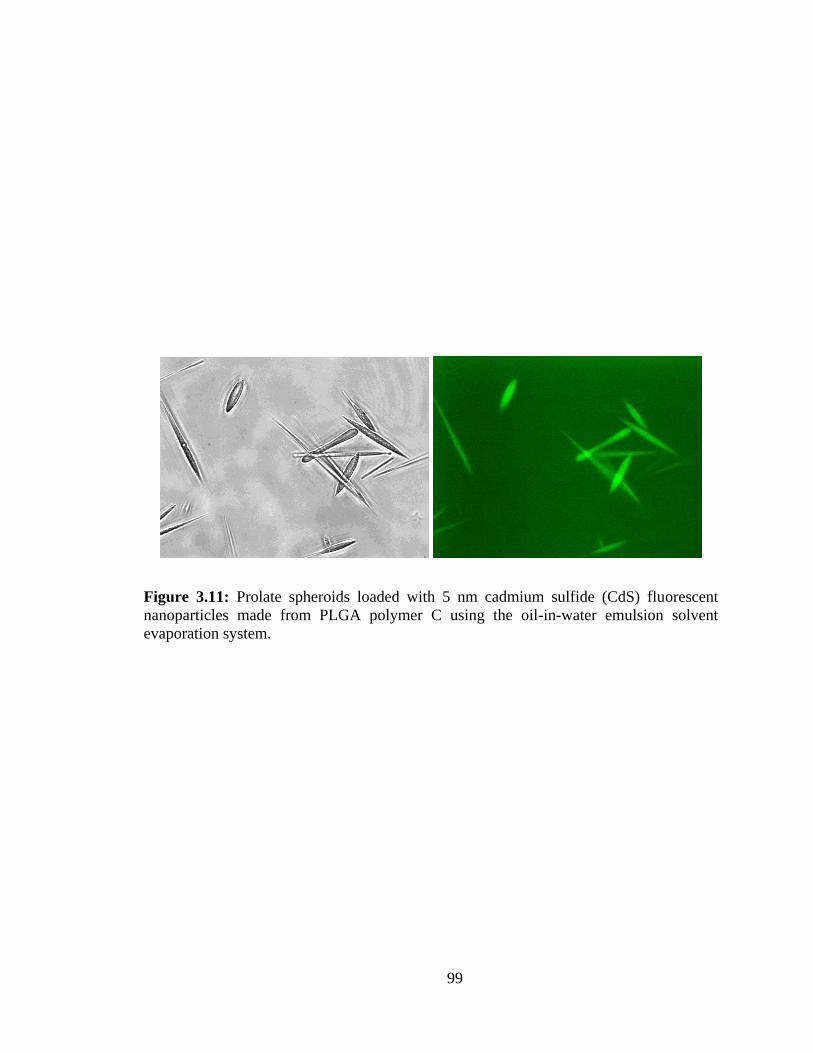
99
Figure 3.11: Prolate spheroids loaded with 5 nm cadmium sulfide (CdS) fluorescent
nanoparticles made from PLGA polymer C using the oil-in-water emulsion solvent
evaporation system.
100
References
[1] S. Baumgartner, J. Kristl, F. Vrecer, P. Vodopivec, B. Zorko, Optimisation of
floating matrix tablets and evaluation of their gastric residence time. Int J Pharm
195(1-2) (2000) 125-135.
[2] Y. El-Malah, S. Nazzal, N.M. Khanfar, D-optimal mixture design: optimization of
ternary matrix blends for controlled zero-order drug release from oral dosage
forms. Drug Dev Ind Pharm 32(10) (2006) 1207-1218.
[3] M.L. Kang, C.S. Cho, H.S. Yoo, Application of chitosan microspheres for nasal
delivery of vaccines. Biotechnol Adv 27(6) (2009) 857-865.
[4] H.S. Mahajan, S.G. Gattani, Nasal administration of ondansetron using a novel
microspheres delivery system. Pharm Dev Technol 14(2) (2009) 226-232.
[5] J.H. Jang, L.D. Shea, Intramuscular delivery of DNA releasing microspheres:
microsphere properties and transgene expression. J Control Release 112(1) (2006)
120-128.
[6] T. Swainston Harrison, G.L. Plosker, S.J. Keam, Extended-release intramuscular
naltrexone. Drugs 66(13) (2006) 1741-1751.
[7] S. Jayaprakash, S. Halith, P.M. Firthouse, K. Kulaturanpillai, Abhijith, M.
Nagarajan, Preparation and evaluation of biodegradable microspheres of
methotrexate. Asian Journal of Pharmaceutics 3(1) (2009) 26-29.
[8] R.C. Siwale, C.W. Oettinger, S.B. Pai, R. Addo, N. Uddin, A. Siddig, M.J.
D'Souza, Formulation and characterization of catalase in albumin microspheres. J
Microencapsul 26(5) (2009) 411-419.
[9] P.H. Tran, T.T. Tran, J.B. Park, B.J. Lee, Controlled release systems containing
solid dispersions: strategies and mechanisms. Pharm Res 28(10) 2353-2378.
[10] G. Richardson, R. Dobish, Chemotherapy induced diarrhea. J Oncol Pharm Pract
13(4) (2007) 181-198.
[11] S.F. Chen, T.H. Hung, C.C. Chen, K.H. Lin, Y.N. Huang, H.C. Tsai, J.Y. Wang,
Lovastatin improves histological and functional outcomes and reduces
inflammation after experimental traumatic brain injury. Life Sci 81(4) (2007)
288-298.
[12] R. Lin, J. Liu, N. Peng, G. Yang, W. Gan, W. Wang, Lovastatin reduces nuclear
factor kappaB activation induced by C-reactive protein in human vascular
endothelial cells. Biol Pharm Bull 28(9) (2005) 1630-1634.
[13] J.S. Pober, W.C. Sessa, Evolving functions of endothelial cells in inflammation.
Nat Rev Immunol 7(10) (2007) 803-815.
[14] R. Bodmeier, J.W. McGinity, Polylactic acid microspheres containing quinidine
base and quinidine sulphate prepared by the solvent evaporation method. III.
Morphology of the microspheres during dissolution studies. J Microencapsul 5(4)
(1988) 325-330.
[15] Y. Yeo, K. Park, Control of encapsulation efficiency and initial burst in polymeric
microparticle systems. Arch Pharm Res 27(1) (2004) 1-12.
101
[16] L. Mu, S.S. Feng, A novel controlled release formulation for the anticancer drug
paclitaxel (Taxol): PLGA nanoparticles containing vitamin E TPGS. J Control
Release 86(1) (2003) 33-48.
[17] K. Frauke Pistel, A. Breitenbach, R. Zange-Volland, T. Kissel, Brush-like
branched biodegradable polyesters, part III. Protein release from microspheres of
poly(vinyl alcohol)-graft-poly(D,L-lactic-co-glycolic acid). J Control Release
73(1) (2001) 7-20.
[18] Rahul C. Mehta, B.C. Thanoo, P.P. Deluca, Peptide containing microspheres from
low molecular weight and hydrophilic poly(d,l-lactide-co-glycolide). Journal of
Controlled Release 41(3) (1996) 249-257.
[19] G. Ruan, S.S. Feng, Preparation and characterization of poly(lactic acid)-
poly(ethylene glycol)-poly(lactic acid) (PLA-PEG-PLA) microspheres for
controlled release of paclitaxel. Biomaterials 24(27) (2003) 5037-5044.
[20] B.B. Youan, M.A. Benoit, B. Baras, J. Gillard, Protein-loaded poly(epsilon-
caprolactone) microparticles. I. Optimization of the preparation by (water-in-oil)-
in water emulsion solvent evaporation. J Microencapsul 16(5) (1999) 587-599.
[21] W. Chaisri, W.E. Hennink, S. Okonogi, Preparation and characterization of
cephalexin loaded PLGA microspheres. Curr Drug Deliv 6(1) (2009) 69-75.
[22] T.G. Park, H. Yong Lee, Y. Sung Nam, A new preparation method for protein
loaded poly(D, L-lactic-co-glycolic acid) microspheres and protein release
mechanism study. J Control Release 55(2-3) (1998) 181-191.
[23] M. Habib, S. Onyilofor, N.K. Ebube, G. Owusu-Ababio, Preparation and
characterization of ofloxacin microspheres for the eradication of bone associated
bacterial biofilm. J Microencapsul 16(1) (1999) 27-37.
[24] Q. Yang, G. Owusu-Ababio, Biodegradable progesterone microsphere delivery
system for osteoporosis therapy. Drug Dev Ind Pharm 26(1) (2000) 61-70.
[25] C. Wang, W. Ye, Y. Zheng, X. Liu, Z. Tong, Fabrication of drug-loaded
biodegradable microcapsules for controlled release by combination of solvent
evaporation and layer-by-layer self-assembly. Int J Pharm 338(1-2) (2007) 165-
173.
[26] D.K. Armstrong, B. Bundy, L. Wenzel, H.Q. Huang, R. Baergen, S. Lele, L.J.
Copeland, J.L. Walker, R.A. Burger, Intraperitoneal cisplatin and paclitaxel in
ovarian cancer. N Engl J Med 354(1) (2006) 34-43.
[27] A. Sandler, R. Gray, M.C. Perry, J. Brahmer, J.H. Schiller, A. Dowlati, R.
Lilenbaum, D.H. Johnson, Paclitaxel-carboplatin alone or with bevacizumab for
non-small-cell lung cancer. N Engl J Med 355(24) (2006) 2542-2550.
[28] J.A. Sparano, M. Wang, S. Martino, V. Jones, E.A. Perez, T. Saphner, A.C.
Wolff, G.W. Sledge, Jr., W.C. Wood, N.E. Davidson, Weekly paclitaxel in the
adjuvant treatment of breast cancer. N Engl J Med 358(16) (2008) 1663-1671.
[29] J.M. Chan, J.W. Rhee, C.L. Drum, R.T. Bronson, G. Golomb, R. Langer, O.C.
Farokhzad, In vivo prevention of arterial restenosis with paclitaxel-encapsulated
targeted lipid-polymeric nanoparticles. Proc Natl Acad Sci U S A 108(48) 19347-
19352.
102
[30] M.D. Bhavsar, S.B. Tiwari, M.M. Amiji, Formulation optimization for the
nanoparticles-in-microsphere hybrid oral delivery system using factorial design. J
Control Release 110(2) (2006) 422-430.
[31] S. Feng, G. Huang, Effects of emulsifiers on the controlled release of paclitaxel
(Taxol) from nanospheres of biodegradable polymers. J Control Release 71(1)
(2001) 53-69.
[32] L. Mu, S.S. Feng, Vitamin E TPGS used as emulsifier in the solvent
evaporation/extraction technique for fabrication of polymeric nanospheres for
controlled release of paclitaxel (Taxol). J Control Release 80(1-3) (2002) 129-
144.
[33] H. Suh, B. Jeong, R. Rathi, S.W. Kim, Regulation of smooth muscle cell
proliferation using paclitaxel-loaded poly(ethylene oxide)-poly(lactide/glycolide)
nanospheres. J Biomed Mater Res 42(2) (1998) 331-338.
[34] K. Holmberg, B. Jonsson, B. Kronberg, B. Lindman, Surfactants and Polymers in
Aqueous Solution, Wiley, West Sussex, 2002.
[35] L. Kong, J.K.Beattie, R.J.Hunter, Electroacoustic determination of size and
charge of sunflower oil-in –water emulsions made by high -pressure
homogenising. Chemical Engineering and Processing: Process Intensification
40(5) (2001) 421-429.
[36] L. Kong, J.K. Beattie, R.J. Hunter, Electroacoustic Study of Concentrated Oil-in-
Water Emulsions. J Colloid Interface Sci 238(1) (2001) 70-79.
[37] M. Heslinga, T. Porter, O. Eniola-Adefeso, Design of nanovectors for therapy and
imaging of cardiovascular diseases. Methodist DeBakey Cardiovascular (In print).
[38] J. Bramhall, J. Hofmann, R. DeGuzman, S. Montestruque, R. Schell, Temperature
dependence of membrane ion conductance analyzed by using the amphiphilic
anion 5/6-carboxyfluorescein. Biochemistry 26(20) (1987) 6330-6340.
[39] M. Beck-Broichsitter, J. Gauss, C.B. Packhaeuser, K. Lahnstein, T. Schmehl, W.
Seeger, T. Kissel, T. Gessler, Pulmonary drug delivery with aerosolizable
nanoparticles in an ex vivo lung model. Int J Pharm 367(1-2) (2009) 169-178.
[40] J.A. Champion, A. Walker, S. Mitragotri, Role of particle size in phagocytosis of
polymeric microspheres. Pharm Res 25(8) (2008) 1815-1821.
[41] T. Cedervall, I. Lynch, S. Lindman, T. Berggard, E. Thulin, H. Nilsson, K.A.
Dawson, S. Linse, Understanding the nanoparticle-protein corona using methods
to quantify exchange rates and affinities of proteins for nanoparticles. Proc Natl
Acad Sci U S A 104(7) (2007) 2050-2055.
[42] C. Fang, B. Shi, Y.Y. Pei, M.H. Hong, J. Wu, H.Z. Chen, In vivo tumor targeting
of tumor necrosis factor-alpha-loaded stealth nanoparticles: effect of MePEG
molecular weight and particle size. Eur J Pharm Sci 27(1) (2006) 27-36.
[43] P. Charoenphol, R.B. Huang, O. Eniola-Adefeso, Potential role of size and
hemodynamics in the efficacy of vascular-targeted spherical drug carriers.
Biomaterials 31(6) 1392-1402.

103
[44] P. Charoenphol, S. Mocherla, D. Bouis, K. Namdee, D.J. Pinsky, O. Eniola-
Adefeso, Targeting therapeutics to the vascular wall in atherosclerosis--carrier
size matters. Atherosclerosis 217(2) 364-370.
[45] R.B. Huang, S. Mocherla, M.J. Heslinga, P. Charoenphol, O. Eniola-Adefeso,
Dynamic and cellular interactions of nanoparticles in vascular-targeted drug
delivery (review). Mol Membr Biol 27(4-6) 190-205.
[46] E. Simone, B.S. Ding, V. Muzykantov, Targeted delivery of therapeutics to
endothelium. Cell Tissue Res 335(1) (2009) 283-300.
[47] J.S. Ananta, B. Godin, R. Sethi, L. Moriggi, X. Liu, R.E. Serda, R.
Krishnamurthy, R. Muthupillai, R.D. Bolskar, L. Helm, M. Ferrari, L.J. Wilson,
P. Decuzzi, Geometrical confinement of gadolinium-based contrast agents in
nanoporous particles enhances T1 contrast. Nat Nanotechnol 5(11) 815-821.
[48] A.C. Langheinrich, D.G. Sedding, M. Kampschulte, R. Moritz, J. Wilhelm, W.G.
Haberbosch, E.L. Ritman, R.M. Bohle, 3-Deazaadenosine inhibits vasa vasorum
neovascularization in aortas of ApoE(-/-)/LDL(-/-) double knockout mice.
Atherosclerosis 202(1) (2009) 103-110.
[49] R.C. Maranhao, E.R. Tavares, A.F. Padoveze, C.J. Valduga, D.G. Rodrigues,
M.D. Pereira, Paclitaxel associated with cholesterol-rich nanoemulsions promotes
atherosclerosis regression in the rabbit. Atherosclerosis 197(2) (2008) 959-966.
[50] H.M. Kwon, G. Sangiorgi, E.L. Ritman, A. Lerman, C. McKenna, R. Virmani,
W.D. Edwards, D.R. Holmes, R.S. Schwartz, Adventitial vasa vasorum in
balloon-injured coronary arteries: visualization and quantitation by a microscopic
three-dimensional computed tomography technique. J Am Coll Cardiol 32(7)
(1998) 2072-2079.

104
CHAPTER IV
Loading protein therapeutics via the water-in-oil-in-water (W/O/W)
emulsion solvent evaporation technique
Introduction
Loading of bovine serum albumin into PLGA spheroids
Recent advances in the number of protein and peptide drugs available for
therapeutic treatment of several diseases, including many cardiovascular diseases, has
created the need for methods to effectively administer these protein drugs [1-4].
Controlled, targeted release of this class of therapeutics may be required in many cases
due to the poor bioavailability of these therapeutics through non-parenteral routes. For
example, oral administration is impractical for proteins and peptides due to the
degradation and poor uptake in the gastrointestinal tract. Additionally, proteins drugs
typically have short half-lives in the body due to natural clearance processes, requiring
repeated dosing.
The encapsulation of protein drugs within injectable, targeted microparticles made
from biodegradable polymers for controlled drug release at the site of disease offers
potential for increasing the efficacy of these therapeutics and maintaining necessary

105
concentrations at affected tissues. Oil-in-water emulsions are not useful for making
protein-loaded particles due to poor solubility and possible damage to the therapeutic in
the oil phase. Therefore, encapsulation of pharmaceutical proteins into biodegradable
drug carriers has typically used water-in-oil-in-water (W/O/W) double emulsion
techniques in order to stabilize the protein and improve loading efficiency over single
emulsion techniques [5, 6]. In the W/O/W technique, the protein is loaded into the inner
aqueous phase and a primary emulsion is made by mixing with the oil phase containing
the biodegradable polymer. A secondary emulsion is made by injection of the W/O
emulsion into the outer aqueous phase. The oil phase acts as a barrier to separate the two
aqueous phases, permitting high encapsulation efficiency while the protein remains stable
in the inner water phase.
Bovine serum albumin (BSA) is attractive as due to its common use in protein
assays as well as its stability, low reactivity and low cost. As such, BSA is a prototypical
protein drug that has previously been loaded into PLGA particles [7-10]. Serum albumin
is the most abundant plasma protein in mammals and is utilized in the body to maintain
the osmotic pressure of plasma in order to stabilize the extracellular fluid volume. It is a
soluble serum protein with molecular weight around 66 kDa and comprises about half of
the blood serum protein by mass. Bovine serum albumin was loaded as a model protein
drug and as a demonstration of the production of rods from the W/O/W solvent
evaporation method in order to expand the range of usable therapeutics from small,
hydrophobic chemical drugs to protein drugs.

106
Experimental methods
Microparticle fabrication and characterization
Bovine serum albumin-loaded microparticles were fabricated from PLGA
polymer using the water-in-oil-in-water emulsion solvent evaporation method.
Specifically, the inner water phase consisted of 2.5 mg BSA and 0.5% w/V PVA in 0.5
ml deionized water. The oil phase contained 49.5 mg PLGA polymer (polymer C, Table
2.1) dissolved in 10 ml dichloromethane. The outer water phase contained 3.0% w/V
PVA and 0.6% w/V tris dissolved in 100 ml deionized water held at pH 9.0 through the
addition of hydrochloric acid. A primary emulsion was formed via mixing of the inner
water phase with the oil phase followed by sonication of the emulsion at 10W for 60
seconds with a 3 mm sonication probe. The primary emulsion was injected into the outer
water phase over 30 seconds and stirred at 1800 rpm for 3 hours at room temperature.
Resultant particles were collected and washed three times via centrifugation at 750 rpm
in deionized water as described in Chapter II. Particle size and shape were characterized
via light and scanning electron microscopy as described in Chapter II. BSA-loaded
PLGA particles displayed rough surface characteristics as shown in Figure 4.1.
Characterization of drug load and encapsulation efficiency
Drug load and encapsulation efficiency for BSA-loaded microparticles were
determined by dissolving dried microparticles in dichloromethane 30 minutes. One mg of
freeze-dried particles loaded with the BSA was dissolved in 5 ml dichloromethane over
30 minutes. The BSA was then extracted into deionized water through liquid-liquid
extraction with deionized water over one hour. The BSA-rich aqueous phase was
removed and its BSA concentration evaluated using UV absorbance at 280 nm and
107
comparing readings to calibration curves generated using free BSA and PLGA polymer.
Drug loading was calculated to be the mass of entrapped paclitaxel divided by the mass
of freeze-dried microparticles. Encapsulation efficiency was calculated as the ratio of
entrapped drug mass fraction to that of the drug mass fraction present in the oil phase
during fabrication.
Results and Discussion
The effect of polyvinyl alcohol on bovine serum albumin-loaded PLGA particles
PLGA particles were fabricated with 2.5% w/w theoretical load BSA using the
W/O/W ESE technique at PVA concentrations varying from 1.0% to 4.0% w/V in the
aqueous buffer with 0.6% w/V tris base concentration at constant aqueous phase pH 9.0.
As the PVA concentration increased from 1.0% to 3.0% w/V, the resultant particles
increased in fraction spheroids from 42% to 86% and average particle aspect ratio from
2.9 to 5.2 (Figure 4.2). Further increase in PVA up to 4.0% w/V decreased the fraction
spheroids to 70% and particle aspect ratio to 4.0. Additionally, the average particle
volume decreased with increasing PVA concentration, decreasing from 1000 to 160 µm3
as PVA concentration increased from 1.0 to 4.0% w/V.
Particle size and shape follow the same trend as observed in unloaded and
paclitaxel-loaded particles (Chapters II and III). PVA acts in a dual role in this emulsion
system; it acts as the surfactant leading to the droplet formation through emulsification
and also acts to increase aqueous phase viscosity. Increasing the continuous phase
viscosity increases the capillary number and decreases the viscosity ratio, leading to not
only increased droplet deformation but also droplet breakup [11]. There is a tradeoff

108
between deformation and breakup that is dominated by decreasing droplet size through
breakup at high PVA concentrations.
Unlike the trend observed for the hydrophobic drug paclitaxel in the O/W ESE
technique, the encapsulation efficiency of BSA increased with increasing PVA
concentration in the aqueous buffer (Figure 4.2). As was the case in the loading of
paclitaxel, high PVA concentrations in the aqueous phase led to the crowding of the
interface between the phases. While this slowed the solvent removal that led to decreased
loading efficiency with paclitaxel, in the W/O/W system the crowded interface serves to
prevent the large BSA molecules from crossing the interface due to their high molecular
weight. Additionally, increased surfactant concentration on the surface decreases the
chance that inner water phase droplets merge with the outer water phase upon contact by
stabilizing the interface and the inner water phase droplets. Therefore, high encapsulation
efficiencies of BSA, up to 95%, were observed at high PVA concentrations.
The effect of aqueous phase pH on bovine serum albumin-loaded PLGA particles
The effect of external aqueous phase pH ranging from 5.0 to 10.0 was observed
for BSA-loaded particles in the W/O/W ESE method. The pH of the aqueous phase was
modified via the addition of either hydrochloric acid (pH 5.0, 7.0, 8.4, 9.0) or sodium
hydroxide (pH 10.0) since the pH of the water phase started at 9.1 prior to titration.
Similar to unloaded particles, basic external water phase pH was required for the
formation of spheroids as all spheres were produced at pH 5.0 and few rods at pH 7.0. As
the aqueous phase pH increased from 5.0 to 8.4, particle elongation (aspect ratio)
increased from 1.0 to 6.4 and spheroid fraction increased from 0% to 88% (Figure 4.3).
Further increase up to pH 10.0 produced no significant difference in spheroid fraction,
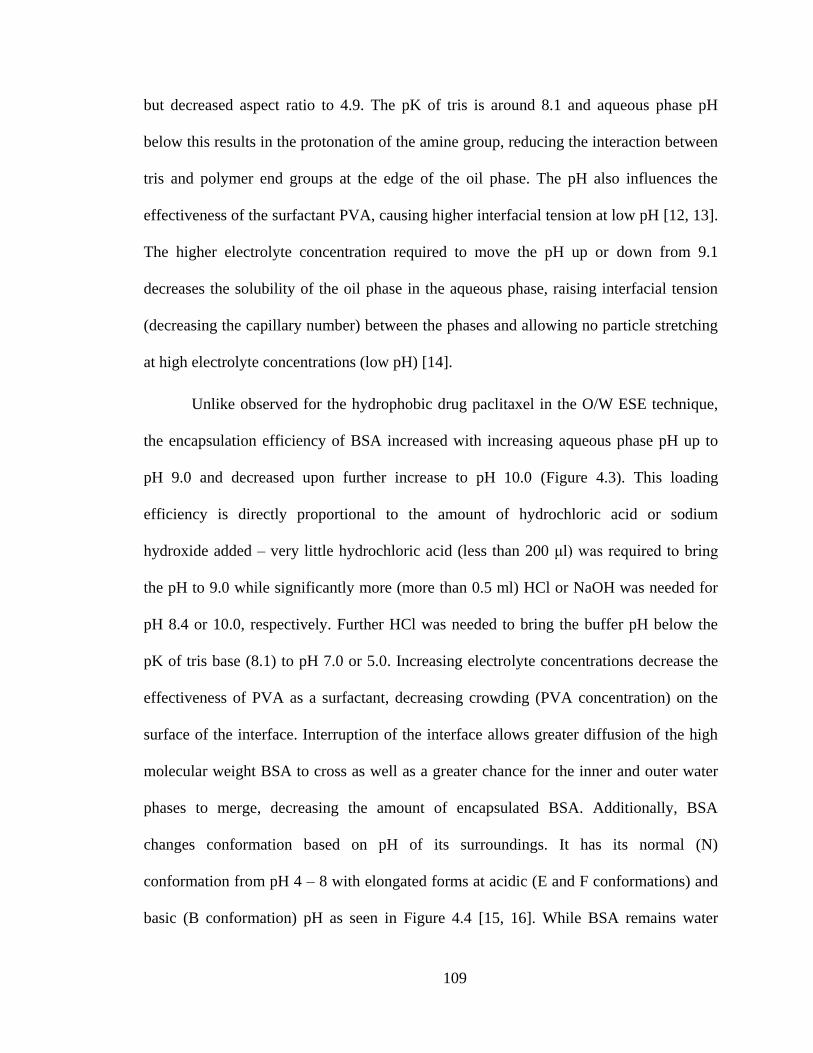
109
but decreased aspect ratio to 4.9. The pK of tris is around 8.1 and aqueous phase pH
below this results in the protonation of the amine group, reducing the interaction between
tris and polymer end groups at the edge of the oil phase. The pH also influences the
effectiveness of the surfactant PVA, causing higher interfacial tension at low pH [12, 13].
The higher electrolyte concentration required to move the pH up or down from 9.1
decreases the solubility of the oil phase in the aqueous phase, raising interfacial tension
(decreasing the capillary number) between the phases and allowing no particle stretching
at high electrolyte concentrations (low pH) [14].
Unlike observed for the hydrophobic drug paclitaxel in the O/W ESE technique,
the encapsulation efficiency of BSA increased with increasing aqueous phase pH up to
pH 9.0 and decreased upon further increase to pH 10.0 (Figure 4.3). This loading
efficiency is directly proportional to the amount of hydrochloric acid or sodium
hydroxide added – very little hydrochloric acid (less than 200 μl) was required to bring
the pH to 9.0 while significantly more (more than 0.5 ml) HCl or NaOH was needed for
pH 8.4 or 10.0, respectively. Further HCl was needed to bring the buffer pH below the
pK of tris base (8.1) to pH 7.0 or 5.0. Increasing electrolyte concentrations decrease the
effectiveness of PVA as a surfactant, decreasing crowding (PVA concentration) on the
surface of the interface. Interruption of the interface allows greater diffusion of the high
molecular weight BSA to cross as well as a greater chance for the inner and outer water
phases to merge, decreasing the amount of encapsulated BSA. Additionally, BSA
changes conformation based on pH of its surroundings. It has its normal (N)
conformation from pH 4 – 8 with elongated forms at acidic (E and F conformations) and
basic (B conformation) pH as seen in Figure 4.4 [15, 16]. While BSA remains water
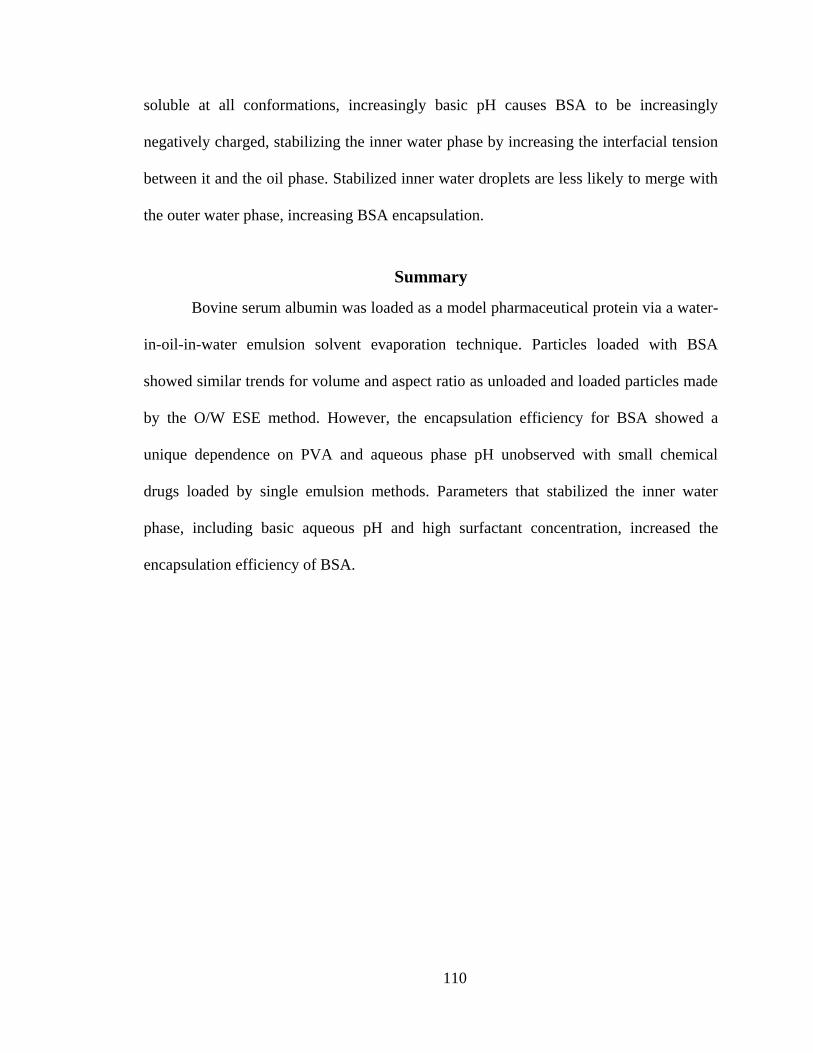
110
soluble at all conformations, increasingly basic pH causes BSA to be increasingly
negatively charged, stabilizing the inner water phase by increasing the interfacial tension
between it and the oil phase. Stabilized inner water droplets are less likely to merge with
the outer water phase, increasing BSA encapsulation.
Summary
Bovine serum albumin was loaded as a model pharmaceutical protein via a water-
in-oil-in-water emulsion solvent evaporation technique. Particles loaded with BSA
showed similar trends for volume and aspect ratio as unloaded and loaded particles made
by the O/W ESE method. However, the encapsulation efficiency for BSA showed a
unique dependence on PVA and aqueous phase pH unobserved with small chemical
drugs loaded by single emulsion methods. Parameters that stabilized the inner water
phase, including basic aqueous pH and high surfactant concentration, increased the
encapsulation efficiency of BSA.
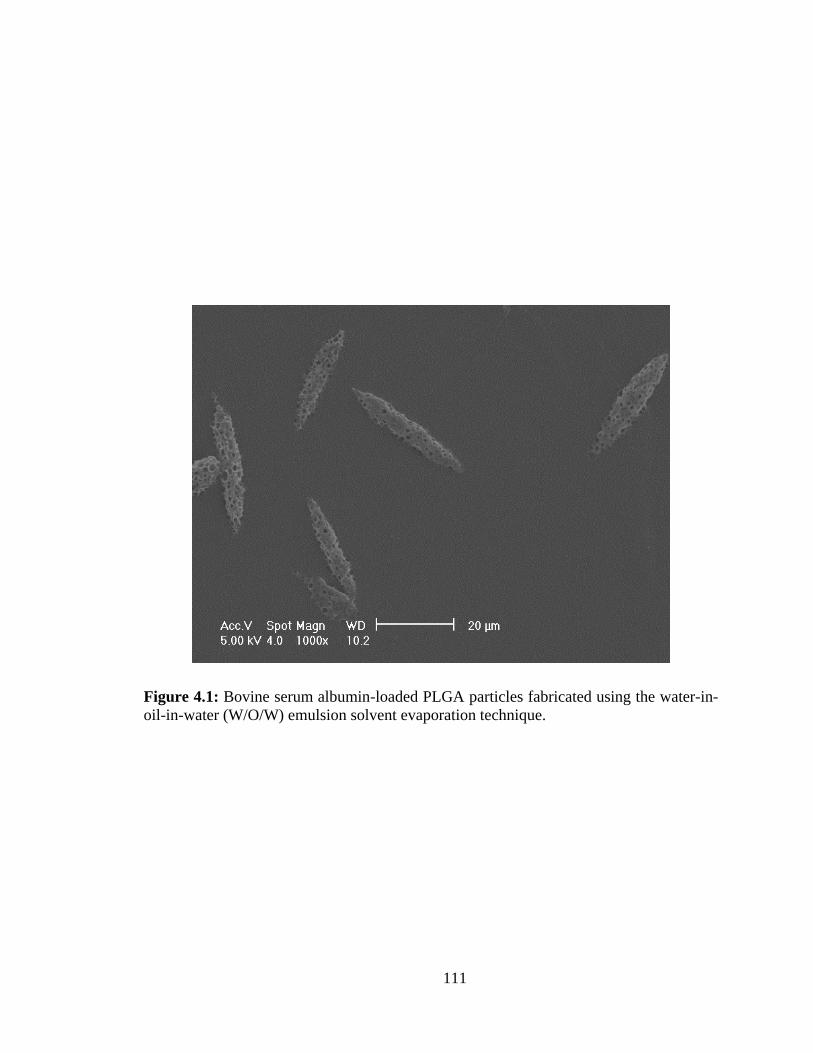
111
Figure 4.1: Bovine serum albumin-loaded PLGA particles fabricated using the water-in-
oil-in-water (W/O/W) emulsion solvent evaporation technique.
112
0.0
1.0
2.0
3.0
4.0
5.0
6.0
0% 1% 2% 3% 4% 5%
Asp
ect
Rati
o
PVA Concentration (w/V)
0
200
400
600
800
1000
1200
0% 1% 2% 3% 4% 5%
Vo
lum
e (μ
m^
3)
PVA Concentration (w/V)
Figure 4.2: (A) Aspect ratio, (B) spheroid fraction, (C) volume and (D) encapsulation
efficiency of bovine serum albumin as functions of the PVA concentration for
microparticles fabricated from polymer C. Tris concentration = 0.6% w/V. Stir rate =
1800 rpm. Aqueous phase pH = 9.0. Theoretical BSA load = 2.5% w/w.
0%
20%
40%
60%
80%
100%
120%
1% 2% 3% 4%
PVA Concentration (w/V)
Lo
ad
ing
Eff
icie
ncy
0%
20%
40%
60%
80%
100%
0% 1% 2% 3% 4% 5%
% S
ph
ero
ids
PVA Concentration (w/V)
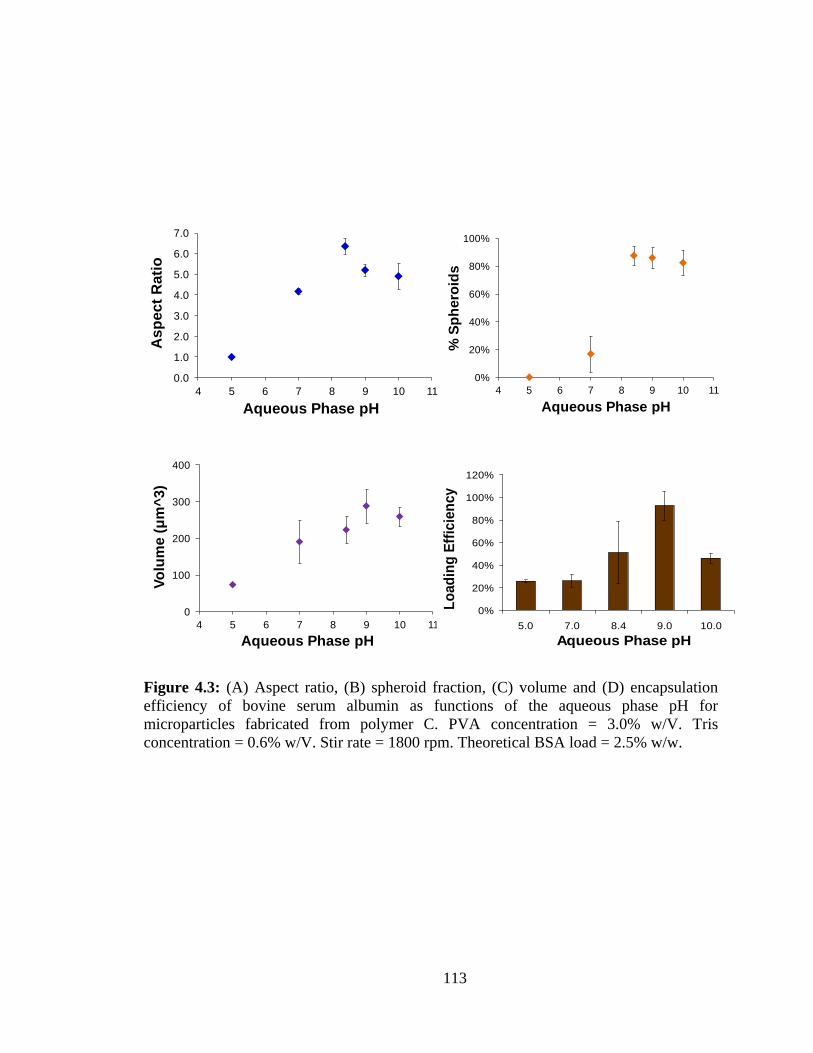
113
0.0
1.0
2.0
3.0
4.0
5.0
6.0
7.0
4 5 6 7 8 9 10 11
As
pect
Rati
o
Aqueous Phase pH
0
100
200
300
400
4 5 6 7 8 9 10 11
Vo
lum
e (μ
m^
3)
Aqueous Phase pH
Figure 4.3: (A) Aspect ratio, (B) spheroid fraction, (C) volume and (D) encapsulation
efficiency of bovine serum albumin as functions of the aqueous phase pH for
microparticles fabricated from polymer C. PVA concentration = 3.0% w/V. Tris
concentration = 0.6% w/V. Stir rate = 1800 rpm. Theoretical BSA load = 2.5% w/w.
0%
20%
40%
60%
80%
100%
120%
5.0 7.0 8.4 9.0 10.0
Aqueous Phase pH
Lo
ad
ing
Eff
icie
ncy
0%
20%
40%
60%
80%
100%
4 5 6 7 8 9 10 11
% S
ph
ero
ids
Aqueous Phase pH

114
Figure 4.4: The dependence of isometric forms of bovine serum albumin on
environmental pH [15].

115
References
[1] H.J. Wang, Z.X. Lin, X.M. Liu, S.Y. Sheng, J.Y. Wang, Heparin-loaded zein
microsphere film and hemocompatibility. J Control Release 105(1-2) (2005) 120-
131.
[2] J.F. Tobin, A.J. Celeste, Bone morphogenetic proteins and growth differentiation
factors as drug targets in cardiovascular and metabolic disease. Drug Discov
Today 11(9-10) (2006) 405-411.
[3] L. Li, H. Okada, G. Takemura, M. Esaki, H. Kobayashi, H. Kanamori, I.
Kawamura, R. Maruyama, T. Fujiwara, H. Fujiwara, Y. Tabata, S. Minatoguchi,
Sustained release of erythropoietin using biodegradable gelatin hydrogel
microspheres persistently improves lower leg ischemia. J Am Coll Cardiol 53(25)
(2009) 2378-2388.
[4] R. Nicolete, M. Lima Kde, J.M. Junior, P.J. Jose, M.J. Sanz, L.H. Faccioli,
Prostaglandin E(2)-loaded microspheres as strategy to inhibit phagocytosis and
modulate inflammatory mediators release. Eur J Pharm Biopharm 70(3) (2008)
784-790.
[5] J. Panyam, V. Labhasetwar, Biodegradable nanoparticles for drug and gene
delivery to cells and tissue. Adv Drug Deliv Rev 55(3) (2003) 329-347.
[6] Y. Chen, V.J. Mohanraj, F. Wang, H.A. Benson, Designing chitosan-dextran
sulfate nanoparticles using charge ratios. AAPS PharmSciTech 8(4) (2007) E98.
[7] J.X. Zhang, K.J. Zhu, An improvement of double emulsion technique for
preparing bovine serum albumin-loaded PLGA microspheres. J Microencapsul
21(7) (2004) 775-785.
[8] L. Li, S.P. Schwendeman, Mapping neutral microclimate pH in PLGA
microspheres. J Control Release 101(1-3) (2005) 163-173.
[9] P. Bahukudumbi, K.H. Carson, A.C. Rice-Ficht, M.J. Andrews, On the diameter
and size distributions of Bovine Serum Albumin (BSA)-based microspheres. J
Microencapsul 21(7) (2004) 787-803.
[10] Y.Y. Yang, T.S. Chung, N.P. Ng, Morphology, drug distribution, and in vitro
release profiles of biodegradable polymeric microspheres containing protein
fabricated by double-emulsion solvent extraction/evaporation method.
Biomaterials 22(3) (2001) 231-241.
[11] R.G. Larson, The Structure and Rheology of Complex Fluids, Oxford University
Press, New York, 1999.
[12] T. Ishijima, Y. Mizumori, K. Kikuchi, A. Suzuki, T. Okaya, Polymerization of
vinyl acetate in fatty acids and properties of poly(vinyl alcohols) derived from the
poly (vinyl acetates). Colloid and Polymer Science 283 (2005) 799–804.
[13] W.B. Chu, J.W. Yang, T.J. Liu, C. Tiu, J. Guo, The effects of pH, molecular
weight and degree of hydrolysis of poly(vinyl alcohol) on slot die coating of PVA
suspensions of TiO2 and SiO2. Colloids and Surfaces A: Physicochemical and
Engineering Aspects 302 (2007) 1-10.
116
[14] K. Holmberg, B. Jonsson, B. Kronberg, B. Lindman, Surfactants and Polymers in
Aqueous Solution, Wiley, West Sussex, 2002.
[15] D.C. Carter, J.X. Ho, Structure of serum albumin. Adv Protein Chem 45 (1994)
153-203.
[16] T. Uchida, N. Nagareya, S. Sakakibara, Y. Konishi, A. Nakai, M. Nishikata, K.
Matsuyama, K. Yoshida, Preparation and characterization of polylactic acid
microspheres containing bovine insulin by a w/o/w emulsion solvent evaporation
method. Chem Pharm Bull (Tokyo) 45(9) (1997) 1539-1543.
117
CHAPTER V
Therapeutic release from loaded PLGA spheroids
Introduction
The release profile of loaded therapeutics is critical to the appropriate design of a
drug delivery system. Not only does the rate of release determine the local (if targeted) or
systemic concentration in vivo, but it also affects several considerations to the broader
treatment plan including dosage amount and frequency [1]. The release of a particular
therapeutic is dependent on several variables of the system including the characteristics
of the drug itself. One variable of interest is particle geometry; the release of loaded
therapeutics from non-spherical particles fabricated via the oil-in-water emulsion solvent
evaporation technique described within and how this release differs from loaded spheres
is important in the design of an optimal drug delivery system [2].
Release profiles from loaded spheres and spheroids needed to be examined since
the rate and duration of release of loaded therapeutics is vital in determining possible
dosage plans. The increased surface area-to-volume ratio of non-spherical particles,
including spheroids, should result in a shorter diffusion path for loaded drug into the
external release media and that media into the particle. Increasing the
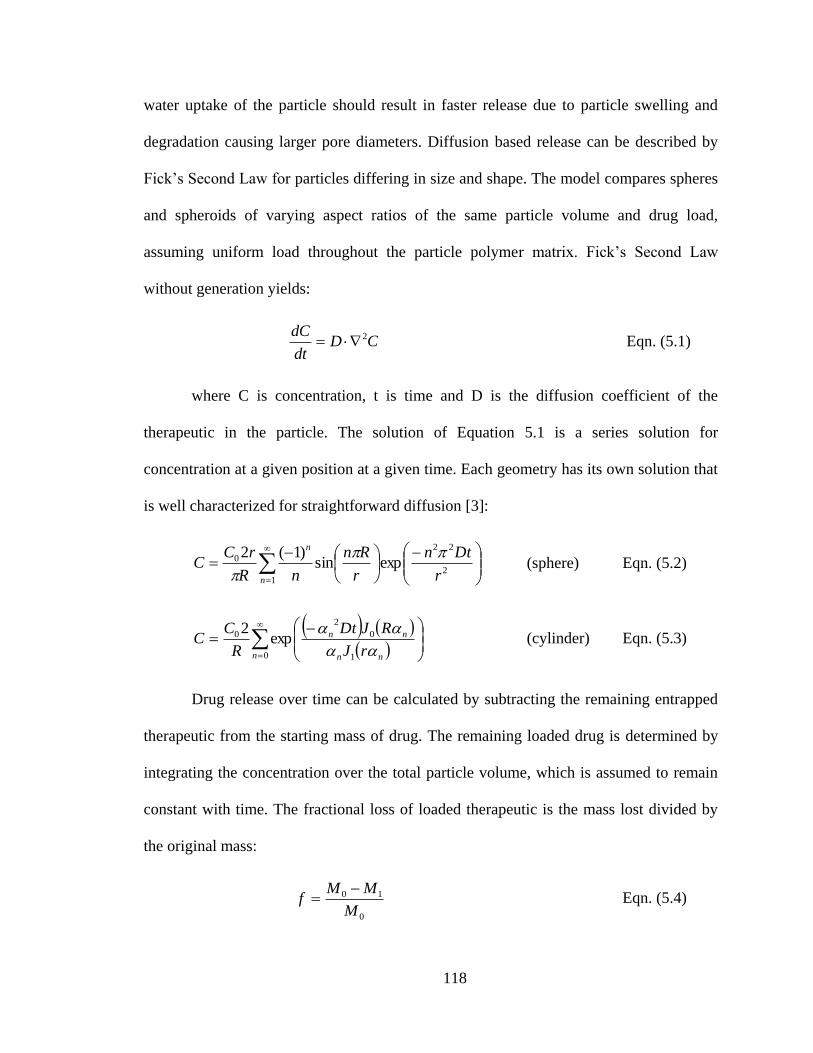
118
water uptake of the particle should result in faster release due to particle swelling and
degradation causing larger pore diameters. Diffusion based release can be described by
Fick’s Second Law for particles differing in size and shape. The model compares spheres
and spheroids of varying aspect ratios of the same particle volume and drug load,
assuming uniform load throughout the particle polymer matrix. Fick’s Second Law
without generation yields:
CDdt
dC 2 Eqn. (5.1)
where C is concentration, t is time and D is the diffusion coefficient of the
therapeutic in the particle. The solution of Equation 5.1 is a series solution for
concentration at a given position at a given time. Each geometry has its own solution that
is well characterized for straightforward diffusion [3]:
2
22
1
0 expsin)1(2
r
Dtn
r
Rn
nR
rCC
n
n
(sphere) Eqn. (5.2)
0 1
0
2
0 exp2
n nn
nn
rJ
RJDt
R
CC
(cylinder) Eqn. (5.3)
Drug release over time can be calculated by subtracting the remaining entrapped
therapeutic from the starting mass of drug. The remaining loaded drug is determined by
integrating the concentration over the total particle volume, which is assumed to remain
constant with time. The fractional loss of loaded therapeutic is the mass lost divided by
the original mass:
0
10
M
MMf
Eqn. (5.4)
119
The fractional loss gives the drug release over time. This diffusion model can be
fit to experimental data in order to determine the diffusion constant for the drug within
the PLGA particle. Diffusion coefficients are constant for a given drug molecule in a
given material system. Such a diffusion model can be utilized to predict how shape
affects drug release from particles of the same material. Figure 5.1 shows the prediction
of the model for diffusion-controlled release from prolate spheroids and spheres – the
shorter diffusion path of the prolate spheroids is predicted to result in faster release rates
than spheres of the same volume. Additionally, higher aspect ratios show faster drug
release due to the shorter diffusion path and larger particle surface area for a given
volume.
Experimental methods
Microparticles loaded with paclitaxel or 6-carboxyfluorescein were fabricated
utilizing O/W ESE methods as described in previous chapters. The drug loading and
encapsulation efficiency were characterized for the loaded particles. In vitro drug release
studies were conducted in 10 mM phosphate-buffered saline (PBS) at pH 7.4 and 37°C.
Five mg of drug-loaded microparticles were suspended in 10.0 ml of PBS in screw-
capped polypropylene tubes and placed on a bench-top rocker in a water bath at 37°C.
Paclitaxel release studies were performed by collecting the samples via
centrifugation at 1000g for five minutes of the entire release medium – the supernatant
was removed, mixed with 5 ml dichloromethane, shaken for 30 seconds to facilitate drug
extraction, permitted to settle for 30 minutes for phase separation and the paclitaxel-rich
oil phase removed for evaluation via UV absorption at 232 nm. Pelleted particles were

120
resuspended in PBS and returned to the water bath. Release studies were done at least in
triplicate.
6-carboxyfluorescein release studies were performed by collecting 200 µl samples
from the release medium at desired time points. Removal of the microparticles was
achieved by centrifugation at 8000 rpm for five minutes. Three samples of 50 µl of the
dye-containing supernatant were gathered and placed in a 96 well plate for measurement
with a fluorescence microplate reader with comparison against a calibration curve with
excitation and emission wavelengths of 492/517 nm. Pelleted particles were discarded
(not replaced). Controls consisted of unloaded PLGA particles in the same media at the
same concentration as well as free 6-CF dissolved in the same media at the same total
weight as loaded in polymer particles.
Results and Discussion
Release of paclitaxel from loaded PLGA spheres and spheroids
The release profile of paclitaxel from loaded PLGA particles was examined in
order to demonstrate the ability of the oil-in-water emulsion solvent evaporation method
to fabricate drug carriers. Prolate spheroid particles were fabricated from PLGA polymer
(polymer A, Table 2.1) at 1.0% w/V PVA and 0.6% w/V tris in the aqueous phase at pH
8.4. The theoretical drug load of these particles was 5.0% w/w paclitaxel and the
measured drug load was 2.7% w/w – an encapsulation efficiency of 54%. Fabricated
spheroid particles had an average aspect ratio of 8.2 and volume of 232 µm3.
Release from paclitaxel-loaded spheroids showed an initial burst release followed
by diffusion-controlled release over time, similar to release studies reported in literature
[4-6]. However, paclitaxel release from these spheroids occurred at a faster rate than
121
reported by the literature, likely due to the particle geometry, though it was consistent
with diffusion controlled release. Figure 5.2 shows the fraction paclitaxel released over
two weeks and the fractional loss model predicted by Fick’s Second Law fit to the
experimental data in order to estimate the diffusion constant for the system. The diffusion
coefficient for paclitaxel released from these particles was estimated to be 2.8∙10-9
cm2/s,
similar in magnitude to the diffusion coefficient reported in literature for paclitaxel
released from a PLGA film [7].
Particle geometry and its impact on the release rate of loaded therapeutics are
important considerations in the design of suitable drug delivery carriers. Experiments
were designed to compare the release rates of spheroids and spheres in order to observe
the impact of particle shape on release rate. Since the release of paclitaxel from loaded
spheroids proved to be diffusion controlled, this system was useful in evaluating the role
of particle shape in diffusion release from carriers. The release of paclitaxel from prolate
spheroids and spheres of the same particle volumes containing the same drug load was
observed to this end.
Paclitaxel-loaded PLGA (polymer C, Table 2.1) prolate spheroids were fabricated
with an aqueous phase containing 1.0% w/V PVA and 0.6% w/V tris at aqueous phase
pH 8.4. Fabricated spheroids contained an average drug load of 2.9% w/w (58%
encapsulation efficiency), had an average particle volume of 196 µm3 and an average
aspect ratio of 9.6. Paclitaxel-loaded PLGA spheres were manufactured from the same
polymer and in an aqueous phase containing 1.0% w/V PVA and 0.0% w/V tris at
aqueous phase pH 8.4. The stir rate was decreased from the base formulation to 1600 rpm
in order to create spheres and spheroids of equivalent volume. Manufactured spheres

122
contained an average drug load of 2.8% w/w (56% encapsulation efficiency) and an
average diameter of 7.1 µm (187 µm3). In vitro release studies were performed in 10 mM
DPBS at pH 7.4 and 37°C to simulate in vivo conditions.
Figure 5.3 shows the release of paclitaxel from loaded spheres and spheroids over
time. The release profile showed a fast burst release over the first day followed by
diffusion-controlled release over approximately one month. As expected, particle
geometry impacts the release rate of loaded paclitaxel from these particles; prolate
spheroid particles show faster release of paclitaxel than spheres of similar volume and
drug load due to their shortened diffusion path and larger surface area. The effect particle
shape has on drug release rates is important to consider in the design of these particles as
a therapeutic treatment [8]. The faster release from stretched, non-spherical particles may
be more appropriate in situations requiring higher dosages of therapeutic. Alternatively,
the mass of injected particles may need to be decreased per dose and the dosing
frequency increased when utilizing spheroids in place of spheres.
Release of 6-carboxyfluorescein from loaded PLGA spheres and spheroids
Imaging vectors have the potential to help identify cardiovascular and other
inflammatory diseases, providing information vital to the following treatment of those
diseases [9-11]. Additionally, drug delivery particles with imaging capabilities may be
useful in tracking the placement of the carriers at the site of interest and the
biodistribution of the particles [12]. The fluorescent dye 6-carboxyfluorescein was loaded
into prolate spheroids and spheres of similar volumes made from PLGA polymer for use
as imaging vectors. Its release from those carriers over time is of interest not only as a
123
model drug release but also because release lessens the intensity of signal from the
particles, decreasing their usefulness for imaging.
6-CF-loaded PLGA (polymer A, Table 2.1) spheroids were fabricated from an
aqueous phase containing 1.0% w/V PVA with 0.6% w/V tris at pH 8.4. Fabricated
spheroids contained an average drug load of 0.39% w/w (39% encapsulation efficiency),
average particle volume of 160 µm3 and average aspect ratio 11.7. 6-CF-loaded spheres
were made in the presence of an aqueous phase consisting of 1.0% w/V PVA and 0.0%
w/V tris at aqueous phase pH 8.4. Fabricated spheres had an average drug load of 0.35%
w/w (3% encapsulation efficiency) with an average particle diameter of 6.7 µm and
particle volume 165 µm3. In vitro release studies were performed in 10 mM DPBS at pH
7.4 and 37°C similar to in vivo conditions.
Release of 6-CF previously recorded in literature was from nanospheres on the
order of 200 nm [13]. 6-CF in that study was released in a matter of hours rather than
weeks as seen with paclitaxel, likely due to the small particle volume. Figure 5.4 shows
the release of 6-CF from loaded rods and spheres of equivalent volumes. Dye release
from loaded spheroids showed fast release compared with paclitaxel release as expected
due to the increased solubility of 6-CF in the aqueous release media. Twenty percent of
loaded dye was released within 5 hours, 80% within 2 days and all dye was released
within 2 weeks from dye-loaded rods. While this was significantly slower than reported
in literature, the fabricated particles were significantly larger in volume and therefore
released their load much more slowly due to the greater diffusion path. The release of 6-
CF from loaded spheres was dramatically different than release from rods – dye release
from spheres showed a burst release of almost 20% followed by little release over the
124
first two weeks before the release rate increased. Spheres released almost all of the
loaded 6-CF over a five week period, more than twice as long as full release from rods.
Dye release from spheres shows a degradation-dependent release; initial release was slow
and steady as the pore size was too small for quick diffusion. Over time, the pore size
was increased through degradation and particle swelling, thus releasing loaded dye
molecules.
The wide difference in release rates between spheroids and spheres is due to the
effect of tris on the loading of 6-CF during fabrication. Rods were fabricated in the
presence of tris in the aqueous phase whereas spheres had no tris in the aqueous phase. 6-
CF is a water-soluble dye at neutral and basic pH due to the charge present on its
functional groups above neutral pH; the pK for the alcohol group is 6.3 and the pK is 4.5
for its terminal carboxyl group [14], causing the partition coefficient to drastically
decrease at pH above 6.3. Ethanol was required as a co-solvent to dissolve the dye in the
oil phase. Upon emulsification, the ethanol diffuses into the water phase faster than DCM
due to its higher water solubility. The water soluble dye has a low partition coefficient at
basic pH, causing it to diffuse rapidly into the water phase as well [14, 15]. Particles
fabricated in the absence of tris (spheres) showed very low loading efficiencies. When
tris was in the aqueous phase, it lowered the interfacial tension, increasing the diffusion
of DCM into the aqueous phase and of water (containing tris) into the oil phase. When
tris contacts 6-CF within the oil phase, it is protonated and makes the dye anionic. This
causes precipitation of the dye within the oil phase, increasing the encapsulation
efficiency. Additionally, faster diffusion rates across the interface results in significantly

125
larger pore sizes. In the absence of tris, diffusion was significantly slower, causing small
pore sizes and requiring particle degradation before 6-CF release could be achieved.
Summary
The in vitro release of paclitaxel and 6-carboxyfluorescein from loaded PLGA
spheroids and spheres was examined in PBS at pH 7.4 and 37°C. Paclitaxel was loaded as
a model hydrophobic chemical drug and its release from PLGA particles was diffusion-
controlled, displaying a small burst release. Loaded paclitaxel released faster from
spheroids than spheres, as predicted by Fick’s Second Law, and particles of both
geometries released their load over about a month. 6-carboxyfluorescein was loaded as
dye permitting the use of loaded particles as contrast agents. Release from spheroids
showed a rapid, diffusion-based release over a few days. This is likely due to the
concentration of 6-CF near the surface of the particle during loading in the presence of
tris base. Release from loaded spheres showed an initial burst release followed by
minimal release for two weeks at which point it released over three weeks, indicating
degradation-controlled release.
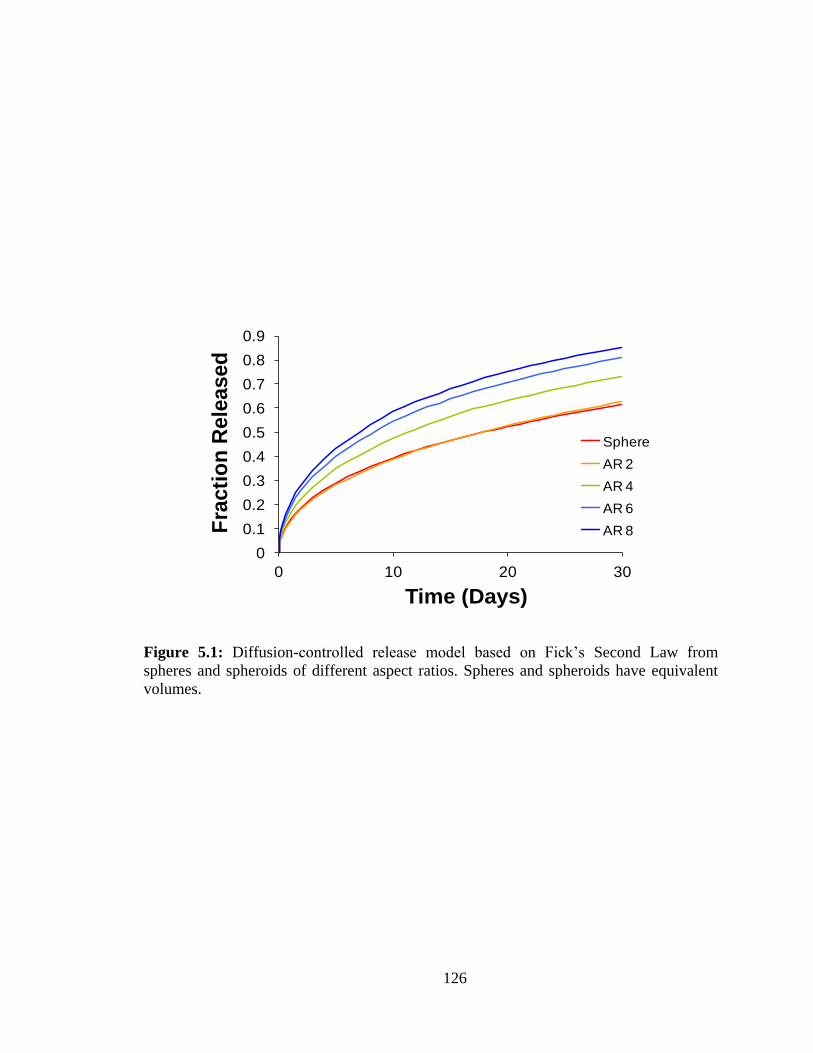
126
0
0.1
0.2
0.3
0.4
0.5
0.6
0.7
0.8
0.9
0 10 20 30
Fra
cti
on
Rele
ased
Time (Days)
Sphere
AR 2
AR 4
AR 6
AR 8
Figure 5.1: Diffusion-controlled release model based on Fick’s Second Law from
spheres and spheroids of different aspect ratios. Spheres and spheroids have equivalent
volumes.

127
0
0.1
0.2
0.3
0.4
0.5
0.6
0.7
0.8
0 2 4 6 8 10 12 14 16
Fra
cti
on
Rele
ased
Time (Days)
Data Model
Figure 5.2: Paclitaxel release from PLGA (polymer A, Table 2.1) prolate spheroids
fabricated from the oil-in-water emulsion solvent evaporation technique compared to a
diffusion-controlled release model. The diffusion coefficient of paclitaxel in PLGA was
calculated to be 2.8∙10-9
cm2/s.
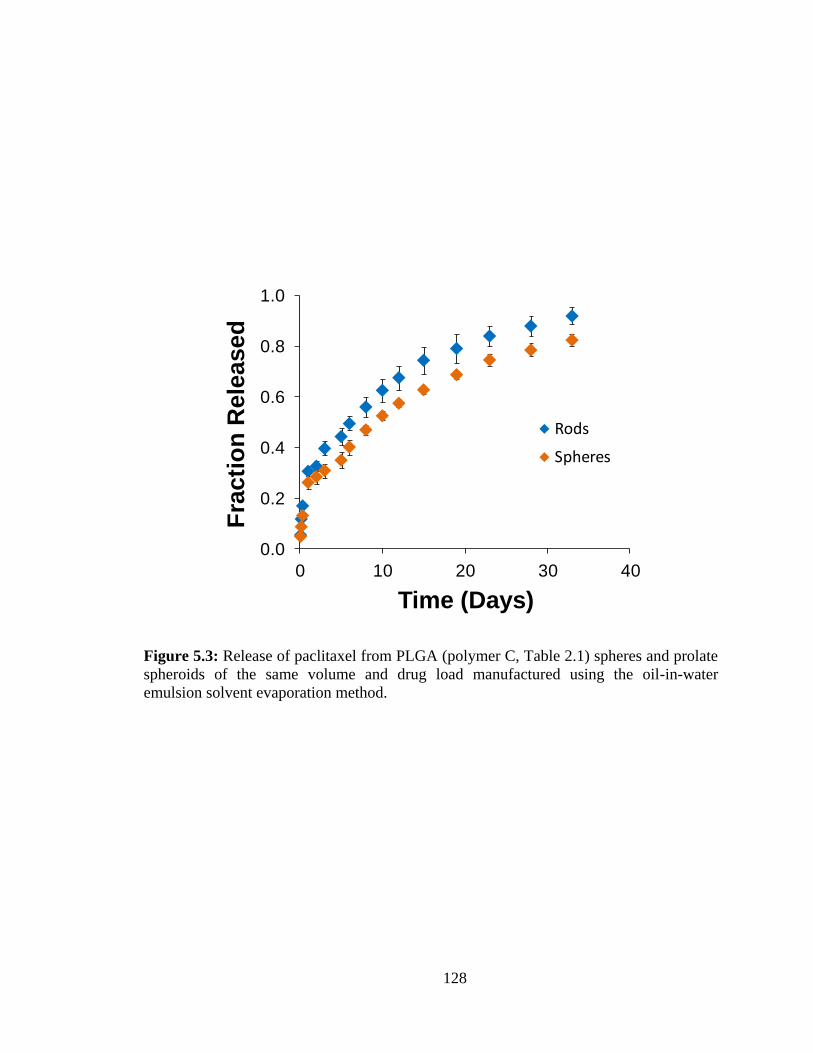
128
0.0
0.2
0.4
0.6
0.8
1.0
0 10 20 30 40
Fra
cti
on
Rele
ased
Time (Days)
Rods
Spheres
Figure 5.3: Release of paclitaxel from PLGA (polymer C, Table 2.1) spheres and prolate
spheroids of the same volume and drug load manufactured using the oil-in-water
emulsion solvent evaporation method.
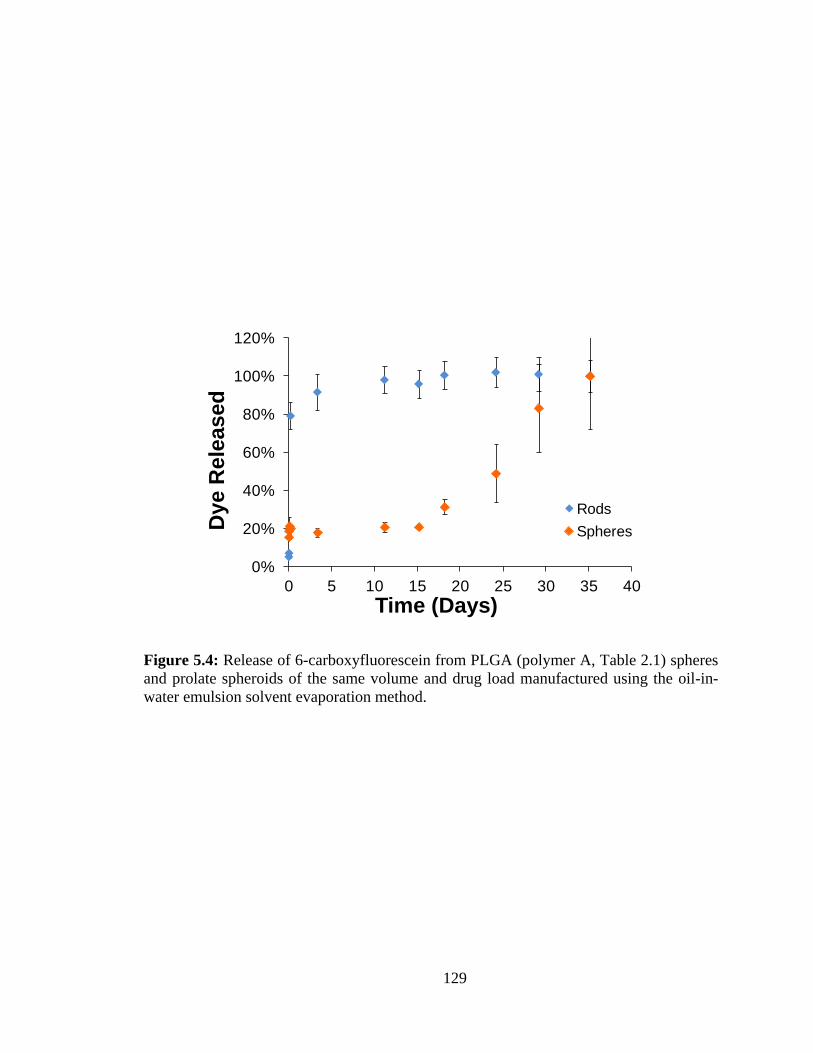
129
0%
20%
40%
60%
80%
100%
120%
0 5 10 15 20 25 30 35 40
Dy
e R
ele
ased
Time (Days)
Rods
Spheres
Figure 5.4: Release of 6-carboxyfluorescein from PLGA (polymer A, Table 2.1) spheres
and prolate spheroids of the same volume and drug load manufactured using the oil-in-
water emulsion solvent evaporation method.
130
References
[1] P.H. Tran, T.T. Tran, J.B. Park, B.J. Lee, Controlled release systems containing
solid dispersions: strategies and mechanisms. Pharm Res 28(10) 2353-2378.
[2] Y.B. Choy, J.H. Park, B.E. McCarey, H.F. Edelhauser, M.R. Prausnitz,
Mucoadhesive microdiscs engineered for ophthalmic drug delivery: effect of
particle geometry and formulation on preocular residence time. Invest Ophthalmol
Vis Sci 49(11) (2008) 4808-4815.
[3] I. McDougall, M.T. Harrison, Geochronology and Thermochronology by the
40Ar/39Ar Method, Oxford University Press, New York, 1999.
[4] S. Feng, G. Huang, Effects of emulsifiers on the controlled release of paclitaxel
(Taxol) from nanospheres of biodegradable polymers. J Control Release 71(1)
(2001) 53-69.
[5] L. Mu, S.S. Feng, Vitamin E TPGS used as emulsifier in the solvent
evaporation/extraction technique for fabrication of polymeric nanospheres for
controlled release of paclitaxel (Taxol). J Control Release 80(1-3) (2002) 129-
144.
[6] H. Suh, B. Jeong, R. Rathi, S.W. Kim, Regulation of smooth muscle cell
proliferation using paclitaxel-loaded poly(ethylene oxide)-poly(lactide/glycolide)
nanospheres. J Biomed Mater Res 42(2) (1998) 331-338.
[7] F. Alexis, S.S. Venkatraman, S.K. Rath, F. Boey, In vitro study of release
mechanisms of paclitaxel and rapamycin from drug-incorporated biodegradable
stent matrices. J Control Release 98(1) (2004) 67-74.
[8] C.I. Winternitz, J.K. Jackson, A.M. Oktaba, H.M. Burt, Development of a
polymeric surgical paste formulation for taxol. Pharm Res 13(3) (1996) 368-375.
[9] V. Amirbekian, J.G. Aguinaldo, S. Amirbekian, F. Hyafil, E. Vucic, M. Sirol,
D.B. Weinreb, S. Le Greneur, E. Lancelot, C. Corot, E.A. Fisher, Z.S. Galis, Z.A.
Fayad, Atherosclerosis and matrix metalloproteinases: experimental molecular
MR imaging in vivo. Radiology 251(2) (2009) 429-438.
[10] B.A. Kaufmann, C.L. Carr, J.T. Belcik, A. Xie, Q. Yue, S. Chadderdon, E.S.
Caplan, J. Khangura, S. Bullens, S. Bunting, J.R. Lindner, Molecular imaging of
the initial inflammatory response in atherosclerosis: implications for early
detection of disease. Arterioscler Thromb Vasc Biol 30(1) 54-59.
[11] M. Heslinga, T. Porter, O. Eniola-Adefeso, Design of nanovectors for therapy and
imaging of cardiovascular diseases. Methodist DeBakey Cardiovascular (In print).
[12] S.E. Gratton, P.D. Pohlhaus, J. Lee, J. Guo, M.J. Cho, J.M. Desimone,
Nanofabricated particles for engineered drug therapies: a preliminary
biodistribution study of PRINT nanoparticles. J Control Release 121(1-2) (2007)
10-18.
[13] M. Beck-Broichsitter, J. Gauss, C.B. Packhaeuser, K. Lahnstein, T. Schmehl, W.
Seeger, T. Kissel, T. Gessler, Pulmonary drug delivery with aerosolizable
nanoparticles in an ex vivo lung model. Int J Pharm 367(1-2) (2009) 169-178.

131
[14] J. Bramhall, J. Hofmann, R. DeGuzman, S. Montestruque, R. Schell, Temperature
dependence of membrane ion conductance analyzed by using the amphiphilic
anion 5/6-carboxyfluorescein. Biochemistry 26(20) (1987) 6330-6340.
[15] Y. Yeo, K. Park, Control of encapsulation efficiency and initial burst in polymeric
microparticle systems. Arch Pharm Res 27(1) (2004) 1-12.
132
CHAPTER VI
Major contributions and future work
Major contributions
This work describes a novel fabrication of non-spherical particles from
biodegradable PLGA polymer for drug delivery applications utilizing oil-in-water and
water-in-oil-in-water emulsion solvent evaporation techniques. It was shown that the size
and shape (aspect ratio) of these fabricated prolate spheroids can be controlled by careful
manipulation of process parameters in the aqueous and oil phases as well as the physical
setup of the system. The data showed that a high aqueous phase viscosity, a basic
aqueous phase pH, a water-soluble co-solvent and hydrophilic end groups on the polymer
chain are all conditions that promote formation of spheroidal particles.
Spheroids were successfully fabricated utilizing these emulsion techniques loaded
with a wide range of therapeutics including hydrophobic (paclitaxel and lovastatin),
water-soluble (6-carboxyfluorescein), nanoparticles (cadmium sulfide) and protein
(bovine serum albumin) model drugs as proof of concept for their potential applications
in drug delivery. Furthermore, spheroids loaded with contrast agents including 6-
carboxyfluorescein and cadmium sulfide fluorescent nanoparticles show the flexibility of
these spheroids for use in imaging applications. Loaded particles showed the same
133
variation in size and shape with varied system parameters as observed with unloaded
particles. The impact of process parameters on encapsulation efficiencies was not
consistent between loaded therapeutics – each loaded drug responded differently
depending on its characteristics. Paclitaxel displayed loading efficiencies consistent with
hydrophobic drugs loaded into spheres described in literature while 6-carboxyfluorescein
encapsulation efficiency depended largely on the presence of tris base in the aqueous
phase, changing the dye solubility in dichloromethane and causing the precipitation of the
dye in the oil phase.
Bovine serum albumin, a model protein, required the added complexity in
fabrication of a primary emulsion entrapping the BSA within an inner water phase
contained in the oil droplets. The size and shape of particles loaded with BSA fabricated
with the W/O/W ESE system followed the same trends as unloaded and loaded particles
fabricated with a single emulsion. The dependence of encapsulation efficiency of BSA in
the double emulsion fabrication was different than that observed with drugs loaded in a
single emulsion fabrication. In the case of BSA loading, parameters that stabilized the
inner water phase (basic pH, high surfactant concentration) increased the loading
efficiency due to decreased merging of inner and outer water phases.
Drug release was examined from particles loaded with paclitaxel or 6-
carboxyfluorescein. Release of the hydrophobic drug paclitaxel from PLGA particles was
diffusion-controlled, showing a small burst release and releasing loaded drug over
approximately one month from both spheroids and spheres of the same volume and drug
load. Particle geometry influenced the release rate of loaded paclitaxel; spheroids
released their cargo faster than their spherical counterparts due to the larger surface area
134
of prolate spheroids as predicted by the diffusion drug release model. Drug release from
6-carboxyfluorescein-loaded spheroids occured rapidly over the course of a few days,
clearly displaying diffusion-controlled release likely due to the concentration of 6-CF
near the surface of the particle as a result of the presence of tris base during fabrication.
6-CF showed a degradation-dependent release from loaded spheres, however. Release
from spheres showed an initial burst release of approximately 20% of loaded 6-CF
followed by no release from two weeks. After sufficient degradation, release began again
at the end of two weeks and continued until all dye was released after a total of five
weeks.
Overall, the O/W and W/O/W emulsion solvent evaporation techniques for
fabricating prolate spheroids are advantageous over other methods currently described in
the literature in their simplicity in setup, high particle yield and adaptability to various
biodegradable polymers and therapeutics. There is evidence in the literature that
spheroidal particles are potentially advantageous over spherical particles for in vivo drug
delivery and imaging. The simple fabrication technique described in this work allows
investigators quick and inexpensive access to a high yield of these particles and thus
rapidly advance their potential for in vivo application.
Predicting droplet deformation and breakup
Drop deformation and breakup in shear flows is governed by the viscous and
interfacial forces present in the system. Mechanically-mixed emulsions of immiscible
phases lead to the formation of a population of drops of the dispersed phase within the
continuous phase. In this fabrication technique, the oil phase consisting of PLGA
polymer and therapeutic dissolved in dichloromethane makes up the dispersed phase in
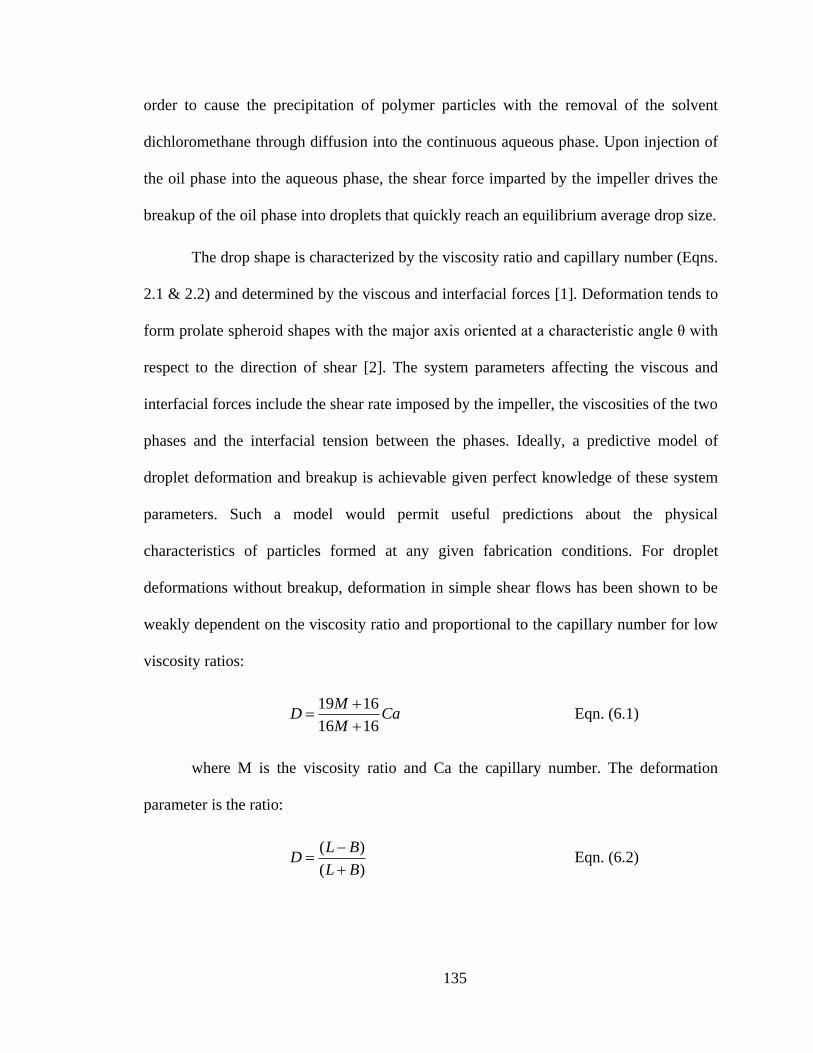
135
order to cause the precipitation of polymer particles with the removal of the solvent
dichloromethane through diffusion into the continuous aqueous phase. Upon injection of
the oil phase into the aqueous phase, the shear force imparted by the impeller drives the
breakup of the oil phase into droplets that quickly reach an equilibrium average drop size.
The drop shape is characterized by the viscosity ratio and capillary number (Eqns.
2.1 & 2.2) and determined by the viscous and interfacial forces [1]. Deformation tends to
form prolate spheroid shapes with the major axis oriented at a characteristic angle θ with
respect to the direction of shear [2]. The system parameters affecting the viscous and
interfacial forces include the shear rate imposed by the impeller, the viscosities of the two
phases and the interfacial tension between the phases. Ideally, a predictive model of
droplet deformation and breakup is achievable given perfect knowledge of these system
parameters. Such a model would permit useful predictions about the physical
characteristics of particles formed at any given fabrication conditions. For droplet
deformations without breakup, deformation in simple shear flows has been shown to be
weakly dependent on the viscosity ratio and proportional to the capillary number for low
viscosity ratios:
CaM
MD
1616
1619
Eqn. (6.1)
where M is the viscosity ratio and Ca the capillary number. The deformation
parameter is the ratio:
)(
)(
BL
BLD
Eqn. (6.2)

136
where L is the major axis length and B the minor axis length [3, 4]. Subsequent
refinements have altered this depending on the relevant flow pattern, but for low viscosity
ratios this generally holds true [5, 6]. However, most theoretical models and experiments
do not simultaneously deal with droplet deformation and breakup due to the complexity
of such systems.
Unfortunately, the dynamic conditions that exist during the fabrication preclude
perfect predictions. The culprits here are the changing viscous shear forces due to the
breakup and coalescence of the drops as well as obtaining accurate interfacial tension
measurements that describe the rapidly evolving environment during particle
solidification in the solvent removal stage. Droplet breakup due to shear forces
overcoming interfacial tension forces results in smaller shear forces on the smaller
resulting drop, causing smaller deformation. This was observed experimentally with
increasing aqueous phase viscosity achieved through the variation of polyvinyl alcohol
concentration in the water phase. Increasing viscosity initially increased deformation
while simultaneously decreasing particle volume (Figure 2.7), yet further increase in
viscosity decreased deformation as interfacial forces dominated shearing forces for the
small drops. Additionally, the droplet size decreases during this emulsion as the solvent
dichloromethane diffuses into the aqueous phase, changing the capillary number and
subsequent deformation over time. The drop will no longer change shape once a
sufficient fraction of the solvent has left the droplet, but the prediction of when exactly
deformation changes cease is complex.
Accurate measurements of interfacial tension, particularly dynamic measurements
during the solvent evaporation phase, are difficult to obtain. Interfacial tension
137
measurements were made using a Du Noüy ring force tensiometer between the aqueous
and oil phases prior to emulsification. While this method yielded results for concentration
changes in the aqueous phase (Figure 2.1), it was insensitive to interfacial tension
changes caused by several polymer properties such as end group, molecular weight and
co-monomer ratio. Interfacial tension in the emulsion system changes with droplet
formation and shape changes, particularly with the presence of surfactants, causing these
measurements to not accurately describe the actual environment [5, 6]. The dynamic
droplet size and interfacial tension make it difficult to accurately calculate the capillary
number and therefore makes predicting the deformation (aspect ratio) and volume of
resultant, hardened particles complicated. What can be observed is the general trend of
deformation with changing viscosities, shear and interfacial tension as observed above
and in Chapter II.
Future work
The described research introduces a new method for the fabrication of
biodegradable, non-spherical microparticles for potential application in drug delivery.
The challenges of drug carrier design are to account for several factors including particle
material, size and shape in order to provide effective targeted delivery through efficient
encapsulation of therapeutic, localization to the target site and release of the therapeutic
[7]. Efficient targeted delivery requires localizing to the target site while avoiding
clearance by the immune system by maneuvering through the bloodstream to the target.
There are advantages and disadvantages to differently sized particles in this regard;
nanoparticles are attractive as they have prolonged circulation and are unlikely to occlude
small blood vessels. However, nanoparticles may not effectively marginate to the

138
vascular wall in medium or large vessels while microspheres may offer much improved
margination in these vessels [7-9]. Yet microspheres are readily cleared and may occlude
the capillaries; PEGylation of these particles can further increase circulation time, but a
change to non-spherical shapes may be optimum for drug delivery and imaging
applications [10]. The prolate spheroid particles fabricated with this method may provide
better efficacy as imaging and drug delivery carriers.
Studies evaluating these drug delivery carriers for the in vitro and in vivo efficacy
need to be performed to confirm possible advantages of the non-spherical carriers. In
vitro flow assays quantifying adhesion to inflamed endothelial cells from blood flow for
different particle geometries may confirm this hypothesis and identify the particle volume
and aspect ratios optimal for each flow type, whether slow flows present in small vessels
or larger, pulsatile flows typical of medium-to-large arteries. Such studies have been
performed for spherical particles of different sizes binding to inflamed endothelial cells
[8, 9], but need to be performed for prolate spheroids. Unloaded PLGA prolate spheroids
fabricated from the oil-in-water emulsion solvent evaporation method may be utilized to
this end.
Even though in vitro assays may confirm that spheroids offer advantages in
binding efficiency and identify size and aspect ratios that work best, they cannot recreate
perfectly the in vivo environment nor guarantee the same performance there. The ability
of drug carriers to the reach their target in vivo depends on the blood pharmacokinetics.
Blood clearance is a function of particle concentration, volume, shape and surface
characteristics. The blood clearance and biodistribution of particles injected into animal
models, such as mice, needs to be examined further to determine any potential benefit to
139
non-spherical particles for drug delivery. Of particular interest for prolate spheroids is an
investigation of the capillaries to determine if elongated particles are entrapped and
occlude these small vessels. Pharmacokinetic parameters such as blood/deposition half-
life, distribution volume and clearance will help determine the ultimate fate of injected
particles.
Analysis of the ability of non-spherical PLGA particles to target inflamed vessels
in atherosclerotic animal models and a determination which particle sizes and aspect
ratios should be investigated. Fluorescent imaging in whole blood and tissue samples
may permit for the evaluation of binding efficiency; the fluorescent 6-CF and CdS PLGA
prolate spheroids fabricated in this work provide the particles needed for such a study.
Although human in vivo assays would be preferred, human subjects are not feasible at
this stage of this research and even though mice models provide more complexity,
significant differences exist between mice and human models. Animal models are
insufficient to identify the best imaging and carriers in humans; differences in vessel
sizes and blood flow patterns, including shear stresses and red blood cell size and shape,
necessitate eventual human trials [11]. However, in vivo mice models provide the
complex hydrodynamic blood flows that are absent from simple laminar or pulsatile
flows inherent in in vitro assays. Once optimal carriers and target ligands are designed,
effective targeted imaging and drug delivery may provide safe and effective treatment of
cardiovascular diseases. This novel fabrication method provides access to non-spherical
particles made from biodegradable polymers for the design of optimal drug delivery
carriers.
140
References
[1] R.G. Larson, The Structure and Rheology of Complex Fluids, Oxford University
Press, New York, 1999.
[2] P.L. Maffettone, M. Minale, Equation of change for ellipsoidal drops in viscous
flow. J. Non-Newtonian Fluid Mech. 78 (1998) 227-241.
[3] G.I. Taylor, The viscosity of a fluid containing small drops of another fluid. Proc.
R. Soc. A 138 (1932) 41-48.
[4] G.I. Taylor, The formation of emulsion in definable field of flow. Proc. R. Soc. A
146 (1934) 501-523.
[5] H.A. Stone, Dynamics of drop deformation and breakup in viscous fluids. Annu.
Rev. Fluid Mech. 26 (1994) 65-102.
[6] D.C. Tretheway, L.G. Leal, Surfactant and viscoelastic effects on drop
deformation in 2-D extensional flow. AIChE Journal 45(5) (2001) 929-937.
[7] R.B. Huang, S. Mocherla, M.J. Heslinga, P. Charoenphol, O. Eniola-Adefeso,
Dynamic and cellular interactions of nanoparticles in vascular-targeted drug
delivery (review). Mol Membr Biol 27(4-6) 190-205.
[8] P. Charoenphol, R.B. Huang, O. Eniola-Adefeso, Potential role of size and
hemodynamics in the efficacy of vascular-targeted spherical drug carriers.
Biomaterials 31(6) 1392-1402.
[9] P. Charoenphol, S. Mocherla, D. Bouis, K. Namdee, D.J. Pinsky, O. Eniola-
Adefeso, Targeting therapeutics to the vascular wall in atherosclerosis--carrier
size matters. Atherosclerosis 217(2) 364-370.
[10] J.A. Champion, S. Mitragotri, Role of target geometry in phagocytosis. Proc Natl
Acad Sci U S A 103(13) (2006) 4930-4934.
[11] M. Heslinga, T. Porter, O. Eniola-Adefeso, Design of nanovectors for therapy and
imaging of cardiovascular diseases. Methodist DeBakey Cardiovascular (In print).