Embed Size (px)
Citation preview

International Journal of Computer Applications (0975 – 8887)
Volume 119 – No.24, June 2015
27
Face Recognition based on Oriented Complex Wavelets
and FFT
Rangaswamy Y
Alpha College of Engineering VTU University Bangalore-077
Raja K B UVCE, Bangalore.
Bangalore University Bangalore-01
Venugopal K R UVCE, Bangalore.
Bangalore University Bangalore-01
ABSTRACT
The Face is a physiological Biometric trait used in Biometric
System. In this paper face recognition using oriented complex
wavelets and Fast Fourier Transform (FROCF) is proposed.
The five-level Dual Tree Complex Wavelet
Transform(DTCWT) is applied on face images to get shift
invariant and directional features along ±15o ,± 45o and ± 75o
angular directions.The different pose, illumination and
expression variations of face images are represented in
frequency domain using Fast Fourier Transform(FFT)
resulting in FFT features. Features of DTCWT and FFT are
fused by arithmetic addition to get final features. Euclidean
Distance classifier is applied to the features to recognize the
genuine and imposter faces. The Performance analysis of
proposed method is tested with ORL, JAFFE, L-SPACEK and
CMU-PIE having different illumination and pose conditions.
The Results shows that Recognition Rate of proposed FROCF
is better compared to Existing Recognition Methods.
General Terms
Euclidean Distance, Identification, False Acceptance Rate
(FAR), False Rejection Rate (FRR), Total Success
Rate(TSR),Recognition Rate, Equal Error Rate (EER).
Keywords
Biometrics, Face Recognition, DTCWT, FFT, TSR
1. INTRODUCTION Biometrics is a secure and reliable authentication system
based on Physiological and behavioral characterstics of an
individual. Biometrics acquires a prominent accessing
technique in modern security applications like access to
banks, ATM, computers and other transactions which needs
authorized user for a claimed service.The advantage of
biometric based access to data over a traditional identification
methods of ID cards and passwords is more secure as it
cannot be shared and attacked by other than claimed authority.
Biometrics works mainly on two biological characterstics
namely physiological characterstics which include face,
fingerprint and iris. The features extracted from these
biological traits remains constant over a period of time
compared to behavioral characterstics like gait, keystroke and
voice which are liable to change based on circumstance and
Enviornamental conditions. The selection of a good biometric
trait depends on its distinctness, Easy availability and
universal acceptance.
Face is widely used biometric trait for personal authentication
because of its easy collectability and can be captured from
longer distance. The face recognition has to face a challenges
of recognizing an individual by extracting features which are
robust to pose, illumination and expression variations. The
features extracted are subjected to Region of Operating
Characterstics which gives performance parameters False
Acceptance Rate (FAR), False Rejection Rate (FRR) and True
Success Rate. The efficient biometric system with minimum
FAR and FRR and maximum TSR can be achieved by
selecting a good classifier for a matching.In the proposed Face
Recognition based on Oriented Complex Wavelets and FFT
method DTCWT and FFT features are fused to get better
Recognition Rates compared to existing state of the art
methods.
2. RELATED WORK Alaa Eleyan et al., [1] have proposed face recognition based
on the Dual-Tree Complex Wavelet Transform (DT-CWT) to
extract features from face images. Gabor wavelet features are
extracted with DT-CWT using Gabor wavelets and similar
kernels. The final features extracted from PCA components
applied on DT-CWT coefficients gives better recognition
rates. Zhongxi Sun et al., [2] have proposed face recognition
using DTCWT features with 2DPCA. DTCWT has advantage
over DWT as it provides local multi-scale description of
images with good directional selectivity and shift invariance.
DTCWT is robust to illumination variations and facial
expression changes. Results have shown that using this
technique it’s possible to capture the local information of
different position, orientation and scales.Ravi et al., [3]
proposed the method in which the original face image is
preprocessed and five level DT-CWT is applied in ordered to
get DT-CWT coefficients. The 3x3 matrix is considered, for
each of these matrix local binary patterns is applied to get the
final features and comparison of features of test image with
database image is done using Euclidean Distance.
Yuehui Sun and Minghui Du[4] have introduced a face
recognition based on DT-CWT feature representation using
Orthogonal Neighborhood Preserving Projections (ONPP),
ONPP is a linear dimensionality reduction technique that
attempts to intrinsic Neighborhood geometry of data samples
and the global geometry . Sun Zhongxi et al., [5] have
introduced a face recognition by combining DT-CWT and
two dimensional inverse Fisher Discriminant Analysis. DT-
CWT is applied to extract features at different scales and
orientations. 2DIFDA is applied for dimensionality reduction
and feature selection. Raja and Ramesha [6] have presented
performance evaluation of face recognition based on DT-
CWT using multi-matching classifiers. Nick Kingsbury [7]
has discussed a method to design a filters for DT-CWT. The
filters are designed such that both the filers are of even length
and also time-reverse of each other. The filters have additional
property that the group delay between the filter is one quarter
of the sample period.Uzair et al.,[8] proposed a hyper spectral
face recognition algorithm based on spatio spectral

International Journal of Computer Applications (0975 – 8887)
Volume 119 – No.24, June 2015
28
covariance for band fusion and PLS regression for
classification. The algorithm was tested on three standard
databases and compared with 18 existing state of the art
algorithms including seven image set classification, six gray
scale/RGB and five hyper spectral face recognition
algorithms. Gao Zhirong et al., [9] proposed a multiple feature
fusion and linear regression based face recognition based on
transform domain features which provides a comprehensive
face information and decrease the effect of pose and
illumination variations. The linear regression classifier is used
for recognition. Yue Long et al., [10] proposed a recognition
method using sparse representation on down sampled input
image to locate un occluded face parts. Local stastical features
are obtained by applying Linear Discriminant Analysis on
occluded face parts for better recognition rate. Jun Huang et
al., [11] proposed a face recognition algorithm based on both
the Multilinear Principal Component Analysis (MPCA) and
Linear Discriminant Analysis(LDA). This approach treats
face images as multidimensional tensor in order to find the
optimal tensor subspace for dimension reduction. The LDA is
used to project samples to new discriminant feature space and
K Nearest Neighbor (KNN) classifier is used for matching.
Zhang et al., [12] proposed a face recognition based on
singular value decomposition features which reduces and
remove redundancy in a data using a nearest orthogonal
matrix representation. The nearest neighbor classifier is used
for matching
3. BACKGROUND
3.1 Dual Tree Complex Wavelet
Transform Dual Tree Complex Wavelet Transform is a analytic
transform with complex valued oscillating sinusoid basis
functions producing oriented and complex coefficients which
are robust to oscillations and shift variance.These Oriented
complex wavelets effectively captures more directional
features compared to 2D separable real wavelet transform.The
filters selected to design oriented and complex wavelets
should be (i) orthogonal (ii) approximately half sample delay
between filter pairs (iii) finite support (iv) vanishing moments
with linear phase for a perfect reconstruction of an image with
limited redundancy.
.
Fig 1: Filter Bank structure for 2-Level DTCWT
DTCWT can be implemented using 2D separable two real
wavelet transform in parallel as shown in Figure 1. The first
real wavelet transform can be implemented using low pass
and high pass filter coefficients )(0 nh and )(1 nh applied
along row and column dimension of 2D data which forms
Upper Filter bank structure of DTCWT. The second Real
wavelet transform which represents Lower Filter bank of
DTCWT can be implemented using low pass and high pass
filter coefficients )(0 ng and )(1 ng which are
approximately analytic to upper filter bank coefficients
resulting in perfect reconstruction of input image data.
Real Oriented 2-D Dual-Tree Wavelet Transform: The
Real 2-D Dual-Tree Wavelet Transform based on six oriented
wavelets can be implemented using two real separable 2-D
wavelet transform in parallel. To obtain a real 2-D wavelets
oriented at ±15,±45,±75 a 2-D separable wavelet transform is
applied on image along row and column dimensions using six
complex oriented wavelets as given in Equations (1) and (2).
)1)).....(,(),((2
1),( ,2,1 yxyxyx iii
)2))....(,(),((2
1),( ,2,13 yxyxyx iii
For i=1,2,3, where the two separable 2-D wavelet are defined
as given in Equations (3), (4) and (5).
)()(),(1,1 yxyx hh ,
).()(),(1,2 yxyx gg ……… (3)
)()(),(2,1 yxyx hh ,
)()(),(2,2 yxyx gg ……….(4)
)()(),(3,1 yxyx hh ,
)()(),(3,2 yxyx gg …….. (5)
Complex Oriented 2-D Dual-Tree Wavelet Transform:
The complex 2-D dual-tree DWT is obtained by converting a
2D real wavelet transform into a complex wavelet transform
of unidirectional spectrum. The real and imaginary part of this
complex wavelet contains sum of two separable wavelets, the
spectrum of theses separable wavelets are unidirectional
avoiding checkerboard artifacts in frequency plane. The six
angular directions ±15o ,± 45o and ± 75o can be obtained by
considering real and imaginary part of this complex wavelets.
The Equations (6)-(11) gives six complex wavelets for these
six directions where h and g indicates upper and lower tree
filter coefficients respectively.
)6(.........)]()()()([)]()()()([,1 yxyxjyxyxyx hgghgghh
)7(........)]()()()([)]()()()([,2 yxyxjyxyxyx hgghgghh
)8(.....)]()()()([)]()()()([,3 yxyxjyxyxyx hhgggghh
9....)]()()()([)]()()()([,4 yxyxjyxyxyx hhgggghh
)10.....()]()()()([)]()()()([,5 yxyxjyxyxyx hhgggghh
)11)]...(()()()([)]()()()([,6 yxyxjyxyxyx hhgggghh
)(nx
Real Tree
Imaginary Tree
)(0 nh
)(1 nh
2
2
2
)(0 nh
)(1 nh
2
2
2
)(0 ng
)(1 ng
2
2
)(0 ng
)(1 ng
2

International Journal of Computer Applications (0975 – 8887)
Volume 119 – No.24, June 2015
29
3.2 Fast Fourier Transform Fast Fourier Transform is a fast computation algorithm for
Discrete Fourier Transform (DFT). DFT is used in signal
processing applications like Linear Filtering, Correlation
analysis and spectrum analysis that involves more
computation time resulting in less efficient algorithms. In
FFT, data sequence is decomposed into small sequences till
we get single-point sequences. For N = 2v, this decomposition
can be performed v = log2N times. Thus, the total number of
complex multiplications is reduced to (N/2) log2N against N2
complex multiplication of direct computation of DFT.
Similarly, the number of complex additions is reduced to
Nlog2N compared to N2-N complex additions of direct DFT
computation. In the proposed FROCF algorithm the two
dimensional FFT is applied on 128* 512 face images and the
resulting complex coefficient matrix is converted into one
dimentional vector of size 65,530 which forms FFT features.
4. PROPOSED MODEL In this section, the proposed FROCF model is discussed. The
transform domain features are fused to generate final feature
set in the Proposed Model to enhance the recognition rate.
The block diagram of proposed FROCF is shown in Figure 2.
Fig 2: The Block Diagram of Proposed FROCF Model
4.1 Face database
The face database such as ORL, JAFFE, L-Speck and CPU-
PIE are used for the Performance analysis.
4.1.1 ORL database The database has 40 Persons with ten images per Person
having size of 112x92. The database is created by considering
20 persons with 9 images per person ie 180 face images in the
database. The tenth image of every person is considered as
test image. The samples of ORL database of person is shown
in the Figure 3.
Fig 3 : Samples of ORL Database
4.1.2 JAFFE database The JAFEE database has ten person with twenty images per
person having each image size of 256x256. The database is
created by considering five persons with 19 images per person
i.e, total no of images in the database are 95. The sample of
JAFFE database of a person is as shown in the Figure 4.
Fig 4: Samples of JAFFE database
4.1.3 Lspeck-database The database has 120 persons with twenty image samples per
person. The database is created by considering 20 persons
with 19 images ie., total no of samples in the database are
380.The image samples of L-spacek database of a person is as
shown in Figure 5.
Fig 5: Samples of L-space K database
4.1.3 CMU-PIE database The database has 68 persons with 13 images per person
having each image size of 640x480. The database is created
by considering 15 persons with eight images per person i.e,
total no images in the database are 120.The samples of CMU-
PIE database of a person is as shown in Figure 6.
Fig 6 : Samples of CMU-PIE Database
4.2 Preprocessing The different face databases has different dimensions in the
face, hence the images are resized into uniform size. The each
image is resized to x to apply DT-CWT. Where m
and n are integers. The face images are resized to x ie
128x512.
4.3 Feature Extraction by DTCWT The Feature Extraction of 2D DTCWT consists of following
three steps.
(i) An input image is decomposed using 2D DWT. In the
proposed model 5 level DT-CWT is applied on face image,
which provides sixteen sub bands at each level, 4 sub bands
of low frequencies and 12 sub bands of high frequencies.
At every level, the image size is reduced to half of the
original image size. i.e., after 5 levels the image size is
reduced to 4x16.
(ii) In the second step, every two corresponding sub bands
which have the same pass bands are linearly combined by
averaging and differencing. As a result, the sub bands of
2D-CWT at each level are obtained as(LHa+LHb)/ ,
Face Database
DT CWT
Preprocessing
FFT
Fusion
Matching
Result
Test Database
DT CWT
Preprocessing
FFT
Fusion

International Journal of Computer Applications (0975 – 8887)
Volume 119 – No.24, June 2015
30
(LHa-LHb)/ , (HLa+HLb)/ , (HHa-HHb)/ ,
(HHa+HHb)/ .
(iii) Magnitudes of real and imaginary bands are used as
features for face recognition.
The 2D separable DWT on each decomposition produces three
high frequency bands HL,HL and HH as shown in Figure 9
which gives a directional information along 0o , ± 45o , and 90o.
DTCWT implemented using 2D real wavelet transform
produces six complex wavelets producing directional
information along ±15o ,± 45o and ± 75o directions by taking
real and imaginary part of each of these complex wavelets. The
magnitude of real and imaginary part of a set of six complex
wavelets are calculated using Equation (12) and Equation (13)
Final magnitude coefficients are obtained by concatenating
using Equation (14).
)12(...............22
caac mmm
)13(..............
22
dbbd mmm
)14......(..........; bdac mmM
Where am , bm and cm , dm are corresponds DTCWT
high frequency coefficient vectors of size 1x192 at 5-Level
DTCWT. The Final feature vector M of size 1x384 is
obtained by concatenating magnitude of acm and bdm .
Fig 9: Showing Orientation of complex wavelets
4.4 FFT Feature Extraction The FFT is applied on preprocessed face image of size
128x512 to generate FFT coefficients. The complex FFT
coefficients are converted into absolute values and FFT matrix
is converted into 1-dimenstional column vector of size
65,536x1. The absolute fft coefficient values are sorted in the
descending order. The top dominant 384 coefficients are
considered as FFT features.
4.5 Final Futures. The DT-CWT features are fused with dominant FFT features
using arithmetic addition to generate final features, for better
recognition of a person as given by Equation (15)
)15...(384
1
i
ii FFTDTCWTFeatureFinal
4.6 Matching The test images features obtained using 5-Level DTCWT and
FFT are compared with features of database images using
Euclidian distance to compute FRR, FAR, EER and TSR
values. The Euclidian distance is given in the Equation (16)
)16.......(),(2
n
i
ii qpqpd
Where
pi= the feature value of the database images.
qi= the feature value of the test image.
5. ALGORITHM In this section the problem definition, objectives and
algorithm are described. The Proposed algorithm for face
recognition is given in Table 1
Problem Definition: Given face images to verify the
authentication of a person using fusion of DTCWT and
dominant FFT features
The objectives are:
(i) To increase the Total Success Rate (TSR).
(i) To reduce the False Rejection Rate (FRR).
(ii) To reduce the False Acceptance Rate (FAR)
Table 1 .Algorithm for proposed FROCF model
6. PER FORMANCE ANALYSIS In this section, the performance analysis of proposed
algorithm is discussed. The face databases ORL, L-space K,
and JAFFE and CMU-PIE are considered for performance
analysis.
6.1 Results for ORL Database FRR, FAR and TSR variations with threshold for ORL
database are given in Table 2. where out of 40 persons 20 are
considered inside the database and 20 persons out of database
for testing.. FRR and TSR decreases with increase in
threshold whereas FAR increases with increase in threshold.
As threshold increases, TSR increases from 0% to 95%. The
maximum TSR obtained for ORL database is 95%.Figure 9
shows variations of False Rejection Rate and False
Input: Face images of ORL, L-Space k, JAFFE, CMP-PIE
Output: Face image identification
Step 1: The Face database is created.
Step 2:The face image is resized to 128x512
Step 3: The 5-Level DTCWT is applied to extract DT-CWT
384 coefficients.
Step 4: The FFT is applied on preprocessed image to generate
absolute coefficient values and converted into 1-
dimestional column vector of size 65,536x1.
Step 5: The absolute coefficients are sorted in descending
order and top 384 coefficients are considered as FFT
features.
Step 6: The FFT and DT-CWT features are fused using
arithmetic addition to generate final set of features.
Step 7: The features of test image are compared with features
of database images using Euclidian distance to
compare performance parameters.
International Journal of Computer Applications (0975 – 8887)
Volume 119 – No.24, June 2015
31
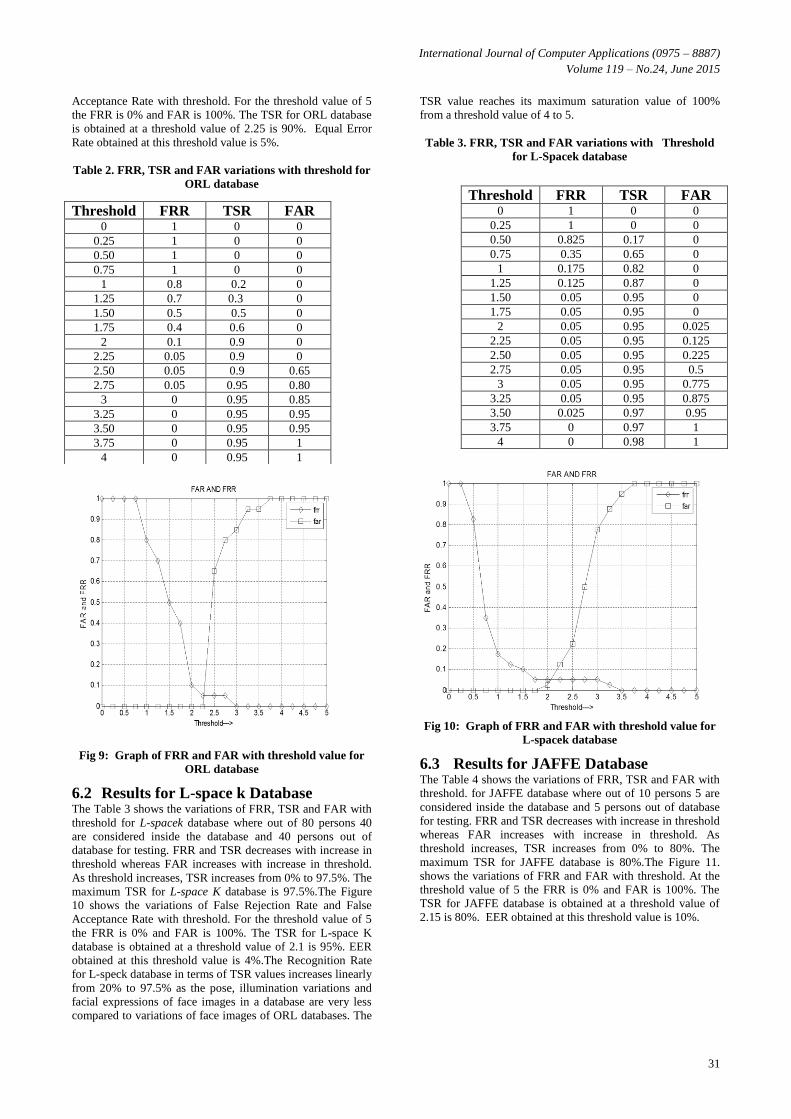
Acceptance Rate with threshold. For the threshold value of 5
the FRR is 0% and FAR is 100%. The TSR for ORL database
is obtained at a threshold value of 2.25 is 90%. Equal Error
Rate obtained at this threshold value is 5%.
Table 2. FRR, TSR and FAR variations with threshold for
ORL database
Fig 9: Graph of FRR and FAR with threshold value for
ORL database
6.2 Results for L-space k Database The Table 3 shows the variations of FRR, TSR and FAR with
threshold for L-spacek database where out of 80 persons 40
are considered inside the database and 40 persons out of
database for testing. FRR and TSR decreases with increase in
threshold whereas FAR increases with increase in threshold.
As threshold increases, TSR increases from 0% to 97.5%. The
maximum TSR for L-space K database is 97.5%.The Figure
10 shows the variations of False Rejection Rate and False
Acceptance Rate with threshold. For the threshold value of 5
the FRR is 0% and FAR is 100%. The TSR for L-space K
database is obtained at a threshold value of 2.1 is 95%. EER
obtained at this threshold value is 4%.The Recognition Rate
for L-speck database in terms of TSR values increases linearly
from 20% to 97.5% as the pose, illumination variations and
facial expressions of face images in a database are very less
compared to variations of face images of ORL databases. The
TSR value reaches its maximum saturation value of 100%
from a threshold value of 4 to 5.
Table 3. FRR, TSR and FAR variations with Threshold
for L-Spacek database
Fig 10: Graph of FRR and FAR with threshold value for
L-spacek database
6.3 Results for JAFFE Database The Table 4 shows the variations of FRR, TSR and FAR with
threshold. for JAFFE database where out of 10 persons 5 are
considered inside the database and 5 persons out of database
for testing. FRR and TSR decreases with increase in threshold
whereas FAR increases with increase in threshold. As
threshold increases, TSR increases from 0% to 80%. The
maximum TSR for JAFFE database is 80%.The Figure 11.
shows the variations of FRR and FAR with threshold. At the
threshold value of 5 the FRR is 0% and FAR is 100%. The
TSR for JAFFE database is obtained at a threshold value of
2.15 is 80%. EER obtained at this threshold value is 10%.
Threshold FRR TSR FAR 0 1 0 0
0.25 1 0 0
0.50 1 0 0
0.75 1 0 0
1 0.8 0.2 0
1.25 0.7 0.3 0
1.50 0.5 0.5 0
1.75 0.4 0.6 0
2 0.1 0.9 0
2.25 0.05 0.9 0
2.50 0.05 0.9 0.65
2.75 0.05 0.95 0.80
3 0 0.95 0.85
3.25 0 0.95 0.95
3.50 0 0.95 0.95
3.75 0 0.95 1
4 0 0.95 1
Threshold FRR TSR FAR 0 1 0 0
0.25 1 0 0
0.50 0.825 0.17 0
0.75 0.35 0.65 0
1 0.175 0.82 0
1.25 0.125 0.87 0
1.50 0.05 0.95 0
1.75 0.05 0.95 0
2 0.05 0.95 0.025
2.25 0.05 0.95 0.125
2.50 0.05 0.95 0.225
2.75 0.05 0.95 0.5
3 0.05 0.95 0.775
3.25 0.05 0.95 0.875
3.50 0.025 0.97 0.95
3.75 0 0.97 1
4 0 0.98 1

International Journal of Computer Applications (0975 – 8887)
Volume 119 – No.24, June 2015
32
Table 4. FRR, TSR and FAR variations with Threshold
for JAFFE database
Fig 11: Graph of FRR and FAR with Threshold value for
JAFFE database
6.4 Results for CMU-PIE Database The Table 5 shows the variations of FRR, TSR and FAR with
threshold for CMU-PIE database where out of 30 persons 15
are considered inside the database and 15 persons out of
database for testing. FRR and TSR decreases with increase in
threshold whereas FAR increases with increase in threshold.
As threshold increases, TSR increases from 0% to 90%. The
maximum TSR for CMU-PIE database is 90%.The Figure 12
shows the variations of FRR and FAR with threshold. At the
threshold value of 5 the FRR is 0% and FAR is 100%. The
TSR for CMU-PIE database is obtained at a threshold value of
2.1 is 90%. EER obtained at this threshold value is 10%.
Table 5. FRR, TSR and FAR variations with Threshold
for CMU-PIE database
Fig 12: Graph of FRR and FAR with Threshold value for
CMU-PIE database
The Recognition Rate of FROCF Algorithm for different
database against threshold values is shown in Figure 13.From
the graph it is observed that Recognition Rate linearly varies
for all considered database within the threshold range of 0 to
2 and Recognition Rate reaches a saturation values of 80 ,90
,95 and 97.5 for JAFEE ,CMU-PIE, ORL and L-speck
database respectively within a threshold ranging from 2 to
4.The Receiver Operating Characteristics for different features
of FROCF Algorithm is shown Figure 14. The ROC consists
of plot of FRR versus FAR for ORL.L-Speck, JAFEE and
CMU-PIE databases. The FRR values decreases from
maximum value to zero and FAR values increases from zero
to maximum values as threshold is increasing from zero to
maximum value. The ROC Characteristics helps in selecting a
Threshold FRR TSR FAR
0 1 0 0
0.25 1 0 0
0.50 1 0 0
0.75 1 0 0
1 0.8 0.2 0
1.25 0.4 0.6 0
1.50 0.4 0.6 0
1.75 0.4 0.6 0
2 0.2 0.8 0
2.25 0 0.8 0.2
2.50 0 0.8 0.2
2.75 0 0.8 0.6
3 0 0.8 0.6
3.25 0 0.8 0.8
3.50 0 0.8 1
3.75 0 0.8 1
4 0 0.8 1
Threshold FRR TSR FAR
0 1 0 0
0.25 1 0.10 0
0.50 0.9 0.65 0
0.75 0.35 0.85 0
1 0.15 0.90 0
1.25 0.1 0.90 0
1.50 0.1 0.90 0
1.75 0.1 0.90 0
2 0.1 0.90 0
2.25 0.1 0.90 0.15
2.50 0.1 0.90 0.25
2.75 0.1 0.90 0.3
3 0.1 0.90 0.45
3.25 0.05 0.90 0.75
3.50 0 0.90 0.95
3.75 0 0.90 0.95
4 0 0.90 1

International Journal of Computer Applications (0975 – 8887)
Volume 119 – No.24, June 2015
33
optimum threshold value which gives good Recognition Rate
with less FAR and FRR values.
Fig 13: Graph of Recognition Rate of FROCF algorithm
for different database
Fig 14: Receiver Operating Characteristics of FROCF
Algorithm
6.5 Comparison of Recognition Rate with
Different Algorithms The percentage recognition of FROCF algorithm is compared
with existing algorithms presented by Gao et al., [9] Li et al.,
[10] and Huang et al., [11] is given in Table 6 for ORL
database. It is observed that the percentage recognition rate is
high i.e., 95.3% compared to low value of existing algorithms
[9],[10],[11] for the ORL database. The percentage
recognition rate of FRDF is 90.25% compared to existing
algorithm presented in Zhang et al., [12] for CMU-PIE
database. The FROCF algorithm performs better for the
following reasons: (i)The feature extracted by DTCWT are
shift invariant and capture directional variations (ii) The pose
and illumination variations are converted into frequency
domain using FFT and features are computed by considering absolute values of FFT coefficients. (iii) The features of
DTCWT and FFT are fused using arithmetic addition to
obtain final features to identify face images accurately. Table
6 gives Comparison of Recognition Rate of FROCF algorithm
with other Existing Algorithms [9],[10],[11] for ORL
Database. Table 7. gives the comparison of Recognition Rate
of FROCF algorithm in comparison with Zhang et al., [12].
Table 6. Comparison of Recognition Rate of Proposed
Algorithm with Various Existing Algorithm for ORL
Database
Table 7. Comparison Recognition Rate of FROCF
algorithm for CMU-PIE database
7. CONCLUSIONS Face is a reliable biometric trait used to authenticate a person.
In the Proposed FROCF Model shift invariant and directional
features of face images are obtained by applying 5-Level DT-
CWT are combined with pose and illumination variation
features of FFT to form Final Features. The Euclidean
distance classifier is used to match test image features with
database image features and Performance Parameters FAR,
FRR and TSR are computed. The Performance of Proposed
FROCF shows better performance results compared to
Existing Methods .In Future both spatial and frequency
domain features are combined for better performance.
8. ACKNOWLEDGMENTS Our thanks to management of Alpha College of Engineering
and Jawaharlal Nehru Technological University,
Anantapur,for their support in Research.
9. REFERENCES [1] Alaa Eleyan, Hasan Demirel and Hiiseyin O. 2008. Face
Recognition using Dual-Tree Wavelet Transform. IEEE
Sl
no
Authors Techniques Recognition
Rate
01 GAO
Zhirong et
al.,[ 9]
HL_LRC 93.5%
02 LI YueLong
et al.,[10 ]
DSRC-LDA 88.0%
03 Jun Huang et
al.,[11] MPCA+LDA 92%
04 Proposed
algorithm DTCWT+FFT 95.3%
Sl
no
Authors Techniques Recognition
Rate
01
Jian Zhang et
al.,[12]
NOMR
82.31%
02 Proposed
algorithm DTCWT+FFT 90.25%

International Journal of Computer Applications (0975 – 8887)
Volume 119 – No.24, June 2015
34
International Symposium on Signal Processing and
Information Technology, pp 7-11.
[2] Zhongxi Sun, Wankou Yang, Changyin Sun and Jifeng,
S. 2010. Face Recognition using DTCWT Feature-based
2D PCA .Chinese Conference on Pattern Recognition. pp
1-5.
[3] Ravi, J. Saleem, S.T. and Raja, K.B. 2012.Face
Recognition using DT-CWT and LBP Features.
International Conference on Computing, Communication
and Applications, pp. 1-6.
[4] Yuehui Sun and Minghui D. 2006. DTCWT Feature
based Classification using Orthogonal Neighborhood
Preserving Projections for Face Recognition.
International Conference on Computational Intelligence
and Security. vol.1, pp. 719-724.
[5] Sun Zhongxi, Sun Changyin, ShenJifeng and Yang, W.
2011. Face Recognition using DT-CWT Feature-based
2DIFDA.Chinese Control Conference, pp. 3140-3145.
[6] Ramesha, K. and Raja, K.B. 2011. Performance
Evaluation of Face Recognition based on DWT and DT-
CWT using Multi-Matching Classifiers. International
Conference on Computational Intelligence and
Communication Networks. pp. 601-605.
[7] Kingsbury, N. G. 2001.Complex Wavelets for Shift
Invariant Analysis and Filtering of Signals. Journal of
Applied Computational Harmonic Analysis, vol.10, pp.
234-253.
[8] Muhammad, U. Arif, M. and Ajmal M. 2015. Hyper
spectral Face Recognition with Spatiospectral
Information Fusion and PLS Regression. IEEE
Transactions on Image Processing, vol. 24, no. 3, pp.
1127-1137.
[9] Gao, z. Ding Lixin, Xiong Chengyi and Huang, B. 2014.
A Robust Face Recognition Method using Multiple
Features Fusion and Linear Regression. Journal of
Natural Science, vol.19 no.4, pp. 323-327.
[10] yuelong, Li. Meng Li, Feng Jufu and Jigang,2014.
Downsampling sparse representation and discriminant
information aided occluded face recognition.
International Journal of Science China Information
Sciences, vol. 57 ,no.03, pp. 1-8.
[11] Jun Huang, Kehua Su, Jamal El-Den, Tao Hu, and
Junlong, Li. 2014. An MPCA/LDA Based
Dimensionality Reduction Algorithm for Face
Recognition. International Journal on Mathematical
Problems in Engineering, vol.14, pp. 1-12.
[12] Jian Zhang ,JianYang , JianjunQian and Jiawei,Xu,2014.
Nearest orthogonal matrix representation for face
recognition. International Journal on Neurocomputing,
vol.151, pp. 471-480.
IJCATM : www.ijcaonline.org