Embed Size (px)
Citation preview

Facebook or Fakebook: Identifying Fake Facebook Accounts ABSTRACT With increasing number of fake accounts permeating social media sites like Facebook, identifying and eliminating fake accounts have become particularly crucial. In this study, we run a logistic regression model on a cleaned dataset with 250 real Facebook accounts and 250 fake Facebook accounts. Our final model is fitted with logit link using backward stepwise procedure under AIC criteria, which yields an AUC score of 0.9962 and predicts that Facebook accounts with fewer photo tags, fewer check-ins, and more group memberships are more likely to be fake.
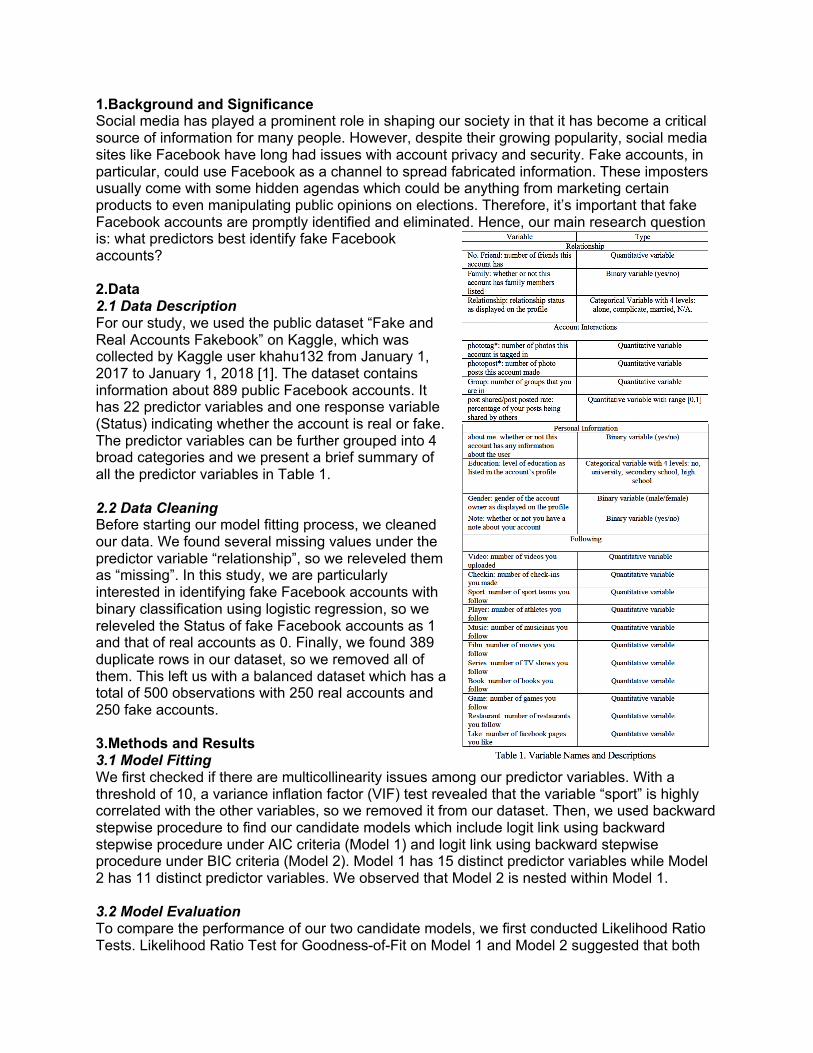
1.Background and Significance Social media has played a prominent role in shaping our society in that it has become a critical source of information for many people. However, despite their growing popularity, social media sites like Facebook have long had issues with account privacy and security. Fake accounts, in particular, could use Facebook as a channel to spread fabricated information. These imposters usually come with some hidden agendas which could be anything from marketing certain products to even manipulating public opinions on elections. Therefore, it’s important that fake Facebook accounts are promptly identified and eliminated. Hence, our main research question is: what predictors best identify fake Facebook accounts? 2.Data 2.1 Data Description For our study, we used the public dataset “Fake and Real Accounts Fakebook” on Kaggle, which was collected by Kaggle user khahu132 from January 1, 2017 to January 1, 2018 [1]. The dataset contains information about 889 public Facebook accounts. It has 22 predictor variables and one response variable (Status) indicating whether the account is real or fake. The predictor variables can be further grouped into 4 broad categories and we present a brief summary of all the predictor variables in Table 1. 2.2 Data Cleaning Before starting our model fitting process, we cleaned our data. We found several missing values under the predictor variable “relationship”, so we releveled them as “missing”. In this study, we are particularly interested in identifying fake Facebook accounts with binary classification using logistic regression, so we releveled the Status of fake Facebook accounts as 1 and that of real accounts as 0. Finally, we found 389 duplicate rows in our dataset, so we removed all of them. This left us with a balanced dataset which has a total of 500 observations with 250 real accounts and 250 fake accounts. 3.Methods and Results 3.1 Model Fitting We first checked if there are multicollinearity issues among our predictor variables. With a threshold of 10, a variance inflation factor (VIF) test revealed that the variable “sport” is highly correlated with the other variables, so we removed it from our dataset. Then, we used backward stepwise procedure to find our candidate models which include logit link using backward stepwise procedure under AIC criteria (Model 1) and logit link using backward stepwise procedure under BIC criteria (Model 2). Model 1 has 15 distinct predictor variables while Model 2 has 11 distinct predictor variables. We observed that Model 2 is nested within Model 1. 3.2 Model Evaluation To compare the performance of our two candidate models, we first conducted Likelihood Ratio Tests. Likelihood Ratio Test for Goodness-of-Fit on Model 1 and Model 2 suggested that both

models provide adequate model fit compared with the saturated model. Likelihood Ratio Test for Model Comparison showed that Model 1 has a better fit for the data than Model 2. We then looked into the various performance metrics for the two models. In particular, a model with lower AIC value and higher AUC value is more preferable. Lower AIC score suggests better trade-off between model complexity and model fit, and higher AUC and accuracy indicate higher prediction power. Based on the performance metrics shown in Table 2, Model 1 performs slightly better than Model 2.
Table 2. Performance Metrics for Candidate Models
Finally, we would like to compare which set of predictor variables has better performance more rigorously by examining the performance metrics under 10-fold cross validation. We first split the entire 500 observations into 10 random subsets. For each iteration, we fitted a model with the set of predictors in Model 1 on 9 subsets, tested the fitted model on the remaining subset, and calculated performance metrics. We then averaged over the 10 iterations to get the cross-validated performance metrics. We repeated the process for Model 2 and the cross-validated performance metrics are shown in Table 3. We concluded that Model 1 indeed has better model fit than Model 2. Since Model 1 has sufficient model fit, we decided not to introduce higher-order terms into our model as first-order models are more parsimonious and easier to interpret compared with higher-order models.
Table 3. Cross-validated Performance Metrics for Candidate Models
3.3 Model Diagnostics and Final Model Interpretation After choosing Model 1 as our best first-order model, we checked the logistic regression diagnostic plots and identified rows 190, 198, 220, and 486 as potential outliers. We then examined the delta deviance plot and found the 486th observation influential, so we removed this observation from our dataset and refitted the model to get our final model. Removing this influential outlier decreased the AIC score from 123.37 to 115.18 and increased the AUC from 0.996 to 0.9962. Therefore, our final model is: logit(𝑓𝑎𝑘𝑒% )=-0.8839-0.0001847*No.Friend + 3.83*educationno + 10.48*educationsecondary school - 4.033*educationuniversity +11.84*about.meyes - 0.1258*familyyes -1.768*gendermale -6.425*relationshipcomplicate -16.29*relationshipmarried + 6.947*relationshipmissing - 1.304*phototag. - 0.3799*checkin - 0.9005*music - 1.1*film - 0.5834*series + 0.002624*like + 0.06862*group - 3.164*noteyes + 2.133*post.shared.post.posted.rate In binary classification with logistic regression using logit transformation, increase in predicted log odds of being fake is associated with increase in predictor variables with positive estimated regression coefficients and decrease in predictor variables with negative estimated regression coefficients. Hence, based on our final model, we were able to summarize the characteristics of Facebook accounts that are more likely to be fake in Table 4:
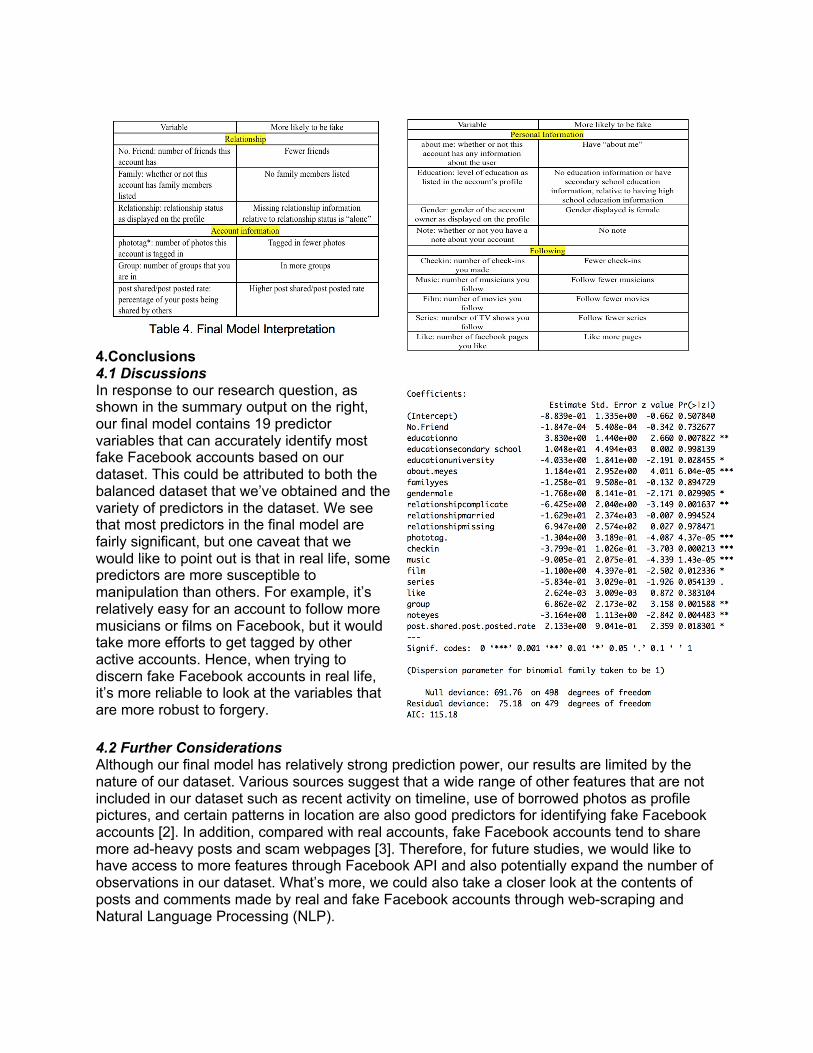
4.Conclusions 4.1 Discussions In response to our research question, as shown in the summary output on the right, our final model contains 19 predictor variables that can accurately identify most fake Facebook accounts based on our dataset. This could be attributed to both the balanced dataset that we’ve obtained and the variety of predictors in the dataset. We see that most predictors in the final model are fairly significant, but one caveat that we would like to point out is that in real life, some predictors are more susceptible to manipulation than others. For example, it’s relatively easy for an account to follow more musicians or films on Facebook, but it would take more efforts to get tagged by other active accounts. Hence, when trying to discern fake Facebook accounts in real life, it’s more reliable to look at the variables that are more robust to forgery.
4.2 Further Considerations Although our final model has relatively strong prediction power, our results are limited by the nature of our dataset. Various sources suggest that a wide range of other features that are not included in our dataset such as recent activity on timeline, use of borrowed photos as profile pictures, and certain patterns in location are also good predictors for identifying fake Facebook accounts [2]. In addition, compared with real accounts, fake Facebook accounts tend to share more ad-heavy posts and scam webpages [3]. Therefore, for future studies, we would like to have access to more features through Facebook API and also potentially expand the number of observations in our dataset. What’s more, we could also take a closer look at the contents of posts and comments made by real and fake Facebook accounts through web-scraping and Natural Language Processing (NLP).

5. References
[1] khahu132. “Fake and Real Accouts Fakebook.” Kaggle, 17 Apr. 2018, www.kaggle.com/khahu132/fake-and-real-accouts-fakebook. [2] Lincoln, John E, et al. “How to Spot a Fake Facebook Account a Mile Away.” Ignite Visibility, 12 Oct. 2018, ignitevisibility.com/how-to-spot-a-fake-facebook-account-a-mile-away/. [3] Elwood, Zachary. “Top 7 Signs a Facebook Account Is Fake – Zachary Elwood – Medium.” Medium.com, Medium, 11 Nov. 2017, medium.com/@apokerplayer/top-7-signs-a-facebook-account-is-fake-1eb942591887.

6.Appendix A. Data Exploration Graphs
B. Model Diagnostic Plots

C. Delta Deviance Plot
D. Influential Outlier
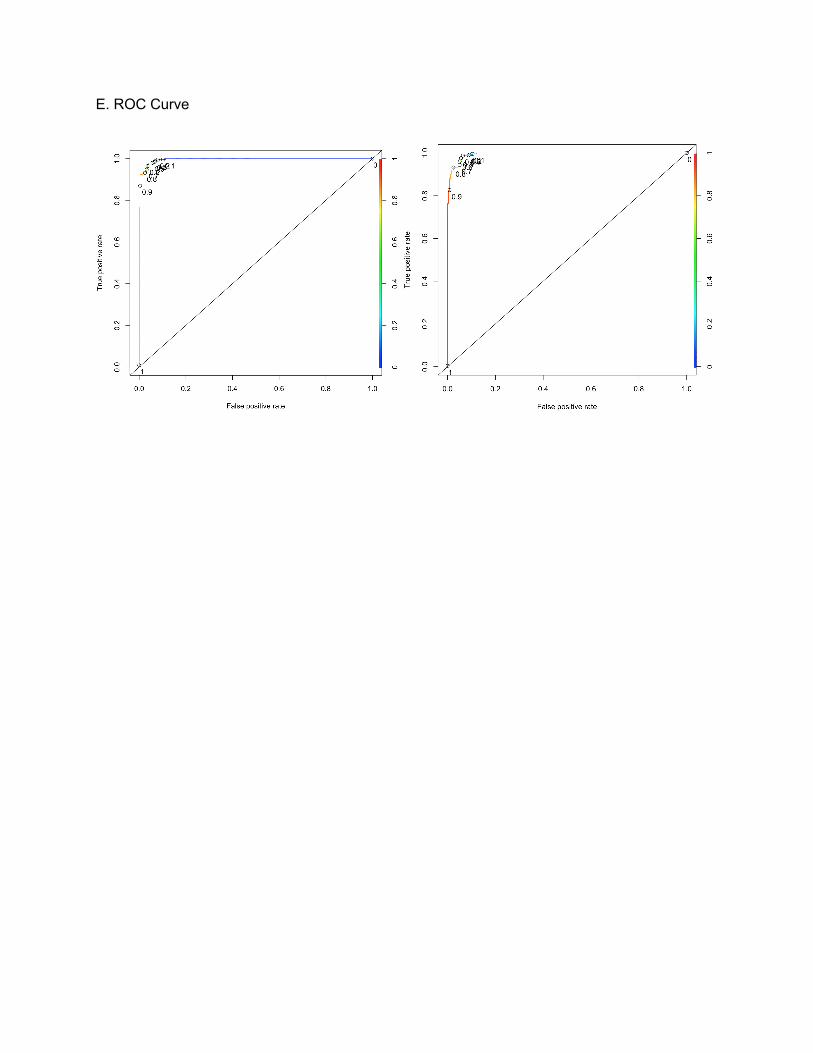
E. ROC Curve