Embed Size (px)
Citation preview

Computer Vision and Image Understanding 91 (2003) 138–159
www.elsevier.com/locate/cviu
Facial asymmetry quantification forexpression invariant human identification
Yanxi Liu,a,* Karen L. Schmidt,b Jeffrey F. Cohn,a,b
and Sinjini Mitrac
a The Robotics Institute, Carnegie Mellon University, 5000 Forbes Avenue, Pittsburgh, PA 15213, USAb Department of Psychology, University of Pittsburgh, Pittsburgh, PA 15260, USAc Statistics Department, Carnegie Mellon University, Pittsburgh, PA 15213, USA
Received 15 February 2002; accepted 24 March 2003
Abstract
We investigate facial asymmetry as a biometric under expression variation. For the first
time, we have defined two types of quantified facial asymmetry measures that are easily com-
putable from facial images and videos. Our findings show that the asymmetry measures of au-
tomatically selected facial regions capture individual differences that are relatively stable to
facial expression variations. More importantly, a synergy is achieved by combining facial
asymmetry information with conventional EigenFace and FisherFace methods. We have as-
sessed the generality of these findings across two publicly available face databases: Using a
random subset of 110 subjects from the FERET database, a 38% classification error reduction
rate is obtained. Error reduction rates of 45–100% are achieved on 55 subjects from the Cohn–
Kanade AU-Coded Facial Expression Database. These results suggest that facial asymmetry
may provide complementary discriminative information to human identification methods,
which has been missing in automatic human identification.
� 2003 Elsevier Inc. All rights reserved.
1. Motivation
Human facial asymmetry has long been a critical factor for evaluation of facial
attractiveness [38] and expressions [32] in psychology and anthropology, albeit most
* Corresponding author. Fax: 1-412-268-6436.
E-mail address: [email protected] (Y. Liu).
1077-3142/$ - see front matter � 2003 Elsevier Inc. All rights reserved.
doi:10.1016/S1077-3142(03)00078-X

Y. Liu et al. / Computer Vision and Image Understanding 91 (2003) 138–159 139
studies are carried out qualitatively using human observers as judges, or locally
where features are measured individually (e.g., length of ears). Asymmetrical faces
are considered less attractive [38], and it has been reported that facial attractiveness
for men is inversely related to recognition accuracy [30]. For face recognition by hu-
mans, a small yet statistically significant decrease in recognition performance is ob-served when facial asymmetry is removed from images [40], which suggests that
facial asymmetry may play a role in human identification by humans.
Individuals in the general population display a wide range of variation in the
amount of facial asymmetry (Fig. 1). Intrinsic facial asymmetry in individuals is af-
fected by multiple factors, including growth, injury, and age-related change. Ex-
trinsic facial asymmetry is caused by viewing orientation, illuminations, shadows,
and highlights. In this work, our goal is to find answers to these questions:
Whether intrinsic facial asymmetry (1) is useful for human identification by ma-chines; (2) can be used for automatic human identification across different data-
bases; and (3) is robust for automatic human identification under expression
variation.
Fig. 1. Left: original face images taken under balanced bilateral lighting. Middle: a perfectly symmetrical
face made of the left half of the original face. Right: a perfectly symmetrical face made of the right half of
the original face. Notice the difference in nasal regions in both individuals caused by left–right asymmetry
of the nasal bridge.
140 Y. Liu et al. / Computer Vision and Image Understanding 91 (2003) 138–159
Bilateral anatomical symmetry of humans and other animals has been exploited
successfully in other fields for the purpose of classification and clustering [7,11,18].
In computer graphics for instance, it is a commonly accepted assumption that hu-
man faces are bilaterally symmetrical (e.g. [35,44]). On the other hand, facial expres-
sions lateralization was reported in the literature [4,5] where facial expression isfound to be more intense on the left side. Previous work on facial expression anal-
ysis, e.g. [3,9,37,39,43], is almost exclusively focused on expression recognition and
coding without regarding to asymmetry. In [27,28], Martinez used local regions on
each half face image separately for human identification under a given facial expres-
sion and reported different recognition rates for left and right face images.
Different from all previous work, we investigate whether facial asymmetry, as a
holistic, explicit, and quantified multidimensional measure is discriminative across
individuals, especially under expression variation [24,25].As an initial attempt in quantifying facial asymmetry, we use frontal facial images
obtained under controlled lighting. This is for the purpose of maximum isolation of
intrinsic from extrinsic factors, and determining how intrinsic facial asymmetry may
contribute to human identification. First, we investigate facial asymmetry as a bio-
metric in face images consisting of predominantly neutral expressions. Using the
FERET face database [31], we found that facial asymmetry captures individual dif-
ferences that can contribute to improved face recognition. We then investigate
whether facial asymmetry as a biometric is robust to type and intensity of facial ex-pression. The Cohn–Kanade AU-Coded Facial Expression Database [15] is used as
the primary testbed.
2. Image data sets
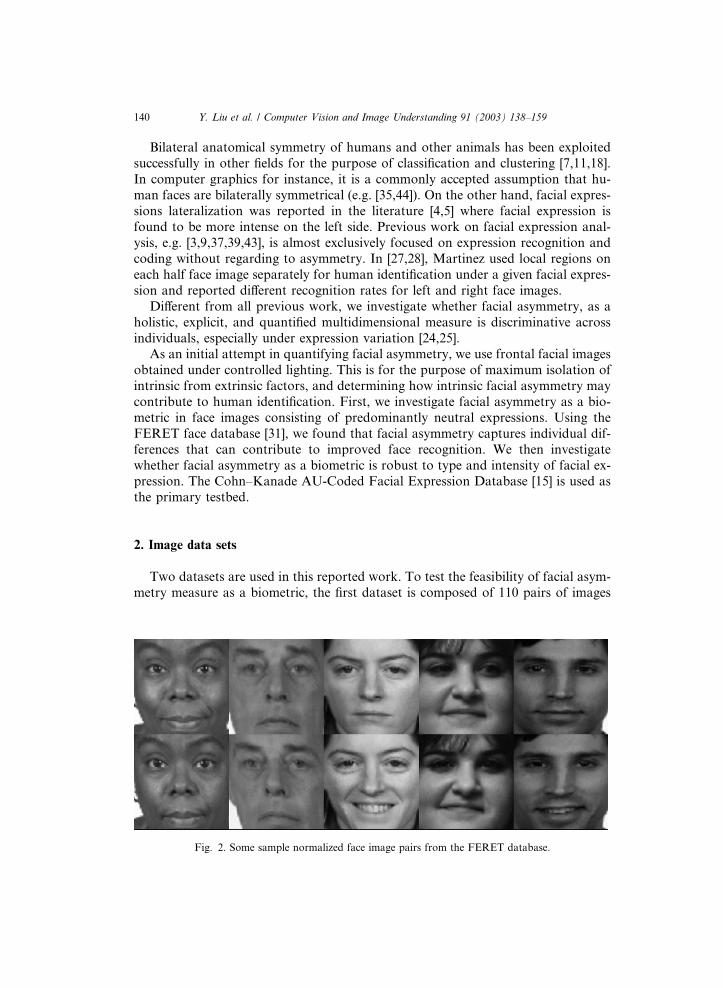
Two datasets are used in this reported work. To test the feasibility of facial asym-
metry measure as a biometric, the first dataset is composed of 110 pairs of images
Fig. 2. Some sample normalized face image pairs from the FERET database.
Y. Liu et al. / Computer Vision and Image Understanding 91 (2003) 138–159 141
from 110 subjects randomly chosen from the FERET database (frontal faces only,
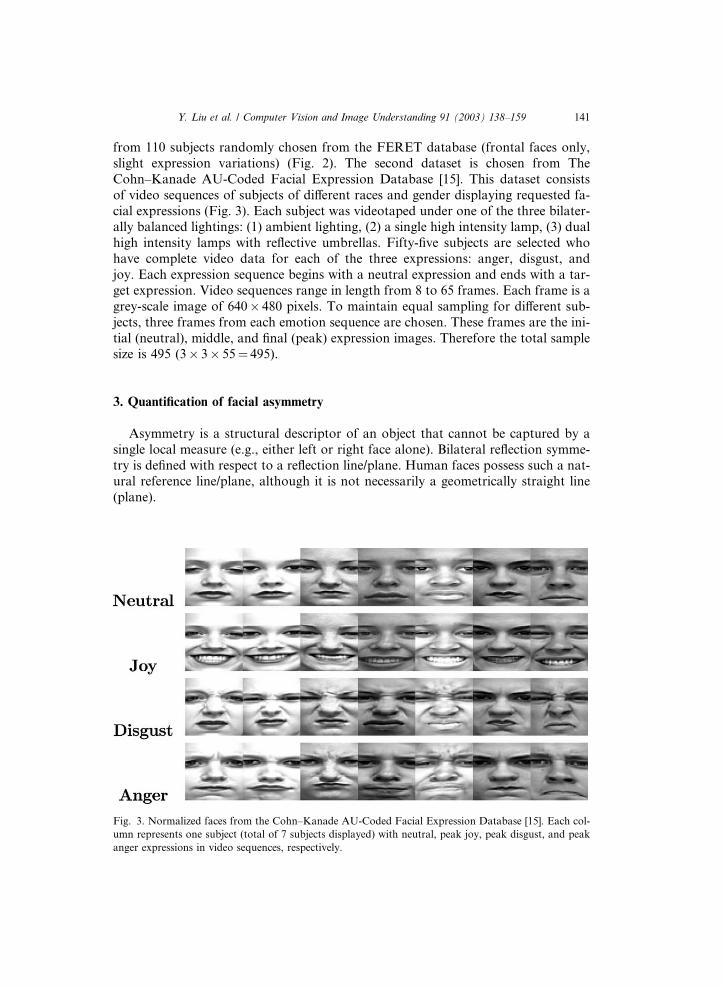
slight expression variations) (Fig. 2). The second dataset is chosen from The
Cohn–Kanade AU-Coded Facial Expression Database [15]. This dataset consists
of video sequences of subjects of different races and gender displaying requested fa-
cial expressions (Fig. 3). Each subject was videotaped under one of the three bilater-ally balanced lightings: (1) ambient lighting, (2) a single high intensity lamp, (3) dual
high intensity lamps with reflective umbrellas. Fifty-five subjects are selected who
have complete video data for each of the three expressions: anger, disgust, and
joy. Each expression sequence begins with a neutral expression and ends with a tar-
get expression. Video sequences range in length from 8 to 65 frames. Each frame is a
grey-scale image of 640� 480 pixels. To maintain equal sampling for different sub-
jects, three frames from each emotion sequence are chosen. These frames are the ini-
tial (neutral), middle, and final (peak) expression images. Therefore the total samplesize is 495 (3� 3� 55¼ 495).
3. Quantification of facial asymmetry
Asymmetry is a structural descriptor of an object that cannot be captured by a
single local measure (e.g., either left or right face alone). Bilateral reflection symme-
try is defined with respect to a reflection line/plane. Human faces possess such a nat-ural reference line/plane, although it is not necessarily a geometrically straight line
(plane).
Fig. 3. Normalized faces from the Cohn–Kanade AU-Coded Facial Expression Database [15]. Each col-
umn represents one subject (total of 7 subjects displayed) with neutral, peak joy, peak disgust, and peak
anger expressions in video sequences, respectively.

142 Y. Liu et al. / Computer Vision and Image Understanding 91 (2003) 138–159
3.1. Face image normalization
The goal of normalization is to establish a common coordinate system such that
different faces can be meaningfully and easily compared. To make facial asymmetry
measures readily comparable and combinable with those of EigenFace and Fisher-Face, we follow a face normalization process similar to [1,41]. We identify three an-
atomical feature points on each face: the inner canthus of each eye, ðC1;C2Þ and the
philtrum C3 (Fig. 4). We define face midline as the line going through the mid point
of ðC1;C2Þ and the philtrum C3. A common coordinate in all faces is formed by
transforming the face midline to a fixed vertical line centered in each face image.
More specifically, this is done by moving ½C1;C2;C3� into their normalized positions
in three steps (Fig. 4):
1. rigid rotation: rotate C1C2 into a horizontal line segment,2. X-skewing: skew the face image horizontally such that C3 is centered on the per-
pendicular line going through the midpoint of C1, C2,
3. X ; Y -scaling: scale C1C2 into length a, and scale the distance between C3 and C1C2
to length b.Step 2 above (X-skewing) forces C1, C2 to be bilaterally symmetrical with respect to
the face midline. This step is equivalent to ‘‘reorienting’’ the anatomical face midline
by an affine transformation. In general, affine transformation may fail to preserve
Euclidean distance upon which definitions of symmetry are based [10]. However, asin the case of skewed symmetry [14], the relative distances of corresponding points
with respect to their midpoint remain intact before and after skewing. Alternatively,
one could normalize face images for facial asymmetry computation without skewing.
The three facial feature points (two canthi and a philtrum) are marked manually
in the first frame and then tracked using the Lucas–Kanade algorithm [16]. In a
Fig. 4. Each face image is normalized using three points: left and right inner canthi (C1, C2) and the phil-
trum (C3), by an affine transformation as follows: (1) rotation: rotate C1C2 into a horizontal line segment;
(2) X-skewing: skew the face image horizontally such that C3 is located on the perpendicular line going
through the midpoint of C1, C2; (3) X=Y -scaling: scale C1C2 into length a and scale the distance between
C3 and C1C2 to length b.
Y. Liu et al. / Computer Vision and Image Understanding 91 (2003) 138–159 143
related study, tracked feature points are highly correlated (P 0.95) with manually
marked final positions [42]. Each image is then cropped into a 128� 128 squared im-
age with face midline centered vertically. All normalized faces have inner canthi and
philtrum in the same pixel locations: C1 ¼ ½40; 48�, C2 ¼ ½88; 48�, and C3 ¼ ½64; 84�.Thus a ¼ 48 and b ¼ 36 (upper-left corner has coordinates [0,0]) (Fig. 4).
3.2. Facial asymmetry measurements
Once a face midline is determined, each point in the normalized face image has a
unique corresponding point on the other side of the face image (given even number
of columns in the image). Let us establish a coordinate system in a normalized face
image with X-axis perpendicular to the face midline and Y-axis coinciding with the
face midline. For a given normalized face density image I , its vertically reflected im-age I 0, and their respective ‘‘edge’’ images Ie, I 0e (formed by applying an edge extrac-
tion algorithm to I , and I 0), we can define the following two facial asymmetry
measurements:
Density Difference (D-face):
Dðx; yÞ ¼ Iðx; yÞ � I 0ðx; yÞ: ð1Þ
Edge orientation Similarity (S-face):Sðx; yÞ ¼ cosð/Ieðx;yÞ;I 0eðx;yÞÞ; ð2Þ
where /Ieðx;yÞ;I 0eðx;yÞ is the angle between the two edge orientations of images Ie, I 0e at thesame pixel point x; y. Fig. 5 displays three normalized faces and their respective
D-face and S-face. D-face and S-face capture facial asymmetry from different per-
spectives. D-face represents left–right relative intensity variation while S-face is
affected by the zero-crossings of the intensity field. The higher the value of D-face,
the more asymmetrical the face. The higher the value of S-face, the more symmetrical
the face.
By construction, S-face is bilaterally symmetric, and the left and right halves of
D-face are opposite (Fig. 5). Therefore, half of D-face and S-face contains all the
needed information. From now on, we denote these half faces as D-face and S-face.
In Table 1, we define six projections of D-face and S-face, D, Dx, Dy S, Sx, Sy , and call
them AsymmetryFaces. Each dimension of an AsymmetryFace is called a feature.
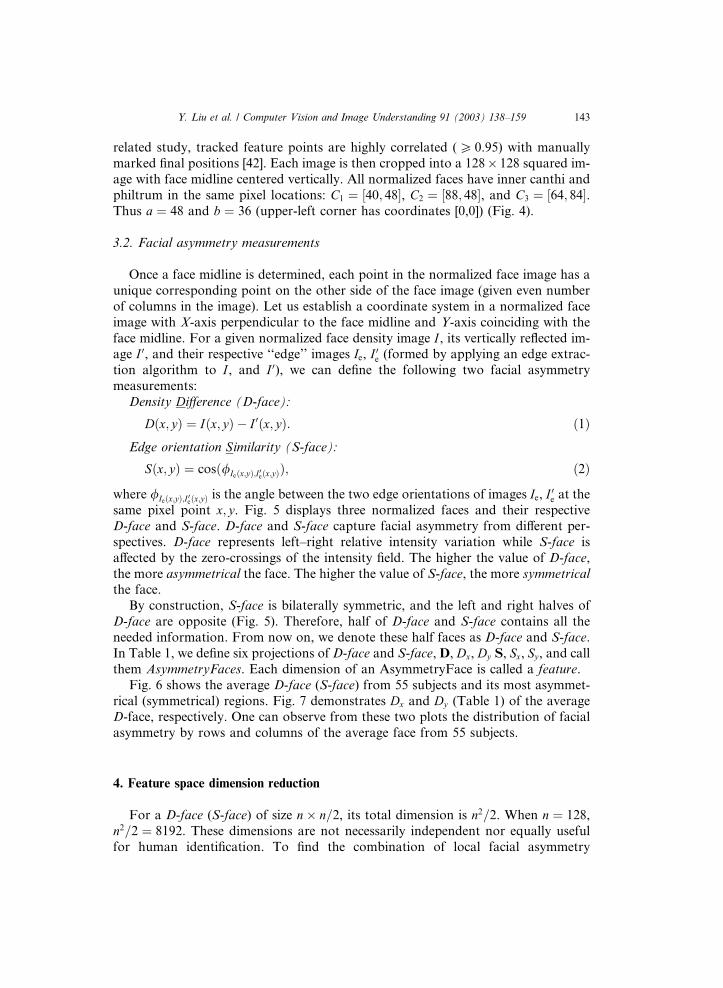
Fig. 6 shows the average D-face (S-face) from 55 subjects and its most asymmet-
rical (symmetrical) regions. Fig. 7 demonstrates Dx and Dy (Table 1) of the averageD-face, respectively. One can observe from these two plots the distribution of facial
asymmetry by rows and columns of the average face from 55 subjects.
4. Feature space dimension reduction
For a D-face (S-face) of size n� n=2, its total dimension is n2=2. When n ¼ 128,
n2=2 ¼ 8192. These dimensions are not necessarily independent nor equally useful
for human identification. To find the combination of local facial asymmetry

Fig. 5. (A) normalized face, (B) D-face, and (C) S-face.
144 Y. Liu et al. / Computer Vision and Image Understanding 91 (2003) 138–159
measures that is most discriminative across human identities and reduce computa-
tion cost, we have experimented with several approaches for feature dimensionality
reduction.
In the following, we use a specific set of AsymmetryFaces computed from the
Cohn–Kanade database as a concrete example of feature space reduction. The di-mensions of the six AsymmetryFaces from this database are specified in the right col-
umn of Table 1.
4.1. Principle component analysis
Principle component analysis (PCA) is performed on an 495� 192 matrix to pro-
duce dataset D and S as defined in Table 1. 8192 ¼ 128� 64 is the total number
of pixels (feature dimension) in each D-face (S-face) and 495 is the sample number.

Table 1
Different AsymmetryFaces
Notation Definitions Size (Y-axis�X-axis)
D-face Intensity Difference image 128� 64
S-face Edge Similarity image 128� 64
AsymmetryFaces Description Dimensions (samples� features)
D Top k PCs accounting for 95% variance
of D-face
495� 60
Dx Column-mean of D-face on X-axis 495� 64
Dy Row-mean of D-face on Y-axis 495� 128
S Top k PCs accounting for 95% variance
of S-face
495� 100
Sx Column-mean of S-face on X-axis 495� 64
Sy Row-mean of S-face on Y-axis 495� 128
Right column indicates the AsymmetryFaces dimensions. PCs means principal components.
Fig. 6. (A) average D-face of 55 subjects, each subject has three expression videos. (B) The absolute values
of D-face. (C) The top 1/3 most asymmetrical regions by D-face measure are circled. (D) Average S-face.
(E) The top 1/3 most symmetrical regions by S-face measure are circled.
Y. Liu et al. / Computer Vision and Image Understanding 91 (2003) 138–159 145
Following a commonly accepted criterion in face recognition [36,41], in this work
(unless otherwise stated) we keep the top k principle components (PCs) that account
for 95% of the variance in the data. Based on this cut-off rate, the top 60 principal
components of D-face and 100 principal components of S-face are retained. The fea-
ture dimensions are thus reduced from 8192 to 60 and 100, respectively.
Fig. 7. Left: Dy (128 dimensions) starts from forehead and ends at the chin of the average D-face in Fig.
6(A). Right: Dx (64 dimensions) starts from the ear-side of the face (more asymmetrical) and ends in the
center of the face (more symmetrical) of the average D-face.
146 Y. Liu et al. / Computer Vision and Image Understanding 91 (2003) 138–159
4.2. Feature averaging
We computed the mean values of D and S along X ; Y -axes to obtain Dx, Dy , Sx, Sy(Table 1) as one way to reduce the feature space dimensions from 8192 to 64 and 128,
respectively. These AsymmetryFaces provide an economical way to examine facial
asymmetry row by row and column by column. Using the Dx, Dy , Sx, Sy representa-tion, facial asymmetry of an expression video can be expressed as a spatiotemporal
3D surface for visualization and comparison. Fig. 8 shows an example of how Dy
(row projections of D-face) varies across expression video clips (joy, anger, and dis-gust) between two different subjects. Despite expression changes, the between subject
variation is more pronounced than variation across expression.
4.3. Discriminative feature subset selection
A common theme in our research is to use available image features selectively for
different image discrimination tasks; this is especially effective when redundancy pre-
sents within different feature dimensions [17–19,26]. In the current study, instead ofusing the full range of the six AsymmetryFaces (Table 1) certain criteria are used to
seek a discriminative feature subspace.
For a feature F with values SF in a data set with C total classes, the variance ratio
(VR) of between- to within-variance is calculated as
VRðF Þ ¼ VarðSF Þ1=C
Pk¼1;...;C VarkðSF Þ
;
where VarkðSF Þ is the variance of the subset of values from feature F which be-
longs to class c. Though VR accounts for the spread between means with thebetween-class variance, it does not take into account separation of classes on an
individual basis.

Fig. 8. Spatiotemporal surface of three expression video clips expressed using AsymmetryFace Dy . Top:
subject 85. Bottom: subject 10. The ‘‘Frame’’ axis indicates the temporal ordering of joy–anger–disgust
expression video clips consecutively. The ‘‘Features’’ axis shows AsymmetryFace Dy starting from fore-
head going towards the chin. The height is the D-face value.
Y. Liu et al. / Computer Vision and Image Understanding 91 (2003) 138–159 147
It is possible for a feature to have small within-class scatter for a class even if themean value of the feature for that class is very close to the mean value of the feature
in another class. Thus we define an augmented variance ratio (AVR) as follows
AVRðF Þ ¼ VarðSF Þð1=CÞ
Pi¼1;...;CðVariðSF Þ=mini6¼jðjmeaniðSF Þ �meanjðSF ÞjÞ
Þ;
where meaniðF Þ is the mean of feature F s values in class i. AVR is the ratio of the
variance of the feature between subjects to the variance of the feature within subjects,
with an added penalty for features that have close inter-subject mean values. Indi-
vidual features that have higher variance ratios are more discriminative.

148 Y. Liu et al. / Computer Vision and Image Understanding 91 (2003) 138–159
Fig. 9 shows the variance ratio values of each feature dimension of the four Asym-
metryFaces Dx, Dy , Sx, Sy (Table 1). The row with the highest AVR value of Dy cor-
responds to the nasal bridge region in the face images (Fig. 10). This finding is
consistent with our observations in Fig. 1, but contrary to the intuition that mouth
and eyes regions are the most discriminating characteristics for face recognition.
Fig. 9. Each plot shows the AVR value of each of the AsymmetryFaces (Dx;Dy ; Sx; Sy defined in Table 1).
The higher the AVR value for a single dimension the more discriminating power that individual feature
has. Dy and Sy (128 dimensions) start from forehead (left) to chin (right). Dx and Sx (64 dimensions) start
from side face (left) towards the face midline (right).

Fig. 10. These are three video clips (joy, anger, disgust) with the most discriminative row feature indi-
cated. The most discriminative row feature on a horizontal region, selected using augmented variance ratio
measurement on each feature dimension, is around nasal bridge area. This region corresponds to the peak
of Dy in Fig. 9.
Y. Liu et al. / Computer Vision and Image Understanding 91 (2003) 138–159 149
Only those regions that are relatively invariant and unique for each subject across
different expressions are candidates for discriminative features. Our goal is to use
computer algorithms to find these regions automatically (Section 5.1.2).
5. Face identification experiments
To test the effectiveness of facial asymmetry measurements, we have used two da-tasets for our experiments. The first one is the FERET Database [31] and the second
is the Cohn–Kanade AU-Coded Facial Expression Video Sequence Database [15].
5.1. Experimental methods
Two different datasets with different statistical properties are used for our exper-
iments. Accordingly, two different classification methods are used as baseline classi-
fiers for comparison when facial asymmetry information is added: EigenFace [41]and FisherFace [1]. For the dataset from the FERET database where there are only
two samples per subject, PCA analysis (EigenFace) is used. Each subject has many
more samples in the dataset from the Cohn–Kanade database, so Linear Discrimi-
nant Analysis (FisherFace) is used. Using different classifiers for different datasets
based on their sample characteristics is well-justified [29].

150 Y. Liu et al. / Computer Vision and Image Understanding 91 (2003) 138–159
5.1.1. Eigenface as a baseline classifier
A popular technique for estimating a covariance is called ‘‘EigenFace’’ [41]. In
this technique, we calculate the overall mean and covariance for all images in our
training set, then use the top k eigenvectors of the covariance matrix, selected based
on the magnitude of their eigenvalues (here k is chosen to retain 95% variance). Toclassify a new image, we project it onto the k remaining eigenvectors, then measure
its distance in this projected space to the mean of each class of training images. Be-
fore computing distances we may scale the coordinates in the projected space by
some estimate of their standard deviation. The EigenFace technique is usually ap-
plied directly to raw image data, but we can also apply it to preprocessed image data.
For example, we compute the eigenfaces of face images after edge detection or after
computing measures of facial asymmetry.
In our experiment, the training set is composed of 110 images, each of them is oneof the pairs and the other image in each pair forms the test set. First, the EigenFace
method is applied to the 110 normalized face images. Then the same EigenFace
method is applied to AsymmetryFace S-faces (edge orientation similarity). Finally,
the EigenFace method is applied to the concatenation of the image and S-face
vectors.
5.1.2. Fisherface as a baseline classifier
The expression video sequence image dataset [15] is our primary testbed, where wehave many samples (frames in a video) for 55 subjects under three expressions (joy,
anger, and disgust) together with their respective neutral and peak frames.
FisherFace [1] is another popular method used in face recognition. FisherFace is
a linear discriminant analysis (LDA) applied to the PCA components of normal-
ized face images. Given a set of relatively independent features on a dataset X con-
sisting of C classes, the objective of LDA is to obtain a ðC � 1Þ-dimensional linear
combination, Y ¼ A0X that maximizes the ratio A0BA=A0WA, where B is the variance
between classes and W is the common covariance matrix for features within a sin-gle class. In another word, LDA creates a linear combination of the given feature
dimensions that yields the largest mean differences between the desired classes
[8,29].
We have designed five types of experiments (Table 2) to systematically investigate
whether the facial asymmetry measures we defined can contribute to expression in-
variant human identification. They are listed in Table 2:
Table 2
Five types of experiments
Train image expressions Test image expressions
1 Anger and disgust Joy
2 Disgust and joy Anger
3 Joy and anger Disgust
4 Peak of all three expressions Neutral
5 Neutral Peak of all three expressions

Y. Liu et al. / Computer Vision and Image Understanding 91 (2003) 138–159 151
Given AsymmetryFaces A (six different feature sets as defined in Table 1), and
PCA components P of the normalized face images F , the experiments are carried
out in three steps:
• Step 1. FisherFace: apply FisherFace on F ;• Step 2. AsymmetryFaces: for each of the six subsets of A and all their possible com-
binations,
� compute the AVR value for each feature dimension of the training data and
order the features in non-increasing order of their AVR values
� carry out forward feature subset selection [2] on the ordered feature list to
obtain a feature subspace
� apply Linear Discriminant Analysis (LDA) to the test data in the selected
feature subspace.
• Step 3. FFþ AF—we define this symbol to denote the following process: for eachand every possible feature vector concatenation of the PCA components P and
each and all of the six AsymmetryFaces,
� compute AVR values for each feature dimension and rank features in non-
decreasing order of their AVR values (P followed by A);
� apply forward feature subset selection to the concatenated feature vector of the
training data;
� perform LDA classification on the selected, reduced feature subspace for the test
data.In our classification procedure, we have included a feature subset selection step
before applying LDA. The reason for this additional step is to eliminate irrelevant
and redundant feature dimensions from the original feature space, thus establishing
a feature subspace that has relatively independent feature dimensions.
5.2. Experimental results
The goal of these experiments is to test the incremental validity of Asymmetry-
Faces relative to EigenFace or FisherFace. We first test AsymmetryFaces in face
image data whose facial expression variation is relatively small (FERET). We then
test whether AsymmetryFaces are robust to variation in type and intensity of facial
expression as found in the Cohn–Kanade database.
5.2.1. FERET database [31]
Using EigenFace alone, error rate is 15%. When S-face is added to the same clas-
sifier, the error rate decreases from 15% to 9.3%. If we define an Error Reduction
Rate (ERR) as: (ERR ¼ ð%Errorbefore �%ErrorafterÞ=%Errorbefore), this result corre-
sponds to an Error Reduction Rate of 38%.
5.2.2. Cohn–Kanade database
In Table 3, we show the outcome from each of the three experimental steps (Sec-
tion 5.1.2: FisherFace, AsymmetryFaces and FFþ AF) on the five different setups
(Table 2). The dimension of the reduced feature space for FisherFace in [1] is no
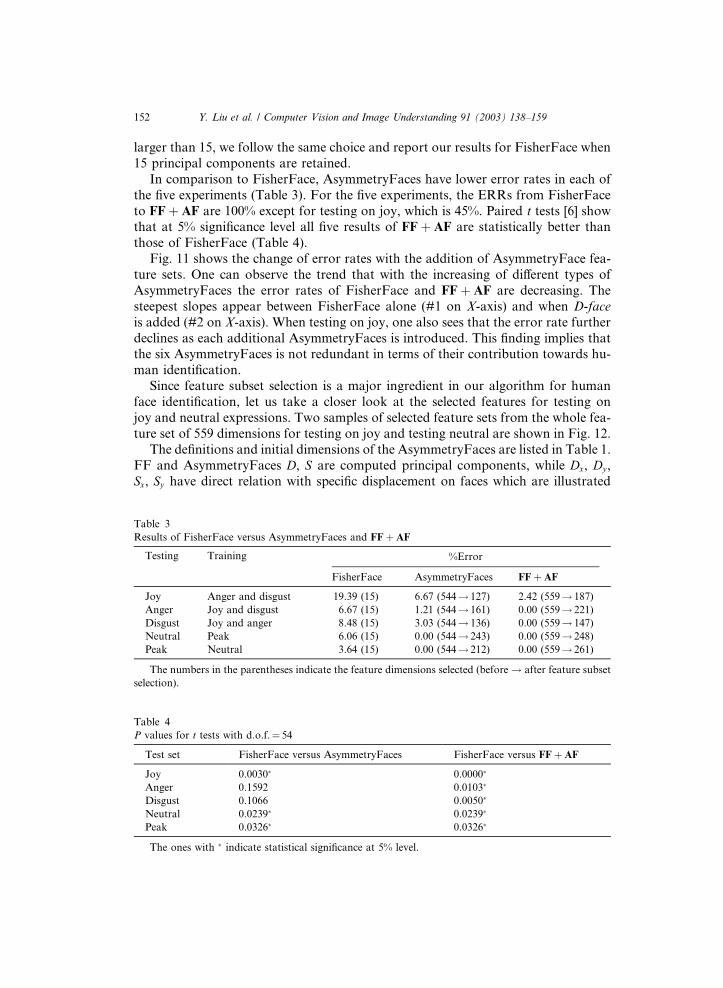
152 Y. Liu et al. / Computer Vision and Image Understanding 91 (2003) 138–159
larger than 15, we follow the same choice and report our results for FisherFace when
15 principal components are retained.
In comparison to FisherFace, AsymmetryFaces have lower error rates in each of
the five experiments (Table 3). For the five experiments, the ERRs from FisherFace
to FFþ AF are 100% except for testing on joy, which is 45%. Paired t tests [6] showthat at 5% significance level all five results of FFþ AF are statistically better than
those of FisherFace (Table 4).
Fig. 11 shows the change of error rates with the addition of AsymmetryFace fea-
ture sets. One can observe the trend that with the increasing of different types of
AsymmetryFaces the error rates of FisherFace and FFþ AF are decreasing. The
steepest slopes appear between FisherFace alone (#1 on X-axis) and when D-face
is added (#2 on X-axis). When testing on joy, one also sees that the error rate further
declines as each additional AsymmetryFaces is introduced. This finding implies thatthe six AsymmetryFaces is not redundant in terms of their contribution towards hu-
man identification.
Since feature subset selection is a major ingredient in our algorithm for human
face identification, let us take a closer look at the selected features for testing on
joy and neutral expressions. Two samples of selected feature sets from the whole fea-
ture set of 559 dimensions for testing on joy and testing neutral are shown in Fig. 12.
The definitions and initial dimensions of the AsymmetryFaces are listed in Table 1.
FF and AsymmetryFaces D, S are computed principal components, while Dx, Dy ,Sx, Sy have direct relation with specific displacement on faces which are illustrated
Table 3
Results of FisherFace versus AsymmetryFaces and FFþ AF
Testing Training %Error
FisherFace AsymmetryFaces FFþ AF
Joy Anger and disgust 19.39 (15) 6.67 (544! 127) 2.42 (559! 187)
Anger Joy and disgust 6.67 (15) 1.21 (544! 161) 0.00 (559! 221)
Disgust Joy and anger 8.48 (15) 3.03 (544! 136) 0.00 (559! 147)
Neutral Peak 6.06 (15) 0.00 (544! 243) 0.00 (559! 248)
Peak Neutral 3.64 (15) 0.00 (544! 212) 0.00 (559! 261)
The numbers in the parentheses indicate the feature dimensions selected (before ! after feature subset
selection).
Table 4
P values for t tests with d.o.f.¼ 54
Test set FisherFace versus AsymmetryFaces FisherFace versus FFþ AF
Joy 0.0030� 0.0000�
Anger 0.1592 0.0103�
Disgust 0.1066 0.0050�
Neutral 0.0239� 0.0239�
Peak 0.0326� 0.0326�
The ones with � indicate statistical significance at 5% level.

Fig. 11. Error rates of FisherFace and FFþ AF when the six AsymmetryFaces are added into FFþ AF
one by one. Each plot represents the error rate when testing on each of the five unseen expressions listed
in Table 2.
Y. Liu et al. / Computer Vision and Image Understanding 91 (2003) 138–159 153
in Fig. 7. One can see that: (1) not all the 15 principal components computed
directly from normalized face images are selected; (2) the selected features vary de-
pending on which expressions are chosen for training/testing; and (3) since each
feature set is added sequentially in feature selection process, the dimensions selectedare getting fewer for feature sets added later. This happens since only those features
that can decrease the current error rate will be added. (4) Bar plots for Dx, Dy , Sx, Sytell us exactly the facial asymmetry measures on which rows (columns) of the face
are selected for this experiment. One can find more detailed experimental results
in [20].
6. Discussion
6.1. Classification error in relation to the number of retained principal components
Our experimental results (Table 3) suggest that quantified facial asymmetry infor-
mation has discriminative power for human identification. When AsymmetryFaces
are explicitly included with existing face identification methods, obvious improve-
ments on classification rates are observed. Meanwhile, we computed and observed
that when more principal components of the normalized face images are used inFisherFace, the error rate decreases (Table 5). A pertinent question is then raised:
is it possible that some small principal components of the normalized face images

Fig. 12. Automatically selected feature dimensions indicated by a bar when testing on joy and training on
anger and disgust (left column) and testing on neutral and training on peak expressions (right column).
Here all feature sets of FFþ AF are used with a total dimension of 559. The selected total feature space
dimensions are 187 and 248, respectively. Note: the features of Dy , Sy run from a subject�s forehead to-
wards the chin (1 to 128), and the features of Dx, Sx go from the side of a face towards the face midline
(1 to 64).
Table 5
Error rates of FisherFace when different number of principal components is used (indicated in parenthe-
ses)
Test on: Joy Anger Disgust Neutral Peak
Train on: Anger and disgust Joy and disgust Joy and anger Peak Neutral
FF (1:10) 27.87% 10.30% 13.33% 8.48% 9.70%
FF (1:15) 19.39% 6.67% 8.48% 6.06% 3.64%
FF (1:20) 12.12% 4.24% 4.24% 3.64% 1.21%
FF (1:25) 12.12% 1.82% 4.24% 3.64% 0.61%
154 Y. Liu et al. / Computer Vision and Image Understanding 91 (2003) 138–159
actually contain information of facial asymmetry, but are being discarded early on in
most EigenFace/FisherFace classifiers?
We pursued this question for the case of testing on joy, which has the largest re-
maining error in our experiment. Fig. 13 shows the results for 57 subjects with 3703

Fig. 13. The FFþ AF method shows superior performance compared with FisherFace method alone even
when extending the PCA components in FisherFace method to 400 dimensions.
Y. Liu et al. / Computer Vision and Image Understanding 91 (2003) 138–159 155
frames, as the number of principal components (Eigen Features) is increased from 10
to 400 dimensions. Even when the principal components are increased to 400 dimen-
sions, FFþ AF method is still doing better than FisherFace alone. This suggests that
explicitly computing and including facial asymmetry measurements in human iden-
tification is indeed beneficial.
6.2. Peak expression faces versus neutral faces are easier to identify
We have also observed from Table 3 that among the five different experimental set-
ups (Table 2) the test-on-neutral face and test-on-peak face are relatively easier than
those cases of training on two expressions and testing on a third expression. Most
tests of human identification under expression variation fall into the neutral-peak cat-
egories [12,27,28]. However, our observation suggests that further studies across dif-
ferent expressions and intensity levels may be even more important and necessary.
From the error rates reported in this work (Tables 3 and 5), one can see that trainingon two expressions and testing on an unseen expression usually has higher error rates
for both FisherFace and AsymmetryFaces methods. Training on anger and disgust
then testing on joy is the most difficult and worth further study.
6.3. Why joy faces are harder to identify?
We found small but consistent decrements in face recognition for joy relative to
anger and disgust. One possible explanation is the difference in emotional valencebetween these emotion expressions. Theory and some data suggest that positive emo-

156 Y. Liu et al. / Computer Vision and Image Understanding 91 (2003) 138–159
tions, such as joy, are lateralized in the left hemisphere while negative emotions such
as anger and disgust are lateralized in the right [33]. A difference in lateralization,
however, would not in itself explain why increased asymmetry would influence face
recognition using asymmetry metrics. A critical factor may be in the location and
range of motion of the muscles involved. Anger and disgust expressions involve mus-cle actions near the midline of the face and many of the movements are relatively
small (e.g., eye narrowing or lip compression), whereas joy expressions involve mus-
cles to the side of the face and one of the two muscles (zygomatic major) involved is
relatively large, which affords greater range of motion. Larger motion toward the
side of the face in joy expressions would therefore increase asymmetry relative to
smaller facial motion toward the midline. This interpretation is consistent with
our finding that asymmetry across all images was greatest toward the side of the face
and decreased as one moves toward the midline (Fig. 7).
6.4. Limitations
A limitation of the present study is the reliance on expressions produced by de-
mand (i.e., deliberate) rather than those elicited by emotion eliciting stimuli. Delib-
erate facial expressions relative to spontaneous ones are believed to be more
asymmetric [13,34], which means that variance due to expressions is increased rela-
tive to variance due to individual differences in faces. The present study may there-fore provide a conservative estimate of the extent to which asymmetry metrics can
contribute to face recognition.
Another limitation is the sizes of datasets used in our experiments. While larger
datasets would have been preferable, the current findings appear reliable. They are
confirmed with statistical tests wherever possible and are consistent across two inde-
pendent databases. Nevertheless, further study with larger databases would be
worthwhile.
7. Conclusion
Previous work in psychology suggests that facial asymmetry contributes to hu-
man identification. In this work, we found that similar benefits may be obtained
in automated face recognition. Facial asymmetry seems to provide significant
information especially when combined with conventional face recognition
algorithms.In this work, we have studied the use of facial asymmetry for human identifica-
tion. We have proposed two quantitative measures of facial asymmetry and demon-
strated that: (1) D-face and S-face measures and their projections are easy and fast to
compute (Table 1); (2) The automatically selected facial asymmetry regions capture
individual differences that show robustness to variations in facial expression (Table
3); (3) The most important finding in our work is that classification accuracy can
be improved by combining AsymmetryFaces with FisherFace or EigenFace. These
results suggest that facial asymmetry may provide complementary discriminative

Y. Liu et al. / Computer Vision and Image Understanding 91 (2003) 138–159 157
information to human identification methods, which has been missing in automatic
human identification.
Our current work includes studying the issue of how to distill intrinsic facial
asymmetry from images cluttered with extrinsic facial asymmetries, examining the
use of 3D faces in verification of our hypothesis and in aiding 2D recognition [23],using asymmetry for facial expression identification [21], gender relevance analysis
[22] and pose estimation, and designing more effective discriminative feature sub-
space reduction schemes for optimal face classification.
Acknowledgments
The authors thank Professor Andrew Moore, Drs. Geoff Gordon and Tom Min-ka of CMU, and J. Phillips of DARPA for productive discussions. CMU students
R.L. Weaver (statistics), Dan Bohus (computer science), Marc Fasnacht (physics),
Yan Karklin (computer science), and N. Serban (statistics) worked with Dr. Liu
on subsets of the data reported here for course projects (Fall 2000, Spring 2001). Jia-
yong Zhang generated Fig. 13. This research is supported in part by ONR N00014-
00-1-0915 (HumanID), by NSF Grant IIS-0099597 and by NIMH Grant MH-51435.
References
[1] P.N. Belhumeur, J.P. Jespanha, D.J. Kriegman, Eigenfaces vs. fisherfaces: Recognition using class
specific linear projection, PAMI 19 (7) (1997) 711–720.
[2] C.M. Bishop, Neural Networks for Pattern Recognition, Clarendon Press, 1995,
ISBN:0198538499.
[3] M.J. Black, Y. Yacoob, Recognizing facial expressions under rigid nd non-rigid facial motions. In:
International Workshop on Automatic Face- and Gesture Recognition, Zurich, 1994, pp. 12–17.
[4] J.D. Borod, E. Koff, S. Yecker, C. Santschi, J.M. Schmidt, Facial asymmetry during emotional
expression: Gender, valence and measurement technique, Psychophysiology 36 (11) (1998)
1209–1215.
[5] R. Campbell, The lateralization of emotion: A critical review, International Journal of Psychology 17
(1982) 211, 219.
[6] G. Casella, R.L. Berger, Statistical Inference, Duxbury Press, Belmont, California, 1990.
[7] J.I. Collins, I.N. Stewart, Coupled nonlinear oscillators and the symmetries of animal gaits,
J. Nonlinear Sci. 3 (1993) 349–392.
[8] R.O. Duda, P.E. Hart, D.G. Stork, Pattern Classification, Wiley, New York, 2001.
[9] I.A. Essa, A.P. Pentland, Coding, analysis, interpretation, and recognition of facial expressions, IEEE
Transactions on Pattern Analysis and Machine Intelligence 19 (7) (1997) 757–763.
[10] J.A. Gallian, Contemporary Abstract Algebra, D.C. Heath and Company, Lexington, MA, 1986.
[11] K. Grammer, R. Thornhill, Human facial attractiveness and sexual selection: The role of symmetry
and averageness, J. Comp. Psychol. 108 (1994) 233–242.
[12] R. Gross, J. Shi, J.F. Cohn, Quo vadis face recognition?, in: Third Workshop on Empirical
Evaluation Methods in Computer Vision, Kauai, Hawaii, 2001, pp. 119–132.
[13] J. Hager, P. Ekman, The asymmetry of facial actions is inconsistent with models of hemispheric
special-ization, Psychophysiology 22 (1985) 307–318.
[14] T. Kanade, Recovery of the 3-dimensional shape of an object from a single view, Artificial Intelligence
17 (1981) 75–116.

158 Y. Liu et al. / Computer Vision and Image Understanding 91 (2003) 138–159
[15] T. Kanade, J.F. Cohn, Y.L. Tian, Comprehensive database for facial expression analysis, in: 4th
IEEE International Conference on Automatic Face and Gesture Recognition, Grenoble, March 1999.
Publically available at <http://www.ri.cmu.edu/projects/project_420.html>.
[16] J. Lien, T. Kanade, J.F. Cohn, C.C. Li, Detection, tracking, and classification of subtle changes in
facial expression, J. Robot. Autonom. Syst. 31 (2000) 1–146.
[17] Y. Liu, F. Dellaert, A Classification-based similarity metric for 3D image retrieval, in: Proceedings of
Computer Vision and Pattern Recognition Conference (CVPR�98), IEEE Computer Society Press,
Santa Barbara, 1998, pp. 800–805.
[18] Y. Liu, F. Dellaert, W.E. Rothfus, A. Moore, J. Schneider, T. Kanade, Classification-driven
pathological neuroimage retrieval using statistical asymmetry measures, in: International Conference
on Medical Imaging Computing and Computer Assisted Intervention (MICCAI 2001), Springer,
2001.
[19] Y. Liu, N.A. Lazar, W.E. Rothfus, M. Buzoianu, T. Kanade, Classification-driven feature space
reducation for semantic-based neuroimage retrieval, in: International Symposium on Information
Retrieval and Exploration in Large Medical Image Collections, October 2001.
[20] Y. Liu, S. Mitra, Experiments with quantified facial asymmetry for human identification, Technical
Report CMU-RI-TR-02-24, The Robotics Institute, Carnegie Mellon University, Pittsburgh, PA,
2002.
[21] Y. Liu, S. Mitra, Human identification versus expression classification via bagging on facial
asymmetry, Technical Report CMU-RI-TR-03-1, The Robotics Institute, Carnegie Mellon Univer-
sity, Pittsburgh, PA,2003.
[22] Y. Liu, S. Mitra, A quantified study of facial asymmetry and gender difference, Technical Report
CMU-RI-TR-03-2, The Robotics Institute, Carnegie Mellon University, Pittsburgh, PA, 2003.
[23] Y. Liu, J. Palmer, A quantified study of facial asymmetry in 3D faces, tech. report CMU-RI-TR-03-
21, Robotics Institute, Carnegie Mellon University, June 2003.
[24] Y. Liu, K. Schmidt, J. Cohn, R.L. Weaver. Facial asymmetry quantification for expression invariant
human identification, in: International Conference on Automatic Face and Gesture Recognition
(FG�02), May 2002.
[25] Y. Liu, R.L. Weaver, K. Schmidt, N. Serban, J. Cohn, Facial asymmetry: A new biometric, Technical
Report CMU-RI-TR-01-23, The Robotics Institute, Carnegie Mellon University, Pittsburgh, PA,
2001.
[26] Y. Liu, T. Zhao, J. Zhang, Learning multispectral texture features for cervical cancer detection, in:
2002 IEEE International Symposium on Biomedical Imaging: Macro to Nano, July 7–10, 2002,
Washington, DC.
[27] A.M. Martinez, Semantic access of frontal face images: The expression-invariant problem, in:
Proceedings of IEEE Workshop on Content-based Access of Images and Video Libraries, 2000.
[28] A.M. Martinez, Recognizing imprecisely localized, partially occluded and expression variant faces
from asingle sample per class, IEEE Trans. Pattern Anal. Mach. Intell. 24 (6) (2002) 748–763.
[29] A.M. Martinez, A.C. Kak, PCA versus LDA, IEEE Trans. Pattern Anal. Mach. Intell. 23 (2) (2001)
228–233.
[30] O�Toole, The perception of face gender: The role of stimulus structure in recognition and
classification, Memory and Cognition 26 (1) (1998) 146, 160.
[31] P.J. Phillips, H. Wechsler, J. Huang, P. Rauss, The feret database and evaluation procedure for face-
recognition algorithms, Image Vis. Comput. 16 (5) (1998) 295–306.
[32] C.K. Richardson, D. Bowers, R.M. Bauer, K.M. Heilman, C.M. Leonard, Digitizing the moving face
during dynamic displays of emotion, Neuropsychologia 38 (7) (2000) 1028–1039.
[33] H.A. Sacheim, R.C. Gur, M.C. Saucy, Emotions are expressed more intensely on the left side of the
face, Science 202 (1978) 434–436.
[34] K. Schmidt, J.F. Cohn, The temporal patterning of smile onsets discriminates posed from
spontaneous smiles. International Society for Research in Emotion, July, Cuenca, Spain 2002.
[35] S.M. Seitz, C.R. Dyer, View morphing, SIGGRAPH, 1996, pp. 21–30.
[36] D. Swets, J. Weng, Using discriminant eigenfeatures for image retrieval, IEEE Trans. Pattern Anal.
Mach. Intell. 18 (8) (1996) 831, 836.

Y. Liu et al. / Computer Vision and Image Understanding 91 (2003) 138–159 159
[37] D. Terzopoulos, K. Waters, Analysis of facial images using physical and anatomical models, in: IEEE
International Conference on Computer Vision, Computer Society Press, 1990, pp. 727–732.
[38] R. Thornhill, S.W. Gangestad, Facial attractiveness, Trans. Cogn. Sci. 3 (12) (1999) 452–460.
[39] Y.L. Tian, T. Kanade, J.F. Cohn, Recognizing action units for facial expression analysis, IEEE
Trans. Pattern Anal. Mach. Intell. 23 (2001) 97–116.
[40] N.F. Troje, H.H. Buelthoff, How is bilateral symmetry of human faces used for recognition of novel
views?, Vis. Res. 38 (1) (1998) 79–89.
[41] M. Turk, A. Pentland, Eigenfaces for recognition, J. Cogn. Neurosci. 3 (1) (1991) 71–86.
[42] G.S. Wachtman, J.F. Cohn, J.M. VanSwearingen, E.K. Manders, Automated tracking of facial
features in facial neuromotor disorders, Plastic Reconstruct. Surg. 107 (2001) 1124–1133.
[43] Y. Yacoob, L.S. Davis, Recognizing human facial expressions from long image sequences using
optical flow, IEEE Trans. Pattern Anal. Mach. Intell. 18 (6) (1996) 636–642.
[44] W.Y. Zhao, R. Chellappa, Symmetric shape-frorn-shading using self-ratio image, IJCV 45 (1) (2001)
55–75.

![Training echo state networks for rotation-invariant bone ... · quantification of blood cell maturation [20]. Tissue micro-architecture is usually well preserved after histological](https://img.pdfslide.net/doc/110x75/5ea72b5f274107763b4f7dae/training-echo-state-networks-for-rotation-invariant-bone-quantiication-of.jpg)