Embed Size (px)
Citation preview

University of New MexicoUNM Digital Repository
Chemical and Biological Engineering ETDs Engineering ETDs
2-14-2014
Facile Synthesis of High Surface AreaMolybdenum Carbide and Nitride: An Applicationin Support Materials for Oxygen ReductionReactionAaron Roy
Follow this and additional works at: https://digitalrepository.unm.edu/cbe_etds
This Thesis is brought to you for free and open access by the Engineering ETDs at UNM Digital Repository. It has been accepted for inclusion inChemical and Biological Engineering ETDs by an authorized administrator of UNM Digital Repository. For more information, please [email protected].
Recommended CitationRoy, Aaron. "Facile Synthesis of High Surface Area Molybdenum Carbide and Nitride: An Application in Support Materials forOxygen Reduction Reaction." (2014). https://digitalrepository.unm.edu/cbe_etds/44

i
Aaron Roy Candidate
Chemical Engineering
Department
This thesis is approved, and it is acceptable in quality and form for publication:
Approved by the Thesis Committee:
Tim L. Ward ,Chairperson
Plamen Atanassov
Alexey Serov

ii
Facile Synthesis of High Surface Area Molybdenum
Carbide and Nitride: An Application in Support
Materials for Oxygen Reduction Catalysts
by
AARON ROY
B.S. CHEMICAL ENGINEERING, UNIVERSITY OF NEW
MEXICO, 2011
THESIS
Submitted in Partial Fulfillment of the
Requirements for the Degree of
Master of Science
Chemical Engineering
The University of New Mexico
Albuquerque, New Mexico
December, 2013
iii
Acknowledgments
My sincere gratitude is extended to Professor Plamen Atanassov and Professor Tim L.
Ward for their continual support of my education, for sharing with me their experience,
and most importantly for offering to me their guidance through which I have gained
invaluable skills which will undoubtedly benefit me both now and in the future.
I also thank my colleagues of whom contributed to this project their own creativity and
intellectualism: Alexey Serov, PhD., Kateryna Artyushkova PhD., Angelica Benavidez,
Ulises Martinez, PhD., Mayat Smolnik, Lior Elbaz, PhD., and Eric Brosha, PhD.

iv
Facile Synthesis of High Surface Area Molybdenum Carbide and
Nitride: An Application in Support Materials for Oxygen Reduction
Catalysts
by
Aaron Roy
B.S., Chemical Engineering, University of New Mexico, 2011.
M.S., Chemical Engineering, University of New Mexico, 2013.
Abstract
A method to synthesize high surface area α-MoC(1-x) without the temperature
programmed reduction (TPR) of MoO3 is described. This method was then used, in
conjunction with a novel in situ method to obtain highly dispersed PtMoz supported on α-
MoC(1-x), to explore the suitability of such materials as catalysts for oxygen reduction
reaction (ORR) in a proton exchange membrane fuel cell (PEMFC). Mg2(Mo3O8) and
Zn2(Mo3O8), alternative tetravalent Mo intermediates to MoO2, were obtained through the
thermal decomposition of Mg(MoO4) and Zn(MoO4) in mixtures of CO and H2. A novel
sacrificial support method was developed where MgO and ZnO were investigated
sacrificial support materials formed in situ as decomposition products of the Mo
precursor. Reaction conditions were explored: including feed composition, synthesis
temperature, and synthesis duration. X-Ray powder diffraction (XRD) was used to
determine the time dependence on conversion, where 30 to 140 minutes at a temperature
of ~ 700 °C was required to reach full conversion of the precursors. Scanning
electron microscopy (SEM) revealed an equiaxed microstructure with primary particle

v
sizes between approximately 15-30 nm, depending on the duration of high temperature
exposure. Rapid heating rates along with limited exposure to high temperature
required by this method resulted in gravimetric surface areas as high 45 m2/g,
measured using four point Brunauer-Emmett-Teller ( BET) analysis. A similar,
ammonia-free, synthesis of β-MoN(1-x) in mixtures of N2 and H2 is also described.
The ability of these precursors to be decomposed rapidly, in comparison to the time
requirements for TPR, was utilized in the development of an in situ method for the
preparation of PtMoz composite phases supported on α-MoC(1-x). Ammonium magnesium
molybdate, (NH4)2Mg(MoO4)2, was developed as a precursor to α-MoC(1-x) which was found
to form favorable interactions with ammonium derived (PtCl6)+2
species when co-
precipitated in NH4(OH). When this co-precipitated, and amorphous, precursor was treated
under the carbiding conditions developed for the synthesis of α-MoC(1-x), highly dispersed
PtMoz on α-MoC(1-x) was obtained. Crystalline platinum phases were not observed by XRD
and Transmission Electron Microscopy (TEM) revealed platinum phases with crystalline
domains on the order of approximately 5 nm, homogeneously dispersed throughout the
observed samples. The materials, as prepared, were found to be catalytically inert for ORR,
leading to the development of an additional treatment designed to redistribute platinum
phases in a manor conducive for yielding more labile surface species. In particular, it was
found that a thermal treatment in a pure CO atmosphere directly following the initial material
synthesis resulted in significant development of electrochemical surface area (ECSA).
Materials were characterized using cyclic voltammetry (CV) in a rotating disc electrode
setup. CV measurements were performed in both O2 and N2 saturated solutions of 0.1 M
HClO4. The ECSA of this material was measured at ~36 m2/g and the specific mass activity
for ORR was measured to be ~ 137 A/gpt. Catalyst durability measurements were also

vi
performed and the results are reported. The gravimetric surface area of the α-MoC(1-x) support
was measured using BET N2 adsorption, measuring ~32 m2/g. The catalysts microstructure
was also characterized using SEM. Transmission electron microscopy (TEM) was employed
for the identification of various possible composite phases ranging from : α-Pt, α-PtMoz, β-
Pt3Mo, and, α-(Pt2Mo3C)0.66. TEM results indicate a more broad distribution of these
platinum phases, with the addition of what is likely β-MoC(1-x), in the materials following the
CO surface treatment. X-ray photoelectron spectroscopy (XPS) was also used for surface
analysis and the results are discussed.

vii
Table of Contents
List of Figures ................................................................................................................ ix
Thesis Introduction .........................................................................................................1
Chapter 1. Synthesis of High Surface area α-MoC(1-x) and β-MoN(1-x) .............3
1.1 Introduction ...............................................................................................................3
1.2 Experimental ..............................................................................................................5
1.2.1 Preparation of Mg(MoO4) and Zn(MoO4) ............................................................5
1.2.2 Synthesis of α-MoC(1-x) in Syngas ........................................................................6
1.2.3 Characterization ....................................................................................................7
1.3 Results and Discussion ...........................................................................................7
1.3.1. Sacrificial Support Method and Non-Oxide Reaction Pathway ..........................7
1.3.2 Synthesis of α-MoC(1-x) from Mg(MoO4) in Syngas ..........................................10
1.3.3 Synthesis of α-MoC(1-x) from Zn(MoO4) in Syngas .........................................14
1.3.4 Synthesis of β-MoN(1-x) from Mg(MoO4) in Forming Gas .................................17
1.4 Conclusion ...............................................................................................................20
Chapter 2. Oxygen Reduction on α-MoC(1-x) Supported PtMoz ........................22
2.1 Introduction .............................................................................................................22
2.2 Experimental ...........................................................................................................24
2.2.1 Synthesis of PtMoz supported on α-MoC(1-x) ......................................................24
2.2.2 Catalyst Characterization ....................................................................................25
2.3 Results and Discussion .........................................................................................26

viii
2.3.1. Synthesis of α-MoC(1-x) from (NH4)2Mg(MoO4)2 in Syngas .............................26
2.3.2 In situ Synthesis of PtMoz/α-MoC(1-x) .................................................................28
2.3.3 Catalyst Activation by CO Surface Treatment ...................................................29
2.3.4 Electrochemical Characterization .......................................................................31
2.3.5 XPS Analysis ......................................................................................................34
2.3.6 TEM Analysis .....................................................................................................37
2.4 Conclusion ...............................................................................................................40
Thesis Conclusions .......................................................................................................42
References .......................................................................................................................43
Appendix A-XRD data for (NH4)2Mg(MoO4)2 .....................................................48
Appendix B-CV Data for Durability Study ............................................................50
Appendix C-Mo2C and Mo2N Phase Diagrams ....................................................52

ix
List of Figures
Figure 1.1 XRD patterns of intermediate species from the decomposition of (A)
Mg(MoO4) to MgO (+) and Mg2(Mo3O8) (*), and (B) AHM to MoO2 in a 5 mol% flow
of NH3 at 500 °C for ~30 min. All peak intensities are normalized to the (200) reflection
of MgO in (A). ..................................................................................................................... 9
Figure 1. 2 XRD patterns showing conversion of Mg2(Mo3O8) to α-MoC(1-x) at
700°C:(A) ~10 % conversion after 1.0 hr, (B) ~35 % after 1.5 hr, (C), ~60 % after 2.0
hr, and (D) ~65 % after 2.5 hr. In all samples MgO was etched using HCl. All peaks are
normalized to the (002) reflection of Mg2(Mo3O8) in “A”, of which reflections are
denoted by “x”. α - MoC(1-x) reflections denoted by (*). ................................................ 11
Figure 1. 3 XRD patterns showing conversion of Mg2(Mo3O8) to (A) α-MoC(1-x) at 60 %
conversion after 2 hr of reaction (2) at 700 °C, and (B) α-MoC(1-y) at 95 % conversion
after 2 hr of Reaction (2) at 700 °C followed by 10 min of reaction (3). In both samples,
MgO was etched using HCl. ............................................................................................. 13
Figure 1.4 SEM image of α-MoC(1-y) prepared using Mg(MoO4) in a 1:4 molar flow of
CO-H2 at 700 °C for 2 hours followed by treatment in pure H2 for 20 minutes. MgO
was etched by HCl. ........................................................................................................... 14
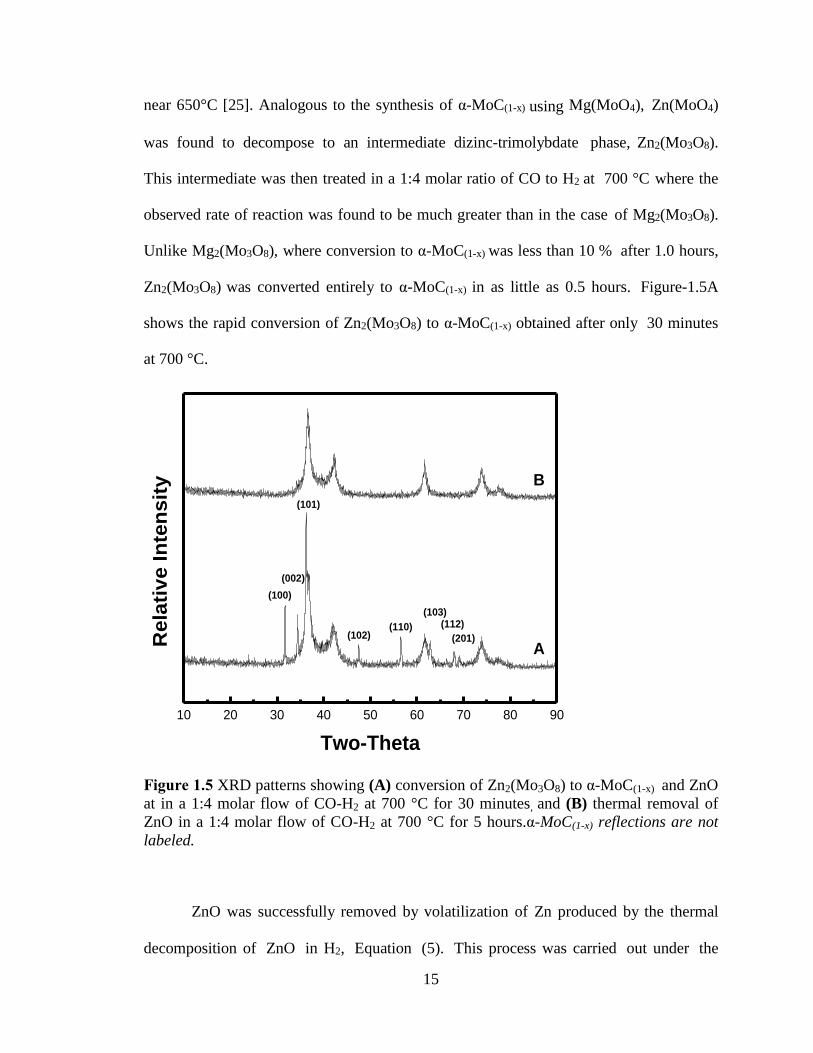
Figure 1.5 XRD patterns showing (A) conversion of Zn2(Mo3O8) to α-MoC(1-x) and ZnO
at in a 1:4 molar flow of CO-H2 at 700 °C for 30 minutes, and (B) thermal removal of
ZnO in a 1:4 molar flow of CO-H2 at 700 °C for 5 hours.α-MoC(1-x) reflections are not
labeled. .............................................................................................................................. 15
Figure 1.6 SEM image of α-MoC(1-x) prepared by the reaction Zn(MoO4) in a 1:4 molar
flow of CO-H2 at 700 °C for 30 minutes. ZnO was etched by HCl. ................................. 17
Figure 1.7 XRD patterns showing (A) conversion of Mg2(Mo3O8) to Mo metal in a 1:4
molar flow of N2-H2 at 700 °C for 30 minutes, and (B) conversion of Mg2(Mo3O8) to β-
MoN(1-x) and Mo metal under identical flow conditions at 900 °C for 1 hour, MgO was
etched by HCl in the sample shown in (B). All peaks are normalized to the Mo (110)
reflection in (A). Reflections of specific phases are denoted as follows: Mg2(Mo3O8) “x”,
MgO “^”, Mo “+”, and β-MoN(1-x) “*”. .......................................................................... 18
Figure 1.8 XRD patterns showing conversion of Mg2Mo3O8 to Hexagonal β-MoN(1-x) in
a 7:3 molar flow of N2-H2 at 900 °C for 2 hours. Sample was washed in HCl to remove
MgO. Inset shows SEM image of β-MoN(1-x) ................................................................... 20

x
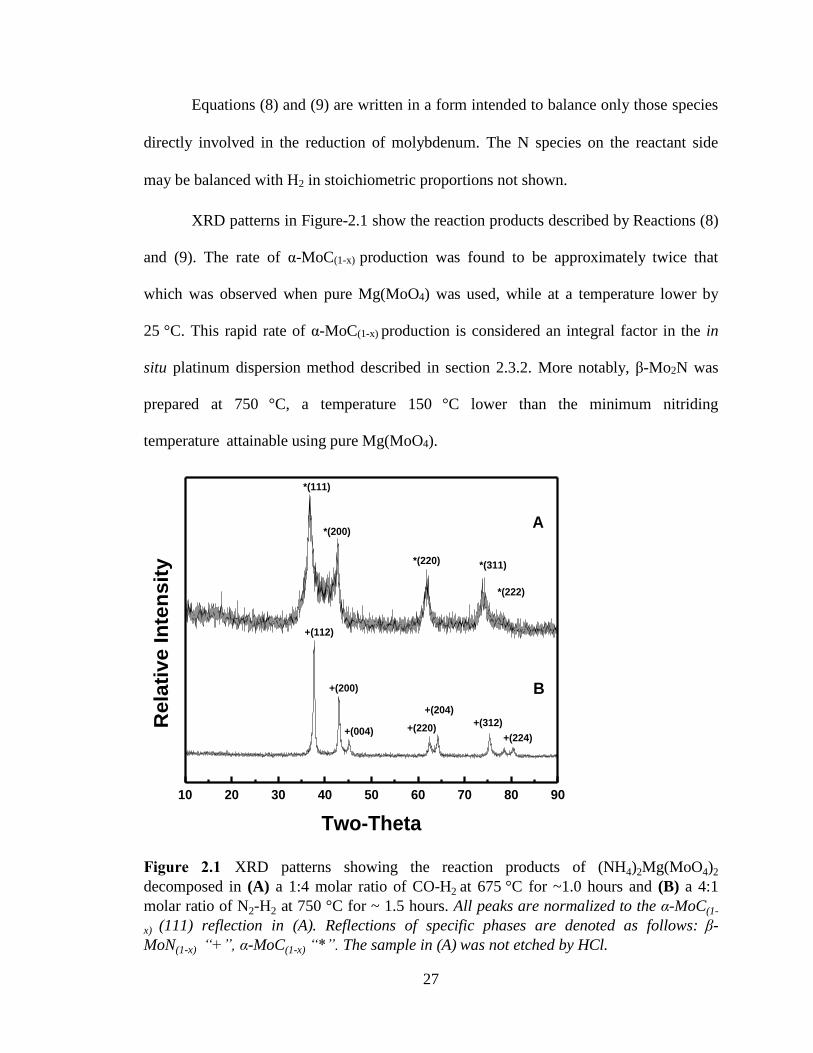
Figure 2.1 XRD patterns showing the reaction products of (NH4)2Mg(MoO4)2
decomposed in (A) a 1:4 molar ratio of CO-H2 at 675 °C for ~1.0 hours and (B) a
4:1 molar ratio of N2-H2 at 750 °C for ~ 1.5 hours. All peaks are normalized to the α-
MoC(1-x) (111) reflection in (A). Reflections of specific phases are denoted as follows:
β-MoN(1-x) “+”, α-MoC(1-x) “*”. The sample in (A) was not etched by HCl. .................. 27
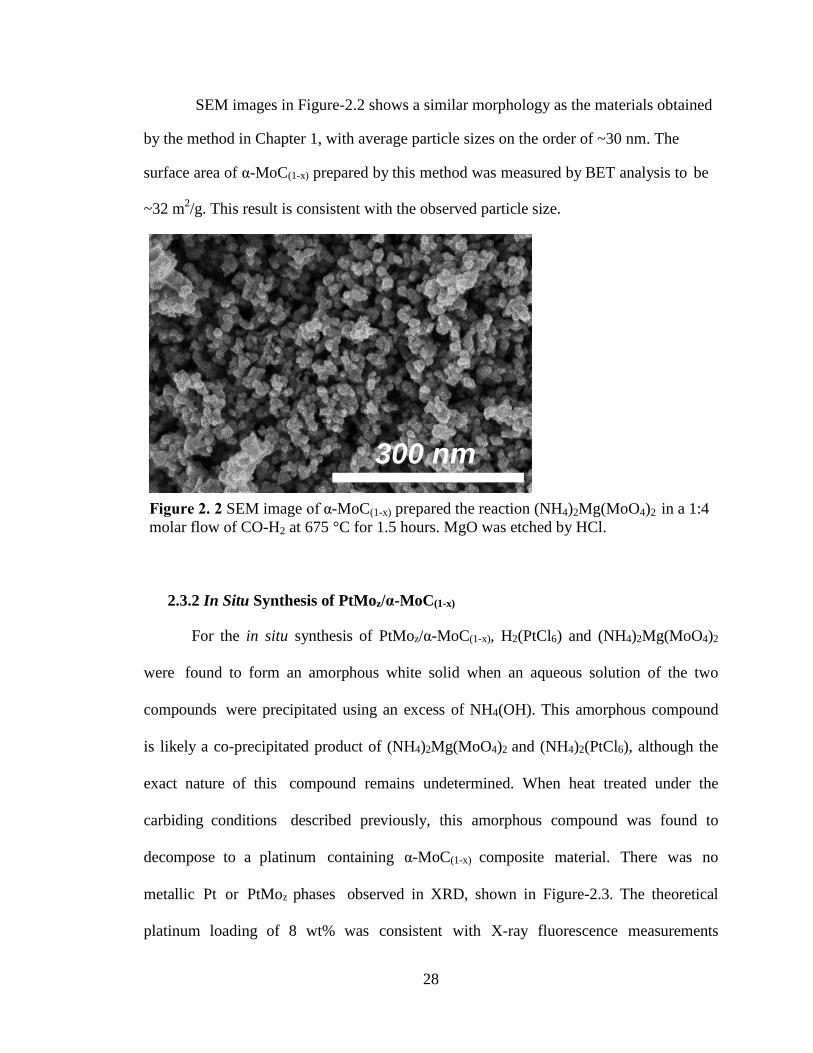
Figure 2. 2 SEM image of α-MoC(1-x) prepared the reaction (NH4)2Mg(MoO4)2 in a 1:4
molar flow of CO-H2 at 675 °C for 1.5 hours. MgO was etched by HCl. ........................ 28
Figure 2.3 XRD patterns showing the reaction products of (A) the precipitated product of
(NH4)2Mg(MoO4)2 and Mg(MoO4) in an excess of NH4(OH) and (B) (NH4)2Mg(MoO4)2
and Mg(MoO4) crystallized from solution without precipitation in NH4(OH). (MgO in the
catalyst shown in (A) was not etched by HCl) .................................................................. 29
Figure 2.4 XRD patterns showing 8 wt% Pt/α-MoC(1-x) prepared from the precipitate
formed by the reaction of H2(PtCl6) and (NH4)2Mg(MoO4)2 in NH4(OH). Samples were
treated in a 1:4 molar ratio of CO-H2 at 675 °C for 1 hour followed by a surface
treatment in pure CO for 2 hours at (A) 650 °C, XS = ~6.8 nm and (B) 450 °C, XS =
~5.3 nm. ............................................................................................................................ 31
Figure 2.5 Cyclic voltammogram at 100 mV/s of 8 wt% Pt/α-MoC(1-x) in deaerated 0.1M
HClO4 after CO surface treatment at 650 °C for 2 hours. ................................................ 32
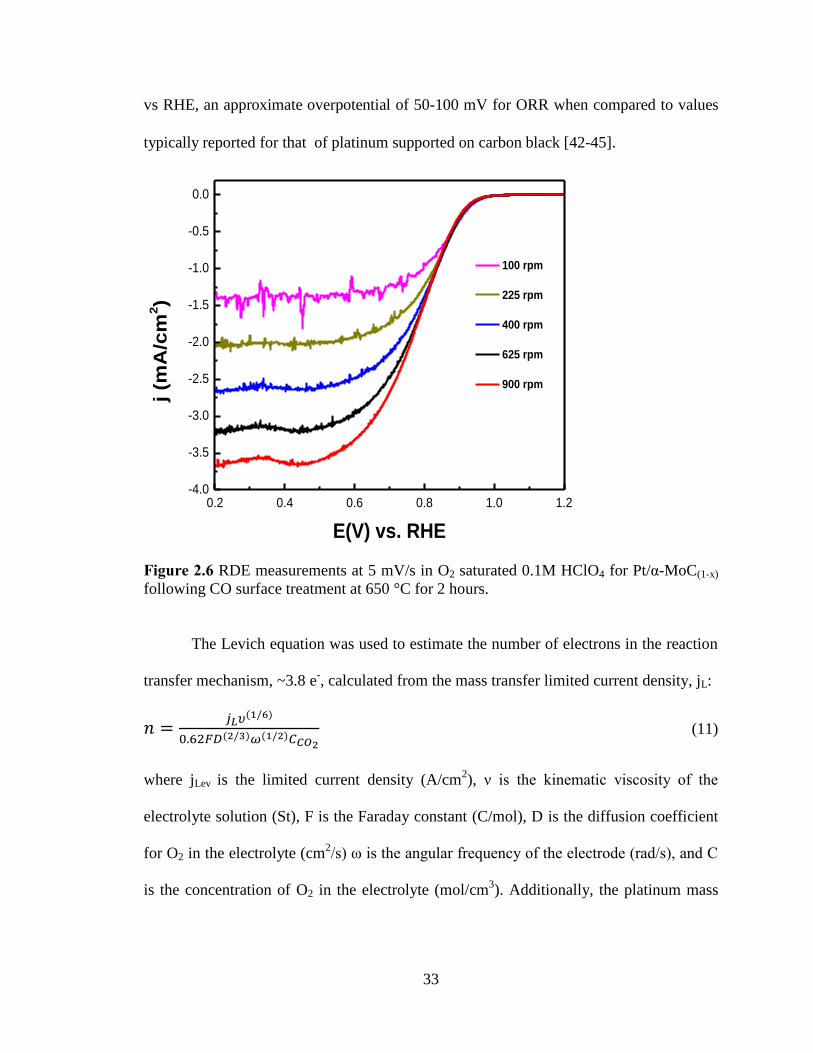
Figure 2.6 RDE measurements at 5 mV/s in O2 saturated 0.1M HClO4 for Pt/α-MoC(1-x)
following CO surface treatment at 650 °C for 2 hours. .................................................... 33
Figure 2.7 Platinum mass activity calculated from RDE data at 900 RPM and a scan rate
of 5 mV/s in O2 saturated 0.1M HClO4 for Pt/α-MoC(1-x) following CO surface treatment
at 650 °C for 2 hours. ........................................................................................................ 34
Figure 2. 8 XPS spectra showing the binding energies of the Pt 4f orbital for (A) 8 wt%
Pt/α-MoC(1-x) CO treated at 650 °C and (B) Pt2Mo, and for the C 1s orbital for (C) 8 wt%
Pt/α-MoC(1-x) CO treated at 450 °C, and (D) 8 wt% Pt/α-MoC(1-x) CO treated at 650 °C
........................................................................................................................................... 35
Figure 2. 9 Ratio of MoC to Mo2C on the surface of 8 wt% Pt/MoC(1-x) as a function of
CO surface treatment temperature calculated from XPS spectra of carbon 1s binding
energies. ............................................................................................................................ 37
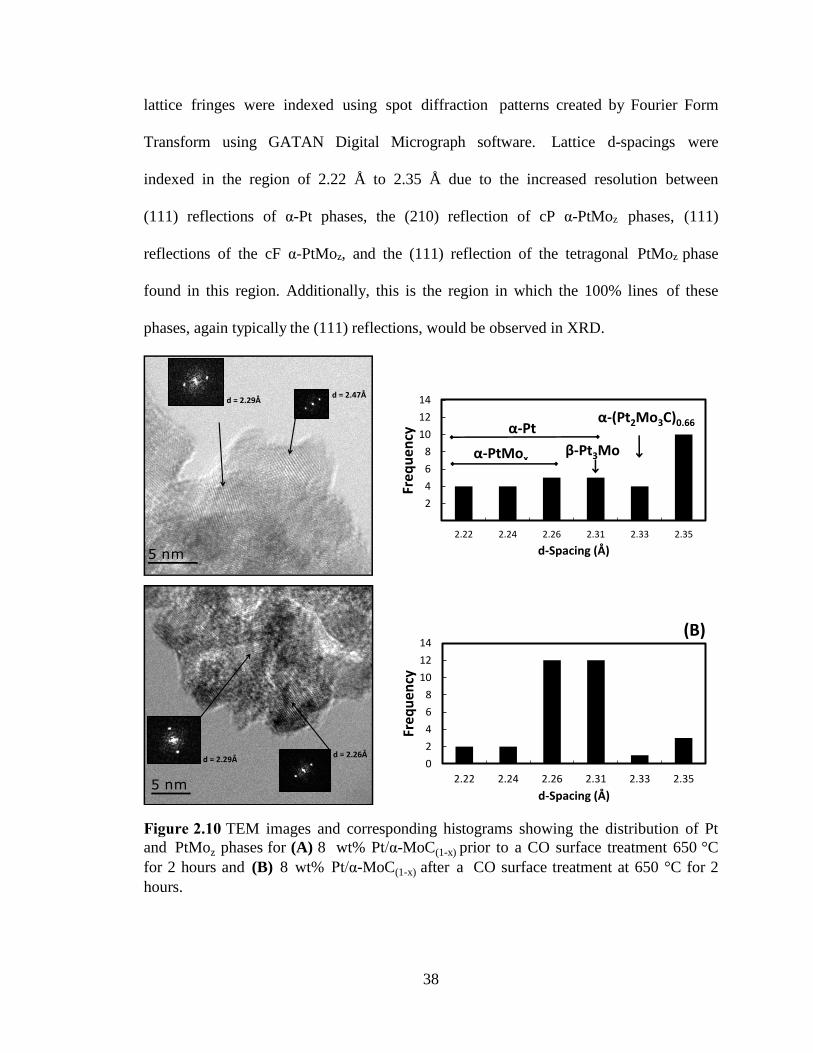
Figure 2.10 TEM images and corresponding histograms showing the distribution of Pt
and PtMoz phases for (A) 8 wt% Pt/α-MoC(1-x) prior to a CO surface treatment 650 °C
for 2 hours and (B) 8 wt% Pt/α-MoC(1-x) after a CO surface treatment at 650 °C for 2
hours. ................................................................................................................................. 38

1
Introduction
Beginning in the latter part of the 20th
century, hydrogen fuel cell technology has
received much attention as a promising avenue for providing unconventional forms of
energy in a variety of applications, most notably the automotive industry. However, high
costs associated with fuel cell catalysts, as well as the durability of these materials, have
proven to be a substantial economic constraint. Of particular interest is the low durability
of state-of-the-art Pt/Cblack catalysts due to electrochemical oxidation, and subsequent
corrosion, of the carbon support. Specifically, cathode materials supported on carbon
are exceptionally vulnerable to corrosion due to electrochemical oxidation of carbon in
the presence of water to form CO2 (E°=0.207 V vs. SHE) [1]. The loss of the support
results in the detachment of Pt particles which can then, through the process of Ostwald
Ripening, agglomerate on the surface which effectively decreases the electrochemical
surface area (ECSA) of the catalyst. Pt nano-particles may also be soluble in acidic
electrolytes at cell potentials near the upper operating range of a PEMFC [2]. Other
phenomena, such as the migration and subsequent sintering of high energy Pt surface
particles, also contribute to the loss of ECSA. Another mode of corrosion at the
cathode is due to the heterogeneous water gas reaction. Here, Pt can catalyze the
oxidation of carbon to form CO and H2 stoichiometrically, again resulting in a loss of
ECSA. As such, it has been proposed to replace carbon with high surface area materials
such as transition metal carbides and nitrides which possess high electrical conductivity
and corrosion resistant properties under the range of PEMFC operating conditions [3].
Of particular interest is α-MoC(1-x), which has been shown to have a large region of

2
stability under an applied potential at low pH [4].
Contemporary methods of preparing high surface area α-MoC(1-x) and MoN(1-x)
typically require extensive temperature programmed reduction reaction designed to
control particle morphology. This, when coupled with the oxophilicity of α-MoC(1-x),
create specific engineering challenges involving the dispersion of catalyst phases on the
surface of these materials. Therefore, it has been the objective of this work to develop
methods of preparing both, high surface area α-MoC(1-x), as well as methods of dispersing
active Pt phases on α-MoC(1-x), in ways which address the specific technical challenges
associated with the preparation of this specific class of materials. This work describes the
methods developed for a more facile preparation of these materials as well as an
assessment, via electrochemical characterization, of the suitability of these materials in
the application for catalysis of oxygen reduction reaction in a proton exchange membrane
fuel cell (PEMFC).

3
Chapter 1
Synthesis of High Surface area α-MoC(1-x) and β-MoN(1-x)
1.1 Introduction
High surface area ceramic materials, such as Mo2N and Mo2C, have been
investigated for their useful material properties which include, but are not limited to:
catalysts for methane reforming, ammonia synthesis, alcohol synthesis from syngas,
hydrodesulfurization, and electrocatalysis for hydrogen evolution reaction [5-10].
Additionally, Mo2C and Mo2N are known to possess high electrical conductivity, which
in combination with their notable material hardness provide the potential to function as
corrosion-resistant supports for platinum in PEM fuel cells [3].
Synthesis methods of high surface area Mo2N and Mo2C have been reported using
a variety of methods, which can be summarized by three main reaction categories:
carbothermal reduction, carburization, and ammonolysis of MoO3 [11-17]. In all three
cases the molybdenum precursors are typically MoO3, (NH4)6Mo7O24·4H2O (AHM),
or (NH4)2MoO4 (AM), where molybdenum is initially hexavalent. During the reduction
of the precursor, an intermediate tetravalent phase (MoO2) is formed which is the
species directly converted to nitride or carbide. High rates of solid state diffusion of
the intermediate oxide phase, along with slow reduction kinetics, often result in
extensive grain growth and low surface area carbides and nitrides [18]. To avoid
this, these methods routinely employ temperature programmed reduction reaction (TPR)
as a means of minimizing grain growth and maximizing surface area. Although effective,

4
TPR typically requires long synthesis times at elevated temperature due to slow ramp
rates involved in the TPR profile. As a result, TPR may be cost prohibitive to the
scaling of these methods and alternative reaction pathways which yield high surface
area materials are of interest.
This work focuses on the deliberate selection of molybdenum precursors which
decompose in reductive atmospheres resulting in nanocrystalline Mo2C or Mo2N,
selectively and without the formation of intermediate MoO2. However, considerable
attention has been placed on the synthesis of the cubic phase of Mo2C, α-MoC(1-x).
The approach has been to achieve rapid conversion of the Mo precursor by
arresting certain tetravalent molybdate intermediates, using high temperature along with
rapid ramp rates to maximize rates of formation of desired phases while minimizing
sintering processes. A sacrificial support method has also been adopted in which a
sacrificial material is used to minimize contact between grain boundaries, thus preventing
sintering and agglomeration of both molybdate intermediates as well as the
carbide/nitride reaction products. In a slight variation of the sacrificial support method
(SSM) commonly reported [19-24], reported here is a novel approach in which the
sacrificial material is formed in situ as a decomposition product of the molybdenum
precursor.

5
1.2 Experimental
1.2.1 Preparation of Mg(MoO4) and Zn(MoO4)
Molybdic acid, H2(MoO4), was prepared by adding MoO3 powder (Sigma-
Aldrich) to an excess amount of 30 wt% H2O2 (Sigma-Aldrich).The mixture was heated
on a hot plate until the MoO3 was fully dissolved and the solution, yellow in color,
became transparent. The solution of H2(MoO4) and excess H2O2 was brought to a boil
to decompose excess peroxide. Next, the H2(MoO4) was removed from the hot plate
and an excess amount of MgO powder (UBE Material Industries, Ltd.) was added
directly to H2(MoO4). The resulting acid/base reaction produces magnesium molybdate,
Mg(MoO4). Water soluble Mg(MoO4) was then isolated by the filtration of insoluble
MgO, which was added in excess to insure complete conversion of H2(MoO4). The
solution of Mg(MoO4) was then brought to a boil on a hot plate until dried and the
crystalized Mg(MoO4) was collected.
For the preparation of Zn(MoO4), the procedure for Mg(MoO4) synthesis was
modified slightly. As Zn(MoO4) is insoluble in water, high purity ZnO (Sigma-Aldrich)
was added to an excess amount of H2(MoO4). The precipitate, Zn(MoO4), was then
isolated by centrifuging the reaction mixture, decanting the excess H2(MoO4), and
then adding deionized water. This step was repeated until all excess H2(MoO4) was
removed. The Zn(MoO4) precipitate was then placed in an oven and dried in air at
~100 °C for several hours. It is important to note that this procedure yields a monoclinic
phase of Zn(MoO4), where a triclinic phase can be prepared by slight modification of
this procedure. In the case of Zn(MoO4) and Mg(MoO4) the monoclinic structures were
used explicitly in this study.

6
1.2.2 Synthesis of α-MoC(1-x) in Syngas
For the preparation of α-MoC(1-x), 0.4 g of Mg(MoO4) or Zn(MoO4) was placed
in a 7 mL porcelain combustion boats inside of a 1 inch diameter quartz tube. The
quartz tube was then heated using a 14 inch single zone tube furnace in a 1:4 molar
mixture of CO-H2 at a total volumetric flow rate of 200 mL/min. The reactor
temperature was ramped from ambient temperature to 700 °C at a rate of ~40 °C/min.
In the case of Mg(MoO4), the synthesis temperature of 700 °C was held for
2.0 hours under continuous flow of a 1:4 molar mixture of CO-H2 at a rate of 200
mL/min, followed by a treatment in pure H2 at a flow rate of 120 mL/min at 700 °C for
20 minutes. For the synthesis of α-MoC(1-x) using Zn(MoO4), the synthesis temperature
of 700 °C in a 1:4 molar mixture of CO-H2 was maintained for only 30 minutes, there
was no addition H2 treatment. After the heat treatment, all samples were cooled to ~400
°C under syngas where the carrier was then switched to a flow of industrial grade argon.
The quartz reactor tubes were then removed from the furnace and allowed to cool to
ambient temperature under argon flow. Once at ambient temperature, the flow was
switched to 2 mol% O2 with a He balance for ~1 hour. This step is intended to passivate
the α-MoC(1-x) surface with oxide to inhibit bulk oxidation of the material upon exposure
to atmospheric partial pressures of O2.
In both cases, the decomposition products, MgO and ZnO respectively, were
removed by etching in 7M HCl. The products were then washed in deionized water by
centrifuging followed by decanting of soluble phases. This process was repeated until a
neutral pH was achieved, approximately 6 wash cycles, and the samples were then dried
at ~85 °C in air for 12-18 hrs.
7
1.2.3 Characterization
Materials morphology, purity, and surface area were characterized using scanning
electron microscopy (SEM), powder X-ray diffraction (XRD), and Brunauer–Emmett–
Teller N2 adsorption (BET).
Powder X-ray diffraction analysis was performed using a Rigaku Smartlab with
Brag-Brentano focusing and Cu Kα radiation (40 kV, 40 mA). The detector used was
the Rigaku D/teX Ultra 250 1D silicon strip detector. Scanning Electron Microscopy
was performed using a Hitachi S-5200 SEM where powder samples were disbursed
ontocarbon tape adhered to an aluminum sample plate. The accelerating voltage used
was 2 kV. Surface areas were measured using N2 adsorption via four point BET analysis,
carried out in a Micrometrics 2360 Gemini Analyzer.
1.3 Results and discussion
1.3.1. Sacrificial Support Method and Non-Oxide Reaction Pathway
The sacrificial support method (SSM) has been extensively used as a generalized
method for creating a variety of high surface area materials. In many cases high
surface area silica is used as the sacrificial material, which is removed by post
processing in either KOH or HF. In the present work, we present a modification to
the SSM method where the sacrificial support is formed in situ as a decomposition
product of the Mo precursor, eliminating lengthy pre-processing methods required by
the SSM method. A reaction mechanism was proposed where various sheelite salts with
the general formula M(MoO4) were used as Mo precursors; where M may be any
8
divalent metal cation (Be, Mg, Ca, Sr, Ba, Mn, Zn). These salts were selected on a
basis of two criteria. The first being that the metal, M, must form a stable oxide,
thus satisfying the general redox reaction described by Equation (1).
𝛭 𝑀𝑜𝑂4 + 𝑅 + 3𝐻2 𝑀𝑂 + 3𝑀𝑜𝑅 1−𝑥 + 3𝐻2𝑂 (1)
R = carbon or nitrogen source
Equation (1) is written in a general form intended to balance only those species
directly involved in the reduction of molybdenum. R may contain other species, not being
C or N, which may be balanced with H2 in stoichiometric proportions not shown. Also,
the variable “x” is bound between 0 and 0.5 for α-MoC as well as between 0.67 and 0.72
for β-MoN; see the phase diagrams for molybdenum carbide and nitride in Appendix-C.
The intended role of the oxide product is to provide resistance to solid-state
mass transfer, effectively preventing the coarsening of grain boundaries. The result of
which is likely to produce smaller grain sizes, smaller primary particle sizes, and
greater specific surface area of molybdenum carbide and nitride.
As previously described, the reaction pathway to molybdenum carbide and nitride
commonly proceeds through a tetravalent molybdenum oxide intermediate, MoO2
[6,16,18]. As it has been suggested that MoO2 is an undesired intermediate phase to
high surface area molybdenum carbide and nitride, a second criterion to the proposed
reaction mechanism was established. This criteria states that these M(MoO4) salts must
decompose reductively to form a tetravalent molybdate. This criteria acknowledges the
fact that Mo(IV)
is the common valency between oxide, carbide, and nitride. Therefore, a
tetravalent molybdate is required for the proposed reaction pathway to carbide or nitride

9
that is not to proceed through MoO2.
Based on the first criteria, Mg and Zn were selected as the most promising cations
to be used in this method due to the stability of MgO and ZnO. To identify possible
intermediate species, Mg(MoO4) was partially decomposed at 500 °C in a 5 mol% flow
of NH3, N2 balance, for ~30 minutes. The decomposition products of Mg(MoO4) were
compared to that of AHM treated under identical conditions. XRD patterns in Figure-1,
for both cases, show the reduction of molybdenum, initially Mo(VI)
, to a valence state of
four.
Figure 1.1 XRD patterns of intermediate species from the decomposition of (A)
Mg(MoO4) to MgO (+) and Mg2(Mo3O8) (*), and (B) AHM to MoO2 in a 5 mol% flow
of NH3 at 500 °C for ~30 min. All peak intensities are normalized to the (200) reflection
of MgO in (A).
This result suggests that dimagnesium-trimolybdate, Mg2(Mo3O8), can replace
MoO2 as the intermediate phase to carbide or nitride when starting from Mg(MoO4). It
10 20 30 40 50 60 70 80 90
*(203)
*(201)
*(102)
B
+(220)*(112)
+(200)
*(002)
(211)
(110)
Re
lati
ve
In
ten
sit
y
Two-Theta
(101)
A

10
was also verified that Zn(MoO4) decomposes to an analogous Zn2(Mo3O8) and ZnO
under identical conditions. Thus, Mg(MoO4) and Zn(MoO4) satisfy both criteria,
establishing these salts as possible precursors to α-MoC(1-x) and β–MoN(1-x).
From this, an overall two-step reaction pathway was proposed and is described by
Equations (2) and (3) for the case of Mg(MoO4) reacting to α-MoC(1-x) using CO as a
carbon source.
3𝑀𝑔 𝑀𝑜𝑂4 + 3𝐻2 𝑀𝑔𝑂 + 𝑀𝑔2 𝑀𝑜3𝑂8 + 3𝐻2𝑂 (2)
𝑀𝑔2 𝑀𝑜3𝑂8 + 3𝐶𝑂 + 9𝐻2 2𝑀𝑔𝑂 + 3𝑀𝑜𝐶 1−𝑥 + 9𝐻2𝑂 (3)
1.3.2 Synthesis of α-MoC(1-x) from MgMoO4
α -MoC(1-x) was prepared by the reaction of Mg(MoO4) in mixtures of CO and H2.
The molar ratio of CO to H2 was held constant at 1:4 and synthesis temperatures were
varied from the approximated thermodynamic minimum of 469 °C, where ∆rG°=0,
to ~ 25 °C below an upper limit determined experimentally [17]. The upper limit was
defined as the onset temperature when the formation of hexagonal phase molybdenum
carbide, β-Mo2C, was observed. The purpose for this was to selectively exclusively
produce cubic α-MoC(1-x) at a maximum rate of reaction. The upper temperature limit
was found to be ~ 725 °C.
XRD was used to study the effect of synthesis time on conversion. Samples were
heat treated at 700 °C from 1.0 - 2.5 hours, followed by passivation in a low
concentration of O2 then post processing in HCl to etch MgO. Whole pattern fitting
(WPF) using MDI JADE 2010™ analytical software was used to determine relative

11
ratios of α-MoC(1-x) and Mg2(Mo3O8). This data was then used to calculate total molar
conversion. Conversion was also calculated through a material balance based on
experimental and theoretical yield. Material balance calculations were in agreement with
XRD WPF calculations within approximately ± 5 %. Figure-1.2 shows XRD patterns for
samples heat treated for1.0hr, 1.5hr, 2.0hr, and 2.5hr under identical conditions.
Molar conversions of Mg2(Mo3O8) were calculated to be ~ 10, 35, 60, and 65%
respectively. Results show the observed rate of reaction (3) slows significantly with
increased conversion and that the rate limiting step is the decomposition of
Mg2(Mo3O8), not the decomposition of Mg(MoO4).
Figure 1. 2 XRD patterns showing conversion of Mg2(Mo3O8) to α-MoC(1-x) at
700°C:(A) ~10 % conversion after 1.0 hr, (B) ~35 % after 1.5 hr, (C), ~60 % after 2.0
hr, and (D) ~65 % after 2.5 hr. In all samples MgO was etched using HCl. All peaks are
normalized to the (002) reflection of Mg2(Mo3O8) in “A”, of which reflections are
denoted by “x”. α - MoC(1-x) reflections denoted by (*).
10 20 30 40 50 60 70 80 90
*(311)*(220)*(200)
xx
xx x
xxxxxx
D
*(111)
x
C
A
B
x(002)
Re
lati
ve
In
ten
sit
y
Two-Theta

12
An additional reaction where α-MoC(1-x) can be used as a carbon source was
investigated. Here, the reduction of Mg2(Mo3O8) by H2 provides the necessary redox
potential for the direct reaction of solid species α-MoC(1-x) and Mg2(Mo3O8).
𝑀𝑔2 𝑀𝑜3𝑂8 + 3𝑀𝑜𝐶1−𝑥 + 6𝐻2
2𝑀𝑔𝑂
+3𝑀𝑜𝐶1−𝑦 + 6𝐻2𝑂 ; 𝑥 < 𝑦 (4)
Reaction (4) allows for a carbon rich phase of α-MoC(1-x) to be converted to a
molybdenum rich phase by the removal of the carbon source from the feed. An
assumption was made that α-MoC(1-x) produced from Reaction (3) serves as the sole
carbon source for reaction (4) and that x=0. These assumptions then set a minimum
intermediate molar conversion, based on Reaction (3), of Mg2(Mo3O8) at 50 %, prior
to the use of Reaction (4). At intermediate conversions of Reaction (3) less than 50
%, Mg2(Mo3O8) will be reduced to molybdenum as the available carbon is becomes
depleted. This corresponds to x=0.5. Once this minimum conversion was reached, the
CO feed was stopped and pure H2 was used to carry out the additional heat treatment,
again at 700 °C.

13
Figure 1. 3 XRD patterns showing conversion of Mg2(Mo3O8) to (A) α-MoC(1-x) at 60 %
conversion after 2 hr of reaction (2) at 700 °C, and (B) α-MoC(1-y) at 95 % conversion
after 2 hr of Reaction (2) at 700 °C followed by 10 min of reaction (3). In both samples,
MgO was etched using HCl.
Figure-1.3 shows the rapid conversion reached, from an intermediate conversion
65 % to 95 % after only 10 minutes in pure H2. Further evidence of this reaction can
be seen by XRD as subtle shifts in the peak positions to slightly lower values of 2θ.
This is an expected result for a shift from a carbon rich phase to a Mo rich phase of α-
MoC(1-y), indicating a decreasing lattice parameter with decreasing carbon content.
10 20 30 40 50 60 70 80 90
A
B(222)
(311)(220)(200)
(111)
Re
lati
ve
In
ten
sit
y
Two-Theta

14
Figure 1.4 SEM image of α-MoC(1-y) prepared using Mg(MoO4) in a 1:4 molar flow of
CO-H2 at 700 °C for 2 hours followed by treatment in pure H2 for 20 minutes. MgO
was etched by HCl.
Additional samples were prepared under the conditions described by Reaction
(4) where it was found that a total of 20 minutes were required to obtain complete
conversion of Mg2(Mo3O8) to α-MoC(1-y). Sample purity was confirmed by XRD.
SEM images in Figure-1.4 show this material to possess a relatively uniform and
equiaxed primary particle size between approximately 15 nm and 30 nm, with
agglomerates on the order of sever microns. The specific surface area was measured,
using four point BET analysis, to be 35 m2/g. This result is consistent with an average
particle size of 20 nm.
1.3.3 Synthesis of α-MoC(1-x) from Zn(MoO4) in Syngas
Zn(MoO4) was studied as an alternative precursor to Mg(MoO4). Initially,
Zn(MoO4) was used in an attempt to eliminate post processing in HCl by making use of
the volatile decomposition of ZnO, occurring in a H2 atmosphere and at temperatures
300 nm 500 nm
15
near 650°C [25]. Analogous to the synthesis of α-MoC(1-x) using Mg(MoO4), Zn(MoO4)
was found to decompose to an intermediate dizinc-trimolybdate phase, Zn2(Mo3O8).
This intermediate was then treated in a 1:4 molar ratio of CO to H2 at 700 °C where the
observed rate of reaction was found to be much greater than in the case of Mg2(Mo3O8).
Unlike Mg2(Mo3O8), where conversion to α-MoC(1-x) was less than 10 % after 1.0 hours,
Zn2(Mo3O8) was converted entirely to α-MoC(1-x) in as little as 0.5 hours. Figure-1.5A
shows the rapid conversion of Zn2(Mo3O8) to α-MoC(1-x) obtained after only 30 minutes
at 700 °C.
Figure 1.5 XRD patterns showing (A) conversion of Zn2(Mo3O8) to α-MoC(1-x) and ZnO
at in a 1:4 molar flow of CO-H2 at 700 °C for 30 minutes, and (B) thermal removal of
ZnO in a 1:4 molar flow of CO-H2 at 700 °C for 5 hours.α-MoC(1-x) reflections are not
labeled.
ZnO was successfully removed by volatilization of Zn produced by the thermal
decomposition of ZnO in H2, Equation (5). This process was carried out under the
10 20 30 40 50 60 70 80 90
(103)(112)
(101)
(002)
(110)(201)(102)
(100)
A
B
Re
lati
ve
In
ten
sit
y
Two-Theta

16
synthesis conditions of a 1:4 molar ratio of CO to H2 at 700 °C. A total of ~5 hours
were required to remove ZnO below trace amounts found by XRD, Figure-1.5B.
Attempts were made to accelerate the decomposition of ZnO in pure H2 and at higher
temperature; however these attempts resulted in the formation of hexagonal carbide,
β-Mo2C. It is unclear as to what role CO plays in the inhibition of this phase transition.
𝑍𝑛𝑂 + 𝑀𝑜𝐶 1−𝑥 + 𝐻2 𝑍𝑛(𝑣) + 𝑀𝑜𝐶 1−𝑥 + 𝐻2𝑂 (5)
No evidence of Zn2(Mo3O8) was found in either sample prepared with and without
the thermal removal of ZnO described by Reaction (5). Although ZnO was successfully
removed in situ, bulk sintering at these temperatures is a concern and HCl was favored
for the etching of ZnO to yield higher surface area materials. SEM images shown in
Figure-1.6 reveal a more nanocrystalline morphology of α-MoC(1-x) than was achieved
using Mg(MoO4). Primary particle sizes were found to be approximately < 20 nm
which is consistent with the surface area measured by BET, ~45 m2/g. The significant
increase in surface area obtained using Zn(MoO4) is directly attributed to the rapid rate of
reaction, and low overall synthesis time, reducing the effects of sintering and grain
coarsening.

17
Figure 1.6 SEM image of α-MoC(1-x) prepared by the reaction Zn(MoO4) in a 1:4 molar
flow of CO-H2 at 700 °C for 30 minutes. ZnO was etched by HCl.
1.3.4 Synthesis of β-MoN(1-x) from MgMoO4 in Forming Gas
The most effective method for synthesizing high surface area molybdenum nitride
was developed by Leo Volpe by the temperature programmed reduction of MoO3 in NH3
[11]. To address the logistical difficulties associated with this method, it was attempted to
eliminate TPR from the synthesis of high surface area β-MoN(1-x) and simultaneously
demonstrate the capability to do so using an ammonia-free synthesis. Reaction (1) was
again applied using Mg(MoO4), where R = N2. An overall pathway to β-MoN(1-x) in a
mixture of N2-H2 is described by Reactions (6) and (7).
3𝑀𝑔 𝑀𝑜𝑂4 + 3𝐻2 𝑀𝑔𝑂 + 𝑀𝑔2 𝑀𝑜3𝑂8 + 3𝐻2𝑂 (6)
𝑀𝑔2 𝑀𝑜3𝑂8 + 𝑁2 + 6𝐻2 2𝑀𝑔𝑂 + 3𝑀𝑜𝑁 1−𝑥 + 6𝐻2𝑂 (7)
500 nm

18
Initially, the molar ratio of N2-H2 was chosen to be 1:4 at a synthesis temperature
of 700 °C, modeled after the synthesis of α-MoC(1-x). Under these conditions, it was
found that this reactive atmosphere was insufficient for nitride formation of for
significant decomposition of Mg2(Mo3O8) , where Mo metal was the primary
decomposition product observed, shown in Figure-1.7A. Temperatures were gradually
increased, using a 1:4 molar ratio of N2-H2, until β-MoN(1-x) was observed as a
reaction product. At 900 °C Mg2(Mo3O8) was seen to form β-MoN(1-x) as a minor
product with Mo metal being the dominant product, Figure-1.7B.
Figure 1.7 XRD patterns showing (A) conversion of Mg2(Mo3O8) to Mo metal in a 1:4
molar flow of N2-H2 at 700 °C for 30 minutes, and (B) conversion of Mg2(Mo3O8) to β-
MoN(1-x) and Mo metal under identical flow conditions at 900 °C for 1 hour, MgO was
etched by HCl in the sample shown in (B). All peaks are normalized to the Mo (110)
reflection in (A). Reflections of specific phases are denoted as follows: Mg2(Mo3O8) “x”,
MgO “^”, Mo “+”, and β-MoN(1-x) “*”.
10 20 30 40 50 60 70 80 90
^
^
*(204)
+(110)
x xx
x
x
x
x
*(200)*(111)
+
++
+
+(220)
+(211)+(200)
Rela
tive In
ten
sit
y
Two Theta
B
A

19
Next, the concentration of N2 was gradually increased, at a temperature of 900
°C, until the hexagonal phase, β-MoN(1-x), was produced without evidence of Mo metal.
This occurred when the molar ratio of N2-H2 used was 7:3 and at a temperature of 900
°C for 2 hours, shown in Figure-1.8. After etching MgO in HCl, BET surface area was
measured to be ~12 m2/g, where SEM images (inset on Figure-1.8) show primary
particle sizes on the order of ~50-100 nm. Lower temperatures were explored in
attempts to increase surface area by reducing the effects of sintering, however slow
rates of conversion and lengthy synthesis durations resulted in the production of
metallic Mo. Further experimentation is needed to establish whether the use of
Zn(MoO4) as a nitride precursor will allow for lower temperature, shorter synthesis,
and the production of higher surface area nitride phases.

20
Figure 1.8 XRD patterns showing conversion of Mg2Mo3O8 to Hexagonal β-MoN(1-x) in
a 7:3 molar flow of N2-H2 at 900 °C for 2 hours. Sample was washed in HCl to remove
MgO. Inset shows SEM image of β-MoN(1-x)
1.4 Conclusion
High surface area α-MoC(1-x) was synthesized in mixtures of CO and H2 at 700
°C without the aid of temperature programmed reduction. Mg(MoO4) and Zn(MoO4)
were used as Mo precursors where the resulting α-MoC(1-x) possessed surface areas,
measured by BET analysis, of 35 m2/g and 45 m
2/g respectively. MoO2 was successfully
replaced as a reaction intermediate by the tetravalent molybdenum compounds
Mg2(Mo3O8) and Zn2(Mo3O8), which form MgO and ZnO as partial decomposition
products. An equiaxed and porous morphology was observed in the α-MoC(1-x)
samples prepared using this method, with primary particle sizes typically ranging from
10 20 30 40 50 60 70 80 90
(116)
(204)(111)
(312)
(220)(004)
(200)
(112)
Re
lati
ve
In
ten
sit
y
Two-Theta
500 nm

21
15-30 nm. Reaction conditions were explored: including feed composition, synthesis
temperature, and synthesis duration, in efforts to maximize the rate of conversion to α-
MoC(1-x). A high surface area hexagonal phase of β-MoN(1-x) was also produced without
TPR using Mg(MoO4), although a much higher temperature was required for this
synthesis (900 °C). This high temperature, compared to the carbide synthesis
temperature of 700 °C, resulted in significantly less surface area in the β-MoN(1-x)
samples, ~12 m2/g. The key result in the synthesis of β-MoN(1-x) was the use of N2-H2
mixtures as the reactive atmosphere. This demonstrates that high surface area
molybdenum nitride phases can be prepared without TPR, and perhaps more useful,
without using NH3 as a nitrogen source.

22
Chapter 2
Oxygen Reduction on α-MoC(1-x) Supported PtMoz
2.1 Introduction
Platinum and platinum composite materials have been extensively used in the
field of catalysis due to the various inherent catalytic properties of platinum [24, 26-31].
More specifically, proton exchange membrane fuel cells (PEMFC’s) have exploited
platinum as a catalyst for oxygen reduction reaction (ORR); a four-electron transfer
reaction which platinum is able to catalyze in a single step. Efficient kinetics and a low
overpotential for ORR make platinum the state-of-the-art catalyst for ORR, thus setting
the performance benchmark for ORR catalyst design [32-37]. The cost of platinum,
and significant performance degradation due to the electrochemical corrosion of
traditional support materials, specifically carbon, gives rise to the basis of several
design considerations necessary for the efficient use of platinum as an ORR catalyst.
Considerations such as increasing the durability of platinum catalysts by the proposed
use of durable support materials such as transition metal nitride or carbide based
ceramics. Another important consideration is to maximize the mass activity of
platinum. This can be accomplished by achieving highly dispersed platinum particles on
the surface of the support, thus maximizing the surface to volume ratio of platinum.
In the present work, cubic phase α-MoC(1-x) was used as a support due to its high
electrical conductivity as well as the large region of stability of α-MoC(1-x) in acidic
media predicted by previous studies [38]. However, passivation oxide on the surface of α-
MoC(1-x) complicates traditional chemical and thermal reduction methods commonly

23
employed for platinum dispersion. To overcome such difficulties an in stu method of
platinum dispersion was pursued. This approach regards the catalyst, a PtMoz composite,
and catalyst support as a single multi-component system, where certain components of
the catalyst species are derived directly from the support itself. In chapter 1, high surface
area molybdenum carbide and nitride ceramics were prepared using a novel method
which does not rely on temperature programmed reduction as the mode of achieving
surface area, rather on the use Mg(MoO4) and Zn(MoO4) which decompose reductively
in a manor found to favor the formation of high surface area products. Here, this method
has been modified by using (NH4)2Mg(MoO4)2, which further reduces the time duration,
as well as temperature requirement, to obtain full conversion of the ceramic precursor.
This modification, in combination with a chemical method of obtaining desirable
interactions between platinum and molybdenum precursors, allows for an in situ method
of creating a highly dispersed PtMoz composite catalyst supported on α-MoC(1-x). This
method has, with platinum loadings as low as 7.5 wt%, resulted in catalysts with an
electrochemical surface area of ~36 m2/g and a platinum mass activity of 137
A/gPt ,comparable to that of commercially available platinum supported on carbon black
[39, 40]. Although these catalysts do not possess the desired improvement in durability
for ORR, this work demonstrates the capability of producing highly dispersed, platinum
or platinum composite catalysts, using a simple in situ synthesis.

24
2.2 Experimental
2.2.1 Synthesis of PtMoz supported on α-MoC(1-x)
The molybdenum precursor, (NH4)2Mg(MoO4)2, was prepared by a slight
modification of a method described in Chapter 1 for preparing Mg(MoO4). Upon the
formation of molybdic acid, H2(MoO4), MgO (UBE Material Industries, Ltd) was added
in a 2:1 molar ratio of Mo to Mg. Next, an excess of saturated NH4(OH) solution was
added during continuous heating on a hot plate. Once the reaction appeared to reach
completion the product was dried in air at 85 °C. Next, a known amount of
(NH4)2Mg(MoO4)2 was dissolved in deionized water and brought to a boil. An
appropriate amount of H2(PtCl6) was dissolved in deionized water then added to the
boiling solution of (NH4)2Mg(MoO4)2; the amount of H2(PtCl6) added was based on a
desired mass loading of Pt on α-MoC(1-x). An excess of saturated (NH4)OH solution was
then added to the boiling mixture where continuous heat was applied until a white
precipitate was formed. The precipitate was allowed to dry completely in air at 85°C.
Once dried the precursor was finely ground using a mortar and pestle.
Approximately 0.5 g of the ground precursor was then placed in a 7 mL
porcelain combustion boat then placed inside of a 1 inch diameter quartz tube. The
quartz tube was then heated using a 14 inch single zone tube furnace. A 1:4 molar
mixture of CO-H2 at a total volumetric flow rate of 200 mL/min was used as the
reaction atmosphere. The reactor temperature was ramped from ambient temperature
to 675 °C at a rate of ~40 °C/min. After 1.5 hours at 675 °C, the reactor was cooled
to 650 °C and the feed was switched to a pure CO atmosphere at a rate of 100
mL/min. After 2 hours, the reactor was cooled to room temperature, the feed was

25
switched to 2 % O2 with a He balance, and these conditions were maintained for ~12-18
hours in order to passivate the α-MoC(1-x) catalyst surface. The powder was then
removed from the furnace and was etched in 7 M HCl to remove MgO. The product was
then washed in deionized water by identical procedures described in section 1.2.1.
Samples were then washed, 2 additional cycles, in 200 proof ethanol then dried in
vacuum (~ 30 inHg) at room temperature for ~12-18 hours.
2.2.2 Catalyst Characterization
As described in chapter 1.2.3, the catalysts were characterized using powder X-ray
diffraction analysis, SEM imaging, and BET surface area measurements. Additional
characterization was performed using X-ray photoelectron spectroscopy for surface
composition analysis (XPS), transmission electron microscopy (TEM), and
electrochemical measurements conducted in a three electrode half-cell using cyclic
voltammetry.
Surface analyses of the catalysts by X-ray photoelectron spectroscopy (XPS) utilized a
Kratos Analytical AXIS Ultra DLD Imaging System with an Al K-alpha X-ray source
operating at 225 W. High-resolution C 1s, O 1s, Mo 3d and Pt 4f spectra were acquired
at 20 eV pass energy for 2, 2, 5 and 10 min respectively. Data analysis and
quantification were performed using Casa XPS software.
Electrochemical measurements of ORR performance were conducted in a three
electrode cell with 0.1M HClO4 as the electrolyte. A rotating disk electrode (RDE) was
used as the working electrode and a real hydrogen electrode (RHE) as the reference
electrode. Forming gas, consisting of 6% H2, was used at the reference electrode for

26
which a correction of +39 mV to all experimentally collected data was applied. A
Pine Instrument Company rotator was used to collect ORR data at 100, 225, 400, 625,
and 900 RPM at a scan rate of 5 mV/s and 100 mV/s in both O2 and N2 saturated
electrolyte.
TEM images were acquired using a JEOL 2010 instrument with an accelerating
voltage of 200kV. Data analysis was performed using GATAN Digital Micrograph
software where TEM images were digitally converted into spot diffraction patterns using
the built in script files “diffractogram3.s”. These diffraction patterns were then used to
measure crystallite d-spacing values by utilizing the built in script file “peak4.s”.
2.3 Results and Discussion
2.3.1 Synthesis of α-MoC(1-x) from (NH4)2Mg(MoO4)2 in Syngas
As described in Chapter 1, Mg(MoO4) and Zn(MoO4) have been shown to be
useful precursors in the synthesis of α-MoC(1-x) and β-MoN(1-x) phases in mixtures of CO-
H2 and N2-H2 respectively. The primary advantage being the ability of these precursors to
decompose to high surface area (30-45 m2/g) α-MoC(1-x) without the necessity of TPR as
the primary means of producing surface area. Here, the co-crystallized product of
Mg(MoO4) and (NH4)2(MoO4), (NH4)2Mg(MoO4)2, has been found to decompose to α-
MoC(1-x) and β-MoN(1-x) phases more rapidly than Mg(MoO4), described by the following
redox reactions:
𝑁𝐻4 2𝛭𝑔(𝑀𝑜𝑂4)2 + 𝐶𝑂 + 8𝐻2 𝑀𝑔𝑂 + 2𝑀𝑜𝐶 1−𝑥 + 8𝐻2𝑂 (8)
𝑁𝐻4 2𝛭𝑔(𝑀𝑜𝑂4)2 + 𝑁2 + 7𝐻2 𝑀𝑔𝑂 + 2𝑀𝑜𝑁 1−𝑥 + 7𝐻2𝑂 (9)
27
Equations (8) and (9) are written in a form intended to balance only those species
directly involved in the reduction of molybdenum. The N species on the reactant side
may be balanced with H2 in stoichiometric proportions not shown.
XRD patterns in Figure-2.1 show the reaction products described by Reactions (8)
and (9). The rate of α-MoC(1-x) production was found to be approximately twice that
which was observed when pure Mg(MoO4) was used, while at a temperature lower by
25 °C. This rapid rate of α-MoC(1-x) production is considered an integral factor in the in
situ platinum dispersion method described in section 2.3.2. More notably, β-Mo2N was
prepared at 750 °C, a temperature 150 °C lower than the minimum nitriding
temperature attainable using pure Mg(MoO4).
Figure 2.1 XRD patterns showing the reaction products of (NH4)2Mg(MoO4)2
decomposed in (A) a 1:4 molar ratio of CO-H2 at 675 °C for ~1.0 hours and (B) a 4:1
molar ratio of N2-H2 at 750 °C for ~ 1.5 hours. All peaks are normalized to the α-MoC(1-
x) (111) reflection in (A). Reflections of specific phases are denoted as follows: β-
MoN(1-x) “+”, α-MoC(1-x) “*”. The sample in (A) was not etched by HCl.
10 20 30 40 50 60 70 80 90
A
*(222)
+(224)
+(204)
*(111)
+(312)+(220)+(004)
+(200)
*(311)*(220)
*(200)
+(112)
Re
lati
ve
In
ten
sit
y
Two-Theta
B
28
SEM images in Figure-2.2 shows a similar morphology as the materials obtained
by the method in Chapter 1, with average particle sizes on the order of ~30 nm. The
surface area of α-MoC(1-x) prepared by this method was measured by BET analysis to be
~32 m2/g. This result is consistent with the observed particle size.
2.3.2 In Situ Synthesis of PtMoz/α-MoC(1-x)
For the in situ synthesis of PtMoz/α-MoC(1-x), H2(PtCl6) and (NH4)2Mg(MoO4)2
were found to form an amorphous white solid when an aqueous solution of the two
compounds were precipitated using an excess of NH4(OH). This amorphous compound
is likely a co-precipitated product of (NH4)2Mg(MoO4)2 and (NH4)2(PtCl6), although the
exact nature of this compound remains undetermined. When heat treated under the
carbiding conditions described previously, this amorphous compound was found to
decompose to a platinum containing α-MoC(1-x) composite material. There was no
metallic Pt or PtMoz phases observed in XRD, shown in Figure-2.3. The theoretical
platinum loading of 8 wt% was consistent with X-ray fluorescence measurements
300 nm
300 nm Figure 2. 2 SEM image of α-MoC(1-x) prepared the reaction (NH4)2Mg(MoO4)2 in a 1:4
molar flow of CO-H2 at 675 °C for 1.5 hours. MgO was etched by HCl.

29
(XRF) showing an actual loading of ~7.5 wt% Pt. These results suggest the presence of
highly dispersed PtMoz phases.
Figure 2.3 XRD patterns showing the reaction products of (A) the precipitated product of
(NH4)2Mg(MoO4)2 and Mg(MoO4) in an excess of NH4(OH) and (B) (NH4)2Mg(MoO4)2
and Mg(MoO4) crystallized from solution without precipitation in NH4(OH). (MgO in the
catalyst shown in (A) was not etched by HCl)
Cyclic voltammetry in deaerated 0.1M HClO4, however, showed no evidence of
platinum oxidation/reduction, H2 underpotential deposition (UPD), or H2
adsorption/stripping (HAD) peaks suggesting the absence of catalytically active Pt surface
species. RDE experiments in O2 saturated 0.1M HClO4 revealed no cathodic activity and
confirmed this material to be catalytically inert for ORR.
2.3.3 Catalyst activation by CO Surface Treatment
Since the as produced catalyst was found to be inactive for ORR, an activation
30 35 40 45 50
B
A
+(130)
+(101)
+(110)
^(200)
*(200)
R
ela
tiv
e I
nte
nsit
y
Two-Theta
*(111)

30
procedure was developed involving a surface treatment in pure CO directly following the
thermal synthesis of the composite material in syngas (1:4 ratio of CO-H2). The use of
CO as an adsorbate which can induce the segregation of certain species within an alloy
have been reported, typically applied to platinum by electrochemical adsorption of CO in
saturated electrolyte [ 4 1 ] . Although electrochemical adsorption of CO was attempted
to activate Pt phases within these materials, this was only found to have limited
effect. A thermal method was attempted in which samples were cooled from the
synthesis temperature of 675 °C to a slightly lower temperature, ranging from 450 °C to
650 °C, where the CO surface treatment would be administered. Once the new target
temperature was reached the feed was switched to a pure CO atmosphere. Samples
were then treated for an additional 2 hours under these conditions. XRD patterns for the
catalysts prepared after the surface treatment, Figure-2.4, show no evidence of Pt or
PtMoz phases found in the region between 36 ° - 40 ° in two-theta, the region where the
(111) reflections of these species would be observed. A subtle decrease in the peak width
at half maximum for the (111) reflection of α-MoC(1-x) was found with increasing surface
treatment temperature, being most pronounced for samples treated at 650 °C. This
result is attributed grain coarsening due to high temperature sintering of the α-MoC(1-x)
domains. Crystallite domain size (XS) was calculated using whole pattern refinement in
MDI JADE analytical software, where the domains were calculated to be approximately
1.5 nm larger for the sample treated in CO at 650 °C compared to the sample treated
at 450 °C.

31
Figure 2.4 XRD patterns showing 8 wt% Pt/α-MoC(1-x) prepared from the precipitate
formed by the reaction of H2(PtCl6) and (NH4)2Mg(MoO4)2 in NH4(OH). Samples were
treated in a 1:4 molar ratio of CO-H2 at 675 °C for 1 hour followed by a surface
treatment in pure CO for 2 hours at (A) 650 °C, XS = ~6.8 nm and (B) 450 °C, XS =
~5.3 nm.
2.3.4 Electrochemical Characterization
Following the CO surface treatment, these materials were found to possess
characteristic Pt features in cyclic voltammetry, including: H2 UPD, H2 adsorption, and
H2 stripping when cycled in N2 saturated perchloric acid, Figure-3. Using the H2
adsorption peak from CV data, the electrochemical surface area was calculated from the
following equation:
2210
Pt
Pt
QECSA
CL
cm
(10)
20 25 30 35 40 45 50 55 60
A
B
Rela
tive In
ten
sit
y
Two-Theta

32
Here, Qpt is the charge density calculated by the integration of the HAD peak
(C/cm2
), 210 is the charge required to reduce a monolayer of protons on the electrode,
and L is the catalyst loading on the electrode (gpt/cm2).
Figure 2.5 Cyclic voltammogram at 100 mV/s of 8 wt% Pt/α-MoC(1-x) in deaerated 0.1M
HClO4 after CO surface treatment at 650 °C for 2 hours.
From this, it was found that samples treated in CO at 650 °C had an ECSA of
~36 m2/gpt, indicating significant development of catalytic surface area as a direct result
of the surface treatment in CO. ORR activity was measured using RDE experiments
in a half cell configuration with O2 saturated 0.1M HClO4 at 100, 225, 400, 625, and
900 RPM at a scan rate of 5 mV/s (Figure-2.4). The half wave potential, E1/2, was
calculated as the potential corresponding to 50 % of the diffusion limited current,
found to be 0.78 V vs RHE. The corresponding onset potential was found to be 1.01 V
0.0 0.3 0.6 0.9 1.2
-1.0
-0.5
0.0
0.5
j (m
A/c
m2
)
E(V) vs. RHE
33
vs RHE, an approximate overpotential of 50-100 mV for ORR when compared to values
typically reported for that of platinum supported on carbon black [42-45].
Figure 2.6 RDE measurements at 5 mV/s in O2 saturated 0.1M HClO4 for Pt/α-MoC(1-x)
following CO surface treatment at 650 °C for 2 hours.
The Levich equation was used to estimate the number of electrons in the reaction
transfer mechanism, ~3.8 e-, calculated from the mass transfer limited current density, jL:
𝑛
(11)
where jLev is the limited current density (A/cm2), ν is the kinematic viscosity of the
electrolyte solution (St), F is the Faraday constant (C/mol), D is the diffusion coefficient
for O2 in the electrolyte (cm2/s) ω is the angular frequency of the electrode (rad/s), and C
is the concentration of O2 in the electrolyte (mol/cm3). Additionally, the platinum mass
0.2 0.4 0.6 0.8 1.0 1.2-4.0
-3.5
-3.0
-2.5
-2.0
-1.5
-1.0
-0.5
0.0
j
(mA
/cm
2)
E(V) vs. RHE
100 rpm
225 rpm
400 rpm
625 rpm
900 rpm

34
activity, im, was calculated from RDE data using the following equation corrected for the
mass transfer limited current density:
L
m
L
j ji
j j L
(12)
The result is shown in Figure-2.6 for data collected at 900 RPM, were the mass activity
evaluated at 0.9 V vs RHE was found to be ~ 137 A/gpt. Again, this result is consistent
with values of mass activity for Pt/Cblack commonly reported [39-40].
Figure 2.7 Platinum mass activity calculated from RDE data at 900 RPM and a scan rate
of 5 mV/s in O2 saturated 0.1M HClO4 for Pt/α-MoC(1-x) following CO surface treatment
at 650 °C for 2 hours.
2.3.5 XPS Analysis
Although bulk composition of the catalyst was seen to be unaffected by the CO
surface treatment, substantial development in catalytic activity and surface area confirms
either morphological or chemical changes in the surface environment of the α-MoC(1-x)
0.75 0.80 0.85 0.90 0.95 1.00 1.05-500
-400
-300
-200
-100
0
i m (
A g
pt-1
)
E(V) vs. RHE

35
supported PtMoz composite phases, however subtle these changes may be. To
investigate the effect of surface treatment temperature, four catalysts were prepared and
characterized using XPS surface analysis where the surface treatment temperatures were
incremented as follows: 450 °C, 550 °C, 600 °C, and 650 °C. All samples were treated
for the same duration, 2 hours, in pure CO.
Figure 2. 8 XPS spectra showing the binding energies of the Pt 4f orbital for (A) 8 wt%
Pt/α-MoC(1-x) CO treated at 650 °C and (B) Pt2Mo, and for the C 1s orbital for (C) 8 wt%
Pt/α-MoC(1-x) CO treated at 450 °C, and (D) 8 wt% Pt/α-MoC(1-x) CO treated at 650 °C
Platinum 4f binding energies were compared to a Pt2Mo reference prepared by the
high temperature reduction of MoO2 and H2(PtCl6), shown in Figure-2.8A and 2.8B
respectively. The platinum environment for the 8 wt% Pt/α-MoC(1-x) catalysts CO treated
Pt 4fPt/MoC(1-x)
C 1s Pt/MoC(1-x)
C 1s MoC(1-x)
Pt 4fPt2Mo
A
B
C
D
Binding Energy (eV)
Pt-Mo
Mo2-C
Mo-C
C-C
Binding Energy (eV)
Co
un
ts(s
-1)
Co
un
ts(s
-1)
Binding Energy (eV)
Binding Energy (eV)
Co
un
ts(s
-1)
Co
un
ts(s
-1)

36
at temperatures from 450 °C to 650 °C were found to be similar to the Pt environment
of the Pt2Mo reference, with a dominant binding energy of 71.8 eV. The absence of a
Pt-Pt binding energy, typically found near 71.2 eV for bulk Pt materials, suggest the
presence of PtMoz intermetallic and solid solution phases by direct comparison of
the Pt2Mo reference. The dominant Pt 4f binding energy and corresponding distributions
were found to remain relatively constant with increased CO treatment temperature.
However, it is possible that the only observed Pt 4f binding energy, 71.8 eV, is a
result of platinum oxide, Pt2+
, where a monolayer of platinum oxide is responsible for
the observed binding energy. This would suggest that the similarity in the Pt 4f binding
energies of the 8 wt% Pt/α-MoC(1-x) catalyst and the Pt2Mo reference is coincidental and
not evidence that the two materials are of similar or identical composition [46].
Analysis of the C 1s spectra, Figure-2.8C and 2.8D, revealed a trend correlating
the C-Mo ratio as a function of increasing surface treatment temperature. Figure-2.9 plots
the ratio of MoC to Mo2C calculated from the C 1s spectra, deconvoluted into the XPS
spectra for MoC, Mo2C, and C-C, as a function of surface treatment temperature.

37
Figure 2. 9 Ratio of MoC to Mo2C on the surface of 8 wt% Pt/MoC(1-x) as a function of
CO surface treatment temperature calculated from XPS spectra of carbon 1s binding
energies.
It was found that increasing the CO surface treatment temperature results in a shift
to a more carbon rich phase of α-MoC(1-x) on the catalyst surface. An initial ratio of
MoC:Mo2C of 1:1 was significantly increased to ~ 3.5:1 following the CO treatment at
650 °C. Although this result may be expected for an additional heat treatment of
molybdenum carbide in a carbonaceous atmosphere, it is unclear if this result has any
significance in the dramatic development of surface activity following the CO treatment.
2.3.6 TEM Analysis
TEM analysis, shown in Figure-2.10, reveals crystallite domains for α-MoC(1-x), as
well as various platinum phases of various domain size, on the approximate order of
5-10 nm. The observed polycrystalline particle structure is consistent with XRD
observations of particle domain size. To confirm the existence of specific PtMoz phases,
450 500 550 600 650
1
2
3
4
Su
rfa
ce
Ra
tio
Surface Treatment Temp. (°C)
MoC/Mo2C
38
lattice fringes were indexed using spot diffraction patterns created by Fourier Form
Transform using GATAN Digital Micrograph software. Lattice d-spacings were
indexed in the region of 2.22 Å to 2.35 Å due to the increased resolution between
(111) reflections of α-Pt phases, the (210) reflection of cP α-PtMoz phases, (111)
reflections of the cF α-PtMoz, and the (111) reflection of the tetragonal PtMoz phase
found in this region. Additionally, this is the region in which the 100% lines of these
phases, again typically the (111) reflections, would be observed in XRD.
Figure 2.10 TEM images and corresponding histograms showing the distribution of Pt
and PtMoz phases for (A) 8 wt% Pt/α-MoC(1-x) prior to a CO surface treatment 650 °C
for 2 hours and (B) 8 wt% Pt/α-MoC(1-x) after a CO surface treatment at 650 °C for 2
hours.
5 nm
d = 2.29Åd = 2.47Å
0
2
4
6
8
10
12
14
2.22 2.24 2.26 2.31 2.33 2.35
Fre
qu
en
cy
d-Spacing (Å)
α-PtMox
α-Pt
β-Pt3Mo
α-(Pt2Mo3C)0.66
5 nm
d = 2.26Åd = 2.29Å 0
2
4
6
8
10
12
14
2.22 2.24 2.26 2.31 2.33 2.35
Freq
uen
cy
d-Spacing (Å)
(B)

39
The results show that prior to the CO surface treatment there was a broad
distribution of Pt and/or PtMoz phases observed, with a majority concentrated in the
region of 2.26 Å and 2.31 Å. Identification of specific phases was not possible due to a
large overlap in the d-spacing of various Pt and PtMoz phases in this region, a result of
the isostructural nature of these materials. Following the CO surface treatment, the
distribution of PtMoz phases was found to be spread more broadly throughout the entire
region. Although there is no clear evidence of a shift from one phase in particular to
another, it is clear that the CO surface treatment is inducing a redistribution of the PtMoz
phases. It is hypothesized that this redistribution results in the exposure of certain Pt or
PtMoz facets on the surface of the material. This result is consistent with the development
of catalytic activity confirmed by CV measurements, where catalytic activity is strictly a
surface phenomenon.
Evidence of a ternary Pt-Mo-C phase can also be found in the region of 2.33 Å,
corresponding to a lattice parameter too large to be associated with any cubic Pt or PtMoz
compound published in various crystal structure databases, as shown in Figure-2.10B.
The preparation of this particular ternary phase is consistent with the direct high
temperature reaction of the constituent species [47]. This phase was found in slightly
higher concentrations following the CO surface treatment, yet it is unclear if this
phase contributes to the developed catalytic activity resulting from the surface
treatment.
The most significant observation found in the materials following the CO surface
treatment is the formation of a phase with the corresponding d-spacing of 2.35 Å. This
phase is attributed to the (103) reflection of hexagonal β-MoC(1-x), a transition within the

40
molybdenum carbide species which may be related to the segregation of carbide and
PtMoz phases. This determination is supported by XRD analysis which reveals no bulk
shift from cubic to hexagonal β-MoC(1-x), which when compared to TEM analysis
suggests an extent of phase transition within the carbide phase on the same order as the
transitions within the PtMoz phases.
2.4 Conclusion
An in situ method of dispersing PtMoz on α-MoC(1-x) was successfully developed
which involves the integration of Pt and Mo precursors, allowing for the simultaneous
synthesis of catalyst and catalyst support species without significant sintering and
agglomeration of the Pt phases. A CO surface treatment was successfully used to tune the
surface properties/composition of the material transforming it from an inert to an active
catalyst for ORR. The development of ECSA following the surface treatment, ~ 36
m2/gpt, and Pt mass activity of ~ 137 A/gpt, demonstrates the success of this method in
creating an active catalyst for ORR. The lack of crystalline PtMoz phases observed in
XRD as well as TEM analysis suggests a particles size of the PtMoz phases estimated to
be on the order of ~ 5 nm, further demonstrating the success of the method for dispersing
PtMoz nano-particles on the surface of the the α-MoC(1-x) support. However, kinetic
measurements for ORR, E1/2 of ~ 0.78 V vs. RHE with an onset potential of ~ 1.01 V vs.
RHE, show this catalysts suffers from an overpotential for ORR approximately 50-100
mV greater than that of P/Cblack. Additionally, preliminary durability studies (see
Appendix-B) suggest this catalyst does not possess any improvement in durability
compared to Pt/Cblack. Although catalyst degradation is observed, the mode of degradation

41
remains unidentified (dissolution of the α-MoC(1-x) support, dissolution of PtMoz, or a
combination of the two processes).
42
Thesis Conclusion
Pertaining to the objectives identified within the scope of this project, a method
for preparing high surface area α-MoC(1-x), and β - MoN(1-x), without the requirement
of temperature programmed reduction (TPR) has been achieved. Mg(MoO4) and
Zn(MoO4) have been demonstrated to decompose, through a preferred non-oxide
(MoO2) reaction pathway, to high surface area α-MoC(1-x) (35 m2/g and 45 m
2/g
respectively) using syngas as a carbon source. The capability of producing β-MoN(1-x)
without TPR and in an NH3 free synthesis (using forming gas as a N2 source) has also
been demonstrated.
This result led to the development of a more effective precursor,
(NH4)2Mg(MoO4)2, which was found to decompose to α-MoC(1-x) in syngas at a rate two
times greater, while at lower temperature, than Mg(MoO4). β - MoN(1-x) was also found
to form more readily when this ammonium molybdate derived precursor was used.
A facile method of producing highly dispersed Pt phases, active for oxygen
reduction reaction, on α-MoC(1-x) has also been accomplished. The integration of Pt and
Mo precursors using a chemical precipitation method made possible the simultaneous
synthesis of α-MoC(1-x), the support species, and PtMoz, the catalyst species. The
simultaneous synthesis of the catalyst and support address the logistical difficulties of
dispersing Pt on α-MoC(1-x) without the exposure of α-MoC(1-x) to air.
Although the PtMoz composite catalyst supported on α-MoC(1-x) was found to be
active for ORR, as characterized by cyclic voltammetry, the durability of this catalyst
does not appear to offer any improvements to the limited durability of Pt/Cblack.

43
References
1. Oh, H. S.; Lee, J. H.; Kim, H., Electrochemical carbon corrosion in high temperature
proton exchange membrane fuel cells. Int. J. Hydrog. Energy 2012, 37 (14), 10844-
10849.
2. Shao, Y. Y.; Yin, G. P.; Gao, Y. Z., Understanding and approaches for the durability
issues of Pt-based catalysts for PEM fuel cell. J. Power Sources 2007, 171 (2), 558-
566.
3. Blackmore, K. J.; Elbaz, L.; Bauer, E.; Brosha, E. L.; More, K.; McCleskey, T. M.;
Burrell, A. K., High Surface Area Molybdenum Nitride Support for Fuel Cell
Electrodes. J. Electrochem. Soc. 2011, 158 (10), B1255-B1259.
4. Hugosson, H. W.; Jansson, U.; Johansson, B.; Eriksson, O., Phase stability diagrams
of transition metal carbides, a theoretical study. Chem. Phys. Lett. 2001, 333 (6), 444-
450.
5. Oshikawa, K.; Nagai, M.; Omi, S., Characterization of molybdenum carbides for
methane reforming by TPR, XRD, and XPS. J. Phys. Chem. B 2001, 105 (38), 9124-
9131.
6. Kojima, R.; Aika, K., Molybdenum nitride and carbide catalysts for ammonia
synthesis. Appl. Catal. A-Gen. 2001, 219 (1-2), 141-147.
7. Wu, Q. X.; Christensen, J. M.; Chiarello, G. L.; Duchstein, L. D. L.; Wagner, J. B.;
Temel, B.; Grunwaldt, J. D.; Jensen, A. D., Supported molybdenum carbide for
higher alcohol synthesis from syngas. Catal. Today 2013, 215, 162-168.
8. Hynaux, A.; Sayag, C.; Suppan, S.; Trawczynski, J.; Lewandowski, M.; Szymanska-
Kolasa, A.; Djega-Mariadassou, G., Kinetic study of the hydrodesulfurization of
dibenzothiophene over molybdenum carbides supported on functionalized carbon
black composite - Influence of indole. Appl. Catal. B-Environ. 2007, 72 (1-2), 62-70.
9. Ramanathan, S.; Yu, C. C.; Oyama, S. T., New catalysts for hydroprocessing:
Bimetallic oxynitrides II. Reactivity studies. J. Catal. 1998, 173 (1), 10-16.
10. Vrubel, H.; Hu, X. L., Molybdenum Boride and Carbide Catalyze Hydrogen
Evolution in both Acidic and Basic Solutions. Angew. Chem.-Int. Edit. 2012, 51 (51),
12703-12706.
11. Volpe, L.; Boudart, M., Compounds of Molybdenum and Tungsten with High
Specific Surface-Area-.2. Nitrides. J. Solid State Chem. 1985, 59 (3), 332-347.
12. Volpe, L.; Boudart, M., Compounds of Molybdenum and Tungsten with High
Specific Surface-Area-.2. Carbides. J. Solid State Chem. 1985, 59 (3), 348-356.

44
13. Bouchy, C.; Hamid, S.; Derouane, E. G., A new route to the metastable FCC
molybdenum carbide alpha-MoC1-x. Chem. Commun. 2000, (2), 125-126.
14. Zhu, Q. L.; Chen, Q. G.; Yang, X. B.; Ke, D. X., A new method for the synthesis of
molybdenum carbide. Mater. Lett. 2007, 61 (29), 5173-5174.
15. Patel, M.; Subrahmanyam, J., Synthesis of nanocrystalline molybdenum carbide
(Mo2C) by solution route. Mater. Res. Bull. 2008, 43 (8-9), 2036-2041.
16. Hanif, A.; Xiao, T. C.; York, A. P. E.; Sloan, J.; Green, M. L. H., Study on the
structure and formation mechanism of molybdenum carbides. Chem. Mat. 2002, 14
(3), 1009-1015.
17. Weimer, A. W., Carbide, Nitride, and Boride Materials Synthesis and Processing.
Chapman & Hall: London, 1997; p 79-80.
18. Wise, R. S.; Markel, E. J., Synthesis of high-Surface-Area Molybdenum Nitride in
Mixtures of Nitrogen and Hydrogen. J. Catal. 1994, 145 (2), 344-355.
19. Robson, M. H.; Serov, A.; Artyushkova, K.; Atanassov, P., A mechanistic study of 4-
aminoantipyrine and iron derived non-platinum group metal catalyst on the oxygen
reduction reaction. Electrochim. Acta 2013, 90, 656-665.
20. Brocato, S.; Serov, A.; Atanassov, P., pH dependence of catalytic activity for ORR of
the non-PGM catalyst derived from heat-treated Fe-phenanthroline. Electrochim. Acta
2013, 87, 361-365.
21. Serov, A.; Robson, M. H.; Artyushkova, K.; Atanassov, P., Templated non-PGM
cathode catalysts derived from iron and poly(ethyleneimine) precursors. Appl. Catal.
B-Environ. 2012, 127, 300-306.
22. Serov, A.; Robson, M. H.; Smolnik, M.; Atanassov, P., Templated bi-metallic non-
PGM catalysts for oxygen reduction. Electrochim. Acta 2012, 80, 213-218.
23. Serov, A.; Martinez, U.; Falase, A.; Atanassov, P., Highly active Pd-Cu catalysts for
electrooxidation of 2-propanol. Electrochem. Commun. 2012, 22, 193-196.
24. Falase, A.; Main, M.; Garcia, K.; Serov, A.; Lau, C.; Atanassov, P., Electrooxidation
of ethylene glycol and glycerol by platinum-based binary and ternary nano-structured
catalysts. Electrochim. Acta 2012, 66, 295-301.
25. Weirich, F. A. A Study of the Reduction of Zinc Oxide by Hydrogen and Methane
School of Mines and Metallurgy of the University of Missouri, Rolla, Mo, 1926.
26. Belgued, M.; Pareja, P.; Amariglio, A.; Amariglio, H., Conversion of Methane Into
Higher Hydrocarbons on Platinum. Nature 1991, 352 (6338), 789-790.

45
27. Davis, R. J.; Derouane, E. G., A Nonporous Supported-Platinum Catalyst For
Aromization Of N-Hexane. Nature 1991, 349 (6307), 313-315.
28. Liang, C. C.; Juliard, A. L., Reduction of Oxygen at Platinum Electrode. Nature
1965, 207 (4997), 629-&.
29. Tian, N.; Zhou, Z. Y.; Sun, S. G.; Ding, Y.; Wang, Z. L., Synthesis of tetrahexahedral
platinum nanocrystals with high-index facets and high electro-oxidation activity.
Science 2007, 316 (5825), 732-735.
30. Tupy, S. A.; Chen, J. G. G.; Vlachos, D. G., Comparison of Ethylene Glycol Steam
Reforming Over Pt and NiPt Catalysts on Various Supports. Top. Catal. 2013, 56
(18-20), 1644-1650.
31. Obradovic, A.; Likozar, B.; Levec, J., Catalytic surface development of novel nickel
plate catalyst with combined thermally annealed platinum and alumina coatings for
steam methane reforming. Int. J. Hydrog. Energy 2013, 38 (3), 1419-1429.
32. Serov, A.; Martinez, U.; Atanassov, P., Novel Pd-In catalysts for alcohols
electrooxidation in alkaline media. Electrochem. Commun. 2013, 34, 185-188.
33. Serov, A.; Robson, M. H.; Smolnik, M.; Atanassov, P., Tri-metallic transition metal–
nitrogen–carbon catalysts derived by sacrificial support method synthesis.
Electrochim. Acta 2013, 109 (0), 433-439.
34. Robson, M. H.; Serov, A.; Artyushkova, K.; Atanassov, P., A mechanistic study of 4-
aminoantipyrine and iron derived non-platinum group metal catalyst on the oxygen
reduction reaction. Electrochim. Acta 2013, 90, 656-665.
35. Bashyam, R.; Zelenay, P., A class of non-precious metal composite catalysts for fuel
cells. Nature 2006, 443 (7107), 63-66.
36. Wu, G.; More, K. L.; Johnston, C. M.; Zelenay, P., High-Performance
Electrocatalysts for Oxygen Reduction Derived from Polyaniline, Iron, and Cobalt.
Science 2011, 332 (6028), 443-447.
37. Lefevre, M.; Proietti, E.; Jaouen, F.; Dodelet, J. P., Iron-Based Catalysts with
Improved Oxygen Reduction Activity in Polymer Electrolyte Fuel Cells. Science
2009, 324 (5923), 71-74.
38. Weidman, M. C.; Esposito, D. V.; Hsu, Y. C.; Chen, J. G., Comparison of
electrochemical stability of transition metal carbides (WC, W2C, MO2C) over a wide
pH range. J. Power Sources 2012, 202, 11-17.

46
39. Kriston, A.; Xie, T. Y.; Gamliel, D.; Ganesan, P.; Popov, B. N., Effect of ultra-low Pt
loading on mass activity of polymer electrolyte membrane fuel cells. J. Power
Sources 2013, 243, 958-963.
40. Patel, S.; Jiang, J. C.; Liu, F. Q., Facile synthesis and characterization of highly
dispersed platinum nanoparticles for fuel cells. Int. J. Hydrog. Energy 2011, 36 (17),
11108-11115.
41. Andersson, K. J.; Calle-Vallejo, F.; Rossmeisl, J.; Chorkendorff, L., Adsorption-
Driven Surface Segregation of the Less Reactive Alloy Component. J. Am. Chem.
Soc. 2009, 131 (6), 2404-2407.
42. Wu, J. B.; Yang, H., Platinum-Based Oxygen Reduction Electrocatalysts. Accounts
Chem. Res. 2013, 46 (8), 1848-1857.
43. Job, N.; Chatenet, M.; Berthon-Fabry, S.; Hermans, S.; Maillard, F., Efficient
Pt/carbon electrocatalysts for proton exchange membrane fuel cells: Avoid chloride-
based Pt salts! J. Power Sources 2013, 240 (0), 294-305.
44. Santos, L. G. R. A.; Freitas, K. S.; Ticianelli, E. A., Heat treatment effect of Pt–V/C
and Pt/C on the kinetics of the oxygen reduction reaction in acid media. Electrochim.
Acta 2009, 54 (22), 5246-5251.
45. Hayden, B. E.; Pletcher, D.; Suchsland, J. P.; Williams, L. J., The influence of
support and particle size on the platinum catalysed oxygen reduction reaction. Phys.
Chem. Chem. Phys. 2009, 11 (40), 9141-9148.
46. Porsgaard, S.; Merte, L. R.; Ono, L. K.; Behafarid, F.; Matos, J.; Helveg, S.;
Salmeron, M.; Cuenya, B. R.; Besenbacher, F., Stability of Platinum Nanoparticles
Supported on SiO2/Si(111): A High-Pressure X-ray Photoelectron Spectroscopy
Study. ACS Nano 2012, 6 (12), 10743-10749.
47. Lawson, A. C., Superconductivity of the f.c.c. transition metals, and of their alloys
and f.c.c. carbides. Journal of the Less Common Metals 1971, 23 (1), 103-106.
48. R. Ferro, M., R., The Mo-N (Molybdenum-Nitrogen) System. Bulletin of Allow Phase
Diagrams 1980, 1 (2), 82-85.
49. FactSage STGE Solution Databse List of Systems and Phases.
http://www.factsage.cn/fact/documentation/SGTE/SGTE_list.htm ( accessed
November 11, 2013).

48
Appendix-A
10 20 30 40 50 60 70 80 90
R
ela
tiv
e I
nte
ns
ity
Two-Theta
Appendix A. 1 XRD diffraction pattern for (NH4)2Mg(MoO4)2 obtained by the co-precipitation of (NH4)2(MoO4) with Mg(MoO4) in stoichiometric proportions. See Appendix A.2 for phase reflection data.

49
Intensity % Angle, 2θ d(Å) ( h k l)24 12.5 7.062 ( 0 2 0)
26.4 13.9 6.3861 ( 1 0 0)
100 15.2 5.819 ( 1 1 0)
41.2 17.3 5.1285 ( 0 1 1)
36.4 18.3 4.8479 (-1 1 1)
51.5 20.4 4.3413 ( 0 2 1)
72.2 21.3 4.1671 (-1 2 1)
87.7 23.5 3.7895 ( 1 3 0)
40.3 24.9 3.5777 ( 0 3 1)
47.3 25.2 3.531 ( 0 4 0)
24 25.6 3.4809 ( 1 1 1)
32.1 25.6 3.4783 (-1 3 1)
24.8 27.6 3.2255 (-2 1 1)
85.3 27.8 3.2014 ( 1 2 1)
60.5 29.8 2.9994 (-2 2 1)
52.9 30.5 2.9289 (-1 0 2)
16.5 30.7 2.9095 ( 2 2 0)
15.7 38.0 2.3683 ( 2 4 0)
38.7 40.0 2.2543 (-1 4 2)18.9 46.1 1.9688 ( 1 6 1)
Appendix A. 2 XRD diffraction data for (NH4)2Mg(MoO4)2. Phase PDF # [97-002-3001] taken from ICSD database.

50
Appendix-B
0.0 0.3 0.6 0.9 1.2
-1.0
-0.5
0.0
0.5
j (m
A/c
m2
)
E(V) vs. RHE Appendix B. 1 CV of 8 wt% Pt/α-MoC(1-x) in N2 saturated HClO4 at 100 mV/s prior to durability study (Black, ECSA ~ 36 m2/g) and after a durability study (Red, ECSA is below instrument resolution). Durability study was conducted in O2 saturated HClO4 using an RDE setup rotating at 900 RPM with a sweep rate of 100 mV/sec from 1.3 – 0.6 V vs. RHE. A total of 5000 cycles were used in the study.
0.2 0.4 0.6 0.8 1.0 1.2-3.0
-2.5
-2.0
-1.5
-1.0
-0.5
0.0
j (m
A/c
m2)
E(V) vs. RHE
100 rpm
225 rpm
400 rpm
625 rpm
900 rpm
Appendix B. 2 CV of 8 wt% Pt/α-MoC(1-x) in O2 saturated HClO4 at 5 mV/s at various rotation speeds after the durability study, described by Appendix B.1.

51
0.2 0.4 0.6 0.8 1.0 1.2-4.0
-3.5
-3.0
-2.5
-2.0
-1.5
-1.0
-0.5
0.0
j (m
A/c
m2
)
E(V) vs. RHE
After AST
Before AST
Appendix B. 3 Comparison of ORR activity before and after the durability study described by Appendix B.1.

52
Appendix-C
Appendix C.1 Mo-N phase [48].

53
Appendix C.2 Mo-C phase diagram. [49].


![Electrochemical Behaviour of Molybdenum(VI) and Tungsten(VI) … powder metallurgy [1—3]. The possibility of obtaining carbide powders by electrolysis in molten media was first reported](https://img.pdfslide.net/doc/110x75/61025f6983afc17aee3d4c30/electrochemical-behaviour-of-molybdenumvi-and-tungstenvi-powder-metallurgy-1a3.jpg)


![Tungsten Carbide as an Reinforcement in Structural Oxide-Matrix …€¦ · and metals – nickel, molybdenum and tungsten and others [1-17]. In this way, the materials with improved](https://img.pdfslide.net/doc/110x75/5f2f52dca101a454bd15f5af/tungsten-carbide-as-an-reinforcement-in-structural-oxide-matrix-and-metals-a-nickel.jpg)