Embed Size (px)
Citation preview

This presentation does not contain any proprietary, confidential, or otherwise
restricted information
Project ID
FC128
Facilitated Direct Liquid Fuel Cells with High Temperature Membrane Electrode Assemblies
Emory S. De Castro, Ryan Pavlicek & Manav Sharma Advent Technologies, Inc.
Piotr Zelenay & Xi Yin Los Alamos National Laboratory
June 13, 2018

Overview - Program
2
Timeline Project Start Date: Oct 1, 2015 Project End Date**: Dec 31, 2018 *no cost extension Budget ($) Total Funding: 1,250,000
Advent Cost Share (20%): 250,000 Federal Share (80%): 1,000,000 Total DOE funds spent* 733,000
**As of 31 March, 2017
Barriers (FCTO-MYRDDP, 2014) A. Durability: new membrane approach B. Cost: elimination of reformer, lower PGM C. Performance: highly active anode catalyst
Funded Partners LANL (P. Zelenay, Xi Yin): catalyst synthesis and fuel cell testing
Incubator program to explore new, high impact areas

Relevance
3
Objective: Demonstrate direct dimethyl ether (DME) oxidation at high temperature MEA significantly better than direct methanol fuel cells (DMFC)
Key Performance Indicator Current DMFC Target Hi T Direct DME Maximum power (> ) 0.180 W/cm2 0.270 W/cm2
Total precious metal loading 5 mgPGM/cm2 3 mgPGM/cm2
Degradation rate 19 µV/h at a 0.2 A/cm2 10 µV/h at a 0.2 A/cm2 Loss in start/stop cycling 1.5 mV/cycle; cycle 0.75 mV/cycle; cycle Anode mass-specific activity 50 A/g at 0.5 V 75 A/g at 0.5V
Program Targets
Benefits: 1. Carbon-neutral auxiliary power for trucks and transport (HT PEM with
reformed methanol already used as battery range extenders for BEV) 2. Slightly modified diesel engines (Volvo) run with DME today 3. DME as the energy carrier from CO2 has a projected SUE (Source to Use)
of 0.285 $/kWh, under the 0.3 $/kWh target

Approach: Pd to Cleave C-O Bond
4
DME vs. methanol fuel cell performance. Anode: 4.0 mgmetal cm-2 PtRuPd/C (HiSPEC® 12100); DME 40 sccm, bp 26 psig; 1.8 mL/min 0.5 M or 1.0 M MeOH. Cathode: 2.0 mg cm-2 Pt/C (HiSPEC® 9100); air 100 sccm, bp 20 psig. Membrane: Nafion® 212 (DME), Nafion® 115 (MeOH); cell: 80 °C.
Temperature dependence of DME fuel cell performance. Anode: 4.0 mgmetal cm-2 PtRu/C (HiSPEC® 12100); DME 40 sccm, bp 26 psig. Cathode: 4.0 mg cm-2 Pt black, air 500 sccm, bp 20 psig. Membrane: Nafion® 212; cell: 80 °C.
High DME activity with PtRuPd/C combined with temperature sensitivity

Approach - Overview
5
1. Benchmark
• Run high temperature MEAs at LANL • Compare Pt anode w MeOH, DME (160 °C
– 180 °C) • Use both PBI and TPS HT MEAs
2. GDE at 5 cm2
• Make gas diffusion electrode (GDE) with PtRu, run with DME
• Compare to LANL ternary anode catalyst • Evaluate PBI and TPS DME crossover and
performance at highest obtainable T
3. Optimize at 5 cm2
• Optimize anode GDE for mass transport • Focus on optimum catalyst alloy • Optimize electrode-membrane interface for
TPS, higher T operation
6 mo.
6-12 mo. Go/No Go
12-24 mo.
This period
Leverage enhanced kinetics at higher T

Approach – Tuning Electrode Architecture
6
Key levers: type of carbon (catalyst), binder content, MEA build compression
Balanced hydrophilic and hydrophobic properties for perfect wetting of the catalyst with phosphoric acid and optimal function of the MEA.
GDL Membrane
H2 H2 H2
H2
H2
H2
H2
H2
H2
H2
H2
H2 H2
H2
H2
H2
H2
H+
H+ H+
H+
H+
H+
GDE Pore size: 0.5-5 μm
H2 H2
H2
H2
H2
H2
H2
H2
H2
H2
H2
H2
H2
H2
H2
H2
GDL
Mem
bran
e
GDE
Acid flooding: The fuel (H2/DME) cannot get in contact with the catalyst.
H2 H2
H2
H2
H2
H2
H2
H2
H2
H2
H2
H2
H2
H2
H2
H2
H2 H2
H2 H2
GDL
Mem
bran
e
GDE Acid starvation: Insufficient electrolyte limits the proton transport.
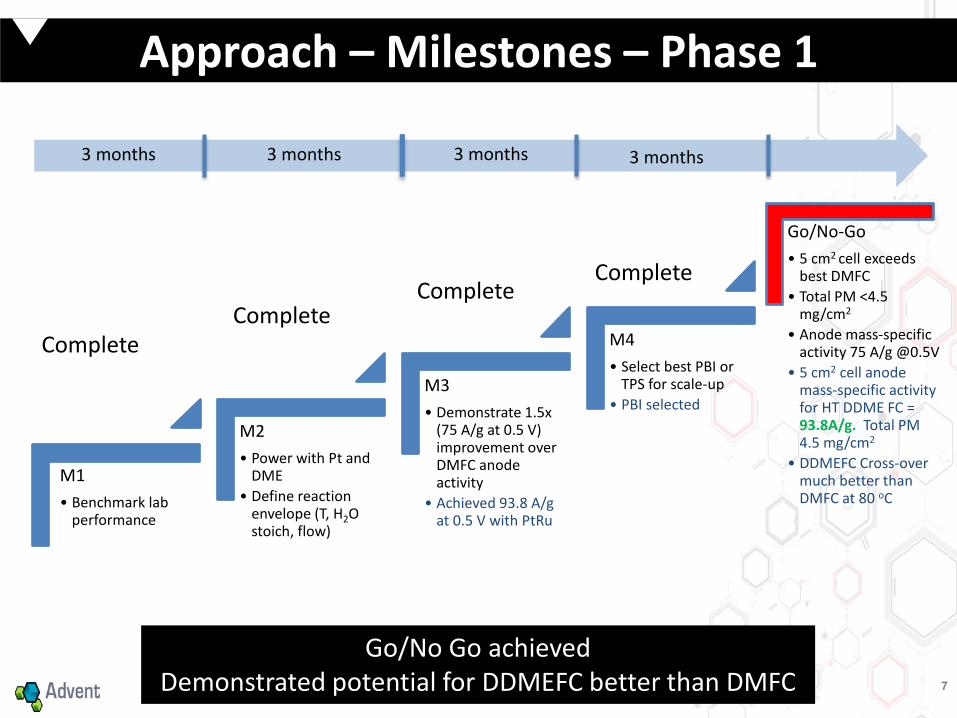
M1 • Benchmark lab
performance
M2 • Power with Pt and
DME • Define reaction
envelope (T, H2O stoich, flow)
M3 • Demonstrate 1.5x
(75 A/g at 0.5 V) improvement over DMFC anode activity
• Achieved 93.8 A/g at 0.5 V with PtRu
M4 • Select best PBI or
TPS for scale-up • PBI selected
Go/No-Go • 5 cm2 cell exceeds
best DMFC • Total PM <4.5
mg/cm2
• Anode mass-specific activity 75 A/g @0.5V
• 5 cm2 cell anode mass-specific activity for HT DDME FC = 93.8A/g. Total PM 4.5 mg/cm2
• DDMEFC Cross-over much better than DMFC at 80 oC
Approach – Milestones – Phase 1
7
Complete Complete
3 months 3 months 3 months 3 months
Go/No Go achieved Demonstrated potential for DDMEFC better than DMFC
Complete Complete

M5 • Scale to 50 cm2
• Mass transport < DMFC using H2 gain as reference
• H2 gain @0.1 A/cm2 for DDMEFC 240 mV; better than DMFC’s 320 mV (at 5 cm2)
M6 • Improve mass transport • < 50% vs. DMFC
M7 • Demonstrate
0.270W/cm2 maximum power with < 4.5 mg/cm2 PGM
M8 • DDMEFC Hi-T MEA >
DMFC per Slide 3 targets
Approach – Milestones – Phase 2
8
3 months 3 months 3 months 3 months
Focus on maximizing PtRuPd activity
Pending Pending
Partial

Accomplishments and Progress (1)
9
Achieved go/no go Cathode loading & temperature limited MEA performance
High T MEA DME fuel cell performance at 240 oC. Cathode: Pt-alloy/C 2.9mg/cm2; air 500 sccm, backpressure 30 psig.
Anode: HiSPEC® 12100 PtRu/C 1.6 mg/cm2; DME 125 sccm, DME:water = 1:3, humidified at backpressure 30 psig. Membrane: PBI
PBI-based MEA DME fuel cell performance. Black: replot data on left as anode specific current Red: 2017 AMR, Anode HiSPEC ® 12100 PtRu/C 1.9 mg/cm2
Cathode Pt-alloy 2.2 mg/cm2, 3.5psig, 180°C Green: 2016 AMR, Anode HiSPEC® 12100 PtRu/C 1.9 mg/cm2 Cathode Pt-alloy 0.8 mg/cm2, 3.5psig, 180°C
Blue: LANL data from prior program, DME at PtRu 80 °C, total 8 mg/cm2 PGM; 26psig Pink X: Program target, 75A/g @ 0.5V
Best Performance to Date
Current Density, A/cm2
0.0 0.1 0.2 0.3 0.4 0.5 0.6
Pote
ntia
l, V
0.1
0.2
0.3
0.4
0.5
0.6
0.7
0.8
0.9
PtRu
Milestone 3: Anode Mass-Specific Activity Anode Mass-Specific Activity
Anode Specific Current, A/gPGM
0 100 200 300 400
Pote
ntia
l, V
0.0
0.2
0.4
0.6
0.8
1.0

Accomplishments and Progress (2)
10
Highest temperature improves performance.
Anode: PtRu 1.6 mg/cm2; 30 psig DME/H2O backpressure; DME 125 sccm, DME:water = 1:3 Cathode: Pt alloy, 2.9 mg Pt/cm2; 30 psig air backpressure; 500 sccm Membrane: PBI; 200-240 °C Cell size: 5 cm2
Temperature effect (this period)
Power
Same specifications as left-hand plot, demonstrating power density correlation to temperature
Temperature Dependence
Current Density, A/cm2
0.0 0.1 0.2 0.3 0.4 0.5 0.6
Pote
ntia
l, V
0.1
0.2
0.3
0.4
0.5
0.6
0.7
0.8
0.9
240°C220°C200°C
Temperature Dependence
Current Density, A/cm2
0.0 0.1 0.2 0.3 0.4 0.5 0.6
Pow
er D
ensi
ty, m
W/c
m2
0
20
40
60
80
100
120
140
240°C220°C200°C

Accomplishments and Progress (3)
11
Transition from 0th order to 1st order dependence on pressure at higher temperatures.
Pressure effects at various temperatures 180°C
Current Density, A/cm2
0.0 0.2 0.4 0.6 0.8
Pote
ntia
l, V
0.0
0.1
0.2
0.3
0.4
0.5
0.6
0.7
0.8
3.5 psig20 psig
Anode: 12100 HiSPEC® PtRu/C 2.23mg/cm2; 125 sccm DME, DME:water = 1:3 Cathode: Pt-alloy 2.3 mg/cm2; 500 sccm air Membrane: PBI; 180 °C, 5cm2 cell
Anode: 12100 HiSPEC® PtRu/C 1.6 mg/cm2; 125 sccm DME, DME:water = 1:3 Cathode: Pt-alloy 2.9mg/cm2; 500 sccm air Membrane: PBI; 240 °C, 5cm2 cell
240°C
Current Density, A/cm2
0.0 0.1 0.2 0.3 0.4 0.5 0.6
Pote
ntia
l, V
0.1
0.2
0.3
0.4
0.5
0.6
0.7
0.8
0.9
30psig20psig10psig3.5psig

12
HT PEM DDMEFC crossover current 10-20× lower than DMFC
Current density (A/cm2)
H2 gain (mV)
DMFC DDMEFC
0.1 320 240
0.2 330 315
0.3 340 375
DDMEFC: PBI; 240 °C, from left-hand figure DMFC: Nafion® 115 Membrane, 80 °C, cell size 5 cm2. HiSPEC® 12100 PtRu 4 mg/cm2, Pt 4 mg/cm2, H2-Air, 20 psig backpressure, 1.0 M MeOH Preliminary studies show relatively improved mass transport DDMEFC vs. DMFC
Accomplishments and Progress (4)
H2 vs DME
Current Density, A/cm2
0.0 0.5 1.0 1.5 2.0 2.5
Pote
ntia
l, V
0.0
0.2
0.4
0.6
0.8
1.0
1.2
H2
DME
H2 gain as relative transport indicator Milestone 5
Cathode: Pt-alloy/C 2.9mg/cm2; air 500 sccm, backpressure 30 psig. Anode: HiSPEC® 12100 PtRu/C 1.6 mg/cm2; humidified at backpressure 30 psig. - Black: DME 125 sccm, DME:water = 1:3, - Red: H2 200sccm Membrane: PBI

Accomplishments and Progress (5)
13
PtRuPd/C substantially different than PtRu/C: 1. Electrode-catalyst design to be improved 2. Ternary to be run at higher T
Preliminary PtRuPd ternary studies
Black: PtRu/C 1.6 mg/cm2; Pt-alloy 2.9 mg/cm2; 30 psig; PBI, 240 °C Red: PtRuPd/C 1.74 mg/cm2; Pt-alloy 2.56 mg/cm2; 30 psig; PBI, 180°C Green: PtRu 4 mg/cm2; Pt 4 mg/cm2; 26 psig; Nafion, 80 °C
Same conditions as left-hand figure
Ternary Studies
Current Density, A/cm2
0.0 0.1 0.2 0.3 0.4 0.5 0.6
Pote
ntia
l, V
0.1
0.2
0.3
0.4
0.5
0.6
0.7
0.8
0.9
PtRuPtRuPdNafion
Ternary Studies
Mass Specific Current, A/gPGM
0 100 200 300 400
Pote
ntia
l, V
0.1
0.2
0.3
0.4
0.5
0.6
0.7
0.8
0.9
PtRuPdPdRuNafion

Response to Previous Year’s Review
14
1. Risk mitigation strategy for PtRuPd/C catalysts is necessary • After 2017 AMR review, two companies have approached Advent with
potential ternary catalysts, and the evaluation of those materials will be integral to Phase II, allowing for more comprehensive correlation of catalyst characteristics to DDMEFC cell performance. With proper characterization and correlation to cell performance, PtRuPd/C is still a viable alternative to PtRu/C.
2. Concerns regarding size of market • Two companies with commercial systems based on HT PEM (UltraCell,
SerEnergy) have expressed interest in developing commercial systems based on DDMEFCs.
• This year’s work has demonstrated that by just utilizing commercial PtRu/C catalyst, the performance on direct DME oxidation is much better than DMFC specific anode activity, and an order of magnitude lower in crossover current.

Collaborations
15
Los Alamos National Laboratory (subcontractor) o Developer of the PtRuPd catalyst o Extensive know-how on setting up and running
direct DME FC systems o First National Laboratory to qualify HT PEM
testing and operation Commercial Catalyst Company #1
o Started small scale PtRuPd catalyst o Extensive know-how on catalyst alloys o Supplier to FC industry
Commercial Catalyst Company #2 o Started small scale PtRuPd catalyst o Extensive know-how on specialty catalyst alloys
and supports o Supplier to FC industry

Remaining Challenges and Barriers
16
1. Can the expected boost from using PtRuPd be realized? • Innate hydrophobicity of this catalyst different than the
Johnson Matthey PtRu on high surface area carbon • Will initiate catalyst collaboration with commercial suppliers
to explore impact of PtRuPd support and alloying on activity 2. PBI has limited stability at > 200 °C • TPS and cross-linked TPS can operate > 200 °C. Will evaluate
in phase 2

Proposed Future Work
17
Milestone Target Path
5 & 6
Scale to 50 cm2
Mass transport < DMFC using H2 gain as reference; then improve
mass transport 50%
Optimize GDL and electrode layer; modify electrode layer
hydrophobicity to accommodate additives that increase DME solubility in phosphoric acid
7 Demonstrate 0.270 W/cm2 maximum power with < 4.5 mg/cm2 PGM
Work with commercial catalyst suppliers to optimize ternary alloy and support. Increase
utilization through electrode structures.
Any proposed future work is subject to change based on funding levels

Advent has approached Hi T MEA customers that currently build systems based on reformed methanol
18
Technology-to-Market
UltraCell LLC can use 45 cm2 scale in their current systems o Expressed interest and joined Advent on hardware proposals
Advantage will be reduction in system cost (no reformer) and simplicity
SerEnergy (Denmark) has interest in auxiliary power for marine systems that use low emission, carbon-neutral fuels o Advent will need to scale to at least 165 cm2 o SerEnergy has previously demonstrated battery range
extenders for electric vehicles using reformed MeOH o DME is “environmental diesel” and runs in slightly modified
diesel engines – well aligned with marine industry
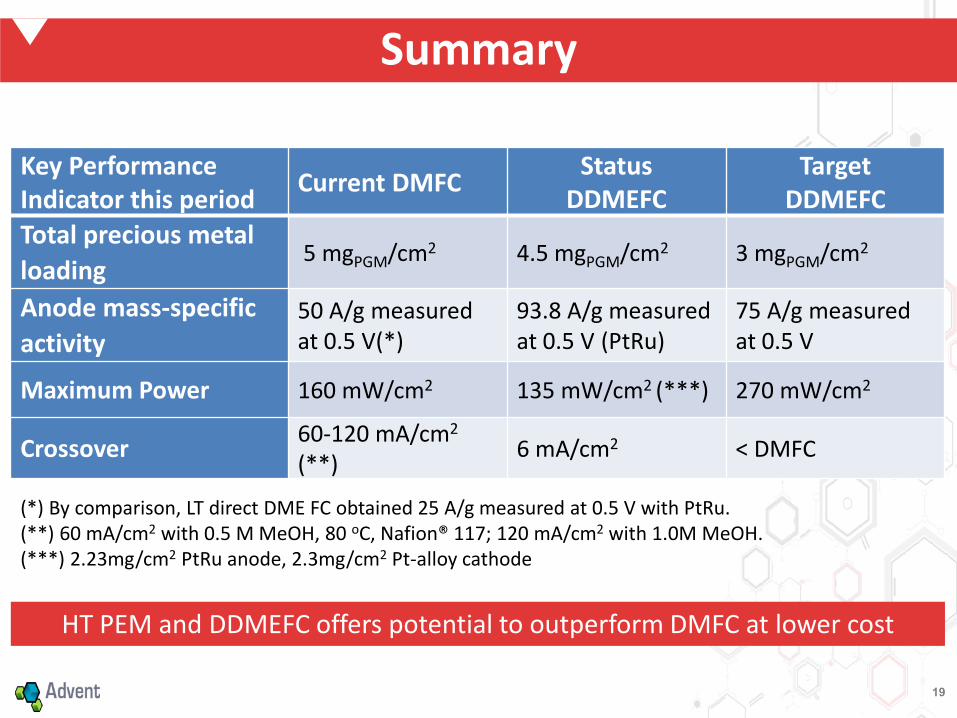
Summary
19
Key Performance Indicator this period Current DMFC Status
DDMEFC Target
DDMEFC Total precious metal loading
5 mgPGM/cm2 4.5 mgPGM/cm2 3 mgPGM/cm2
Anode mass-specific activity
50 A/g measured at 0.5 V(*)
93.8 A/g measured at 0.5 V (PtRu)
75 A/g measured at 0.5 V
Maximum Power 160 mW/cm2 135 mW/cm2 (***) 270 mW/cm2
Crossover 60-120 mA/cm2 (**) 6 mA/cm2 < DMFC
(*) By comparison, LT direct DME FC obtained 25 A/g measured at 0.5 V with PtRu. (**) 60 mA/cm2 with 0.5 M MeOH, 80 oC, Nafion® 117; 120 mA/cm2 with 1.0M MeOH. (***) 2.23mg/cm2 PtRu anode, 2.3mg/cm2 Pt-alloy cathode
HT PEM and DDMEFC offers potential to outperform DMFC at lower cost

Technical Back-Up Slides
20
Contacts: [email protected] [email protected]
LANL logo used with permission by LANL